MONTEREY, CALIFORNIA THESIS Approved for public release, distribution is unlimited INFORMATION TECHNOLOGY PORTFOLIO MANAGEMENT AND THE REAL OPTIONS METHOD (ROM): MANAGING THE RISKS OF IT INVESTMENTS IN THE DEPARTMENT OF THE NAVY (DON) by Jeffery P. Davis December 2003 Thesis Advisors: Philip Candreva Kenneth Doerr Second Reader: Glenn Cook

Welcome message from author
This document is posted to help you gain knowledge. Please leave a comment to let me know what you think about it! Share it to your friends and learn new things together.
Transcript

MONTEREY, CALIFORNIA
THESIS
Approved for public release, distribution is unlimited
INFORMATION TECHNOLOGY PORTFOLIO MANAGEMENT AND THE REAL OPTIONS METHOD
(ROM): MANAGING THE RISKS OF IT INVESTMENTS IN THE DEPARTMENT OF THE NAVY (DON)
by
Jeffery P. Davis
December 2003
Thesis Advisors: Philip Candreva Kenneth Doerr Second Reader: Glenn Cook

THIS PAGE INTENTIONALLY LEFT BLANK

i
REPORT DOCUMENTATION PAGE Form Approved OMB No. 0704-0188 Public reporting burden for this collection of information is estimated to average 1 hour per response, including the time for reviewing instruction, searching existing data sources, gathering and maintaining the data needed, and completing and reviewing the collection of information. Send comments regarding this burden estimate or any other aspect of this collection of information, including suggestions for reducing this burden, to Washington headquarters Services, Directorate for Information Operations and Reports, 1215 Jefferson Davis Highway, Suite 1204, Arlington, VA 22202-4302, and to the Office of Management and Budget, Paperwork Reduction Project (0704-0188) Washington DC 20503. 1. AGENCY USE ONLY (Leave blank)
2. REPORT DATE December 2003
3. REPORT TYPE AND DATES COVERED Master’s Thesis
4. TITLE AND SUBTITLE: Information Technology Portfolio Management and the Real Options Method (ROM): Managing the Risks of IT Investments in the Department of the Navy (DON) 6. AUTHOR(S) Jeffery P. Davis
5. FUNDING NUMBERS
7. PERFORMING ORGANIZATION NAME(S) AND ADDRESS(ES) Naval Postgraduate School Monterey, CA 93943-5000
8. PERFORMING ORGANIZATION REPORT NUMBER
9. SPONSORING /MONITORING AGENCY NAME(S) AND ADDRESS(ES) N/A
10. SPONSORING/MONITORING AGENCY REPORT NUMBER
11. SUPPLEMENTARY NOTES The views expressed in this thesis are those of the author and do not reflect the official policy or position of the Department of Defense or the U.S. Government. 12a. DISTRIBUTION / AVAILABILITY STATEMENT Approved for public release; distribution unlimited
12b. DISTRIBUTION CODE
13. ABSTRACT (maximum 200 words) The FY 2003 Federal Budget contains provisions for over $52 billion in IT investments. The Navy
portion of those funds is over $5 billion. Rapid change and increasing uncertainty in the technology field has resulted in a high degree of financial risk associated with IT capital investment decisions. The Federal Chief Information Officer (CIO) Council has endorsed IT Portfolio Management (ITPM) as an approach for making IT investment decisions. This research draws upon ITPM implementation strategies currently employed by the DON and provides recommendations for managing the inherent risk in IT investments, specifically the application of the Real Options Method (ROM). ITPM provides a thoughtful framework for managing the capital investment process but still depends primarily on traditional methods such as EVA, IRR and NPV for evaluating IT investment alternatives. This study uses the Naval Supply Systems Command (NAVSUP) Automatic Identification Technology (AIT) program to illustrate how ROM can be utilized to supplement these traditional valuation methods and aid in managing investment risks. IT capital investments are inherently linked to organization strategy and the uncertainties that define the future. This study demonstrates how ROM can allow managers to capitalize on the uncertainties of IT investment decisions to implement organization strategy.
15. NUMBER OF PAGES 83
14. SUBJECT TERMS Information Technology Management, Information Technology Investment, Real Options Method
16. PRICE CODE
17. SECURITY CLASSIFICATION OF REPORT
Unclassified
18. SECURITY CLASSIFICATION OF THIS PAGE
Unclassified
19. SECURITY CLASSIFICATION OF ABSTRACT
Unclassified
20. LIMITATION OF ABSTRACT
UL
NSN 7540-01-280-5500 Standard Form 298 (Rev. 2-89) Prescribed by ANSI Std. 239-18

ii
THIS PAGE INTENTIONALLY LEFT BLANK

iii
Approved for public release, distribution is unlimited
INFORMATION TECHNOLOGY PORTFOLIO MANAGEMENT AND THE REAL OPTIONS METHOD (ROM): MANAGING THE RISKS OF IT
INVESTMENTS IN THE DEPARTMENT OF THE NAVY (DON)
Jeffery P. Davis Lieutenant Commander, United States Navy
B.A., Louisiana State University, 1992
Submitted in partial fulfillment of the requirements for the degree of
MASTER OF BUSINESS ADMINISTRATION
from the
NAVAL POSTGRADUATE SCHOOL December 2003
Author: Jeffery P. Davis
Approved by: Philip Candreva Thesis Advisor
Kenneth Doerr Thesis Advisor Glenn Cook Second Reader
Douglas A. Brook Dean Graduate School of Business and Public Policy

iv
THIS PAGE INTENTIONALLY LEFT BLANK

v
ABSTRACT The FY 2003 Federal Budget contains provisions for over $52 billion in IT
investments. The Navy portion of those funds is over $5 billion. Rapid change and
increasing uncertainty in the technology field has resulted in a high degree of financial
risk associated with IT capital investment decisions. The Federal Chief Information
Officer (CIO) Council has endorsed IT Portfolio Management (ITPM) as an approach for
making IT investment decisions. This research draws upon ITPM implementation
strategies currently employed by the DON and provides recommendations for managing
the inherent risk in IT investments, specifically the application of the Real Options
Method (ROM). ITPM provides a thoughtful framework for managing the capital
investment process but still depends primarily on traditional methods such as EVA, IRR
and NPV for evaluating IT investment alternatives. This study uses the Naval Supply
Systems Command (NAVSUP) Automatic Identification Technology (AIT) program to
illustrate how ROM can be utilized to supplement these traditional valuation methods and
aid in managing investment risks. IT capital investments are inherently linked to
organization strategy and the uncertainties that define the future. This study
demonstrates how ROM can allow managers to capitalize on the uncertainties of IT
investment decisions to implement organization strategy.

vi
THIS PAGE INTENTIONALLY LEFT BLANK

vii
TABLE OF CONTENTS
I. INTRODUCTION........................................................................................................1 A. BACKGROUND ..............................................................................................1 B. PURPOSE.........................................................................................................2 C. ASSUMPTIONS AND LIMITATIONS ........................................................2 D. SCOPE OF STUDY.........................................................................................3 E. RESEARCH METHODOLOGY ...................................................................3
1. Literature Review ................................................................................3 2. Data Collection.....................................................................................3
F. BENEFITS OF STUDY...................................................................................4 G. ORGANIZATION OF PAPER ......................................................................5
II. MANAGING IT INVESTMENTS WITH ITPM .....................................................7 A. IMPETUS FOR IT PORTFOLIO MANAGEMENT (ITPM) ....................7 B. IT PORTFOLIO MANAGEMENT ...............................................................8
1. DON IT Investment Portfolio Model .................................................8 2. DON IT Capital Investment Guide ..................................................10 3. DON IT Portfolio Management Benchmark Report ......................14
C. IT INVESTMENT SELECTION AND EVALUATION PROCESSES ...15 1. DON Framework................................................................................15 2. Current NAVSUP Process.................................................................16
III. THE ROM-ITPM FRAMEWORK..........................................................................21 A. ROM AND UNCERTAINTY .......................................................................21
1. What is an Option? ............................................................................21 2. Real Options .......................................................................................23
B. ADDRESSING RISK WITH ROM .............................................................27 1. Risk......................................................................................................27 2. ROM and Riskmove this to the next page .......................................29
C. APPLYING ROM IN IT PORTFOLIO MANAGEMENT.......................30 1. Comparing ROM to Traditional Methods ......................................30 2. Steps for Using ROM to Evaluate a Project ....................................33
a. Framing the Option ................................................................34 b. Analyzing the Option ..............................................................37 c. Acting on the Option...............................................................45
IV. MANAGING INVESTMENT RISKS WITH THE ROM-ITPM FRAMEWORK..........................................................................................................49 A. AUTOMATIC IDENTIFICATION TECHNOLOGY (AIT) AND
SERIAL NUMBER TRACKING.................................................................49 B. EVALUATING SNT WITH TRADITIONAL DISCOUNTED CASH
FLOWS ...........................................................................................................50 C. USING ROM TO EVALUATE THE SNT PROJECT..............................52
1. Framing the Option ...........................................................................52
viii
2. Analyzing the Option.........................................................................54 3. Acting on the Option..........................................................................57
V. SUMMARY................................................................................................................61 A. RESULTS OF THE STUDY…A MODEL FOR ADDRESSING RISK ..61 B. BROADER IMPLICATIONS OF THIS STUDY.......................................62 C. AREAS FOR FUTURE STUDY...................................................................63 D. CONCLUSION AND RECOMMENDATION ..........................................64
APPENDIX I: GETTING STARTED WITH ROM .........................................................65
LIST OF REFERENCES ......................................................................................................67
INITIAL DISTRIBUTION LIST.........................................................................................71
ix
LIST OF FIGURES
Figure 1. Capital Planning Phases from (DON 1999).......................................................9 Figure 2. Provisions of Clinger-Cohen Act of 1996 from (DON 2001a)........................10 Figure 3. Acquisition Program, IT Capital Planning and PPBES Relationships from
(DON 2001a)....................................................................................................12 Figure 4. PPBES and DON IT Capital Planning from (DON 2001a). ............................13 Figure 5. NAVSUP IT Management Process from (NAVSUP 2003a). .........................17 Figure 6. Call Option Impact on the Owner from (Devaraj and Kohli 2002). ................22 Figure 7. Types of Options modified from (Devaraj and Kohli 2002). ..........................23 Figure 8. Basic Example of a Real Option modified from (Copeland and Keenan
1998). ...............................................................................................................25 Figure 9. Real Options Scenario modified from (Mun 2002). ........................................26 Figure 10. Risk Matrix from (Jeffery 2003). .....................................................................27 Figure 11. ROM vs. Traditional Analysis modified from (Amran and Kulatilaka
1999). ...............................................................................................................31 Figure 12. ROM-ITPM Methodology. ..............................................................................32 Figure 13. Strategic Tree Example. ...................................................................................34 Figure 14. ROM-ITPM Portfolio Map from (Tjan 2001). ................................................36 Figure 15. Black-Scholes Formula and Assumptions from (Mun 2002). .........................38 Figure 16. Black-Scholes Deconstructed modified from (Amran and Kulatilaka
1999). ...............................................................................................................40 Figure 17. Binomial Lattices modified from (Mun 2002).................................................41 Figure 18. Calculating Volatility. ......................................................................................44 Figure 19. Output from Crystal Reports© Real Options Software. ...................................45 Figure 20. ROM-ITPM Methodology. ..............................................................................47 Figure 21. SNT/AIT Return on Investment Analysis........................................................51 Figure 22. Serial Number Tracking Strategic Tree. ..........................................................53 Figure 23. Calculated Volatility. .......................................................................................55 Figure 24. Crystal Ball© Real Options Output. .................................................................56

x
THIS PAGE INTENTIONALLY LEFT BLANK

xi
ACKNOWLEDGMENTS I would like to lovingly thank my wife, Leah, for her support of this research and
commitment to the success of our family. After twelve years of marriage, I am still learning from her example of devotion and love.
THIS PAGE INTENTIONALLY LEFT BLANK

1
I. INTRODUCTION
A. BACKGROUND
The FY 2003 Federal Budget contains provisions for over $52 billion in IT
investments (Federal CIO Council 2002). The Navy portion of those funds is over $5
billion. One of the most difficult issues facing the DON is determining how these funds
should be used and evaluating the validity of current IT investments. Rapid change and
increasing uncertainty in the technology field have resulted in a high degree of financial
risk associated with IT capital investment. This incredibly rapid pace of change in the
world of IT creates a major dilemma for those charged with determining how these funds
are invested. It is particularly difficult to determine what to invest in, how much to
invest, and how to evaluate investments while attempting to manage associated financial
risks. Answering these questions become more important as the cost of IT investment
continues to rise and financial resources become more constrained.
Congress has addressed this challenge through the passage of the Clinger-Cohen
Act of 1996, which provides a framework for government IT acquisition. Likewise, the
Department of Defense (DOD) acquisition reform efforts have addressed the unique
challenges involving the selection and fielding of major IT system acquisitions. The
Federal Chief Information Officer (CIO) Council has endorsed IT Portfolio Management
(ITPM) as the approach for making IT investment decisions. ITPM is a system for
evaluating, selecting, prioritizing, budgeting and planning for investments to maximize
the benefits to an organization (Federal CIO Council 2002). The DOD and DON
Information Technology/Information Management (IT/IM) leadership have established
that ITPM principles will guide IT investment decisions. In turn, organizations, such as
the Naval Supply Systems Command (NAVSUP), have implemented an ITPM approach
to its budgeting and resource allocation processes for IT.
Many DON organizations are now actively employing ITPM for IT investment
decisions. Still, these organizations must address the issue of managing the financial
risks inherent to IT investment that may not be adequately addressed through commonly
used tools like discounted cash flow analysis (DCF), decision tree analysis and net

2
present value (NPV). The Real Options Method (ROM) is a tool historically used in
financial markets for managing risk. In recent years, it has gained prominence as a
method of managing capital investment risk in areas such as pharmaceutical R&D,
petroleum exploration and energy trading (Boer 2002). Since ITPM is based on Modern
Portfolio Theory derived from the capital markets, ROM may have a role in managing IT
investment risk. Analysis of the benefits and limitations of utilizing ROM with ITPM is
an important step in gaining insight into how to make better IT investment decisions and
effectively managing the risk involved in committing limited DON financial and human
resources.
B. PURPOSE
The purpose of this study is to describe a methodology for using ROM with ITPM
to manage financial risks involved in DON IT investment decisions. A secondary goal of
this study is to develop a model for utilizing ROM within the Portfolio Management
framework for managing risks associated with investment decisions including, but not
exclusive to, information technology investments.
C. ASSUMPTIONS AND LIMITATIONS
IT Portfolio Management has been adopted as the method required for IT
investment and management in the government sector as a result of legislation such as the
Clinger-Cohen Act and the Government Performance and Results Act. The ROM-ITPM
methodology proposed in this study as well as the example presented in this study
assumes ITPM has been implemented. Specifically, this study uses the ITPM
implementation as outlined in the NAVSUP Portfolio Management Concept of
Operations because it incorporates the best practices from ITPM implementations across
the government sector. Using this best of breed implementation of ITPM provides the
unique opportunity to demonstrate how the proposed ROM-ITPM methodology can
contribute valuable information not available through current ITPM investment analysis
tools.
This thesis does not attempt to assess the validity of ITPM or the quality of
NAVSUP’s employment of ITPM. Instead, this thesis will address managing investment
risks within the DON’s ITPM framework using ROM. The example presented in this
3
study is provided only to illustrate the usefulness of the ROM-ITPM methodology as an
additional tool for making IT investment decisions and managing the financ ial risks
associated with these investment decisions.
D. SCOPE OF STUDY
Specifically, this thesis will define ROM and ITPM including a brief review of
where and how these tools have been used. The initial discussion of ITPM will be
followed by a discussion of how ITPM is currently being employed by NAVSUP. ROM
will be discussed as a primary means for dealing with strategic investment financial risks
paying particular attention to how ROM differs from historical methods such as DCF,
decision tree analysis and NPV. Finally, this thesis will draw upon how ROM is
currently being employed in other industries and utilize a NAVSUP IT capital investment
example to illustrate the potential benefits and limitations of applying ROM in the DON.
E. RESEARCH METHODOLOGY
1. Literature Review
The methodology included a review of pertinent legislation such as the Clinger-
Cohen Act, Paperwork Reduction Act of 1995, Government Performance and Results Act
of 1993, and OMB Circular A-130. A review of literature related to government ITPM
implementations such as those done by the Departments of Veterans Affairs, Housing
and Urban Development (HUD), Transportation (DOT), Naval Supply Systems
Command (NAVSUP) and Defense Logistics Agency (DLA) was conducted to identify
best practices and select a best of breed ITPM implementation. Finally, the literature
review included scholarly articles and texts related to IT investment strategies,
application of Real Options in the private sector, and the software tools currently used for
these purposes.
2. Data Collection
Data collection included a review of documented procedures, interviews with key
personnel involved in ITPM, and data available from applicable business case analyses
for the project selected to illustrate the ROM-ITPM methodology. The financial data
utilized in this study was based on business case estimates as well as estimates from
knowledgeable project management personnel. The financial data used in this study are
4
for illustrative purposes only and are not intended to be utilized as an optimal solution to
a specific scenario.
F. BENEFITS OF STUDY
IT investments make up a significant portion of the Navy budget. Therefore,
making sound IT investment decisions and managing the risks involved in those
decisions is paramount. The importance of effectively managing IT investments has
attracted significant attention from both Congress and the White House over the past
several years. In response to their concerns, Congress passed the Clinger-Cohen Act of
1996 to “establish processes and have information in place to ensure that IT projects are
being implemented at acceptable cost, within reasonable and expected time-frames, and
are contributing to tangible, observable improvements in mission performance” (DON
2001a). The Federal CIO and DON CIO have responded by issuing a series of reports
designating ITPM as the mechanism that will be used to achieve the goals of Clinger-
Cohen. Although ITPM provides a cogent process for selecting, managing and
evaluating IT investments, it is limited in its ability to manage the risks involved in the
selection and evaluation phases of the process. The success of ROM as a mechanism for
managing risk in the volatile pharmaceutical R&D and petroleum exploration industries
has created interest in the application of ROM to IT investment decisions. This study
will provide an analysis of the usefulness of incorporating ROM into ITPM as a
mechanism for addressing the financial risks inherent in IT investment decisions. The
success of ROM in the arena of IT investments can provide far-reaching benefits to
managers attempting to balance the risks of IT investments with the competing demands
on scarce financial and human resources. This study seeks to address these concerns by
explicitly analyzing the usefulness of ROM in addressing IT investment risks within the
framework of ITPM.
The viability of ROM as a risk management tool in government may be far
reaching. In fact, in a recent article Commander Greg Glaros of the Office of Force
Transformation has offered ROM as a possible tool for evaluating new DOD programs.
However, the major issue that is faced when dealing with projects in government is
related to purpose, time and amount (PTA) restrictions. Projects are defined and funded
based on available funding. The established funding (amount) can only be used for the

5
intended purposes set forth in the appropriation (purpose) and is only available for the
duration of that appropriation (time). Although PTA restrictions present a challenge,
ROM provides a financial tool that can evaluate multiple strategic pathways present in
the changing global landscape. If ROM is demonstrated to be a viable method of
managing IT investment risks, this method can be applied to IT and other strategic
investments across DON and other government agencies in the foreseeable future.
G. ORGANIZATION OF PAPER
Chapter I begins by introducing the reader to the dilemma the Department of the
Navy currently faces with regard to managing financial risks associated with IT
investment decisions. This background information is followed by an explanation of the
significance of this study including future application to strategic investment decisions
throughout government.
Chapter II begins by defining ITPM and describing how it came to be the method
used by government for making IT investment decisions. This explanation is followed by
a brief coverage of how ITPM is currently being implemented within DON and the
challenges still facing DON managers with regard to managing IT investment risks.
Chapter III introduces ROM as a potential method of managing risks associated
with IT investments. This chapter defines ROM and describes how it works as well as
how it can be incorporated into ITPM to manage financial risks associated with IT
investments. Chapter III concludes by presenting a proposed model for using ROM
within the ITPM framework to manage risk.
Chapter IV provides an example of how ROM can be employed in ITPM to
address risk. The chapter begins with an explanation of Naval Supply Systems
Command (NAVSUP) Automatic Identification Technology (AIT), which will be used to
demonstrate the viability of ROM in managing risk. The chapter goes on to identify the
usefulness of ROM based on the AIT example.
Finally, Chapter V provides a summary of this study including a discussion of the
proposed ROM-ITPM methodology for addressing risk. The broader implications of this
study are discussed focusing on recent proposals by the DOD Office of Force

6
Transformation to apply ROM to PPBE. Chapter V concludes with recommendations for
future research based on the findings of this study.

7
II. MANAGING IT INVESTMENTS WITH ITPM
A. IMPETUS FOR IT PORTFOLIO MANAGEMENT (ITPM)
Programming and budgeting in DOD determines how scarce resources will be
allocated. Major increases or decreases, in the current system, are rarities with most
changes occurring incrementally. This incremental change is the result of the methodical
Planning, Programming, Budgeting and Execution System (PPBES) used to determine
which programs are funded within DOD and at what level. Unfortunately, the incredibly
rapid pace of change in the world of IT creates a dilemma for those who are charged with
determining how these funds are invested. Particularly difficult is determining what to
invest in, how much to invest, how to evaluate investments, and how to increase return on
investments. Answering these questions becomes more important as the cost of IT
investments continues to rise and financial resources become more constrained.
Over the years, the Department of the Navy (DON) has learned just how elusive
the answer to the IT investment question can be. Recent investments in the Navy Marine
Corps Intranet (NMCI) and the funding of Enterprise Resource Planning (ERP) pilots
have raised significant questions surrounding how IT proposals are reviewed and selected
(Capaccio 2003). The business world is experiencing similar troubles in dealing with the
IT investment dilemma. The business world is littered with examples of major
corporations making significant IT investments that proved nearly fatal because of poor
selection or flawed execution/implementation of IT solutions. For example, Hershey’s
flawed implementation of a $115M Enterprise Resource Planning (ERP) system resulted
in an 18.6% decrease in earnings during its busiest quarter of the year (Osterland 2001).
In spite of estimates that returns from some new technology would be substantial, in
some cases, these pay-offs have been few and far between. In fact, some of these
corporations have reverted to previous systems and cut their losses as their hopes for
gaining a competitive advantage using costly IT systems have been dashed due to flawed
implementation and poor selections of IT solutions. Not all corporations were so
unfortunate. Companies like Wal-Mart and Dell have effectively used IT solutions to
8
improve supply chain management and gain a significant competitive advantage while
meeting the needs of their customers (Afuah and Tucci 2001).
The problems DON faces with regard to selecting, managing and evaluating IT
solutions are common to all government agencies. The potential for waste caused by
these shortcomings has attracted the attention of Congress. Aware of the significant
benefits to be derived from effective selection and implementation of IT solutions,
Congress passed legislation to promote the use of IT to reduce the cost of government
operations, e.g., the Paperwork Reduction Act of 1995. This legislation required that all
government agencies define program information needs, develop an information
resources management (IRM) plan, and integrate the IRM within the organization. This
plan was to be “integrated with organizational planning, budget, financial management,
human resources management and program decisions” (DON 2001a). The Clinger-
Cohen Act of 1996 further shifted the momentum in government towards identifying a
systematic mechanism for selection, management and evaluating IT solutions.
B. IT PORTFOLIO MANAGEMENT
The government, and DON specifically, has looked to the commercial sector to
identify a model for making IT investment decisions, implementing IT solutions and
evaluating the return on investment. The Federal Chief Information Officer (CIO) has
since identified ITPM as the mechanism by which IT investments are selected, managed
and evaluated. The Federal CIO has defined ITPM as a system for evaluating, selecting,
prioritizing, budgeting and planning for investments that provide the greatest
value/contribution to an organization (Federal CIO Council 2002). Over the past several
years, the DON CIO Council has defined ITPM within DON using three major reports:
(1) DON IT Investment Portfolio Model, (2) DON IT Capital Investment Guide, and (3)
DON IT Portfolio Management Benchmark Report. Although these studies differ in their
scope and focus, they each provide valuable insight into ITPM.
1. DON IT Investment Portfolio Model
The first major document produced by DON was the DON IT Investment
Portfolio Model drafted by the Investment Practices Integrated Process Team back in
1999. This document is relatively narrow in scope but provides a three-phase framework
for IT investment: Selection, Management, and Evaluation. Figure 1 provides a

9
graphical representation of this three-phase process (DON 1999). During the Selection
Phase, criteria are established, and then projects are screened, documented, reviewed,
prioritized and selected. Once the project is selected, the Management Phase begins.
During this phase, managers must utilize objective criteria for evaluating projects based
on careful monitoring. Managers are then involved in identifying problems and
implementing corrective actions that improve the project. Finally, in the evaluation
phase, the project is reviewed to assess whether the actual performance matches the
expected performance and if intended objectives are met. Decisions must be made at this
point regarding required improvements/modifications or whether a new project is needed
to meet the objectives.
Capital Planning Phases: Capital Planning Phases: Select, Manage, Evaluate
SelectIT Investment
Funding Decisions
ManageDecisions to continue, modify, or terminate
EvaluateFeedback based on
post-deployment reviews, lessons learned
Information Flow
Process Dynamic
This model focuses primarily on the “Select” phase of Capital Planning. The portfolio investment model also addresses the “Management” and “Evaluate” phases.
Figure 1
Figure 1. Capital Planning Phases from (DON 1999).
Although each of the three phases discussed in this document are important, the
Selection Phase is the most difficult and the most critical. During this phase, managers
make important tradeoffs regarding risks and returns that affect the rest of the process.
These risks can be as basic as assessing the affordability and reliability of a system or
may be extremely elusive as in the case of identifying the degree of information
assurance and system security required. Although light discussion is given to these
topics, DON IT Investment Portfolio Model does not go into significant detail regarding

10
how this should be done. Nonetheless, this type of analysis is provided in detail in the
second major report, the DON IT Capital Investment Guide.
2. DON IT Capital Investment Guide
Introduced by the DON CIO in April 2001, the DON IT Capital Investment Guide
begins with a reiteration of the basic three-phase portfolio model discussed above. The
document goes on to describe the legislation and policy that has served as a major
impetus for instituting ITPM. The most significant of these is the Clinger-Cohen Act of
1996. Clinger-Cohen’s goal is to establish processes for ensuring IT projects that are
implemented meet cost objectives and demonstrate tangible benefits. Figure 2 details
some of the specific requirements laid out in Clinger-Cohen (DON 2001a). Other
legislation and policy such as the Paperwork Reduction Act of 1995, Government
Performance and Results Act of 1993 and OMB Circular A-130 similarly stress the need
for process improvements in government centered on technology and managing
investments. Executive Order 13011, issued by the Clinton Administration, reinforced
these requirements.
The most useful feature of the DON IT Capital Investment Guide is the degree of
detail it offers in connecting relationships among the IT Capital Planning Process,
Acquisition Program Process and the Planning Programming and Budgeting System
(PPBS). This feature of the document provides a more complete picture of the
implications of an effective IT Capital Planning Process such as ITPM.
Figure 2. Provisions of Clinger-Cohen Act of 1996 from (DON 2001a).
Established by former Secretary of Defense Robert McNamara in 1962, PPBS
assists the Secretary of Defense in resource allocation decisions among numerous
Selection, management and evaluation of IT investments;
Integrated with the processes for making budget, financial and program management decisions;
Bases IT investment-funding decisions on minimum criteria, which facilitate the comparison and prioritization of competing IT investment alternatives;
Provides for the identification of investments with potential benefits to other governmental agencies;
Provides for the identification of measurements which quantify the risks and benefits of the investment to the
mission or business area; and
Provides the means for Agency management personnel to obtain timely information regarding the progress of the IT investment including the status of meeting specified milestones in terms of cost, schedule, quality, etc.

11
competing programs. The PPBS systematically translates strategies into well- formulated
requirements and programs that are incorporated into the President’s budget submission.
PPBS has recently been renamed the Planning, Programming, Budgeting and Execution
System (PPBES) to reflect a growing sentiment that more emphasis needs to be placed on
execution of the budget (Wolfowitz 2003). ITPM links to the planning and budgeting
phases of PPBES by providing a mechanism for selecting programs that fit established
plans and evaluating existing programs already included in the budget.
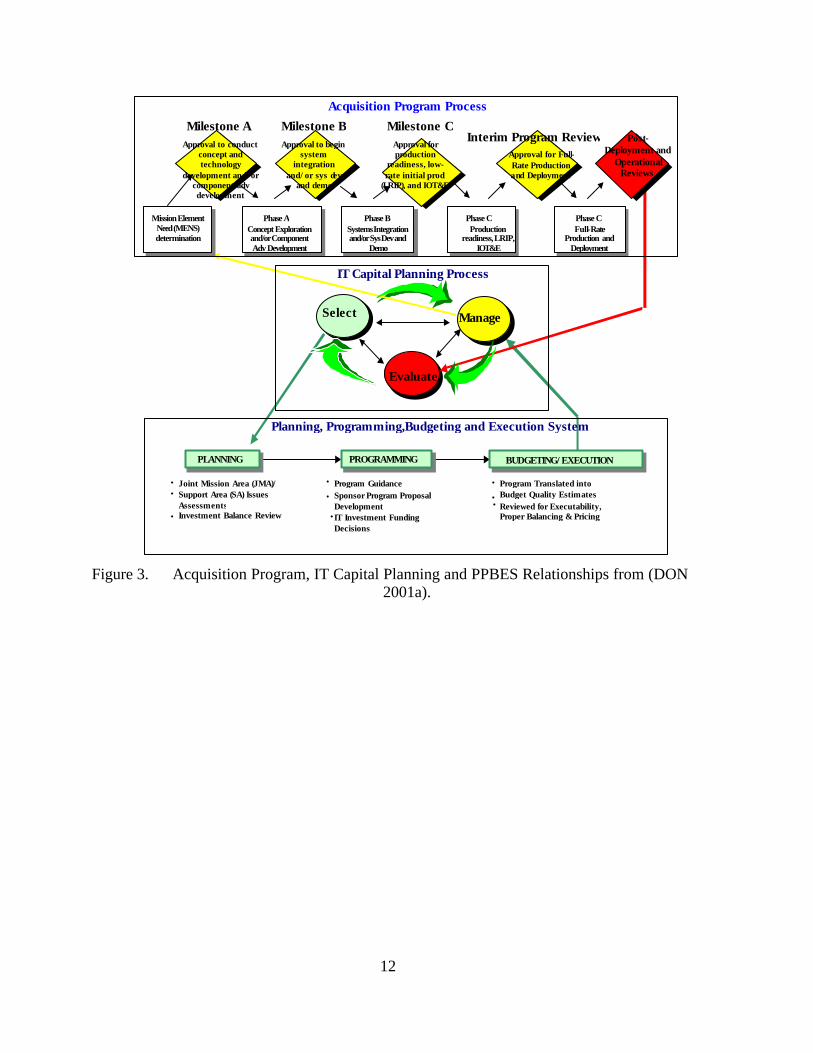
The Acquisition Program Process is described by outlining the different
Acquisition Categories (ACAT) into which IT programs may be placed based on total life
cycle cost and complexity. The DON acquisition process for IT investments is governed
by: (1) DOD Directive 5000.1, “The Defense Acquisition System” of May 03; (2) DOD
Instruction 5000.2, “Operation of the Defense Acquisition System” of May 03; and (3)
SECNAVINST 5000.2B of Dec 96 (DON 2001). The Acquisition Program Process
provides guidance for establishing milestones, decision-making levels, and appropriate
documentation of milestones. Based on size, complexity and risk, this process designates
programs as falling into one of four categories: ACAT 1A, ACAT II, ACAT III, and
ACAT IV. Each ACAT provides for a different level of management attention designed
to facilitate successful program management. This process is closely linked to the ITPM
selection and management phases. Figures 3 and 4 describe these processes and the
relationships that exist among them (DON 2001a).1
1 The processes referenced in this instruction have recently been revised (e.g. PPBE). However, the
basic relationship existing between these processes and the IT Portfolio Management process is the same.
12
• • Development Decisions
Budget Quality Estimates •
Manage
Evaluate
IT Capital Planning Process
Select
Planning, Programming,Budgeting and Execution System
• Joint Mission Area (JMA)/ Support Area (SA) Issues Assessments
• Investment Balance Review
Program Guidance Sponsor Program Proposal
• IT Investment Funding
• Program Translated into • Reviewed for Executability,
Proper Balancing & Pricing
PLANNING PROGRAMMING BUDGETING/EXECUTION
Milestone A Approval to conduct
concept and technology
development and/or component adv development
Milestone B Approval to begin
system integration
and/or sys dev and demo
Milestone C Post-
Deployment and Operational Reviews
Phase A Concept Exploration and/or Component Adv Development
Phase B Systems Integration and/or Sys Dev and
Demo
Phase C Phase C
Acquisition Program Process
Approval for production
readiness, low-rate initial prod
(LRIP), and IOT&E
Production readiness, LRIP,
IOT&E
Full-Rate Production and
Deployment
Mission Element Need (MENS) determination
Approval for Full-Rate Production and Deployment
•
Interim Program Review
Figure 3. Acquisition Program, IT Capital Planning and PPBES Relationships from (DON
2001a).

13
Defense Planning Guidance
DoD ITM Strategic
Plan
DOD Strategic Plan
DON Assessment/ Planning Process
Budget Development
(Specific Investments)
POM Development
(Specific Investments)
Inter-relationship of Strategic Planning and Capital Planning S
T R A T E G I C
P L A N N I N G
P P B E S
Budget Execution (Specific Investments)
Annual Navy (OPNAV)/MC
IT Investment Strategy
DON IM/IT Strategic Plan (Mission, Goals,
Objectives, Planning
Strategies)
Figure 4. PPBES and DON IT Capital Planning from (DON 2001a).
Also discussed are important concepts such as evaluating the acceptability of
commercial off-the-shelf (COTS) solutions. The roles of Program Managers (PMs) and
Milestone Decision Authorities (MDAs) are discussed in terms of responsibilities to
monitor programs and determine whether major milestones have been achieved in the
execution of a program. This document also provides a cogent explanation of the
relationship between PPBES and IT Capital Planning that is also extremely useful in
developing a better understanding of the process.
Finally, the DON IT Capital Investment Guide provides significant discussion of
methods of measuring and evaluating performance of projects. These performance

14
measures occur at the Enterprise, Functional and Infrastructure Levels. In this scenario,
Enterprise Level involves evaluation of projects based on outcomes and conformance to
IT strategic plans/initiatives. The Functional Level includes evaluations based on
measuring how useful outcomes are at the functional or business level. Cost and
efficiency are common evaluative criteria at the Functional Level. Infrastructure Level,
in contrast, is based on evaluation of programs based on shared utility such as Local Area
Networks (LANs) or Wide Area Networks (WANs). Measures in this case tend to focus
on technical outputs like interconnectivity, bandwidth and infrastructure support that
serve as a pseudonym for customer satisfaction.
3. DON IT Portfolio Management Benchmark Report
The final major document is the DON IT Portfolio Management Benchmark
Report, which was introduced in July 2001. This moves from the realm of theory to
review the practical application of ITPM in selected organizations to provide lessons and
examples to facilitate DON implementation of ITPM. The report reviews the ITPM
efforts of U.S. Departments of Housing and Urban Development (HUD), Veteran’s
Affairs (VA), Agriculture (USDA), and General Services Administration (GSA). ITPM
implementations in each of these organizations are reviewed in terms of the three major
phases: Selection, Management and Evaluation. In addition, ongoing efforts at major
DON organizations like NAVAIR and NAVSEA are reviewed along with lessons learned
from their implementations. These reviews of ITPM, both internal and external to DON,
provide valuable insight and lessons from which other organizations can base their
implementations.
The document also provides a valuable discussion of ITPM Tools that are
currently being used in the government and commercial sector. These tools include
Information Technology Portfolio Management System (I-TIPS©), Expert Choice©,
NITE/STAR©, ProSight, and Crystal Reports to name a few, along with points of
contact for these tools. These tools are decision support tools that allow
managers/decision makers to systematically compare alternatives and make decisions
based on those comparisons. Systems like I-TIPS© and Expert Choice© are commercial
systems that provide flexibility in facilitating group collaboration/decisions.
Organizations like the Department of Housing and Urban Development (HUD) and the
15
Department of Veterans Affairs (VA) use these systems. DON has instead selected the
NITE/STARS system as the system of choice. This Navy system provides some
flexibility but was selected because it “provides all levels of DON, with an efficient
means of capturing, consolidating, maintaining, reporting and distributing Information
Technology (IT) and National Security Systems (NSS) budget and Program Objectives
Memoranda (POM) Tab G [information technology] resources information” (DON
2001b). The DON IT Portfolio Management Benchmark Report provides a practical
guide that serves as a blueprint for implementing ITPM in DON. Each of the three major
DON documents discussed above provides valuable information for implementing ITPM.
Projects like Enterprise Resource Planning (ERP) and Navy and Marine Corps Intranet
(NMCI) are providing opportunities for DON to demonstrate how well it is incorporating
the lessons and processes of ITPM.
C. IT INVESTMENT SELECTION AND EVALUATION PROCESSES
Selection and evaluation of IT investments has become increasingly important in
government as organizations embark on an ambitious path to transformation or reinvent
government. The availability of powerful enabling technologies has presented
tremendous opportunities among which managers must choose due to limitations in the
availability of financial and personnel resources. Recognition of this important fact has
led to the incorporation of ITPM to aid in the selection and evaluation processes.
1. DON Framework
Selection and evaluation processes involve the careful weighing of the benefits,
costs, relevance to mission, and risks of potential investments for the purpose of making
funding decisions. New proposals are presented in the form of a business case that
identifies the organization need that will be met by the investment and provides a method
for comparing competing investments. Comparisons are then made based on established
common criteria allowing funding sponsors to make decisions based on the relative merit
and affordability of the projects. This DON framework relies heavily on standard
methods such as net present value (NPV) and return on investment (ROI). Typically,
these measures are used as thresholds that provide a control limit for determining which
projects will be considered. For instance, the DON IT Capital Planning Guide
establishes that projects must have an ROI greater than one (1.0) to be considered. This

16
guide goes on to point out that “…it is expected that all IT investments will produce
either savings/cost avoidances or performance improvements and that, as a minimum,
one of the two is required for funding approval” (DON 2001a). This concept is
reinforced by legislation such as Clinger-Cohen Act of 1996, Executive Order 13011 and
OMB Circular A-11. Consequently, the burden of demonstrating that current and
proposed IT investments meet established ROI criteria significantly affects how
managers view potential investments.
2. Current NAVSUP Process
The Naval Supply Systems Command (NAVSUP) is responsible for delivering
information, material, services and quality of life products to U.S. Naval Forces across
the globe. NAVSUP is organized into ten geographically dispersed field activities
assigned to seven Assistant Chiefs of Staff (ACOS). This arrangement is designed to
align the NAVSUP organization to its diverse customer base: Operating Forces (OFS),
Operational Commanders (OCS), Navy Family Support (NFS), Regional Commander
Support (RCS), International Logistics (ILS), Acquisition (AS) and Industrial Support
(IS).
The NAVSUP process is of particular interest because their specific application of
ITPM will be the backdrop to the illustration of ROM implementation presented in this
study. A review of their current process establishes a context for the proposed ROM-
ITPM methodology introduced in the pages that follow. For the purposes of this study, it
is assumed that the NAVSUP implementation of ITPM is consistent with the procedures
contained in their Portfolio Management Concept of Operations. The NAVSUP
implementation of ITPM fits well within the guidelines prescribed by the Federal Chief
Information Officer (CIO) and DON. NAVSUP has further defined Portfolio
Management as “a disciplined, structured, and repeatable approach to assist decision
makers in aligning their information technology investments with the organization’s
business needs to achieve measurable improvements in the overall mission outcome”
(NAVSUP 2003a). After reviewing the ITPM implementations by agencies like the
HUD, VA, USDA and GSA, NAVSUP was selected as the backdrop in this study
because it represents a balanced approach to ITPM that reflects many of the best practices
of the aforementioned agencies. In fact, the NAVSUP CONOPS has been written to

17
incorporate these best practices (Lattig and Spiegel 2003). Yet, as we shall see later,
using the ROM-ITPM methodology can provide additional insights even for this best of
breed implementation.
Portfolio Management at NAVSUP is one subset of an overall IT management
life cycle. Figure 5 illustrates how the IT Investment Plan, IT Architecture, IT
Enterprise Plan and ITPM are woven to ensure alignment with the organization’s
business strategy (NAVSUP 2003a). NAVSUP’s Portfolio Management process moves
authority to make investment decisions from the headquarters comptroller to the Chief
Information Officer (CIO) and cognizant Assistant Chiefs of Staff (ACOS) responsible
for the process supported by the IT investment. The CIO is responsible for “IT visioning,
planning, policy development, resource allocation, and Transformation savings
attainment” (NAVSUP News 2003). The headquarters comptroller, primarily responsible
for allocating and managing financial resources in accordance with organization
objectives, has now turned over IT decisions to an executive focused on making sound
strategic investments in IT.
B u s i n e s s S t r a t e g yB u s i n e s s S t r a t e g y
I T E n t e r p r i s e P l a nI T E n t e r p r i s e P l a n
P o r t f o l i o M a n a g e m e n tP o r t f o l i o M a n a g e m e n t I T I n v e s t m e n tP lan
I T I n v e s t m e n tP lan
I T A r c h i t e c t u r eI T A r c h i t e c t u r e
I T
B u s i n e s s
I T M a n a g e m e n t
P r o c e s s
I T M a n a g e m e n t
P r o c e s s
Figure 5. NAVSUP IT Management Process from (NAVSUP 2003a).
NAVSUP’s IT investment decision-making process is facilitated by the Corporate
Project Management System (CPMS). A centerpiece of the NAVSUP process, CPMS
automates the flow of proposals for in-house IT solutions and the review of competing
project proposals. This automated system facilitates information exchanges among the
18
major elements of the NAVSUP organization: the ACOS, the Architectural Review
Board (ARB) and the Investment Review Board (IRB). In this process, the ACOS
determines if the project is a sound investment based on a preliminary package provided
by the Navy Supply Information Systems Activity (NAVSISA) Portfolio Management
staff.2 CPMS incorporates ACOS reviews, and uses commercial software solutions such
as ProSight and Primavera for portfolio management and project management
respectively. The reviews formalized by CPMS pose a series of questions that guide
investment decisions for the NAVSUP organization. The ACOS is asked to answer
questions designed to identify project significance, verify a problem exists, determine
adequacy of project solution, verify savings, and determine other impacts such as the cost
or impact to other organizations.
The ACOS review mentioned above provides an initial assessment of strategic fit
of the project including feasibility and the need for the capabilities provided by the
project. If approved by the ACOS, the ARB then determines the technical requirements
for the project. In this arrangement, the ARB is primarily responsible for evaluating the
technical aspects of proposed projects such as hardware specifications, coding and
interfaces. The ARB “has authority over all technical decisions” (NAVSUP 2003a).
Once the ACOS and ARB reviews are completed, the results of their reviews are
recorded in CPMS and the IRB review begins. During the IRB review the project is
scored using an established scoring system designed to compare and assess projects.
The IRB is convened to monitor existing projects, new projects and make
decisions regarding the need to terminate failing projects. The IRB is made up of
NAVSISA and NAVSUP staff designated to bring together the inputs from the cognizant
ACOS and ARB to score the project based on risk, organizational impact, strategic
alignment, mission effectiveness and benefit-cost impact. Based on this final scoring, a
decision to include or exclude a project is made by the CIO and ACOS who make up the
Corporate Board.
This process is spelled out in its entirety in the NAVSUP Portfolio Management
Concept of Operations. This discussion of the process is offered to illustrate the balanced
2 NAVSISA provides the information technology expertise within the NAVSUP claimancy headed by the ACOS for Information Support.

19
approach used at NAVSUP and provide the reader a frame of reference for the example
and discussion that follows. The NAVSUP Portfolio Management process seeks to
address important issues such as determining what to invest in, how much to invest, how
to evaluate investments and how to increase return on investments. However, even this
best of breed alternative is lacking. Its reliance on traditional discounted cash flow does
not factor in the flexibility managers have when making strategic investments to wait,
expand, or abandon as more information becomes available. Uncertainty and financial
risks associated with investments are not addressed with the analytical rigor available
through the Real Options Method. This study seeks to present a new methodology using
the Real Option Method that will allow managers to leverage investment risk and exploit
opportunities created by risk and uncertainty.

20
THIS PAGE INTENTIONALLY LEFT BLANK
21
III. THE ROM-ITPM FRAMEWORK
A. ROM AND UNCERTAINTY
Inherent in all business decisions is a careful balancing of risk versus reward.
Most managers view the uncertainty that exists in strategic investment decisions as
something to avoid, but also understand that higher risk is also associated with higher
reward. Over the past several decades, managers have looked to different tools to help
them make critical investment decisions that often meant the difference between
sustaining/achieving competitive advantage and becoming irrelevant. Discounted Cash
Flow (DCF), Net Present Value (NPV) and decision tree analysis have been the
traditional methods for evaluating these investment decisions. Each of these measures
provides important information that allows managers to make comparisons among
competing investment choices. Unfortunately, these methods fail to account for the
iterative nature of real world decisions. These methods treat investment decisions as a
static process assuming away management’s ability to alter decisions as conditions
change. This hardly reflects the true complexity of IT capital investment decisions. In
reality, every capital investment decision is based on a series of options. Managers can
elect to “defer additional work, abandon it outright, shut it down and restart later, expand
it, trim it back, or even switch its strategic purpose” (Alleman 2000). ROM provides a
framework to address this real world scenario.
1. What is an Option?
An option can be defined as “the right, but not the obligation, to take an action in
the future” (Amran and Kulatilaka 1999). A financial option allows the owner to sell
(put) or buy (call) a stock at a given price within an established period of time. The key
is that there is no obligation to actually sell or buy. If the option is never exercised the
owner of the option loses only the cost of the option, yet the potential for gain remains
high. It stands to reason that the owner of the option will only choose to exercise the
option to buy or sell when conditions are favorable. Therefore the greater the uncertainty
associated with an option, the greater the value of that option. The following are terms
associated with options that are also common to Real Options (Mun 2002).

22
Option (Real Option)- a contract that gives the owner the right but not the legal obligation to buy or sell an underlying asset (invest in a project/asset).
Call- an option to buy (invest in) a specified number of shares (specified project) at a pre-established price within some future period.
Exercise price (Strike price)- the price stated in the option contract at which the security (project/asset) can be bought or sold.
Market price- the value of the underlying security (project) in the market.
Option price (Call price) - the market price for the option contract.
Expiration date- the date the option expires or matures.
Options effectively restrict downside risk due to uncertainty while retaining the
potential for upside (good) risk. Figure 6 depicts this characteristic of options (Devaraj
and Kohli 2002). Here we see that the option is exercised only when the market price
(M) is favorable and reaches the exercise price (X). As the market price increases the
payoff increases as illustrated by the 45-degree line following the exercise price. The
graph on the right illustrates that the profit available from exercising the option is slightly
reduced by the amount paid for the option referred to as the call price (-C). As previously
discussed, this cost also represents the limit on loss for buying the option.
Profit
Loss
0-CX
M
Payoff
MX
X = Exercise PriceM = Market PriceC = Call Price (option price)
Profit
Loss
0-CX
M
Payoff
MX
X = Exercise PriceM = Market PriceC = Call Price (option price)
Figure 6. Call Option Impact on the Owner from (Devaraj and Kohli 2002).

23
2. Real Options
Real options work similar to the financial option just described. However, real
options apply financial option theory to options on non-financial (real) assets. The same
definitions that apply to financial options apply to real options. The difference is that the
options are tangible assets or projects instead of financial instruments such as stocks and
securities. In the case of real options, managers identify options and their exercise prices
related to a strategic investment or project. If conditions are favorable in the project, the
option can be exercised. However, if conditions are unfavorable, the option need not be
exercised and the owner loses only the cost of the option. Figure 7 describes the various
types of options that can be employed using ROM (Devaraj and Kohli 2002). The arrows
indicate the conditions that exist with up arrows meaning favorable, down arrows
signifying unfavorable conditions and bi-directional arrows indicating the preference to
wait/defer until some future event (neither favorable or unfavorable).
Figure 7. Types of Options modified from (Devaraj and Kohli 2002).
ROM has been slowly gaining prominence as a method of evaluating capital
investments since being introduced in the 1980’s. ROM is supported by the Nobel Prize-
Winning breakthrough, the Black-Scholes model, first introduced by Fischer Black,
• Growth Options: If first one is successful, produce second one
• Expansion Options: If building leases all space, expand facility
• Timing (Wait) Options: Wait to see what the market does
• Change Options: If Linux catches on, our PC will support
• Contract (reduce) Options: Ability to decrease scope
• Abandonment Options: If the market is soft…stop operations
• Compound Options: The value of one option depends on another option
Abandon Reduce Change Wait Expand Compound/ Grow

24
Myron Scholes and Robert Merton in 1973. This method allows managers to account for
and manage the risk and uncertainty of capital investment decisions. Pharmaceutical
R&D, petroleum exploration, and energy trading companies that recognize the value of
quantifying and managing investment decision risks are already using ROM.
In many respects IT investment decisions are very similar to these risk-oriented
industry segments. The bursting of the technology bubble in recent years has driven
home this point. Attempts have been made to address investment decision risks through
probability methods that incorporate DCF, decision tree analysis, modeling and
simulation. Unfortunately, these tools still fail to adequately quantify the opportunities
and risks associated with the myriad of different options that face the manager. It is
important to note that ROM should not be viewed as disruptive technology that will
replace the fundamentals of DCF and NPV. Instead, ROM should be used as a
supplement that provides yet another perspective for managers attempting to identify and
weigh competing alternatives. ROM can provide valuable insight, allowing managers to
see opportunities that may have otherwise gone untapped. Real Options provide a
valuable tool for “identification, valuation, prioritization, and selection of strategic
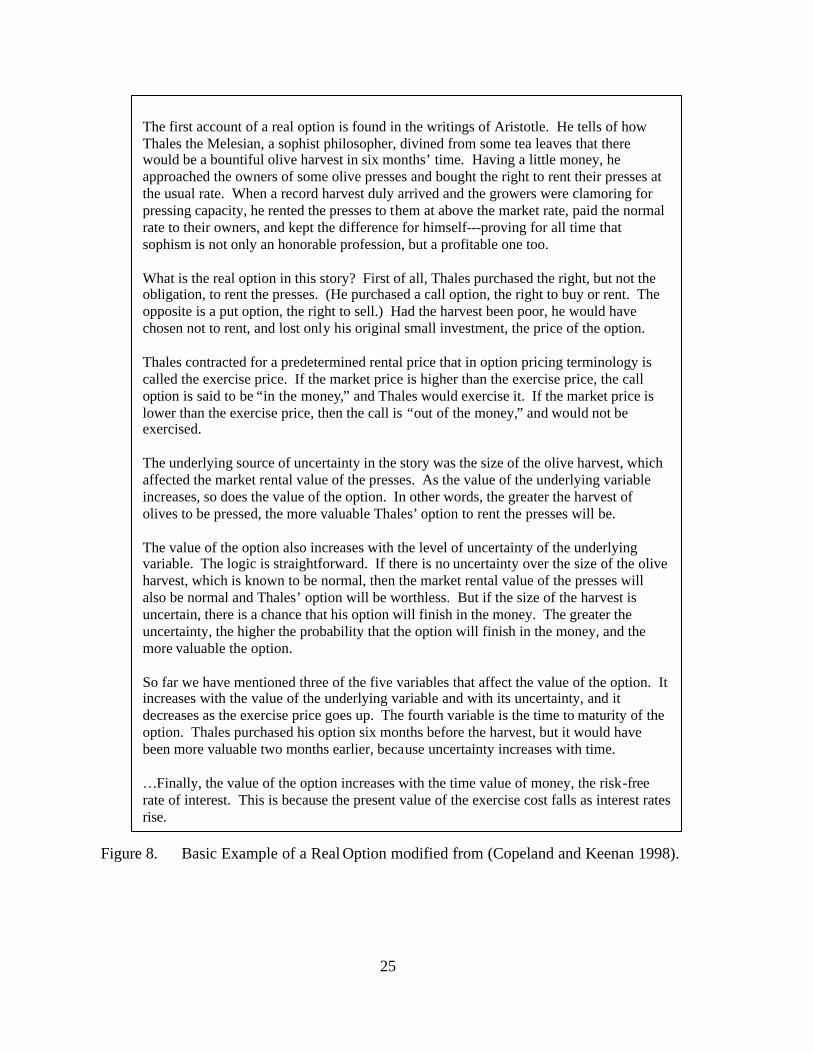
projects” (Mun 2002). Figure 8 provides a basic example describing what Real Options
are (Copeland and Keenan 1998). Figure 9 is an example of how real options can apply
to real-world strategic investment decisions (Mun 2002).
25
The first account of a real option is found in the writings of Aristotle. He tells of how Thales the Melesian, a sophist philosopher, divined from some tea leaves that there would be a bountiful olive harvest in six months’ time. Having a little money, he approached the owners of some olive presses and bought the right to rent their presses at the usual rate. When a record harvest duly arrived and the growers were clamoring for pressing capacity, he rented the presses to them at above the market rate, paid the normal rate to their owners, and kept the difference for himself---proving for all time that sophism is not only an honorable profession, but a profitable one too. What is the real option in this story? First of all, Thales purchased the right, but not the obligation, to rent the presses. (He purchased a call option, the right to buy or rent. The opposite is a put option, the right to sell.) Had the harvest been poor, he would have chosen not to rent, and lost only his original small investment, the price of the option. Thales contracted for a predetermined rental price that in option pricing terminology is called the exercise price. If the market price is higher than the exercise price, the call option is said to be “in the money,” and Thales would exercise it. If the market price is lower than the exercise price, then the call is “out of the money,” and would not be exercised. The underlying source of uncertainty in the story was the size of the olive harvest, which affected the market rental value of the presses. As the value of the underlying variable increases, so does the value of the option. In other words, the greater the harvest of olives to be pressed, the more valuable Thales’ option to rent the presses will be. The value of the option also increases with the level of uncertainty of the underlying variable. The logic is straightforward. If there is no uncertainty over the size of the olive harvest, which is known to be normal, then the market rental value of the presses will also be normal and Thales’ option will be worthless. But if the size of the harvest is uncertain, there is a chance that his option will finish in the money. The greater the uncertainty, the higher the probability that the option will finish in the money, and the more valuable the option. So far we have mentioned three of the five variables that affect the value of the option. It increases with the value of the underlying variable and with its uncertainty, and it decreases as the exercise price goes up. The fourth variable is the time to maturity of the option. Thales purchased his option six months before the harvest, but it would have been more valuable two months earlier, because uncertainty increases with time. …Finally, the value of the option increases with the time value of money, the risk-free rate of interest. This is because the present value of the exercise cost falls as interest rates rise.
Figure 8. Basic Example of a Real Option modified from (Copeland and Keenan 1998).

26
E-Business Initiative Example: Managers of an investment bank are currently contemplating the development of an e-business initiative in response to the e-business boom experienced in recent years. These managers recognize that their options range from developing a static Web site with a map of its location and text explaining what their business did to a more elaborate interactive site providing bill-paying, stock trades and loan applications. They realize that competition from other online stock trading and lending service firms would be an issue but were concerned about being left behind as more institutions move to e-business. Unfortunately, the impact of competition, customer acceptance of the ir e-business initiative and regulatory changes are all areas of high uncertainty. At this point some major questions have to be answered: What if the strategy flops? Are there future growth opportunities? Should we outsource the e-business initiative or build it from the ground up? How do you prioritize potential strategies and perform a financial and strategic feasibility analysis? What is the impact on the organization for going down the wrong path? If we realize we are on the wrong path after starting, can we take steps to get on the right path? What options can we create to enable this? Which of these strategies is optimal?
Figure 9. Real Options Scenario modified from (Mun 2002).
The Real Options Method can provide answers to these important questions and
facilitate better decisions by helping managers to effectively identify and evaluate
alternatives. Specifically, ROM is useful in:
• Identifying different strategic investment decision pathways.
• Valuing each strategic decision pathway and its financial viability and feasibility.
• Prioritizing these pathways/projects based on qualitative and quantitative metrics.
• Optimizing the value of strategic investment decisions by evaluating different decision paths.
27
• Timing the effective execution of investments and finding the optimal trigger values and cost of revenue drivers.
• Managing existing or developing new optionalities and strategic decision pathways for future opportunities (Mun 2002).
B. ADDRESSING RISK WITH ROM
Managers recognize that strategic investments are often made in uncertain
environments, which leads to financial risk. Strategic investments in government,
including information technology investments, fall into this category. ROM is a tool that
allows managers to use options techniques to minimize these financial risks. We begin
our discussion by defining risk.
1. Risk
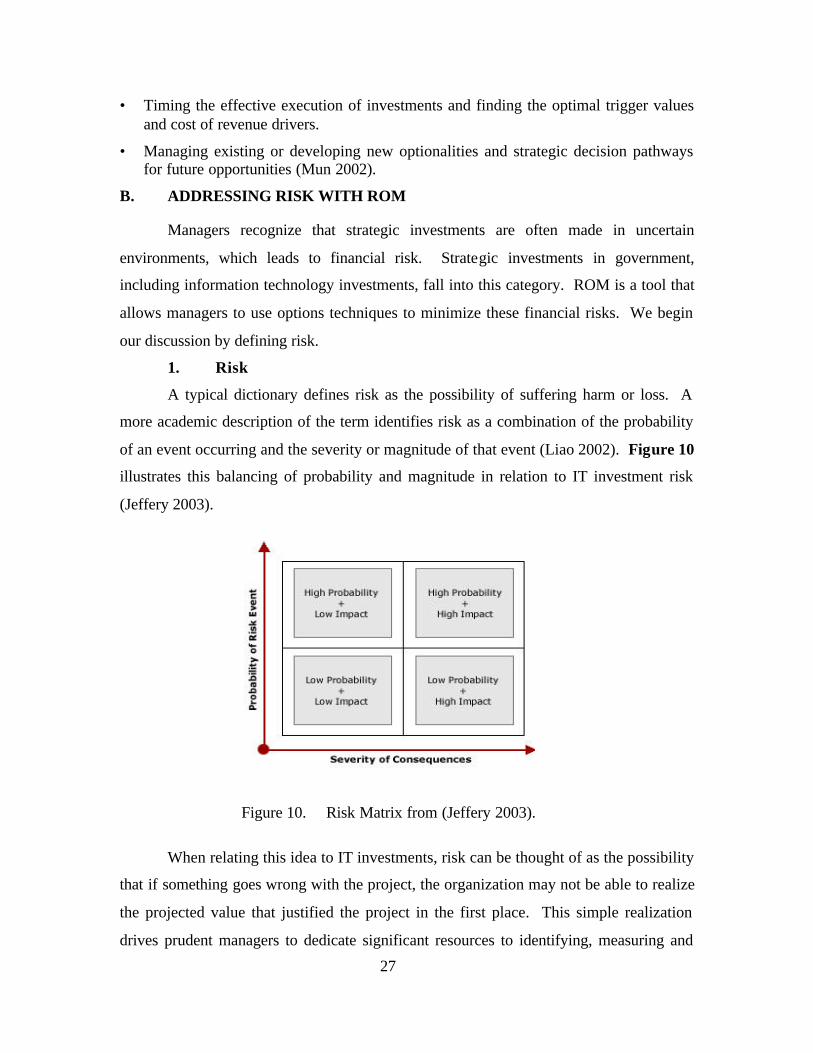
A typical dictionary defines risk as the possibility of suffering harm or loss. A
more academic description of the term identifies risk as a combination of the probability
of an event occurring and the severity or magnitude of that event (Liao 2002). Figure 10
illustrates this balancing of probability and magnitude in relation to IT investment risk
(Jeffery 2003).
Figure 10. Risk Matrix from (Jeffery 2003).
When relating this idea to IT investments, risk can be thought of as the possibility
that if something goes wrong with the project, the organization may not be able to realize
the projected value that justified the project in the first place. This simple realization
drives prudent managers to dedicate significant resources to identifying, measuring and

28
mitigating risks. In fact, the legislation that has led to the adoption of ITPM, the Clinger-
Cohen Act, lists risk management as a primary objective. Implementations of ITPM have
provided managers with tools for measuring the risks that exist in projects and have made
it possible to systematically avoid some risks. Key risk areas incorporated into the DON
IT Capital Planning Guide framework include:
Minimal ROI (or NPV): An investment with a minimally acceptable ROI (or NPV) is inherently risky. Unexpected cost growth could cause the ROI (or NPV) to shift into the unfavorable range.
Project Longevity: Longer duration projects are more risky than those that adopt a modular approach that combines controlled system development with rapid prototyping.
Technical Risk: Investments which involve “cutting edge” technology or which represent new developmental items are more risky than those that take advantage of commercially available or non-developmental items (DON 2001a).
These observations are indicative of the way risk is addressed in ITPM literature
throughout government. This also reflects the reliance of ITPM on traditional methods of
analyzing competing alternatives for IT investment. Unfortunately, this type of risk
aversion can potentially lead to managers passing up on significant opportunities.
Intuitively, managers recognize that some risks must be assumed to take advantage of the
opportunities that technology can potentially create. The DON faces this same dilemma
as it embarks on progressive initiatives like Sea Power 21 with Littoral Combat Vehicles
and with NMCI, the military’s largest information technology program. Change happens,
and managers understand the need to take on certain risks to achieve and retain
competitive advantage. The current methods employed by ITPM are limited in their
ability to help managers deal with managing risk. ROM offers an alternative view.
Instead of viewing risk and uncertainty as something to be avoided at all costs, ROM
demonstrates that uncertainty can be leveraged to allow organizations to exploit
opportunities that could be overlooked when using only traditional tools to assess
investments.

29
2. ROM and Risk
ROM turns the traditional view of risk and uncertainty upside down. ROM can
be used in situations where management has flexibility in making large capital
investment decisions. The NAVSUP Portfolio Management framework expands upon
the DON Capital Planning Guide by identifying four categories or risk:
Cost sensitivity- The sensitivity or quality of price estimates. Technical Risk- Risk to completing the system from a technical standpoint (i.e. hardware/software conformity, availability of commercial support). Organizational Risk- Risk that the proposed system will fail due to organizational disruption (i.e. degree of organizational change required by the system). Risk of Not Doing- Risk to the organization for not proceeding with the project.
We have discussed how risk is categorized in the DON and NAVSUP literature.
The extensive discussion of risk in portfolio management and capital investment
literature underscores the importance being placed on managing risk. However, all of
these categories of risk can be further simplified into two major types of risk---unique
(private) risk and systematic (market) risk (Boer 2002a). Unique risks can be thought of
as those risks that are inherent to a particular organization and are partially subject to the
organization’s control. These are the types of risks that have been a focus of the current
implementations of ITPM. As one might suspect, the higher the unique risk the lower the
value of a project. Conversely, systematic risks are based on volatility that organizations
cannot control. This category of risks is where ROM offers significant potential. ROM
leverages the uncertainty that permeates systematic risks to identify opportunities and
create value. Most projects have aspects of both of these types of risks. Current
implementations of ITPM neglect this fact and therefore cause managers to overlook
opportunities that appear unattractive due to limitations present in current tools such as
NPV and decision tree analysis.
Identifying and addressing risks is an important aspect of managing any
organizational activity. Financial risks associated with IT investment decisions can be
vital to the future of an organization. Hershey’s flawed implementation of an Enterprise
Resource Planning system is a good example of this. In Hershey’s case, the company
lost millions of dollars in sales (18.6% decrease in quarterly sales) during the Halloween

30
and Christmas season due to problems getting products to store shelves (Osterland 2000).
This devastating financial impact is evidence of the importance of managing risks
associated with new investments and projects.
Risk management frameworks such as the ones advocated by the Software
Engineering Institute and the Project Management Institute are gaining acceptance.
These approaches range from “qualitative and subjective assessments of risk to highly
evolved mathematical models to determine optimal courses of action based on time-
dependent probabilities” (Dushanko 2003). ROM incorporates quantitative measures
such as the volatility measure derived through Monte Carlo simulation with the strategic
assessments and justifications found in typical business case analyses. As a result,
decision-makers have additional information that can be crucial in making decisions
when a high degree of uncertainty exists for key elements of the business case such as
cash flows, costs, and effectiveness.
C. APPLYING ROM IN IT PORTFOLIO MANAGEMENT
ITPM is a system for evaluating, selecting, prioritizing, budgeting and planning
for investments. The selection and evaluation of investments is done utilizing traditional
discounted cash flow methods that often do not account for the uncertainty that managers
face when making strategic investments. ROM offers promise as an additional tool at the
disposal of managers to deal with uncertainty and reduce exposure to financial risks. We
begin our discussion by comparing ROM to the traditional discounted cash flow
methodology currently used in ITPM.
1. Comparing ROM to Traditional Methods
ROM takes into account the fact that an organization’s environment is fraught
with uncertainty and risk. An important characteristic of uncertainty is that it typically
becomes reduced over time, as more information is known. ROM incorporates this
learning characteristic, while traditional methods assume away the flexibility managers
have to delay or modify decisions as more information becomes available. Therefore,
increases in time horizon and uncertainty actually increase the value of a real option.
Figure 11 illustrates this principle (Amran and Kulatilaka 1999). The diagram on the left
illustrates the traditional view that shows value decreasing as uncertainty increases and
the real options view, which shows value increasing as uncertainty increases due to

31
options. The bold line on the right side of the diagram illustrates the benefits of options
in minimizing losses while maintaining the potential for gains. The dashed line in this
diagram shows the increased exposure to potential losses when options are not
incorporated. Here we see just how useful options can be in reducing financial risk.
}
+
-
-
+
Sunk Cost ofReal Options
Project NPV
Losses from changes to NPV
Gains fromchanges to NPV
w/o options
with options
Real Options View
Traditional View
Managerial Options Increase Value
Val
ue
Uncertainty
Traditional View (No options)
Real Options View
}
+
-
-
+
Sunk Cost ofReal Options
Project NPV
Losses from changes to NPV
Gains fromchanges to NPV
w/o options
with options
}
+
-
-
+
Sunk Cost ofReal Options
Project NPV
Losses from changes to NPV
Gains fromchanges to NPV
w/o options
with options
Real Options View
Traditional View
Managerial Options Increase Value
Val
ue
Uncertainty
Traditional View (No options)
Real Options View
Real Options View
Traditional View
Managerial Options Increase Value
Val
ue
Uncertainty
Traditional View (No options)
Real Options View Figure 11. ROM vs. Traditional Analysis modified from (Amran and Kulatilaka 1999).
The ROM-ITPM methodology advocated by this study attempts to identify
situations when uncertainty of cash flows (or savings) exists and there is flexibility
regarding the investment decision (alternative options). Figure 12a is a logical diagram
that illustrates how investment decisions are made using only traditional discounted cash
flow models. Once again, this logical process fails to capture the dynamic nature of
investment decisions. Figure 12b is a logical diagram of how the proposed ROM-ITPM
may be incorporated to provide additional insights into investment decisions.

32
a. Logical Diagram of the Current Investment Decision Process.
Do OptionsExist?
Does Project FitOrg. strategy?
Project valueexceeds exercise
price?
High Uncertainty/Expandability?
Develop BusinessCase For
Proposed Projects
Use ROM-ITPMFramework
Use ConventionalValuation
Approaches
Yes Yes
No
Yes
Y e s
No
NoNo
Kill Project
Exercise Option(Expand/Invest)
Do Not Exercise(Wait, Abandon)
Project Meets ROI/NPV objectives?
Invest in ProjectYes
No b. Diagram Incorporating the Proposed ROM-ITPM Methodology.
Figure 12. ROM-ITPM Methodology.
This modified logical diagram provides a disciplined approach to making
investment decisions needed to provide additional insights necessary for better
investment decisions. The remainder of this chapter is dedicated to defining the three-
33
step process of the ROM-ITPM methodology and the important information this new
methodology can provide.
2. Steps for Using ROM to Evaluate a Project
Using ROM to evaluate a project can be accomplished through a series of steps,
which include framing the option, analyzing the option and acting or exercising the
option. Intuitively, most DON managers evaluate options every day. They begin with a
subjective assessment of the probability of a risk event associated with a decision and
attempt to ascertain whether the potential benefits outweigh the potential costs.
Managers do this because they understand that they can little afford to ignore the fact that
the value of a long-term project may change over time due to rapidly changing
technology, shifting requirements and changing threats. ROM provides a mechanism to
quantify this sort of management intuition. As resources become increasingly
constrained, it will become even more important for managers to be able to effectively
quantify the value of alternatives to facilitate intelligent comparisons and sound
investment decisions.
ROM is not a one size fits all solution. In fact, there are times when ROM is not
recommended. For instance, projects with cash flows, costs and effectiveness that are
known or predictable with a high degree of certainty do not require the added rigor of
ROM. Also, in cases where mandates exist for how, when and what to invest in, ROM is
of little use. In such cases, where little uncertainty exists or when no options exist the
traditional methods for making investments are suitable. ROM should be used when any
of the following situations exist:
• There is a contingent investment decision.
• Uncertainty is large enough to make it worthwhile to wait for more information.
• Value may be captured in possibilities for future growth options
• Uncertainty is large enough to make flexibility a consideration.
• When there will be project updates and mid-course strategy corrections (Amran and Kulatilaka 1999).

34
a. Framing the Option
Framing can be thought of in terms of identifying and defining an
opportunity. It is accomplished by dividing the path to the objective into separate stages.
For instance, a large project with a large amount of uncertainty can be separated into a
series of smaller pilot projects. This allows the organization to test the risks of the
project at a reduced cost before expanding the project. Figure 13 is an example of the
type of strategic tree that may be used to frame options.
Start
ExpansionOption
Initial Investmentw/ option
Initial Investment w/o option
Do nothing
Continue
Abandon/DivestStart
ExpansionOption
Initial Investmentw/ option
Initial Investment w/o option
Do nothing
Continue
Abandon/Divest
Figure 13. Strategic Tree Example.
Framing the option also involves developing a business case and assessing
the risks involved. Developing the business case and assessing risks are already integral
parts of ITPM. Although this process typically occurs in the initial stages of ITPM it is
also a critical part of the ROM-ITPM methodology that deserves mention. The business
case must establish the costs and value-creating elements of the proposed project in the
form of cost-savings/cost avoidances, or improved capabilities. When establishing the
business case the organization evaluates whether the proposed investment fits its current
strategy. In an article on this subject, Anthony Tjan provides a strong argument that
management should focus on identifying the viability and business fit of proposed
technology initiatives (Tjan 2001).
Tjan observed that companies often hurt themselves by simultaneously
embarking on numerous uncoordinated projects, betting their company’s future on one
major project, or simply following the crowd investing in “the next big thing”.
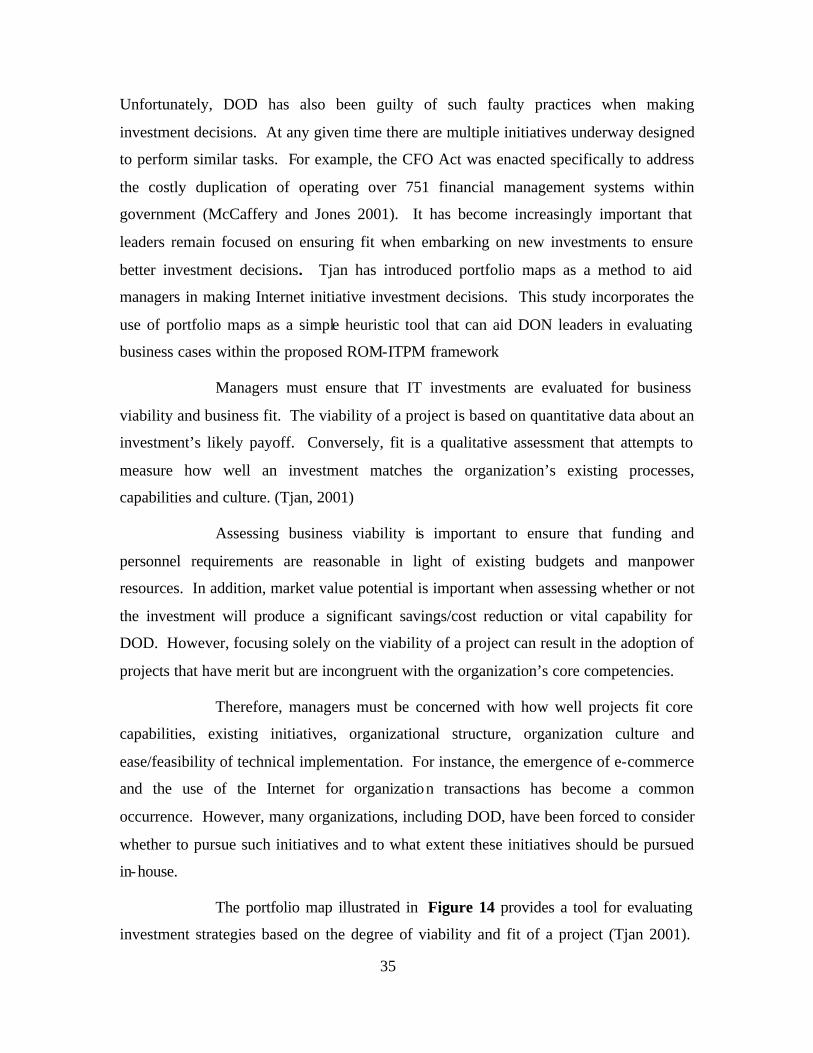
35
Unfortunately, DOD has also been guilty of such faulty practices when making
investment decisions. At any given time there are multiple initiatives underway designed
to perform similar tasks. For example, the CFO Act was enacted specifically to address
the costly duplication of operating over 751 financial management systems within
government (McCaffery and Jones 2001). It has become increasingly important that
leaders remain focused on ensuring fit when embarking on new investments to ensure
better investment decisions. Tjan has introduced portfolio maps as a method to aid
managers in making Internet initiative investment decisions. This study incorporates the
use of portfolio maps as a simple heuristic tool that can aid DON leaders in evaluating
business cases within the proposed ROM-ITPM framework
Managers must ensure that IT investments are evaluated for business
viability and business fit. The viability of a project is based on quantitative data about an
investment’s likely payoff. Conversely, fit is a qualitative assessment that attempts to
measure how well an investment matches the organization’s existing processes,
capabilities and culture. (Tjan, 2001)
Assessing business viability is important to ensure that funding and
personnel requirements are reasonable in light of existing budgets and manpower
resources. In addition, market value potential is important when assessing whether or not
the investment will produce a significant savings/cost reduction or vital capability for
DOD. However, focusing solely on the viability of a project can result in the adoption of
projects that have merit but are incongruent with the organization’s core competencies.
Therefore, managers must be concerned with how well projects fit core
capabilities, existing initiatives, organizational structure, organization culture and
ease/feasibility of technical implementation. For instance, the emergence of e-commerce
and the use of the Internet for organization transactions has become a common
occurrence. However, many organizations, including DOD, have been forced to consider
whether to pursue such initiatives and to what extent these initiatives should be pursued
in-house.
The portfolio map illustrated in Figure 14 provides a tool for evaluating
investment strategies based on the degree of viability and fit of a project (Tjan 2001).

36
For instance, in the e-commerce example described above, managers may make the
assessment that although a project is sound and will produce tangible benefits it is not a
core capability of the organization. In such cases, the project can be described as having
a high degree of viability but a low degree of fit. The portfolio map illustrates that such
a project should be re-assigned or outsourced. By outsourcing this project the
organization can use its resources (personnel and time) to concentrate on core areas.
These types of decisions have become increasingly important in DOD as the demands on
our limited military forces have continued to expand.
Figure 14. ROM-ITPM Portfolio Map from (Tjan 2001).
The proposed ROM-ITPM methodology advocated by this study
incorporates an assessment of strategic fit and viability. The attention given to these two
important aspects of a proposed investment ensures that proposals not worthy of
management attention are weeded out early.
Another critical aspect of framing options is the process of conducting a
risk assessment. In this proposed ROM-ITPM methodology, the risk assessment will be
based on the NAVSUP criteria discussed in Chapter II of this study:
Cost sensitivity- The sensitivity or quality of price estimates.
Re-assignor Spin Out
Revamp
Invest
KillVia
bilit
y
Fit
Most immediate and relevant opportunities
low high
highPortfolio Map
Re-assignor Outsource
Revamp
Invest
KillVia
bilit
y
Fit
Most immediate and relevant opportunities
low high
highPortfolio Map
Re-assignor Spin Out
Revamp
Invest
KillVia
bilit
y
Fit
Most immediate and relevant opportunities
low high
highPortfolio Map
Re-assignor Outsource
Revamp
Invest
KillVia
bilit
y
Fit
Most immediate and relevant opportunities
low high
highPortfolio Map

37
Technical Risk- Risk to completing the system from a technical standpoint (i.e. hardware/software conformity, availability of commercial support). Organizational Risk- Risk that the proposed system will fail due to organizational disruption (i.e. degree of organizational change required by the system). Risk of Not Doing- Risk to the organization for not proceeding with the project.
The ROM-ITPM model developed in this study will incorporate business
case and risk assessment methods used in the NAVSUP Corporate Project Management
System (CPMS) discussed in Chapter II of this study.
b. Analyzing the Option
Analyzing options involves the application of options algorithms. Options
algorithms can be accomplished using Monte Carlo path-dependent simulation methods,
binomial lattices and closed-form equations such as the risk-neutral Black-Scholes
model. Binomial lattices and derivations of the Black-Scholes formula are the most
commonly used of these techniques. This study incorporates the mathematical discipline
of the Black-Scholes formula and the flexibility of binomial lattices available in Crystal
Reports© Real Options software for valuing options. This combined approach provides
us with the accuracy of the Black-Scholes formula and the flexibility of binomial lattices
in modeling and simulating outcomes.
The Black-Scholes formula consists of five parameters:
(1) Value of the underlying security/project (V) - Expected cost savings/cost avoidance or increase in capabilities obtained by using traditional DCF methods.
(2) Exercise (strike) price (X) - Stated price at which the security (project) can be bought or sold.
(3) Time to expiration (T) - Length of time from one stage of the program to the next opportunity to exercise the option.
(4) Volatility ( σ ) - Degree of uncertainty that exists regarding the program.
(5) Risk-free interest rate (r)- Standard rate used based on the government Treasury bond (Mun 2002).

38
The Black-Scholes formula and its underlying assumptions are listed in
Figure 15 (Mun 2002). This formula is used to calculate the value of a Real Options call
(C).
A s s u m p t i o n s o f t h e B l a c k a n d S c h o l e s M o d e l :
1 ) T h e s t o c k p a y s n o d i v i d e n d s d u r i n g t h e o p t i o n ' s l i f e- M o s t c o m p a n i e s p a y d i v i d e n d s t o t h e i r s h a r e h o l d e r s , s o t h i s m i g h t s e e m a s e r i o u s l i m i t a t i o n t o t h e m o d e l c o n s i d e r i n g t h e o b s e r v a t i o n t h a t h i g h e r d i v i d e n d y i e l d s e l i c i t l o w e r c a l l p r e m i u m s . A c o m m o n w a y o f a d j u s t i n g t h e m o d e l f o r t h i s s i t u a t i o n i s t o s u b t r a c t t h e d i s c o u n t e d v a l u e o f a f u t u r e d i v i d e n d f r o m t h e s t o c k p r i c e .
2 ) E u r o p e a n e x e r c i s e t e r m s a r e u s e d - E u r o p e a n e x e r c i s e t e r m s d i c t a t e t h a t t h e o p t i o n c a n o n l y b e e x e r c i s e d o n t h e e x p i r a t i o n d a t e . A m e r i c a n e x e r c i s e t e r m a l l o w t h e o p t i o n t o b e e x e r c i s e d a t a n y t i m e d u r i n g t h e l i f e o f t h e o p t i o n , m a k i n g a m e r i c a n o p t i o n s m o r e v a l u a b l e d u e t o t h e i r g r e a t e r f l e x i b i l i t y . T h i s l i m i t a t i o n i s n o t a m aj o r c o n c e r n b e c a u s e v e r y f e w c a l l s a r e e v e r e x e r c i s e d b e f o r e t h e l a s t f e w d a y s o f t h e i r l i f e . T h i s i s t r u e b e c a u s e w h e n y o u e x e r c i s e a c a l l e a r l y , y o u f o r f e i t t h e r e m a i n i n g t i m e v a l u e o n t h e c a l l a n d c o l l e c t t h e i n t r i n s i c v a l u e . T o w a r d s t h e e n d o f t h e l i f e o f a c a l l , t h e r e m a i n i n g t i m e v a l u e i s v e r y s m a l l , b u t t h e i n t r i n s i c v a l u e i s t h e s a m e .
3 ) M a r k e t s a r e e f f i c i e n t - T h i s a s s u m p t i o n s u g g e s t s t h a t p e o p l e c a n n o t c o n s i s t e n t l y p r e d i c t t h e d i r e c t i o n o f t h e m a r k e t o r a n i n d i v i d u a l s t o c k . T h e m a r k e t o p e r a t e s c o nt i n u o u s l y w i t h s h a r e p r i c e s f o l l o w i n g a c o n t i n u o u s I t ô p r o c e s s . T o u n d e r s t a n d w h a t a c o n t i n u o u s I t ô p r o c e s s i s , y o u m u s t f i r s t k n o w t h a t a M a r k o v p r o c e s s i s " o n e w h e r e t h e o b s e r v a t i o n i n t i m e p e r i o d t d e p e n d s o n l y o n t h e p r e c e d i n g o b s e r v a t i o n . " A n I t ô p r o c e s s i s s i m p l y a M a r k o v p r o c e s s i n c o n t i n u o u s t i m e . I f y o u w e r e t o d r a w a c o n t i n u o u s p r o c e s s y o u w o u l d d o s o w i t h o u t p i c k i n g t h e p e n u p f r o m t h e p i e c e o f p a p e r .
4 ) N o c o m m i s s i o n s a r e c h a r g e d - U s u a l l y m a r k e t p a r t i c i p a n t s d o h a v e t o p a y a c o m m i s s i o n t o b u y o r s e l l o p t i o n s . E v e n f l o o r t r a d e r s p a y s o m e k i n d o f f e e , b u t i t i s u s u a l l y v e r y s m a l l . T h e f e e s t h a t I n d i v i d u a l i n v e s t o r ' s p a y i s m o r e s u b s t a n t i a l a n d c a n o f t e n d i s t o r t t h e o u t p u t o f t h e m o d e l .
5 ) I n t e r e s t r a t e s r e m a i n c o n s t a n t a n d k n o w n - T h e B l a c k a n d S c h o l e s m o d e l u s e s t h e r i s k -f r e e r a t e t o r e p r e s e n t t h i s c o n s t a n t a n d k n o w n r a t e . I n r e a l i t y t h e r e i s n o s u c h t h i n g a s t h e r i s k - f r e e r a t e , b u t t h e d i s c o u n t r a t e o n U . S . G o v e r n m e n t T r e a s u r y B i l l s w i t h 3 0 d a y s l e f t u n t i l m a t u r i t y i s u s u a l l y u s e d t o r e p r e s e n t i t . D u r i n g p e r i o d s o f r a p i d l y c h a n g i n g i n t e r e s t r a t e s , t h e s e 3 0 d a y r a t e s a r e o f t e n s u b j e c t t o c h a n g e , t h e r e b y v i o l a t i n g o n e o f t h e a s s u m p t i o n s o f t h e m o d e l .
6 ) R e t u r n s a r e l o g n o r m a l l y d i s t r i b u t e d - T h i s a s s u m p t i o n s u g g e s t s , r e t u r n s o n t h e u n d e r l y i n g s t o c k a r e n o r m a l l y d i s t r i b u t e d , w h i c h i s r e a s o n a b l e f o r m o s t a s s e t s t h a t o f f e r o p t i o n s.
Figure 15. Black-Scholes Formula and Assumptions from (Mun 2002).
C= Value of a call option
N= Cumulative standard normal distribution
e= exponential term (2.7183)
d= continuous dividend payout Tdd
T
Tr
XV
d
dNXedVNC rT
σ
σ
σ
−=
++
=
−= −
12
2
21
)2
()ln(
),()(
39
The primary benefit of the Black-Scholes formula is that very little
information is needed about the underlying asset in order to compute the value of the
option. An in-depth discussion of the Black-Scholes would require significant coverage
of advanced mathematics and is beyond the scope of this study. Actual calculations will
be achieved utilizing software designed to generate solutions based on the five
parameters described above. Before applying option algorithms a manager knows the
cost of the project (X), the anticipated time before being able to execute the project
option (T), the value of the underlying asset/project based on simulated discounted cash
flows (V), and the risk-free interest rate (r). The remaining volatility parameter (σ ) is
computed using techniques described later in this chapter.
Although an in-depth discussion of the Black-Scholes formula is beyond
the scope of this study, understanding the important relationships expressed by this
equation is helpful in understanding ROM. Simply put, the fair market value of a call
option is determined by taking the difference between the expected value of the
project/asset and the present value of what is paid to invest in that project/asset. The
expected value of the underlying asset/project is (VN d1) and the present value of paying
the exercise price for that asset/project (Xe-rtN d2). The continuous dividend payouts (d1
and d2) are computed percentages designed to reflect the impact of time and uncertainty
on V and X. Figure 16 is a deconstruction of the Black-Scholes equation that illustrates
this point (Amran and Kulatilaka 1999). We see from the Black-Scholes equation that
higher uncertainty and longer times to expiration result in a higher option value. This
option value is useful to management because it places a price tag on how much
managers should be willing to pay for an option. When considering real options, this is
the amount of funding allotted for a pilot project, or how much should be spent on
assets/projects that provide opportunities for future expansion or greater capabilities.

40
Figure 16. Black-Scholes Deconstructed modified from (Amran and Kulatilaka 1999).
Although not as precise, binomial lattices lead to results similar to those
derived using Black-Scholes. Binomial lattices provide a discrete simulation of
stochastic processes (involving probabilities). They are useful because they provide a
simple graphical method of understanding the range of alternatives available based on the
probabilities of various outcomes. The accuracy of binomial lattices are based on the
number of branching events in a lattice referred to as time-steps. These time steps should
not be confused with the branches of the strategic tree discussed in step one of this three-
step process. Instead, these time-steps represent the number of simulations of the
stochastic processes related to a single strategic pathway within a given time frame. As
the number of time-steps used in formulating binomial lattices increase, the calculated
solution approaches the closed-form Black-Scholes solution. Similar to Black-Scholes,
binomial lattices are derived through risk neutral valuation using risk-free rates of return.
The starting value of the underlying asset (V) is multiplied by the up (u) and down (d)
factors to create the binomial lattice. These factors provide a method of determining the
change in project value based on different outcomes with up meaning favorable and
down indicating unfavorable outcomes. Figure 17 below illustrates how these binomial
lattices are derived (Mun 2002).
C = V N ( d 1 ) - X e - r T N ( d 2 ) ,
Expected Value of the underlying asset factoring in the volatility of the asset
Present Value of investment cost
(minus)
d2= d1 - s vT
Larger volatility and Time values result in a smaller investment cost and a higher option value
+
-
C = V N ( d 1 ) - X e - r T N ( d 2 ) ,
Expected Value of the underlying asset factoring in the volatility of the asset
Present Value of investment cost
(minus)
d2= d1 - s vT
Larger volatility and Time values result in a smaller investment cost and a higher option value
+
-Tdd σ−= 12
C = V N ( d 1 ) - X e - r T N ( d 2 ) ,
Expected Value of the underlying asset factoring in the volatility of the asset
Present Value of investment cost
(minus)
d2= d1 - s vT
Larger volatility and Time values result in a smaller investment cost and a higher option value
+
-
C = V N ( d 1 ) - X e - r T N ( d 2 ) ,
Expected Value of the underlying asset factoring in the volatility of the asset
Present Value of investment cost
(minus)
d2= d1 - s vT
Larger volatility and Time values result in a smaller investment cost and a higher option value
+
-Tdd σ−= 12
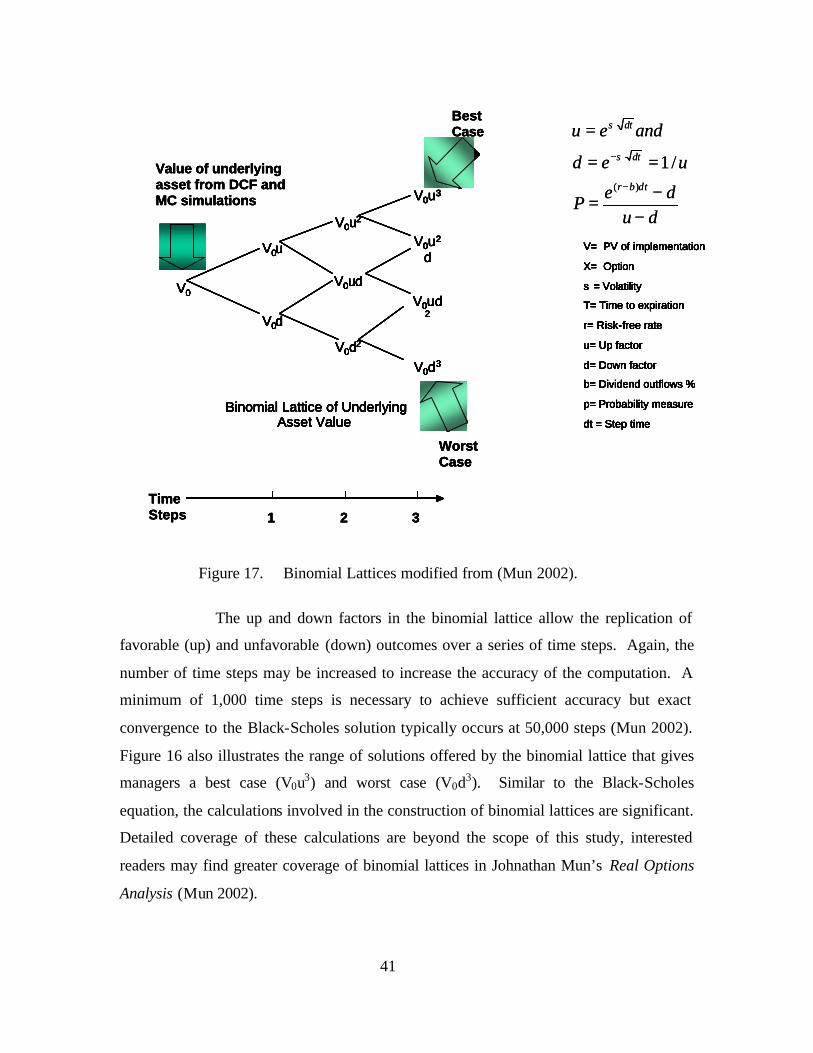
41
Figure 17. Binomial Lattices modified from (Mun 2002).
The up and down factors in the binomial lattice allow the replication of
favorable (up) and unfavorable (down) outcomes over a series of time steps. Again, the
number of time steps may be increased to increase the accuracy of the computation. A
minimum of 1,000 time steps is necessary to achieve sufficient accuracy but exact
convergence to the Black-Scholes solution typically occurs at 50,000 steps (Mun 2002).
Figure 16 also illustrates the range of solutions offered by the binomial lattice that gives
managers a best case (V0u3) and worst case (V0d3). Similar to the Black-Scholes
equation, the calculations involved in the construction of binomial lattices are significant.
Detailed coverage of these calculations are beyond the scope of this study, interested
readers may find greater coverage of binomial lattices in Johnathan Mun’s Real Options
Analysis (Mun 2002).
V= PV of implementation
X= Option
s = Volatility
T= Time to expiration
r= Risk-free rate
u= Up factor
d= Down factor
b= Dividend outflows %
p= Probability measure
dt = Step time
V= PV of implementation
X= Option
s = Volatility
T= Time to expiration
r= Risk-free rate
u= Up factor
d= Down factor
b= Dividend outflows %
p= Probability measure
dt = Step time
V= PV of implementation
X= Option
s = Volatility
T= Time to expiration
r= Risk-free rate
u= Up factor
d= Down factor
b= Dividend outflows %
p= Probability measure
dt = Step time
V= PV of implementation
X= Option
s = Volatility
T= Time to expiration
r= Risk-free rate
u= Up factor
d= Down factor
b= Dividend outflows %
p= Probability measure
dt = Step time
V0
V0u
V0d
V0u2
V0ud
V0d2
V0u3
V0u2
d
V0ud2
V0d3
Binomial Lattice of Underlying Asset Value
Best Case
Worst Case
Value of underlying asset from DCF and MC simulations
Time Steps 1 2 3
V0
V0u
V0d
V0u2
V0ud
V0d2
V0u3
V0u2
d
V0ud2
V0d3
Binomial Lattice of Underlying Asset Value
V0
V0u
V0d
V0u2
V0ud
V0d2
V0u3
V0u2
d
V0ud2
V0d3
Binomial Lattice of Underlying Asset Value
V0
V0u
V0d
V0u2
V0ud
V0d2
V0u3
V0u2
d
V0ud2
V0d3
Binomial Lattice of Underlying Asset Value
Best Case
Worst Case
Value of underlying asset from DCF and MC simulations
Time Steps 1 2 3
dudeP
ued
andeu
tbr
t
t
−−=
==
=
−
−
δ
δσ
δσ
)(
/1
V= PV of implementation
X= Option
s = Volatility
T= Time to expiration
r= Risk-free rate
u= Up factor
d= Down factor
b= Dividend outflows %
p= Probability measure
dt = Step time
V= PV of implementation
X= Option
s = Volatility
T= Time to expiration
r= Risk-free rate
u= Up factor
d= Down factor
b= Dividend outflows %
p= Probability measure
dt = Step time
V= PV of implementation
X= Option
s = Volatility
T= Time to expiration
r= Risk-free rate
u= Up factor
d= Down factor
b= Dividend outflows %
p= Probability measure
dt = Step time
V= PV of implementation
X= Option
s = Volatility
T= Time to expiration
r= Risk-free rate
u= Up factor
d= Down factor
b= Dividend outflows %
p= Probability measure
dt = Step time
V0
V0u
V0d
V0u2
V0ud
V0d2
V0u3
V0u2
d
V0ud2
V0d3
Binomial Lattice of Underlying Asset Value
Best Case
Worst Case
Value of underlying asset from DCF and MC simulations
Time Steps 1 2 3
V0
V0u
V0d
V0u2
V0ud
V0d2
V0u3
V0u2
d
V0ud2
V0d3
Binomial Lattice of Underlying Asset Value
V0
V0u
V0d
V0u2
V0ud
V0d2
V0u3
V0u2
d
V0ud2
V0d3
Binomial Lattice of Underlying Asset Value
V0
V0u
V0d
V0u2
V0ud
V0d2
V0u3
V0u2
d
V0ud2
V0d3
Binomial Lattice of Underlying Asset Value
Best Case
Worst Case
Value of underlying asset from DCF and MC simulations
Time Steps 1 2 3
dudeP
ued
andeu
tbr
t
t
−−=
==
=
−
−
δ
δσ
δσ
)(
/1
42
This study will utilize binomial lattices as well as the Black-Scholes
model for the purpose of discussion because “it is recommended that both approaches be
used to verify the results” of calculations (Mun 2002). The Crystal Reports© Real
Options software incorporates both Black-Scholes and binomial lattices into a single
graphical display based on common inputs: (1) value of the underlying asset – V, (2)
exercise price-X, (3) time to expiration-T, (4) risk-free rate- r, and (5) volatility- σ . For
this reason, the results of the Serial Number Tracking example provided in Chapter Four
will be illustrated using binomial lattices produced in the Crystal Reports© Real Options
software.
The first stage in applying these options algorithms is to use the strategic
tree structure developed in the framing step to identify the scenarios that can be
undertaken. Based on this strategic tree, calculate the net present value (NPV) of each
potential strategy using discounted cash flow methodology. Incorporating Monte Carlo
simulations to improve upon this calculation can be useful. Keep in mind that utilizing
Crystal Ball© to simulate cash flows and improve the NPV calculation is not a substitute
for ROM. Such simulations do not provide important information such as the cost of
waiting, the value of an option, and the optimal time to expand.
The NPV obtained at this point is the value of the underlying asset (V)
required for calculating the value of the option. The next and most challenging stage in
applying these algorithms is to calculate the volatility, a numerical expression of the
uncertainty of the predicted benefits/savings/cash flows. Accounting for this uncertainty
is one of the major differences between ROM and traditional discounted cash flow
methods. The uncertainty surrounding cash flows is referred to as volatility (s).
Volatility is “…the most difficult input parameter to estimate in a real options analysis”
(Mun 2002).
The ROM volatility estimate may be derived using several different
approaches. These include the logarithmic cash flow returns approach, logarithmic
present value approach, management assumption approach, market proxy approach and
the complex Generalized Autoregressive Conditional Heteroskedasticity (GARCH)
approach which is based on the work of the recent Nobel Prize winner NYU’s Robert F.

43
Engle (Mun 2002).3 For the purposes of this study we will utilize the logarithmic present
value approach because it accommodates the initial negative cash flows experienced in
our SNT example. This approach assumes a 10 percent discount rate and collapses all
future cash flow estimates into two sets of present values, one for the first time period
(time period one) and another for the present time (time period zero). The log of the
present value at time period one is then divided by the log of time period zero to obtain
an X-value (ratio of the two present values). A Monte Carlo simulation is then used to
calculate a standard deviation for a forecasted distribution of the X-value. This standard
deviation is used as the volatility estimate (s ) for Black-Scholes and binomial lattice
calculations. This computation along with the other volatility estimate approaches
mentioned above can be accomplished quickly utilizing the volatility estimates tool found
in Crystal Ball© Real Options Software used in this study. Figure 18 illustrates the
results obtained from this computation.
3 Discussion of GARCH and other advanced methods of calculating volatility are beyond the scope of
this research. More information regarding the use of these techniques can be found in Johnathan Mun’s Real Options Analysis (2002), and other financial/economics texts.

44
Figure 18. Calculating Volatility.
Once volatility and NPV calculations are obtained, the Crystal Reports©
Real Options software can be utilized to calculate the option value. At this point, an
assessment may be made as to whether a strategy that includes the purchase of an option
(e.g. pilot test or partial roll out) is more valuable. This step in ROM also provides
decision makers with important insights such as:
(1) Value of perfect information. This provides a dollar amount for how much we should we be willing to spend on pilot tests or advanced functionality before embarking on a complete rollout.
(2) Optimal time to expand. This estimates when expansion will make economic sense.
(3) Breakeven cost of waiting. Based on the cost of waiting this illustrates how long we should be willing to wait before executing the strategy or exercising the option (Mun 2003).
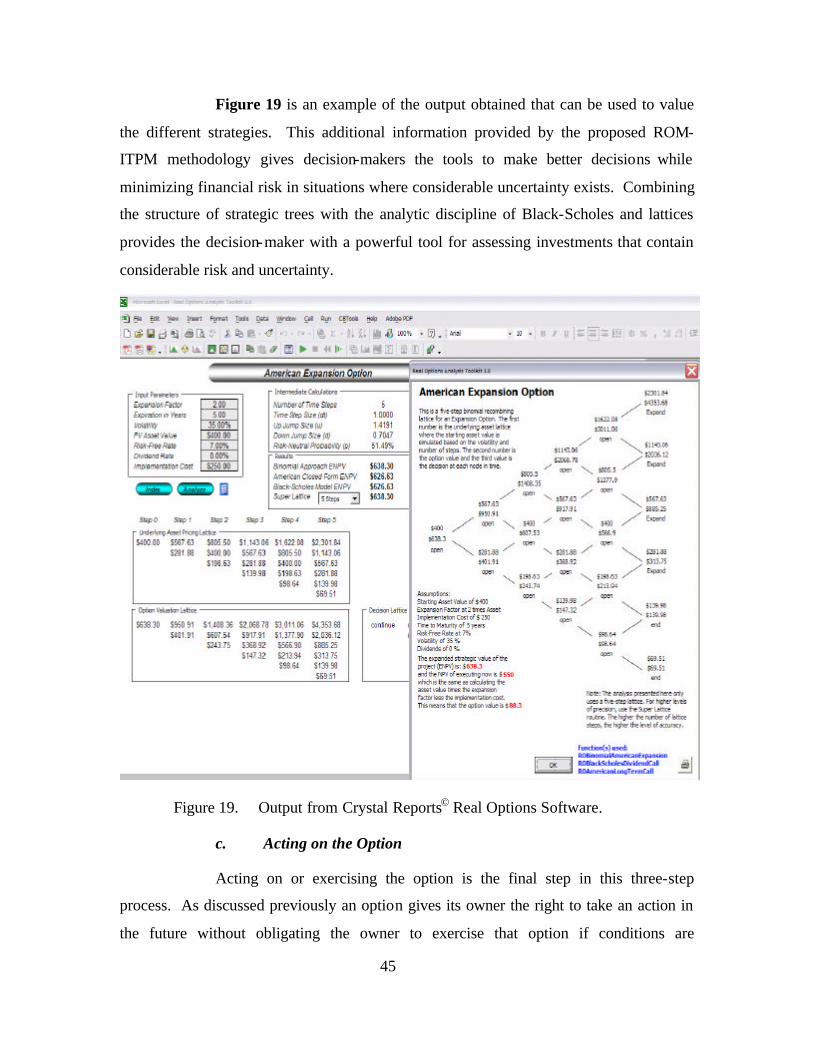
45
Figure 19 is an example of the output obtained that can be used to value
the different strategies. This additional information provided by the proposed ROM-
ITPM methodology gives decision-makers the tools to make better decisions while
minimizing financial risk in situations where considerable uncertainty exists. Combining
the structure of strategic trees with the analytic discipline of Black-Scholes and lattices
provides the decision-maker with a powerful tool for assessing investments that contain
considerable risk and uncertainty.
Figure 19. Output from Crystal Reports© Real Options Software.
c. Acting on the Option
Acting on or exercising the option is the final step in this three-step
process. As discussed previously an option gives its owner the right to take an action in
the future without obligating the owner to exercise that option if conditions are

46
unfavorable. It stands to reason that in ROM, the option is only exercised when the value
derived by exercising the option is deemed sufficient to warrant exercising the option.
Therefore, exercising the real option consists of the decision to pursue a project by
signing a contract or purchase agreement. The project phases identified in step one of
this three-step process allow managers to view each stage as the purchase of an option to
pursue the next stage of a project. This important aspect of this process gives the
organization an opportunity to learn more about the risks involved in a project before
moving ahead into a progressively larger (more expensive) stage. By using ROM in
ITPM the organization can make better investment decisions and utilize the flexibility of
options to avoid missing important opportunities.
This study offers a structured approach for determining when the ROM-
ITPM methodology should be used. The logical diagram provided in Figure 12b is
designed to aid managers in deciding when to employ the ROM-ITPM methodology.
Figure 20 illustrates the proposed ROM-ITPM process advocated in this study. This
ROM-ITPM process begins in the ITPM select, manage, and evaluate cycle. Managers
can then use the portfolio map to evaluate proposed projects for viability and fit. This
stage involves a review of the project’s business case including discounted cash flow
analysis. The initial option framing step takes place when a strategic tree is developed to
identify possible strategies for executing the project incorporating options (pilot tests,
advanced procurements of features/capabilities etc.). Once potential strategies are
identified the analyzing step begins as options are analyzed using Crystal Reports© Real
Options software to simulate discounted cash flows and calculate option values. In the
final step, managers are able to act on the option by utilizing the outputs obtained from
the ROM-ITPM methodology to compare competing projects, optimize a portfolio of
investments, or make new (or expansion) investment decisions. This proposed ROM-
ITPM methodology will be tested in Chapter IV using the NAVSUP AIT project as an
example.
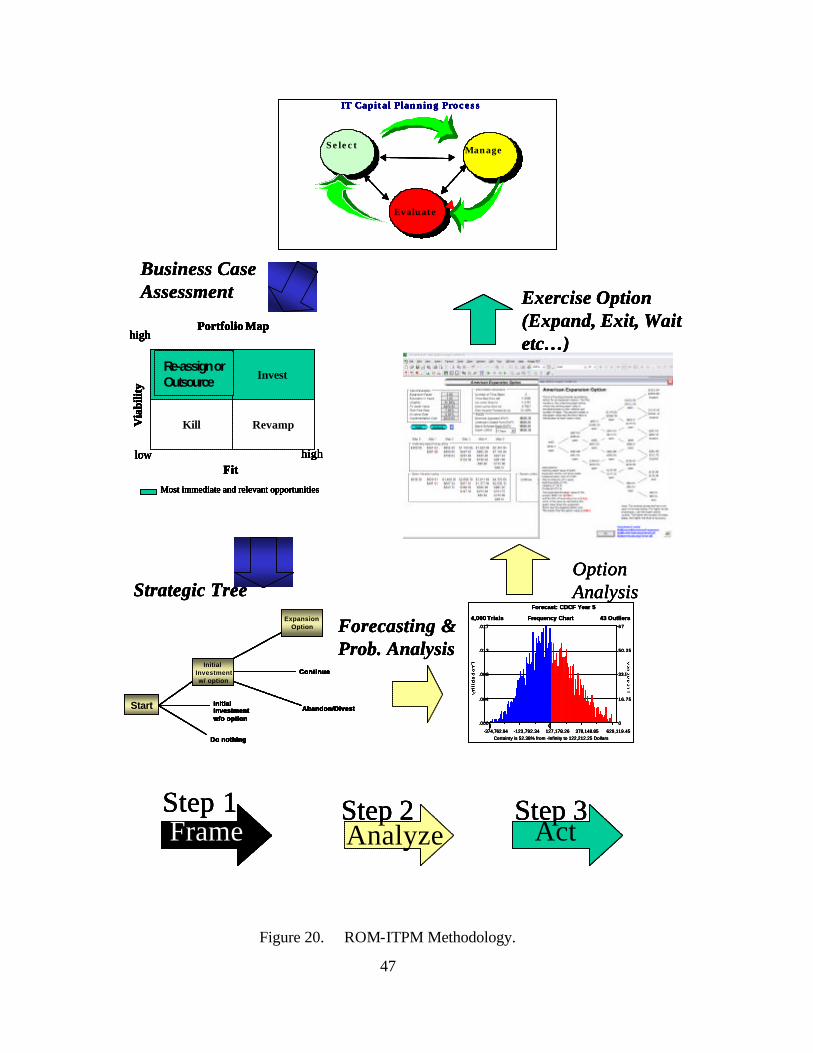
47
Figure 20. ROM-ITPM Methodology.
Manage
Evaluate
IT Capital Planning Process
Select
Frequency Chart
Certainty is 52.38% from -Infinity to 122,212.25 Dollars
.000
.004
.008
.013
.017
0
16.75
33.5
50.25
67
-374,762.94 -123,792.34 127,178.26 378,148.85 629,119.45
4,000 Trials 43 Outliers
Forecast: CDCF Year 5
Business Case Assessment
Strategic Tree
Forecasting & Prob. Analysis
Option Analysis
Exercise Option (Expand, Exit, Wait etc…)
Re-assignor Spin Out
Revamp
Invest
KillVia
bilit
y
Fit
Most immediate and relevant opportunities
low high
highPortfolio Map
Re-assignor Spin Out
Revamp
Invest
KillVia
bilit
y
Fit
Most immediate and relevant opportunities
low high
highPortfolio Map
Start
ExpansionOption
Initial Investmentw/ option
Initial Investment w/o option
Do nothing
Continue
Abandon/DivestStart
ExpansionOption
Initial Investmentw/ option
Initial Investment w/o option
Do nothing
Continue
Abandon/Divest
Frame Analyze ActStep 1 Step 2 Step 3
Manage
Evaluate
IT Capital Planning Process
Select Manage
Evaluate
IT Capital Planning Process
Select
Frequency Chart
Certainty is 52.38% from -Infinity to 122,212.25 Dollars
.000
.004
.008
.013
.017
0
16.75
33.5
50.25
67
-374,762.94 -123,792.34 127,178.26 378,148.85 629,119.45
4,000 Trials 43 Outliers
Forecast: CDCF Year 5
Business Case Assessment
Strategic Tree
Forecasting & Prob. Analysis
Option Analysis
Exercise Option (Expand, Exit, Wait etc…)
Re-assignor Spin Out
Revamp
Invest
KillVia
bilit
y
Fit
Most immediate and relevant opportunities
low high
highPortfolio Map
Re-assignor Spin Out
Revamp
Invest
KillVia
bilit
y
Fit
Most immediate and relevant opportunities
low high
highPortfolio Map
Start
ExpansionOption
Initial Investmentw/ option
Initial Investment w/o option
Do nothing
Continue
Abandon/DivestStart
ExpansionOption
Initial Investmentw/ option
Initial Investment w/o option
Do nothing
Continue
Abandon/Divest
Frame Analyze ActStep 1 Step 2 Step 3
Re-assign or Outsource
Manage
Evaluate
IT Capital Planning Process
Select
Frequency Chart
Certainty is 52.38% from -Infinity to 122,212.25 Dollars
.000
.004
.008
.013
.017
0
16.75
33.5
50.25
67
-374,762.94 -123,792.34 127,178.26 378,148.85 629,119.45
4,000 Trials 43 Outliers
Forecast: CDCF Year 5
Business Case Assessment
Strategic Tree
Forecasting & Prob. Analysis
Option Analysis
Exercise Option (Expand, Exit, Wait etc…)
Re-assignor Spin Out
Revamp
Invest
KillVia
bilit
y
Fit
Most immediate and relevant opportunities
low high
highPortfolio Map
Re-assignor Spin Out
Revamp
Invest
KillVia
bilit
y
Fit
Most immediate and relevant opportunities
low high
highPortfolio Map
Start
ExpansionOption
Initial Investmentw/ option
Initial Investment w/o option
Do nothing
Continue
Abandon/DivestStart
ExpansionOption
Initial Investmentw/ option
Initial Investment w/o option
Do nothing
Continue
Abandon/Divest
Frame Analyze ActStep 1 Step 2 Step 3
Manage
Evaluate
IT Capital Planning Process
Select Manage
Evaluate
IT Capital Planning Process
Select
Frequency Chart
Certainty is 52.38% from -Infinity to 122,212.25 Dollars
.000
.004
.008
.013
.017
0
16.75
33.5
50.25
67
-374,762.94 -123,792.34 127,178.26 378,148.85 629,119.45
4,000 Trials 43 Outliers
Forecast: CDCF Year 5
Business Case Assessment
Strategic Tree
Forecasting & Prob. Analysis
Option Analysis
Exercise Option (Expand, Exit, Wait etc…)
Re-assignor Spin Out
Revamp
Invest
KillVia
bilit
y
Fit
Most immediate and relevant opportunities
low high
highPortfolio Map
Re-assignor Spin Out
Revamp
Invest
KillVia
bilit
y
Fit
Most immediate and relevant opportunities
low high
highPortfolio Map
Start
ExpansionOption
Initial Investmentw/ option
Initial Investment w/o option
Do nothing
Continue
Abandon/DivestStart
ExpansionOption
Initial Investmentw/ option
Initial Investment w/o option
Do nothing
Continue
Abandon/Divest
Frame Analyze ActStep 1 Step 2 Step 3
Re-assign or Outsource

48
THIS PAGE INTENTIONALLY LEFT BLANK
49
IV. MANAGING INVESTMENT RISKS WITH THE ROM-ITPM FRAMEWORK
A. AUTOMATIC IDENTIFICATION TECHNOLOGY (AIT) AND SERIAL NUMBER TRACKING
The Department of Defense Automatic Identification Technology Office
(DODAIT) has defined Automatic Identification Technology (AIT) as “the basic building
block in the Defense Department's efforts to provide timely asset visibility in the logistics
pipeline, whether in-process, in-storage, or in- transit” (DOD 2003). There are many
forms of AIT media including barcodes, radio frequency ID, satellite tracking systems,
smart cards/CAC, optical memory cards, and contact memory buttons. Each of the DOD
services have begun developing programs to facilitate the use of AIT to enhance asset
visibility and support the needs of our agile military forces by enabling data collection,
tracking, documenting and controlling our agile military forces and its material.
NAVSUP is currently leading the Department of the Navy (DON) AIT through its
Serial Number Tracking (SNT) project. The SNT project was initiated in November
1998 in response to the Aviation Supply-Maintenance Readiness (AMSR) review, which
determined that a serial number tracking system was required to assist in determining
what factors were causing increasing costs and decreasing reliability of aviation depot
level repairables (NAVSUP 2003a). SNT is defined in the NAVSUP SNT Concept of
Operations as “closed- loop cradle-to-grave tracking of maintenance critical serialized
parts, providing asset and material status, and enabled by Automatic Identification
Technology” (NAVSUP 2000). Once implemented, SNT will consist of a web-based
Serial Number Tracking system that serves as a data warehouse for all material being
tracked. This web-based system will provide near real-time information to customers
relying on timely, accurate data. The second piece of the SNT program includes the use
of an automated method of marking and identifying equipment to eliminate the need for
manual entry of data. The goals of this program include: (1) Reduction in total inventory
ownership costs, (2) Reduction in secondary inventory level and (3) Enhancement of
customer (war fighter) satisfaction (NAVSUP 2000).
50
The primary media envisioned for use in SNT are two-dimensional (2-D)
barcodes and contact memory buttons. Two-dimensional barcodes are the most advanced
barcode technology that allows for storage of over 7000 numeric or over 4200
alphanumeric characters (NAVSUP 2000). This data storage method provides the wide
range of data needed by military users, military and civilian repair personnel and
suppliers. The barcode technology will dramatically reduce the need for re-entry of data
and reduce the errors created by multiple data entry.
Contact memory buttons (CMBs) are also an integral part of NAVSUP’s
proposed solution. A CMB is a small (size of a coin) data-storage device that can be
attached to material to electronically store data for accurate material identification. These
devices cost between $7-$13 and can store 2KB-8MB of data depending on the type of
CMB. This technology provides another viable method of eliminating errors created by
manual data entry.
B. EVALUATING SNT WITH TRADITIONAL DISCOUNTED CASH FLOWS
Traditional discounted cash flow methods provide a simple mechanism for
determining the desirability of a project. This analysis is performed by identifying the
relevant cash flows for a given project over a specified time period. These cash flows are
then discounted based on the market risk-adjusted discount rate known as the weighted
average cost of capital (WACC). Discounting these cash flows results in the present
value of future cash flows (or savings) relevant to the project. The net present value
(NPV) is then derived by computing the sum of cash flows minus the initial outlays for
the project. When projects consist only of a stream of costs, the project with the lowest
NPV is more attractive. If the project cash flows are revenues or cost savings, the project
proposal with the highest NPV is more attractive. Simply stated, NPV is utilized to
assess the economic merit of projects as well as a tool to compare competing alternatives.
The SNT project has been presented as an investment that will generate cost
savings. Therefore, a higher NPV is desirable when evaluating this project. Fitting Out
& Supply Support Assistance Center (FOSSAC) and SABRE CORPORATION provided
the initial business case for this project. The current SNT project managers have
subsequently refined this business case analysis. Figure 21 is a summary of the analysis

51
performed for the SNT project (FOSSAC 1999). Assuming a $3.3M initial investment
(combined ‘99/’00), a standard 10% discount rate, and five years of uneven cash flows,
the NPV of the cash flows for this project is $116,416,842. Based on this analysis, this
project is an easy choice. However, as we shall see, this analysis does not capture many
other elements that affect other investment decisions during the life cycle management of
this project.
Figure 21. SNT/AIT Return on Investment Analysis.
This analysis provides a snapshot of the potential benefits of the SNT project
based on the circumstances presented. However, relying solely on this traditional
analysis fails to account for the uncertainty of future events and the flexibility that
managers have in how and when to execute this decision to invest. What happens when
initial cash flow assumptions are not realized over time? What happens if the technology
or procedural requirements prove to be too cumbersome and never become widely
accepted and used? What happens if technological changes result in a better technique to

52
accomplish the objective? These questions underscore the fundamental problem of
relying solely on traditional methods such as DCF analysis to evaluate projects. The
uncertainty inherent in many technology-based capital investment decisions is not
accounted for in DCF analysis. ROM provides a mechanism to supplement traditional
DCF methodology to gain further insights into potential investments.
C. USING ROM TO EVALUATE THE SNT PROJECT
Chapter III provided a brief outline of the ROM-ITPM methodology that is
advocated by this study. At this point in the discussion it is important to point out once
more that the ROM-ITPM methodology is not intended to replace the traditional methods
of evaluating projects. Instead, this methodology is advocated as a useful supplement to
the tools already in use. As discussed earlier, ROM provides managers with an
alternative view of project value that takes into account management’s ability to alter
decisions. The ROM-ITPM methodology advocated by this study uses a three step
process that provides the rigor of traditional DCF methods along with simulation and risk
analysis tools available in the Crystal Reports© software. This software has been selected
because it is a widely used risk analysis tool that has been catered specifically to real
options applications. The remainder of this chapter is devoted to the application of the
ROM-ITPM methodology in evaluating the NAVSUP SNT project to discern ROM-
ITPM’s usefulness as a tool for selecting and evaluating projects. The discussion will
follow the same three-step pattern presented in Chapter III: framing the option, analyzing
the option and acting on the option.
1. Framing the Option
The first step in the ROM-ITPM framework is to frame the option. Framing the
option involves determining whether options exist and whether there is uncertainty. The
SNT project has been designed in response to the Aviation Maintenance-Supply
Readiness (AMSR) Review, which provided goals to lower maintenance and supply costs
while increasing fleet readiness (NAVSUP 2000). Although SNT is built upon the
objective of lower maintenance and supply costs and increased fleet readiness, multiple
options exist for how SNT might reach this objective. In other words, there is no
mandate that dictates one path to achieving the stated objective. Another important factor
is that SNT is a technology-based solution to the problem that is subject to risks and
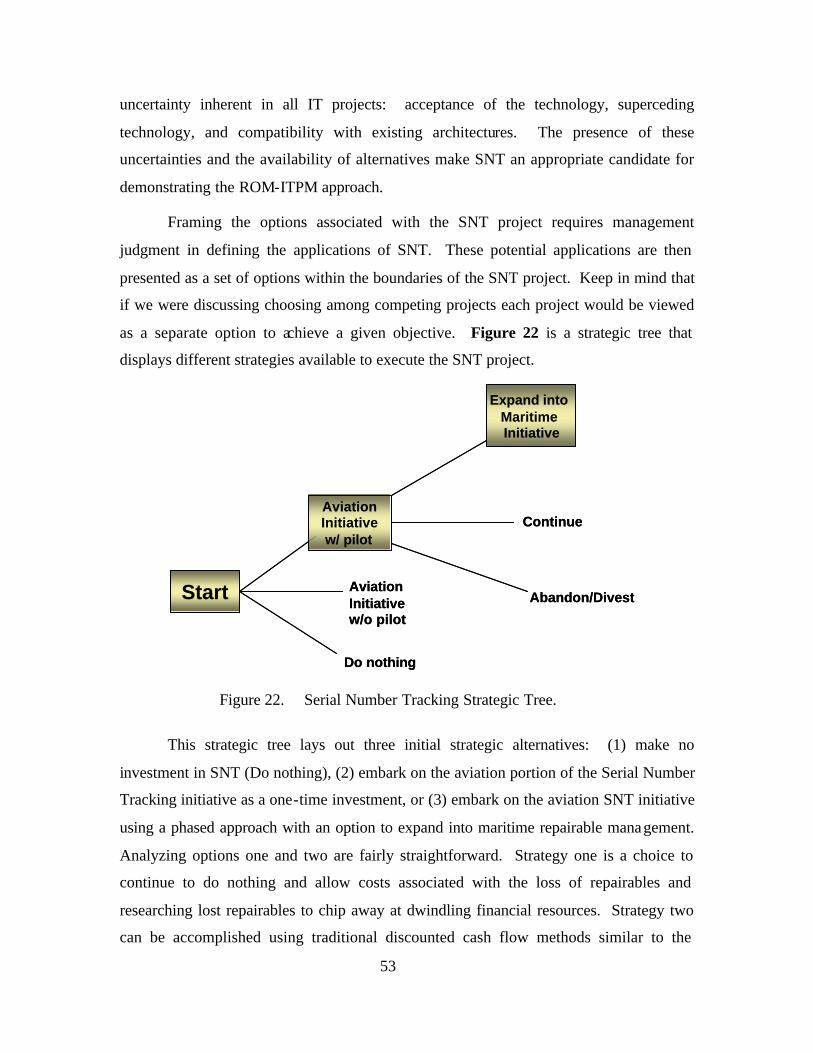
53
uncertainty inherent in all IT projects: acceptance of the technology, superceding
technology, and compatibility with existing architectures. The presence of these
uncertainties and the availability of alternatives make SNT an appropriate candidate for
demonstrating the ROM-ITPM approach.
Framing the options associated with the SNT project requires management
judgment in defining the applications of SNT. These potential applications are then
presented as a set of options within the boundaries of the SNT project. Keep in mind that
if we were discussing choosing among competing projects each project would be viewed
as a separate option to achieve a given objective. Figure 22 is a strategic tree that
displays different strategies available to execute the SNT project.
Start
Expand into Maritime Initiative
AviationInitiativew/ pilot
AviationInitiative w/o pilot
Do nothing
Continue
Abandon/DivestStart
Expand into Maritime Initiative
AviationInitiativew/ pilot
AviationInitiative w/o pilot
Do nothing
Continue
Abandon/Divest
Figure 22. Serial Number Tracking Strategic Tree.
This strategic tree lays out three initial strategic alternatives: (1) make no
investment in SNT (Do nothing), (2) embark on the aviation portion of the Serial Number
Tracking initiative as a one-time investment, or (3) embark on the aviation SNT initiative
using a phased approach with an option to expand into maritime repairable management.
Analyzing options one and two are fairly straightforward. Strategy one is a choice to
continue to do nothing and allow costs associated with the loss of repairables and
researching lost repairables to chip away at dwindling financial resources. Strategy two
can be accomplished using traditional discounted cash flow methods similar to the
54
method described above. This approach is a feast or famine approach that entails
committing to the total investment and running the risk of having the project fail.
Strategy three incorporates the flexibility to expand into maritime repairable
management and the option to abandon the initiative based on better information over
time. Strategy three incorporates the disciplined approach advocated by this study and
demonstrates the additional insights available using ROM-ITPM methodology. Although
the current focus of the SNT initiative is on aviation repairable management, for the
purposes of illustration we shall introduce the option of expansion into Navy maritime
(non-aviation) repairable management. The cost and savings figures used for this
expansion initiative are rough estimates provided by SNT project managers and are for
illustrative purposes only. These figures do not reflect the type of rigorous analysis that
would be required for a detailed business case analysis. However, these estimates are
suitable for the purposes of illustrating the type of additional information that can be
obtained through the ROM-ITPM approach.
2. Analyzing the Option
Utilizing the tools of ROM, strategic alternative three will be analyzed using the
Expand/Abandon Option Model. 4 This model is one of many option models available for
solving Real Options problems in the Crystal Ball© Real Options Software. We begin
our analysis by identifying the five common inputs to the Black-Scholes formula: (1)
value of the underlying asset – V, (2) exercise price-X, (3) time to expiration-T, (4) risk-
free rate- r, and (5) volatility- σ . Although the financial data used in this example is
based on available business case information for SNT, assumptions have been made
regarding the exercise price/expansion cost (X=$80M), time to expiration of the option
(T=3 years), and risk-free rate (r = 5%). We know from the business case analysis done
on this project that the NPV for the initial project is $116,416,842 and a corresponding
present value (PV) of $182,975,000. This PV is the value of the underlying asset (V) and
is calculated by adding back the cost of the initial project investment to the NPV
(116,416,842 + 66,560,000). Based on the cash flow assumptions used to calculate the
4 The Expand/Abandon Option Model is one of several different categories of options models available in Crystal Ball© Real Options Software. This study does not seek to address all of the different types of Real Options models. More information regarding this and other specific Real Options models can be found in Dr. Johnathan Mun’s Real Options Analysis (2002), and other financial/economics texts.

55
PV, volatility is computed using the logarithmic present value approach discussed in
Chapter III. Figure 23 illustrates the solution obtained using our selected software. The
resulting volatility estimate (σ) for the SNT project is 46.29% indicating that
considerable uncertainty in projected cash flows exists. The Expand/Abandon Option
Model also incorporates two additional pieces of data: the expansion factor (1.42) and
the salvage value ($60M). The expansion factor is obtained by dividing the PV of the
project including projected cash flows from expansion by the PV of the original project
($259M/$182M). The salvage value is included to illustrate the additional information
that can be derived in project/asset investments with a salvage value.
Figure 23. Calculated Volatility.
Once these initial PV and volatility calculations have been completed, we now
have the required information to complete the Black-Scholes and binomial lattice
computations displayed in Figure 24.

56
Figure 24. Crystal Ball© Real Options Output.
The software generates three binomial lattices. The first lattice is the underlying
pricing lattice that provides the manager with a range of values indicating the relative
value of the underlying asset dependent on best/worse case scenarios. This information
allows the manager to quantify the cost of waiting and identify the optimal time to
expand given a set of possible outcomes. For our SNT example, this information is

57
useful in deciding when and if expansion into the maritime initiative is prudent. The
large positive value obtained makes a strong case for expansion into the maritime
initiative. This lattice identifies that the manager should be willing to pay up to
$182,975,000 for the initial aviation-focused SNT project. Once again, because this
project has an extremely high payoff, the decision to expand is easy. However, it is easy
to see how this type of information could be extremely valuable for projects without such
dramatic payoffs.
The second lattice generated is the option valuation lattice. The valuation lattice
illustrates the increase in the project value due to the value created by the option. The
actual value of the option is computed by taking the difference between the step zero (0)
values of the two lattices (underlying asset lattice and option pricing lattice). This allows
the manager to see the value of the option under a range of possible outcomes. It
provides a best/worst case scenario that allows the manager to determine how much (s)he
should be willing to pay for an option. In the case of SNT, this information will provide
an estimate of how much should be spent on pilot projects to test the technology before
expanding. The results of this analysis demonstrate that no more than $29,130,000
($212M-182.98M) should be spent on an option (pilot test, advance purchase of
functionality to be used in the future etc.) before choosing to exercise the option to
embark on the maritime phase. Here we notice that the $212 million dollar value of the
project that includes the option is substantially different from the $182 million dollar PV
originally computed for the SNT aviation initiative. Quantifying the value of
management’s flexibility using options creates the increase. The third lattice is the
decision lattice that interprets the output and informs managers of when it will be prudent
to expand or abandon a project or strategic investment. The use of software tools
simplifies the rigorous analysis to provide useful information for better investment
decisions.
3. Acting on the Option
The crucial final step in the ROM-ITPM methodology is to apply the insights
gained through framing and analyzing the options to making investment decisions. These
decisions include whether to make an initial investment, expand an existing project based
on the results of the existing project (expansion option), whether to wait for more
58
information (wait/timing option) or whether to divest/terminate a project (abandon
option). Each of these alternatives is reflective of the dynamic nature of the decisions
that face leaders every day. Our SNT example illustrates how ROM-ITPM methodology
can help managers identify different strategic decision pathways, prioritize these
pathways/projects, and place a value on them.
The information obtained from this analysis goes beyond the static discounted
cash flow analysis. In our example the SNT maritime focus was not only identified as an
option but a value could be placed on that option. Best and worst case scenarios were
identified to help managers determine their degree of exposure to financial risk.
However, it is important to note that the proposed ROM-ITPM methodology and the
neatly packaged solution obtained through software should not be viewed as the silver
bullet that provides the definitive solution. Instead, the value of the ROM-ITPM process
lies in the disciplined approach that causes managers to view investments as options
which reflects the true nature of most investment decisions. The added benefit is a
solution that provides best/worst case scenarios for the SNT initiative that allows the
manager to estimate how much they should be willing to spend on pilot tests, know when
it makes economic sense to expand a project and know the cost of waiting.
The SNT project is a relatively easy decision based on the business case
presented. However, we can see from this example that using the ROM-ITPM
framework can still provide valuable information. Different strategic investment decision
pathways were identified (i.e. maritime initiative option). This process allowed the
strategic pathways to be evaluated for viability and fit using the portfolio map. The
Black-Scholes and binomial lattice solutions provided information useful in evaluating
competing options and prioritizing SNT options. Setting up the SNT project as a series
of options has laid the foundation for developing new strategic pathways that may
include outsourcing the project, developing greater functionality for tracking maintenance
actions, and incorporating newer technology that may be developed in the future. The
NAVSUP organization can even build upon this analysis to evaluate the opportunity to
expand the technology employed by the SNT project to track test equipment, PDAs,
laptops and other pilferable equipment. The information provided by the ROM-ITPM
methodology reveals important opportunities managers of the SNT project can exploit to

59
meet the objective of reducing the cost of inventory management and improving the
visibility of high-cost parts. Based on the analysis performed, the SNT project is a
winner and expansion into a maritime initiative should be pursued immediately.

60
THIS PAGE INTENTIONALLY LEFT BLANK

61
V. SUMMARY
A. RESULTS OF THE STUDY…A MODEL FOR ADDRESSING RISK
The passage of legislation such as the Clinger-Cohen Act, Paperwork Reduction
Act of 1995, and the Government Performance and Results Act of 1993 have emphasized
the importance of a disciplined approach to technology investments. ITPM has been
identified as the mechanism by which IT investments will be selected, evaluated and
managed. This study has explored the limitations of current investment analysis tools
being used to select and evaluate IT investments. Tools such as the DCF methods
commonly used to evaluate investments are extremely useful in analyzing investments
provided the assumptions regarding cash flows (or cost savings) hold true. Such tools
provide important information but they fail to account for the iterative nature of real
world decisions. These methods treat investment decisions as a static process and do not
reflect management’s ability to alter decisions as conditions change.
The ROM-ITPM methodology has been introduced as an additional tool for
evaluating IT investments. This methodology is intended for use in circumstances when
the decision-maker has flexibility regarding what, when, and how an investment is made.
The logical diagram provided in Chapter III, Figure 12(b) has been presented as a tool for
determining when the ROM-ITPM methodology should be used. Again, the ROM-ITPM
methodology is presented as a supplement to existing tools for evaluating investments---
not a replacement. It is one more tool for managers to use when evaluating investment
opportunities. This methodology uses rigorous analytical tools to derive the value of
investment alternatives based on determining the level of uncertainty associated with
predicted cash flows. The ROM-ITPM process begins in the ITPM select, manage, and
evaluate cycle. Managers use the portfolio map to evaluate proposed projects for
viability and fit, which includes a review of the project’s business case including
discounted cash flow analysis. The framing step begins when a strategic tree is
developed to identify possible strategies for executing the project incorporating options
(pilot tests, advanced procurements of features/capabilities etc.). Once potential
strategies are identified the analyzing step begins as options are analyzed using Crystal

62
Reports© Real Options software to simulate discounted cash flows and calculate option
values. In the final step, managers are able to act on the option by utilizing the outputs
obtained from the ROM-ITPM methodology to compare competing projects, optimize a
portfolio of investments, or make new (or expansion) investment decisions. These steps
are illustrated in Figure 20. The mathematical discipline of this approach helps to place a
value on the uncertainty commonly associated with strategic investments. However, the
real benefit of this approach is that it allows decision-makers to identify investments as
options, which reflects the true nature of most investment decisions and what most
managers do intuitively, but here with rigor and precision. The solutions obtained
provide best/worst case scenarios and allows the manager to estimate the maximum that
should be spent on pilot tests, know when it makes economic sense to contract, expand,
abandon, change, and wait given the circumstances surrounding a project.
B. BROADER IMPLICATIONS OF THIS STUDY
This study has identified how the Real Options Method can be utilized as a tool to
manage the risks associated with investments in the rapidly changing world of
technology. As we have discussed, this method is already being widely used by
managers of pharmaceutical R&D, petroleum exploration, and energy trading companies
to manage the financia l risk and uncertainty of capital investment decisions. The
disciplined approach to evaluating investments offered by ROM is not only useful for IT
investments but also for other investments that involve committing resources when there
is considerable uncertainty regarding outcomes (returns on investment). This is an apt
description of most of the investments that are made within the Department of Defense
(DOD). As discussed in Chapter I, the Office of Force Transformation has already
offered the Real Options Method as a possible mechanism for evaluating new DOD
programs. A recent Office of Force Transformation article asserts that “leaders of the
military services now confront the dilemma of whether or not to invest in a particular
stage of a new program, or given market and technology uncertainties surrounding the
perceived need, delay the decisions” (Glaros 2003).
The Planning, Programming, and Budgeting System introduced by then Secretary
of Defense Robert McNamara in the 1960’s often takes as long as eight years to field new

63
programs (Glaros 2003). The recently revised PPBS known as the Planning
Programming Budgeting and Execution System (PPBES) discussed in Chapter II of this
study has attempted to improve the process but may still lack the ability to capture the
economic value of capital investments in an environment fraught with uncertainty and
change. The disciplined ROM-based approach offered in this study has potential to help
resolve these shortcomings.
In spite of the PTA restrictions discussed in Chapter I, the ROM-ITPM
methodology can still provide important information for deciding which programs should
be funded based on fit and how the program should be pursued (in-house vs.
outsourcing). The flexibility required to deal with a rapidly changing global landscape
will require efforts to increase the flexibility of the existing PPBES process to give
managers of major programs greater flexibility to take advantage of investment
opportunities by shifting resources. Today, this flexibility is being incorporated into our
acquisitions process through spiral acquisition and project development techniques. The
ROM-ITPM is a good fit to facilitate these techniques by providing a financial tool that
can evaluate multiple strategic pathways. As economic resources become more and more
constrained it will be important to explore new methodologies like ROM to sustain
competitive advantage in a rapidly changing world.
C. AREAS FOR FUTURE STUDY
In the course of researching this topic three areas for future study have been
identified. First, the application of the Real Options Method in the DON provides
significant opportunities in identifying the appropriate funding levels for pilot projects.
In recent years we have seen the DON embark upon four separate Enterprise Resource
Planning (ERP) pilots. At the same time the DON has also begun the ambitious Navy
Marine Corps Intranet (NMCI) initiative, the largest seat (desktop) management contract
ever. Future research can be conducted to explore what is the maximum amount DON
should be willing to pay for pilot projects such as ERP. This research could also assess
what would be the value of a phased approach (considering expansion, exit and wait
options) to the NMCI project.

64
A second research opportunity would be to establish a proposed mechanism to
link ROM methodology to the DON E-Business Office, which is currently responsible
for selecting and funding pilot projects for the DON. Identifying opportunities for
increased coordination between the DON Chief Information Officer (CIO), the CIOs of
major systems commands, and the E-Business Office may result in a single IT Portfolio
for the DON that reflects our IT needs without costly duplication.
A third area for additional research would be to expand upon recent efforts by the
Office of Force Transformation. Identifying a framework to systematically apply ROM
in the current PPBES, offers hope for a process that will accommodate the uncertainty
and rapid change present in the current global landscape. ROM is not a panacea that will
solve all the problems presented by investment uncertainty but it does offer a regimented
approach to measuring and leveraging this uncertainty.
D. CONCLUSION AND RECOMMENDATION
This study has identified ROM as an additional tool to be used in evaluating
strategic investments that involve uncertainty. The ROM-ITPM approach advocated by
this study provides a disciplined approach to evaluating these investments without
significantly expanding information requirements and administrative burden. The same
information currently used for business case analyses can be applied to the ROM-ITPM
framework to obtain additional insights helpful in making sound strategic investment
decisions. Therefore, the discipline of the ROM-ITPM approach can be applied without
dramatic changes in the current strategic investment decision-making processes.
Appendix I briefly describes how interested organizations can incorporate the ROM-
ITPM approach into their current processes.
Based on the results of this study, it is recommended that the ROM-ITPM
methodology be adopted by the Navy eBusiness Operations Office to support its
screening process for Navy pilot projects. This methodology will assist in the
determination of which pilot projects to fund, and to what extent they should be funded.
It is also recommended that the DOD Force Transformation Office continue its efforts in
developing mechanisms to apply ROM to the PPBES in order to improve investment
flexibility and reduce financial risks associated with these investments.

65
APPENDIX I: GETTING STARTED WITH ROM
1. Framing
• Initial business case analyses for proposed investments are conducted as
before.
• Utilize the proposed ROM-ITPM decision process (Figure 12b) to
identify whether the ROM-ITPM methodology should be applied.
• A strategic tree of alternative pathways for pursuing the investment
should be developed and presented as part of the initial business case.
• Focus on expanding the set of investment alternatives considered.
• Think farther into the future to identify opportunities for expansion,
waiting, change, and abandonment options, as more information is
known.
• Ensure involvement of a team (i.e. investment review board) that consists
of members with access to senior management, and able to identify a
broad range of investment opportunities.
2. Analyzing
• Ensure the investment review board contains members able to apply the
quantitative tools discussed in Chapter III available in the Crystal
Reports© Real Options software.
3. Acting
• Based on the results of this ROM-ITPM methodology, management can
identify the appropriate strategic pathway, the value of a pilot, and how
much to spend on a pilot or advanced capabilities.

66
THIS PAGE INTENTIONALLY LEFT BLANK

67
LIST OF REFERENCES
Afuah, Alan and Christopher Tucci. Internet Business Models and Strategies. New York: McGraw-Hill, 2001.
Alleman, James. Real Options, Real Opportunities. CMP Media, LLC: Copyright 2000.
Amran, Martha and Nalin Kulatilaka. Real Options: Managing Strategic Investment in an Uncertain World. Boston: Harvard Business School Press, 1999.
Black, Fischer and Myron Scholes, The Pricing of Options and Corporate Liabilities, Journal of Political Economy, 81:3, 1973.
Boer, Peter F. Real Options: The IT Investment Risk-Buster, Issue 9, Optimize Magazine (July 2002), Available: http://www.optimizemag.com/issue/009/financial.htm
Boer, Peter F. The Real Options Solution: Finding Total Value in a High-Risk World. New York: John Wiley & Sons, Inc., 2002.
Budget of the United States, Office of Management and Budget, February 2002 http://www.whitehouse.gov/omb/budget/fy2003/index.html
Capaccio, Tony. EDS To See Increased Revenue From Computer Program, Navy Says. (June 2003), Available: http://www.bloomberg.com/
CFO Magazine at http://www.cfo.com/Article?article=1684
Circular A-130, Management of Federal Information Resources, Office of Management and Budget (2003), Available: http://w3.access.gpo.gov/usbudget/index.html
Department of Defense AIT website (2003), Available: http:// www.dodait.com/
Department of the Navy CIO, Information Management and Information Technology Strategic Plan FY 2002-2003, Available: http://www.DON-imit.navy.mil/ (2003)
Department of the Navy, Information Technology (IT) Capital Planning Guide (Version 3), April 2001.
Department of the Navy, Information Technology (IT) Investment Portfolio Model, July 1999.
Department of the Navy, Portfolio Management Benchmark Report, July 2001.
Devaraj, Sarv and Rajiv Kohli. The IT Payoff: Measuring the Business Value of Information Technology Investments. New Jersey: Prentice-Hall Inc, 2002.

68
Dushanko, Mark. Discussion Document: NAVSUP/NAVSISA Asset Risk Management (Working Version). May 2003.
Federal CIO Council, A Summary of First Practices and Lessons Learned in Information Technology Portfolio Management, March 2002.
Fitting Out & Supply Support Assistance Center (FOSSAC) and SABRE Corporation. Business Case Analysis for Serial Number Tracking (FOSSAC, 1999).
General Accounting Office (2003), Available: http://www.gao.gov/
Glaros, CDR Greg. Real Options for Defense. Office of Force Transformation, Department of Defense: Transformation Trends. June 6, 2003.
Jeffery, Mark. Mitigating Risk in Technology Investments through Information Technology Portfolio Management. (March 2003), Available: http://www.teradata.com/t/
Lattig, Jerry and Spiegel, Brent NAVSISA/NAVSUP Program Management Staff and contributors to the NAVSUP ITPM CONOPS. Interview by LCDR Jeffery Davis. (July 2003).
Liao, Shu. Risk Management and Decision Analysis. Manuscript, (2002).
Lippert, VADM Keith. Director, Defense Logistics Agency (DLA) brief: ERP in the Public Sector. (September 19, 2002).
McCaffery, Jerry L. and Jones, L.R. Budgeting and Financial Management in the Federal Government. Connecticut: Information Age Publishing, 2001.
Mun, Johnathan. EMAIL correspondence with LCDR Jeffery Davis. (October 2003).
Mun, Johnathan. Real Options Analysis: Tools and Techniques for Valuing Strategic Investment Decisions. New Jersey: John Wiley & Sons, Inc., 2002.
Naval Supply System Command, Serial Number Tracking Document, June 2003.
Naval Supply Systems Command, Serial Number Tracking Concept of Operations, Revision 1. September 2000.
NAVSEA Portfolio Management White Paper, November 2002.
NAVSUP News Release (May 2003), Available: http://www.navsup.navy.mil/npi/news/030509a.jsp
Navy Supply Systems Command Portfolio Management Concept of Operations, June 2003.
Osterland, Andrew. Blaming ERP. CFO Magazine. January 2000.

69
President’s Defense Budget FY ’04 (2003) Available: http://www.dtic.mil/comptroller/budgetindex.html
Simons, Robert. Performance Measurement & Control Systems for Implementing Strategy. New Jersey: Prentice-Hall Inc, 2000.
Tjan, Anthony K. Finally, a Way to Put Your Internet Portfolio in Order. Harvard Business Review. Feb. 2001.
U.S. Department of Agriculture (USDA) IT Capital Planning and Investment Control Guide, April 2002.
United States General Accounting Officer (GAO). Information Technology: Issues Affecting Cost Impact of Navy Marine Corps Intranet Need to be Resolved. October 2002.
Walters, Chris, and Giles, Tim. Using Real Options in Strategic Decision Making. (2000). Available: http://mba.tuck.dartmouth.edu/paradigm/spring2000/articles/walters-decision_making.html

70
THIS PAGE INTENTIONALLY LEFT BLANK

71
INITIAL DISTRIBUTION LIST
1. Defense Technical Information Center Ft. Belvoir, Virginia
2. Dudley Knox Library Naval Postgraduate School Monterey, California
3. SECNAV DON CIO Washington, D.C. 20350-1000
4. NAVSUP CIO Mechanicsburg, Pennsylvania
5. Department of the Navy eBusiness Operations Office Mechanicsburg, Pennsylvania
6. Conrad Chair Naval Postgraduate School Monterey, California
7. LCDR Jeffery P. Davis 133 Deprimo Lane Opelousas, Louisiana 70570
8. CDR Philip Candreva Naval Postgraduate School Monterey, California
9. Professor Kenneth Doerr Naval Postgraduate School Monterey, California
10. Professor Glenn Cook Naval Postgraduate School Monterey, California
Related Documents