A Study of Gas Streaming in Deep Fluidized Beds By Shayan Karimipour A Thesis Submitted to the College of Graduate Studies and Research In Partial Fulfillment of the Requirements For the Degree of Doctor of Philosophy In the Department of Chemical Engineering The University of Saskatchewan Saskatoon © Copyright Shayan Karimipour, March, 2010. All rights reserved.

Welcome message from author
This document is posted to help you gain knowledge. Please leave a comment to let me know what you think about it! Share it to your friends and learn new things together.
Transcript

A Study of Gas Streaming in Deep
Fluidized Beds
By
Shayan Karimipour
A Thesis Submitted to the College of
Graduate Studies and Research
In Partial Fulfillment of the Requirements
For the Degree of Doctor of Philosophy
In the Department of Chemical Engineering
The University of Saskatchewan
Saskatoon
© Copyright Shayan Karimipour, March, 2010. All rights reserved.
i
Permission to Use
In presenting this thesis in partial fulfillment of the requirements for a Postgraduate
degree from the University of Saskatchewan, I agree that the Libraries of this University
may make it freely available for inspection. I further agree that permission for copying of
this thesis in any manner, in whole or in part, for scholarly purposes may be granted by
the professor who supervised my thesis work or, in his absence, by the Head of the
Department or the Dean of the College in which my thesis work was done. It is
understood that any copying or publication or use of this thesis or parts thereof for
financial gain shall not be allowed without my written permission. It is also understood
that due recognition shall be given to me and to the University of Saskatchewan in any
scholarly use which may be made of any material in my thesis.
Requests for permission to copy or to make other use of material in this thesis in whole or
part should be addressed to:
Head of the Department of Chemical Engineering
The University of Saskatchewan
Saskatoon, Saskatchewan S7N 5A9
Canada

ii
Abstract
Recent studies have shown that, in a sufficiently deep gas-solid fluidized bed of Geldart
A particles, gas streaming may occur causing gas to bypass a large portion of the particle
bed. Since this is a newly observed phenomenon in fluidized beds, there is uncertainty
and lack of information about the various aspects of the streaming flow. The objective of
the current project was to investigate the streaming phenomenon with a combination of
experimentation and modeling. In the experimental part, pressure fluctuations as a
measure of the fluidized bed hydrodynamics were used to study the influence of different
parameters on the behavior of a deep fluidized bed. Pressure fluctuations have been
measured at 8 axial locations from 4 to 150 cm above the gas distributor for bed depths
and gas velocities ranging from 0.4 to 1.6 m and 0.04 to 0.20 m/s (equal to 10 to 50 times
minimum fluidization velocity), respectively. Two particle size distributions with Sauter
mean diameters of 48 µm and 84 µm and two distributor plates with differing percentage
open area were also tested for each bed depth and gas velocity. Analysis of pressure
fluctuations in the time and frequency domains, in combination with visual observations
revealed that streaming flow emerges gradually at bed depths greater than 1 m. Increased
gas velocity and fines content act to delay the onset of streaming, but can not completely
eliminate it over the range of velocities examined. The two different distributor designs
had no measurable effect on the streaming flow. The results of this study are provided in
the first chapter of the present report.
In order to further investigate the nature of streaming flow, several known cases,
including a forced stream (imposing a stream flow by cutting a side of distributor) and

iii
jetting flows (60 m/s and 31 m/s) were designed and conducted, in addition to the natural
streaming flow in deep beds. Results indicated that the natural streaming most closely
resembles the case of imposed stream in the bed with the presence of primary gas flow
through the distributor. The case of jet flows with no additional gas resembles the severe
streaming that might happen in very deep beds with the existence of completely non-
fluidized regions. Application of supporting jets in addition to the main gas flow could
enhance the fluidization quality to some extent, however, not enough to provide a normal
fluidization. Wavelet analysis of the pressure fluctuations showed that in deep fluidized
beds, bubbling activity with a dominant frequency approximately the same as the typical
value reported in the literature (3-4 Hz) coexist with the streaming flow, although with a
minor contribution. Wavelet findings suggested that the streaming flow can be considered
to form by increasing the relative importance of one of the available stream of bubbles
compared to others with increasing bed depth. The results of this study are provided in
the second chapter of this report.
Further study of streaming flow was undertaken with computational fluid dynamic (CFD)
simulation of the deep fluidized bed. CFD simulation of fine Geldart A particles has met
with challenges in the open literature and various modifications have been proposed to be
able to model fluidized beds of these particles. In the present work, the commercial CFD
codes FLUENT and MFIX were initially tested for the modeling of deep fluidized bed of
Geldart A particles. However, simulation results did not show any sign of streaming flow
in the fluidized bed. Subsequently, the commercial CFD code BARRACUDATM that has
been claimed by the developers to be appropriate for this purpose, was tested. Due to the

iv
lack of data on the performance of this code, a simple case of modeling a freely bubbling
fluidized bed of Geldart A particles was attempted first. For this purpose, four different
simulation cases, which included three different numerical grid sizes and two drag
models with a realistic particle size distribution were designed and tested. The simulated
bed expansion, bubble size distribution, rise velocity and solid fraction were compared
with commonly accepted correlations and experimental data from the literature. The
results showed a promising predictive capability of the code without the need for
modifying the drag model or other constitutive relations of the model. The third chapter
of the report presents the simulation results of this study.
The BARRACUDA code was then used for simulating the deep fluidized bed of Geldart
A particles. However, similar to the previous CFD codes tested, instead of streaming
flow, bubbling fluidization was predicted. Therefore, a phenomenological model was
developed to better understand streaming flow. It was assumed that the deep bed is
comprised of two streaming and non-streaming zones. According to the model results, the
stream represents a zone of much lower pressure drop compared to other parts of the bed,
which can be a possible reason for the formation and stability of the streaming flow
inside the fluidized bed. The model results showed that increasing the bed depth enhances
the streaming flow, while increasing the gas velocity improves the uniformity of the bed
and decreases the streaming severity. Streaming flow was found to be less severe for
larger particle sizes. All of these trends agree with experimental findings. These findings
provide the content of the fourth and final chapter of this report.

v
Acknowledgements
The completion of my PhD program would not have been possible without invaluable
support and guidance of my supervisor, Prof. Todd Pugsley who truly believed in my
potential and provided me with opportunities throughout my research and endeavors. I
would like to express my sincere gratitude to him.
I would like to thank all of my friends in the Chemical Engineering Department of the
University of Saskatchewan, specially my colleagues Zhiguo Wang and Mike
Wormsbecker, who enriched my learning by sharing their wealth of knowledge with me.
I recognize and appreciate the assistance of the support staff and faculty at the
Department of Chemical Engineering, specially my committee members, Profs: G. Hill,
M. Nemati, A. Phoenix, and Prof. R. Johanson from the Department of Electrical
Engineering for their valuable advices and proficiency in keeping me on track.
Financial support from the University of Saskatchewan is also gratefully acknowledged.

vi
Table of Contents
Permission to Use i
Abstract ii
Acknowledgements v
Table of Contents vi
List of Tables xi
List of Figures xii
CHAPTER 1 – Introduction 1
1.1. Fluidization 1
1.1.1. Fluidization Regimes 2
1.1.2. Geldart Classification 3
1.2. Streaming Phenomenon in Deep Fluidized Beds 5
1.3. Pressure Measurement 8
1.4. CFD Modeling of Dense Fluidized Beds 8
1.5. Project Motivation 12
1.6. Objectives 13
1.7. References 14
CHAPTER 2 - Study of the Gas Streaming Flow in a Deep Fluidized Bed
Containing Geldart’s Group A Particles 21
2.1. Abstract 22
2.2. Introduction 23

vii
2.3. Experimental 29
2.4. Analysis Methods 31
2.4.1. Auto Correlation and Cross Correlation Functions 31
2.4.2. Power Spectral Density and Coherency 32
2.5. Results and Discussions 33
2.5.1. Visual Observations 34
2.5.2. Quantitative Analyses and Discussions 35
2.5.2.1. Effect of Bed Depth 35
2.5.2.2. Effect of Gas Velocity 38
2.5.2.3. Effect of Particle Size Distribution 40
2.5.2.4. Effect of Distributor 41
2.6. Conclusion 42
2.7. References 43
2.8. Nomenclature 47
CHAPTER 3 - Experimental Study of the Nature of Gas Streaming in Deep
Fluidized Beds of Geldart’s A Particles 64
3.1. Abstract 65
3.2. Introduction 66
3.3. Experimental 70
3.4. Analysis Methods 71
3.5. Results and Discussions 73
3.5.1. Effect of Bed Depth 73

viii
3.5.2. Effect of Gas Velocity 76
3.5.3. Effect of Particle Size Distribution (Fines Content) 77
3.5.4. Wavelet Decomposition and Analysis 78
3.6. Conclusion 81
3.7. References 82
3.8. Nomenclature 84
CHAPTER 4 - CFD Simulations of Bubbling Fluidized Beds of Geldart’s Group A
Powders using Particle in Cell Approach 98
4.1. Abstract 99
4.2. Introduction 100
4.3. Material and Experiments 103
4.4. Model Development 104
4.4.1. Drag Models 105
4.4.2. Solid Stress Models 106
4.4.3. Solution Procedure 106
4.5. Model Set up and Parameters 108
4.5.1. Fluidized Bed and Flow Conditions 108
4.5.2. Boundary and Initial Conditions 108
4.6. Extraction of Bubble Properties from the Simulation Results 109
4.7. Results and Discussions 112
4.7.1. Bed Expansion 112
4.7.2. Bubble Size 113
ix
4.7.3. Bubble Rise Velocity 116
4.7.4. Bubble Solid Fraction 117
4.7.5. Dynamic Characteristics 118
4.8. Conclusion 119
4.9. References 119
4.10. Nomenclature 125
CHAPTER 5 - A Modeling Study of Gas Streaming in a Deep Fluidized Bed of
Geldart A Particles 145
5.1. Abstract 146
5.2. Introduction 146
5.3. Model Development 148
5.4. Results and Discussions 152
5.4.1. Effect of Bed Depth 153
5.4.2. Effect of Gas Velocity 153
5.4.3. Effect of Particle Size 154
5.4.4. Effect of Solid Circulating Rate 154
5.5. Conclusion 155
5.6. References 155
5.7. Nomenclature 157
CHAPTER 6 - Conclusions and Recommendations 164
6.1. Conclusions 164

x
6.2. Recommendations 167

xi
List of Tables
Table 2.1. The range of different variables studied in this work 49
Table 2.2. Specifications of the pressure transducers used in the present work 50
Table 3.1. The range of operating conditions studied in this work 86
Table 4.1. Governing equations of the multiphase PIC model 127
Table 4.2. Equations of drag models 128
Table 4.3. Input parameters used in the simulation 129

xii
List of Figures
Figure 1.1. Different fluidization regimes that occur by increasing the gas velocity in fluidized beds
19
Figure 1.2. A schematic diagram of Geldart’s particle classification chart 20
Figure 2.1. Schematic diagram of the fluidized bed used in the experiments depicting axial positions (in cm) of the pressure ports above the distributor.
51
Figure 2.2. Particle size distribution of the FCC powders used in the experiments
52
Figure 2.3. Time series of pressure fluctuations measured for different bed depths, coarse FCC (3% fines content), HPD distributor, U0=35 Umf. Pressure fluctuations correspond to an axial position of 30 cm above the distributor plate
53
Figure 2.4. (a) Autocorrelation and (b) Cross correlation of pressure fluctuations for different bed depths, coarse FCC (3% fines content), HPD distributor, U0=35 Umf. Pressure fluctuations correspond to an axial position of 30 cm above the distributor plate
54
Figure 2.4. (c) PSD and (d) Coherency of pressure fluctuations for different bed depths, coarse FCC (3% fines content), HPD distributor, U0=35 Umf. Pressure fluctuations correspond to an axial position of 30 cm above the distributor plate
55
Figure 2.5. The autocorrelation coefficient at different axial positions above the gas distributor for the case of coarse FCC (3% fines), HPD distributor, H=160 cm, and U0=10 Umf
56
Figure 2.6. The autocorrelation coefficient of pressure fluctuations for different gas velocities, coarse FCC, HPD distributor, a) H=40 cm, b) H=160 cm. Pressure fluctuations correspond to an axial position of 30 cm above the distributor plate
57
Figure 2.7. The PSD of pressure fluctuations for different gas velocities, coarse FCC, HPD distributor, a) H=40 cm, b) H=160 cm. Pressure fluctuations correspond to an axial position of 30 cm above the distributor plate
58
Figure 2.8. The Cross Correlation coefficient of pressure fluctuations for different particle sizes, U0=10 Umf, HPD distributor, a) H=40 cm, b) H=160 cm. Pressure fluctuations correspond to an axial position of 30 cm above the distributor plate
59
Figure 2.9. The PSD coefficient of pressure fluctuations for different particle sizes, U0=10 Umf, HPD distributor, a) H=40 cm, b) H=160 cm.
60

xiii
Pressure fluctuations correspond to an axial position of 30 cm above the distributor plate
Figure 2.10. The pressure drops of the HPD and LPD distributors as a function of gas velocity
61
Figure 2.11. The Cross Correlation of pressure fluctuations for coarse FCC with different distributors, a) H=40 cm, b) H=160 cm. Pressure fluctuations correspond to an axial position of 30 cm above the distributor plate
62
Figure 2.12. The PSD of pressure fluctuations for coarse FCC with different distributors, a) H=40 cm, b) H=160 cm. Pressure fluctuations correspond to an axial position of 30 cm above the distributor plate
63
Figure 3.1. Schematic diagram of the experimental apparatus, showing the double-jet nozzle and the distributor modified to produce a force streaming flow in the bed: (1) Fluidized bed unit, (2) Primary air flow from blower, (3) Orifice plate, (4) Wind-box, (5) Distributor, (6) Double-jet nozzle, (7) Jet air flow from building air, (8) Flow meter, (9) Pressure transducers, (10) PC and data acquisition system, (11) Modified distributor, (12) Perforated area, (13) Opening area. Arrows in the figure indicate the direction of the air flow
87
Figure 3.2. a) Daubechies number 5 wavelet (“db5”) which has been used in the present work as the mother wavelet, b) Decomposition of a signal (S) into its components using Wavelet transform
88
Figure 3.3. (a) Autocorrelation and (b) PSD of pressure fluctuations for the different test configurations, 40 cm bed depth, 3% fines content, U0=10 Umf
89
Figure 3.4. (a) Autocorrelation and (b) PSD of pressure fluctuations for the different test configurations, 160 cm bed depth, 3% fines content, U0=10 Umf
90
Figure 3.5. (a) Autocorrelation and (b) PSD of pressure fluctuations for the different test configurations, 40 cm bed depth, 3% fines content, U0=50 Umf
91
Figure 3.6. (a) Autocorrelation and (b) PSD of pressure fluctuations for the different test configurations, 160 cm bed depth, 3% fines content, U0=50 Umf
92
Figure 3.7. The autocorrelation function of pressure fluctuations for the different test configurations, 20% fines content, U0=10 Umf, (a) 40 cm bed depth, (b) 160 cm bed depth
93
Figure 3.8. The PSD of the approximate and detail parts of the pressure fluctuations measured for U0=10 Umf, 3% fines content in 40 cm bed, (a) Approximate (A), (b) Detail (D)
94

xiv
Figure 3.9. The PSD of the approximate and detail parts of the pressure fluctuations measured for U0=10 Umf and 3% fines FCC in 160 cm bed, (a) Approximate (A), (b) Detail (D)
95
Figure 3.10. The PSD of the approximate and detail parts of the pressure fluctuations measured for U0=10 Umf and 3% fines FCC in 160 cm bed with imposed stream, (a) Approximate (A), (b) Detail (D)
96
Figure 3.11. The PSD of the approximate and detail parts of the pressure fluctuations measured for U0=10 Umf and 3% fines FCC in 160 cm bed with No. 1 jet, (a) Approximate (A), (b) Detail (D)
97
Figure 4.1. Particle size distribution of the FCC powders used in the experiments
130
Figure 4.2. Comparison between different drag models used for CFD simulations in the literature
131
Figure 4.3a. The segmentation of the axial and cross sectional images for calculating the distribution of the bubble size
132
Figure 4.3b. Snapshots of the simulation cases with different grid size, a) 0.5 cm grid, b) 1 cm grid, c) 2 cm grid
133
Figure 3c. Binary versions of the snapshots provided above, a) 0.5 cm grid, b) 1 cm grid, c) 2 cm grid
134
Figure 4.4. Axial profile of solid fraction inside the fluidized bed. U0 = 0.1 m/s, time-averaged over the period 12-25 s
135
Figure 4.5. Axial profiles of bubble sizes extracted from the simulation results for the case of a 0.5 cm grid and drag model 2. U0 = 0.1 m/s, time-averaged over the period 12-25 s
136
Figure 4.6. Comparison of model predictions of bubble average equivalent diameter as a function of height above the distributor with predictions of selected correlations and the experimental data of Werther (1976). U0 = 0.1 m/s, time-averaged over the period 12-25 s
137
Figure 4.7. Model predictions of the probability distribution of the number of bubbles as a function of height above the distributor for differing mesh sizes and drag models. U0 = 0.1 m/s, time-averaged over the period 12-25 s
138
Figure 4.8. Comparison of model predictions of the bubble average velocity as a function of height above the distributor with the selected correlations from the literature. U0 = 0.1 m/s, time-averaged over the period 12-25 s for the model predictions
140
Figure 4.9a. Cross sectional mesh plot of the solid fraction in height of 30 cm of the fluidized bed; the color in the figure shows the distribution of
141

xv
solid fraction which is defined in the scaled color bar at the right. U0 = 0.1 m/s, 0.5 cm grid size and drag model 2, time-averaged over the period 12-25 s
Figure 4.9b. Examples of the radial profile of the fraction of solids inside the bubbles. U0 = 0.1 m/s, 0.5 cm grid size and drag model 2, time-averaged over the period 12-25 s
142
Figure 4.10. Axial profile of the average bubble voidage and the average bed voidage as a function of height above the gas distributor. U0 = 0.1 m/s, 0.5 cm grid size and drag model 2, time-averaged over the period 12-25 s
143
Figure 4.11. Comparison between simulated and experimental pressure fluctuations in the fluidized bed at the height of 30 cm above the gas distributor. U0 = 0.1 m/s, 0.5 cm grid size and drag model 2, time-averaged over the period 12-25 s
144
Figure 5.1. Axial profile of the pressure drop in the fluidized bed, Bed depth = 5 m, Superficial gas velocity = 0.2 m/s, Particle diameter = 84 microns
159
Figure 5.2. Difference between the pressure drop of Stream and Non-Stream pathways at the bottom of the fluidized bed for different bed depths, Superficial gas velocity = 0.2 m/s, Particle diameter = 84 microns
160
Figure 5.3. Axial profile of the pressure drop in the fluidized bed for different superficial gas velocities, Bed depth = 5 m, Particle diameter = 84 microns
161
Figure 5.4. Axial profile of the pressure drop in the fluidized bed for different particle sizes, Bed depth = 5 m, Superficial gas velocity = 0.2 m/s
162
Figure 5.5. Effect of variation of Gs on the axial profile of pressure drop in the fluidized bed
163

Chapter 1 – Introduction
1
CHAPTER 1 – Introduction
Contribution to Overall Study
This chapter provides insight regarding fluidization and the relevant theory related
to this thesis. First, the concept of fluidization is explained along with its importance to
the chemical process industry. Second, the chapter then goes on to present fundamental
fluidization theory and its relevance to the present study. Finally, the motivation of this
thesis is presented, along with the underlying objectives.
1.1. Fluidization
The Winkler coal gasifier can be considered as the first large scale industrial application
of fluidized bed technology; the gasifier was first operated in 1926 (Kunii and
Levenspiel, 1991). The single largest application of fluidized bed technology is the Fluid
Catalytic Cracking (FCC) process. FCC originated from a collaboration between
Standard Oil engineers (now Exxon) and two Massachusetts Institute of Technology
(MIT) professors in 1942 (Wilson, 1997). The FCC process cracks heavier crude oil
fractions into lighter, value-added products in the gasoline boiling range. Today, fluidized
beds have found many applications in physical and chemical industrial processes. Some

Chapter 1 – Introduction
2
of the major physical applications include drying of powders, granulation, dust/particle
filtration, coating of pharmaceutical tablets, heat exchangers, boilers, and adsorption
(Pain et al., 2001). The applications where the solid acts as catalyst or heat sink, such as
in oil cracking for manufacturing of various chemical substances, production of different
polymeric material, and those where solids undergo a phase change, such as in coal
combustion or coal gasification are some examples of chemical applications of fluidized
beds (Lim et al., 1995). Fluidized beds are used in the chemical process industries mostly
because of the excellent gas-solid contacting, which greatly enhances the chemical
reactions and heat and mass transfer (Kuipers et al., 1992).
1.1.1. Fluidization Regimes
When a fluid enters a vessel containing a bed of solid particles, different contact regimes
can be established in the vessel (Kunii and Levenspiel, 1991). These regimes are arranged
tentatively in order of increasing the superficial gas velocity. Fig. 1.1 presents a regime
diagram illustrating those regimes. At very low fluid velocities, the fluid percolates
through the void spaces (interstices) between particles without disturbing the bed and no
visual change in the state of the bed occurs. With increasing fluid velocity, the solids start
to vibrate but still maintain the same height as the bed at rest. This is called a fixed bed.
In the fixed bed the particles are in direct contact with each other, supporting each other’s
weight. If the increase in velocity continues, the bed expands and particles remain
suspended in a way that the drag force imparted by the upward fluid is equal to the
weight of the particles. This is known as minimum fluidization. The state of the system
has some fluid-like properties and is called a fluidized bed.

Chapter 1 – Introduction
3
After the minimum fluidization, the behavior of a fluidized bed differs depending
whether the fluid is a gas or liquid. In liquid-solid systems, a smooth progressive
expansion of the bed occurs in which large scale instabilities and heterogeneities such as
formation of bubbles are not observed. This behavior is typically observed when the fluid
and solids have similar densities. In gas-solid systems, the appearance of bubbles imposes
a great deal of instability in the system after minimum fluidization. This is called the
bubbling regime. It should be mentioned that in group A particles there is a short period
of bed expansion without formation of bubbles until the velocity at which bubble first
appear (minim bubbling velocity) is reached.
If the bed is sufficiently deep and the column diameter is small, the bubbles may coalesce
and create bubbles as large as the vessel diameter with the solid particles flowing down as
a thin layer near the vessel wall. This is known as the slugging regime (Kunii and
Levenspiel, 1991). If the particles are fluidized at a high enough gas flowrate, the upper
surface of the bed disappears and, instead of bubbles, a turbulent motion of solid clusters
and voids of gas of various sizes and shapes is observed. Beds under these conditions are
called turbulent beds. With further increases of gas velocity, the rate of particle
entrainment with gas increases and extreme turbulence and extensive refluxing of dense
packets and strands of particles occurs. This regime is called fast fluidization. Eventually
the fluidized bed becomes an entrained bed in which disperse, dilute or lean phase
fluidized bed exists, which leads to a pneumatic transport of solids.

Chapter 1 – Introduction
4
I all of these fluidization regimes all regions of the bed are similarly subject to the gas
flow from the distributor and the phenomena that occur due to the fluidization are
probable to occur all over the cross section.
1.1.2. Geldart Classification
The fluidized behavior of solid particles depends on their size and density. Geldart (1973)
classified powders into four groups according to their fluidization properties at ambient
conditions. A schematic diagram of the Geldart’s particle classification chart is provided
in Fig. 1.2. He categorized his observations by particle diameter versus the density
difference between the fluid and particles and identified four classes of particles.
Group A particles, known as aeratable particles
Usually fluidize easily, with normal bubbling fluidization at low gas velocities
Bubbling bed fluidization at higher gas velocities
Showing maximum stable bubble size with less than 10 cm diameter
Gross circulation of solids
Group B particles, known as sand-like particles
Form bubbles as soon as the gas velocity exceeds minimum fluidization
Form large bubbles with no maximum stable bubble size
Group C particles, known as cohesive particles
Hard to fluidize with a tendency to create slugs in small diameter fluidized beds

Chapter 1 – Introduction
5
Have tendency to form channels with no fluidization in large beds due to high
interparticle cohesive forces
Group D particles, known as spoutable
Particles are either very large or very dense
Form bubbles which coalesce rapidly and grow large
Form slugs when the bubble size approaches the bed diameter
Form a spouting regime and particles may be blown out with a jet in a spouting
motion
1.2. Streaming Phenomenon in Deep Fluidized Beds
Recent studies have shown that, in a sufficiently deep bed of Geldart’s Group A particles
(Geldart, 1973) gas bypassing may occur when the flow rate of the fluidizing gas is
increased beyond the minimum fluidization velocity (Wells, 2001; Karri et al., 2004;
Issangya et al., 2007). When this phenomenon occurs, the fluidizing gas bypasses the bed
in the form of streams of gas, leaving a large fraction of the bed unfluidized or poorly
fluidized. Since many industrial fluidized bed processes might work with deep beds, gas
streaming is a potential problem that can decrease the efficiency of these chemical and
physical fluidized bed processes.
With the exception of the previously cited works (Wells, 2001; Karri et al., 2004;
Issangya et al., 2007), there is little discussion of streaming flow in the open literature.
This may be attributed to the fact that laboratory scale fluidized beds are typically not

Chapter 1 – Introduction
6
operated with sufficient bed depth for streams to appear (Karri et al., 2004). Some
previous researchers have reported the presence of non-uniformity in the radial gas
distribution (Rowe et al., 1978; Farag et al., 1997). However, they have not considered it
as an important phenomenon to be separately studied. For instance, Farag et al. (1997)
conducted experiments in 0.3 and 0.5 m columns with 160 cm bed of FCC particles and
observed an axi-symmetric bubble flow “in spite of the careful design of the grid and
frequent checks of column verticality”. They have attributed this to the influence of the
return of particles from the cyclone dipleg. They noticed that increasing the bed
temperature enhanced the uniformity of the radial bubbling activity.
The concept of gas streaming was first reported in the literature by Wells (2001). He
performed experiments in large scale units with up to 2.5 m diameter and 5 m bed depth
and observed streaming flow under conditions that were expected to lead to operation in
the bubbling regime. He studied the effects of fines content (particles smaller than 44
μm), distributor design, anti-static agents, baffles, and bed depth. Presumably due to
restrictions surrounding the publication of industrial data, details of his findings were
limited; however he reported no influence of the various parameters, with the exception
of bed depth and baffles. The streaming phenomenon was attributed to gas compression
caused by the pressure head of the deep bed over the distributor. The onset of streaming
corresponded to an increase in the emulsion suspension density above that at minimum
fluidization. The bed then defluidized and gas streaming occurred. Wells (2001)
concluded that when the ratio of the density at minimum fluidization to the density of the
emulsion phase becomes less than some critical value for a given bed depth, streaming

Chapter 1 – Introduction
7
occurs. This ratio was calculated using the equation of Abrahamsen and Geldart (1980).
However, his criterion was not a direct function of the operating condition such as bed
depth and gas velocity. Instead, the emulsion phase density was a function of voidage at
minimum bubbling and pressure at the surface of fluidized bed.
Karri et al. (2004) investigated the formation of streaming flow in a column of 0.3 m
inner diameter and 4.9 m height, and tried to characterize different aspects of this
phenomenon. They used FCC particles with average diameter of 70 μm and a static bed
depth of 2 m. They found that the standard deviation of pressure drop in a bed exhibiting
streaming was much greater than a uniformly fluidized bed. They also reported that for
all combinations of operating conditions investigated, the addition of a sufficient amount
of fines to the bed of Geldart’s Group A particles was able to delay the streaming. This
was contrary to the findings of Wells (2001). Karri et al. (2004) also evaluated the use of
baffles and found that using two baffles located vertically with a distance of 0.76 cm
apart can eliminate the streaming flow. The value of 0.76 cm was found by continuously
withdrawing the particles from a fluidized bed with deep bed of particles until the
signatures of streaming disappears. The bed depth at this stage was found to be 0.76 m.
Issangya et al. (2007) performed another study in a 0.9-m-diameter and 6.1 m tall test
unit. They used FCC catalyst particles with fines contents of 3 and 12% and median
particle diameters of 80 and 74 μm, respectively, and gas velocities up to 0.5 m/s. Tests
with higher gas velocities were done in another unit. They applied four pressure
transducers mounted at four radial positions across axial heights spanning 61 cm to detect

Chapter 1 – Introduction
8
the presence of streaming flow. They attributed the significantly higher magnitudes of
differential pressure fluctuations to the passage of streaming flow in front of the pressure
transducer. They also concluded that the maximum in the plot of standard deviation of the
pressure fluctuation measured across the entire bed versus gas velocity, which has been
shown in the literature to be an indication of the transition between the bubbling to
turbulent fluidization regimes, is not present for deep beds that are subject to streaming.
They also used a bubble probe and related the non-uniformity of the radial bubble
distribution to the streaming phenomenon. The maximum in the graph of standard
deviation of pressure fluctuation versus gas velocity has been reported in the literature as
the transition point between bubbling and turbulent regimes (Bi and Grace, 1995a,
1995b). The absence of this peak has been introduced as an indication of streaming in
deep beds by Issangya et al. (2007) is contrary to the earlier findings of Ellis (2003). Ellis
(2003) performed a comprehensive study on the bubbling-turbulent transition velocity in
fluidized beds of FCC particle with 75 μm diameter and 1560 kg/m3 density with bed
depth and gas velocity of as high as 1.5 m and 1.2 m/s, respectively. She reported that
although by increasing the bed depths the location of maximum shifts to the higher gas
velocities, it is always present in the graph. Since her study was focused on the effect of
the bubbling/turbulent transition point, there is not any reference to streaming in her
work. The gas velocities used in the present work are much less than the transition point,
thus, the present work remains neutral in this debate.
1.3. Pressure Measurement

Chapter 1 – Introduction
9
Probably the most widespread measurement technique in fluidized beds is the pressure
measurement. Research tools such as electrical capacitance tomography (ECT) and x-ray
densitometry and imaging techniques are feasible to determine fluidized bed
hydrodynamics through local voidage profiles in laboratory scale fluidized bed units, but
have not been proved to be sufficient for monitoring larger scale units. Pressure
fluctuation measurements have great potential to be used as a means of monitoring
fluidized bed processes due to its simplicity and ease of application. Pressure fluctuations
in fluidized beds are generated by temporary variations in the bed voidage (Saxena and
Waghmare, 2000). These variations originate from a variety of phenomena that occur
during fluidization process such as bubble formation, coalescence, splitting, eruption at
the surface, etc. (van Ommen, 2001). Compression waves of various magnitudes created
by these phenomena propagate and attenuate throughout the fluidized bed.
1.4. Computational Fluid Dynamics (CFD) Modeling of Dense Fluidized
Beds
Although CFD modeling of single phase systems is now a common task, using CFD tools
for modeling multiphase systems is still far from perfected. This is due in part to the
difficulties encountered in describing the interactions between different phases. The
systems containing solids are usually the most complex and challenging ones in the field
of multiphase flows. According to the literature (van Wachem et al., 2001; Goldschmidt
et al., 2001; Sinclair and van Wachem, 2004), the CFD models of particle-laden flows are
divided into two major groups: Lagrangian and Eulerian models. In the Lagrangian
models, also called Discrete Element Method (DEM), the particles paths and trajectories
Chapter 1 – Introduction
10
are calculated based on the Newtonian laws of motion (Goldschmidt et al., 2001). The
interactions between the particles are described either by a potential force soft-particle
dynamics (Tsuji et al., 1993) or by collisional force hard particle dynamics (Hoomans et
al., 1996).
The potential of easily changing the physical properties of the particles (e.g., size or
density) and exploring the local physical phenomena related to the particle flow behavior
is one of the important advantages of the Lagrangian approach. However, the Lagrangian
approach consumes a large amount of computer memory and long calculation time is
needed to track each of the single particles. Hence, Lagrangian approach seems not to be
convenient for the simulation of dense-phase particle-laden flows, especially systems of
industrial scale.
Eulerian models, also called Two Fluid Models (TFM), consider the particle and fluid
phases as two interpenetrating continua and solve the Navier-Stokes equations as the
governing equations for each phase. Since these equations were originally derived for
fluids, several additional terms are included in these equations to be able to describe the
behavior of the solid particles as a fluid. The kinetic theory of granular flow
(Goldschmidt et al., 2001; Farrell et al., 1986; Kim et al., 1993) is the leading tool in
calculating the solid phase properties. In this theory, a separate energy balance associated
with the particle velocity fluctuations that results from particle interactions (the so-called
“granular energy balance”) is solved in conjunction with the particle continuity and
momentum balances (Sinclair and van Wachem, 2004).

Chapter 1 – Introduction
11
Although mathematical models have been able to provide acceptable results for the
modeling of coarser particles (Goldschmidt et al., 2001; Taghipour et al., 2005; Boemer
et al., 1997), attempts at the simulation of finer Geldart A class of powders have
encountered some significant challenges (McKeen and Pugsley, 2003; Makkawi et al.,
2006). This difficulty arises due to the relative importance of interparticle cohesive forces
compared with the gravitational forces when dealing with Geldart A powders (e.g.
Massimilla and Donsi, 1976). According to Molerus (1982), cohesive forces can be
neglected for the larger group B and D particles. Massimilla and Donsi (1976) found that
the cohesion force between particles of 40–100 μm diameters might be very high
compared to the particle weight. Therefore, neglecting cohesive forces in CFD models of
dense fluidized beds of Geldart A particles can lead to over-prediction of bed expansion
by as much as 100% (McKeen and Pugsley, 2003; Makkawi et al., 2006). In fact, by
neglecting these forces the underlying assumption is that mainly the collisional effects
control individual particle-particle contacts, thus a large part of the remaining dynamic
energy of the particles is consumed for propelling the particles towards the top of the bed.
McKeen and Pugsley (2003) were among the early researchers who reported this over-
prediction of bed expansion. They argued that interparticle forces lead to the formation of
particle clusters with a corresponding reduction in gas-solid drag. They found that by
scaling the drag model of Gibilaro et al. (1985) with a fractional constant equal to 0.25,
realistic bed expansion and bubble properties were predicted. Incorporation of equations
for the interparticle cohesive forces was attempted by Kim and Arastoopour (2002), who

Chapter 1 – Introduction
12
extended the kinetic theory of granular flow to cohesive particles by modifying the solid
distribution equation. However, the final expression for the particulate stress was
complex and difficult to incorporate into the current CFD models. Neither their model
nor the model of McKeen and Pugsley (2003) considered the size distribution of particles
in the fluidized bed.
As pointed out by Grace and Sun (1991), particle size distribution has a significant
influence on the bed expansion. Therefore, considering the size distribution of the
particles in the computational models might eliminate the problem of over-prediction of
the bed expansion. However, the presence of different types and sizes of particles
complicates the modeling process because separate continuity and momentum equations
must be solved for each size and type (Risk, 1993; Gidaspow, 1994). As a result, these
models have been only used for up to three solid phases in the literature, due to the
computational limitations.
The multiphase Particle in Cell (PIC) approach (Andrews and O'Rourke, 1996; Snider et
al., 1998; Snider, 2001; Karimipour and Pugsley, 2009), which is essentially an Eulerian-
Lagrangian model, provides a numerical scheme in which particles are grouped into
computational parcels each containing a number of particles with identical density,
volume and velocity, located at a specific position. The evolution of the particle phase is
governed by solving a Liouville equation for the particle distribution. The result of this
procedure is a computational technique for multiphase flow that can handle particle
loadings ranging from dilute to dense with a distribution of particle types and sizes.

Chapter 1 – Introduction
13
1.5. Project Motivation
Streaming flow in deep beds is a relatively new phenomenon reported in the literature in
fluidized beds and there is still a great deal of uncertainty and contradiction between
results of different investigations. For instance, while Wells (2001) found no effect of
fines content, others (Karri et al., 2004; Issangya et al., 2007) reported an influence of
fines on the streaming flow. The mathematical work presented by Wells (2001) to predict
the onset of streaming flow does not a have a functional dependency on conditions such
as bed depth and gas velocity and seems not to be able to predict the presence of
streaming for various cases. These facts indicate that further experimental and theoretical
work is still required to shed light on this phenomenon. The present work attempted to
verify the presence of the streaming flow, to find the differences between the
hydrodynamics of fluidized beds with different bed depths, and to investigate the possible
reasons for these differences and their relationship to the presence of streams. For this
purpose, a combination of experimental and mathematical modeling has been employed.
1.6. Objectives
The main objective of the present PhD project was to perform a comprehensive study on
the various aspects of the gas streaming phenomenon in deep fluidized beds of Geldart A
particles. This main objective was achieved by a combination of experimental and
modeling work. The detail of the sub-objectives of the project can be summarized as
follows:
1. Experimental study of the general characteristics of deep beds (chapter 1).

Chapter 1 – Introduction
14
a. Design and construction of a 0.3 m diameter by 3.3 m tall cold model
fluidized bed.
b. Calibration and installation of the pressure transducers across the fluidized
bed.
c. Measurement of pressure fluctuations for different conditions of bed
depth, gas velocity, particle size, and distributor design.
d. Comparative study of the effect of these different conditions on the
fluidized bed hydrodynamics using pressure fluctuations time series.
2. Experimental study of the nature of streaming flow (chapter 2).
a. Measurement of pressure fluctuations for various conditions of bed depth,
gas velocity, particle size, and distributor design for different cases of
forced streaming flow and jet flows.
b. Assessment of the tendency for streaming in these different cases.
c. Wavelet decomposition analysis to investigate the detail of the phenomena
that participate in the observed streaming flow.
3. Modeling study of the streaming flow in deep fluidized bed (chapters 3 and 4).
a. CFD simulation using available commercial codes.
b. Phenomenological modeling of the deep bed.
1.7. References
Abrahamsen, A.R., Geldart, D., 1980. Behaviour of gas-fluidized beds of fine powders
part I. Homogeneous expansion, Powder Technology 26, 35-46.

Chapter 1 – Introduction
15
Andrews, M.J., O'Rourke, P.J., 1996. The multiphase particle-in-cell (MP-PIC) method
for dense particulate flows, International Journal of Multiphase Flow 22, 379-402.
Bi, H.T., Grace J.R., 1995a. Effect of measurement method on the velocities used to
demarcate the onset of turbulent fluidization, The Chemical and Biochemical Engineering
Journal 57, 261-271.
Bi, H.T., Grace J.R., 1995b. Flow regime diagrams for gas-solid fluidization and upward
transport, International Journal of Multiphase Flow 21, 1229-1236.
Boemer, A., Qi, H., Renz, U., 1997. Eulerian simulation of bubble formation at a jet in a
two-dimensional fluidized bed. International Journal of Multiphase Flow 23, 927-944.
Ellis, N., 2003. Ph.D. Dissertation, Hydrodynamics of gas-solid turbulent fluidized beds,
University of British Columbia, Canada.
Farag, H.I., Mejdell, T., Hjarbo, K., Ege, P., Lysberg, M., Grislingas, A., De Lasa, H.,
1997. Fibre optic and capacitance probes in turbulent fluidized beds, Chemical
Engineering Communication 157, 73-107.
Farrell, M., Lun, C., Savage, S., 1986. Simple kinetic theory for granular flow of binary
mixtures of smooth, Inelastic, Spherical Particles. Acta Mechanica 63, 45-60.
Geldart, D., 1973. Types of gas fluidization. Powder Technology 7, 285-292.
Gibilaro, L., Di Felice, R., Waldram, S., 1985. Generalized friction factor and drag
coefficient correlations for fluid-particle interactions. Chemical Engineering Science 40,
1817-1823.
Gidaspow, D., 1994. Multiphase flow and fluidization: Continuum and kinetic theory
description. Academic Press, Boston.

Chapter 1 – Introduction
16
Goldschmidt, M., Kuipers, J., van Swaaij, W., 2001. Hydrodynamic modelling of dense
gas-fluidised beds using the kinetic theory of granular flow: effect of coefficient of
restitution on bed dynamics. Chemical Engineering Science 56, 571-578.
Grace, J., Sun, G., 1991. Influence of particle size distribution on the performance of
fluidized bed reactors. Canadian Journal of Chemical Engineering 69, 1126-1134.
Hoomans, B., Kuipers, J., Briels, W., van Swaaij, W., 1996. Discrete particle simulation
of bubble and slug formation in a two-dimensional gas-fluidised bed: A hard sphere
approach. Chemical Engineering Science 51, 99-118.
Issangya, A., Knowlton, T., Karri, S.B.R., 2007. Detection of gas bypassing due to jet
streaming in deep fluidized beds of group A particles. In: Fluidization XII, Berruti, F., Bi,
X., Pugsley, T. (Eds.), Vancouver, British Columbia, Canada, May 13-17.
Karimipour, S., Pugsley, T., 2009. Application of the particle in cell approach for the
simulation of bubbling fluidized beds of Geldart A particles. 7th International Conference
on Computational Fluid Dynamics in the Minerals and Process Industries, Melbourne,
Australia, December 9-11.
Karri, S.B.R., Issangya, A.S., Knowlton, M., 2004. Gas bypassing in deep fluidized beds.
In: Fluidization XI, Arena, U., Chirone, R., Miccio, M., Salatino, P. (Eds.), Ischia
(Naples), Italy, May 9-14.
Kim, S., Woodcock, L., 1993. Kinetic theory of granular shear flow: constitutive relations
for the hard-disk model. Journal of Statistical Physics 71, 143-162.
Kim, H., Arastoopour, H., 2002. Extension of kinetic theory to cohesive particle flow.
Powder Technology 122, 83-94.

Chapter 1 – Introduction
17
Kuipers, J., van Duin, K., van Beckum, F., van Swaaij, W., 1992. A numerical model of
gas-fluidized beds. Chemical Engineering Science 47, 1913-1924.
Kunii, D., Levenspiel, O., 1991. Fluidization Engineering, 2nd edition, Butterworth-
Heinemann, Boston, USA.
Lim, K., Zhu, J., Grace, J., 1995. Hydrodynamics of gas–solid fluidization. International
Journal of Multiphase Flow 21, 141-193.
Makkawi, Y., Wright, P., Ocone, R., 2006. The effect of friction and inter-particle
cohesive forces on the hydrodynamics of gas-solid flow: A comparative analysis of
theoretical predictions and experiments. Powder Technology 163, 69-79.
Massimilla, L., Donsi, G., 1976. Cohesive forces between particles of fluid-bed catalysts.
Powder Technology 15, 253-260.
McKeen, T., Pugsley, T., 2003. Simulation and experimental validation of freely
bubbling bed of FCC catalyst. Powder Technology 129, 139-152.
Molerus, O., 1982. Interpretation of Geldart type A, B, C and D powders by taking into
account interparticle forces. Powder Technology 33, 81-87.
Pain, C. Mansoorzadeh, S. de Oliveira, C. Goddard, A., 2001. Numerical modelling of
gas-solid fluidized beds using the two-fluid approach. International Journal for Numerical
Methods in Fluids 36, 91-124.
Risk, M., 1993. Mathematical modeling of densely loaded, particle laden turbulent flows.
Atomization and Sprays 3, 1-27.
Rowe, P.N., L. Santoro, J.G. Yates, 1978. The division of gas between bubble and
interstitial phases in fluidized beds of fine powders. Chemical Engineering Science 33,
133-140.
Chapter 1 – Introduction
18
Saxena, S.C., Waghmare, B., 2000. Investigation of pressure fluctuation history records
of gas-solid fluidized beds. International Journal of Energy Research 24, 495-502.
Sinclair, J., van Wachem, B., 2004. Modeling particle-laden flows: A research outlook.
AIChE Journal 50, 2638-2645.
Snider D.M, O'Rourke P.J., Andrews M.J., 1998. Sediment flow in inclined vessels
calculated using a multiphase particle-in-cell model for dense particle flows. International
Journal of Multiphase Flow 24, 1359-1382.
Snider D.M., 2001. An incompressible three-dimensional multiphase particle-in-cell
model for dense particle flows. Journal of Computational Physics 170, 523-549.
Taghipour, F., Ellis, N., Wong, C., 2005. Experimental and computational study of gas-
solid fluidized bed hydrodynamics. Chemical Engineering Science 60, 6857-6867.
Tsuji, Y., Kawaguchi, T., Tanaka, T., 1993. Discrete particle simulation of two-
dimensional fluidised bed. Powder Technology 77, 79-87.
van Ommen, J., Schouten, J., Coppens, M., van den Bleek, C., 2001. Monitoring of
fluidized bed hydrodynamics to detect changes in particle size distribution. In:
Fluidization X, Kwauk, M., Li, J., Yang, W.C. (Eds.), Beijing, China, May 20-25.
van Wachem, B., Schouten, J., van den Bleek, C., 2001. Comparative analysis of CFD
models of dense gas-solid systems. AIChE Journal 47, 1035-51.
Wells, J., 2001. Streaming flow in large scale fluidization. AIChE Annual Meeting,
Particle Technology Forum, Reno, Nevada, USA.
Wilson, J., 1997. Fluid Catalytic Cracking Technology and Operation, 1st edition,
Pennwell Publishing, Oklahoma, USA.

Chapter 1 – Introduction
19
Figure 1.1. Different fluidization regimes that occur by increasing the gas velocity in
fluidized beds
Fixed bed Bubbling Turbulent Fast fluidization
Slugging

Chapter 1 – Introduction
20
Figure 1.2. A schematic diagram of Geldart’s particle classification chart
D Spoutable
B Sand-like
A Aeratable
ρ p-ρ
g (g
/cm
3 )
C Cohesive

CHAPTER 2 - Study of Gas Streaming in a Deep
Fluidized Bed Containing Geldart’s Group A Particles
The contents of this chapter have been published in the journal Chemical Engineering
Science. It has been published in a version similar to what appears in this chapter.
Citation
S. Karimipour, T. Pugsley, Study of gas streaming in a deep fluidized bed containing
Geldart’s group A particles, ChemicalEngineeringScience65(2010) 3508-3517.
Contribution of PhD Candidate
The experiments performed for the purpose of this work were planned and performed by
Shayan Karimipour. Todd Pugsley provided consultation regarding the experimental
program. The programs for all of the data analysis were developed by Shayan
Karimipour. All of the writing of the submitted manuscript was done by Shayan
Karimipour with Todd Pugsley providing editorial guidance regarding the style and
technical content of the manuscript.

Chapter 2 - Study of Gas Streaming in a Deep Fluidized Bed
22
Contribution of this Paper to the Overall Study
This paper investigates the characteristics of gas streaming in a deep fluidized bed
containing Geldart A particles in a 30-cm ID cold flow unit. The objective of this work
was to verify the presence of the streaming flow, find the differences between the
hydrodynamics of fluidized beds with different bed depths, and explore the possible
reasons for these differences and their relationship to the presence of streams.
2.1. Abstract
The nature of gas streaming in a deep fluidized bed containing Geldart’s Group A powder
has been investigated in a 30-cm ID cold flow unit. Pressure fluctuations have been
measured at 8 locations from 4 to 150 cm above the gas distributor for bed depths and gas
velocities ranging from 0.4 to 1.6 m and 0.04 to 0.20 m/s, respectively. In order to study
the effect of fines content on gas streaming, two particle size distributions with Sauter
mean diameters of 48 µm and 84 µm were tested for each bed depth and gas velocity.
Two distributor plates with differing percentage open area were also tested for their
influence on gas streaming. Analysis of pressure fluctuations in the time and frequency
domains, in combination with visual observations show that streaming flow emerges
gradually at bed depths greater than 1 m. Increased gas velocity and fines content act to
delay the onset of streaming, but can not completely eliminate it over the range of
velocities examined. The two different distributor designs had no measurable effect on
the streaming flow.

Chapter 2 - Study of Gas Streaming in a Deep Fluidized Bed
23
2.2. Introduction
Fluidized beds have broad applications in many chemical, pharmaceutical, and mineral
processing industries. Numerous studies have been carried out to characterize the
hydrodynamics of fluidized beds. Several techniques based on the measurement of the
fluctuations of pressure (Johnsson et al., 1995; Svensson et al., 1996; Bai et al., 1997),
voidage (Daw and Halow, 1991; Huilin et al., 1997; Bai et al., 1997; Ohara et al., 1999)
and temperature (Kozma et al., 1996; Woo et al., 2001; Huilin et al., 2002) have been
developed and used in the literature. Pressure transducers have been one of the most
popular devices due to their simplicity and ease of implementation in industrial facilities.
Tamarin (1964) and Hiby (1967) were one of the first researchers who attempted to
determine the frequency of the pressure fluctuations using visual observations of the
pressure signals. Kang et al. (1967) were among the first who used time series analysis
techniques such as probability density functions, root mean square of pressure
fluctuations, and power spectral density (PSD), to illustrate the time and frequency
characteristics of the pressure fluctuations. Lirag and Littman (1971) included
autocorrelation and cross-correlation functions to the analysis techniques used by Kang et
al. (1967). The autocorrelation function was used to detect signs of periodic phenomena
in the pressure fluctuations, while the cross-correlation function was used to calculate the
time lag between the pressure fluctuations in the bed and in the plenum. This time lag
was used to calculate the propagation velocity of the pressure wave. Fan et al. (1981) and
Clark et al. (1991) also discussed similar applications of pressure fluctuations analysis in
fluidized bed researches.
Chapter 2 - Study of Gas Streaming in a Deep Fluidized Bed
24
Investigating regime transitions in fluidized beds based on analysis of the time series of
pressure data has been one of the major concerns of many researchers. Yerushalmi and
Cankurt (1979) defined the transition velocity from bubbling to turbulent regime as the
point where the standard deviation of pressure fluctuations reaches a peak. Regime
transitions have also been identified by studying the changes that occur in the frequency
distribution of PSD (Lirag and Littman, 1971; Canada et al., 1978; Satija and Fan, 1985;
Johnsson et al., 1995; Svensson et al., 1996).
The study of pressure fluctuations has been widely continued until recent days. One of
the important operating parameters that can greatly affect the fluidized bed
hydrodynamics, and thus the in-bed pressure fluctuations, is the bed depth. Grace and
Sun (1991) studied the effect of bed depths varied from 40 to 100 cm on the differential
pressure fluctuations in a bed of FCC particles. They found that the transition velocity
from bubbling to turbulent regime is almost independent of the bed depth. Similar results
were reported by Satija and Fan (1985) and Jin et al. (1986). Falkowski and Brown
(2004) studied the pressure fluctuations for a range of variables including bed depth in a
fluidized bed of Geldart B and D particles to determine the effect of these parameters on
the PSD graph. They reported that dominant frequency decreases with increasing the bed
depth from 8.6 to 50.8 cm.
The bed depth, which is directly related to the material inventory of the fluidized bed, is
indeed one of the important operating parameters in various applications of fluidized
beds. Achieving specific efficiencies or throughput can lead to the necessity of employing

Chapter 2 - Study of Gas Streaming in a Deep Fluidized Bed
25
deep fluidized beds. In these cases, maintaining specified gas residence times, low
particle entrainment, and a good fluidization quality possess special importance. Recent
studies have shown that, in a sufficiently deep bed of Geldart’s Group A particles
(Geldart, 1973) gas bypassing may occur when the flow rate of the fluidizing gas is
increased beyond the minimum fluidization velocity (Wells, 2001; Karri et al., 2004;
Issangya et al., 2007). When this phenomenon occurs, the fluidizing gas bypasses the bed
in the form of streams of gas, leaving a large fraction of the bed unfluidized or poorly
fluidized. Since many industrial fluidized bed processes might work with deep beds, gas
streaming is a potential problem that can decrease the efficiency of these chemical and
physical fluidized bed processes.
With the exception of the previously cited works (Wells, 2001; Karri et al., 2004;
Issangya et al., 2007), there is little discussion of streaming flow in the open literature.
This may be attributed to the fact that laboratory scale fluidized beds are typically not
operated with sufficient bed depth for streams to appear (Karri et al., 2004). At the same
time, industrial units that may operate with very deep beds of particles are mostly made
of steel columns that eliminate the possibility of visual observation of the inside of the
column. Some previous researchers have reported the presence of non-uniformity in the
radial gas distribution (Rowe et al., 1978; Farag et al., 1997). However, they have not
considered it as an important phenomenon to be separately studied. For instance, Farag et
al. (1997) conducted experiments in 0.3 and 0.5 m diameter columns with a 160 cm deep
bed of FCC particles and observed an axi-symmetric bubble flow “in spite of the careful
design of the grid and frequent checks of column verticality”. They attributed this to the

Chapter 2 - Study of Gas Streaming in a Deep Fluidized Bed
26
influence of the return of particles from the cyclone dipleg. They noticed that increasing
the bed temperature enhanced the uniformity of the radial bubbling activity.
The concept of gas streaming was first reported in the literature by Wells (2001). He
performed experiments in large scale units with up to 2.5 m diameter and 5 m bed depth
and observed streaming flow under conditions that were expected to lead to operation in
the bubbling regime. He studied the effects of fines content (particles smaller than 44
µm), distributor design, anti-static agents, baffles, and bed depth. Presumably due to
restrictions surrounding the publication of industrial data, details of his findings were
limited; however he reported no influence of the various parameters, with the exception
of bed depth and baffles. The streaming phenomenon was attributed to gas compression
caused by the pressure head of the deep bed over the distributor. The onset of streaming
corresponded to an increase in the emulsion suspension density above that at minimum
fluidization. The bed then defluidized and gas streaming occurred. Wells (2001)
concluded that when the ratio of the density at minimum fluidization to the density of the
emulsion phase becomes less than some critical value for a given bed depth, streaming
occurs. However, his criterion was not a direct function of the operating condition such as
bed depth and gas velocity. Instead, the emulsion phase density was a function of voidage
at minimum bubbling and pressure at the surface of the fluidized bed.
Karri et al. (2004) investigated the formation of streaming flow in a column of 0.3 m
inner diameter and 4.9 m height, and tried to characterize different aspects of this
phenomenon. They used FCC particles with average diameter of 70 μm and a static bed

Chapter 2 - Study of Gas Streaming in a Deep Fluidized Bed
27
depth of 2 m. They found that the standard deviation of pressure drop in a bed exhibiting
streaming was much greater than a uniformly fluidized bed. They also reported that for
all combinations of operating conditions investigated, the addition of a sufficient amount
of fines to the bed of Geldart’s Group A particles was able to delay the streaming. This
was contrary to the findings of Wells (2001). Karri et al. (2004) also evaluated the use of
baffles and found that two baffles separated vertically by a distance of 0.76 cm eliminated
the streaming flow. The value of 0.76 cm was chosen because it corresponded to the
maximum bed depth beyond which streaming occurred in a non-baffled bed.
Issangya et al. (2007) performed another study in a 0.9-m-diameter and 6.1 m tall test
unit. FCC catalyst with fines contents of 3 and 12% and median particle diameters of 80
and 74 μm, respectively was used as the bed test material. Results for gas velocities up to
approximately 1 m/s were reported. Four pressure transducers were mounted at four
radial positions across axial heights spanning 61 cm to detect the presence of streaming
flow. They attributed the larger differential pressure fluctuations measured by certain
transducers to the passage of streams closer to that transducer. Issangya et al. (2007) also
concluded that the maximum in the plot of standard deviation of the pressure fluctuation
measured across the entire bed versus gas velocity, which has been shown in the literature
to be an indication of the transition between the bubbling and turbulent fluidization
regimes, is not present for deep beds that are subject to streaming. The absence of the
maximum in the graph of standard deviation of pressure fluctuation versus gas velocity
which is reported as an indication of streaming in deep beds by Issangya et al. (2007) is
contrary to the findings of Ellis (2003). Ellis (2003) performed a comprehensive study on

Chapter 2 - Study of Gas Streaming in a Deep Fluidized Bed
28
the bubbling-turbulent transition velocity in fluidized beds of FCC particle with 75 μm
diameter and 1560 kg/m3 density with bed depth and gas velocity of as high as 1.5 m and
1.2 m/s, respectively. She reported that although by increasing the bed depths the location
of the maximum shifts to the higher gas velocities, it is always present in the graph. Since
her study was focused on the effect of the bubbling/turbulent transition point, there is not
any reference to streaming in her work. The gas velocities used in the present work are
much less than the transition point, thus, the present work remains neutral in this debate.
Streaming flow in deep beds is a relatively new phenomenon reported in the literature in
fluidized beds and there is still a great deal of uncertainty and contradiction between
results of different investigations. For instance, while Wells (2001) found no effect of
fines content, others (Karri et al., 2004; Issangya et al., 2007) reported an influence of
fines on the streaming flow. The mathematical work performed by Wells (2001) to
predict the onset of streaming flow was not a direct function of the operating conditions
such as bed depth and gas velocity and seems not to be able to predict the presence of
streaming flow for various conditions. He also has not presented a comparative analysis
between different bed depths to clarify the presence of streaming flow.
These facts indicate that further experimental and theoretical work is still required to shed
light on this phenomenon. The objective of the present work is to verify the presence of
the streaming flow, to find the differences between the hydrodynamics of fluidized beds
with different bed depths, and to investigate the possible reasons for these differences and
their relationship to the presence of streams. For this purpose, pressure fluctuations have

Chapter 2 - Study of Gas Streaming in a Deep Fluidized Bed
29
been used to perform a comparative analysis of the influence of different parameters on
the fluidized bed behavior. The pressure fluctuations have been measured at several
locations along the fluidized bed for various combinations of bed depth, gas velocity,
particle size, and distributor design in a 0.3 m diameter column. Quantitative analysis
methods in both the time and frequency domains have been used to extract and evaluate
useful information regarding the fluidized bed behavior under these different conditions.
2.3. Experimental
Fluidized Bed
The fluidized bed unit was made of a cylindrical Plexiglas column with an inner diameter
of 30 cm and height of 3.3 m (Fig. 2.1). The column was equipped with an internal
cyclone and a dipleg to continuously return entrained particles to the bed during
operation. The distance between the dipleg exit and the distributor was 0.19 m for all bed
depths. The cyclone gas exit was connected with a flexible hose to a barrel with filter
cloth stretched over openings on the top to prevent very fine particles from escaping into
the surrounding room. In order to test the influence of distributor design, two different
perforated plate distributors with open areas and orifice diameters of 0.54% and 1 mm
and 2.15% and 2 mm, respectively were used. The former is referred to as the high
pressure drop (HPD) distributor and the latter the low pressure drop (LPD) distributor.
The holes on both distributors were arranged in a rectangular pitch. A very fine screen
was glued on the distributor to prevent from weeping of particles into the wind-box. The
fluidization air was supplied by a 50 hp Kaeser® positive displacement blower. The air
flowrate was measured using an orifice plate and water manometer. To limit the effect of

Chapter 2 - Study of Gas Streaming in a Deep Fluidized Bed
30
electrostatic charges on the fluidized bed hydrodynamics, the outer periphery of the
column was wrapped with aluminum strips and grounded properly in a way that still
allowed visual observation of the system through the wall of the Plexiglas vessel.
Test Material
The bed material was fluid catalytic cracking (FCC) catalyst with a particle density of
1400 kg/m3. Two catalyst size distributions were used: one with a Sauter mean diameter
of 84 μm and the other with a Sauter mean of 48 μm. The particle size distributions of the
two test powders, measured using a Mastersizer S Long Bench (Malvern, Worcestershire,
UK), are provided in Fig. 2.2. The minimum fluidization velocity of the particles having
a mean diameter of 84 μm was measured in previous experiments to be 0.004 m/s
(McKeen and Pugsley, 2003). The minimum fluidization velocity for the finer particles
was not available experimentally, and thus was calculated using the Wen and Yu (1966)
equation to be equal to 0.0014 m/s.
Experimental Conditions and Instrumentation
The operating variables investigated in the present study and their ranges are summarized
in Table 2.1. Pressure fluctuations were measured with reference to the atmosphere by
Omega® differential pressure transducers mounted along the fluidized bed column. The
axial positions of the pressure transducers are illustrated in Fig. 2.1, while model numbers
and specifications of the transducers are provided in Table 2.2. The pressure transducers
were flush-mounted to the internal wall of the fluidized bed with 15 cm long and 4.5 mm
diameter stainless steel tubes covered by a 10 μm mesh at the tip to prevent particles from

Chapter 2 - Study of Gas Streaming in a Deep Fluidized Bed
31
entering the tube. Special care was taken to maintain the volume of the steel tube less
than 2500 mm3, as recommended by Johnsson et al. (2000), to reduce the damping effect
of the tube on the pressure fluctuations. Pressure measurements were performed at a
sampling frequency of 100 Hz, which is well above the major frequencies observed in
fluidized bed pressure fluctuation power spectra (the dominant frequency is normally
below 10 Hz (Johnsson et al., 2000). Sampling time was 5 min for all measurements. The
data acquisition equipment was interfaced with a continuous data logging program built
with LabVIEW® (National Instruments®, Austin, USA).
2.4. Analysis Methods
Time series of pressure fluctuations collected with the differential pressure transducers
have been analyzed in the time and frequency domains. Key properties that are extracted
from the time series through these analyses are briefly explained in the following
sections.
2.4.1. Autocorrelation and Cross Correlation Functions
The autocorrelation function measures the correlation between successive observations in
a single time series. It is calculated through a comparison between a times series and the
delayed version of itself. The autocorrelation function is one at zero delay, and decreases
with an increase in the delay value. For a times series containing different degrees of
periodicity, the autocorrelation function shows an oscillatory behavior. The rate of
decrease of the function is proportional to the rate of information loss in the system.
Hence, the more vigorous the turbulence in the measurement region, the more rapid the

Chapter 2 - Study of Gas Streaming in a Deep Fluidized Bed
32
decrease of the autocorrelation function. The autocorrelation function is calculated from
the following equation:
1
2
1
( )( )
( )
n k
i i kin
ii
x x x xACF
x x
(2.1)
The cross correlation function measures the correlation between two different time series.
It compares a reference time series with the delayed versions of another time series and
calculates a correlation coefficient for each pair of time series. The magnitude of the
correlation coefficients is a measure of the similarity of the phenomena affecting regions
where the time series are measured. If the magnitude is large, it can be concluded that
those time series are highly correlated and the same phenomena is happening in both
regions. The rate of decrease of the cross correlation function can be interpreted in the
same manner as the autocorrelation function. A rapid decrease indicates that mostly local
phenomena are affecting the two measurement regions. However, a slow decrease shows
that a more global phenomenon or a phenomenon that prolongs from one measurement
region to the other is predominant. The cross correlation function can be calculated using
the following equation:
1
2 2
1 1
( )( )
( ) ( )
n k
i i ki
n n
i ii i
x x y yACF
x x y y
(2.2)
2.4.2. Power Spectral Density and Coherency
Spectral analysis is a common tool for exploring the pressure fluctuations time series
generated in a fluidized bed. This approach has been used in many previous works for
determining bubble characteristics (e.g. Fan et al., 1983; van der Schaaf et al., 2002),

Chapter 2 - Study of Gas Streaming in a Deep Fluidized Bed
33
fluidization regime transitions [(e.g. Johnsson et al., 2000), and fluidization quality (e.g.
van Ommen et al., 2000)]. Most of these applications rely on determining the major
frequencies present in the time series and relating them to various physical phenomena in
the system. This is usually done by calculating the PSD of the time series. In the present
work, the PSD function of all time series is estimated with Welch’s averaged
periodogram method (Welch, 1967). It is computed for a window length of 1024 points
and is averaged over the length of the time series. The window size is selected in such a
way to eliminate the roughness of the PSD and at the same time, maintain the important
features of it. This was done by choosing different values of window size and visual
comparison of the PSDs calculated for each case. In order to avoid edge effects and
reduce spectral leakage in PSD calculations, Hanning windowing has been applied to
each window. The dominant frequency is considered as the frequency corresponding to
the maximum power of the PSD function.
The coherency between time series from two successive measurement locations along the
fluidized bed is calculated as a measure of similarity between the spectral activities
happening in those locations. The coherency ranges from 0 to 1 and can be calculated
using the formula below (van der Schaaf et al., 2002):
*2 ( ) ( )
( )( ) ( )
xy xyxy
xx yy
f ff
f f
(2.3)
where Фxy and Фxy are the power spectral density and cross power spectral density for x
and y time series, respectively. A coherency of one indicates that phenomena with exactly
the same frequency activity are present in the region of both measurement ports, although
the PSD of each time series might be different from the other at that frequency. On the

Chapter 2 - Study of Gas Streaming in a Deep Fluidized Bed
34
other hand, a zero coherency means the existence of no spectral correlation between two
time series at that specific frequency. It should be noted that the difference between
coherency and the cross correlation function is that cross correlation compares the value
of pressure in two time series and reports the extent of similarity in terms of a correlation
coefficient. The coherency quantifies the similarity between variations of the pressure for
two time series. This means that although the pressure may not be the same, the rate of
variation might be similar.
2.5. Results and Discussions
2.5.1. Visual Observations
The use of a transparent Plexiglas vessel in the present study permitted us to make visual
observations during experiments. This section is based on the observations made for the
coarse FCC particles (3% fines content); however, it covers low and high gas velocities
and both the HPD and LPD gas distributors. The observations showed that in the case of
the 40 cm bed depth, bubbles were formed over the entire bed cross section and the entire
bed appeared to be fluidized. For the 80 cm bed depth, some signs of preferential gas
flow began to emerge; however, this was not severe enough to deteriorate the general
fluidization quality and the entire cross section remained fluidized. The presence of
streaming flow was clear for the 120 cm bed depth. In this case, the bed was divided into
two regions with a diffuse boundary which changes due to the high turbulency of the gas
flow. Most of the gas appeared to flow upward in a stream that formed just above the gas
distributor and that constituted a small fraction of the bed cross-sectional area. In the
remainder of the cross section near the distributor, particles were slowly flowing down. It

Chapter 2 - Study of Gas Streaming in a Deep Fluidized Bed
35
was further observed that the particles were entrained by the stream to the top of the bed
and then moved downward in the dense region away from the streaming flow. Gas
entering the bed through the distributor tended to preferentially migrate laterally and join
the streaming flow, instead of flowing upward in the form of jets and then detaching to
form bubbles, as is the case in a normal fluidized bed. It should be noted that the
distributor plate was checked before and after the experiments to make sure that the
distributor orifices were not plugged by fine particulate material. Although the stream
could remain in one place for a longer time (typically less than two min), they generally
tended to change their position around the column during the measurement period. At bed
depths greater than 120 cm, the stream boundaries became more distinguished from the
remainder of the bed.
The streams observed at low gas velocities are best described as a “trail” of bubbles and
the stream passage was more unstable in nature. However, for higher velocities, the
stream looked similar to a passage of particle-laden gas in a pipe. These streams were
observed to mostly form at near-wall regions. This is probably due to the effect of wall to
support and stabilize the stream in a specific place. It is worth mentioning that although
the simultaneous presence of several gas streams has been reported in the literature (Karri
et al., 2004; Issangya et al., 2007) the occurrence of more than one stream was rarely
observed in the present work. Since the streams make the majority of gas to pass from a
channel with lower cross sectional area, the velocity of the gas in the streams are
expected to be much higher than the superficial gas velocity. This higher velocity may
cause higher rates of particle entrainment compared to the normal bubbling beds.

Chapter 2 - Study of Gas Streaming in a Deep Fluidized Bed
36
2.5.2. Quantitative Analyses and Discussion
2.5.2.1. Effect of Bed Depth
The time series of pressure fluctuations measured at an axial position of 30 cm above the
distributor for bed depths of 40 to 160 cm, superficial gas velocity of 35 Umf, and the
coarse FCC particles (3% fines content) are shown in Fig. 2.3. The autocorrelation
coefficients calculated using these time series is presented in Fig. 2.4a. There are
observable differences between the autocorrelations of the fluidized bed with different
bed depths. There is a clear decrease in the periodicity of the autocorrelation function
with increasing bed depth. For shallow beds, the periodic nature of the fluidized bed is
characterized by bubbling activities with various sizes along the column. These bubbles
that change faster compared to the gas stream produce higher frequency variations. With
the onset of streaming flow at bed depths beyond 80 cm, smooth fluidization with
uniform bubbling activity is compromised and the periodic variations of autocorrelation
are gradually suppressed. This is clearly observable by lower domain and lower
frequency oscillations in the autocorrelation graph for deep beds of 120 and 160 cm
depths.
Another visible difference with increasing bed depth is the rate of decrease of the
autocorrelation function. In the case of shallow bed depths, the autocorrelation coefficient
decreases sharply. This can be attributed to the presence of various local phenomena
arising from the coalescence and splitting of gas bubbles and to a lesser extent caused by
Chapter 2 - Study of Gas Streaming in a Deep Fluidized Bed
37
gas-particle and particle-particle interactions around the measurement point. However,
since streaming is a more stable (albeit undesirable) phenomenon compared to the
rigorous mixing present during bubbling fluidization, the autocorrelation coefficient
corresponding to streaming decreases more slowly.
Fig. 2.4b provides the cross correlation of the pressure fluctuations for the first two
successive measurement locations above the gas distributor (4 cm and 30 cm) for bed
depths of 40 to 160 cm and gas velocity of 35 Umf. As Fig. 2.4b shows, the correlation
coefficient between adjacent locations is higher in deeper beds and also lasts longer. This
suggests that the phenomenon that is affecting these two locations is changing with
increasing bed depth and its spread over these adjacent measurement points increases the
correlation coefficient between locations along the column. As mentioned for the case of
the autocorrelation function, this is probably due to the gradual change of fluidized bed
hydrodynamics from normal bubbling to severe streaming flow. Deterioration of the
periodic nature of the fluidized bed with increasing bed depth can also be seen in the
cross correlation graph.
Power spectral density (PSD) functions of the pressure fluctuations for different bed
depths are shown in Fig. 2.4c. Dominant frequencies are apparent in the PSD graph at
low bed depths and are equal to 4 Hz and 2.7 Hz for the 40 cm and 80 cm bed depths,
respectively. Increasing the bed depth shifts the dominant frequency towards very low
frequencies. The 120 cm bed exhibits local maxima at low frequencies, while the PSD
function for the 160 cm bed follows an exponential decrease with no noticeable

Chapter 2 - Study of Gas Streaming in a Deep Fluidized Bed
38
maximum. It is well known from the fluidization literature that the dominant frequency is
related to the major bubbling activity in the system. Increasing the bed depth shifts the
bed from a bubbling fluidization regime to a regime dominated by streaming flow. Since
the streams correspond to a lower variability compared to bubbling flow with a range of
bubble sizes and rise velocities, the dominant frequency decreases when streams are
formed. Stable streaming flow in the case of deeper beds behaves like the single phase
flow of gas in a pipe, which shows a distribution of frequencies with low power without a
clear dominant frequency.
The coherency between two pressure fluctuations time series measured at 4 cm and 30
cm above the gas distributor for different bed depths is plotted in Fig. 2.4d. As the plot
illustrates, the maximum coherency value shifts towards lower frequencies with
increasing bed depth. This indicates that most of the events affecting the fluidized
behavior in deep beds are low frequency phenomena. For the 120 and 160 cm bed depths,
the coherency rapidly decreases with frequency, which demonstrates that when streams
are present, they produce very low frequency activity and there exist no other major
phenomenon to increase the coherency at higher frequencies. In the case of lower bed
depths, Fig. 2.4d depicts a maximum at frequencies corresponding to the typical
dominant frequency in a bubbling bed.
It has been shown (Ellis, 2003) that the transition from the bubbling to the turbulent
fluidization regime first starts at positions closer to the upper surface of a fluidized bed
and then gradually, with increasing velocity, the transition works its way downward until

Chapter 2 - Study of Gas Streaming in a Deep Fluidized Bed
39
the entire bed is in turbulent fluidization. The extent of streaming flow at different axial
positions in our 30 cm ID fluidized bed can be evaluated by comparing the pressure
fluctuations corresponding to different positions above the gas distributor (Fig. 2.5). Fig.
2.5 represents the autocorrelation function of the pressure fluctuation for different
positions along the fluidized bed for the case of 160 cm bed depth. There is a clear
change in the autocorrelation function with increasing axial position above the
distributor. By moving upward in the bed, the autocorrelation function tends to find its
periodic nature, which resembles the fluidization behavior corresponding to bed depths of
40 and 80 cm in Fig. 2.4a. It can be concluded that even in the case of deep fluidized
beds, the upper part of the bed encounters a better mixing condition, which is also in
accordance with the visual observations.
2.5.2.2. Effect of Gas Velocity
The effect of gas velocity on the autocorrelation and the power spectral density are
provided in Figs. 2.6 and 2.7. In general, increasing the gas velocity delays the streaming
in a deep bed by providing extra gas to diffuse into the poorly fluidized regions. As can
be seen from Figs. 2.6 and 2.7, increasing gas velocity does not have a great influence in
the 40 cm bed, which indicates that in shallow beds, fluidization is well established at low
velocities. This fact has also been reported by other researchers (Cui et al., 2000).
Changes in the periodic nature of the bed with increasing velocity can be attributed to
changes in bubble diameters and rise velocities as more gas is added to the bed. However,
increasing the gas velocity causes a marked change in the case of deep-bed fluidization,
although the condition is still far from the smooth fluidization seen in the shallower bed.

Chapter 2 - Study of Gas Streaming in a Deep Fluidized Bed
40
The change can be seen in the return of periodic oscillations, a more rapid decrease of the
autocorrelation function and the suggestion of a dominant frequency in the PSD plot
(albeit a lower dominant frequency than that associated with fully bubbling fluidization).
It is important to point out from Figs. 2.6 to 2.7 that the extent of the change in the
autocorrelation function and the PSD trace in moving from 35 to 50 times the minimum
fluidization velocity is far less than when moving from 10 to 35 times the minimum
fluidization velocity. In addition, the plots at these higher velocities are still very
dissimilar from those in the shallow bed. This signifies that for the range investigated
here (up to 50 Umf (=0.2 m/s)), increasing the fluidizing velocity in deep fluidized beds
can not completely solve the maldistribution problem caused by streaming flow in the
fluidized bed with coarse FCC particles and bed depth of 160 cm. Presumably, very high
gas velocities might be effective in eliminating the streams, however this would lead to
excessive entrainment and indeed a potential transition to the fast fluidization regime.
Such experiments would require modification to our unit involving multistage cyclones
and proper solids recycling.
2.5.2.3. Effect of Particle Size Distribution
The effect of the particle size distribution (i.e. fines addition) on the fluidized bed
behavior in two bed depths of 40 cm and 160 cm and gas velocity of 10 Umf in terms of
PSD and autocorrelation coefficients is shown in Figs. 2.8 and 2.9. As can be seen in Fig.
2.8a and 9a, there is no observable difference for the 40 cm deep fluidized bed for the two
particle sizes. As the autocorrelation plot of Fig. 2.8a shows, the periodic nature and the

Chapter 2 - Study of Gas Streaming in a Deep Fluidized Bed
41
level of the correlation between two fluidized beds of coarse and fine particles are
minimally affected by the particle size distribution. The PSD graphs of Fig. 2.9a show the
dominant frequency of 4 and 4.5 Hz for coarse and fine particles, respectively, which are
quite close. However, the plots corresponding to the 160 cm bed depth, where it was
established that streaming flow occurs, shows differences between the two particle sizes.
The autocorrelation for fine particles in the deep bed, Fig. 2.8b, shows some levels of
periodicity and a sharper drop-off rate, which are characteristics of normal fluidization.
The difference between the fluidization of two particle sizes can also be seen in the PSD
graph of Fig. 2.9b. As noted previously, in case of coarse particles, the PSD decreases
exponentially and does not show a dominant frequency. However, the fluidized bed of
fine particles exhibits local peaks at frequencies of roughly 2.5 and 3 Hz and are probably
the outcome of the superposition of the bubbling and streaming phenomena in the bed.
The general conclusion is that fines content has some influence on decreasing the severity
of the streaming flow. This influence can be attributed to the effect of fines in loosening
the boundary between bubbles and gas passages and the surrounding dense phase
(Lockett and Harrison, 1967) that allows the gas to further diffuse into the surrounding
regions. The effect of fines on decreasing the viscosity of the fluidized bed can also be an
important factor in conducting an extra flow of gas into other parts of the fluidized bed
(Geldart, 1972). Rowe et al. (1978) reported that the interstitial gas flow increased by
three orders of magnitude with increasing fines content from 3% to 20% for particles
originally having a mean diameter of 52 μm. It should be noted that the effect of fines in
the range of operating conditions studied here (160 cm bed and gas velocity of 10 Umf)is
still not sufficient to achieve a normal bubbling activity in the system.

Chapter 2 - Study of Gas Streaming in a Deep Fluidized Bed
42
2.5.2.4. Effect of Distributor
A plot of the distributor pressure drop as a function of gas velocity is provided in Fig.
2.10. As can be seen, the LPD and HPD distributors have very different pressure drops
and are expected to exert a different influence on the bed hydrodynamics. The effect of
distributor pressure drop on the fluidization quality for 40 and 160 cm bed depths, two
gas velocities of 10 and 50 times minimum fluidization, and the coarse FCC particles (3%
fines) are provided in Figs. 2.11 and 2.12, in terms of autocorrelation and PSD. For the 40
cm bed depth, both the low pressure drop (LPD) distributor and the high pressure drop
(HPD) distributor exhibit similar autocorrelation functions. At high velocity, the
oscillations are larger for the LPD distributor. Generally, the higher pressure drop
provides a more uniform air distribution, thus promoting the formation of bubbles over
the entire distributor and spread over wider frequencies. The formation of larger bubbles
that easily coalesce and produce dominant bubbling activity is the reason for sharper
peaks in the PSD graph of the LPD distributor at lower gas velocity. The graphs of both
autocorrelation and PSD for the 160 cm bed which is subject to streaming flow do not
show any significant effect of distributor design on the streaming phenomenon at both
high and low velocities.
2.6. Conclusions
A series of experiments was conducted to study the effect of bed depth, superficial gas
velocity, fines content, and distributor pressure drop on streaming flow in a 0.3-m
diameter fluidized bed. The analysis of the pressure fluctuations time series for bed

Chapter 2 - Study of Gas Streaming in a Deep Fluidized Bed
43
depths ranging from 40 to 160 cm revealed that the normal bubbling fluidization is
gradually compromised by increasing the bed depth. This conclusion is based on the
gradual increase of the autocorrelation function, the decrease in the rate of decay of the
autocorrelation function, and the disappearance of the dominant frequency in the PSD
graph with increasing bed depth. The extent of streaming maldistribution was found to be
non-uniform along the bed, with the quality of fluidization improving with increasing
height above the distributor plate. Increasing the gas velocity from 10 to 50 Umf was
found to be able to delay the streaming flow, likely due to the additional gas diffusing
into the poorly fluidized regions. This effect was observed to be more prominent when
gas velocity was increased from 10 to 35 Umf than when it was increased from 35 to 50
Umf. The analyses illustrated that increasing the fines content from 3% to 20% can
decrease the severity of the streaming flow. However, the improvement is not enough to
solve the streaming problem. Finally, analyses did not show any significant effect of
distributor design on the streaming phenomenon.
2.7. References
Bai, D., Bi, H.T. Grace J., 1997. Chaotic behavior of fluidized beds based on pressure
and voidage fluctuations. AIChE journal 43, 1357-1361.
Bai, D., Issangya, A.S., Grace J., 1999. Characteristics of gas-fluidized beds in different
flow regimes. Industrial and Engineering Chemistry Research 38, 803-811.
Canada, G.S., McLaughlin, M., Staub, F.W., 1978. Flow regimes and void fraction
distribution in gas fluidization of large particles in beds without tube banks. AIChE
Symposium Series 74, 14-26.

Chapter 2 - Study of Gas Streaming in a Deep Fluidized Bed
44
Clark, N.N., McKenzie, E.A., Gautam, M., 1991. Differential pressure measurements in a
slugging fluidized bed. Powder Technology 67, 187-199.
Cui, H., Mostoufi, N., Chaouki, J., 2000. Characterization of dynamic gas-solid
distribution in fluidized beds. Chemical Engineering Journal 79, 133-143.
Daw, C.S., Halow, J.S., 1991. Characterization of voidage and pressure signals from
fluidized beds using deterministic chaos theory. In: Proceeding of 11th International
Conference on Fluidized Bed Combustion. Anthony, E.J. (Ed.), American Society of
Mechanical Engineers, New York.
Ellis, N., 2003. Ph.D. Dissertation, Hydrodynamics of gas-solid turbulent fluidized beds.
University of British Columbia, Canada.
Falkowski, D., Brown, R.C., 2004. Analysis of pressure fluctuations in fluidized beds.
Industrial and Engineering Chemistry Research 43, 5721-5729.
Fan, L.T., Ho, T.C., Hiraoka, S., Walawender, W.P., 1981. Pressure fluctuations in a
fluidized bed. AIChE Journal 27, 388-396.
Fan, L.T., Ho T.-Ching, Walawender, W.P., 1983. Measurements of the rise velocities of
bubbles, slugs and pressure waves in a gas-solid fluidized bed using pressure fluctuation
signals. AIChE Journal 29, 33-39.
Farag, H.I., Mejdell, T., Hjarbo, K., Ege, P., Lysberg, M., Grislingas, A., De Lasa, H.,
1997. Fibre optic and capacitance probes in turbulent fluidized beds. Chemical
Engineering Communication 157, 73-107.
Geldart, D., 1972. The effect of particle size and size distribution on the behaviour of gas-
fluidised beds. Powder Technology 6, 201-215.
Geldart, D., 1973. Types of gas fluidization. Powder Technology 7, 285-292.

Chapter 2 - Study of Gas Streaming in a Deep Fluidized Bed
45
Grace, J., Sun, G., 1991. Influence of particle size distribution on the performance of
fluidized bed reactors. The Canadian Journal of Chemical Engineering 69, 1126-1134.
Hiby, J.W., 1967. Periodic phenomena connected with gas-solid fluidization. Proceedings
of the International Symposium on Fluidization, The Netherlands University Press,
Amsterdam, The Netherlands.
Huilin, L., Gidaspow, D., Bouiilard J., 1997. Dimension measurements of hydrodynamic
attractors in circulating fluidized beds. Powder Technology 90, 179-185.
Huilin, L., Gidaspow, D., Bouiilard J., 2002. Chaotic behavior of local temperature
fluctuations in a laboratory-scale circulating fluidized bed. Powder Technology 123, 59-
68.
Issangya, A., Knowlton, T., Karri, S.B.R., 2007. Detection of gas bypassing due to jet
streaming in deep fluidized beds of group A particles. In: Fluidization XII, Berruti, F., Bi,
X., Pugsley, T. (Eds.), Vancouver, British Columbia, Canada, May 13-17.
Jin, Y., Yu, Z.Q., Wang, Z.W., Cai, P., 1986. In: Fluidization, Ostergaard V.K., Sorensen,
A. (Eds.), Engineering Foundation, New York.
Johnsson, F., Svensson, A. Andersson, S., Leckner, B., 1995. Fluidization regimes in
boilers, Fluidization VIII, Tours, pp. 129-136.
Johnsson, F., Zijerveld, R.C., Schouten, J.C., van den Bleek, C.M., Leckner, B., 2000.
Characterization of fluidization regimes by time-series analysis of pressure fluctuations.
International Journal of Multiphase Flow 26, 663-715.
Kang, W.K., Sutherland, J.P., Osberg, G.L. 1967. Pressure fluctuations in a fluidized bed
with and without screen cylindrical packings. Industrial Engineering Chemistry
Fundamentals 6, 499-504.

Chapter 2 - Study of Gas Streaming in a Deep Fluidized Bed
46
Karri, S.B.R., Issangya, A.S., Knowlton, M., 2004. Gas bypassing in deep fluidized beds.
In: Fluidization XI, Arena, U., Chirone, R., Miccio, M., Salatino, P. (Eds.), Ischia
(Naples), Italy, May 9-14.
Kozma, R., Kok, H., Sakuma, M., Djainal, D.D., Kitamura, M., 1996. Characterization of
two-phase flows using fractal analysis of local temperature fluctuations. International
Journal of Multiphase Flow 22, 951-968.
Lirag, R.C., Littman, H., 1971. Statistical study of the pressure fluctuations in a fluidized
bed. AIChE Journal 67, 11-22.
Lockett, J. Harrison, D., 1967. The distribution of voidage fraction near bubbles rising in
gas fluidized beds. Proceeding of the International Symposium on Fluidization,
Drinkenburg, A.A.H. (Ed.) Netherland University Press, Amsterdam, pp. 257-270.
McKeen, T. Pugsley, T., 2003. Simulation and experimental validation of freely bubbling
bed of FCC catalyst. Powder Technology 129, 139-152.
Ohara, H., Ji, H., Kuramoto, K., Tsutsumi, A., Yoshida, K., Hirama, T., 1999. Chaotic
characteristics of local voidage fluctuation in a circulating fluidized bed. The Canadian
Journal of Chemical Engineering 77, 247-252.
Rowe, P.N., L. Santoro, J.G. Yates, 1978. The division of gas between bubble and
interstitial phases in fluidized beds of fine powders. Chemical Engineering Science 33,
133-140.
Satija, S., Fan, L.-S., 1985. Characteristics of slugging regime and transition to turbulent
regime for fluidized beds of large coarse particles. AIChE Journal 31, 1554-1562.

Chapter 2 - Study of Gas Streaming in a Deep Fluidized Bed
47
Svensson, A., Johnsson, F., Leckner, B., 1996. Fluidization regimes in non-slugging
fluidized beds: the influence of pressure drop across the air distributor. Powder
Technology 86, 299-312.
Tamarin, A.I., 1964. The origin of self-excited oscillations in fluidized beds. International
Journal of Chemical Engineering 4, 50-54.
van der Schaaf, J., Schouten, J.C., Johnsson, F., van den Bleek, C., 2002. Non-intrusive
determination of bubble and slug length scales in fluidized beds by decomposition of the
power spectral density of pressure time series. International Journal of Multiphase Flow
28, 865-880.
van Ommen, J.R., Coppens, M.O., van den Bleek, C.M., Schouten, J.C., 2000. Early
warning of agglomeration in fluidized beds by attractor comparison. AIChE Journal 46,
2183-2197.
Welch, P.D., 1967. The use of a fast Fourier transform for the estimation of power
spectra. IEEE Transactions, Audio and Electroacoustics AU-15, 70-73.
Wells, J., 2001. Streaming flow in large scale fluidization. AIChE Annual Meeting,
Particle Technology Forum, Reno, Nevada, USA.
Wen, C.Y., Yu, Y.H., 1966. A generalized method for predicting the minimum
fluidization velocity. AIChE Journal 12, 610-612.
Woo, K.J., Kim, J.S., Kang, Y., Kim, S.D., 2001. Effects of chaotic temperature
fluctuations on the heat transfer coefficient in liquid-liquid-solid fluidized beds, Chemical
Engineering Technology 24, 829-834.
Yerushalmi, J., Cankurt, N.T., 1979. Further studies of the regimes of fluidization.
Powder Technology 24, 187-205.

Chapter 2 - Study of Gas Streaming in a Deep Fluidized Bed
48
2.8. Nomenclature
ACF autocorrelation function
f frequency (Hz)
H bed depth (m)
i counter
k counter
n time series length
CCF cross correlation function
T time series period (1/s)
U0 superficial gas velocity (m/s)
xi ith component of the x time series
x average of the x time series
y time series
y average of the x time series
Greek Letters:
Фxx power spectral density for x time series
Фxy cross power spectral density between x and y time series
Фyy power spectral density for y time series
γxy coherency between x and y time series

Chapter 2 - Study of Gas Streaming in a Deep Fluidized Bed
49
Table 2.1. The range of different variables studied in this work
Variable Range Bed depth (cm) 40, 80, 120, 160 U0/Umf 10, 35, 50 Fines content (particles with a diameter of less than 44 μm)
3%, 20%
Distributor 1 mm holes and 0.54% opening, 2 mm holes and 2.15% opening

Chapter 2 - Study of Gas Streaming in a Deep Fluidized Bed
50
Table 2.2. Specifications of the pressure transducers used in the present work
Model Type Range Accuracy Response Position on the column
Omega PX143-2.5BD5V Differential -17.2 to 17.2 kPa ±1.5 FC 1 ms 130, 150 cm
Omega PX142-005D5V Differential 0 to 34.5 kPa ±1.5 FC 1 ms 50-110 cm
Omega PX142-015D5V Differential 0 to 103.4 kPa ±1.5 FC 1 ms 4, 30 cm

Chapter 2 - Study of Gas Streaming in a Deep Fluidized Bed
51
Figure 2.1. Schematic diagram of the fluidized bed used in the experiments depicting
axial positions (in cm) of the pressure ports above the distributor.
4
30
50
70
90
Air in
Air out
Distributor
Pressu
re Po
rts
110
130
150
Cyclone
Cyclone Dipleg

Chapter 2 - Study of Gas Streaming in a Deep Fluidized Bed
52
0
20
40
60
80
100
0 50 100 150 200 250 300Particle Size (μm)
Cu
mu
lati
ve %
Fine FCC
Coarse FCC
Figure 2.2. Particle size distribution of the FCC powders used in the experiments
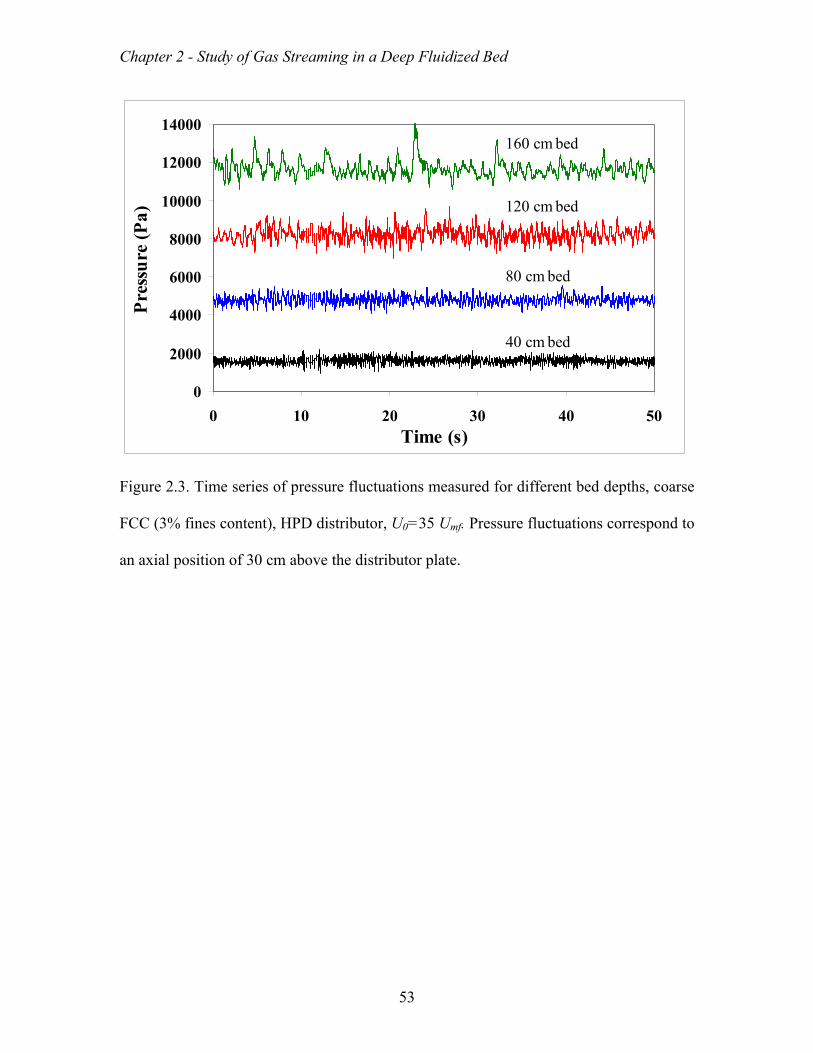
Chapter 2 - Study of Gas Streaming in a Deep Fluidized Bed
53
0
2000
4000
6000
8000
10000
12000
14000
0 10 20 30 40 50Time (s)
Pre
ssu
re (
Pa)
160 cm bed
120 cm bed
40 cm bed
80 cm bed
Figure 2.3. Time series of pressure fluctuations measured for different bed depths, coarse
FCC (3% fines content), HPD distributor, U0=35 Umf. Pressure fluctuations correspond to
an axial position of 30 cm above the distributor plate.

Chapter 2 - Study of Gas Streaming in a Deep Fluidized Bed
54
-0.4
-0.2
0
0.2
0.4
0.6
0.8
1
0 0.5 1 1.5 2 2.5Lags (s)
Au
to C
orre
lati
on160 cm bed
120 cm bed
80 cm bed
40 cm bed
-0.6
-0.4
-0.2
0
0.2
0.4
0.6
0.8
1
-2 -1.5 -1 -0.5 0 0.5 1 1.5 2Lags (s)
Cro
ss C
orre
lati
on
120 cm bed
160 cm bed
80 cm bed
40 cm bed
Figure 2.4. (a) Autocorrelation and (b) Cross correlation of pressure fluctuations for
different bed depths, coarse FCC (3% fines content), HPD distributor, U0=35 Umf.
Pressure fluctuations correspond to an axial position of 30 cm above the distributor plate.

Chapter 2 - Study of Gas Streaming in a Deep Fluidized Bed
55
0
20000
40000
60000
80000
100000
120000
0 5 10 15 20 25Frequency (Hz)
PS
D (
Pa2 /H
z)
160 cm bed
120 cm bed
80 cm bed
40 cm bed
0
0.2
0.4
0.6
0.8
1
0.1 1 10 100Frequency (Hz)
Coh
eren
cy
160 cm bed
120 cm bed
40 cm bed
80 cm bed
Figure 2.4. (c) PSD and (d) Coherency of pressure fluctuations for different bed depths,
coarse FCC (3% fines content), HPD distributor, U0=35 Umf. Pressure fluctuations
correspond to an axial position of 30 cm above the distributor plate.

Chapter 2 - Study of Gas Streaming in a Deep Fluidized Bed
56
-0.4
-0.2
0
0.2
0.4
0.6
0.8
1
0 0.5 1 1.5 2 2.5Lags (s)
Au
to C
orre
lati
on4 cm
30 cm
50 cm
70 cm
90 cm
110 cm
130 cm
150 cm
Figure 2.5. The autocorrelation coefficient at different axial positions above the gas
distributor for the case of coarse FCC (3% fines content), HPD distributor, H=160 cm,
and U0=10 Umf

Chapter 2 - Study of Gas Streaming in a Deep Fluidized Bed
57
-0.4
-0.2
0
0.2
0.4
0.6
0.8
1
0 0.5 1 1.5 2 2.5Lags (s)
Au
to C
orre
lati
on
10 Umf
35 Umf
50 Umf
-0.4
-0.2
0
0.2
0.4
0.6
0.8
1
0 0.5 1 1.5 2 2.5Lags (s)
Au
to C
orre
lati
on
10 Umf
35 Umf
50 Umf
Figure 2.6. The autocorrelation coefficient of pressure fluctuations for different gas
velocities, coarse FCC (3% fines content), HPD distributor, a) H=40 cm, b) H=160 cm.
Pressure fluctuations correspond to an axial position of 30 cm above the distributor plate.

Chapter 2 - Study of Gas Streaming in a Deep Fluidized Bed
58
0
100
200
300
400
0 5 10 15 20 25Frequency (Hz)
PS
D (
Pa2 /H
z)
0
4000
8000
12000
16000
10 Umf (left axis)
35 Umf (right axis)
50 Umf (right axis)
0
2000
4000
6000
8000
0 5 10 15 20 25Frequency (Hz)
PS
D (
Pa2 /H
z)
0
40000
80000
120000
160000
200000
10 Umf (left axis)
35 Umf (right axis)
50 Umf (right axis)
Figure 2.7. The PSD of pressure fluctuations for different gas velocities, coarse FCC (3%
fines content), HPD distributor, a) H=40 cm, b) H=160 cm. Pressure fluctuations
correspond to an axial position of 30 cm above the distributor plate.
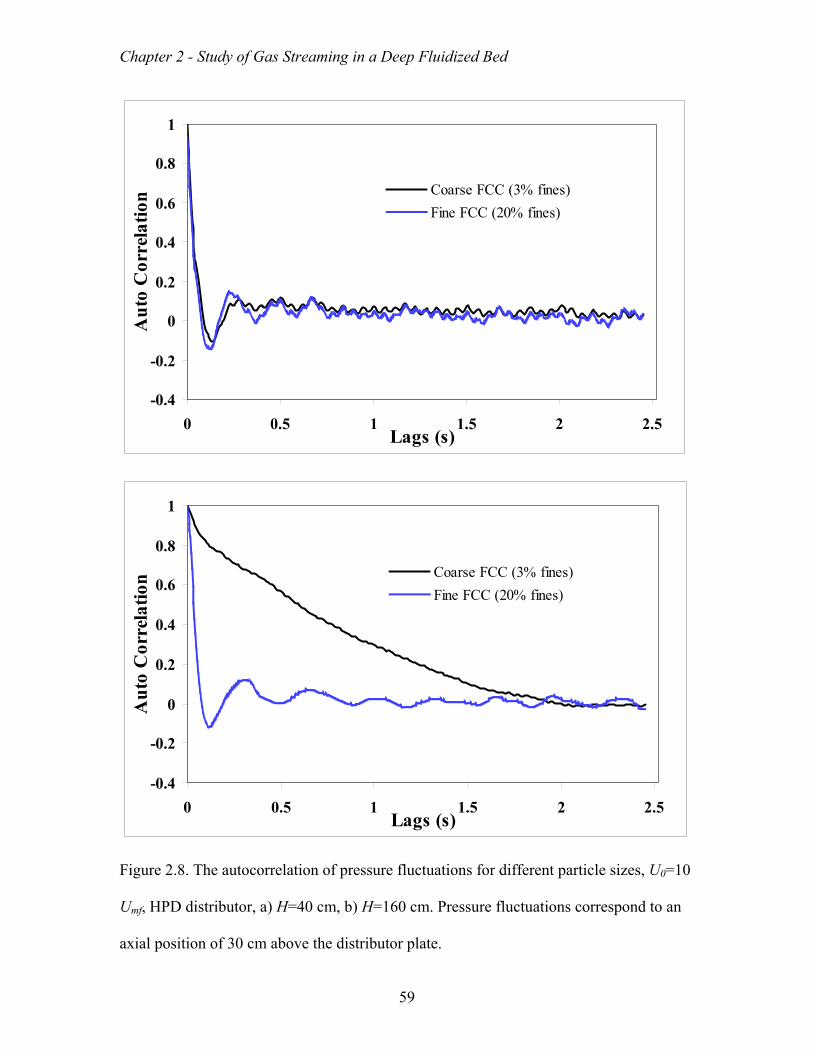
Chapter 2 - Study of Gas Streaming in a Deep Fluidized Bed
59
-0.4
-0.2
0
0.2
0.4
0.6
0.8
1
0 0.5 1 1.5 2 2.5Lags (s)
Au
to C
orre
lati
on
Coarse FCC (3% fines)
Fine FCC (20% fines)
-0.4
-0.2
0
0.2
0.4
0.6
0.8
1
0 0.5 1 1.5 2 2.5Lags (s)
Au
to C
orre
lati
on
Coarse FCC (3% fines)
Fine FCC (20% fines)
Figure 2.8. The autocorrelation of pressure fluctuations for different particle sizes, U0=10
Umf, HPD distributor, a) H=40 cm, b) H=160 cm. Pressure fluctuations correspond to an
axial position of 30 cm above the distributor plate.

Chapter 2 - Study of Gas Streaming in a Deep Fluidized Bed
60
0
100
200
300
400
500
0 5 10 15 20 25Frequency (Hz)
PSD
(P
a2 /Hz) Coarse FCC (3% fines)
Fine FCC (20% fines)
0
1000
2000
3000
4000
5000
6000
7000
0 5 10 15 20 25Frequency (Hz)
PS
D (
Pa2 /H
z)
Coarse FCC (3% fines)
Fine FCC (20% fines)
Figure 2.9. The PSD coefficient of pressure fluctuations for different particle sizes,
U0=10 Umf, HPD distributor, a) H=40 cm, b) H=160 cm. Pressure fluctuations correspond
to an axial position of 30 cm above the distributor plate.
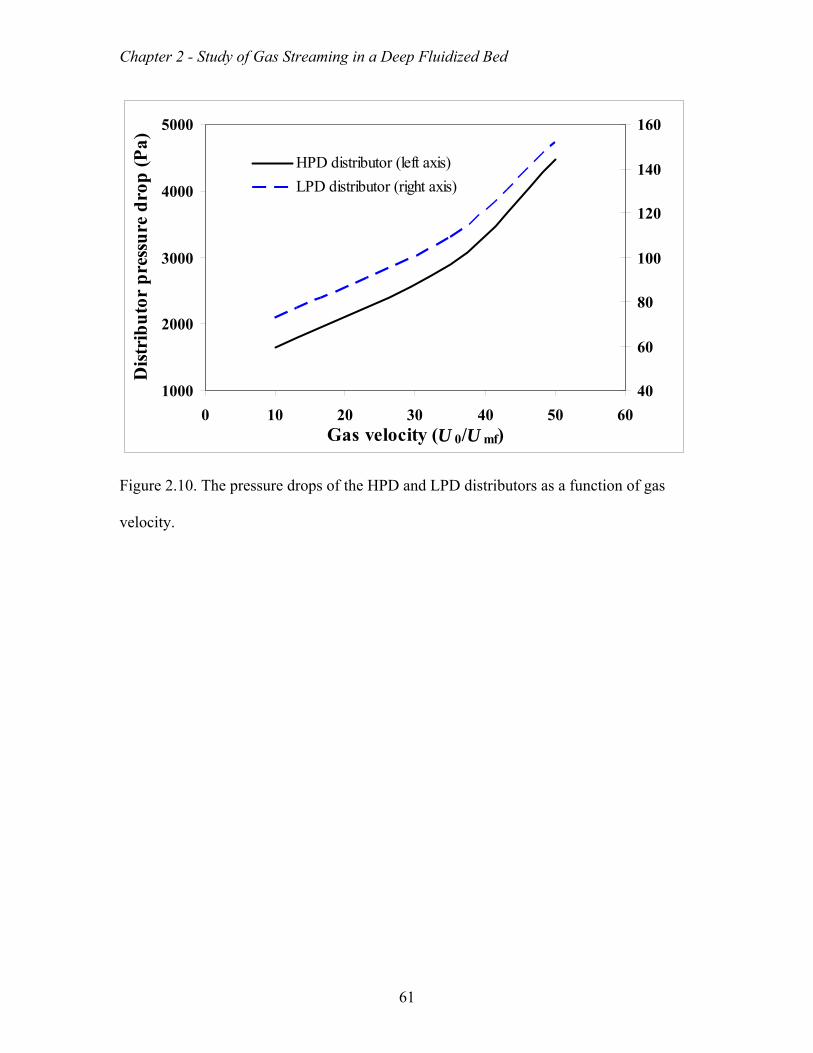
Chapter 2 - Study of Gas Streaming in a Deep Fluidized Bed
61
1000
2000
3000
4000
5000
0 10 20 30 40 50 60Gas velocity (U 0/U mf)
Dis
trib
uto
r p
ress
ure
dro
p (
Pa)
40
60
80
100
120
140
160
HPD distributor (left axis)
LPD distributor (right axis)
Figure 2.10. The pressure drops of the HPD and LPD distributors as a function of gas
velocity.

Chapter 2 - Study of Gas Streaming in a Deep Fluidized Bed
62
-0.4
-0.2
0
0.2
0.4
0.6
0.8
1
0 0.5 1 1.5 2 2.5Lags (s)
Au
to C
orre
lati
on10 Umf, HPD
10 Umf, LPD
50 Umf, HPD
50 Umf, LPD
-0.4
-0.2
0
0.2
0.4
0.6
0.8
1
0 0.5 1 1.5 2 2.5Lags (s)
Au
to C
orre
lati
on
10 Umf, HPD
10 Umf, LPD
50 Umf, HPD
50 Umf, LPD
Figure 2.11. The autocorrelation of pressure fluctuations for coarse FCC (3% fines
content) with different distributors, a) H=40 cm, b) H=160 cm. Pressure fluctuations
correspond to an axial position of 30 cm above the distributor plate.

Chapter 2 - Study of Gas Streaming in a Deep Fluidized Bed
63
0
400
800
1200
1600
0 5 10 15 20 25Frequency (Hz)
PS
D (
Pa2 /H
z)
0
4000
8000
12000
16000
10 Umf, HPD (right axis)
10 Umf, LPD (right axis)
50 Umf, HPD (left axis)
50 Umf, LPD (left axis)
0
800
1600
2400
3200
4000
0 5 10 15 20 25Frequency (Hz)
PS
D (
Pa2 /H
z)
0
40000
80000
120000
160000
200000
10 Umf, HPD (right axis)
10 Umf, LPD (right axis)
50 Umf, HPD (left axis)
50 Umf, LPD (left axis)
Figure 2.12. The PSD of pressure fluctuations for coarse FCC (3% fines content) with
different distributors, a) H=40 cm, b) H=160 cm. Pressure fluctuations correspond to an
axial position of 30 cm above the distributor plate.

Chapter 3 - Experimental Study of the Nature of Gas Streaming
64
CHAPTER 3 - Experimental Study of the Nature of Gas
Streaming in Deep Fluidized Beds of Geldart A
Particles
The contents of this chapter have been submitted to the Chemical Engineering journal.
It has been submitted in a version similar to what appears in this chapter.
Citation
S. Karimipour, T. Pugsley, Experimental study of the nature of gas streaming in deep
fluidized beds of Geldart A particles, Chemical Engineering journal, March 2010 (Ref.
No. CEJ-S-10-00526).
Contribution of Ph.D. Candidate
The experiments performed for the purpose of this work were planned and performed by
Shayan Karimipour. Todd Pugsley provided consultation regarding the experimental
program. The programs for all of the data analysis were developed by Shayan
Karimipour. All of the writing of the submitted manuscript was done by Shayan

Chapter 3 - Experimental Study of the Nature of Gas Streaming
65
Karimipour with Todd Pugsley providing editorial guidance regarding the style and
technical content of the manuscript.
Contribution of this Paper to the Overall Study
The objective of the present work is to execute a more fundamental investigation of the
streaming flow using a comparative analysis of the streaming with some well-defined
phenomena (Jet flows and imposed streams) in order to further improve the
understanding of the streaming flow gained in the previous work and establish some
theories about the origin of streaming flow. Time series analysis and wavelet
decomposition of the pressure fluctuations time series will be used.
3.1 Abstract
The characteristics of gas streaming in a deep fluidized bed containing Geldart’s Group A
powder has been investigated in a 30-cm ID cold flow unit. Four different experimental
configurations including forced streaming flow, high and low-velocity jetting flows and
natural streaming flow in deep beds were designed and conducted for bed depths and gas
velocities ranging from 0.4 to 1.6 m and 0.04 to 0.20 m/s, respectively. The effect of fines
content was also studied using two particle size distributions with Sauter mean diameters
of 48 µm and 84 µm, corresponding to 20% and 3% fines content, respectively. Results
indicated that the natural streaming closely resembles the forced streaming flow at the
wall in which flow of gas is also present in the remaining regions of the distributor. The
configurations of jet flows without primary gas from the distributor resemble the severe
streaming that might happen in very deep beds with possible formation of completely

Chapter 3 - Experimental Study of the Nature of Gas Streaming
66
non-fluidized regions. Application of supporting jets in addition to the primary gas flow
enhanced the fluidization quality to some extent, but was not sufficient to provide normal
fluidization. Increasing the primary gas velocity from 10 to 50 Umf was found to reduce
the effect of supporting jets. It was also found that higher fine content improved
fluidization. Wavelet analysis of pressure fluctuations showed that in deep fluidized beds,
bubbling activity with the typical dominant frequency coexist with the streaming flow,
with a minor contribution. Wavelet findings suggested that the streaming flow can be
considered to form by increasing the relative importance of one of the available streams
of bubbles with increasing bed depth.
3.2. Introduction
Fluidized bed technology is applied in a range of industrial sectors, including oil refining,
coal gasification and combustion, and pharmaceutical manufacture. In certain
applications, it is necessary to operate with very deep fluidized beds to control solids
and/or gas residence time to achieve reactor performance targets. Recently, it has been
revealed that in a sufficiently deep bed of Geldart’s Group A particles (Geldart, 1973),
gas bypassing may occur when the flow rate of the fluidizing gas is increased beyond the
minimum fluidization velocity (Wells, 2001; Karri et al., 2004; Issangya et al., 2007;
Karimipour and Pugsley, 2010) [2-5]. When this phenomenon occurs, the fluidizing gas
bypasses the bed in the form of streams of gas, leaving a large fraction of the bed
unfluidized or poorly fluidized. Since many industrial fluidized bed processes might work
with deep beds, gas streaming is a potential problem that can decrease the efficiency of
these chemical and physical fluidized bed processes.

Chapter 3 - Experimental Study of the Nature of Gas Streaming
67
The concept of gas streaming was first reported in the literature by Wells (2001). He
studied the effects of fines content (particles smaller than 44 µm), distributor design, anti-
static agents, baffles, and bed depth in large scale units with up to 2.5 m diameter and 5 m
bed depth. He reported no influence of the various parameters, with the exception of bed
depth and baffles. The streaming phenomenon was attributed to gas compression caused
by the pressure head of the deep bed over the distributor. The onset of streaming
corresponded to an increase in the emulsion suspension density above that at minimum
fluidization. The bed then defluidized and gas streaming occurred. Karri et al. (2004)
investigated the formation of streaming flow in a column of 0.3 m inner diameter and 4.9
m height. They found that the standard deviation of pressure drop in a bed exhibiting
streaming was much greater than a uniformly fluidized bed. Karri et al. (2004) also
evaluated the use of baffles and found that two baffles separated vertically by a distance
of 0.76 cm eliminated the streaming flow. Issangya et al. (2007) performed another study
in a 0.9-m-diameter and 6.1 m tall test unit. They attributed the larger differential
pressure fluctuations measured by certain transducers to the passage of streams closer to
that transducer. Issangya et al. (2007) also concluded that the maximum in the plot of
standard deviation of the pressure fluctuation measured across the entire bed versus gas
velocity, which has been shown in the literature to be an indication of the transition
between the bubbling and turbulent fluidization regimes, is not present for deep beds that
are subject to streaming.

Chapter 3 - Experimental Study of the Nature of Gas Streaming
68
Recently, Karimipour and Pugsley (2010) have done a systematic study on the streaming
flow in a 30-cm ID cold flow unit of FCC particles with two different distributor designs.
They discussed the characteristics of the streaming flow based on analysis of the pressure
fluctuations time series measured in the fluidized bed at 8 locations from 4 to 150 cm
above the gas distributor for bed depths and gas velocities ranging from 0.4 to 1.6 m and
0.04 to 0.20 m/s, respectively. They also studied the effect of fines content on gas
streaming using two particle size distributions with Sauter mean diameters of 48 µm and
84 µm for each bed depth and gas velocity. They concluded that streaming flow emerges
gradually in beds with greater than 1 m depth. Increasing gas velocity and fines content
was found to delay the onset of streaming, but were not completely eliminate it over the
range of velocities examined. They showed that two different distributor designs with
much different pressure drops had no measurable effect on the streaming flow.
Wavelet transform is valuable analysis tool for understanding the detail of the intrinsic
features of fluidized beds. One of the first direct applications of wavelets in fluidized bed
research was by He et al. (1997). They used wavelet analysis to decompose the pressure
fluctuations time series measured in a fluidized bed with 30 cm diameter and 60 cm bed
depth. They argued that the gas jetting at the distributor and formation of small bubbles
near the distributor are important sources of Gaussian random noise in the pressure
fluctuations. These effects are transmitted upward and reduced gradually by the increase
in height and finally superimposed on the larger fluctuations caused by bubble growth
and motion. Lu and Li (1999) obtained the average peak frequency of different scales of
pressure fluctuation time series measured in a 3.3 cm fluidized bed using wavelet

Chapter 3 - Experimental Study of the Nature of Gas Streaming
69
decomposition. They found the peak frequency of the scale 4 detail of the wavelet
analysis to be equivalent to the bubble frequency obtained from Darton’s correlation
(1977). Guo et al. (2003) decomposed the time series of pressure fluctuations obtained in
a 8.2 cm bed with 11.5 cm bed depth operating at high temperatures. By comparison of
the detail part of the decomposed signals to the power spectral density (PSD) of the
original signal, they concluded that the frequency of peaks in the scale 6 decomposition
of detail signal is equal to the major frequency obtained from the PSD plot, thus each
peak represents a bubble passing through the pressure probe. Zhao and Yang (2003) used
wavelets to decompose the pressure time series measured in a 30 cm bed with 46 cm bed
depth into several components or “levels”. They classified the different levels as micro,
meso and macro-scales based on the Hurst exponent calculated at each level. Ellis et al.
(2003, 2004) studied the effect of probe scale on the voidage data measured by optical
probes using wavelets. They showed that the probe size affects the scale of the detected
voidage fluctuations in a way that smaller probes reflect small-scale fluctuation, while a
larger probe reveals meso-scale fluctuations caused mostly by bubble motion (2004).
Sasic et al. (2006) extracted and analyzed the time series representing single bubbles,
exploding bubbles and pressure waves from the original pressure fluctuations time series
using wavelets. These phenomena were identified as distinct local maxima in the energy
distribution over wavelet scales. Guenther and Breault (2007) studied the cluster size and
count at various radial and axial positions in a large scale circulating fluidized bed using
fiber optic probes. To remove high frequency noise from the voidage time series, they
used wavelets to decompose and then reconstruct the time series excluding scales 1 and 2
of detail components. Their results showed that remarkable changes in the cluster size

Chapter 3 - Experimental Study of the Nature of Gas Streaming
70
and count occurred when flow conditions changed from one regime to another. They also
found that cluster count generally decreased toward the wall and increased toward the
center of the riser.
Although the general appearance of the streaming flow has been studied, a more detailed
look at the nature and behavior of the streaming is still absent in the literature. The
objective of the present work is to execute a more fundamental investigation of the
streaming flow using a comparative analysis of the streaming with other well-defined
phenomena in order to further improve the understanding of streaming gained in the
previous works by our group and other researchers. Time series analysis and wavelet
decomposition of the pressure fluctuations time series will be used. For this purpose,
three well-defined configurations of forced streams and jetting have been designed in
order to compare their dynamic behavior with that of normal streaming flow in deep
fluidized beds. Pressure fluctuations have been measured and analyzed in all of these
configurations for various combinations of bed depth, gas velocity and particle size.
3.3. Experimental
The fluidized bed unit used in this study was comprised of a cylindrical Plexiglas column
with an inner diameter of 30 cm and height of 3.3 m. Details of the experimental setup,
instrumentation and the bed particulate material have been reported in a previous work of
our group (Karimipour and Pugsley, 2010) and provided in chapter 2. In order to fully
understand the nature of the streaming flow in the deep bed (referred to here as “normal
streaming”), three configurations for the addition of air to the bed were designed and

Chapter 3 - Experimental Study of the Nature of Gas Streaming
71
implemented. The first configuration was a double-jet nozzle made of a copper tube with
4 mm inside diameter and mounted vertically upward at a height of 19 cm above the
distributor plate. The arrangement of the nozzle can be seen in Fig. 3.1. The distance
between the two jets was equal to 8 cm. Compressed building air was used for gas flow to
the nozzle and the flowrate was measured using a rotameter before entering the nozzle
system. The jetting experiments were performed at two gas velocities of 60 (No. 1) and
31 m/s (No. 2) from each of the two jets in the nozzle. To force the creation of a stream
flow at the wall of the fluidized bed column as apposed to “normal streaming”, a lateral
opening was cut in the distributor at a location near the pressure transducers. The opening
area is supported by a flange from below in a way that gas can enter from the wind-box,
but particles can not leak back into the wind-box. This area indeed provides a preferential
alternative pass-way with lower pressure drop for gas that helps the stream to be
stabilized in the desired region of the bed for the purpose of further analysis. A diagram
of this modified distributor is shown in also Fig. 3.1. The primary fluidization air through
the distributor for both natural and imposed streaming was supplied by a 50 hp Kaeser®
positive displacement blower. The air flowrate was measured using an orifice plate with a
colored water manometer. The ranges of the studied variables are summarized in Table
3.1.
3.4. Analysis Methods
In our previous study (Karimipour and Pugsley, 2010) the well established analysis
methods of autocorrelation function, cross correlation function, power spectral density
(PSD) and coherency were applied to the fluidized bed pressure fluctuations. In the

Chapter 3 - Experimental Study of the Nature of Gas Streaming
72
present study the wavelet decomposition technique has been utilized to decompose the
pressure time series into its basic components and extract more detail information about
the streaming phenomenon.
The present theoretical form of the wavelet concept was first proposed by Jean Morlet
and the team working under Alex Grossmann in France (Hubbard, 1998). The theory of
wavelet transformation first appeared in the literature with the work of Grossman and
Morlet (1984) and was motivated by application to the analysis of seismic data. The main
algorithm of wavelet analysis dates back to the work of Mallat (1988, 1989). Following
these efforts in the context of multiresolution signal analysis, Daubechies (1988, 1992)
introduced the first highly practical families of orthogonal wavelets.
The wavelet translation of a signal x(t) is defined in term of projections of x(t) onto a
family of functions that are all normalized dilation and translation of a prototype wavelet
function ψ(t) such that
{ ( )} ( ) ( )v vw x t X x t t dt
(3.1)
1 2( )v
t vt
(3.2)
where w is the wavelet transform operator and ψ is the prototype wavelet. The prototype
wavelet, ψ, also called the mother wavelet, possesses some basic properties which are
discussed in the wavelet literature (1992). The family of orthogonal wavelets proposed by
Daubechies (1988) has been broadly used for analysis of time series generated in the
fluidized beds in the recent years (Guo et al., 2003; Zhao and Yang, 2003; Ellis et al.,

Chapter 3 - Experimental Study of the Nature of Gas Streaming
73
2003; Ellis et al., 2004; Sasic et al., 2006; Guenther and Breault, 2007). Daubechies
(1988) originally provided nine sets of coefficients corresponding to wavelet numbers 2
to 10 (“db2-db10”). The regularity of wavelets increases with increasing their number.
Indeed, the ragged edges and sharp changes become smoother by increasing the
regularity. Decomposing the original time series using wavelets with increased regularity
provides smoother time series (1992). Considering a trade-off between complexity and
regularity, Daubechies number 5 wavelet (“db5”) was chosen as the mother wavelet for
this study. A plot of this wavelet is provided in Fig. 3.2a. According to the theory of
multi-resolution analysis, an original signal can be decomposed into successive lower
resolution components. Fig 3.2b demonstrates a schematic diagram of a four level
decomposition process. Each level of decomposition contains information associated with
a scale. The scale is inversely proportional to the frequency of the Fourier analysis.
During the decomposition process, the main body of the signal, with lower frequencies,
will be stored as the approximation part (A) and the fluctuating component of the time
series as the detail part (D). Continuing the decomposition process makes the
approximation part more and more depleted of the high frequency fluctuating
components. Therefore, the first detail time series contain the fluctuations with the
highest frequencies of the pressure time series.
3.5. Results and Discussions
3.5.1. Effect of Bed Depth
Plots of the autocorrelation function and PSD corresponding to a 40 cm bed depth and a
gas velocity of 10 Umf through the distributor are provided in Figs. 3.3a-b. Pressure

Chapter 3 - Experimental Study of the Nature of Gas Streaming
74
fluctuations were measured at 30 cm above the distributor. As Fig. 3.3.3a illustrates, all
configurations but one exhibit similar periodic oscillations in the autocorrelation function
with a rapid initial decrease, signifying extensive mixing in the systems. The correlation
for the case of high-velocity jet (No. 1 jet) with no primary air flow through the
distributor remains higher than other configurations after an initial decrease. This
indicates that the gas jet with higher velocity is able to pass through the entire 40 cm bed
with its basic structure remaining intact. Hence, the system exhibits a greater extent of
predictability, as evidenced by a higher value of the autocorrelation function. It should be
noted that the autocorrelation for this configuration also tends to zero at higher delay
times of about 20 seconds.
The PSD of the various configurations, provided in Fig. 3.3b, shows that the PSD is
spread over a wider frequency domain and the dominant frequency is less distinctive
when gas flow is only available through the distributor. As can be seen, the presence of a
more coherent gas flow in other configurations imposes a clear dominant frequency in the
PSD graph. The dominant frequency is 3 to 4 Hz for all configurations, which is the
typical frequency of bubbling beds. This result is not surprising, because there is no
inherent difference between the bubbles that form at the jet nozzles and those form at the
distributor nozzles. In fact, many people have used the latter case to study the
characteristics of bubbles in the fluidized beds (Rowe and Everett, 1972a, 1972b, 1972c).
Plots of the autocorrelation function and PSD of the different configurations for a 160 cm
bed depth and primary gas velocity of 10 Umf are provided in Figs. 3.4a-b. Pressure

Chapter 3 - Experimental Study of the Nature of Gas Streaming
75
fluctuations were again measured at a location of 30 cm above the distributor. As can be
seen, there are clear differences between these graphs and the previous graphs for the 40
cm bed depth. Especially, the periodic oscillations are absent in the autocorrelation
function and the function decays much more slowly. Furthermore, there is a clear shift of
dominant frequency towards lower frequencies in the PSD graphs of the fluidized bed
with 160 cm bed depth. We have presented these phenomena previously (Karimipour and
Pugsley, 2010) and consider them to be characteristic of non-uniform flow and streaming
in deep beds. According to Fig. 3.4a, the configurations that resulted in similar
fluidization for the shallow bed, create three different classes of behavior in the deep bed.
These classes are: jets with primary gas flow; natural and imposed streams; and jets
without primary gas flow. As can be seen, there is a gradual change in the autocorrelation
function between these groups. The two jet flows without primary gas, show a gradual
decrease plus no observable periodic behavior. Therefore, these configurations represent
a clear departure from the normal fluidization in shallow beds discussed above. The two
configurations of natural and imposed streaming produce very similar behavior,
illustrating the similarity in hydrodynamic behavior between these configurations for the
160 cm bed fluidized bed. As can be seen in the figure, adding jet flow to the fluidized
bed affects all characteristics of the autocorrelation graph, including a more rapid
decrease of the autocorrelation and the return of periodic oscillation. This indicates an
improvement of the fluidization quality when jets are implemented in the bed with
fluidizing gas already entering through distributor. The PSDs of all configurations in the
160 cm bed (Fig. 3.4b) all exhibit a shift from 3-4 Hz frequency (frequency of bubbling
activity) toward lower frequencies with no clear dominant frequency. The configuration

Chapter 3 - Experimental Study of the Nature of Gas Streaming
76
which includes both primary gas flow through the distributor and high-velocity jet again
displays a tendency to have some local frequencies, although trivial compared to the
general trend towards lower frequencies.
These results for the 160 cm bed depth suggest that the streaming flow most closely
resembles a fluidized bed in which a maldistribution of gas on the distributor leads to
bypassing of gas through the bed. However, due to the relatively larger size of streams
compared to jets (stream cross section was at least 5 times the cross section of jet after
formation at the nozzle) which allows the gas to diffuse into and fluidize other parts of
the bed) and availability of the gas entering through the distributor, the fluidization
quality is better in case of streaming compared to a pure jetting fluidized bed.
3.5.2. Effect of Gas Velocity
Figs. 3.5a-b provide the autocorrelation function and PSDs of the pressure fluctuations
for the same conditions as Figs. 3.3a-b, but with a higher primary gas velocity of 50 Umf.
The two configurations of jets without primary gas flow (which are evidently not affected
by the primary gas flow) are not shown in these figures. Comparing Figs. 3.3a and 5a
illustrates that increasing the primary gas velocity has a minor effect on the fluidized bed
behavior. Furthermore, a slight increase of dominant frequency by about 2 Hz with
increasing gas velocity from 10 to 50 times the minimum fluidization velocity can also be
observed by comparing Figs. 3.3b and 3.5b. This increase can be attributed to the
formation of more, faster-rising bubbles with increasing gas velocity.

Chapter 3 - Experimental Study of the Nature of Gas Streaming
77
Figs. 3.6a-b provide the autocorrelation and PSD of the pressure fluctuations in the 160
cm bed at the primary gas velocity of 50 Umf. In this case, a more prominent effect of gas
velocity on the behavior of the fluidized bed can be seen by comparing Figs. 3.4a and
3.6a. As Fig. 3.6a illustrates, the rate of decrease of correlation and the amplitude of the
periodicity are greater at 50 Umf. This is indicative of improved mixing in the bed at the
higher gas velocity. However, as the PSD graph of Fig. 3.6b shows, the frequency
domain does not show a significant change compared to Fig. 3.4b. It can be concluded
that although increasing the gas velocity leads to slight improvement in mixing, it is still
not able to provide normal bubbling with bubble frequencies in the typical 3 to 4 Hz
range for fluidized beds. Fig. 3.6b also signifies that at high primary gas velocities
through distributor, the PSD graph of jetting and non-jetting configurations approach
each other and the effect of jets for enhancing the fluidization becomes negligible.
3.5.3. Effect of Particle Size Distribution (Fines Content)
Figs. 3.7a-b provide the autocorrelation function of the pressure fluctuations
corresponding to 20% fines content, a primary gas velocity of 10 Umf and bed depths of
40 and 160 cm. The experiments of imposed stream were not performed for fine FCC
fluidized beds. Comparison of Figs. 3.3a and 3.7a illustrates that fluidized beds with 3%
and 20% fines content exhibit very similar behavior in the case of 40 cm bed depth. The
rate of decline of autocorrelation is somewhat more for the case 20% fines content which
can be related to the tendency to form channeling flow in fluidized beds of fine particles.
A comparison between figures 3.4a and 3.7b reveals that particle size has a visible
influence on the characteristics of different flow configurations studied here in the 160

Chapter 3 - Experimental Study of the Nature of Gas Streaming
78
cm deep bed. As can be seen the appearance of the graphs in Fig. 3.7b mostly resemble
Figs. 3.3a and 3.7a of 40 cm bed depth, thus, showing the tendency of the system toward
a normal bubbling fluidized bed. The two cases of jet flows without primary gas flow
decline very slowly compared to Fig. 3.4a of FCC particles with 3% fines content. As
mentioned above, this feature can be attributed to the intrinsic characteristics of fines
particles to form channels and possible effect of jets to create these phenomena in the
bed. The endurance of the pressure fluctuations they cause, and the statistical similarity of
the events in the bed at different times might lead to these types of autocorrelation
graphs.
3.5.4. Wavelet Decomposition and Analysis
The time series of the pressure fluctuations measured for the 3% fines content FCC has
been used for wavelet analysis here. For this purpose, the time series is decomposed into
6 levels or scales. Then, the PSD of the resulting approximate and detail parts of the time
series have been calculated. The PSD of the approximate and detail parts for 40 cm bed,
160 cm bed, imposed stream and high-velocity jet are provided in Figs. 3.8-3.11. As can
be seen in Fig. 3.8a, the shape of the PSD graph and the dominant frequency of the
approximate time series remain almost constant at around 3 Hz until scale 3 of the
decomposition. This dominant frequency is equal to the dominant frequency of the
original pressure fluctuation time series (Fig. 3.3b) and is related to the bubbling activity
in the fluidized bed. Following scale 3, a decrease in the dominant frequency and power
occurs. This indicates that by transferring from scale 3 to scale 4 decomposition, a change
in the content of the time series occurs that removes the contribution of bubbling activity

Chapter 3 - Experimental Study of the Nature of Gas Streaming
79
from the main body of the time series. Studying Fig. 3.8b shows that the first two detail
time series contain very high frequency fluctuations However, the power of these
fluctuations is very low relative to the power of the next detail time series, which
indicates their limited contributions in the main pressure time series. The PSD of scale 4
detail time series shows the higher power and a dominant frequency of less than 4 Hz,
which is similar to the dominant frequency of the approximate time series of less than
scale 3 decomposition. Hence, the contribution of the bubbling activity in the original
time series transfers from scale 3 approximate to the scale 4 detail time series by
continuing the decomposition. Thus, As the figure shows, scale 5 detail presents a
dominant frequency of 2 Hz. Since the presence of several bubbling activities with
different dominant frequencies has been reported in the previous literature (Falkowski
and Brown, 2004), scale 5 detail may be presenting another bubbling activity. After
decomposition of scale 4, the dominant frequency of the detail parts shifts towards lower
frequencies with lower power in the PSD graph. Therefore, it can be concluded that the
dominant frequency of 3 Hz, found for 40 cm fluidized bed, is a superposition of these
two bubbling activities.
As Fig. 3.9a indicates, all the approximate times series for 160 cm bed depth provide
similar PSD graphs. Only the contribution of the higher frequencies decreases in the PSD
with continuing the decomposition, which is generally considered to be trivial. As Fig.
3.9b shows, scale 4 and 5 detail time series of the 160 cm bed exhibit dominant
frequencies of 4 and 2 Hz, respectively, which is similar to the 40 cm bed depths.
However, the relative power of the scale 5 component with 2 Hz frequency increases

Chapter 3 - Experimental Study of the Nature of Gas Streaming
80
compared to the scale 4 part with 4 Hz frequency. Furthermore, contrary to the 40 cm
bed, the power of scale 6 part which possesses lower dominant frequency, increases
compared to the previous scales. This signifies the appearance of other activities with
greater influence on the overall fluidized bed hydrodynamics. This can be related to the
emergence of streaming flow in the 160 cm fluidized bed. Therefore, it can be postulated
that similar bubbling activity that exists in the 40 cm bed fluidized bed is present for 160
cm bed fluidized bed, however, its contribution is much less than the streaming flow that
is present at the same time.
Figs. 3.10 and 3.11 illustrate the PSD of the approximate and detail parts of the pressure
fluctuations for the imposed stream and high-velocity jet configuration in the 160 cm bed
fluidized bed. As these figures demonstrate, the power of the higher scale decompositions
with lower dominant frequencies gradually increases. The ratio of the power of scale 5
(beginning of streaming) detail to scale 4 detail (contains the activities related to
bubbling) are calculated as 1, 2.3, 3.6 and 10, respectively, for normal bubbling in the 40
cm bed, natural streaming in the 160 cm bed, imposed stream in the 160 cm deep bed and
high-velocity jet without primary air flow. These numbers reveal a gradual change of
power ratio from a case of shallow fluidized bed containing normal bubbling activity with
a uniform distribution of gas towards a packed bed with one internal jet. Therefore,
streaming flow can be considered to form by increasing the relative importance of one
available stream of bubble activity compared to other activities with increasing the bed
depth and suppressing the uniform gas distribution. It should be noted that although
fluidized beds with different bed depths apparently have PSD powers with different

Chapter 3 - Experimental Study of the Nature of Gas Streaming
81
orders, the calculated values, discussed above, are power ratios and thus, are not
influenced by absolute values of power.
A thorough review of the literature reveals that these findings can be explained by the
observations reported previously by other authors. Rowe and Yacono (1976) compared
the bubbling fluidization of different particle sizes based on the concept of permeability.
The permeability is defined as the ability of gas to diffuse into the bed of particles and is
related to the bed voidage. It has been calculated using by the Kozeny-Carmen relation,
Scheidegger (1960):
3 2
2
1
180 (1 )pd
(3.3)
where κ is the permeability of the particle bed.
Rowe and Yacono (1976) found that the permeability decreases for deeper fluidized beds.
The presence of preferred bubble tracks and channeling has also been reported in the
literature by various researchers (Rowe and Yacono, 1976; Rowe, 1971; Glicksman et al.,
1987). Furthermore, Matsuno and Rowe (1970) have argued that bubbles prefer to rise
successively along the preferred paths and increasing the superficial gas velocity
increases the number of bubbles, thus their frequency, in a specific path rather than
generating new paths. It is probable that some adjacent streams of fast bubbles join each
other to form streams of gas in the fluidized bed. Since permeability is expected to be
much lower at the bottom of very deep beds, these bubble streams can be stabilized in the
bed, especially at the bottom region. Other available bubble streams can gradually join
this stream and provide a lower pressure drop passage for the gas flow. Therefore, the
streaming would be directly related to lower permeability at the bottom of the deep bed

Chapter 3 - Experimental Study of the Nature of Gas Streaming
82
for fluidized beds of small particles. This is in conformity with visual observations
reported in our previous work (Karimipour and Pugsley, 2010) and the findings of this
work which indicates that streams form by the changing the relative importance of the
activities present in the bed with increasing bed depth. Other, less important bubble
streams that have not attached to the main stream can also be simultaneously present in
the system. It is worth mentioning here that based on the findings of the previous chapter,
increasing the fine content improves the fluidization behavior which is in contrary to the
lower permeability expected for finer particles. Thus, the dominant effect of fine content
in improving the fluidization quality should be related to the other effects of fines
(Lockett and Harrison, 1967; Geldart, 1972; Rowe et al., 1978) as have been discussed in
the previous chapter.
3.6. Conclusions
Study of natural streaming flow, forced streaming, and jetting flows revealed that there is
no significant difference between the configurations for a fluidized bed with 40 cm bed
depth. However, differences emerge by increasing the bed depth to 160 cm. It was found
that the natural streaming in a deep fluidized bed closely resembles the case of forced
stream in which the gas flow is also present in the remaining regions of the distributor.
The jet flows without the primary gas flow could be considered as the cases of severe
streaming that might happen in very deep beds with possible formation of completely
non-fluidized regions. Application of supporting jets with primary gas flow could
enhance the fluidization quality to some extent. Increasing the primary gas velocity from
10 to 50 Umf was found to reduce the effect of supporting jets. It was also found that finer

Chapter 3 - Experimental Study of the Nature of Gas Streaming
83
FCC particles relatively represent better fluidization. Wavelet analysis showed that even
in deep fluidized beds that are dominated by the streaming flow, bubbling activity with
the same dominant frequency as the shallow bed coexists, although with a minor
contribution. These findings suggested that the streaming flow can be considered to form
by increasing the relative importance of available stream of bubbles compared to other
activities as the bed depth increases.
3.7. References
Darton, R.C., La Naueza, R.D., Davidson, J.F., Harrison, D., 1977. Bubble growth due to
coalescence in fluidized beds. Chemical Engineering Research and Design 55, 274-280.
Daubechies, I., 1992. Ten lectures on wavelets, Philadelphia, PA, SIAM.
Daubechies, I., 1988. Orthogonal bases of compactly supported wavelets.
Communications of Pure Applied Mathematics 41, 909-996.
Ellis, N., Briens, L.A., Grace, J.R., Bi, H.T., Lim, C.J., 2003. Characterization of
dynamic behaviour in gas-solid turbulent fluidized bed using chaos and wavelet analyses.
Chemical Engineering Journal 96, 105-116.
Ellis, N., Bi, H.T., Lim, C. J., Grace, J.R., 2004. Influence of probe scale and analysis
method on measured hydrodynamic properties of gas-fluidized beds. Chemical
Engineering Science 59, 1841-1851.
Falkowski, D., Brown, R.C., 2004. Analysis of Pressure Fluctuations in Fluidized Beds,
Industrial and Engineering Chemistry Research 43, 5721-5729.
Geldart, D., 1973. Types of gas fluidization. Powder Technology 7, 285-292.

Chapter 3 - Experimental Study of the Nature of Gas Streaming
84
Glicksman, L.R., Lord, W.K., Sakagami, M., 1987. Bubble properties in large-particle
fluidized beds. Chemical Engineering Science 42, 479-491.
Grossman, A., Morlet, J., 1984. Decompositions of hardy functions into square integrable
wavelets of constant shape, SIAM Journal of Mathematics 15, 723-736.
Guenther, C., Breault, R., 2007. Wavelet analysis to characterize cluster dynamics in a
circulating fluidized bed. Powder Technology 173, 163-173.
Guo, Q., Yue, G., Suda, T., Sato, J., Flow characteristics in a bubbling fluidized bed at
elevated temperature. Chemical Engineering and Processing 42, 439-447.
He, Z., Zhang, W., He, K., Chen, B., 1997. Modeling pressure fluctuations via correlation
structure in a gas-solids fluidized bed. AIChE Journal 43, 1914-1920.
Hubbard, B.B., 1998. The world according to wavelets: The story of a mathematical
technique in the making, 2nd edition, A.K. Peters, Natick, Massachusetts.
Issangya, A., Knowlton, T., Karri, S.B.R., 2007. Detection of gas bypassing due to jet
streaming in deep fluidized beds of group A particles. In: Fluidization XII, Berruti, F., Bi,
X., Pugsley, T. (Eds.), Vancouver, British Columbia, Canada, May 13-17.
Karri, S.B.R., Issangya, A.S., Knowlton, M., 2004. Gas bypassing in deep fluidized beds.
In: Fluidization XI, Arena, U., Chirone, R., Miccio, M., Salatino, P. (Eds.), Ischia
(Naples), Italy, May 9-14.
Lu, X., Li, H., 1999. Wavelet analysis of pressure fluctuation signals in a bubbling
fluidized bed. Chemical Engineering Journal 75, 113-119.
Mallat, S., 1989. Multiresolution approximations and wavelet orthogonal bases of L2(R).
Transactions of American Mathematics Society 315, 69-87.

Chapter 3 - Experimental Study of the Nature of Gas Streaming
85
Mallat, S., 1988. Multiresolution representation and wavelets, Ph.D. Thesis, University of
Pennsylvania, Philadelphia.
Matsuno, R., Rowe, P.N., 1970. The distribution of bubbles in a gas fluidised bed.
Chemical Engineering Science 25, 1587-1593.
Rowe, P.N., Everett, D.F., 1972. Fluidised bed bubbles viewed by X-rays-Part I-
Experimental details and the interaction of bubbles with solid surfaces, Chemical
Engineering Research and Design 50, 42-48.
Rowe, P.N., Everett, D.F., 1972. Fluidised bed bubbles viewed by X-rays-Part II-The
transition from two to three dimensions of undisturbed bubbles, Chemical Engineering
Research and Design 50, 49-54.
Rowe, P.N., Everett, D.F., 1972. Fluidised bed bubbles viewed by X-rays-Part III-Bubble
size and number when unrestrained three-dimensional growth occurs, Chemical
Engineering Research and Design 50, 55-60.
Rowe, P.N., Yacono, C.X.R., 1976. The bubbling behaviour of fine powders when
fluidised. Chemical Engineering Science 31, 1179-1192.
Rowe, P.N., 1971. Experimental properties of bubbles. In: Fluidization, Davidson, J.F.,
Harrison D. (Eds.), Academic Press.
Sasic, S., Leckner, B., Johnsson, F., 2006. Time-frequency investigation of different
modes of bubble flow in a gas-solid fluidized bed. Chemical Engineering Journal 121,
27-35.
Scheidegger, A.E., 1960. The physics of flow through porous media. University of
Toronto Press, Toronto, Canada.

Chapter 3 - Experimental Study of the Nature of Gas Streaming
86
Wells, J., 2001. Streaming flow in large scale fluidization. AIChE Annual Meeting,
Particle Technology Forum, Reno, Nevada, USA.
Zhao, G., Yang, Y., 2003. Multiscale resolution of fluidized-bed pressure fluctuations.
AIChE Journal 49, 869-882.
3.8. Nomenclature
A1-4 Approximate components of the pressure fluctuations time series
ACF autocorrelation function
dp particle diameter (m)
D1-4 Detail components of the pressure fluctuations time series
t time (s)
U0 superficial gas velocity (m/s)
w wavelet transform operator
x pressure fluctuations time series (Pa)
X wavelet transform
Greek Letters:
κ permeability (m2)
ε voidage
ψ mother wavelet
μ dilation of the mother wavelet
υ translation of the mother wavelet

Chapter 3 - Experimental Study of the Nature of Gas Streaming
87
Table 3.1. The range of operating conditions studied in this work
Variable Range
Bed depth (cm) 40, 160
U0/Umf 10, 50
Fines content 3%, 20%
Distributor 1 mm holes and 0.54% opening, 2 mm holes and 2.15% opening
Jet velocity (m/s) 31 (No. 2), 60 (No. 1)

Chapter 3 - Experimental Study of the Nature of Gas Streaming
88
Figure 3.1. Schematic diagram of the experimental apparatus, showing the double-jet
nozzle and the distributor modified to produce a force streaming flow in the bed: (1)
Fluidized bed unit, (2) Primary air flow from blower, (3) Orifice plate, (4) Wind-box, (5)
Distributor, (6) Double-jet nozzle with 8cm distance between two jets and 19 cm distance
from distributor, (7) Jet air flow from building air, (8) Flow meter, (9) Pressure
transducers, (10) PC and data acquisition system, (11) Modified distributor, (12)
Perforated area, (13) Opening area. Arrows in the figure indicate the direction of the air
flow.
(2)
(7) (5)
(6) (9)
(4)
(3)
(1)
(8)
(10)
(11)
(13)
(12)

Chapter 3 - Experimental Study of the Nature of Gas Streaming
89
Figure 3.2. (a) Daubechies number 5 wavelet (“db5”) which has been used in the present
work as the mother wavelet, (b) Decomposition of a signal (S) into its components using
Wavelet transform
(a)
(b)

Chapter 3 - Experimental Study of the Nature of Gas Streaming
90
-0.4
-0.2
0
0.2
0.4
0.6
0.8
1
0 1 2 3 4 5 6Lags (s)
Au
to C
orre
lati
onFluidized Bed with only primary gas flowImposed StreamNo. 1 Jet with primary gas flowNo. 1 Jet without primary gas flowNo. 2 Jet with primary gas flowNo. 2 Jet without primary gas flow
0
500
1000
1500
2000
2500
3000
0 2 4 6 8 10 12 14 16Frequency (Hz)
PS
D (
Pa2 /H
z)
Fluidized Bed with only primary gas flow
Imposed Stream
NO. 1 Jet with primary gas flow
NO. 1 Jet without primary gas flow
NO. 2 Jet with primary gas flow
NO. 2 Jet without primary gas flow
Figure 3.3. (a) Autocorrelation and (b) PSD of pressure fluctuations for the different test
configurations, 40 cm bed depth, coarse FCC (3% fines content), U0=10 Umf
(a)
(b)

Chapter 3 - Experimental Study of the Nature of Gas Streaming
91
-0.4
-0.2
0
0.2
0.4
0.6
0.8
1
0 1 2 3 4 5 6Lags (s)
Au
to C
orre
lati
onFluidized Bed with only primary gas flowImposed StreamNo. 1 Jet with primary gas flowNo. 1 Jet without primary gas flowNo. 2 Jet with primary gas flowNo. 2 Jet without primary gas flow
Class 1
Class 3
Class 2
0
4000
8000
12000
16000
20000
0 2 4 6 8 10 12 14 16Frequency (Hz)
PS
D (
Pa2 /H
z)
Fluidized Bed with only primary gas flow
Imposed Stream
NO. 1 Jet with primary gas flow
NO. 1 Jet without primary gas flow
NO. 2 Jet with primary gas flow
NO. 2 Jet without primary gas flow
Figure 3.4. (a) Autocorrelation and (b) PSD of pressure fluctuations for the different test
configurations, 160 cm bed depth, coarse FCC (3% fines content), U0=10 Umf
(a)
(b)

Chapter 3 - Experimental Study of the Nature of Gas Streaming
92
-0.4
-0.2
0
0.2
0.4
0.6
0.8
1
0 1 2 3 4 5 6Lags (s)
Au
to C
orre
lati
onFluidized Bed with only primary gas flow
Imposed Stream
No. 1 Jet with primary gas flow
No. 2 Jet with primary gas flow
0
4000
8000
12000
16000
20000
0 2 4 6 8 10 12 14 16Frequency (Hz)
PS
D (
Pa2 /H
z)
Fluidized Bed with only primary gas flow
Imposed Stream
No. 1 Jet with primary gas flow
No. 2 Jet with primary gas flow
Figure 3.5. (a) Autocorrelation and (b) PSD of pressure fluctuations for the different test
configurations, 40 cm bed depth, coarse FCC (3% fines content), U0=50 Umf
(a)
(b)

Chapter 3 - Experimental Study of the Nature of Gas Streaming
93
-0.4
-0.2
0
0.2
0.4
0.6
0.8
1
0 1 2 3 4 5 6Lags (s)
Au
to C
orre
lati
onFluidized Bed with only primary gas flow
Imposed Stream
No. 1 Jet with primary gas flow
No. 2 Jet with primary gas flow
0
50000
100000
150000
200000
250000
300000
0 2 4 6 8 10 12 14 16Frequency (Hz)
PS
D (
Pa2 /H
z)
Fluidized Bed with only primary gas flow
Imposed Stream
No. 1 Jet with primary gas flow
No. 2 Jet with primary gas flow
Figure 3.6. (a) Autocorrelation and (b) PSD of pressure fluctuations for the different test
configurations, 160 cm bed depth, coarse FCC (3% fines content), U0=50 Umf
(a)
(b)
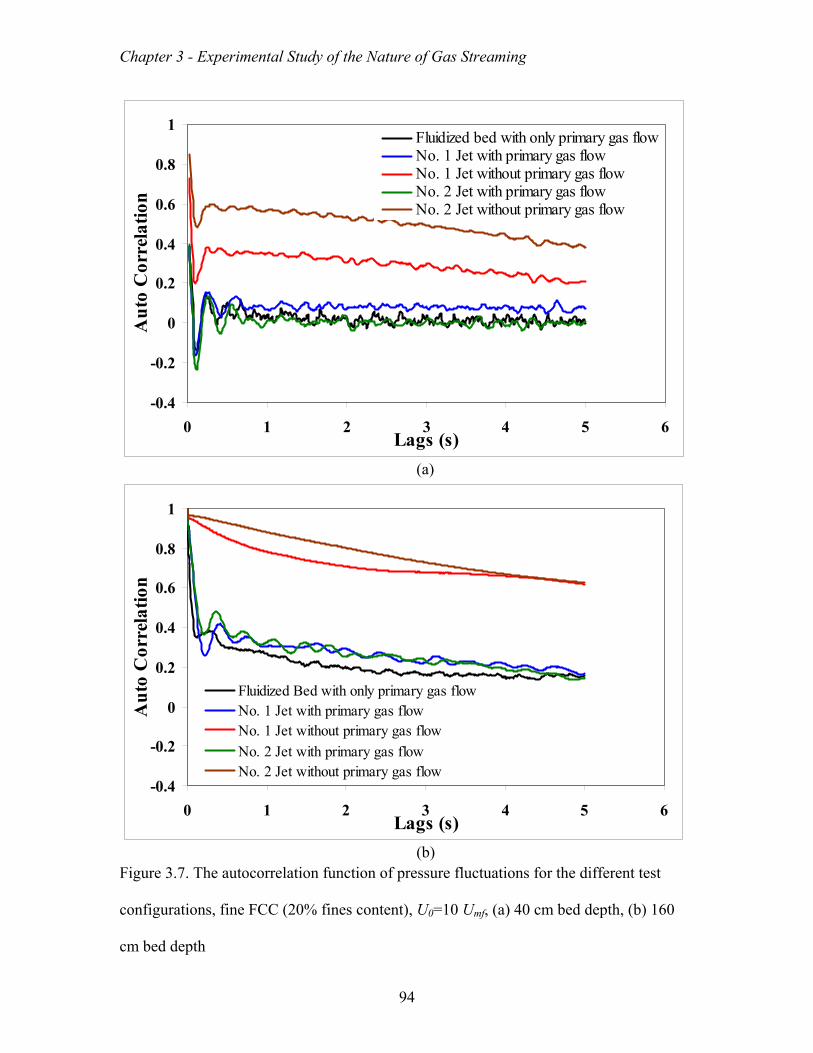
Chapter 3 - Experimental Study of the Nature of Gas Streaming
94
-0.4
-0.2
0
0.2
0.4
0.6
0.8
1
0 1 2 3 4 5 6Lags (s)
Au
to C
orre
lati
onFluidized bed with only primary gas flowNo. 1 Jet with primary gas flowNo. 1 Jet without primary gas flowNo. 2 Jet with primary gas flowNo. 2 Jet without primary gas flow
-0.4
-0.2
0
0.2
0.4
0.6
0.8
1
0 1 2 3 4 5 6Lags (s)
Au
to C
orre
lati
on
Fluidized Bed with only primary gas flowNo. 1 Jet with primary gas flowNo. 1 Jet without primary gas flow
No. 2 Jet with primary gas flowNo. 2 Jet without primary gas flow
Figure 3.7. The autocorrelation function of pressure fluctuations for the different test
configurations, fine FCC (20% fines content), U0=10 Umf, (a) 40 cm bed depth, (b) 160
cm bed depth
(a)
(b)

Chapter 3 - Experimental Study of the Nature of Gas Streaming
95
0
50
100
150
200
250
300
350
0 2 4 6 8 10 12 14 16Frequency (Hz)
PSD
(P
a2 /Hz)
A1A2A3A4
A5A6
0
50
100
150
200
250
0 2 4 6 8 10 12 14 16Frequency (Hz)
PS
D (
Pa2 /H
z)
0
0.04
0.08
0.12
0.16
0.2
D2D3D4D5
D6D1(right axis)
Figure 3.8. The PSD of the approximate and detail parts of the pressure fluctuations
obtained by Wavelet decomposition, U0=10 Umf, coarse FCC (3% fines content) in 40 cm
bed, (a) Approximate (A), (b) Detail (D)
(b)
(a)
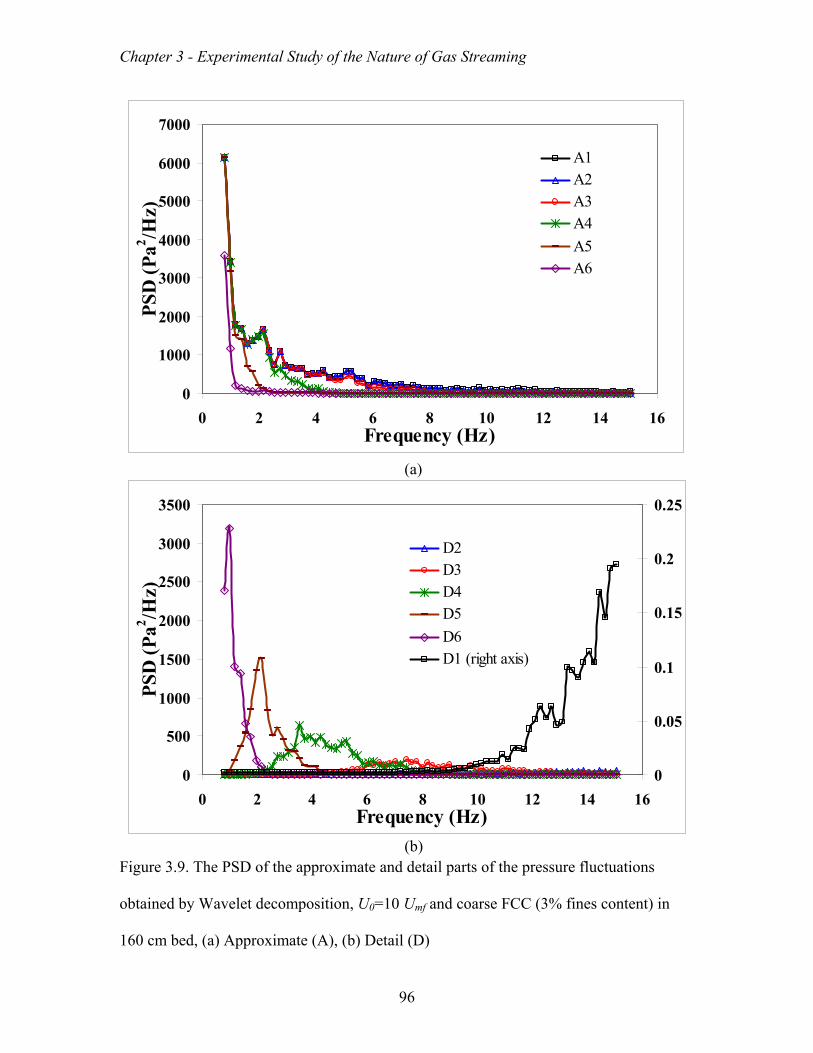
Chapter 3 - Experimental Study of the Nature of Gas Streaming
96
0
1000
2000
3000
4000
5000
6000
7000
0 2 4 6 8 10 12 14 16Frequency (Hz)
PSD
(P
a2 /Hz)
A1A2A3A4
A5A6
0
500
1000
1500
2000
2500
3000
3500
0 2 4 6 8 10 12 14 16Frequency (Hz)
PSD
(P
a2 /Hz)
0
0.05
0.1
0.15
0.2
0.25
D2D3D4D5
D6D1 (right axis)
Figure 3.9. The PSD of the approximate and detail parts of the pressure fluctuations
obtained by Wavelet decomposition, U0=10 Umf and coarse FCC (3% fines content) in
160 cm bed, (a) Approximate (A), (b) Detail (D)
(b)
(a)

Chapter 3 - Experimental Study of the Nature of Gas Streaming
97
0
500
1000
1500
2000
2500
3000
0 2 4 6 8 10 12 14 16Frequency (Hz)
PSD
(P
a2 /Hz)
A1A2A3A4
A5A6
0
200
400
600
800
1000
1200
0 2 4 6 8 10 12 14 16Frequency (Hz)
PSD
(P
a2 /Hz)
0
0.01
0.02
0.03
0.04
0.05
0.06
0.07
D2D3D4D5
D6D1 (right axis)
Figure 3.10. The PSD of the approximate and detail parts of the pressure fluctuations
obtained by Wavelet decomposition, U0=10 Umf and coarse FCC (3% fines content) in
160 cm bed with imposed stream, (a) Approximate (A), (b) Detail (D)
(b)
(a)

Chapter 3 - Experimental Study of the Nature of Gas Streaming
98
0
2000
4000
6000
8000
10000
12000
14000
0 2 4 6 8 10 12 14 16Frequency (Hz)
PS
D (
Pa2 /H
z)A1A2A3A4
A5A6
0
10
20
30
40
50
0 2 4 6 8 10 12 14 16Frequency (Hz)
PS
D (
Pa2 /H
z)
0
500
1000
1500
2000
2500
3000
3500
4000
D1
D2
D3
D4
D5 (right axis)
D6 (right axis)
Figure 3.11. The PSD of the approximate and detail parts of the pressure fluctuations
obtained by Wavelet decomposition, U0=10 Umf and coarse FCC (3% fines content) in
160 cm bed with No. 1 jet, (a) Approximate (A), (b) Detail (D)
(b)
(a)

Chapter 4 - CFD Simulation of a Bubbling Fluidized Bed using the MP-PIC
99
CHAPTER 4 - CFD Simulation of a Bubbling Fluidized
Bed of Geldart A Particles using the Multiphase
Particle in Cell Approach
The contents of this chapter have been submitted to the AIChE Journal. It has been
submitted in a version similar to what appears in this chapter.
Citation
Sh. Karimipour, T. Pugsley, CFD Simulation of a Bubbling Fluidized Bed of Geldart A
Particles using the Multiphase Particle in Cell Approach, AIChE Journal, February 2010
(Ref. No. AIChE-10-12468)
Contribution of Ph.D. Candidate
The CFD simulations performed for the purpose of this work and measuring pressure
fluctuations in the fluidized bed were planned and performed by Shayan Karimipour.
Todd Pugsley provided consultation regarding the design of simulation cases. The
programs for all of the data analysis were developed by Shayan Karimipour. All of the

Chapter 4 - CFD Simulation of a Bubbling Fluidized Bed using the MP-PIC
100
writing of the submitted manuscript was done by Shayan Karimipour with Todd Pugsley
providing editorial guidance regarding the style and technical content of the manuscript.
Contribution of this Paper to the Overall Study
Since initial test of the commercial CFD codes FLUENT and MFIX did not show any
sign of gas streaming in the deep fluidized bed, the CFD code BARRACUDATM that has
been claimed by the developers to be appropriate for this purpose was tested. Due to the
lack of data on the performance of this code, a simple case of modeling a freely bubbling
fluidized bed of Geldart A particles in a 14 cm diameter column was attempted first. The
results of this study are provided in this chapter. I should be noted that similar to the
previous mentioned codes, this code also failed to capture the streaming flow when
applied to a deep fluidized.
4.1 Abstract
The capability of the multiphase Particle in Cell (PIC) approach to resolve the
characteristics of a bubbling fluidized bed of Geldart A particles has been investigated.
Four different simulation cases, which include three different uniform grid sizes (0.5, 1,
and 2 cm) and two drag models with a realistic particle size distribution have been
designed and tested for this purpose. The simulated bubble size distribution, rise velocity,
and bubble frequency as well as bed expansion and voidage distribution have been
compared with commonly accepted correlations and experimental data provided in this
work and from the literature. The dynamic characteristics of the different cases are also
evaluated using the time series of pressure fluctuations generated by the simulations. The

Chapter 4 - CFD Simulation of a Bubbling Fluidized Bed using the MP-PIC
101
results show a promising predictive capability of the multiphase PIC approach without
the need to modify the drag model or other constitutive relations.
4.2. Introduction
The hydrodynamics of a gas-solid fluidized bed influence such bed characteristics as
solid and gas mixing, heat and mass transfer between particles, gas, and immersed
surfaces, and elutriation of particles from the bed. The hydrodynamics of fluidized beds
operating in the bubbling regime are largely governed by the distribution of the size,
velocity, and number of bubbles passing through the bed. Therefore, proper prediction of
bubble properties by computational fluid dynamics (CFD) models is essential if these
models are to provide a realistic picture of bed performance.
Although there have been numerous experimental studies of bubble characteristics from
the early days of fluidization research, most of the modeling efforts of gas-solid fluidized
beds in the literature have been limited to qualitative evaluations. This is due to the
difficulty of extracting the bubble properties and the need for relatively high resolution
simulations that are computationally costly. In some recent works, researchers have
begun to quantitatively discuss the simulation cases by extracting the bubble size
distribution and rise velocity from the simulation results (Wachem et al., 1999; Wachem
et al., 2001; Cammarata et al, 2003; McKeen and Pugsley, 2003; Patil et al., 2005).
However, most of these investigations have been based on coarser particles, belonging to
the Geldart B or D classification of powders (Geldart, 1973) and Geldart A models are
still scarce (McKeen and Pugsley, 2003).

Chapter 4 - CFD Simulation of a Bubbling Fluidized Bed using the MP-PIC
102
Although mathematical models have been able to provide acceptable results for the
modeling of coarser particles (Boemer and Renz, 1997; Goldschmidt et al., 2001;
Taghipour et al., 2005), attempts at the simulation of finer Geldart A class of powders
have encountered some significant challenges (McKeen and Pugsley, 2003; Makkawi et
al., 2006). This difficulty arises due to the relative importance of interparticle cohesive
forces compared with the gravitational forces when dealing with Geldart A powders (e.g.
Massimilla and Donsi, 1976). According to Molerus (1982), cohesive forces can be
neglected for the larger group B and D particles. Neglecting cohesive forces in CFD
models of dense fluidized beds of Geldart A particles can lead to over-prediction of bed
expansion by as much as 100% (McKeen and Pugsley, 2003; Makkawi et al., 2006). In
fact, by neglecting these forces the underlying assumption is that mainly the collisional
effects control individual particle-particle contacts, thus a large part of the remaining
dynamic energy of the particles is consumed for propelling the particles towards the top
of the bed.
McKeen and Pugsley (2003) were among the early researchers who reported this over-
prediction of bed expansion. They argued that interparticle forces lead to the formation of
particle clusters with a corresponding reduction in gas-solid drag. They found that by
scaling the drag model of Gibilaro et al. (1985) with a fractional constant equal to 0.25,
realistic bed expansion and bubble properties were predicted. Incorporation of equations
for the interparticle cohesive forces was attempted by Kim and Arastoopour (2002), who
extended the kinetic theory of granular flow to cohesive particles by modifying the solid
distribution equation. However, the final expression for the particulate stress was
Chapter 4 - CFD Simulation of a Bubbling Fluidized Bed using the MP-PIC
103
complex and difficult to incorporate into the current CFD models. Neither their model
nor the model of McKeen and Pugsley (2003) considered the size distribution of particles
in the fluidized bed.
As pointed out by Grace and Sun (1991), particle size distribution has a significant
influence on the bed expansion. Therefore, considering the size distribution of the
particles in the computational models might eliminate the problem of over-prediction of
the bed expansion. However, the presence of different types and sizes of particles
complicates the modeling process because separate continuity and momentum equations
must be solved for each size and type (Risk, 1993; Gidaspow, 1994). As a result, these
models have been only used for up to three solid phases in the literature, due to the
computational limitations. The multiphase Particle in Cell (PIC) approach (Andrews and
O'Rourke, 1996; Snider, 2001; Snider et al., 2001; Karimipour and Pugsley, 2009), which
is essentially an Eulerian-Lagrangian model, provides a numerical scheme in which
particles are grouped into computational parcels each containing a number of particles
with identical density, volume and velocity, located at a specific position. The evolution
of the particle phase is governed by solving a Liouville equation for the particle
distribution.
In the present work, the capability of the multiphase PIC approach for simulating a
bubbling fluidized bed of Geldart A particles will be investigated. The model predictions
of bed expansion and bubble properties as well as radial and axial profiles of bed voidage
will be validated by comparison with published correlations and experimental data. The

Chapter 4 - CFD Simulation of a Bubbling Fluidized Bed using the MP-PIC
104
ability of the model to resolve the dynamic characteristics of the fluidized bed will also
be evaluated using the time series of pressure fluctuations generated by the model.
4.3. Material and Experiments
A cylindrical Plexiglas vessel with an internal diameter of 14 cm and equipped with
electrical capacitance tomography (ECT) sensors is used for conducting the bubbling
fluidized bed experiments. Details of the ECT system can be found elsewhere (McKeen
and Pugsley, 2003). Spent FCC catalyst powder with a Sauter mean diameter of 79 μm,
low fines content (4% < 44 μm), and particle density of 1400 kg/m3 was used as the bed
material. The particle size distribution, provided in Fig. 4.1, was measured using a
Microtrac particle size analyzer (Microtrac, Montgomeryville, USA).
Fluidized bed pressure fluctuations were measured using a series of Omega® pressure
transducers mounted along the fluidized bed column. The transducers were flush-
mounted to the internal wall of the fluidized bed with 15 cm long by 4.5 mm diameter
stainless steel tubes covered by a 10 μm mesh at the tip to prevent fine particles from
entering. The tube volume was less than 2500 mm3 as recommended by Johnsson et al.
(2000) to minimize the damping effect on the pressure fluctuations. The pressure
measurements were performed at a sampling frequency of 100 Hz. This is far above the
major frequency component of fluidized bed pressure fluctuations, which is normally
below 10 Hz (Johnsson et al., 2000). The sampling time was 10 min. The data acquisition
equipment was interfaced with a continuous data logging program built with LabVIEW®
(National Instruments, Austin, USA).
Chapter 4 - CFD Simulation of a Bubbling Fluidized Bed using the MP-PIC
105
4.4. Model Development
The governing equations of the multiphase PIC formulation are provided in Table 4.1. In
the PIC model, the mass and momentum balance equations are solved for the continuous
phase (fluid) and a Liouville-type equation is solved for the particle phase to find the
distribution of particle positions with different velocities and sizes.
The Liouville equation is a differential equation which gives the future coordinates of the
particle locations based on the current coordinates of the particles and the particle
properties in the phase-space. It is assumed that the mass of each particle is constant
through time (no mass transfer between particles or to the fluid), but particles can have a
distribution of sizes and densities. Particles are grouped into computational parcels each
containing Np particles located at position, xp. The particles in each parcel are considered
to have identical density, volume and velocity. Parcels are smaller than the computational
cells and thus each cell contains multiple parcels. These parcels move freely within the
computational domain, similar to the movement of particles in the Lagrangian
simulations. The Liouville equation conserves the particle numbers in parcel volumes,
moving along dynamic trajectories in the particle phase-space. By using the Liouville
equation for calculating the particle distribution function integrated over velocity, density
and volume of all particles, the probable number of particles per unit volume at x and t
that have the velocity, density and volume in the interval of (up, up+dup), (ρp, ρp+dρp) and
(Vp, Vp+dVp) can be obtained. In this way, the size distribution of the particles will be
applied in calculating the interphase momentum transfer. The particle phase is implicitly

Chapter 4 - CFD Simulation of a Bubbling Fluidized Bed using the MP-PIC
106
coupled to the fluid phase through the interphase drag. The relations describing drag and
solid stress are discussed in the next two sections.
4.4. 1. Drag Models
Ergun (1952) developed his correlation based primarily on the experimental data
measured from the flow of gas through packed beds of coke particles with particle
volume fractions ranging from 0.47 to 0.59. He extended the application range of his
model using literature data measured for systems with particle volume fractions of up to
0.7. Wen and Yu (1966) conducted defluidization experiments in a liquid-solid system.
They started at a fluidized state and gradually decreased the flow rate to reach the fixed
bed condition. Their investigation covered the range of particle volume fractions between
0.28-0.61, but they also used literature data for particle volume fractions of as low as
0.01. Thus, the Ergun equation totally covers the range of particle volume fraction from
0.47-0.7 and the Wen and Yu (1966) equation covers the range of 0.01-0.61. However,
the transition point used in the Gidaspow drag model (1994) occurs at a solid volume
fraction of 0.2 which is not in the range of the overlapping between two models which is
between 0.47-0.61. In order to prevent possible numerical problems due to the sharp
transition or discontinuity in the Gidaspow drag model (1994), the application of a
switching function has been recommended by some researchers.
As can bee seen in Table 2, a linear transition between two drag models as a function of
the particle volume fraction at the close pack condition has been used in the present work.
Assuming the close pack solid fraction as 0.6, the transition between two drag models

Chapter 4 - CFD Simulation of a Bubbling Fluidized Bed using the MP-PIC
107
occurs between solid fractions of 0.51 and 0.45 which is in the overlapping range of two
models.
The other drag models plotted in Fig. 4.2 are the original Gidaspow model (1994), the
Syamlal and O’ Brien (1989) model in which the coefficients of the model are modified
based on the minimum fluidization velocity using the method proposed by the authors
(Syamlal and O’ Brien, 1989) and the drag model proposed by Gibilaro et al. (1985) and
its scaled version used by McKeen and Pugsley (2003). As the figure shows, McKeen
and Pugsley (2003) had to scale down the Gibilaro drag model by 75% (the Modified
Gibilaro drag model in the figure) to be able to predict a realistic bed expansion, while
the two drag models used in the current study (the Wen and Yu and the modified
Gidaspow model) are in the range of the other drag models.
4.4. 2. Solid Stress Model
The particle normal stress model used in this study is the Lun et al. (1984) model which
is developed based on the dense phase kinetic theory of gases. It is assumed in this model
that the acceleration of an individual particle due to the solids stress is independent of
size and velocity. The solids stress equation is comprised of two parts. The first part
represents the kinetic contribution and the second part represents the collisional
contribution. In a physical view, the kinetic part accounts for the momentum transferred
by particles moving across imaginary shear layers in the system. The collisional part
refers to the momentum transferred by direct particulate collisions.
Chapter 4 - CFD Simulation of a Bubbling Fluidized Bed using the MP-PIC
108
The radial distribution function term provides a correction to the possible number of
collisions in the kinetic theory of granular flow, due to the presence of other particles. In
the case of slightly inelastic collisions, where the collisional anisotropy plays a negligible
role, the radial distribution function depends only on the local particle volume fraction
(Ye et al., 2005).
4.4.3. Solution Procedure
Each computational parcel contains np real particles with identical density, ρp, velocity,
up, volume, Vp, and position, xp. The particle positions are updated using the following
implicit approximations:
1 1x x un n np p p t (4.1)
The particle velocity is updated by integration of the particle acceleration equation:
1 1 1
1
1 1
1
n n n np p p p
p p pnp
t D p g
t D
u u
u
(4.2)
where 1unp is the interpolated implicit particle velocity at the particle location, 1n
pp is the
interpolated implicit pressure gradient at the particle location, 1np is the interpolated
solids stress gradient at the particle location, g is gravity acceleration and D is the drag
force. The particle velocity given by Eq. (4.2) can be solved directly at each time step
using fluid properties updated from the current time step and old-time properties for the
solids stress. Following the particle velocity calculation, the particle positions are
updated. The final grid volume fraction is calculated using Eq. (4.3) by mapping the
particle volumes to the grid:

Chapter 4 - CFD Simulation of a Bubbling Fluidized Bed using the MP-PIC
109
, , , , , , ,1, ,
1 Np
i j k p m p m i j k mmi j k
n V SV
(4.3)
np is the number of particles in a parcel (a cloud of particles all with the same properties),
Np is the number of parcels, and the grid cell volume is Vi,j,k. This volume fraction will be
used for the solution of gas continuity and momentum equations in the next time step.
The new-time fluid volume fraction can be calculated by knowing the total solid fraction.
Generally, the multiphase PIC approach possesses some major differences with the usual
multiphase flow formulations (Andrews and O'Rourke, 1996). Firstly, the interphase
momentum transfer function is more detailed than in continuum models. The momentum
transfer rate in continuum models is considered to be proportional to the difference
between the mass-averaged velocities of the phases (Gidaspow, 1986; Risk, 1993;
Gidaspow, 1994). However in the PIC method, the particle distribution function is
solved. Thus, the detailed interphase momentum transfer can be computed by summing
the contributions from particles of different velocities and sizes. Secondly, the equation
of acceleration for the particle phase has some differences compared to the Lagrangian
methods. In PIC, particles are grouped into parcels that contain a fixed number of
identical particles, while individual particles are tracked in the Lagrangian approach.
Furthermore, collisions between particles are not resolved explicitly. Instead, the effect of
particle collisions is accounted for in an average manner using a continuum model for the
solid-phase stress.
4.5. Model Set up and Parameters
Chapter 4 - CFD Simulation of a Bubbling Fluidized Bed using the MP-PIC
110
4.5. 1. Fluidized Bed and Flow Conditions
A 14-cm ID fluidized bed containing FCC catalyst filled to a static bed depth of 50 cm
was defined for all simulation cases. The FCC particles had a Sauter mean diameter of 79
μm and the particle size distribution provided in Fig. 4.1. All simulations were three-
dimensional with uniform grid sizes of 0.5, 1, and 2 cm. The simulations in this work
were carried out with the commercial CFD code BARRACUDA (CPFD-Software
Technology, Albuquerque, USA).
4.5. 2. Boundary and Initial Conditions
A Dirichlet boundary condition is defined for the gas phase at the bottom of the fluidized
bed in which the superficial gas velocity is specified; the wind box is not part of the
simulation. A constant pressure boundary condition was employed at the top of the
vessel, which was set to a reference value of atmospheric pressure. A uniform pressure
equal to the atmospheric pressure and uniform gas velocity equal to the gas superficial
velocity at minimum fluidization were defined over the entire vessel as the initial
conditions. The initial solid fraction of the bed was considered to be equal to the solid
fraction at minimum fluidization conditions which was assumed to be 0.55. Details of
these boundary and initial conditions and other input parameters are provided in Table
4.3.
4.6. Extraction of Bubble Properties from the Simulation Results
Three different bubble diameters (chord length, bubble equivalent diameter, and bubble
cross sectional diameter) were extracted from the simulation results. In order to extract

Chapter 4 - CFD Simulation of a Bubbling Fluidized Bed using the MP-PIC
111
the two-dimensional bubble properties of chord length and bubble equivalent diameter
from the three-dimensional simulations, two orthogonal vertical planes intersecting at the
centre of the axis of the bed were defined. Both planes were divided into 6-cm segments
in the axial direction of the bed (Fig. 4.3a). Bubble characteristics extracted from these
vertical planes are analogous to measurements made with capacitance or fibre optic
probes and X-ray fluoroscopy. In addition, a horizontal plane of circular cross-section
was defined at an axial position 30 cm above the gas distributor (also depicted in Fig.
4.3a). The images of the bubble cross sectional diameter extracted from this plane are
analogous to those captured with an ECT system (McKeen and Pugsley, 2003).
An example of the two-dimensional images extracted from the vertical planes for
different grid sizes is provided in Fig. 4.3b. The bubble sizes were calculated based on a
time average of bubble sizes in both planes at a given axial position taken between 12 s
and 25 s. The first 12 s of the simulation were discarded in the time-averaging to avoid
the influence of initial transients in the model output. To perform the quantitative analysis
of bubble size and velocity, these gray-style images were converted to binary images
using a global thresholding method. The threshold is a normalized darkness intensity
value that lies in the range of [0, 1]. Pixels darker than the threshold are considered to be
totally black and brighter pixels are assigned as white pixels. Otsu’s method (Otsu, 1979)
is used to find this threshold for each image. This method finds the proper threshold to
minimize the variance of the black and white pixels in the images. By applying this
method, the bubbles become visible objects in the images. The binary version of the
previous images based on Otsu’s method (Otsu, 1979), are provided in Fig. 4.3c. To

Chapter 4 - CFD Simulation of a Bubbling Fluidized Bed using the MP-PIC
112
verify the relevance of the threshold value calculated by Otsu method, the binary images
were produced with several other values around the value calculated by Otsu’s method
(Otsu, 1979). It was found that the Otsu’s method provides the most proper threshold
value, because with higher values of the threshold close bubbles could not be
differentiated. To discard very deformed objects, the eccentricity of the detected objects
was defined to be greater than 0.98. The eccentricity is the ratio of the distance between
the foci of the ellipse-shape object and its major axis length. The value ranges between 0
(for a circle) and 1 (for a line segment). The value of 0.98 was found by visual checking
of several objects with different shapes in the images.
After detecting the bubbles based on the procedure discussed above, the center of the
bubbles is found. As it was mentioned before, each image is divided to several regions.
The bubbles are assigned to a specific region when their center of mass is located in that
region. Then the displacement of the center of mass of a specific bubble between
subsequent images is calculated. Since the time delay between subsequent images is
known, the velocity of bubble can be calculated the values of delay time and
displacement. In order to increase the possibility of tracking the same bubble between
images, a limit of 5 cm for the displacement between two successive images was defined.
It was also checked that the bubbles were present in the same radial section in successive
images.
The radial profile of bubble size and the bubble number were similarly determined by
dividing the cross sectional images into 7 radial slices (Fig. 4.3a). While a bubble, as a

Chapter 4 - CFD Simulation of a Bubbling Fluidized Bed using the MP-PIC
113
3D object, is passing the cross section, objects with different diameters are continuously
produced. The objects in each part of the cross section were separately tracked and the
equivalent diameters of these objects were determined simultaneously. In this way, a
vector of sizes is provided for each section. The diameter associated to the points of
maximum diameter in these vectors which are produced by the passage of the equator of
the bubbles was taken as the bubble diameter.
According to Harlow and Amsden (1975), bubbles should be detected in the context of
the local voidage, hence for calculating the average bubble voidage, local voidage
gradients have been considered here for detecting the bubble boundaries in the cross
sectional voidage data. Based on these voidage gradients, the boundary of a bubble is
considered to correspond to the average of the voidage at the center of the bubble and the
voidage of the emulsion around the bubbles. For example, if a bubble has a voidage of
one at the center and its surrounding emulsion has a voidage of 0.5, the boundary of
bubbles happen at the voidage of 0.75.
The bubble frequency can be obtained from the vectors obtained previously for
calculating the bubble diameter from cross sectional images. The number of peaks in a
vector of bubble diameters (which represents the passage of bubbles with time)
corresponds to the number of bubbles passing through cross section during a specified
time period. The bubble frequency can be defined as the number of these peaks divided
by the sampling time.

Chapter 4 - CFD Simulation of a Bubbling Fluidized Bed using the MP-PIC
114
4.7. Results and Discussions
In this section model predictions are compared with literature correlations for bubble
properties and with experimental data. As seen in Fig. 4.3b, performing the simulation
using a 2 cm grid is insufficient to resolve the bubbles. Hence, the bubble properties have
not been calculated for this case. The simulations do not predict bubbling in the initial 10
cm of the bed, but rather shows that this region is dominated by pressure waves. This
behavior has also been observed in simulations and experiments by previous authors
(Burgess and Calderbank, 1975; Boemer et al., 1998). Time-averaged properties are
based on the period between 12 to 25 s out of a total simulation time of 25 s, to eliminate
the effect of the initial transient fluctuations.
4.7.1. Bed Expansion
Fig. 4.4 presents the cross-sectionally averaged axial profile of the solid fraction inside
the fluidized bed. Except for the case of 2 cm grid, both of the drag models predict a
uniform axial profile of solid fraction inside the dense bed, with the sudden sharp
decrease corresponding to the interface between the upper surface of the dense bed and
dilute freeboard. The percentage expansions from the static bed depth for all simulation
cases are also reported in Fig. 4.4. These values show that the grid size has an important
influence on the predicted bed expansion, while the effect of the drag model is negligible.
The dependency of the bed expansion on the grid size was also reported earlier by Wang
et al. (2009). They found that a sufficiently small grid size (of the order of three particle
diameters for the case they studied) was required to be able to correctly predict the bed
expansion using the two-fluid model (TFM) or Eulerian modeling approach. However,

Chapter 4 - CFD Simulation of a Bubbling Fluidized Bed using the MP-PIC
115
employing grid sizes in the order of particles, as they proposed, makes the simulation
very time consuming and decreases its functionality for larger scale simulations. As it
was shown in Fig. 4.4, the PIC approach is able to correctly predict bed expansion with a
practical grid size as well as an unmodified drag model.
4.7.2. Bubble Size
Fig. 4.5 presents the different bubble dimensions extracted from the simulation results at
a superficial gas velocity of 0.1 m/s (0.5 cm grid and drag model 2). The figure illustrates
that bubble shape varies with increasing distance above the gas distributor. Bubble width
is greater than chord length along most of the fluidized bed except near the upper bed
surface. At the top of the bed, the increased velocity of the bubbles, which will be
discussed later, leads to a different distribution of forces throughout the bubble, making
them more elongated in that region. The comparison between equivalent bubble diameter
and bubble width and chord length in the figure shows that the bubble equivalent
diameter is less than both other dimensions near the upper bed surface. This is probably
due to deformation of the bubble arising from the vigorous mixing patterns and the
influence of the bed surface fluctuations. Since the various bubble dimensions of Fig. 4.5
are similar, in the ensuing comparison with published literature correlations only the
bubble equivalent diameter is used.
Fig. 4.6 compares the bubble equivalent diameter predicted by our model with the
literature correlations as a function of height above the distributor. Six different
correlations, including two more elaborate correlations proposed by Horio and Nonako

Chapter 4 - CFD Simulation of a Bubbling Fluidized Bed using the MP-PIC
116
(1987) and Choi et al. (1998) that account for bubble coalescence and splitting have been
used here. As the figure illustrates, the model results fall within the range of predictions
of the correlations and close to the data of Werther (1976), which was obtained at
experimental conditions similar to those defined in our model. As can be seen, the model
predicts that bubble size increases with increasing height above the distributor, which is
consistent with the experimental evidence on the topic. It is also interesting to note that
the trends of the model predictions suggest a leveling-off of bubble growth as the upper
surface of the bed is reached. This notion of a maximum bubble size for Geldart A
powders has been extensively discussed in the literature. However, this trend is not
consistent with two correlations of Agarwal (Agarwal, 1985; Agarwal, 1987) and
Werthers’s correlation (Werther, 1976). Most of the available data used by the authors to
develop their correlations are based on Geldart B and larger particles. For For example,
Agarwal used 268 μm glass particles in developing both of his correlations for bubble
size (Agarwal, 1985; Agarwal, 1987) and Werther used sand particles of 100 μm
diameter to develop his bubble size correlation (Werther, 1976). Since bubbles are larger
for these types of particles, the correlations may not be completely appropriate for
predicting the smaller bubble sizes that appear in the fluidization of Geldart A particles.
Between the correlations of Horio and Nonako (1987) and Choi et al. (1998) which are
expected to be more relevant for this case, one overpredicts and the other underpredicts
the model and the experimental data. Owing to the differences between the predictions of
the various bubble correlations and the range of data used in their development, a precise
assessment of our model based on comparison with these correlations can not be made.
However, it can be stated that these correlations have been used for both fluidized bed

Chapter 4 - CFD Simulation of a Bubbling Fluidized Bed using the MP-PIC
117
design and analysis of experiments since they were introduced into the fluidization
literature. In this regard, our model performs well and is consistent with these published
correlations.
When bubbles form above the distributor and move upward, bubble coalescence takes
place, leading to fewer bubbles of larger size. The probability distribution of the number
of bubbles at different axial positions above the distributor for two grid sizes and two
drag models is plotted in Fig. 4.7. The decreasing trend of bubble number is properly
captured in the case of 0.5 cm grid and drag model 2. The case with drag model 1 and 0.5
cm grid also predicts the decreasing trend of bubble number, however the decrease begins
at a higher elevation compared to the previous case. The case with 1 cm grid and drag
model 2 predicts an increasing number of bubbles, which is against the actual trend. This
behavior points to the likelihood of the 1 cm grid being too coarse to obtain satisfactory
results.
4.7.3. Bubble Rise Velocity
Fig. 4.8 provides a comparison between the average bubble velocity predicted by our
model with literature correlations for bubble velocity, as a function of height above the
distributor. As the figure shows, the different simulation cases provide nearly similar
values for bubble velocity along the fluidized bed. The correlations of bubble velocity
require the rise velocity of a single bubble. The correlation proposed by Wallis (1969)
that accounts for the effect of system geometry on the bubble rise velocity has been used
for this purpose. As Fig. 4.8 demonstrates, the correlations of Davidson and Harrison

Chapter 4 - CFD Simulation of a Bubbling Fluidized Bed using the MP-PIC
118
(1963) and Kunii and Levenspiel (1991), provide predictions that are closer to our model
results. The basis of both the correlations of Werther (1978) and Hilligardt and Werther
(1986) is the correlation proposed by Davidson and Harrison (1963). They added
empirical coefficients to the original equation to improve the correlation for their
experimental observations.
4.7.4. Bubble Solid Fraction
Fig. 4.9a is a cross sectional mesh plot of the solid fraction at an axial position of 30 cm
above the gas distributor. The horizontal axes indicate x and y directions and vertical axis
shows the solid fraction. The gradient of solid fraction is also represented using different
colors and the color bar provided at the side of the figure. As can be seen bubbles are
visible as three holes in the graph. The presence of a distribution of the solids fraction
inside the bubbles is clearly observable. An example of this distribution for the case of
0.5 cm grid and drag model 2 is provided in Fig. 4.9b. As can be seen, only a small
region at the center of bubble with a typical diameter of 1 cm seems to be free of
particles, i.e. a so-called “pure bubble” as described by Cui et al. (2000). The profile of
solid fraction inside the bubble generally has an “S” shape with a slow rate of increase.
Yates et al. (1994) found similar trends for Geldart B particles. However, the variation of
the solid fraction seems to be sharper for Geldart B particles, compared to Geldart A
particles investigated here. Therefore, bubble boundaries are more clearly discernible for
larger particles. According to the correlations proposed by Cui et al. (2000), the ratio of
the average solid fraction of bubble to emulsion for Geldart A and B particles are 0.57
and 0.41, respectively. This confirms the existence of more solid-laden bubbles in case of

Chapter 4 - CFD Simulation of a Bubbling Fluidized Bed using the MP-PIC
119
Geldart A particles which is also in conformity with the findings reported by Grace and
Sun (1991). This suggests that considering a distribution of the solid fraction is necessary
when modeling fluidized bed reactors in order to properly capture the extent of reaction
occurring inside the bubbles.
The axial profiles of bubble and bed voidages are shown in Fig. 4.10. As can be seen, the
average bed voidage increases slowly and then levels-off at about 20 cm above the
distributor with a voidage of 0.55. The bubble voidage increases faster and levels-off at
about 27 cm and with a voidage of 0.8. This decreasing trend of bubble voidage has also
been reported previously (Rowe et al., 1978; Yue et al., 1986). It indicates that the ability
of bubbles to entrain the particles decreases and the bubbles become more and more
depleted of particles as they approach the bed surface. Therefore, although the bubble
fraction in bed is increasing due to the presence of larger bubbles, the role of bubble in
the overall conversion may decrease (for gas-solid reactions or reactions with solid
catalysts) due to carrying much lower fractions of particles. Fig. 4.10 also shows that
average voidage in a large part of the fluidized bed is more than minimum fluidization.
This is against the postulations of the simple two-phase theory and proves the notion of
having higher amounts of interstitial gas flow (Rowe et al., 1978).
4.7.5. Dynamic Characteristics
An example of pressure fluctuations time series for the case of 0.5 cm grid and drag
model 2, at a height of 30 cm above the gas distributor is compared to the experimental
pressure fluctuations in Fig. 4.11. The standard deviation of the pressure fluctuations for

Chapter 4 - CFD Simulation of a Bubbling Fluidized Bed using the MP-PIC
120
all cases is also given in the figure. As can be seen, the general appearance of the pressure
fluctuations predicted by the simulation is similar to the experimental data. The standard
deviation decreases as the grid size is increased. A possible reason is that the pressure
fluctuations waves can not easily transfer between adjacent grids when the resolution is
not sufficient. Also previous comparisons indicated that the coarse grid can not resolve
bubbles, which have a large contribution in the pressure fluctuations. The standard
deviation is also somewhat lower for the case of the 0.5 cm grid with drag model 1. This
suggests that the choice of drag model also influences predictions of the bed dynamic
behavior.
4.8. Conclusion
In the present work, the capability of the multiphase Particle in Cell (PIC) approach with
a realistic particle size distribution for simulating the bubbling fluidized bed of Geldart A
particles has been investigated. For this purpose, four cases with three different grid sizes
and two drag models have been simulated using PIC approach. After simulating the
bubbling fluidized bed, the bubble properties such as bubble size distribution, bubble rise
velocity and bubble frequency as well as bed expansion and voidage profile have been
calculated based on the simulation results. The results have been compared with
commonly accepted correlations as well as experimental data provided in this work and
from the literature. The results show a promising prediction capability of the multiphase
PIC approach without any kind of modification in the drag model or other constituents of
the model. The results indicate that although both grid size and drag model affect the

Chapter 4 - CFD Simulation of a Bubbling Fluidized Bed using the MP-PIC
121
simulation results, the effect of drag model is negligible compared to the effect of the grid
size.
4.9. References
Agarwal, P.K., 1985. Bubble characteristics in gas fluidized beds. Chemical Engineering
Research and Design 63, 323-337.
Agarwal, P.K., 1987. Effect of bed diameter on bubble growth and incipient slugging in
gas fluidised beds. Chemical Engineering Research and Design 65, 345-354.
Andrews M.J., O'Rourke P.J., 1996. The multiphase particle-in-cell (MP-PIC) method for
dense particulate flows. International Journal of Multiphase Flow 22, 379-402.
Boemer, A., Qi, H., Renz, U., 1997. Eulerian simulation of bubble formation at a jet in a
two-dimensional fluidized bed. International Journal of Multiphase Flow 23, 927-944.
Boemer, A., Qi H., Renz U., 1998. Verification of Eulerian simulation of spontaneous
bubble formation in a fluidized bed. Chemical Engineering Science 53, 1835-1846.
Burgess. J.M., Calderbank P.H., 1975. The measurement of bubble properties in two
phase dispersions-III Bubble properties in a freely bubbling fluidized bed. Chemical
Engineering Science 30, 1511-1518.
Cammarata, L., Lettieri, P., Micale, G., Colman D., 2003. 2D and 3D CFD simulations of
bubbling fluidized beds using Eulerian-Eulerian models. International Journal of
Chemical Reaction Engineering 1, Article A48.
Chiba, T., Terashima, K., Kobayashi H., 1973. Bubble growth in gas fluidized beds.
Journal of Chemical Engineering of Japan 6, 78-83.

Chapter 4 - CFD Simulation of a Bubbling Fluidized Bed using the MP-PIC
122
Choi, J, Son J., Kim, S., 1998. Generalized model for bubble size and frequency in gas
fluidized beds. Industrial and Engineering Chemistry Research 37, 2559-2564.
Cui, H., Mostoufi, N., Chaouki J., 2000. Characterization of dynamic gas-solid
distribution in the fluidized beds. Chemical Engineering Journal 79, 135-143.
Davidson, J., Harrison, D., 1963. Fluidized Particles. Cambridge University Press, New
York.
Ergun, S., 1952. Fluid flow through packed columns. Chemical Engineering Progress 48,
89-94.
Geldart, D., 1973. Types of gas fluidization. Powder Technology 7, 285-292.
Gibilaro, L., Di Felice, R., Waldram, S., 1985. Generalized friction factor and drag
coefficient correlations for fluid-particle interactions. Chemical Engineering Science 40,
1817-1823.
Gidaspow, D., 1986. Hydrodynamics of fluidization and heat transfer: supercomputer
modeling. Applied Mechanical Review 39, 1-22.
Gidaspow, D., 1994. Multiphase flow and fluidization: Continuum and kinetic theory
description. 1st edition, Academic Press, Boston.
Goldschmidt, M., Kuipers, J., van Swaaij, W., 2001. Hydrodynamic modelling of dense
gas-fluidised beds using the kinetic theory of granular flow: effect of coefficient of
restitution on bed dynamics. Chemical Engineering Science 56, 571-578.
Grace, J., Sun, G., 1991. Influence of particle size distribution on the performance of
fluidized bed reactors. Canadian Journal of Chemical Engineering 69, 1126-1134.
Harlow, F., Amsden, A., 1975. Numerical calculation of multiphase fluid flow. Journal of
Computational Physics 17, 19-52.

Chapter 4 - CFD Simulation of a Bubbling Fluidized Bed using the MP-PIC
123
Hilligardt, K., Werther, J., 1986. Local bubble gas hold-up and expansion of gas-solid
fluidized beds. German Chemical Engineering 9, 215-221.
Horio, M., Nonaka A., 1987. A generalized bubble diameter correlation for gas-solid
fluidized beds. AIChE Journal 33, 1865-1872.
Johnsson, F., Zijerveld, R., Schouten, J., van den Bleek C., Leckner B., 2000.
Characterization of fluidization regimes by time-series analysis of pressure fluctuations.
International Journal of Multiphase Flow 26, 663-715.
Karimipour, S., Pugsley, T., 2009. Application of the particle in cell approach for the
simulation of bubbling fluidized beds of Geldart A particles, 7th Int. Conf. on CFD in
Min and Proc. Industries. Melbourne, Australia, December 9-11.
Kim, H., Arastoopour, H., 2002. Extension of kinetic theory to cohesive particle flow.
Powder Technology 122, 83-94.
Kunii, D., Levenspiel O., 1991. Fluidization Engineering, 2nd edition, Butterworth-
Heinemann, Boston.
Lun, C., Savage S., Jeffrey, D., 1984. Kinetic theories for granular flow: inelastic
particles in coquette flow and slightly inelastic particles in a general flow field. Journal of
Fluid Mechanics 1409, 223-256.
Makkawi, Y., Wright, P., Ocone, R., 2006. The effect of friction and inter-particle
cohesive forces on the hydrodynamics of gas-solid flow: A comparative analysis of
theoretical predictions and experiments. Powder Technology 63, 69-79.
Massimilla, L., Donsi G., 1976. Cohesive forces between particles of fluid-bed catalysts.
Powder Technology 15, 253-260.

Chapter 4 - CFD Simulation of a Bubbling Fluidized Bed using the MP-PIC
124
McKeen, T., Pugsley, T., 2003. Simulation and experimental validation of freely
bubbling bed of FCC catalyst. Powder Technology 129, 139-152.
Molerus, O., 1982. Interpretation of Geldart type A, B, C and D powders by taking into
account interparticle forces. Powder Technology 33, 81-87.
Otsu, N., 1979, A threshold selection method from gray-level histograms, IEEE
Transactions on Systems, Man and Cybernetics 9, 62-66.
Patil, D., van Sint Annaland, M., Kuipers, J., 2005. Critical comparison of hydrodynamic
models for gas-solid fluidized beds-Part II: freely bubbling gas-solid fluidized beds.
Chemical Engineering Science 60, 73-84.
Risk, M., 1993. Mathematical modeling of densely loaded, particle laden turbulent flows.
Atomization Sprays 3, 1-27.
Rowe, P.N., Santoro, L., Yates, J.G., 1978. The division of gas between bubble and
interstitial phases in fluidized beds of fine powders. Chemical Engineering Science 33,
133-140.
Schiller, L., Naumann, Z., 1935. A drag coefficient correlation, VDI Zeitung 77, 318-
320.
Snider, D.M., O'Rourke P.J., Andrews M.J., 1998. Sediment flow in inclined vessels
calculated using a multiphase particle-in-cell model for dense particle flows. International
Journal of Multiphase Flow 24, 1359-1382.
Snider, D.M., 2001. An incompressible three-dimensional multiphase particle-in-cell
model for dense particle flows. Journal of Computational Physics 170, 523-549.
Syamlal, M., O’Brien, T., 1989. Computer simulation of bubbles in a fluidized bed.
AIChE Symposium Series 85, 22-31.

Chapter 4 - CFD Simulation of a Bubbling Fluidized Bed using the MP-PIC
125
Taghipour, F., Ellis, N., Wong, C., 2005. Experimental and computational study of gas-
solid fluidized bed hydrodynamics. Chemical Engineering Science 60, 6857-6867.
van Wachem, B., Schouten, J., Krishna, R., van den Bleek, C., 1999. Validation of the
Eulerian simulated dynamic behaviour of gas-solid fluidised beds. Chemical Engineering
Science 54, 2141-2149.
van Wachem, B., Schouten, J., van den Bleek, C., 2001. Comparative analysis of CFD
models of dense gas-solid systems. AIChE Journal 47, 1035-1051.
Wallis, G.B., 1969. One dimensional two-phase flow, McGraw-Hill, New York.
Wang, J., van der Hoef, M., Kuipers, J.A.M., 2009. Why the two-fluid model fails to
predict the bed expansion characteristics of Geldart A particles in gas-fluidized beds: A
tentative answer. Chemical Engineering Science 64, 622-625.
Wen, C., Yu, Y., 1966, Mechanics of fluidization, Chemical Engineering Progress
Symposium Series 62, 100-111.
Werther, J., 1976. Bubble growth in large diameter fluidized beds. In: Fluidization
Technology, Keairns D.L. (Ed.), Hemisphere Publishing Co, Washington DC.
Werther, J., 1978. Effect of gas distributor on the hydrodynamics of gas fluidized beds.
German Chemical Engineering 1, 166-174.
Yates, J., Cheesman, D., Sergeev, Y., 1994. Experimental observations of voidage
distribution around bubbles in a fluidized bed. Chemical Engineering Science 49, 1885-
1895.
Ye, M., van Der Hoef, M., Kuipers, J.A.M., 2005. From discrete particle model to a
continuous model of Geldart A particles. Chemical Engineering Research and Design 83,
833-843.

Chapter 4 - CFD Simulation of a Bubbling Fluidized Bed using the MP-PIC
126
Yue, P.L., Rizzuti, L., Augugliaro, V., 1986, Bubble phase voidage and dense phase
voidage in thin two-dimensional fluidized beds. Chemical Engineering Science 41, 171-
177.
4.10. Nomenclature
A particle acceleration (m/s2)
C particle velocity fluctuations averaged over the velocity space (m/s)
CD drag coefficient
D drag force (kg/m3s)
D1 drag force in drag model 1 (kg/m3s)
D2 drag force in drag model 2 (kg/m3s)
dp particle diameter (m)
f(x, up, ρp, Vp, t) Liouville equation
F rate of momentum exchange per unit volume from the gas to the particle phase
(N/m3s)
g gravitational acceleration (m/s2)
g0 solid radial distribution function
np number of particles in a parcel
Np total number of parcels or clouds
p gas pressure (kPa)
Pc gas density (gas mass per unit volume occupied by the gas)
Ps constant with units of pressure (kPa)
Re Reynolds number (ρ ε dp (up- ug )/μg)

Chapter 4 - CFD Simulation of a Bubbling Fluidized Bed using the MP-PIC
127
Si,j,k interpolation function for cell centered variables
STD standard deviation of pressure fluctuations
t time (s)
ug gas velocity (m/s)
up particle velocity (m/s)
Umf minimum fluidization velocity (m/s)
Vi,j,k grid cell volume (m3)
Vp particle volume (m3)
xp particle position (m)
Greek Letters
ε gas volume fraction
γ restitution coefficient
μg gas viscosity (kg/m s)
ρg gas density (kg/m3)
ρp particle density (kg/m3)
p average particle density (kg/m3)
τ particle normal stress (N/m2)
pu Divergence operator with respect to velocity
θ particle volume fraction
θcp particle-phase volume fraction at close packing
Θ granular temperature (m2/s2)

Chapter 4 - CFD Simulation of a Bubbling Fluidized Bed using the MP-PIC
128
Table 4.1. Governing equations of the multiphase PIC model
Fluid phase continuity equation: ( )
( ) 0
gx g gu
t
Fluid phase momentum balance:
2( )( )g g
g g g g g gp gt
x x
uu u u F
Rate of momentum transfer between gas and solid phase per unit volume:
1( )F u u up p g p p p
p
fV D p dV d d
Liouville equation for finding the particle positions:
( ) ( ) 0uupx p
ff fA
t
Particle acceleration balance: 1 1 1
( )g pp p p
A D p gx xu u
Particle normal stress (Lun et al., 1984): 2
0(1 )p p g
Granular temperature (calculated with kinetic theory of granular flow equations):
21
3C
Radial distribution function (Gidaspow, 1994): 11/3
0
31
5 cp
g
Solid fraction in each cell:
up p p pfV dV d d

Chapter 4 - CFD Simulation of a Bubbling Fluidized Bed using the MP-PIC
129
Table 4.2. Equations of drag models
Model 1
0.687
240.5
241 0.15 0.5 1000
0.44 1000
D
D
D
C ReRe
C Re ReRe
C Re
1.653
4g p
D gp
u uD C
d
g p g p
g
d u uRe
Model 2
0.687
240.5
241 0.15 0.5 1000
0.44 1000
D
D
D
C ReRe
C Re ReRe
C Re
1.651
3
4g p
D gp
u uD C
d
2
1802
g p
gp
u uD
Re d
g p g p
g
d u uRe
1
2 1 1
2
0.75
0.750.75 0.85
0.85 0.75
0.85
CP
CPCP CP
CP CP
CP
D D
D D D D
D D

Chapter 4 - CFD Simulation of a Bubbling Fluidized Bed using the MP-PIC
130
Table 4.3. Input parameters used in the simulation
Geometry Three-dimensional, Cartesian
Vessel dimension 0.14 m diameter and 1 m height
Grid 0.5×0.5×0.5, 1×1×1, 2×2×2 cm
Total number of particles 1.31472×10¹⁰
Total number of clouds 3.8944×10⁶
Granular viscosity model Lun et al. (1984)
Drag models No. 1: Wen and Yu (1966) No. 2: Modified Gidaspow (1994)
Flow type Compressible with no gas-phase
turbulence
Simulation time 25 seconds
Time step 0.0001 seconds
Pressure-Velocity coupling SIMPLE
Solid fraction at maximum packing 0.55
Initial condition Bed at minimum fluidization
Minimum fluidization velocity 0.004 m/s
Minimum fluidization voidage 0.45
Boundary conditions Uniform flow from bottom
Atmospheric pressure at the top
Gas superficial velocity 0.1 m/s
Bed depth 0.5 m
Restitution coefficient 0.4

Chapter 4 - CFD Simulation of a Bubbling Fluidized Bed using the MP-PIC
131
0
20
40
60
80
100
0 50 100 150 200 250 300Particle Size (μm)
Cu
mu
lati
ve %
Figure 4.1. Particle size distribution of the FCC powders used in the experiments

Chapter 4 - CFD Simulation of a Bubbling Fluidized Bed using the MP-PIC
132
0
100000
200000
300000
400000
500000
0.4 0.5 0.6 0.7 0.8 0.9 1.0Voidage
Dra
g F
un
ctio
n (
Kg/
m3 s)
Drag Model NO. 1 (This work)Drag Model NO. 2 (This work)Gibilaro et al. (1985)Modified Gibilaro et al. (2003)Syamlal and O'Brien (1989)Gidaspow (1994)
Figure 4.2. Comparison between different drag models used for CFD simulations in the
literature

Chapter 4 - CFD Simulation of a Bubbling Fluidized Bed using the MP-PIC
133
Figure 4.3a. The segmentation of the axial and cross sectional images for calculating the
distribution of the bubble size
6 cm
2 cm
two-dimensional images in x and y directions
cross sectional image of the bed obtained from 30 cm above the distributor

Chapter 4 - CFD Simulation of a Bubbling Fluidized Bed using the MP-PIC
134
Figure 4.3b. Snapshots of the simulation cases with different grid size, a) 0.5 cm grid, b)
1 cm grid, c) 2 cm grid, the width of the images is 14 cm.
(a) (b) (c)

Chapter 4 - CFD Simulation of a Bubbling Fluidized Bed using the MP-PIC
135
Figure 4.3c. Binary versions of the snapshots provided in Fig. 4.3b, a) 0.5 cm grid, b) 1
cm grid, c) 2 cm grid, the width of the images is 14 cm.
(a) (b) (c)

Chapter 4 - CFD Simulation of a Bubbling Fluidized Bed using the MP-PIC
136
0
0.1
0.2
0.3
0.4
0.5
0.6
0 20 40 60 80 100Height above distributor (cm)
Sol
id F
ract
ion
Simulation with 0.5 cm mesh (Drag 2)
Simulation with 1 cm mesh (Drag 2)
Simulation with 2 cm mesh (Drag 2)
Simulation with 0.5 cm mesh (Drag 1)
mesh bed expansion0.5 cm (drag 2) 20%0.5 cm (drag 1) 16%1 cm (drag 2) 24%2 cm (drag 2) 34%Experimental 20%(McKeen and Pugsley, 2003)
Figure 4.4. Axial profile of solid fraction inside the fluidized bed. U0 = 0.1 m/s, time-
averaged over the period 12-25 s.

Chapter 4 - CFD Simulation of a Bubbling Fluidized Bed using the MP-PIC
137
0
1
2
3
4
10 20 30 40 50 60 70Height above distributor (cm)
Bu
bb
le d
iam
eter
(cm
)
Bubble equivalent diameter
Bubble width
Bubble chord length
Figure 4.5. Axial profiles of bubble sizes extracted from the simulation results for the
case of a 0.5 cm grid and drag model 2. U0 = 0.1 m/s, time-averaged over the period 12-
25 s.

Chapter 4 - CFD Simulation of a Bubbling Fluidized Bed using the MP-PIC
138
0
2
4
6
8
10
10 20 30 40 50 60Height above distributor (cm)
Bu
bb
le d
iam
eter
(cm
)Simulation (mesh 0.5 cm, Drag 2) Simulation (mesh 1 cm, Drag 2)Simulation (mesh 0.5 cm, Drag 1) Werther (1976)Agarwal (1985) Agarwal (1987)Horio and Nonaka (1987) Chiba et al. (1973)Choi et al. (1998) Exp data (Werther, 1976)
Figure 4.6. Comparison of model predictions of bubble average equivalent diameter as a
function of height above the distributor with predictions of selected correlations and the
experimental data of Werther (1976). U0 = 0.1 m/s, time-averaged over the period 12-25
s.

Chapter 4 - CFD Simulation of a Bubbling Fluidized Bed using the MP-PIC
139
0
5
10
15
20
25
12 18 24 29 35 41 47 53 59Height above distributor (cm)
Pro
bab
ility
dis
trib
uti
onmesh 0.5 cm, Drag 2
mesh 1 cm, Drag 2
mesh 0.5 cm, Drag 1
Figure 4.7. Model predictions of the probability distribution of the number of bubbles as
a function of height above the distributor for differing mesh sizes and drag models. U0 =
0.1 m/s, time-averaged over the period 12-25 s.
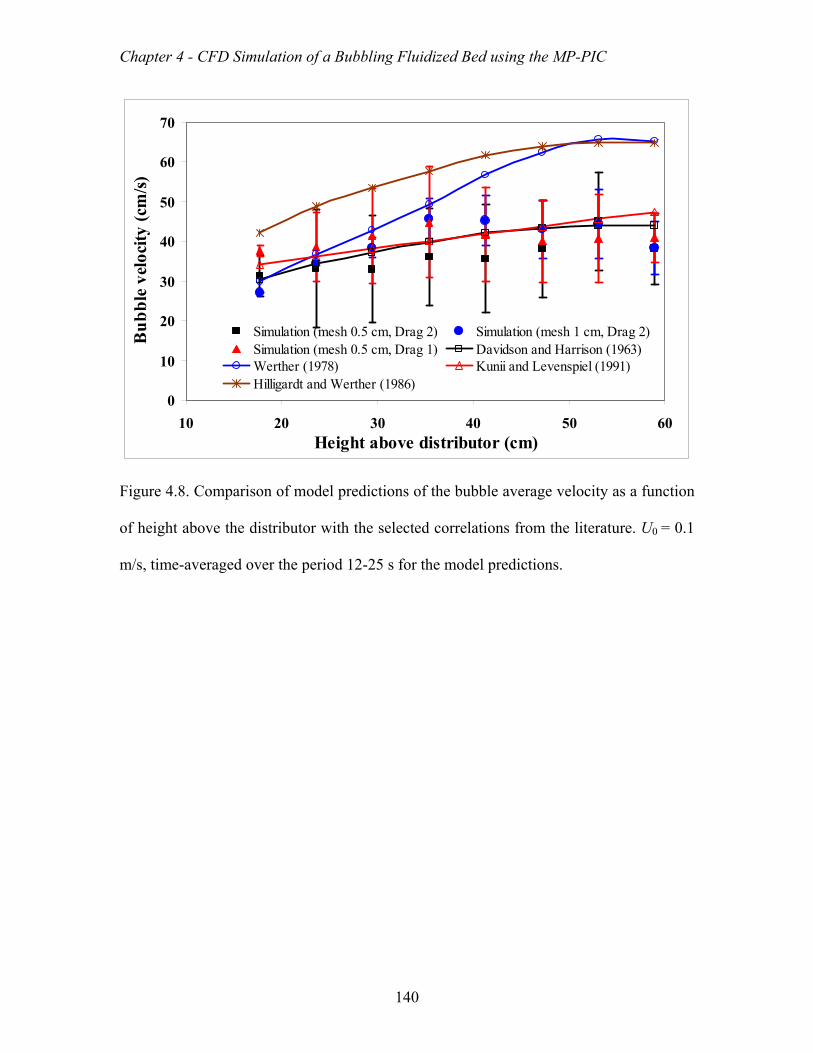
Chapter 4 - CFD Simulation of a Bubbling Fluidized Bed using the MP-PIC
140
0
10
20
30
40
50
60
70
10 20 30 40 50 60Height above distributor (cm)
Bu
bb
le v
eloc
ity
(cm
/s)
Simulation (mesh 0.5 cm, Drag 2) Simulation (mesh 1 cm, Drag 2)Simulation (mesh 0.5 cm, Drag 1) Davidson and Harrison (1963)Werther (1978) Kunii and Levenspiel (1991)Hilligardt and Werther (1986)
Figure 4.8. Comparison of model predictions of the bubble average velocity as a function
of height above the distributor with the selected correlations from the literature. U0 = 0.1
m/s, time-averaged over the period 12-25 s for the model predictions.

Chapter 4 - CFD Simulation of a Bubbling Fluidized Bed using the MP-PIC
141
0
5
10
0
5
10
0
0.5
1
X (cm)Y (cm)
Sol
id F
ract
ion
0
0.1
0.2
0.3
0.4
0.5
0.6
Figure 4.9a. Cross sectional mesh plot of the solid fraction in height of 30 cm of the
fluidized bed; the color in the figure shows the distribution of solid fraction which is
defined in the scaled color bar at the right. U0 = 0.1 m/s, 0.5 cm grid size and drag model
2, time-averaged over the period 12-25 s.
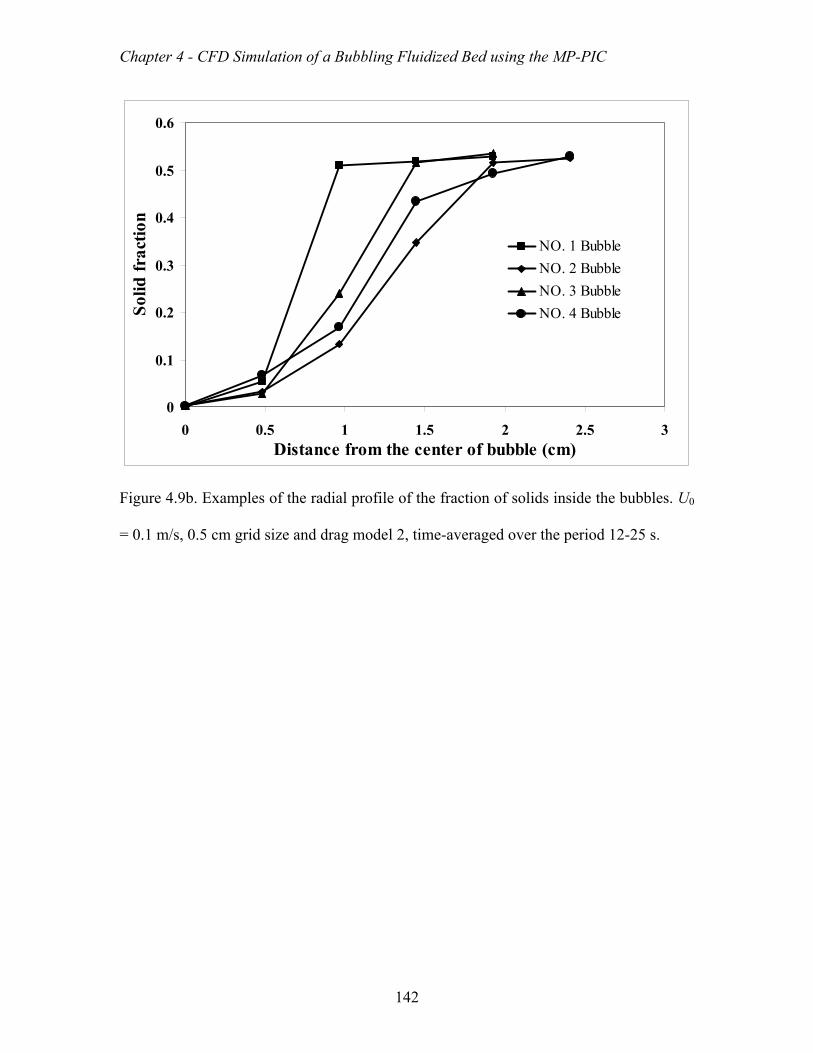
Chapter 4 - CFD Simulation of a Bubbling Fluidized Bed using the MP-PIC
142
0
0.1
0.2
0.3
0.4
0.5
0.6
0 0.5 1 1.5 2 2.5 3Distance from the center of bubble (cm)
Sol
id f
ract
ion
NO. 1 Bubble
NO. 2 Bubble
NO. 3 Bubble
NO. 4 Bubble
Figure 4.9b. Examples of the radial profile of the fraction of solids inside the bubbles. U0
= 0.1 m/s, 0.5 cm grid size and drag model 2, time-averaged over the period 12-25 s.

Chapter 4 - CFD Simulation of a Bubbling Fluidized Bed using the MP-PIC
143
0.45
0.5
0.55
0.6
0.65
0.7
0.75
0.8
0.85
0 10 20 30 40 50Height above distributor (cm)
Voi
dag
eBubble voidage
Average bed voidage
Figure 4.10. Axial profile of the average bubble voidage and the average bed voidage as a
function of height above the gas distributor. U0 = 0.1 m/s, 0.5 cm grid size and drag
model 2, time-averaged over the period 12-25 s.
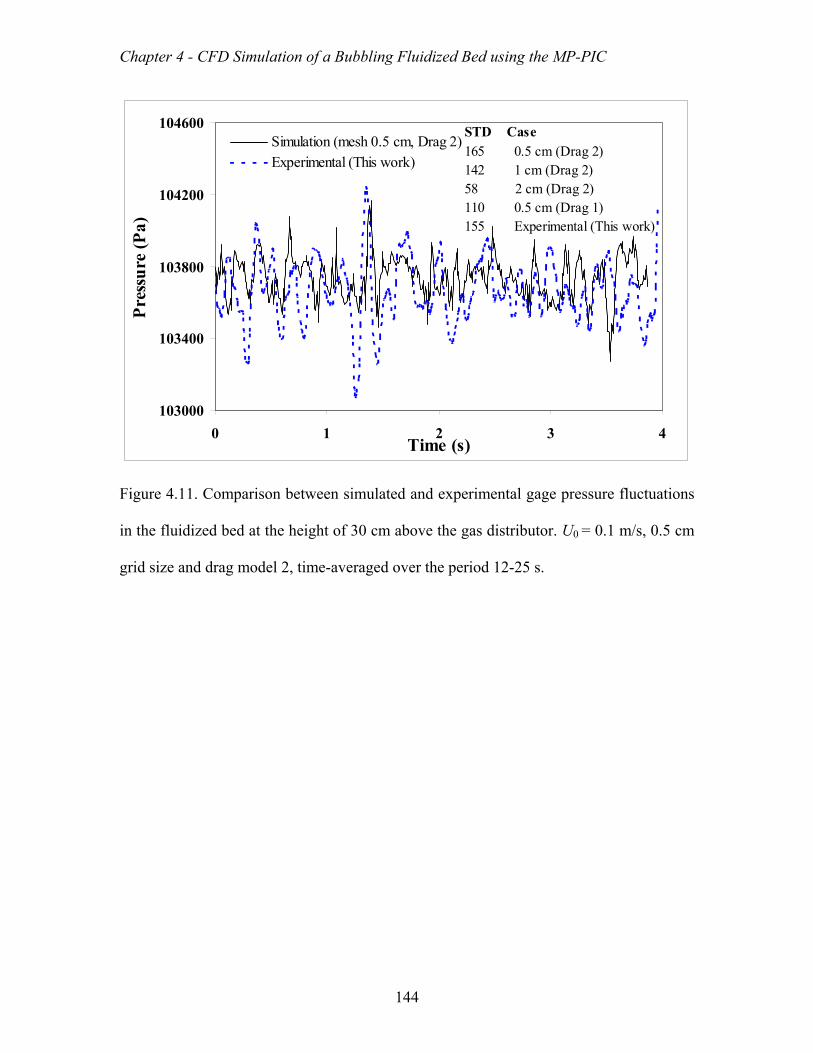
Chapter 4 - CFD Simulation of a Bubbling Fluidized Bed using the MP-PIC
144
103000
103400
103800
104200
104600
0 1 2 3 4Time (s)
Pre
ssu
re (
Pa)
Simulation (mesh 0.5 cm, Drag 2)Experimental (This work)
STD Case165 0.5 cm (Drag 2)142 1 cm (Drag 2)58 2 cm (Drag 2)110 0.5 cm (Drag 1)155 Experimental (This work)
Figure 4.11. Comparison between simulated and experimental gage pressure fluctuations
in the fluidized bed at the height of 30 cm above the gas distributor. U0 = 0.1 m/s, 0.5 cm
grid size and drag model 2, time-averaged over the period 12-25 s.

Chapter 5 - Modeling Study of Gas Streaming in a Deep Fluidized Bed
145
CHAPTER 5 - Modeling Study of Gas Streaming in a
Deep Fluidized Bed of Geldart A Particles
The contents of this chapter have been submitted to the CFB10 -- International
Conference on Circulating Fluidized Beds and Fluidized Bed Technology. It has been
submitted in a version similar to what appears in this chapter.
Citation
S. Karimipour, T. Pugsley, Modeling study of gas streaming in a deep fluidized bed of
Geldart A particles, CFB10 - International Conference on Circulating Fluidized Beds and
Fluidized Bed Technology, Sun River, Oregon, USA, May 1-6, 2011
Contribution of Ph.D. Candidate
The CFD simulations performed for the purpose of this work were planned and
performed by Shayan Karimipour. Todd Pugsley provided consultation regarding the
design of simulation cases. The programs for all of the data analysis were developed by

Chapter 5 - Modeling Study of Gas Streaming in a Deep Fluidized Bed
146
Shayan Karimipour. All of the writing of the submitted manuscript was done by Shayan
Karimipour with Todd Pugsley providing editorial guidance regarding the style and
technical content of the manuscript.
Contribution of this Paper to the Overall Study
The objective of the present work is to develop a phenomenological model for the
streaming flow. The model will then be used to evaluate the effect of bed depth, gas
velocity, and particle size on the streaming flow and discuss possible causes of the
appearance of this phenomenon by increasing the bed depth in fluidized bed.
5.1 Abstract
Gas streaming has been modeled in a deep fluidized bed of 5 m depth and 0.3 m inside
diameter. The cross section of the bed is divided into two zones: stream and non-stream.
The pressure drop in the stream zone is modeled based on a force balance over a single
particle and the pressure drop of non-stream zone is considered to be equal to the head of
the particle bed. The model results suggest that the lower pressure drop of the stream
zone compared to the remainder of the bed is the reason for the formation and stability of
the streaming flow. The effects of different parameters such as bed depth, gas velocity
and particle size on the severity of the streaming flow are also evaluated with the model.
The model results show that increasing the bed depth favors the streaming flow, while
increasing the gas velocity increases the uniformity of the bed and decreases the
streaming severity. Streaming flow was found to be less severe for larger particle sizes.

Chapter 5 - Modeling Study of Gas Streaming in a Deep Fluidized Bed
147
All of these findings are in conformity with experimental investigations reported
previously in the literature.
5.2. Introduction
Several studies in the past decade have demonstrated that in sufficiently deep fluidized
beds of Geldart A particles (Geldart, 1973), gas bypassing may occur by increasing the
superficial gas velocity beyond minimum fluidization. When this phenomenon occurs,
the fluidizing gas bypasses the bed in the form of streams of gas, leaving a large fraction
of the bed unfluidized or poorly fluidized (Wells, 2001; Karri et al., 2004; Issangya et al.,
2007; Karimipour and Pugsley, 2010). The concept of gas streaming was first reported in
the literature by Wells (2001). He performed several experiments in large scale units with
up to 2.5 m diameter and 5 m bed depth and observed streaming flow under conditions
that were expected to lead to operation in the bubbling regime. He attributed the
streaming phenomenon to gas compression, caused by the pressure head of the deep
solids bed over the distributor.
Karri et al. (2004) investigated the formation of streaming flow in a column of 0.3 m
inner diameter and 4.9 m height. They found that the standard deviation of pressure drop
in a bed exhibiting streaming was much greater than a uniformly fluidized bed. They also
reported that for all combinations of operating conditions investigated, the addition of a
sufficient amount of fines to the bed of Geldart A particles was able to delay the
streaming, even in deep beds. In another work, Issangya et al. (2007) used several
pressure transducers mounted at various radial positions to detect the presence of
Chapter 5 - Modeling Study of Gas Streaming in a Deep Fluidized Bed
148
streaming flow. They concluded that the maximum in the plot of standard deviation of the
pressure fluctuation versus gas velocity, which has been shown in the literature to be an
indication of the transition between the bubbling to turbulent fluidization regimes, is not
present for deep beds that are subject to streaming.
Recently, Karimipour and Pugsley (2010) have done a systematic study on the streaming
flow in deep beds of FCC particles. They discussed the signs of streaming flow in the
pressure fluctuations time series measured in the fluidized bed for different combinations
of bed depth, gas velocity, particle size and distributor. They concluded that streaming
flow does not appear suddenly, but emerges gradually in the bed by increasing the bed
depth. They found that although changing some parameters can influence the severity of
the streaming flow, streaming is the dominant phase for deep fluidized beds operating in
normal conditions.
Although several experimental works have been performed to study the general
characteristics of the streaming flow, mathematical representation and evaluation of the
streaming flow is still absent in the literature. The only mathematical work presented by
Wells (2001) to detect the onset of streaming flow does not include a functional
dependency on conditions such as bed depth and gas velocity and seems not to be able to
predict the correct situation for various cases. The objective of the present work is to
develop a phenomenological model for the streaming flow and to use the model to
evaluate the effect of bed depth, gas velocity, and particle size.

Chapter 5 - Modeling Study of Gas Streaming in a Deep Fluidized Bed
149
5.3. Model Development
Based on the visual observations made during a separate experimental campaign, the
deep fluidized bed was divided into two adjacent regions in which the smaller region was
occupied with the stream flow and the other region was assumed to be at minimum
fluidization conditions. The stream is assumed to form near the wall and occupy one
fourth of the bed diameter. The diameter of the stream is assumed to remain constant
along the fluidized bed. A small zone above the distributor is reported to be better
fluidized and gas and particles from other parts of the distributor find their way towards
the stream and move upward through the stream. As such, particles can be assumed to
move upward only in the stream and after discharging at the surface of the bed slowly
return to the bottom through the non-streaming region. Similar to the acceleration zone of
a circulating fluidized bed (Pugsley and Berruti, 1996; Karimipour et al., 2006), the
stream can be modeled by a force balance over a single particle inside the stream. Three
forces that act on a particle moving upward in a swarm of other particles are
gravitational, buoyancy and gas-solid drag. The axial pressure drop along the stream can
then be extracted from the force balance equation. Assuming the particles as spheres of
constant diameter, the force balance equation can be written as follows:
2
1( )
2p st
p p g p p D p g pg
d uV A C V g
dt
(5.1)
Substituting Vp and Ap in Eq. 5.1 by the subsequent relations
3
6p pV d
(5.2)
2
4p pA d
(5.3)

Chapter 5 - Modeling Study of Gas Streaming in a Deep Fluidized Bed
150
and considering the following equality from the derivative theory
p pp
d d
dt dz
(5.4)
Eq. 5.1 can be rearranged as
23
( )4
p g D stp p g
p p p g p p
d C u g
dz d
(5.5)
The drag coefficient, CD, in Eq. 5.5 can be estimated from one of the abundant
correlations of the drag coefficient in the literature. The correlation of Mostoufi and
Chaouki (1999) which has been developed for FCC particles, used in the experimental
works in chapters 2 and 3, has been employed here. The porosity in these equations is
calculated from the solids mass balance equation as follows:
(1 )p p g pG (5.6)
The initial value of the particle velocity at the bottom of the stream is obtained from the
solids mass balance. Thus, Eq. 5.5 will be solved subject to the following initial
condition:
0 (1 )p
p zp mf
G
(5.7)
Once the axial profile of particle velocity in the stream is determined from Eq. 5.5, the
corresponding solids holdup can be calculated from
1p g (5.8)
The axial profile of the pressure drop along the stream can be determined from the
momentum balance over the stream. The momentum balance could be expressed as
follows:

Chapter 5 - Modeling Study of Gas Streaming in a Deep Fluidized Bed
151
head acceleration friction
dp dp dp dp
dz dz dz dz
(5.9)
where
p p g ghead
dpg g
dz
(5.10)
p st stp p p g g
acceleration g g
d u udp d
dz dz dz
(5.11)
The pressure drop caused by friction includes two sources, i.e., gas-wall and particle-wall
frictions:
friction gas wall particl wall
dp dp dp
dz dz dz
(5.12)
These pressure losses are defined by the Fanning equation as
21
2st
g ggas wall st g
udpf
dz d
(5.13)
21
2p p p pparticle wall st
dpf
dz d
(5.14)
Since gas-wall and particle-wall frictions form a minor portion of the overall pressure
drop, type of the friction factor does not have a major effect on the results. Here, the gas-
wall friction factor, fg, has been calculated from the Blasius formula (Fox et al., 2003):
50.25
0.31610p g
g
f , ReRe
(5.15)
and the particle-wall friction factor has been estimated using the correlation of Kanno and
Saito (1969):
1/ 20.057
2p stp
f gd
(5.16)

Chapter 5 - Modeling Study of Gas Streaming in a Deep Fluidized Bed
152
In order to solve these equations, the solid circulation rate (Gp) is needed as an input.
Since the system is not a real circulating fluidized bed, a pseudo-circulating rate may be
calculated from the correlations proposed for the internally circulating fluidized bed. An
internally circulating fluidized bed resembles the current case in that both of the systems
involve flow of gas and solids between a fluidized bed at minimum fluidization
conditions and a dilute bed (a riser in an internally circulating fluidized bed and a stream
in the current case). The net rate of the particle exchange between two zones along the
fluidized bed is considered to be trivial. The correlation of Jeon et al. (2008) has been
used for this purpose:
0.520 0.795 0.728
3 05.327 10 pstor
mf mf or
dU uP
U U d
(5.17)
2 (1 )orp dis p mf or
st
SG C P
S (5.18)
In the above equations, the orifice refers to the point at the bottom of the bed that allows
for the exchange of gas and particles between the stream and non-stream zone. Since
there is no experimental data for Sor, this parameter has been considered as a tuning
factor.
For the pressure drop through the none-streaming zone which is considered to be at
minimum fluidization conditions, the pressure drop is assumed to be due to the mass of
the particle bed:
(1 )p g
dpg
dz (5.19)

Chapter 5 - Modeling Study of Gas Streaming in a Deep Fluidized Bed
153
5.4. Results and Discussions
The model predictions of pressure drop along the fluidized bed for a bed depth of 5 m are
provided in Fig. 5.1. As can be seen in the figure, the model predicts a lower pressure
drop immediately above the distributor for the non-stream zone compared to the case of
the stream zone. Therefore streams do not form in this region. However, the stream
pressure drop decreases dramatically with increasing distance from the distributor, which
makes the streams a preferable pathway for the gas. The higher pressure drop of the
stream at right over distributor is due to the much higher flow of gas and particles in the
stream compared to the non-stream zone. Similar trend of pressure drop has been
reported for the bottom of FCC risers (Pugsley and Berruti, 1996). As illustrated in the
figure, as the upper surface of the bed is approached, the difference between the pressure
drop of the streaming and non-streaming zones decreases. The result of this would be that
preferential flow of gas through the stream would be diminished, allowing gas to diffuse
into other parts of the bed and provide more uniform fluidization at upper regions. This is
consistent with visual observations from experiments, which showed improved
fluidization at the upper regions of the bed.
5.4.1. Effect of Bed Depth
Fig. 5.2 illustrates the differences between the pressure drops of stream and non-stream
pathways at the bottom of the fluidized bed for different bed depths. As can be seen, the
difference in the pressure drops of the two zones, which is considered to be the
motivation for the formation and stability of the streams, increases with increasing bed
depth. Experimentally we found that the onset of streaming flow occurred gradually in

Chapter 5 - Modeling Study of Gas Streaming in a Deep Fluidized Bed
154
the fluidized bed as bed depth was increased. According to the model results, this can be
attributed to the gradual increase of the difference in pressure drop between the streaming
and non-streaming zones. This difference is probably low enough in shallow beds that the
gas is able to fluidize all of the cross section and prevents the formation or permanence of
streaming flow.
5.4.2. Effect of Gas Velocity
Fig. 5.3 provides the axial profile of the pressure drop in the fluidized bed for different
superficial gas velocities. As model results provided in Fig. 5.3 illustrate, two changes
occur in the fluidized bed by increasing the gas velocity. Firstly, the difference between
the pressure drops of the streaming and non-streaming zones decreases and secondly, the
region expands above the distributor where streaming is not preferred or present. The
positive influence of increasing the gas velocity on diminishing the streaming flow has
been emphasized in all of the previous experimental works in the literature (Wells, 2001;
Karri et al., 2004; Issangya et al., 2007; Karimipour and Pugsley, 2010). As the figure
indicates, at gas velocities higher than 1 m/s streaming flow is not preferred anywhere in
the fluidized bed and uniform fluidization would be possible throughout the bed. It
should be noted that these high velocities are usually higher than the bubbling-turbulent
transition velocity for Geldart A particles at normal conditions. Therefore, although a
uniform fluidization may be achieved by increasing gas velocity, the bubbling regime
may be bypassed for deep fluidized beds.
5.4.3. Effect of Particle Size
Chapter 5 - Modeling Study of Gas Streaming in a Deep Fluidized Bed
155
Fig. 5.4 illustrates the axial profile of the pressure drop in the fluidized bed for different
particle sizes and a constant particle density of 1400 kg/m3. As can be seen, the pressure
drop in the stream increases by increasing the particle size. Thus, its preference as an
alternative pathway with lower pressure drop for gas decreases gradually. According to
the literature, streaming flow has only been reported for Geldart A particles; it does not
appear to exist for coarser Geldart B particles. The results show that the model is able to
predict this directional effect of increasing particle size.
5.4.4. Effect of Solid Circulating Rate
The stream pressure drop increases by increasing the solid circulating rate. Therefore,
increasing this parameter may delay the streaming flow by decreasing the preference of
streams over the non-stream regions. At the other hand, a lower value of solid circulating
rate increases the possibility of streaming. Fig. 5.5 shows the effect of 20% lower and
higher than the calculated value of solid circulating rate on the model predictions. As can
be seen, the trend of the results remains unchanged for different values of solid
circulating rate. Therefore, application of the presented correlation for solid circulating
rate seems to be sufficient for the qualitative analyses discussed here, until a correlation
for the solid circulation rate of the streaming fluidized beds is provided.
5.5. Conclusions
In the present work, gas streaming flow has been modeled in a deep fluidized bed of 5 m
bed depth and 0.3 m diameter. The model predictions have been qualitatively compared
and validated with the experimental findings. According to the model results, the stream

Chapter 5 - Modeling Study of Gas Streaming in a Deep Fluidized Bed
156
represents a low pressure drop region compared to other parts of the bed, which is the
most likely reason for the formation and stability of the streaming flow. The influence of
different parameters on the severity of the streaming flow is also evaluated with the
model. The model results show that increasing the bed depth favors the streaming flow,
while increasing the gas velocity increases the uniformity of the bed and decreases the
streaming severity. Streaming flow was found to be less severe for larger particle sizes.
All of these findings are in conformity with experimental investigations reported
previously in the literature.
5.6. References
Fox, R.W., McDonald, A.T., Pritchard, P.J., 2003. Introduction to fluid mechanics, 6th
edition; Wiley, New York.
Geldart, D., 1973. Types of gas fluidization. Powder Technology 7, 285-292.
Issangya, A., Knowlton, T., Karri, S.B.R., 2007. Detection of gas bypassing due to jet
streaming in deep fluidized beds of group A particles. In: Fluidization XII, Berruti, F., Bi,
X., Pugsley, T. (Eds.), Vancouver, British Columbia, Canada, May 13-17.
Jeon, J.H., Kima, S.D., Kim, S.J., Kang, Y., 2008. Solid circulation and gas bypassing
characteristics in a square internally circulating fluidized bed with draft tube. Chemical
Engineering and Processing 47, 2351-2360.
Kanno, H., Saito, S., 1969. Pneumatic conveying of solid through straight pipes, Journal
of Chemical Engineering of Japan 2, 211-217.
Karimipour, S., Pugsley, T., 2010. Study of gas streaming in a deep fluidized bed
containing Geldart’ Group A particles. Chemical Engineering Science 65, 3508-3517.
Chapter 5 - Modeling Study of Gas Streaming in a Deep Fluidized Bed
157
Karimipour, S., Mostoufi, N., Sotudeh-Gharebagh, R., 2006. Modeling the
hydrodynamics of downers by cluster-based approach. Industrial and Engineering
Chemistry Research 45, 7204-7209.
Karri, S.B.R., Issangya, A.S., Knowlton, M., 2004. Gas bypassing in deep fluidized beds.
In: Fluidization XI, Arena, U., Chirone, R., Miccio, M., Salatino, P. (Eds.), Ischia
(Naples), Italy, May 9-14.
Mostoufi, N. Chaouki, J., 1999. Prediction of effective drag coefficient in fluidized beds.
Chemical Engineering Science 54, 851-858.
Pugsley, T.S., Berruti F., 1996. A predictive hydrodynamic model for circulating
fluidized bed risers. Powder Technology 89, 57-69.
Wells, J., 2001. Streaming flow in large scale fluidization, Paper presented at the AIChE
annual meeting, Particle Technology Forum, Reno, Nevada, USA.
5.7. Nomenclature
Ap cross-sectional area of particle (m2)
Cdis gas discharge coefficient
CD effective drag coefficient
dp particle diameter (m)
dst stream diameter (m)
D fluidized bed diameter (m)
f drag coefficient correction factor
fp solid-wall friction factor
fg gas-wall friction factor

Chapter 5 - Modeling Study of Gas Streaming in a Deep Fluidized Bed
158
g acceleration of gravity (m/s2)
Gp solids flux (kg/m2s)
p pressure (Pa)
ΔPor orifice pressure drop (Pa)
Reg gas Reynolds number (D U0 ρg/μg)
Sor orifices cross sectional area (m2)
Sst stream cross sectional area (m2)
t time (s)
U0 superficial gas velocity (m/s)
Umf minimum fluidization velocity (m/s)
ust gas velocity in stream (m/s)
vp particle velocity (m/s)
Vp particle volume (m3)
z fluidized bed height above distributor (m)
Greek Letters
εg gas voidage
εp gas voidage
εmf voidage at minimum fluidization
ρg gas density (kg/m3)
ρp particle density (kg/m3)
μ gas viscosity (

Chapter 5 - Modeling Study of Gas Streaming in a Deep Fluidized Bed
159
0
1
2
3
4
5
6
0 5000 10000 15000 20000 25000 30000 35000
Pressure Drop (Pa)
Ax
ial P
os
itio
n (
m)
Non-Stream Zone
Stream Zone
Figure 5.1. Axial profile of the pressure drop in the fluidized bed, Bed depth = 5 m,
Superficial gas velocity = 0.2 m/s, Particle diameter = 84 microns

Chapter 5 - Modeling Study of Gas Streaming in a Deep Fluidized Bed
160
0
4000
8000
12000
16000
20000
0 1 2 3 4 5 6Bed Depth (m)
Pre
ss
ure
Dro
p (
Pa
)
Figure 5.2. Difference between the pressure drop of Stream and Non-Stream pathways at
the bottom of the fluidized bed for different bed depths, Superficial gas velocity = 0.2
m/s, Particle diameter = 84 microns

Chapter 5 - Modeling Study of Gas Streaming in a Deep Fluidized Bed
161
0
1
2
3
4
5
6
0 10000 20000 30000 40000 50000
Pressure Drop (Pa)
Ax
ial P
os
itio
n (
m)
Non-Stream Zone
Stream Zone, U0 = 0.2 (m/s)
Stream Zone, U0 = 0.4 (m/s)
Stream Zone, U0 = 0.6 (m/s)
Stream Zone, U0 = 0.8 (m/s)
Stream Zone, U0 = 1 (m/s)
Stream Zone, U0 = 1.2 (m/s)
Figure 5.3. Axial profile of the pressure drop in the fluidized bed for different superficial
gas velocities, Bed depth = 5 m, Particle diameter = 84 microns
Increasing gas velocity

Chapter 5 - Modeling Study of Gas Streaming in a Deep Fluidized Bed
162
0
1
2
3
4
5
6
0 5000 10000 15000 20000 25000 30000 35000
Pressure Drop (Pa)
Ax
ial P
os
itio
n (
m)
Non-Stream Zone
Stream Zone, Particle Ave. Diam. = 42 microns
Stream Zone, Particle Ave. Diam. = 84 microns
Stream Zone, Particle Ave. Diam. = 168 microns
Stream Zone, Particle Ave. Diam. = 252 microns
Figure 5.4. Axial profile of the pressure drop in the fluidized bed for different particle
sizes, Bed depth = 5 m, Superficial gas velocity = 0.2 m/s
Increasing particle diameter

Chapter 5 - Modeling Study of Gas Streaming in a Deep Fluidized Bed
163
0
1
2
3
4
5
6
0 5000 10000 15000 20000 25000 30000 35000Particle Size (microns)
Pre
ssu
re D
rop
(P
a)Non-Stream Zone
Stream Zone, Gs = 0.8 Calculated Gs
Stream Zone, Gs = Calculated Gs
Stream Zone, Gs = 1.2 Calculated Gs
Figure 5.5. Effect of variation of Gs on the axial profile of pressure drop in the fluidized
bed
Increasing Gs

Chapter 6 - Conclusions and Recommendations
164
CHAPTER 6 - Conclusions and Recommendations
6.1. Conclusions
The current project was designed and implemented to investigate the characteristics of
gas-streaming phenomenon with a combination of experimental and modeling
approaches. In the first phase of the experimental part, a series of experiments was
conducted to study the effect of bed depth, superficial gas velocity, fines content, and
distributor pressure drop on the streaming flow in a 0.3 m diameter fluidized bed. The
analysis of the pressure fluctuations time series for bed depths ranging from 40 to 160 cm
revealed that the normal bubbling fluidization is gradually compromised by increasing
the bed depth. This conclusion is based on the gradual increase of the autocorrelation
function, the decrease in the rate of decay of the autocorrelation function, and the
disappearance of the dominant frequency in the PSD graph with increasing bed depth.
The extent of streaming maldistribution was found to be non-uniform along the bed, with
the quality of fluidization improving with increasing the distance above the distributor
plate. Increasing the gas velocity from 10 to 50 Umf was found to delay the streaming
flow, likely due to the diffusion of additional gas into the poorly fluidized regions. This
effect was observed to be more prominent at lower gas velocities. The analyses illustrated

Chapter 6 - Conclusions and Recommendations
165
that increasing the fines content from 3% to 20% can decrease the severity of the
streaming flow. However, the improvement is not enough to solve the streaming problem.
Finally, analyses did not show any significant effect of distributor design on the
streaming phenomenon.
In order to further investigate the nature of streaming flow, several well-known
configurations of gas flow into the fluidized bed (forced streaming, and jetting flows) was
designed and compared to natural streaming flow in deep beds. The results of these
studies revealed that there is no significant difference between the configurations for a
fluidized bed with 40 cm bed depth. However, differences emerge by increasing the bed
depth to 160 cm. It was found that natural streaming in a deep fluidized bed closely
resembles the case of forced stream in which the gas flow is also present in the remaining
regions of the distributor. The jet flows without the primary gas flow could be considered
as the cases of severe streaming that might happen in very deep beds with possible
formation of completely non-fluidized regions. Application of supporting jets with
primary gas flow could enhance the fluidization quality to some extent. Increasing the
primary gas velocity from 10 to 50 Umf was found to reduce the effect of supporting jets.
It was also found that finer FCC particles provide a better fluidization quality. Wavelet
analysis showed that even in deep fluidized beds that are dominated by the streaming
flow, bubbling activity with the same dominant frequency as the shallow bed coexists,
although with a minor contribution. These findings suggested that the streaming flow can
be considered to form by increasing the relative importance of one of the available stream
of bubbles compared to others as the bed depth increases.

Chapter 6 - Conclusions and Recommendations
166
Further study of the streaming flow was undertaken with computational fluid dynamic
(CFD) simulations of the deep fluidized bed. In the present work, the commercial CFD
codes FLUENT and MFIX were initially tested for the modeling of deep fluidized bed of
Geldart A particles. However, simulation results did not show any sign of streaming flow
in the fluidized bed. Subsequently, the commercial CFD code BARRACUDATM that has
been claimed by the developers to be appropriate for this purpose, was tested. Due to the
lack of data on the performance of this code, a simple case of modeling a freely bubbling
fluidized bed of Geldart A particles was attempted first. For this purpose, four cases with
three different grid sizes and two drag models have been simulated using the PIC
approach. After simulating the bubbling fluidized bed, the bubble properties such as
bubble size distribution, bubble rise velocity and bubble frequency as well as bed
expansion and voidage profile have been calculated based on the simulation results. The
results have been compared with commonly accepted correlations as well as experimental
data provided in this work and from the literature. The results show a promising
prediction capability of the multiphase PIC approach without any kind of modification in
the drag model or other constituents of the model. The results indicate that although both
grid size and drag model affect the simulation results, the effect of drag model is
negligible compared to the effect of the grid size.
The BARRACUDA code was then used for simulating the deep fluidized bed of Geldart
A particles. However, similar to the previous CFD codes tested, instead of streaming
flow, bubbling fluidization was predicted. Therefore, a phenomenological model was

Chapter 6 - Conclusions and Recommendations
167
developed to better understand the streaming flow. According to the model results, the
stream represents a low pressure drop region compared to other parts of the bed, which is
the most likely reason for the formation and stability of the streaming flow. The influence
of different parameters on the severity of the streaming flow is also evaluated with the
model. The model results show that increasing the bed depth favors the streaming flow,
while increasing the gas velocity increases the uniformity of the bed and decreases the
streaming severity. Streaming flow was found to be less severe for larger particle sizes.
All of these findings are in conformity with experimental investigations reported
previously in the literature.
6.2. Recommendations
Many aspects of the gas streaming flow in deep fluidized beds of Geldart A particles have
been studied in the context of the present project. However, several areas still exist that
need to be investigated. Some of these proposed areas of research are:
Providing a series of pressure transducers along the column in at least two angles
and two radial positions. These arrangements enable us to simultaneously
compare the hydrodynamics of several regions of the inside of the bed and detect
possible non-uniformities. Also the pressure drop along the column in stream and
non-stream areas can be calculated and used for a quantitative evaluation of the
modeling results discussed in chapter 5.

Chapter 6 - Conclusions and Recommendations
168
Equipping the column with more elaborate solid recycling equipment such as a
series of external cyclones to be able to perform experiments at higher gas
velocities.
Repeating the experiments with other types of gas distributors, such as tuyers,
bubble caps and Dutch weaves and evaluate their effects on streaming flow.
One approach which is followed to enhance the flow of solids in stand-pipes is to
consider several aeration nozzles along the column. The effectiveness of this
approach and other approaches such as baffling in case of streaming flow can be
tested.
Fluidized beds have been frequently modeled by considering the emulsion and
bubble phases as a series of CSTR and plug flow reactors, respectively, in the
literature. This approach can be examined for modeling the streaming flow where
the properties of these two phases will be determined from the non-fluidized and
stream regions instead of emulsion and bubbles. The effect of streaming flow on
the conversion rate in the fluidized bed reactors can be investigated.
In the present study, only the pressure fluctuations measurement was used for
investigating the fluidized bed hydrodynamics. Other types of measurement
techniques which can provide more direct views of the hydrodynamic regimes in
the fluidized bed such as ECT, fiber optic and capacitance probes can be tested.

Chapter 6 - Conclusions and Recommendations
169
The CFD modeling of the streaming flow was followed as part of the present
study. Different commercial CFD softwares such as FLUENT, MFIX and
BARRACUDA in their original form were found to be unable to reveal the
streaming flow in deep fluidized beds. Some types of modifications such as
modifying the drag function and body force, as has been claimed by previous
authors to be appropriate for accounting the effect of inter-particle forces, were
attempted, but satisfactory results were not achieved. A separate project can be
defined on seeking the appropriate method to consider the effect of inter-particle
forces in one of the available CFD models to capture the streaming flow in deep
beds.
The effect of fines content of particles on the streaming flow was studied in the
present work. The effect of adding coarse particles can also be studied. It is clear
that coarser particles have a higher inter-particles pore size and voidage, thus gas
can better diffuse into a bed of these particles. Adding some of these particles into
the particle size distribution may enhance the uniform fluidization and decrease
the streaming flow. This claim should be investigated in future studies.
Effect of system pressure on the behavior of deep fluidized beds should be
studied.
Related Documents