École Doctorale : Sciences pour l’Ingénieur (ED353) Institut de Recherche sur les Phénomènes Hors Équilibre THÈSE DE DOCTORAT pour obtenir le grade de DOCTEUR de l’ÉCOLE CENTRALE de MARSEILLE Discipline : Mécanique et Physiques des Fluides GLOTTAL MOTION AND ITS IMPACT ON AIRFLOW AND AEROSOL DEPOSITION IN UPPER AIRWAYS DURING HUMAN BREATHING par SCHEINHERR Adam Directeur de thèse: BOIRON Olivier Co-encadrante de thèse: BAILLY Lucie Soutenue le 12 janvier 2015 devant le jury composé de : DARQUENNE Chantal Prof., University of California, San Diego, USA Rapporteur JÍCHA MIROSLAV Prof., Brno University of Technology, Czech republic Rapporteur ISABEY Daniel DR, INSERM, Paris, France MAURY Bertrand Prof., Université Paris-Sud, France PICHELIN Marine Dr., Air Liquide Healthcare, Jouy en Josas, France CAILLIBOTTE Georges Dr., Air Liquide Healthcare, Jouy en Josas, France BOIRON Olivier Prof., École Centrale de Marseille, France Directeur BAILLY Lucie CR, CNRS, Marseille, France Co-encadrante

Welcome message from author
This document is posted to help you gain knowledge. Please leave a comment to let me know what you think about it! Share it to your friends and learn new things together.
Transcript
École Doctorale : Sciences pour l’Ingénieur (ED353)
Institut de Recherche sur les Phénomènes Hors Équilibre
THÈSE DE DOCTORAT
pour obtenir le grade de
DOCTEUR de l’ÉCOLE CENTRALE de MARSEILLE
Discipline : Mécanique et Physiques des Fluides
GLOTTAL MOTION AND ITS IMPACT ON AIRFLOW ANDAEROSOL DEPOSITION IN UPPER AIRWAYS DURING
HUMAN BREATHING
par
SCHEINHERR Adam
Directeur de thèse: BOIRON Olivier
Co-encadrante de thèse: BAILLY Lucie
Soutenue le 12 janvier 2015
devant le jury composé de :
DARQUENNE Chantal Prof., University of California, San Diego, USA RapporteurJÍCHA MIROSLAV Prof., Brno University of Technology, Czech republic RapporteurISABEY Daniel DR, INSERM, Paris, FranceMAURY Bertrand Prof., Université Paris-Sud, FrancePICHELIN Marine Dr., Air Liquide Healthcare, Jouy en Josas, FranceCAILLIBOTTE Georges Dr., Air Liquide Healthcare, Jouy en Josas, FranceBOIRON Olivier Prof., École Centrale de Marseille, France DirecteurBAILLY Lucie CR, CNRS, Marseille, France Co-encadrante


To asthmatics.
GLOTTAL MOTION AND ITS IMPACT ON AIRFLOW AND AEROSOL DEPOSITION INUPPER AIRWAYS DURING HUMAN BREATHING
AbstractDuring inhaled therapies several factors limits the amount of drug delivered to the lungs. E.g.
the upper airways morphology and in particular the glottis, defined by the vocal-fold aperture,causes upper airways to narrow in a minimal cross section, which is determinant on aerosol depo-sition by inertial impaction. This thesis aims to (i) investigate evolution of the glottal area duringbreathing, and (ii) predict the effects of a dynamic glottis and realistic airflow conditions on theaerosol deposition in upper airways using three-dimensional simulations.
First, a clinical study was conducted on 20 healthy volunteers (10 males and 10 females) toexplore the glottal motion during several specific slow (below 20 cycles/min) and rapid breathingtasks (up to 90 cycles/min). The breathing was investigated simultaneously for the glottal areavariations using laryngoscopic video recordings and for airflow rate using oral flowmeter.
The experimental measurements showed that the glottal geometry observed during a breathingcycle can be extremely variable depending on the respiratory phase, tidal volume, and breathingfrequency. Testing the dynamic behaviour of the glottis during breathing, two groups of subjectswere identified: one with relatively constant glottal area and other with significant variations. Inaverage, the variations for the latter group of subjects was observed for males at 26% comparingmaximale and minimal glottal opening during inspiration and expiration respectively.
The results of the clinical study together with anatomical morphological data served to createa model with idealised geometry of upper airways. This model represents the major geometricalcharacteristics of upper airways with special interest in the glottal region. Transport and depositionof aerosols was studied using 3D numerical cyclic simulations and parametrical analysis allowed toevaluate the influence of the cyclic flow, glottal dynamics, type of carrier gas (air or helium-oxygenmixture) and particle size on the deposition of aerosols in the upper airways.
The numerical simulations demonstrated significant decrease of respiration work with He-O2
and jet-like flow with recirculation zone in the oro-pharynx and downstream the glottal plane. Theprincipal deposition mechanism is inertial impaction (for the particle diameters 1 - 10µm) withmost significant deposition region in the oro-pharynx. Important parameters for deposition arethe particle size and the nature of carrier gas. For He-O2 the deposition reaches two times smallervalues than for air and the fraction of deposited particles increases significantly with diameter,reaching 80% of deposited efficiency for 10µm particles. Finally, the CFD results demonstratednegligible differences in aerosol transport and deposition between different glottal characteristics.Therefore, in normal breathing conditions the glottal motion can be neglected.
Key wordsGlottal motion, respiration, flow, aerosol deposition, inhalation, upper airways, CFD simu-
lation, air, Helium-Oxygen mixture.

IMPACT DU MOUVEMENT GLOTTIQUE SUR L’ÉCOULEMENT ET LE DÉPÔTD’AÉROSOLS DANS LES VOIES AÉRIENNES SUPÉRIEURES LORS DE LA
RESPIRATION HUMAINE
Résumé La délivrance de médicaments lors de la mise en oeuvre de thérapies inhalées estdépendante de nombreux facteurs. Parmi ceux-ci la morphologie des voies aériennes supérieures(VAS) et en particulier celle de la région glottique est déterminante dans les mécanismes de dépôtde particules par impaction inertielle. Dans le cadre de ce travail, il est examiné d’une part ladynamique glottique durant différentes modalités de respiration et d’autre part déterminé numé-riquement l’effet de ces mouvements et des conditions de respiration associées sur le dépôt desaérosols dans les VAS.
Une étude clinique a été menée dans un premier temps sur un panel de 20 sujets sains (10 ho-mmes et 10 femmes) au sein du service ORL de l’hôpital de la Timone à Marseille pour déterminerle mouvement glottique durant différentes tâches de ventilation allant d’une respiration normaleavec moins de 20 cycles/min à une ventilation accélérée jusqu’à 90 cycles/min. L’acquisition desmouvements glottiques a été réalisée par imagerie numérique durant un examen de laryngoscopieavec mesure simultanée des débits associés aux différentes tâches de respiration.
Les mesures expérimentales montrent que la géométrie glottique varie pendant la respirationen fonction de la tâche de respiration, du volume courant et de la fréquence respiratoire. Uneétude statistique a permis d’isoler deux comportements types l’un où l’aire glottique demeuresensiblement constante durant la respiration et l’autre ou une variation de cette même aire estobservée. Sur ce dernier groupe d’individus la variation d’aire maximale observée sur les hommesest de 26%, l’ouverture maximale étant atteinte durant la phase d’inspiration et l’aire minimaledurant l’expiration.
Ces résultats, ainsi que des données anatomiques, ont permis de construire un modèle géo-métrique idéalisé des VAS. Ce modèle reproduit fidèlement les principales singularités des voiesextrathoraciques en apportant un grand soin à la description de la région glottique. Le transportet le dépôt d’aérosols dans ce modèle a été étudié en ayant recours à des simulations numériques3D de l’écoulement cyclique. Une étude paramétrique a permis d’évaluer l’influence sur le dépôtde l’écoulement cyclique, de la nature du gaz porteur (Air vs mélange d’hélium-oxygène), de laprise en compte de la dynamique glottique et de la taille des particules.
Les résultats mettent principalement en évidence une nette diminution de la part extratho-racique du travail respiratoire lors de l’emploi du mélange He-O2 et un écoulement de type jeten aval de la glotte durant l’inspiration associé à une recirculation sous le plancher glottique. Lemécanisme de dépôt principal étant l’impaction inertielle (pour les tailles des particules 1 - 10µm)le zone principale de dépôt est situé dans l’oropahrynx, quelles que soient les conditions pendantinspiration. La fraction de dépôt augmente rapidement avec le diamètre des particules atteignantprès de 80% pour les particules de 10µm et diminuer deux fois pour He-O2 en comparaison avec air.Finalement, la dynamique du dépôt ne varie pas de façon significative entre le modèle où la glotteest considérée comme statique et celle où elle est mobile. Donc, dans les conditions de respirationnormal le mouvement de la glotte peut être négligé.
Mot clésMouvement glottique, respiration, écoulement, dépôt des aérosols, inhalation, voies aériennes
supérieures, simulations CFD, air, mélange d’hélium-oxygène.
POHYB HLASIVEK A JEHO VLIV NA PROUDĚNÍ A DEPOZICI AEROSOLŮ BĚHEMDÝCHÁNÍ V HORNÍCH CESTÁCH DÝCHACÍCH
AbstraktÚčinnost inhalačních terapií může být ovlivněna několika faktory, které limitují distribuci ae-
rosolů do plic. Mezi ně patří například morfologie horních cest dýchacích a obzvláště hlasivek,které definují nejužší místo horních cest dýchacích, tzv. hlasivkovou štěrbinu. Tento region je tudížurčující pro depozici aerosolů vlivem setrvačného mechanismu. Cílem této disertační práce je (i)definovat pohyb hlasivek během dýchání a (ii) pomocí 3D numerických simulací predikovat vlivpohybu hlasivek a podmínek dýchání na depozici aerosolů v horních cestách dýchacích.
V první fázi této práce byla provedena klinická studie na 20 zdravých dobrovolnících (10 mužícha 10 žen) za účelem popsání pohybu hlasivek během uvolněného (pod 20 cyklů/min) a zrychle-ného (až 90 cyklů/min) dýchání. Během studie probíhala pozorování pohybu hlasivkové štěrbinyflexibilním laryngoskopem zároveň s měřením průtoku vzduchu orálním průtokoměrem.
Experimentální měření ukázaly, že pohyb hlasivek může být velice variabilní a záleží na decho-vém objemu a režimu a frekvenci dýchání. Studií dynamiky hlasivek během dýchání byly identi-fikovány dvě skupiny pacientů: první s relativně nepodstatným pohybem a druhá s významnýmpohybem hlasivek. U druhé skupiny pacientů byl pozorován porovnáním maxima při inspiraci aminima při exhalaci v průměru 26% rozdíl velikosti hlasivkové štěrbiny.
Experimentální výsledky a morfologická data umožnili vytvořit idealizovaný model s geometriíhorních cest dýchacích. Tento model reprezentuje hlavní geometrické charakteristiky horních cestdýchacích, se zvláštním detailem v oblasti hlasivek. Transport a depozice aerosolů byla studovánapomocí 3D numerických cyklických simulací a parametrické analýzy umožnily ohodnotit vliv cyk-lického proudění, pohybu hlasivek, typu nosného plynu (vzduch nebo helium-kyslíková směs) avelikosti částic na depozici aerosolů v horních cestách dýchacích.
CFD výsledky ukázaly výrazný pokles dýchací práce se směsí He-O2 a vzniku jet prouděnís recirkulačními oblastmi v oropharynxu a za hlasivkami. Hlavním depozičním mechanismem jepro studované velikosti částic (1 - 10µm) setrvačný mechanismus s nejvýznamnějším depozitnímregionem v oropharynxu. Důležitými parametry pro depozici je velikost částic a druh nosnéhoplynu. V případě He-O2 směsi depozice dosahuje 2krát nižších hodnot než pro vzduch a množstvídeponovaných aerosolů vzrůstá s velikostí partiklů, kdy dosahuje až 80% pro částice o velikosti10µm. Konečně, výsledky ukázaly zanedbatelný rozdíl v transportu a depozici aerosolů mezi dvěmazjištěnými druhy pohybu hlasivek. Proto, v případě uvolněného dýchání, pohyb hlasivek je možnozanedbat.
Klíčová slovaPohyb hlasivek, dýchání, proudění, depozice aerosolů, inhalace, horní cesty dýchací, CFD si-
mulace, vzduch, směs helia a kyslíku.
Contents
Abstract . . . . . . . . . . . . . . . . . . . . . . . . . . . . . . . . . . . . . . . . . . . . . . . . . 4
Preface 11
Part I General Context & Aims 15
I.1 Background and Motivation 21I.1.1 Respiratory System . . . . . . . . . . . . . . . . . . . . . . . . . . . . . . . . . . . . . . . . 21
I.1.1.1 Introduction . . . . . . . . . . . . . . . . . . . . . . . . . . . . . . . . . . . . . . . . 21I.1.1.2 Upper Airways and Laryngeal Morphology . . . . . . . . . . . . . . . . . . . . . . . 22
I.1.1.2.a Laryngeal Functions . . . . . . . . . . . . . . . . . . . . . . . . . . . . . . 24I.1.1.2.b Laryngeal kinematics . . . . . . . . . . . . . . . . . . . . . . . . . . . . . . 24I.1.1.2.c Laryngeal Major Dimensions . . . . . . . . . . . . . . . . . . . . . . . . . 26
I.1.1.3 Breathing Aerodynamics . . . . . . . . . . . . . . . . . . . . . . . . . . . . . . . . . 28I.1.1.3.a Nature of Gases Involved . . . . . . . . . . . . . . . . . . . . . . . . . . . 28I.1.1.3.b Lung Volumes and Capacities . . . . . . . . . . . . . . . . . . . . . . . . . 28I.1.1.3.c Breathing Flow Rates . . . . . . . . . . . . . . . . . . . . . . . . . . . . . 29
I.1.2 Lung Diseases and Aerosol Therapy . . . . . . . . . . . . . . . . . . . . . . . . . . . . . . 31I.1.2.1 Most Common Chronic Lung Diseases . . . . . . . . . . . . . . . . . . . . . . . . . 32
I.1.2.1.a Pathogenesis . . . . . . . . . . . . . . . . . . . . . . . . . . . . . . . . . . 32I.1.2.1.b Obstructive Lung Diseases . . . . . . . . . . . . . . . . . . . . . . . . . . . 32I.1.2.1.c Chronic Sinusitis . . . . . . . . . . . . . . . . . . . . . . . . . . . . . . . . 32
I.1.2.2 Aerosol Therapy . . . . . . . . . . . . . . . . . . . . . . . . . . . . . . . . . . . . . 33I.1.3 Fundamental Mechanics of Aerosol Transport and Deposition . . . . . . . . . . . . . . . . 33
I.1.3.1 Aerosol Geometrical and Physical Characteristics . . . . . . . . . . . . . . . . . . . 34I.1.3.1.a Particle Shape and Size . . . . . . . . . . . . . . . . . . . . . . . . . . . . 34I.1.3.1.b Aerosol Size Distribution . . . . . . . . . . . . . . . . . . . . . . . . . . . 34I.1.3.1.c Aerosol Hygroscopicity . . . . . . . . . . . . . . . . . . . . . . . . . . . . . 35I.1.3.1.d Inhalability of Particles in the Respiratory System . . . . . . . . . . . . . 36
I.1.3.2 Aerosol Transport . . . . . . . . . . . . . . . . . . . . . . . . . . . . . . . . . . . . . 37I.1.3.2.a Drag Force on Particle . . . . . . . . . . . . . . . . . . . . . . . . . . . . . 38I.1.3.2.b Stokes Number . . . . . . . . . . . . . . . . . . . . . . . . . . . . . . . . . 40I.1.3.2.c Settling velocity . . . . . . . . . . . . . . . . . . . . . . . . . . . . . . . . . 40
I.1.3.3 Aerosol Deposition . . . . . . . . . . . . . . . . . . . . . . . . . . . . . . . . . . . . 42I.1.3.3.a Inertial Impaction . . . . . . . . . . . . . . . . . . . . . . . . . . . . . . . 42I.1.3.3.b Turbulent mixing . . . . . . . . . . . . . . . . . . . . . . . . . . . . . . . . 43I.1.3.3.c Brownian Diffusion . . . . . . . . . . . . . . . . . . . . . . . . . . . . . . . 43I.1.3.3.d Sedimentation . . . . . . . . . . . . . . . . . . . . . . . . . . . . . . . . . 44I.1.3.3.e Interception . . . . . . . . . . . . . . . . . . . . . . . . . . . . . . . . . . . 44I.1.3.3.f Electrostatic Deposition . . . . . . . . . . . . . . . . . . . . . . . . . . . . 44
7
I.1.3.3.g Cloud Motion . . . . . . . . . . . . . . . . . . . . . . . . . . . . . . . . . . 44I.1.4 Current Clinical Needs and Challenges . . . . . . . . . . . . . . . . . . . . . . . . . . . . . 45
I.1.4.1 Adjustable Key Factors . . . . . . . . . . . . . . . . . . . . . . . . . . . . . . . . . 45I.1.4.1.a Carrier Gas . . . . . . . . . . . . . . . . . . . . . . . . . . . . . . . . . . . 45I.1.4.1.b Inhaled Flow Conditions . . . . . . . . . . . . . . . . . . . . . . . . . . . . 45
I.1.4.2 Unadjustable Key Factors . . . . . . . . . . . . . . . . . . . . . . . . . . . . . . . . 46
I.2 Impact of the Glottis During Breathing 49I.2.1 Glottal Motion Observed During Breathing . . . . . . . . . . . . . . . . . . . . . . . . . . 49
I.2.1.1 Characterization of the Glottal Kinematics . . . . . . . . . . . . . . . . . . . . . . . 50I.2.1.1.a Under Healthy Conditions . . . . . . . . . . . . . . . . . . . . . . . . . . . 50I.2.1.1.b Under Pathological Conditions . . . . . . . . . . . . . . . . . . . . . . . . 52
I.2.1.2 Measurement of Glottal Dimensions . . . . . . . . . . . . . . . . . . . . . . . . . . 53I.2.1.3 Relationship between Glottal Area and Airflow Rate . . . . . . . . . . . . . . . . . 55
I.2.2 Impact of the Glottis on Airflow in Upper Airways . . . . . . . . . . . . . . . . . . . . . . 56I.2.2.1 In Vitro Studies . . . . . . . . . . . . . . . . . . . . . . . . . . . . . . . . . . . . . . 56
I.2.2.1.a Phonation-related Studies . . . . . . . . . . . . . . . . . . . . . . . . . . . 56I.2.2.1.b Breathing-related Studies . . . . . . . . . . . . . . . . . . . . . . . . . . . 57
I.2.2.2 In Silico Studies . . . . . . . . . . . . . . . . . . . . . . . . . . . . . . . . . . . . . 61I.2.2.2.a Phonation-related Studies . . . . . . . . . . . . . . . . . . . . . . . . . . . 61I.2.2.2.b Breathing-related Studies . . . . . . . . . . . . . . . . . . . . . . . . . . . 62
I.2.3 Impact of the Glottis on Aerosol Transport and Deposition . . . . . . . . . . . . . . . . . 64I.2.3.1 In vivo Studies . . . . . . . . . . . . . . . . . . . . . . . . . . . . . . . . . . . . . . 64I.2.3.2 In vitro Studies . . . . . . . . . . . . . . . . . . . . . . . . . . . . . . . . . . . . . . 65I.2.3.3 In Silico Studies . . . . . . . . . . . . . . . . . . . . . . . . . . . . . . . . . . . . . 65
Summary and Aims 69
Part II Breathing Aerodynamics & Glottal Motion: In Vivo Study 71
II.3 Methodology 77II.3.1 Preliminary Experiments . . . . . . . . . . . . . . . . . . . . . . . . . . . . . . . . . . . . 77
II.3.1.1 Videoscopy & Air-flowrate measurements . . . . . . . . . . . . . . . . . . . . . . . 77II.3.1.2 Direct Transglottal Pressure Drop Measurements . . . . . . . . . . . . . . . . . . . 79
II.3.2 Clinical Study . . . . . . . . . . . . . . . . . . . . . . . . . . . . . . . . . . . . . . . . . . 80II.3.2.1 in vivo Recordings . . . . . . . . . . . . . . . . . . . . . . . . . . . . . . . . . . . . 80
II.3.2.1.a Subjects . . . . . . . . . . . . . . . . . . . . . . . . . . . . . . . . . . . . 80II.3.2.1.b Breathing Tasks & Database . . . . . . . . . . . . . . . . . . . . . . . . . 81II.3.2.1.c Measurements . . . . . . . . . . . . . . . . . . . . . . . . . . . . . . . . . 82
II.3.2.2 Data Processing . . . . . . . . . . . . . . . . . . . . . . . . . . . . . . . . . . . . . 83II.3.2.2.a Airflow-rate . . . . . . . . . . . . . . . . . . . . . . . . . . . . . . . . . . 83II.3.2.2.b Glottal Motion Detection . . . . . . . . . . . . . . . . . . . . . . . . . . . 84II.3.2.2.c Methodology Accuracy . . . . . . . . . . . . . . . . . . . . . . . . . . . . 87
II.4 Results 89II.4.1 Breathing Aerodynamics . . . . . . . . . . . . . . . . . . . . . . . . . . . . . . . . . . . . 89
II.4.1.1 General Airflow Features . . . . . . . . . . . . . . . . . . . . . . . . . . . . . . . . 89II.4.1.2 Breathing frequency . . . . . . . . . . . . . . . . . . . . . . . . . . . . . . . . . . . 91II.4.1.3 Breathing amplitude . . . . . . . . . . . . . . . . . . . . . . . . . . . . . . . . . . . 91
II.4.2 Glottal motion during breathing . . . . . . . . . . . . . . . . . . . . . . . . . . . . . . . . 92II.4.2.1 General Features . . . . . . . . . . . . . . . . . . . . . . . . . . . . . . . . . . . . . 93II.4.2.2 Influence of subject gender . . . . . . . . . . . . . . . . . . . . . . . . . . . . . . . 97
8
II.4.2.2.a "Static" and "dynamic" group of subjects . . . . . . . . . . . . . . . . . . 97II.4.2.2.b Glottal motion amplitudes & time-variations . . . . . . . . . . . . . . . . 97
II.4.2.3 Influence of breathing task . . . . . . . . . . . . . . . . . . . . . . . . . . . . . . . 97II.4.2.4 Correlation between airflow rate pattern & glottal motion . . . . . . . . . . . . . . 98
II.4.3 Discussion . . . . . . . . . . . . . . . . . . . . . . . . . . . . . . . . . . . . . . . . . . . . 99II.4.3.1 Towards the reasons for glottal motion and aerodynamics . . . . . . . . . . . . . . 99II.4.3.2 Towards the aerodynamic impact of glottal motion . . . . . . . . . . . . . . . . . . 102
Summary 105
Part III Flow & Aerosol Transport in Upper Airways: In Silico Study 107
III.5 Preliminary CFD Models with Mobile Glottis and Unsteady Breathing Conditions113III.5.1 Geometry . . . . . . . . . . . . . . . . . . . . . . . . . . . . . . . . . . . . . . . . . . . . 114III.5.2 Solution Method . . . . . . . . . . . . . . . . . . . . . . . . . . . . . . . . . . . . . . . . 115
III.5.2.1 Mechanical model . . . . . . . . . . . . . . . . . . . . . . . . . . . . . . . . . . . . 115III.5.2.2 Numerical method . . . . . . . . . . . . . . . . . . . . . . . . . . . . . . . . . . . 116III.5.2.3 Simulation setting . . . . . . . . . . . . . . . . . . . . . . . . . . . . . . . . . . . 117
III.5.3 Initial & Boundary Conditions . . . . . . . . . . . . . . . . . . . . . . . . . . . . . . . . 118III.5.4 Mesh Properties . . . . . . . . . . . . . . . . . . . . . . . . . . . . . . . . . . . . . . . . 125III.5.5 Results . . . . . . . . . . . . . . . . . . . . . . . . . . . . . . . . . . . . . . . . . . . . . . 127
III.5.5.1 Study of Flow in Case 1 & 2 . . . . . . . . . . . . . . . . . . . . . . . . . . . . . . 127III.5.5.2 Aerosol Deposition . . . . . . . . . . . . . . . . . . . . . . . . . . . . . . . . . . . 130
III.6 3D CFD Model of Upper Airways with Mobile Glottis and Unsteady BreathingConditions 137III.6.1 Geometry . . . . . . . . . . . . . . . . . . . . . . . . . . . . . . . . . . . . . . . . . . . . 137
III.6.1.1 3D upper airways idealized geometry . . . . . . . . . . . . . . . . . . . . . . . . . 137III.6.1.2 3D Laryngeal region idealized geometry . . . . . . . . . . . . . . . . . . . . . . . 139
III.6.2 Solution Method . . . . . . . . . . . . . . . . . . . . . . . . . . . . . . . . . . . . . . . . 142III.6.2.1 Mechanical flow model . . . . . . . . . . . . . . . . . . . . . . . . . . . . . . . . . 142III.6.2.2 Discrete Phase Model . . . . . . . . . . . . . . . . . . . . . . . . . . . . . . . . . 143
III.6.2.2.a Inertial impaction . . . . . . . . . . . . . . . . . . . . . . . . . . . . . . 144III.6.2.2.b Turbulent mixing . . . . . . . . . . . . . . . . . . . . . . . . . . . . . . . 145III.6.2.2.c Brownian diffusion . . . . . . . . . . . . . . . . . . . . . . . . . . . . . . 145III.6.2.2.d Sedimentation . . . . . . . . . . . . . . . . . . . . . . . . . . . . . . . . 147
III.6.2.3 Numerical method . . . . . . . . . . . . . . . . . . . . . . . . . . . . . . . . . . . 147III.6.2.4 Simulation setting . . . . . . . . . . . . . . . . . . . . . . . . . . . . . . . . . . . 148
III.6.3 Initial & Boundary Conditions . . . . . . . . . . . . . . . . . . . . . . . . . . . . . . . . 148III.6.4 Mesh Properties . . . . . . . . . . . . . . . . . . . . . . . . . . . . . . . . . . . . . . . . 152
III.6.4.1 Grid dependence . . . . . . . . . . . . . . . . . . . . . . . . . . . . . . . . . . . . 152III.6.4.2 Quality of Dynamic mesh . . . . . . . . . . . . . . . . . . . . . . . . . . . . . . . 154
III.7 CFD Results 157III.7.1 Pressure Drop Dynamics . . . . . . . . . . . . . . . . . . . . . . . . . . . . . . . . . . . . 157III.7.2 Airflow Dynamics . . . . . . . . . . . . . . . . . . . . . . . . . . . . . . . . . . . . . . . . 159
III.7.2.1 General Flow Features in the Upper Airways . . . . . . . . . . . . . . . . . . . . 160III.7.2.1.a Velocity Magnitude Contours . . . . . . . . . . . . . . . . . . . . . . . . 160III.7.2.1.b Turbulence Kinetic Energy . . . . . . . . . . . . . . . . . . . . . . . . . 162III.7.2.1.c Wall Shear Stress . . . . . . . . . . . . . . . . . . . . . . . . . . . . . . . 163
III.7.2.2 Laryngeal jet under different breathing conditions . . . . . . . . . . . . . . . . . . 165III.7.3 Aerosol Deposition . . . . . . . . . . . . . . . . . . . . . . . . . . . . . . . . . . . . . . . 169
9
III.7.3.1 Effects of non-steady airflow . . . . . . . . . . . . . . . . . . . . . . . . . . . . . . 169III.7.3.2 Deposition spots within the model . . . . . . . . . . . . . . . . . . . . . . . . . . 171III.7.3.3 Impact of steady and dynamic glottal variations in the trachea region . . . . . . 174III.7.3.4 Summary on deposition results within the upper airways for the 6 cases . . . . . 176
Summary 183
Conclusions 185
Bibliography 208
Annexes 209
Annex A - Instruction Interface for Clinical Study 211
Annex B - 2D Model 213Geometry . . . . . . . . . . . . . . . . . . . . . . . . . . . . . . . . . . . . . . . . . . . . . 213Mesh Properties . . . . . . . . . . . . . . . . . . . . . . . . . . . . . . . . . . . . . . . . . 213Solution Method . . . . . . . . . . . . . . . . . . . . . . . . . . . . . . . . . . . . . . . . . 215Boundary Conditions . . . . . . . . . . . . . . . . . . . . . . . . . . . . . . . . . . . . . . . 216Results . . . . . . . . . . . . . . . . . . . . . . . . . . . . . . . . . . . . . . . . . . . . . . . 218
Case 1 - Steady glottal geometry . . . . . . . . . . . . . . . . . . . . . . . . . . . . 218Case 2 - Moving glottal geometry . . . . . . . . . . . . . . . . . . . . . . . . . . . . 218
Annex C - User Defined Functions 221UDF - Glottal Motion . . . . . . . . . . . . . . . . . . . . . . . . . . . . . . . . . . . . . . . . . 222UDF - Subglottal Motion . . . . . . . . . . . . . . . . . . . . . . . . . . . . . . . . . . . . . . . 224
10
Pursuing a PhD is both painful and enjoyable experience. It is like climbing a high peak, step by step,accompanied with bitterness, hardship, encouragement and trust. When I found myself at the top
enjoying the beautiful scenery, I realized that it was the teamwork that got me here. Thus, I would liketo express my gratitude to all those who gave me the possibility to complete this thesis.
I am deeply indebted to my supervisors Doctor Lucie Bailly and Professor Olivier Boiron. Theirguidance has made this a thoughtful and rewarding journey. I am thankful for the constant trust,
invaluably constructive criticism and friendly advice during the research work and writing of my thesis.Even through the language and cultural barrier they had always patience and understanding. Theirencouragement was the driving force of my research. I always ended up with confidence and full of
energy after our discussions.
I am also very grateful to our colleagues from Air Liquide company Doctor Marine Pichelin, DoctorGeorges Caillibotte, Doctor Ira Katz and Benoit Piednoir for their constant availability in the most
difficult steps of my thesis. I gratefully acknowledge Air Liquid for the funding that made my PhD workpossible.
A great deal of the work was carried out in the collaboration with Doctor Aude Lagier, who gavefundamental scientific contribution to the clinical study. Also I would like to thank Thierry Legou for
his willing assistance and availability and I can’t forget to mention all 20 volunteers participating in thisstudy.
A special thank to Professor Chantal Darquenne and Doctor Jan Jedelský, for their valuable suggestionsand discussions during our meetings.
Many thanks to the scientists but also my great friends from our laboratory Yannick, Marjorie, Eric,Wei, Lionel, Jonathan and Guillaume.
I can’t forget to explicit my love to all my Marseille friends Giova, Franchi, Elisa, Luca, Olivia, Floris,Fulvia, Brunella, Jessica, Zdenko, Dimitri, Karim.
A heartfelt thanks goes out to my girlfriend Cecilia for all her love, support and patience when I wasonly thinking about glottal images. Moreover, I can’t forget her enormous help and precious discussions
in the field of aerosol research.
Last, but not least, my family had to grudgingly learn to accept my separation from them and still gaveme nothing but support, day after day, my love and gratitude for them can hardly be expressed in words.
PS: I can’t forget my bicycle, for the whole three years carrying me everydayto the laboratory and passing with me over 12 000 kilometers. :-)
11

12

Preface
13

15
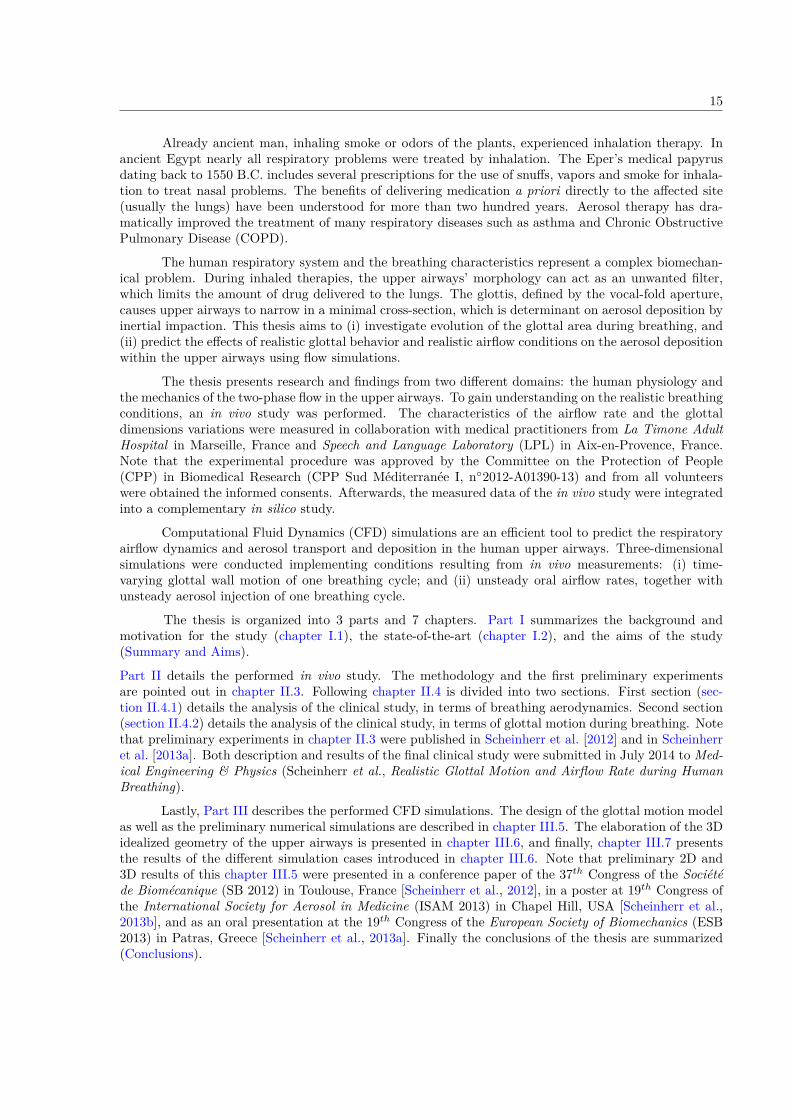
Already ancient man, inhaling smoke or odors of the plants, experienced inhalation therapy. Inancient Egypt nearly all respiratory problems were treated by inhalation. The Eper’s medical papyrusdating back to 1550 B.C. includes several prescriptions for the use of snuffs, vapors and smoke for inhala-tion to treat nasal problems. The benefits of delivering medication a priori directly to the affected site(usually the lungs) have been understood for more than two hundred years. Aerosol therapy has dra-matically improved the treatment of many respiratory diseases such as asthma and Chronic ObstructivePulmonary Disease (COPD).
The human respiratory system and the breathing characteristics represent a complex biomechan-ical problem. During inhaled therapies, the upper airways’ morphology can act as an unwanted filter,which limits the amount of drug delivered to the lungs. The glottis, defined by the vocal-fold aperture,causes upper airways to narrow in a minimal cross-section, which is determinant on aerosol deposition byinertial impaction. This thesis aims to (i) investigate evolution of the glottal area during breathing, and(ii) predict the effects of realistic glottal behavior and realistic airflow conditions on the aerosol depositionwithin the upper airways using flow simulations.
The thesis presents research and findings from two different domains: the human physiology andthe mechanics of the two-phase flow in the upper airways. To gain understanding on the realistic breathingconditions, an in vivo study was performed. The characteristics of the airflow rate and the glottaldimensions variations were measured in collaboration with medical practitioners from La Timone AdultHospital in Marseille, France and Speech and Language Laboratory (LPL) in Aix-en-Provence, France.Note that the experimental procedure was approved by the Committee on the Protection of People(CPP) in Biomedical Research (CPP Sud Méditerranée I, n2012-A01390-13) and from all volunteerswere obtained the informed consents. Afterwards, the measured data of the in vivo study were integratedinto a complementary in silico study.
Computational Fluid Dynamics (CFD) simulations are an efficient tool to predict the respiratoryairflow dynamics and aerosol transport and deposition in the human upper airways. Three-dimensionalsimulations were conducted implementing conditions resulting from in vivo measurements: (i) time-varying glottal wall motion of one breathing cycle; and (ii) unsteady oral airflow rates, together withunsteady aerosol injection of one breathing cycle.
The thesis is organized into 3 parts and 7 chapters. Part I summarizes the background andmotivation for the study (chapter I.1), the state-of-the-art (chapter I.2), and the aims of the study(Summary and Aims).
Part II details the performed in vivo study. The methodology and the first preliminary experimentsare pointed out in chapter II.3. Following chapter II.4 is divided into two sections. First section (sec-tion II.4.1) details the analysis of the clinical study, in terms of breathing aerodynamics. Second section(section II.4.2) details the analysis of the clinical study, in terms of glottal motion during breathing. Notethat preliminary experiments in chapter II.3 were published in Scheinherr et al. [2012] and in Scheinherret al. [2013a]. Both description and results of the final clinical study were submitted in July 2014 to Med-ical Engineering & Physics (Scheinherr et al., Realistic Glottal Motion and Airflow Rate during HumanBreathing).
Lastly, Part III describes the performed CFD simulations. The design of the glottal motion modelas well as the preliminary numerical simulations are described in chapter III.5. The elaboration of the 3Didealized geometry of the upper airways is presented in chapter III.6, and finally, chapter III.7 presentsthe results of the different simulation cases introduced in chapter III.6. Note that preliminary 2D and3D results of this chapter III.5 were presented in a conference paper of the 37th Congress of the Sociétéde Biomécanique (SB 2012) in Toulouse, France [Scheinherr et al., 2012], in a poster at 19th Congress ofthe International Society for Aerosol in Medicine (ISAM 2013) in Chapel Hill, USA [Scheinherr et al.,2013b], and as an oral presentation at the 19th Congress of the European Society of Biomechanics (ESB2013) in Patras, Greece [Scheinherr et al., 2013a]. Finally the conclusions of the thesis are summarized(Conclusions).

16

Part I
General Context & Aims
17


I.1 Background and Motivation 21I.1.1 Respiratory System . . . . . . . . . . . . . . . . . . . . . . . . . . . . . . . . . . . . . . . . 21
I.1.1.1 Introduction . . . . . . . . . . . . . . . . . . . . . . . . . . . . . . . . . . . . . . . . 21I.1.1.2 Upper Airways and Laryngeal Morphology . . . . . . . . . . . . . . . . . . . . . . . 22I.1.1.3 Breathing Aerodynamics . . . . . . . . . . . . . . . . . . . . . . . . . . . . . . . . . 28
I.1.2 Lung Diseases and Aerosol Therapy . . . . . . . . . . . . . . . . . . . . . . . . . . . . . . 31I.1.2.1 Most Common Chronic Lung Diseases . . . . . . . . . . . . . . . . . . . . . . . . . 32I.1.2.2 Aerosol Therapy . . . . . . . . . . . . . . . . . . . . . . . . . . . . . . . . . . . . . 33
I.1.3 Fundamental Mechanics of Aerosol Transport and Deposition . . . . . . . . . . . . . . . . 33I.1.3.1 Aerosol Geometrical and Physical Characteristics . . . . . . . . . . . . . . . . . . . 34I.1.3.2 Aerosol Transport . . . . . . . . . . . . . . . . . . . . . . . . . . . . . . . . . . . . . 37I.1.3.3 Aerosol Deposition . . . . . . . . . . . . . . . . . . . . . . . . . . . . . . . . . . . . 42
I.1.4 Current Clinical Needs and Challenges . . . . . . . . . . . . . . . . . . . . . . . . . . . . . 45I.1.4.1 Adjustable Key Factors . . . . . . . . . . . . . . . . . . . . . . . . . . . . . . . . . 45I.1.4.2 Unadjustable Key Factors . . . . . . . . . . . . . . . . . . . . . . . . . . . . . . . . 46
I.2 Impact of the Glottis During Breathing 49I.2.1 Glottal Motion Observed During Breathing . . . . . . . . . . . . . . . . . . . . . . . . . . 49
I.2.1.1 Characterization of the Glottal Kinematics . . . . . . . . . . . . . . . . . . . . . . . 50I.2.1.2 Measurement of Glottal Dimensions . . . . . . . . . . . . . . . . . . . . . . . . . . 53I.2.1.3 Relationship between Glottal Area and Airflow Rate . . . . . . . . . . . . . . . . . 55
I.2.2 Impact of the Glottis on Airflow in Upper Airways . . . . . . . . . . . . . . . . . . . . . . 56I.2.2.1 In Vitro Studies . . . . . . . . . . . . . . . . . . . . . . . . . . . . . . . . . . . . . . 56I.2.2.2 In Silico Studies . . . . . . . . . . . . . . . . . . . . . . . . . . . . . . . . . . . . . 61
I.2.3 Impact of the Glottis on Aerosol Transport and Deposition . . . . . . . . . . . . . . . . . 64I.2.3.1 In vivo Studies . . . . . . . . . . . . . . . . . . . . . . . . . . . . . . . . . . . . . . 64I.2.3.2 In vitro Studies . . . . . . . . . . . . . . . . . . . . . . . . . . . . . . . . . . . . . . 65I.2.3.3 In Silico Studies . . . . . . . . . . . . . . . . . . . . . . . . . . . . . . . . . . . . . 65
Summary and Aims 69

20 TABLE DES MATIÈRES

NOMENCLATURE
Overline indicates time average.
Ag glottal area [mm2]AE
g the mean glottal area obtained during expiration [mm2]AI
g the mean glottal area obtained during inspiration [mm2]c the average molecular velocity of the air [m/s]
APg antero-posterior glottal diameter (glottal length) [mm2]Cc the Cunningham slip correction factorCC the BTPS conversion coefficient [-]CD drag coefficientDa particle aerodynamic diameter [m]De particle equivalent diameter [m]Dg particle geometric diameter [m]Dh hydraulic diameter [m]Ds particle Stokes diameter [m]Dp particle diameter [m]Ei impaction efficiencyf breathing frequency [Hz]FD drag force [N]g gravitational acceleration [m/s2]k Boltzmann constant (1.38× 10⁻²³ J·K−1)`T turbulence length scalel length referring to dimensions of the model
mp particle mass [g]nz number of collisions [-]P penetration [%]Pa ambient pressure [Pa]
PEAg the mean Peak Expiratory Area of glottis [mm2]PEF the maximum flow rate during exhalation [L/min]PIAg the mean Peak Inspiratory Area of glottis [mm2]PIF the maximum flow rate during inhalation [L/min]Pws the saturation pressure of water vapor [Pa]Q flowrate [L/min]R2 linear regressionRe Reynolds number [-]Rep relative Reynolds number of a particle [-]Stk Stokes number [-]Ta ambient temperature [K]TE expiratory period [s]TI inspiratory period [s]Tt 1 breathing cycle period [s]
22 TABLE DES MATIÈRES
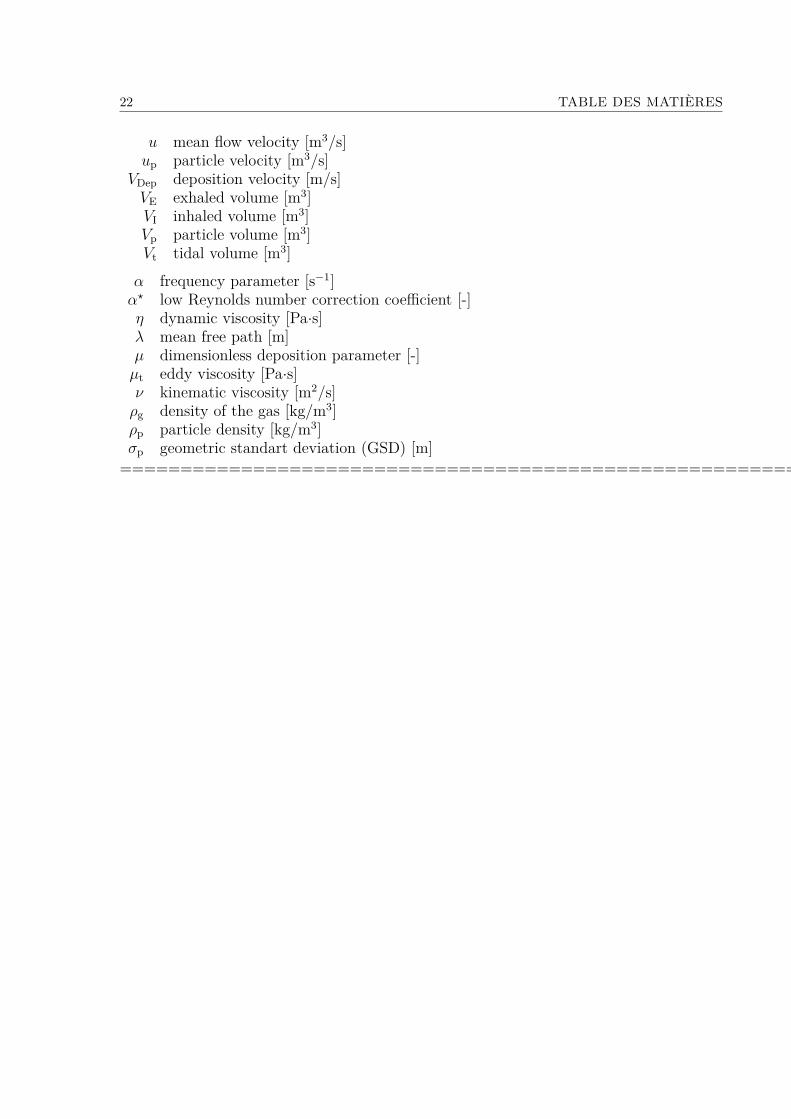
u mean flow velocity [m3/s]up particle velocity [m3/s]
VDep deposition velocity [m/s]VE exhaled volume [m3]VI inhaled volume [m3]Vp particle volume [m3]Vt tidal volume [m3]
α frequency parameter [s−1]α? low Reynolds number correction coefficient [-]η dynamic viscosity [Pa·s]λ mean free path [m]µ dimensionless deposition parameter [-]µt eddy viscosity [Pa·s]ν kinematic viscosity [m2/s]ρg density of the gas [kg/m3]ρp particle density [kg/m3]σp geometric standart deviation (GSD) [m]
===================================================================
Chapter I.1
Background and Motivation
1.1 Respiratory System
1.1.1 Introduction
This section provides a general description of the respiration process in humans. In phys-iology, the term "respiration" is defined as transport of Oxygen (O2) from the ambientair to the cells within tissues and transport of Carbon dioxide (CO2) in the oppositedirection. The respiratory system is responsible for gas transfer between the tissues andthe atmospheric air. Carbon dioxide produced by metabolism in the tissues is moved bythe blood to the lungs where it is lost to the outside air. Oxygen that is supplied to thetissues is extracted from the outside air by the lungs. Atmospheric air is pumped in andout regularly through a network of pipes, called conducting airways, which connect thegas-exchange region inside the body with the environment outside the body.
The term "breathing", also referred as "ventilation" in organisms with lungs, is a part ofrespiration and considers the inhalation and exhalation of the gas inside and outside ofthe lungs. The diaphragm, as the main respiratory muscle, and the intercostal muscles ofthe chest wall play an essential role by generating, under the control of the central nervoussystem, the pumping action of the lung. The muscles expand and contract the internalspace of the thorax, whose bony framework is formed by the ribs and the thoracic vertebrae[Rogers, 2011]. Therefore, breathing is an automated function in which nerve impulsessent from the brain stimulate the respiratory muscles to contract, thereby producing themechanical forces associated with inhalation and exhalation.The nose, mouth, pharynx, larynx, trachea, bronchial trees, lung air sacs and respiratorymuscles are the structures that make up the respiratory system (see Figure I.1.1). Therespiratory system can be divided into three regions, each consisting of several anatomicalunits:
i. the first region is the "upper airways" (UA) region, also referred as the extra-thoracicregion,
23

24 CHAPTER I.1. BACKGROUND AND MOTIVATION
ii. the second is the "tracheobronchial" region, which includes the airways from thetrachea to the terminal bronchioles,
iii. and the last is the "alveolar" region, where proceeds the gas exchange.
These regions differ in airways structure, airflow patterns, function, retention time, andsusceptibility to deposited inhaled aerosols. Readers interested in more detailed reviewscan consult following works [West, 2007, 2008; Cotes et al., 2009].
In this thesis, focus is given to the flow dynamics occurring in the "upper airways" re-gion during breathing, and specifically in the laryngeal area. The next part providesphysiological and anatomical details on this area.
Figure I.1.1: Frontal view of the respiratory system (from Stocks and Hislop [2001]).
1.1.2 Upper Airways and Laryngeal Morphology
The upper airways have a complex geometry (see Figure I.1.1), that includes followingcomponents:
• the "oral cavity", sometimes called also the buccal cavity,
I.1.1. RESPIRATORY SYSTEM 25
• the "nasal cavity", comprising the nose and paranasal cavities (sinuses),
• the "pharynx", divided into two parts including the pathway from the mouth to thelarynx (oropharynx) and the nose (nasopharynx);
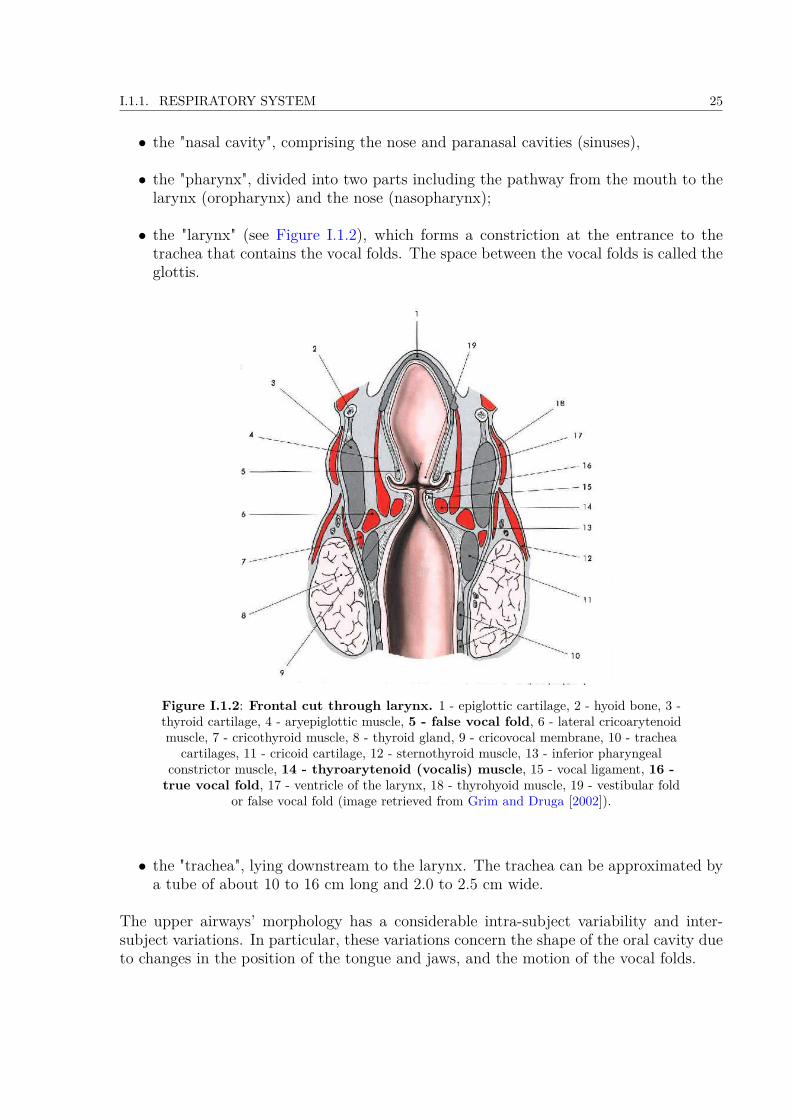
• the "larynx" (see Figure I.1.2), which forms a constriction at the entrance to thetrachea that contains the vocal folds. The space between the vocal folds is called theglottis.
Figure I.1.2: Frontal cut through larynx. 1 - epiglottic cartilage, 2 - hyoid bone, 3 -thyroid cartilage, 4 - aryepiglottic muscle, 5 - false vocal fold, 6 - lateral cricoarytenoidmuscle, 7 - cricothyroid muscle, 8 - thyroid gland, 9 - cricovocal membrane, 10 - trachea
cartilages, 11 - cricoid cartilage, 12 - sternothyroid muscle, 13 - inferior pharyngealconstrictor muscle, 14 - thyroarytenoid (vocalis) muscle, 15 - vocal ligament, 16 -true vocal fold, 17 - ventricle of the larynx, 18 - thyrohyoid muscle, 19 - vestibular fold
or false vocal fold (image retrieved from Grim and Druga [2002]).
• the "trachea", lying downstream to the larynx. The trachea can be approximated bya tube of about 10 to 16 cm long and 2.0 to 2.5 cm wide.
The upper airways’ morphology has a considerable intra-subject variability and inter-subject variations. In particular, these variations concern the shape of the oral cavity dueto changes in the position of the tongue and jaws, and the motion of the vocal folds.

26 CHAPTER I.1. BACKGROUND AND MOTIVATION
a/ Laryngeal Functions
The larynx is an organ of complex structure, displayed on Figure I.1.2. It serves threephysiological functions [Hoh, 2010]:• a respiratory function, as an air canal to the lungs. During inspiration, the air passesalong the epiglottic cartilage, and further around a pair of "false" and "true" vocalfolds.• an airway protective function, which is phylogenetically the oldest function. Thisfunction is ensured during coughing, sneezing and swallowing. In that case, theepiglottis swings down and covers the opening into the larynx to avoid the aspirationof liquids or food into the lungs.• a vocal function, as the organ of phonation.
b/ Laryngeal kinematics
Movements and muscular activity The main movement within the larynx is opening andclosing of the glottis as displayed in Figure I.1.3. The vocal-fold movement is composedof rotation and translation of the arytenoids cartilages, in cricoarytenoids joints.
(a) Action of the posterior crico-arytenoidmuscle - abduction of the vocal ligaments.
(b) Action of the inter-arytenoid muscle -adduction of the vocal ligaments.
Figure I.1.3: Superior view of the vocal folds movement (from [Hansen and Koeppen,2002]). Note the crico-arytenoid joint action in abduction (left) and adduction (right).
The tension, altering the length and spatial orientation of the true vocal cords is managedby the intrinsic laryngeal muscles. Those are traditionally divided into three groups:vocal-fold adductors, one abductor and one tensor muscle. To the adductors belong:

I.1.1. RESPIRATORY SYSTEM 27
• the lateral cricoarytenoid muscle (see Figure I.1.2, point #6 ),• the thyroarytenoid muscle (see Figure I.1.2, point #14 ), which besides closing thevocal folds also modulates the sound quality,• and the inter-arytenoid muscle (see Figure I.1.3b), which is found in the interary-tenoid fold (see Figure I.1.4, point #5 ).
The tensor muscle is the cricothyroid muscle (see Figure I.1.2, point #7 ). The abductormuscle is the posterior cricoarytenoid (PCA) muscle (see Figure I.1.3a), thereby princi-pally responsible for the control of the glottis (see Figure I.1.4).
Figure I.1.4: Laryngoscopic image (example of indirect laryngoscopy). 1 -epiglottis, 2 - aryepiglottic fold, 3 - cuneiform tubercle, 4 - arytenoid (corniculate
tubercle), 5 - interarytenoid fold, 6 - true vocal fold, 7 - false vocal fold, 8 - glottis(from Grim and Druga [2002]).
The cricothyroid muscle is innervated by the superior laryngeal nerve, while all the othersare innervated by the recurrent laryngeal nerve. Laryngeal muscles control breathing byadjusting the resistance to airflow to match respiratory frequency. The PCA dilates theglottis during inspiration to reduce the load on respiratory muscles, while the adductorscontract during expiration to regulate expiratory airflow (see review of Hoh [2005]). Theactivity of these muscles is modulated by pressure receptors in the laryngeal mucosa[Sammon et al., 1993; Stella and England, 2001].
Means of Investigation The first in vivo observation of the glottal motion dates back tothe 19th century, with Garcia’s laryngeal mirror created in 1855 (see review of Henrich[2006]). The principle is displayed on Figure I.1.4. Thereby, one of the first studiesdescribing the respiratory function of human larynx was done by Hooper [1885]. Fromthe 1880s to the present time, the advances in the medical equipment have allowed arefined exploration of the vocal-fold dynamics, to characterize the vocal-fold vibrations

28 CHAPTER I.1. BACKGROUND AND MOTIVATION
during phonation (see a review of Ziethe et al. [2011]) or their movement during breathing(see a review of Faber and Grymer [2003]). However, the vocal-fold specific anatomicallocation, surrounded by many laryngeal cartilages, makes them hardly discernible withultrasound medical imaging. Instead, the current means of investigation are commonlyreferred as either "direct" or "indirect" tools, as follows:
• Direct investigation tools are used to perform invasive laryngoscopy [Karnell, 1989;Ouaknine et al., 2000; Švec et al., 2000], i.e., a visual examination of the vocal foldsthanks to a source of light and camera optics inserted in a tube. There are twotypes of laryngoscopies, using either a rigid endoscope inserted in the mouth, or aflexible nasofiberscope. Implemented transnasaly, the latter consists of bundles withflexible glassfibres conducting the image to camera optics and additional fiber to carrylight from an external source. According to the spatio-temporal resolutions chosenduring the examination mode (from 25 frames/s up to 10000 frames/s - full image orselected line), different methods can be conducted: classical videolaryngostroboscopy[Jackson et al., 1975; Baier et al., 1977; England and Bartlett, 1982; Brancatisanoet al., 1983; Chen et al., 2013], high-speed cinematography [Childers et al., 1983, 1990;Bailly et al., 2010; Karakozoglou et al., 2012; Bailly et al., 2014], or videokymography[Švec and Schutte, 1996; Švec et al., 1999]. Aside from this classical tools in thevoice scientific community, note that some recent studies rely on the use of MagneticResonance Imaging (MRI) [Pritchard and McRobbie, 2004].
• Indirect investigation tools do not allow a visual examination of the vocal folds.Instead, they yield to other quantities, measurable non-invasively, and related eitherto the vocal-fold contact variations - like electroglottography [Fourcin and Abberton,1971; Rothenberg, 1992; Orlikoff, 1998] or photoglottography [Hess and Ludwigs,2000; Honda and Maeda, 2008; Vaissière et al., 2010], or to the upper airway arealike acoustic reflection technique [D’Urzo et al., 1988; Rubinstein et al., 1989; Martinet al., 1997; Busetto et al., 2009]. The latter is based on measurements of high-frequency sound waves which are emitted at the mouth and are reflected as theypropagate along the respiratory tract. From the knowledge of reflected intensitiesand the times of arrival of reflections, the area at a given distance from the sensingmicrophone is computed, and a plot of airway cross-sectional area as a function ofdistance into the airway is constructed [Rubinstein et al., 1989].
c/ Laryngeal Major Dimensions
In the work of Eckel and Sittel [1995], 20 fresh larynges of human cadavers were in-vestigated for laryngeal morphometry in horizontal sections. In the following, the maindimensions in the glottal plane are reported (see Figure I.1.5). Value 1 (female 2.1 mm,male 2.9 mm) gives the thickness of the thyroid cartilage about 1 cm from the mid-lineon the left side. The greatest width of thyroid cartilage (the transverse distance betweenits posterior ends) is given by value 2 (female 31.6 mm, male 32.3 mm). The part ofthe glottis represented by the arytenoid cartilages is defined by value 3 (female 6.9 mm,male 8.6 mm). The ligament part of the glottis was measured as value 4 (female 10.6

I.1.1. RESPIRATORY SYSTEM 29
Figure I.1.5: Definitions of main distances in glottal level and posterior & anteriorreference planes (image retrieved from Eckel and Sittel [1995]).
mm, male 13.6 mm). Value 5 is the antero-posterior diameter APg of the glottis (alsocalled glottic length), defined as the distance between the intersection of the vocal folds inthe thyroid cartilage and the dorsal mucosa-walled border of the glottis. For female, thelength APg was in average measured at 17.6 mm, and for male at 22.1 mm. These valuesare comparable to the work of Friedrich and Lichtenegger [1997] who measured the lengthAPg on 50 cadaver laryngeal specimens. They found 15.1 mm for female and 21.1 mm formale. Note that these previous data are consistent with the measurements performed byC. Darquenne from University of California, San Diego, USA (personal communication,May 7, 2014), who found APg = 22.0 mm using MRI on 1 male volunteer. Noticable arethe differences of glottal dimensions depending on gender, that causes the male voices tobe usually lower pitched influenced by larger glottal dimensions.
As typically observed during in vivo laryngoscopic investigation during tidal breathing(e.g., Jackson et al. [1975]; Chen et al. [2013]), the glottis can be approximated by atriangular cross-section. Different values of the glottal cross-sectional area Ag can befound in the literature: Ag = 45 mm2 is reported as the worst case scenario of glottalnarrowing [Baier et al., 1977; Brouns et al., 2007b], while Ag = 100 mm2 is reported as arealistic mean value in Brancatisano et al. [1983] (data obtained on 12 healthy subjects).These values are further detailed in section I.2.1. Note that typical dimensions of vocalfolds and glottal channel during respiration differs from that during phonation (see Šidlofet al. [2008]).
30 CHAPTER I.1. BACKGROUND AND MOTIVATION
1.1.3 Breathing Aerodynamics
This part introduces the composition of inhaled and exhaled gases, the lung volumes andthe breathing airflow. For details on normal breathing aerodynamics available literaturecan be consulted (e.g., Proctor and Hardy [1949]; Altman and Dittmer [1971]; Rodarteand Rehder [1986]; Chang [1989]).
a/ Nature of Gases Involved
Ambient air is composed primarily of the nitrogen N2 (78.08%), oxygen O2 (20.95%) andargon Ar (0.93%). Water vapor is the next most abundant constituent, and its concen-tration is highly variable. The remaining gaseous constituent of the ambient inhaled airare the trace gases, i.e., carbon dioxide CO2 (0.04%), methane CH4, etc. They representless than 1% of the global composition [Seinfeld and Pandis, 2012]. The levels of O2 andCO2 change in the exhaled air and correspond to 16.5% and 4.5%, respectively. Moreover,the exhaled air is expected to be nearly saturated (i.e., with a relative humidity close to100%)
b/ Lung Volumes and Capacities
Spirometres are devices to assess the ventilatory function [Miller et al., 2005], i.e., tomeasure the volume of expired and inspired air in time. The earliest spirometers werewater seal spirometers, first described by J. Hutchinson in 1846, and still used nowadays.Water seal spirometers measure the amount of water displaced in a sealed container whena patient exhales. The patient breathes into a hose, which is connected to a water-filledcontainer (see Figure I.1.6). Inside the container is a lightweight plastic object, oftencalled a bell, which rises as water is displaced during the patient’s exhalation. A penhooked up to the bell documents the exhalation and inhalation against time on a rotatingchart carrier. The chart produced is called a spirogram, as illustrated in Figure I.1.6. Onthis chart, lung volumes and lung capacities refer to the volume of air associated withdifferent phases of the respiratory cycle. Thus, several static lung volumes and capacitiesare commonly defined [Finlay, 2001; Guyton and Hall, 2003; West, 2008; Rogers, 2011]:• the total lung capacity (TLC), that is the amount of air the lung can contain at theheight of maximum inspiratory effort. The average total lung capacity of an adulthuman male is about 6 L of air, but only a small amount of this capacity is usedduring normal breathing. Therefore, all other volumes are natural subdivisions ofTLC.• the residual volume, that is the volume of gas which remains within the lung aftermaximum exhalation. Inhaled at birth, it is not exhaled until death because the ribcage prevents total lung collapse. Its average value is around 1.2 L.• the tidal volume (Vt), that is the volume of air displaced between normal inhalationand exhalation. In a healthy adult, tidal volume is approximately 0.5 L under rest-

I.1.1. RESPIRATORY SYSTEM 31
ing conditions. During exercise, the displaced volume may exceed three times thisamount.
• the vital capacity (V C), that is the volume of air breathed out after the deepestinhalation. A normal adult has a vital capacity between 3 and 5 litres.
• the functional residual capacity, that is the volume in the lungs at the end-expiratoryposition under resting conditions. Its value is around 2.3 L in adults.
Note that typical values of these volumes and capacities depend on subject’s age, height,weight and clinical status.
Figure I.1.6: Lung volumes and capacities, as displayed on a spirogram (image retrievedfrom West [2008]).
c/ Breathing Flow Rates
Note that a complete review on the breathing flow rate pattern, its parameters, diversityand individuality can be found in Benchetrit [2000] or Miller et al. [2005].
Definitions and typical values Typical variations of breathing flow rate Q are displayedas function of time in Figure I.1.7. Several ventilatory quantities are defined, such as:
• the total duration of one breathing cycle Tt [s], from which the breathing frequencyis derived, f = 60
Tt[breaths/min]. Typical values of f range between 12 and 15
breaths/min during normal breathing.
• the duration of inspiration phase, TI [s];

32 CHAPTER I.1. BACKGROUND AND MOTIVATION
• the duration of expiration phase, TE [s]; note that, under normal conditions, theduration of the inspiration phase is always shorter in comparison with that of theexpiration phase [Cain and Otis, 1949].
• the total volume inhaled during one breathing cycle, VI [L];
• the total volume exhaled during one breathing cycle, VE [L];
• the maximum flow rate during inhalation referred as "Peak Inspiratory Flow", PIF[L/min];
• the maximum flow rate during exhalation referred as "Peak Expiratory Flow", PEF[L/min].
Figure I.1.7: Typical airflow rate pattern during one breathing cycle showing some of thequantities used to characterize breathing (airflow pattern shape).
Note that under quiet periodic breathing conditions, the tidal volume Vt corresponds tothe average inhaled volume VI (or equally to the average exhaled volume VE). Knowingthe tidal volume Vt and the breathing frequency f , minute ventilation can be calculatedV = Vtf , i.e., the amount of gas inspired or expired per minute. Typically, the minuteventilation V is approximately 6 L/min in a healthy adult, compared to less than 1 L/minin an infant [Heyder and Svartengren, 2001]. Finally, different breathing regimes can bedefined depending on the breathing frequency f or the depth of breathing:
• eupnea, characterized by slow respiratory rates ranging up to 20 breaths per minute(tidal breathing);
• tachypnea, characterized by rapid respiratory rates ranging from 20 to 90 breaths perminute;
• hyperpnea, which is a ventilation with increased depth of breathing;
• apnea, which is a temporary interruption in breathing; it can be voluntarily achievedby closing the vocal folds or it can occur as a consequence of sleeping disorders (sleepapnea) or trauma.
I.1.2. LUNG DISEASES AND AEROSOL THERAPY 33
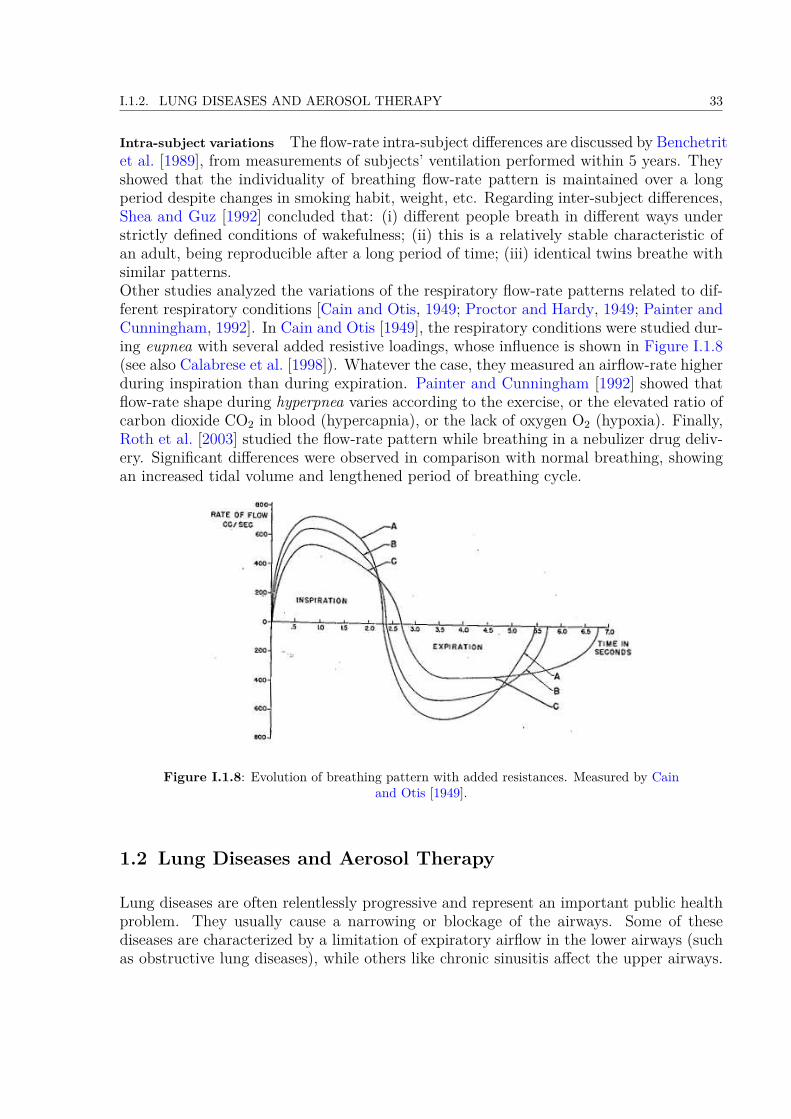
Intra-subject variations The flow-rate intra-subject differences are discussed by Benchetritet al. [1989], from measurements of subjects’ ventilation performed within 5 years. Theyshowed that the individuality of breathing flow-rate pattern is maintained over a longperiod despite changes in smoking habit, weight, etc. Regarding inter-subject differences,Shea and Guz [1992] concluded that: (i) different people breath in different ways understrictly defined conditions of wakefulness; (ii) this is a relatively stable characteristic ofan adult, being reproducible after a long period of time; (iii) identical twins breathe withsimilar patterns.Other studies analyzed the variations of the respiratory flow-rate patterns related to dif-ferent respiratory conditions [Cain and Otis, 1949; Proctor and Hardy, 1949; Painter andCunningham, 1992]. In Cain and Otis [1949], the respiratory conditions were studied dur-ing eupnea with several added resistive loadings, whose influence is shown in Figure I.1.8(see also Calabrese et al. [1998]). Whatever the case, they measured an airflow-rate higherduring inspiration than during expiration. Painter and Cunningham [1992] showed thatflow-rate shape during hyperpnea varies according to the exercise, or the elevated ratio ofcarbon dioxide CO2 in blood (hypercapnia), or the lack of oxygen O2 (hypoxia). Finally,Roth et al. [2003] studied the flow-rate pattern while breathing in a nebulizer drug deliv-ery. Significant differences were observed in comparison with normal breathing, showingan increased tidal volume and lengthened period of breathing cycle.
Figure I.1.8: Evolution of breathing pattern with added resistances. Measured by Cainand Otis [1949].
1.2 Lung Diseases and Aerosol Therapy
Lung diseases are often relentlessly progressive and represent an important public healthproblem. They usually cause a narrowing or blockage of the airways. Some of thesediseases are characterized by a limitation of expiratory airflow in the lower airways (suchas obstructive lung diseases), while others like chronic sinusitis affect the upper airways.
34 CHAPTER I.1. BACKGROUND AND MOTIVATION
In this part, the common chronic lung diseases are presented, together with their currentclinical treatment based on aerosol therapy.
1.2.1 Most Common Chronic Lung Diseases
a/ Pathogenesis
Tobacco smoke and exposure to indoor and outdoor air pollution are the most importantrisk factors. The incidence of lung diseases increases dramatically with the rise of airborneaerosol pollution. Numerous epidemiological studies showed that aerosol pollution isrelated to respiratory diseases [Schwartz, 1993; Dockery and Pope, 1994; Pope et al.,1995; Šrám et al., 2013]. The following health effects of undesirable aerosols have beenobserved: increased incidence of respiratory symptoms, decreased lung function, increasedhospitalization rate.
b/ Obstructive Lung Diseases
Obstructive lung diseases limit flow of air in and out of the lungs. The main diseases withinthis group are Chronic Obstructive Pulmonary Disease (COPD), asthma and bronchiec-tasis.• COPD is a serious long-term disease that mainly affects older people. It can leadto mild or severe shortness of breath that is not fully reversible even with treat-ment. Generally COPD embraces emphysema and chronic bronchitis. Emphysemais the destructive process of the alveolar structures that leads to the loss of lungelastic recoil. Chronic bronchitis affects both the large and the small airways, withhypertrophy (increase of the volume of the cells) or hyperplasia (cell proliferation).• Asthma is a chronic inflammation with bronchoconstriction. Patients with asthmaexperience symptoms such as wheezing, breathlessness and chest tightness due towidespread narrowing of the airways.• Bronchiectasis refers to an abnormal and irreversible widening of air passages inthe lungs. Patients suffering from bronchiectasis are prone to infections as mucusaccumulates in the airways and becomes stagnant. The symptoms can be coughingup blood, sputum production, chest pain and shortness of breath.
c/ Chronic Sinusitis
Chronic sinusitis is characterized by an inflammation of cavities around the paranasalsinuses. This inflammation can last for around eight weeks, despite treatment attempts.The most common symptoms are nasal congestion, increased secretions, facial pain andfatigue. Most cases are due to a viral infection, but it can also be caused by growths inthe sinuses (nasal polyps) or by a deviated nasal septum. Young and middle-aged adultssuffer most commonly from this disease.
I.1.3. FUNDAMENTAL MECHANICS OF AEROSOL TRANSPORT AND DEPOSITION 35
1.2.2 Aerosol Therapy
Inhalation has been employed as a method for delivering medications for more than twothousands years [Sanders, 2007]. The benefits of delivering medication a priori directly tothe affected site (oftenly the lungs) have been understood for more than two hundred years.Therefore, aerosol therapy has dramatically improved the treatment of many respiratorydiseases such as asthma and COPD.
Advantages Basic advantage of aerosol therapy lies in the direct delivery of high localconcentrations of the drug to the site of action, with minimized risks of systemic effects[Khilnani and Banga, 2008]. In comparison with other methods of treatment (oral deliveryor injection), the improvement includes:• ease and rapidity of administration;• effectiveness with smaller doses of drug needed;• faster pharmacokinetics of drug delivery to targeted area.
Drawbacks The efficiency of inhaled therapies depends on the ability of the subject (i)to produce an adequate inspiratory flow, and (ii) to properly use the delivery device:
i. During childhood, peak inspiratory flow (PIF ) ranges from less than 0.05 to over 40L/min, depending on age, maturity, and clinical status [Coates and Ho, 1998]. Mostsubjects older than 6 years are able to generate an adequate PIF (i.e., > 30 L/min),that is necessary for efficient inhalation from most commonly used delivery devices[Coates and Ho, 1998].
ii. The chosen device and its correct use have a major impact on aerosol delivery effi-ciency [Kovářová and Ždímal, 2009]. The medicament can be delivered in the formof a nebulized drug (nebulizers), a spray (pressurised Metered Dose Inhalers pMDI)or a powder (Dry Powder Inhalers (DPI). The device has to be chosen according totype of drug, patient’s age and his mental/physical capacities.
In addition to these subject’s abilities, several physical and anatomical factors such asparticle characteristics, carrier gas flow properties or airways morphology can largely in-fluence treatment efficiency [Finlay, 2001; Sandeau et al., 2010; Kleinstreuer and Zhang,2010]. This can be explained by fundamental mechanics of aerosol transport and deposi-tion, as detailed in next section.
1.3 Fundamental Mechanics of Aerosol Transport and Deposition
The inhaled pharmaceutical aerosols can be transported in the airflow stream by severalmechanisms, including convection, diffusion, thermophoresis, etc. The delivery to thetarget site depends on the efficiency of these mechanisms, the geometry of the airways

36 CHAPTER I.1. BACKGROUND AND MOTIVATION
and the aerosol properties. In this section, the aerosol geometrical and physical charac-teristics are presented, together with their effects on the particle transport and depositionmechanisms in human upper airways.
1.3.1 Aerosol Geometrical and Physical Characteristics
An aerosol is an assembly of solid or liquid particles suspended in a gaseous medium(e.g., air), that is a two-phase system. In the following, we will focus on liquid particlessuspended in a carrier gas. Manufactured and naturally produced particles may havea great diversity in size, shape, surface area, density and chemical composition. Theparticle size (noted as Dp) is the key property to characterize aerosol particles, sinceparticle behavior is governed by different physical laws according to the size [Ruzer andHarley, 2005; John, 2011].
a/ Particle Shape and Size
Shape Aerosol particles like liquid droplets are spherical, while particles formed by crush-ing have irregular shape, and some crystalline particles can exhibit a regular geometricshapes. In the theoretical description of particle properties, a spherical shape is usuallyassumed. In the application of these theories to non-spherical particles, correction factorsor equivalent diameters are used to estimate their properties.
Size Aerosol particle sizes range over 5 orders of magnitude, from about 1 nm to morethan 100 µm. For a spherical particle of unit density, the size can be simply characterizedby the geometric diameter. For particles of non-spherical shape and/or arbitrary density,an equivalent diameter De is used [John, 2011]. An equivalent diameter De is the diameterof a spherical particle that has the same property or characteristic as the non-sphericalparticle. Examples of such an equivalent diameter (see Figure I.1.9) can be:
• the aerodynamic diameter, Da. It is defined as the diameter of a spherical particleof unit density having the same terminal settling velocity as that of the particle inquestion.
• the Stokes diameter, Ds. It is defined as the diameter of a spherical particle havingthe same density and settling velocity as the particle in question.
Both are the main diameters used in this thesis, and further detailed in section I.1.3.2.c.Note that numerous other diameters can be defined like diffusive diameter, electricalmobility diameter, optical diameter, etc.
b/ Aerosol Size Distribution
Two types of aerosols are defined, according to their size distribution:
I.1.3. FUNDAMENTAL MECHANICS OF AEROSOL TRANSPORT AND DEPOSITION 37
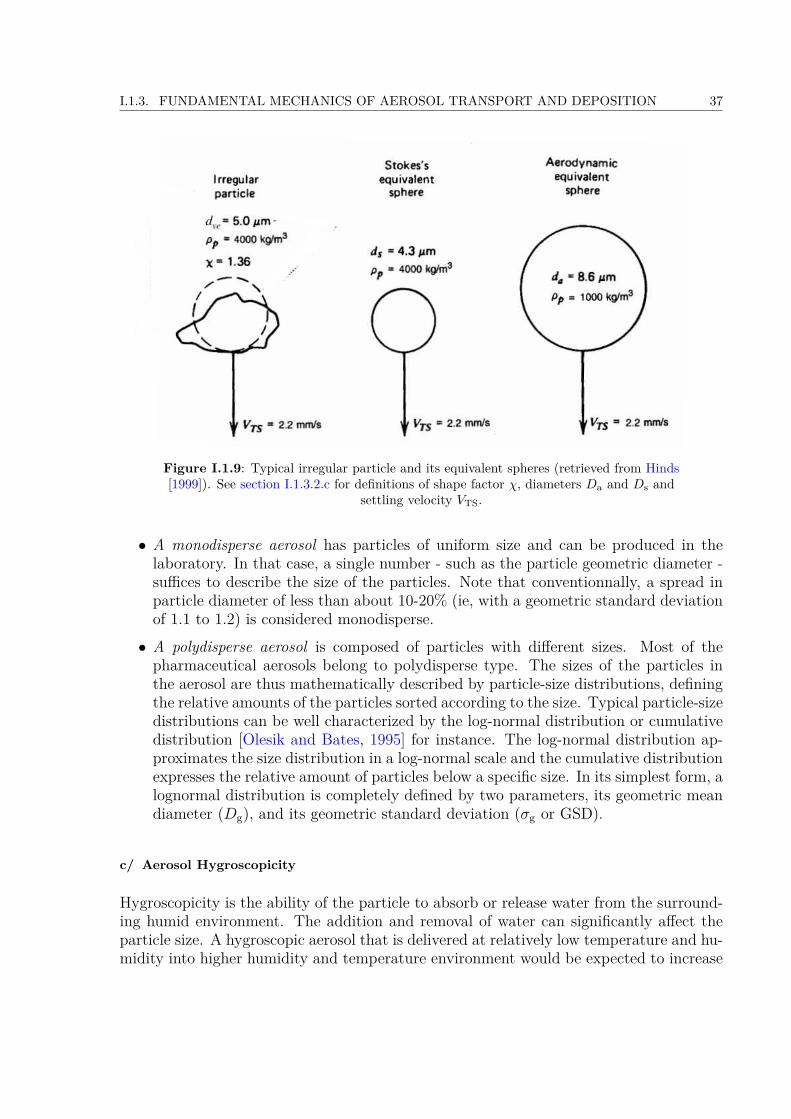
Figure I.1.9: Typical irregular particle and its equivalent spheres (retrieved from Hinds[1999]). See section I.1.3.2.c for definitions of shape factor χ, diameters Da and Ds and
settling velocity VTS.
• A monodisperse aerosol has particles of uniform size and can be produced in thelaboratory. In that case, a single number - such as the particle geometric diameter -suffices to describe the size of the particles. Note that conventionnally, a spread inparticle diameter of less than about 10-20% (ie, with a geometric standard deviationof 1.1 to 1.2) is considered monodisperse.• A polydisperse aerosol is composed of particles with different sizes. Most of thepharmaceutical aerosols belong to polydisperse type. The sizes of the particles inthe aerosol are thus mathematically described by particle-size distributions, definingthe relative amounts of the particles sorted according to the size. Typical particle-sizedistributions can be well characterized by the log-normal distribution or cumulativedistribution [Olesik and Bates, 1995] for instance. The log-normal distribution ap-proximates the size distribution in a log-normal scale and the cumulative distributionexpresses the relative amount of particles below a specific size. In its simplest form, alognormal distribution is completely defined by two parameters, its geometric meandiameter (Dg), and its geometric standard deviation (σg or GSD).
c/ Aerosol Hygroscopicity
Hygroscopicity is the ability of the particle to absorb or release water from the surround-ing humid environment. The addition and removal of water can significantly affect theparticle size. A hygroscopic aerosol that is delivered at relatively low temperature and hu-midity into higher humidity and temperature environment would be expected to increase

38 CHAPTER I.1. BACKGROUND AND MOTIVATION
in size. The rate of growth is a function of the initial diameter of the particle, relativehumidity, temperature of the surrounding air, and the relative speed between the particleand the surrounding gas.
More specifically, the hygroscopic growth of a particle strongly depends on the particlesize relative to the mean free path of the carrier gas. The gas must be considered as anensemble of rapidly moving molecules, colliding with the particles. The mean free pathis defined as the average distance traveled by the air molecules between two successivecollisions. The mean free path λ of a gas can be determined from the average number ofcollisions that a molecule undergoes in one second, nz, and the average distance traveledin that second, so that:
λ = c
nz, (I.1.1)
where c is the average molecular velocity of the air. The mean free path increases withincreasing temperature or decreasing pressure. The growth rate for particles smaller thanthe mean free path is independent of droplet size, while for larger particles it is inverselyproportional to the diameter [Barrett and Clement, 1988].In the human respiratory tract, the air is nearly saturated. A value of relative humidityof 99% or 99.5% is generally accepted. The relative humidity increases rapidly in theupper airways region. When a particle is inhaled, it grows very rapidly, following anexponential time function, and then increases asymptotically to its equilibrium size [Xuand Yu, 1985]. To improve the lung delivery of inhaled medicines, the concept of controlledsize increase was recently introduced by Longest and Hindle [2011]. In this approach, tosignificantly reduce device and extrathoracic depositional losses, the aerosol is deliveredwith an initially small size (submicrometer or nanometer) at all practical flow rates.Increasing the aerosol size as it enters the lungs is then used to ensure lung retention andto potentially target the site of delivery within the airways.
d/ Inhalability of Particles in the Respiratory System
The respiratory system is an effective size-selective aerosol sampler. Not all sizes ofparticle can be breathed in with 100% efficiency. The mass fraction of particles in aninhaled air volume that enters the nose or the mouth represents the inhalable fraction.The inhalability of the particle depends on the particle diameter and the airflow velocityand direction. Because particles transport and deposition depend on particle aerodynamicbehavior in a flowing gas, the aerodynamic equivalent diameter is employed. Specificdefinitions of particles fraction according to the penetration in the respiratory tract areused (see Figure I.1.10) [Brown et al., 2013]:
• Extrathoracic fraction: the mass fraction of inhaled particles failing to penetratebeyond the larynx.
• Thoracic fraction: the mass fraction of inhaled particles penetrating beyond thelarynx.
I.1.3. FUNDAMENTAL MECHANICS OF AEROSOL TRANSPORT AND DEPOSITION 39
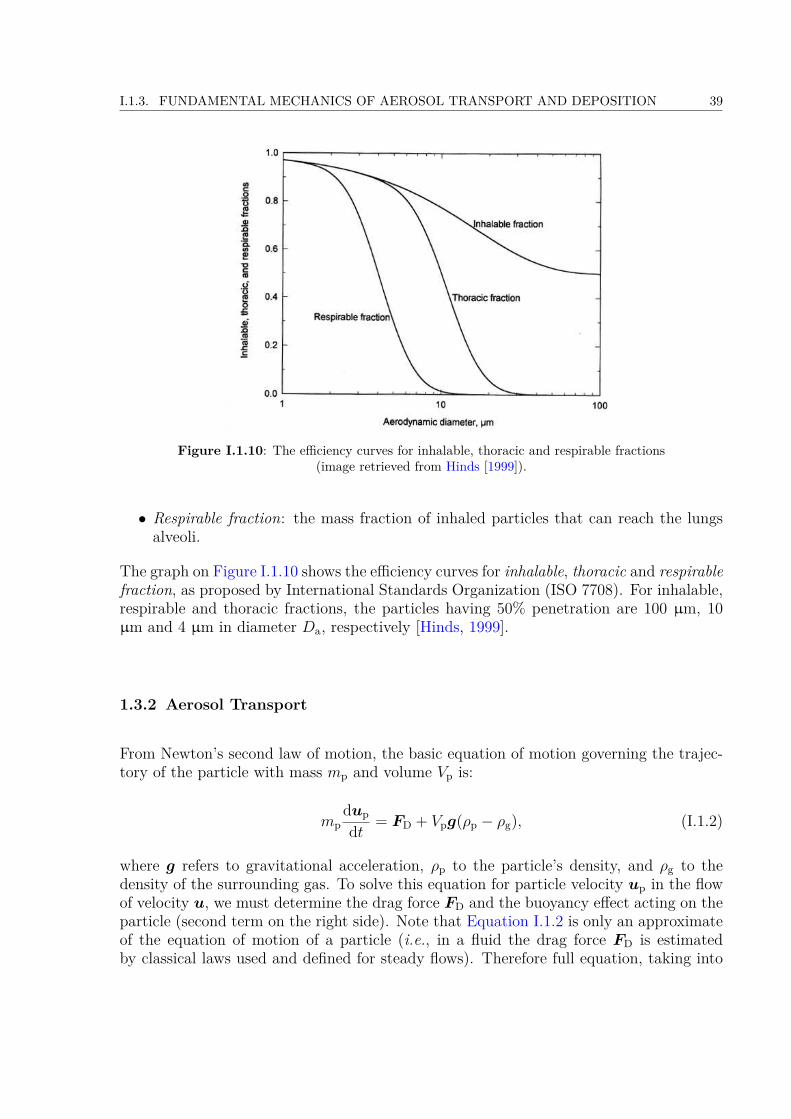
Figure I.1.10: The efficiency curves for inhalable, thoracic and respirable fractions(image retrieved from Hinds [1999]).
• Respirable fraction: the mass fraction of inhaled particles that can reach the lungsalveoli.
The graph on Figure I.1.10 shows the efficiency curves for inhalable, thoracic and respirablefraction, as proposed by International Standards Organization (ISO 7708). For inhalable,respirable and thoracic fractions, the particles having 50% penetration are 100 µm, 10µm and 4 µm in diameter Da, respectively [Hinds, 1999].
1.3.2 Aerosol Transport
From Newton’s second law of motion, the basic equation of motion governing the trajec-tory of the particle with mass mp and volume Vp is:
mpdup
dt = FD + Vpg(ρp − ρg), (I.1.2)
where g refers to gravitational acceleration, ρp to the particle’s density, and ρg to thedensity of the surrounding gas. To solve this equation for particle velocity up in the flowof velocity u, we must determine the drag force FD and the buoyancy effect acting on theparticle (second term on the right side). Note that Equation I.1.2 is only an approximateof the equation of motion of a particle (i.e., in a fluid the drag force FD is estimatedby classical laws used and defined for steady flows). Therefore full equation, taking into

40 CHAPTER I.1. BACKGROUND AND MOTIVATION
account the unsteadiness effects of the flow behavior was defined by [Hinze, 1975]:
mpdup
dt = FD + Vpρgdudt + Vp
2 ρg
(dudt −
dvdt
)+
+ 3Dp2
2 (πρgη)12
∫ t
0
(du/dt′)− (dv/dt′)(t− t′)
12
dt′ + Vpg(ρp − ρg) +∑i
Fi, (I.1.3)
where η is the dynamic viscosity of the surrounding gas. The second term on the right sideis due to the pressure gradient in the fluid surrounding the particle, caused by accelerationof the gas by the particle. The third term on the right side is the force required toaccelerate the apparent mass of the particle relative to the fluid. The fourth term onthe right side, called the Basset history integral, accounts for the force arising due to thedeviation of the fluid velocity from the steady state. The fifth term considers the gravityand the last term considers the additional external forces Fi exerted on the particle. Fromthe standpoint of liquid aerosols in the air, in most situations the second, third, and fourthterms on the right-hand side of the Equation I.1.3 may be neglected.
a/ Drag Force on Particle
The drag force FD is the resistance experienced by a particle moving in a fluid. Whena particle is moving through the fluid, it deforms the fluid, causing layers of the fluid inthe region around the particle to slide one over another. The drag force on a sphericalparticle is given by Finlay [2001]:
FD = −12ρgvrel
2πD2p
4 CDvdrag, (I.1.4)
where CD is the drag coefficient, vrel is the velocity magnitude of the particle relative tothe fluid motion:
vrel = |up − u| (I.1.5)and vdrag is the unit vector representing the direction of the drag force parallel to therelative velocity vrel:
vdrag = up − uvrel
. (I.1.6)
Equation I.1.4 is the general form of the Newton’s resistance equation, valid for all sub-sonic particle motions.
In 1851, Stokes derived an expression for the drag force, when inertial forces are negligiblecompared to viscous forces. The drag force on a spherical particle moving with velocityup through a fluid is given by:
FD = −3πηDp (up − u) . (I.1.7)
This is Stokes’ law, that contains dynamic viscosity η but not factors associated withinertia, such as the density of the fluid. Comparing Equation I.1.4 with Equation I.1.7
I.1.3. FUNDAMENTAL MECHANICS OF AEROSOL TRANSPORT AND DEPOSITION 41
we can get the drag coefficient:
CD = 24ηρgvrelDp
= 24Rep
, for Rep < 1 (I.1.8)
where Rep is the relative Reynolds number of the spherical particle defined as
Rep = ρgDpvrel
η. (I.1.9)
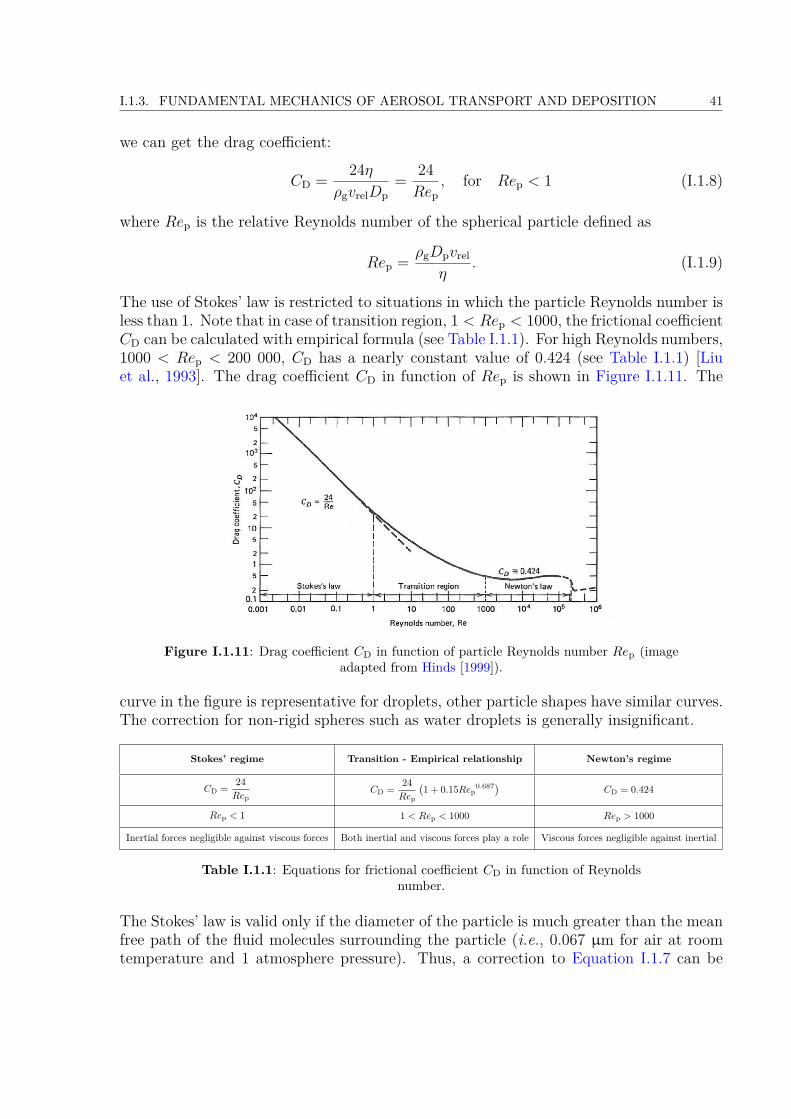
The use of Stokes’ law is restricted to situations in which the particle Reynolds number isless than 1. Note that in case of transition region, 1 < Rep < 1000, the frictional coefficientCD can be calculated with empirical formula (see Table I.1.1). For high Reynolds numbers,1000 < Rep < 200 000, CD has a nearly constant value of 0.424 (see Table I.1.1) [Liuet al., 1993]. The drag coefficient CD in function of Rep is shown in Figure I.1.11. The
Figure I.1.11: Drag coefficient CD in function of particle Reynolds number Rep (imageadapted from Hinds [1999]).
curve in the figure is representative for droplets, other particle shapes have similar curves.The correction for non-rigid spheres such as water droplets is generally insignificant.
Stokes’ regime Transition - Empirical relationship Newton’s regime
CD = 24Rep
CD = 24Rep
(1 + 0.15Rep
0.687) CD = 0.424
Rep < 1 1 < Rep < 1000 Rep > 1000
Inertial forces negligible against viscous forces Both inertial and viscous forces play a role Viscous forces negligible against inertial
Table I.1.1: Equations for frictional coefficient CD in function of Reynoldsnumber.
The Stokes’ law is valid only if the diameter of the particle is much greater than the meanfree path of the fluid molecules surrounding the particle (i.e., 0.067 µm for air at roomtemperature and 1 atmosphere pressure). Thus, a correction to Equation I.1.7 can be
42 CHAPTER I.1. BACKGROUND AND MOTIVATION
applied to submicrometer particles, referred to as the Cunningham slip correction factorCc, which is defined as [Ounis et al., 1991]:
Cc = 1 + 2λDp
(1.257 + 0.4e−
1.1Dp2λ
). (I.1.10)
The drag force is then:
FD = −3πηDpvdrag
Cc. (I.1.11)
In that case, the drag coefficient for a sphere is replaced by:
CD = 24Cc ×Rep
. (I.1.12)
For particles with Dp > 1µm the correction for slip can be neglected, and so Cunninghamslip correction factor is equal to 1 [Hinds, 1999].
b/ Stokes Number
The equation of particle motion can be written in dimensionless form, by introducing U0 asa characteristic velocity magnitude in the fluid flow, and Dh as a characteristic dimensionof the geometry containing the fluid flow (e.g., the hydraulic diameter of the airway theparticle is in). Once the equation of motion Equation I.1.2 is non-dimensionalized, theStokes number is obtained (Stk) as follows:
Stk = ρpDp2uCc
18ηDh= τU0
Dh, (I.1.13)
where ρp is the density of the particle, Dp its diameter, η is the dynamic viscosity of thegas and time τ is the particle relaxation time τ , defined by:
τ = ρpDp2Cc
18η (I.1.14)
The particle relaxation time τ is the time required for the particle’s velocity relative tothe fluid to decay to e−1 = 37% of its initial value [Finlay, 2001], and the Stokes numberis a dimensionless parameter that describes the ease of a particle to change its trajectoryin the airflow. The value of the Stokes number determines whether a particle will undergoinertial impaction (see more in section I.1.3.3.a).
c/ Settling velocity
In the still air, the particle will settle under the action of gravity.
I.1.3. FUNDAMENTAL MECHANICS OF AEROSOL TRANSPORT AND DEPOSITION 43
Spherical particles If the particle is spherical the gravity force is defined:
Fg = ρpVpg. (I.1.15)
When the particle begins to move, the gas surrounding the particle exerts an opposite dragforce (aerodynamic drag), which is equal to the gravitational force, and the particle reachesits terminal settling velocity (also called sedimentation velocity). Therefore, assumingRep < 1, by equating the drag force defined by Stokes (Equation I.1.7 with a zero gas-velocity) to the gravitational force (Equation I.1.15) the magnitude of the settling velocityVTS is obtained:
VTS = ρpDp2g
18η . (I.1.16)
Nonspherical particles A correction coefficient referred as dynamic shape factor χ canbe applied to the Stokes’ law, when particle has other than spherical shape. This willresult in the modification of the drag force equation derived by Stokes (Equation I.1.7)applying the equivalent diameter De:
FD = −3πηDe (up − u)χ (I.1.17)
and the settling velocity will become:
VTS = ρpDe2g
18ηχ . (I.1.18)
According to definition given in section I.1.3.1, the aerodynamic diameter Da can becalculated. The Da is the diameter of a spherical particle, having a standard density ρw(that of a water droplet: 1000 kg/m3), and having the same gravitational settling velocityas the particle in question, so that:
VTS = ρpDe2g
18ηχ = ρwDa2g
18η . (I.1.19)
Similarly, the particle’s Stokes diameterDs can be derived. It is the diameter of a sphericalparticle having the same density and settling velocity as the particle in question, so that:
VTS = ρpDe2g
18ηχ = ρpDs2g
18η . (I.1.20)
From Equation I.1.19 and Equation I.1.20 can be derived as:
Da = De
(ρp
ρwχ
) 12
= Ds
(ρp
ρw
) 12
(I.1.21)
and for spheres:
Da = Dp
(ρp
ρw
) 12
. (I.1.22)
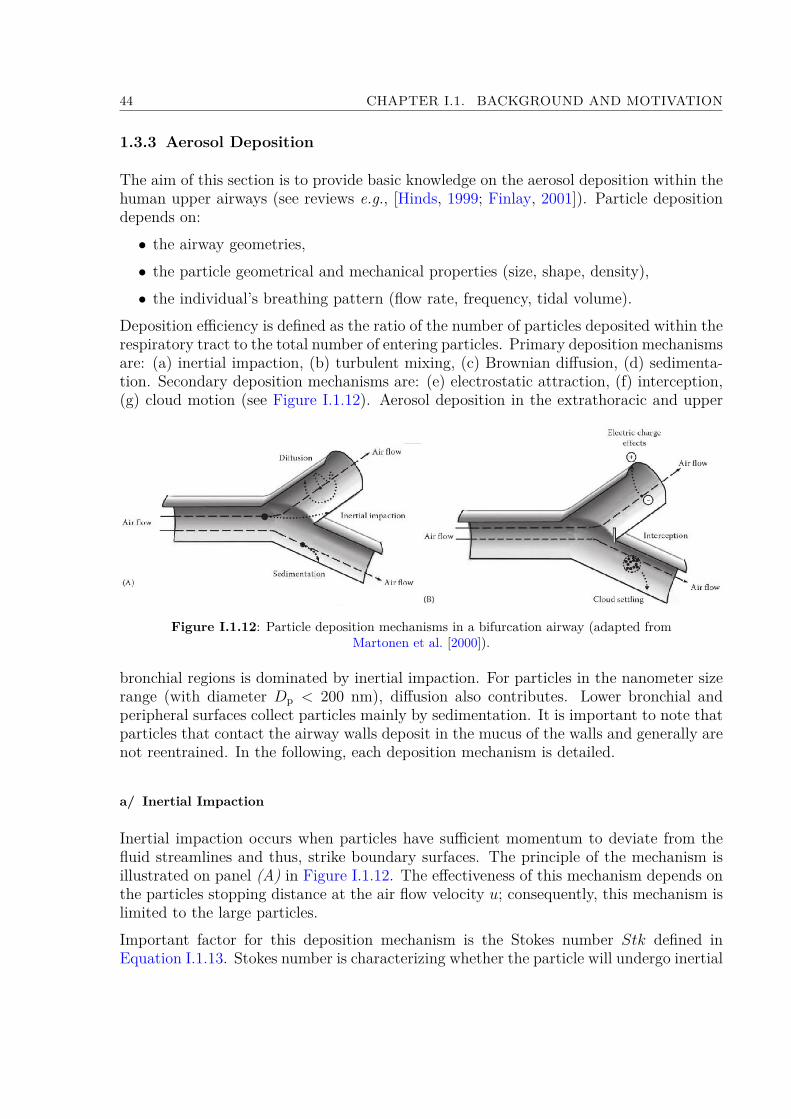
44 CHAPTER I.1. BACKGROUND AND MOTIVATION
1.3.3 Aerosol Deposition
The aim of this section is to provide basic knowledge on the aerosol deposition within thehuman upper airways (see reviews e.g., [Hinds, 1999; Finlay, 2001]). Particle depositiondepends on:• the airway geometries,• the particle geometrical and mechanical properties (size, shape, density),• the individual’s breathing pattern (flow rate, frequency, tidal volume).
Deposition efficiency is defined as the ratio of the number of particles deposited within therespiratory tract to the total number of entering particles. Primary deposition mechanismsare: (a) inertial impaction, (b) turbulent mixing, (c) Brownian diffusion, (d) sedimenta-tion. Secondary deposition mechanisms are: (e) electrostatic attraction, (f) interception,(g) cloud motion (see Figure I.1.12). Aerosol deposition in the extrathoracic and upper
Figure I.1.12: Particle deposition mechanisms in a bifurcation airway (adapted fromMartonen et al. [2000]).
bronchial regions is dominated by inertial impaction. For particles in the nanometer sizerange (with diameter Dp < 200 nm), diffusion also contributes. Lower bronchial andperipheral surfaces collect particles mainly by sedimentation. It is important to note thatparticles that contact the airway walls deposit in the mucus of the walls and generally arenot reentrained. In the following, each deposition mechanism is detailed.
a/ Inertial Impaction
Inertial impaction occurs when particles have sufficient momentum to deviate from thefluid streamlines and thus, strike boundary surfaces. The principle of the mechanism isillustrated on panel (A) in Figure I.1.12. The effectiveness of this mechanism depends onthe particles stopping distance at the air flow velocity u; consequently, this mechanism islimited to the large particles.Important factor for this deposition mechanism is the Stokes number Stk defined inEquation I.1.13. Stokes number is characterizing whether the particle will undergo inertial

I.1.3. FUNDAMENTAL MECHANICS OF AEROSOL TRANSPORT AND DEPOSITION 45
impaction in the fluid motion. When Stk >> 1, particles continue moving in a straightline when the flow turns. When Stk << 1, particles follow the gas streamlines perfectly.During inhalation, the incoming air often changes direction as it flows from the nose ormouth down through the branching airways system to the alveolar region. The greatestdeposition by inertial impaction occurs in the regions, where the flow streamlines turnmost sharply (i.e., in the oropharynx, near glottal area, at the tracheal bifurcation andto a lesser degree at other bifurcations).
b/ Turbulent mixing
Turbulent mixing (also referred as turbulence diffusion) is the phenomenon when eddystructures and recirculation zones are created in the flow, which decreases the boundarylayer on the walls and facilitates particles to deposit on the walls [Tian and Ahmadi,2007]. As reported in previous studies e.g., [Zhang et al., 2002]) particles basically fol-low the secondary airflow and are evidently affected by the intensity of turbulence andsecondary flow. In such a case, the velocity of the particles and thus their trajectoriesare continuously undergoing changes in both magnitude and direction, which can resultin their deposition on the walls. The turbulent flow for those reasons can be described interms of its mean values over which are superimposed the instantaneous flow fluctuations.Therefore, on contrary from inertial impaction, that is produced by the mean flows, tur-bulent mixing is generated by the flow fluctuations. In human upper airways turbulentmixing plays a significant role in aerosol deposition in particular for high flows.The turbulent flow in the respiratory tract is principally a function of the gas density[Darquenne and Prisk, 2004]. Therefore lowering the gas density can lead to convertingof the flow regime to laminar flow. Within the respiratory system, turbulent mixingaffects deposition mainly inside the upper airways region [Darquenne and Prisk, 2004;Darquenne, 2012].
c/ Brownian Diffusion
The Brownian motion is the irregular wiggling motion of an aerosol particle caused bythe relentless bombardment of the gas molecules on the particle’s surface. The principleof Brownian diffusion is illustrated on panel (A) in Figure I.1.12. Diffusion of aerosolparticle is the net transport of the particles in a concentration gradient. The process ischaracterized by the particle diffusion coefficient D [Hinds, 1999]:
D = kTCc
3πηDp. (I.1.23)
Here k is the Boltzmann constant (1.38× 10⁻²³ J·K−1), T [K] is the temperature, η [Pa·s]is the air dynamic viscosity and Dp the particle diameter. The larger the value of D, themore vigorous the Brownian motion and the more rapid the mass transfer. A problemof great practical importance is the deposition by diffusion of aerosol particles to thewalls of a tube as they flow through it. In the human respiratory tract, this deposition

46 CHAPTER I.1. BACKGROUND AND MOTIVATION
mechanism is important for sub-micrometer particles. In the lung region diffusion is themain deposition mechanism for particles smaller than 0.5 µm in diameter and in the upperairways region for particles smaller than 0.01 µm in diameter [Hinds, 1999].
d/ Sedimentation
Sedimentation is the deposition of the particles by gravitational forces. The gravitationalpull depends on the difference between the density of the particle and that of the sur-rounding medium. Mechanism by sedimentation in airway bifurcation is illustrated onpanel (A) in Figure I.1.12. The particle sedimentation increases in importance with in-creasing particle size, and with low flow velocities causing increased particle residencetime within the airway. Sedimentation has its maximum removal effect for particles inhorizontally orientated airways. In human respiratory tract, sedimentation is a majorfactor affecting the particle deposition within the lung region, in particular for particleswith Stokes number Stk < 0.01 [Darquenne et al., 2011]. In the upper airways region,high flow rates leads to insufficient time for particle to deposit by sedimentation [Cohenand Asgharian, 1990; Heyder and Svartengren, 2001].
e/ Interception
Interception is the process when a particle contacts the airway surface because of its phys-ical size (see panel (B) on Figure I.1.12). Note that, on contrary from inertial impactionduring deposition by interception particle does not deviate from the gas streamline. Thusthe probability of the interception depends on the proximity of the gas streamline to theairway surface, and on the ratio of the particle size to the airway diameter, which is usuallysmall even in the narrowest airways. For elongated particles (e.g., fibers), interception isan important respiratory tract deposition mechanism. The chance of particle interceptionincreases as the airway diameter becomes smaller.
f/ Electrostatic Deposition
Highly charged particles are attracted to the airway surface by the electrostatic charge thatthe particle induces in the airway surface by its presence (see panel (B) onFigure I.1.12).Unipolar charged aerosols with high number concentrations are also deposited becausetheir mutual repulsion drives particles away from each other and towards the airway wall.Electrostatic deposition in human airways can be an important mechanism for submicronparticles Cohen et al. [1998].
g/ Cloud Motion
Individual particles can, under certain conditions, form a cloud of particles (see panel(B) on Figure I.1.12). Such an entity will behave in the gas differently than individualparticle. The movement of an entity is called cloud motion and can be significant for

I.1.4. CURRENT CLINICAL NEEDS AND CHALLENGES 47
example for deposition of cigarette smoke in the alveolar region [Martonen and Musante,2000].
1.4 Current Clinical Needs and Challenges
As shown in previous parts, in addition to the chosen inhalation device, the characteris-tics of inhaled particles, airways morphology, carrier gas and flow properties can largelyinfluence the aerosol transport-deposition mechanisms in upper airways. Thereby, theyare key factors which determine the treatment efficiency of inhaled therapies [Finlay,2001; Kleinstreuer and Zhang, 2010; Sandeau et al., 2010]. Some of these key factorscan be monitored and optimized (e.g., particles and flow properties), while others are notadjustable (airway anatomy).
1.4.1 Adjustable Key Factors
The influence of the particle aerodynamic diameter on deposition fraction in upper airwayshas already been described in section I.1.3.1.d. Therefore, in the following, the impact ofgas-flow properties is detailed.
a/ Carrier Gas
Different gas mixtures may also affect particle transportation and deposition rate. Forinstance, a mixture of 78% of Helium and 22% of Oxygen (He-O2) has a gas density aboutone third that of the air, and a viscosity about 8% higher than the air. Thus, at similarflow rates, the Reynolds number for Helium is approximately one third that of the airin any given airway. Accordingly, the use of He-O2 mixture reduces turbulent flow inthe trachea and secondary transitional flows in the conducting airways, thereby reducingdeposition by turbulent mixing. The study of Peterson et al. [2008] reported a significantdecrease in deposition within the mouth and throat and a significant increase in alveolardeposition when breathing He-O2 compared to air. The comparison of the depositionfraction of monodisperse aerosol predicted in the extrathoracic region using air or He-O2as carrier gas is illustrated in Figure I.1.13, for several particle diameters. This predictionderives from the modeling described in Grgic et al. [2004a].
b/ Inhaled Flow Conditions
The effect of changes in breathing flow rates and volumes has direct influence on theefficiency of aerosol therapy [Agertoft and Pedersen, 1993; Bisgaard, 1995], as discussedin section I.1.1.3. High respiratory rates usually result in increased deposition in the moreproximal airways. Shallow, rapid breathing should be avoided during inhalation therapy,since the smaller the tidal volume, the greater the proportion that will be wasted in the
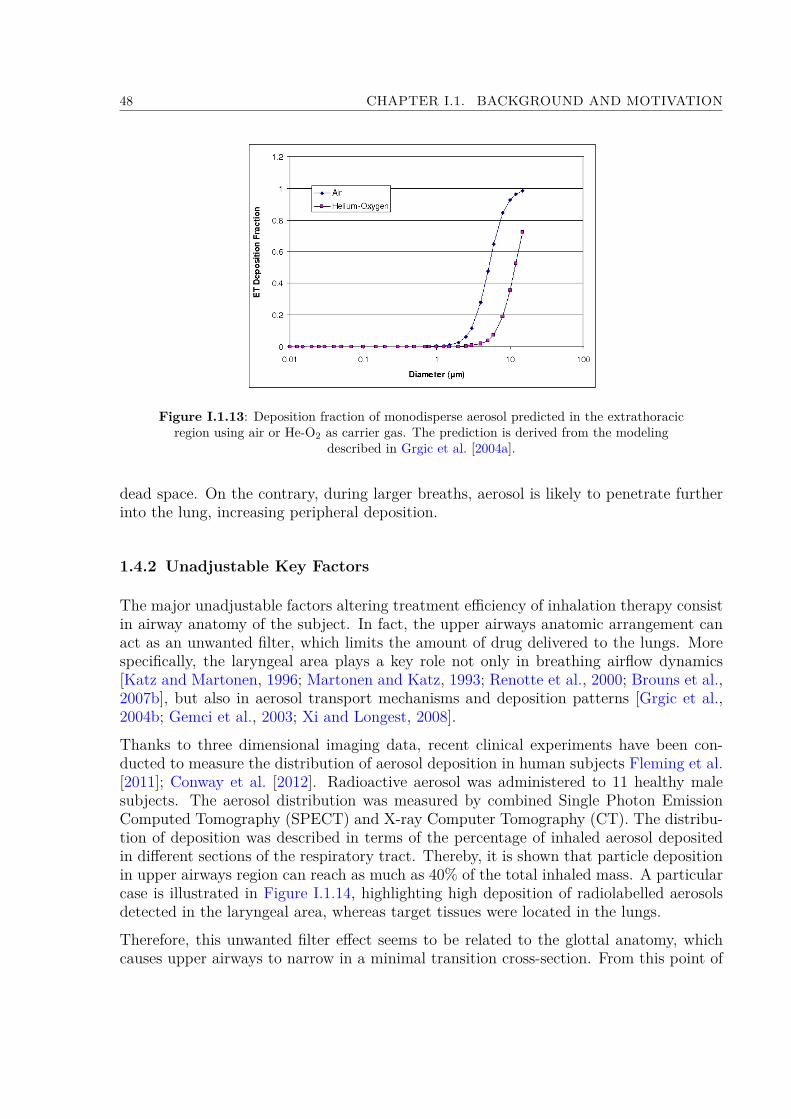
48 CHAPTER I.1. BACKGROUND AND MOTIVATION
Figure I.1.13: Deposition fraction of monodisperse aerosol predicted in the extrathoracicregion using air or He-O2 as carrier gas. The prediction is derived from the modeling
described in Grgic et al. [2004a].
dead space. On the contrary, during larger breaths, aerosol is likely to penetrate furtherinto the lung, increasing peripheral deposition.
1.4.2 Unadjustable Key Factors
The major unadjustable factors altering treatment efficiency of inhalation therapy consistin airway anatomy of the subject. In fact, the upper airways anatomic arrangement canact as an unwanted filter, which limits the amount of drug delivered to the lungs. Morespecifically, the laryngeal area plays a key role not only in breathing airflow dynamics[Katz and Martonen, 1996; Martonen and Katz, 1993; Renotte et al., 2000; Brouns et al.,2007b], but also in aerosol transport mechanisms and deposition patterns [Grgic et al.,2004b; Gemci et al., 2003; Xi and Longest, 2008].
Thanks to three dimensional imaging data, recent clinical experiments have been con-ducted to measure the distribution of aerosol deposition in human subjects Fleming et al.[2011]; Conway et al. [2012]. Radioactive aerosol was administered to 11 healthy malesubjects. The aerosol distribution was measured by combined Single Photon EmissionComputed Tomography (SPECT) and X-ray Computer Tomography (CT). The distribu-tion of deposition was described in terms of the percentage of inhaled aerosol depositedin different sections of the respiratory tract. Thereby, it is shown that particle depositionin upper airways region can reach as much as 40% of the total inhaled mass. A particularcase is illustrated in Figure I.1.14, highlighting high deposition of radiolabelled aerosolsdetected in the laryngeal area, whereas target tissues were located in the lungs.
Therefore, this unwanted filter effect seems to be related to the glottal anatomy, whichcauses upper airways to narrow in a minimal transition cross-section. From this point of

I.1.4. CURRENT CLINICAL NEEDS AND CHALLENGES 49
Figure I.1.14: Example of aerosol distribution measured on a heatlhy subject by singlephoton emission computed tomography (SPECT) after inhalation of radiolabelledparticles. Extracted from the clinical study performed by Fleming et al. [2011] andConway et al. [2012]. Illustration of the high deposition in the laryngeal region.
view, the knowledge of glottal motion during human breathing is of primary interest inorder to assess the filtration efficiency of the upper airways.

50 CHAPTER I.1. BACKGROUND AND MOTIVATION

Chapter I.2
Impact of the Glottis DuringBreathing
This chapter provides a state-of-the-art focused on the vocal-fold kinematics observedduring human breathing (section I.2.1), its influence on the airflow occurring in the laryn-geal/tracheal region (section I.2.2), and on the aerosols deposition in the upper airways(section I.2.3).
Note that the review covers the three common approaches in scientific research:
• In vivo studies, which provide experimental results from real living subjects. The ap-plied methodology is often connected with strict legislation, high financial demands,inter- and intra-subject variability and needs to obtain informed consent.
• In vitro studies, which allow less expensive measurements, easier handling, feasibilityand reproducibility through simplified laboratory experiments.
• In silico studies, which afford the possibility to set arbitrary boundary conditions,and to predict data not always reachable by the experiments, through numeri-cal/theoretical modeling.
2.1 Glottal Motion Observed During Breathing
This section presents the current knowledge gained from in vivo studies, upon (1) theglottal kinematics observed under healthy and pathological breathing conditions, (2) thedetected dimensions of the glottal area, and (3) the relationships between glottal openingand airflow rate.
51
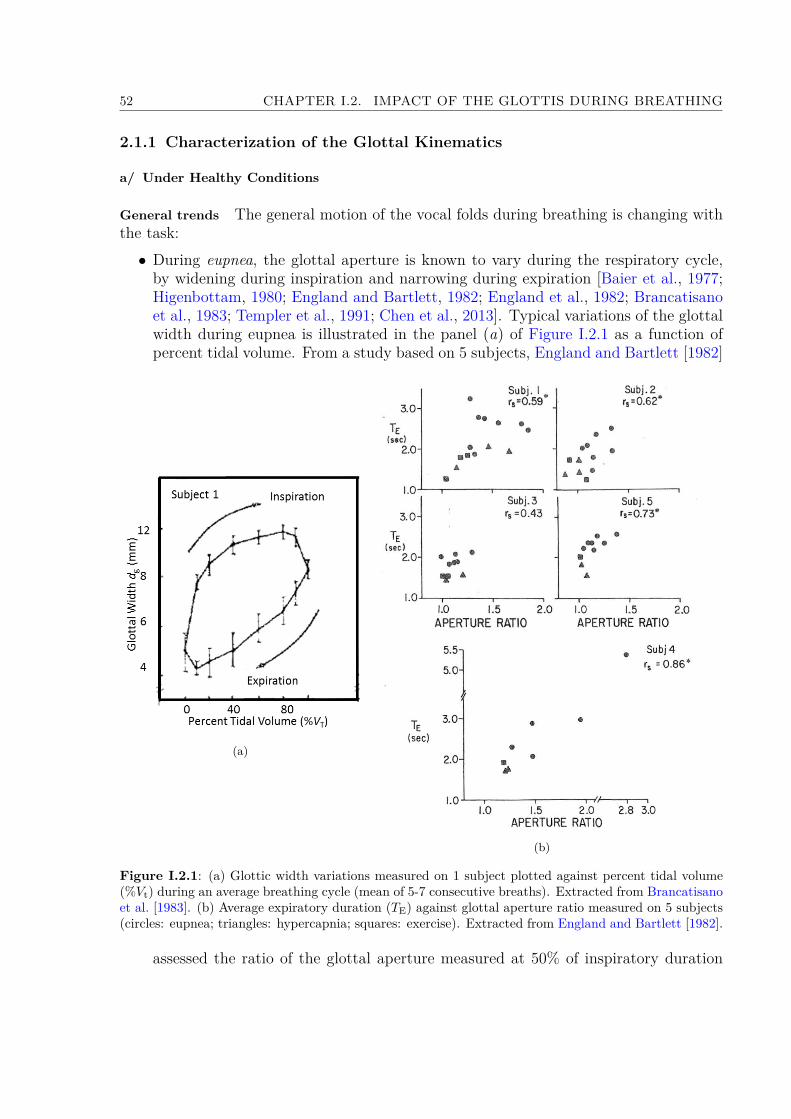
52 CHAPTER I.2. IMPACT OF THE GLOTTIS DURING BREATHING
2.1.1 Characterization of the Glottal Kinematics
a/ Under Healthy Conditions
General trends The general motion of the vocal folds during breathing is changing withthe task:• During eupnea, the glottal aperture is known to vary during the respiratory cycle,by widening during inspiration and narrowing during expiration [Baier et al., 1977;Higenbottam, 1980; England and Bartlett, 1982; England et al., 1982; Brancatisanoet al., 1983; Templer et al., 1991; Chen et al., 2013]. Typical variations of the glottalwidth during eupnea is illustrated in the panel (a) of Figure I.2.1 as a function ofpercent tidal volume. From a study based on 5 subjects, England and Bartlett [1982]
(a)
(b)
Figure I.2.1: (a) Glottic width variations measured on 1 subject plotted against percent tidal volume(%Vt) during an average breathing cycle (mean of 5-7 consecutive breaths). Extracted from Brancatisanoet al. [1983]. (b) Average expiratory duration (TE) against glottal aperture ratio measured on 5 subjects(circles: eupnea; triangles: hypercapnia; squares: exercise). Extracted from England and Bartlett [1982].
assessed the ratio of the glottal aperture measured at 50% of inspiratory duration
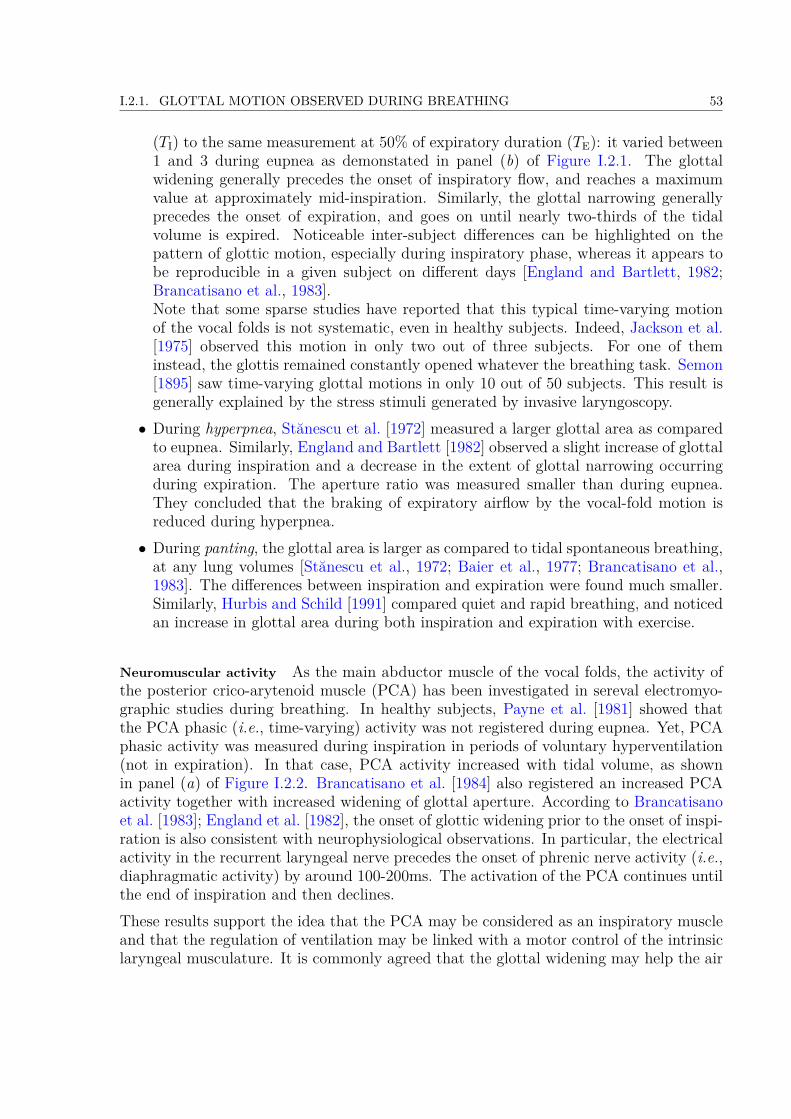
I.2.1. GLOTTAL MOTION OBSERVED DURING BREATHING 53
(TI) to the same measurement at 50% of expiratory duration (TE): it varied between1 and 3 during eupnea as demonstated in panel (b) of Figure I.2.1. The glottalwidening generally precedes the onset of inspiratory flow, and reaches a maximumvalue at approximately mid-inspiration. Similarly, the glottal narrowing generallyprecedes the onset of expiration, and goes on until nearly two-thirds of the tidalvolume is expired. Noticeable inter-subject differences can be highlighted on thepattern of glottic motion, especially during inspiratory phase, whereas it appears tobe reproducible in a given subject on different days [England and Bartlett, 1982;Brancatisano et al., 1983].Note that some sparse studies have reported that this typical time-varying motionof the vocal folds is not systematic, even in healthy subjects. Indeed, Jackson et al.[1975] observed this motion in only two out of three subjects. For one of theminstead, the glottis remained constantly opened whatever the breathing task. Semon[1895] saw time-varying glottal motions in only 10 out of 50 subjects. This result isgenerally explained by the stress stimuli generated by invasive laryngoscopy.• During hyperpnea, Stănescu et al. [1972] measured a larger glottal area as comparedto eupnea. Similarly, England and Bartlett [1982] observed a slight increase of glottalarea during inspiration and a decrease in the extent of glottal narrowing occurringduring expiration. The aperture ratio was measured smaller than during eupnea.They concluded that the braking of expiratory airflow by the vocal-fold motion isreduced during hyperpnea.• During panting, the glottal area is larger as compared to tidal spontaneous breathing,at any lung volumes [Stănescu et al., 1972; Baier et al., 1977; Brancatisano et al.,1983]. The differences between inspiration and expiration were found much smaller.Similarly, Hurbis and Schild [1991] compared quiet and rapid breathing, and noticedan increase in glottal area during both inspiration and expiration with exercise.
Neuromuscular activity As the main abductor muscle of the vocal folds, the activity ofthe posterior crico-arytenoid muscle (PCA) has been investigated in sereval electromyo-graphic studies during breathing. In healthy subjects, Payne et al. [1981] showed thatthe PCA phasic (i.e., time-varying) activity was not registered during eupnea. Yet, PCAphasic activity was measured during inspiration in periods of voluntary hyperventilation(not in expiration). In that case, PCA activity increased with tidal volume, as shownin panel (a) of Figure I.2.2. Brancatisano et al. [1984] also registered an increased PCAactivity together with increased widening of glottal aperture. According to Brancatisanoet al. [1983]; England et al. [1982], the onset of glottic widening prior to the onset of inspi-ration is also consistent with neurophysiological observations. In particular, the electricalactivity in the recurrent laryngeal nerve precedes the onset of phrenic nerve activity (i.e.,diaphragmatic activity) by around 100-200ms. The activation of the PCA continues untilthe end of inspiration and then declines.These results support the idea that the PCA may be considered as an inspiratory muscleand that the regulation of ventilation may be linked with a motor control of the intrinsiclaryngeal musculature. It is commonly agreed that the glottal widening may help the air

54 CHAPTER I.2. IMPACT OF THE GLOTTIS DURING BREATHING
Figure I.2.2: Inspiratory electromyographic activity of PCA during hyperventilation infunction of the tidal volume for (a) healthy subjects and (b) patients with airflow
obstruction. From Payne et al. [1981].
intake during inspiration, to minimize the upper airways resistance to flow. By contrast,the glottal narrowing is interpreted as a metabolically inexpensive aid to modulate theexpiratory airflow and control the rate at which the lungs return to their resting volume[England et al., 1982; Brancatisano et al., 1983; Templer et al., 1991].
b/ Under Pathological Conditions
General trends In the presence of experimentally induced bronchoconstriction or airflowobstruction due to lung disease, the vocal-fold narrowing during expiration is enhanced,as shown in Higenbottam [1980]. These observations are in agreement with the increasedexpiratory laryngeal resistance observed during eupnea in patients with airflow obstruc-tion [Campbell et al., 1976], as also observed during pursed lip breathing. In healthysubjects, the resistance across the upper airways is reported around 1cmH20/L/s duringquiet breathing, whereas it is on the order of 4 to 15 mmH20/L/s in most patients withupper airway obstruction [Templer et al., 1991]. In the later study, it was shown that witha glottal area Ag below 50 mm2, the pressures needed to generate normal airflows increasesignificantly, which is symptomatic of clinical trouble. Typically, for airflow rates rangingfrom 30 to 50 L/min, values of such "abnormal" pressures range from 10 to 29 mm H20for Ag = 42.5 mm2, as shown on Figure I.2.3. Finally, it is interesting to note that vocalfold dysfunction, also referred to as paradoxical vocal fold motion (PVFM) in othorhino-laryngology, and defined as an intermittent, abnormal adduction of the vocal folds duringrespiration, frequently co-exits with asthma [Jain et al., 2006; Benninger et al., 2011].
Neuromuscular activity In constrast with healthy subjects, a time-varying PCA inspira-tory activity was recorded by Payne et al. [1981] during eupnea in patients with airflow

I.2.1. GLOTTAL MOTION OBSERVED DURING BREATHING 55
Figure I.2.3: Airflow rate against pressure difference across the vocal folds placed inbreathing configuration for varying degrees of laryngeal obstruction. Glottal areas are
parametrically varied between 29 mm2 and 66.5 mm2. Measurements performed on 5 freshcadaveric larynges, extracted from Templer et al. [1991].
obstruction. In that case, the PCA activity failed to increase during voluntary hyperven-tilation, as shown in panel (b) of Figure I.2.2. Besides, at low tidal volumes, the PCAactivity was measured nearly twice the value for healthy subjects at comparable tidalvolumes.
2.1.2 Measurement of Glottal Dimensions
Depending on the subjects’ characteristics (age, gender, body mass index, lung volumes),the breathing task and the chosen means of investigation (fibroscopy, MRI, acousticsreflection technique), different ranges of values have been measured for the glottal areaAg in adult healthy subjects (as defined in section I.1.1.2.c):• Average value in the order of 50 mm2 - Baier et al. [1977] provided one of the firstdirect dimensions of the vocal folds during eupnea and tachypnea (100 breaths/min)using fiberoptic cinelaryngoscopy (16Hz). Magnification of the camera optics was cal-culated using 1 mm diameter Teflon particles placed on the vocal folds as a reference.The measurements performed on 6 subjects (4 females, 2 males) are summarized inTable I.2.1, with a mean low value of 46 mm2 for males in eupnea.• Average value in the order of 100 mm2 - Brancatisano et al. [1983] measured realdimensions of glottal area during eupnea on 10 males and 2 females using nasofi-broscopy, assuming that the glottal antero-posterior diameter APg remains constant(see Figure I.1.5). Area Ag increased during inspiration up to 126 ± 8 mm2 (meanvalue ± standard deviation), whereas during expiration it decreased down to 70 ±7 mm2. Thereby, according to this work, the glottic area oscillates about a mean of98 mm2 during eupnea. Recently, using nasofibroscopy, Chen et al. [2013] observedmaximal peaks of glottal area during inspiration varying between 71 and 135 mm2
on 8 subjects (mean value 98 ± 29 mm2), and minimal peak areas during expiration

56 CHAPTER I.2. IMPACT OF THE GLOTTIS DURING BREATHING
varying between 11 and 115 mm2 (mean value 76 ± 28 mm2). Finding a similarrange of values, Pritchard and McRobbie [2004] used MRI to measure mean glottalarea Ag on 10 females (Ag = 79.3 mm2) and 10 males (Ag = 131.8 mm2), near thepoint of maximum inflow.• Average value in the order of 200 mm2 - Rubinstein et al. [1989] measured changes inglottal cross-sectional area of 44 subjects using acoustic reflection technique. Subjectswere instructed to inspire to total lung capacity (TLC) and then expire slowly toresidual volume (RV) (hyperpnea task). The expiratory flow rate was kept relativelyconstant, between 500 and 700 mL/s. The authors found a value ranging between137 and 207 mm2 by 19 females (mean value of 194 ± 34 mm2 at 50% of vital capacity(V C)), and between 144 and 231 mm2 by 25 males (mean value of 185 ± 54 mm2 at50% of V C). The obtained data are summarized in Figure I.2.4, showing peak Agvalues over 300 mm2. Using the same investigation technique, a more recent study
Figure I.2.4: Glottic cross-section area Ag measured by Rubinstein et al. [1989].Measurements performed on 44 subjects, at total lung capacity (TLC), 50% of vitalcapacity (VC) and residual volume (RV). Extracted from Rubinstein et al. [1989].
has been performed on 60 male and 54 female subjects at the onset of inspiration(flow rate Q = 0 L/min) by Martin et al. [1997]. The mean area Ag was assessedat 170 mm2 (at both seated and supine position). Note that in this latter work,the accuracy of the acoustic reflection technique was validated using both in vitromodels and in vivo comparison with MRI technique, when area measurements werefound to be within 10%.
In the literature, note that a mean Ag value ranging between 90-100 mm2, as measured byBrancatisano et al. [1983] during eupnea, is often chosen as a reference, so as to conductnumerical simulations or in vitro measurements in upper airway models of healthy adult
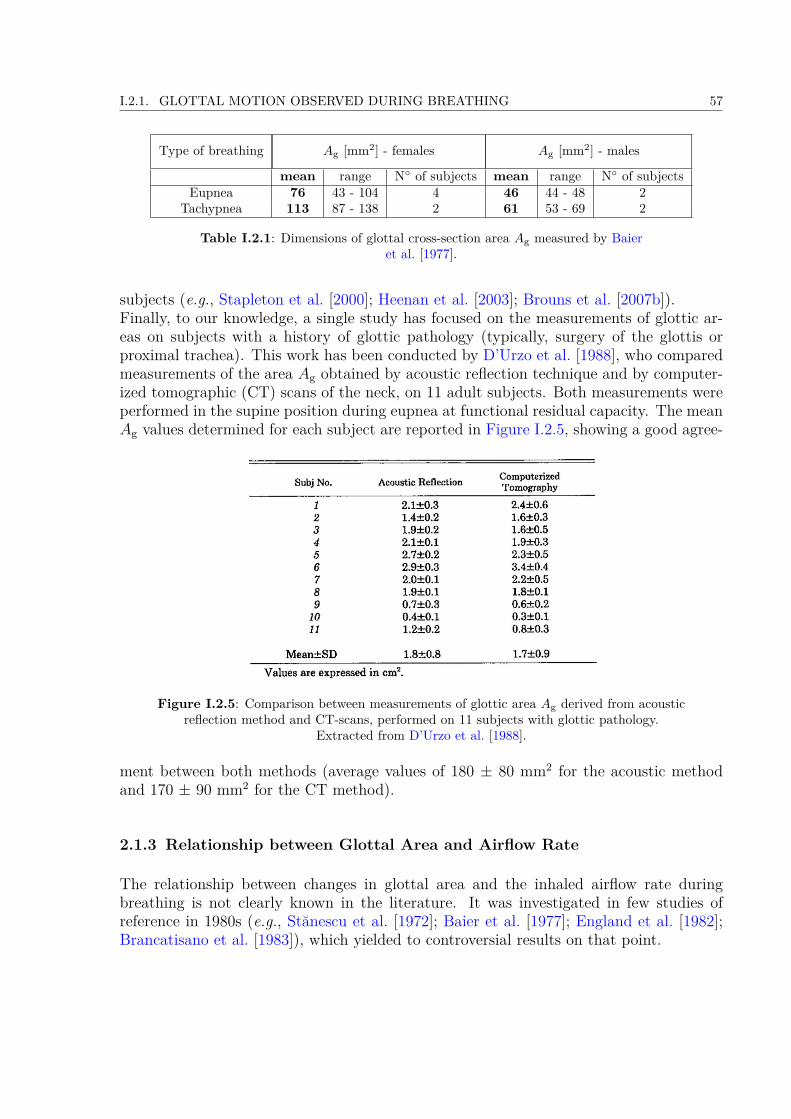
I.2.1. GLOTTAL MOTION OBSERVED DURING BREATHING 57
Type of breathing Ag [mm2] - females Ag [mm2] - males
mean range N of subjects mean range N of subjectsEupnea 76 43 - 104 4 46 44 - 48 2
Tachypnea 113 87 - 138 2 61 53 - 69 2
Table I.2.1: Dimensions of glottal cross-section area Ag measured by Baieret al. [1977].
subjects (e.g., Stapleton et al. [2000]; Heenan et al. [2003]; Brouns et al. [2007b]).Finally, to our knowledge, a single study has focused on the measurements of glottic ar-eas on subjects with a history of glottic pathology (typically, surgery of the glottis orproximal trachea). This work has been conducted by D’Urzo et al. [1988], who comparedmeasurements of the area Ag obtained by acoustic reflection technique and by computer-ized tomographic (CT) scans of the neck, on 11 adult subjects. Both measurements wereperformed in the supine position during eupnea at functional residual capacity. The meanAg values determined for each subject are reported in Figure I.2.5, showing a good agree-
Figure I.2.5: Comparison between measurements of glottic area Ag derived from acousticreflection method and CT-scans, performed on 11 subjects with glottic pathology.
Extracted from D’Urzo et al. [1988].
ment between both methods (average values of 180 ± 80 mm2 for the acoustic methodand 170 ± 90 mm2 for the CT method).
2.1.3 Relationship between Glottal Area and Airflow Rate
The relationship between changes in glottal area and the inhaled airflow rate duringbreathing is not clearly known in the literature. It was investigated in few studies ofreference in 1980s (e.g., Stănescu et al. [1972]; Baier et al. [1977]; England et al. [1982];Brancatisano et al. [1983]), which yielded to controversial results on that point.

58 CHAPTER I.2. IMPACT OF THE GLOTTIS DURING BREATHING
In Stănescu et al. [1972], a positive significant correlation was found between glottisopening, lung volume and airflow rate. England et al. [1982] found a positive correlationbetween the average expiratory airflow from 75 to 25 % of the tidal volume and the meanglottal aperture during this interval. Therefore, according to the authors, a decrease inairflow is correlated with a decrease in the distance between the vocal folds.
By contrast however, Baier et al. [1977] did not find any correlation between inspiratoryand expiratory flow with glottis dimensions during eupnea and breathing with increasedfrequencies. Similarly, no correlation was observed within a breath between airflow andglottic width in the reference study by Brancatisano et al. [1983]. In this latter work, dur-ing inspiration, both glottic width between the apexes of the arytenoid cartilages (dg) andflow rate increased to a maximum value, and then decreased. However, the rise and fallof these two variables was not closely correlated. Furthermore, the volume correspondingto dmax
g and maximal flow rate rarely coincided. Similarly, during expiration, flow rateand dg showed no consistent relationship.
2.2 Impact of the Glottis on Airflow in Upper Airways
The impact of the vocal-fold constriction on the airflow occurring in the human upperairways has been intensively investigated since the 1960s. In this section, a survey ofthe main in vitro and in silico studies which allowed to gain insight on this subject ispresented.
2.2.1 In Vitro Studies
To overcome the limitations of in vivo test conditions, studies using artificial experimentallarynges increased from the last 50 years. In 1957, Van den Berg et al. [1957] publisheda study of a static model of the vocal tract, in which flow resistance and Bernoulli effectwithin the glottal constriction were investigated. Since then (up to nowadays), many invitro devices were developped to mimic the vocal-fold self-sustained vibrations as observedduring human phonation, in order to better understand the fluid/structure interactionstaking place within the laryngeal acoustical source. In comparison, the in vitro stud-ies dealing with the glottis in breathing configuration are far less numerous. However,some pioneer studies in the 1960s-1980s allowed to highlight the impact of the glottison breathing airflow properties. The main phonation- and breathing-related studies aresummarized thereafter.
a/ Phonation-related Studies
Since 1960s, three main groups of mechanical replica of the larynx can be found in thephonation-related studies (e.g., see a review in Ruty et al. [2007] and Kniesburges et al.[2011]):
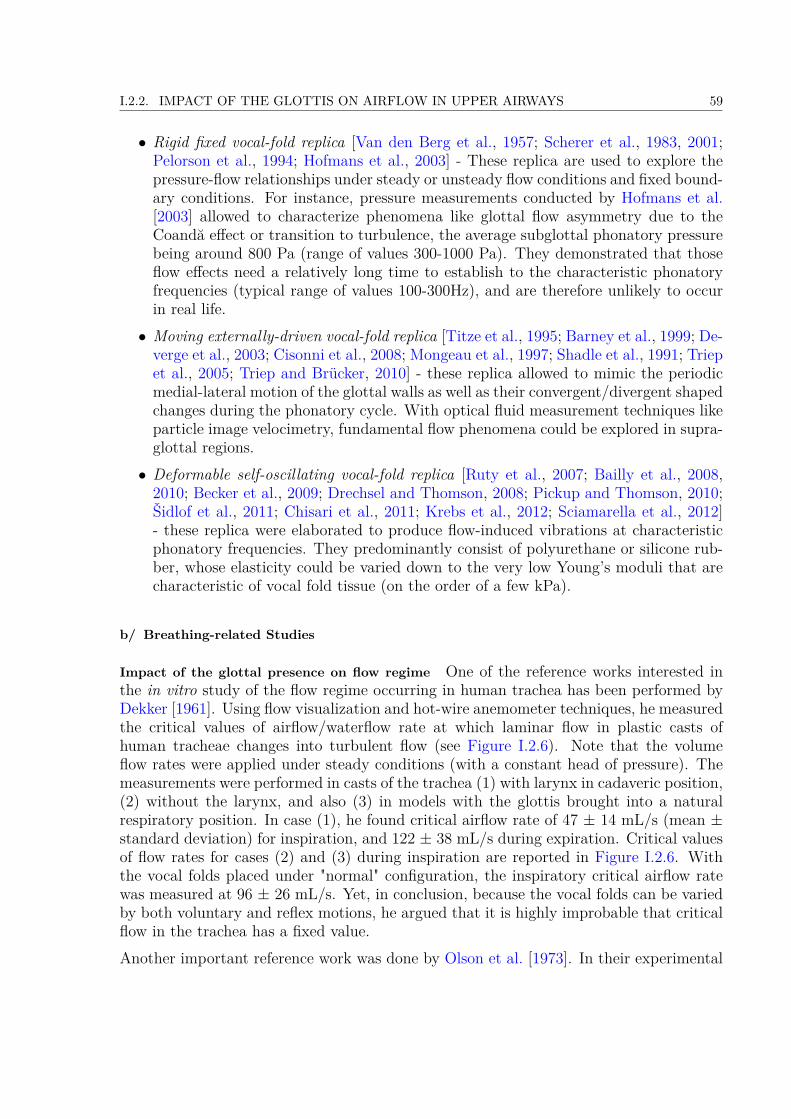
I.2.2. IMPACT OF THE GLOTTIS ON AIRFLOW IN UPPER AIRWAYS 59
• Rigid fixed vocal-fold replica [Van den Berg et al., 1957; Scherer et al., 1983, 2001;Pelorson et al., 1994; Hofmans et al., 2003] - These replica are used to explore thepressure-flow relationships under steady or unsteady flow conditions and fixed bound-ary conditions. For instance, pressure measurements conducted by Hofmans et al.[2003] allowed to characterize phenomena like glottal flow asymmetry due to theCoandă effect or transition to turbulence, the average subglottal phonatory pressurebeing around 800 Pa (range of values 300-1000 Pa). They demonstrated that thoseflow effects need a relatively long time to establish to the characteristic phonatoryfrequencies (typical range of values 100-300Hz), and are therefore unlikely to occurin real life.• Moving externally-driven vocal-fold replica [Titze et al., 1995; Barney et al., 1999; De-verge et al., 2003; Cisonni et al., 2008; Mongeau et al., 1997; Shadle et al., 1991; Triepet al., 2005; Triep and Brücker, 2010] - these replica allowed to mimic the periodicmedial-lateral motion of the glottal walls as well as their convergent/divergent shapedchanges during the phonatory cycle. With optical fluid measurement techniques likeparticle image velocimetry, fundamental flow phenomena could be explored in supra-glottal regions.• Deformable self-oscillating vocal-fold replica [Ruty et al., 2007; Bailly et al., 2008,2010; Becker et al., 2009; Drechsel and Thomson, 2008; Pickup and Thomson, 2010;Šidlof et al., 2011; Chisari et al., 2011; Krebs et al., 2012; Sciamarella et al., 2012]- these replica were elaborated to produce flow-induced vibrations at characteristicphonatory frequencies. They predominantly consist of polyurethane or silicone rub-ber, whose elasticity could be varied down to the very low Young’s moduli that arecharacteristic of vocal fold tissue (on the order of a few kPa).
b/ Breathing-related Studies
Impact of the glottal presence on flow regime One of the reference works interested inthe in vitro study of the flow regime occurring in human trachea has been performed byDekker [1961]. Using flow visualization and hot-wire anemometer techniques, he measuredthe critical values of airflow/waterflow rate at which laminar flow in plastic casts ofhuman tracheae changes into turbulent flow (see Figure I.2.6). Note that the volumeflow rates were applied under steady conditions (with a constant head of pressure). Themeasurements were performed in casts of the trachea (1) with larynx in cadaveric position,(2) without the larynx, and also (3) in models with the glottis brought into a naturalrespiratory position. In case (1), he found critical airflow rate of 47 ± 14 mL/s (mean ±standard deviation) for inspiration, and 122 ± 38 mL/s during expiration. Critical valuesof flow rates for cases (2) and (3) during inspiration are reported in Figure I.2.6. Withthe vocal folds placed under "normal" configuration, the inspiratory critical airflow ratewas measured at 96 ± 26 mL/s. Yet, in conclusion, because the vocal folds can be variedby both voluntary and reflex motions, he argued that it is highly improbable that criticalflow in the trachea has a fixed value.Another important reference work was done by Olson et al. [1973]. In their experimental

60 CHAPTER I.2. IMPACT OF THE GLOTTIS DURING BREATHING
Figure I.2.6: Measurements of critical flow rate through transparent plastic casts ofhuman tracheae for different fluid (air, water) and geometrical conditions (without larynx,
with glottis included). Extracted from Dekker [1961].
study conducted on cast replicas of the human airway system (from the mouth to subseg-mental bronchi) under steady flow conditions, it is reported that (i) the flow is generallylaminar in the mouth for inspiratory rates below 200 mL/s; (ii) the onset of instabilities inthe flow occurs at 700 to 800 mL/s in the pharynx; (iii) it occurs at 400 to 500 mL/s in theupper part of the larynx; (iv) and at 150 mL/s in the area just below the larynx. Duringeupnea at an inspiratory volume flow of 500 mL/s, they determined a mean Reynoldsnumber of about 2000 in the larynx (peak value around 4000) and an average velocityvarying from 5 to 7 m/sec, as shown in Figure I.2.7. Figure I.2.8 illustrates the velocity
Figure I.2.7: Variations of the Reynolds number and the average airflow velocity in theupper airways during eupnea at an inspiratory volume flow of 500 mL/s. Extracted from
Olson et al. [1973].
profiles measured in the larynx region for the lateral and antero-posterior planes duringeupnea at 600 mL/s. Orders of magnitude of flow velocity are given, as well as main flowfeatures, like the reversed flow pattern below each vocal fold.
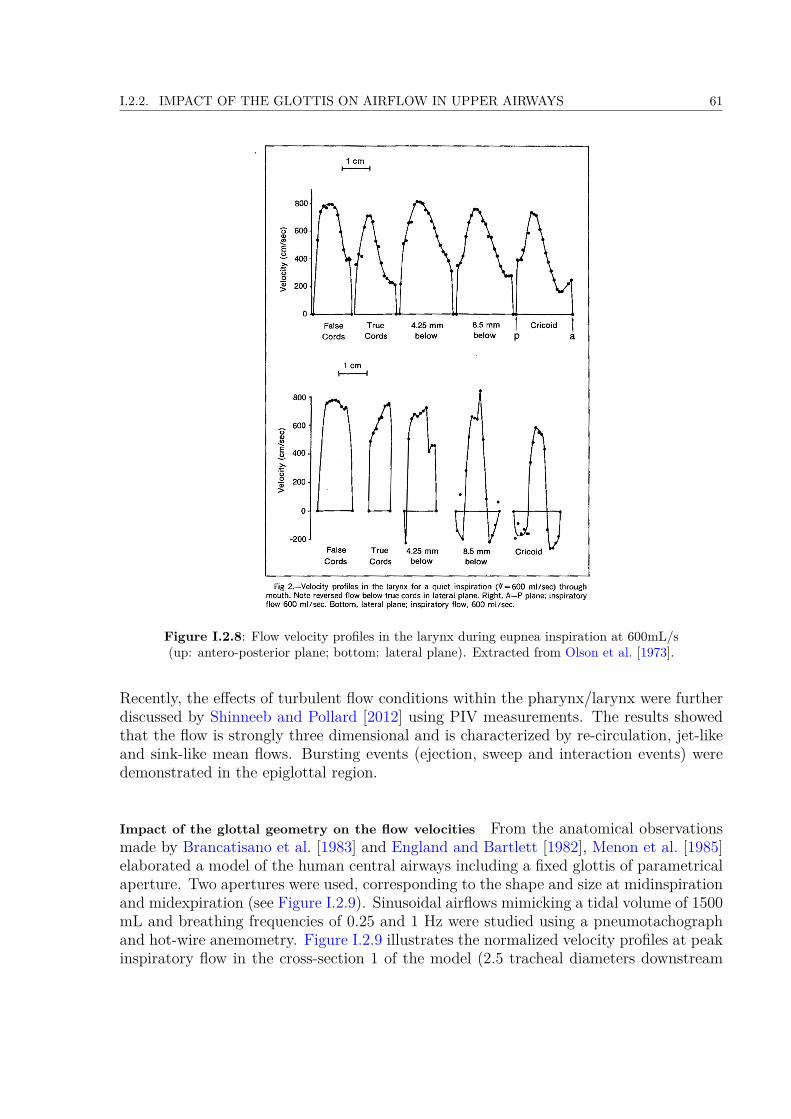
I.2.2. IMPACT OF THE GLOTTIS ON AIRFLOW IN UPPER AIRWAYS 61
Figure I.2.8: Flow velocity profiles in the larynx during eupnea inspiration at 600mL/s(up: antero-posterior plane; bottom: lateral plane). Extracted from Olson et al. [1973].
Recently, the effects of turbulent flow conditions within the pharynx/larynx were furtherdiscussed by Shinneeb and Pollard [2012] using PIV measurements. The results showedthat the flow is strongly three dimensional and is characterized by re-circulation, jet-likeand sink-like mean flows. Bursting events (ejection, sweep and interaction events) weredemonstrated in the epiglottal region.
Impact of the glottal geometry on the flow velocities From the anatomical observationsmade by Brancatisano et al. [1983] and England and Bartlett [1982], Menon et al. [1985]elaborated a model of the human central airways including a fixed glottis of parametricalaperture. Two apertures were used, corresponding to the shape and size at midinspirationand midexpiration (see Figure I.2.9). Sinusoidal airflows mimicking a tidal volume of 1500mL and breathing frequencies of 0.25 and 1 Hz were studied using a pneumotachographand hot-wire anemometry. Figure I.2.9 illustrates the normalized velocity profiles at peakinspiratory flow in the cross-section 1 of the model (2.5 tracheal diameters downstream
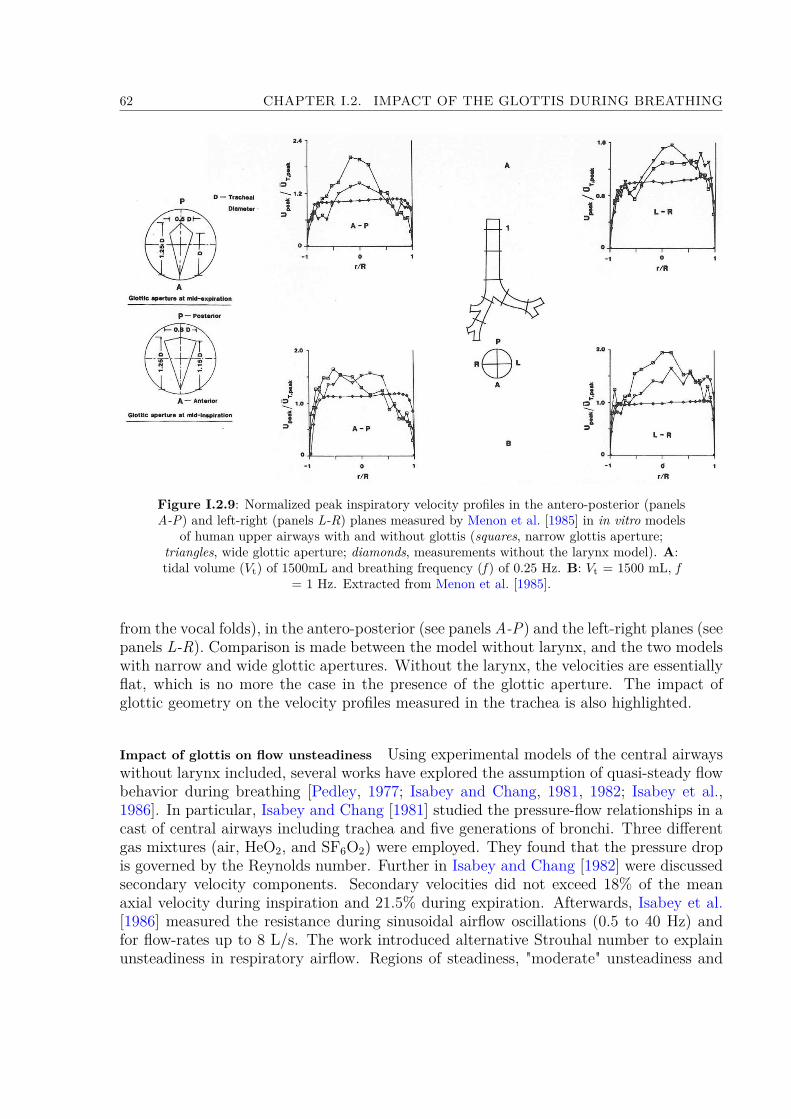
62 CHAPTER I.2. IMPACT OF THE GLOTTIS DURING BREATHING
Figure I.2.9: Normalized peak inspiratory velocity profiles in the antero-posterior (panelsA-P) and left-right (panels L-R) planes measured by Menon et al. [1985] in in vitro models
of human upper airways with and without glottis (squares, narrow glottis aperture;triangles, wide glottic aperture; diamonds, measurements without the larynx model). A:tidal volume (Vt) of 1500mL and breathing frequency (f ) of 0.25 Hz. B: Vt = 1500 mL, f
= 1 Hz. Extracted from Menon et al. [1985].
from the vocal folds), in the antero-posterior (see panels A-P) and the left-right planes (seepanels L-R). Comparison is made between the model without larynx, and the two modelswith narrow and wide glottic apertures. Without the larynx, the velocities are essentiallyflat, which is no more the case in the presence of the glottic aperture. The impact ofglottic geometry on the velocity profiles measured in the trachea is also highlighted.
Impact of glottis on flow unsteadiness Using experimental models of the central airwayswithout larynx included, several works have explored the assumption of quasi-steady flowbehavior during breathing [Pedley, 1977; Isabey and Chang, 1981, 1982; Isabey et al.,1986]. In particular, Isabey and Chang [1981] studied the pressure-flow relationships in acast of central airways including trachea and five generations of bronchi. Three differentgas mixtures (air, HeO2, and SF6O2) were employed. They found that the pressure dropis governed by the Reynolds number. Further in Isabey and Chang [1982] were discussedsecondary velocity components. Secondary velocities did not exceed 18% of the meanaxial velocity during inspiration and 21.5% during expiration. Afterwards, Isabey et al.[1986] measured the resistance during sinusoidal airflow oscillations (0.5 to 40 Hz) andfor flow-rates up to 8 L/s. The work introduced alternative Strouhal number to explainunsteadiness in respiratory airflow. Regions of steadiness, "moderate" unsteadiness and

I.2.2. IMPACT OF THE GLOTTIS ON AIRFLOW IN UPPER AIRWAYS 63
"dominant" unsteadiness were thereby identified.The impact of the larynx inclusion in the models upon the quasi-steady flow propertieswas discussed in Menon et al. [1985]. They compared the peak oscillatory velocity profilesdescribed in the previous section with the ones obtained in steady flow at the correspond-ing Reynolds number (Re = 8830). Figure I.2.10 Some differences in velocity magnitude
illustrates the comparison obtained on profiles at several stations of the in vitro model including thewide glottal aperture.
Figure I.2.10: Comparison between the peak inspiratory oscillatory velocity profiles withsteady velocity profile at equivalent Reynolds number of 8830 (Vt = 1500 mL, f = 1 Hz;squares, steady flow; triangles, peak oscilatory flow). Extracted from Menon et al. [1985].
are demonstrated between steady and unsteady modes of breathing, albeit assigned tothe inability to match the peak oscillatory flow exactly with the steady-flow value.
2.2.2 In Silico Studies
Similarly to the in vitro studies, there exists numerous works dedicated to the laryn-geal flow from the standpoint of phonation, i.e., during the vocal-fold vibrations. Thefluid/structure models developed in this context are not directly usable to simulate breath-ing aerodynamics due to the high differences in the vocal-fold kinematics for both cases.Therefore, since the 1990s, another series of computational fluid dynamics (CFD) mod-els has been implemented to investigate the flow field in human upper airways duringbreathing. A survey of the main phonation- and breathing-related in silico studies issummarized thereafter.
a/ Phonation-related Studies
During the last four decades, numerous theoretical and computational works have pro-vided a detailed analysis of the glottal-jet spatio-temporal features during vocal-fold vibra-tions as observed in human phonation [Titze, 1994; Alipour et al., 2011]. In particular,the moving flow separation point at the glottal walls, the pulsatile glottal waveforms,flow unsteady properties, the cycle-to-cycle asymmetric deflection in the supraglottal re-gion and the aerodynamic forces acting on the vocal-fold tissues have been extensivelydescribed. By order of complexity, the vocal-folds’ dynamics were firstly simplified by
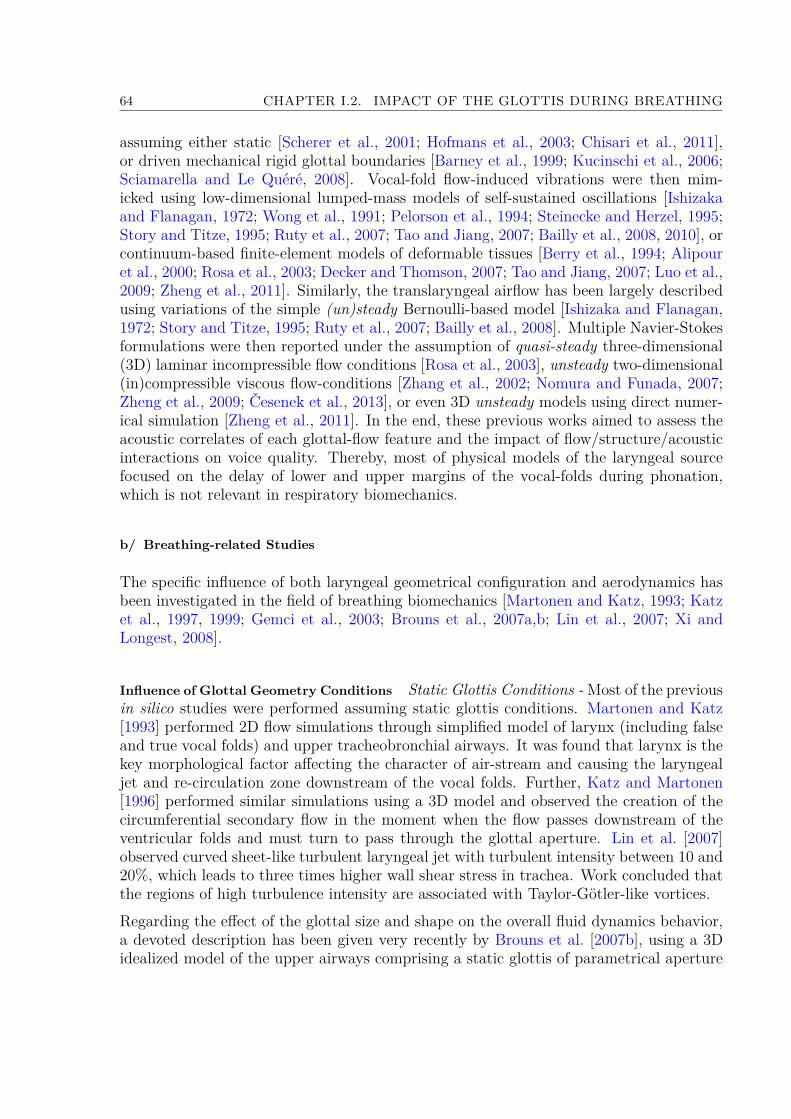
64 CHAPTER I.2. IMPACT OF THE GLOTTIS DURING BREATHING
assuming either static [Scherer et al., 2001; Hofmans et al., 2003; Chisari et al., 2011],or driven mechanical rigid glottal boundaries [Barney et al., 1999; Kucinschi et al., 2006;Sciamarella and Le Quéré, 2008]. Vocal-fold flow-induced vibrations were then mim-icked using low-dimensional lumped-mass models of self-sustained oscillations [Ishizakaand Flanagan, 1972; Wong et al., 1991; Pelorson et al., 1994; Steinecke and Herzel, 1995;Story and Titze, 1995; Ruty et al., 2007; Tao and Jiang, 2007; Bailly et al., 2008, 2010], orcontinuum-based finite-element models of deformable tissues [Berry et al., 1994; Alipouret al., 2000; Rosa et al., 2003; Decker and Thomson, 2007; Tao and Jiang, 2007; Luo et al.,2009; Zheng et al., 2011]. Similarly, the translaryngeal airflow has been largely describedusing variations of the simple (un)steady Bernoulli-based model [Ishizaka and Flanagan,1972; Story and Titze, 1995; Ruty et al., 2007; Bailly et al., 2008]. Multiple Navier-Stokesformulations were then reported under the assumption of quasi-steady three-dimensional(3D) laminar incompressible flow conditions [Rosa et al., 2003], unsteady two-dimensional(in)compressible viscous flow-conditions [Zhang et al., 2002; Nomura and Funada, 2007;Zheng et al., 2009; Česenek et al., 2013], or even 3D unsteady models using direct numer-ical simulation [Zheng et al., 2011]. In the end, these previous works aimed to assess theacoustic correlates of each glottal-flow feature and the impact of flow/structure/acousticinteractions on voice quality. Thereby, most of physical models of the laryngeal sourcefocused on the delay of lower and upper margins of the vocal-folds during phonation,which is not relevant in respiratory biomechanics.
b/ Breathing-related Studies
The specific influence of both laryngeal geometrical configuration and aerodynamics hasbeen investigated in the field of breathing biomechanics [Martonen and Katz, 1993; Katzet al., 1997, 1999; Gemci et al., 2003; Brouns et al., 2007a,b; Lin et al., 2007; Xi andLongest, 2008].
Influence of Glottal Geometry Conditions Static Glottis Conditions -Most of the previousin silico studies were performed assuming static glottis conditions. Martonen and Katz[1993] performed 2D flow simulations through simplified model of larynx (including falseand true vocal folds) and upper tracheobronchial airways. It was found that larynx is thekey morphological factor affecting the character of air-stream and causing the laryngealjet and re-circulation zone downstream of the vocal folds. Further, Katz and Martonen[1996] performed similar simulations using a 3D model and observed the creation of thecircumferential secondary flow in the moment when the flow passes downstream of theventricular folds and must turn to pass through the glottal aperture. Lin et al. [2007]observed curved sheet-like turbulent laryngeal jet with turbulent intensity between 10 and20%, which leads to three times higher wall shear stress in trachea. Work concluded thatthe regions of high turbulence intensity are associated with Taylor-Götler-like vortices.Regarding the effect of the glottal size and shape on the overall fluid dynamics behavior,a devoted description has been given very recently by Brouns et al. [2007b], using a 3Didealized model of the upper airways comprising a static glottis of parametrical aperture
I.2.2. IMPACT OF THE GLOTTIS ON AIRFLOW IN UPPER AIRWAYS 65
(area of 45 or 90 mm2). Three different laryngeal geometries with different shapes ofglottal aperture - circular, elliptical and triangular were studied (see Figure I.2.11). Flow
Figure I.2.11: Upper Airways geometry with different shapes of glottal aperture andresulting pressure drop variations found by Brouns et al. [2007b] (upper panel, steady flow
at 15 L/min; lower panel, steady flow at 30 L/min).
rates of 15 and 30 L/min were simulated. This work shows that the interaction betweenthe size and shape of the glottal aperture and the geometry of the mouth-throat model iscrucial to the overall fluid dynamics. The predicted pressure drop along the oropharyn-geal pathway is illustrated in Figure I.2.11. For the circular glottis (cross-section area of90 mm2), pressure drops at the glottis were predicted at 10 Pa (38 Pa) for the flow-rateof 15 L/min (30 L/min). Finally, Brouns et al. [2007b] suggested the needs for renderingmore realistic geometry including moving boundaries in the glottal area.
Time-varying Glottis Conditions - To our knowledge, a single study considered an oscil-latory flow simulated through driven glottal boundaries [Renotte et al., 2000], albeit in a3D laryngeal tube isolated from the global upper airway geometry. Pseudo-time-varyingglottic aperture and flow inlet conditions were set, with a peak flow rate of 0.75 L/s andoscillation frequency of 0.25 Hz. The respiratory cycle was modelled by a succession of 14steady situations. The glottal area evolved between 66 and 112 mm2 and the phase shiftbetween flow rate and glottal area signal was set to 25. Depending upon the Reynoldsnumber, either laminar (Re ≤ 1500) and/or turbulent (Re > 1500) flow equations weresolved. Renotte et al. [2000] observed the jet-like behavior and a backflow region es-tablishing in the sagittal plane at one diameter from the glottal constriction, extendingover about 40 mm. Between inspiration and expiration profiles were found only minordifferences.
66 CHAPTER I.2. IMPACT OF THE GLOTTIS DURING BREATHING
Influence of flow properties About the turbulence model - Flow simulations in upper air-ways presented by Ball et al. [2008] showed k−ω model to be the most precise among otherturbulence models. Wang et al. [2009] used on contrary k−ε model. Flow in the laryngealarea resulted in the jet, that impacts on the posterior trachea wall. The pressure drop wasassesed at -80 Pa during inspiration and around 110 Pa during expiration (for flow rate of6 L/min). Turbulence models were also studied by Cui and Gutheil [2011]. In the workwas discussed the suitability of Large Eddy Simulation (LES). The results were comparedwith studies using other turbulent models and also with an experimental model. Themodels compared Reynolds-averaged Navier-Stokes (RANS) coupled with low Reynoldsnumber (LRN) k−ω model used by Zhang and Kleinstreuer [2003], and LRN shear-stresstransport k − ω model used by Jayaraju et al. [2007]. The results of LES model showimprovement in particular in the transitional regime of the laminar-transitional-turbulentflow. The flow visualisation showed the impact of the laryngeal jet on the anterior wallof trachea, where a pair of smaller vortices is created. Location and length scale of thesecondary vortices changed with the location of the laryngeal jet, which indicates that thevortices are also influenced by the laryngeal jet. Recently Elcner et al. [2013] simulatedthe flow in the respiratory system under steady inlet flow rate conditions (15, 30, and 60L/min) using RANS coupled with LRN k − ω model. The laryngeal jet is discussed toimpact tracheal anterior part and affect the flow in the entire trachea. Simulations werecompared to experimental measurements and small differences were found in near-wallarea. The study suggested that this can be influenced by chosen turbulence model.
About the unsteady properties - Two approximations are widely adopted in the numericalstudies of breathing airflow and aerosol transport in upper airways: (i) a mean constantinhalation flow rate (typically 15, 30 and 60 L/min) is often applied at inlet conditions,considering that aerosols’ inhalation only occurs for about one-half of the breathing cycle[Katz et al., 1997, 1999; Stapleton et al., 2000; Finlay, 2001; Brouns et al., 2007a,b;Jayaraju et al., 2007; Xi and Longest, 2007; Zhang and Kleinstreuer, 2011]; and (ii) quasi-steady-state flow conditions are frequently assumed, based on previous experimental datain the central airways showing that unsteadiness is important at the time of zero flow whenexhalation stops and inhalation begins, i.e., on a small portion of the tidal breathing cycle[Olson et al., 1973; Isabey et al., 1986; Finlay, 2001]. However, Jin et al. [2007] showedthat the maximal inflow velocity in the upper airways is 60% higher in the unsteadyrespiration than in the steady mode.
2.3 Impact of the Glottis on Aerosol Transport and Deposition
2.3.1 In vivo Studies
A review summarizing some important in vivo studies related to aerosol deposition inhuman upper airways was published by Stahlhofen et al. [1989]. This work determinedmathematical expressions of regional deposition in function of respiratory variables andparticle size. A deposition of particles mostly located in the laryngeal area is already

I.2.3. IMPACT OF THE GLOTTIS ON AEROSOL TRANSPORT AND DEPOSITION 67
suggested from these early works.
As mentioned in section I.1.4, a recent work was published by Fleming et al. [2011];Conway et al. [2012], using Single Photon Emission Computed Tomography (SPECT) todescribe the deposition of radionucleides in the respiratory system, in three dimensions,and in combination with X-ray computed tomography (CT) to relate deposition to lunganatomy. The results showed that the deposition in the upper airways can reach up to40% of inhaled mass of aerosols in some cases.
2.3.2 In vitro Studies
In the previous experimental studies, the impact of the glottal geometry and kinematicson aerosol deposition was not extensively studied as such. A detailed review of the sparseearlier in vitro studies can be found in Xi and Longest [2008]. However, several works werededicated to the measurement of total and regional deposition in idealized and patient-specific models of human upper airways (neglecting the larynx specificities). These studieswere performed using either gamma scintigraphy [Grgic et al., 2004b; Heenan et al., 2004],gravimetry [Swift et al., 1992], Positron Emission Tomography (PET) [Lízal et al., 2013],fluorescence spectrometry [Cheng et al., 1999] or optical counting [Bělka et al., 2013].Note that some works were dedicated to the characterization of particles’ transport usingPhase Doppler Particle Analyser (P/DPA) [Jedelský et al., 2012].Grgic et al. [2004b] used gamma scintigraphy in several models of human upper airways,at flow rates of 30 and 90 L/min and particle diameters of 3− 6.5µm. They found thataerosols mostly deposit in laryngeal and upper trachea regions. The nasopharyngeal andglottal constrictions were the key morphological factors affecting downstream flow pat-terns and thus deposition. Using similar techniques in Heenan et al. [2004] together withPIV flow measurements, a strong connection was demonstrated between local depositionand local fluid velocity field, characterized at a constant inspiratory flow rate of 90 L/min.The authors concluded that local deposition levels correlate very strongly with local levelsof velocity magnitude and flow curvature, which is consistent with an inertial impactiondeposition mechanism.Lízal et al. [2013] used PET technique in a model of the airways up to the 7th generationof branching, with particle sizes of 2.5 µm and 4.3 µm and three steady flow regimes(15, 30 and 60 L/min). Highest deposition was measured in oral cavity and trachea. Amoderate increase was observed for regimes with higher Stokes numbers.
2.3.3 In Silico Studies
A large amount of in silico studies has been proposed to simulate aerosol deposition inthe upper airways, with varying nano- or micrometric particles, carrier gases and flowmodels and inlet flow conditions (e.g., Stapleton et al. [2000]; Zhang and Kleinstreuer[2004]; Jin et al. [2007]; Xi and Longest [2008]; Sandeau et al. [2010]; Miyawaki et al.
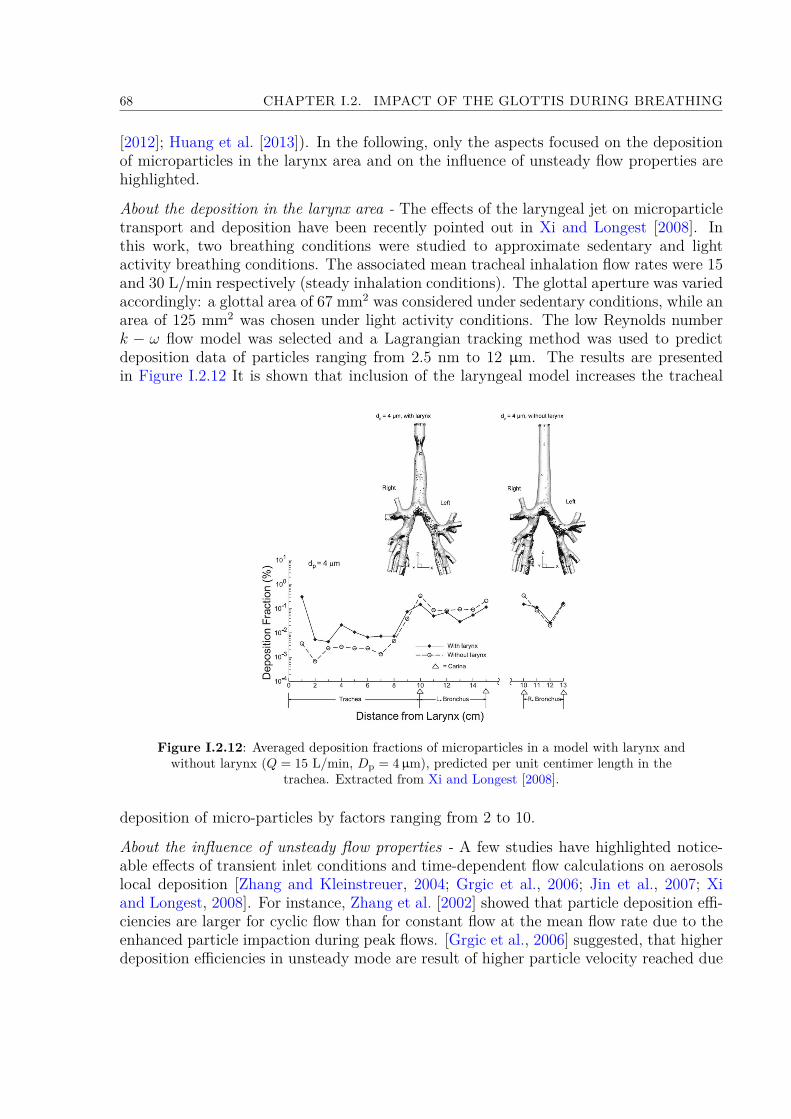
68 CHAPTER I.2. IMPACT OF THE GLOTTIS DURING BREATHING
[2012]; Huang et al. [2013]). In the following, only the aspects focused on the depositionof microparticles in the larynx area and on the influence of unsteady flow properties arehighlighted.
About the deposition in the larynx area - The effects of the laryngeal jet on microparticletransport and deposition have been recently pointed out in Xi and Longest [2008]. Inthis work, two breathing conditions were studied to approximate sedentary and lightactivity breathing conditions. The associated mean tracheal inhalation flow rates were 15and 30 L/min respectively (steady inhalation conditions). The glottal aperture was variedaccordingly: a glottal area of 67 mm2 was considered under sedentary conditions, while anarea of 125 mm2 was chosen under light activity conditions. The low Reynolds numberk − ω flow model was selected and a Lagrangian tracking method was used to predictdeposition data of particles ranging from 2.5 nm to 12 µm. The results are presentedin Figure I.2.12 It is shown that inclusion of the laryngeal model increases the tracheal
Figure I.2.12: Averaged deposition fractions of microparticles in a model with larynx andwithout larynx (Q = 15 L/min, Dp = 4µm), predicted per unit centimer length in the
trachea. Extracted from Xi and Longest [2008].
deposition of micro-particles by factors ranging from 2 to 10.
About the influence of unsteady flow properties - A few studies have highlighted notice-able effects of transient inlet conditions and time-dependent flow calculations on aerosolslocal deposition [Zhang and Kleinstreuer, 2004; Grgic et al., 2006; Jin et al., 2007; Xiand Longest, 2008]. For instance, Zhang et al. [2002] showed that particle deposition effi-ciencies are larger for cyclic flow than for constant flow at the mean flow rate due to theenhanced particle impaction during peak flows. [Grgic et al., 2006] suggested, that higherdeposition efficiencies in unsteady mode are result of higher particle velocity reached due

I.2.3. IMPACT OF THE GLOTTIS ON AEROSOL TRANSPORT AND DEPOSITION 69
to the accelerating flow rate. Similarly, Jin et al. [2007] showed that about 7.5% higherdeposition efficiencies of micron-size particles is found, when unsteady respiration modeis selected (see Figure I.2.13). Recently, Huang et al. [2013] simulated the flow in up-
Figure I.2.13: Comparison of particle deposition efficiencies DE simulated in an upperairway model, assuming unsteady or steady respiration modes. Dp = 5µm, Q = 60 L/min,
particle density of 600 kg/m3. Extracted from Jin et al. [2007].
per airways employing a realistic breathing condition - expansion of the pleural cavity.Comparison with fixed boundary conditions showed that: "(i) the velocity profiles at theinlet are not uniform or axially symetric, but askew with high-speed flow shifted to upperwall, (ii) the pressure drop and turbulence intensity are lower, but the secondary intensityis higher, (iii) at different flow rates (30, 40.8 and 60 L/min) the secondary intensitiescharacteristics are identical before larynx, because low turbulent fluctuations, but in tra-chea were observed discrepancies caused by high level turbulence intensity and differentpattern of recirculation, (iv) the length of recirculation zones increases with flow rate, (v)the peaks of secondary flow intensity in the trachea are found near the flow separationand reattachment points and the peaks of turbulence intensity in the trachea seem tocorrespond to the separation and reattachment area".A summary of the main results from this state-of-the-art, together with the main issues,is proposed in the next chapter.

70 CHAPTER I.2. IMPACT OF THE GLOTTIS DURING BREATHING
Summary and Aims
Characterisation of Glottal Motion during Breathing
Regarding the glottal kinematics during human breathing, the current knowledge gainedfrom previous in vivo studies can be summarized as follows:• Under healthy conditions, the vocal-fold geometry is generally unsteady during abreathing cycle: the glottal area progressively increases during inspiration and nar-rows during expiration. The ratio of the glottal aperture measured at 50% of inspi-ratory duration to the same measurement at 50% of expiratory duration can varybetween 1 and 3 during eupnea. The glottal widening generally precedes the onsetof inspiratory flow. The opening of the vocal folds is connected with an increased ac-tivity of the posterior crico-arytenoid (abductor) muscle of the larynx. The onset ofglottic widening prior to the onset of inspiration is consistent with neurophysiologicalobservations.• However, some sparse studies have reported that the typical time-varying glottalmotion is not systematic: in some cases, the glottis can remain constantly openedwhatever the breathing task.• In the presence of airflow obstruction due to lung disease, the glottal narrowingduring expiration is enhanced.• A mean glottal cross-section area (Ag) of 90-100 mm2 is often chosen as a referencein the literature during eupnea [Brancatisano et al., 1983]. However, it is importantto note that numerous studies found an average value around 200 mm2.• Whereas the qualitative observations and average/peak glottal area dimensions areoften provided in the previous works, the quantitative description of the glottalmotion in time has been barely studied in details. In particular the glottal dynamicsand its interaction with the breathing airflow rate is generally poorly described.It was investigated in few early reference studies, which yielded to controversialresults however. That is why, currently this research interest is still subject of activeinvestigations [Brouns et al., 2007a; Chen et al., 2013; Xi et al., 2014].
Therefore, the first general purpose of this thesis was to investigate the time-variationsof the glottal area during breathing, together with the synchronized breathing airflowpattern. To this end, a clinical study was conducted on 20 healthy volunteers to explore
71
72 CHAPTER I.2. IMPACT OF THE GLOTTIS DURING BREATHING
the glottal motion during several specific slow and rapid breathing tasks. The glottalarea variations were investigated using laryngoscopic video recordings and synchronizedairflow measurements. The methodology and the results are detailed in Part II.
Impact of Glottal Motion on Airflow & Aerosol Deposition
The impact of glottal motion on airflow and aerosol deposition in the human upper airwaysis often discarded from the experimental and numerical studies. The current knowledgeon this point can be summarized as follows:• Many studies have been developed to better mimic and model the vocal-fold self-sustained vibrations as observed during human phonation, in order to better under-stand the fluid/structure interactions taking place within the laryngeal acousticalsource. However, in comparison, the studies dealing with the impact of glottal kine-matics on breathing airflow and aerosol deposition are far less numerous.• Early in vitro studies were mainly carried out under steady flow conditions, with astatic glottis. They showed that the inspiratory critical airflow rate at the laminar-turbulent transition is around 100 mL/s; the mean Reynolds number is of about 2000in the larynx (peak value around 4000), with an average velocity varying from 5 to7 m/s at the glottis.• Most of the previous in silico studies were performed assuming static glottis con-ditions. Furthermore, two approximations are widely adopted: (i) a mean constantinhalation flow rate (15 to 60 L/min) applied at inlet conditions; (ii) quasi-steady flowconditions. However, some recent studies showed that the maximal inflow velocityin the upper airways is 60% higher in unsteady respiration than in steady mode; andthat about 7.5% higher deposition efficiencies of microparticles are obtained whenunsteady mode is selected [Jin et al., 2007; Xi and Longest, 2008].• Finally, to our knowledge, a single study considered an oscillatory flow simulatedthrough a mobile glottis during breathing [Renotte et al., 2000]. However, the res-piratory cycle was modelled by a succession of steady situations, and the breathingpattern was approximated by a simple sinusoidal function, as well as the glottalmotion.
Therefore, the second general purpose of this thesis was to predict the effects of a dynamicglottis and realistic airflow conditions on the aerosol deposition within the upper airwaysusing three-dimensional simulations. To this end, measured geometrical variations ofthe glottal area (see Part II) were used to develop a 3D dynamic model of the glottalaperture. Two-phase flow simulations were then conducted within a 3D average geometryof the upper airways, using experimental unsteady airflow conditions and dynamic glottalconfigurations. The methodology and the results are detailed in Part III.
Part II
Breathing Aerodynamics & GlottalMotion: In Vivo Study
73

II.3 Methodology 77II.3.1 Preliminary Experiments . . . . . . . . . . . . . . . . . . . . . . . . . . . . . . . . . . . . 77
II.3.1.1 Videoscopy & Air-flowrate measurements . . . . . . . . . . . . . . . . . . . . . . . 77II.3.1.2 Direct Transglottal Pressure Drop Measurements . . . . . . . . . . . . . . . . . . . 79
II.3.2 Clinical Study . . . . . . . . . . . . . . . . . . . . . . . . . . . . . . . . . . . . . . . . . . 80II.3.2.1 in vivo Recordings . . . . . . . . . . . . . . . . . . . . . . . . . . . . . . . . . . . . 80II.3.2.2 Data Processing . . . . . . . . . . . . . . . . . . . . . . . . . . . . . . . . . . . . . 83
II.4 Results 89II.4.1 Breathing Aerodynamics . . . . . . . . . . . . . . . . . . . . . . . . . . . . . . . . . . . . 89
II.4.1.1 General Airflow Features . . . . . . . . . . . . . . . . . . . . . . . . . . . . . . . . 89II.4.1.2 Breathing frequency . . . . . . . . . . . . . . . . . . . . . . . . . . . . . . . . . . . 91II.4.1.3 Breathing amplitude . . . . . . . . . . . . . . . . . . . . . . . . . . . . . . . . . . . 91
II.4.2 Glottal motion during breathing . . . . . . . . . . . . . . . . . . . . . . . . . . . . . . . . 92II.4.2.1 General Features . . . . . . . . . . . . . . . . . . . . . . . . . . . . . . . . . . . . . 93II.4.2.2 Influence of subject gender . . . . . . . . . . . . . . . . . . . . . . . . . . . . . . . 97II.4.2.3 Influence of breathing task . . . . . . . . . . . . . . . . . . . . . . . . . . . . . . . 97II.4.2.4 Correlation between airflow rate pattern & glottal motion . . . . . . . . . . . . . . 98
II.4.3 Discussion . . . . . . . . . . . . . . . . . . . . . . . . . . . . . . . . . . . . . . . . . . . . 99II.4.3.1 Towards the reasons for glottal motion and aerodynamics . . . . . . . . . . . . . . 99II.4.3.2 Towards the aerodynamic impact of glottal motion . . . . . . . . . . . . . . . . . . 102
Summary 105

76 TABLE DES MATIÈRES

Introduction
In section I.2.1 was introduced a large number of studies that extensively characterizethe vocal-fold vibrations during human phonation. By contrast, however, the glottalvariations during different human breathing regimes have been barely investigated sofar. Despite a few reference studies [Baier et al., 1977; England and Bartlett, 1982;Brancatisano et al., 1983], the relationship between the glottal area and the inhaled airflowrate is still poorly understood.For that reason was initiated a collaboration with the Speech and Language Laboratory(LPL, Aix Marseille University, CNRS, UMR 7309, Aix-en-Provence, France - A. Lagier,T. Legou, A. Giovanni) together with the ENT Department of the La Timone Adults Hos-pital (AP-HM, Marseille, France - A. Lagier, A. Giovanni). The main objective of thiswork was to explore and to characterize the glottal dynamics during human respiratoryphase by means of an in vivo exploratory approach. The physiological mechanisms of therespiratory cycles were investigated using synchronized video-recording of laryngofiber-scopic examination and oral airflow measurements. A quantitative characterization of theglottal motion was derived from the processing of the recorded laryngeal images. In thispart, the recorded clinical database is presented as follows:• the methodology is detailed in chapter II.3. First, preliminary experiments are de-scribed. Then, the final clinical study performed on 20 healthy volunteers and com-prising 144 breathing sequences of 30s is presented.• the chapter II.4 is divided into two sections. First section (section II.4.1) details theanalysis of the clinical study, in terms of breathing aerodynamics. Second section(section II.4.2) details the analysis of the clinical study, in terms of glottal motionduring breathing. Combining these anatomical observations with variations of airflowpattern of section II.4.1, the aerodynamic impact of the glottal motion is discussedas a function of breathing task and subject gender.
Note that preliminary experiments in chapter II.3 were published in Scheinherr et al.[2012] and in Scheinherr et al. [2013a]. Both description and results of the final clinicalstudy were submitted in July 2014 to Medical Engineering & Physics (Scheinherr et al.,Realistic Glottal Motion and Airflow Rate during Human Breathing).
77

78 TABLE DES MATIÈRES
Chapter II.3
Methodology
All the recording sessions took place at the Otolaryngology Department of the La TimoneAdults Hospital. The experimental procedure was approved by the Committee on theProtection of People (CPP) in Biomedical Research (CPP Sud Méditerranée I, n2012-A01390-13).
3.1 Preliminary Experiments
Several preliminary measurements were performed so as to test the feasibility of theclinical study and to design the whole measurement protocol.
3.1.1 Videoscopy & Air-flowrate measurements
Two healthy female subjects - S1 (29 year-old), S2 (33 year-old), and two healthy malesubjects - S3 (48 year-old), S4 (24 year-old), were involved in preliminary measurementsof glottal area and airflow rate. These experiments enabled:
i. the test and validation of the measurement equipment,ii. the development of a graphical interface to describe the breathing tasks the subject
is asked to produce [NI LabWindowsTM/CVI],iii. the development of a customized methodology to synchronize airflow measurement
and laryngeal images acquisition [Acquisition tool - NI LabWindowsTM/CVI],iv. the development of a customized methodology to process the recorded data [Matlab R©],v. preliminary CFD simulations [ANSYS R© Fluent Academic Research] (see chapter III.5).
Test and validation of the measurement equipment. The measurement equipmentconsists of:
i. a flexible videonasofibroscope, as used in clinical routine to perform video laryn-goscopy;
79

80 CHAPTER II.3. METHODOLOGY
ii. the EVA2TM system developped at the Laboratory Speech and Language to performoral airflow measurements during vocal production, i.e., during expiratory phase(S.Q.Lab). The EVA2TM system consists in a two-grid flowmeter (pneumotacho-graph) characterized by a small dead space, specific linearized response for the in-haled and exhaled flow, and an accuracy of 1 cm3/s [Ghio and Teston, 2004].
Preliminary in vitro experiments were conducted to calibrate the EVA2TM system underunsteady flow conditions (i.e., during both inspiratory and expiratory phases). To thisend, a device reproducing mechanical ventilation under unsteady sinusoidal regimes wasused, based on the set-up developped in Fahd [2012] for dynamic calibration of pressuresensors. The latter is equipped with a cylinder comprising a mobile piston of controllablekinematics. The displacement of the piston is driven by a numerically controlled electricalrod. This device allowed to reproduce sinusoidal flow conditions, with a controlled airflowrate varied from 200 to 500 mL/s, and a breathing period varied from 1.5 to 4s. This stepshowed a quantitative agreement in frequency and amplitude between the time-variationsof the reference airflow rate generated by the ventilation device and the sensor EVA2TM.Figure II.3.1 illustrates this quantitative agreement on four cycles of sinusoidal ventilationcharacterized by a period of 2.5s and a maximal airflow rate of 290 mL/s. The relativediscrepancy between the airflow rate amplitudes as measured by the two devices is assessedaround 1% in average over an acquisition of 30s.
Figure II.3.1: (left) Schematic illustration of the device reproducing sinusoidalmechanical ventilation using a piston of known position in time. (right) Typical
time-variations of the airflow rate Q during unsteady flow conditions, as measured by theEVA2TM sensor and derived from the piston displacement (reference signal).
Development of a graphical interface to define the breathing tasks. The interfacedeveloped to describe the instructions to the subject during the preliminary experiments isdisplayed in Annex A - Instruction Interface for Clinical Study. In particular, this interfacecomprises the list of the breathing tasks to realize (see the list detailed in next section),a metronome to help the subject breathing at the target frequency when necessary, and

II.3.1. PRELIMINARY EXPERIMENTS 81
a progress bar to show her/him the duration of the target task.Other aspects of the methodology (synchronization set-up, post-processing of data) aredetailed in section II.3.2, in the scope of the final clinical study.Finally, results from these preliminary experiments are valorized in chapter III.5, wherethey are used as boundary conditions for airflow simulations.
3.1.2 Direct Transglottal Pressure Drop Measurements
During this exploratory approach, direct measurement of subglottal air pressure was alsoperformed on one subject (a 59-years-old male) to assess the transglottal pressure dropchanges during several breathing tasks. Thanks to the EVA2TM system, subglottal pres-sure Psub and intraoral pressure Pio measurements were recorded simultaneously to theoral airflow signal Q (see Figure II.3.2). This step was performed in collaboration withthe LPL (B. Amy de la Bretèque, T. Legou, A. Giovanni), and the Department Speechand Cognition of GIPSA-lab (Images, Speech, Signal, Automation Laboratory - GrenobleUMR 5216, N. Henrich-Bernardoni).
The subglottal pressure was directly measured via puncture of the cricothyroid membrane,while the intraoral air pressure was measured using a catheter located into the subject’smouth [Plant and Hillel, 1998]. These measurements allowed to determine the transglottalpressure drop changes during breathing. Two tasks were investigated: tidal breathing(eupnea) and task with an increasing breathing frequency and amplitude (panting).
Different results can be highlighted in Figure II.3.2:• the order of magnitude of the transglottal pressure during tidal breathing is around40 Pa. This pressure drop can reach as much as 600 Pa in specific forced breathingregimes (panting).• a small hysteresis is measured in the (Q, ∆P ) loop during tidal breathing. Thishysteresis increases notably during the panting task, showing either a change in flowregime and/or a change in the anatomical configuration during the breathing cycle.

82 CHAPTER II.3. METHODOLOGY
Figure II.3.2: (left) Schematic illustration of the subglottal pressure (Psub) and intraoralpressure (Pio) measurements location. (middle) Typical variations of the airflow rate Q
with time during eupnea, and transglottal pressure drop ∆P = Psub - Pio in function of Q(right) Same as (middle) during panting.
3.2 Clinical Study
The preliminary experiments described in the previous section yielded to the elaborationof a clinical study, as a biomedical research project promoted by the Marseille PublicUniversity Hospital System (AP-HM).
3.2.1 in vivo Recordings
a/ Subjects
The study was conducted on 20 healthy volunteers, including 10 females (Fi, i ∈ [01..10])and 10 males (Mi, i ∈ [01..10]) who delivered informed consent. All subjects were non-smokers, without any professional sportive activity, aging between 22 and 28 years. Vol-unteers with previous laryngeal or respiratory disorder were excluded from the study.Table II.3.1 lists the subjects’ characteristics.

II.3.2. CLINICAL STUDY 83
Females MalesSubject Age [yr] Weight [kg] Height [cm] BMI [kg/m2] Subject Age [yr] Weight [kg] Height [cm] BMI [kg/m2]F01 27 55 162 21.0 M01 25 75 188 21.2F02 24 55 166 20.0 M02 26 76 177 24.3F03 24 50 170 17.3 M03 24 65 170 22.5F04 22 70 182 21.1 M04 28 63 176 20.3F05 25 55 160 21.5 M05 25 75 180 23.1F06 23 65 170 22.5 M06 27 65 168 23.0F07 25 59 172 19.9 M07 26 65 178 20.5F08 23 60 160 23.4 M08 26 63 173 21.0F09 23 51 170 17.6 M09 26 65 180 20.1F10 26 60 168 21.3 M10 27 70 179 21.8
Mean 24.2 58 168 20.6 Mean 26 68.2 177 21.8SD 1.5 6.2 6.6 1.9 SD 1.2 5.3 5.7 1.4
Table II.3.1: General physical characteristics of the subjects. (BMI: BodyMass Index; SD: standard deviation of the data)
b/ Breathing Tasks & Database
Each subject was asked to produce eight 30s-tasks of quiet and rapid breathing, describedas follows:(A) Slow breathing tasks - below 20 cycles/min:
(a) Eupf : task of free eupnea(b) Repetition of Eupf
(c) Eup15: task of eupnea with a controlled breathing frequency at 15 cycles/min.(d) Hyperf : task of free hyperpnea (deep breathing with maximal respiratory vol-
ume)(B) Rapid breathing tasks - above 20 cycles/min:
(e) Tachyp30: task of tachypnea with a controlled breathing frequency at 30 cy-cles/min.
(f) Tachyp60: task of tachypnea with a controlled breathing frequency at 60 cy-cles/min.
(g) Tachyp90: task of tachypnea with a controlled breathing frequency at 90 cy-cles/min.
(C) Specific inhalation task:(h) Aerosol: task mimicking the breathing gesture typically performed when using
a dry powder inhaler (or a metered dose inhaler) to deliver medication (quickand deep inspiration followed by slow expiration).
For all tasks, the subject’s nose was closed to ensure that the subject breathed onlythrough her/his mouth. Note that both tasks of free eupnea (Eupf) were intentionallypresented to the subject as a phase of acquisition trials. This aimed to prepare her/himbefore the recording of the controlled tasks, which were described as the target of the

84 CHAPTER II.3. METHODOLOGY
study. Thereby, by reducing the effect of a motor control focused on the breathing,tasks (A)a and (A)b were acquired in the condition closer to spontaneous breathing.By contrast, the other tasks correspond to cases of controlled breathing, for which thesubjects were asked to synchronize their breathing frequency with a metronome projectedon an instruction computer. These tasks intended to explore the extent of glottal motionand breathing capacity in specific respiratory contexts. In the end, 18 volunteers only(9 females and 9 males) successfully performed the entire protocol, thus yielding to adatabase comprising 144 sequences of 30s.
c/ Measurements
All measurements were done in the seated posture. The measurement set-up is displayedon Figure II.3.3. The glottis was observed using a flexible nasofiberscope equipped with a
Figure II.3.3: Setup of the measurement (image of nasal endoscopy adapted fromAkerlund et al. [2014]).
PAL camera (Storz endovision XL 202800) and a continuous cold light source. Laryngealimages were captured at a frequency of 25 frames/s with a resolution of 768×288 pixels.The airflow rate was simultaneously registered by means of a pneumotachograph placedat the mouth, the EVA2TM system (see section II.3.1), that enables flow rate signal mea-surements with the sampling frequency of 6250 Hz. A trigger generated by an acquisitiontool developed in NI LabWindowsTM/CVI (National Instruments Corporation, USA) wasused to synchronize the recordings of laryngeal images and flow rate signal. Note that forseveral subjects (7 females and 6 males), a local anesthetic (Lidocaine Aguettant 5%) was
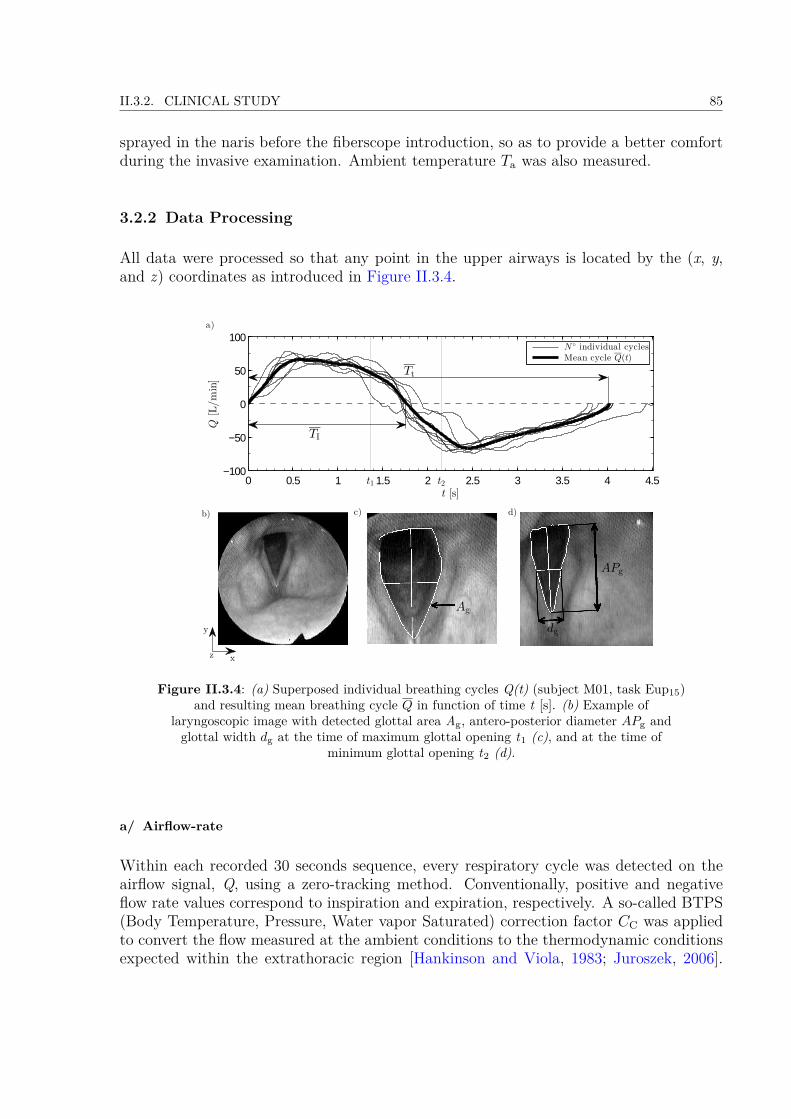
II.3.2. CLINICAL STUDY 85
sprayed in the naris before the fiberscope introduction, so as to provide a better comfortduring the invasive examination. Ambient temperature Ta was also measured.
3.2.2 Data Processing
All data were processed so that any point in the upper airways is located by the (x, y,and z) coordinates as introduced in Figure II.3.4.
0 0.5 1 1.5 2 2.5 3 3.5 4 4.5−100
−50
0
50
100
t [s]
Q[L/min]
N individual cyclesMean cycle Q(t)
d)
a)
t2t1
b)
APg
dg
Ag
TI
c)
z
y
x
Tt
Figure II.3.4: (a) Superposed individual breathing cycles Q(t) (subject M01, task Eup15)and resulting mean breathing cycle Q in function of time t [s]. (b) Example of
laryngoscopic image with detected glottal area Ag, antero-posterior diameter APg andglottal width dg at the time of maximum glottal opening t1 (c), and at the time of
minimum glottal opening t2 (d).
a/ Airflow-rate
Within each recorded 30 seconds sequence, every respiratory cycle was detected on theairflow signal, Q, using a zero-tracking method. Conventionally, positive and negativeflow rate values correspond to inspiration and expiration, respectively. A so-called BTPS(Body Temperature, Pressure, Water vapor Saturated) correction factor CC was appliedto convert the flow measured at the ambient conditions to the thermodynamic conditionsexpected within the extrathoracic region [Hankinson and Viola, 1983; Juroszek, 2006].
86 CHAPTER II.3. METHODOLOGY
For each sequence, the Q-zero axis was updated so that
V E = CCV I, (II.3.1)
where V E [L] is the average expired volume, V I [L] is the average inspired volume andthe conversion coefficient CC [-] is defined by Juroszek [2006]:
CC = 310Ta
Pa − Pws
Pa − 6.26 , (II.3.2)
where pressure Pws is the saturation pressure of water vapor at ambient temperature Ta[K], and ambient pressure Pa [kPa]. Coefficient CC was quasi-constant over the wholedatabase, equal to 1.07 (see Table II.3.2, column #7). Each corrected sequence wasaveraged into one mean flow rate
Q(t) = 1N − 1
N∑j=0
Q(t+ jT t
), (II.3.3)
where time T t [s] (see Table II.3.2, column #2) is the average period of N cycles (seeTable II.3.2, column #8). Number of cycles N stands for the total number of breathingcycles of all subjects within the breathing task and gender group. An illustrative exampleis displayed on panel (a) in Figure II.3.4.
b/ Glottal Motion Detection
This procedure was limited to the analysis of two major tasks, Eup15 and Tachyp30,altogether representing slow and rapid breathing tasks, respectively. At first, breathingcycles with hidden glottis aperture (by the epiglottis or the arytenoid cartilages) wereremoved from the video processing. Finally, about 126 (252) respiratory cycles out of149 (291) were associated to task Eup15 (Tachyp30 respectively). For these retainedsequences, the glottal motion was extracted from every laryngoscopic image k taken atthe shot-instant (tk) as follows:
i. Correction of the x- and y-motions of the fiberscope and focus on a region of interest(ROI) using a cross-correlation technique. Initially, on the first image the ROI ischosen by hand. When proceeding next image, the cross-correlation coefficient of theprecedent ROI is calculated at all possible positions in actual image. The coordinateswith the highest cross-correlation coefficient value are then chosen for new ROI.
ii. Smoothing of the resized image using a Gaussian bandpass filtering [Iheme, 2011].Gaussian bandpass filter is a frequency filtering, which is based on Fourier Transform.A bandpass attenuates very high and very low frequencies, but retains a middlerange of frequencies. The advantage of the Gaussian filter is that when Gaussianis transformed between the frequency and spatial domains, it remains Gaussian.Therefore it does not incur the ringing effect in the spatial domain of the filteredimage as can be significant in case of Ideal bandpass filter or Butterworth bandpass
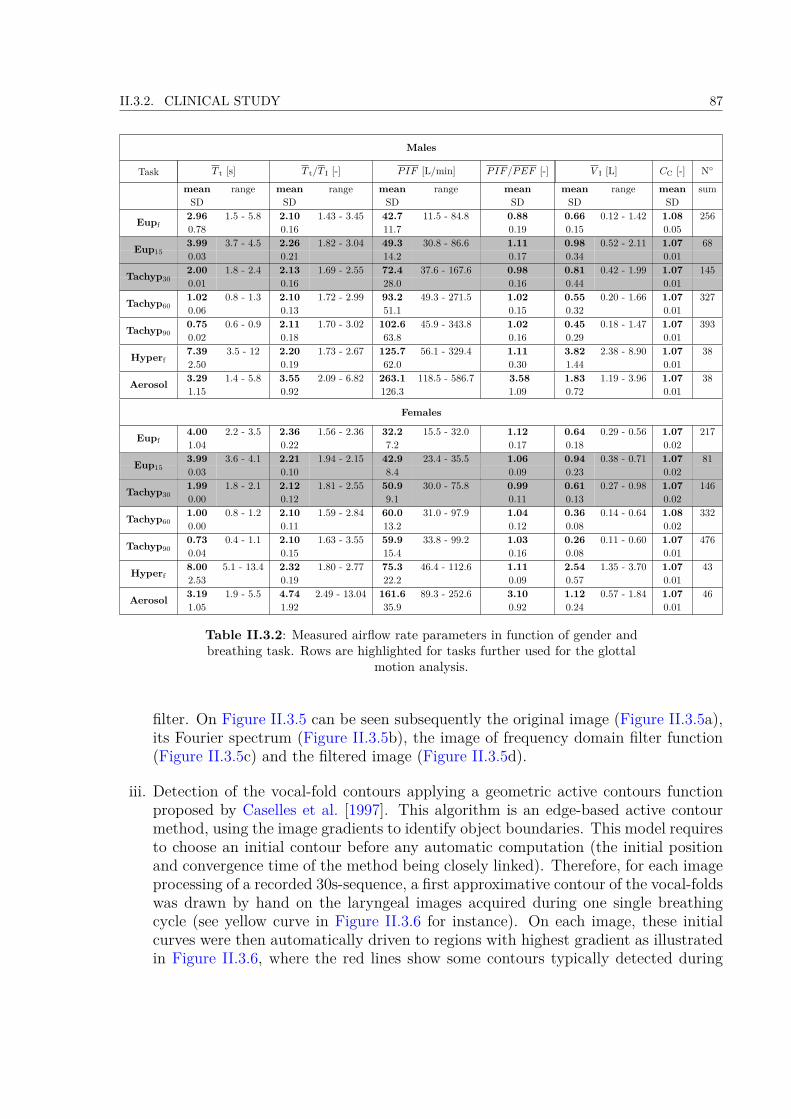
II.3.2. CLINICAL STUDY 87
Males
Task T t [s] T t/T I [-] PIF [L/min] PIF/PEF [-] V I [L] CC [-] N
mean range mean range mean range mean mean range mean sumSD SD SD SD SD SD
Eupf2.96 1.5 - 5.8 2.10 1.43 - 3.45 42.7 11.5 - 84.8 0.88 0.66 0.12 - 1.42 1.08 2560.78 0.16 11.7 0.19 0.15 0.053.99 3.7 - 4.5 2.26 1.82 - 3.04 49.3 30.8 - 86.6 1.11 0.98 0.52 - 2.11 1.07 68Eup15 0.03 0.21 14.2 0.17 0.34 0.012.00 1.8 - 2.4 2.13 1.69 - 2.55 72.4 37.6 - 167.6 0.98 0.81 0.42 - 1.99 1.07 145Tachyp30 0.01 0.16 28.0 0.16 0.44 0.01
Tachyp601.02 0.8 - 1.3 2.10 1.72 - 2.99 93.2 49.3 - 271.5 1.02 0.55 0.20 - 1.66 1.07 3270.06 0.13 51.1 0.15 0.32 0.01
Tachyp900.75 0.6 - 0.9 2.11 1.70 - 3.02 102.6 45.9 - 343.8 1.02 0.45 0.18 - 1.47 1.07 3930.02 0.18 63.8 0.16 0.29 0.01
Hyperf7.39 3.5 - 12 2.20 1.73 - 2.67 125.7 56.1 - 329.4 1.11 3.82 2.38 - 8.90 1.07 382.50 0.19 62.0 0.30 1.44 0.01
Aerosol 3.29 1.4 - 5.8 3.55 2.09 - 6.82 263.1 118.5 - 586.7 3.58 1.83 1.19 - 3.96 1.07 381.15 0.92 126.3 1.09 0.72 0.01
Females
Eupf4.00 2.2 - 3.5 2.36 1.56 - 2.36 32.2 15.5 - 32.0 1.12 0.64 0.29 - 0.56 1.07 2171.04 0.22 7.2 0.17 0.18 0.023.99 3.6 - 4.1 2.21 1.94 - 2.15 42.9 23.4 - 35.5 1.06 0.94 0.38 - 0.71 1.07 81Eup15 0.03 0.10 8.4 0.09 0.23 0.021.99 1.8 - 2.1 2.12 1.81 - 2.55 50.9 30.0 - 75.8 0.99 0.61 0.27 - 0.98 1.07 146Tachyp30 0.00 0.12 9.1 0.11 0.13 0.02
Tachyp601.00 0.8 - 1.2 2.10 1.59 - 2.84 60.0 31.0 - 97.9 1.04 0.36 0.14 - 0.64 1.08 3320.00 0.11 13.2 0.12 0.08 0.02
Tachyp900.73 0.4 - 1.1 2.10 1.63 - 3.55 59.9 33.8 - 99.2 1.03 0.26 0.11 - 0.60 1.07 4760.04 0.15 15.4 0.16 0.08 0.01
Hyperf8.00 5.1 - 13.4 2.32 1.80 - 2.77 75.3 46.4 - 112.6 1.11 2.54 1.35 - 3.70 1.07 432.53 0.19 22.2 0.09 0.57 0.01
Aerosol 3.19 1.9 - 5.5 4.74 2.49 - 13.04 161.6 89.3 - 252.6 3.10 1.12 0.57 - 1.84 1.07 461.05 1.92 35.9 0.92 0.24 0.01
Table II.3.2: Measured airflow rate parameters in function of gender andbreathing task. Rows are highlighted for tasks further used for the glottal
motion analysis.
filter. On Figure II.3.5 can be seen subsequently the original image (Figure II.3.5a),its Fourier spectrum (Figure II.3.5b), the image of frequency domain filter function(Figure II.3.5c) and the filtered image (Figure II.3.5d).
iii. Detection of the vocal-fold contours applying a geometric active contours functionproposed by Caselles et al. [1997]. This algorithm is an edge-based active contourmethod, using the image gradients to identify object boundaries. This model requiresto choose an initial contour before any automatic computation (the initial positionand convergence time of the method being closely linked). Therefore, for each imageprocessing of a recorded 30s-sequence, a first approximative contour of the vocal-foldswas drawn by hand on the laryngeal images acquired during one single breathingcycle (see yellow curve in Figure II.3.6 for instance). On each image, these initialcurves were then automatically driven to regions with highest gradient as illustratedin Figure II.3.6, where the red lines show some contours typically detected during
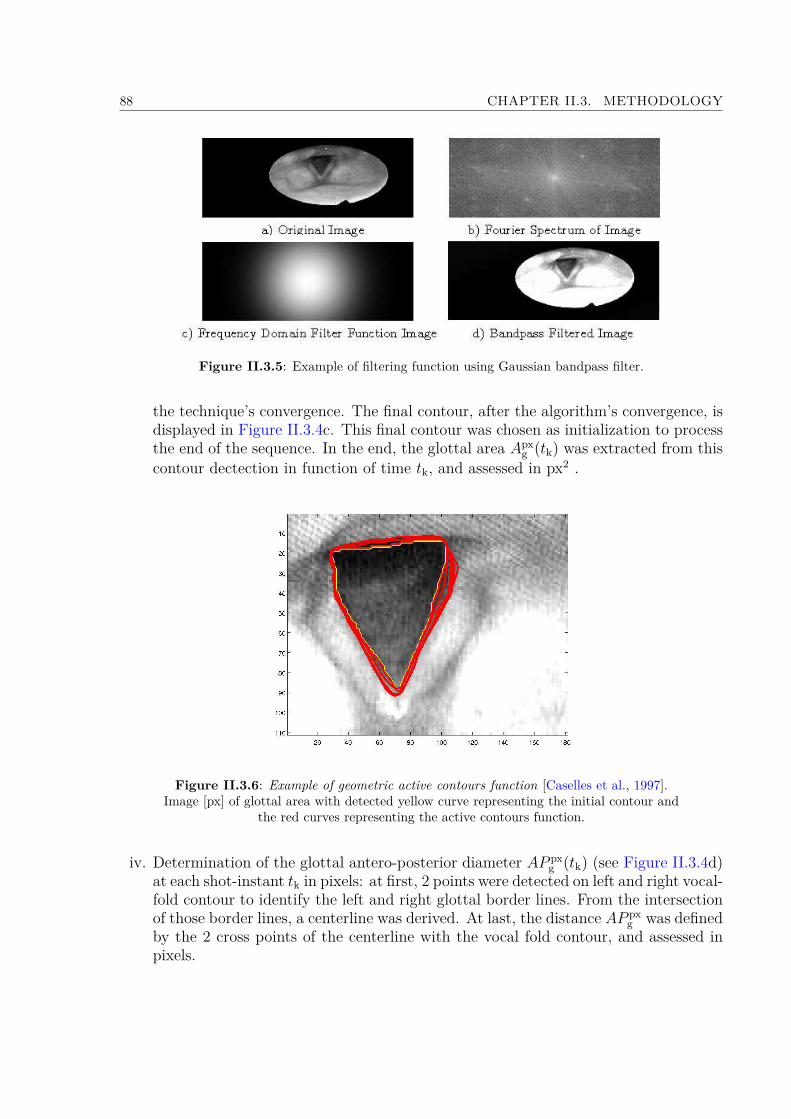
88 CHAPTER II.3. METHODOLOGY
Figure II.3.5: Example of filtering function using Gaussian bandpass filter.
the technique’s convergence. The final contour, after the algorithm’s convergence, isdisplayed in Figure II.3.4c. This final contour was chosen as initialization to processthe end of the sequence. In the end, the glottal area Apx
g (tk) was extracted from thiscontour dectection in function of time tk, and assessed in px2 .
Figure II.3.6: Example of geometric active contours function [Caselles et al., 1997].Image [px] of glottal area with detected yellow curve representing the initial contour and
the red curves representing the active contours function.
iv. Determination of the glottal antero-posterior diameter AP pxg (tk) (see Figure II.3.4d)
at each shot-instant tk in pixels: at first, 2 points were detected on left and right vocal-fold contour to identify the left and right glottal border lines. From the intersectionof those border lines, a centerline was derived. At last, the distance AP px
g was definedby the 2 cross points of the centerline with the vocal fold contour, and assessed inpixels.

II.3.2. CLINICAL STUDY 89
v. Determination of the glottal width dpxg (tk) at each shot-instant tk in pixels: this
distance was determined by a perpendicular line to APg at its mid-level (see Fig-ure II.3.4d).
vi. Correction of possible vertical movement of the larynx and z-motion of the fiberscopeby assuming the glottal antero-posterior diameter as a geometrical invariant duringbreathing [Higenbottam, 1980], labelled AP o
g . Thereby, the distance AP pxg assessed
in pixels after step iv) is updated to sastisfy this condition.vii. Finally, conversion of the measured data from pixels to millimeters, assuming AP o
g =22.1 mm for males and 17.6 mm for females [Eckel and Sittel, 1995]. The conversionof glottal area is done using equation:
Ag(tk) = Apxg (tk)
(AP o
g
AP pxg (tk)
)2
. (II.3.4)
c/ Methodology Accuracy
The measurement of the distance between the camera extremity and the glottal planewould enable direct conversion from pixels to millimeters. However, touching the glottalplane was not allowed by the protocol as it could cause laryngospasm. That is whywe chose the hypothesis of APg as a geometrical invariant [Higenbottam, 1980], as analternative to convert the pixels measurements. This approach has been previously appliedby several authors [Brancatisano et al., 1983; Hurbis and Schild, 1991; Beaty et al., 1999],and it seemed a reasonable assumption during our experiment, as the APg borders wererelatively fixed. In the future, this problem could be overcome using other endoscopedesigns, like used by Kobler et al. [2006], where a grid of light projected from the endoscopemakes it possible to determine the distance between camera optics and the observed tissue.The accuracy of the protocol was tested by recording a printed glottal image of knownarea Ag =930 mm2 and distance AP o
g = 47 mm. During the recording, several motionsof the camera were applied along x-, y- and z-directions, so as to mimic the possiblemotions of the fiberscope during the laryngoscopy. Figure II.3.7 shows two curves derivedfrom the image processing of these recordings, following the steps described in previoussection: the green curve (with crosses) shows the detected area Apx
g (t) in px2, beforeapplication of step vi); the other one shows the deduced area Ag(t) in mm2, according toEquation II.3.4 (red curve with triangles). From this latter case, the time-averaged valueof Ag(t) could be calculated and assessed at: 972 mm2. Therefore, the average error ofthe detection procedure was found around 4.5%. This procedure was repeated on severalglottal images of the database. The error of the detection depended on the recordedlaryngoscopic image quality (e.g., variable light contrast). In the end, the maximal errorreached by the detection procedure was assessed at 10%.
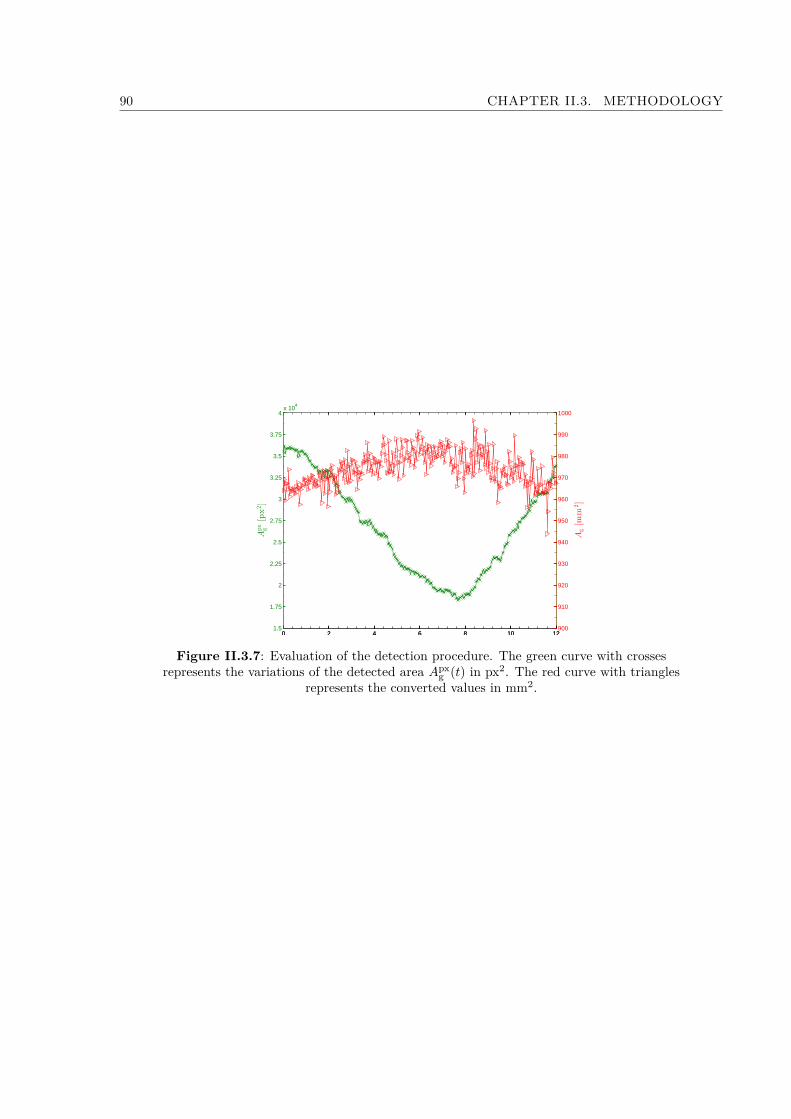
90 CHAPTER II.3. METHODOLOGY
0 2 4 6 8 10 121.5
1.75
2
2.25
2.5
2.75
3
3.25
3.5
3.75
4x 10
4
Apx
g[px2]
0 2 4 6 8 10 12900
910
920
930
940
950
960
970
980
990
1000
Ag[m
m2]
Figure II.3.7: Evaluation of the detection procedure. The green curve with crossesrepresents the variations of the detected area Apx
g (t) in px2. The red curve with trianglesrepresents the converted values in mm2.
Chapter II.4
Results
In the followings, if X is a function of time t, Xmax refers to the maximum value of Xover duration t.
4.1 Breathing Aerodynamics
For each task and subject gender of the database, the previous Table II.3.2 summarizesthe measured primary respiratory variables: mean period length T t [s] (see Figure II.3.4),mean Peak Inspiratory Flow PIF [L/min] and mean inspired volume V I [L]. Furthermore,Table II.3.2 reports the derived variables T t/T I (T I [s] is the mean inspiration period, seeFigure II.3.4a) and PIF/PEF (PEF [L/min] is the mean Peak Expiratory Flow), andthe BTPS correction factor, CC. All variables are averaged over the number of processedbreathing cycles, N.Figure II.4.1 and Figure II.4.2 present the corresponding normalized mean flow-ratesQ/PIF as a function of ωt [rad], where ω is the pulsation of the average cycle definedas ω = 2π/T t. The flow rates obtained for the slow breathing tasks (A)a to (A)d (seeFigure II.4.1a and Figure II.4.1c for males and females respectively), and rapid breathingtasks (B)e to (B)g (see Figure II.4.1b and Figure II.4.1d for males and females respectively)are displayed. The flow rate obtained for the specific inhalation task (C)h is plottedseparately in Figure II.4.2.
4.1.1 General Airflow Features
For each case, the measured airflow pattern was confronted to the sinusoidal evolutionsin(ωt), commonly used as an idealized breathing pattern [Renotte et al., 2000; Jin et al.,2007; Jedelský et al., 2012]. For slow and rapid breathing tasks, Figure II.4.1 showsthat the quasi-sinusoidal approximation can be a priori usable as a whole. Yet, severaldiscrepancies can be highlighted. First, the Euclidean distance between measurements andthis harmonic signal (noted εk [−] at instant tk) is smaller for male than female subjects
91
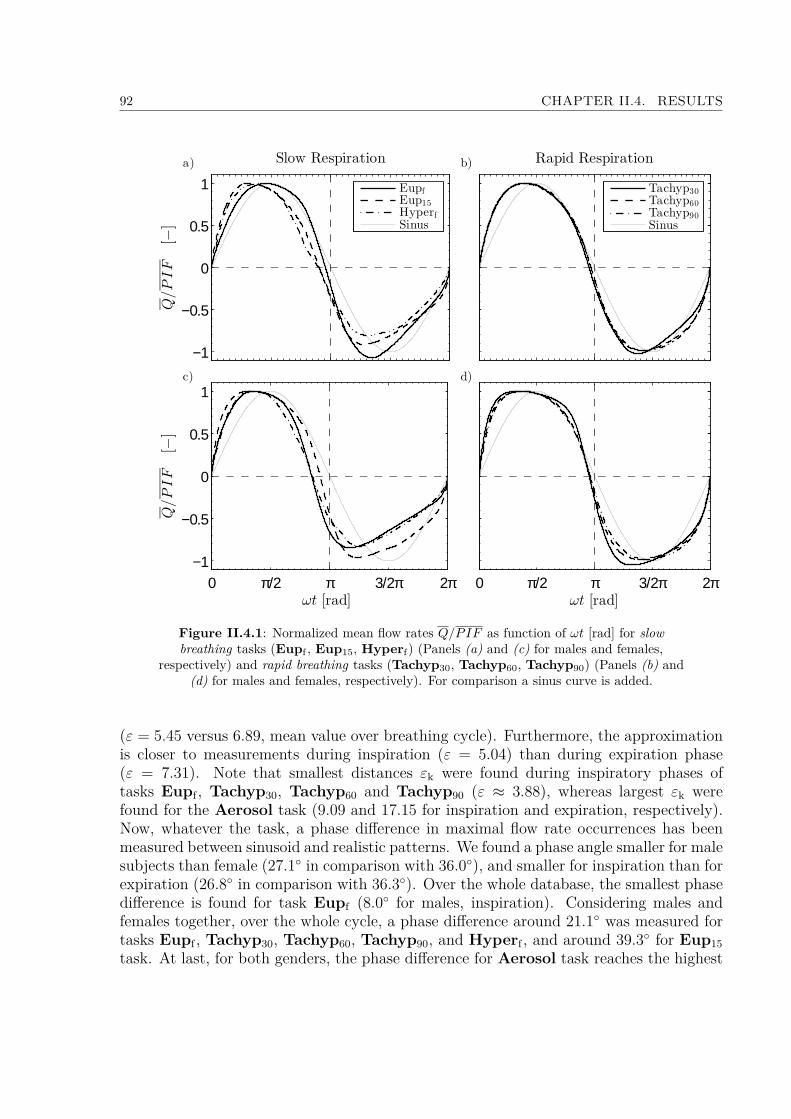
92 CHAPTER II.4. RESULTS
−1
−0.5
0
0.5
1Q/PIF
[−]
Slow Respiration
EupfEup15HyperfSinus
0 π/2 π 3/2π 2π−1
−0.5
0
0.5
1
ωt [rad]
Q/PIF
[−]
Rapid Respiration
Tachyp30Tachyp60Tachyp90Sinus
0 π/2 π 3/2π 2πωt [rad]
a) b)
c) d)
Figure II.4.1: Normalized mean flow rates Q/PIF as function of ωt [rad] for slowbreathing tasks (Eupf , Eup15, Hyperf) (Panels (a) and (c) for males and females,
respectively) and rapid breathing tasks (Tachyp30, Tachyp60, Tachyp90) (Panels (b) and(d) for males and females, respectively). For comparison a sinus curve is added.
(ε = 5.45 versus 6.89, mean value over breathing cycle). Furthermore, the approximationis closer to measurements during inspiration (ε = 5.04) than during expiration phase(ε = 7.31). Note that smallest distances εk were found during inspiratory phases oftasks Eupf , Tachyp30, Tachyp60 and Tachyp90 (ε ≈ 3.88), whereas largest εk werefound for the Aerosol task (9.09 and 17.15 for inspiration and expiration, respectively).Now, whatever the task, a phase difference in maximal flow rate occurrences has beenmeasured between sinusoid and realistic patterns. We found a phase angle smaller for malesubjects than female (27.1 in comparison with 36.0), and smaller for inspiration than forexpiration (26.8 in comparison with 36.3). Over the whole database, the smallest phasedifference is found for task Eupf (8.0 for males, inspiration). Considering males andfemales together, over the whole cycle, a phase difference around 21.1 was measured fortasks Eupf , Tachyp30, Tachyp60, Tachyp90, and Hyperf , and around 39.3 for Eup15task. At last, for both genders, the phase difference for Aerosol task reaches the highest

II.4.1. BREATHING AERODYNAMICS 93
0 π/2 π 3/2π 2π
−1
−0.5
0
0.5
1
Q/PIF
[−]
ωt [rad]
MaleFemaleSinus
Figure II.4.2: Normalized mean flow rates Q/PIF as function of ωt [rad] for the specificinhalation task Aerosol, for males and females. For comparison a sinus curve is added.
values (up to 79) and thus the sinusoidal hypothesis is no more valuable in case of specificinhalation task (Figure II.4.2).
4.1.2 Breathing frequency
From T t in Table II.3.2 can be deduced that spontaneous slow breathing (Eupf) wasachieved at a mean frequency of 20 cycles/min for males and 15 cycles/min for females.The measured frequencies of tasks Eup15, Tachyp30, and Tachyp60 correspond to thetarget values, which validates the protocol for this range of breathing rates. Note thatthe target value chosen for task Tachyp90 (90 cycles/min) was too high for most of thesubjects, who worked out with a breathing frequency around 80 cycles/min instead. Allthe tasks were performed so that in average T t/T I > 2, thereby yielding to an inspiratoryduration shorter than the expiratory one, which is in agreement with previous studiesmade on healthy subjects [Cain and Otis, 1949; Benchetrit, 2000]. In particular, Proctorand Hardy [1949] found a ratio T t/T I in the range 1.57 - 2.9 during quiet breathing(including patients with pulmonary disease), versus 1.43 - 3.45 in our case (mean value2.10 and 2.36, for male and female groups, respectively).
4.1.3 Breathing amplitude
Values of the flow rate maximal amplitudes PIF are very different inter-tasks and inter-subjects, as detailed in Table II.3.2. Over the whole database, the amplitudes are 30%higher for male than for female subjects. During spontaneous breathing, the typical peakvalues ranged between 29 L/min and 68 L/min, with a mean value of 43 L/min for males,and 32 L/min for females. These results are in line with previous studies (see range ofvalues between 13 L/min and 78 L/min in Proctor and Hardy [1949]).
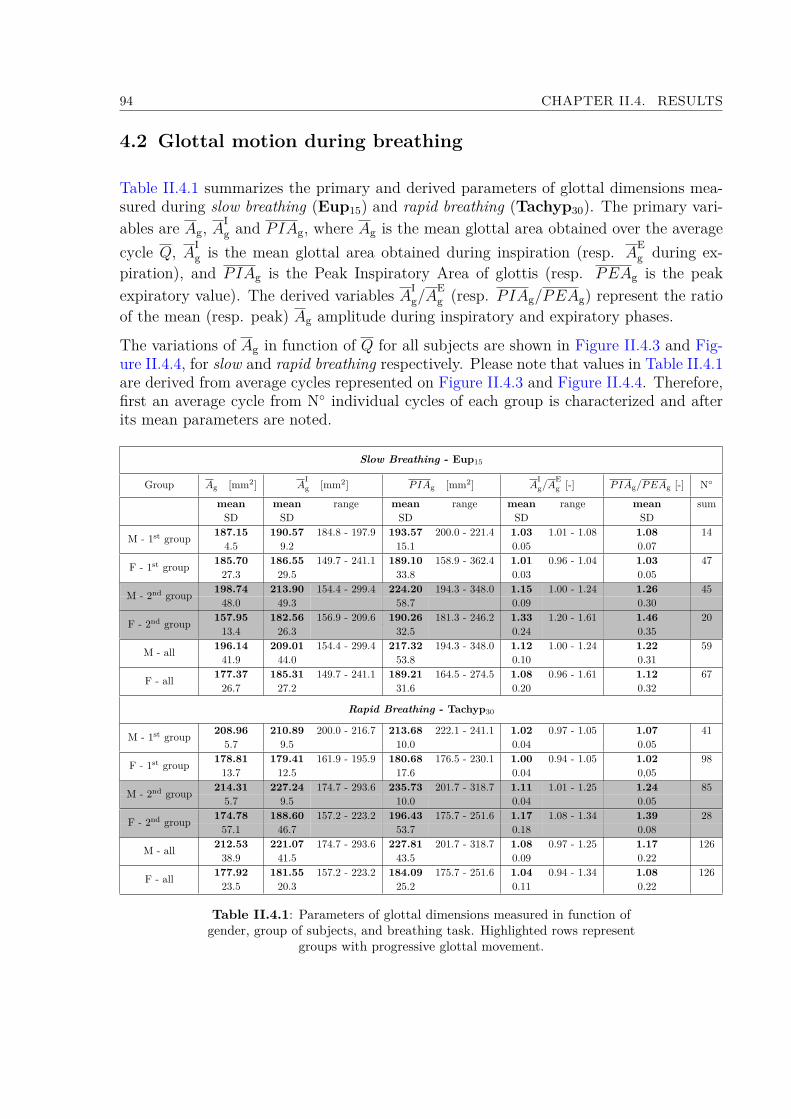
94 CHAPTER II.4. RESULTS
4.2 Glottal motion during breathing
Table II.4.1 summarizes the primary and derived parameters of glottal dimensions mea-sured during slow breathing (Eup15) and rapid breathing (Tachyp30). The primary vari-ables are Ag, A
Ig and PIAg, where Ag is the mean glottal area obtained over the average
cycle Q, AIg is the mean glottal area obtained during inspiration (resp. A
Eg during ex-
piration), and PIAg is the Peak Inspiratory Area of glottis (resp. PEAg is the peakexpiratory value). The derived variables AI
g/AEg (resp. PIAg/PEAg) represent the ratio
of the mean (resp. peak) Ag amplitude during inspiratory and expiratory phases.
The variations of Ag in function of Q for all subjects are shown in Figure II.4.3 and Fig-ure II.4.4, for slow and rapid breathing respectively. Please note that values in Table II.4.1are derived from average cycles represented on Figure II.4.3 and Figure II.4.4. Therefore,first an average cycle from N individual cycles of each group is characterized and afterits mean parameters are noted.
Slow Breathing - Eup15
Group Ag [mm2] AIg [mm2] PIAg [mm2] A
Ig/A
Eg [-] PIAg/PEAg [-] N
mean mean range mean range mean range mean sumSD SD SD SD SD
M - 1st group 187.15 190.57 184.8 - 197.9 193.57 200.0 - 221.4 1.03 1.01 - 1.08 1.08 144.5 9.2 15.1 0.05 0.07
F - 1st group 185.70 186.55 149.7 - 241.1 189.10 158.9 - 362.4 1.01 0.96 - 1.04 1.03 4727.3 29.5 33.8 0.03 0.05
198.74 213.90 154.4 - 299.4 224.20 194.3 - 348.0 1.15 1.00 - 1.24 1.26 45M - 2nd group 48.0 49.3 58.7 0.09 0.30157.95 182.56 156.9 - 209.6 190.26 181.3 - 246.2 1.33 1.20 - 1.61 1.46 20F - 2nd group 13.4 26.3 32.5 0.24 0.35
M - all 196.14 209.01 154.4 - 299.4 217.32 194.3 - 348.0 1.12 1.00 - 1.24 1.22 5941.9 44.0 53.8 0.10 0.31
F - all 177.37 185.31 149.7 - 241.1 189.21 164.5 - 274.5 1.08 0.96 - 1.61 1.12 6726.7 27.2 31.6 0.20 0.32
Rapid Breathing - Tachyp30
M - 1st group 208.96 210.89 200.0 - 216.7 213.68 222.1 - 241.1 1.02 0.97 - 1.05 1.07 415.7 9.5 10.0 0.04 0.05
F - 1st group 178.81 179.41 161.9 - 195.9 180.68 176.5 - 230.1 1.00 0.94 - 1.05 1.02 9813.7 12.5 17.6 0.04 0,05
214.31 227.24 174.7 - 293.6 235.73 201.7 - 318.7 1.11 1.01 - 1.25 1.24 85M - 2nd group 5.7 9.5 10.0 0.04 0.05174.78 188.60 157.2 - 223.2 196.43 175.7 - 251.6 1.17 1.08 - 1.34 1.39 28F - 2nd group 57.1 46.7 53.7 0.18 0.08
M - all 212.53 221.07 174.7 - 293.6 227.81 201.7 - 318.7 1.08 0.97 - 1.25 1.17 12638.9 41.5 43.5 0.09 0.22
F - all 177.92 181.55 157.2 - 223.2 184.09 175.7 - 251.6 1.04 0.94 - 1.34 1.08 12623.5 20.3 25.2 0.11 0.22
Table II.4.1: Parameters of glottal dimensions measured in function ofgender, group of subjects, and breathing task. Highlighted rows represent
groups with progressive glottal movement.

II.4.2. GLOTTAL MOTION DURING BREATHING 95
4.2.1 General Features
Identification of two groups in the database. In a first approach, a statistical anal-ysis of the database was conducted to test the common assumption of a linear correlationbetween the area Ag(t) and the airflow rate Q(t) time-variations. A linear regression co-efficient R2 between those two variables was calculated. Closer the value R2 is to 1, moresignificant is this linear relationship between Ag(t) and Q(t). The values of regressionfor all subjects and tasks Eup15 and Tachyp30 are summarized in Table II.4.2. Twogroups of subjects can be distinguished (see Figure II.4.3 and Figure II.4.4 for Eup15 andTachyp30, respectively):• The “1st group” of subjects is characterized by a linear regression coefficient close to0, such as R2 < 0.3 (see Table II.4.2). In this case, no linear correlation betweenQ(t) and Ag(t) is evidenced. Note however that this result does not imply that theglottal aperture is constant in time.• The “2nd group” of subjects is characterized by a non-negligible linear regressioncoefficient, such as R2 ≥ 0.3 (highlighted cells in Table II.4.2). In this case, the non-zero R2−values show that the area Ag(t) varies according to the breathing phase.However, the assumption of a linear correlation between Q(t) and Ag(t) seems veryinaccurate, as shown by the low R2−values.
FEMALES
Task F01 F02 F03 F04 F05 F06 F07 F08 F09 F10Eup15 0.05 0.78 0.41 0.08 0.02 0.01 0.01 0.08 0.45 0.18
Tachyp30 0.11 0.08 0.53 0.01 0.01 0.01 0.11 0.17 - 0.12
MALES
Task M01 M02 M03 M04 M05 M06 M07 M08 M09 M10Eup15 0.51 0.56 0.59 0.02 0.30 0.47 - 0.45 0.01 0.18
Tachyp30 0.54 0.50 0.73 0.01 0.05 0.10 - 0.01 0.05 0.33
Table II.4.2: R2 values of linear regression between area Ag(t) and Q(t).Highlighted cells are those with important value of R2 ≥ 0.3.
In a second approach, this criterion based on R2−value was completed by the analysisof the glottal amplitudes measured for each subject during a mean cycle. Every meanbreathing cycle of the database can be characterized by a mean ratio AI
g/AEg greater or
roughly equal to 1 (see Table II.4.1, column #5). In some cases, the glottal amplitudeswere quite important, although not in linear proportion with the inspired airflow rate.Yet, the detected glottal area time-variations demonstrate a substantial inter-subject vari-ability.
Therefore, within each gender and task category, the subjects were finally divided intotwo groups, depending on both R2−value and the glottal aera amplitude, relatively to theaccuracy of the glottal motion detection procedure assessed at 10% (see section II.3.2.2.c).
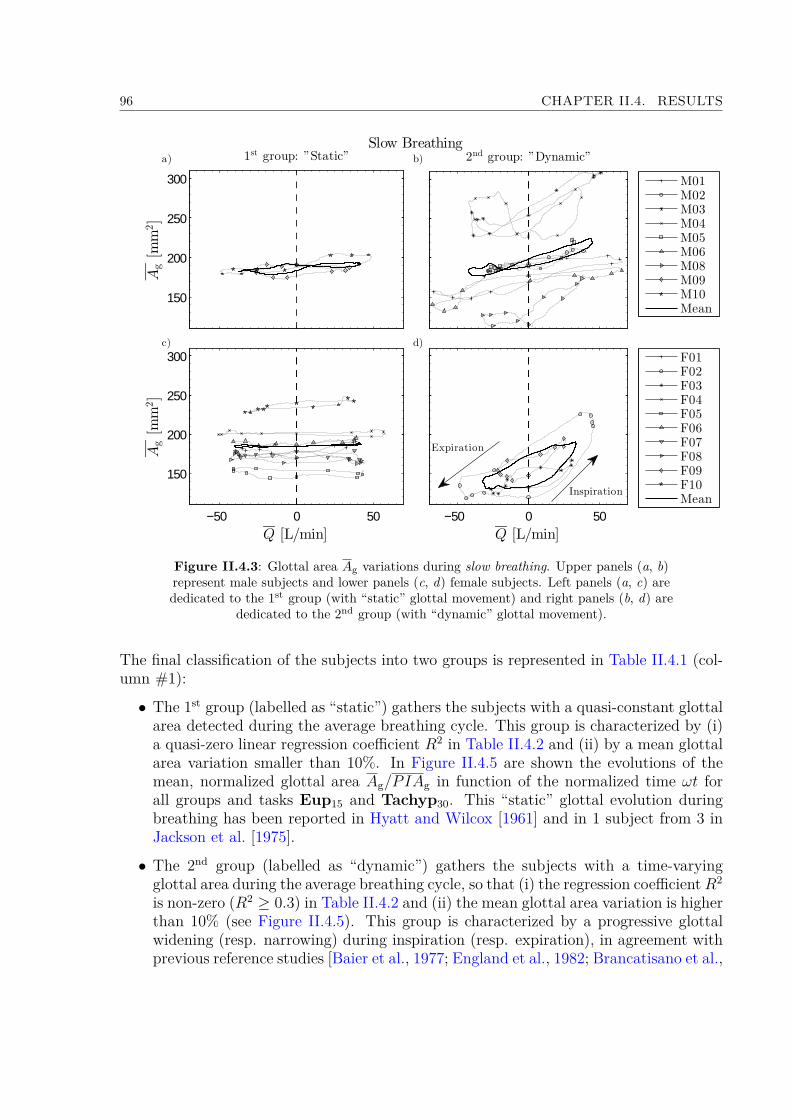
96 CHAPTER II.4. RESULTS
Slow Breathing
F01F02F03F04F05F06F07F08F09F10Mean
−50 0 50Q [L/min]
M01M02M03M04M05M06M08M09M10Mean
2nd group: ”Dynamic”
−50 0 50
150
200
250
300
Q [L/min]
Ag[m
m2]
150
200
250
300
Ag[m
m2]
1st group: ”Static”a)
c) d)
Expiration
Inspiration
b)
Figure II.4.3: Glottal area Ag variations during slow breathing. Upper panels (a, b)represent male subjects and lower panels (c, d) female subjects. Left panels (a, c) arededicated to the 1st group (with “static” glottal movement) and right panels (b, d) are
dedicated to the 2nd group (with “dynamic” glottal movement).
The final classification of the subjects into two groups is represented in Table II.4.1 (col-umn #1):
• The 1st group (labelled as “static”) gathers the subjects with a quasi-constant glottalarea detected during the average breathing cycle. This group is characterized by (i)a quasi-zero linear regression coefficient R2 in Table II.4.2 and (ii) by a mean glottalarea variation smaller than 10%. In Figure II.4.5 are shown the evolutions of themean, normalized glottal area Ag/PIAg in function of the normalized time ωt forall groups and tasks Eup15 and Tachyp30. This “static” glottal evolution duringbreathing has been reported in Hyatt and Wilcox [1961] and in 1 subject from 3 inJackson et al. [1975].
• The 2nd group (labelled as “dynamic”) gathers the subjects with a time-varyingglottal area during the average breathing cycle, so that (i) the regression coefficientR2
is non-zero (R2 ≥ 0.3) in Table II.4.2 and (ii) the mean glottal area variation is higherthan 10% (see Figure II.4.5). This group is characterized by a progressive glottalwidening (resp. narrowing) during inspiration (resp. expiration), in agreement withprevious reference studies [Baier et al., 1977; England et al., 1982; Brancatisano et al.,
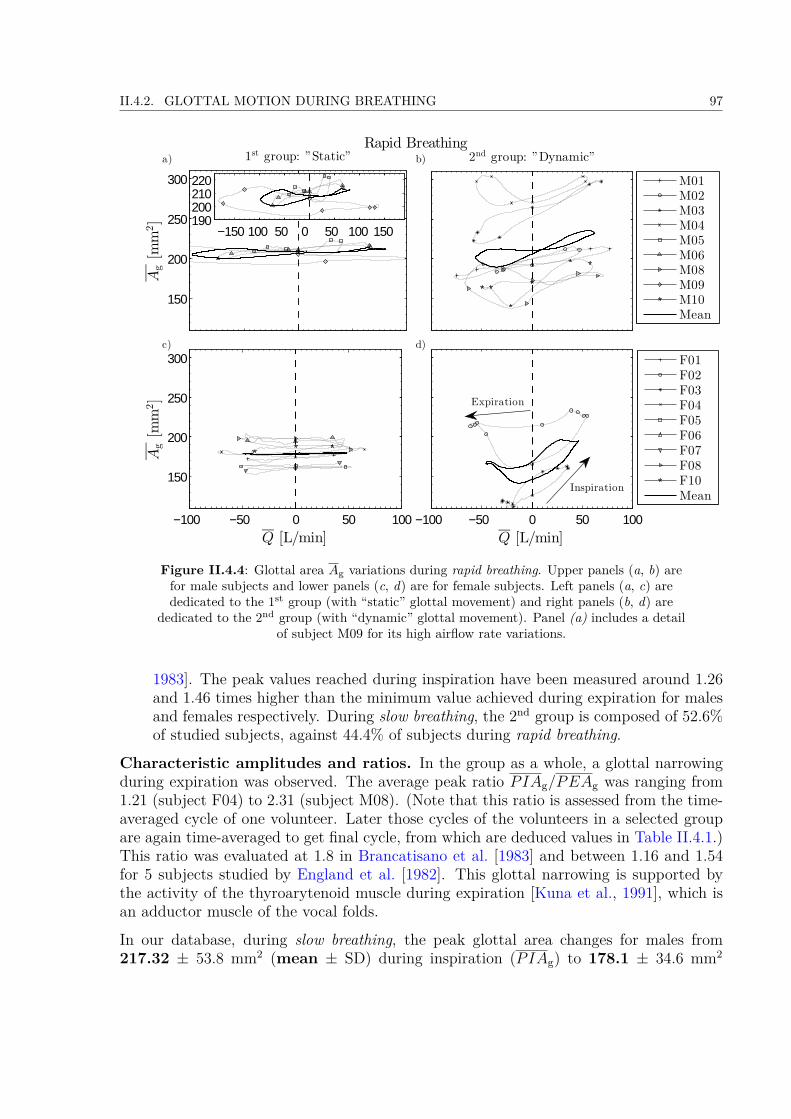
II.4.2. GLOTTAL MOTION DURING BREATHING 97
Rapid Breathing
−150100 50 0 50 100 150 190200210220
F01F02F03F04F05F06F07F08F10Mean
−100 −50 0 50 100Q [L/min]
M01M02M03M04M05M06M08M09M10Mean
2nd group: ”Dynamic”
−100 −50 0 50 100
150
200
250
300
Q [L/min]
Ag[m
m2]
150
200
250
300
Ag[m
m2]
1st group: ”Static”
−150100 50 0 50 100 150 190200210220
a) b)
c) d)
Expiration
Inspiration
Figure II.4.4: Glottal area Ag variations during rapid breathing. Upper panels (a, b) arefor male subjects and lower panels (c, d) are for female subjects. Left panels (a, c) arededicated to the 1st group (with “static” glottal movement) and right panels (b, d) are
dedicated to the 2nd group (with “dynamic” glottal movement). Panel (a) includes a detailof subject M09 for its high airflow rate variations.
1983]. The peak values reached during inspiration have been measured around 1.26and 1.46 times higher than the minimum value achieved during expiration for malesand females respectively. During slow breathing, the 2nd group is composed of 52.6%of studied subjects, against 44.4% of subjects during rapid breathing.
Characteristic amplitudes and ratios. In the group as a whole, a glottal narrowingduring expiration was observed. The average peak ratio PIAg/PEAg was ranging from1.21 (subject F04) to 2.31 (subject M08). (Note that this ratio is assessed from the time-averaged cycle of one volunteer. Later those cycles of the volunteers in a selected groupare again time-averaged to get final cycle, from which are deduced values in Table II.4.1.)This ratio was evaluated at 1.8 in Brancatisano et al. [1983] and between 1.16 and 1.54for 5 subjects studied by England et al. [1982]. This glottal narrowing is supported bythe activity of the thyroarytenoid muscle during expiration [Kuna et al., 1991], which isan adductor muscle of the vocal folds.
In our database, during slow breathing, the peak glottal area changes for males from217.32 ± 53.8 mm2 (mean ± SD) during inspiration (PIAg) to 178.1 ± 34.6 mm2
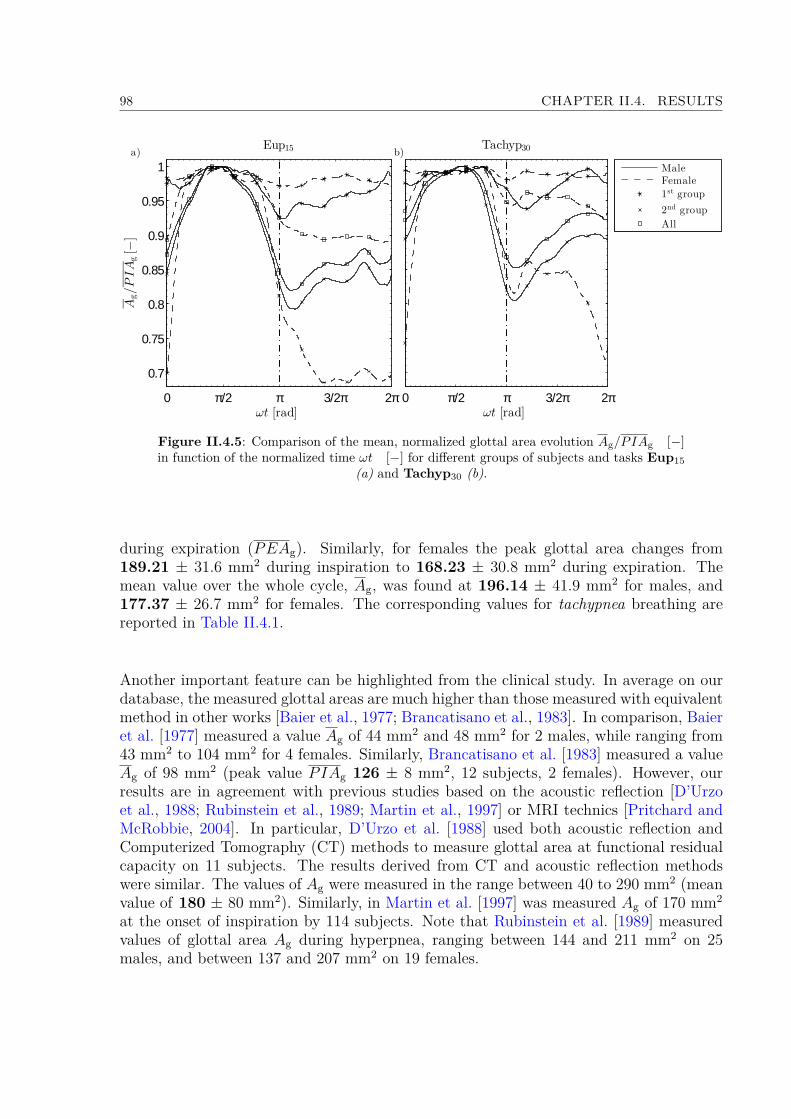
98 CHAPTER II.4. RESULTS
0 π/2 π 3/2π 2π
0.7
0.75
0.8
0.85
0.9
0.95
1
Ag/PIA
g[−
]
ωt [rad]
Eup15
0 π/2 π 3/2π 2πωt [rad]
Tachyp30
MaleFemale
1st group
2nd group
All
a) b)
Figure II.4.5: Comparison of the mean, normalized glottal area evolution Ag/PIAg [−]in function of the normalized time ωt [−] for different groups of subjects and tasks Eup15
(a) and Tachyp30 (b).
during expiration (PEAg). Similarly, for females the peak glottal area changes from189.21 ± 31.6 mm2 during inspiration to 168.23 ± 30.8 mm2 during expiration. Themean value over the whole cycle, Ag, was found at 196.14 ± 41.9 mm2 for males, and177.37 ± 26.7 mm2 for females. The corresponding values for tachypnea breathing arereported in Table II.4.1.
Another important feature can be highlighted from the clinical study. In average on ourdatabase, the measured glottal areas are much higher than those measured with equivalentmethod in other works [Baier et al., 1977; Brancatisano et al., 1983]. In comparison, Baieret al. [1977] measured a value Ag of 44 mm2 and 48 mm2 for 2 males, while ranging from43 mm2 to 104 mm2 for 4 females. Similarly, Brancatisano et al. [1983] measured a valueAg of 98 mm2 (peak value PIAg 126 ± 8 mm2, 12 subjects, 2 females). However, ourresults are in agreement with previous studies based on the acoustic reflection [D’Urzoet al., 1988; Rubinstein et al., 1989; Martin et al., 1997] or MRI technics [Pritchard andMcRobbie, 2004]. In particular, D’Urzo et al. [1988] used both acoustic reflection andComputerized Tomography (CT) methods to measure glottal area at functional residualcapacity on 11 subjects. The results derived from CT and acoustic reflection methodswere similar. The values of Ag were measured in the range between 40 to 290 mm2 (meanvalue of 180 ± 80 mm2). Similarly, in Martin et al. [1997] was measured Ag of 170 mm2
at the onset of inspiration by 114 subjects. Note that Rubinstein et al. [1989] measuredvalues of glottal area Ag during hyperpnea, ranging between 144 and 211 mm2 on 25males, and between 137 and 207 mm2 on 19 females.

II.4.2. GLOTTAL MOTION DURING BREATHING 99
4.2.2 Influence of subject gender
a/ "Static" and "dynamic" group of subjects
The influence of the subject gender on glottal variations during slow breathing is clearlyhighlighted in Figure II.4.3. Indeed the male group has much more representatives inthe 2nd group “dynamic” (7/9) relative to the 1st “static” group (2/9), whereas femalesubjects are gathered together in majority in the 1st “static” group (7/10) compared withthe 2nd “dynamic” group (3/10). These trends are similar in rapid breathing, as displayedin Figure II.4.4 (6/9 males against 2/9 females only in the 2nd “dynamic” group).
b/ Glottal motion amplitudes & time-variations
Despite their minimal proportion within the 2nd group, females in this group demonstrateglottal motion amplitudes larger than males. This result yields to higher ratios AI
g/AEg and
PIAg/PEAg for females, whatever the task (see Table II.4.1, darkened rows). However,for both genders, the mean Ag
(Q)loops plotted in Figure II.4.3 panels (b) and (d)
do not exhibit ellipsoidal shapes, which would have been observed in case of sinusoidalglottal dynamics during a breathing period. Instead, the shape-differences observed on theAg(Q)loops of males and females mainly derive from the different time-variations of the
glottal area recorded during inspiration for both genders: a plateau in Ag evolution occursduring this phase for females, while a quasi-sinusoidal variation is measured for males (seeFigure II.4.6). Note that during slow breathing, the glottal dynamics during expiration issimilar for males and females: the glottis tends to stay opened in the narrowest posture(panels (a) and (c) on Figure II.4.6).
4.2.3 Influence of breathing task
The comparison of the Ag(Q)loops given in Figure II.4.3 and Figure II.4.4 shows similar
tendencies and orders of magnitude for eupnea and tachypnea.From our results, the influence of the breathing task on glottal motion is far less empha-sized than the one of the subject gender. The glottal aperture is larger during the wholecycle for tachypnea than for eupnea. This is in agreement with Baier et al. [1977], whomeasured larger glottal areas for men and women during tachypnea in comparison withquiet breathing.Furthermore, during hyperpnea, England and Bartlett [1982] observed an area Ag slightlyincreasing during inspiration and narrowing during expiration. Also they found smalleraperture ratio in comparison with quiet breathing. Those observations are confirmed bymeasurements of upper airways resistance. Spann and Hyatt [1971] measured a decreasein the average laryngeal resistance with hyperpnea. Stănescu et al. [1972] measured a 43%decrease in airway resistance during inspiration, and a 26% decrease during inspiration

100 CHAPTER II.4. RESULTS
0.68
0.76
0.84
0.92
1A
g/PIA
g[−
]Eup15
0 π/2 π 3/2π 2π0.4
0.55
0.7
0.85
1
ωt [rad]
Ag/PIA
g[−
]
0 π/2 π 3/2π 2π
0.8
0.85
0.9
0.95
1
Tachyp30
−1
−0.5
0
0.5
1
Q/PIF
[−]
Ag
QSinus
0 π/2 π 3/2π 2π0.48
0.61
0.74
0.87
1
ωt [rad]0 π/2 π 3/2π 2π
−1
−0.5
0
0.5
1
Q/PIF
[−]
a) b)
c) d)
Figure II.4.6: Comparison of mean normalized glottal area Ag/PIAg [−], meannormalized flow rate Q/PIF , and sinusoidal pattern for males (panels (a) and (b), tasksEup15 and Tachyp30, respectively) and females (panels (c) and (d), tasks Eup15 and
Tachyp30, respectively). Results given for subjects with “dynamic” glottal variations (2nd
group).
during hyperpnea. Finally, Insalaco et al. [1990] confirmed those results by measuring adecrease in thyroarytenoid muscle activity during hyperpnea.
4.2.4 Correlation between airflow rate pattern & glottal motion
Figure II.4.6 shows the mean normalized glottal area dynamics (Ag/PIAg) in function ofnormalized time (ωt) for subjects classified within the 2nd group only. The 1st group isnot presented here as the glottal dynamics is steady and the resulting normalized patternwould be a straight line close to 1. Upper (resp. lower) panels correspond to male (resp.female) subjects. On the figures are superposed the mean normalized airflow rate patterns(Q/PIF ), to analyze the correlation between airflow rate and glottal area time-variations.
For all subjects of the 2nd group and for all tasks, the glottal widening starts with theonset of inspiration, whereas the glottal narrowing precedes the expiration phase. Formales, the opening of Ag reaches the Peak Inspiratory glottal Area PIAg after the Peak
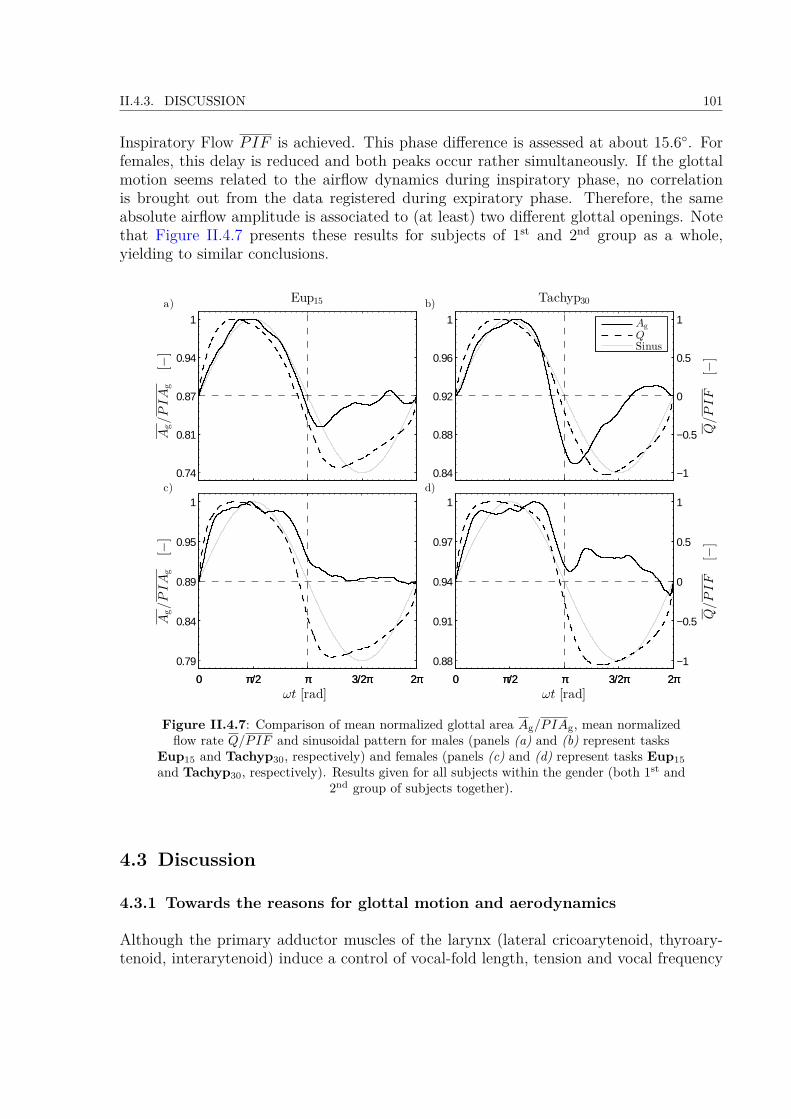
II.4.3. DISCUSSION 101
Inspiratory Flow PIF is achieved. This phase difference is assessed at about 15.6. Forfemales, this delay is reduced and both peaks occur rather simultaneously. If the glottalmotion seems related to the airflow dynamics during inspiratory phase, no correlationis brought out from the data registered during expiratory phase. Therefore, the sameabsolute airflow amplitude is associated to (at least) two different glottal openings. Notethat Figure II.4.7 presents these results for subjects of 1st and 2nd group as a whole,yielding to similar conclusions.
0.74
0.81
0.87
0.94
1
Ag/PIA
g[−
]
Eup15
0 π/2 π 3/2π 2π0.79
0.84
0.89
0.95
1
ωt [rad]
Ag/PIA
g[−
]
0 π/2 π 3/2π 2π
0.84
0.88
0.92
0.96
1
Tachyp30
−1
−0.5
0
0.5
1
Q/PIF
[−]
Ag
QSinus
0 π/2 π 3/2π 2π0.88
0.91
0.94
0.97
1
ωt [rad]0 π/2 π 3/2π 2π
−1
−0.5
0
0.5
1
Q/PIF
[−]
a) b)
c) d)
Figure II.4.7: Comparison of mean normalized glottal area Ag/PIAg, mean normalizedflow rate Q/PIF and sinusoidal pattern for males (panels (a) and (b) represent tasks
Eup15 and Tachyp30, respectively) and females (panels (c) and (d) represent tasks Eup15and Tachyp30, respectively). Results given for all subjects within the gender (both 1st and
2nd group of subjects together).
4.3 Discussion
4.3.1 Towards the reasons for glottal motion and aerodynamics
Although the primary adductor muscles of the larynx (lateral cricoarytenoid, thyroary-tenoid, interarytenoid) induce a control of vocal-fold length, tension and vocal frequency
102 CHAPTER II.4. RESULTS
during human phonation, the glottal self-sustained vibrations result from complex interac-tions between the laryngeal airflow and the mechanical behavior of vocal-fold soft tissues[Titze, 1994]. In fact, these vibrations can typically be reproduced on excised larynges orin vitro synthetic models of vocal folds [Dollinger et al., 2011]. Thereby, once installed,the sound-related glottal motion is not driven by a neuromotor control. By contrast, therespiratory-related glottal motion is generated by contractions of intralaryngeal muscles,and is highly affected by laryngeal reflex responses [Widdicombe and Tatar, 1988; Shiba,2009]. More specifically, the vocal fold abductor (posterior cricoarytenoid muscle) dilatesthe glottis during inspiration by abduction rotation of the arytenoid cartilages, while theadductor muscles narrow the glottis during expiration by adduction-rotation of the ary-tenoid cartilages. There is general agreement that this controlled motion is carried out inorder:
i. to help the air intake during inspiration by glottis widening, which lowers the upperairways resistance to flow,
ii. to brake the passive expiratory airflow by glottis narrowing, which enables a controlof the end-expiratory lung volume and pressure in order to prevent alveoli fromcollapse [Rattenborg, 1961; Brancatisano et al., 1983; Roux, 2002; Shiba, 2009].
Note that several studies are dedicated to the restoration of an optimal laryngeal geometryafter a surgical change of the vocal folds, which would minimize the airflow resistance inthe upper airways [Templer et al., 1991; Hundertmark-Zaušková et al., 2013]. Thus, theresults obtained in our study on glottal motion and aerodynamics during breathing werefurther analyzed to interpret the data in terms of energy efficiency. To this end, thepower dissipated by an airflow (volume airflow rate Q0(t)) through a circular diaphragm(“glottis” of cross section area A0
g) across a cylindrical tube (“trachea” of cross sectionarea At with diameter equal to glottal antero-posterior distance APg) was calculated intwo comparative cases:(a) a realistic case, mimicking the measured unsteady flow and glottal conditions, where:
Q0(t) = Q(t), (II.4.1)
and A0g(t) = Ag(t), (II.4.2)
(b) an idealized case assuming unsteady sinusoidal flow conditions and steady glottis,where:
Q0(t) = PIF sin(ωt),
with PIF = πV I
T t,
(II.4.3)
and A0g(t) = Ag. (II.4.4)
Considering the air as an incompressible Newtonian gas with typical flow Reynolds numberRe < 105 and neglecting unsteady effect, the power Pw [W] dissipated through a circular
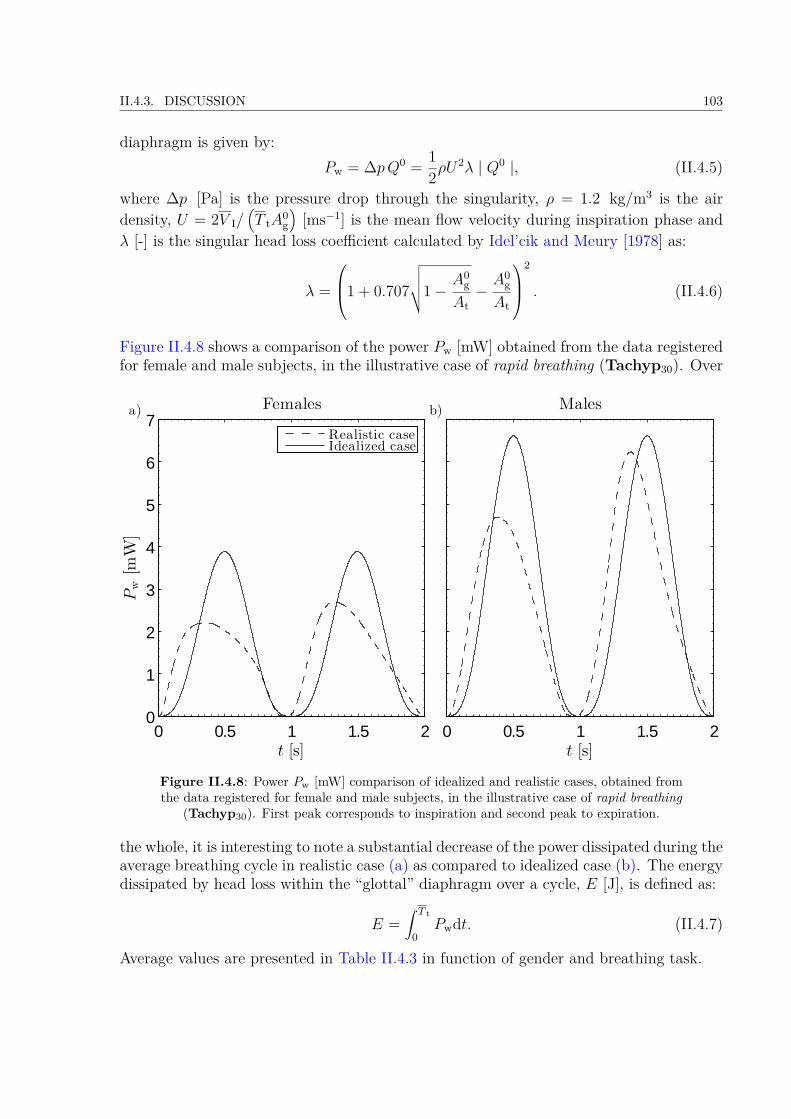
II.4.3. DISCUSSION 103
diaphragm is given by:Pw = ∆pQ0 = 1
2ρU2λ | Q0 |, (II.4.5)
where ∆p [Pa] is the pressure drop through the singularity, ρ = 1.2 kg/m3 is the airdensity, U = 2V I/
(T tA
0g
)[ms−1] is the mean flow velocity during inspiration phase and
λ [-] is the singular head loss coefficient calculated by Idel’cik and Meury [1978] as:
λ =
1 + 0.707
√√√√1−A0
g
At−A0
g
At
2
. (II.4.6)
Figure II.4.8 shows a comparison of the power Pw [mW] obtained from the data registeredfor female and male subjects, in the illustrative case of rapid breathing (Tachyp30). Over
0 0.5 1 1.5 20
1
2
3
4
5
6
7
t [s]
Pw[m
W]
Females
Realistic caseIdealized case
0 0.5 1 1.5 2t [s]
Malesa) b)
Figure II.4.8: Power Pw [mW] comparison of idealized and realistic cases, obtained fromthe data registered for female and male subjects, in the illustrative case of rapid breathing
(Tachyp30). First peak corresponds to inspiration and second peak to expiration.
the whole, it is interesting to note a substantial decrease of the power dissipated during theaverage breathing cycle in realistic case (a) as compared to idealized case (b). The energydissipated by head loss within the “glottal” diaphragm over a cycle, E [J], is defined as:
E =∫ T t
0Pwdt. (II.4.7)
Average values are presented in Table II.4.3 in function of gender and breathing task.
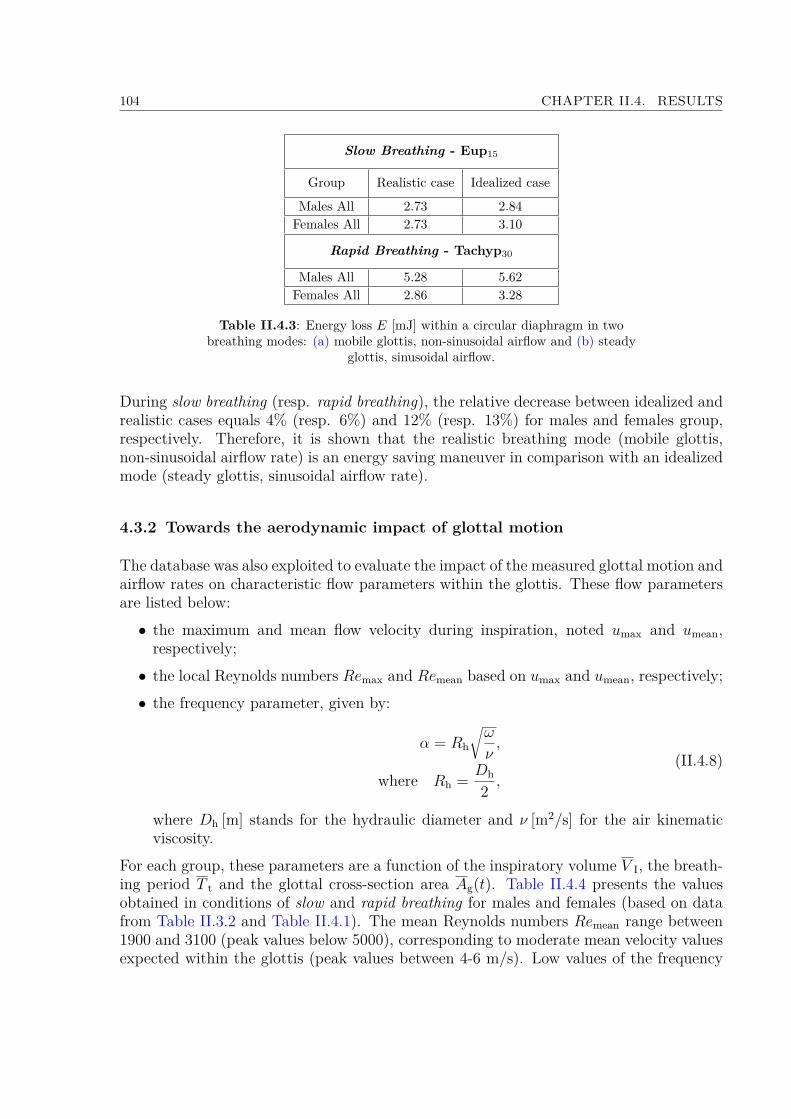
104 CHAPTER II.4. RESULTS
Slow Breathing - Eup15
Group Realistic case Idealized case
Males All 2.73 2.84Females All 2.73 3.10
Rapid Breathing - Tachyp30
Males All 5.28 5.62Females All 2.86 3.28
Table II.4.3: Energy loss E [mJ] within a circular diaphragm in twobreathing modes: (a) mobile glottis, non-sinusoidal airflow and (b) steady
glottis, sinusoidal airflow.
During slow breathing (resp. rapid breathing), the relative decrease between idealized andrealistic cases equals 4% (resp. 6%) and 12% (resp. 13%) for males and females group,respectively. Therefore, it is shown that the realistic breathing mode (mobile glottis,non-sinusoidal airflow rate) is an energy saving maneuver in comparison with an idealizedmode (steady glottis, sinusoidal airflow rate).
4.3.2 Towards the aerodynamic impact of glottal motion
The database was also exploited to evaluate the impact of the measured glottal motion andairflow rates on characteristic flow parameters within the glottis. These flow parametersare listed below:• the maximum and mean flow velocity during inspiration, noted umax and umean,respectively;• the local Reynolds numbers Remax and Remean based on umax and umean, respectively;• the frequency parameter, given by:
α = Rh
√ω
ν,
where Rh = Dh
2 ,
(II.4.8)
where Dh [m] stands for the hydraulic diameter and ν [m2/s] for the air kinematicviscosity.
For each group, these parameters are a function of the inspiratory volume V I, the breath-ing period T t and the glottal cross-section area Ag(t). Table II.4.4 presents the valuesobtained in conditions of slow and rapid breathing for males and females (based on datafrom Table II.3.2 and Table II.4.1). The mean Reynolds numbers Remean range between1900 and 3100 (peak values below 5000), corresponding to moderate mean velocity valuesexpected within the glottis (peak values between 4-6 m/s). Low values of the frequency
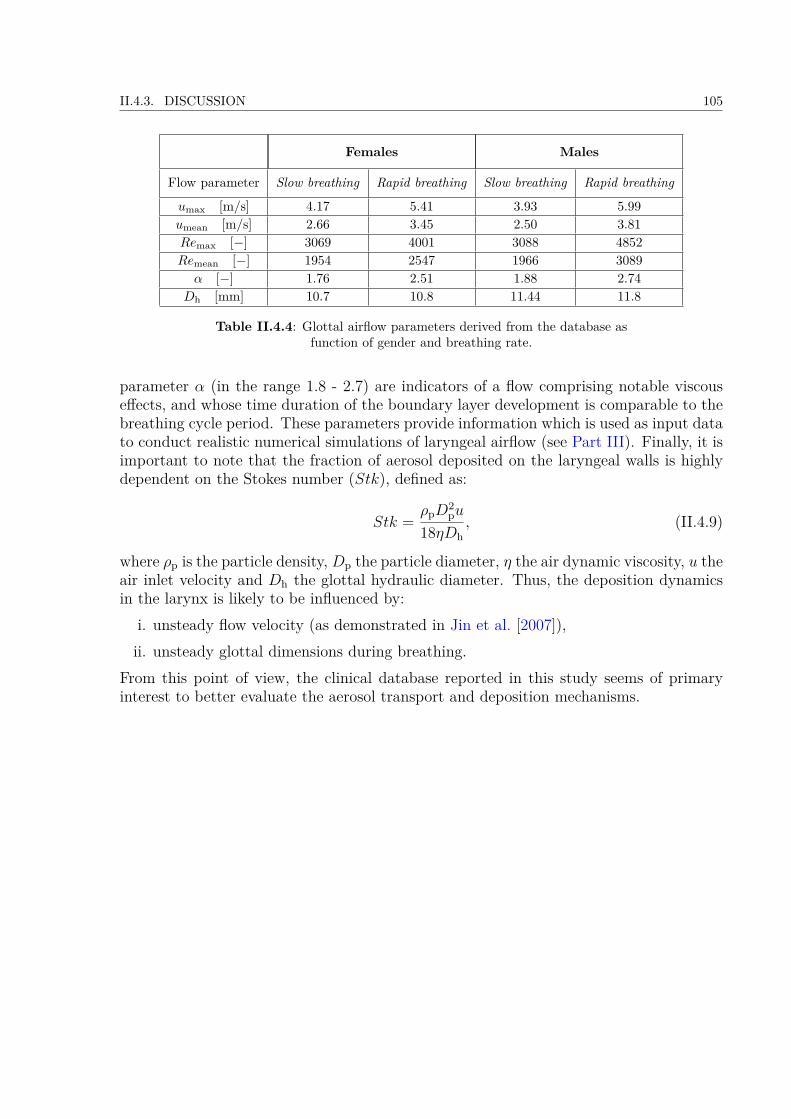
II.4.3. DISCUSSION 105
Females Males
Flow parameter Slow breathing Rapid breathing Slow breathing Rapid breathing
umax [m/s] 4.17 5.41 3.93 5.99umean [m/s] 2.66 3.45 2.50 3.81Remax [−] 3069 4001 3088 4852Remean [−] 1954 2547 1966 3089α [−] 1.76 2.51 1.88 2.74
Dh [mm] 10.7 10.8 11.44 11.8
Table II.4.4: Glottal airflow parameters derived from the database asfunction of gender and breathing rate.
parameter α (in the range 1.8 - 2.7) are indicators of a flow comprising notable viscouseffects, and whose time duration of the boundary layer development is comparable to thebreathing cycle period. These parameters provide information which is used as input datato conduct realistic numerical simulations of laryngeal airflow (see Part III). Finally, it isimportant to note that the fraction of aerosol deposited on the laryngeal walls is highlydependent on the Stokes number (Stk), defined as:
Stk =ρpD
2pu
18ηDh, (II.4.9)
where ρp is the particle density, Dp the particle diameter, η the air dynamic viscosity, u theair inlet velocity and Dh the glottal hydraulic diameter. Thus, the deposition dynamicsin the larynx is likely to be influenced by:
i. unsteady flow velocity (as demonstrated in Jin et al. [2007]),ii. unsteady glottal dimensions during breathing.
From this point of view, the clinical database reported in this study seems of primaryinterest to better evaluate the aerosol transport and deposition mechanisms.

106 CHAPTER II.4. RESULTS
Summary
Several items can be highlighted to summarize the methodology and results presented inthe Part II:• A clinical study was conducted in collaboration with the ENT Department of theLa Timone Adults Hospital to examine the glottal motion during eight breathingtasks by means of an in vivo exploratory approach. This study was realized on 20healthy non-smoking volunteers in the range of 20 and 30 years old, including 10women and 10 men. Laryngofibroscopy was realized using a flexible nasofibroscope.Synchronized oral airflow measurements were achieved by means of EVA2TM sys-tem developed at the Speech and Language Laboratory (LPL). The breathing taskswere divided in slow breathing tasks (below 20 cycles/min) and rapid breathing tasks(above 20 cycles/min). In total, 144 breathing sequences of 30s were recorded.• The data processing comprised: (i) the detection of a mean breathing airflow rate pergender for the "slow" and "rapid" breathing tasks; (ii) the extensive analysis of thelaryngeal images recorded during two major tasks for all subjects: the task of eupneaperformed at 15 cycles/min; and the task of tachypnea performed at 30 cycles/min.These tasks are altogether representative of "slow" and "rapid" breathing tasks. Acustomized methodology was developed to extract time-variations of the glottal areain each case.• In addition, some preliminary experiments allowed to measure the transglottal pres-sure drop during several breathing tasks, i.e., an information which completes theclinical study and which is rarely available in the literature. The transglottal pressureduring eupnea was found around 40 Pa; it can reach as much as 600 Pa in specificforced breathing regimes (panting).• Regarding the whole database, two cases of glottal time-variations were found: "static"and "dynamic" ones. Thus, testing the correlation of glottal and flow-rate time-variations, subjects with “static” or “dynamic” glottis during an average breathingcycle were sorted. Whatever the breathing regime, male have much more represen-tatives in the "dynamic" group, while female are gathered together in majority inthe "static" group. Yet, despite their minimal proportion in the "dynamic" group,females demonstrate glottal motion amplitudes larger than males.• During "slow" breathing, for males, the peak value of glottal area narrowed from217.32 ± 53.8 mm2 (mean ± SD) during inspiration, to 178.1 ± 34.6 mm2 during
107
108 CHAPTER II.4. RESULTS
expiration. For females, the peak glottal area changes from 189.21 ± 31.6 mm2
during inspiration to 168.23 ± 30.8 mm2 during expiration. The mean value overthe whole cycle, Ag, was found at 196.14 ± 41.9 mm2 for males, and 177.37 ± 26.7mm2 for females.• If the glottal motion seems related to the airflow dynamics during inspiratory phase,no correlation is brought out from the data registered during expiratory phase. Thesame absolute airflow amplitude is associated to at least two different glottal open-ings.• Regarding flow unsteadiness, this study showed that the that the realistic breathingmode (mobile glottis, non-sinusoidal airflow rate) is an energy saving maneuver incomparison with an idealized mode (steady glottis, sinusoidal airflow rate).• These measurements provided input data to conduct the realistic numerical sim-ulations of laryngeal airflow and particle deposition, as presented in the followingPart III.
Part III
Flow & Aerosol Transport in UpperAirways: In Silico Study
109

III.5 Preliminary CFD Models with Mobile Glottis and Unsteady Breathing Conditions113III.5.1 Geometry . . . . . . . . . . . . . . . . . . . . . . . . . . . . . . . . . . . . . . . . . . . . 114III.5.2 Solution Method . . . . . . . . . . . . . . . . . . . . . . . . . . . . . . . . . . . . . . . . 115
III.5.2.1 Mechanical model . . . . . . . . . . . . . . . . . . . . . . . . . . . . . . . . . . . . 115III.5.2.2 Numerical method . . . . . . . . . . . . . . . . . . . . . . . . . . . . . . . . . . . 116III.5.2.3 Simulation setting . . . . . . . . . . . . . . . . . . . . . . . . . . . . . . . . . . . 117
III.5.3 Initial & Boundary Conditions . . . . . . . . . . . . . . . . . . . . . . . . . . . . . . . . 118III.5.4 Mesh Properties . . . . . . . . . . . . . . . . . . . . . . . . . . . . . . . . . . . . . . . . 125III.5.5 Results . . . . . . . . . . . . . . . . . . . . . . . . . . . . . . . . . . . . . . . . . . . . . . 127
III.5.5.1 Study of Flow in Case 1 & 2 . . . . . . . . . . . . . . . . . . . . . . . . . . . . . . 127III.5.5.2 Aerosol Deposition . . . . . . . . . . . . . . . . . . . . . . . . . . . . . . . . . . . 130
III.6 3D CFD Model of Upper Airways with Mobile Glottis and Unsteady BreathingConditions 137III.6.1 Geometry . . . . . . . . . . . . . . . . . . . . . . . . . . . . . . . . . . . . . . . . . . . . 137
III.6.1.1 3D upper airways idealized geometry . . . . . . . . . . . . . . . . . . . . . . . . . 137III.6.1.2 3D Laryngeal region idealized geometry . . . . . . . . . . . . . . . . . . . . . . . 139
III.6.2 Solution Method . . . . . . . . . . . . . . . . . . . . . . . . . . . . . . . . . . . . . . . . 142III.6.2.1 Mechanical flow model . . . . . . . . . . . . . . . . . . . . . . . . . . . . . . . . . 142III.6.2.2 Discrete Phase Model . . . . . . . . . . . . . . . . . . . . . . . . . . . . . . . . . 143III.6.2.3 Numerical method . . . . . . . . . . . . . . . . . . . . . . . . . . . . . . . . . . . 147III.6.2.4 Simulation setting . . . . . . . . . . . . . . . . . . . . . . . . . . . . . . . . . . . 148
III.6.3 Initial & Boundary Conditions . . . . . . . . . . . . . . . . . . . . . . . . . . . . . . . . 148III.6.4 Mesh Properties . . . . . . . . . . . . . . . . . . . . . . . . . . . . . . . . . . . . . . . . 152
III.6.4.1 Grid dependence . . . . . . . . . . . . . . . . . . . . . . . . . . . . . . . . . . . . 152III.6.4.2 Quality of Dynamic mesh . . . . . . . . . . . . . . . . . . . . . . . . . . . . . . . 154
III.7 CFD Results 157III.7.1 Pressure Drop Dynamics . . . . . . . . . . . . . . . . . . . . . . . . . . . . . . . . . . . . 157III.7.2 Airflow Dynamics . . . . . . . . . . . . . . . . . . . . . . . . . . . . . . . . . . . . . . . . 159
III.7.2.1 General Flow Features in the Upper Airways . . . . . . . . . . . . . . . . . . . . 160III.7.2.2 Laryngeal jet under different breathing conditions . . . . . . . . . . . . . . . . . . 165
III.7.3 Aerosol Deposition . . . . . . . . . . . . . . . . . . . . . . . . . . . . . . . . . . . . . . . 169III.7.3.1 Effects of non-steady airflow . . . . . . . . . . . . . . . . . . . . . . . . . . . . . . 169III.7.3.2 Deposition spots within the model . . . . . . . . . . . . . . . . . . . . . . . . . . 171III.7.3.3 Impact of steady and dynamic glottal variations in the trachea region . . . . . . 174III.7.3.4 Summary on deposition results within the upper airways for the 6 cases . . . . . 176
Summary 183

112 TABLE DES MATIÈRES

Introduction
As reported in Part I, some previous Computational Fluid Dynamics (CFD) studiesshowed that the laryngeal area can play a key role in airflow dynamics (see section I.2.2.2).More specifically, the glottis causes human upper airways to tighten and narrow in a min-imal transition cross-section (see section I.2.1). This anatomical singularity yields to acomplex jet-like tracheal flow, characterized by important recirculation zones and a locallyturbulent behavior, which can be determinant on particle deposition by inertial impaction[Katz and Martonen, 1996; Katz et al., 1997; Renotte et al., 2000; Brouns et al., 2007b].
However, as summarized in section I.1.3.2, most of the studies dedicated to the glottalimpact on the respiratory biomechanics and aerosol deposition patterns within the upperairways are still limited. Indeed, several assumptions often adopted are: a mean constantinhalation flow rate applied at inlet conditions, quasi-steady respiratory flow conditions,and a parametric static glottal cross-section [Katz et al., 1997; Brouns et al., 2007b; Zhangand Kleinstreuer, 2011].
Therefore, the aim of this part is to exploit the results of the in vivo study detailed inPart II, and to elaborate an original CFD model employing the measured data as dimen-sions of upper airways geometry, and unsteady input conditions. Thereby considering:realistic cyclic breathing airflow rates at the inlet area, unsteady flow conditions andaerosol delivery, and mobile glottal walls. To this end, a step-by-step methodology wasadopted, comprising (i) the elaboration of a glottal motion model derived from the invivo data, (ii) numerical modeling in preliminary 2D and 3D geometries including bothmobile glottal walls and unsteady breathing conditions, (iii) the elaboration of a 3D aver-age idealized geometry of the upper airways, and (iv) numerical simulations of two-phaseflow conducted in the complete 3D geometry using experimental unsteady airflow condi-tions and dynamic glottal configurations. Hence, this part is divided in three chapters asfollows:
• The design of the glottal motion model as well as the preliminary numerical models(steps i and ii) are described in chapter III.5. The methodology used to elaboratedynamic meshes is pointed out. The results obtained in a simple 3D tube geometryincluding a mobile diaphragm are presented.
• The elaboration of the 3D idealized geometry of the upper airways (step iii) is pre-sented in chapter III.6. This chapter describes the chosen geometry, the mesh proper-ties, the solution method and the different simulation cases implemented in ANSYS R©
113
114 TABLE DES MATIÈRES
Fluent Academic Research (Release 15.0). The glottal wall conditions (static or dy-namic group), the breathing type (eupnea or tachypnea) and the nature of carriergas (air or Helium (He) - Oxygen (O2) 78% - 22% mixture) are the three parametersvaried in the simulation cases.• Finally, chapter III.7 presents the results of the different simulation cases introducedin chapter III.6 (step iv).
Note that preliminary 2D and 3D results of this chapter III.5 were presented in a confer-ence paper of the 37th Congress of the Société de Biomécanique (SB 2012) in Toulouse,France [Scheinherr et al., 2012], in a poster at 19th Congress of the International Societyfor Aerosol in Medicine (ISAM 2013) in Chapel Hill, USA [Scheinherr et al., 2013b], andas an oral presentation at the 19th Congress of the European Society of Biomechanics(ESB 2013) in Patras, Greece [Scheinherr et al., 2013a].
Chapter III.5
Preliminary CFD Models withMobile Glottis and UnsteadyBreathing Conditions
This chapter details the design of a glottal motion model derived from the in vivo datareported in Part II, and its implementation in simplified preliminary CFD models withaerosol transport. As pilot studies, two simple geometries including glottal mobile wallswere created: (i) a 2D rectangular moving constriction placed in a 2D rectangular channel,and (ii) a 3D cylindrical tube including a mobile 2D diaphragm representing the glottalconstriction. The first 2D case is described in Annex B - 2D Model. Present chapter isfully dedicated to the 3D case.
In comparison with realistic geometry of the larynx, the geometry considered in thischapter only comprises a realistic glottal area, derived from previous part. However, thisfirst rough approximation enabled to understand the problematics connected to unsteady3D flow simulations with unsteady boundary conditions. It allowed to provide basicqualitative information and first orders of magnitude relative to the airflow occurringin the glottal region, while performing low time-consuming computational calculations.More specifically, the elementary design of the model (tube) was chosen to focus on thesettings of the mobile walls and the mesh deformation in time, by allowing an easieradjustment of dynamic mesh geometries in the CFD solver, an easier choice of the meshproperties and an easier assessment of the relevance of the moving mesh settings.
In the following, the design of geometry is described in section III.5.1, the solution methodin section III.5.2, and the initial and boundary conditions are detailed in section III.5.3together with the different cases of simulations. The mesh properties are presented inIII.5.4. The numerical results of CFD simulations on the flow field and aerosol transportand deposition are discussed in section III.5.5.
115
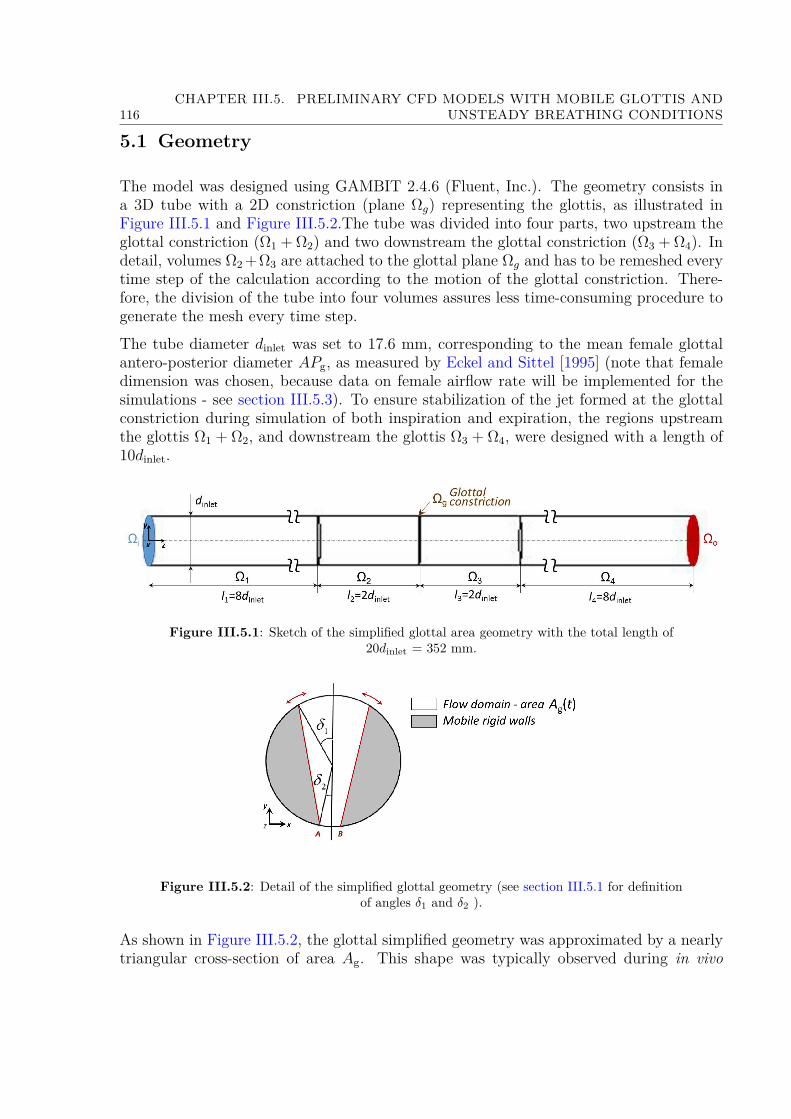
116CHAPTER III.5. PRELIMINARY CFD MODELS WITH MOBILE GLOTTIS AND
UNSTEADY BREATHING CONDITIONS
5.1 Geometry
The model was designed using GAMBIT 2.4.6 (Fluent, Inc.). The geometry consists ina 3D tube with a 2D constriction (plane Ωg) representing the glottis, as illustrated inFigure III.5.1 and Figure III.5.2.The tube was divided into four parts, two upstream theglottal constriction (Ω1 + Ω2) and two downstream the glottal constriction (Ω3 + Ω4). Indetail, volumes Ω2 +Ω3 are attached to the glottal plane Ωg and has to be remeshed everytime step of the calculation according to the motion of the glottal constriction. There-fore, the division of the tube into four volumes assures less time-consuming procedure togenerate the mesh every time step.The tube diameter dinlet was set to 17.6 mm, corresponding to the mean female glottalantero-posterior diameter APg, as measured by Eckel and Sittel [1995] (note that femaledimension was chosen, because data on female airflow rate will be implemented for thesimulations - see section III.5.3). To ensure stabilization of the jet formed at the glottalconstriction during simulation of both inspiration and expiration, the regions upstreamthe glottis Ω1 + Ω2, and downstream the glottis Ω3 + Ω4, were designed with a length of10dinlet.
Figure III.5.1: Sketch of the simplified glottal area geometry with the total length of20dinlet = 352 mm.
Figure III.5.2: Detail of the simplified glottal geometry (see section III.5.1 for definitionof angles δ1 and δ2 ).
As shown in Figure III.5.2, the glottal simplified geometry was approximated by a nearlytriangular cross-section of area Ag. This shape was typically observed during in vivo

III.5.2. SOLUTION METHOD 117
laryngoscopic investigation of quiet breathing in Part II, and was already applied in theliterature [Renotte et al., 2000]. The middle part proximates the glottis and the gray sideparts correspond to the vocal folds. Points A and B are fixed in the geometry, symmetricwith respect to the glottal median axis (that of APg). Their position is defined by theangle δ2, chosen constant in time, at a value of 5 (see Figure III.5.2). This value waschosen in agreement with typical measurements performed on laryngeal images recordedin the clinical study (Part II). The glottal motion is parametrized by the angle δ1 (seeFigure III.5.2) whose values can be varied as a function of time. Thereby, the glottal areavariations are obtained through the rotation of the side parts around points A and B. Tosimulate a glottal area variation Ag(t) as measured in Part II, the value of angle δ1(t) atshot-instant t was calculated as follows:
Ag (t)− APg
2
(δ1 (t) + δ2 + 1
2 sin(π− δ1(t)− δ2))
= 0. (III.5.1)
Equation III.5.1 was solved using Matlab R© function fsolve in the frame of non-linearequations. Further, details on the mobile boundary conditions for the simulated cases aregiven in section III.5.3.
5.2 Solution Method
5.2.1 Mechanical model
Flow regime. For realistic inhalation conditions in slow and rapid breathing, the ordersof magnitude of the flow parameters in the laryngeal region have been detailed in previ-ous part (see Table II.4.4). In particular, the local mean Reynolds number obtained atthe glottis is moderate, ranging between 1900 and 3100, with peak values around 5000.The prior measurements conducted by Dekker [1961] on casts of human trachea (seesection I.2.2.1) showed that the critical value of Reynolds number corresponding to thetransition between laminar and turbulent regimes is around 460, under steady conditions.Based on that experiment, most of the CFD studies dealing with breathing airflow inthe literature assume a turbulent regime in the upper airways geometry (see e.g.Sandeau[2010]).Due to the moderate values of the Reynolds number, and to the different values of flowrates occurring during a mean breathing cycle (see Table II.3.2), it is likely that the flowregime can stand close to the laminar-turbulent transition at some instants in the cycle.By analogy with hemodynamic pulsatile flows of similar characteristic patterns, the flowunsteadiness induces internal stabilization effects, so that laminar regimes can be observedin spite of peak Reynolds number larger than 4000 [Boiron et al., 2007]. Therefore, a tur-bulence flow model was chosen for the following 3D CFD model, keeping in mind thattransitional flows are likely to occur.

118CHAPTER III.5. PRELIMINARY CFD MODELS WITH MOBILE GLOTTIS AND
UNSTEADY BREATHING CONDITIONS
Mechanical formulation. In the following, it is assumed that studied gas behaves as aNewtonian incompressible gas. With respect to dynamic meshes, the integral form of theNavier-Stokes flow governing equations in turbulent regime on a volume Ωi is moving canbe written in primitive variables formulation as:
∇ · u(x, t) = 0
ρ
[∂u(x,t)∂t
+((u (x, t)− ugrid
)· ∇
)u(x, t)
]= −∇p(x, t) +∇ · τ
∀[x, t]∈ Ωi × [0,+∞](III.5.2)
where variables u, p, ρ, τ stand respectively for the Reynolds averaged gas velocity vector,the static pressure, the fluid density, and the viscous tensor. The latter depends on theeddy viscosity coefficient µt (Equation III.5.4). Vector ugrid represents the grid velocityof the moving mesh, which is determined for all mesh elements as:
ugrid = ∆y∆t . (III.5.3)
This approach to describe the evolution of fluid domain is referred as Arbitrary Lagrangian-Eulerian (ALE) mapping. The ALE formulation combines the advantage of both classicalkinematical descriptions: the Lagrangian and the Eulerian description. In the ALE de-scription, the nodes of the computational mesh may be moved with the continuum innormal Lagrangian fashion, or be held fixed in Eulerian manner, or be moved in somearbitrarily specified way to give a continuous rezoning capability. The advantages are(i) in comparison with a purely Lagrangian method, greater distortions can be afforded;and (ii) in comparison with a purely Eulerian approach, the distortions are handled withhigher resolution [Donea et al., 2004].
5.2.2 Numerical method
With respect to the assumption of transitional flows (see previous paragraphs), the Shear-Stress Transport (SST) k − ω turbulence model was chosen to describe the turbulentflow regime, based on its ability to capture the air flow structures in the transitional flowregimes (e.g., Zhang and Kleinstreuer [2003]; Xi and Longest [2007]; Sandeau et al. [2010]).The Shear-Stress Transport (SST) k−ω turbulence model combines the advantage of thestandard k−ω model [Wilcox, 1998] in the near wall region and the robustness of the k−εfor the free-stream flow [Menter et al., 2003]. This results in a more complex formulationof the eddy viscosity (Equation III.5.4) that includes two main variables, k the turbulentkinetic energy, and ω the dissipation per unit turbulence kinetic energy. The model wasdeveloped by Menter [1993], where can be found its standard formulation. It is a modelwith two governing equations (Equation III.5.5 and Equation III.5.6), based on the eddyviscosity µt [Menter, 1993]:
µt = ρk
ω
1SF2a1ω
, (III.5.4)
where S is the invariant measure of the strain rate magnitude, F2 the second blend-ing function (explained below), and the model constant a1 is the Bradshaw’s structuralparameter (for details, see definitions in Menter [1993]).

III.5.2. SOLUTION METHOD 119
The transport equations are derived from Reynolds Averaged Navier-Stokes equations(RANS) and, applied to dynamic mesh, are written for k as:
ρg∂k
∂t+ ρg
∂(k(uj − ugridj
))∂xj
= ∂
∂xj
[(ηg + µt
σk
)∂k
∂xj
]+
+ min[−ρgu′iu
′j∂ (ui − ugridi)
∂xj, 10ρgβ
?kω
]− β?ρgkω (III.5.5)
and correspondingly for ω as:
ρg∂ω
∂t+ ρg
∂(ω(uj − ugridj
))∂xj
= ∂
∂xj
[(ηg + µt
σω
)∂ω
∂xj
]− α
µtu′iu′j∂(ui − ugridj
)∂xj
− βρgω2+
+ 2 (1− F1) ρgσω,21ω
∂k
∂xj
∂ω
∂xj. (III.5.6)
The first term on the right side of each equations stands for effective diffusivity of kand ω respectively, composed of the diffusion caused by turbulent flow fluctuations andby molecular diffusion. The second (source) term represents the production of k and ωrespectively, and the third (sink) term stand for the dissipation of k and ω, respectively.Finally the fourth term on the right side of Equation III.5.6 includes the first blendingfunction F1. This and the second blending function F2 ensure that close to boundary isvalid the k − ω model and in distance the k − ε model.The flow mean velocity ui is composed from mean (ensemble-averaged or time-averaged)and fluctuating components, and the velocity ugridi,j is the instantaneous velocity of themoving mesh boundaries. Details and definitions on the turbulent Prandtl numbers σkand σω for k and ω respectively, the coefficients in dissipation terms of transport equationsβ? and β, and other model constants can be found in Menter [1993] and Menter et al.[2003].
5.2.3 Simulation setting
The equations were solved by means of a finite volume method using first-order time,spatial discretization schemes, and time step set to 2.5× 10⁻³s. The unsteady calculationhad 1260 time steps. Iterative convergence was achieved when the dimensionless RMSresiduals over the entire flow field were inferior to 10−4, which occurred at each time-stepafter about 50 iterations. The Courant-Friedrich-Lewy (CFL) criterion
CFLinlet = uinletmax∆t∆xinlet
= 14.5[−], (III.5.7)
is derived for the inlet area using the inlet velocity uinlet
uinlet(t) = Q(t)Ainlet
, (III.5.8)
120CHAPTER III.5. PRELIMINARY CFD MODELS WITH MOBILE GLOTTIS AND
UNSTEADY BREATHING CONDITIONS
where the inlet area is
Ainlet = πdinlet2
4 , (III.5.9)
. In the present solution for the shot-instant t(Qmax) the CFL = 10. Even if CFL > 1,calculation converged, so neither mesh dimensions and neither ∆t had to be changed.
5.3 Initial & Boundary Conditions
As for the 2D CFD model (see Boundary Conditions in Annex B - 2D Model), the airflowrate input conditions and glottal geometry kinematics were based on the data from thepreliminary in vivo study (see section II.3.1.1).
All boundary conditions were set and the simulation was conducted for one breathingcycle. The computational process of this transient calculation is illustrated by a flowchart on the Figure III.5.3. At first, the initial conditions (items ((a) and (b)) are appliedand the boundary conditions are set (items (c)) to (k)). Next, the CFD equations areprocessed until convergence is achieved and particles touching the walls of the modelare post-processed (item (l)). New time step is passed, mesh nodes in domain Ωg arerecalculated (item (h)) and the attached domains Ω2 and Ω3 are smoothed and remeshedif skewness or size of the elements exceeds preassigned limits (item (i)). Finally, the inletvelocity (item (c)) and particles injection (item (k)) are set.
Initial and boundary conditions were set for different domains of the model Ωi, Ω1, Ω2,Ω3, Ω4, Ωg, and Ωo (see Figure III.5.1) as follows:
Initial conditions
(a) Initial conditions with zero velocities u(t=0) = 0 and pressures p(t=0) = 0 were assumedat all points.
(b) At the inlet wall Ωi, the initial values for the turbulent kinetic energy k and thespecific dissipation rate ω were assigned, assuming a fully developed flow, using theempirical relation as follows:
kinlet = 32(umax
z I)2 and ωinlet = 2umaxz I
3`T, (III.5.10)
where I is the turbulence intensity chosen at 2% (low intensity) and `T the turbulencelength scale:
`T = 0.07dinlet. (III.5.11)
The factor 0.07 is based on the maximum value of the mixing length in fully-developedturbulent pipe flow [Schlichting, 1968, p. 568].

III.5.3. INITIAL & BOUNDARY CONDITIONS 121
Figure III.5.3: A flow chart of the numerical process. See list in the Initial & BoundaryConditions section for details on the items in brackets.

122CHAPTER III.5. PRELIMINARY CFD MODELS WITH MOBILE GLOTTIS AND
UNSTEADY BREATHING CONDITIONS
Flow boundary conditions
(c) The inlet velocity uinlet(t) is set at the inlet face Ωi. The time-variations were evalu-ated in agreement with the in vivo recordings of female subject S1 (section II.3.1.1)using the airflow rate Q(t) (see Equation III.5.8). The mean flow rate Q(t) cycle(see Figure III.5.4a) was calculated from 54 quiet breathing cycles. The unsteadyboundary condition was coded in C programming language using a User DefinedFunction (UDF) with DEFINE_PROFILE macro.
(d) A pressure outlet boundary condition p(t) was set at outlet domain Ωo to 0 Pa.
Wall boundary and dynamic mesh conditions
(e) On solid walls of Ω1, Ω2, Ω3, and Ω4 domains, a no slip shear boundary conditionuwall · n = 0 was applied, where uwall is the velocity vector of the wall motion, hereequal to zero and n is the outward normal vector.
(f) The wall boundary conditions at Ω1, Ω2, Ω3, and Ω4 domains for the k − ω modelequations correspond to the wall function approach for wall-function meshes and tothe appropriate low-Reynolds number boundary condition for the fine meshes. Thevalue of ω is specified at the wall as:
ωw = ρg(u∗)2
ηω+, (III.5.12)
where u∗ is the friction velocity (for definition see Equation III.5.14 in the followingchapter), η is the fluid dynamic viscosity and ω+ is defined for both laminar sublayerand logarithmic region (see Launder and Spalding [1974] for details).
(g) The wall boundary conditions for the inlet Ωi and outlet face Ωo were imposed as:
∂k
∂n= ∂ω
∂n= 0, (III.5.13)
where n is the normal to the boundary.
(h) The deforming motion of solid boundaries in glottal domain Ωg was set accordingto the area of the glottal constriction Ag (for definition see Figure II.3.4c in sec-tion II.3.2.2) as measured in the clinical preliminary study (section II.3.1). Thechosen kinematics are the ones registered during the typical quiet breathing cycle ofsubject S1 (see Figure III.5.4a). Two different cases were simulated for comparison:
• Case 1 considers a steady glottal geometry with a glottal area Ag(t) = 90.2 mm2
(see Figure III.5.4a). This value corresponds to the initial inspiration value atQ = 0 L/min obtained during typical quiet breathing cycle of subject S1 frompreliminary in vivo study: Ag(t=0) = 90.2 mm2 (section II.3.1.1). Note that thisglottal area dimension is in agreement with the glottal aperture used by Brounset al. [2007a] in their CFD study.
III.5.3. INITIAL & BOUNDARY CONDITIONS 123
• Case 2 considers a glottal area moving in time, Ag(t). Time-variations are theones measured during typical quiet breathing cycle of subject S1, and displayedin Figure III.5.4a. The corresponding evolution of angle δ1 [] is displayed onIII.5.4b. Angle δ1 varies between 10 and 40 and was defined by resolving theEquation III.5.1 for given values Ag(t).The resulting geometry of the glottal model in case 2 can be compared with reallaryngoscopic images acquired for female subject S1 in Figure III.5.5. This figureshows two shot-instants chosen during one typical breathing cycle of subject S1,as displayed on the airflow rate signal Q: the first one corresponds to peak inspi-ration (Figure III.5.5a), and the second one to peak expiration (Figure III.5.5b).The movement in the glottal plane Ωg was assured by rotation of the rigidwalls around the points A and B in Figure III.5.2. The movement of eachnode in glottal plane was accomplished every time-step by UDF loaded andcompiled within the ANSYS Fluent solver. The UDF was based on the DE-FINE_GRID_MOTION macro and the movement was determined solving across-multiplication. Resulting mesh at peak inspiration and peak expiration isshown at Figure III.5.6.
(i) Volumes Ω2 and Ω3, attached to the glottal plane, were updated every time-stepapplying the smoothing and remeshing function of the ANSYS Fluent solver, if theskewness or size of the mesh elements exceeds specified values. This ensured adequatemesh quality over the entire calculation. The quality of the mesh over the wholebreathing cycle is reported later for final model of upper airways.
Discrete phase boundary condition
(j) The wall boundary conditions for the discrete phase are set: “escape” at the inlet Ωiand outlet Ωo faces, and UDF for trapped particles at all the other faces (see item(l)). This ensures that a particle passing the outlet boundary Ωo during inspiration orpassing the inlet boundary Ωi during expiration (leaving the computational domain)is lost for further calculation and a particle touching all the other walls is post-processed according to conditions set in the UDF (see (l)).
(k) A monodisperse aerosol was injected from inlet area Ωi into the model during theinspiration phase (between t = 0 and t = 1.5 s). The particles were composedof liquid water with density 998.2 kg/m3 and had a spherical shape with diameterDp = 5.7 µm. Those values correspond to large particles utilized in in vivo study ofConway et al. [2012] (note that the diameter was evaluated as the volume mediandiameter). The particle’s injection speed and direction were chosen identical to theinlet airflow velocity (up = u). Thus, the Stokes number Stk (Equation I.1.13) variedbetween 0 and 0.45. The particles were injected from the center of each mesh elementat the inlet face. So, the number of particles injected at one instant corresponds tothe number of cells in the inlet surface. The time step is equal to the time step ofthe calculation, i.e., 2.5× 10⁻³s. This results to face-uniformly injected particles inaccordance with linear function (see linear injection curve at Figure III.5.13).

124CHAPTER III.5. PRELIMINARY CFD MODELS WITH MOBILE GLOTTIS AND
UNSTEADY BREATHING CONDITIONS
In the present case, the density of the particle is much larger than the density ofthe gas ρp >> ρg. So, the only non-negligible force on the particle is the drag forceFD [Crowe et al., 2011]. Thus, the equation of motion for a single particle (seeEquation I.1.2 in section I.1.3.1.d) is used for the present simulation in the formwithout the second term on the right side. For the final simulation with realisticupper airways model, the importance of Brownian diffusion will be discussed (seesection III.6.2.2).
(l) The discrete phase boundary condition for particles touching the wall (walls of Ω1, Ω2,Ωg, Ω3, and Ω4 domains) was programmed using an UDF with DEFINE_DPM_BCmacro. The UDF removes such a particle from the computational domain and savesinformation about its position and velocity.

III.5.3. INITIAL & BOUNDARY CONDITIONS 125
0 0.5 1 1.5 2 2.5 3−40
−30
−20
−10
0
10
20
30
40
Q[L/min]
t [s]
0 0.5 1 1.5 2 2.5 30
20
40
60
80
100
120
140
160
Ag[m
m2]
0 0.5 1 1.5 2 2.5 30
20
40
60
80
100
120
140
160Q(t)Ag = const.
Ag(t)
(a) Evolution of airflow rate Q and glottal area Ag in function of the time t.Flow rate Q is mean of 54 quiet breathing cycles and positive axis
corresponds to inspiration, negative to expiration. Area Ag(t) correspondsto a typical quiet breathing cycle and area Ag = const. corresponds to the
initial value Ag(t = 0) = 90.2 mm2.
(b) Evolution of angle δ1 [] derived from glottal area Ag.
Figure III.5.4: Reference data for the unsteady boundary conditions measured on femalesubject S1 in preliminary in vivo study (see section II.3.1.1).
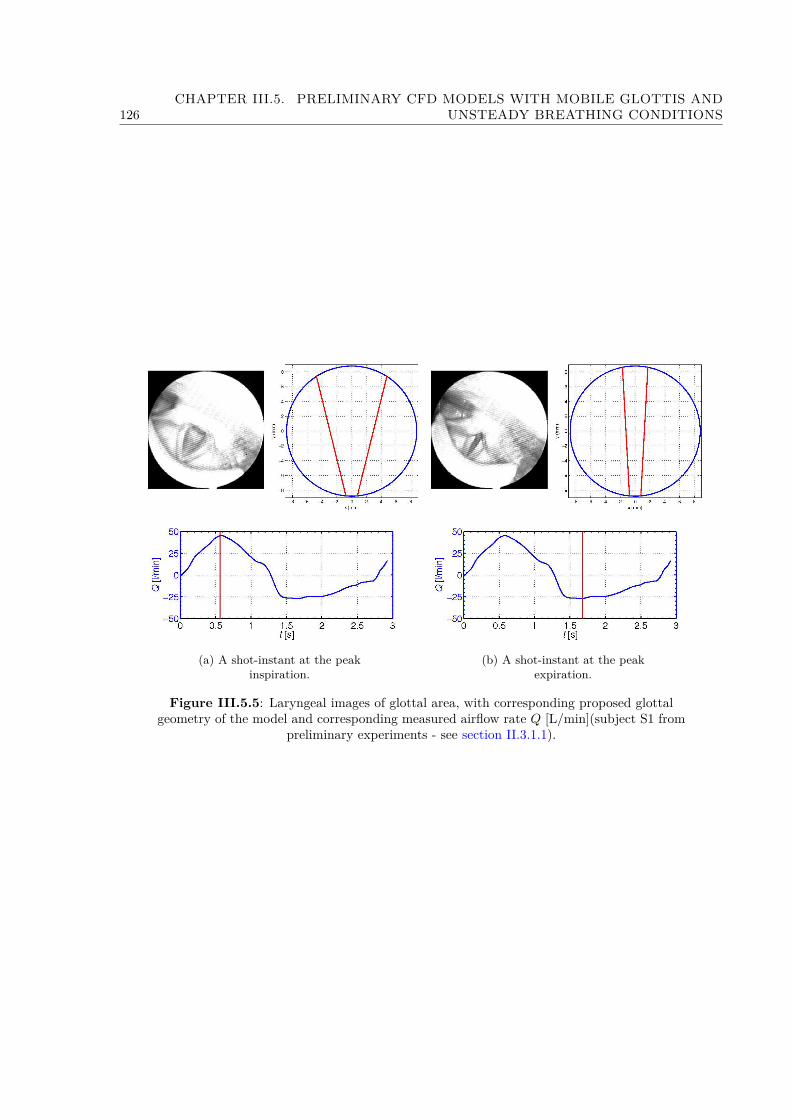
126CHAPTER III.5. PRELIMINARY CFD MODELS WITH MOBILE GLOTTIS AND
UNSTEADY BREATHING CONDITIONS
(a) A shot-instant at the peakinspiration.
(b) A shot-instant at the peakexpiration.
Figure III.5.5: Laryngeal images of glottal area, with corresponding proposed glottalgeometry of the model and corresponding measured airflow rate Q [L/min](subject S1 from
preliminary experiments - see section II.3.1.1).
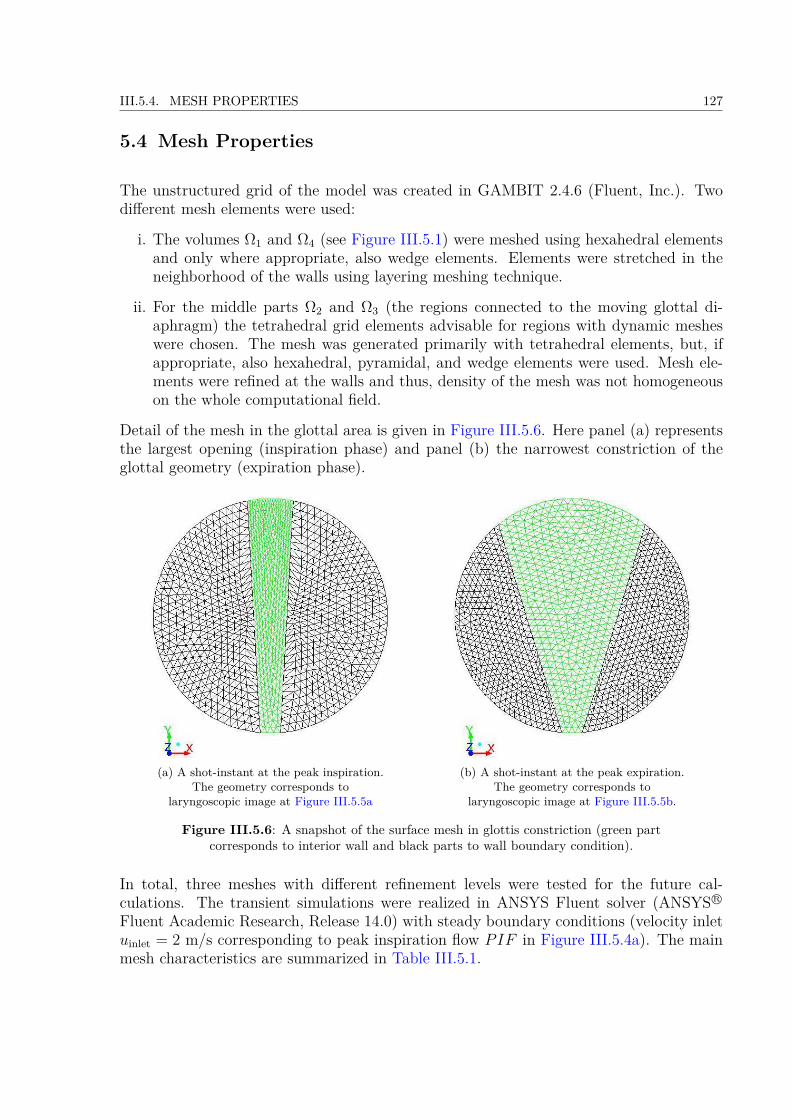
III.5.4. MESH PROPERTIES 127
5.4 Mesh Properties
The unstructured grid of the model was created in GAMBIT 2.4.6 (Fluent, Inc.). Twodifferent mesh elements were used:
i. The volumes Ω1 and Ω4 (see Figure III.5.1) were meshed using hexahedral elementsand only where appropriate, also wedge elements. Elements were stretched in theneighborhood of the walls using layering meshing technique.
ii. For the middle parts Ω2 and Ω3 (the regions connected to the moving glottal di-aphragm) the tetrahedral grid elements advisable for regions with dynamic mesheswere chosen. The mesh was generated primarily with tetrahedral elements, but, ifappropriate, also hexahedral, pyramidal, and wedge elements were used. Mesh ele-ments were refined at the walls and thus, density of the mesh was not homogeneouson the whole computational field.
Detail of the mesh in the glottal area is given in Figure III.5.6. Here panel (a) representsthe largest opening (inspiration phase) and panel (b) the narrowest constriction of theglottal geometry (expiration phase).
(a) A shot-instant at the peak inspiration.The geometry corresponds to
laryngoscopic image at Figure III.5.5a
(b) A shot-instant at the peak expiration.The geometry corresponds to
laryngoscopic image at Figure III.5.5b.
Figure III.5.6: A snapshot of the surface mesh in glottis constriction (green partcorresponds to interior wall and black parts to wall boundary condition).
In total, three meshes with different refinement levels were tested for the future cal-culations. The transient simulations were realized in ANSYS Fluent solver (ANSYS R©
Fluent Academic Research, Release 14.0) with steady boundary conditions (velocity inletuinlet = 2 m/s corresponding to peak inspiration flow PIF in Figure III.5.4a). The mainmesh characteristics are summarized in Table III.5.1.
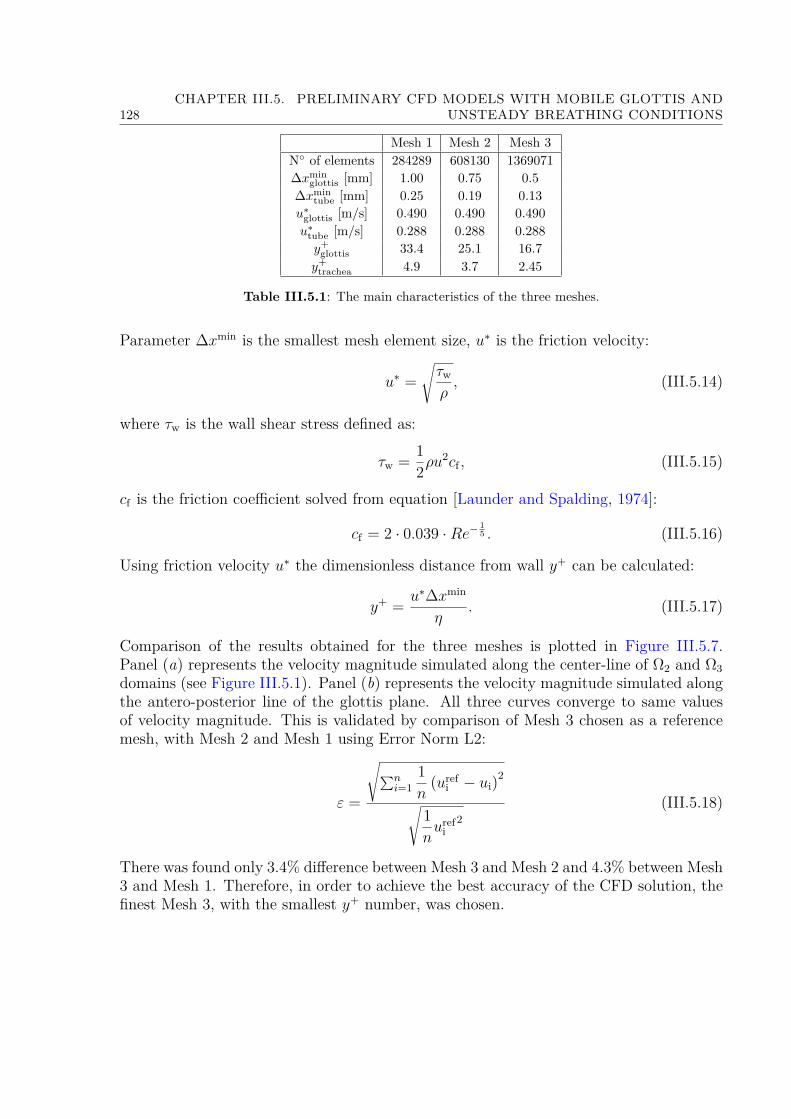
128CHAPTER III.5. PRELIMINARY CFD MODELS WITH MOBILE GLOTTIS AND
UNSTEADY BREATHING CONDITIONS
Mesh 1 Mesh 2 Mesh 3N of elements 284289 608130 1369071∆xmin
glottis [mm] 1.00 0.75 0.5∆xmin
tube [mm] 0.25 0.19 0.13u∗
glottis [m/s] 0.490 0.490 0.490u∗
tube [m/s] 0.288 0.288 0.288y+
glottis 33.4 25.1 16.7y+
trachea 4.9 3.7 2.45
Table III.5.1: The main characteristics of the three meshes.
Parameter ∆xmin is the smallest mesh element size, u∗ is the friction velocity:
u∗ =√τw
ρ, (III.5.14)
where τw is the wall shear stress defined as:
τw = 12ρu
2cf , (III.5.15)
cf is the friction coefficient solved from equation [Launder and Spalding, 1974]:
cf = 2 · 0.039 ·Re− 15 . (III.5.16)
Using friction velocity u∗ the dimensionless distance from wall y+ can be calculated:
y+ = u∗∆xmin
η. (III.5.17)
Comparison of the results obtained for the three meshes is plotted in Figure III.5.7.Panel (a) represents the velocity magnitude simulated along the center-line of Ω2 and Ω3domains (see Figure III.5.1). Panel (b) represents the velocity magnitude simulated alongthe antero-posterior line of the glottis plane. All three curves converge to same valuesof velocity magnitude. This is validated by comparison of Mesh 3 chosen as a referencemesh, with Mesh 2 and Mesh 1 using Error Norm L2:
ε =
√∑ni=1
1n
(urefi − ui)2
√1nuref
i2
(III.5.18)
There was found only 3.4% difference between Mesh 3 and Mesh 2 and 4.3% between Mesh3 and Mesh 1. Therefore, in order to achieve the best accuracy of the CFD solution, thefinest Mesh 3, with the smallest y+ number, was chosen.

III.5.5. RESULTS 129
0 0.01 0.02 0.03 0.04 0.05 0.06 0.070
0.5
1
1.5
2
2.5
3
3.5
4
4.5
5
5.5VelocityMagnitude[m
/s]
z axis [m]
mesh 1mesh 2mesh 3
(a) Velocity magnitude | u | along thecenter-line of Ω2 and Ω3 domains.
−0.01 −0.008 −0.006 −0.004 −0.002 0 0.002 0.004 0.006 0.008 0.010
0.5
1
1.5
2
2.5
3
3.5
4
VelocityMagnitude[m
/s]
y axis [m]
mesh 1mesh 2mesh 3
(b) Velocity magnitude | u | at theglottal antero-posterior line.
Figure III.5.7: Comparison of the results obtained with the three tested meshes.
5.5 Results
Simulations were performed in ANSYS Fluent solver (ANSYS R© Fluent Academic Re-search, Release 14.0) for both cases 1 and 2 presented in the previous section. First sim-ulation (case 1) was performed considering unsteady experimental flow inlet conditionstogether with glottal static wall boundaries. Second simulation (case 2) was performedusing unsteady conditions for both airflow and glottal moving walls (see section III.5.3and Figure III.5.4a). The results on the flow field are presented in the first part and onthe aerosol deposition in the second part.
5.5.1 Study of Flow in Case 1 & 2
In the following, the flow is studied in details mainly at the instant of peak inspiratoryflow PIF , where the effects should be important on the particle deposition by inertialimpaction.Figure III.5.8 shows the velocity magnitude |u| contours for peak inspiration PIF andpeak expiration PEF , respectively. The cut through the model in the plane y = 0 pointsout the laryngeal jet formed at the glottal constriction area. The flow passing the glottalconstriction is not furthermore axially symmetrical and the jet formed shifts towards thewall of the tube. The attraction of the fluid jet to the nearby wall is often referred asthe Coandă effect. It was observed in the 2D simulations (see Annex B - 2D Model)and also found in the literature (e.g., see Česenek et al. [2013]). This phenomenon isnoteworthy in particular during peak expiration flow PEF (Figure III.5.8b) for the case2 with moving glottal constriction.The maximum streamwise velocity reached by the flow during PIF is around 4.0 and
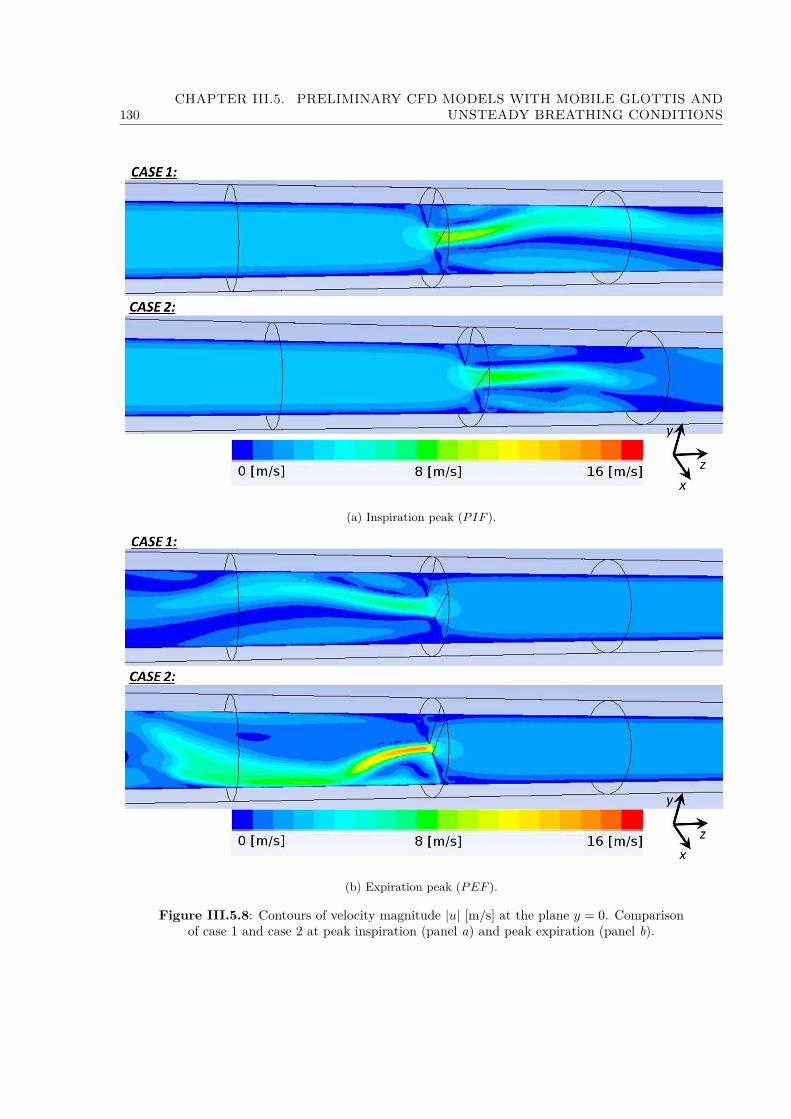
130CHAPTER III.5. PRELIMINARY CFD MODELS WITH MOBILE GLOTTIS AND
UNSTEADY BREATHING CONDITIONS
(a) Inspiration peak (PIF ).
(b) Expiration peak (PEF ).
Figure III.5.8: Contours of velocity magnitude |u| [m/s] at the plane y = 0. Comparisonof case 1 and case 2 at peak inspiration (panel a) and peak expiration (panel b).

III.5.5. RESULTS 131
3.5uinlet for case 1 and 2 respectively, that is within the range of amplitudes found alsoby Renotte et al. [2000]. During PEF the flow reaches velocity up to 3.8 and 9.3uinletfor case 1 and 2, respectively. High value for case 2 is caused by the very narrow glottisaperture measured during expiration.
Figure III.5.9a illustrates the velocity magnitude |u| contours in the plane x = 0, per-
(a) Velocity magnitude |u| [m/s].
(b) Static pressure [Pa].
Figure III.5.9: Contours of different flow dynamics parameters at the plane x = 0 andshot-instant of peak inspiration (PIF ). Comparison of case 1 and 2.
pendicular to plane displayed in Figure III.5.8. The chosen shot-instant corresponds tothe peak inspiration flow, PIF . The important feature is the shift of the jet towards theupper (posterior part in sense of glottal plane) wall of the tube, in agreement with thesimulations of the flow through glottal region performed by Gemci et al. [2000]; Renotteet al. [2000]. The static pressure contours presented on Figure III.5.9b can explain theshift of the jet towards the widest opening of the glottis. Likewise in perfect fluid, theflow is following the direction towards regions with lower pressure. In our case, in thesection before glottal plane, the flow starts to orientate towards the low pressure region,
132CHAPTER III.5. PRELIMINARY CFD MODELS WITH MOBILE GLOTTIS AND
UNSTEADY BREATHING CONDITIONS
which is found in the upper part of the glottal plane.
Further description of the laryngeal jet during PIF is given in Figure III.5.10. Thegenerated contours represent the axial velocity uz and the superposed vectors are scaledaccording to the magnitude of the secondary flow, here represented as the tangential ve-locity. The profiles presented are perpendicular to model z-axis. The first panel representsthe profile in the glottal plane z = 0. Further panels correspond to the subsequent planesin the tube. In both cases 1 and 2, at the glottal plane the flow reaches axial velocityaround 6 m/s. The vectors show that the pressure gradient force induces strong secondaryflows, forming the flow direction towards the central plane x = 0. In subsequent levels, theflow shifts towards the posterior wall and until the distance z = 1.5 dinlet the importanceof secondary vectors is noteworthy. As the high-speed flow is moving downstream theglottal plane, it is being slowed down and a backflow up to -3 m/s is generated. Renotteet al. [2000] observed similar recirculation zone downstream the glottal orifice. Finally, ata distance z = 5 dinlet the secondary flow is negligible, the laryngeal jet losses its kineticenergy, the flow stabilizes and becomes uniform. These observations are also in agreementwith results by Renotte et al. [2000]. Therefore, it may be concluded that the flow is wellpredicted by the proposed model and the selected geometrical and numerical models areadequate.
The importance of laryngeal jet and secondary flow with recirculation zones is crucial forparticle deposition efficiency. The recirculation zones are formed in the location wherethe jet impacts the walls of the tube. This can be observed on Figure III.5.8 in the planey = 0. On Figure III.5.10 is explained the velocity composition of the laryngeal jet andthe importance of tangential velocity. The secondary flow is pushing the high-speed flowtowards the anterior wall as shown on Figure III.5.9a.
Another important parameter from the physiological point of view is the transglottal pres-sure drop. Figure III.5.11 presents the results obtained along the center-line of the 3Dmodel. The figures compare the two simulation cases with/without moving boundaries,showing the importance of the mobile glottal geometry, located at z = 0 and representingthe realistic conditions. In particular, the narrow constriction during expiration demon-strates the influence of glottal variations on pressure drop dynamics (see Figure III.5.11b).Curves on III.5.11a representing the PIF are in agreement with previous other studiesconcerned with the inspiratory flow [Kleinstreuer and Zhang, 2003; Brouns et al., 2007b].The pressure drop dynamics is visualized on Figure III.5.12 for the entire cycle. Thecurves represent the total pressure drop through the model in function of the airflowrate. The order of magnitude is in accordance with the preliminary in vivo study (seeFigure II.3.2 detailed in section II.3.1.2), and confirms the significance of realistic glottalmovements for the airflow.
5.5.2 Aerosol Deposition
On Figure III.5.13 are demonstrated the particles injected into the model and their ratioof deposition on the model walls and the ratio of particles escaped by the outlet face in
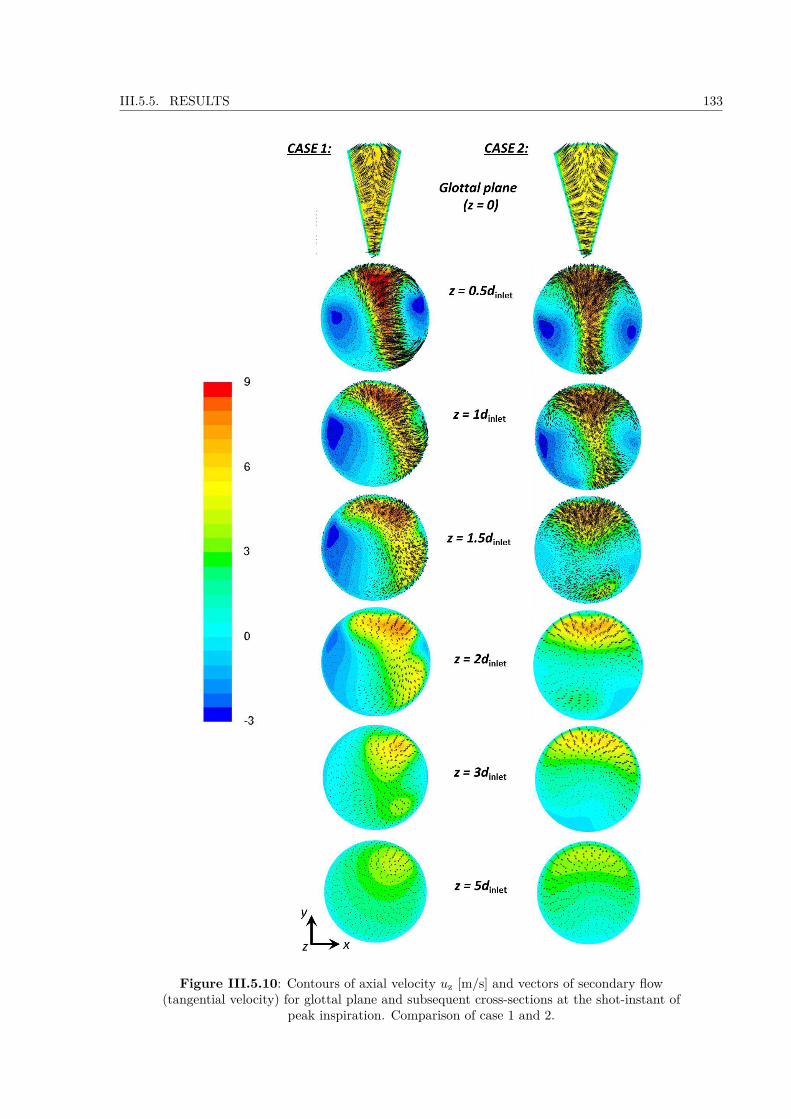
III.5.5. RESULTS 133
Figure III.5.10: Contours of axial velocity uz [m/s] and vectors of secondary flow(tangential velocity) for glottal plane and subsequent cross-sections at the shot-instant of
peak inspiration. Comparison of case 1 and 2.
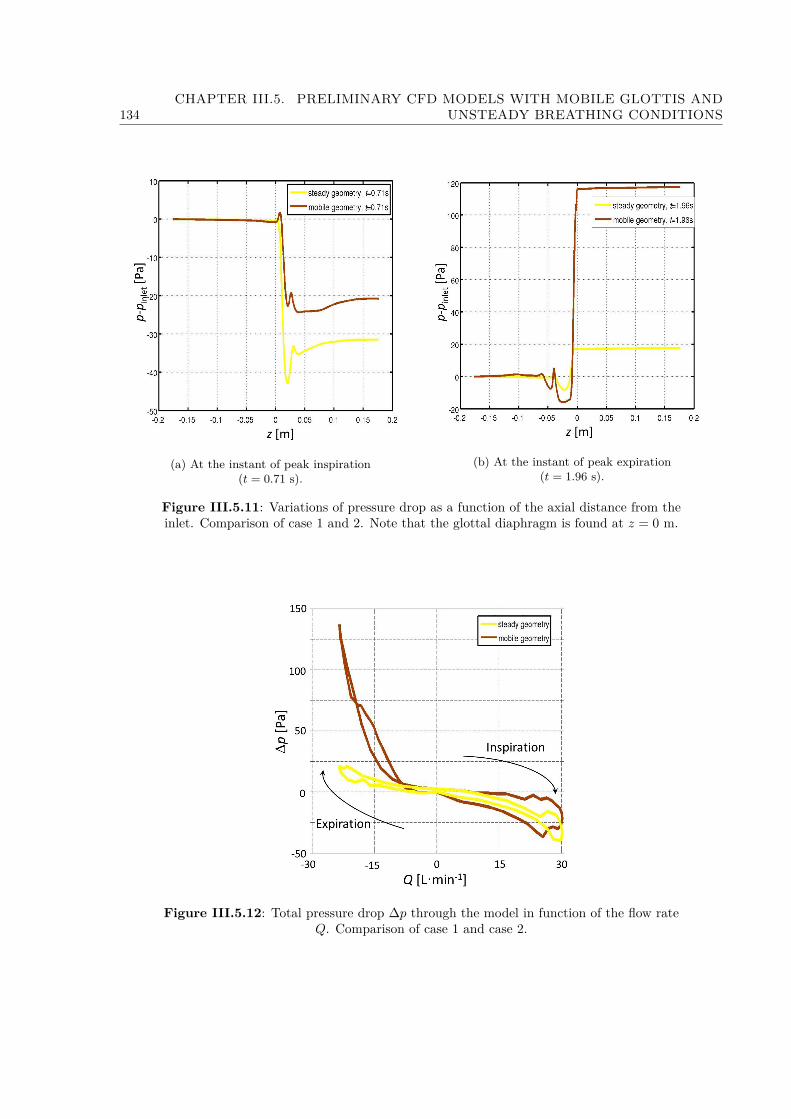
134CHAPTER III.5. PRELIMINARY CFD MODELS WITH MOBILE GLOTTIS AND
UNSTEADY BREATHING CONDITIONS
(a) At the instant of peak inspiration(t = 0.71 s).
(b) At the instant of peak expiration(t = 1.96 s).
Figure III.5.11: Variations of pressure drop as a function of the axial distance from theinlet. Comparison of case 1 and 2. Note that the glottal diaphragm is found at z = 0 m.
Figure III.5.12: Total pressure drop ∆p through the model in function of the flow rateQ. Comparison of case 1 and case 2.

III.5.5. RESULTS 135
Figure III.5.13: Ratio of particles injected, deposited and escaped from the model infunction of the time.
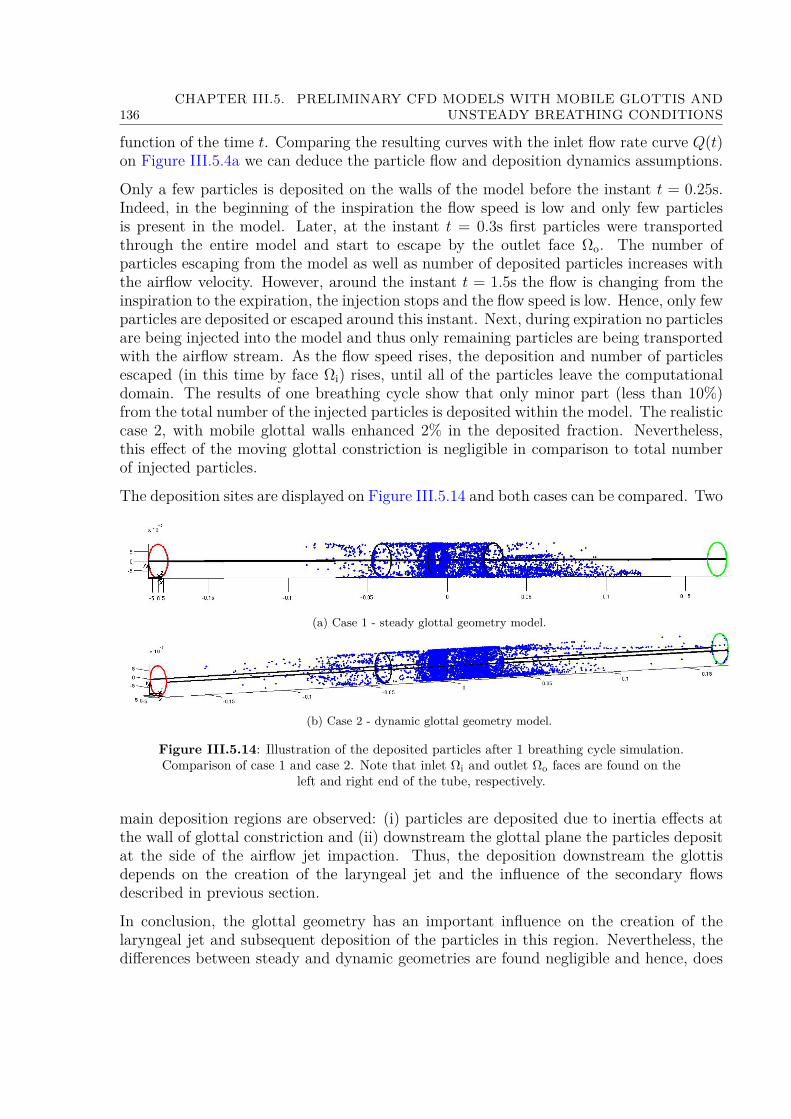
136CHAPTER III.5. PRELIMINARY CFD MODELS WITH MOBILE GLOTTIS AND
UNSTEADY BREATHING CONDITIONS
function of the time t. Comparing the resulting curves with the inlet flow rate curve Q(t)on Figure III.5.4a we can deduce the particle flow and deposition dynamics assumptions.
Only a few particles is deposited on the walls of the model before the instant t = 0.25s.Indeed, in the beginning of the inspiration the flow speed is low and only few particlesis present in the model. Later, at the instant t = 0.3s first particles were transportedthrough the entire model and start to escape by the outlet face Ωo. The number ofparticles escaping from the model as well as number of deposited particles increases withthe airflow velocity. However, around the instant t = 1.5s the flow is changing from theinspiration to the expiration, the injection stops and the flow speed is low. Hence, only fewparticles are deposited or escaped around this instant. Next, during expiration no particlesare being injected into the model and thus only remaining particles are being transportedwith the airflow stream. As the flow speed rises, the deposition and number of particlesescaped (in this time by face Ωi) rises, until all of the particles leave the computationaldomain. The results of one breathing cycle show that only minor part (less than 10%)from the total number of the injected particles is deposited within the model. The realisticcase 2, with mobile glottal walls enhanced 2% in the deposited fraction. Nevertheless,this effect of the moving glottal constriction is negligible in comparison to total numberof injected particles.
The deposition sites are displayed on Figure III.5.14 and both cases can be compared. Two
(a) Case 1 - steady glottal geometry model.
(b) Case 2 - dynamic glottal geometry model.
Figure III.5.14: Illustration of the deposited particles after 1 breathing cycle simulation.Comparison of case 1 and case 2. Note that inlet Ωi and outlet Ωo faces are found on the
left and right end of the tube, respectively.
main deposition regions are observed: (i) particles are deposited due to inertia effects atthe wall of glottal constriction and (ii) downstream the glottal plane the particles depositat the side of the airflow jet impaction. Thus, the deposition downstream the glottisdepends on the creation of the laryngeal jet and the influence of the secondary flowsdescribed in previous section.
In conclusion, the glottal geometry has an important influence on the creation of thelaryngeal jet and subsequent deposition of the particles in this region. Nevertheless, thedifferences between steady and dynamic geometries are found negligible and hence, does

III.5.5. RESULTS 137
not play a significant role on overall deposition in the present geometry of the glottal area.

138CHAPTER III.5. PRELIMINARY CFD MODELS WITH MOBILE GLOTTIS AND
UNSTEADY BREATHING CONDITIONS

Chapter III.6
3D CFD Model of Upper Airwayswith Mobile Glottis and UnsteadyBreathing Conditions
——————–
This chapter describes the elaboration of the final 3D CFD model used in this thesis tostudy the airflow and the aerosol transport and deposition in the upper airways. Startingfrom the preliminary 3D CFD model presented in chapter III.5, the final methodology isdetailed in the next sections. The chosen idealized geometry is described in section III.6.1and the mechanical formulation in section III.6.2. Next follows section III.6.3 on theapplied boundary conditions, defined according to the clinical measurements reported inPart II. section III.6.2.2 deals with the discrete phase model, while the mesh propertiesare detailed in section III.6.4. The results obtained from the simulations are presented inthe next chapter (chapter III.7).
6.1 Geometry
6.1.1 3D upper airways idealized geometry
A volumetric male upper airways (UA) geometry was built from the processing of amedical database obtained using High Resolution Computed Tomography (HRCT) as de-scribed in Conway et al. [2012]. A typical example of the UA HRCT-scan from this studyis given in Figure III.6.1 (left panel), in median saggital view. This example correspondsto a male adult. From these scans, an average idealized model was reconstructed to berepresentative of the major geometrical characteristics of UA in a male adult, yet madeof basic shapes of adjustable parameters. Note that the specific shape and position ofthe tongue apex in the HRCT-scan (Figure III.6.1) was not reproduced in the modelgeometry. The identified main geometrical singularities are summarized in Figure III.6.1.
139
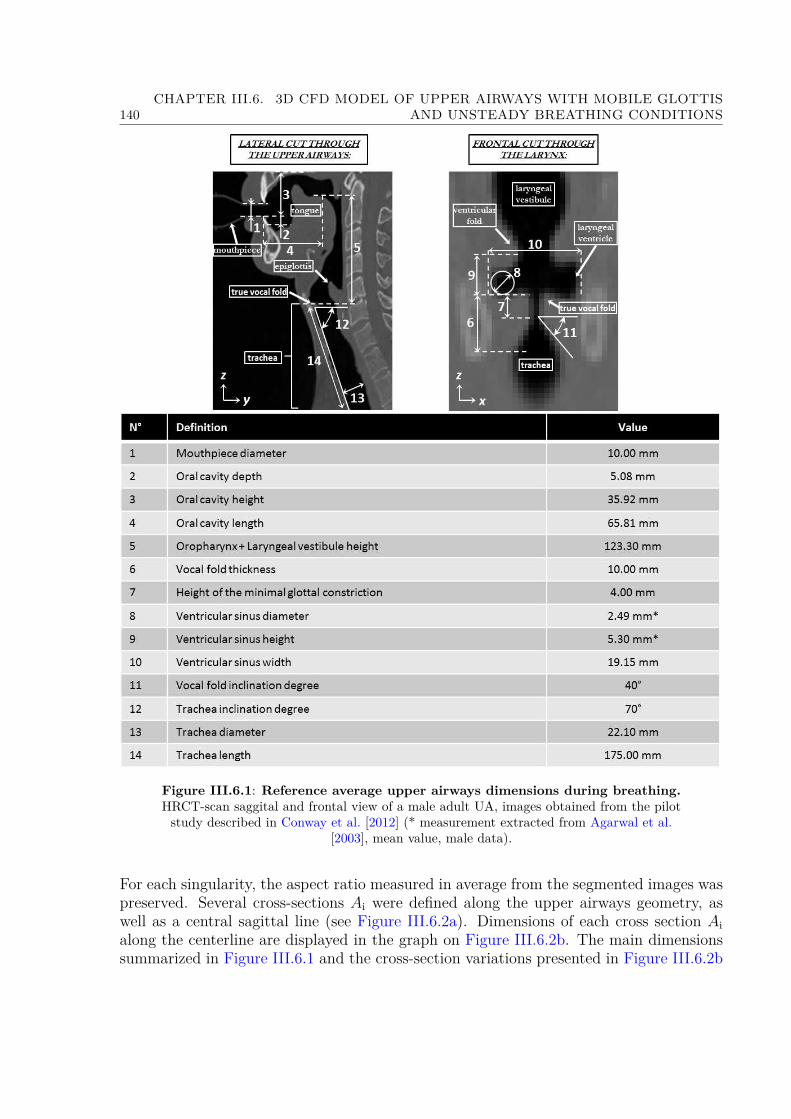
140CHAPTER III.6. 3D CFD MODEL OF UPPER AIRWAYS WITH MOBILE GLOTTIS
AND UNSTEADY BREATHING CONDITIONS
Figure III.6.1: Reference average upper airways dimensions during breathing.HRCT-scan saggital and frontal view of a male adult UA, images obtained from the pilotstudy described in Conway et al. [2012] (* measurement extracted from Agarwal et al.
[2003], mean value, male data).
For each singularity, the aspect ratio measured in average from the segmented images waspreserved. Several cross-sections Ai were defined along the upper airways geometry, aswell as a central sagittal line (see Figure III.6.2a). Dimensions of each cross section Aialong the centerline are displayed in the graph on Figure III.6.2b. The main dimensionssummarized in Figure III.6.1 and the cross-section variations presented in Figure III.6.2b
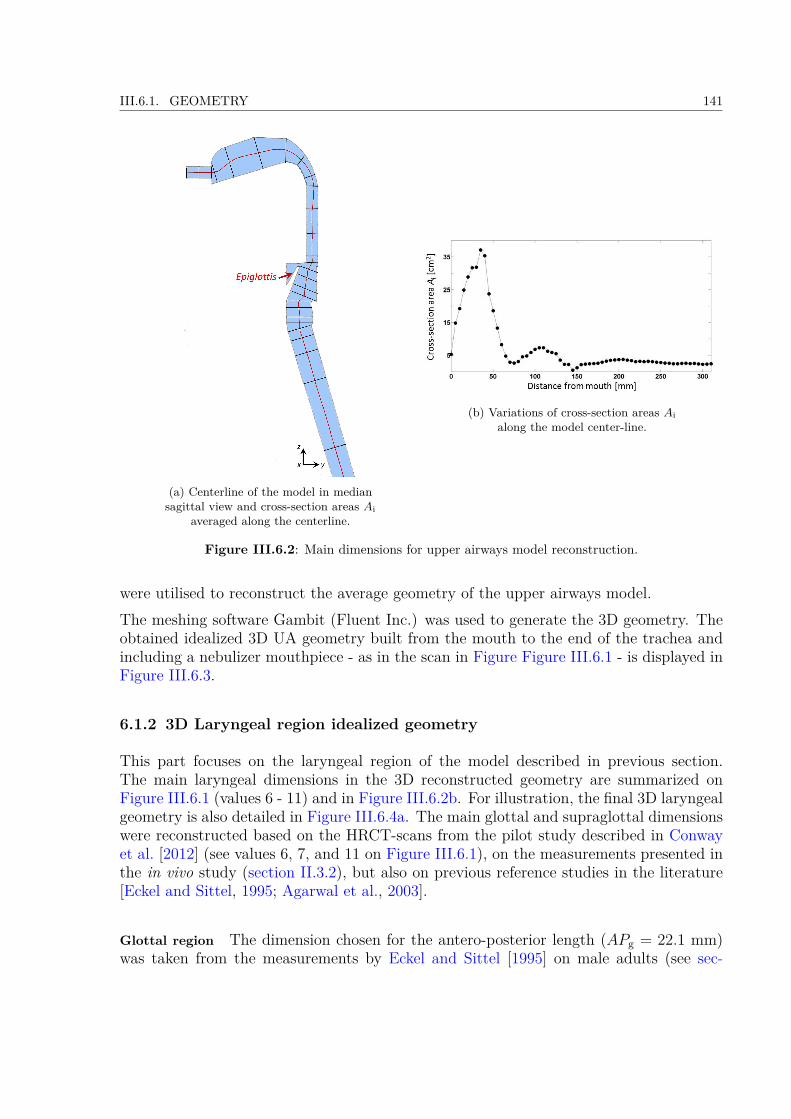
III.6.1. GEOMETRY 141
(a) Centerline of the model in mediansagittal view and cross-section areas Ai
averaged along the centerline.
(b) Variations of cross-section areas Aialong the model center-line.
Figure III.6.2: Main dimensions for upper airways model reconstruction.
were utilised to reconstruct the average geometry of the upper airways model.The meshing software Gambit (Fluent Inc.) was used to generate the 3D geometry. Theobtained idealized 3D UA geometry built from the mouth to the end of the trachea andincluding a nebulizer mouthpiece - as in the scan in Figure Figure III.6.1 - is displayed inFigure III.6.3.
6.1.2 3D Laryngeal region idealized geometry
This part focuses on the laryngeal region of the model described in previous section.The main laryngeal dimensions in the 3D reconstructed geometry are summarized onFigure III.6.1 (values 6 - 11) and in Figure III.6.2b. For illustration, the final 3D laryngealgeometry is also detailed in Figure III.6.4a. The main glottal and supraglottal dimensionswere reconstructed based on the HRCT-scans from the pilot study described in Conwayet al. [2012] (see values 6, 7, and 11 on Figure III.6.1), on the measurements presented inthe in vivo study (section II.3.2), but also on previous reference studies in the literature[Eckel and Sittel, 1995; Agarwal et al., 2003].
Glottal region The dimension chosen for the antero-posterior length (APg = 22.1 mm)was taken from the measurements by Eckel and Sittel [1995] on male adults (see sec-
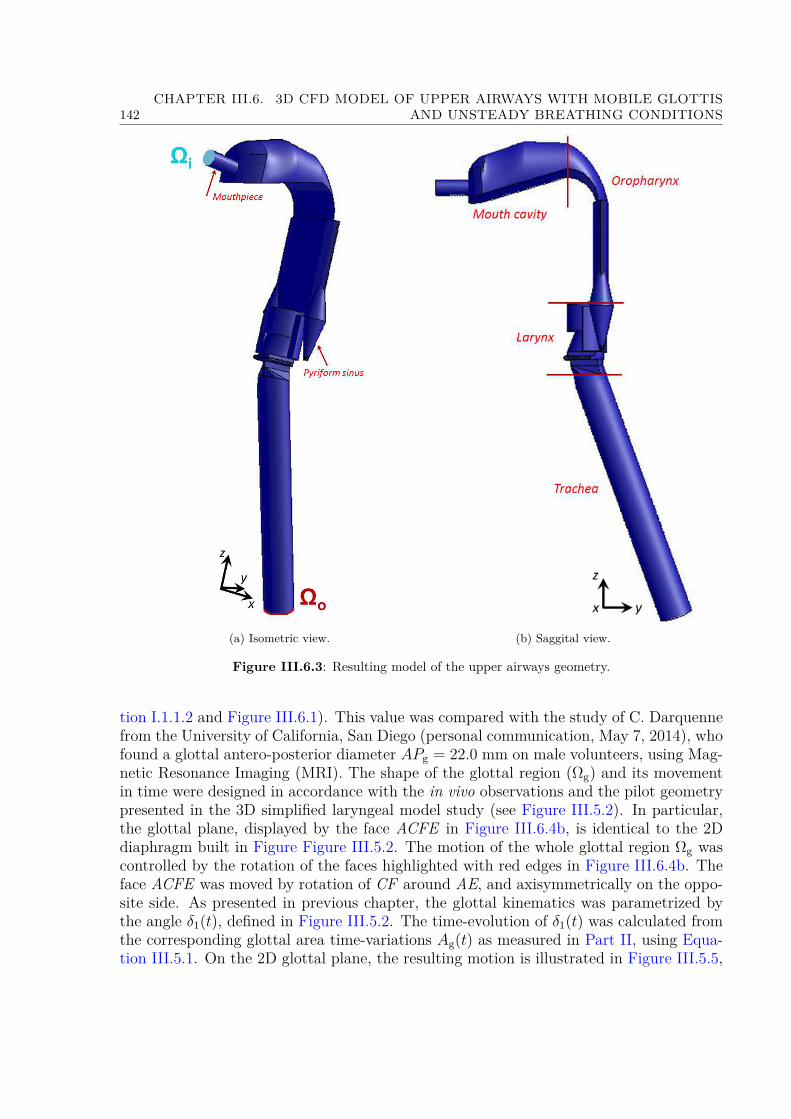
142CHAPTER III.6. 3D CFD MODEL OF UPPER AIRWAYS WITH MOBILE GLOTTIS
AND UNSTEADY BREATHING CONDITIONS
(a) Isometric view. (b) Saggital view.
Figure III.6.3: Resulting model of the upper airways geometry.
tion I.1.1.2 and Figure III.6.1). This value was compared with the study of C. Darquennefrom the University of California, San Diego (personal communication, May 7, 2014), whofound a glottal antero-posterior diameter APg = 22.0 mm on male volunteers, using Mag-netic Resonance Imaging (MRI). The shape of the glottal region (Ωg) and its movementin time were designed in accordance with the in vivo observations and the pilot geometrypresented in the 3D simplified laryngeal model study (see Figure III.5.2). In particular,the glottal plane, displayed by the face ACFE in Figure III.6.4b, is identical to the 2Ddiaphragm built in Figure Figure III.5.2. The motion of the whole glottal region Ωg wascontrolled by the rotation of the faces highlighted with red edges in Figure III.6.4b. Theface ACFE was moved by rotation of CF around AE, and axisymmetrically on the oppo-site side. As presented in previous chapter, the glottal kinematics was parametrized bythe angle δ1(t), defined in Figure III.5.2. The time-evolution of δ1(t) was calculated fromthe corresponding glottal area time-variations Ag(t) as measured in Part II, using Equa-tion III.5.1. On the 2D glottal plane, the resulting motion is illustrated in Figure III.5.5,

III.6.1. GEOMETRY 143
(a) Description of the laryngeal geometryin the 3D UA model. (b) Scheme of the glottal geometry
movement.
Figure III.6.4: Detail of the 3D laryngeal geometry.
where the cases of maximal and minimal opening can be compared with laryngoscopic im-ages of the glottal area. Below the volume Ωg, the movement of the subglottal area (Ωsub1)was controlled by the rotation of the point F around point E, point H being fixed. Thisyielded to the inclination of the HF edge in time, and the axisymmetric movement on theopposite side. At the begining of inspiration, the inclination of the HF edge correspondsto the value 9 derived from the HRCT images (see Figure III.6.1). Finally, Figure III.6.5provides a 3D illustration of the laryngeal zone as deformed at peak inspiration and peak
Figure III.6.5: Isometric view of the laryngeal region. Comparison of the mesh at PIFand PEF .
expiration during a typical breathing cycle.
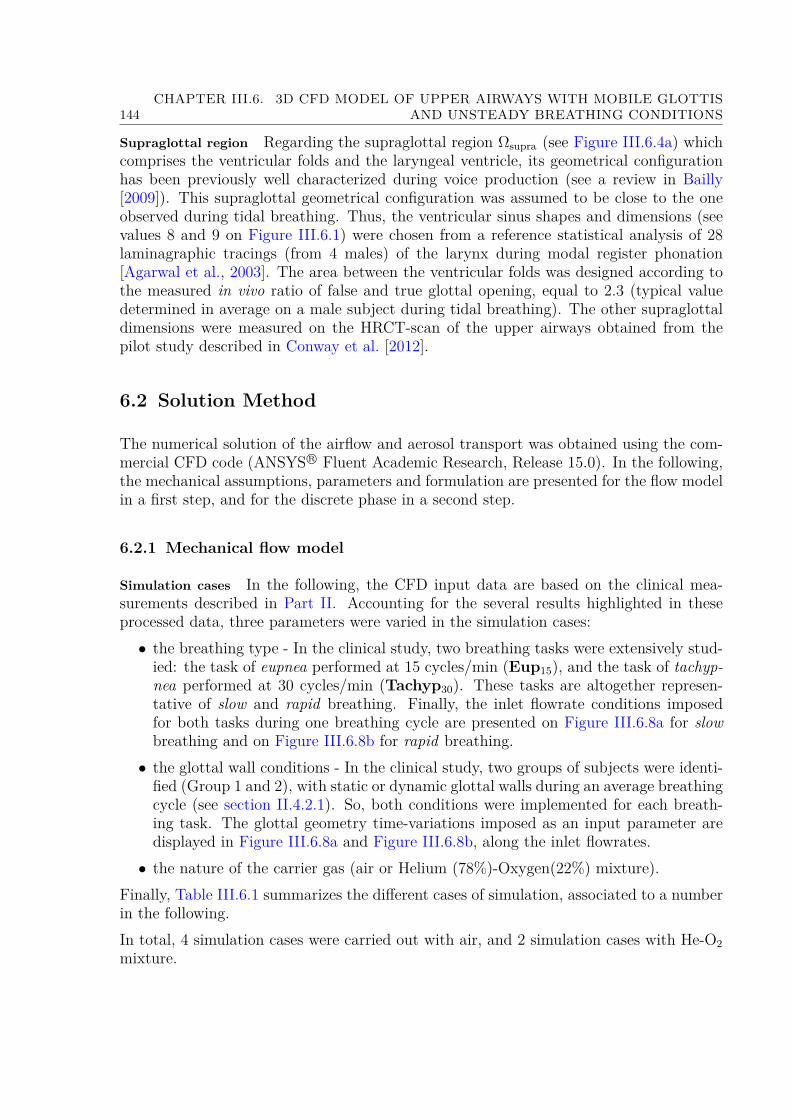
144CHAPTER III.6. 3D CFD MODEL OF UPPER AIRWAYS WITH MOBILE GLOTTIS
AND UNSTEADY BREATHING CONDITIONS
Supraglottal region Regarding the supraglottal region Ωsupra (see Figure III.6.4a) whichcomprises the ventricular folds and the laryngeal ventricle, its geometrical configurationhas been previously well characterized during voice production (see a review in Bailly[2009]). This supraglottal geometrical configuration was assumed to be close to the oneobserved during tidal breathing. Thus, the ventricular sinus shapes and dimensions (seevalues 8 and 9 on Figure III.6.1) were chosen from a reference statistical analysis of 28laminagraphic tracings (from 4 males) of the larynx during modal register phonation[Agarwal et al., 2003]. The area between the ventricular folds was designed according tothe measured in vivo ratio of false and true glottal opening, equal to 2.3 (typical valuedetermined in average on a male subject during tidal breathing). The other supraglottaldimensions were measured on the HRCT-scan of the upper airways obtained from thepilot study described in Conway et al. [2012].
6.2 Solution Method
The numerical solution of the airflow and aerosol transport was obtained using the com-mercial CFD code (ANSYS R© Fluent Academic Research, Release 15.0). In the following,the mechanical assumptions, parameters and formulation are presented for the flow modelin a first step, and for the discrete phase in a second step.
6.2.1 Mechanical flow model
Simulation cases In the following, the CFD input data are based on the clinical mea-surements described in Part II. Accounting for the several results highlighted in theseprocessed data, three parameters were varied in the simulation cases:• the breathing type - In the clinical study, two breathing tasks were extensively stud-ied: the task of eupnea performed at 15 cycles/min (Eup15), and the task of tachyp-nea performed at 30 cycles/min (Tachyp30). These tasks are altogether represen-tative of slow and rapid breathing. Finally, the inlet flowrate conditions imposedfor both tasks during one breathing cycle are presented on Figure III.6.8a for slowbreathing and on Figure III.6.8b for rapid breathing.• the glottal wall conditions - In the clinical study, two groups of subjects were identi-fied (Group 1 and 2), with static or dynamic glottal walls during an average breathingcycle (see section II.4.2.1). So, both conditions were implemented for each breath-ing task. The glottal geometry time-variations imposed as an input parameter aredisplayed in Figure III.6.8a and Figure III.6.8b, along the inlet flowrates.• the nature of the carrier gas (air or Helium (78%)-Oxygen(22%) mixture).
Finally, Table III.6.1 summarizes the different cases of simulation, associated to a numberin the following.In total, 4 simulation cases were carried out with air, and 2 simulation cases with He-O2mixture.
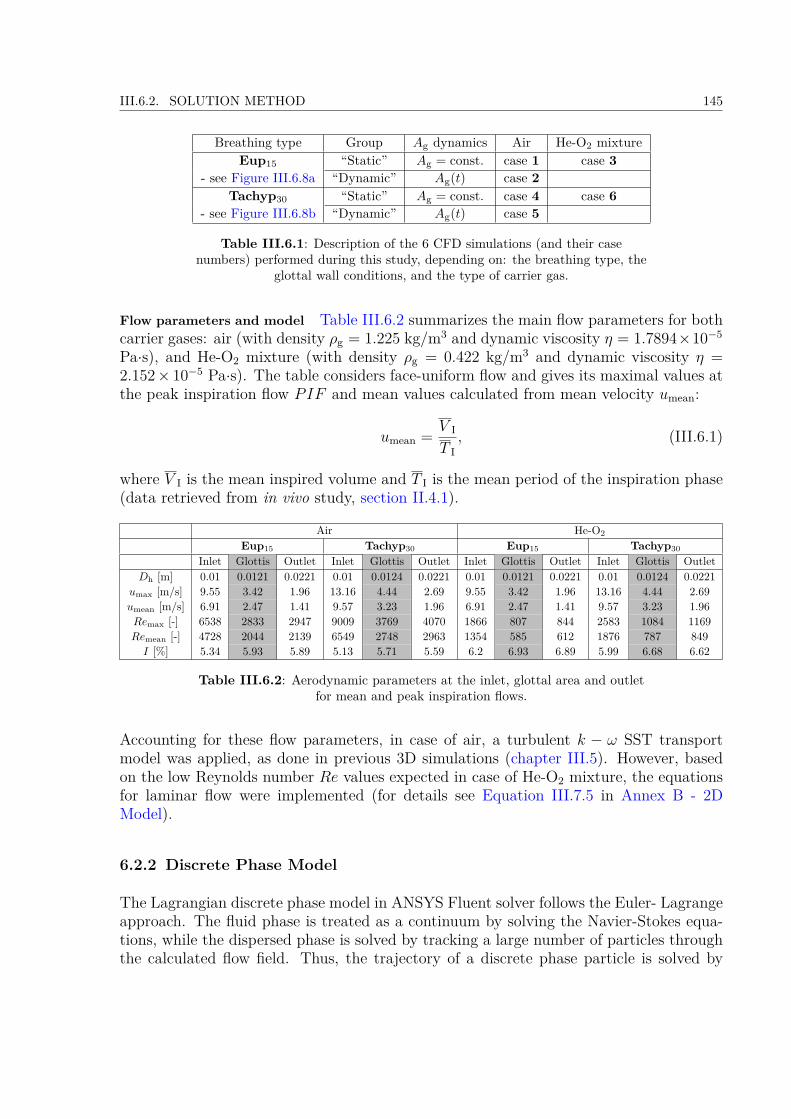
III.6.2. SOLUTION METHOD 145
Breathing type Group Ag dynamics Air He-O2 mixtureEup15 “Static” Ag = const. case 1 case 3
- see Figure III.6.8a “Dynamic” Ag(t) case 2Tachyp30 “Static” Ag = const. case 4 case 6
- see Figure III.6.8b “Dynamic” Ag(t) case 5
Table III.6.1: Description of the 6 CFD simulations (and their casenumbers) performed during this study, depending on: the breathing type, the
glottal wall conditions, and the type of carrier gas.
Flow parameters and model Table III.6.2 summarizes the main flow parameters for bothcarrier gases: air (with density ρg = 1.225 kg/m3 and dynamic viscosity η = 1.7894×10⁻⁵
Pa·s), and He-O2 mixture (with density ρg = 0.422 kg/m3 and dynamic viscosity η =2.152× 10⁻⁵ Pa·s). The table considers face-uniform flow and gives its maximal values atthe peak inspiration flow PIF and mean values calculated from mean velocity umean:
umean = V I
T I, (III.6.1)
where V I is the mean inspired volume and T I is the mean period of the inspiration phase(data retrieved from in vivo study, section II.4.1).
Air He-O2
Eup15 Tachyp30 Eup15 Tachyp30
Inlet Glottis Outlet Inlet Glottis Outlet Inlet Glottis Outlet Inlet Glottis OutletDh [m] 0.01 0.0121 0.0221 0.01 0.0124 0.0221 0.01 0.0121 0.0221 0.01 0.0124 0.0221
umax [m/s] 9.55 3.42 1.96 13.16 4.44 2.69 9.55 3.42 1.96 13.16 4.44 2.69umean [m/s] 6.91 2.47 1.41 9.57 3.23 1.96 6.91 2.47 1.41 9.57 3.23 1.96Remax [-] 6538 2833 2947 9009 3769 4070 1866 807 844 2583 1084 1169Remean [-] 4728 2044 2139 6549 2748 2963 1354 585 612 1876 787 849I [%] 5.34 5.93 5.89 5.13 5.71 5.59 6.2 6.93 6.89 5.99 6.68 6.62
Table III.6.2: Aerodynamic parameters at the inlet, glottal area and outletfor mean and peak inspiration flows.
Accounting for these flow parameters, in case of air, a turbulent k − ω SST transportmodel was applied, as done in previous 3D simulations (chapter III.5). However, basedon the low Reynolds number Re values expected in case of He-O2 mixture, the equationsfor laminar flow were implemented (for details see Equation III.7.5 in Annex B - 2DModel).
6.2.2 Discrete Phase Model
The Lagrangian discrete phase model in ANSYS Fluent solver follows the Euler- Lagrangeapproach. The fluid phase is treated as a continuum by solving the Navier-Stokes equa-tions, while the dispersed phase is solved by tracking a large number of particles throughthe calculated flow field. Thus, the trajectory of a discrete phase particle is solved by

146CHAPTER III.6. 3D CFD MODEL OF UPPER AIRWAYS WITH MOBILE GLOTTIS
AND UNSTEADY BREATHING CONDITIONS
integrating the force balance on the particle, which is written in a Lagrangian referenceframe. This force balance equates the particle inertia with the forces acting on the particle.The purpose of this section is to evaluate forces on the particle within the upper airwaysusing very simple approximations. Consequently the full equation of particle transport(Equation I.1.3 in section I.1.3.2) derived by Hinze [1975] is reduced to essentials and thesimplified form is afterwards implemented in ANSYS Fluent solver.
Evaluation of forces on the particle As presented in section I.1.3.3, the principal mecha-nisms influencing the transport of aerosols in human airways: (a) inertial impaction, (b)turbulent mixing, (c) Brownian diffusion, (d) sedimentation:
a/ Inertial impaction
The inertial impaction mechanism can be described using the dimensionless Stokes numberStk as defined in Equation I.1.13.The deposition by inertial impaction was evaluated using an approximation of the mouth-throat airway area as a circular pipe with a bend. The angle β = 90 was measured fromoro-pharynx curvature of our model. The flow parameters used were those of Eup15breathing (Male, Group 2 “dynamic”), assuming the peak flow velocity at PIF u = 5.68m/s and the hydraulic diameter of the narrowest oropharynx cross-section Dh = 9.17 mm.Pui et al. [1987] derived a relationship to calculate the penetration fraction P (the fractionof entering particles that exit the model), in a tube bend of a circular cross-section forlaminar flow (Re = 1000) as:
P =1 +
[Stk
0.171
]0.452 Stk0.171 +2.242
−2πβ
, (III.6.2)
and for turbulent flow (independently of Reynolds number) as:
P = exp [−2.823Stk β] , (III.6.3)
where β [rad] is the angle of the curve geometry.For our purpose, the penetration fraction P was calculated in the case of turbulent regimewith air (density ρg = 1.225 kg/m−3 and dynamic viscosity η = 1.7894×10⁻⁵ Pa·s) and inthe case of laminar regime with He-O2 mixture (density ρg = 0.422 kg/m−3 and dynamicviscosity η = 2.152× 10⁻⁵ Pa·s). The resulting curves on Figure III.6.6 show that, in thisconfiguration, the deposition by inertial impaction is more efficient in turbulent regimethan in laminar flow regime.In laminar flow the penetration fraction starts to decrease with the particle diameterDp > 4µm, in turbulent flow with particle diameter Dp > 1µm. In conclusion, the bendgeometry of the oro-pharynx within the upper airways causes inertial impaction to havesignificant influence on micro-particle transport and deposition.
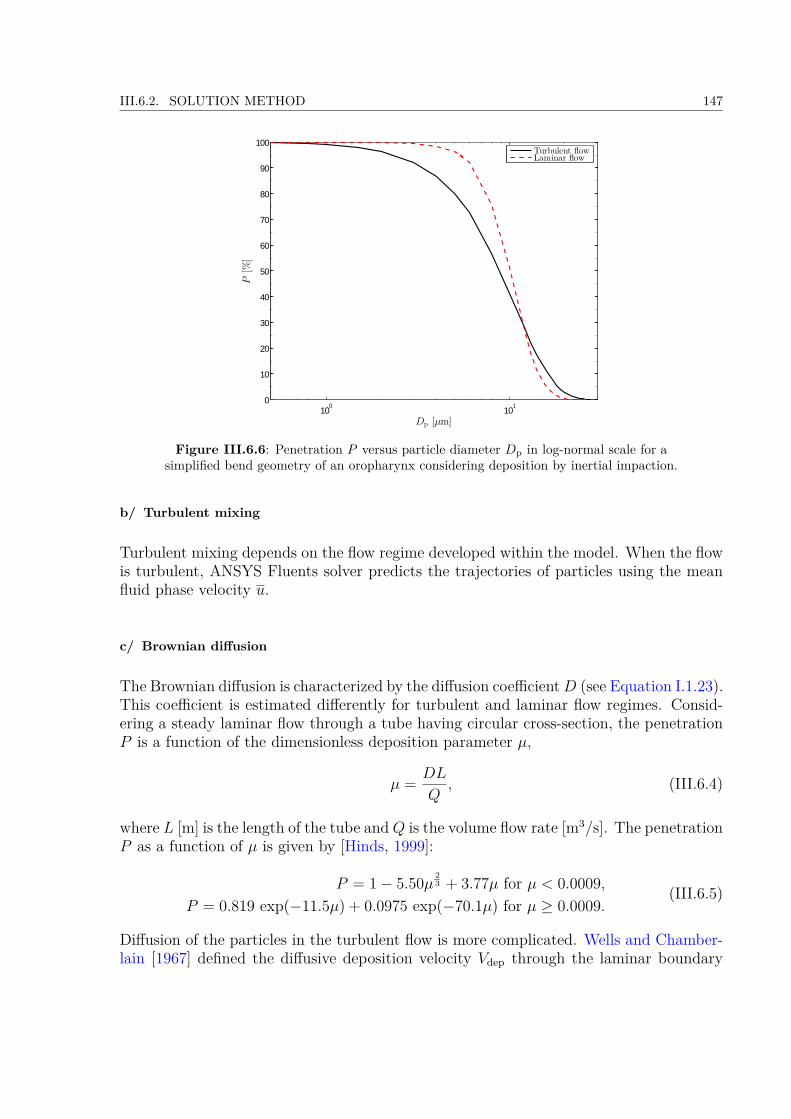
III.6.2. SOLUTION METHOD 147
100
101
0
10
20
30
40
50
60
70
80
90
100
P[%
]
Dp [µm]
Turbulent flowLaminar flow
Figure III.6.6: Penetration P versus particle diameter Dp in log-normal scale for asimplified bend geometry of an oropharynx considering deposition by inertial impaction.
b/ Turbulent mixing
Turbulent mixing depends on the flow regime developed within the model. When the flowis turbulent, ANSYS Fluents solver predicts the trajectories of particles using the meanfluid phase velocity u.
c/ Brownian diffusion
The Brownian diffusion is characterized by the diffusion coefficientD (see Equation I.1.23).This coefficient is estimated differently for turbulent and laminar flow regimes. Consid-ering a steady laminar flow through a tube having circular cross-section, the penetrationP is a function of the dimensionless deposition parameter µ,
µ = DL
Q, (III.6.4)
where L [m] is the length of the tube andQ is the volume flow rate [m3/s]. The penetrationP as a function of µ is given by [Hinds, 1999]:
P = 1− 5.50µ 23 + 3.77µ for µ < 0.0009,
P = 0.819 exp(−11.5µ) + 0.0975 exp(−70.1µ) for µ ≥ 0.0009.(III.6.5)
Diffusion of the particles in the turbulent flow is more complicated. Wells and Chamber-lain [1967] defined the diffusive deposition velocity Vdep through the laminar boundary

148CHAPTER III.6. 3D CFD MODEL OF UPPER AIRWAYS WITH MOBILE GLOTTIS
AND UNSTEADY BREATHING CONDITIONS
layer for turbulent flow:
Vdep = 0.04uRep
14
(ρgD
η
) 23
, (III.6.6)
where u is the average flow velocity in the tube and ρg the density of the gas. Using thediffusive deposition velocity Vdep can be further calculated the penetration through thetube:
P = exp(−4VdepL
Dhu
). (III.6.7)
The main parameter of the deposition by diffusion is the length L of the model. Therefore,in the case of our upper airways geometry, an approximation was made and the lengthL was evaluated as the total length of the upper airways model, L = 0.42 m. Furtherturbulent flow conditions were assumed for air (dynamic viscosity η = 1.85× 10⁻⁵ Pa·s),while laminar flow conditions were assumed for the He-O2 mixture (dynamic viscosityη = 2.152× 10⁻⁵ Pa·s). The hydraulic diameter Dh was assumed as the glottal hydraulicdiameter for the mean glottal geometry (inspiration, Male, Group 2 “dynamic”) and thepeak glottal velocity (at PIF ) of Eup15 breathing u = 5.68 m/s (inspiration, Male, Group2 “dynamic”).Results on Figure III.6.7 show that for our approximation the penetration P is higher in
10−3
10−2
10−1
100
101
0
10
20
30
40
50
60
70
80
90
100
P[%
]
Dp [µm]
Turbulent flowLaminar flow
Figure III.6.7: Penetration P versus particle diameter Dp for a circular tube of a lengthL = 0.42 m considering deposition by diffusion.
laminar flow of He-O2 mixture, because in this flow regime occurs lower diffusional depo-sition. Nevertheless, for particles greater than 0.1 µm, the Brownian diffusion mechanismis negligible in both flow regimes. Thus, since in the following simulations, particles withDp > 1µm are used, the term with Brownian force is negligible in the equation of motion(see Equation I.1.2).
III.6.2. SOLUTION METHOD 149
d/ Sedimentation
In the upper airways region, high flow rates lead to insufficient time for particle to depositby sedimentation [Cohen and Asgharian, 1990; Heyder and Svartengren, 2001]. Thus,force of gravity is not included and the gravitational acceleration in the gravity term ofEquation I.1.3 (in the fifth term on the right hand side) is set to zero.
Final Form of the Equation of Particle Motion Finally, the equation of particle motion,Equation I.1.3 in section I.1.3.2, can be expressed in the following form:
mpdup
dt = −12ρg|up − u|2
πD2p
4 CDup − u|up − u|
(III.6.8)
Hence, for the simulations within the ANSYS Fluent environment the equation of particlemotion includes only the drag force term.
6.2.3 Numerical method
The numerical method is similar to the one presented in the case of previous 3D sim-ulations (chapter III.5). Yet, in the following, some details are given on the turbulentk − ω SST transport model applied to simulate the airflow. An additional option withlow Reynolds number correction (LRN) was set to capture the airflow structures at lowReynolds numbers. This is assured by reduction of turbulent viscosity using the coefficientα?:
α? = α?0 +Ret/Rk
1 +Ret/Rk, (III.6.9)
where the turbulent Reynolds number Ret is defined as:
Ret = ρk
ηω, (III.6.10)
and constants Rk = 6, α?0 = 0.0723 [ANSYS R©, 2013b]. Thus, the formulation of eddy
viscosity (Equation III.5.4) considers the low Reynolds coefficient:
µt = ρk
ω
1max
[1α?, SF2a1ω
] . (III.6.11)
The kinetic turbulent energy k and specific dissipation rate ω were solved using Equa-tion III.5.5 and Equation III.5.6, respectively. The turbulence intensity I at the inlet andoutlet face were set according to:
I = 0.16Remax− 1
8 , (III.6.12)
and the turbulent length scale as defined in Equation III.5.11. The Reynolds number wascalculated using equation:
ReDh = ρgumaxDh
η, (III.6.13)

150CHAPTER III.6. 3D CFD MODEL OF UPPER AIRWAYS WITH MOBILE GLOTTIS
AND UNSTEADY BREATHING CONDITIONS
whereDh is the hydraulic diameter of the inlet surface, umax the maximal surface-averagedspeed of the flow derived from the inlet airflow rate Q and η the dynamic viscosity of theair.
6.2.4 Simulation setting
In low Mach numbers, in the limit of incompressible flows, the linkage between density-pressure is weak. Thus, pressure is treated as an independent variable, and the continuityequation is replaced by a pressure equation, obtained from the continuity and momentumequations. Such a solution is in ANSYS Fluent called as pressure-based (see ANSYS R©
[2013b]). The form of the Navier-Stokes equations shows linear dependence of velocityon pressure and vice-versa. Here was applied the PISO (Pressure Implicit with Splittingof Operator) algorithm (originally proposed by Issa [1986]), where the estimated velocityfield is corrected with the pressure correction field to derive a divergence-free velocityfield. The PISO was chosen because it is supposed to better resolve the simulations withmoving computational meshes [Ferziger and Peric, 2001].
To avoid start-up effects and obtain a periodic solution of the flow field, all simulationswere solved during three consecutive breathing cycles. The results of the flow field atdifferent periods are within the same range (u(x, t) = u(x, t + T)) and so 3 periods cal-culation is shown to be sufficient. The equations were solved by means of a finite vol-ume method using first-order time, spatial discretization schemes, and time step set to3.167× 10−3 s or 1.587× 10⁻³ s for Eup15 and Tachyp30, repectively. This yields to theCourant-Friedrich-Lewy (CFL) criterion defined in Equation III.5.7 about 20 and 13.5 inthe glottal region, respectively. The unsteady calculation had 1260 time steps. Iterativeconvergence was achieved when the dimensionless RMS residuals over the entire flow fieldwere inferior to 10−3.
6.3 Initial & Boundary Conditions
The boundary conditions setting are similar to the ones detailed in the previous CFDmodel (section III.5.3). However the data for the airflow inlet and the glottal kinematicswere taken from the in vivomeasurements realized on 9 male volunteers (see section II.3.2).All boundary conditions were set and the simulation was conducted for 3 consecutivebreathing cycles. The computational process of such a transient calculation is illustratedby the flow chart on Figure III.5.3 (see section III.5.3 for details).
The computational process of this transient calculation is illustrated by a flow charton the Figure III.5.3. At first, initial conditions (items ((a) and (b)) are applied andall the boundary conditions are set (items (c)) to (k)). Next, the CFD equations areprocessed until convergence is achieved and particles touching the walls of the model arepost-processed (item (l)). New time step is passed, mesh nodes in domains Ωg and Ωsub1are recalculated (item (h)) and the attached domains Ωsupra and Ωsub2 are smoothed and
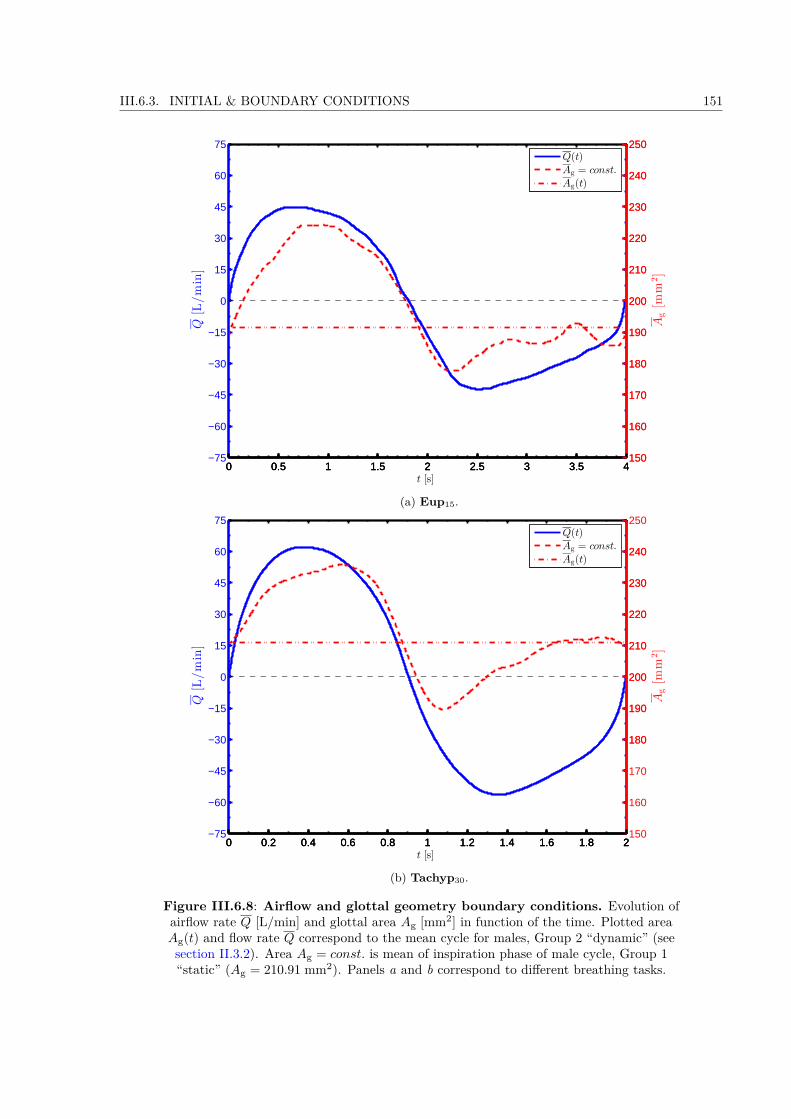
III.6.3. INITIAL & BOUNDARY CONDITIONS 151
0 0.5 1 1.5 2 2.5 3 3.5 4−75
−60
−45
−30
−15
0
15
30
45
60
75
Q[L/min]
t [s]
0 0.5 1 1.5 2 2.5 3 3.5 4150
160
170
180
190
200
210
220
230
240
250
Ag[m
m2]
0 0.5 1 1.5 2 2.5 3 3.5 4150
160
170
180
190
200
210
220
230
240
250Q(t)Ag = const.
Ag(t)
(a) Eup15.
0 0.2 0.4 0.6 0.8 1 1.2 1.4 1.6 1.8 2−75
−60
−45
−30
−15
0
15
30
45
60
75
Q[L/min]
t [s]
0 0.2 0.4 0.6 0.8 1 1.2 1.4 1.6 1.8 2150
160
170
180
190
200
210
220
230
240
250
Ag[m
m2]
0 0.2 0.4 0.6 0.8 1 1.2 1.4 1.6 1.8 2
180
190
200
210
220
230
240
Q(t)Ag = const.
Ag(t)
(b) Tachyp30.
Figure III.6.8: Airflow and glottal geometry boundary conditions. Evolution ofairflow rate Q [L/min] and glottal area Ag [mm2] in function of the time. Plotted areaAg(t) and flow rate Q correspond to the mean cycle for males, Group 2 “dynamic” (seesection II.3.2). Area Ag = const. is mean of inspiration phase of male cycle, Group 1“static” (Ag = 210.91 mm2). Panels a and b correspond to different breathing tasks.
152CHAPTER III.6. 3D CFD MODEL OF UPPER AIRWAYS WITH MOBILE GLOTTIS
AND UNSTEADY BREATHING CONDITIONS
remeshed if skewness or size of the elements exceeds preassigned limits (item (i)). Finallyvelocity inlet (item (c)) and particle injection (item (k)) are set.The unsteady boundary conditions were coded in C programming language using the UserDefined Functions (UDFs). The UDF is a function that can be dynamically loaded withinthe ANSYS Fluent solver (ANSYS R© Fluent Academic Research, Release 15.0) to enhancethe standard features of the code. All UDFs were compiled within the ANSYS Fluentsolver and executed every time step during the simulation.The conditions for different domains Ωi, Ωo (see III.6.3a) and Ωp, Ωsupra, Ωg, Ωsub1, Ωsub2,Ωt (see Figure III.6.5) were set as following:
Initial conditions
(a) Initial conditions with zero velocities u(t=0) = 0 and pressures p(t=0) = 0 were assumedat all points.
(b) At the inlet wall Ωi, the initial values for the turbulent kinetic energy k and thespecific dissipation rate ω were assigned, assuming a fully developed flow, using theempirical relation from Equation III.5.10.
Flow boundary conditions
(c) At the inlet face Ωi the inlet velocity uinlet was derived from Equation III.5.8 usingthe flow rate Q(t) and inlet area Ainlet. Variation of the flow rate Q(t) was takenfrom the results of male Group 2 “dynamic” (see section II.4.2). A mean of all quietbreathing cycles was calculated (see Figure III.5.4a) for two breathing tasks, Eup15and Tachyp30 (see Figure III.6.8). The unsteady boundary condition was coded inC programming language using an UDF with DEFINE_PROFILE macro.
(d) A pressure outlet boundary condition p(t) was set at outlet domain Ωo to 0 Pa.
Wall boundary and dynamic mesh conditions
(e) On solid walls of Ωp, and Ωt domains, a no slip shear boundary condition was applied:uwall ·n = 0, where uwall is the velocity vector of the wall motion, here equal to zeroand n is the outward normal vector.
(f) The wall boundary conditions at Ωt, Ωsupra, Ωg, Ωsub1, Ωsub2, and Ωt domains for thek − ω model equations correspond to the wall function approach for wall-functionmeshes (see Launder and Spalding [1974] for details).
(g) Wall boundary conditions for the inlet Ωi and outlet face Ωo were imposed using theEquation III.5.13.
(h) The geometry in the glottal and subglottal domain, respectively Ωg and Ωsub1 wereset according to the dimensions of the glottal constriction Ag (for definition seeFigure II.3.4c in section II.3.2.2) measured in the in vivo study (section II.4.2).
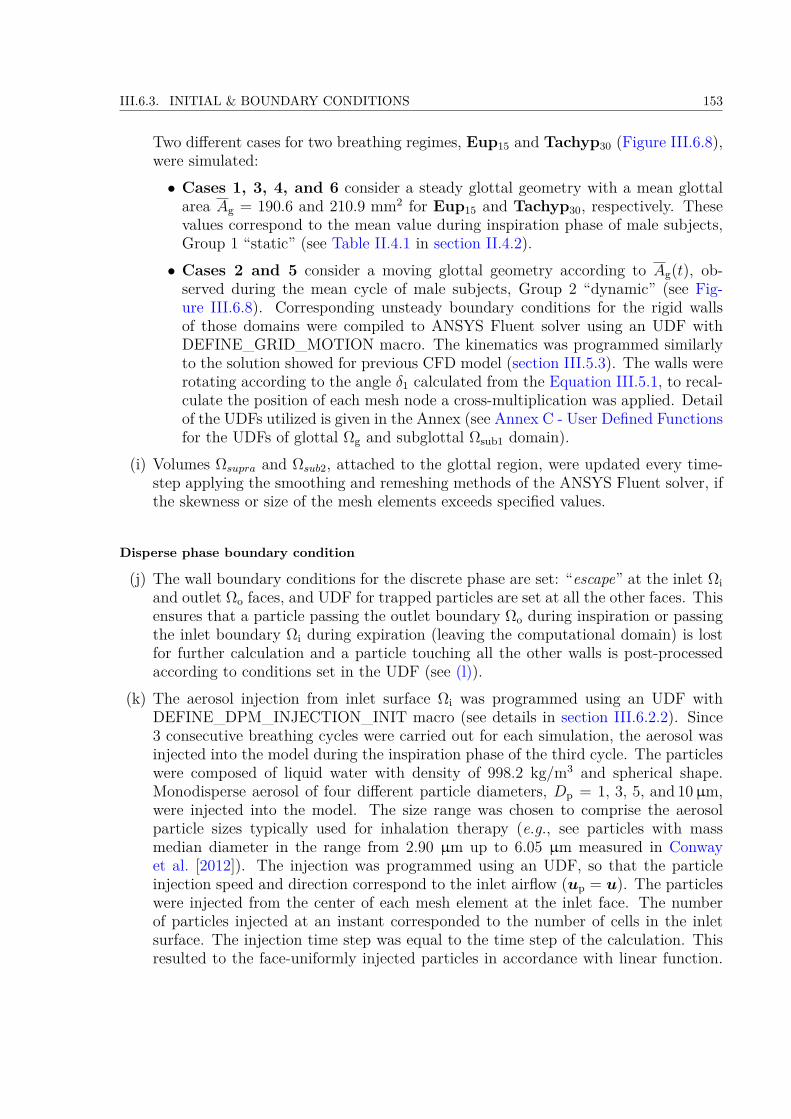
III.6.3. INITIAL & BOUNDARY CONDITIONS 153
Two different cases for two breathing regimes, Eup15 and Tachyp30 (Figure III.6.8),were simulated:• Cases 1, 3, 4, and 6 consider a steady glottal geometry with a mean glottalarea Ag = 190.6 and 210.9 mm2 for Eup15 and Tachyp30, respectively. Thesevalues correspond to the mean value during inspiration phase of male subjects,Group 1 “static” (see Table II.4.1 in section II.4.2).• Cases 2 and 5 consider a moving glottal geometry according to Ag(t), ob-served during the mean cycle of male subjects, Group 2 “dynamic” (see Fig-ure III.6.8). Corresponding unsteady boundary conditions for the rigid wallsof those domains were compiled to ANSYS Fluent solver using an UDF withDEFINE_GRID_MOTION macro. The kinematics was programmed similarlyto the solution showed for previous CFD model (section III.5.3). The walls wererotating according to the angle δ1 calculated from the Equation III.5.1, to recal-culate the position of each mesh node a cross-multiplication was applied. Detailof the UDFs utilized is given in the Annex (see Annex C - User Defined Functionsfor the UDFs of glottal Ωg and subglottal Ωsub1 domain).
(i) Volumes Ωsupra and Ωsub2, attached to the glottal region, were updated every time-step applying the smoothing and remeshing methods of the ANSYS Fluent solver, ifthe skewness or size of the mesh elements exceeds specified values.
Disperse phase boundary condition
(j) The wall boundary conditions for the discrete phase are set: “escape” at the inlet Ωiand outlet Ωo faces, and UDF for trapped particles are set at all the other faces. Thisensures that a particle passing the outlet boundary Ωo during inspiration or passingthe inlet boundary Ωi during expiration (leaving the computational domain) is lostfor further calculation and a particle touching all the other walls is post-processedaccording to conditions set in the UDF (see (l)).
(k) The aerosol injection from inlet surface Ωi was programmed using an UDF withDEFINE_DPM_INJECTION_INIT macro (see details in section III.6.2.2). Since3 consecutive breathing cycles were carried out for each simulation, the aerosol wasinjected into the model during the inspiration phase of the third cycle. The particleswere composed of liquid water with density of 998.2 kg/m3 and spherical shape.Monodisperse aerosol of four different particle diameters, Dp = 1, 3, 5, and 10µm,were injected into the model. The size range was chosen to comprise the aerosolparticle sizes typically used for inhalation therapy (e.g., see particles with massmedian diameter in the range from 2.90 µm up to 6.05 µm measured in Conwayet al. [2012]). The injection was programmed using an UDF, so that the particleinjection speed and direction correspond to the inlet airflow (up = u). The particleswere injected from the center of each mesh element at the inlet face. The numberof particles injected at an instant corresponded to the number of cells in the inletsurface. The injection time step was equal to the time step of the calculation. Thisresulted to the face-uniformly injected particles in accordance with linear function.

154CHAPTER III.6. 3D CFD MODEL OF UPPER AIRWAYS WITH MOBILE GLOTTIS
AND UNSTEADY BREATHING CONDITIONS
The particles were assumed deposited when they approached the solid wall to adistance equal to the half of their diameter.
(l) The discrete phase boundary condition for particles that touch the wall (walls ofΩt, Ωsupra, Ωg, Ωsub1, Ωsub2, and Ωt domains) was programmed using an UDF withDEFINE_DPM_BC macro. The UDF removes such a particle from the computa-tional domain and saves information about the position of injection and deposition,about the time of injection and deposition and about the particle velocity and sizecharacteristics.
6.4 Mesh Properties
The unstructured grid of the model was generated in Gambit 2.4.6 (Fluent Inc.). Findingsfrom previous preliminary simulations (chapter III.5) were applied. In correspondenceto previous 3D model, the complex geometries including dynamic meshes were meshedpreferably using tetrahedral elements.
i. The volumes from the mouthpiece up to the end of the larynx (see Figure III.6.3)were meshed with tetrahedral elements. The Tet/Hybrid element scheme with TGridoption in GAMBIT assures that mesh is generated primarily with tetrahedral ele-ments. Yet, where appropriate, also hexahedral, pyramidal, and wedge elements canbe used. Density of the mesh was not homogeneous on the whole computationalfield. At first, mesh elements were refined at the walls all over the model and second,special interest was put to glottal Ωg and subglottal Ωsub1 regions (see Figure III.6.5)including moving walls. Those were meshed with smaller mesh element size (Ta-ble III.6.3).
ii. The volume of trachea (see Figure III.6.3) was meshed using primarily hexahedralelements and where appropriate also wedge elements were utilised (Hex/Wedge mesh-ing option in GAMBIT). Elements were stretched in the neighborhood of the wallsusing layering meshing technique. Table III.6.3 summarizes the mesh element sizeused.
6.4.1 Grid dependence
The dependence of the results on the chosen computational grid was tested on 3 differ-ent meshes. Table III.6.3 summarizes the main parameters (see Equation III.5.14 andEquation III.5.17) corresponding to the meshes under test. One testing simulation foreach mesh was held with stationary boundary conditions. The calculation was solvedusing k − ω SST turbulence model. The velocity inlet was set to 7.2256 m/s (mean inletvelocity during quiet breathing Eup15, male) and the glottal geometry corresponded toarea Ag = 190.6 mm2 equal to mean glottal area during Eup15 breathing, male Group 1.Other simulation parameters were similar to those explained in next section.

III.6.4. MESH PROPERTIES 155
Mesh 1 Mesh 2 Mesh 3N of elements 464409 900180 2002748
∆xminglottis[m] 0.00075 0.00052 0.00035
∆xmintrachea[m] 0.00025 0.00025 0.00019
u∗glottis[m/s] 0.302 0.302 0.302
u∗trachea[m/s] 0.175 0.175 0.175y+
glottis 11.3 10.7 7.2y+
trachea 3.0 3.0 2.2CPU time [s] 16 800 30 900 96 720
Table III.6.3: The main characteristics of the three meshes.
Because the main purpose of this study is put on particle transport and deposition inupper airways, the deposition fraction was chosen as the most relevant parameter totest the accuracy of the meshes. Deposition fraction gives the ratio of total number ofparticles deposited in the given region to the total number of particles injected to themodel. Therefore, the quality of the meshes was assessed by comparing the resultingdeposition fractions in the mouth region for 4 different particle diameters Dp = 1, 3, 5,and 10 µm (see Figure III.6.9a). The results show that “Mesh 1” results in up to 2 times
0
5
10
15
20
25
30
35
40
45
Particles
depositionfractions[%
]
Dp = 1 µm Dp = 3 µm Dp = 5 µm Dp = 10 µm
Mesh 1Mesh 2Mesh 3
(a) Fraction of particles deposited fordifferent particle diameters Dp.
0
5
10
15
20
25
30
Particles
depositionfractions[%
]
Mesh 1 Mesh 2 Mesh 3
(b) Total fraction of particles deposited.
Figure III.6.9: Comparison of deposition fractions in the oral region for the 3 testedmeshes.
higher deposition fraction in comparison with other two meshes (in case of Dp = 1 µm).On contrary, results of “Mesh 2” and “Mesh 3” differ in total (see Figure III.6.9b) only2% from each other. “Mesh 2” does not show significant discrepancies from “Mesh 3” andyield to almost identical results. In conclusion, with respect to computational efficiency(see CPU times in Table III.6.3) and accuracy, mesh-independent results may be achievedusing “Mesh 2”. Thus all of the UA models considered in this study were meshed with
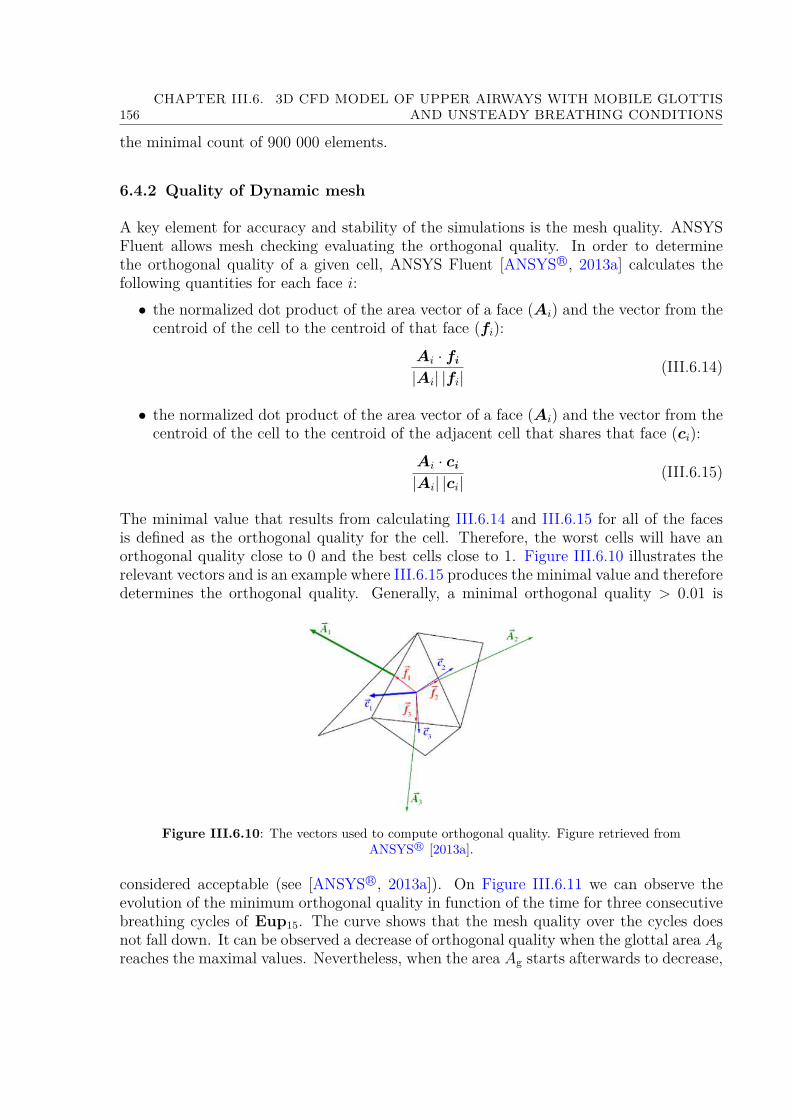
156CHAPTER III.6. 3D CFD MODEL OF UPPER AIRWAYS WITH MOBILE GLOTTIS
AND UNSTEADY BREATHING CONDITIONS
the minimal count of 900 000 elements.
6.4.2 Quality of Dynamic mesh
A key element for accuracy and stability of the simulations is the mesh quality. ANSYSFluent allows mesh checking evaluating the orthogonal quality. In order to determinethe orthogonal quality of a given cell, ANSYS Fluent [ANSYS R©, 2013a] calculates thefollowing quantities for each face i:• the normalized dot product of the area vector of a face (Ai) and the vector from thecentroid of the cell to the centroid of that face (fi):
Ai · fi
|Ai| |fi|(III.6.14)
• the normalized dot product of the area vector of a face (Ai) and the vector from thecentroid of the cell to the centroid of the adjacent cell that shares that face (ci):
Ai · ci
|Ai| |ci|(III.6.15)
The minimal value that results from calculating III.6.14 and III.6.15 for all of the facesis defined as the orthogonal quality for the cell. Therefore, the worst cells will have anorthogonal quality close to 0 and the best cells close to 1. Figure III.6.10 illustrates therelevant vectors and is an example where III.6.15 produces the minimal value and thereforedetermines the orthogonal quality. Generally, a minimal orthogonal quality > 0.01 is
Figure III.6.10: The vectors used to compute orthogonal quality. Figure retrieved fromANSYS R© [2013a].
considered acceptable (see [ANSYS R©, 2013a]). On Figure III.6.11 we can observe theevolution of the minimum orthogonal quality in function of the time for three consecutivebreathing cycles of Eup15. The curve shows that the mesh quality over the cycles doesnot fall down. It can be observed a decrease of orthogonal quality when the glottal area Agreaches the maximal values. Nevertheless, when the area Ag starts afterwards to decrease,
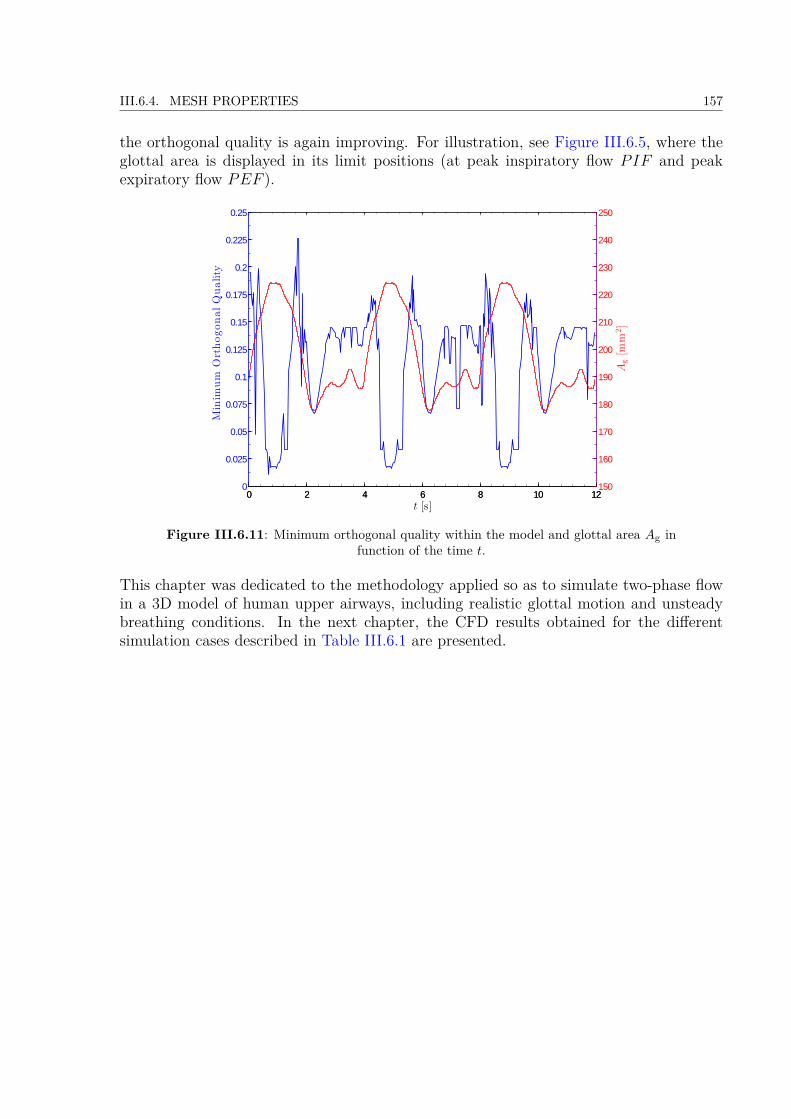
III.6.4. MESH PROPERTIES 157
the orthogonal quality is again improving. For illustration, see Figure III.6.5, where theglottal area is displayed in its limit positions (at peak inspiratory flow PIF and peakexpiratory flow PEF ).
0 2 4 6 8 10 120
0.025
0.05
0.075
0.1
0.125
0.15
0.175
0.2
0.225
0.25Minim
um
OrthogonalQuality
t [s]0 2 4 6 8 10 12
150
160
170
180
190
200
210
220
230
240
250
Ag[m
m2]
Figure III.6.11: Minimum orthogonal quality within the model and glottal area Ag infunction of the time t.
This chapter was dedicated to the methodology applied so as to simulate two-phase flowin a 3D model of human upper airways, including realistic glottal motion and unsteadybreathing conditions. In the next chapter, the CFD results obtained for the differentsimulation cases described in Table III.6.1 are presented.

158CHAPTER III.6. 3D CFD MODEL OF UPPER AIRWAYS WITH MOBILE GLOTTIS
AND UNSTEADY BREATHING CONDITIONS

Chapter III.7
CFD Results
This chapter describes the CFD results deriving from the methodology presented in pre-vious chapter III.6. 6 simulation cases detailed in Table III.6.1 are presented. In thefollowing, results are presented firstly in terms of pressure drop dynamics, thereby offeringa comparison with the in vivo data described in section II.3.1.2. Next, in section III.7.2,a detailed analysis of the airflow in the upper airways is given, comparing the 6 cases,differing from each other through the breathing type (eupnea/tachypnea), the glottal wallcondition (steady/dynamic) and the nature of the carrier gas (air or He-O2 mixture).Finally the micro-particle deposition mechanics are discussed in section III.7.3.
7.1 Pressure Drop Dynamics
Human breathing is the result of differences in pressure between the pleural cavity andthe atmosphere (see section I.1.1.1). The pressure in the respiratory system with theaxial distance from the mouth inlet, and the pressure drop increases with higher flowrates [Zhang and Kleinstreuer, 2004] or different glottal cross-section dimensions [Brounset al., 2007a]. Consequently pressure drop dynamics has effects on aerosol deposition inthe airways. Therefore, the performed simulations enable to study in details the pressuredrop in function of different breathing regimes (eupnea and tachypnea), different glottaldynamics (steady and dynamic) and different carrier gases (air and He-O2 mixture) inthe model of upper airways.
Figure III.7.1 compares the pressure drop variations for different models in function of thedistance from the mouthpiece inlet, l. Values of the pressure drops correspond to the differ-ence between the pressure at the mouthpiece inlet, pinlet, and the pressure of the followingcross-sectional areas along the center-line of the model, pi (see Figure III.6.2a). Pressureat each cross-section was calculated at the shot-instant of peak inspiration (PIF ), andspatially averaged for the cross-section areas.
The shapes of displayed curves are very similar to those reported by [Kleinstreuer andZhang, 2003; Brouns et al., 2007b] except for the oral cavity region, where in present study
159

160 CHAPTER III.7. CFD RESULTS
Figure III.7.1: Variations of cross-sectional area-averaged pressure drop in function ofthe distance from the mouthpiece inlet l. Comparison of different models at the
shot-instant of peak inspiration (PIF ).
a great pressure drop is caused by tiny mouthpiece diameter. Comparison between staticand dynamic model, corresponding to “static” and “dynamic” groups of the in vivo study,gives around 5% decrease in pressure drop for case of “dynamic” group in both eupneaand tachypnea breathing. This is caused by wider glottal opening in case of “dynamic”group during inspiration (see Figure III.6.8). Further, significant pressure drop reduce ispresent in the models with He-O2 mixture. In comparison with air, it reaches around 50%.In agreement with previous results presented by Sandeau [2010] the transairway pressureis lower with He-O2 mixture than with air. In conclusion, unsteady glottal dynamics orHe-O2 mixture as a carrier gas results in lower work of breathing.The evolution of the pressure drop in function of the flow rate variations over the wholebreathing cycle is presented in the Figure III.7.2. The 6 breathing options (see Ta-ble III.6.1) are compared using the total pressure drop through the model in function ofthe flow rate. The shape of the curves is similar to the results of preliminary transglot-tal pressure in vivo measurements (see Figure II.3.2 in section II.3.1.2). In general thepressure drop is higher during inspiration in comparison with expiration. The decrease inpressure drop in expiration is about 38% for static models with air. Similarly, in He-O2mixture the decrease of pressure drop during expiration is 24 and 34% for eupnea andtachypnea task, respectively. In case of model with dynamic glottal walls, the differencesbetween inspiration and expiration rise up to 34 and 50% for eupnea and tachypnea task,respectively.
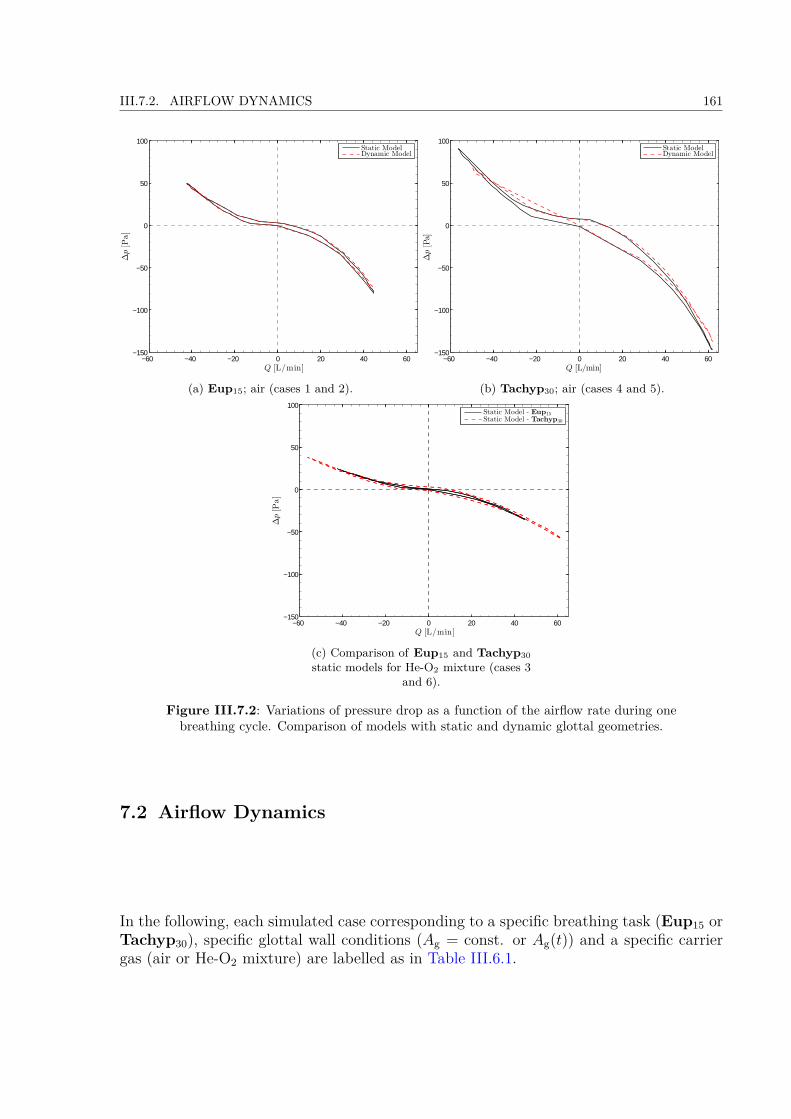
III.7.2. AIRFLOW DYNAMICS 161
−60 −40 −20 0 20 40 60−150
−100
−50
0
50
100
∆p[P
a]
Q [L/min]
Static ModelDynamic Model
(a) Eup15; air (cases 1 and 2).
−60 −40 −20 0 20 40 60−150
−100
−50
0
50
100
∆p[Pa]
Q [L/min]
Static ModelDynamic Model
(b) Tachyp30; air (cases 4 and 5).
−60 −40 −20 0 20 40 60−150
−100
−50
0
50
100
∆p[P
a]
Q [L/min]
Static Model - Eup15Static Model - Tachyp30
(c) Comparison of Eup15 and Tachyp30static models for He-O2 mixture (cases 3
and 6).
Figure III.7.2: Variations of pressure drop as a function of the airflow rate during onebreathing cycle. Comparison of models with static and dynamic glottal geometries.
7.2 Airflow Dynamics
In the following, each simulated case corresponding to a specific breathing task (Eup15 orTachyp30), specific glottal wall conditions (Ag = const. or Ag(t)) and a specific carriergas (air or He-O2 mixture) are labelled as in Table III.6.1.
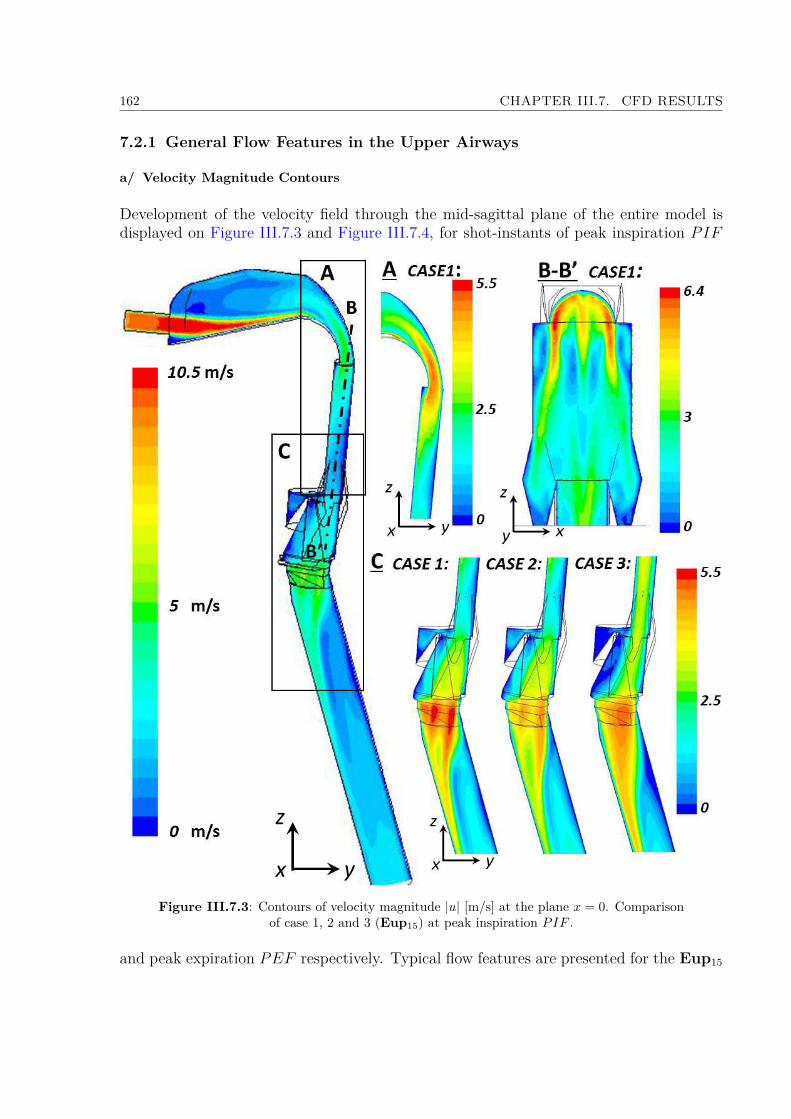
162 CHAPTER III.7. CFD RESULTS
7.2.1 General Flow Features in the Upper Airways
a/ Velocity Magnitude Contours
Development of the velocity field through the mid-sagittal plane of the entire model isdisplayed on Figure III.7.3 and Figure III.7.4, for shot-instants of peak inspiration PIF
Figure III.7.3: Contours of velocity magnitude |u| [m/s] at the plane x = 0. Comparisonof case 1, 2 and 3 (Eup15) at peak inspiration PIF .
and peak expiration PEF respectively. Typical flow features are presented for the Eup15
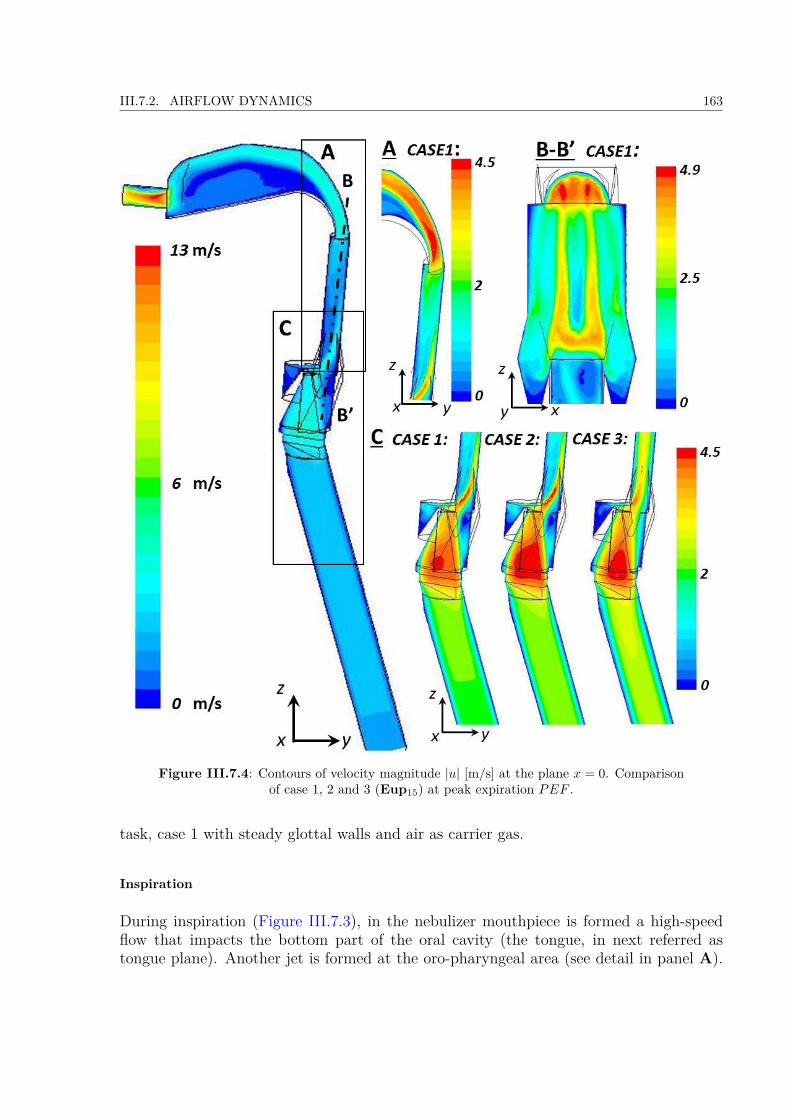
III.7.2. AIRFLOW DYNAMICS 163
Figure III.7.4: Contours of velocity magnitude |u| [m/s] at the plane x = 0. Comparisonof case 1, 2 and 3 (Eup15) at peak expiration PEF .
task, case 1 with steady glottal walls and air as carrier gas.
Inspiration
During inspiration (Figure III.7.3), in the nebulizer mouthpiece is formed a high-speedflow that impacts the bottom part of the oral cavity (the tongue, in next referred astongue plane). Another jet is formed at the oro-pharyngeal area (see detail in panel A).
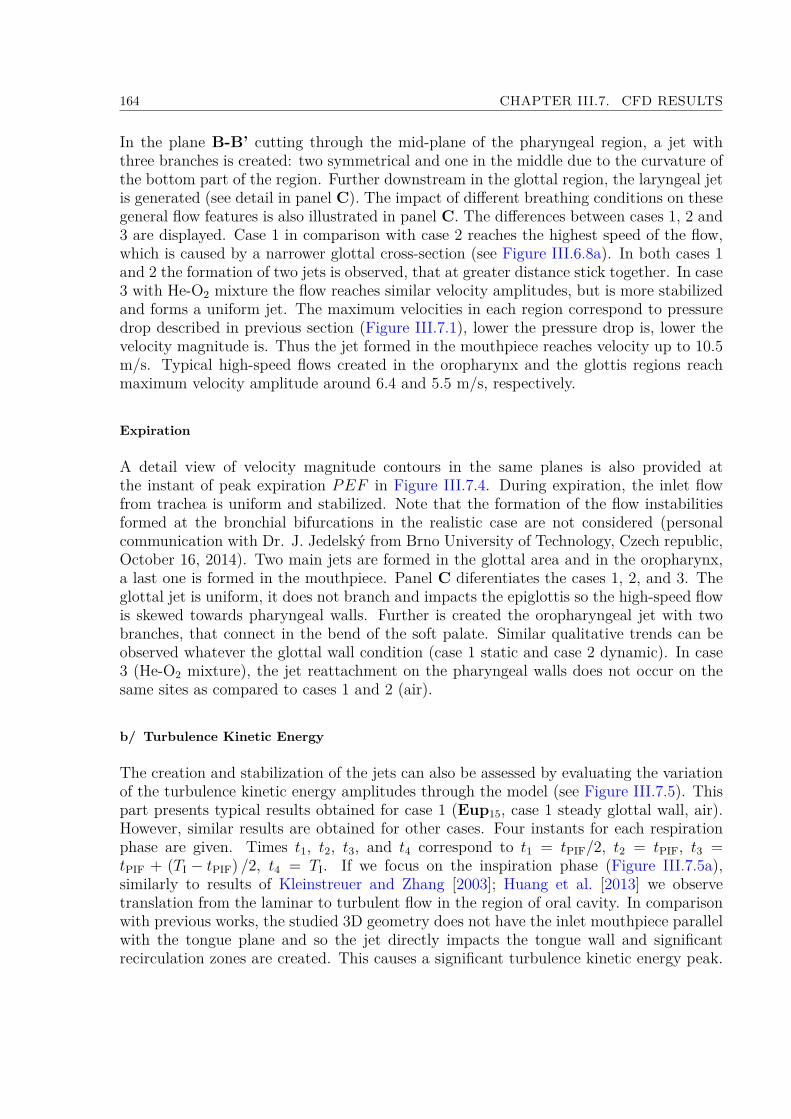
164 CHAPTER III.7. CFD RESULTS
In the plane B-B’ cutting through the mid-plane of the pharyngeal region, a jet withthree branches is created: two symmetrical and one in the middle due to the curvature ofthe bottom part of the region. Further downstream in the glottal region, the laryngeal jetis generated (see detail in panel C). The impact of different breathing conditions on thesegeneral flow features is also illustrated in panel C. The differences between cases 1, 2 and3 are displayed. Case 1 in comparison with case 2 reaches the highest speed of the flow,which is caused by a narrower glottal cross-section (see Figure III.6.8a). In both cases 1and 2 the formation of two jets is observed, that at greater distance stick together. In case3 with He-O2 mixture the flow reaches similar velocity amplitudes, but is more stabilizedand forms a uniform jet. The maximum velocities in each region correspond to pressuredrop described in previous section (Figure III.7.1), lower the pressure drop is, lower thevelocity magnitude is. Thus the jet formed in the mouthpiece reaches velocity up to 10.5m/s. Typical high-speed flows created in the oropharynx and the glottis regions reachmaximum velocity amplitude around 6.4 and 5.5 m/s, respectively.
Expiration
A detail view of velocity magnitude contours in the same planes is also provided atthe instant of peak expiration PEF in Figure III.7.4. During expiration, the inlet flowfrom trachea is uniform and stabilized. Note that the formation of the flow instabilitiesformed at the bronchial bifurcations in the realistic case are not considered (personalcommunication with Dr. J. Jedelský from Brno University of Technology, Czech republic,October 16, 2014). Two main jets are formed in the glottal area and in the oropharynx,a last one is formed in the mouthpiece. Panel C diferentiates the cases 1, 2, and 3. Theglottal jet is uniform, it does not branch and impacts the epiglottis so the high-speed flowis skewed towards pharyngeal walls. Further is created the oropharyngeal jet with twobranches, that connect in the bend of the soft palate. Similar qualitative trends can beobserved whatever the glottal wall condition (case 1 static and case 2 dynamic). In case3 (He-O2 mixture), the jet reattachment on the pharyngeal walls does not occur on thesame sites as compared to cases 1 and 2 (air).
b/ Turbulence Kinetic Energy
The creation and stabilization of the jets can also be assessed by evaluating the variationof the turbulence kinetic energy amplitudes through the model (see Figure III.7.5). Thispart presents typical results obtained for case 1 (Eup15, case 1 steady glottal wall, air).However, similar results are obtained for other cases. Four instants for each respirationphase are given. Times t1, t2, t3, and t4 correspond to t1 = tPIF/2, t2 = tPIF, t3 =tPIF + (TI − tPIF) /2, t4 = TI. If we focus on the inspiration phase (Figure III.7.5a),similarly to results of Kleinstreuer and Zhang [2003]; Huang et al. [2013] we observetranslation from the laminar to turbulent flow in the region of oral cavity. In comparisonwith previous works, the studied 3D geometry does not have the inlet mouthpiece parallelwith the tongue plane and so the jet directly impacts the tongue wall and significantrecirculation zones are created. This causes a significant turbulence kinetic energy peak.
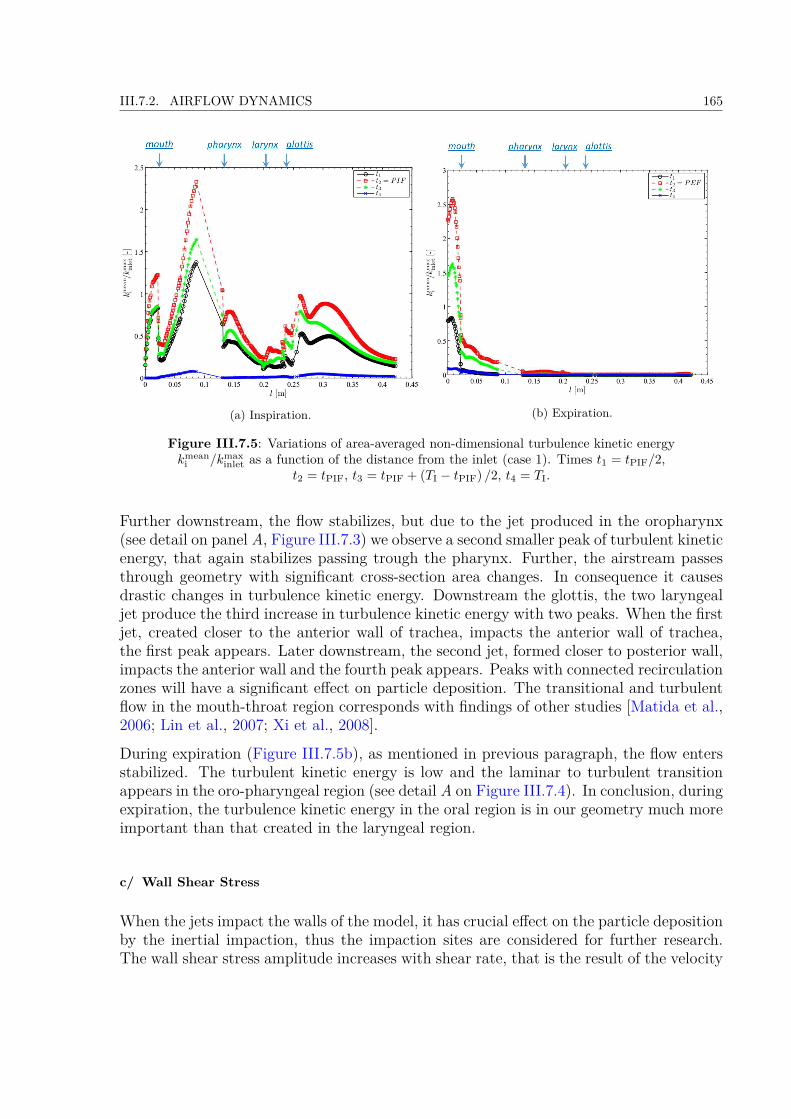
III.7.2. AIRFLOW DYNAMICS 165
(a) Inspiration. (b) Expiration.
Figure III.7.5: Variations of area-averaged non-dimensional turbulence kinetic energykmean
i /kmaxinlet as a function of the distance from the inlet (case 1). Times t1 = tPIF/2,
t2 = tPIF, t3 = tPIF + (TI − tPIF) /2, t4 = TI.
Further downstream, the flow stabilizes, but due to the jet produced in the oropharynx(see detail on panel A, Figure III.7.3) we observe a second smaller peak of turbulent kineticenergy, that again stabilizes passing trough the pharynx. Further, the airstream passesthrough geometry with significant cross-section area changes. In consequence it causesdrastic changes in turbulence kinetic energy. Downstream the glottis, the two laryngealjet produce the third increase in turbulence kinetic energy with two peaks. When the firstjet, created closer to the anterior wall of trachea, impacts the anterior wall of trachea,the first peak appears. Later downstream, the second jet, formed closer to posterior wall,impacts the anterior wall and the fourth peak appears. Peaks with connected recirculationzones will have a significant effect on particle deposition. The transitional and turbulentflow in the mouth-throat region corresponds with findings of other studies [Matida et al.,2006; Lin et al., 2007; Xi et al., 2008].
During expiration (Figure III.7.5b), as mentioned in previous paragraph, the flow entersstabilized. The turbulent kinetic energy is low and the laminar to turbulent transitionappears in the oro-pharyngeal region (see detail A on Figure III.7.4). In conclusion, duringexpiration, the turbulence kinetic energy in the oral region is in our geometry much moreimportant than that created in the laryngeal region.
c/ Wall Shear Stress
When the jets impact the walls of the model, it has crucial effect on the particle depositionby the inertial impaction, thus the impaction sites are considered for further research.The wall shear stress amplitude increases with shear rate, that is the result of the velocity

166 CHAPTER III.7. CFD RESULTS
gradient. Thus, with high velocity gradient the wall shear stress is rising and thereforeis considered to be a good representative of the jet flow impaction and recirculated flow[Nithiarasu et al., 2008]. The important places with high wall shear stress amplitudeare displayed on Figure III.7.6 for inspiration peak PIF . The highest amplitude (0.9
(a) Tongue plane. (b) Oropharyngeal area.
(c) Subglottal area (trachea).
Figure III.7.6: Comparison of wall shear stress at the walls of the model [Pa]. Specialinterest was put on the regions, where the jets are impacting the wall. Displayed results
correspond to Eup15 task at peak inspiration PIF .
Pa) of the wall shear stress is found in the tongue plane, where the site of high speedimpaction is the largest in comparison with other places of the model (Figure III.7.6a).In the zone of oropharyngeal jet occurs second site of impaction (Figure III.7.6b) and thewall shear stress rises up to 0.6 Pa. Finally, when glottal jet impacts the trachea wall(Figure III.7.6c) the wall shear stress rises up to 0.25 Pa. The glottal jet impaction onthe anterior wall of the trachea was also reported in several previous studies [Cui andGutheil, 2011; Zhang and Kleinstreuer, 2011; Elcner et al., 2013].
Case 1 with air and case 3 with He-O2 mixture are compared. Simulation with He-O2mixture results in 25% decrease of wall shear stress. Detail on impact of different glottaldynamics is given in panel (c). The sites of highest wall shear stress values are found in

III.7.2. AIRFLOW DYNAMICS 167
correlation with the most dense deposition sites. Note that in case 2, with moving glottalwalls, the wall shear stress occurs at smaller amplitudes. This is result of the laryngealjet that reaches in case 2 smaller speed (compare with panel C on Figure III.7.3.
7.2.2 Laryngeal jet under different breathing conditions
In this section the interest is put on the glottal region and cross section further down-stream. A detail view is given to observe the influence of the moving glottal geometryand different carrier gases.
Figure III.7.7 and Figure III.7.8 show the velocity magnitude contours for different sim-ulations of Eup15 and Tachyp30, respectively. Superposed vectors of secondary flowrepresent the tangential velocity. Each column represents one simulation case: case 1 onthe left with steady glottal geometry and air, case 2 with mobile glottal geometry andair, and case 3 with steady glottal geometry and He-O2 mixture, respectively.
The results of flow velocity and structure simulated during the Eup15 breathing taskare illustrated on Figure III.7.7. At the glottal inlet area (l = 238.9 mm) the velocitymagnitude reaches around 5 m/s. The secondary flow vectors direct towards the glottalcentral plane. In cases 1 and 2 a formation of two jets is observed: one faster close tothe posterior plane and one slower close to the anterior plane. In the case 3 with He-O2 mixture the flow structure is more uniform. Nevertheless, note that the airstream isinfluenced by secondary flow, that performs higher velocity towards the central plane. Atthe glottal outlet plane the form of the jet starts to be evident and the speed of the flowrises to its maximum (5.5 m/s). Further at the distance 0.5 APg, in cases 1 and 2 the highspeed flow created in the anterior region of the glottal constriction impacts the trachealwall. On contrary from the previous simulations with simple tube geometry model (seeFigure III.5.9) the laryngeal jet impacts the anterior wall of the trachea. This is a resultof inertia effect due to geometry of the laryngeal region, that directs the flow towards theanterior region (see Figure III.7.3, detail C), and is in agreement with previous studies[Jayaraju et al., 2007; Elcner et al., 2013]. This observation points out the importanceof considering the interactions between the entire upper airways geometry and glottalconfiguration. The second laryngeal jet, closer to posterior wall, is directed by secondaryflow towards the anterior wall too. In case 3, the jet looks axisymetrical, but the secondaryvectors are forcing the flow towards the anterior wall. In air cases (1 and 2) at the distanceof 2APg both jets are connected and impact the anterior wall. In case 3 the single jetin He-O2 mixture impacts the anterior wall at the same distance 2APg. Finally at thedistance of 5APg the flow starts to be stabilized and uniform.
There are not observed significant differences between the flow in cases 1 and 2. In steadycase 1 the glottal constriction is narrower and thus the flow speed is slightly higher.
In comparison with Eup15 breathing task the structure of the flow is similar in Tachyp30breathing. The flow reaches higher levels of the velocity amplitude, but the jet formationhas the same characteristics. The flow in cases 3 and 6 with He-O2 mixture in the laminarregime is more uniform, but as well is characterized by the jet shift towards the anterior

168 CHAPTER III.7. CFD RESULTS
Figure III.7.7: Contours of velocity magnitude |u| [m/s] and vectors of secondary flow(tangential velocity) for glottal plane and subsequent cross-sections at the shot-instant of
peak inspiration. Comparison of cases 1, 2, and 3 (Eup15).
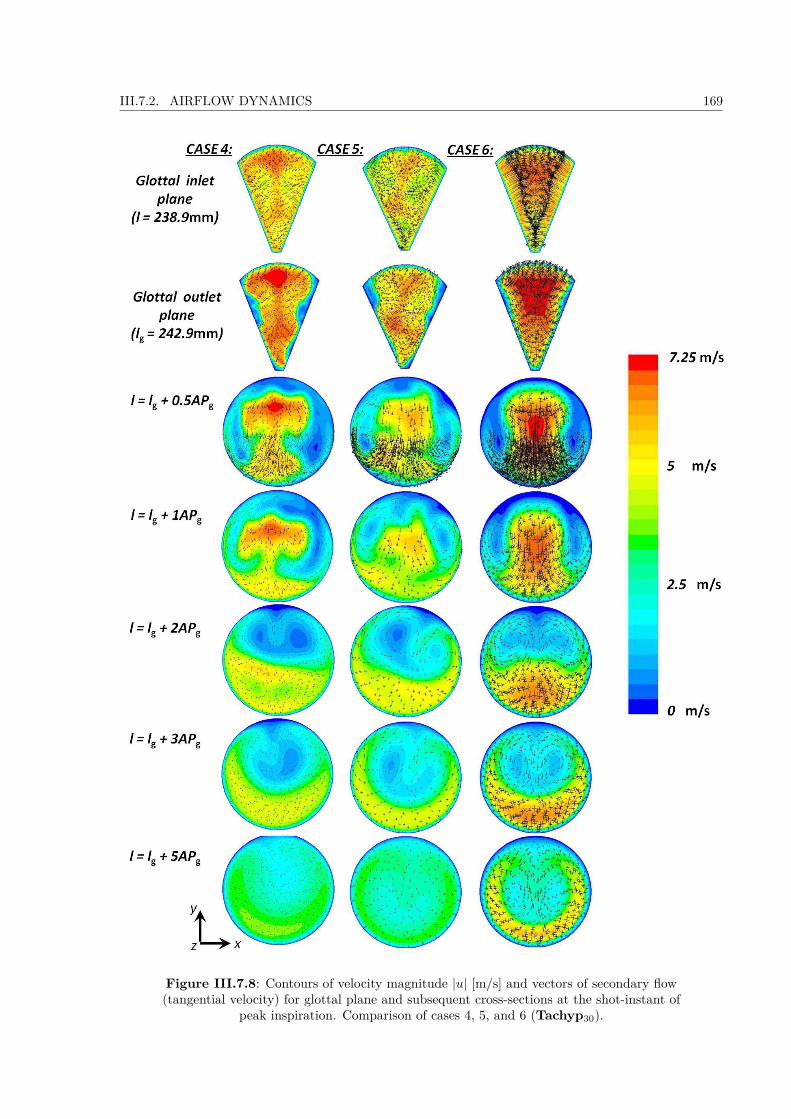
III.7.2. AIRFLOW DYNAMICS 169
Figure III.7.8: Contours of velocity magnitude |u| [m/s] and vectors of secondary flow(tangential velocity) for glottal plane and subsequent cross-sections at the shot-instant of
peak inspiration. Comparison of cases 4, 5, and 6 (Tachyp30).
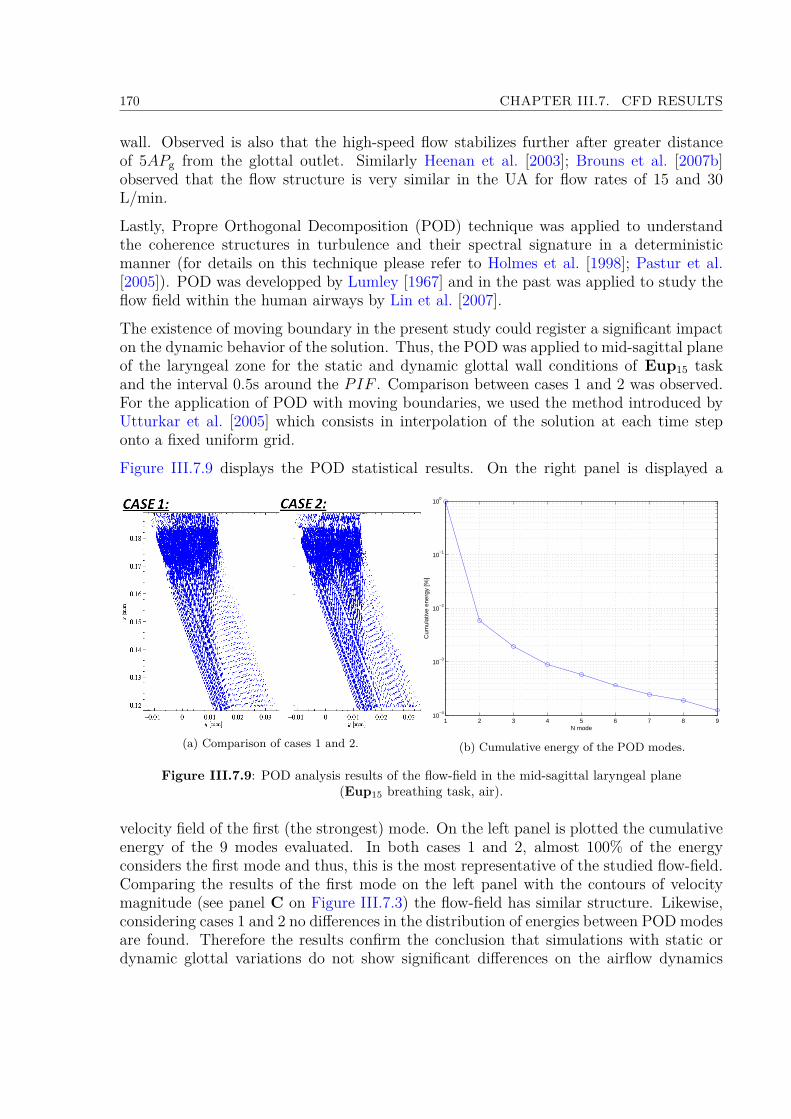
170 CHAPTER III.7. CFD RESULTS
wall. Observed is also that the high-speed flow stabilizes further after greater distanceof 5APg from the glottal outlet. Similarly Heenan et al. [2003]; Brouns et al. [2007b]observed that the flow structure is very similar in the UA for flow rates of 15 and 30L/min.
Lastly, Propre Orthogonal Decomposition (POD) technique was applied to understandthe coherence structures in turbulence and their spectral signature in a deterministicmanner (for details on this technique please refer to Holmes et al. [1998]; Pastur et al.[2005]). POD was developped by Lumley [1967] and in the past was applied to study theflow field within the human airways by Lin et al. [2007].
The existence of moving boundary in the present study could register a significant impacton the dynamic behavior of the solution. Thus, the POD was applied to mid-sagittal planeof the laryngeal zone for the static and dynamic glottal wall conditions of Eup15 taskand the interval 0.5s around the PIF . Comparison between cases 1 and 2 was observed.For the application of POD with moving boundaries, we used the method introduced byUtturkar et al. [2005] which consists in interpolation of the solution at each time steponto a fixed uniform grid.
Figure III.7.9 displays the POD statistical results. On the right panel is displayed a
(a) Comparison of cases 1 and 2.
1 2 3 4 5 6 7 8 910
−4
10−3
10−2
10−1
100
N mode
Cum
ulat
ive
ener
gy [%
]
(b) Cumulative energy of the POD modes.
Figure III.7.9: POD analysis results of the flow-field in the mid-sagittal laryngeal plane(Eup15 breathing task, air).
velocity field of the first (the strongest) mode. On the left panel is plotted the cumulativeenergy of the 9 modes evaluated. In both cases 1 and 2, almost 100% of the energyconsiders the first mode and thus, this is the most representative of the studied flow-field.Comparing the results of the first mode on the left panel with the contours of velocitymagnitude (see panel C on Figure III.7.3) the flow-field has similar structure. Likewise,considering cases 1 and 2 no differences in the distribution of energies between POD modesare found. Therefore the results confirm the conclusion that simulations with static ordynamic glottal variations do not show significant differences on the airflow dynamics
III.7.3. AEROSOL DEPOSITION 171
within the laryngeal area.
7.3 Aerosol Deposition
The aim of this study was to describe the micro-particle deposition in the upper airwaysunder realistic breathing conditions. The methodology on the aerosol injection was de-tailed in section III.6.3 and section III.6.2.2, particles of 1, 3, 5, and 10 µm were injectedinto the model during the inspiration phase.
7.3.1 Effects of non-steady airflow
Aerosol transport under non-steady airflow To visualize the transport of the particlesthrough the upper airways model, Figure III.7.10 displays the particles at different shotinstants of the breathing cycle. The breathing cycle corresponds to Eup15 task (case 2,unsteady glottal walls) as shown in Figure III.6.8a. The illustration case of 5 µm particlesis chosen here. The particles are colored according to their velocity magnitude | u |. At thebeginning of the inspiration phase (see t1 = 0.08s on the Figure III.7.10), the individualaerosol injections are apparent in the mouthpiece region. The aerosol follows the high-speed flow from the mouthpiece (for the detail on the flow structure, see Figure III.7.3).Further, the particles impact the tongue plane and follow towards the walls of the softpalate (t2 = 0.10s). At this moment a part of aerosols continues downstream the modeland a part recirculates backflow into the mouth cavity (see t2, t3, and t4). At instantt5 = 0.19s, the flow of particles impacts the anterior wall of trachea. Later, at the peakinspiratory flow PIF (t6), the particles are escaping from the trachea by the outlet wall Ωoand reach the highest speed around 5 m/s in the oropharynx and in the region downstreamthe glottis. At the end of inspiration phase, when the flow rate Q is close to 0 m/s, allthe particles are distributed through the whole model and their speed is close to 0 m/s(see t7). When expiration begins, the particles are transported backwards towards themouth cavity, escape by the inlet wall Ωi and around t9 is noticeable a jet up to 5 m/sin the oropharyngeal region. Finally, around the time t10 = 2.63s a negligible amount ofparticles stays in the model and recirculates in the mouth cavity until the end of the cycleat t = 4s.
Aerosol deposition under non-steady airflow Figure III.7.11 and Figure III.7.12 illustratethe temporal deposition fractions (intervals of 0.1s) of the 5 µm particles during onebreathing cycle (Eup15 task, case 2 with dynamic glottal geometry) on the walls of themodel.
Local deposition fractions in Figure III.7.12 are differentiated according to 4 regions de-fined in Figure III.6.3b: mouth cavity, oropharynx, larynx, and trachea. The temporaldeposition fraction is defined as the ratio of momentary deposited mass in a given region,to the total injected mass of aerosols during one breathing cycle into the model.
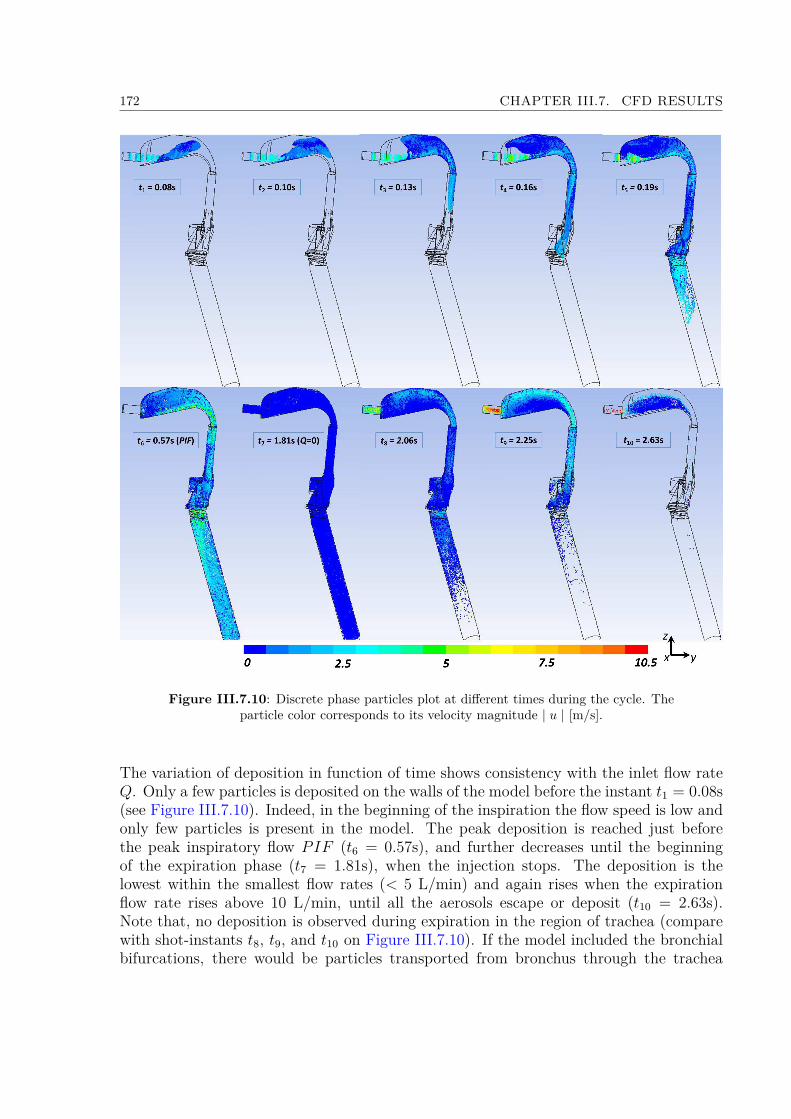
172 CHAPTER III.7. CFD RESULTS
Figure III.7.10: Discrete phase particles plot at different times during the cycle. Theparticle color corresponds to its velocity magnitude | u | [m/s].
The variation of deposition in function of time shows consistency with the inlet flow rateQ. Only a few particles is deposited on the walls of the model before the instant t1 = 0.08s(see Figure III.7.10). Indeed, in the beginning of the inspiration the flow speed is low andonly few particles is present in the model. The peak deposition is reached just beforethe peak inspiratory flow PIF (t6 = 0.57s), and further decreases until the beginningof the expiration phase (t7 = 1.81s), when the injection stops. The deposition is thelowest within the smallest flow rates (< 5 L/min) and again rises when the expirationflow rate rises above 10 L/min, until all the aerosols escape or deposit (t10 = 2.63s).Note that, no deposition is observed during expiration in the region of trachea (comparewith shot-instants t8, t9, and t10 on Figure III.7.10). If the model included the bronchialbifurcations, there would be particles transported from bronchus through the trachea
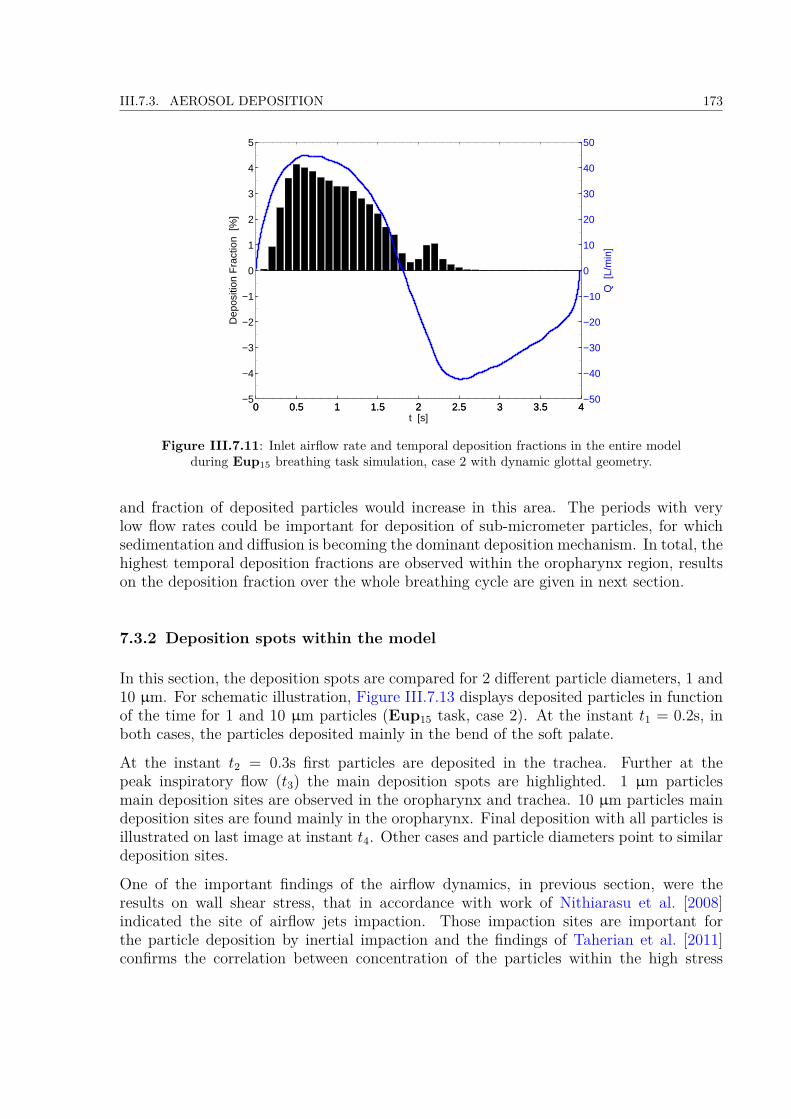
III.7.3. AEROSOL DEPOSITION 173
0 0.5 1 1.5 2 2.5 3 3.5 4−5
−4
−3
−2
−1
0
1
2
3
4
5
Dep
ositi
on F
ract
ion
[%]
t [s]0 0.5 1 1.5 2 2.5 3 3.5 4
−50
−40
−30
−20
−10
0
10
20
30
40
50
Q [
L/m
in]
Figure III.7.11: Inlet airflow rate and temporal deposition fractions in the entire modelduring Eup15 breathing task simulation, case 2 with dynamic glottal geometry.
and fraction of deposited particles would increase in this area. The periods with verylow flow rates could be important for deposition of sub-micrometer particles, for whichsedimentation and diffusion is becoming the dominant deposition mechanism. In total, thehighest temporal deposition fractions are observed within the oropharynx region, resultson the deposition fraction over the whole breathing cycle are given in next section.
7.3.2 Deposition spots within the model
In this section, the deposition spots are compared for 2 different particle diameters, 1 and10 µm. For schematic illustration, Figure III.7.13 displays deposited particles in functionof the time for 1 and 10 µm particles (Eup15 task, case 2). At the instant t1 = 0.2s, inboth cases, the particles deposited mainly in the bend of the soft palate.
At the instant t2 = 0.3s first particles are deposited in the trachea. Further at thepeak inspiratory flow (t3) the main deposition spots are highlighted. 1 µm particlesmain deposition sites are observed in the oropharynx and trachea. 10 µm particles maindeposition sites are found mainly in the oropharynx. Final deposition with all particles isillustrated on last image at instant t4. Other cases and particle diameters point to similardeposition sites.
One of the important findings of the airflow dynamics, in previous section, were theresults on wall shear stress, that in accordance with work of Nithiarasu et al. [2008]indicated the site of airflow jets impaction. Those impaction sites are important forthe particle deposition by inertial impaction and the findings of Taherian et al. [2011]confirms the correlation between concentration of the particles within the high stress
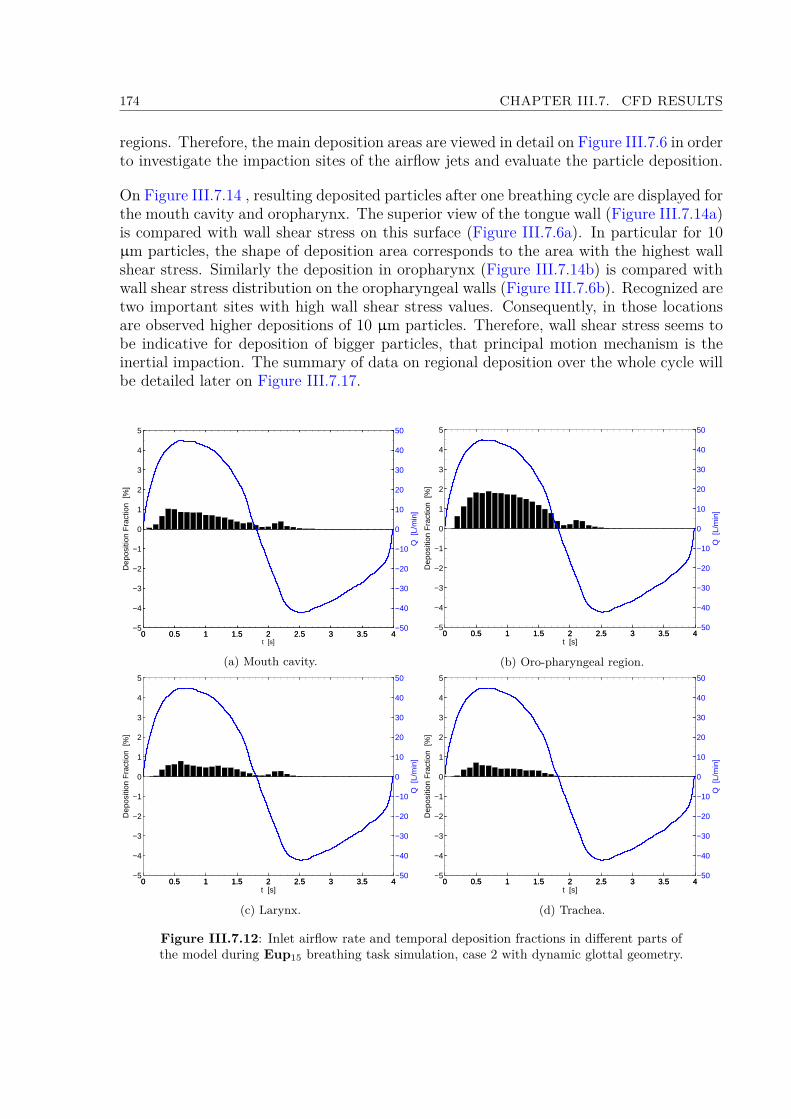
174 CHAPTER III.7. CFD RESULTS
regions. Therefore, the main deposition areas are viewed in detail on Figure III.7.6 in orderto investigate the impaction sites of the airflow jets and evaluate the particle deposition.
On Figure III.7.14 , resulting deposited particles after one breathing cycle are displayed forthe mouth cavity and oropharynx. The superior view of the tongue wall (Figure III.7.14a)is compared with wall shear stress on this surface (Figure III.7.6a). In particular for 10µm particles, the shape of deposition area corresponds to the area with the highest wallshear stress. Similarly the deposition in oropharynx (Figure III.7.14b) is compared withwall shear stress distribution on the oropharyngeal walls (Figure III.7.6b). Recognized aretwo important sites with high wall shear stress values. Consequently, in those locationsare observed higher depositions of 10 µm particles. Therefore, wall shear stress seems tobe indicative for deposition of bigger particles, that principal motion mechanism is theinertial impaction. The summary of data on regional deposition over the whole cycle willbe detailed later on Figure III.7.17.
0 0.5 1 1.5 2 2.5 3 3.5 4−5
−4
−3
−2
−1
0
1
2
3
4
5
Dep
ositi
on F
ract
ion
[%]
t [s]0 0.5 1 1.5 2 2.5 3 3.5 4
−50
−40
−30
−20
−10
0
10
20
30
40
50
Q [
L/m
in]
(a) Mouth cavity.
0 0.5 1 1.5 2 2.5 3 3.5 4−5
−4
−3
−2
−1
0
1
2
3
4
5D
epos
ition
Fra
ctio
n [%
]
t [s]0 0.5 1 1.5 2 2.5 3 3.5 4
−50
−40
−30
−20
−10
0
10
20
30
40
50
Q [
L/m
in]
(b) Oro-pharyngeal region.
0 0.5 1 1.5 2 2.5 3 3.5 4−5
−4
−3
−2
−1
0
1
2
3
4
5
Dep
ositi
on F
ract
ion
[%]
t [s]0 0.5 1 1.5 2 2.5 3 3.5 4
−50
−40
−30
−20
−10
0
10
20
30
40
50
Q [
L/m
in]
(c) Larynx.
0 0.5 1 1.5 2 2.5 3 3.5 4−5
−4
−3
−2
−1
0
1
2
3
4
5
Dep
ositi
on F
ract
ion
[%]
t [s]0 0.5 1 1.5 2 2.5 3 3.5 4
−50
−40
−30
−20
−10
0
10
20
30
40
50
Q [
L/m
in]
(d) Trachea.
Figure III.7.12: Inlet airflow rate and temporal deposition fractions in different parts ofthe model during Eup15 breathing task simulation, case 2 with dynamic glottal geometry.
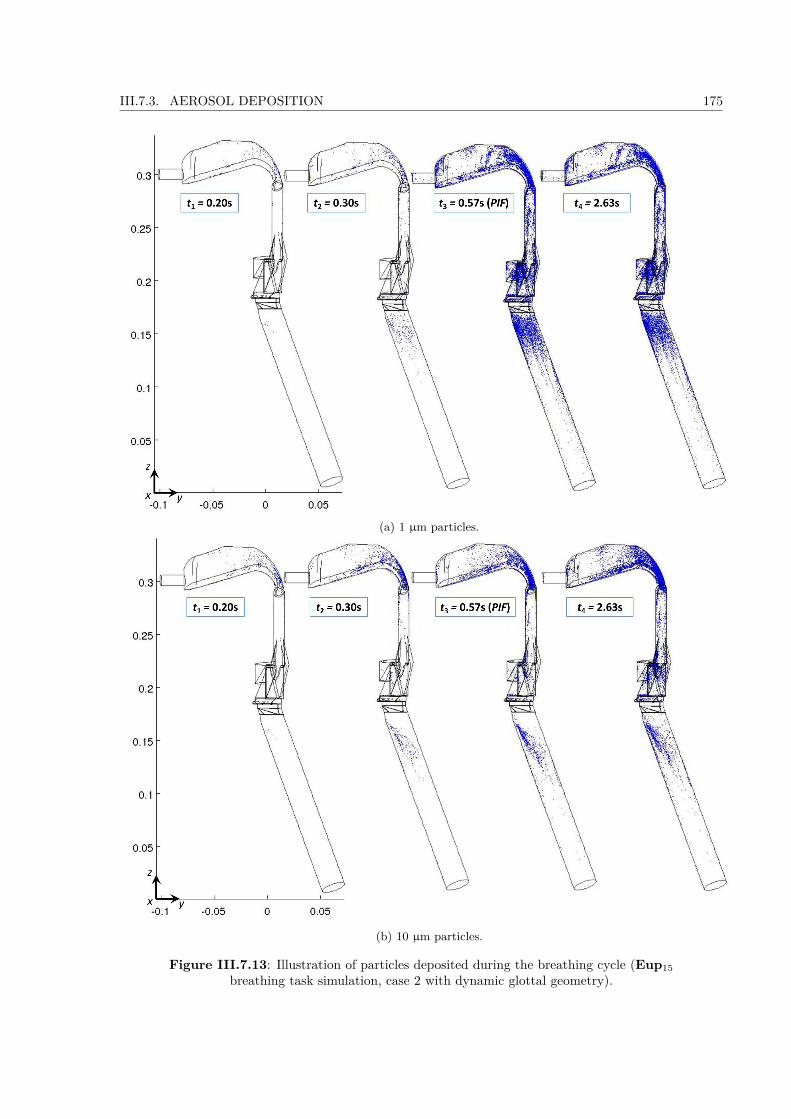
III.7.3. AEROSOL DEPOSITION 175
(a) 1 µm particles.
(b) 10 µm particles.
Figure III.7.13: Illustration of particles deposited during the breathing cycle (Eup15breathing task simulation, case 2 with dynamic glottal geometry).
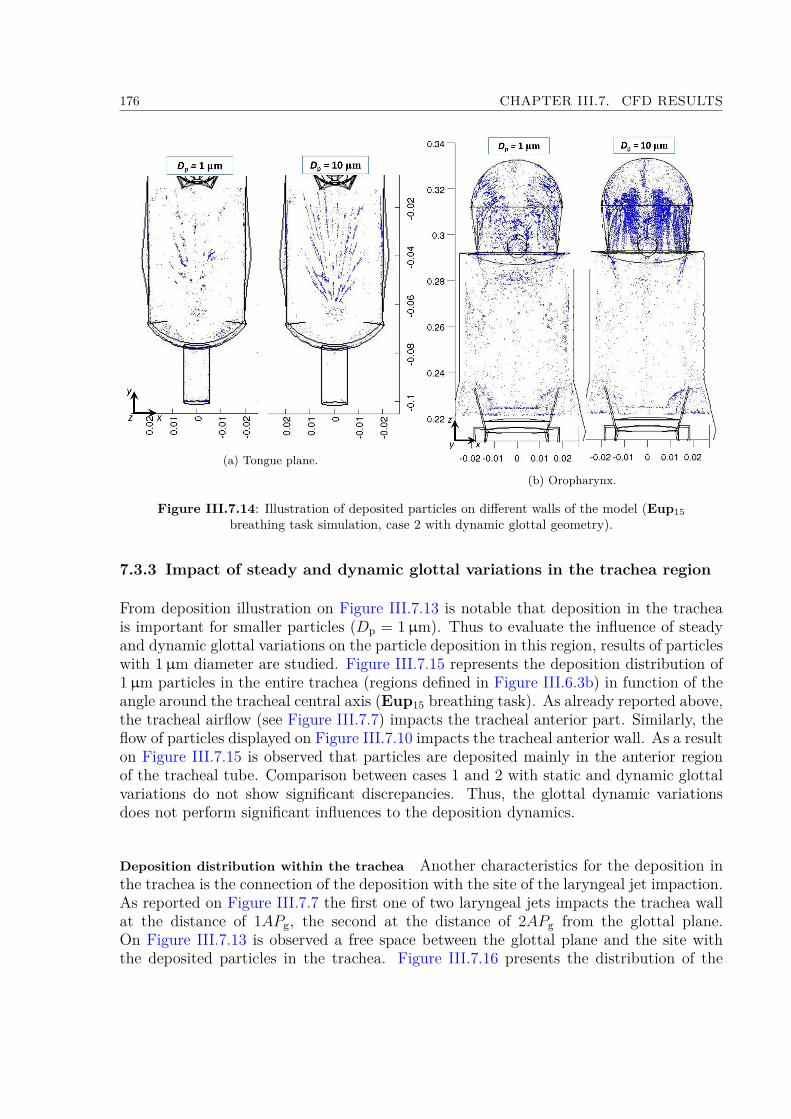
176 CHAPTER III.7. CFD RESULTS
(a) Tongue plane.(b) Oropharynx.
Figure III.7.14: Illustration of deposited particles on different walls of the model (Eup15breathing task simulation, case 2 with dynamic glottal geometry).
7.3.3 Impact of steady and dynamic glottal variations in the trachea region
From deposition illustration on Figure III.7.13 is notable that deposition in the tracheais important for smaller particles (Dp = 1µm). Thus to evaluate the influence of steadyand dynamic glottal variations on the particle deposition in this region, results of particleswith 1µm diameter are studied. Figure III.7.15 represents the deposition distribution of1µm particles in the entire trachea (regions defined in Figure III.6.3b) in function of theangle around the tracheal central axis (Eup15 breathing task). As already reported above,the tracheal airflow (see Figure III.7.7) impacts the tracheal anterior part. Similarly, theflow of particles displayed on Figure III.7.10 impacts the tracheal anterior wall. As a resulton Figure III.7.15 is observed that particles are deposited mainly in the anterior regionof the tracheal tube. Comparison between cases 1 and 2 with static and dynamic glottalvariations do not show significant discrepancies. Thus, the glottal dynamic variationsdoes not perform significant influences to the deposition dynamics.
Deposition distribution within the trachea Another characteristics for the deposition inthe trachea is the connection of the deposition with the site of the laryngeal jet impaction.As reported on Figure III.7.7 the first one of two laryngeal jets impacts the trachea wallat the distance of 1APg, the second at the distance of 2APg from the glottal plane.On Figure III.7.13 is observed a free space between the glottal plane and the site withthe deposited particles in the trachea. Figure III.7.16 presents the distribution of the
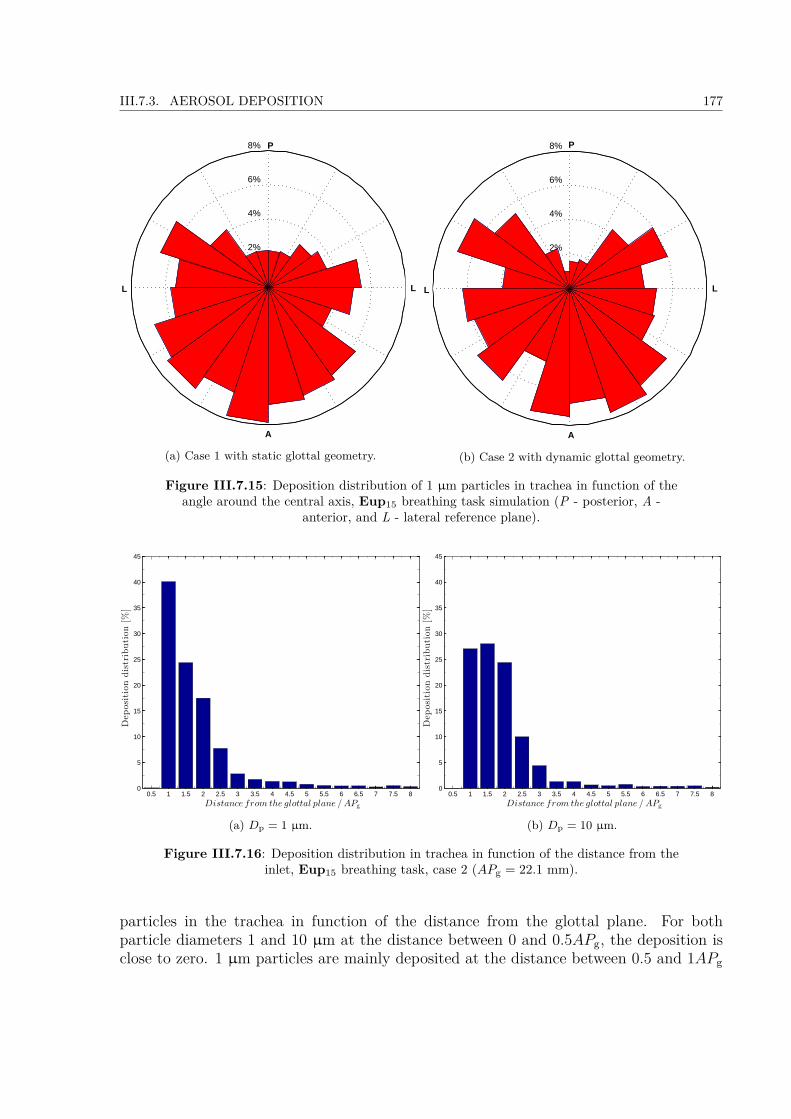
III.7.3. AEROSOL DEPOSITION 177
2%
4%
6%
8%
LL
P
A
(a) Case 1 with static glottal geometry.
2%
4%
6%
8%
LL
P
A
(b) Case 2 with dynamic glottal geometry.
Figure III.7.15: Deposition distribution of 1 µm particles in trachea in function of theangle around the central axis, Eup15 breathing task simulation (P - posterior, A -
anterior, and L - lateral reference plane).
0.5 1 1.5 2 2.5 3 3.5 4 4.5 5 5.5 6 6.5 7 7.5 80
5
10
15
20
25
30
35
40
45
Dep
ositiondistribution[%
]
Distance from the glottal plane / APg
(a) Dp = 1 µm.
0.5 1 1.5 2 2.5 3 3.5 4 4.5 5 5.5 6 6.5 7 7.5 80
5
10
15
20
25
30
35
40
45
Dep
ositiondistribution[%
]
Distance from the glottal plane / APg
(b) Dp = 10 µm.
Figure III.7.16: Deposition distribution in trachea in function of the distance from theinlet, Eup15 breathing task, case 2 (APg = 22.1 mm).
particles in the trachea in function of the distance from the glottal plane. For bothparticle diameters 1 and 10 µm at the distance between 0 and 0.5APg, the deposition isclose to zero. 1 µm particles are mainly deposited at the distance between 0.5 and 1APg

178 CHAPTER III.7. CFD RESULTS
from the glottal plane. 10 µm particles deposition is slightly more spread and the peakdeposition is located at the distance between 1 and 1.5APg. In conclusion, bigger particleshave higher inertia and so do not follow the flow streamlines perfectly and are depositedin further distance in comparison with small particles.
7.3.4 Summary on deposition results within the upper airways for the 6 cases
The variations of other particle diameters (1, 3, and 10 µm) and other simulation cases (1,and 3 - 6) are marked with similar characteristics as the ones detailed previously for case2. Note that, only differences in particle velocity amplitude or deposition can be found.Therefore, on Figure III.7.17 are displayed regional and total deposition efficiencies infunction of particle diameter, and different simulation cases over the entire breathingcycle. First column summarizes deposition fractions in different regions of the model(according to sections defined in Figure III.6.3b), and second column gives the depositionefficiencies for the entire model. The deposition efficiency is defined as the ratio of thenumber of particles trapped by the walls of the model to the total number of particlesreleased in the mouthpiece during one breathing cycle.Comparing the deposition fractions in different regions of the model, the highest fractionin all cases and for all studied diameters is deposited within the oropharyngeal region. Inthe following, if not specified else, the cases with air as a medium (cases 1, 2 and 4, 5)are discussed.
Regional deposition fractions Particles with diameter 1, 3, and 5 µm result in similardeposition characteristics in the mouth cavity, laryngeal, and tracheal regions (see leftcolumn on Figure III.7.17). In the mouth cavity and larynx the deposition reaches around10% of all particles injected into the model. In cases 3 and 6 with He-O2 mixture, incomparison with air, the deposition is about two times less, around 6% in the mouthcavity and about 3% in the larynx.In the trachea is for all diameters deposited the smallest fraction. Within this regionis significant the difference between slow breathing task Eup15 and rapid breathing taskTachyp30, when in former case the deposition gets up to 6% (less than 2% in He-O2mixture), but in the later one up to 3% (less than 0.5% in He-O2 mixture).Regarding the deposition in the oropharynx significant differences between different par-ticle diameters are found. The highest deposition is reached during rapid breathing taskTachyp30. Bigger the particles are, higher the difference is. Thus, for 1 µm particles inslow and rapid breathing the deposition is slightly less and slightly above 20%, repectively.On the other side, for 3 µm particles the deposition reaches more than 25% and morethan 35% for slow and rapid breathing, respectively. In He-O2 mixture in both breathingregimes the results come to about 12% of deposited mass in this region.For particle’s diameter 10 µm, the values in the mouth cavity and oropharynx are muchhigher (see panel (g) on Figure III.7.17). Because the main deposition mechanism inupper airways is inertial impaction, higher deposition with bigger particle diameter can

III.7.3. AEROSOL DEPOSITION 179
0
10
20
30
40
50
60
Particles
depositionfractions[%
]
Mouth cavity Oro-pharynx Larynx Trachea
Case 1Case 2Case 3Case 4Case 5Case 6
(a) Dp = 1µm. Deposition fractions indifferent sections.
0
10
20
30
40
50
60
70
80
90
100
Particles
depositionfractions[%
]
41.9 42.5
17.8
43.145.1
16.7
Case 1 Case 2 Case 3 Case 4 Case 5 Case 6
(b) Dp = 1µm. Total depositionfractions.
0
10
20
30
40
50
60
Particles
depositionfractions[%
]
Mouth cavity Oro-pharynx Larynx Trachea
Case 1Case 2Case 3Case 4Case 5Case 6
(c) Dp = 3µm. Deposition fractions indifferent sections.
0
10
20
30
40
50
60
70
80
90
100Particles
depositionfractions[%
]
48.5 48.1
21.0
50.9 51.6
18.2
Case 1 Case 2 Case 3 Case 4 Case 5 Case 6
(d) Dp = 3µm. Total depositionfractions.
0
10
20
30
40
50
60
Particles
depositionfractions[%
]
Mouth cavity Oro-pharynx Larynx Trachea
Case 1Case 2Case 3Case 4Case 5Case 6
(e) Dp = 5µm. Deposition fractions indifferent sections.
0
10
20
30
40
50
60
70
80
90
100
Particles
depositionfractions[%
]
53.150.8
23.2
60.758.9
20.5
Case 1 Case 2 Case 3 Case 4 Case 5 Case 6
(f) Dp = 5µm. Total depositionfractions.
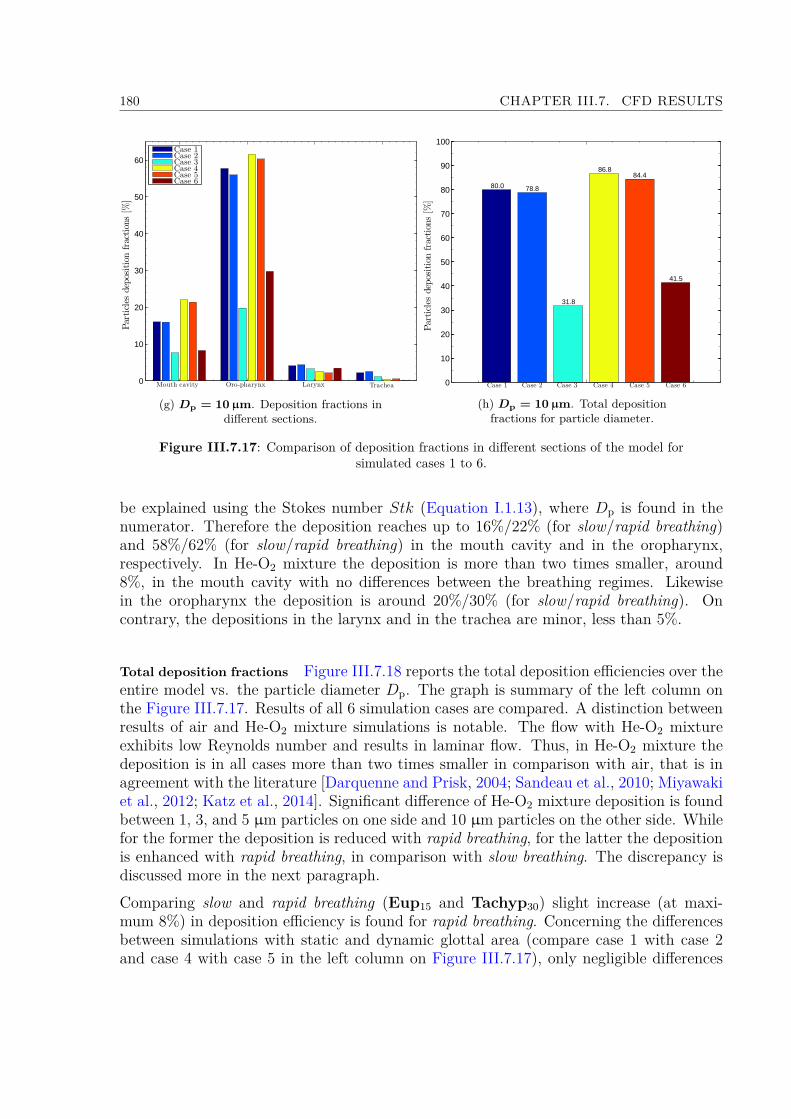
180 CHAPTER III.7. CFD RESULTS
0
10
20
30
40
50
60
Particles
depositionfractions[%
]
Mouth cavity Oro-pharynx Larynx Trachea
Case 1Case 2Case 3Case 4Case 5Case 6
(g) Dp = 10µm. Deposition fractions indifferent sections.
0
10
20
30
40
50
60
70
80
90
100
Particles
depositionfractions[%
]
80.0 78.8
31.8
86.884.4
41.5
Case 1 Case 2 Case 3 Case 4 Case 5 Case 6
(h) Dp = 10µm. Total depositionfractions for particle diameter.
Figure III.7.17: Comparison of deposition fractions in different sections of the model forsimulated cases 1 to 6.
be explained using the Stokes number Stk (Equation I.1.13), where Dp is found in thenumerator. Therefore the deposition reaches up to 16%/22% (for slow/rapid breathing)and 58%/62% (for slow/rapid breathing) in the mouth cavity and in the oropharynx,respectively. In He-O2 mixture the deposition is more than two times smaller, around8%, in the mouth cavity with no differences between the breathing regimes. Likewisein the oropharynx the deposition is around 20%/30% (for slow/rapid breathing). Oncontrary, the depositions in the larynx and in the trachea are minor, less than 5%.
Total deposition fractions Figure III.7.18 reports the total deposition efficiencies over theentire model vs. the particle diameter Dp. The graph is summary of the left column onthe Figure III.7.17. Results of all 6 simulation cases are compared. A distinction betweenresults of air and He-O2 mixture simulations is notable. The flow with He-O2 mixtureexhibits low Reynolds number and results in laminar flow. Thus, in He-O2 mixture thedeposition is in all cases more than two times smaller in comparison with air, that is inagreement with the literature [Darquenne and Prisk, 2004; Sandeau et al., 2010; Miyawakiet al., 2012; Katz et al., 2014]. Significant difference of He-O2 mixture deposition is foundbetween 1, 3, and 5 µm particles on one side and 10 µm particles on the other side. Whilefor the former the deposition is reduced with rapid breathing, for the latter the depositionis enhanced with rapid breathing, in comparison with slow breathing. The discrepancy isdiscussed more in the next paragraph.Comparing slow and rapid breathing (Eup15 and Tachyp30) slight increase (at maxi-mum 8%) in deposition efficiency is found for rapid breathing. Concerning the differencesbetween simulations with static and dynamic glottal area (compare case 1 with case 2and case 4 with case 5 in the left column on Figure III.7.17), only negligible differences
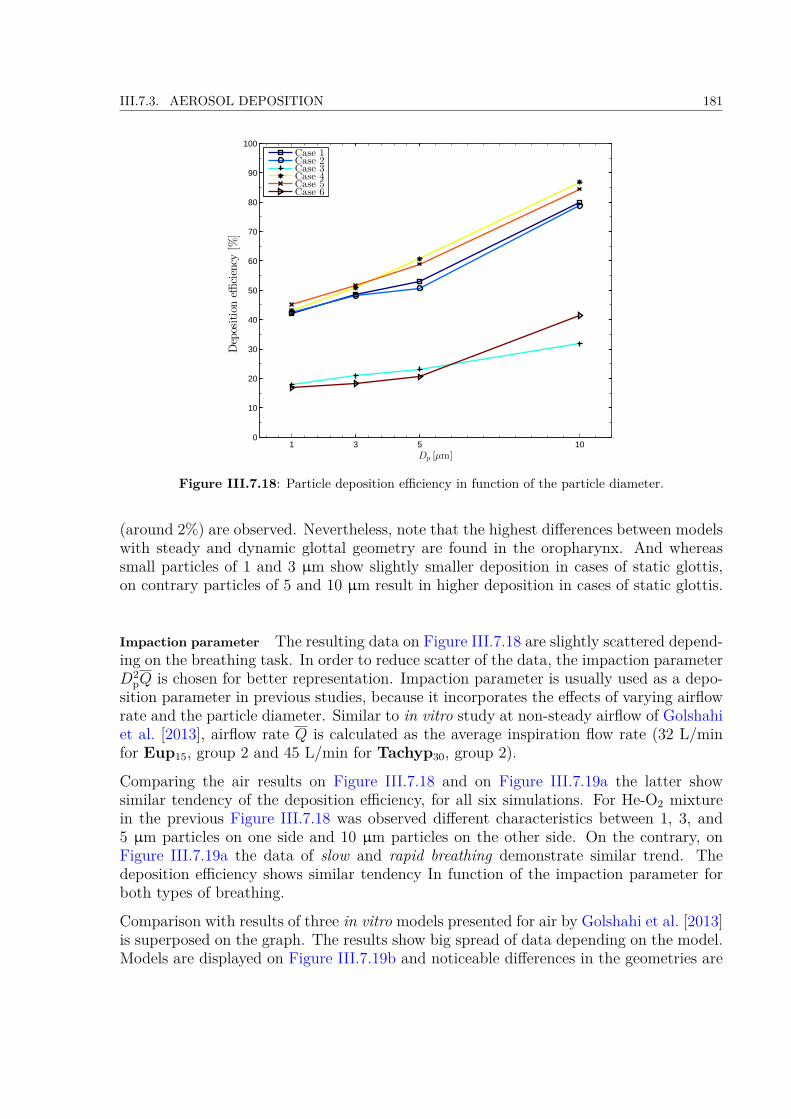
III.7.3. AEROSOL DEPOSITION 181
1 3 5 100
10
20
30
40
50
60
70
80
90
100
Dp [µm]
Depositioneffi
ciency
[%]
Case 1Case 2Case 3Case 4Case 5Case 6
Figure III.7.18: Particle deposition efficiency in function of the particle diameter.
(around 2%) are observed. Nevertheless, note that the highest differences between modelswith steady and dynamic glottal geometry are found in the oropharynx. And whereassmall particles of 1 and 3 µm show slightly smaller deposition in cases of static glottis,on contrary particles of 5 and 10 µm result in higher deposition in cases of static glottis.
Impaction parameter The resulting data on Figure III.7.18 are slightly scattered depend-ing on the breathing task. In order to reduce scatter of the data, the impaction parameterD2
pQ is chosen for better representation. Impaction parameter is usually used as a depo-sition parameter in previous studies, because it incorporates the effects of varying airflowrate and the particle diameter. Similar to in vitro study at non-steady airflow of Golshahiet al. [2013], airflow rate Q is calculated as the average inspiration flow rate (32 L/minfor Eup15, group 2 and 45 L/min for Tachyp30, group 2).
Comparing the air results on Figure III.7.18 and on Figure III.7.19a the latter showsimilar tendency of the deposition efficiency, for all six simulations. For He-O2 mixturein the previous Figure III.7.18 was observed different characteristics between 1, 3, and5 µm particles on one side and 10 µm particles on the other side. On the contrary, onFigure III.7.19a the data of slow and rapid breathing demonstrate similar trend. Thedeposition efficiency shows similar tendency In function of the impaction parameter forboth types of breathing.
Comparison with results of three in vitro models presented for air by Golshahi et al. [2013]is superposed on the graph. The results show big spread of data depending on the model.Models are displayed on Figure III.7.19b and noticeable differences in the geometries are

182 CHAPTER III.7. CFD RESULTS
(a) Particle deposition efficiency in function of the impaction parameter. Comparison withGolshahi et al. [2013].
(b) Comparison of present model geometry with models of 3 subjects studied by Golshahi et al.[2013].
Figure III.7.19: Comparison of present study with Golshahi et al. [2013].
evident between those models and also in comparison with our model. Golshahi et al.[2013] presented results on particles diameter in the range between 0.5 and 6.7 µm. Ourdata in the range between 102 and 103 of D2
pQ (that correspond to particle diameter 3and 5 µm) are found within the results of their in vitro models. For higher values data ofpresent study are in the range of deposition efficiencies 80 and 90%, that correspond to thehighest deposition efficiencies of Golshahi et al. [2013]. Finally the deposition efficienciesof the smallest impaction parameters between 30 and 40 result in much higher values than

III.7.3. AEROSOL DEPOSITION 183
would be expected from measured results by Golshahi et al. [2013]. Taking into accountthe scatter of Golshahi et al. [2013] results depending on different model geometries, it issuggested that such a difference could be caused by this reason. In particular, the smallgeometry of the present mouthpiece generates very thin jet flow, that can lead to higherdeposition for micrometer particles within the upper airways, as was described in Linet al. [2001].

184 CHAPTER III.7. CFD RESULTS
Summary
Several items can be highlighted to summarize the methodology and the results presentedin the Part III.
• An averaged 3D geometry of the human upper airways has been designed basedon: (i) the HRCT-scans of a male adult obtained from the pilot study described inConway et al. [2012]; and (ii) the laryngoscopic images of glottal motion elaboratedin the Part II. The time-varying laryngeal area has been developed through 2D and3D steps, considering a rectangular constriction and a simplified tubular geometry,respectively. Finally the glottal region geometry has been integrated into the 3Daveraged model of upper airways.
• CFD simulations were conducted implementing conditions resulting from in vivomeasurements in the Part II: (i) time-varying glottal wall motion of one breathingcycle; and (ii) unsteady oral airflow rates, together with unsteady aerosol injectionof one breathing cycle. In total, six simulation cases were performed in this the-sis, differing from each other through different conditions: (i) the breathing regime(eupnea/tachypnea); (ii) the glottal wall condition (steady/dynamic); and (iii) thecarrier gas (air or He-O2 mixture). During the inspiration phase, aerosol particleswith diameter 1, 3, 5, and 10 µm, were injected into the model.
• For each simulation case, the numerical data post-processing comprised several dif-ferent analysis. (i) Concerning the flow dynamics: study of the airflow field includingpressure drop evolution, turbulence distribution through the model and wall shearstress on the regions of jet impaction. (ii) Concerning the unsteady aerosol dynamics:study of particle flow over one breathing cycle and temporal aerosol depositions. (iii)Finally, concerning the aerosol deposition efficiency: study of deposition in differentparts of the model and for different particle sizes.
• Regarding the airflow dynamics, three regions forming important jet structures wereobserved: one in the mouthpiece, second in the oropharyngeal bend and last in theglottal area. Consequently the created high-speed airstream caused jet impactionand recirculation zones in the mouth cavity, in the pharynx and in the trachea,respectively. The wall shear stress (WSS) is considered to be a good representative ofthe jet impaction and recirculated flow. Thus, the WSS was studied at the impactionsites and later compared with the aerosol deposition distribution in those regions. Nosignificant differences in airflow dynamics were observed between the two simulation
185
186 CHAPTER III.7. CFD RESULTS
cases: (i) steady glottal walls (group of subjects with unvarying glottal opening);and (ii) unsteady glottal walls (subjects with moving glottal walls).• Inertial impaction is the most important deposition mechanism within the upperairways and thus the deposition is primarily dependent on the particle size and airflowspeed (i.e., Stokes number). Concerning the former one, particles with diameter 1,3, and 5 µm result in similar deposition distributions over the model. The resultsshowed high correlation between jet impaction sites and aerosol deposition regions,in particular for 10 µm particles. The highest deposition fractions were found inthe oropharyngeal region, where for 10 µm particles it reaches up to 60% of thetotal mass of the particles injected into the model. During eupnea, the depositionefficiency reaches around 42%, 49%, 53% and 80% for 1, 3, 5 and 10µm particles,respectively. In comparison with previous CFD works is found higher deposition forparticles of 1 and 3 µm. It has been suggested that the increase can be a result ofapplied variable upper airways geometries and dimension of the mouthpiece. Otherimportant parameter is the nature of the carrier gas. The flow with He-O2 mixtureexhibits low Reynolds number and results in laminar flow. Thus, for He-O2 mixturethe deposition reaches two times smaller values than for air.• For slow and rapid breathing (eupnea and tachypnea respectively) the results ofaerosol deposition in upper airways exhibit similar characteristics in both air andHe-O2 mixture. Concerning the aerosol deposition in air, the fraction is higher fortachypnea breathing. On the contrary in He-O2 mixture for 1, 3, and 5 µm parti-cles the deposited fraction is higher in eupnea than in tachypnea. Only for 10 µmparticles the deposited fraction is increased in tachypnea.• The impact of the glottal motion was found to have negligible effects on the depo-sition dynamics. The deposition fraction does not significantly differ between thetwo simulation cases: (i) steady glottal walls (group of subjects with unvarying glot-tal opening); and (ii) unsteady glottal walls (subjects with moving glottal walls).Therefore, in normal breathing conditions the glottal motion can be neglected. How-ever, further research should be performed on the glottal motion influence in specificbreathing conditions, e.g. when inhaling aerosols. In those conditions the glottismovement may lead to different deposition characteristics.

Conclusions
187


189
The aim of this study was to investigate the conditions of human breathing in theupper airways region of the respiratory system and to examine their influence on airflowdynamics and on aerosol transport and deposition. The human respiratory system andthe breathing characteristics represent a complex biomechanical problem. During inhaledtherapies, the upper airways’ morphology can act as an unwanted filter, which limits theamount of drug delivered to the lungs. The glottis, defined by the vocal-fold aperture,causes upper airways to narrow in a minimal cross section, which is determinant on aerosoldeposition.
The observations made in the previous works on healthy subjects during breathingfound the following glottal features: (i) the glottal area progressively increases duringinspiration and narrows during expiration; and (ii) in some cases, the glottis can remainconstantly opened whatever the breathing task. However, the quantitative descriptionof the glottal motion in time has been barely studied and the glottal dynamics andits interaction with the breathing airflow rate was poorly described, which yielded tocontroversial results. Thus, the first general purpose of this thesis was to investigatethe time-variations of the glottal area during breathing, together with the synchronizedbreathing airflow pattern.
Experiments and Computational Fluid Dynamics (CFD) simulations are an efficienttool to predict the respiratory airflow dynamics and aerosol transport and deposition in thehuman upper airways. However, up to now the data on the realistic breathing conditions(glottal motion and oral airflow rate) were missing and thus, the impact of glottal motionon airflow and aerosol deposition in the human upper airways was often discarded fromthe numerical and experimental studies. Early in vitro studies were mainly carried outunder steady flow conditions, with a static glottis. As well the previous in silico studieswere performed assuming the following approximations: (i) a mean constant inhalationflow rate (15 to 60 L/min); (ii) quasi-steady flow conditions; (iii) simple tubular geometryin the glottal area; and (iv) to our knowledge, a single study considered an oscillatoryflow and glottal movement conditions (approximated by sinusoidal functions) [Renotteet al., 2000]. Thus, the second general purpose of this thesis was to predict the effectsof a dynamic glottis and realistic airflow conditions on the aerosol deposition within theupper airways using three-dimensional simulations.
This thesis presents research and findings from two different domains: the humanphysiology and the mechanics of the two-phase flow in the upper airways. To gain un-derstanding on the realistic breathing conditions, an in vivo study was performed. Thecharacteristics of the airflow rate and the glottal dimensions variations were measuredin collaboration with medical practitioners from La Timone Adult Hospital in Marseille,France and Speech and Language Laboratory (LPL) in Aix-en-Provence, France. After-wards, the measured data were integrated into a complementary in silico study.
In vivo study
An experimental protocol was developed to examine 20 healthy subjects in a clinicalstudy to investigate: (i) the respiration airflow rate, and (ii) the vocal folds movement

190
characteristics during breathing. Therefore, oral airflow measurements were achieved bymeans of EVA2TM system developed at the LPL and synchronized laryngoscopic videorecording was realized using a flexible nasofibroscope. Several different breathing taskswere studied in order to investigate glottal dynamics in different conditions: eupnea,tachypnea, hyperpnea (slow, rapid, and deep breathing, respectively), apnea and a apecifictask mimicking aerosol inhalation.
For all subjects the data processing comprised: (i) the detection of a mean breathingairflow rate per gender for two breathing tasks eupnea (performed at 15 cycles/min), andtachypnea (performed at 30 cycles/min); (ii) the extensive analysis of the laryngeal imagesrecorded during those two major tasks. These tasks are altogether representative of slowand rapid breathing. A customized methodology was developed to extract time-variationsof the glottal area in each case.
During eupnea, for males, the peak value of glottal area decreased from 217.32 ±53.8 mm2 (mean ± SD) during inspiration, to 178.1 ± 34.6 mm2 during expiration. Forfemales, the peak glottal area changes from 189.21 ± 31.6 mm2 during inspiration to168.23 ± 30.8 mm2 during expiration. The mean value over the whole cycle, was foundat 196.14 ± 41.9 mm2 for males, and 177.37 ± 26.7 mm2 for females. During tachypneathe average glottal area is about 8.4% and 0.3% larger for male and female, respectively.
The recorded data showed that glottal and airflow dynamics during breathing dif-fer from sinusoidal signal. The glottal motion seems related to the airflow dynamicsduring inspiratory phase, but no correlation is observed during expiratory phase. Glottalvariations depending on the subject can have “steady” or “dynamic” behavior. Thus,testing the correlation of glottal and airflow rate time-variations, subjects with “static”or “dynamic” glottis during an average breathing cycle were sorted.
Finally, average breathing cycle of a group of subjects with “static” and with “dy-namic” characteristics provided input data to conduct the realistic numerical simulationsof laryngeal airflow and particle deposition in the model of upper airways.
In silico study
An averaged 3D geometry of the human upper airways has been designed basedon: (i) the High-Resolution Computerized Tomography (HRCT) scans of a male adultobtained from the pilot study described in Conway et al. [2012]; and (ii) the laryngoscopicimages of glottal motion elaborated in the in vivo study. Next, the main task was toimplement realistic respiration airflow conditions and realistic movement of the vocalcords within the model.
In total 6 transient simulations of the breathing cycle were performed, 4 with airand 2 with He-O2 mixture. The boundary conditions were based on the results fromthe in vivo study: (i) the breathing regime (eupnea or tachypnea); and (ii) the glottalcharacteristics (“static” or “dynamic”). During the inspiration phase, aerosol particleswith diameter 1, 3, 5, and 10 µm, were injected into the model.
191
The predicted important flow phenomena such as laryngeal jet, recirculation zones,secondary flows patterns are in agreement with the previous in silico studies. On thecontrary, the small geometry of the present mouthpiece generates very thin jet flow, thatcan increase the deposition efficiency of the model.
The deposition in upper airways is primarily dependent on the particle size andairflow speed (i.e., Stokes number). Concerning the former one, particles with diameter 1,3, and 5 µm result in similar deposition distributions over the model. The results showedhigh correlation between jet impaction sites and aerosol deposition regions, in particularfor 10 µm particles. The highest deposition fractions were found in the oropharyngealregion, where for 10 µm particles it reaches up to 60% of the total mass of the particlesinjected into the model.
During eupnea, the deposition efficiency reaches around 42%, 49%, 53% and 80% for1, 3, 5 and 10µm particles, respectively. In comparison with previous CFD works is foundhigher deposition for particles with 1 and 3 µm diameter. It has been suggested that theincrease can be a result of applied variable upper airways geometries and dimension of themouthpiece. Other important parameter is the nature of the carrier gas. The flow withHe-O2 mixture exhibits low Reynolds number and results in laminar flow. Thus, for He-O2 mixture the deposition reaches two times smaller values than for air. These findingsconsider important conclusions for clinicians, to determine the therapeutic efficiency ofdrugs administration during inhalation therapy.
The CFD results on airflow dynamics and aerosol transport and deposition demon-strated negligible differences between “static” and “dynamic” glottal characteristics. There-fore, in normal breathing conditions the glottal motion can be neglected.
Perspectives
Concerning the in vivo study, nasofiberscopy is an invasive technique to examine theglottal region. The patient is in an uncomfortable condition, which may influence theglottal behavior. Better alternative would be examination using non-invasive techniques,e.g. HRCT scan, nevertheless, currently this technique does not provide sufficient imagetime-resolution.
Further research should be performed on the glottal motion influence in specificbreathing conditions, e.g. when inhaling aerosols. In those conditions the glottis move-ment may lead to different deposition characteristics.
Concerning the in silico study, future investigation should be orientated on the devel-opment of the more realistic upper airways geometry including bronchial bifurcations.The comparison of aerosol deposition results with the previous studies suggest importantinfluence of different geometries on the aerosol deposition. Thus, several realistic geome-tries should be investigated together with the breathing conditions, in order to providestatistically significant data. In addition, concerning the geometry, interest should be puton the pharyngeal compliance, that can be significant especially in disease.

192
The study of the particle deposition dynamics in the respiratory tract should beextended also to sub-micrometric particles. Both sub-micron and microparticles are animportant subject not only in the field of pharmaceutics, but also regarding the ambientair pollution. Therefore, further application of the present study on the deposition ofairborne particles in the respiratory tract would help to study the health effects of aerosolair pollution.

Bibliography
Agarwal, M., Scherer, R. C., and Hollien, H. (2003). The false vocal folds: Shape and sizein frontal view during phonation based on laminagraphic tracings. Journal of Voice,17(2):97–113.
Agertoft, L. and Pedersen, S. (1993). Importance of the inhalation device on the effect ofbudesonide. Archives of Disease in Childhood, 69(1):130–133.
Akerlund, L., Kitzing, P., Petersson, G., and Linder, H. (2014). Dysphonia - examinationtechnique. Available at http://www.dysphonia.certec.lth.se/.
Alipour, F., Berry, D. A., and Titze, I. R. (2000). A finite-element model of vocal-foldvibration. The Journal of the Acoustical Society of America, 108(6):3003–3012.
Alipour, F., Brucker, C., D Cook, D., Gommel, A., Kaltenbacher, M., Mattheus, W.,Mongeau, L., Nauman, E., Schwarze, R., Tokuda, I., and others (2011). Mathemat-ical models and numerical schemes for the simulation of human phonation. CurrentBioinformatics, 6(3):323–343.
Altman, P. L. and Dittmer, D. S. (1971). Respiration and circulation. Federation ofAmerican Societies for Experimental Biology, Bethesda, Md.
ANSYS R©(2013a). ANSYS Fluent Meshing User’s Guide. Release 15.0. ANSYS, Inc.,Canonsburg, USA.
ANSYS R©(2013b). ANSYS Fluent Theory Guide. Release 15.0. ANSYS, Inc., Canonsburg,USA.
ANSYS R©(2013c). ANSYS Fluent UDF Manual. Release 15.0. ANSYS, Inc., Canonsburg,USA.
Baier, H., Wanner, A., Zarzecki, S., and Sackner, M. A. (1977). Relationships amongglottis opening, respiratory flow, and upper airway resistance in humans. Journal ofApplied Physiology, 43(4):603–611.
Bailly, L. (2009). Interaction entre cordes vocales et bandes ventriculaires en phonation:exploration in-vivo, modélisation physique, validation in-vitro. Université du Maine.Doctoral thesis.
193
194 BIBLIOGRAPHY
Bailly, L., Henrich, N. B., Müller, F., Rohlfs, A.-K., and Hess, M. (2014). The ventricular-fold dynamics in human phonation. Journal of Speech, Language, and Hearing Research,57:1219–1242.
Bailly, L., Henrich, N. B., and Pelorson, X. (2010). Vocal fold and ventricular fold vibra-tion in period-doubling phonation: physiological description and aerodynamic modeling.The Journal of the Acoustical Society of America, 127(5):3212–3222.
Bailly, L., Pelorson, X., Henrich, N. B., and Ruty, N. (2008). Influence of a constrictionin the near field of the vocal folds: Physical modeling and experimental validation. TheJournal of the Acoustical Society of America, 124(5):3296–3308.
Ball, C. G., Uddin, M., and Pollard, A. (2008). High resolution turbulence modelling ofairflow in an idealised human extra-thoracic airway. Computers & Fluids, 37(8):943–964.
Barney, A., Shadle, C. H., and Davies, P. (1999). Fluid flow in a dynamic mechanicalmodel of the vocal folds and tract. i. measurements and theory. The Journal of theAcoustical Society of America, 105(1):444–455.
Barrett, J. C. and Clement, C. F. (1988). Growth rates for liquid drops. Journal ofAerosol Science, 19(2):223–242.
Beaty, M. M., Wilson, J. S., and Smith, R. J. H. (1999). Laryngeal motion during exercise.The Laryngoscope, 109(1):136–139.
Becker, S., Kniesburges, S., Müller, S., Delgado, A., Link, G., Kaltenbacher, M., andDöllinger, M. (2009). Flow-structure-acoustic interaction in a human voice model. TheJournal of the Acoustical Society of America, 125(3):1351–1361.
Bělka, M., Lízal, F., Jedelský, J., and Jícha, M. (2013). Analysis of fiber deposition usingautomatic image processing method. EPJ Web of Conferences, 45:01011.
Benchetrit, G. (2000). Breathing pattern in humans: diversity and individuality. Respi-ration physiology, 122(2-3):123–129.
Benchetrit, G., Shea, S. A., Dinh, T. P., Bodocco, S., Baconnier, P., and Guz, A. (1989).Individuality of breathing patterns in adults assessed over time. Respiration Physiology,75(2):199–209.
Benninger, C., Parsons, J. P., and Mastronarde, J. G. (2011). Vocal cord dysfunction andasthma. Current Opinion in Pulmonary Medicine, 17(1):45–49.
Berry, D. A., Herzel, H., Titze, I. R., and Krischer, K. (1994). Interpretation of biome-chanical simulations of normal and chaotic vocal fold oscillations with empirical eigen-functions. The Journal of the Acoustical Society of America, 95(6):3595–3604.
Bisgaard, H. (1995). A metal aerosol holding chamber devised for young children withasthma. European Respiratory Journal, 8(5):856–860.
Boiron, O., Deplano, V., and Pelissier, R. (2007). Experimental and numerical studieson the starting effect on the secondary flow in a bend. Journal of Fluid Mechanics,574:109–129.
BIBLIOGRAPHY 195
Brancatisano, T., Collett, P. W., and Engel, L. A. (1983). Respiratory movements of thevocal cords. Journal of Applied Physiology, 54(5):1269–1276.
Brancatisano, T. P., Dodd, D. S., and Engel, L. A. (1984). Respiratory activity of pos-terior cricoarytenoid muscle and vocal cords in humans. Journal of Applied Physiology,57(4):1143–1149.
Brouns, M., Jayaraju, S. T., Lacor, C., De Mey, J., Noppen, M., Vincken, W., andVerbanck, S. (2007a). Tracheal stenosis: a flow dynamics study. Journal of AppliedPhysiology, 102(3):1178–1184.
Brouns, M., Verbanck, S., and Lacor, C. (2007b). Influence of glottic aperture on thetracheal flow. Journal of biomechanics, 40(1):165–172.
Brown, J. S., Gordon, T., Price, O., and Asgharian, B. (2013). Thoracic and respirableparticle definitions for human health risk assessment. Particle and Fibre Toxicology,10:12.
Busetto, L., Calo’, E., Mazza, M., De Stefano, F., Costa, G., Negrin, V., and Enzi, G.(2009). Upper airway size is related to obesity and body fat distribution in women.European Archives of Oto-Rhino-Laryngology, 266(4):559–563.
Cain, C. C. and Otis, A. B. (1949). Some physiological effects resulting from addedresistance to respiration. The Journal of aviation medicine, 20(3):149–160.
Calabrese, P., Dinh, T. P., Eberhard, A., Bachy, J. P., and Benchetrit, G. (1998). Effectsof resistive loading on the pattern of breathing. Respiration Physiology, 113(2):167–179.
Campbell, A. H., Imberger, H., and Jones, B. M. (1976). Increased upper airway resistancein patients with airway narrowing. British Journal of Diseases of the Chest, 70:58–65.
Caselles, V., Kimmel, R., and Sapiro, G. (1997). Geodesic active contours. InternationalJournal of Computer Vision, 22(1):61–79.
Česenek, J., Feistauer, M., Horáček, J., Kučera, V., and Prokopová, J. (2013). Simulationof compressible viscous flow in time-dependent domains. Applied Mathematics andComputation, 219(13):7139–7150.
Chang, H. K. (1989). Respiratory Physiology: An Analytical Approach. Dekker.
Chen, Y., Maksym, G., Brown, T., and Deng, L. (2013). Determination of glottic openingfluctuation by a new method based on nasopharyngoscopy. The Chinese journal ofphysiology, 56(1):52–57.
Cheng, Y.-S., Zhou, Y., and Chen, B. T. (1999). Particle deposition in a cast of humanoral airways. Aerosol Science & Technology, 31(4):286–300.
Childers, D. G., Hicks, D. M., Moore, G. P., Eskenazi, L., and Lalwani, A. L. (1990).Electroglottography and vocal fold physiology. Journal of Speech, Language and hearingresearch, 33(2):245–254.
196 BIBLIOGRAPHY
Childers, D. G., Naik, J. M., Larar, J. N., Krishnamurthy, A. K., and Moore, G. P.(1983). Electroglottography, speech, and ultra-high speed cinematography. Vocal foldphysiology: Biomechanics, acoustics and phonatory control, pages 202–220.
Chisari, N. E., Artana, G., and Sciamarella, D. (2011). Vortex dipolar structures in arigid model of the larynx at flow onset. Experiments in Fluids, 50(2):397–406.
Cisonni, J., Van Hirtum, A., Pelorson, X., and Willems, J. (2008). Theoretical simula-tion and experimental validation of inverse quasi-one-dimensional steady and unsteadyglottal flow models. The Journal of the Acoustical Society of America, 124(1):535–545.
Coates, A. L. and Ho, S. L. (1998). Drug administration by jet nebulization. PediatricPulmonology, 26(6):412–423.
Cohen, B. S. and Asgharian, B. (1990). Deposition of ultrafine particles in the upperairways: An empirical analysis. Journal of Aerosol Science, 21(6):789–797.
Cohen, B. S., Xiong, J. Q., Fang, C. P., and Li, W. (1998). Deposition of charged particleson lung airways. Health Physics, 74(5):554–560.
Conway, J., Fleming, J., Majoral, C., Katz, I., Perchet, D., Peebles, C., Tossici-Bolt,L., Collier, L., Caillibotte, G., Pichelin, M., Sauret-Jackson, V., Martonen, T., Apiou-Sbirlea, G., Muellinger, B., Kroneberg, P., Gleske, J., Scheuch, G., Texereau, J., Martin,A., Montesantos, S., and Bennett, M. (2012). Controlled, parametric, individualized,2-D and 3-D imaging measurements of aerosol deposition in the respiratory tract ofhealthy human subjects for model validation. Journal of Aerosol Science, 52:1–17.
Cotes, J. E., Chinn, D. J., and Miller, M. R. (2009). Lung Function: Physiology, Mea-surement and Application in Medicine. John Wiley & Sons.
Crowe, C. T., Schwarzkopf, J. D., Sommerfeld, M., and Tsuji, Y. (2011). MultiphaseFlows with Droplets and Particles, Second Edition. CRC Press.
Cui, X. G. and Gutheil, E. (2011). Large eddy simulation of the unsteady flow-field in anidealized human mouth-throat configuration. Journal of Biomechanics, 44(16):2768–2774.
Darquenne, C. (2012). Aerosol deposition in health and disease. Journal of AerosolMedicine and Pulmonary Drug Delivery, 25(3):140–147.
Darquenne, C. and Prisk, G. K. (2004). Aerosol deposition in the human respiratory tractbreathing air and 80:20 heliox. Journal of Aerosol Medicine, 17(3):278–285.
Darquenne, C., van Ertbruggen, C., and Prisk, G. K. (2011). Convective flow dominatesaerosol delivery to the lung segments. Journal of Applied Physiology, 111(1):48–54.
Decker, G. Z. and Thomson, S. L. (2007). Computational simulations of vocal fold vibra-tion: Bernoulli versus Navier-Stokes. Journal of Voice, 21(3):273–284.
Dekker, E. (1961). Transition between laminar and turbulent flow in human trachea.Journal of Applied Physiology, 16(6):1060–1064.

BIBLIOGRAPHY 197
Deverge, M., Pelorson, X., Vilain, C., Lagrée, P.-Y., Chentouf, F., Willems, J., andHirschberg, A. (2003). Influence of collision on the flow through in-vitro rigid modelsof the vocal folds. The Journal of the Acoustical Society of America, 114(6):3354–3362.
Dockery, D. W. and Pope, C. A. (1994). Acute respiratory effects of particulate airpollution. Annual Review of Public Health, 15(1):107–132.
Dollinger, M., Kobler, J., A. Berry, D., D. Mehta, D., Luegmair, G., and Bohr, C. (2011).Experiments on analysing voice production: Excised (human, animal) and in vivo (an-imal) approaches. Current Bioinformatics, 6(3):286–304.
Donea, J., Huerta, A., Ponthot, J.-P., and Rodríguez-Ferran, A. (2004). ArbitraryLagrangian-Eulerian methods. Encyclopedia of computational mechanics.
Drechsel, J. S. and Thomson, S. L. (2008). Influence of supraglottal structures on theglottal jet exiting a two-layer synthetic, self-oscillating vocal fold model. The Journalof the Acoustical Society of America, 123(6):4434–4445.
D’Urzo, A. D., Rubinstein, I., Lawson, V. G., Vassal, K. P., Rebuck, A. S., Slutsky, A. S.,and Hoffstein, V. (1988). Comparison of glottic areas measured by acoustic reflectionsvs. computerized tomography. Journal of Applied Physiology, 64(1):367–370.
Eckel, H. E. and Sittel, C. (1995). Morphometry of the larynx in horizontal sections.American journal of otolaryngology, 16(1):40–48.
Elcner, J., Jedelský, J., Lízal, F., and Jícha, M. (2013). Velocity profiles in idealized modelof human respiratory tract. EPJ Web of Conferences, 45:01025.
England, S. J. and Bartlett, Jr, D. (1982). Changes in respiratory movements of thehuman vocal cords during hyperpnea. Journal of Applied Physiology, 52(3):780–785.
England, S. J., Bartlett, J. D., and Daubenspeck, J. A. (1982). Influence of human vocalcord movements on airflow and resistance during eupnea. Journal of Applied Physiology,52(3):773–779.
Faber, C. E. and Grymer, L. (2003). Available techniques for objective assessment ofupper airway narrowing in snoring and sleep apnea. Sleep & Breathing, 7(2):77–86.
Fahd, G. (2012). Création d’une chaine de référence pour la mesure de la pressionartérielle. Aix Marseille Université. Doctoral thesis.
Ferziger, J. H. and Peric, M. (2001). Computational Methods for Fluid Dynamics. SpringerBerlin Heidelberg.
Finlay, W. H. (2001). The Mechanics of Inhaled Pharmaceutical Aerosols. AcademicPress, London.
Fleming, J., Conway, J., Majoral, C., Tossici-Bolt, L., Katz, I., Caillibotte, G., Perchet,D., Pichelin, M., Muellinger, B., Martonen, T., Kroneberg, P., and Apiou-Sbirlea, G.(2011). The use of combined single photon emission computed tomography and x-raycomputed tomography to assess the fate of inhaled aerosol. Journal of Aerosol Medicineand Pulmonary Drug Delivery, 24(1):49–60.
198 BIBLIOGRAPHY
Fourcin, A. J. and Abberton, E. (1971). First applications of a new laryngograph. Medical& biological illustration, 21(3):172–182.
Friedrich, G. and Lichtenegger, R. (1997). Surgical anatomy of the larynx. Journal ofVoice, 11(3):345–355.
Gemci, T., Corcoran, T. E., and Chigier, N. (2000). Dispersion and deposition of in-halation therapy sprays in the larynx and trachea using experimental and numericalmethods. In Eighth International Conference on Liquid Atomization and Spray Sys-tems, Pasadena, CA.
Gemci, T., Shortall, B., Allen, G. M., Corcoran, T. E., and Chigier, N. (2003). A CFDstudy of the throat during aerosol drug delivery using heliox and air. Journal of AerosolScience, 34(9):1175–1192.
Ghio, A. and Teston, B. (2004). Evaluation of the acoustic and aerodynamic constraintsof a pneumotachograph for speech and voice studies. In Proceedings of internationalconference on voice physiology and biomechanics, pages 55–58.
Golshahi, L., Noga, M. L., Vehring, R., and Finlay, W. H. (2013). An in vitro studyon the deposition of micrometer-sized particles in the extrathoracic airways of adultsduring tidal oral breathing. Annals of Biomedical Engineering, 41(5):979–989.
Grgic, B., Finlay, W. H., Burnell, P. K. P., and Heenan, A. F. (2004a). In vitro intersubjectand intrasubject deposition measurements in realistic mouth-throat geometries. Journalof Aerosol Science, 35(8):1025–1040.
Grgic, B., Finlay, W. H., and Heenan, A. F. (2004b). Regional aerosol deposition and flowmeasurements in an idealized mouth and throat. Journal of Aerosol Science, 35(1):21–32.
Grgic, B., Martin, A. R., and Finlay, W. H. (2006). The effect of unsteady flow rateincrease on in vitro mouth-throat deposition of inhaled boluses. Journal of AerosolScience, 37(10):1222–1233.
Grim, M. and Druga, R. (2002). Základy anatomie: Trávici, dýchací, močopohlavní aendokrinní systém. 3. Galén.
Guyton, A. C. and Hall, J. E. (2003). Précis de physiologie médicale. Piccin, Padoue, 2edition.
Hankinson, J. L. and Viola, J. O. (1983). Dynamic BTPS correction factors for spirometricdata. Journal of Applied Physiology, 55(4):1354–1360.
Hansen, J. T. and Koeppen, B. M. (2002). Netter’s Atlas of Human Physiology. IconLearning Systems.
Heenan, A. F., Finlay, W. H., Grgic, B., Pollard, A., and Burnell, P. K. P. (2004). Aninvestigation of the relationship between the flow field and regional deposition in realisticextra-thoracic airways. Journal of aerosol science, 35(8):1013–1023.
BIBLIOGRAPHY 199
Heenan, A. F., Matida, E., Pollard, A., and Finlay, W. H. (2003). Experimental measure-ments and computational modeling of the flow field in an idealized human oropharynx.Experiments in Fluids, 35(1):70–84.
Henrich, N. B. (2006). Mirroring the voice from Garcia to the present day: some insightsinto singing voice registers. Logopedics, Phoniatrics, Vocology, 31(1):3–14.
Hess, M. M. and Ludwigs, M. (2000). Strobophotoglottographic transillumination as amethod for the analysis of vocal fold vibration patterns. Journal of Voice, 14(2):255–271.
Heyder, J. and Svartengren, M. U. (2001). Basic principles of particle behavior in thehuman respiratory tract. In Drug Delivery to the Lung, Lung Biology in Health andDisease, pages 21–45. CRC Press.
Higenbottam, T. (1980). Narrowing of glottis opening in humans associated with experi-mentally induced bronchoconstriction. Journal of Applied Physiology, 49(3):403–407.
Hinds, W. C. (1999). Aerosol Technology: Properties, Behavior, and Measurement ofAirborne Particles. John Wiley & Sons.
Hinze, J. O. (1975). Turbulence. McGraw-Hill.
Hofmans, G. C. J., Groot, G., Ranucci, M., Graziani, G., and Hirschberg, A. (2003).Unsteady flow through in-vitro models of the glottis. The Journal of the AcousticalSociety of America, 113(3):1658–1675.
Hoh, J. F. Y. (2005). Laryngeal muscle fibre types. Acta Physiologica Scandinavica,183(2):133–149.
Hoh, J. F. Y. (2010). Chapter 2.1 - laryngeal muscles as highly specialized organs inairway protection, respiration and phonation. In Stefan M. Brudzynski, editor, Hand-book of Behavioral Neuroscience, volume 19 of Handbook of Mammalian VocalizationAn Integrative Neuroscience Approach, pages 13–21. Elsevier.
Holmes, P., Lumley, J. L., and Berkooz, G. (1998). Turbulence, coherent structures,dynamical systems and symmetry. Cambridge university press.
Honda, K. and Maeda, S. (2008). Glottal-opening and airflow pattern during productionof voiceless fricatives: a new non-invasive instrumentation. The Journal of the AcousticalSociety of America, 123(5):3738.
Hooper, F. H. (1885). The respiratory function of the human larynx. New York MedicalJournal, pages 2–8.
Huang, J., Sun, H., Liu, C., and Zhang, L. (2013). Moving boundary simulation ofairflow and micro-particle deposition in the human extra-thoracic airway under steadyinspiration. part i: Airflow. European Journal of Mechanics - B/Fluids, 37:29–41.
Hundertmark-Zaušková, A., Lehmann, R., Hess, M., and Müller, F. (2013). Numericalsimulation of glottal flow. Computers in biology and medicine, 43(12):2177–2185.
200 BIBLIOGRAPHY
Hurbis, C. G. and Schild, J. A. (1991). Laryngeal changes during exercise and exercise-induced asthma. The Annals of otology, rhinology, and laryngology, 100(1):34–37.
Hyatt, R. E. and Wilcox, R. E. (1961). Extrathoracic airway resistance in man. Journalof Applied Physiology, 16(2):326–330.
Idel’cik, I. and Meury, M. (1978). Mémento des pertes de charge coefficients de pertes decharge singulières et de pertes de charge par frottement. Eyrolles, Paris.
Iheme, L. O. (2011). Frequency domain bandpass filtering for image processing. Tech-nical report, Eastern Mediterranean University, Electrical and Electronic EngineeringDepartment. Available at http://fr.scribd.com/.
Insalaco, G., Kuna, S. T., Cibella, F., and Villeponteaux, R. D. (1990). Thyroarytenoidmuscle activity during hypoxia, hypercapnia, and voluntary hyperventilation in humans.Journal of Applied Physiology, 69(1):268–273.
Isabey, D. and Chang, H. K. (1981). Steady and unsteady pressure-flow relationships incentral airways. Journal of Applied Physiology, 51(5):1338–1348.
Isabey, D. and Chang, H. K. (1982). A model study of flow dynamics in human centralairways. part II: secondary flow velocities. Respiration Physiology, 49(1):97–113.
Isabey, D., Chang, H. K., Delpuech, C., Harf, A., and Hatzfeld, C. (1986). Dependenceof central airway resistance on frequency and tidal volume: a model study. Journal ofApplied Physiology, 61(1):113–126.
Ishizaka, K. and Flanagan, J. L. (1972). Synthesis of voiced sounds from a two-massmodel of the vocal cords. Bell system technical journal, 51(6):1233–1268.
Issa, R. I. (1986). Solution of the implicitly discretised fluid flow equations by operator-splitting. Journal of Computational Physics, 62(1):40–65.
Jackson, A. C., Gulesian, Jr, P. J., and Mead, J. (1975). Glottal aperture during pantingwith voluntary limitation of tidal volume. Journal of Applied Physiology, 39(5):834–836.
Jain, S., Bandi, V., Officer, T., Wolley, M., and Guntupalli, K. K. (2006). Role of vocalcord function and dysfunction in patients presenting with symptoms of acute asthmaexacerbation. Journal of Asthma, 43(3):207–212.
Jayaraju, S., Brouns, M., Verbanck, S., and Lacor, C. (2007). Fluid flow and particledeposition analysis in a realistic extrathoracic airway model using unstructured grids.Journal of Aerosol Science, 38(5):494–508.
Jedelský, J., Lízal, F., and Jícha, M. (2012). Characteristics of turbulent particle transportin human airways under steady and cyclic flows. International Journal of Heat and FluidFlow, 35:84–92.
Jin, H. H., Fan, J. R., Zeng, M. J., and Cen, K. F. (2007). Large eddy simulationof inhaled particle deposition within the human upper respiratory tract. Journal ofAerosol Science, 38(3):257–268.
BIBLIOGRAPHY 201
John, W. (2011). Size distribution characteristics of aerosols. In Kulkarni, P., Baron,P. A., and Willeke, K., editors, Aerosol Measurement, pages 41–54. John Wiley & Sons,Inc.
Juroszek, B. (2006). Air features in spirometric transducers. Measurement, 39(5):466–476.
Karakozoglou, S.-Z., Henrich, N., d’Alessandro, C., and Stylianou, Y. (2012). Automaticglottal segmentation using local-based active contours and application to glottovibrog-raphy. Speech Communication, 54(5):641–654.
Karnell, M. P. (1989). Synchronized videostroboscopy and electroglottography. Journalof Voice, 3(1):68–75.
Katz, I., Pichelin, M., Montesantos, S., Majoral, C., Martin, A., Conway, J., Fleming,J., Venegas, J., Greenblatt, E., and Caillibotte, G. (2014). Using helium-oxygen toimprove regional deposition of inhaled particles: mechanical principles. Journal ofAerosol Medicine and Pulmonary Drug Delivery, 27(2):71–80.
Katz, I. M., Davis, B. M., and Martonen, T. B. (1999). A numerical study of particlemotion within the human larynx and trachea. Journal of Aerosol Science, 30(2):173–183.
Katz, I. M. and Martonen, T. B. (1996). Flow patterns in three-dimensional laryngealmodels. Journal of Aerosol Medicine, 9(4):501–511.
Katz, I. M., Martonen, T. B., and Flaa, W. (1997). Three-dimensional computationalstudy of inspiratory aerosol flow through the larynx: the effect of glottal aperturemodulation. Journal of Aerosol Science, 28(6):1073–1083.
Khilnani, G. C. and Banga, A. (2008). Noninvasive ventilation in patients with chronicobstructive airway disease. International Journal of Chronic Obstructive PulmonaryDisease, 3(3):351–357.
Kleinstreuer, C. and Zhang, Z. (2003). Laminar-to-turbulent fluid-particle flows in ahuman airway model. International Journal of Multiphase Flow, 29(2):271–289.
Kleinstreuer, C. and Zhang, Z. (2010). Airflow and particle transport in the humanrespiratory system. Annual Review of Fluid Mechanics, 42:301–334.
Kniesburges, S., Thomson, S. L., Barney, A., Triep, M., Šidlof, P., Horáček, J., Brücker,C., and Becker, S. (2011). In vitro experimental investigation of voice production.Current Bioinformatics, 6(3):305–322.
Kobler, J. B., Rosen, D. I., Burns, J. A., Akst, L. M., Broadhurst, M. S., Zeitels, S. M.,and Hillman, R. E. (2006). Comparison of a flexible laryngoscope with calibrated siz-ing function to intraoperative measurements. The Annals of otology, rhinology, andlaryngology, 115(10):733–740.
Kovářová, E. and Ždímal, V. (2009). Deposition of inhalants in the human respiratorytract. In Proceedings of the 10th Annual Conference of the Czech Aerosol Society, pages59–60, Čejkovice, Czech Republic. Czech Aerosol Society. ISBN: 978-80-86186-20-7.
202 BIBLIOGRAPHY
Krebs, F., Silva, F., Sciamarella, D., and Artana, G. (2012). A three-dimensional studyof the glottal jet. Experiments in Fluids, 52(5):1133–1147.
Kucinschi, B. R., Scherer, R. C., DeWitt, K. J., and Ng, T. T. (2006). An experimentalanalysis of the pressures and flows within a driven mechanical model of phonation. TheJournal of the Acoustical Society of America, 119(5):3011–3021.
Kuna, S. T., Insalaco, G., and Villeponteaux, R. D. (1991). Arytenoideus muscle activityin normal adult humans during wakefulness and sleep. Journal of Applied Physiology,70(4):1655–1664.
Launder, B. E. and Spalding, D. B. (1974). The numerical computation of turbulentflows. Computer Methods in Applied Mechanics and Engineering, 3(2):269–289.
Lin, C.-L., Tawhai, M. H., McLennan, G., and Hoffman, E. A. (2007). Characteristics ofthe turbulent laryngeal jet and its effect on airflow in the human intra-thoracic airways.Respiratory Physiology & Neurobiology, 157(2-3):295–309.
Lin, T.-C., Breysse, P. N., Laube, B. L., and Swift, D. L. (2001). Mouthpiece diameteraffects deposition efficiency in cast models of the human oral airways. Journal of AerosolMedicine, 14(3):335–341.
Liu, A. B., Mather, D., and Reitz, R. D. (1993). Modeling the effects of drop drag andbreakup on fuel sprays. SAE Technical Paper 930072, SAE International, Warrendale,PA.
Lízal, F., Jedelský, J., Adam, J., Bělka, M., and Jícha, M. (2013). Application of positronemission tomography to aerosol transport research in a model of human lungs. EPJWeb of Conferences, 45:01060.
Longest, P. W. and Hindle, M. (2011). Numerical model to characterize the size increaseof combination drug and hygroscopic excipient nanoparticle aerosols. Aerosol Scienceand Technology, 45(7):884–899.
Lumley, J. (1967). The structure of inhomogeneous turbulent flows. In Yaglom, A. andTatarski, V., editors, Atmospheric turbulence and radio propagation, pages 166–178.Nauka.
Luo, H., Mittal, R., and Bielamowicz, S. A. (2009). Analysis of flow-structure interactionin the larynx during phonation using an immersed-boundary method. The Journal ofthe Acoustical Society of America, 126(2):816–824.
Martin, S. E., Mathur, R., Marshall, I., and Douglas, N. J. (1997). The effect of age, sex,obesity and posture on upper airway size. European Respiratory Journal, 10(9):2087–2090.
Martonen, T. B. and Katz, I. M. (1993). Deposition patterns of aerosolized drugs withinhuman lungs: effects of ventilatory parameters. Pharmaceutical research, 10(6):871–878.
Martonen, T. B. and Musante, C. J. (2000). Importance of cloud motion on cigarettesmoke deposition in lung airways. Inhalation Toxicology, 12 Suppl 4:261–280.
BIBLIOGRAPHY 203
Martonen, T. B., Musante, C. J., Segal, R. A., Schroeter, J. D., Hwang, D., Dolovich,M. A., Burton, R., Spencer, R. M., and Fleming, J. S. (2000). Lung models: strengthsand limitations. Respiratory Care, 45(6):712–736.
Matida, E. A., Finlay, W. H., Breuer, M., and Lange, C. F. (2006). Improving predictionof aerosol deposition in an idealized mouth using large-eddy simulation. Journal ofaerosol medicine, 19(3):290–300.
Menon, A. S., Weber, M. E., and Chang, H. K. (1985). Effect of the larynx on oscillatoryflow in the central airways: a model study. Journal of Applied Physiology, 59(1):160–169.
Menter, F. (1993). Zonal two equation k − ω turbulence models for aerodynamic flows.In 23rd Fluid Dynamics, Plasmadynamics, and Lasers Conference. American Instituteof Aeronautics and Astronautics.
Menter, F. R., Kuntz, M., and Langtry, R. (2003). Ten years of industrial experience withthe SST turbulence model. Turbulence, heat and mass transfer, 4:625–632.
Miller, M. R., Hankinson, J., Brusasco, V., Burgos, F., Casaburi, R., Coates, A., Crapo,R., Enright, P., van der Grinten, C. P. M., Gustafsson, P., Jensen, R., Johnson, D. C.,MacIntyre, N., McKay, R., Navajas, D., Pedersen, O. F., Pellegrino, R., Viegi, G.,Wanger, J., and ATS/ERS Task Force (2005). Standardisation of spirometry. TheEuropean Respiratory Journal, 26(2):319–338.
Miyawaki, S., Tawhai, M. H., Hoffman, E. A., and Lin, C.-L. (2012). Effect of carriergas properties on aerosol distribution in a CT-based human airway numerical model.Annals of Biomedical Engineering, 40(7):1495–1507.
Mongeau, L., Franchek, N., Coker, C. H., and Kubli, R. A. (1997). Characteristics of apulsating jet through a small modulated orifice, with application to voice production.The Journal of the Acoustical Society of America, 102(2):1121–1133.
Nithiarasu, P., Hassan, O., Morgan, K., Weatherill, N. P., Fielder, C., Whittet, H., Ebden,P., and Lewis, K. R. (2008). Steady flow through a realistic human upper airwaygeometry. International Journal for Numerical Methods in Fluids, 57(5):631–651.
Nomura, H. and Funada, T. (2007). Sound generation by unsteady flow ejecting from thevibrating glottis based on a distributed parameter model of the vocal cords. Acousticalscience and technology, 28(6):392–402.
Olesik, J. W. and Bates, L. C. (1995). Characterization of aerosols produced by pneumaticnebulizers for inductively coupled plasma sample introduction: effect of liquid and gasflow rates on volume based drop size distributions. Spectrochimica Acta Part B: AtomicSpectroscopy, 50(4-7):285–303.
Olson, D. E., Sudlow, M. F., Horsfield, K., and Filley, G. F. (1973). Convective patternsof flow during inspiration. Archives of Internal Medicine, 131(1):51–57.
Orlikoff, R. F. (1998). Scrambled EGG: The uses and abuses of electroglottography.Phonoscope, 1:37–53.
204 BIBLIOGRAPHY
Ouaknine, M., Fernandes, M., and Giovanni, A. (2000). Visualisation des mouvementsvibratoires des cordes vocales en condition d’asymétrie. Revue de laryngologie, d’otologieet de rhinologie, 121(5):297–300.
Ounis, H., Ahmadi, G., and McLaughlin, J. B. (1991). Brownian diffusion of submi-crometer particles in the viscous sublayer. Journal of Colloid and Interface Science,143(1):266–277.
Painter, R. and Cunningham, D. J. (1992). Analyses of human respiratory flow patterns.Respiration Physiology, 87(3):293–307.
Pastur, L. R., Lusseyran, F., Fraigneau, Y., and Podvin, B. (2005). Determining thespectral signature of spatial coherent structures in an open cavity flow. Physical ReviewE, 72(6).
Payne, J., Higenbottam, T., and Guindi, G. (1981). Respiratory activity of the vocalcords in normal subjects and patients with airflow obstruction: an electromyographicstudy. Clinical Science, 61(2):163–167.
Pedley, T. J. (1977). Pulmonary fluid dynamics. Annual Review of Fluid Mechanics,9(1):229–274.
Pelorson, X., Hirschberg, A., Van Hassel, R. R., Wijnands, A. P. J., and Auregan, Y.(1994). Theoretical and experimental study of quasisteady-flow separation within theglottis during phonation. Application to a modified two-mass model. The Journal ofthe Acoustical Society of America, 96(6):3416–3431.
Peterson, J. B., Prisk, G. K., and Darquenne, C. (2008). Aerosol deposition in thehuman lung periphery is increased by reduced-density gas breathing. Journal of AerosolMedicine and Pulmonary Drug Delivery, 21(2):159–168.
Pickup, B. A. and Thomson, S. L. (2010). Flow-induced vibratory response of idealizedversus magnetic resonance imaging-based synthetic vocal fold models. Journal of theAcoustical Society of America, 128(3):EL124–EL129.
Plant, R. L. and Hillel, A. D. (1998). Direct measurement of subglottic pressure andlaryngeal resistance in normal subjects and in spasmodic dysphonia. Journal of Voice,12(3):300–314.
Pope, C. A., Bates, D. V., and Raizenne, M. E. (1995). Health effects of particulate airpollution: time for reassessment? Environmental Health Perspectives, 103(5):472–480.
Pritchard, S. E. and McRobbie, D. W. (2004). Studies of the human oropharyngealairspaces using magnetic resonance imaging. II. the use of three-dimensional gated MRIto determine the influence of mouthpiece diameter and resistance of inhalation deviceson the oropharyngeal airspace geometry. Journal of Aerosol Medicine, 17(4):310–324.
Proctor, D. F. and Hardy, J. B. (1949). Studies of respiratory air flow; significance of thenormal pneumotachogram. Bulletin of the Johns Hopkins Hospital, 85(4):253–280.

BIBLIOGRAPHY 205
Pui, D. Y. H., Romay-Novas, F., and Liu, B. Y. H. (1987). Experimental study of particledeposition in bends of circular cross section. Aerosol Science and Technology, 7(3):301–315.
Rattenborg, C. (1961). Laryngeal regulation of respiration. Acta Anaesthesiologica Scan-dinavica, 5(3):129–140.
Renotte, C., Bouffioux, V., and Wilquem, F. (2000). Numerical 3D analysis of oscillatoryflow in the time-varying laryngeal channel. Journal of Biomechanics, 33(12):1637–1644.
Rodarte, J. R. and Rehder, K. (1986). Dynamics of respiration. In Terjung, R., editor,Comprehensive Physiology. John Wiley & Sons, Inc., Hoboken, NJ, USA.
Rogers, K. (2011). The Respiratory System. The Rosen Publishing Group.
Rosa, M. O., Pereira, J. C., Grellet, M., and Alwan, A. (2003). A contribution to simu-lating a three-dimensional larynx model using the finite element method. The Journalof the Acoustical Society of America, 114(5):2893–2905.
Roth, A. P., Lange, C. F., and Finlay, W. H. (2003). The effect of breathing pattern onnebulizer drug delivery. Journal of Aerosol Medicine, 16(3):325–339.
Rothenberg, M. (1992). A multichannel electroglottograph. Journal of Voice, 6(1):36–43.
Roux, E. (2002). Origine et évolution de l’appareil respiratoire aérien des vertébrés. Revuedes maladies respiratoires, 19(5):601–615.
Rubinstein, I., England, S. J., Zamel, N., and Hoffstein, V. (1989). Glottic dimensions inhealthy men and women. Respiration physiology, 77(3):291–299.
Ruty, N., Pelorson, X., Van Hirtum, A., Lopez-Arteaga, I., and Hirschberg, A. (2007). Anin vitro setup to test the relevance and the accuracy of low-order vocal folds models.The Journal of the Acoustical Society of America, 121(1):479–490.
Ruzer, L. S. and Harley, N. H. (2005). Aerosols Handbook: Measurement, Dosimetry, andHealth Effects. CRC Press.
Sammon, M., Romaniuk, J. R., and Bruce, E. N. (1993). Role of deflation-sensitivefeedback in control of end-expiratory volume in rats. Journal of Applied Physiology,75(2):902–911.
Sandeau, J. (2010). Transport et Dépôt des Particules d’Aérosols Médicaments: Modéli-sation Physique et Résolution Numérique dans les Voies Respiratoires ExtrathoraciquesHumaines. Editions universitaires européennes EUE. Doctoral thesis.
Sandeau, J., Katz, I., Fodil, R., Louis, B., Apiou-Sbirlea, G., Caillibotte, G., and Is-abey, D. (2010). CFD simulation of particle deposition in a reconstructed human oralextrathoracic airway for air and helium-oxygen mixtures. Journal of Aerosol Science,41(3):281–294.
Sanders, M. (2007). Inhalation therapy: an historical review. Primary Care RespiratoryJournal, 16(2):71–81.
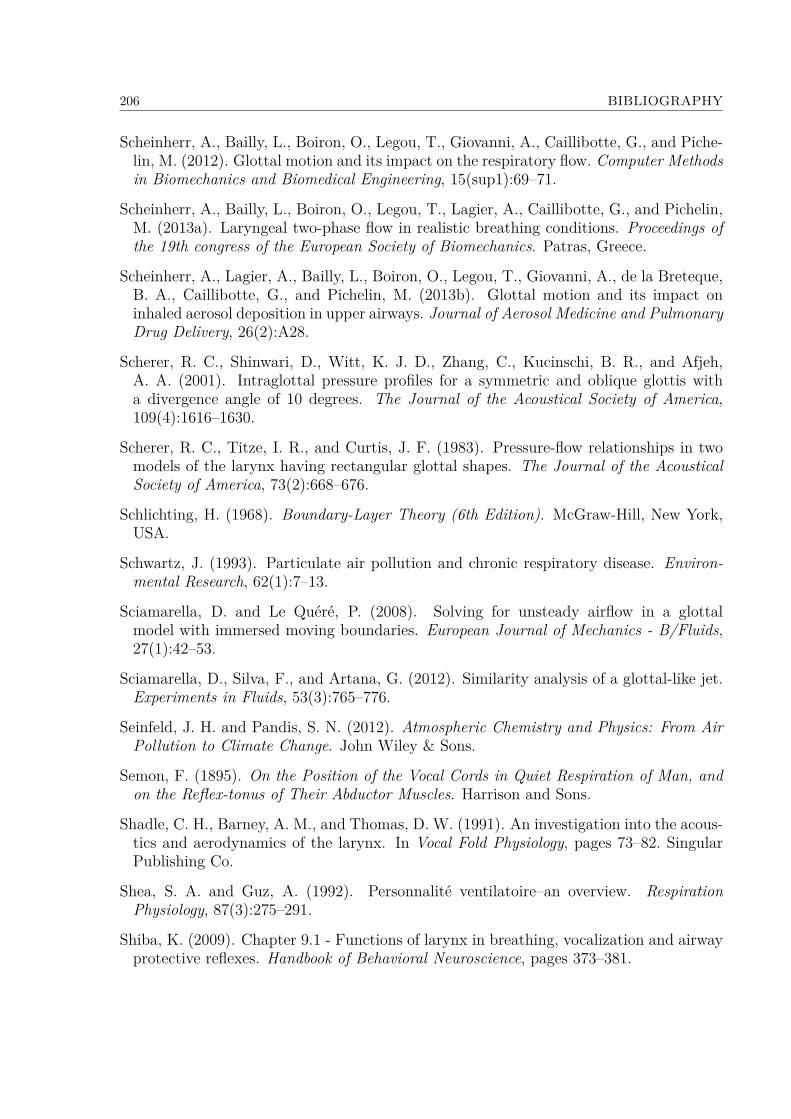
206 BIBLIOGRAPHY
Scheinherr, A., Bailly, L., Boiron, O., Legou, T., Giovanni, A., Caillibotte, G., and Piche-lin, M. (2012). Glottal motion and its impact on the respiratory flow. Computer Methodsin Biomechanics and Biomedical Engineering, 15(sup1):69–71.
Scheinherr, A., Bailly, L., Boiron, O., Legou, T., Lagier, A., Caillibotte, G., and Pichelin,M. (2013a). Laryngeal two-phase flow in realistic breathing conditions. Proceedings ofthe 19th congress of the European Society of Biomechanics. Patras, Greece.
Scheinherr, A., Lagier, A., Bailly, L., Boiron, O., Legou, T., Giovanni, A., de la Breteque,B. A., Caillibotte, G., and Pichelin, M. (2013b). Glottal motion and its impact oninhaled aerosol deposition in upper airways. Journal of Aerosol Medicine and PulmonaryDrug Delivery, 26(2):A28.
Scherer, R. C., Shinwari, D., Witt, K. J. D., Zhang, C., Kucinschi, B. R., and Afjeh,A. A. (2001). Intraglottal pressure profiles for a symmetric and oblique glottis witha divergence angle of 10 degrees. The Journal of the Acoustical Society of America,109(4):1616–1630.
Scherer, R. C., Titze, I. R., and Curtis, J. F. (1983). Pressure-flow relationships in twomodels of the larynx having rectangular glottal shapes. The Journal of the AcousticalSociety of America, 73(2):668–676.
Schlichting, H. (1968). Boundary-Layer Theory (6th Edition). McGraw-Hill, New York,USA.
Schwartz, J. (1993). Particulate air pollution and chronic respiratory disease. Environ-mental Research, 62(1):7–13.
Sciamarella, D. and Le Quéré, P. (2008). Solving for unsteady airflow in a glottalmodel with immersed moving boundaries. European Journal of Mechanics - B/Fluids,27(1):42–53.
Sciamarella, D., Silva, F., and Artana, G. (2012). Similarity analysis of a glottal-like jet.Experiments in Fluids, 53(3):765–776.
Seinfeld, J. H. and Pandis, S. N. (2012). Atmospheric Chemistry and Physics: From AirPollution to Climate Change. John Wiley & Sons.
Semon, F. (1895). On the Position of the Vocal Cords in Quiet Respiration of Man, andon the Reflex-tonus of Their Abductor Muscles. Harrison and Sons.
Shadle, C. H., Barney, A. M., and Thomas, D. W. (1991). An investigation into the acous-tics and aerodynamics of the larynx. In Vocal Fold Physiology, pages 73–82. SingularPublishing Co.
Shea, S. A. and Guz, A. (1992). Personnalité ventilatoire–an overview. RespirationPhysiology, 87(3):275–291.
Shiba, K. (2009). Chapter 9.1 - Functions of larynx in breathing, vocalization and airwayprotective reflexes. Handbook of Behavioral Neuroscience, pages 373–381.

BIBLIOGRAPHY 207
Shinneeb, A.-M. and Pollard, A. (2012). Investigation of the flow physics in the humanpharynx/larynx region. Experiments in Fluids, 53(4):989–1003.
Šidlof, P., Doaré, O., Cadot, O., and Chaigne, A. (2011). Measurement of flow separationin a human vocal folds model. Experiments in Fluids, 51(1):123–136.
Šidlof, P., Švec, J. G., Horáček, J., Veselý, J., Klepáček, I., and Havlík, R. (2008). Ge-ometry of human vocal folds and glottal channel for mathematical and biomechanicalmodeling of voice production. Journal of Biomechanics, 41(5):985–995.
Spann, R. W. and Hyatt, R. E. (1971). Factors affecting upper airway resistance inconscious man. Journal of Applied Physiology, 31(5):708–712.
Šrám, R. J., Binková, B., Dostál, M., Merkerová-Dostalová, M., Líbalová, H., Milcová, A.,Rössner, P., Rössnerová, A., Schmuczerová, J., Švecová, V., Topinka, J., and Votavová,H. (2013). Health impact of air pollution to children. International Journal of Hygieneand Environmental Health, 216(5):533–540.
Stahlhofen, W., Rudolf, G., and James, A. (1989). Intercomparison of experimentalregional aerosol deposition data. Journal of Aerosol Medicine, 2(3):285–308.
Stănescu, D. C., Pattijn, J., Clément, J., and van de Woestijne, K. P. (1972). Glottisopening and airway resistance. Journal of Applied Physiology, 32(4):460–6.
Stapleton, K. W., Guentsch, E., Hoskinson, M. K., and Finlay, W. H. (2000). On thesuitability of k− ε turbulence modeling for aerosol deposition in the mouth and throat:a comparison with experiment. Journal of Aerosol Science, 31(6):739–749.
Steinecke, I. and Herzel, H. (1995). Bifurcations in an asymmetric vocal-fold model. TheJournal of the Acoustical Society of America, 97(3):1874–1884.
Stella, M. H. and England, S. J. (2001). Modulation of laryngeal and respiratory pumpmuscle activities with upper airway pressure and flow. Journal of Applied Physiology,91(2):897–904.
Stocks, J. and Hislop, A. A. (2001). Structure and function of the respiratory system. InDrug Delivery to the Lung, Lung Biology in Health and Disease, pages 47–104. CRCPress.
Story, B. H. and Titze, I. R. (1995). Voice simulation with a body-cover model of thevocal folds. The Journal of the Acoustical Society of America, 97(2):1249–1260.
Švec, J. G., Horáček, J., Šram, F., and Veselý, J. (2000). Resonance properties of the vocalfolds: In vivo laryngoscopic investigation of the externally excited laryngeal vibrations.The Journal of the Acoustical Society of America, 108(4):1397–1407.
Švec, J. G. and Schutte, H. K. (1996). Videokymography: High-speed line scanning ofvocal fold vibration. Journal of Voice, 10(2):201–205.
Švec, J. G., Šram, F., and Schutte, H. K. (1999). Videokymography: A new high-speedmethod for the examination of vocal-fold vibrations. Otorinolaryngologie a foniatrie,48:155–162.

208 BIBLIOGRAPHY
Swift, D. L., Montassier, N., Hopke, P. K., Karpen-Hayes, K., Cheng, Y.-S., Su, Y. F.,Yeh, H. C., and Strong, J. C. (1992). Inspiratory deposition of ultrafine particles inhuman nasal replicate cast. Journal of Aerosol Science, 23(1):65–72.
Taherian, S., Rahai, H. R., and Waddington, T. (2011). CFD modeling and analysis ofpulmonary airways/particles transport and deposition. Proceedings of the 41st AIAAFluid Dynamics Conference and Exhibit.
Tao, C. and Jiang, J. J. (2007). Mechanical stress during phonation in a self-oscillatingfinite-element vocal fold model. Journal of Biomechanics, 40(10):2191–2198.
Templer, J. W., Von Doersten, P. G., Quigley, P. R., Scott, G. C., and Davis, W. E.(1991). Laryngeal airway resistance. the relationships of airflow, pressure, and aperture.Archives of Otolaryngology–Head & Neck Surgery, 117(8):867–870.
Tian, L. and Ahmadi, G. (2007). Particle deposition in turbulent duct flows-comparisonsof different model predictions. Journal of Aerosol Science, 38(4):377–397.
Titze, I. R. (1994). Principles of voice production. Prentice Hall.
Titze, I. R., Schmidt, S. S., and Titze, M. R. (1995). Phonation threshold pressure ina physical model of the vocal fold mucosa. The Journal of the Acoustical Society ofAmerica, 97(5):3080–3084.
Triep, M. and Brücker, C. (2010). Three-dimensional nature of the glottal jet. The Journalof the Acoustical Society of America, 127(3):1537–1547.
Triep, M., Brücker, C., and Schröder, W. (2005). High-speed PIV measurements of theflow downstream of a dynamic mechanical model of the human vocal folds. Experimentsin Fluids, 39(2):232–245.
Utturkar, Y., Zhang, B., and Shyy, W. (2005). Reduced-order description of fluid flowwith moving boundaries by proper orthogonal decomposition. International Journal ofHeat and Fluid Flow, 26(2):276–288.
Vaissière, J., Honda, K., Amelot, A., Maeda, S., and Crevier-Buchman, L. (2010). Multi-sensor platform for speech physiology research in a phonetics laboratory. The Journalof the Phonetic Society of Japan, 14(2):65–78.
Van den Berg, J. W., Zantema, J. T., and Doornenbal Jr, P. (1957). On the air resistanceand the bernoulli effect of the human larynx. The Journal of the Acoustical Society ofAmerica, 29(5):626–631.
Wang, Y., Liu, Y., Sun, X., Yu, S., and Gao, F. (2009). Numerical analysis of respiratoryflow patterns within human upper airway. Acta Mechanica Sinica, 25(6):737–746.
Wells, A. C. and Chamberlain, A. C. (1967). Transport of small particles to verticalsurfaces. British Journal of Applied Physics, 18(12):1793.
West, J. B. (2007). Pulmonary Physiology and Pathophysiology: An Integrated, Case-basedApproach. Lippincott Williams & Wilkins.

BIBLIOGRAPHY 209
West, J. B. (2008). Respiratory Physiology: The Essentials. Lippincott Williams &Wilkins.
Widdicombe, J. G. and Tatar, M. (1988). Upper airway reflex control. Annals of the NewYork Academy of Sciences, 533:252–261.
Wilcox, D. C. (1998). Turbulence Modeling for CFD, volume 2. DCW Industries, Incor-porated.
Wong, D., Ito, M. R., Cox, N. B., and Titze, I. R. (1991). Observation of perturbations ina lumped-element model of the vocal folds with application to some pathological cases.The Journal of the Acoustical Society of America, 89(1):383–394.
Xi, J. and Longest, P. W. (2007). Transport and deposition of micro-aerosols in realisticand simplified models of the oral airway. Annals of Biomedical Engineering, 35(4):560–581.
Xi, J. and Longest, P. W. (2008). Evaluation of a drift flux model for simulating submi-crometer aerosol dynamics in human upper tracheobronchial airways. Annals of biomed-ical engineering, 36(10):1714–1734.
Xi, J., Longest, P. W., and Martonen, T. B. (2008). Effects of the laryngeal jet onnano-and microparticle transport and deposition in an approximate model of the uppertracheobronchial airways. Journal of Applied Physiology, 104(6):1761–1777.
Xi, J., Si, X. A., Kim, J., Mckee, E., and Lin, E.-B. (2014). Exhaled aerosol patterndiscloses lung structural abnormality: A sensitivity study using computational modelingand fractal analysis. PLoS ONE, 9(8):e104682.
Xu, G. B. and Yu, C. P. (1985). Theoretical lung deposition of hygroscopic NaCl aerosols.Aerosol Science and Technology, 4(4):455–461.
Zhang, Z. and Kleinstreuer, C. (2003). Low-reynolds-number turbulent flows in locallyconstricted conduits: A comparison study. AIAA Journal, 41(5):831–840.
Zhang, Z. and Kleinstreuer, C. (2004). Airflow structures and nano-particle deposition ina human upper airway model. Journal of Computational Physics, 198(1):178–210.
Zhang, Z. and Kleinstreuer, C. (2011). Computational analysis of airflow and nanoparticledeposition in a combined nasal-oral-tracheobronchial airway model. Journal of AerosolScience, 42(3):174–194.
Zhang, Z., Kleinstreuer, C., and Kim, C. S. (2002). Micro-particle transport and deposi-tion in a human oral airway model. Journal of Aerosol Science, 33(12):1635–1652.
Zheng, X., Bielamowicz, S., Luo, H., and Mittal, R. (2009). A computational study ofthe effect of false vocal folds on glottal flow and vocal fold vibration during phonation.Annals of Biomedical Engineering, 37(3):625–642.
Zheng, X., Mittal, R., Xue, Q., and Bielamowicz, S. (2011). Direct-numerical simulationof the glottal jet and vocal-fold dynamics in a three-dimensional laryngeal model. TheJournal of the Acoustical Society of America, 130(1):404–415.

210 BIBLIOGRAPHY
Ziethe, A., Patel, R., Kunduk, M., Eysholdt, U., and Graf, S. (2011). Clinical analysismethods of voice disorders. Current Bioinformatics, 6(3):270–285.

Annexes
211

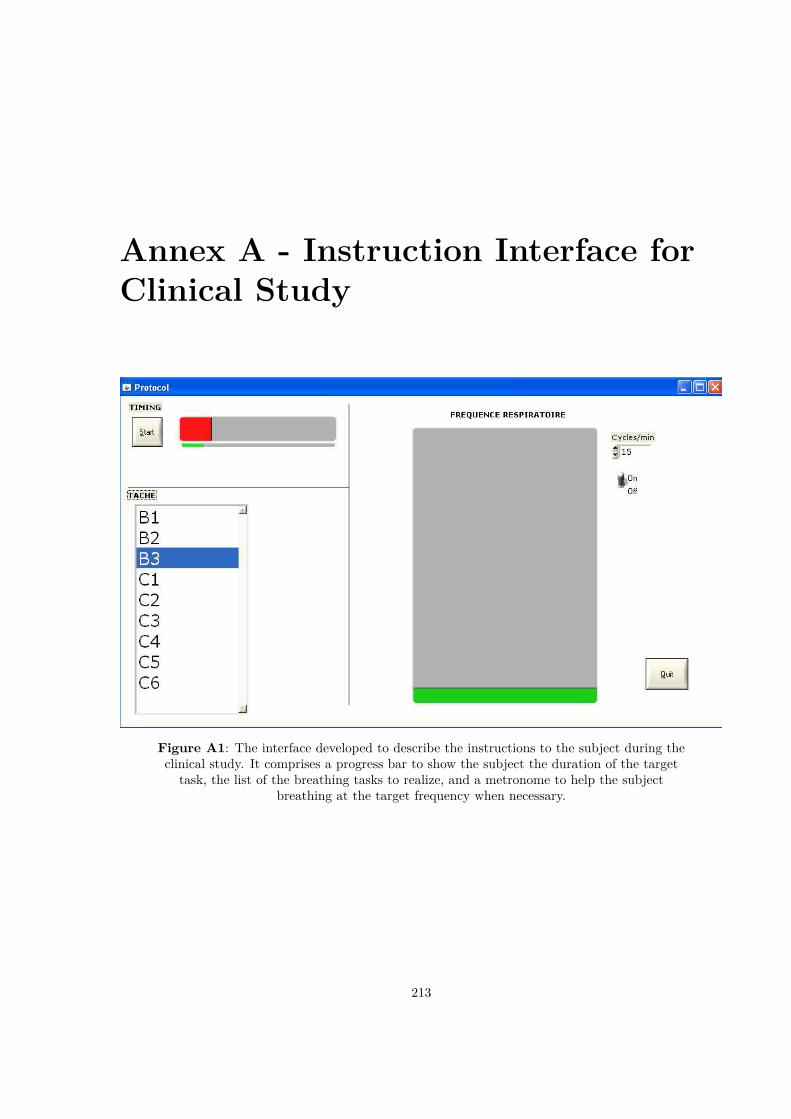
Annex A - Instruction Interface forClinical Study
Figure A1: The interface developed to describe the instructions to the subject during theclinical study. It comprises a progress bar to show the subject the duration of the target
task, the list of the breathing tasks to realize, and a metronome to help the subjectbreathing at the target frequency when necessary.
213

214 ANNEX A - INSTRUCTION INTERFACE FOR CLINICAL STUDY
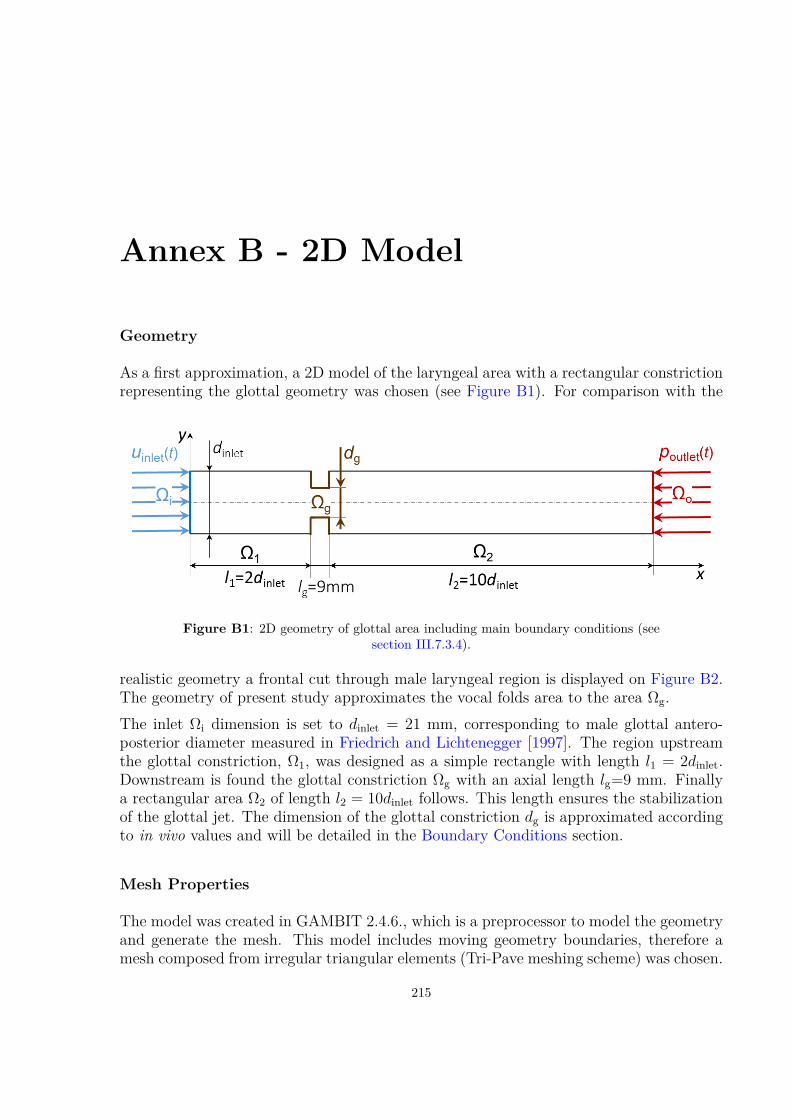
Annex B - 2D Model
Geometry
As a first approximation, a 2D model of the laryngeal area with a rectangular constrictionrepresenting the glottal geometry was chosen (see Figure B1). For comparison with the
Figure B1: 2D geometry of glottal area including main boundary conditions (seesection III.7.3.4).
realistic geometry a frontal cut through male laryngeal region is displayed on Figure B2.The geometry of present study approximates the vocal folds area to the area Ωg.The inlet Ωi dimension is set to dinlet = 21 mm, corresponding to male glottal antero-posterior diameter measured in Friedrich and Lichtenegger [1997]. The region upstreamthe glottal constriction, Ω1, was designed as a simple rectangle with length l1 = 2dinlet.Downstream is found the glottal constriction Ωg with an axial length lg=9 mm. Finallya rectangular area Ω2 of length l2 = 10dinlet follows. This length ensures the stabilizationof the glottal jet. The dimension of the glottal constriction dg is approximated accordingto in vivo values and will be detailed in the Boundary Conditions section.
Mesh Properties
The model was created in GAMBIT 2.4.6., which is a preprocessor to model the geometryand generate the mesh. This model includes moving geometry boundaries, therefore amesh composed from irregular triangular elements (Tri-Pave meshing scheme) was chosen.
215
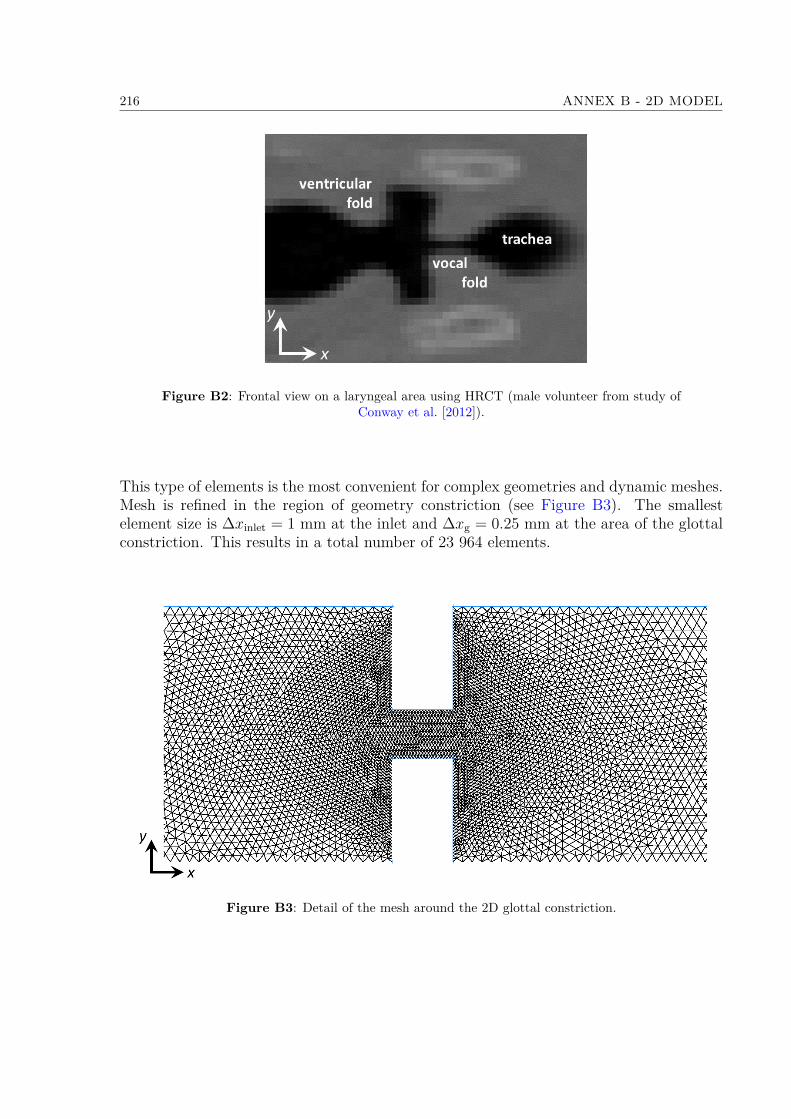
216 ANNEX B - 2D MODEL
Figure B2: Frontal view on a laryngeal area using HRCT (male volunteer from study ofConway et al. [2012]).
This type of elements is the most convenient for complex geometries and dynamic meshes.Mesh is refined in the region of geometry constriction (see Figure B3). The smallestelement size is ∆xinlet = 1 mm at the inlet and ∆xg = 0.25 mm at the area of the glottalconstriction. This results in a total number of 23 964 elements.
Figure B3: Detail of the mesh around the 2D glottal constriction.
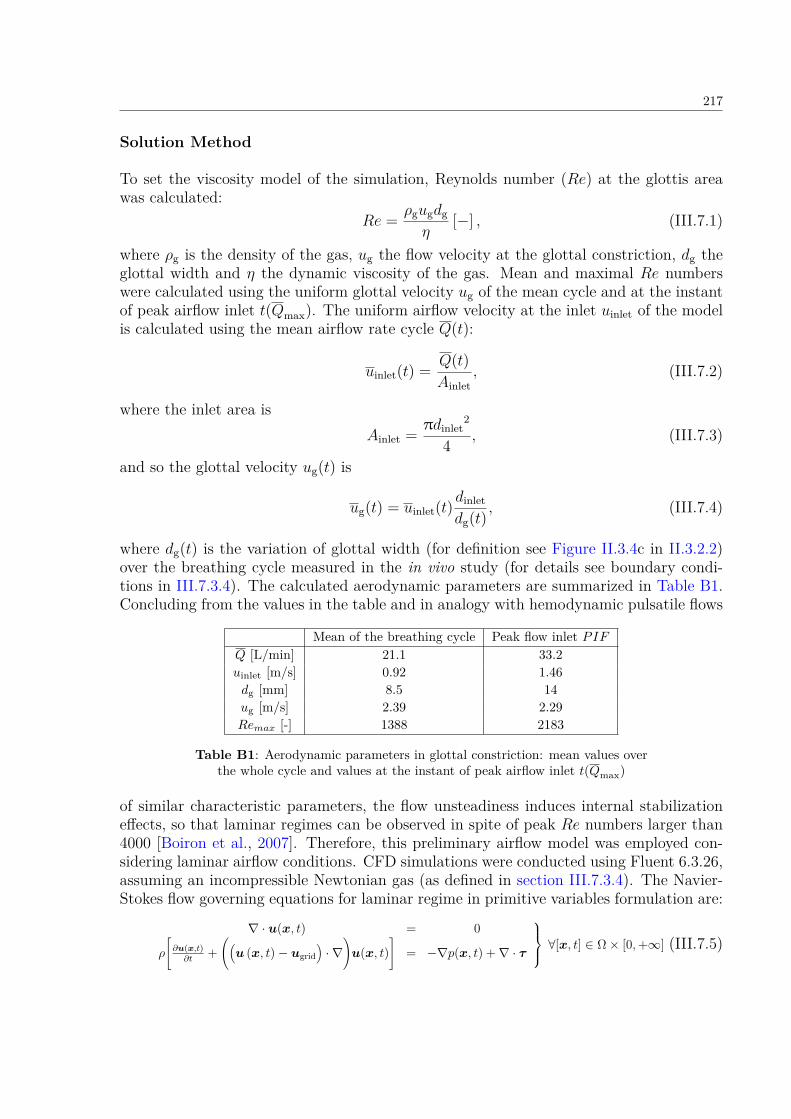
217
Solution Method
To set the viscosity model of the simulation, Reynolds number (Re) at the glottis areawas calculated:
Re = ρgugdg
η[−] , (III.7.1)
where ρg is the density of the gas, ug the flow velocity at the glottal constriction, dg theglottal width and η the dynamic viscosity of the gas. Mean and maximal Re numberswere calculated using the uniform glottal velocity ug of the mean cycle and at the instantof peak airflow inlet t(Qmax). The uniform airflow velocity at the inlet uinlet of the modelis calculated using the mean airflow rate cycle Q(t):
uinlet(t) = Q(t)Ainlet
, (III.7.2)
where the inlet area isAinlet = πdinlet
2
4 , (III.7.3)
and so the glottal velocity ug(t) is
ug(t) = uinlet(t)dinlet
dg(t) , (III.7.4)
where dg(t) is the variation of glottal width (for definition see Figure II.3.4c in II.3.2.2)over the breathing cycle measured in the in vivo study (for details see boundary condi-tions in III.7.3.4). The calculated aerodynamic parameters are summarized in Table B1.Concluding from the values in the table and in analogy with hemodynamic pulsatile flows
Mean of the breathing cycle Peak flow inlet PIFQ [L/min] 21.1 33.2uinlet [m/s] 0.92 1.46dg [mm] 8.5 14ug [m/s] 2.39 2.29Remax [-] 1388 2183
Table B1: Aerodynamic parameters in glottal constriction: mean values overthe whole cycle and values at the instant of peak airflow inlet t(Qmax)
of similar characteristic parameters, the flow unsteadiness induces internal stabilizationeffects, so that laminar regimes can be observed in spite of peak Re numbers larger than4000 [Boiron et al., 2007]. Therefore, this preliminary airflow model was employed con-sidering laminar airflow conditions. CFD simulations were conducted using Fluent 6.3.26,assuming an incompressible Newtonian gas (as defined in section III.7.3.4). The Navier-Stokes flow governing equations for laminar regime in primitive variables formulation are:
∇ · u(x, t) = 0
ρ
[∂u(x,t)∂t
+((u (x, t)− ugrid
)· ∇
)u(x, t)
]= −∇p(x, t) +∇ · τ
∀[x, t] ∈ Ω× [0,+∞] (III.7.5)

218 ANNEX B - 2D MODEL
with tensor vector:τ = η(∇u(x, t) +∇Tu(x, t)), (III.7.6)
where u and p stand respectively for the instantaneous flow velocity vector and the in-stantaneous static pressure. The vector ugrid represents the grid velocity of the movingmesh, which is determined for all mesh elements as:
ugrid = ∆y∆t . (III.7.7)
The mesh displacement ∆y was defined at solid walls of Ωg using user defined function.The process is described in next section, and the quality of the mesh over the wholebreathing cycle is reported later for final model of upper airways.The transport equations were solved by means of a finite volume method using first-order time and spatial discretization schemes. The time step of the calculation ∆t wasset to 10−2s resulting in 353 time steps of the calculation. Iterative convergence wasachieved when the dimensionless RMS residuals over the entire flow field were inferiorto 10−3, which occurred at each time-step after about 80 iterations. Physical propertiesof the gas were those of air with the density ρ = 1.225 kg/m3 and dynamic viscosityηair = 1.7894 × 10⁻⁵ Pa·s).The Courant-Friedrichs-Lewy (CFL) number derived for the inlet area using the inletvelocity uinlet at the instant t(Qmax):
CFLinlet = uinletmax∆t∆xinlet
= 14.5[−]. (III.7.8)
Even if CFL > 1, calculation converged, so neither mesh dimensions, nor ∆t had to bechanged.
Boundary Conditions
The boundary conditions for different domains of the model Ωi, Ω1, Ω2, Ωg, Ωo (seeFigure B1) were set:• At the inlet face Ωi, the velocity inlet condition was set as Ωi = uinlet(t). Velocity inlet(see Figure B1) conforms with the preliminary in vivo study (see section II.3.1.1).An average of the flow rate over 185 quiet breathing cycles was calculated (eupneacycles of S1, S2, and S3 volunteers). This yielded to the mean respiratory periodT = 3.52s (see Figure B4) and the mean inlet velocity uinlet(t) (see III.7.2). Theunsteady boundary condition was coded in C programming language using a UserDefined Function (UDF) with DEFINE_PROFILE macro. The UDF is a functionthat can be dynamically loaded within the ANSYS Fluent solver to enhance thestandard features of the code [ANSYS R©, 2013c].• On solid walls of Ω1 and Ω2 domains was applied a no slip shear boundary conditionuwall ·n = 0, where uwall is the velocity vector of the wall motion, here equal to zeroand n is the outward normal vector.
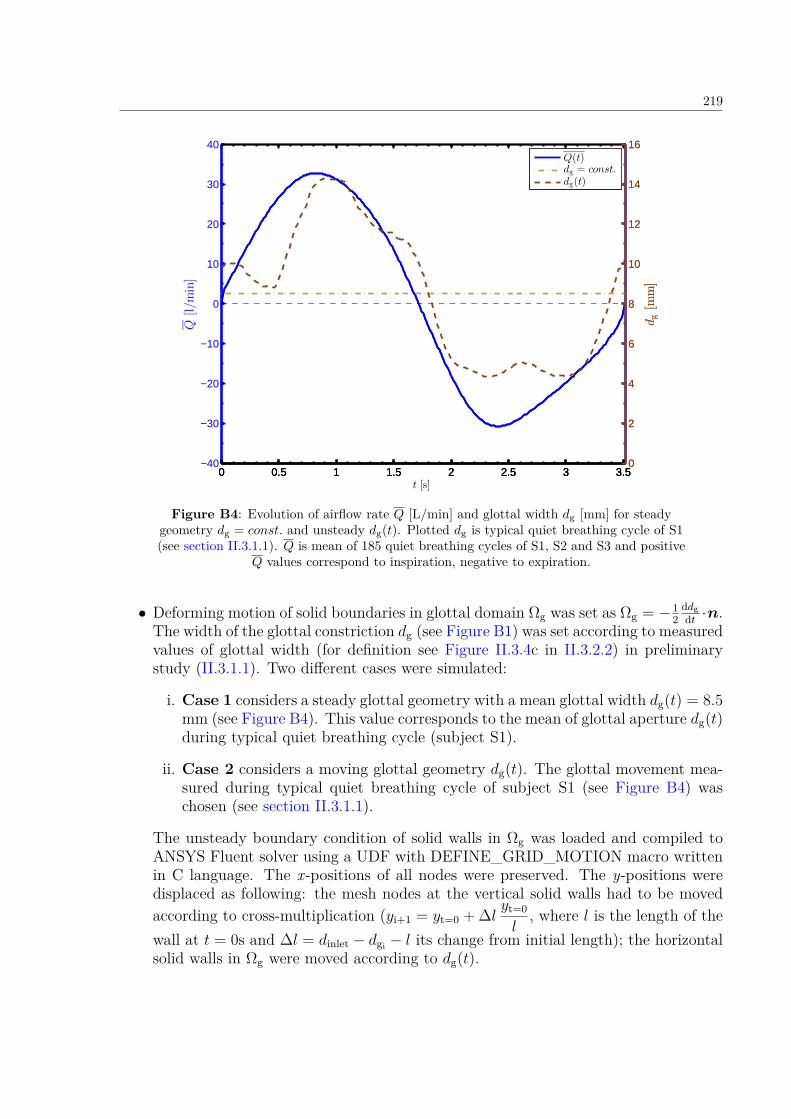
219
0 0.5 1 1.5 2 2.5 3 3.5−40
−30
−20
−10
0
10
20
30
40
Q[l/m
in]
t [s]
0 0.5 1 1.5 2 2.5 3 3.50
2
4
6
8
10
12
14
16
dg[m
m]
0 0.5 1 1.5 2 2.5 3 3.50
2
4
6
8
10
12
14
16
dg[m
m]
Q(t)dg = const.
dg(t)
Figure B4: Evolution of airflow rate Q [L/min] and glottal width dg [mm] for steadygeometry dg = const. and unsteady dg(t). Plotted dg is typical quiet breathing cycle of S1(see section II.3.1.1). Q is mean of 185 quiet breathing cycles of S1, S2 and S3 and positive
Q values correspond to inspiration, negative to expiration.
• Deforming motion of solid boundaries in glottal domain Ωg was set as Ωg = −12
ddgdt ·n.
The width of the glottal constriction dg (see Figure B1) was set according to measuredvalues of glottal width (for definition see Figure II.3.4c in II.3.2.2) in preliminarystudy (II.3.1.1). Two different cases were simulated:
i. Case 1 considers a steady glottal geometry with a mean glottal width dg(t) = 8.5mm (see Figure B4). This value corresponds to the mean of glottal aperture dg(t)during typical quiet breathing cycle (subject S1).
ii. Case 2 considers a moving glottal geometry dg(t). The glottal movement mea-sured during typical quiet breathing cycle of subject S1 (see Figure B4) waschosen (see section II.3.1.1).
The unsteady boundary condition of solid walls in Ωg was loaded and compiled toANSYS Fluent solver using a UDF with DEFINE_GRID_MOTION macro writtenin C language. The x-positions of all nodes were preserved. The y-positions weredisplaced as following: the mesh nodes at the vertical solid walls had to be movedaccording to cross-multiplication (yi+1 = yt=0 + ∆l yt=0
l, where l is the length of the
wall at t = 0s and ∆l = dinlet − dgi − l its change from initial length); the horizontalsolid walls in Ωg were moved according to dg(t).
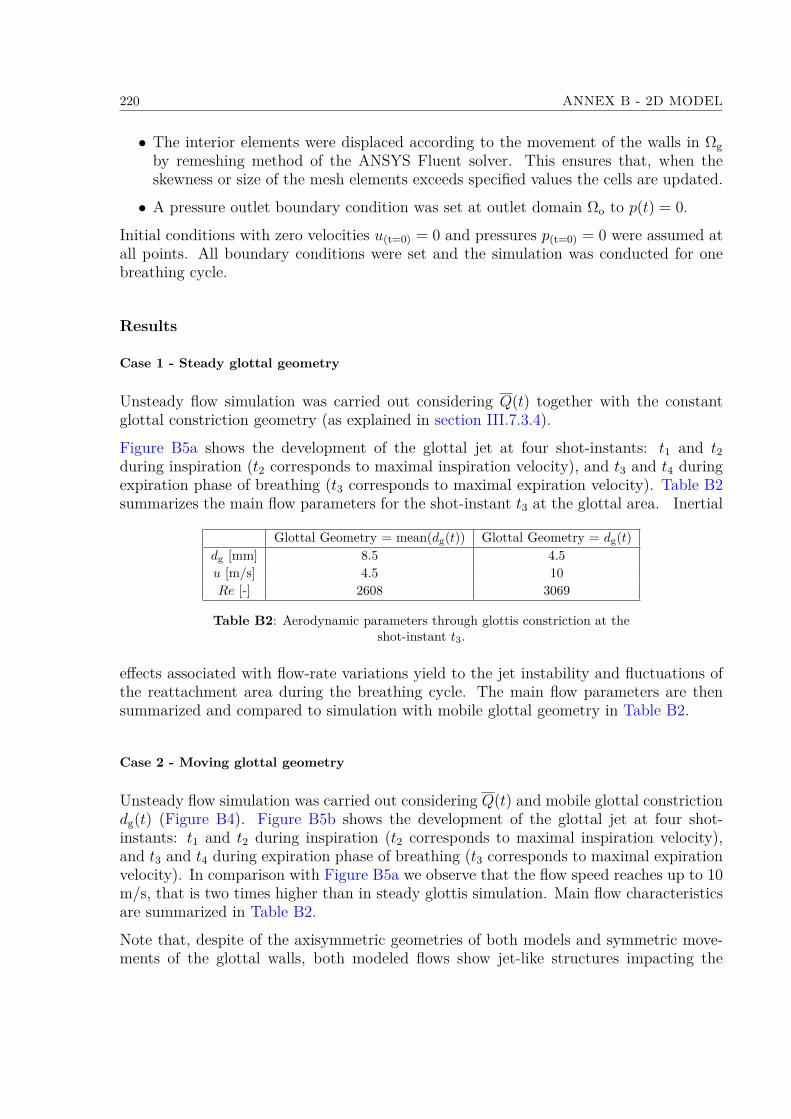
220 ANNEX B - 2D MODEL
• The interior elements were displaced according to the movement of the walls in Ωgby remeshing method of the ANSYS Fluent solver. This ensures that, when theskewness or size of the mesh elements exceeds specified values the cells are updated.
• A pressure outlet boundary condition was set at outlet domain Ωo to p(t) = 0.
Initial conditions with zero velocities u(t=0) = 0 and pressures p(t=0) = 0 were assumed atall points. All boundary conditions were set and the simulation was conducted for onebreathing cycle.
Results
Case 1 - Steady glottal geometry
Unsteady flow simulation was carried out considering Q(t) together with the constantglottal constriction geometry (as explained in section III.7.3.4).
Figure B5a shows the development of the glottal jet at four shot-instants: t1 and t2during inspiration (t2 corresponds to maximal inspiration velocity), and t3 and t4 duringexpiration phase of breathing (t3 corresponds to maximal expiration velocity). Table B2summarizes the main flow parameters for the shot-instant t3 at the glottal area. Inertial
Glottal Geometry = mean(dg(t)) Glottal Geometry = dg(t)dg [mm] 8.5 4.5u [m/s] 4.5 10Re [-] 2608 3069
Table B2: Aerodynamic parameters through glottis constriction at theshot-instant t3.
effects associated with flow-rate variations yield to the jet instability and fluctuations ofthe reattachment area during the breathing cycle. The main flow parameters are thensummarized and compared to simulation with mobile glottal geometry in Table B2.
Case 2 - Moving glottal geometry
Unsteady flow simulation was carried out considering Q(t) and mobile glottal constrictiondg(t) (Figure B4). Figure B5b shows the development of the glottal jet at four shot-instants: t1 and t2 during inspiration (t2 corresponds to maximal inspiration velocity),and t3 and t4 during expiration phase of breathing (t3 corresponds to maximal expirationvelocity). In comparison with Figure B5a we observe that the flow speed reaches up to 10m/s, that is two times higher than in steady glottis simulation. Main flow characteristicsare summarized in Table B2.
Note that, despite of the axisymmetric geometries of both models and symmetric move-ments of the glottal walls, both modeled flows show jet-like structures impacting the
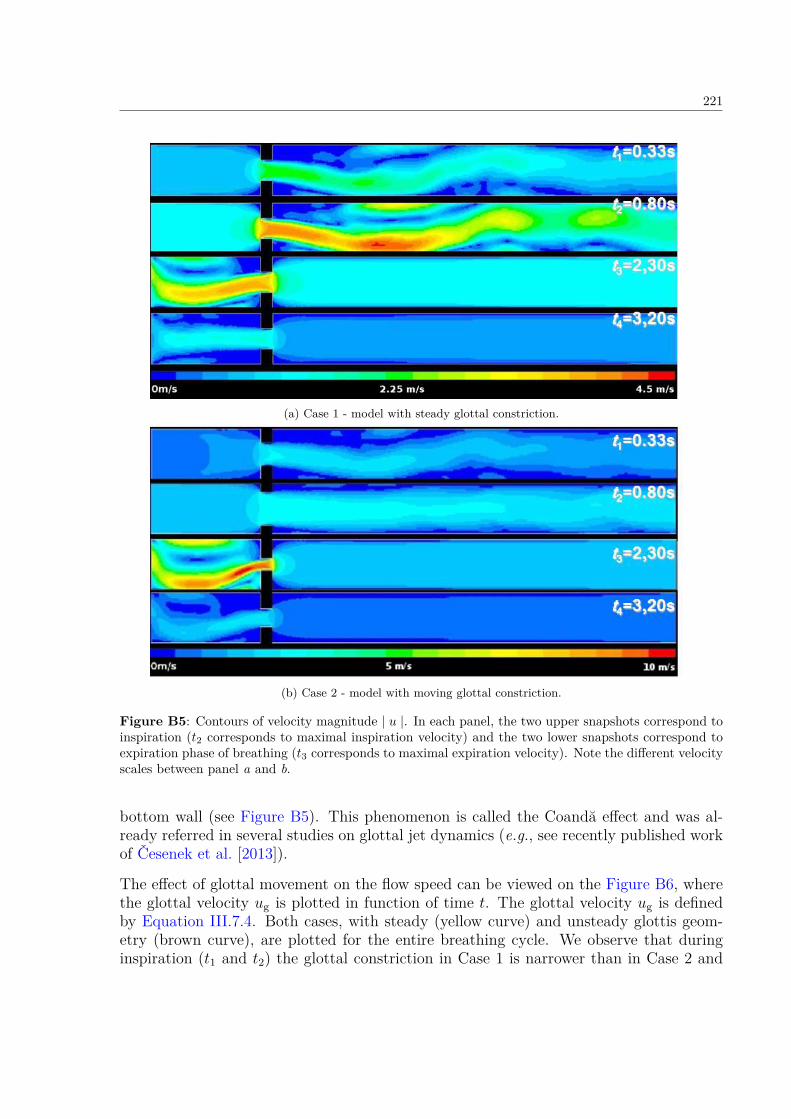
221
(a) Case 1 - model with steady glottal constriction.
(b) Case 2 - model with moving glottal constriction.
Figure B5: Contours of velocity magnitude | u |. In each panel, the two upper snapshots correspond toinspiration (t2 corresponds to maximal inspiration velocity) and the two lower snapshots correspond toexpiration phase of breathing (t3 corresponds to maximal expiration velocity). Note the different velocityscales between panel a and b.
bottom wall (see Figure B5). This phenomenon is called the Coandă effect and was al-ready referred in several studies on glottal jet dynamics (e.g., see recently published workof Česenek et al. [2013]).
The effect of glottal movement on the flow speed can be viewed on the Figure B6, wherethe glottal velocity ug is plotted in function of time t. The glottal velocity ug is definedby Equation III.7.4. Both cases, with steady (yellow curve) and unsteady glottis geom-etry (brown curve), are plotted for the entire breathing cycle. We observe that duringinspiration (t1 and t2) the glottal constriction in Case 1 is narrower than in Case 2 and
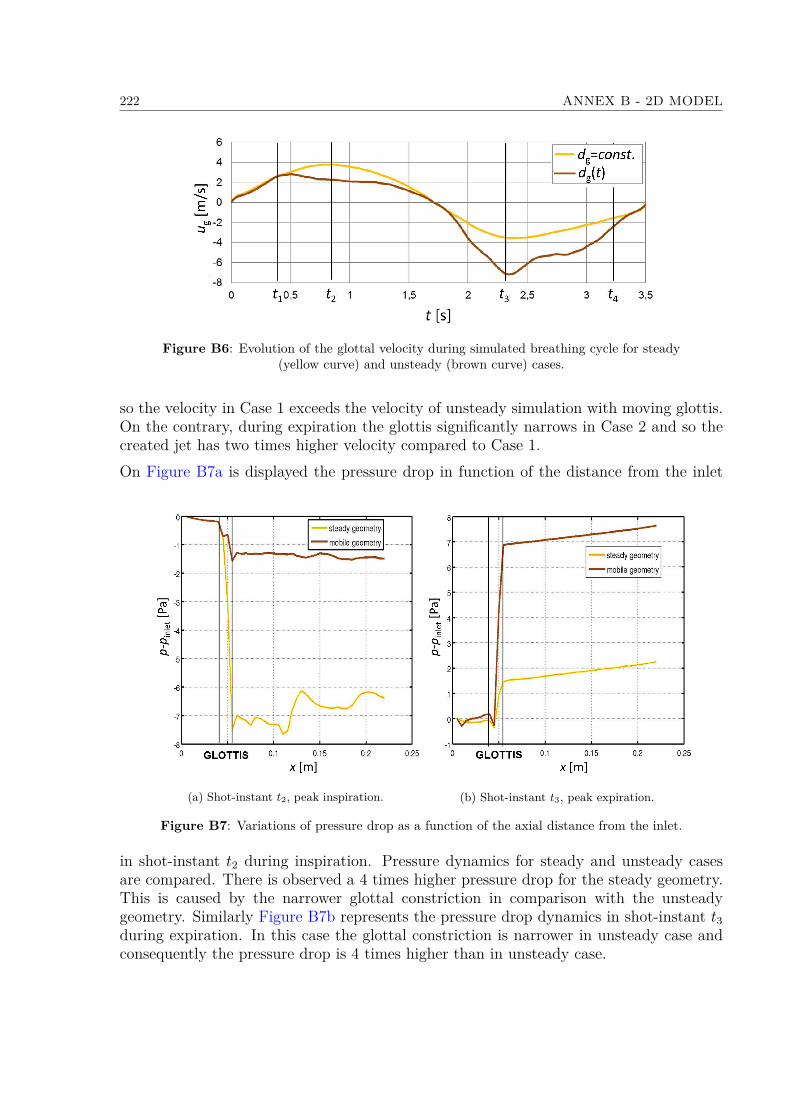
222 ANNEX B - 2D MODEL
Figure B6: Evolution of the glottal velocity during simulated breathing cycle for steady(yellow curve) and unsteady (brown curve) cases.
so the velocity in Case 1 exceeds the velocity of unsteady simulation with moving glottis.On the contrary, during expiration the glottis significantly narrows in Case 2 and so thecreated jet has two times higher velocity compared to Case 1.On Figure B7a is displayed the pressure drop in function of the distance from the inlet
(a) Shot-instant t2, peak inspiration. (b) Shot-instant t3, peak expiration.
Figure B7: Variations of pressure drop as a function of the axial distance from the inlet.
in shot-instant t2 during inspiration. Pressure dynamics for steady and unsteady casesare compared. There is observed a 4 times higher pressure drop for the steady geometry.This is caused by the narrower glottal constriction in comparison with the unsteadygeometry. Similarly Figure B7b represents the pressure drop dynamics in shot-instant t3during expiration. In this case the glottal constriction is narrower in unsteady case andconsequently the pressure drop is 4 times higher than in unsteady case.

Annex C - User Defined Functions
223
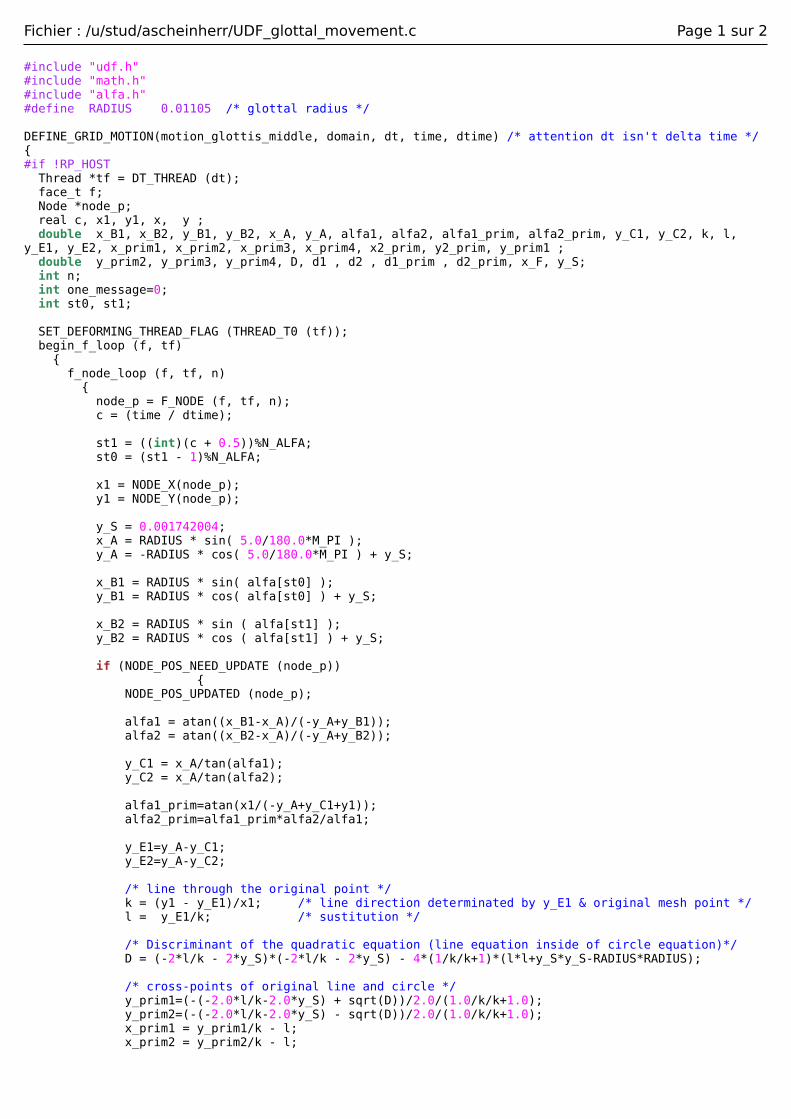
Fichier : /u/stud/ascheinherr/UDF_glottal_movement.c Page 1 sur 2
#include "udf.h"#include "math.h"#include "alfa.h"#define RADIUS 0.01105 /* glottal radius */
DEFINE_GRID_MOTION(motion_glottis_middle, domain, dt, time, dtime) /* attention dt isn't delta time */ #if !RP_HOST Thread *tf = DT_THREAD (dt); face_t f; Node *node_p; real c, x1, y1, x, y ; double x_B1, x_B2, y_B1, y_B2, x_A, y_A, alfa1, alfa2, alfa1_prim, alfa2_prim, y_C1, y_C2, k, l, y_E1, y_E2, x_prim1, x_prim2, x_prim3, x_prim4, x2_prim, y2_prim, y_prim1 ; double y_prim2, y_prim3, y_prim4, D, d1 , d2 , d1_prim , d2_prim, x_F, y_S; int n; int one_message=0; int st0, st1;
SET_DEFORMING_THREAD_FLAG (THREAD_T0 (tf)); begin_f_loop (f, tf) f_node_loop (f, tf, n) node_p = F_NODE (f, tf, n); c = (time / dtime);
st1 = ((int)(c + 0.5))%N_ALFA; st0 = (st1 - 1)%N_ALFA;
x1 = NODE_X(node_p); y1 = NODE_Y(node_p);
y_S = 0.001742004; x_A = RADIUS * sin( 5.0/180.0*M_PI ); y_A = -RADIUS * cos( 5.0/180.0*M_PI ) + y_S;
x_B1 = RADIUS * sin( alfa[st0] ); y_B1 = RADIUS * cos( alfa[st0] ) + y_S;
x_B2 = RADIUS * sin ( alfa[st1] ); y_B2 = RADIUS * cos ( alfa[st1] ) + y_S;
if (NODE_POS_NEED_UPDATE (node_p))
NODE_POS_UPDATED (node_p);
alfa1 = atan((x_B1-x_A)/(-y_A+y_B1)); alfa2 = atan((x_B2-x_A)/(-y_A+y_B2));
y_C1 = x_A/tan(alfa1); y_C2 = x_A/tan(alfa2);
alfa1_prim=atan(x1/(-y_A+y_C1+y1)); alfa2_prim=alfa1_prim*alfa2/alfa1;
y_E1=y_A-y_C1; y_E2=y_A-y_C2;
/* line through the original point */ k = (y1 - y_E1)/x1; /* line direction determinated by y_E1 & original mesh point */ l = y_E1/k; /* sustitution */
/* Discriminant of the quadratic equation (line equation inside of circle equation)*/ D = (-2*l/k - 2*y_S)*(-2*l/k - 2*y_S) - 4*(1/k/k+1)*(l*l+y_S*y_S-RADIUS*RADIUS);
/* cross-points of original line and circle */ y_prim1=(-(-2.0*l/k-2.0*y_S) + sqrt(D))/2.0/(1.0/k/k+1.0); y_prim2=(-(-2.0*l/k-2.0*y_S) - sqrt(D))/2.0/(1.0/k/k+1.0); x_prim1 = y_prim1/k - l; x_prim2 = y_prim2/k - l;

Fichier : /u/stud/ascheinherr/UDF_glottal_movement.c Page 2 sur 2
/* line through the new point */ x_F=-y_E2*tan(alfa2_prim); k = -y_E2/x_F; l = y_E2/k;
/* Discriminant of the quadratic equation (line equation inside of circle equation)*/ D = (-2*l/k - 2*y_S)*(-2*l/k - 2*y_S) - 4*(1/k/k+1)*(l*l+y_S*y_S-RADIUS*RADIUS);
/* cross-points of new line with the circle*/ y_prim3=(-(-2.0*l/k-2.0*y_S) + sqrt(D))/2.0/(1.0/k/k+1.0); y_prim4=(-(-2.0*l/k-2.0*y_S) - sqrt(D))/2.0/(1.0/k/k+1.0); x_prim3 = y_prim3/k - l; x_prim4 = y_prim4/k - l;
/* length of new lines */ if (y_prim1>=y_S)
/* length of the secant */ d1=sqrt((y_prim1-y_prim2)*(y_prim1-y_prim2)+(x_prim1-x_prim2)*(x_prim1-x_prim2));
/* length of the part to the mesh point */ d1_prim=sqrt((y_prim1-y1)*(y_prim1-y1)+(x_prim1-x1)*(x_prim1-x1));
else
d1=sqrt((y_prim2-y_prim1)*(y_prim2-y_prim1)+(x_prim2-x_prim1)*(x_prim2-x_prim1)); d1_prim=sqrt((y_prim2-y1)*(y_prim2-y1)+(x_prim2-x1)*(x_prim2-x1));
if (y_prim3>=y_S)
d2=sqrt((y_prim3-y_prim4)*(y_prim3-y_prim4)+(x_prim3-x_prim4)*(x_prim3-x_prim4));
else
d2=sqrt((y_prim4-y_prim3)*(y_prim4-y_prim3)+(x_prim4-x_prim3)*(x_prim4-x_prim3));
d2_prim=d1_prim*d2/d1; x2_prim=d2_prim*sin(alfa2_prim); y2_prim=sqrt(d2_prim*d2_prim-x2_prim*x2_prim);
if (y_prim3>=y_S)
x = x_prim3-x2_prim; y = y_prim3-y2_prim;
else
x = x_prim4-x2_prim; y = y_prim4-y2_prim;
NODE_X(node_p) = x; NODE_Y(node_p) = y;
if (one_message==0) /* condition enables only one printf in a loop = in one time step */
Message("x1:%f, y1:%f, \n", x1, y1); one_message=one_message+1;
end_f_loop (f, tf);#endif
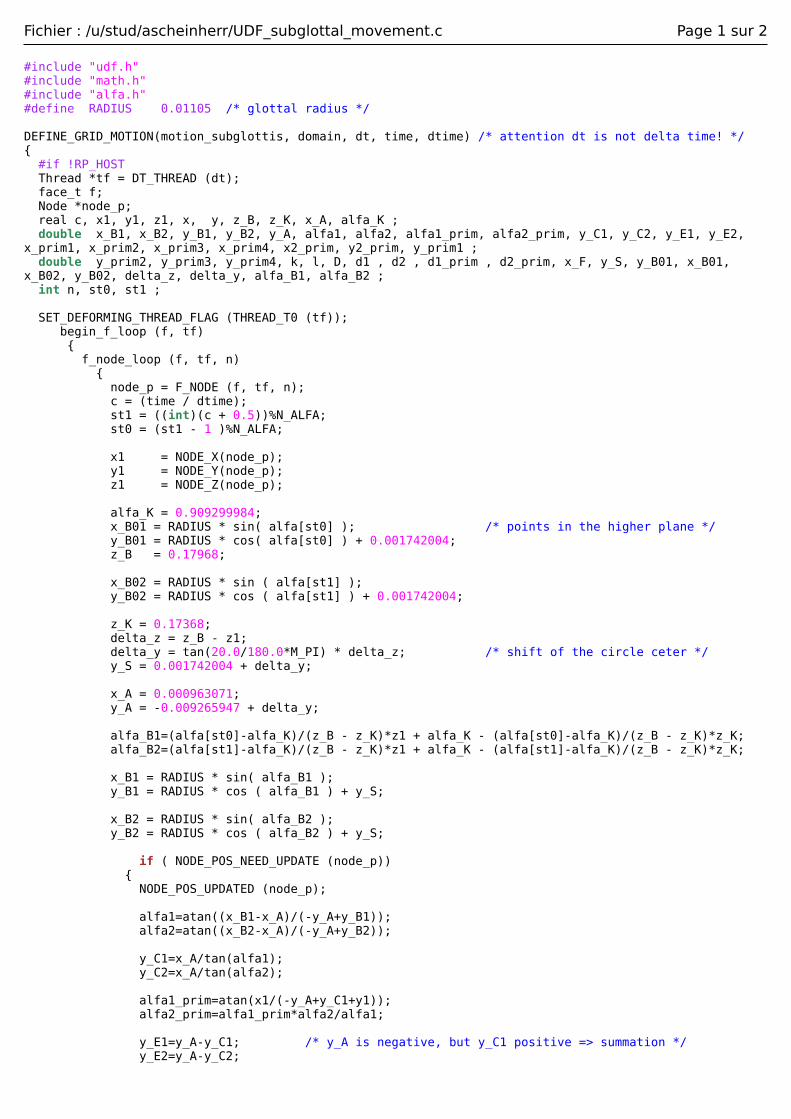
Fichier : /u/stud/ascheinherr/UDF_subglottal_movement.c Page 1 sur 2
#include "udf.h"#include "math.h"#include "alfa.h"#define RADIUS 0.01105 /* glottal radius */
DEFINE_GRID_MOTION(motion_subglottis, domain, dt, time, dtime) /* attention dt is not delta time! */ #if !RP_HOST Thread *tf = DT_THREAD (dt); face_t f; Node *node_p; real c, x1, y1, z1, x, y, z_B, z_K, x_A, alfa_K ; double x_B1, x_B2, y_B1, y_B2, y_A, alfa1, alfa2, alfa1_prim, alfa2_prim, y_C1, y_C2, y_E1, y_E2, x_prim1, x_prim2, x_prim3, x_prim4, x2_prim, y2_prim, y_prim1 ; double y_prim2, y_prim3, y_prim4, k, l, D, d1 , d2 , d1_prim , d2_prim, x_F, y_S, y_B01, x_B01, x_B02, y_B02, delta_z, delta_y, alfa_B1, alfa_B2 ; int n, st0, st1 ;
SET_DEFORMING_THREAD_FLAG (THREAD_T0 (tf)); begin_f_loop (f, tf) f_node_loop (f, tf, n) node_p = F_NODE (f, tf, n); c = (time / dtime); st1 = ((int)(c + 0.5))%N_ALFA; st0 = (st1 - 1 )%N_ALFA;
x1 = NODE_X(node_p); y1 = NODE_Y(node_p); z1 = NODE_Z(node_p);
alfa_K = 0.909299984; x_B01 = RADIUS * sin( alfa[st0] ); /* points in the higher plane */ y_B01 = RADIUS * cos( alfa[st0] ) + 0.001742004; z_B = 0.17968;
x_B02 = RADIUS * sin ( alfa[st1] ); y_B02 = RADIUS * cos ( alfa[st1] ) + 0.001742004;
z_K = 0.17368; delta_z = z_B - z1; delta_y = tan(20.0/180.0*M_PI) * delta_z; /* shift of the circle ceter */ y_S = 0.001742004 + delta_y;
x_A = 0.000963071; y_A = -0.009265947 + delta_y;
alfa_B1=(alfa[st0]-alfa_K)/(z_B - z_K)*z1 + alfa_K - (alfa[st0]-alfa_K)/(z_B - z_K)*z_K; alfa_B2=(alfa[st1]-alfa_K)/(z_B - z_K)*z1 + alfa_K - (alfa[st1]-alfa_K)/(z_B - z_K)*z_K;
x_B1 = RADIUS * sin( alfa_B1 ); y_B1 = RADIUS * cos ( alfa_B1 ) + y_S;
x_B2 = RADIUS * sin( alfa_B2 ); y_B2 = RADIUS * cos ( alfa_B2 ) + y_S;
if ( NODE_POS_NEED_UPDATE (node_p)) NODE_POS_UPDATED (node_p);
alfa1=atan((x_B1-x_A)/(-y_A+y_B1)); alfa2=atan((x_B2-x_A)/(-y_A+y_B2));
y_C1=x_A/tan(alfa1); y_C2=x_A/tan(alfa2);
alfa1_prim=atan(x1/(-y_A+y_C1+y1)); alfa2_prim=alfa1_prim*alfa2/alfa1;
y_E1=y_A-y_C1; /* y_A is negative, but y_C1 positive => summation */ y_E2=y_A-y_C2;

Fichier : /u/stud/ascheinherr/UDF_subglottal_movement.c Page 2 sur 2
/* line through the original point */ k = (y1 - y_E1)/x1; /* line direction determinated by y_E1 & original mesh point */ l = y_E1/k; /* sustitution */
/* Discriminant of the quadratic equation (line equation inside of circle equation)*/ D = (-2*l/k - 2*y_S)*(-2*l/k - 2*y_S) - 4*(1/k/k+1)*(l*l+y_S*y_S-RADIUS*RADIUS);
/* cross-points of original line and circle */ y_prim1=(-(-2.0*l/k-2.0*y_S) + sqrt(D))/2.0/(1.0/k/k+1.0); y_prim2=(-(-2.0*l/k-2.0*y_S) - sqrt(D))/2.0/(1.0/k/k+1.0); x_prim1 = y_prim1/k - l; x_prim2 = y_prim2/k - l;
/* line through the new point */ x_F=-y_E2*tan(alfa2_prim); k = -y_E2/x_F; l = y_E2/k;
/* Discriminant of the quadratic equation (line equation inside of circle equation)*/ D = (-2*l/k - 2*y_S)*(-2*l/k - 2*y_S) - 4*(1/k/k+1)*(l*l+y_S*y_S-RADIUS*RADIUS); /* cross points of new line with the circle*/ y_prim3=(-(-2.0*l/k-2.0*y_S) + sqrt(D))/2.0/(1.0/k/k+1.0); y_prim4=(-(-2.0*l/k-2.0*y_S) - sqrt(D))/2.0/(1.0/k/k+1.0); x_prim3 = y_prim3/k - l; x_prim4 = y_prim4/k - l;
if (y_prim1>=y_S) /* length of new lines */ /* length of the secant */ d1=sqrt((y_prim1-y_prim2)*(y_prim1-y_prim2)+(x_prim1-x_prim2)*(x_prim1-x_prim2));
/* length of the part to the mesh point */ d1_prim=sqrt((y_prim1-y1)*(y_prim1-y1)+(x_prim1-x1)*(x_prim1-x1)); else d1=sqrt((y_prim2-y_prim1)*(y_prim2-y_prim1)+(x_prim2-x_prim1)*(x_prim2-x_prim1)); d1_prim=sqrt((y_prim2-y1)*(y_prim2-y1)+(x_prim2-x1)*(x_prim2-x1));
if (y_prim3>=y_S) d2=sqrt((y_prim3-y_prim4)*(y_prim3-y_prim4)+(x_prim3-x_prim4)*(x_prim3-x_prim4)); else d2=sqrt((y_prim4-y_prim3)*(y_prim4-y_prim3)+(x_prim4-x_prim3)*(x_prim4-x_prim3));
d2_prim=d1_prim*d2/d1; x2_prim=d2_prim*sin(alfa2_prim); y2_prim=sqrt(d2_prim*d2_prim-x2_prim*x2_prim);
if (y_prim3>=y_S) x = x_prim3-x2_prim; y = y_prim3-y2_prim; else x = x_prim4-x2_prim; y = y_prim4-y2_prim;
NODE_X(node_p) = x; NODE_Y(node_p) = y; NODE_Z(node_p) = z1; end_f_loop (f, tf);#endif

228 ANNEX C - USER DEFINED FUNCTIONS
Related Documents