Chemical Engineering Journal 165 (2010) 864–873 Contents lists available at ScienceDirect Chemical Engineering Journal journal homepage: www.elsevier.com/locate/cej Thermoneutral point analysis of ethanol dry autothermal reforming Ganesh R. Kale ∗ , Bhaskar D. Kulkarni CEPD Division, National Chemical Laboratory, Pune 411008, India article info Article history: Received 15 July 2010 Received in revised form 11 October 2010 Accepted 13 October 2010 Keywords: Ethanol reforming Thermoneutral CO2 utilization Dry autothermal reforming abstract Dry autothermal reforming of ethanol can be used to produce a variety of value added products like hydrogen, syngas and also carbon (possible CNF). A thermodynamic analysis of dry autothermal reform- ing of ethanol has been carried out to locate the thermoneutral temperatures and product composition at those points at 1, 3, 6 and 9 bar reaction pressures. The variations of thermoneutral temperatures and individual product yields at those temperatures have been discussed to find the optimum operating parameters for desired product output from the process. The process operated at thermoneutral condi- tions can give useful products like hydrogen, syngas (of low ratio) and carbon (possibly CNFs) and also provide a way for CO 2 sequestration using renewable ethanol fuel. A maximum of 2.58 moles of syngas of ratio 2.01 obtained at 1 bar, CER = 1 and OER = 0.5 along with 0.82 moles of carbon, 0.20 moles of CH 4 and 0.89 moles of water for the thermoneutral temperature of 603.55 ◦ C was found to be the best operating thermoneutral point for value added product generation from this process. This study can be applied to a variety of fuels for producing value added products. © 2010 Elsevier B.V. All rights reserved. 1. Introduction Climate change has become a crucial issue due to the huge CO 2 emissions to environment. World leaders are united to cut CO 2 emissions. CO 2 sequestration has become an urgent need. Carbon credits are being offered to encourage less pollution and efforts to combat greenhouse gas emissions have already generated a consid- erable interest worldwide. New methods for CO 2 capture, storage and sequestration are extensively researched worldwide [1,2].A popular method for CO 2 sequestration is compressing and inject- ing the CO 2 deep inside earth’s crust [3]. However, the questions related to the cost effectiveness and safety of this method are still not answered satisfactorily [4]. Use of CO 2 to produce car- bon nanofilaments (CNF) [5,6] or petrochemicals via FT (Fisher Tropsch) synthesis seems to be a viable solution at this moment. Petrochemicals require syngas (H 2 + CO) that is presently produced using partial oxidation or steam reforming of fossil fuels like natu- ral gas. But the increase in demand of fossil fuels is pushing the oil and gas prices beyond limits. One example is the huge increase in global price of crude oil (140$/barrel) in 2008. This has prompted the petrochemical industry to find a fresh feedstock for syngas manufacture [7–9]. The spurt of renewable energy has brought bio- fuels like ethanol, glycerol and biodiesel into limelight. Biofuels are considered as reliable energy sources for the future. Bioethanol, glycerol, etc can be produced in abundant quantities all around ∗ Corresponding author. Tel.: +91 2025902436. E-mail addresses: [email protected], [email protected] (G.R. Kale). the world once the biofuel revolution commercializes. Ethanol is easy to produce, safe to handle, transport and store. Ethanol does not contain heteroatoms (N, S, etc) or metals, and using it in pro- cess will not emit NOx or SOx. CO 2 is another carbon source found abundantly in atmosphere. All flue gases contain CO 2 . Plants utilize CO 2 to convert them to carbohydrates. But industrial revolution has resulted in loss of vegetation and an increased CO 2 output to the atmosphere. Although commercial biodiesel manufacture is being done recently, ethanol manufacture from molasses has been well known in industry. Ethanol is a reliable and preferred feedstock and can be used to generate hydrogen and syngas instead of traditional feeds like coal, oil or gas as their reserves have been depleting over the time [10]. Ethanol to syngas by partial oxidation, steam reform- ing, autothermal reforming and dry reforming has been studied by many researchers. Some important ethanol to hydrogen work reported in literature is summarized below: 1.1. Thermodynamic studies on steam reforming of ethanol Vasudeva et al. [11] have investigated the thermodynamic fea- sibility of ethanol steam reforming under conditions conducive to carbon formation and have reported that 5.5 moles of hydro- gen can be obtained as against the stoichiometric value of 6.0 per mole ethanol feed. Garcia et al. [12] have conducted thermody- namic analysis of steam reforming of ethanol to produce hydrogen between 1–9 atm, 400–800 K and 0:1–10:1 water to ethanol feed ratio and found that atmospheric pressure and water in excess in the feed gave the best condition for hydrogen production at T > 650 K minimizing methane production preventing carbon for- 1385-8947/$ – see front matter © 2010 Elsevier B.V. All rights reserved. doi:10.1016/j.cej.2010.10.033

Welcome message from author
This document is posted to help you gain knowledge. Please leave a comment to let me know what you think about it! Share it to your friends and learn new things together.
Transcript
T
GC
a
ARRA
KETCD
1
eecceapirsbTPuragtmfcg
1d
Chemical Engineering Journal 165 (2010) 864–873
Contents lists available at ScienceDirect
Chemical Engineering Journal
journa l homepage: www.e lsev ier .com/ locate /ce j
hermoneutral point analysis of ethanol dry autothermal reforming
anesh R. Kale ∗, Bhaskar D. KulkarniEPD Division, National Chemical Laboratory, Pune 411008, India
r t i c l e i n f o
rticle history:eceived 15 July 2010eceived in revised form 11 October 2010ccepted 13 October 2010
eywords:
a b s t r a c t
Dry autothermal reforming of ethanol can be used to produce a variety of value added products likehydrogen, syngas and also carbon (possible CNF). A thermodynamic analysis of dry autothermal reform-ing of ethanol has been carried out to locate the thermoneutral temperatures and product compositionat those points at 1, 3, 6 and 9 bar reaction pressures. The variations of thermoneutral temperaturesand individual product yields at those temperatures have been discussed to find the optimum operatingparameters for desired product output from the process. The process operated at thermoneutral condi-
thanol reforminghermoneutralO2 utilizationry autothermal reforming
tions can give useful products like hydrogen, syngas (of low ratio) and carbon (possibly CNFs) and alsoprovide a way for CO2 sequestration using renewable ethanol fuel. A maximum of 2.58 moles of syngas ofratio 2.01 obtained at 1 bar, CER = 1 and OER = 0.5 along with 0.82 moles of carbon, 0.20 moles of CH4 and0.89 moles of water for the thermoneutral temperature of 603.55 ◦C was found to be the best operatingthermoneutral point for value added product generation from this process. This study can be applied to
ucing
a variety of fuels for prod. Introduction
Climate change has become a crucial issue due to the huge CO2missions to environment. World leaders are united to cut CO2missions. CO2 sequestration has become an urgent need. Carbonredits are being offered to encourage less pollution and efforts toombat greenhouse gas emissions have already generated a consid-rable interest worldwide. New methods for CO2 capture, storagend sequestration are extensively researched worldwide [1,2]. Aopular method for CO2 sequestration is compressing and inject-
ng the CO2 deep inside earth’s crust [3]. However, the questionselated to the cost effectiveness and safety of this method aretill not answered satisfactorily [4]. Use of CO2 to produce car-on nanofilaments (CNF) [5,6] or petrochemicals via FT (Fisherropsch) synthesis seems to be a viable solution at this moment.etrochemicals require syngas (H2 + CO) that is presently producedsing partial oxidation or steam reforming of fossil fuels like natu-al gas. But the increase in demand of fossil fuels is pushing the oilnd gas prices beyond limits. One example is the huge increase inlobal price of crude oil (140$/barrel) in 2008. This has promptedhe petrochemical industry to find a fresh feedstock for syngas
anufacture [7–9]. The spurt of renewable energy has brought bio-uels like ethanol, glycerol and biodiesel into limelight. Biofuels areonsidered as reliable energy sources for the future. Bioethanol,lycerol, etc can be produced in abundant quantities all around
∗ Corresponding author. Tel.: +91 2025902436.E-mail addresses: [email protected], [email protected] (G.R. Kale).
385-8947/$ – see front matter © 2010 Elsevier B.V. All rights reserved.oi:10.1016/j.cej.2010.10.033
value added products.© 2010 Elsevier B.V. All rights reserved.
the world once the biofuel revolution commercializes. Ethanol iseasy to produce, safe to handle, transport and store. Ethanol doesnot contain heteroatoms (N, S, etc) or metals, and using it in pro-cess will not emit NOx or SOx. CO2 is another carbon source foundabundantly in atmosphere. All flue gases contain CO2. Plants utilizeCO2 to convert them to carbohydrates. But industrial revolution hasresulted in loss of vegetation and an increased CO2 output to theatmosphere. Although commercial biodiesel manufacture is beingdone recently, ethanol manufacture from molasses has been wellknown in industry. Ethanol is a reliable and preferred feedstock andcan be used to generate hydrogen and syngas instead of traditionalfeeds like coal, oil or gas as their reserves have been depleting overthe time [10]. Ethanol to syngas by partial oxidation, steam reform-ing, autothermal reforming and dry reforming has been studiedby many researchers. Some important ethanol to hydrogen workreported in literature is summarized below:
1.1. Thermodynamic studies on steam reforming of ethanol
Vasudeva et al. [11] have investigated the thermodynamic fea-sibility of ethanol steam reforming under conditions conduciveto carbon formation and have reported that 5.5 moles of hydro-gen can be obtained as against the stoichiometric value of 6.0 permole ethanol feed. Garcia et al. [12] have conducted thermody-
namic analysis of steam reforming of ethanol to produce hydrogenbetween 1–9 atm, 400–800 K and 0:1–10:1 water to ethanol feedratio and found that atmospheric pressure and water in excessin the feed gave the best condition for hydrogen production atT > 650 K minimizing methane production preventing carbon for-
Engine
mestpasotaahhgarptcpy[gh
1
odfkfitrstinr
1
1
gt1a
1
icaotmgthstrfe
G.R. Kale, B.D. Kulkarni / Chemical
ation. Fishtik et al. [13] have studied the thermodynamics ofthanol steam reforming using an algorithm for deriving a uniqueet of response reactions (RERs) that can be used to rationalizehe effect of process variables on steam reforming of ethanol toroduce hydrogen and have reported that at or above 700–800 K,nd using high water/ethanol ratios, the desired reaction of ethanolteam reforming can be made predominant minimizing the effectf undesirable side reactions. Comas et al. [14] have studied thehermodynamic analysis of ethanol steam reforming using CaOs a CO2 sorbent and reported that atmospheric pressure, 700 ◦Cnd water/ethanol molar ratio of 4 were the best conditions forydrogen production in the presence of CaO. De Souza et al. [15]ave studied the physical–chemical, thermodynamic and exer-etic analysis of a steam reformer of ethanol to produce hydrogennd reported that the best thermodynamic conditions for steameforming of ethanol are the same conditions suggested in thehysical–chemical analysis. Da Silva et al. [16] have presented ahermodynamic analysis of ethanol steam reforming to identifyonditions for carbon formation and also stated that the work couldrovide explanations for deviations between thermodynamic anal-sis and experimental results regarding carbon deposition. Ni et al.17] have presented a review on reforming bio-ethanol for hydro-en production. Haryanto et al. [18] have presented a review ofydrogen production techniques by steam reforming of ethanol.
.2. Kinetics and process engineering aspect studies
Vaidya et al. [19] have discussed the process engineering aspectsf ethanol steam reforming along with catalysts, optimum con-itions and ways to prevent problems like coking and byproductormation. Sahoo et al. [20] have experimentally investigated theinetics of ethanol steam reforming using Co/Al2O3 catalysts in axed bed tubular reactor and proposed a kinetic model to describehe steam reforming of ethanol process adequately for a wideange of experimental data. Vaidya et al. [21] studied the catalyticteam reforming of ethanol over a Ru/Al2O3 catalyst in 873–973 Kemperature range. Mathure et al. [22] have experimentally stud-ed the kinetics of ethanol steam reforming over a commercialickel–magnesia–alumina (Ni/MgO/Al2O3) catalyst in a fixed-bedeactor.
.3. Oxidative steam reforming/autothermal reforming of ethanol
.3.1. Thermodynamic studiesLiu et al. [23] have conducted thermodynamic analysis of hydro-
en production in oxidative steam reforming of ethanol to calculatehe thermoneutral product gas equilibrium moles at 700, 900 and100 K and reported that maximum hydrogen with minimum cokend methane were formed at 900 K.
.3.2. Experimental studiesBiswas et al. [24] have experimentally compared steam reform-
ng and autothermal reforming of ethanol over Ni–CeO2–ZrO2atalyst and reported that the hydrogen yield was higher in ATRt 500 ◦C but at higher temperatures higher hydrogen yields werebtained in absence of oxygen. Chen et al. [25] have experimen-ally studied the autothermal reforming of ethanol using noble
etal (Ir, Ru, Rh, and Pd) catalysts supported on various oxides likeamma-Al2O3, CeO2, ZrO2 and La2O3 and found that La2O3 washe best support for the ATR reaction and Ir/La2O3 gave excellentydrogen selectivity with good stability on stream and high conver-
ion approaching thermodynamic limit. Cai et al. [26] have studiedhe ethanol autothermal reforming over an Rh/CeO2 catalyst andeported that the catalysts exhibited stable activity and selectivityor long term operation without deactivation or sintering. Delugat al. [27] have also studied ethanol autothermal reforming onering Journal 165 (2010) 864–873 865
rhodium–ceria catalysts and reported that the process has greatpotential for low-cost H2 generation applications. Markova et al.[28] have experimentally studied bio-ethanol autothermal reform-ing to generate data for regression models to provide optimumvalues of the process factors to maximize hydrogen. Youn et al.[29] have investigated the effect of addition of second metal (Ce,Co, Cu, Mg and Zn) to Ni/gamma-Al2O3 catalysts for autothermalreforming of ethanol and found that Cu was the most efficient pro-moter for hydrogen production. De Lima et al. [30] have tested thecatalytic performance of a Pt/CeZrO2 catalyst for ethanol decom-position, steam reforming, partial oxidation, and oxidative steamreforming and proposed a reaction mechanism based on resultsobtained under reaction conditions. Cai et al. [31] have experi-mentally tested the oxidative steam reforming of ethanol over anIr/CeO2 catalyst and reported complete conversion of ethanol at773 K with hydrogen, carbon oxides and methane as only productsand stable performance of Ir/CeO2 without deactivation or coking.
1.4. Dry reforming of ethanol
Jankhah et al. [32] have studied the thermodynamic equilib-rium analysis and experimentation of thermal and catalytic ethanolcracking and dry reforming using a carbon steel catalyst precursorand reported that highest hydrogen and carbon (carbon nanofil-aments)) yields were obtained at 550 ◦C. Wang et al. [33] havestudied the thermodynamics of ethanol reforming with carbondioxide for hydrogen production and have reported that optimumconditions gave over 94% yield of syngas with complete conversionof ethanol without carbon deposition. De Oliveira-Vigier et al. [34]have experimentally studied the dry reforming of ethanol usinga recyclable and long lasting SS 316 catalyst and have obtainedhydrogen yield 98% of the theoretical value. Blanchard et al. [6] haveexperimentally studied the ethanol dry reforming using a carbonsteel catalyst to produce syngas and also nanocarbons.
No study of ethanol dry reforming with oxygen addition [dryautothermal reforming (DATR) of ethanol] has been reported yetalthough a similar study for glycerol has been reported [35] whichhas stated the advantages of DATR over the DR process and role ofCO2 in the process. CO2 utilization from the CLC (chemical loopingcombustion) product stream by combined reforming of propanehas been recently reported [36].
Autothermal reforming processes are considered more energyefficient due to the in situ energy generation for the endother-mic reactions. Dry autothermal reforming is a combination of(endothermic) dry reforming and (exothermic) partial oxidationto produce a syngas rich stream without external energy supply.Thermoneutral point is the condition where the endothermic reac-tions balance the exothermic reactions to make the net enthalpyof reaction zero. Autothermal processes are generally operated atthermoneutral conditions to maximize energy efficiency. However,very little literature is available regarding thermoneutral points andproduct trends at those points. Ahmed et al. [37] have theoreticallyexplained the advantages of thermoneutral points of reformingreactions. The main goal of this work is to analyze the thermoneu-tral conditions for DATR of ethanol process to produce a varietyof value added products like hydrogen, syngas and CNF’s whoseyield can be maximized at different operating conditions and inputratios. This paper intends to study the variation of components inthe product stream at thermoneutral conditions, presenting prod-uct yields and product distribution trends at various pressures tofind the best operating thermoneutral point for the desired product.
2. Methodology
Thermodynamic analysis is the first step for determining thefeasibility of clean energy process like DATR of ethanol. Gibbs
866 G.R. Kale, B.D. Kulkarni / Chemical Engineering Journal 165 (2010) 864–873
400
450
500
550
600
650
700
750
800
0 1 2 3 4 5 6 7 8 9 10
Pressure (bar)
Ther
mo
neu
tral
tem
per
atu
re (o C)
A1 (OER=0.1,CER=1) A2 (OER=0.1,CER=2) A3 (OER=0.1,CER=3)
B1 (OER=0.3,CER=1) B2 (OER=0.3,CER=2) B3 (OER=0.3,CER=3)
C1 (OER=0.5,CER=1) C2 (OER=0.5,CER=2) C3 (OER=0.5,CER=3)
C1
A3
A2
A1B3
B2C3
B1C2
pera
foAtCgopsCC(topeObbttibipbaorarcwcppzhtc
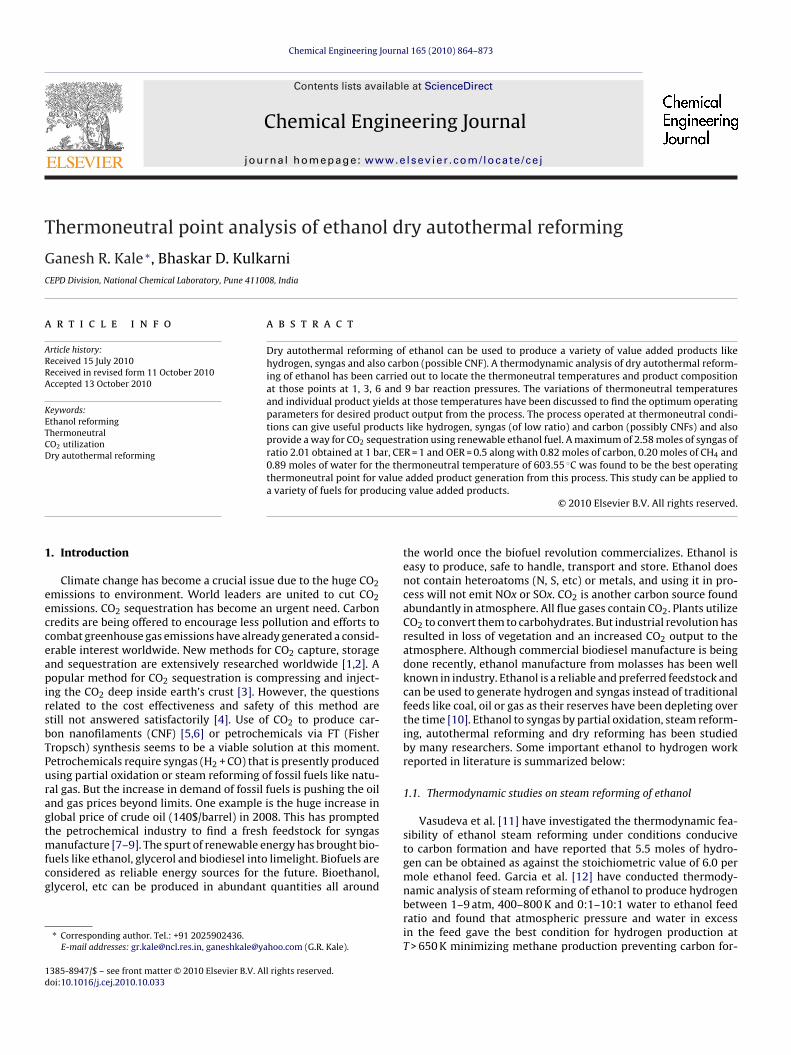
Fig. 1. Thermoneutral tem
ree minimization algorithm is commonly used for this step. Vari-us chemical engineering software packages like Design II, HYSYS,spen Plus, etc. have equilibrium reactor modules and some of
hem use the Gibbs free energy minimization algorithms. HSChemistry software package [38] (version 5.1) has been used toenerate the equilibrium data for this study. The input and desiredutput species need to be defined by the user along with tem-erature and pressure conditions. The input species fed to theoftware were ethanol (both gaseous and liquid state), air (g) andO2 (g). The output species fed to the software are H2, CO, CO2,H4 (all in gaseous state), H2O (both gas and liquid state) and Csolid), which are common reaction products of reforming reac-ions. The software gives the individual product moles, along withverall reaction enthalpy at the T and P condition. Temperature,ressure, CER (feed CO2 to ethanol ratio) and OER (feed O2 tothanol ratio) are the key parameters for the process design. TheER is the equivalent of the equivalence ratio, which is definedy the fuel to oxygen ratio compared to the stoichiometric valuey some researchers. It was decided to study the process opera-ion at thermoneutral points only, so the data generation is limitedo product compositions at thermoneutral conditions for changen CER, OER and pressure. Thermoneutral point temperatures cane obtained from the temperature vs reaction enthalpy graph as it
s the temperature at which the enthalpy curve touches the tem-erature axis where the enthalpy is zero. 1 mole of ethanol haseen used at all conditions for this study. The thermodynamicnalysis of ethanol dry autothermal reforming has been carriedut in the temperature range (450–950 ◦C) at 1, 3, 6 and 9 bareaction pressures with CER (feed CO2 to ethanol ratio) 1, 2, 3nd OER (feed O2 to ethanol ratio) 0.1, 0.3, 0.5. These conditionsepresent a realistic view for process operation and are carefullyhosen to limit the thermoneutral point temperature to <700 ◦Chich is practical for ethanol feed and also to produce signifi-
ant carbon (possible CNFs) as they have been reported as usefulroducts by some researchers. The data for variation in yields of
roducts like H2, CO, CH4, H2O and C and also CO2 conversion atero enthalpy (thermoneutral) temperatures at different pressuresave been generated, analyzed and discussed in the proceeding sec-ion. Complete conversion of ethanol and oxygen was found in allases.tures in DATR of ethanol.
3. Results and discussion
3.1. Thermoneutral points for DATR of ethanol
Thermoneutral point (TNP) is the temperature at which zeronet enthalpy is obtained in the autothermal process. It is consid-ered as the best point for autothermal process operation. LowerTNPs are generally preferred to reduce heat losses. Fig. 1 depictsthe variation of TNP in DATR of ethanol with change in pres-sure, CER and OER. As seen from Fig. 1, the TNP increases withincrease in pressure at constant CER and OER and also increaseswith increase in OER at constant pressure and constant CER. How-ever, the TNP decreases with increase in CER at constant pressureand constant OER. At constant pressure, the TNP shows an increasewith a simultaneous increase in CER and OER, but it decreaseswith increase in CER and decrease in OER at constant pressure.Simultaneous increase in pressure, CER and OER generally increasesthe TNP except for one (P = 6 bar, CER = 1, OER = 0.3 and P = 9 bar,CER = 3, OER = 0.5) point. The TNP range obtained for increase inpressure from 1 bar to 9 bar, was from 436.05 ◦C to 603.55 ◦C(P = 1 bar), from 457.38 ◦C to 646.66 ◦C (P = 3 bar), from 469.74 ◦Cto 675.61 ◦C (P = 6 bar) and from 476.47 ◦C to 693.15 ◦C (P = 9 bar)at different CERs and OERs. The TNP range obtained for increase inCER from 1 to 3, was from 498.61 ◦C to 693.15 ◦C (CER = 1), from466.08 ◦C to 654.36 ◦C (CER = 2) and from 436.05 ◦C to 623.00 ◦C(CER = 3) for the considered pressure and OER range. The TNP rangeobtained for increase in OER from 0.1 to 0.5, was from 436.05 ◦C to568.32 ◦C (OER = 0.1), from 509.37 ◦C to 647.37 ◦C (OER = 0.3) andfrom 551.51 ◦C to 693.15 ◦C (OER = 0.5) for the considered pressureand CER range. The minimum TNP for every pressure were obtainedat CER = 3 and OER = 0.1 while the maximum TNPs were obtainedat CER = 1 and OER = 0.5. Considering all the data points, the mini-mum TNP of 436.05 ◦C was obtained at 1 bar pressure, CER = 3 andOER = 0.1 and the maximum TNP of 693.15 ◦C was found at 9 barpressure, CER = 1 and OER = 0.5.
3.2. Hydrogen yield at TNP
Hydrogen generation is one of the most desired applicationsof reforming processes. Thermoneutral operation of the process

G.R. Kale, B.D. Kulkarni / Chemical Engineering Journal 165 (2010) 864–873 867
0
0.2
0.4
0.6
0.8
1
1.2
1.4
1.6
1.8
5
ratu
Mo
les
of
hyd
rog
en
pro
du
ced
A1 = (CER = 1, OER = 0.1)
A2 = (CER = 1, OER = 0.3)
A3 = (CER = 1, OER = 0.5)
B1 = (CER = 2, OER = 0.1)
B2 = (CER = 2, OER = 0.3)
B3 = (CER = 2, OER = 0.5)
C1 = (CER = 3, OER = 0.1)
C2 = (CER = 3, OER = 0.3)
C3 = (CER = 3, OER = 0.5)
A1
B3
B2
B1
C3
C2
C1
A3
A2
Pressure = 1 bar
Pressure = 3 bar
Pressure = 6 bar
Pressure = 9 bar
therm
tvtdaBCadpadib(at(pif(iaCmCm
3
tmeOCd
430 480 530
Tempe
Fig. 2. Hydrogen yield at
o give higher hydrogen yield is highly desired. Fig. 2 shows theariation of hydrogen yield in DATR of ethanol at thermoneu-ral points at various pressures, CER and OER. The hydrogen yieldecreases with increase in pressure at constant CER and OER, andlso decreases with increase in CER at constant OER and pressure.ut the hydrogen yield increases with increase in OER at constantER and pressure. Similarly, with simultaneous increase in CERnd OER, the hydrogen yield increases at constant pressure. But itecreases when CER is increased and OER is decreased at constantressure. Simultaneous increase in pressure, CER and OER showsmixed trend (the hydrogen yield increases at some points and
ecreases at other points). The hydrogen yield obtained for increasen pressure from 1 bar to 9 bar, was from 0.48 to 1.72 moles (P = 1ar), from 0.36 to 1.51 moles (P = 3 bar), from 0.29 to 1.37 molesP = 6 bar) and from 0.26 to 1.29 moles (P = 9 bar) at different CERsnd OERs. The hydrogen yield obtained for increase in CER from 1o 3, was from 0.56 to 1.72 moles (CER = 1), from 0.38 to 1.45 molesCER = 2) and from 0.26 to 1.24 moles (CER = 3) for the consideredressure and OER range. The hydrogen yield obtained for increase
n OER from 0.1 to 0.5, was from 0.26 to 0.87 moles (OER = 0.1),rom 0.58 to 1.38 moles (OER = 0.3) and from 0.84 to 1.72 molesOER = 0.5) for the considered pressure and CER range. The min-mum hydrogen yield for every pressure was obtained at CER = 3nd OER = 0.1 and the maximum hydrogen yield was obtained atER = 1 and OER = 0.5. Considering all the data points, the maxi-um hydrogen yield of 1.72 moles was observed at 1 bar pressure,
ER = 1 and OER = 0.5, while the minimum hydrogen yield of 0.26oles was observed at 9 bar pressure, CER = 3 and OER = 0.1.
.3. CO yield at TNP
Carbon monoxide is an undesired gas for PEM fuel cell applica-ions but a desired component of syngas for GTL (gas-to-liquids)
anufacture. Fig. 3 shows the variation of CO yield in DATR ofthanol at thermoneutral points with variation in pressure, CER andER. The CO yield decreases with increase in pressure at constantER and OER, (but it was constant at CER = 1, OER = 0.1) and alsoecreases with increase in CER at constant pressure and constant
80 630 680 730
re (oC)
oneutral temperatures.
OER, but the CO yield increases with increase in OER at constantpressure and constant CER. The CO yield increases at constant pres-sure when CER and OER are increased simultaneously. The CO yielddecreases when CER is increased and OER is decreased at constantpressure. The CO yield increases when pressure is increased andCER is decreased simultaneously at constant OER. Simultaneousincrease in pressure, CER and OER increases the CO yield. The COyield obtained for increase in pressure for 1 bar to 9 bar, was from0.07 to 0.86 moles (P = 1 bar), from 0.06 to 0.84 moles (P = 3 bar),from 0.06 to 0.82 moles (P = 6 bar), and from 0.05 to 0.8 moles (P = 9bar). The CO yield obtained for increase in CER from 1 to 3, wasfrom 0.12 to 0.86 moles (CER = 1), from 0.08 to 0.81 moles (CER = 2)and from 0.05 to 0.74 moles (CER = 3) for the considered pressureand OER range. The CO yield obtained for increase in OER from0.1 to 0.5, was from 0.05 to 0.12 moles (OER = 0.1), from 0.29 to0.43 moles (OER = 0.3) and from 0.65 to 0.86 moles (OER = 0.5) forthe considered pressure and CER range. The minimum CO yield forevery pressure was obtained at CER = 3 and OER = 0.1 and the max-imum CO yield were obtained at CER = 1 and OER = 0.5. Consideringall the data points, it was observed that a minimum of 0.05 molesof CO were produced at 9 bar pressure, CER = 3 and OER = 0.1, whilea maximum of 0.86 moles were produced at 1 bar pressure, CER = 1and OER = 0.5.
3.4. Syngas (H2 + CO) amount at TNP
Syngas (H2 + CO) is important for petrochemical manufacture.The conditions for maximizing syngas yield are desired. The vari-ation in the amount of syngas moles obtained in DATR of ethanolat thermoneutral points with variation in pressure, CER and OERis shown in Fig. 4. As seen from the figure, the moles of syngasdecrease with increase in pressure at constant CER and OER, andalso decrease with increase in CER at constant pressure and con-
stant OER. But the syngas yield increases with increase in OER atconstant pressure and constant CER. The moles of syngas producedincrease when CER and OER are increased simultaneously at con-stant pressure. On the other hand, the moles of syngas produceddecrease when CER is increased and OER is decreased at constant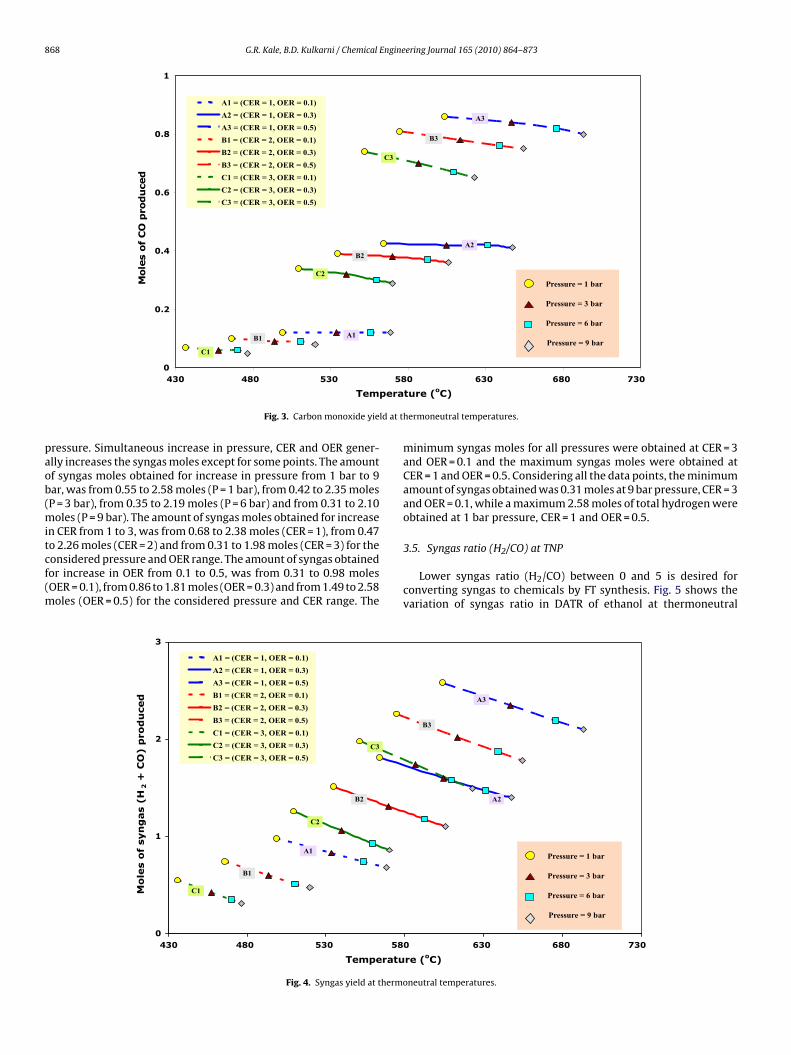
868 G.R. Kale, B.D. Kulkarni / Chemical Engineering Journal 165 (2010) 864–873
0
0.2
0.4
0.6
0.8
1
58
pera
Mole
s of
CO
pro
du
ced
A1 = (CER = 1, OER = 0.1)
A2 = (CER = 1, OER = 0.3)
A3 = (CER = 1, OER = 0.5)
B1 = (CER = 2, OER = 0.1)
B2 = (CER = 2, OER = 0.3)
B3 = (CER = 2, OER = 0.5)
C1 = (CER = 3, OER = 0.1)
C2 = (CER = 3, OER = 0.3)
C3 = (CER = 3, OER = 0.5)
A1
B3
B2
B1
C3
C2
C1
A3
A2
Pressure = 1 bar
Pressure = 3 bar
Pressure = 6 bar
Pressure = 9 bar
ld at t
paob(mitcf(m
530480430
Tem
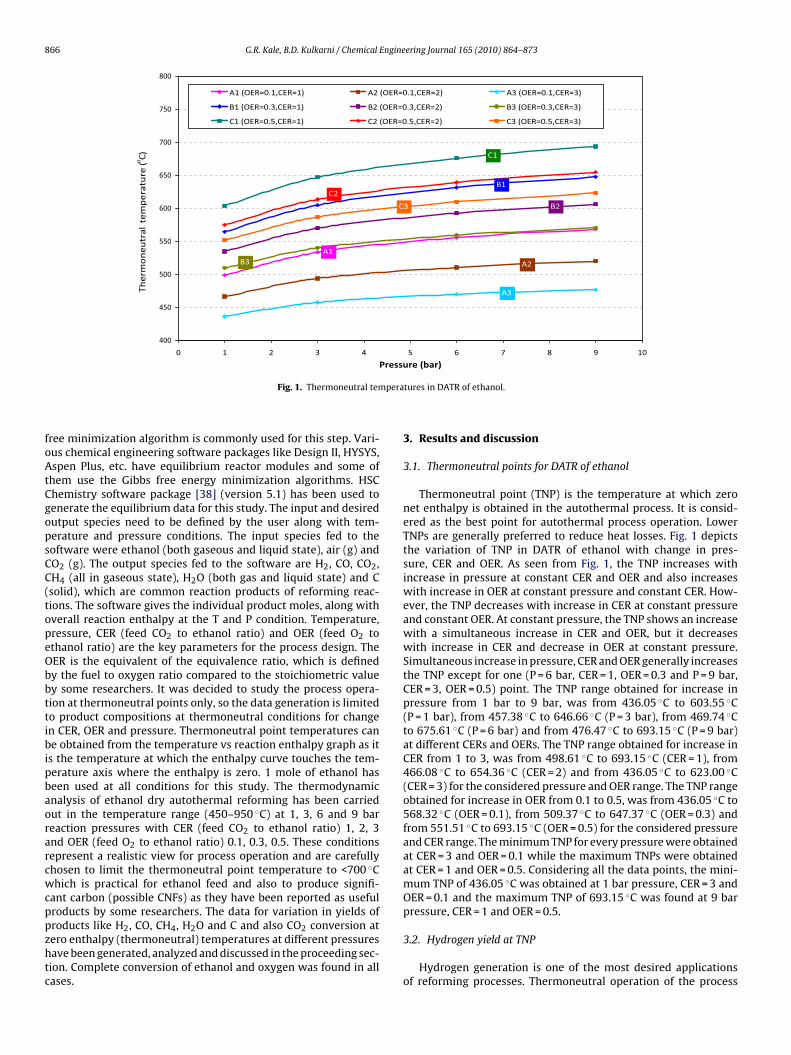
Fig. 3. Carbon monoxide yie
ressure. Simultaneous increase in pressure, CER and OER gener-lly increases the syngas moles except for some points. The amountf syngas moles obtained for increase in pressure from 1 bar to 9ar, was from 0.55 to 2.58 moles (P = 1 bar), from 0.42 to 2.35 molesP = 3 bar), from 0.35 to 2.19 moles (P = 6 bar) and from 0.31 to 2.10
oles (P = 9 bar). The amount of syngas moles obtained for increasen CER from 1 to 3, was from 0.68 to 2.38 moles (CER = 1), from 0.47
o 2.26 moles (CER = 2) and from 0.31 to 1.98 moles (CER = 3) for theonsidered pressure and OER range. The amount of syngas obtainedor increase in OER from 0.1 to 0.5, was from 0.31 to 0.98 molesOER = 0.1), from 0.86 to 1.81 moles (OER = 0.3) and from 1.49 to 2.58oles (OER = 0.5) for the considered pressure and CER range. The
0
1
2
3
58530480430
Temperatu
Mo
les o
f syn
gas (
H2 +
CO
) p
rod
uced
A1 = (CER = 1, OER = 0.1)
A2 = (CER = 1, OER = 0.3)
A3 = (CER = 1, OER = 0.5)
B1 = (CER = 2, OER = 0.1)
B2 = (CER = 2, OER = 0.3)
B3 = (CER = 2, OER = 0.5)
C1 = (CER = 3, OER = 0.1)
C2 = (CER = 3, OER = 0.3)
C3 = (CER = 3, OER = 0.5)
B1
B2
C1
C2
C3
A1
Fig. 4. Syngas yield at thermo
7306806300
ture (oC)
hermoneutral temperatures.
minimum syngas moles for all pressures were obtained at CER = 3and OER = 0.1 and the maximum syngas moles were obtained atCER = 1 and OER = 0.5. Considering all the data points, the minimumamount of syngas obtained was 0.31 moles at 9 bar pressure, CER = 3and OER = 0.1, while a maximum 2.58 moles of total hydrogen wereobtained at 1 bar pressure, CER = 1 and OER = 0.5.
3.5. Syngas ratio (H2/CO) at TNP
Lower syngas ratio (H2/CO) between 0 and 5 is desired forconverting syngas to chemicals by FT synthesis. Fig. 5 shows thevariation of syngas ratio in DATR of ethanol at thermoneutral
7306806300
re (oC)
A3
B3
A2
Pressure = 1 bar
Pressure = 3 bar
Pressure = 6 bar
Pressure = 9 bar
neutral temperatures.
G.R. Kale, B.D. Kulkarni / Chemical Engineering Journal 165 (2010) 864–873 869
1
2
3
4
5
6
7
8
730680630580530480430
era
Syn
gas r
ati
o (
H2/C
O)
A1 = (CER = 1, OER = 0.1)
A2 = (CER = 1, OER = 0.3)
A3 = (CER = 1, OER = 0.5)
B1 = (CER = 2, OER = 0.1)
B2 = (CER = 2, OER = 0.3)
B3 = (CER = 2, OER = 0.5)
C1 = (CER = 3, OER = 0.1)
C2 = (CER = 3, OER = 0.3)
C3 = (CER = 3, OER = 0.5)
A3
B1
B2
B3
C1
C2
C3
A1
A2
Pressure = 1 bar
Pressure = 3 bar
Pressure = 6 bar
Pressure = 9 bar
hermo
ptCirpOsBdpsftg7(s4twpOae1r
3
dmtscAd
Temp
Fig. 5. Syngas ratio at t
oints with variation in pressure, CER and OER. It was seen thathe syngas ratio decreased with increase in pressure at constantER and OER, the decrease was much more for lower OERs. With
ncrease in OER at constant pressure and constant CER, the syngasatio decreased considerably. Also with increase in CER at constantressure and constant OER, the syngas ratio decreased (except atER = 0.1). It was observed that when CER and OER were increased
imultaneously, the syngas ratio decreased at constant pressure.ut at constant pressure, when CER was increased and OER wasecreased, the syngas ratio increased. Simultaneous increase inressure, CER and OER decreased the syngas ratio. The range ofyngas ratio obtained for increase in pressure from 1 to 9 bar, wasrom 1.69 to 7.34 (P = 1 bar), from 1.49 to 5.93 (P = 3 bar), from 1.37o 5.23 (P = 6 bar) and from 1.30 to 4.82 (P = 9 bar). The range of syn-as ratio obtained for increase in CER from 1 to 3, was from 1.59 to.34 (CER = 1), from 1.38 to 6.42 (CER = 2) and from 1.3 to 6.46 molesCER = 3) for the considered pressure and OER range. The range ofyngas ratio obtained for increase in OER from 0.1 to 0.5, was from.53 to 7.34 (OER = 0.1), from 2.03 to 3.21 (OER = 0.3) and from 1.30o 2.01 (OER = 0.5) for the considered pressure and CER range. Itas observed that the range of syngas ratio decreases at higherressures. The minimum syngas ratio was obtained at CER = 3 andER = 0.5 and the maximum syngas ratio was obtained at CER = 1nd OER = 0.1 (except at 9 bar) for all pressures considered. Consid-ring all the data points, the minimum syngas ratio obtained was.30 at 9 bar pressure, CER = 3 and OER = 0.5, and maximum syngasatio of 7.34 was observed at 1 bar pressure, CER = 1 and OER = 0.1.
.6. Methane formation at TNP
Methane formation is inevitable in reforming processes. Fig. 6epicts the variation of CH4 formation in DATR of ethanol at ther-oneutral points with change in pressure, CER and OER. It was seen
hat, the CH4 formation increases with increase in pressure at con-tant CER and OER. It was observed that with increase in OER atonstant pressure and constant CER, the CH4 formation decreased.lso at constant pressure and constant OER, the CH4 formationecreased with increase in CER. Similarly at constant pressure when
ture (oC)
neutral temperatures.
CER and OER were increased, the CH4 formation decreased gradu-ally. When CER was increased and OER was decreased, the methaneformation increased at constant pressure except for P = 9 bar. Simul-taneous increase in pressure, CER and OER generally decreases theCH4 formation except for some points. The moles of CH4 obtainedfor increase in pressure from 1 to 9 bar was from 0.17 to 0.42 (P = 1bar), from 0.22 to 0.49 (P = 3 bar), from 0.25 to 0.52 (P = 6 bar) andfrom 0.27 to 0.55 (P = 9 bar). The moles of methane obtained forincrease in CER from 1 to 3, was from 0.20 to 0.55 (CER = 1), from0.19 to 0.43 (CER = 2) and from 0.17 to 0.35 (CER = 3) for the con-sidered pressure and OER range. The moles of methane formed forincrease in OER from 0.1 to 0.5, was from 0.28 to 0.55 (OER = 0.1),from 0.22 to 0.42 (OER = 0.3) and from 0.17 to 0.33 (OER = 0.5) for theconsidered pressure and CER range. The minimum CH4 yield for allpressure conditions was obtained at CER = 3 and OER= 0.5, while themaximum CH4 was obtained at CER = 1 and OER = 0.1. Consideringall the data points, minimum of 0.17 moles of CH4 were obtained at1 bar pressure, CER = 3 and OER = 0.5 and a maximum of 0.55 molesof CH4 were obtained at 9 bar pressure, CER = 1 and OER = 0.1.
3.7. Water formation at TNP
Water formation is undesirable in reforming processes as itdecreases the hydrogen yield. But water formation cannot beavoided. Fig. 7 depicts the variation in H2O yield in DATR of ethanolat thermoneutral points at specified pressures, CER and OER. FromFig. 7, it was seen that the moles of H2O produced increased withincrease in pressure at constant CER and OER but the moles of H2Oproduced decreased with increase in OER at constant pressure andconstant CER. When CER was increased at constant pressure andconstant OER, the moles of H2O produced increased. Similarly, atconstant pressure when CER and OER were increased simultane-ously, the moles of H2O produced increased at some points and
decreased at other points. It was observed that at constant pressurewhen CER was increased and OER was decreased, the moles of H2Oproduced gradually increased. Simultaneous increase in pressure,CER and OER generally increases the H2O except for some points.The moles of H2O produced for increase in pressure from 1 to 9 bar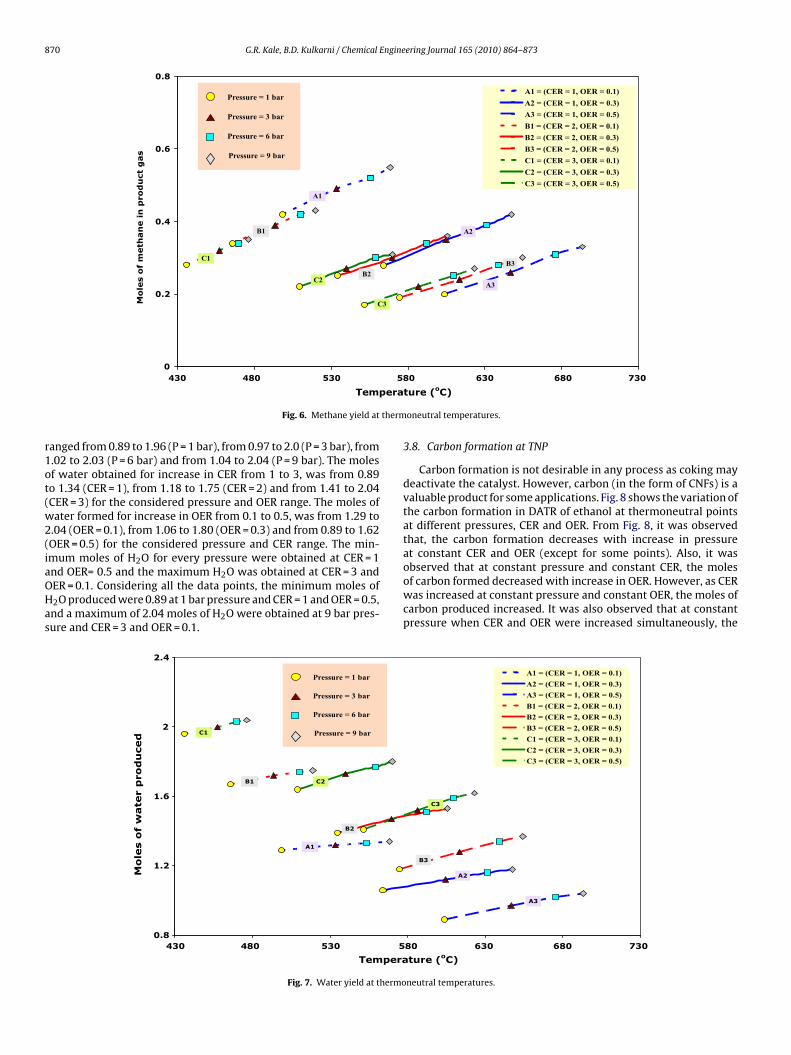
870 G.R. Kale, B.D. Kulkarni / Chemical Engineering Journal 165 (2010) 864–873
0
0.2
0.4
0.6
0.8
58
era
Mo
les o
f m
eth
an
e i
n p
rod
uct
gas
A1 = (CER = 1, OER = 0.1)
A2 = (CER = 1, OER = 0.3)
A3 = (CER = 1, OER = 0.5)
B1 = (CER = 2, OER = 0.1)
B2 = (CER = 2, OER = 0.3)
B3 = (CER = 2, OER = 0.5)
C1 = (CER = 3, OER = 0.1)
C2 = (CER = 3, OER = 0.3)
C3 = (CER = 3, OER = 0.5)
A3
B1
B2
B3C1
C2
C3
A1
A2
Pressure = 1 bar
Pressure = 3 bar
Pressure = 6 bar
Pressure = 9 bar
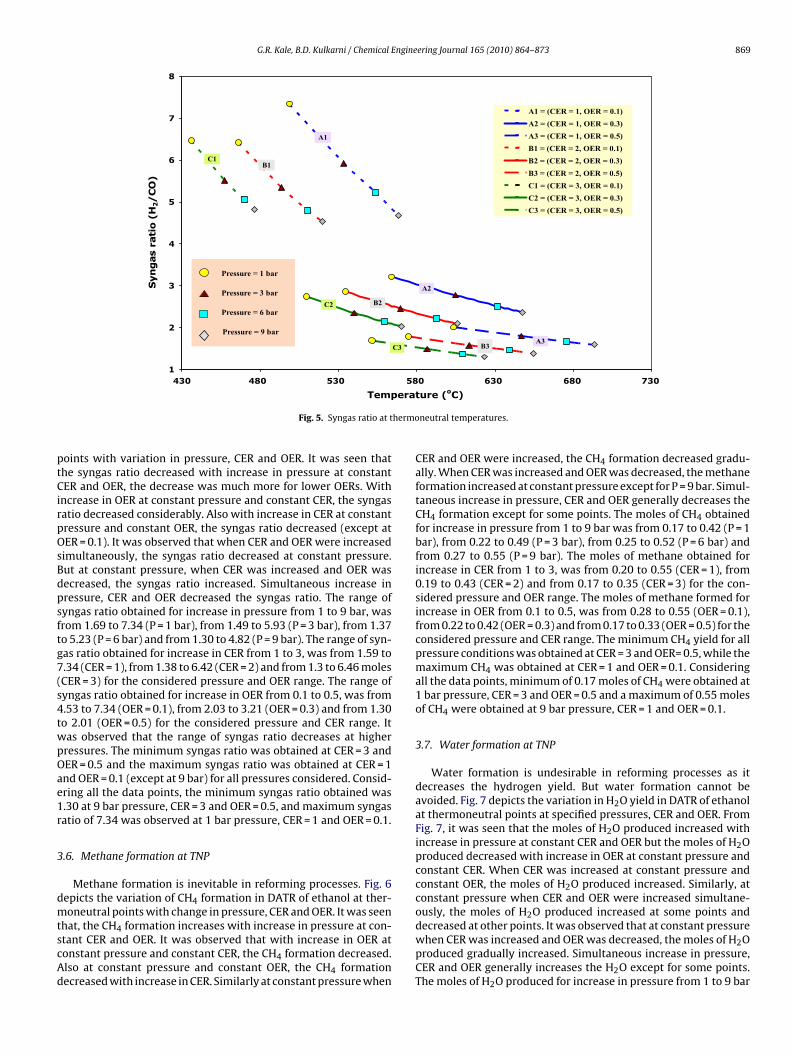
therm
r1ot(w2(iaOHas
530480430
Temp
Fig. 6. Methane yield at
anged from 0.89 to 1.96 (P = 1 bar), from 0.97 to 2.0 (P = 3 bar), from.02 to 2.03 (P = 6 bar) and from 1.04 to 2.04 (P = 9 bar). The molesf water obtained for increase in CER from 1 to 3, was from 0.89o 1.34 (CER = 1), from 1.18 to 1.75 (CER = 2) and from 1.41 to 2.04CER = 3) for the considered pressure and OER range. The moles ofater formed for increase in OER from 0.1 to 0.5, was from 1.29 to
.04 (OER = 0.1), from 1.06 to 1.80 (OER = 0.3) and from 0.89 to 1.62OER = 0.5) for the considered pressure and CER range. The min-mum moles of H2O for every pressure were obtained at CER = 1
nd OER= 0.5 and the maximum H2O was obtained at CER = 3 andER = 0.1. Considering all the data points, the minimum moles of2O produced were 0.89 at 1 bar pressure and CER = 1 and OER = 0.5,nd a maximum of 2.04 moles of H2O were obtained at 9 bar pres-ure and CER = 3 and OER = 0.1.0.8
1.2
1.6
2
2.4
5530480430
Tempera
Mo
les o
f w
ate
r p
rod
uced
B1
B2
C1
C2
A1
Pressure = 1 bar
Pressure = 3 bar
Pressure = 6 bar
Pressure = 9 bar
Fig. 7. Water yield at thermo
7306806300
ture (oC)
oneutral temperatures.
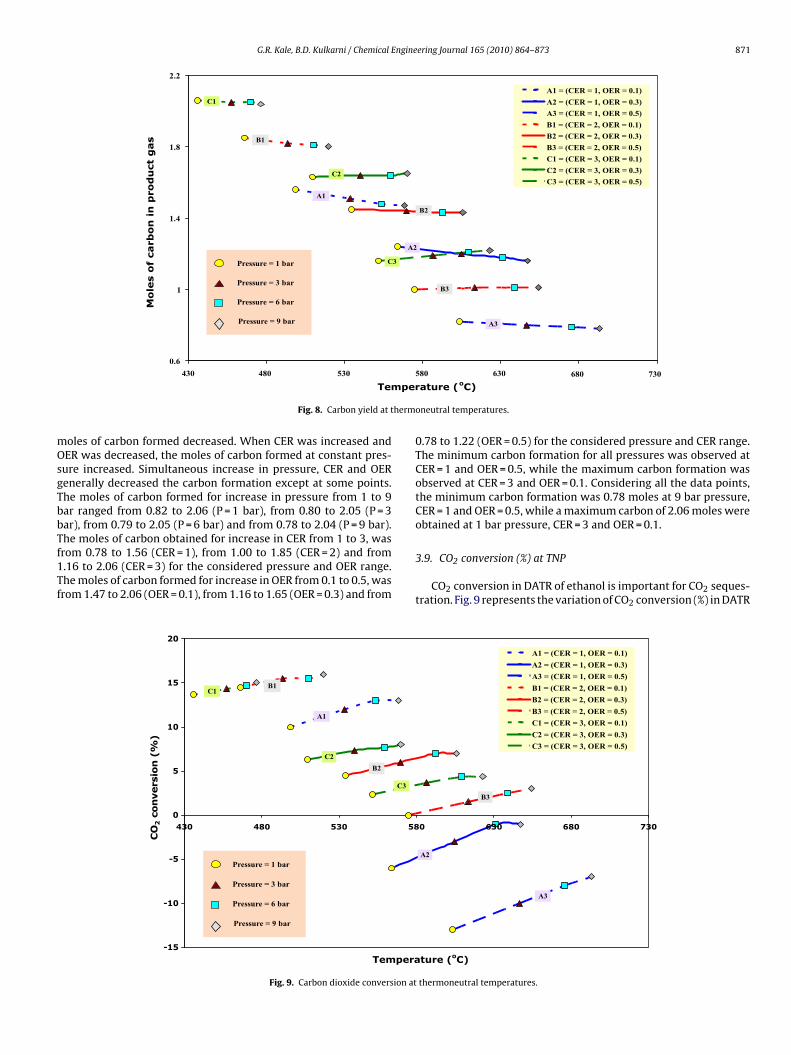
3.8. Carbon formation at TNP
Carbon formation is not desirable in any process as coking maydeactivate the catalyst. However, carbon (in the form of CNFs) is avaluable product for some applications. Fig. 8 shows the variation ofthe carbon formation in DATR of ethanol at thermoneutral pointsat different pressures, CER and OER. From Fig. 8, it was observedthat, the carbon formation decreases with increase in pressureat constant CER and OER (except for some points). Also, it was
observed that at constant pressure and constant CER, the molesof carbon formed decreased with increase in OER. However, as CERwas increased at constant pressure and constant OER, the moles ofcarbon produced increased. It was also observed that at constantpressure when CER and OER were increased simultaneously, the73068063080
ture (oC)
A1 = (CER = 1, OER = 0.1)
A2 = (CER = 1, OER = 0.3)
A3 = (CER = 1, OER = 0.5)
B1 = (CER = 2, OER = 0.1)
B2 = (CER = 2, OER = 0.3)
B3 = (CER = 2, OER = 0.5)
C1 = (CER = 3, OER = 0.1)
C2 = (CER = 3, OER = 0.3)
C3 = (CER = 3, OER = 0.5)
A3
B3
C3
A2
neutral temperatures.
G.R. Kale, B.D. Kulkarni / Chemical Engineering Journal 165 (2010) 864–873 871
0.6
1
1.4
1.8
2.2
per
Mo
les o
f carb
on
in
pro
du
ct
gas
A1 = (CER = 1, OER = 0.1)
A2 = (CER = 1, OER = 0.3)
A3 = (CER = 1, OER = 0.5)
B1 = (CER = 2, OER = 0.1)
B2 = (CER = 2, OER = 0.3)
B3 = (CER = 2, OER = 0.5)
C1 = (CER = 3, OER = 0.1)
C2 = (CER = 3, OER = 0.3)
C3 = (CER = 3, OER = 0.5)
A3
B1
B2
B3
C1
C2
C3
A1
A2
Pressure = 1 bar
Pressure = 3 bar
Pressure = 6 bar
Pressure = 9 bar
herm
mOsgTbbTf1Tf
530480430
Tem
Fig. 8. Carbon yield at t
oles of carbon formed decreased. When CER was increased andER was decreased, the moles of carbon formed at constant pres-
ure increased. Simultaneous increase in pressure, CER and OERenerally decreased the carbon formation except at some points.he moles of carbon formed for increase in pressure from 1 to 9ar ranged from 0.82 to 2.06 (P = 1 bar), from 0.80 to 2.05 (P = 3ar), from 0.79 to 2.05 (P = 6 bar) and from 0.78 to 2.04 (P = 9 bar).
he moles of carbon obtained for increase in CER from 1 to 3, wasrom 0.78 to 1.56 (CER = 1), from 1.00 to 1.85 (CER = 2) and from.16 to 2.06 (CER = 3) for the considered pressure and OER range.he moles of carbon formed for increase in OER from 0.1 to 0.5, wasrom 1.47 to 2.06 (OER = 0.1), from 1.16 to 1.65 (OER = 0.3) and from-15
-10
-5
0
5
10
15
20
430 480 530 58
Tempera
CO
2 c
onvers
ion (
%)
B1
B2
C1
C2
C3
A1
Pressure = 1 bar
Pressure = 3 bar
Pressure = 6 bar
Pressure = 9 bar
Fig. 9. Carbon dioxide conversion at
730680630580
ature (oC)
oneutral temperatures.
0.78 to 1.22 (OER = 0.5) for the considered pressure and CER range.The minimum carbon formation for all pressures was observed atCER = 1 and OER = 0.5, while the maximum carbon formation wasobserved at CER = 3 and OER = 0.1. Considering all the data points,the minimum carbon formation was 0.78 moles at 9 bar pressure,CER = 1 and OER = 0.5, while a maximum carbon of 2.06 moles wereobtained at 1 bar pressure, CER = 3 and OER = 0.1.
3.9. CO2 conversion (%) at TNP
CO2 conversion in DATR of ethanol is important for CO2 seques-tration. Fig. 9 represents the variation of CO2 conversion (%) in DATR
0 630 680 730
ture (oC)
A1 = (CER = 1, OER = 0.1)
A2 = (CER = 1, OER = 0.3)
A3 = (CER = 1, OER = 0.5)
B1 = (CER = 2, OER = 0.1)
B2 = (CER = 2, OER = 0.3)
B3 = (CER = 2, OER = 0.5)
C1 = (CER = 3, OER = 0.1)
C2 = (CER = 3, OER = 0.3)
C3 = (CER = 3, OER = 0.5)
A3
B3
A2
thermoneutral temperatures.
8 Engine
oOiOdcoaivibfifto1tmaOmip
4
eiipTddnmaocav4irbbdocoiplta
R
[
[
[
[
[
[
[
[
[
[
[
[
[
[
[
[
[
[
[
[
[
72 G.R. Kale, B.D. Kulkarni / Chemical
f ethanol at thermoneutral point at different pressures, CER andER. From Fig. 9, it is seen that, the CO2 conversion increases with
ncrease in pressure at constant CER and OER and with increase inER at constant pressure and constant CER, the CO2 conversionecreases. Also at constant pressure and constant OER, the CO2onversion increases (except for OER = 0.1) with increase in CERf the process. Also at constant pressure when CER is increasednd OER is decreased, the CO2 conversion increases. Simultaneousncrease in pressure, CER and OER generally decreases the CO2 con-ersion except for some points. The CO2 conversion (%) obtained forncrease in pressure from 1 to 9 bar ranged from −13.0 to 14.5 (P = 1ar), from −10.0 to 15.5 (P = 3 bar), from −8.0 to 15.5 (P = 6 bar) androm −7.0 to 16.0 (P = 9 bar). The CO2 conversion (%) obtained forncrease in CER from 1 to 3, was from −13.00 to +13.00 (CER = 1),rom 0.00 to 16.00 (CER = 2) and from 2.33 to 15.00 (CER = 3) forhe considered pressure and OER range. The CO2 conversion (%)btained for increase in OER from 0.1 to 0.5, was from 10.00 to6.00 (OER = 0.1), from −6.00 to 8.00 (OER = 0.3) and from −13.00o 4.33 (OER = 0.5) for the considered pressure and CER range. The
inimum CO2 conversions were obtained at CER = 1 and OER = 0.5nd the maximum CO2 conversions were obtained at CER = 2 andER = 0.1 for all the pressures. The CO2 conversion varied from ainimum of −13% at 1 bar pressure, CER = 1 and OER = 0.5 to a max-
mum of 16% at 9 bar pressure, CER = 2 and OER = 0.1, for all the dataoints considered.
. Conclusions
The product composition at thermoneutral points for DATR ofthanol at various pressures showed some interesting results. Max-mum carbon formation was observed at OER = 0.1 and CER = 3 andt decreased with increase in pressure; hence thermo-neutral lowressure operation can be used to produce carbon (possibly CNFs).he syngas ratio ranged between 7.34 to 1.30 and the syngas ratioecreased with increase in pressure, and as lower syngas ratios areesirable for petrochemical manufacture by FT synthesis, thermo-eutral higher pressure operation can be used for this purpose. Theaximum syngas (total H2) was formed at CER = 1 and OER = 0.5,
nd it reduced with increase in pressure, so lower pressure TNPperation can be used for hydrogen/syngas manufacture for fuelells. Higher CO2 conversion was observed for CER = 2 and OER = 0.1nd higher pressures making this process effective for CO2 con-ersion (CO2 sequestration). Thermoneutral points ranged from36.05 to 693.15 ◦C which are practically achievable temperatures
n ethanol chemical processes. Depending upon the desired productequirements, the system pressure and thermoneutral points cane chosen for process operation. Syngas (of a particular ratio), car-on (in the form of CNFs), syngas moles (total H2) are the usualesired products. A maximum of 2.58 moles of total hydrogenbtained at 1 bar, CER = 1 and OER = 0.5 producing 0.82 moles ofarbon, of syngas ratio 2.01 with 0.20 moles of CH4 and 0.89 molesf water for the TNP = 603.55 ◦C was found to be the best operat-ng thermoneutral point for value added product generation. Lowerressure TNP operation is favored for higher hydrogen production,
ower methane and water formation. Higher pressure TNP opera-ion is favored for lower syngas ratio with higher CO2 conversionnd sometimes lower carbon formation.
eferences
[1] J.D. Figueroa, T. Fout, S. Plasynski, H. McIlvried, R.D. Srivastava, Advances in
CO2 capture technology—the U.S. Department of Energy’s Carbon SequestrationProgram, Int. J. Greenh. Gas Control 2 (1) (2008) 9–20.[2] A.L. Chaffee, G.P. Knowles, Z. Liang, J. Zhang, P. Xiao, P.A. Webley, CO2 capture byadsorption: materials and process development, Int. J. Greenh. Gas Control 1-1(2007), 8th International Conference on Greenhouse Gas Control Technologies– GHGT-8, 11-18.
[
[
ering Journal 165 (2010) 864–873
[3] K. Sasaki, T. Fujii, Y. Niibori, T. Ito, T. Hashida, Numerical simulation of super-critical CO2 injection into subsurface rock masses, Energy Convers. Manag. 49(1) (2008) 54–61.
[4] X. Xie, M.J. Economides, The impact of carbon geological sequestration, J. Nat.Gas. Sci. Eng. 1 (3) (2009) 103–111.
[5] S. Jankhah, N. Abatzoglou, F. Gitzhofer, Thermal and catalytic dry reforming andcracking of ethanol for hydrogen and carbon nanofilaments’ production, Int. J.Hydrogen Energy 33 (18) (2008) 4769–4779.
[6] J. Blanchard, H. Oudghiri-Hassani, N. Abatzoglou, S. Jankhah, F. Gitzhofer, Syn-thesis of nanocarbons via ethanol dry reforming over a carbon steel catalyst,Chem. Eng. J. 143 (1) (2008) 186–194.
[7] D.J. Wilhelm, D.R. Simbeck, A.D. Karp, R.L. Dickenson, Syngas production for gas-to-liquids applications: technologies, issues and outlook, Fuel Process Technol.71 (1) (2001) 139–148.
[8] K. Goransson, U. Soderlind, J. He, W. Zhang, Review of syngas production viabiomass DFBGs, Renewable Sustainable Energy Rev. (2010), Accepted Articlein press, doi:10.1016/j.rser.2010.09.032.
[9] W. Zhang, Automotive fuels from biomass via gasification, Fuel Process. Tech-nol. 91 (8) (2010) 866–876, Gasification: Fundamentals and application.
10] C.H. Smith, D.M. Leahey, L.E. Miller, J.L. Ellzey, Conversion of wet ethanolto syngas via filtration combustion: an experimental and computationalinvestigation, Proc. Combust. Inst. (2010), Accepted Article in press,doi:10.1016/j.proci.2010.06.006.
11] K. Vasudeva, N. Mitra, P. Umasankar, S.C. Dhingra, Steam reforming of ethanolfor hydrogen production: thermodynamic analysis, Int. J. Hydrogen Energy 21(1) (1996) 13–18.
12] E.Y. Garcia, M.A. Laborde, Hydrogen-production by the steam reforming ofethanol – thermodynamic analysis, Int. J. Hydrogen Energy 16 (5) (1991)307–312.
13] I. Fishtik, A. Alexander, R. Datta, D. Geana, A thermodynamic analysis of hydro-gen production by steam reforming of ethanol via response reactions, Int. J.Hydrogen Energy 25 (1) (2000) 31–45.
14] J. Comas, M. Laborde, N. Amadeo, Thermodynamic analysis of hydrogen pro-duction from ethanol using CaO as a CO2 sorbent, J. Power Sources 138 (1)(2004) 61–67.
15] A.C.C. De Souza, J. Luz-Silveira, M.I. Sosa, Physical–chemical and thermody-namic analyses of ethanol steam reforming for hydrogen production, J. FuelCell Sci. Technol. 3 (3) (2006) 346–350.
16] A.L. Da Silva, C. De, F. Malfatti, I.L. Muller, Thermodynamic analysis of ethanolsteam reforming using gibbs energy minimization method: a detailed studyof the conditions of carbon deposition, Int. J. Hydrogen Energy 34 (10) (2009)4321–4330.
17] M. Ni, D.Y.C. Leung, M.K.H. Leung, A review on reforming bio-ethanol for hydro-gen production, Int. J. Hydrogen Energy 32 (15) (2007) 3238–3247.
18] A. Haryanto, S. Fernando, N. Murali, S. Adhikari, Current status of hydrogenproduction techniques by steam reforming of ethanol: a review, Energy Fuels19 (5) (2005) 2098–2106.
19] P.D. Vaidya, A.E. Rodrigues, Insight into steam reforming of ethanol to producehydrogen for fuel cells, Chem. Eng. J. 117 (1) (2006) 39–49.
20] D.R. Sahoo, S. Vajpai, S. Patel, K.K. Pant, Kinetic modeling of steam reformingof ethanol for the production of hydrogen over Co/Al2O3 catalyst, Chem. Eng. J.125 (3) (2007) 139–147.
21] P.D. Vaidya, A.E. Rodrigues, Kinetics of steam reforming of ethanol over aRu/Al2O3 catalyst, Ind. Eng. Chem. Res. 45 (19) (2006) 6614–6618.
22] P.V. Mathure, S. Ganguly, A.V. Patwardhan, R.K. Saha, Steam reforming ofethanol using a commercial nickel-based catalyst, Ind. Eng. Chem. Res. 46(2007) 8471–8479.
23] S. Liu, K. Zhang, L. Fang, Y. Li, Thermodynamic analysis of hydrogen produc-tion from oxidative steam reforming of ethanol, Energy Fuels 22 (2) (2008)1365–1370.
24] P. Biswas, D. Kunzru, Oxidative steam reforming of ethanol over Ni/CeO2-ZrO2
catalyst, Chem. Eng. J. 136 (1) (2007) 41–49.25] H.Q. Chen, H. Yu, Y. Tang, M.Q. Pan, G.X. Yang, F. Peng, H.J. Wang, J. Yang, Hydro-
gen production via autothermal reforming of ethanol over noble metal catalystssupported on oxides, J. Nat. Gas Chem. 18 (2) (2009) 191–198.
26] W.J. Cai, F.G. Wang, A.C. Van Veen, H. Provendier, C. Mirodatos, W.J. Shen,Autothermal reforming of ethanol for hydrogen production over an Rh/CeO2
catalyst, Catal. Today 138 (3) (2008) 152–156.27] G.A. Deluga, J.R. Salge, L.D. Schmidt, X.E. Verykios, Renewable hydrogen
from ethanol by autothermal reforming, Science 303 (5660) (2004) 993–997.
28] D. Markova, G. Bazbauers, K. Valters, R.A. Arias, C. Weuffen, L. Rochlitz, Opti-mization of bio-ethanol autothermal reforming and carbon monoxide removalprocesses, J. Power Sources 193 (1 (Special Issue)) (2009) 9–16.
29] M.H. Youn, J.G. Seo, P. Kim, J.J. Kim, H.I. Lee, I.K. Song, Hydrogen production byauto-thermal reforming of ethanol over Ni/-gamma-Al2O3 catalysts: effect ofsecond metal addition, J. Power Sources 162 (2) (2006) 1270–1274.
30] S.M. De Lima, I.O. Da Cruz, G. Jacobs, B.H. Davis, L.V. Mattos, F.B. Noronha, Steamreforming, partial oxidation, and oxidative steam reforming of ethanol overPt/CeZrO2 catalyst, J. Catal. 257 (2) (2008) 356–368.
31] W. Cai, B. Zhang, Y. Li, Y. Xu, W. Shen, Hydrogen production by oxidative steamreforming of ethanol over an Ir/CeO2 catalyst, Catal. Commun. 8 (11) (2007)1588–1594.
32] S. Jankhah, N. Abatzoglou, Thermal and catalytic dry reforming and cracking ofethanol for hydrogen and carbon nanofilaments’ production, Intl. J. HydrogenEnergy 33 (18) (2008) 4769–4779.

Engine
[
[
[
G.R. Kale, B.D. Kulkarni / Chemical
33] W.J. Wang, Y.Q. Wang, Dry reforming of ethanol for hydrogen production: ther-modynamic investigation, Int. J. Hydrogen Energy 34 (13) (2009) 5382–5389.
34] K. De Oliveira-Vigier, N. Abatzoglou, Dry-reforming of ethanol in the presenceof a 316 stainless steel catalyst, Can. J. Chem. Eng. 83 (6) (2005) 978–984.
35] G.R. Kale, B.D. Kulkarni, Thermodynamic analysis of dry autothermal reformingof glycerol, Fuel Process. Technol. 91 (2010) 520–530.
[
[
[
ering Journal 165 (2010) 864–873 873
36] G.R. Kale, B.D. Kulkarni, A.R. Joshi, Thermodynamic study of combining chem-ical looping combustion and combined reforming of propane, Fuel 89 (2010)3141–3146.
37] S. Ahmed, M. Krumpelt, Hydrogen from hydrocarbon fuels for fuel cells, Int. J.Hydrogen Energy 26 (2001) 291–301.
38] HSC Chemistry [software]. Version 5.1 Pori: Outokumpu Research Oy (2002).
Related Documents