Thermomechanical Processing Environment and Morphology Development of a Thermotropic Polymer Liquid Crystal Ju ´ lio C. Viana, 1 Ricardo Simo ˜es, 1,3 Joa ˜o F. Mano, 2 Maria. J. Oliveira, 1 Zlatan Z. Denchev, 1 Witold Brostow, 3 Anto ´nio M. Cunha 1 1 IPC - Institute for Polymers and Composites, Department of Polymer Engineering, University of Minho, 4800-058 Guimaraes, Portugal 2 3B’s Research Group in Biomaterials, Biodegradable, Biomimetics, Department of Polymer Engineering, University of Minho, 4800-058 Guimaraes, Portugal 3 Laboratory of Advanced Polymers & Optimized Materials (LAPOM), Department of Materials Science and Engineering, University of North Texas, Denton, Texas 76203-5310 Received 4 January 2007; accepted 12 May 2007 DOI 10.1002/app.30087 Published online 30 October 2009 in Wiley InterScience (www.interscience.wiley.com). ABSTRACT: We have studied a longitudinal polymer liquid crystal consisting of poly(ethylene terephthalate) (PET) and p-hydroxybenzoic acid, namely PET/0.6PHB, where 0.6 is the mole fraction of the second component. The material was injection molded with systematic varia- tions of the melt and mold temperatures and injection flow rate using design of experiments based on a Taguchi orthogonal array. Thermomechanical environment defined by local melt temperatures and shear rates and stresses imposed during processing was estimated by computer simulations of the mold-filling phase. The morphology of the moldings was characterized by optical and scanning electronic microscopy, wide- and small-angle X-ray scatter- ing, and differential scanning calorimetry. An analysis of variance approach identified the significant processing var- iables and their contributions to variations of morphologi- cal parameters. The processing environment affects strongly the melt viscosity, and there is a strong thermo- mechanical coupling. The result is a complex multilami- nated and hierarchical microstructure, whose morphologi- cal features are very sensitive to the processing conditions. Relationships between local thermomechanical variables (rather than global ones) and the morphological parame- ters are established. V V C 2009 Wiley Periodicals, Inc. J Appl Polym Sci 115: 2991–3004, 2010 Key words: polymer liquid crystal; injection molding; processing; thermomechanical environment; morphology INTRODUCTION Polymer liquid crystals (PLCs) are high performance polymers and exhibit an advantageous combination of properties, particularly in applications requiring high thermal and mechanical performance, high chemical resistance, and high dimensional stability. However, their high cost has limited the widespread use of these polymers, promoting their blending with thermoplastics engineering polymers. 1–3 Longitudinal (or main-chain) PLCs are copolymers comprised of rigid liquid crystalline (LC) sequences connected to flexible sequences by chemical bonds. The rigid mesogenic groups are exclusively in the main chain and are oriented parallel to it (so-called a-type PLC). 3–6 This segmental nature allows easy orientation of the rigid segments under external applied fields, whether electric, magnetic, or me- chanical. 7–13 In fact, their thermotropic character allows them to be transformed by melt processing techniques, such as injection molding, because of their low viscosity resultant from the easy orienta- tion of the rigid segments in the flowing melt. Because of high relaxation times of PLCs, the orien- tation induced by the flow cannot easily relax during subsequent cooling, leading to highly oriented struc- tures (self-reinforced polymers) with exceptional me- chanical behavior and highly anisotropic character. 14,15 Methods for successful prediction of long-term performance of PLCs from short-term tests have been developed. 16,17 In a PLC, the rigid phase is inhomogeneously dis- persed throughout the material forming a Journal of Applied Polymer Science, Vol. 115, 2991–3004 (2010) V V C 2009 Wiley Periodicals, Inc. Correspondence to: J. C. Viana ([email protected]). Contract grant sponsor: DESY and the European Commission (under HASYLAB Project DESY-D-II-05-101 EC). Contract grant sponsor: Robert A. Welch Foundation, Houston; contract grant numbers: B-1203, FP6, RII3-CT- 2004-506008. Contract grant sponsor: FCT - Portuguese Foundation for Science and Technology, Lisbon (through the POCTI and FEDER programmes).

Welcome message from author
This document is posted to help you gain knowledge. Please leave a comment to let me know what you think about it! Share it to your friends and learn new things together.
Transcript
Thermomechanical Processing Environment andMorphology Development of a ThermotropicPolymer Liquid Crystal
Julio C. Viana,1 Ricardo Simoes,1,3 Joao F. Mano,2 Maria. J. Oliveira,1
Zlatan Z. Denchev,1 Witold Brostow,3 Antonio M. Cunha1
1IPC - Institute for Polymers and Composites, Department of Polymer Engineering,University of Minho, 4800-058 Guimaraes, Portugal23B’s Research Group in Biomaterials, Biodegradable, Biomimetics,Department of Polymer Engineering, University of Minho, 4800-058 Guimaraes, Portugal3Laboratory of Advanced Polymers & Optimized Materials (LAPOM), Department of Materials Science andEngineering, University of North Texas, Denton, Texas 76203-5310
Received 4 January 2007; accepted 12 May 2007DOI 10.1002/app.30087Published online 30 October 2009 in Wiley InterScience (www.interscience.wiley.com).
ABSTRACT: We have studied a longitudinal polymerliquid crystal consisting of poly(ethylene terephthalate)(PET) and p-hydroxybenzoic acid, namely PET/0.6PHB,where 0.6 is the mole fraction of the second component.The material was injection molded with systematic varia-tions of the melt and mold temperatures and injectionflow rate using design of experiments based on a Taguchiorthogonal array. Thermomechanical environment definedby local melt temperatures and shear rates and stressesimposed during processing was estimated by computersimulations of the mold-filling phase. The morphology ofthe moldings was characterized by optical and scanningelectronic microscopy, wide- and small-angle X-ray scatter-ing, and differential scanning calorimetry. An analysis of
variance approach identified the significant processing var-iables and their contributions to variations of morphologi-cal parameters. The processing environment affectsstrongly the melt viscosity, and there is a strong thermo-mechanical coupling. The result is a complex multilami-nated and hierarchical microstructure, whose morphologi-cal features are very sensitive to the processing conditions.Relationships between local thermomechanical variables(rather than global ones) and the morphological parame-ters are established. VVC 2009 Wiley Periodicals, Inc. J ApplPolym Sci 115: 2991–3004, 2010
Key words: polymer liquid crystal; injection molding;processing; thermomechanical environment; morphology
INTRODUCTION
Polymer liquid crystals (PLCs) are high performancepolymers and exhibit an advantageous combinationof properties, particularly in applications requiringhigh thermal and mechanical performance, highchemical resistance, and high dimensional stability.However, their high cost has limited the widespreaduse of these polymers, promoting their blendingwith thermoplastics engineering polymers.1–3
Longitudinal (or main-chain) PLCs are copolymerscomprised of rigid liquid crystalline (LC) sequencesconnected to flexible sequences by chemical bonds.The rigid mesogenic groups are exclusively in themain chain and are oriented parallel to it (so-calleda-type PLC).3–6 This segmental nature allows easyorientation of the rigid segments under externalapplied fields, whether electric, magnetic, or me-chanical.7–13 In fact, their thermotropic characterallows them to be transformed by melt processingtechniques, such as injection molding, because oftheir low viscosity resultant from the easy orienta-tion of the rigid segments in the flowing melt.Because of high relaxation times of PLCs, the orien-tation induced by the flow cannot easily relax duringsubsequent cooling, leading to highly oriented struc-tures (self-reinforced polymers) with exceptional me-chanical behavior and highly anisotropiccharacter.14,15 Methods for successful prediction oflong-term performance of PLCs from short-termtests have been developed.16,17
In a PLC, the rigid phase is inhomogeneously dis-persed throughout the material forming a
Journal ofAppliedPolymerScience,Vol. 115, 2991–3004 (2010)VVC 2009 Wiley Periodicals, Inc.
Correspondence to: J. C. Viana ([email protected]).Contract grant sponsor: DESY and the European
Commission (under HASYLAB Project DESY-D-II-05-101EC).
Contract grant sponsor: Robert A. Welch Foundation,Houston; contract grant numbers: B-1203, FP6, RII3-CT-2004-506008.
Contract grant sponsor: FCT - Portuguese Foundationfor Science and Technology, Lisbon (through the POCTIand FEDER programmes).

hierarchical poly-domain structure1,18; Figure 1. ThePLC tends to form spherical or ellipsoidal aggregatesof LC-rich phase which are called islands.1,18,19
The islands constitute of smaller quasisphericalshape LC crystallites connected by flexible chain seg-ments. Wide-angle X-ray scattering (WAXS) resultsshow that the LC crystallites (with dimensions ofseveral nm) are mostly composed of highly orientedand packed rigid sequences of the macromolecularchains.18,19 However, although each LC crystallite ishighly oriented, the different crystallites are ran-domly oriented inside an island, so that no preferredorientation exists inside the islands.15 The rigidphase is easily oriented during processing forminghighly oriented structures. Shear and extensionalstress fields have different effects on the morphologydeveloped in PLCs. The former will result in a tum-bling flow originating highly oriented sheet-likestructures. An extensional flow leads to the develop-ment of fiber-like structures.20
Injection molding is an attractive technology forthe production of large series of parts with a com-plex geometry. During processing, the polymer meltis subjected to a complex thermomechanical environ-ment that constrains the respective morphologicaldevelopment. In the case of PLCs, with high shearand elongational fields and fast cooling rates, a com-plex highly heterogeneous laminated microstructureis formed, which is composed of several layers fea-turing distinct textures and states of molecular orien-tation.21–24 Elongational viscosity of several PLCblends shows that the PLC constituent causes chan-nelling of the flexible polymer25 and thus its orienta-tion along the PLC—this effect is predictedtheoretically by an extension of the Flory statistical-mechanical theory of PLCs.26
At the micrometric level, a five-layer laminatedmicrostructure is normally formed: two externalskins, two intermediate zones, and a central coreregion. The skin and the intermediate zone can befurther discriminated and more sublayers can beidentified. The number of identifiable layers dependson the thickness of the molding and the criteriaestablished by the observer. The skin layer exhibits a
high level of molecular orientation. This feature,combined with the lack of chain entanglements,makes the skin layer easy to delaminate. In the coreregion, the melt experiences a tumbling flow of LCislands, resulting in molecular orientation along theflow lines. Studies of the morphology developmentof injection-molded PLCs has been based on the tra-ditional approach of directly relating the globalprocessing conditions (e.g., temperatures, velocities,molding thickness) to the morphological parame-ters.23,24,27,28 This does not support the establishmentof universally valid processing-morphology relation-ships, which are molding geometry and injectionmolded machine dependent. It does not support apredictive effort. Our approach—used in the presentwork—is different; we believe that these types ofrelationships must be established locally, relating thelocal thermomechanical environment to the devel-oped morphology. The processing-morphology rela-tionships are, therefore, of a more general character,independent of selected injection molding machineand molding geometry.This work investigated the structure development
of an injection-molded thermotropic PLC. The localthermomechanical environment is assessed by com-puter simulations of the mold-filling phase. Themorphology developed by the injection-molded PLCspecimens is characterized by several structure-sen-sitive experimental techniques including the follow-ing: scanning electronic microscopy, differentialscanning calorimetry, wide-, and small-anlge X-rayscattering. The relationships between the local proc-essing thermomechanical variables and the morpho-logical parameters are then established. A study ofthe relationships between the developed morphol-ogy and the mechanical behavior of injection-moldedPLCs will be described in a later article. It isexpected that the morphology developed duringprocessing, because of the imposed thermomechani-cal environment, will affect the mechanical proper-ties of the injection-molded PLCs. This wasdemonstrated before by molecular dynamics com-puter simulations of PLCs comprised of amorphouspolymeric chains and a rigid LC phase dispersed
Figure 1 Polydomain hierarchical structure of a PLC (n is the orientation director).
2992 VIANA ET AL.
Journal of Applied Polymer Science DOI 10.1002/app

throughout the flexible matrix in the form of quasi-spherical islands. Simulation results indicate thatboth the LC concentration and spatial distributioninfluence the response of the material.29,30 Further-more, the presence of the rigid LC phase affects thepredominant molecular deformation mechanisms,31
and the crack formation and propagation phenom-ena.29 On the other hand, experiments tell us thatother morphological features—such as the skin-coreratio in injection-molded materials—influence thefinal macroscopic properties.32
EXPERIMENTAL
Material and specimen geometry
The material is a longitudinal PLC: a copolyestercomprised of 0.6 mole fraction of p-hydroxybenzoicacid (PHB) and 0.4 mole fraction of poly(ethyleneterephtalate) (PET), referred to as PET/0.6PHB. Itwas purchased from Unitika, Kyoto, Japan, underthe commercial name of Rodrun LC-3000. PET/0.6PHB has a density ¼ 1.4 g cm�3 and a meltingtemperature ¼ 200�C.33 Above that temperature, wehave a smectic E phase coexisting with the isotropicliquid. Upon further heating, we have a 3-phase sys-tem (smectic E, smectic B, and isotropic liquid), thena different 2-phase system (smectic B and isotropicliquid) until the clearing temperature � 420�C isreached.33
The molded specimens are tensile dumbbell-likebars 60-mm long with 20 mm of reference lengthand uniform rectangular cross-section (4 � 2 mm2).The tab gate was located laterally in the middle ofthe specimen head.
Processing and thermomechanical environment
Molding programme
The molding program includes systematic variationsof three processing variables: melt and mold temper-ature, Tinj and Tw, respectively, and injection flowrate, Qinj. These were varied in three levels (1, mini-mum; 2, medium; and 3, maximum) following adesign of experiments (DOE) plan based on a Tagu-chi orthogonal matrix (L9). This plan ensures thatthe effects of each processing variable can be ana-lyzed independently of each other. Table I lists thevalues of the processing variables for each process-ing run. All the other processing parameters werekept constant. The order of the processing runs wasrandomized to avoid blocking effects.
The PLC material pellets were dried at 100�C dur-ing 12 h before molding. They were then molded ina Klocker-Ferromatic FM 20 injection moldingmachine. In each run, the weight of the molded sam-ples was statistically controlled.
Thermomechanical environment characterization
The thermomechanical environment imposed uponthe melt during processing was estimated by com-puter modeling of the mold-filling stage using acommercial Moldflow package. A thermotropic PLCsuch as Rodrun LC3000 shows a complex rheologicalbehavior because of its flexible-rigid segmental na-ture and polydomain structure. The rheological flowcurves exhibit distinct behavior depending on theselected temperature,34 evidencing a strong depend-ence of the viscosity upon the temperature. In thehigh shear rates regime (101 to 103 s�1), a tempera-ture-dependent shear thinning behavior can beassumed. In this study, the experimental viscositydata reported elsewhere34 was used and fitted to apower-law equation:
g ¼ 1:060� 1014 _c�0:41e�0:199T (1)
with T in �C. This simple constitutive model wasused in the mold-filling simulations, despite its over-simplification in describing the rheological behaviorof the material, which may lead to a less accuratecharacterization of the thermomechanical environ-ment. The mold-filling simulations allowed the esti-mation of the through-the-thickness temperature,shear rate, and stress profiles. These profiles werecharacterized, respectively, by the bulk temperature,Tb, the maximum shear rate, _cmax and the shearstress at the solid/liquid interface, sw. A coolingindex, Y, was defined as32,35–37:
Y ¼ Tb � Tt
Tb � Tw(2)
where Tt is a transition temperature (a constantvalue of Tt ¼ 200�C was used). Y characterizes thethermal level of the moldings: a high Y correspondsto a slower cooling process.
TABLE IMolding Program Based on a L9 Taguchi
Orthogonal Matrix
Run Tinj (�C) Tw (�C)
Qinj
(cm3/s)/tinj (s)
R1 220 20 4.9/1.00R2 220 40 18.4/0.45R3 220 60 27.0/0.10R4 250 20 27.0/0.10R5 250 40 4.9/1.00R6 250 60 18.4/0.45R7 280 20 18.4/0.45R8 280 40 27.0/0.10R9 280 60 4.9/1.00
Tinj, melt temperature; Tw, mold temperature; Qinj, injec-tion flow rate; tinj, injection time.
THERMOMECHANICAL PROCESSING ENVIRONMENT 2993
Journal of Applied Polymer Science DOI 10.1002/app

Morphological characterization
Scanning electronic microscopy
The fracture surfaces of the tensile specimens wereobserved in a scanning electronic microscope (SEM)Leica Cambridge LS360. The samples were previ-ously sputtered with a thin conductive layer of gold.Two magnifications were used: �30 for observingthe overall microstructure of the injection moldingsand �5,000 for observing the intermediate layer. Themicrostructure of the moldings was evaluated bymeasuring the thickness of each layer in their multi-layered structure. Measurements were made underthe lower magnification SEM micrographs using animage analyser software.
Differential scanning calorimetry
Differential scanning calorimetry (DSC) scans wereperformed in a PerkinElmer DSC-7 apparatus inheating. Both experiments and calibrations (tempera-ture and heat flow) were performed with indiumstandard at 20�C/min. Sample cross-sections of 14–20 mg were cut from the central zone of the speci-mens. One sample per processing run was used. Forprocessing Run 1, the DSC experiment was repeatedfor three different specimens. Experimental scatter of4.9, 0.7, and 14.6% was found, respectively, for theenthalpy of melting Hm, the glass transition tempera-ture Tg, and the heat capacity change upon meltingDCp (this error was assumed as equally dispersedwithin the other runs).
Wide- and small-angle X-ray scattering
The crystalline phase morphology of the moldingswas studied by X-ray synchrotron radiation source(transmission mode), generated at the Soft Con-densed Matter beam line (A2 polymer), HASYLAB,at DESY, Hamburg, Germany (Gc with the wave-length of k ¼ 0.15 nm). The injection-molded speci-mens were placed vertically (flow direction in thevertical) and perpendicularly to the incident X-raybeam. The experimental set-up allowed for the si-multaneous acquisition of both wide-angle (WAXS)and small-angle X-ray (SAXS) bidimensional scatter-ing patterns. For both techniques only one specimenper processing run was used.
The WAXS patterns were recorded on a phospho-rus-based image plate after the exposure time of 60s. The specimen-to-detector distance was 22 cm. They�2y scattering scans for the equatorial reflectionand the azimuthal angle scans for the mesogenicgroup reflection (highest intensity reflection arc)were obtained from the 2D WAXS patterns. Boththese curves were corrected for background scatter-ing and beam-intensity and normalized with respect
to the specimen thickness and accumulation time. Inthe y�2y scans the scattering angle coordinate wascalibrated using a semi-crystalline PET sample.The level of orientation (or second-order orienta-
tion function), s, was calculated from the angular in-tensity distribution I(/), using the Herman’sorientation function as discussed by Gedde andWiberg15:
s ¼ 1
23 cos2 /� �� 1
� �(3)
where is the angle between the axis of the averagemesogen direction (director) and the preferred direc-tion of the nematic phase. The angle brackets meanthe averaging over the azimuthal angle, i.e.,
cos2 /� � ¼
R p=20 I /ð Þ cos2 / sin/ d/R p=20 I /ð Þ sin/ d/
(4)
where I(/) is the scattered intensity of the mesogenicreflection at the azimuthal angle.The parameter s can also be obtained by other
routes, for instance by proton and deuterium nuclearmagnetic resonance as described by Arrighi et al.38
It follows from the definition of the angle that s ¼ 1for a system comprising molecules perfectly alignedin the flow direction. As already noted, given ahighly layered configuration of injection-moldedPLC, the use of a single global parameter to charac-terize the orientation state may be misleading. Tenta-tively, we might use a global through-the-thicknessvalue of s as a measure of the mean orientation aver-aged over the thickness of the sample.The SAXS reflections were recorded in a
MARCCD detector, from which bidimensional pat-terns were obtained. The specimen-to-detector dis-tance was 202 cm. The same exposure time wasused as in the WAXS analysis. From these 2D pat-terns the intensity-scattering vector scans (in the me-ridional/flow direction) were calculated. Again, andas before, the intensity values were corrected frombackground scattering and beam intensity, and nor-malized with respect to the specimen thickness andexposure time. In the SAXS experiments, the scatter-ing vector coordinate was calibrated by a rat tendontail standard.
RESULTS
Thermomechanical environment characterization
Table II lists the computed values of the variablesselected to characterize the thermomechanical envi-ronment associated with the experimental pro-gramme. The processing conditions resulted in aconsiderable variation of the shear stress and shearrate, also due to the high dependence of the
2994 VIANA ET AL.
Journal of Applied Polymer Science DOI 10.1002/app

rheological behavior on the temperature and shear-ing levels. The values of Tb are only dependentupon the melt temperature, both temperatures beingvery similar. The bulk temperature increases linearlywith the melt temperature. The highest variationswere found in the shear stress, which is influencedmostly by the melt temperature. This is a conse-quence of the strong temperature dependence of themelt viscosity. The shear rate shows a two-decade
amplitude of variation and is affected only by theinjection flow rate: an increment on the injectionflow rate induces a strong increase on the shear rate,as would be expected. In this shear rate range (102
to 103 s�1), the temperature and shear rate depend-ence of the viscosity were assumed to be welldescribed by a power law model with an Arrheniusthermal dependence.
Figure 2 Relationship between the wall shear stress, sw,and the bulk temperature, Tb, for all the moldings evidenc-ing a strong thermo-mechanical coupling (the solid line isthe fitting of the data with sw ¼ 2.55 � 1012e�0.111Tb equa-tion (R2 is the coefficient of correlation).
TABLE IIComputed Thermomechanical Variables
Run Tb (�C) sw (kPa) _cmax (s�1)
R1 219.3 70.0 3.82 � 102
R2 220.3 57.4 8.69 � 102
R3 220.8 67.7 3.98 � 103
R4 249.9 3.20 3.97 � 103
R5 247.7 3.68 3.81 � 102
R6 249.3 2.55 8.62 � 102
R7 279.1 8.37 � 10�2 8.62 � 102
R8 279.9 9.46 � 10�2 3.98 � 103
R9 277.6 1.18 � 10�1 3.80 � 102
Variationa (%) 27.6 8.35 � 104 9.95 � 103
Tb, bulk temperature; _cmax, maximum shear rate; sw,shear stress at the solid/melt interface.
a Variation ¼ [(maximum value)-(minimum value)]/(minimum value) � 100.
Figure 3 Effect of the processing variables (see Table I) on the microstructure of the moldings: SEM micrographs of thefracture surfaces.
THERMOMECHANICAL PROCESSING ENVIRONMENT 2995
Journal of Applied Polymer Science DOI 10.1002/app
A strong thermal and mechanical coupling is evi-denced during processing, as depicted in Figure 2,and already anticipated from the data in Table II. Infact, the data can be divided in three groups accord-ingly to Tb and sw ranges. This thermomechanicalcoupling strongly determines and limits the mor-phology development in injection molding.35–37
Morphological characterization by SEM
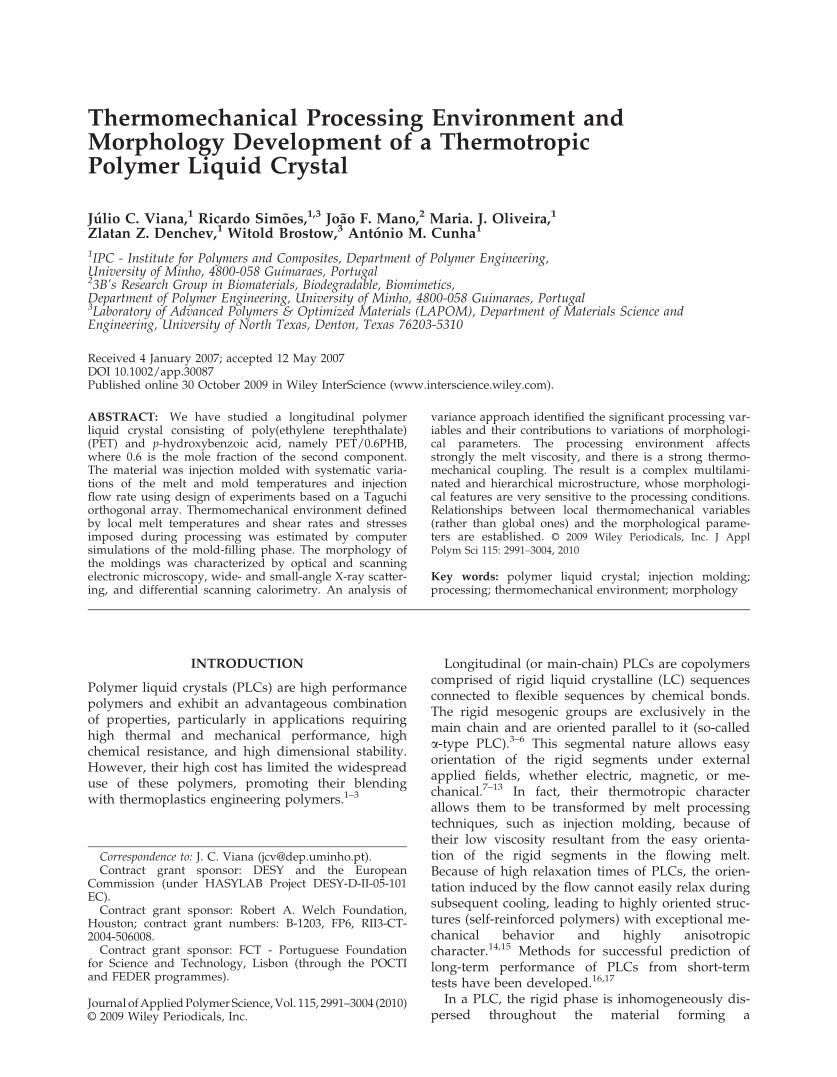
Figure 3 depicts the SEM micrographs of the fracturesurfaces of all the tensile specimens. The processingconditions induce distinct patterns in the fracturesurfaces.
The overall trend is the formation of a five-layerlaminate composed of a very thin external layer, alarge intermediate zone and an internal core, asillustrated in Figure 3 (Run 1). The thinner skin layeris developed during the filling stage as the hot mate-rial enters in contact with the cold mold wall, andits thickness is determined by the heat transfer con-ditions.23 In the core region the melt experiences atumbling flow of the poly-domains. This results inmolecular orientation along the flow lines of thistumbling flow.19,23 The fracture surfaces follow thisimposed orientation, giving rise to parabolic patternsseen in the cores of the fracture specimens. In the in-termediate layer, the molecular chains can be highlyoriented in the flow direction. This layer can betherefore easily delaminated, creating visible holes(e.g., Run 7 in Fig. 3). A magnified view of these in-termediate zones is presented in Figure 4 forselected processing runs.
For processing condition R2 it is possible toobserve some spherical domains that were notdeformed during the mechanical drawing. Theseaggregates are more evident for the low-melt tem-perature moldings (Runs 1 to 3), suggesting a weakcoupling between these aggregates. Conversely, con-dition R8 shows a highly deformed structure, typicalof samples molded at the highest melt temperature(Runs 7 to 9). In this case, the stress is better trans-ferred to the aggregates which are able to deform,resulting in high local plasticity. For condition R5,some fibrillar-like structures can be observed (simi-larly also in Run 6). This type of morphologyappears as intermediate with respect to thosereferred to above. The thicknesses of the layers weremeasured from the SEM micrographs. The skin layeris very small (c.a. 11% of the total molding thick-ness) and the measurements were not very accurate.For that reason, only two layers were considered: ahighly oriented external layer (corresponding to thesum of the thickness of the skin and intermediatelayers, Si; see Fig. 3) and a central core layer, Ca.
Differential scanning calorimetry
The DSC scans for all the moldings are shown inFigure 5. The degree of crystallinity of the moldingsis relatively low, as expected because the room tem-perature PET/0.6PHB solid contains 4 phases: PETcrystals, PHB-rich islands, isotropic PET-rich glassand PHB-rich glass.33 A very small and broad crys-talline peak is observed centred approximately at
Figure 4 Magnified (�5,000) SEM micrographs of the in-termediate layer for selected moldings. (R2): Tinj ¼ 220�C;Tw ¼ 40�C, Qinj ¼ 18.4 cm3/s; (R5): Tinj ¼ 250�C; Tw ¼40�C, Qinj ¼ 4.9 cm3/s; (R8): Tinj ¼ 280�C; Tw ¼ 40�C,Qinj ¼ 27.0 cm3/s.
2996 VIANA ET AL.
Journal of Applied Polymer Science DOI 10.1002/app

190�C and ranging from approximately 150– 220�C(we recall the melting temperature resulting from acombination of results obtained by several techni-ques ¼ 200�C33 whereas that temperature from DSCalone is 212�C10). The calculated enthalpies of fusionare very small, of the order of 2–4 J/g, whereas theexperimental errors are significant. In Ref. 1 thevalue of Hm ¼ 3 J/g is reported, in the middle ofour range. The low Hm value is typical for meltingPLCs because the transition on heating does notresult in a single isotropic phase but in a fairly well-ordered LC-containing phase.
Two glass transitions can be detected in all sys-tems at 58 and 78�C. These processes are identifiedhere by the endothermic peaks resulting from astructural relaxation process that occurred at roomtemperature before the DSC experimental run. Bydynamic mechanical analysis a loss peak was foundat 65�C (at 3 Hz) in PET/0.6PHB, ca. 12�C below theTg of the pure PET.33 Also in dielectric relaxationspectroscopy a a relaxation is identified for PET/0.6PHB at 60�C (maximum of the dielectric loss at 1Hz), and it is attributed to the glass transition of thePET-rich domains.39 A weak process, labelled a0,was found at approximately 40�C and was ascribedto segmental dynamics within the PHB-richdomains; apparently this mechanism was not visiblein the DSC results of the present work. The presenceof the a-relaxation in the PLC material was also con-firmed by thermally stimulated depolarization,where a depolarization peak was observed at 65�C,and again attributed to the glass transition withinthe PET-rich phase.40
No significant differences were found in the twoglass transition detected from the range of sampleprepared. Second run DSC experiments were per-formed right after the first ones (see first lower curvein Fig. 6), to investigate the thermal properties of thesamples after erasing the processing history. As
Figure 5 DSC scans for all the processing runs (see Table I for processing conditions and run identification).
Figure 6 WAXS patterns for different processing condi-tions. (R1): Tinj ¼ 220�C; Tw ¼ 20�C, Qinj ¼ 4.9 cm3/s; (R5):Tinj ¼ 250�C; Tw ¼ 40�C, Qinj ¼ 4.9 cm3/s; (R9): Tinj ¼280�C; Tw ¼ 60�C, Qinj ¼ 4.9 cm3/s. FD is the flowdirection.
THERMOMECHANICAL PROCESSING ENVIRONMENT 2997
Journal of Applied Polymer Science DOI 10.1002/app
expected, the two endothermic peaks were no longerdetected, as the thermal history was erased. More-over, the high temperature glass transition processalmost vanished, and only the glass transition at� 58�C was detected as a step in the heat flowcurve. This result is consistent with the findingsobserved for PET/0.6PHB discussed before. Thehigh glass transition process should be then assignedto the segmental mobility of a confined PET-richphase, induced during the processing. The devel-oped shear stresses may create PET-rich amorphousregions that are geometrically confined within ori-ented crystalline structures. The difference in the dy-namics for conformational mobility of bulk-like andconfined amorphous PET was already quantified41
from a practical point of view; apparently amor-phous PET entrapped within crystalline structuresexhibits a higher Tg than the one found in pureamorphous PET. Interestingly, the confinement effectdue to the processing studied in this work seems tobe similar in both skin and core of the injected parts.Samples taken from these two regions were alsotested by DSC and, in the first run, the same posi-tion in the temperature axis and similar relativeintensities of the two glass transitions were ob-served. Another possibility for the assignment of thetwo glass transitions is to consider the existence oftwo kinds of glassy states: an isotropic one and amore ordered glass resulting from the freezing of themesophase structure. It was proposed before that theordered phase should be characterized by a lower Tg
with respect to the amorphous one.42 Under this pic-ture, we could conclude from the double glass transi-tion events observed in the DSC results that afterinjection molding the two glassy states could coexist,as the fast cooling in the mold could prevent thecomplete organization of the chains. In the secondDSC run just the lower Tg is observed indicating thatthe previous cooling was slow enough to allow theformation of the mesophase and the formation of aordered glassy structure.
Wide-angle X-ray scattering
WAXS patterns of selected moldings are presentedin Figure 6.All the patterns show an intense equatorial reflec-
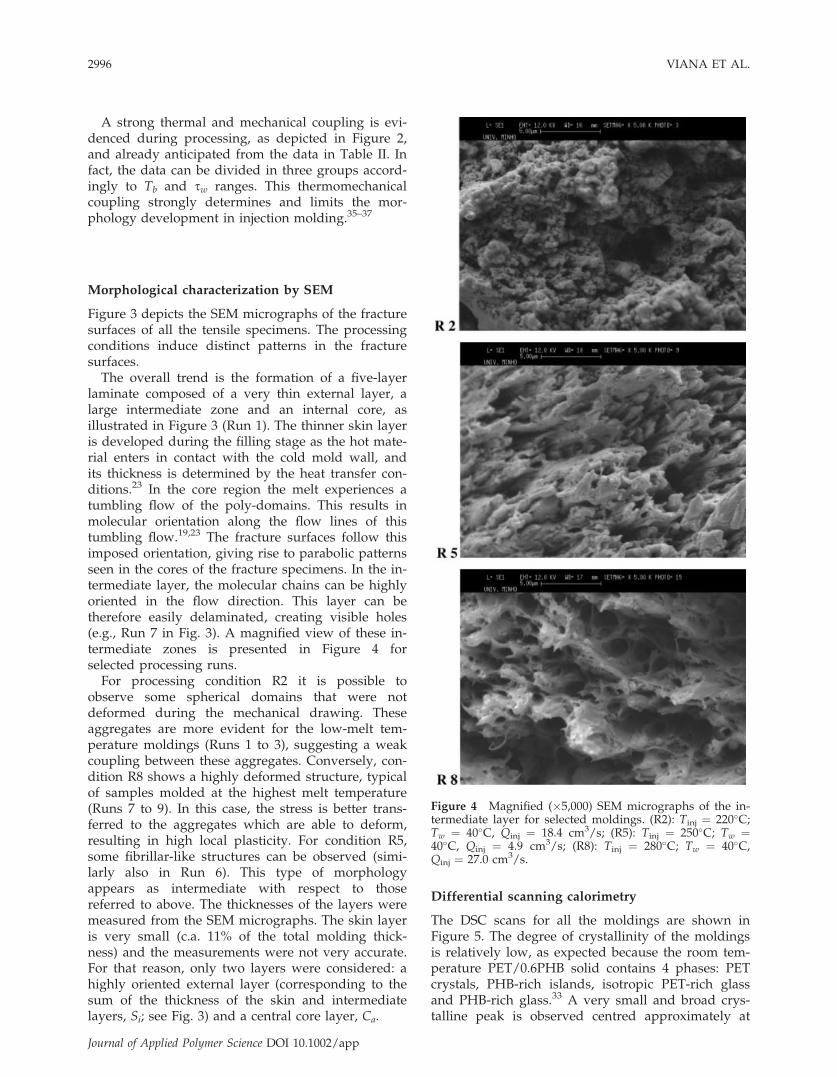
tion, reflecting the presence of the PHB mesogenicgroups. The angular dimension of this reflection andits spread are both dependent on the processing con-ditions. For this set of moldings the effect of thethermal level on the developed morphology is al-ready visible: as the thermal level increases (fromruns R1 to R9), the mesogen reflection becomes nar-rower and the angular scattering is reduced. Assuch, a higher level of orientation of specimen R9 isanticipated (as compared to condition R1).Figure 7 represents the WAXS equatorial scatter-
ing scan for all the moldings. The mesogenic groupreflection is centred at 2y ¼ 19–20�.6
The effect of processing is noticeable. The diffrac-tion peak gets more intense and broad (compareconditions R2 and R9). The peak position is thesame, within the experimental error. The highincrease of intensity of the reflection peak reflects anincrease of magnitude of the relative order of themesogenic groups (higher LC order). The increase ofthe peak width is related to a decrease of the meanLC crystallite size inside an island.Figure 8 shows the WAXS azimuthal scans for the
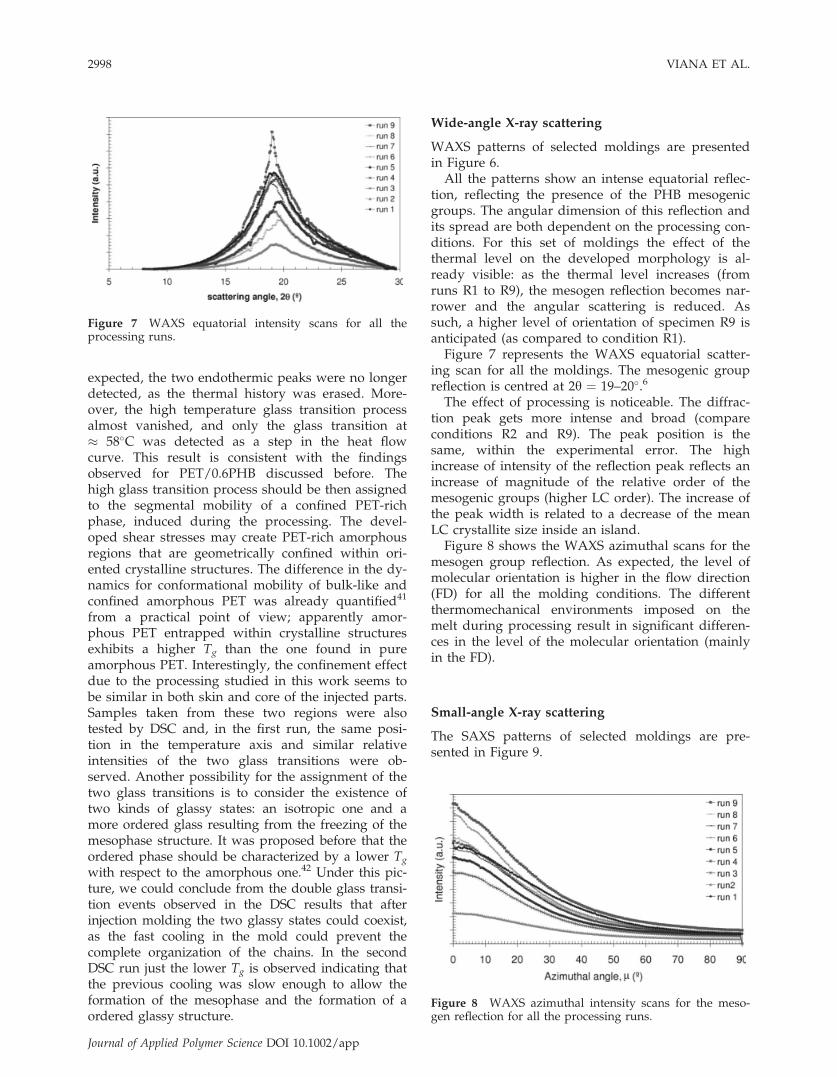
mesogen group reflection. As expected, the level ofmolecular orientation is higher in the flow direction(FD) for all the molding conditions. The differentthermomechanical environments imposed on themelt during processing result in significant differen-ces in the level of the molecular orientation (mainlyin the FD).
Small-angle X-ray scattering
The SAXS patterns of selected moldings are pre-sented in Figure 9.
Figure 7 WAXS equatorial intensity scans for all theprocessing runs.
Figure 8 WAXS azimuthal intensity scans for the meso-gen reflection for all the processing runs.
2998 VIANA ET AL.
Journal of Applied Polymer Science DOI 10.1002/app
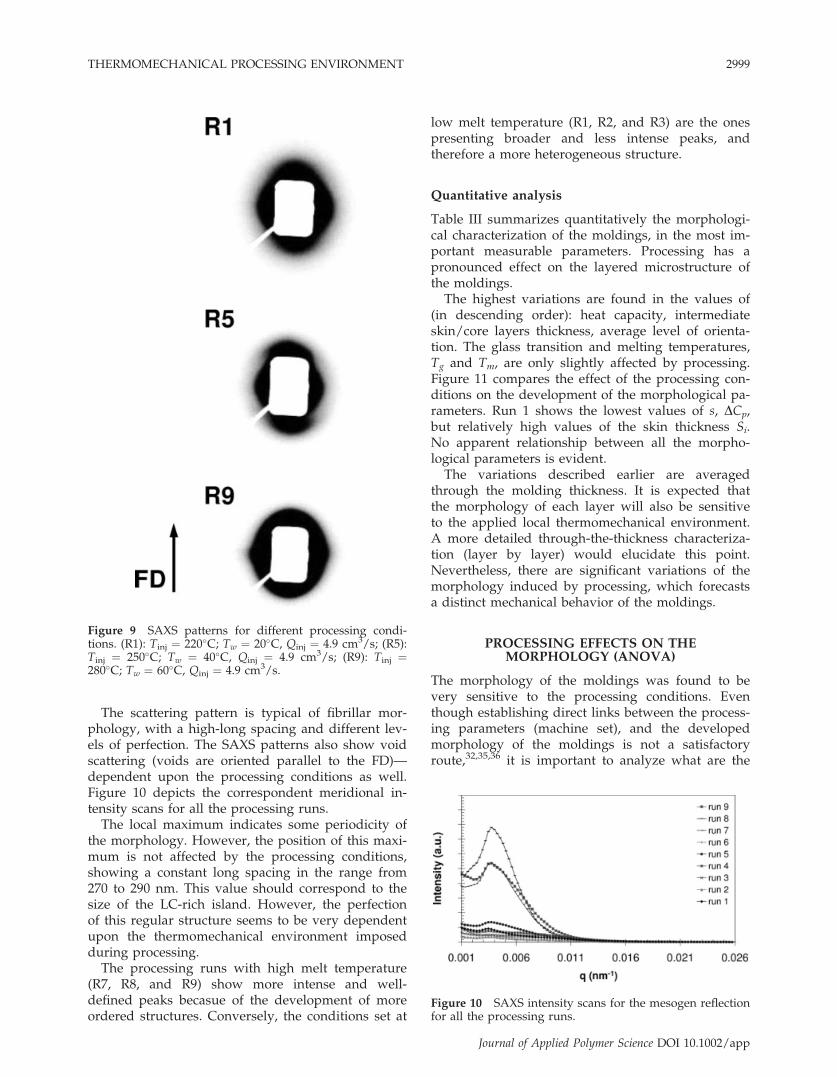
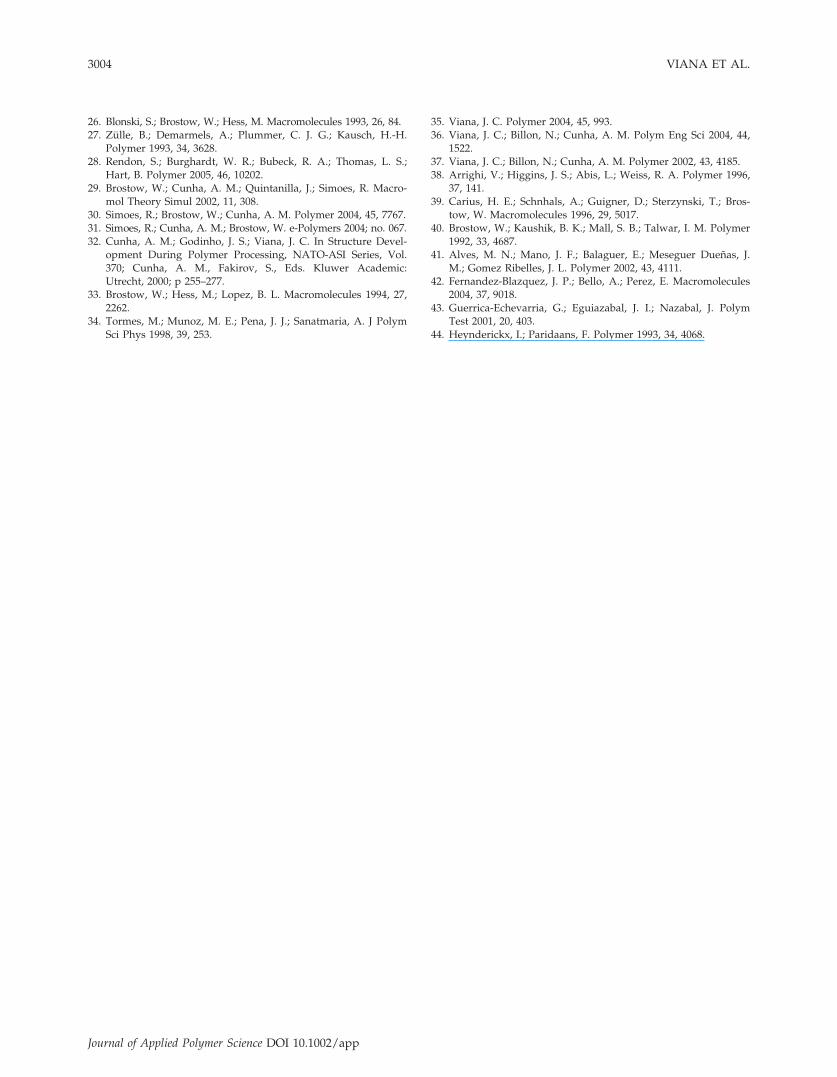
The scattering pattern is typical of fibrillar mor-phology, with a high-long spacing and different lev-els of perfection. The SAXS patterns also show voidscattering (voids are oriented parallel to the FD)—dependent upon the processing conditions as well.Figure 10 depicts the correspondent meridional in-tensity scans for all the processing runs.
The local maximum indicates some periodicity ofthe morphology. However, the position of this maxi-mum is not affected by the processing conditions,showing a constant long spacing in the range from270 to 290 nm. This value should correspond to thesize of the LC-rich island. However, the perfectionof this regular structure seems to be very dependentupon the thermomechanical environment imposedduring processing.
The processing runs with high melt temperature(R7, R8, and R9) show more intense and well-defined peaks becasue of the development of moreordered structures. Conversely, the conditions set at
low melt temperature (R1, R2, and R3) are the onespresenting broader and less intense peaks, andtherefore a more heterogeneous structure.
Quantitative analysis
Table III summarizes quantitatively the morphologi-cal characterization of the moldings, in the most im-portant measurable parameters. Processing has apronounced effect on the layered microstructure ofthe moldings.The highest variations are found in the values of
(in descending order): heat capacity, intermediateskin/core layers thickness, average level of orienta-tion. The glass transition and melting temperatures,Tg and Tm, are only slightly affected by processing.Figure 11 compares the effect of the processing con-ditions on the development of the morphological pa-rameters. Run 1 shows the lowest values of s, DCp,but relatively high values of the skin thickness Si.No apparent relationship between all the morpho-logical parameters is evident.The variations described earlier are averaged
through the molding thickness. It is expected thatthe morphology of each layer will also be sensitiveto the applied local thermomechanical environment.A more detailed through-the-thickness characteriza-tion (layer by layer) would elucidate this point.Nevertheless, there are significant variations of themorphology induced by processing, which forecastsa distinct mechanical behavior of the moldings.
PROCESSING EFFECTS ON THEMORPHOLOGY (ANOVA)
The morphology of the moldings was found to bevery sensitive to the processing conditions. Eventhough establishing direct links between the process-ing parameters (machine set), and the developedmorphology of the moldings is not a satisfactoryroute,32,35,36 it is important to analyze what are the
Figure 9 SAXS patterns for different processing condi-tions. (R1): Tinj ¼ 220�C; Tw ¼ 20�C, Qinj ¼ 4.9 cm3/s; (R5):Tinj ¼ 250�C; Tw ¼ 40�C, Qinj ¼ 4.9 cm3/s; (R9): Tinj ¼280�C; Tw ¼ 60�C, Qinj ¼ 4.9 cm3/s.
Figure 10 SAXS intensity scans for the mesogen reflectionfor all the processing runs.
THERMOMECHANICAL PROCESSING ENVIRONMENT 2999
Journal of Applied Polymer Science DOI 10.1002/app

contributions of the different processing parametersto the morphology development. Furthermore, thishas been the general approach followed in the litera-ture,23,24,27,28 and it will be—initially—adopted inthis discussion. The results were treated by analysisof variance (ANOVA). The relevant processing pa-rameters were identified for a significance level of0.9. The effect of processing on the microstructure ofthe moldings is shown in Figures 12–15.
Figure 12 represents the variations of the thicknessof the external layer Si with the processing condi-tions. Only Tw and Qinj are significant factors. Themold temperature has the highest influence with thecontribution of 71%.
Si shows a minimum value for intermediate Tw.At the lowest Tw, the high cooling rates contribute tothicker Si (faster cooling). For the highest Tw, theexpected lower melt viscosity induces a higher levelof flow-induced molecular orientation, resulting in athicker oriented layer due to the low relaxationcapabilities of PLCs.20 This also applies to the varia-tions of Si with Qinj; as Qinj is increased, the melt vis-cosity decreases and the flow-induced molecularorientation increases, resulting in thicker Si. The for-mation of the external layer appears to be dictatedby the imposed cooling and shear levels. The negli-gible effect of Tinj may also be due to this balance.As Tinj increases the cooling rate decreases (lowerSi), but simultaneously the flow-induced orientationincreases (higher Si). Si is therefore insensitive tovariations of Tinj within the studied range. Asexpected, the effect of the processing conditions onthe thickness of the core layer, Ca, is opposed to thatof Si.
Figure 13 depicts the evolution of the orientationparameter s with the processing variables. Generally,s increases with the increase of all the studied proc-essing variables. The contribution of Tinj is the high-est (c.a. 47 %). Again, the increase of the thermal
level and imposed shear rate contributes to a highermolecular orientation in the moldings.Despite the higher melt and mold temperatures,
the flow-induced orientation is not allowed to relaxdue to the high relaxation times of PLCs. HigherQinj will decrease the melt viscosity and willenhance the orientability of the melt. The final levelof molecular orientation seems to be a compromisebetween the orientability of the melt (related to itsviscosity) and the characteristic relaxation times ofthe PLC, as is the case for semicrystalline poly-mers.37 Furthermore, the high value of the contribu-tion of the pooled error anticipates an eventualimportant interaction between the studied process-ing variables, as already suggested.43 In fact, theeffects of Tinj and Qinj on the orientation levels aresometimes opposed. In general, low injection rateslead to high levels of molecular orientation,27,42–44
but this is not always the case.42 Higher melt tem-peratures result in higher levels of molecular orien-tation, but exceptions also exist here.36 This reveals
TABLE IIIResults of the Morphological Characterization
Run
DSC WAXS SEM
Tg (�C) DCp (J/g
�C) Tm (�C) s Imax (a.u.) Si (m/m) Ca (m/m)
R1 67.6 0.200 191.8 0.217 0.182 0.581 0.419R2 61.6 0.248 191.5 0.264 0.045 0.405 0.595R3 61.9 0.226 192.8 0.325 0.097 0.541 0.459R4 65.8 0.246 192.9 0.323 0.157 0.630 0.370R5 63.8 0.248 192.9 0.316 0.119 0.436 0.564R6 61.6 0.238 195.4 0.325 0.159 0.510 0.490R7 59.1 0.330 195.3 0.326 0.146 0.566 0.434R8 63.8 0.253 190.9 0.304 0.082 0.529 0.471R9 63.5 0.228 194.4 0.317 0.195 0.505 0.495
Variation (%) 14.4 65.0 2.3 50.5 333.3 55.5 60.8
Tg, glass transition temperature; DCp, heat capacity; Tm, melting temperature; s, level of orientation; Imax, maximumWAXS equatorial intensity; Si, external layers thickness; Ca, core layer thickness.
Figure 11 Effect of processing conditions on the morpho-logical parameters (the values are normalized between 0and 1 for comparison purposes).
3000 VIANA ET AL.
Journal of Applied Polymer Science DOI 10.1002/app

some interactions between the processing parame-ters, their effects being a function of their relativelevels. The direct link between the overall processingparameters and the morphology is therefore not asatisfactory approach.
Figure 14 represents the maximum intensity of theWAXS peak, Imax, as a function of the processingvariables. Imax is proportional to the order of the LCphase: a more ordered structure gives a higher maxi-mum intensity of the WAXS reflection.
Imax increases with the increase of Tinj, especiallyfor the low values of this processing parameter andit also decreases with the increment on Qinj, in par-ticular for lower Qinj values. The dependences ofImax upon Tw show a minimum value for intermedi-ate Tw. The most important processing parameter isTw, with the contribution of 57%, followed by Qinj
and Tinj with 27 and 12.5 %, respectively. Imax seemsto be determined by both the cooling conditions andshear levels applied during the molding phases. Ahigher thermal level results in a higher level of mo-lecular orientation as a consequence of the lowermelt viscosity. Incrementing Qinj leads also to ahigher level of orientation, but also to a thicker skin
layer resulting in a less ordered structure. The effectof Tw on the extent of order depends upon the bal-ance between the imposed cooling and shear levels.For low Tw, the shear level is higher and for high Tw
the cooling rate is lower; both these conditions lead-ing to a higher order state. For intermediate Tw val-ues, these opposed trends lead to low order state.Nonetheless, these relationships are not easy to es-tablish when an average through-the-thickness Imax
value is considered.
PROCESSING THERMOMECHANICALENVIRONMENT AND MORPHOLOGY
RELATIONSHIPS
Clearly, the morphology development in injectionmolding is determined by the thermomechanicalenvironment imposed on the melt during the proc-essing stages. In fact, the morphology evolves insidethe molding tool and is controlled locally by thethermal and mechanical fields applied to the mate-rial. Again, as already argued, it would therefore bedesirable to establish relations between the localthermomechanical environment and the local mor-phology development.32,35–37
Figure 12 Effect of the processing variables on the thick-ness of the external layers, Si (Tinj, melt temperature; Tw,mold temperature; Qinj, injection flow rate; %p, percentageof contribution; error, pooled error, 1-2-3 are, respectively,the low, medium, and high level sets of the processingvariables). Lines in the graph are for guidance.
Figure 13 Variation of the level of orientation, S, with theprocessing variables (Tinj, melt temperature; Tw, mold tem-perature; Qinj, injection flow rate; %p, percentage of con-tribution; error, pooled error, 1-2-3 are, respectively, thelow, medium, and high level sets of the processing varia-bles). Lines in the graph are for guidance.
THERMOMECHANICAL PROCESSING ENVIRONMENT 3001
Journal of Applied Polymer Science DOI 10.1002/app

Figures 15 and 16 present the variation of theassessed morphological parameters with thermome-chanical variables locally computed from the mold-filling simulations. The shown dependences werechosen taking into consideration the results fromprevious Sections (Processing effects – ANOVA results
and Thermomechanical environment characterization)and an equation that best fits the experimental data(as evaluated by the coefficient of multiple correla-tion, R2, and the percentage residuals). The low val-ues of R2 of the fittings may indicate that otherthermomechanical variables, interactions or morecomplex relationships need to be considered. Thevalues of the residuals must be analysed taking intoaccount the experimental scatter. The fitted simpleequations, and the respective graphical repre-sentation, aim only at presenting the main trends ofvariations, evidencing the most relevant thermo-mechanical parameters, and their effects on the mor-phology development.Figure 15 shows the variations of the outer skin
ratio, Si, with the maximum shear rate and tempera-ture at the mold/polymer interface, Ti.The latter is an interface temperature defined as
an averaged temperature of the polymer (subscriptp) and mold (subscript w) weighted by their thermaleffusivities, b:
Ti ¼bwTw þ bpTp
bw þ bbp(5)
Where Tm ¼ Tp, b¼ (qkcp)0.5 (q is the density, K is
the thermal conductivity, and cp is the heat capacity).In this case, Ti is mainly governed by Tw.The main processing parameters influencing Si are
Tw and Qinj (Fig. 13). _cmax is mainly determined byQinj (Table II). A higher _cmax leads to a thicker ori-ented layer. During mold-filling, the flow-inducedorientation increases with _cmax. This molecular orien-tation cannot relax due to the long relaxation timesof PLCs, thus resulting in a thicker oriented layer.Conversely, a higher Ti results in less severe coolingconditions and in a thinner external layer. Thethickness of this layer seems to be related to the
Figure 14 Effect of the processing variables on the maxi-mum intensity, Imax, of the WAXS peak (Tinj, melt temper-ature; Tw, mold temperature; Qinj, injection flow rate; %p,percentage of contribution; error, pooled error, 1-2-3 are,respectively, the low, medium, and high level sets of theprocessing variables).
Figure 16 Effect of the thermomechanical variables onthe level of orientation of the moldings, s (sw, shear stressat the solid/liquid interface; Y, cooling index, R2 ¼ 0.71,average residuals of 5.6 %; maximum residual of 11.0%).
Figure 15 Effect of the thermomechanical variables onthe external skin layer ratio, Si ( _cmax - maximum shearrate, Ti – interface temperature (mold/polymer), R2 ¼ 0.55;average residuals of 8.0 %; maximum residual of 23.0%).
3002 VIANA ET AL.
Journal of Applied Polymer Science DOI 10.1002/app

shear and thermal levels – as in semi-crystallinepolymers.35,37
Figure 16 shows the dependence of the orientationparameter s on the local shear stress and coolingindex. s is affected by all processing parameters (Fig.13). It increases with both Y and sw. The dependenceon Y is stronger than on sw.
Y is mainly determined by Tinj. At high Tinj themelt viscosity is lower allowing a better melt orient-ability, thus, resulting in a higher flow-induced ori-entation. Despite the higher thermal level of themoldings, the molecular relaxation process is con-strained by the high relaxation times of the rigidPLC molecules, and the flow-induced orientation isessentially preserved. The orientation parameterincreases slightly with sw because of the strong cou-pling between the thermal and stress levels. In fact,the highest sw are obtained for the lowest Y, whichtends to reduce s. On the other hand, sw increasesalso with the flow rate, Qinj, contributing to anincrease of the flow-induced orientation and of thefinal level of orientation. In Figure 16, the datapoints are located along a narrow area. This is dueto the high coupling between the thermal and me-chanical fields in the injection molding process, asmentioned earlier (Fig. 2).
CONCLUSIONS
We have established certain relationships betweenthe local thermomechanical environment and themorphology developed in a thermotropic PLC. Themain conclusions can be summarized as follows:
• A strong thermal and mechanical coupling isevidenced by the moldings.
• The imposed thermomechanical environmentresults in the development of a complex multila-minated and hierarchical microstructure whosethicknesses and morphological features are verysensitive to the processing conditions.
• The skin thickness is mainly determined by themold temperature and injection flow rate, actingin opposite ways. The thickness increases withincreasing melt flow shear rate and a reductionof the mold/melt interface temperature. Thethickness of this layer seems to be related to theshear and thermal levels—as in semi-crystallinepolymers.
• The molecular orientation increases with theincrease of all processing parameters, but mostsignificantly with the melt temperature. It ismaximized for the highest thermal levels andshear stresses evidencing the preponderant effectof the flow-induced molecular orientation andhigh relaxation times of PLC materials.
• The order parameter (as reflected by the maxi-mum intensity on WAXS scans) is mainly influ-enced by the mold temperature and injectionflow rate. It seems to be determined by both thecooling conditions and shear levels applied dur-ing the molding phases.
The mechanical properties of the PLC injectionmoldings are expected to be determined by the mor-phology developed upon the constraints imposed bythe processing thermomechanical environment. Thiswill be reported later, where dependence of mechan-ical properties upon morphological parameters (Si, s,and Imax) will be demonstrated.
References
1. Brostow, W.; Dziemianowicz, T.; Romanski, J.; Werber, W.Polym Eng Sci 1988, 28, 785.
2. Brostow, W.; Hess, M.; Lopez, B. L.; Sterzynski, T. Polymer1996, 37, 1551.
3. Hess, M. In Performance of Plastics; Brostow, W., Ed. Hanser:Munich, Cincinnati, OH, 2000; Chapter 21.
4. Brostow, W. Polymer 1990, 31, 979.5. Brostow, W. In Liquid Crystal Polymers: From Structures to
Applications; Collyer, A. A., Ed. Elsevier Applied Science:London, 1992; Chapter 1.
6. Brostow, W., Ed. Mechanical and Thermophysical Propertiesof Polymer Liquid Crystals; Chapman & Hall: London, 1998.
7. Brostow, W.; Faitelson, E. A.; Kamensky, M. G.; Korkhov, V. P.;Rodin, Y. P. Polymer 1999, 40, 1441.
8. Salahshoor-Kordestani, S.; Hanna, S.; Windle, A. H. Polymer2000, 41, 6619.
9. Vaish, N. V.; Cinader, D. K.; Burghardt, W. R.; Zhou, W.;Kornfield, J. A. Polymer 2001, 42, 10147.
10. Brostow, W.; Hibner, K.; Walasek, J. Macromol Theory Simul2001, 10, 304.
11. Brostow, W.; Jaklewicz, M.; Montemartini, P. Mater Res Inno-vat 2002, 5, 261.
12. Brostow, W.; Walasek, J. J Chem Phys 2004, 121, 3272.13. Brostow, W.; Jaklewicz, M. J Mater Res 2004, 19, 1038.14. Samran, J. Sci Asia 1999, 15, 91.15. Gedde, U. W.; Wiberg, G.In Mechanical and Thermophysical
Properties of Polymer Liquid Crystals; Brostow, W., Ed. Chap-man & Hall: London, 1998; Chapter 10.
16. Brostow, W.; D’Souza, N. A.; Kubat, J.; Maksimov, R. D.J Chem Phy 1999, 110, 9706.
17. Akinay, E. A.; Brostow, W.; Maksimov, R. Polym Eng Sci2001, 41, 977.
18. Brostow, W.; Hess, M. Mater Res Soc Proc 1992, 255, 57.19. Hess, M.; Lopez, B. L. In Mechanical and Thermophysical
Properties of Polymer Liquid Crystals; Brostow, W., Ed. Chap-man & Hall: London, 1998; Chapter 9.
20. Viola, G. C.; Baird, D. G.; Wilkes, G. L. Polym Eng Sci 1985,25, 888.
21. Weng, T.; Hiltner, A.; Baer, E. J Mat Sci 1986, 21, 744.22. Hedmark, P. G.; Lopez, J. M. R.; Westdahl, M. Polym Eng Sci
1988, 28, 1248.23. Zhong, Y. In Mechanical and Thermophysical Properties of
Polymer Liquid Crystals, Brostow, W., Ed. Chapman & Hall:London, 1998; Chapter 4.
24. Plummer, C. J. G.; Zulle, B.; Demarmels, A.; Kausch, H. H.J Appl Polym Sci 1993, 48, 751.
25. Brostow, W.; Triouleyre, S. Polymer 1996, 37, 1561.
THERMOMECHANICAL PROCESSING ENVIRONMENT 3003
Journal of Applied Polymer Science DOI 10.1002/app
26. Blonski, S.; Brostow, W.; Hess, M. Macromolecules 1993, 26, 84.27. Zulle, B.; Demarmels, A.; Plummer, C. J. G.; Kausch, H.-H.
Polymer 1993, 34, 3628.28. Rendon, S.; Burghardt, W. R.; Bubeck, R. A.; Thomas, L. S.;
Hart, B. Polymer 2005, 46, 10202.29. Brostow, W.; Cunha, A. M.; Quintanilla, J.; Simoes, R. Macro-
mol Theory Simul 2002, 11, 308.30. Simoes, R.; Brostow, W.; Cunha, A. M. Polymer 2004, 45, 7767.31. Simoes, R.; Cunha, A. M.; Brostow, W. e-Polymers 2004; no. 067.32. Cunha, A. M.; Godinho, J. S.; Viana, J. C. In Structure Devel-
opment During Polymer Processing, NATO-ASI Series, Vol.370; Cunha, A. M., Fakirov, S., Eds. Kluwer Academic:Utrecht, 2000; p 255–277.
33. Brostow, W.; Hess, M.; Lopez, B. L. Macromolecules 1994, 27,2262.
34. Tormes, M.; Munoz, M. E.; Pena, J. J.; Sanatmaria, A. J PolymSci Phys 1998, 39, 253.
35. Viana, J. C. Polymer 2004, 45, 993.36. Viana, J. C.; Billon, N.; Cunha, A. M. Polym Eng Sci 2004, 44,
1522.37. Viana, J. C.; Billon, N.; Cunha, A. M. Polymer 2002, 43, 4185.38. Arrighi, V.; Higgins, J. S.; Abis, L.; Weiss, R. A. Polymer 1996,
37, 141.39. Carius, H. E.; Schnhals, A.; Guigner, D.; Sterzynski, T.; Bros-
tow, W. Macromolecules 1996, 29, 5017.40. Brostow, W.; Kaushik, B. K.; Mall, S. B.; Talwar, I. M. Polymer
1992, 33, 4687.41. Alves, M. N.; Mano, J. F.; Balaguer, E.; Meseguer Duenas, J.
M.; Gomez Ribelles, J. L. Polymer 2002, 43, 4111.42. Fernandez-Blazquez, J. P.; Bello, A.; Perez, E. Macromolecules
2004, 37, 9018.43. Guerrica-Echevarria, G.; Eguiazabal, J. I.; Nazabal, J. Polym
Test 2001, 20, 403.44. Heynderickx, I.; Paridaans, F. Polymer 1993, 34, 4068.
3004 VIANA ET AL.
Journal of Applied Polymer Science DOI 10.1002/app
Related Documents