Thermoluminescence glow curves and deconvoluted glow peaks of Ge doped flat fibers at ultra-high doses of electron radiation A. Alawiah a,n , S. Bauk a , M.W. Marashdeh b , K.S. Ng c , H.A. Abdul-Rashid d , Z. Yusoff d , W. Gieszczyk e , M.N. Noramaliza f , G.A. Mahdiraji g , N. Tamchek h , S.Z. Muhd-Yassin i , K.A. Mat-Sharif i , M.I. Zulkifli i , M.J. Maah j , S.S. Che Omar k , D.A. Bradley l,m a Physics Department, Universiti Sains Malaysia, 11800 Penang, Malaysia b Department of Physics, College of Science, Al Imam Mohammad Bin Saud Islamic University, Riyadh 11623, Saudi Arabia c Faculty of Engineering and Technology, Multimedia University, 75450 Malacca, Malaysia d Faculty of Engineering, Multimedia University, 20100 Cyberjaya, Selangor, Malaysia e Institute of Nuclear Physics Polish Academy of Sciences, Radzikowskiego 152, 31-342 Krakow, Poland f Department of Imaging, Faculty of Medicine and Health Sciences, Universiti Putra Malaysia, 43400 Serdang, Selangor, Malaysia g Photonics Research Group, Department of Electrical Engineering, Faculty of Engineering, University of Malaya, 50603 Kuala Lumpur, Malaysia h Department of Physics, Faculty of Science, Universiti Putra Malaysia, 43400 Serdang, Selangor, Malaysia i Telekom Research & Development Sdn. Bhd, Idea Tower, UPM-MTDC, Technology Incubation Center One, Lebuh Silikon, 43400 Serdang, Selangor, Malaysia j Department of Chemistry, Faculty of Science, University of Malaya, 50603 Kuala Lumpur, Malaysia k Department of Physics, Faculty of Science, Universiti Teknologi Malaysia, 81310 UTM Skudai, Johor, Malaysia l Department of Physics, University of Surrey, Guildford, Surrey GU2 7XH, United Kingdom m Department of Physics, University of Malaya, 50603 Kuala Lumpur, Malaysia HIGHLIGHTS The supralinearity of FF was highly dependent on UHD. f(D) max occurs around 50 kGy for 6 wt% Ge doped FF. Peak 2 (230 °C) and peak 4 (290 °C) are the first-order kinetic peaks. Sensitivity of FF decreases for doses 450 kGy. article info Article history: Received 3 January 2015 Received in revised form 29 April 2015 Accepted 30 April 2015 Available online 1 May 2015 Keywords: Thermoluminescence WinREMS WinGCF Flat fiber Ultra-high dose Supralinearity abstract The behavior of Ge doped silica, SiO 2 flat fibers (FF) irradiated with 2.5 MeV electron radiation at ultra- high dose (UHD) range, up to 1 MGy, has been investigated. The analyzed glow curves measured by the usage of the WinREMS software revealed that peak height and glow curve maximum temperature are highly dependent on the dose. The shape of the glow curves is constant with increasing dose. The su- pralinearity of all glow peaks increases to its f(D) max , which occurs around 50 kGy. No saturation occurs at f(D) max and further increases in dose, up to 1 MGy, exhibits a significant decrease in f(D). The glow peaks 2 (230 °C) and 4 (290 °C), deconvoluted by the usage of WinGCF software, are the first-order kinetic peaks and can be used as the main dosimetric peaks for high-dose measurements between 1 and 50 kGy in an industrial environment. & 2015 Elsevier Ltd. All rights reserved. 1. Introduction Thermoluminescence (TL) dosimetry is a well-known method applied in radiation dose measurements, especially in the area of personnel dose, medical and environmental dosimetry. Much re- search has been carried out for its TL improvement in terms of sensitivity as well as to develop new TL materials. The silica (SiO 2 ) optical fiber has attracted much attention as a radiation sensor in dosimetry which can be found in a number of reports (Alawiah et al., 2013; Issa et al., 2011; Ong et al., 2009; Hashim et al., 2009). Contents lists available at ScienceDirect journal homepage: www.elsevier.com/locate/radphyschem Radiation Physics and Chemistry http://dx.doi.org/10.1016/j.radphyschem.2015.04.030 0969-806X/& 2015 Elsevier Ltd. All rights reserved. n Corresponding author. Fax: þ60 62316552. E-mail address: [email protected] (A. Alawiah). URL: http://www.usm.my (A. Alawiah). Radiation Physics and Chemistry 113 (2015) 53–58

Welcome message from author
This document is posted to help you gain knowledge. Please leave a comment to let me know what you think about it! Share it to your friends and learn new things together.
Transcript
Radiation Physics and Chemistry 113 (2015) 53–58
Contents lists available at ScienceDirect
Radiation Physics and Chemistry
http://d0969-80
n CorrE-mURL
journal homepage: www.elsevier.com/locate/radphyschem
Thermoluminescence glow curves and deconvoluted glow peaks of Gedoped flat fibers at ultra-high doses of electron radiation
A. Alawiah a,n, S. Bauk a, M.W. Marashdeh b, K.S. Ng c, H.A. Abdul-Rashid d, Z. Yusoff d,W. Gieszczyk e, M.N. Noramaliza f, G.A. Mahdiraji g, N. Tamchek h, S.Z. Muhd-Yassin i,K.A. Mat-Sharif i, M.I. Zulkifli i, M.J. Maah j, S.S. Che Omar k, D.A. Bradley l,m
a Physics Department, Universiti Sains Malaysia, 11800 Penang, Malaysiab Department of Physics, College of Science, Al Imam Mohammad Bin Saud Islamic University, Riyadh 11623, Saudi Arabiac Faculty of Engineering and Technology, Multimedia University, 75450 Malacca, Malaysiad Faculty of Engineering, Multimedia University, 20100 Cyberjaya, Selangor, Malaysiae Institute of Nuclear Physics Polish Academy of Sciences, Radzikowskiego 152, 31-342 Krakow, Polandf Department of Imaging, Faculty of Medicine and Health Sciences, Universiti Putra Malaysia, 43400 Serdang, Selangor, Malaysiag Photonics Research Group, Department of Electrical Engineering, Faculty of Engineering, University of Malaya, 50603 Kuala Lumpur, Malaysiah Department of Physics, Faculty of Science, Universiti Putra Malaysia, 43400 Serdang, Selangor, Malaysiai Telekom Research & Development Sdn. Bhd, Idea Tower, UPM-MTDC, Technology Incubation Center One, Lebuh Silikon, 43400 Serdang, Selangor, Malaysiaj Department of Chemistry, Faculty of Science, University of Malaya, 50603 Kuala Lumpur, Malaysiak Department of Physics, Faculty of Science, Universiti Teknologi Malaysia, 81310 UTM Skudai, Johor, Malaysial Department of Physics, University of Surrey, Guildford, Surrey GU2 7XH, United Kingdomm Department of Physics, University of Malaya, 50603 Kuala Lumpur, Malaysia
H I G H L I G H T S
� The supralinearity of FF was highly dependent on UHD.
� f(D)max occurs around 50 kGy for 6 wt% Ge doped FF.� Peak 2 (230 °C) and peak 4 (290 °C) are the first-order kinetic peaks.� Sensitivity of FF decreases for doses 450 kGy.a r t i c l e i n f o
Article history:Received 3 January 2015Received in revised form29 April 2015Accepted 30 April 2015Available online 1 May 2015
Keywords:ThermoluminescenceWinREMSWinGCFFlat fiberUltra-high doseSupralinearity
x.doi.org/10.1016/j.radphyschem.2015.04.0306X/& 2015 Elsevier Ltd. All rights reserved.
esponding author. Fax: þ60 62316552.ail address: [email protected] (A. Alawia: http://www.usm.my (A. Alawiah).
a b s t r a c t
The behavior of Ge doped silica, SiO2 flat fibers (FF) irradiated with 2.5 MeV electron radiation at ultra-high dose (UHD) range, up to 1 MGy, has been investigated. The analyzed glow curves measured by theusage of the WinREMS software revealed that peak height and glow curve maximum temperature arehighly dependent on the dose. The shape of the glow curves is constant with increasing dose. The su-pralinearity of all glow peaks increases to its f(D)max, which occurs around 50 kGy. No saturation occurs atf(D)max and further increases in dose, up to 1 MGy, exhibits a significant decrease in f(D). The glow peaks2 (230 °C) and 4 (290 °C), deconvoluted by the usage of WinGCF software, are the first-order kineticpeaks and can be used as the main dosimetric peaks for high-dose measurements between 1 and 50 kGyin an industrial environment.
& 2015 Elsevier Ltd. All rights reserved.
1. Introduction
Thermoluminescence (TL) dosimetry is a well-known method
h).
applied in radiation dose measurements, especially in the area ofpersonnel dose, medical and environmental dosimetry. Much re-search has been carried out for its TL improvement in terms ofsensitivity as well as to develop new TL materials. The silica (SiO2)optical fiber has attracted much attention as a radiation sensor indosimetry which can be found in a number of reports (Alawiahet al., 2013; Issa et al., 2011; Ong et al., 2009; Hashim et al., 2009).
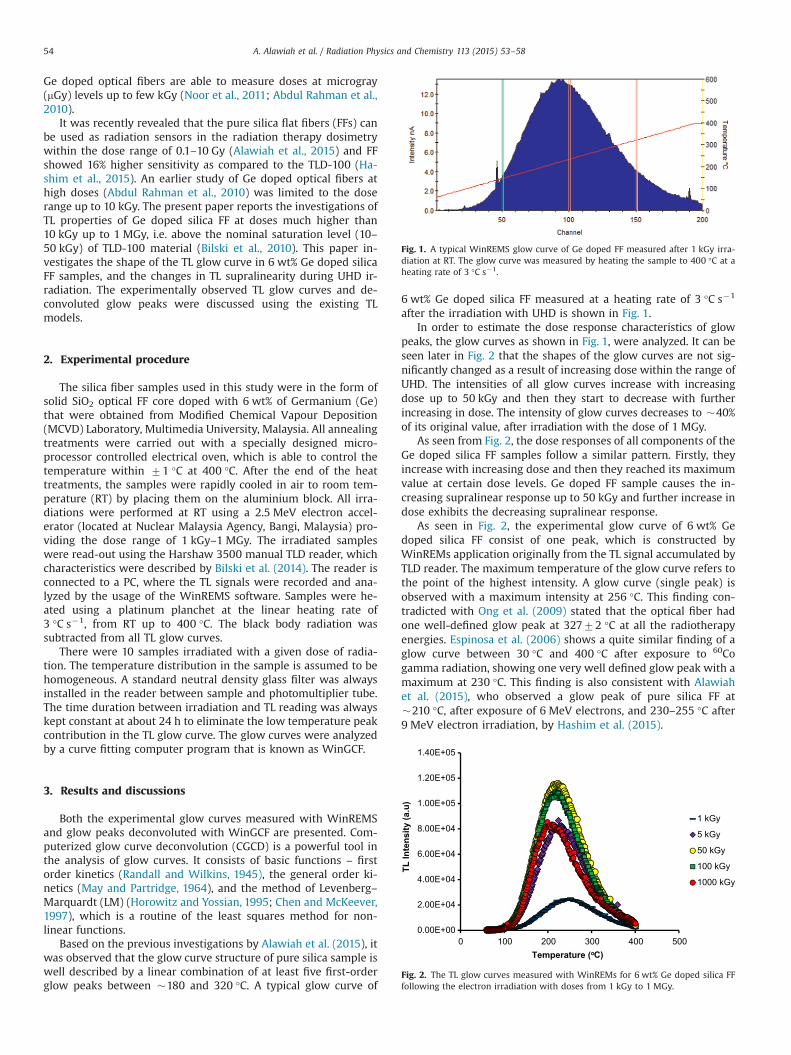
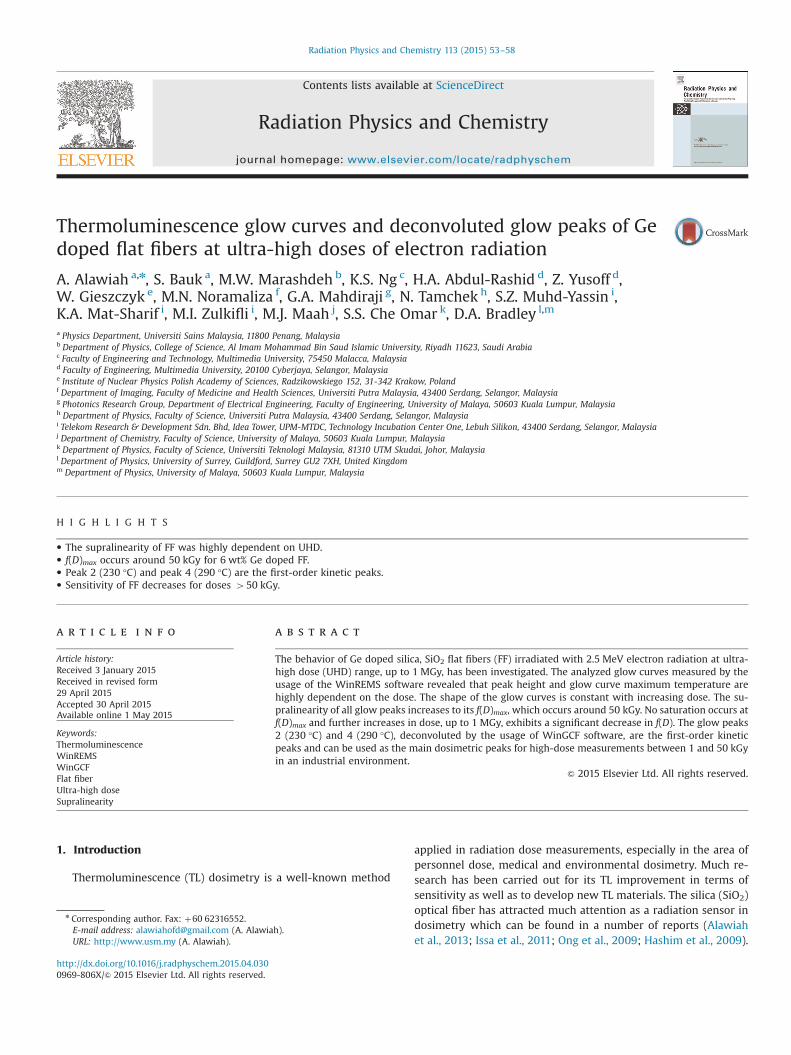
Fig. 1. A typical WinREMS glow curve of Ge doped FF measured after 1 kGy irra-diation at RT. The glow curve was measured by heating the sample to 400 °C at aheating rate of 3 °C s�1.
A. Alawiah et al. / Radiation Physics and Chemistry 113 (2015) 53–5854
Ge doped optical fibers are able to measure doses at microgray(mGy) levels up to few kGy (Noor et al., 2011; Abdul Rahman et al.,2010).
It was recently revealed that the pure silica flat fibers (FFs) canbe used as radiation sensors in the radiation therapy dosimetrywithin the dose range of 0.1–10 Gy (Alawiah et al., 2015) and FFshowed 16% higher sensitivity as compared to the TLD-100 (Ha-shim et al., 2015). An earlier study of Ge doped optical fibers athigh doses (Abdul Rahman et al., 2010) was limited to the doserange up to 10 kGy. The present paper reports the investigations ofTL properties of Ge doped silica FF at doses much higher than10 kGy up to 1 MGy, i.e. above the nominal saturation level (10–50 kGy) of TLD-100 material (Bilski et al., 2010). This paper in-vestigates the shape of the TL glow curve in 6 wt% Ge doped silicaFF samples, and the changes in TL supralinearity during UHD ir-radiation. The experimentally observed TL glow curves and de-convoluted glow peaks were discussed using the existing TLmodels.
1.40E+05
2. Experimental procedure
The silica fiber samples used in this study were in the form ofsolid SiO2 optical FF core doped with 6 wt% of Germanium (Ge)that were obtained from Modified Chemical Vapour Deposition(MCVD) Laboratory, Multimedia University, Malaysia. All annealingtreatments were carried out with a specially designed micro-processor controlled electrical oven, which is able to control thetemperature within 71 °C at 400 °C. After the end of the heattreatments, the samples were rapidly cooled in air to room tem-perature (RT) by placing them on the aluminium block. All irra-diations were performed at RT using a 2.5 MeV electron accel-erator (located at Nuclear Malaysia Agency, Bangi, Malaysia) pro-viding the dose range of 1 kGy–1 MGy. The irradiated sampleswere read-out using the Harshaw 3500 manual TLD reader, whichcharacteristics were described by Bilski et al. (2014). The reader isconnected to a PC, where the TL signals were recorded and ana-lyzed by the usage of the WinREMS software. Samples were he-ated using a platinum planchet at the linear heating rate of3 °C s�1, from RT up to 400 °C. The black body radiation wassubtracted from all TL glow curves.
There were 10 samples irradiated with a given dose of radia-tion. The temperature distribution in the sample is assumed to behomogeneous. A standard neutral density glass filter was alwaysinstalled in the reader between sample and photomultiplier tube.The time duration between irradiation and TL reading was alwayskept constant at about 24 h to eliminate the low temperature peakcontribution in the TL glow curve. The glow curves were analyzedby a curve fitting computer program that is known as WinGCF.
0.00E+00
2.00E+04
4.00E+04
6.00E+04
8.00E+04
1.00E+05
1.20E+05
0 100 200 300 400 500
TL In
tens
ity (a
.u)
Temperature (oC)
1 kGy
5 kGy
50 kGy
100 kGy
1000 kGy
Fig. 2. The TL glow curves measured with WinREMs for 6 wt% Ge doped silica FFfollowing the electron irradiation with doses from 1 kGy to 1 MGy.
3. Results and discussions
Both the experimental glow curves measured with WinREMSand glow peaks deconvoluted with WinGCF are presented. Com-puterized glow curve deconvolution (CGCD) is a powerful tool inthe analysis of glow curves. It consists of basic functions – firstorder kinetics (Randall and Wilkins, 1945), the general order ki-netics (May and Partridge, 1964), and the method of Levenberg–Marquardt (LM) (Horowitz and Yossian, 1995; Chen and McKeever,1997), which is a routine of the least squares method for non-linear functions.
Based on the previous investigations by Alawiah et al. (2015), itwas observed that the glow curve structure of pure silica sample iswell described by a linear combination of at least five first-orderglow peaks between �180 and 320 °C. A typical glow curve of
6 wt% Ge doped silica FF measured at a heating rate of 3 °C s�1
after the irradiation with UHD is shown in Fig. 1.In order to estimate the dose response characteristics of glow
peaks, the glow curves as shown in Fig. 1, were analyzed. It can beseen later in Fig. 2 that the shapes of the glow curves are not sig-nificantly changed as a result of increasing dose within the range ofUHD. The intensities of all glow curves increase with increasingdose up to 50 kGy and then they start to decrease with furtherincreasing in dose. The intensity of glow curves decreases to �40%of its original value, after irradiation with the dose of 1 MGy.
As seen from Fig. 2, the dose responses of all components of theGe doped silica FF samples follow a similar pattern. Firstly, theyincrease with increasing dose and then they reached its maximumvalue at certain dose levels. Ge doped FF sample causes the in-creasing supralinear response up to 50 kGy and further increase indose exhibits the decreasing supralinear response.
As seen in Fig. 2, the experimental glow curve of 6 wt% Gedoped silica FF consist of one peak, which is constructed byWinREMs application originally from the TL signal accumulated byTLD reader. The maximum temperature of the glow curve refers tothe point of the highest intensity. A glow curve (single peak) isobserved with a maximum intensity at 256 °C. This finding con-tradicted with Ong et al. (2009) stated that the optical fiber hadone well-defined glow peak at 32772 °C at all the radiotherapyenergies. Espinosa et al. (2006) shows a quite similar finding of aglow curve between 30 °C and 400 °C after exposure to 60Cogamma radiation, showing one very well defined glow peak with amaximum at 230 °C. This finding is also consistent with Alawiahet al. (2015), who observed a glow peak of pure silica FF at�210 °C, after exposure of 6 MeV electrons, and 230–255 °C after9 MeV electron irradiation, by Hashim et al. (2015).

0
100
200
300
400
500
600
700
800
0 200 400 600 800 1000 1200
TL P
eak
Are
a (a
.u)
Dose (kGy)
Fig. 3. The influence of dose (ultra-high dose range) on the TL peak area of theglow curves of Ge doped silica FF (6 wt%) following 2.5 MeV electron irradiation of1 kGy–1 MGy.
0.0
0.2
0.4
0.6
0.8
1.0
1.2
1.4
1.6
0.6
0.7
0.8
0.9
1.0
1.1
1.2
1.3
1.4
E/ e
V
Tmax/ K
Peak 1 Peak 2
Peak 3Peak 4
Peak 5
420 440 460 480 500 520 540 560 580
Fig. 5. The variation of kinetic parameter of Ea as the function of Tmax.
A. Alawiah et al. / Radiation Physics and Chemistry 113 (2015) 53–58 55
A significant decrease of the maximum temperature of the glowcurve (256–209 °C) is observed as the UHD increases from 1 kGy to1 MGy. The time taken to reach its maximum glow peak was alsodecreased within the range of 66.0–50.1 s with increasing dose.
As the dose increases, the width of the glow curve increases.The peak integral of 6 wt% Ge doped silica FF showed a significant
Peak 1
Peak 2 Peak 3 Peak 4
Peak 5
1 kGy
Peak 1
Peak 2 Peak 3
Peak 4Peak 5
100 kGy
Fig. 4. A WinGCF deconvoluted glow peaks of Ge doped FF for the ultra-high
decrease of 13% as the UHD increases. The peak integral which isalso associated with the peak area indicated the number of freeelectrons that transit from the traps to the luminescence center.The area under the glow curve was found to be highly dependenton dose, which reached its maximum value when the dose is50 kGy. Then, further increase in dose would result a significant
Peak 1
Peak 2 Peak 3
Peak 4
Peak 5
50 kGy
Peak 1
Peak 2 Peak 3
Peak 4
Peak 5
1 MGy
doses of 1 kGy, 50 kGy, 100 kGy and 1 MGy 2.5 MeV electron radiation.
0.78
0.80
0.82
0.84
0.86
0.88
0.90
0.92
0.6
0.7
0.8
0.9
1.0
1.1
1.2
1.3
1.4
40 60 80 100 120
E/e
V
Peak Integral (nC)
Peak 1
Peak 2
Peak 5
Peak 3
Peak 4
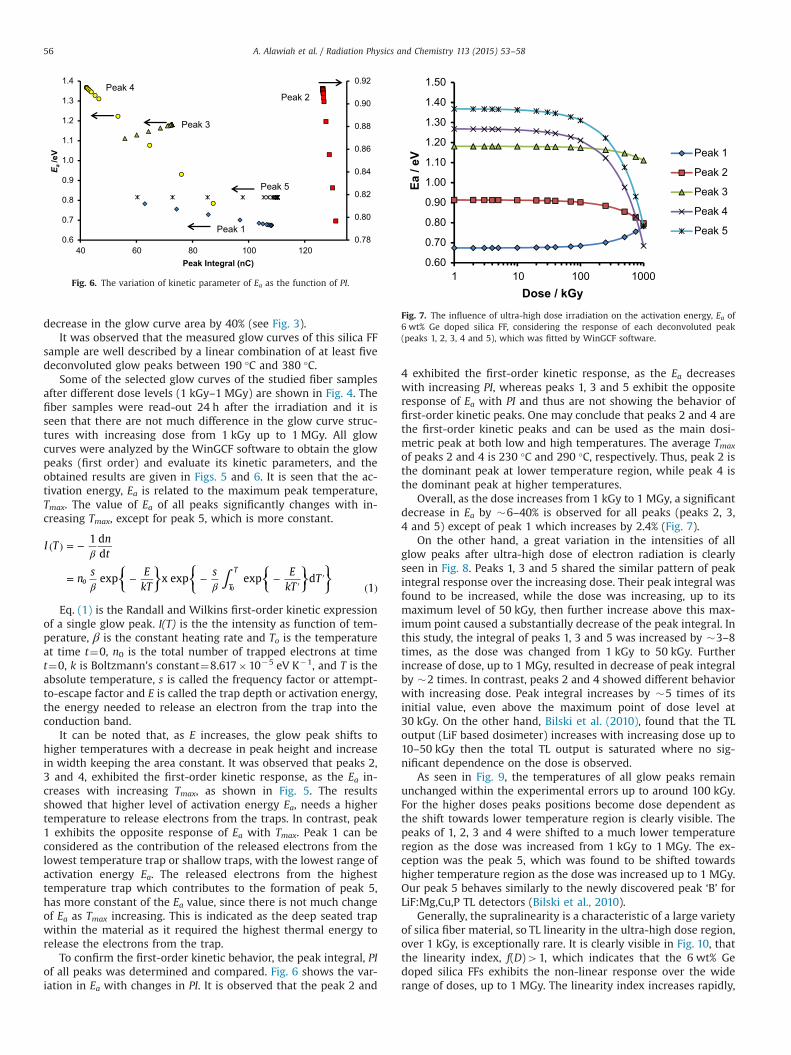
Fig. 6. The variation of kinetic parameter of Ea as the function of PI.
0.60
0.70
0.80
0.90
1.00
1.10
1.20
1.30
1.40
1.50
1 10 100 1000
Ea /
eV
Dose / kGy
Peak 1
Peak 2
Peak 3
Peak 4
Peak 5
Fig. 7. The influence of ultra-high dose irradiation on the activation energy, Ea of6 wt% Ge doped silica FF, considering the response of each deconvoluted peak(peaks 1, 2, 3, 4 and 5), which was fitted by WinGCF software.
A. Alawiah et al. / Radiation Physics and Chemistry 113 (2015) 53–5856
decrease in the glow curve area by 40% (see Fig. 3).It was observed that the measured glow curves of this silica FF
sample are well described by a linear combination of at least fivedeconvoluted glow peaks between 190 °C and 380 °C.
Some of the selected glow curves of the studied fiber samplesafter different dose levels (1 kGy–1 MGy) are shown in Fig. 4. Thefiber samples were read-out 24 h after the irradiation and it isseen that there are not much difference in the glow curve struc-tures with increasing dose from 1 kGy up to 1 MGy. All glowcurves were analyzed by the WinGCF software to obtain the glowpeaks (first order) and evaluate its kinetic parameters, and theobtained results are given in Figs. 5 and 6. It is seen that the ac-tivation energy, Ea is related to the maximum peak temperature,Tmax. The value of Ea of all peaks significantly changes with in-creasing Tmax, except for peak 5, which is more constant.
⎧⎨⎩⎫⎬⎭
⎧⎨⎩⎧⎨⎩
⎫⎬⎭⎫⎬⎭
I Tnt
ns E
kTs E
kTT
1 dd
exp x exp exp d1
oT
T
o∫
β
β β
( ) = −
= − − −′
′( )
Eq. (1) is the Randall and Wilkins first-order kinetic expressionof a single glow peak. I(T) is the the intensity as function of tem-perature, β is the constant heating rate and To is the temperatureat time t¼0, n0 is the total number of trapped electrons at timet¼0, k is Boltzmann's constant¼8.617�10�5 eV K�1, and T is theabsolute temperature, s is called the frequency factor or attempt-to-escape factor and E is called the trap depth or activation energy,the energy needed to release an electron from the trap into theconduction band.
It can be noted that, as E increases, the glow peak shifts tohigher temperatures with a decrease in peak height and increasein width keeping the area constant. It was observed that peaks 2,3 and 4, exhibited the first-order kinetic response, as the Ea in-creases with increasing Tmax, as shown in Fig. 5. The resultsshowed that higher level of activation energy Ea, needs a highertemperature to release electrons from the traps. In contrast, peak1 exhibits the opposite response of Ea with Tmax. Peak 1 can beconsidered as the contribution of the released electrons from thelowest temperature trap or shallow traps, with the lowest range ofactivation energy Ea. The released electrons from the highesttemperature trap which contributes to the formation of peak 5,has more constant of the Ea value, since there is not much changeof Ea as Tmax increasing. This is indicated as the deep seated trapwithin the material as it required the highest thermal energy torelease the electrons from the trap.
To confirm the first-order kinetic behavior, the peak integral, PIof all peaks was determined and compared. Fig. 6 shows the var-iation in Ea with changes in PI. It is observed that the peak 2 and
4 exhibited the first-order kinetic response, as the Ea decreaseswith increasing PI, whereas peaks 1, 3 and 5 exhibit the oppositeresponse of Ea with PI and thus are not showing the behavior offirst-order kinetic peaks. One may conclude that peaks 2 and 4 arethe first-order kinetic peaks and can be used as the main dosi-metric peak at both low and high temperatures. The average Tmax
of peaks 2 and 4 is 230 °C and 290 °C, respectively. Thus, peak 2 isthe dominant peak at lower temperature region, while peak 4 isthe dominant peak at higher temperatures.
Overall, as the dose increases from 1 kGy to 1 MGy, a significantdecrease in Ea by �6–40% is observed for all peaks (peaks 2, 3,4 and 5) except of peak 1 which increases by 2.4% (Fig. 7).
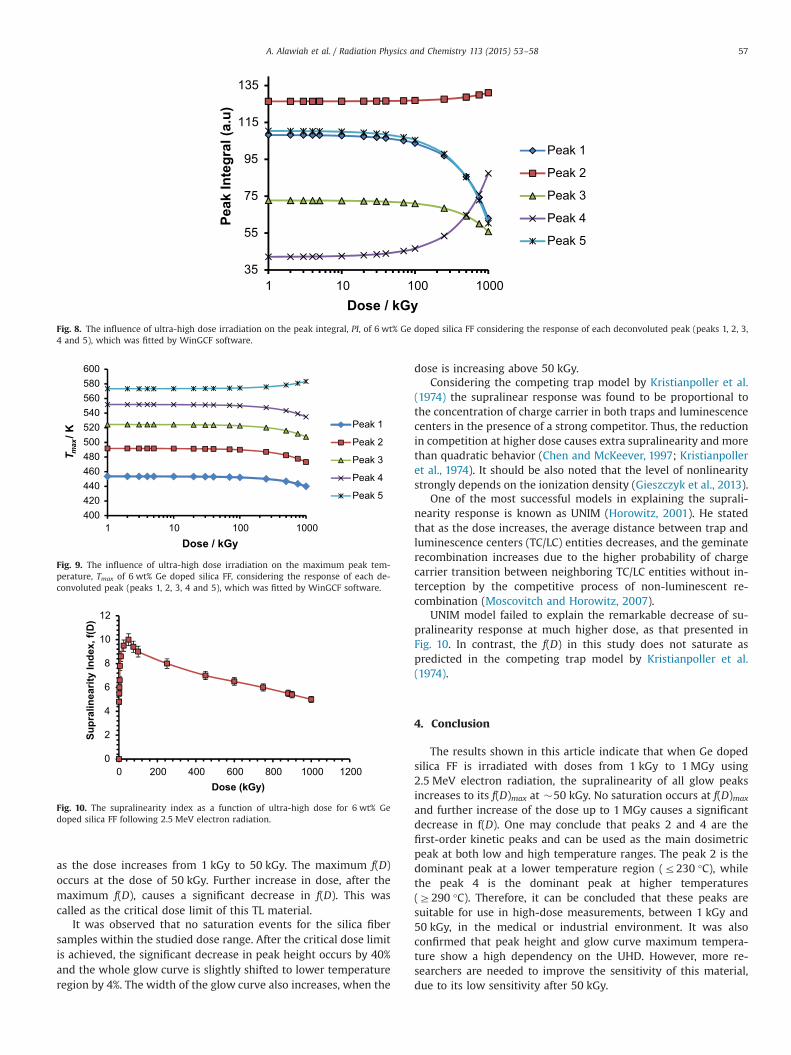
On the other hand, a great variation in the intensities of allglow peaks after ultra-high dose of electron radiation is clearlyseen in Fig. 8. Peaks 1, 3 and 5 shared the similar pattern of peakintegral response over the increasing dose. Their peak integral wasfound to be increased, while the dose was increasing, up to itsmaximum level of 50 kGy, then further increase above this max-imum point caused a substantially decrease of the peak integral. Inthis study, the integral of peaks 1, 3 and 5 was increased by �3–8times, as the dose was changed from 1 kGy to 50 kGy. Furtherincrease of dose, up to 1 MGy, resulted in decrease of peak integralby �2 times. In contrast, peaks 2 and 4 showed different behaviorwith increasing dose. Peak integral increases by �5 times of itsinitial value, even above the maximum point of dose level at30 kGy. On the other hand, Bilski et al. (2010), found that the TLoutput (LiF based dosimeter) increases with increasing dose up to10–50 kGy then the total TL output is saturated where no sig-nificant dependence on the dose is observed.
As seen in Fig. 9, the temperatures of all glow peaks remainunchanged within the experimental errors up to around 100 kGy.For the higher doses peaks positions become dose dependent asthe shift towards lower temperature region is clearly visible. Thepeaks of 1, 2, 3 and 4 were shifted to a much lower temperatureregion as the dose was increased from 1 kGy to 1 MGy. The ex-ception was the peak 5, which was found to be shifted towardshigher temperature region as the dose was increased up to 1 MGy.Our peak 5 behaves similarly to the newly discovered peak ‘B’ forLiF:Mg,Cu,P TL detectors (Bilski et al., 2010).
Generally, the supralinearity is a characteristic of a large varietyof silica fiber material, so TL linearity in the ultra-high dose region,over 1 kGy, is exceptionally rare. It is clearly visible in Fig. 10, thatthe linearity index, f(D)41, which indicates that the 6 wt% Gedoped silica FFs exhibits the non-linear response over the widerange of doses, up to 1 MGy. The linearity index increases rapidly,
35
55
75
95
115
135
1 10 100 1000
Peak
Inte
gral
(a.u
)
Dose / kGy
Peak 1
Peak 2
Peak 3
Peak 4
Peak 5
Fig. 8. The influence of ultra-high dose irradiation on the peak integral, PI, of 6 wt% Ge doped silica FF considering the response of each deconvoluted peak (peaks 1, 2, 3,4 and 5), which was fitted by WinGCF software.
400420440460480500520540560580600
1 10 100 1000
T max
/ K
Dose / kGy
Peak 1
Peak 2
Peak 3
Peak 4
Peak 5
Fig. 9. The influence of ultra-high dose irradiation on the maximum peak tem-perature, Tmax of 6 wt% Ge doped silica FF, considering the response of each de-convoluted peak (peaks 1, 2, 3, 4 and 5), which was fitted by WinGCF software.
0
2
4
6
8
10
12
0 200 400 600 800 1000 1200
Supr
alin
earit
y In
dex,
f(D
)
Dose (kGy)
Fig. 10. The supralinearity index as a function of ultra-high dose for 6 wt% Gedoped silica FF following 2.5 MeV electron radiation.
A. Alawiah et al. / Radiation Physics and Chemistry 113 (2015) 53–58 57
as the dose increases from 1 kGy to 50 kGy. The maximum f(D)occurs at the dose of 50 kGy. Further increase in dose, after themaximum f(D), causes a significant decrease in f(D). This wascalled as the critical dose limit of this TL material.
It was observed that no saturation events for the silica fibersamples within the studied dose range. After the critical dose limitis achieved, the significant decrease in peak height occurs by 40%and the whole glow curve is slightly shifted to lower temperatureregion by 4%. The width of the glow curve also increases, when the
dose is increasing above 50 kGy.Considering the competing trap model by Kristianpoller et al.
(1974) the supralinear response was found to be proportional tothe concentration of charge carrier in both traps and luminescencecenters in the presence of a strong competitor. Thus, the reductionin competition at higher dose causes extra supralinearity and morethan quadratic behavior (Chen and McKeever, 1997; Kristianpolleret al., 1974). It should be also noted that the level of nonlinearitystrongly depends on the ionization density (Gieszczyk et al., 2013).
One of the most successful models in explaining the suprali-nearity response is known as UNIM (Horowitz, 2001). He statedthat as the dose increases, the average distance between trap andluminescence centers (TC/LC) entities decreases, and the geminaterecombination increases due to the higher probability of chargecarrier transition between neighboring TC/LC entities without in-terception by the competitive process of non-luminescent re-combination (Moscovitch and Horowitz, 2007).
UNIM model failed to explain the remarkable decrease of su-pralinearity response at much higher dose, as that presented inFig. 10. In contrast, the f(D) in this study does not saturate aspredicted in the competing trap model by Kristianpoller et al.(1974).
4. Conclusion
The results shown in this article indicate that when Ge dopedsilica FF is irradiated with doses from 1 kGy to 1 MGy using2.5 MeV electron radiation, the supralinearity of all glow peaksincreases to its f(D)max at �50 kGy. No saturation occurs at f(D)max
and further increase of the dose up to 1 MGy causes a significantdecrease in f(D). One may conclude that peaks 2 and 4 are thefirst-order kinetic peaks and can be used as the main dosimetricpeak at both low and high temperature ranges. The peak 2 is thedominant peak at a lower temperature region (r230 °C), whilethe peak 4 is the dominant peak at higher temperatures(Z290 °C). Therefore, it can be concluded that these peaks aresuitable for use in high-dose measurements, between 1 kGy and50 kGy, in the medical or industrial environment. It was alsoconfirmed that peak height and glow curve maximum tempera-ture show a high dependency on the UHD. However, more re-searchers are needed to improve the sensitivity of this material,due to its low sensitivity after 50 kGy.
A. Alawiah et al. / Radiation Physics and Chemistry 113 (2015) 53–5858
Acknowledgments
We are indebted to the Alurtron, Nuclear Malaysia Agency (Mr.Zahidee, Mr. Shari, Mr. Azmi and Mr. Basit), for the use of anelectron beam accelerator. This work was supported by the Uni-versity of Malaya (UM)-Ministry of Higher Education Malaysia(MOHE) High Impact Research (HIR) Grant H-21001-00-F000033and UM-MOHE HIR Fiber Pulling Grant A000007-50001. The au-thors would also like to acknowledge MOHE Research Grant FRGS/1/2012/SG02/MMU/02/2 and FRGS/2/2013/SG02/UPM/02/1.
References
Abdul Rahman, A.T., Nisbet, A., Bradley, D.A., 2010. Dose-rate and the reciprocitylaw:TL response of Ge-doped SiO2 optical fibers at therapeutic radiation doses.Nucl. Instr. Meth. Phys. Res. A 619, 157–162.
Alawiah, A., Bauk, S., Abdul-Rashid, H.A., Gieszczyk, W., Hashim, S., Mahdiraji, G.A.,Tamchek, N., Bradley, D.A., 2015. Potential application of pure silica optical flatfibers for radiation therapy dosimetry. Radiat. Phys. Chem. 106, 73–76.
Alawiah, A., Intan, A.M., Bauk, S., Abdul Rashid, H.A., Yusoff, Z., Mokhtar, M.R., WanAbdullah, W.S., Mat Sharif, K.A., Mahdiraji, G.A., Mahamd Adikan, F.R., Tamchek,N., Noor, N.M., Bradley, D., 2013. Thermoluminescence of flat optical fiber inradiation dosimetry under different electron irradiation conditions. In: Pro-ceedings of SPIE8775, Mirco-structured and Specialty Optical Fibres II, 87750S,May 3, 2013.
Bilski, P., Gieszczyk, W., Obryk, B., Hodyr, K., 2014. Comparison of commercialthermoluminescent readers regarding high-dose high-temperature measure-ments. Radiat. Meas. 65, 8–13.
Bilski, P., Obryk, B., Stuglik, Z., 2010. Behaviour of LiF:Mg,Cu,P and LiF:Mg,Ti ther-moluminescent detectors for electron doses up to 1 MGy. Radiat. Meas. 45,576–578.
Chen, R., McKeever, S.W.S., 1997. Theory of Thermoluminescence and RelatedPhenomena. World Scientific, London.
Espinosa, G., Golzarri, J.I., Bogard, J., Garcia-Macedo, J., 2006. Commercial opticalfibre as TLD material. Radiat. Prot. Dosim 119 (1-4), 197–200.
Gieszczyk, W., Bilski, P., Olko, P., Herrmann, R., Kettunen, H., Virtanen, A., Bassler, N.,2013. Evaluation of the relative thermoluminescence efficiency of LiF: Mg, Tiand LiF: Mg, Cu, P TL detectors to low-energy heavy ions. Radiat. Meas. 51,7–12.
Hashim, S., Al-Ahbabi, S., Bradley, D.A., Webb, M., Jeynes, C., Ramli, A.T., Wagiran, H.,2009. The thermoluminescence response of doped SiO2 optical fibers subjectedto photon and electron irradiation. Appl. Radiat. Isot. 67, 423–427.
Hashim, S., Che Omar, S.S., Ibrahim, S.A., Wan Hassan, W.M.S., Ung, N.M., Mahdiraji,G.A., Bradley, D.A., Alzimami, K., 2015. Thermoluminescence response of flatoptical fiber subjected to 9MeV electron irradiations. Radiat. Phys. Chem. 106,46–49.
Horowitz, Y.S., Yossian, D., 1995. Computerised glow curve deconvolution: appli-cation to thermoluminescence dosimetry. Radiat. Prot. Dosim. 60, 1–110.
Horowitz, Y.S., 2001. Theory of thermoluminescence gamma dose response: theunified interaction model. Nucl. Instrum. Methods Phys. Res. Sect. B 184, 68–84.
Issa, F., Latip, N.A.A., Bradley, D.A., Nisbet, A., 2011. Ge-doped optical fibres asthermoluminescence dosimeters for kilovoltage X-ray therapy irradiations.Nucl. Instr. Methods Phys. Res. A 652 (1), 834–837.
Kristianpoller, N., Chen, R., Israeli, M., 1974. Dose dependence of thermo-luminescence peaks. J. Phys. D Appl. Phys. 7, 1063–1072.
May, C.E., Partridge, J.A., 1964. Thermoluminescence kinetics of alpha irradiatedalkali halides. J. Chem. Phys. 40, 1401–1415.
Moscovitch, M., Horowitz, Y.S., 2007. Thermoluminescence materials for medicalapplications: LiF:Mg,Ti and LiF:Mg,Cu,P. Radiat. Meas. 41, S71–S77.
Noor, N.M., Hussein, M., Bradley, D.A., Nisbet, A., 2011. The potential of Ge-dopedoptical fiber TL dosimetry for 3D verification of high energy IMRT photonbeams. Nucl. Instrum. Methods Phys. Res. Sect. A 652, 891–895.
Ong, C.L., Kandaiya, S., Kho, H.T., Chong, M.T., 2009. Segments of a commercial Ge-doped optical fiber as a thermoluminescent dosimeter in radiotherapy. Radiat.Meas. 44 (2), 158–162.
Randall, J.T., Wilkins, M.H.F., 1945. Phosphorescence and electron traps. I. The studyof trap distributions. Proc. R. Soc. Sci. Lond. A 184, 366–389.
Related Documents


