Thermogravimetric study on the pyrolysis kinetics of apple pomace as waste biomass M. R. Baray Guerrero a , M. Marques da Silva Paula b , M. Mel endez Zaragoza a , J. Salinas Guti errez a , V. Guzm an Velderrain a , A. L opez Ortiz a , V. Collins-Martı´nez a,* a Departamento de Materiales Nanoestructurados, Centro de Investigaci on en Materiales Avanzados, S.C., Miguel de Cervantes 120, Chihuahua, Chih. 31109, Mexico b Laboratory of Synthesis of Multifunctional Complexes, PPGCS, Universidade do Extremo Sul Catarinense, 88806-000 Criciu ´ ma, SC, Brazil article info Article history: Available online 23 July 2014 Keywords: Apple pomace Waste pyrolysis TGA Kinetics abstract Biomass waste-to-energy is an attractive alternative to fossil feedstocks because of essentially zero net CO 2 impact. A viable option consists in an integrated process, in which biomass is partly used to produce valuable chemicals with residual fractions employed for hydrogen production. One example of a biomass waste is the apple pomace, which is the residue generated in the process of extraction of apple juice. In this research, a kinetic study of the pyrolysis of apple pomace biomass (APB) was performed by TGA aiming its liquid and gaseous products be utilized for the production of valuable chemicals and hydrogen. Characterization of APB consisted in calorific value, compositional, proximal and elemental analyzes. Kinetics were evaluated using three iso-conversional TGA models at 5, 10, 15 and 20 C/min. Activation energy values of 213.0 and 201.7 kJ/mol were within the range for hemicellulose and cellulose, respectively, which are the main components of biomass. Copyright © 2014, Hydrogen Energy Publications, LLC. Published by Elsevier Ltd. All rights reserved. Introduction The current global economic development is based on the trade and processing of oil, however, depletion is expected during the first quarter of this century, which poses both economic and energy supply problems because energy de- mand is met mainly from fossil fuels [1]. Biomass as a renewable source not only allows to partially replace fossil fuels, but also to reduce concentrations of gaseous pollutants (carbon oxides) emitted into the atmosphere [2]. Agro- industrial residues represent a renewable source of energy, as obtained in large quantities as a result of industrial pro- cessing of fruits and vegetables and are a cheap raw material for conversion to biofuels [3]. Moreover the use of renewable energy technologies such as wind, geothermal, hydro, solar, hydrogen and those obtained from biomass are alternatives in the medium and long-term for the replacement of fossil fuels [4]. Today hydrogen is generated mostly from fossil fuels with a consequent, release of CO 2 * Corresponding author. Tel.: þ52 6144391129. E-mail address: [email protected] (V.Collins-Martı´nez). Available online at www.sciencedirect.com ScienceDirect journal homepage: www.elsevier.com/locate/he international journal of hydrogen energy 39 (2014) 16619 e16627 http://dx.doi.org/10.1016/j.ijhydene.2014.06.012 0360-3199/Copyright © 2014, Hydrogen Energy Publications, LLC. Published by Elsevier Ltd. All rights reserved.

Welcome message from author
This document is posted to help you gain knowledge. Please leave a comment to let me know what you think about it! Share it to your friends and learn new things together.
Transcript

ww.sciencedirect.com
i n t e r n a t i o n a l j o u r n a l o f h y d r o g e n en e r g y 3 9 ( 2 0 1 4 ) 1 6 6 1 9e1 6 6 2 7
Available online at w
ScienceDirect
journal homepage: www.elsevier .com/locate/he
Thermogravimetric study on the pyrolysis kineticsof apple pomace as waste biomass
M. R. Baray Guerrero a, M. Marques da Silva Paula b,M. Mel�endez Zaragoza a, J. Salinas Guti�errez a, V. Guzm�an Velderrain a,A. L�opez Ortiz a, V. Collins-Martınez a,*
a Departamento de Materiales Nanoestructurados, Centro de Investigaci�on en Materiales Avanzados, S.C.,
Miguel de Cervantes 120, Chihuahua, Chih. 31109, Mexicob Laboratory of Synthesis of Multifunctional Complexes, PPGCS, Universidade do Extremo Sul Catarinense,
88806-000 Criciuma, SC, Brazil
a r t i c l e i n f o
Article history:
Available online 23 July 2014
Keywords:
Apple pomace
Waste pyrolysis
TGA
Kinetics
* Corresponding author. Tel.: þ52 614439112E-mail address: [email protected]
http://dx.doi.org/10.1016/j.ijhydene.2014.06.00360-3199/Copyright © 2014, Hydrogen Ener
a b s t r a c t
Biomass waste-to-energy is an attractive alternative to fossil feedstocks because of
essentially zero net CO2 impact. A viable option consists in an integrated process, in which
biomass is partly used to produce valuable chemicals with residual fractions employed for
hydrogen production. One example of a biomass waste is the apple pomace, which is the
residue generated in the process of extraction of apple juice. In this research, a kinetic
study of the pyrolysis of apple pomace biomass (APB) was performed by TGA aiming its
liquid and gaseous products be utilized for the production of valuable chemicals and
hydrogen. Characterization of APB consisted in calorific value, compositional, proximal
and elemental analyzes. Kinetics were evaluated using three iso-conversional TGA models
at 5, 10, 15 and 20 �C/min. Activation energy values of 213.0 and 201.7 kJ/mol were within
the range for hemicellulose and cellulose, respectively, which are the main components of
biomass.
Copyright © 2014, Hydrogen Energy Publications, LLC. Published by Elsevier Ltd. All rights
reserved.
Introduction
The current global economic development is based on the
trade and processing of oil, however, depletion is expected
during the first quarter of this century, which poses both
economic and energy supply problems because energy de-
mand is met mainly from fossil fuels [1]. Biomass as a
renewable source not only allows to partially replace fossil
fuels, but also to reduce concentrations of gaseous pollutants
9.u.mx (V. Collins-Martıne12gy Publications, LLC. Publ
(carbon oxides) emitted into the atmosphere [2]. Agro-
industrial residues represent a renewable source of energy,
as obtained in large quantities as a result of industrial pro-
cessing of fruits and vegetables and are a cheap raw material
for conversion to biofuels [3].
Moreover the use of renewable energy technologies such as
wind, geothermal, hydro, solar, hydrogen and those obtained
frombiomassarealternatives in themediumand long-termfor
the replacement of fossil fuels [4]. Todayhydrogen is generated
mostly from fossil fuels with a consequent, release of CO2
z).
ished by Elsevier Ltd. All rights reserved.
i n t e rn a t i o n a l j o u r n a l o f h y d r o g e n en e r g y 3 9 ( 2 0 1 4 ) 1 6 6 1 9e1 6 6 2 716620
during its production stage.While, biomasswaste-to-energy is
an attractive alternative to fossil feedstocks because of
essentially zero net CO2 impact. A viable economical option
consists in an integrated process, in which biomass is partly
used to produce valuable materials or chemicals with residual
fractions employed for hydrogen production. Therefore, the
transformation of waste biomass into energy valued com-
pounds (i. e. H2) is a research field that is considered of great
importance in the present due to the current energy crisis and
environmental pollution issues [2]. Furthermore, biofuels
produced fromvarious lignocellulosicmaterials such aswood,
agricultural or forest residues, have the potential to be a valu-
able substitute (or supplement to gasoline biofuels) to liquid or
gaseous fuels for the transport sector [4].
One specific example of a biomass waste is the apple
pomace, which is the residue generated in the process of
extraction of apple juice. This apple pomace, is formed by a
complex mixture of shell, seed kernel, calyx, stem and soft
tissue, which is representative of the pomace, and this con-
tains mainly cellulose, hemicellulose, lignin and pectin.
The processing of biomass is grouped into three major
groups: biochemical, thermochemical and physicochemical.
Basically three types of thermochemical processes are
distinguished: pyrolysis, gasification and combustion. The
term pyrolysis refers to the incomplete thermal degradation
which leads to the production of coal tars and condensable
liquids and gases. In its strictest sense, pyrolysis must be
performed in complete absence of oxygen, however, this term
is nowused in a broader connotation, to describe the chemical
changes caused by the action of heat [5].
Moreover, pyrolysis is typically studied based on hypotheti-
cal models [6], where it is considered that the overall perfor-
mance of pyrolysis is the combination of the behavior of each
individual component [6,7]. Therefore, the determination of the
kinetic parameters provides key information of the processes
that take place, as well as the structure and composition of its
constituents [6]. Furthermore, the analysis of the thermal
degradation volatile products, identifies the gaseous species
emitted by the biomass, and thus provides insights to the pro-
cesses through which such decomposition occurs. The deter-
mination of the decomposition kinetics of lignocellulosic
biomass involves the knowledge of the reaction mechanisms.
However, the number of reactions occurring simultaneously in
the simplest pyrolysis process is so great that prevents to
develop a kinetic model that takes into account all these re-
actions. A kinetic study aims to reveal how the thermal
decomposition takes place (whether one ormore processes and
what range of conversions occur) through the characteristic ki-
netic constants provided by the kinetic models. This last is
critical to thedesign,constructionandoperationona large-scale
reactor for thepyrolysisofapplepomacesubject to study, for the
use of valued chemicals that may be generated or for the pro-
duction of hydrogen from gaseous products or simply to get rid
of certain wastes in a clean way [6]. The kinetic analysis of the
thermaldecompositionofbiomass isgenerally basedonthe rate
equation of decomposition of solids [8].
The present research is aimed to perform a basic charac-
terization of apple pomace (from the region of Cuauhtemoc,
Chihuahua, Mexico), the determination of the kinetic param-
eters (activation energy and pre-exponential factor) of the
pyrolysis reaction under a nitrogen atmosphere using differ-
ential and integral non-isothermal iso-conversional models.
Furthermore, the models employed in the present research
were: the differential Friedman and two integral
FlynneWalleOzawa (FWO) and KissingereAkahiraeSunose
(KAS)models onTGAdata for the apple pomacebiomass (APB).
Experimental
Sample characterization
Apple pomace sampleswere collected from the northern state
of Chihuahua (Cuauht�emoc, Chihuahua) and subjected to a
drying process, crushed, grounded and sieved to achieve a
particle size of 150 mm.
The elemental and proximal analyzes for the apple pomace
sample were performed using a Carlo Erba EA-1110 elemental
analyzer and an atomic emission spectrometer coupled with
ICP (ICP Thermo Jarrell Ash IRIS/AP DUO), calorific power was
determined through an adiabatic bomb calorimeter (Parr-1341
Oxygen Bomb Calorimeter) following the standard test
method ASTM D-2015-96.
Lignin, cellulose, hemicellulose and pectin content from
the pomace were determined using gravimetric techniques,
described in ASTM (E 1756-95, D1106-95) andASTM (D1103-60).
Moisture, volatiles and ash content was determined according
to the procedure described in ASTM E (871-82), ASTM (872-82)
and ASTM (1755e1795), respectively. In order to determine the
particle size (dp), samples were analyzed with dimensions:
dp < 150 mm (150 mm), 150 < dp < 180 mm (180 mm),
180 < dp < 250 mm (250 mm), and 250 < dp < 450 mm (450 mm)
under 100 cm3/min N2 flow and heating from room tempera-
ture to 800 �C at a rate of 10 �C/min. To verify the effect of the
heating rate on the generation of volatiles and to obtain the
kinetic parameters, the pomace sample was used with the
same particle size, which was subjected to different heating
rates of 5, 10, 15 and 20 �C/min.
Thermogravimetric analysis
TGA tests were carried out under an inert atmosphere (N2)
using a TGA-Q-500, TA Instruments equipment. Heating rates
(b) were controlled at 5, 10, 15 and 20 �C/min. Experiments
were performed under a nitrogen atmosphere with a flowrate
of 100 cm3/min and by duplicate. In all TGA tests between 20
and 30 mg of apple pomace biomass (APB) sample with a
specific particle size were deposited on the crucible of the
thermo balance. Then this sample was the subjected to a
specific heating rate from room temperature to 800 �C.
Kinetic models
During the pyrolysis primary reactions occur, so that the ki-
netic study of these are of paramount importance with TGA
being a very powerful tool. The determination of decomposi-
tion kinetics of lignocellulosic materials involves the knowl-
edge of the reaction mechanisms. However, the number of
reactions occurring simultaneously during a simple pyrolysis
process is so great that prevents the development of a kinetic

i n t e r n a t i o n a l j o u r n a l o f h y d r o g e n en e r g y 3 9 ( 2 0 1 4 ) 1 6 6 1 9e1 6 6 2 7 16621
model that takes into account all these reactions. Thus, py-
rolysis is typically studied through hypothetical [5] models, in
which the overall pyrolysis behavior is considered as the
combination of each individual component [6,7].
Moreover, the kinetic study attempts to unravel how the
thermal decomposition takes place (whether one or more
processes and what range of conversions occur) through the
characteristic kinetic constants provided by the kinetic
models. This is critical to the design, build and operation of a
large-scale reactor for pyrolysis of the apple pomace biomass,
subject of the present study.
Kinetic analysis of the thermal decomposition of biomass
is generally based on the rate equation of decomposition of
solids [8]:
dadt
¼ A exp
��Ea
RT
�fðaÞ (1)
where t denotes time, a indicates the fraction of sample that
has reacted and the degree of conversion, da/dt is the rate of
the process, A and Ea are the pre-exponential factor and the
activation energy, respectively, from the Arrhenius equation
f(a) is a conversion function that represents the reaction
model used and depends on the controlling mechanism.
In this study, the degree of conversion, a, is defined as:
a ¼ W0 �WW0 �Wf
(2)
where w0, wf and w are the sample masses at the beginning,
end, and at a specific time t, respectively.
The unknown terms in equation (1) are the formal kinetic
parameters (A, Ea and f(a)) which are used to characterize
biomass pyrolysis reactions [9].
For non-isothermal reactions, where the heating rate,
b¼ dT/dt is constant, the above equationmay be expressed as:
dadt
¼ bdadT
¼ A exp
��Ea
RT
�fðaÞ (3)
The techniques developed for the evaluation of the kinetic
parameters for non-isothermal thermogravimetric analysis can
be divided into fitting models and free models. With the free
model is not necessary to assume a kinetic reaction, while ki-
netic parameters are obtained as a function of conversion or
temperature.Within suchmodels there are the iso-conversional
methods, which assume a constant degree of conversion, and
therefore the reaction rate depends only on the temperature.
Thus, these methods allow the estimation of the activation en-
ergy, Ea as a function of conversion, a, and independently of the
reactionmodel, f(a).
TheTGAdataprocessing of iso-conversionalmethodscanbe
either differential or integral. This paper presents results froma
differential (Friedman) and two integral; FlynneWalleOzawa
(FWO) and KissingereAkahiraeSunose (KAS) methods.
The Friedman iso-conversional method is a differential
technique, which involves taking natural logarithms of both
sides of equation (3) [10],:
ln
�dadt
�¼
�bdadT
�¼ ln½AfðaÞ� ¼
��Ea
RT
�(4)
It is assumed that the conversion function f(a) remains
constant, which means that the biomass degradation is
temperature independent and depends exclusively on the rate
of mass loss. A plot of ln(da/dt) versus 1/T for the same degree
of conversion of data taken at various heating rates, will result
in a series of lines with slopes equal to �Ea/R for each value of
conversion, a, at different heating rates.
The FlynneWalleOzawa method (FWO) is an integral iso-
conversional technique where regrouping the terms of equa-
tion (4), and integrating these with respect to a and T variables
and using the approximation of Doyle the following expres-
sion is obtained:
ln bylog
�A
Ea
RgðaÞ�� 2:315� 0:4567
�Ea
RT
�(5)
Thus, in the FWO method the plot of log(AEa/Rg(a)) vs 1/T
or ln(b) vs 1/T for different heating rates allows to obtain
parallel lines for a fixed degree of conversion. The slope
(�0.4567Ea/R) of these lines is proportional to the apparent
activation energy. If equal Ea values are obtained for different
values of a, it can be assumed with certainty that there is a
single reaction step. By contrast, a change in Ea with an in-
crease in the conversion degree is indicative of a complex
reaction mechanism [11].
Another widely used integral iso-conversional technique is
the KissingereAkahiraeSunose (KAS) method, obtained from
the CoatseRedfern approximation and based on the following
equation [12,13]:
ln
�b
T2
�¼ ln
�AR
EagðaÞ���Ea
RT
�(6)
Assuming that a has a fixed value, the activation energy
(Ea) can be determined from the slope of the straight line ob-
tained by plotting ln(b/T2) vs 1/T.
Results and Discussion
Chemical analyses
Table 1 presents results from the proximal, elemental and
compositional analyses for apple pomace.
From the results of Table 1 it can be seen that the apple
pomace has a small amount of N (0.78%), while for the case of
S, this could not be detected, which is advantageous because
it minimizes the corrosion problems associated with the
formation of acids in the process equipment [4]. It is also
evident that the greatest elemental amount corresponds to
carbon with a 47.98% followed by oxygen with 37.44%.
Moreover, there is a low ash (3.4%) and a high volatile
(81.32%) contents, characteristic of lignocellulosic materials,
which makes this biomass very attractive for thermal
degradation processes [9]. The lignocellulosic composition is
typically of biomass, although it is important to notice its
high cellulose content (47.49%). With respect to the mineral
composition of the ashes the major contributions come from
barium (37.75%) and titanium (17.51%).
Thermogravimetric analysis
Experimental TGA curves obtained for the apple pomace
under different heating rates are presented in Fig. 1. The

Table 1 e Results from calorific power, proximal,elemental and compositional analyses for the APB.
Parameter Unit Magnitude
Elemental Analysis
C % 47.98
H % 6.65
N % 0.78
O % 37.44
S % N.D
Compositional Analysis
Cellulose % 47.49
Hemicellulose % 27.77
Lignin % 24.72
Proximate Analysis
Moisture % 8.87
Fixed Carbon % 6.41
Volatile matter % 81.32
Ash % 3.40
Composition of ash
Al % 0.51
B % 11.43
Ba % 37.75
Ca % 2.01
Cr % 0.80
Cu % 8.50
Fe % 0.35
K % 7.73
Mg % 1.54
Mn % 10.24
Na % 0.23
Ti % 17.51
V % 0.56
Zn % 0.84
Removable
Ethanol % 2.89
Physical Properties
Density kg/m3 1103
Calorific Power kJ/kg 22,420
i n t e rn a t i o n a l j o u r n a l o f h y d r o g e n en e r g y 3 9 ( 2 0 1 4 ) 1 6 6 1 9e1 6 6 2 716622
thermal decomposition of the apple pomace reveals two
main regions attributed to the decomposition of cellulose and
hemicellulose. The first decomposition mass loss that occurs
at low temperatures can be associated to the process of py-
rolysis of hemicellulose and at higher temperatures the
0 100 200 300 400 500 600 700 800 900
0
5
10
15
20
25
30
35
Wei
ght,
%
Temperature, °C
5 °C/min 10°C /min 15 °C/min 20 °C/min
Fig. 1 e TGA curves for the pyrolysis of apple pomace under
N2 at different heating rates.
weight loss is associated with decomposition of cellulose.
Moreover, mass losses for the decomposition of lignin are not
observed in this temperature range. Understanding of the
volatilization of apple pomace is important because pyrolysis
is the first step in a process of gasification or combustion [8].
Furthermore, in this TGA plot it is observed that the greatest
amount of volatile material is produced at a heating rate of
5 �C/min, which is the curve that ends its decomposition at a
lower temperature (~540 �C). When heating rate increases,
the required time to reach a certain temperature value in-
creases, enabling dehydration, depolymerization, carbonyla-
tion, carboxylation and transglycosylation reactions. As a
consequence, the amount of devolatilized matter is
increased. The obtained curves at different heating rates,
after a certain decomposition stage at high heating rate,
reach a common value typical of the mass solid residue [14].
The largest sample weight loss is located from a temperature
range of 200e450 �C, as can be observed in Fig. 1, and this can
be attributed to the devolatilization process. Analyzing this
behavior, according to the literature the weight loss that oc-
curs at 200 �C is related to the beginning of the lignin and
hemicellulose pyrolysis contained in the apple pomace [15].
From 250 and up to approximately 350 �C the high decom-
position rate arises and in this region the maximum devo-
latilization of hemicellulose, cellulose and lignin is achieved.
Remaining molecules of these compounds generate the next
weight loss that corresponds to the temperature (up to
550 �C) in which the reaction ends.
Fig. 2 presents a TGA plot of the apple pomace biomass
(APB) subjected to different particle size fractions at a heating
rate of 10 �C/min. In this Figure it can be observed that particle
sizes smaller or equal than 150 mm are the ones that allow the
generation of the greater amount of volatile matter. The dif-
ference in volatiles production with respect to the size of the
particles is attributed to a main reason: particles greater than
425 mm, during the devolatilization process, some problems
arise related to the heat and mass transfer [16], as reported by
Lou and Stanmore [17].
Fig. 2 e TGA curves for the pyrolysis of the apple pomace
under N2 at a heating rate of 10 �C/min and different
particle sizes.

Fig. 3 e DTGA curves for the pyrolysis of apple pomace
under N2 at different heating rates.
i n t e r n a t i o n a l j o u r n a l o f h y d r o g e n en e r g y 3 9 ( 2 0 1 4 ) 1 6 6 1 9e1 6 6 2 7 16623
The derivative of weight vs temperature plots for the
different heating rates (b) of 5, 10, 15, 20 �C/min for the apple
pomace are shown in Fig. 3. In TGA and derivative
thermogravimetric analysis (DTGA) from the pyrolysis of
lignocellulosic materials typically, at least three peaks are
observed, which can be associated to the cellulose,
200 300 400 500 600 700 800 900 1000 11000.0
0.2
0.4
0.6
0.8
1.0
Con
vers
ion,
Temperature, K
5 °C/min
200 300 400 500 600 700 800 900 1000 11000.0
0.2
0.4
0.6
0.8
1.0
Con
vers
ion,
Temperature, K
15 °C/min
Fig. 4 e Isothermal residence time effect for
hemicellulose and lignin. Thus, indicating that although
there appear interactions between fractions they usually
overlap in their decomposition, while their identity is
maintained [5]. Specifically, at temperatures below 200 �Cthere is a small change in conversion of the sample and is
this usually attributed to moisture removal, which is bonded
to the surface of the sample. The apple pomace decompo-
sition started around 250 �C as shown in Figs. 1 and 2. While,
in Fig. 3 a displacement of the curves to the right with the
increase in heating rate is observed. This shift happened
due to a greater reaction times that occurred at higher
temperatures, In addition, the maximum decomposition
rate tends to increase at higher heating rates, because a
greater thermal energy is provided that facilitates the heat
transfer around and within the samples [18]. Furthermore,
TGA curves show that the major decomposition occurs be-
tween 220 and 600 �C. Given the fact that the biomass con-
tains mainly cellulose, hemicellulose, lignin and pectin, it
has been found that cellulose decomposes between 277 and
427 �C, hemicellulose around 197 and 327 �C and lignin be-
tween 277 and 527 �C [19]. Also, it can be observed that the
decomposition of the pomace after 400 �C proceeds at a
slower rate because of the characteristic lignin decomposi-
tion rate [20].
200 300 400 500 600 700 800 900 1000 11000.0
0.2
0.4
0.6
0.8
1.0
Con
vers
ion,
10 °C/min
Temperature, K
200 300 400 500 600 700 800 900 1000 11000.0
0.2
0.4
0.6
0.8
1.0
Con
vers
ion,
Temperature, K
20 °C/min
the apple pomace (from 300 to 1070 K).
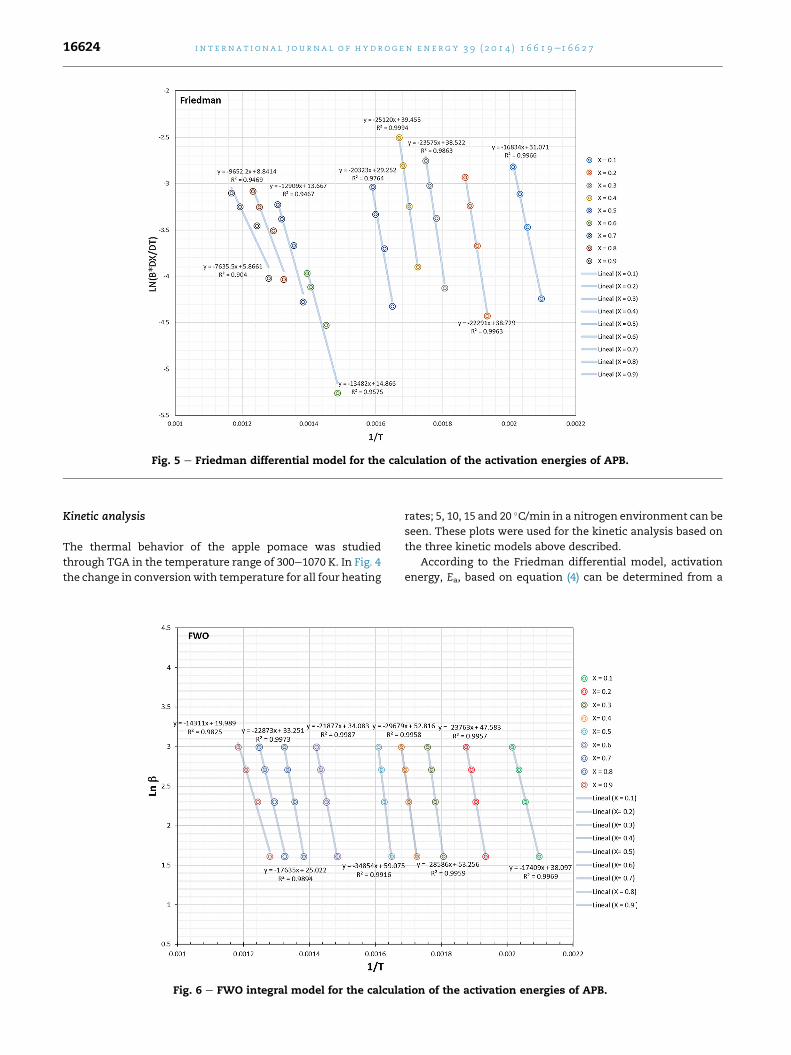
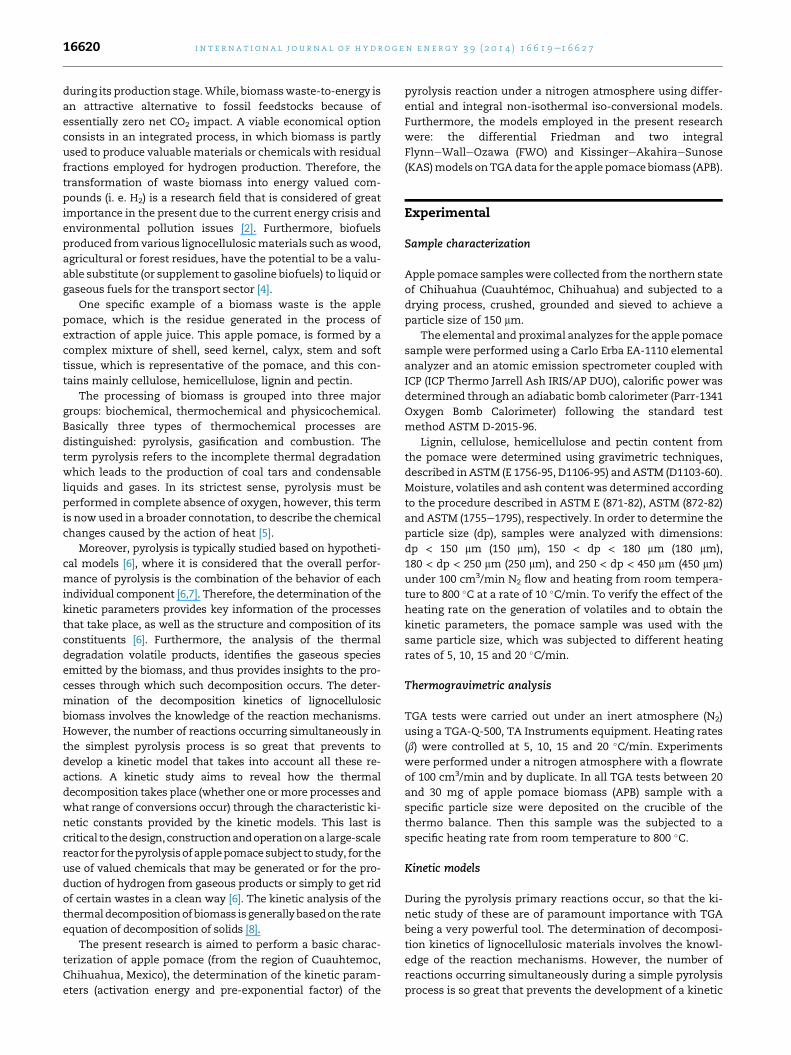
Fig. 5 e Friedman differential model for the calculation of the activation energies of APB.
i n t e rn a t i o n a l j o u r n a l o f h y d r o g e n en e r g y 3 9 ( 2 0 1 4 ) 1 6 6 1 9e1 6 6 2 716624
Kinetic analysis
The thermal behavior of the apple pomace was studied
through TGA in the temperature range of 300e1070 K. In Fig. 4
the change in conversionwith temperature for all four heating
Fig. 6 e FWO integral model for the calcula
rates; 5, 10, 15 and 20 �C/min in a nitrogen environment can be
seen. These plots were used for the kinetic analysis based on
the three kinetic models above described.
According to the Friedman differential model, activation
energy, Ea, based on equation (4) can be determined from a
tion of the activation energies of APB.
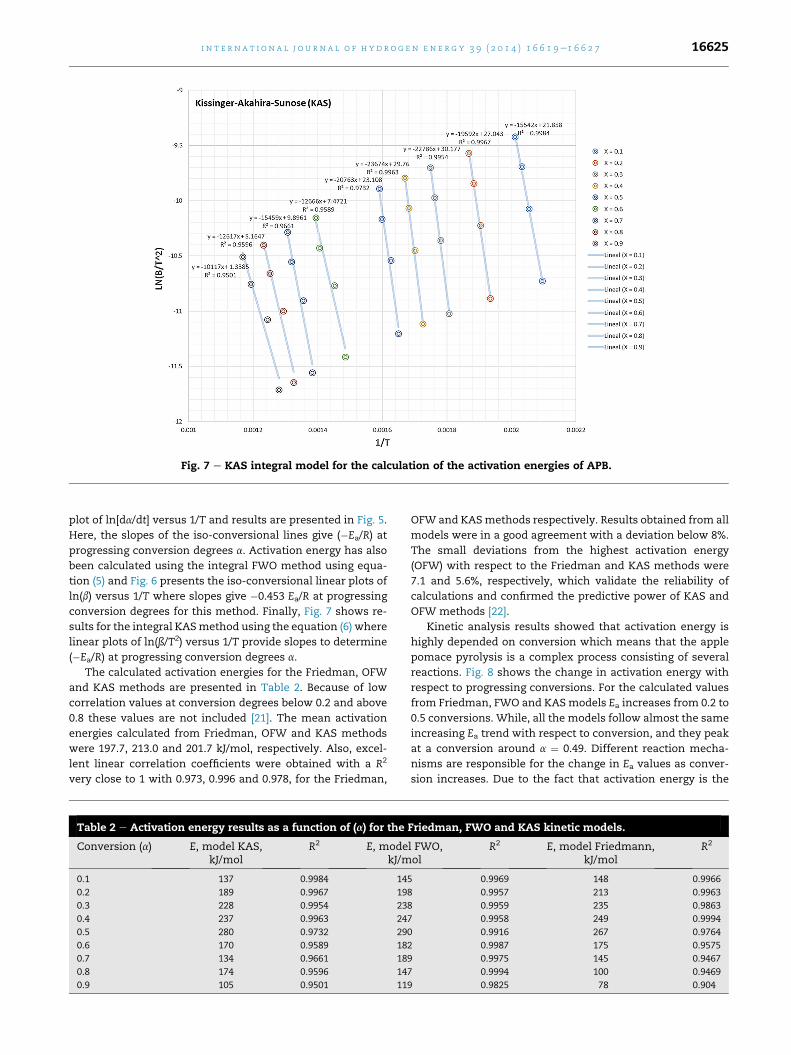
Fig. 7 e KAS integral model for the calculation of the activation energies of APB.
i n t e r n a t i o n a l j o u r n a l o f h y d r o g e n en e r g y 3 9 ( 2 0 1 4 ) 1 6 6 1 9e1 6 6 2 7 16625
plot of ln[da/dt] versus 1/T and results are presented in Fig. 5.
Here, the slopes of the iso-conversional lines give (�Ea/R) at
progressing conversion degrees a. Activation energy has also
been calculated using the integral FWO method using equa-
tion (5) and Fig. 6 presents the iso-conversional linear plots of
ln(b) versus 1/T where slopes give �0.453 Ea/R at progressing
conversion degrees for this method. Finally, Fig. 7 shows re-
sults for the integral KASmethod using the equation (6) where
linear plots of ln(ß/T2) versus 1/T provide slopes to determine
(�Ea/R) at progressing conversion degrees a.
The calculated activation energies for the Friedman, OFW
and KAS methods are presented in Table 2. Because of low
correlation values at conversion degrees below 0.2 and above
0.8 these values are not included [21]. The mean activation
energies calculated from Friedman, OFW and KAS methods
were 197.7, 213.0 and 201.7 kJ/mol, respectively. Also, excel-
lent linear correlation coefficients were obtained with a R2
very close to 1 with 0.973, 0.996 and 0.978, for the Friedman,
Table 2 e Activation energy results as a function of (a) for the
Conversion (a) E, model KAS,kJ/mol
R2 E, modekJ/m
0.1 137 0.9984 14
0.2 189 0.9967 19
0.3 228 0.9954 23
0.4 237 0.9963 24
0.5 280 0.9732 29
0.6 170 0.9589 18
0.7 134 0.9661 18
0.8 174 0.9596 14
0.9 105 0.9501 11
OFW and KASmethods respectively. Results obtained from all
models were in a good agreement with a deviation below 8%.
The small deviations from the highest activation energy
(OFW) with respect to the Friedman and KAS methods were
7.1 and 5.6%, respectively, which validate the reliability of
calculations and confirmed the predictive power of KAS and
OFW methods [22].
Kinetic analysis results showed that activation energy is
highly depended on conversion which means that the apple
pomace pyrolysis is a complex process consisting of several
reactions. Fig. 8 shows the change in activation energy with
respect to progressing conversions. For the calculated values
from Friedman, FWO and KASmodels Ea increases from 0.2 to
0.5 conversions. While, all the models follow almost the same
increasing Ea trend with respect to conversion, and they peak
at a conversion around a ¼ 0.49. Different reaction mecha-
nisms are responsible for the change in Ea values as conver-
sion increases. Due to the fact that activation energy is the
Friedman, FWO and KAS kinetic models.
l FWO,ol
R2 E, model Friedmann,kJ/mol
R2
5 0.9969 148 0.9966
8 0.9957 213 0.9963
8 0.9959 235 0.9863
7 0.9958 249 0.9994
0 0.9916 267 0.9764
2 0.9987 175 0.9575
9 0.9975 145 0.9467
7 0.9994 100 0.9469
9 0.9825 78 0.904
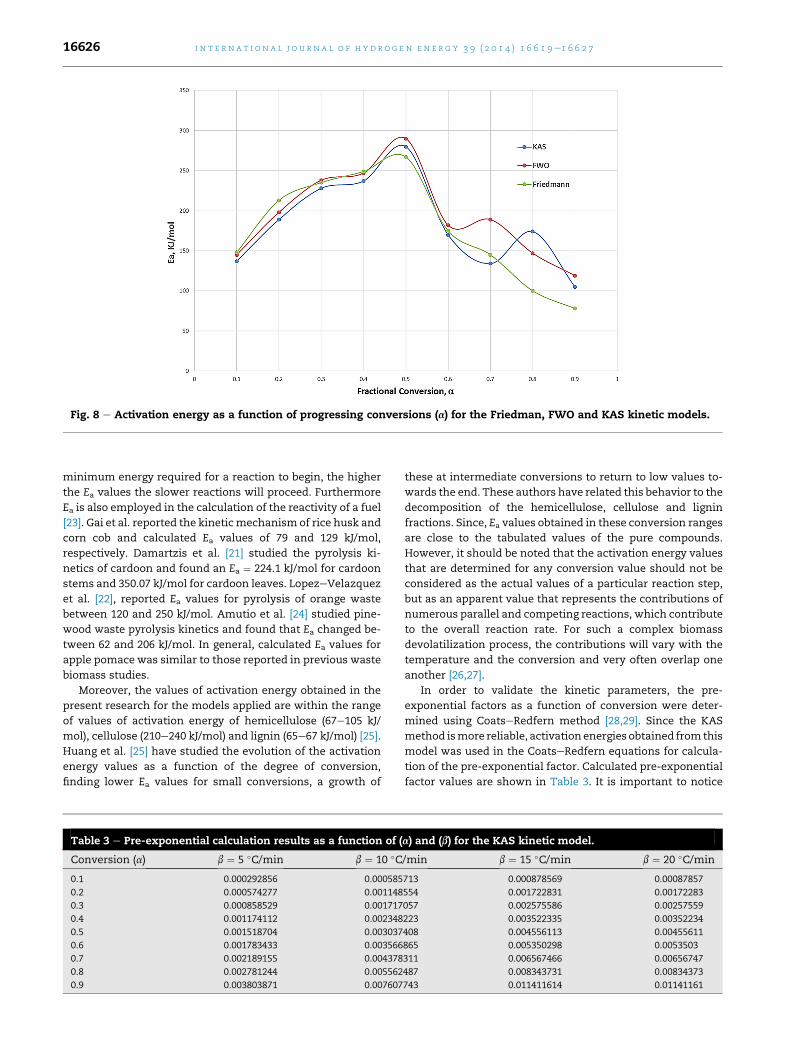
Fig. 8 e Activation energy as a function of progressing conversions (a) for the Friedman, FWO and KAS kinetic models.
i n t e rn a t i o n a l j o u r n a l o f h y d r o g e n en e r g y 3 9 ( 2 0 1 4 ) 1 6 6 1 9e1 6 6 2 716626
minimum energy required for a reaction to begin, the higher
the Ea values the slower reactions will proceed. Furthermore
Ea is also employed in the calculation of the reactivity of a fuel
[23]. Gai et al. reported the kineticmechanism of rice husk and
corn cob and calculated Ea values of 79 and 129 kJ/mol,
respectively. Damartzis et al. [21] studied the pyrolysis ki-
netics of cardoon and found an Ea ¼ 224.1 kJ/mol for cardoon
stems and 350.07 kJ/mol for cardoon leaves. LopezeVelazquez
et al. [22], reported Ea values for pyrolysis of orange waste
between 120 and 250 kJ/mol. Amutio et al. [24] studied pine-
wood waste pyrolysis kinetics and found that Ea changed be-
tween 62 and 206 kJ/mol. In general, calculated Ea values for
apple pomace was similar to those reported in previous waste
biomass studies.
Moreover, the values of activation energy obtained in the
present research for the models applied are within the range
of values of activation energy of hemicellulose (67e105 kJ/
mol), cellulose (210e240 kJ/mol) and lignin (65e67 kJ/mol) [25].
Huang et al. [25] have studied the evolution of the activation
energy values as a function of the degree of conversion,
finding lower Ea values for small conversions, a growth of
Table 3 e Pre-exponential calculation results as a function of (
Conversion (a) b ¼ 5 �C/min b ¼ 10 �C
0.1 0.000292856 0.000585
0.2 0.000574277 0.001148
0.3 0.000858529 0.001717
0.4 0.001174112 0.002348
0.5 0.001518704 0.003037
0.6 0.001783433 0.003566
0.7 0.002189155 0.004378
0.8 0.002781244 0.005562
0.9 0.003803871 0.007607
these at intermediate conversions to return to low values to-
wards the end. These authors have related this behavior to the
decomposition of the hemicellulose, cellulose and lignin
fractions. Since, Ea values obtained in these conversion ranges
are close to the tabulated values of the pure compounds.
However, it should be noted that the activation energy values
that are determined for any conversion value should not be
considered as the actual values of a particular reaction step,
but as an apparent value that represents the contributions of
numerous parallel and competing reactions, which contribute
to the overall reaction rate. For such a complex biomass
devolatilization process, the contributions will vary with the
temperature and the conversion and very often overlap one
another [26,27].
In order to validate the kinetic parameters, the pre-
exponential factors as a function of conversion were deter-
mined using CoatseRedfern method [28,29]. Since the KAS
method ismore reliable, activationenergiesobtained from this
model was used in the CoatseRedfern equations for calcula-
tion of the pre-exponential factor. Calculated pre-exponential
factor values are shown in Table 3. It is important to notice
a) and (b) for the KAS kinetic model.
/min b ¼ 15 �C/min b ¼ 20 �C/min
713 0.000878569 0.00087857
554 0.001722831 0.00172283
057 0.002575586 0.00257559
223 0.003522335 0.00352234
408 0.004556113 0.00455611
865 0.005350298 0.0053503
311 0.006567466 0.00656747
487 0.008343731 0.00834373
743 0.011411614 0.01141161
i n t e r n a t i o n a l j o u r n a l o f h y d r o g e n en e r g y 3 9 ( 2 0 1 4 ) 1 6 6 1 9e1 6 6 2 7 16627
that in the CoatseRedfern model the pseudo-order n, has no
physical meaning and therefore this parameter was not
calculated in the present research. Finally, it is important to
notice that thepresent study is thefirst report onapplepomace
biomass (APB) pyrolysis kinetics and the obtained mid-
activation energy values for APB makes it an attractive ener-
getic waste biomass for a waste-to-energy potential fuel.
Conclusion
In this study the pyrolysis of waste apple pomace biomass
(APB) has been investigated for the first time by means of
thermogravimetric analysis. The low moisture and ash con-
tent and high volatile matter makes apple pomace a high
potential candidate for production of bio-chemicals and with
further processing for hydrogen production. Apple pomace
pyrolysis kinetics using data obtained from TGA analysis
showed good agreement with experimental data. This kinetic
data will be an important tool to model, design and develop a
thermochemical system for apple pomace in the near future.
The results of this study are crucial as they provide many
options for future application of APB as a waste-to-energy
resource for energy and chemicals.
Acknowledgments
This researchwas supported by Consejo Nacional de Ciencia y
Tecnologıa (CONACYT-M�exico)
r e f e r e n c e s
[1] Bassam EN. Renewable energy for rural communities. RenewEnergy 2001;24(3):401e8.
[2] Tang L, Huang H. Biomass gasification using capacitivelycoupled RF plasma technology. Fuel 2005;16:2055e63.
[3] Hong Y, Yuan Z, Junguo L. Land and water requirements ofbiofuel and implications for food supply and theenvironment in China. Energy Policy 2009;37(5):1876e85.
[4] I.D.A.E.e Instituto para laDiversificaci�onyelAhorrodeEnergıa.Biomasa. Available at: http://www.idae.es/index.php/idpag.233/relcategoria.1037/relmenu.48/mod.pags/mem.detalle
[5] Conesa JA. Curso B�asico de An�alisis T�ermico.Termogravimetrıa, cin�etica de reacciones y an�alisis t�ermicodiferencial. Mayo: Universidad de Alicante; 2000.
[6] Conesa JA, Domene A. Biomasses pyrolysis and combustionkinetics through n-th order parallel reactions. ThermochimActa 2011;523:176e81.
[7] Garcıa Barneto A, Ariza Carmona J, Martın Alfonso JE, DıazBlanco J. Kinetic models based in biomass components forthe combustion and pyrolysis of sewage sludge and itscompost. J Anal Appl Pyrolysis 2009;86:108e14.
[8] Min F, Zhang M, Chen Q. Non-isothermal kinetics ofpyrolysis of three kinds of fresh biomass. J China Univ MinTechnol 2007;17(1):105e11.
[9] White JE, Catallo WJ, Legendre BL. Biomass pyrolysis kinetics:a comparative critical review with relevant agriculturalresidue case studies. J Anal Appl Pyrolysis 2011;91:1e33.
[10] Friedman H. Kinetics of thermal degradation of char-formingplastics from thermogravimetry. Application to a phenolicplastic. J Polym Sci Part C Polym Lett 1964;6(1):183e95.
[11] Ozawa T. A new method of analyzing thermogravimetricdata. Bull Chem Soc Jpn 1965;38:1881e6.
[12] Kissinger HE. Reaction kinetics in differential thermalanalysis. Anal Chem 1957;29:1702e6.
[13] Akahira T, Sunose T. Trans. Joint convention of fourelectrical institutes; 1969. p. 246.
[14] Zabaniotou AA, Kantarelis EK, Theodoropoulos DC.Sunflower shells utilization for energetic purposes in anintegrated approach of energy crops: laboratory studypyrolysis and kinetics. Bioresour Technol2008;99:3174e81.
[15] Munir S, Daood SS, Nimmo W, Cunliffe AM, Gibbs BM.Thermal analysis and devolatilization kinetics ofcotton stalk, sugar cane bagasse and shea meal undernitrogen and air atmospheres. Bioresour Technol2009;100:1413e8.
[16] Antony Raja S, Robert Kennedy Z, Pillai BC, Lindon RobertLee C. Flash pyrolysis of jatropha oil cake in electricallyheated fluidized bed reactor. Energy 2010;35:2819e23.
[17] Luo M, Stanmore B. The combustion characteristics of charfrom pulverized bagasse. Fuel 1992;71:1074e6.
[18] Alexander G, Wolfgang K, Sonia R. Tesis de Doctorado,Universi-dad Nacional de Colombia, Colombia y Universidadde Kassel; 2008. Alemania.
[19] Du ZY, Sarofim AF, Longwell JP. Activation-energydistribution in temperature-programmed desorption e
modeling and application to the soot e oxygen system.Energy Fuels 1990;4:296e302.
[20] Xiaodong Z, Min X, Rongfeng S, Sun L. Study on biomasspyrolysis kinetics. J Eng Gas Turbines 2006;128:493e6.
[21] Damartzis T, Vamvuka D, Sfakiotakis S, Zabaniotou A.Thermal degradation studies and kinetic modeling ofcardoon (Cynara cardunculus) pyrolysis usingthermogravimetric analysis (TGA). Bioresour Technol2011;102:6230e8.
[22] Lopez-Velazquez MA, Santes V, Balmaseda J, Torres-Garcia E.Pyrolysis of orange waste: a thermokinetic study. J Anal ApplPyrolysis 2013;99:170e7.
[23] Gai C, Dong Y, Zhang T. The kinetic analysis of the pyrolysisof agricultural residue under non-isothermal conditions.Bioresour Technol 2013;127:298e305.
[24] Amutio M, Lopez G, Aguado R, Artetxe M, Bilbao J, Olazar M.Kinetic study of lignocellulosic biomass oxidative pyrolysis.Fuel 2012;95:305e11.
[25] Huang YF, Kuan WH, Chiueh PT, Lo SL. Pyrolysis of biomassby thermal analysis-mass spectrometry (TA-MS). BioresourTechnol 2011;102(3):3527e34.
[26] Vyazovkin S. Model-free kinetics. J Therm Anal Calorim2006;83:45e51.
[27] Akinwale OA, Thomas JH, Marion C, Edson L, Meyer RS,Knoetze JH, et al. Non-isothermal kinetic analysis of thedevolatilization of corn cobs and sugar cane bagasse in aninert atmosphere. Thermochim Acta 2011;517:81e9.
[28] Suuberg E. Approximate solution technique for non-isothermal, Gaussian distributed activation energy models.Combust Flame 1983;50:243e5.
[29] Teng H, Hsieh CT. Activation energy for oxygenchemisorption on carbon at low temperature. Ind Eng ChemRes 1999;38:292e7.
Related Documents