Thermodynamic modeling of the NbeB system Rockfeller Maciel Pec ¸anha a , Fla ´vio Ferreira b, * , Gilberto Carvalho Coelho a , Carlos Angelo Nunes a , Bo Sundman c a Departamento de Engenharia de Materiais, DEMAR-EEL-USP, CP116, 12600-970, Lorena, SP, Brazil b Escola de Engenharia Industrial Metalu ´rgica de Volta RedondaeUFFeTMC, Av. dos Trabalhadores, 420, CEP 27255-125, Volta Redonda, RJ, Brazil c Division of Physical Metallurgy, Royal Institute of Technology, S-10044, Stockholm 70, Sweden Received 19 June 2006; received in revised form 2 October 2006; accepted 30 October 2006 Available online 20 April 2007 Abstract In the present work, the NbeB binary system was thermodynamically optimized. The stable phases in this system are BCC (niobium), Nb 3 B 2 , NbB, Nb 3 B 4 , Nb 5 B 6 , NbB 2 , B (boron) and liquid L. The borides Nb 3 B 2 , NbB, Nb 3 B 4 and Nb 5 B 6 and the B (boron) were modeled as stoichiometric phases and the liquid L, BCC (niobium) and NbB 2 as solutions, using the sublattices model, with their excess terms described by the RedlicheKister polynomials. The Gibbs energy coefficients were optimized based on the experimental values of enthalpy of formation, low temperature specific heat, liquidus temperatures and temperatures of invariant transformations. The calculated NbeB diagram reproduces well the experimental values from the literature. Ó 2006 Elsevier Ltd. All rights reserved. Keywords: A. Intermetallics, miscellaneous; B. Phase diagrams; B. Thermodynamic and thermochemical properties; E. Phase diagram, prediction 1. Introduction The development of new high-temperature materials is es- sential for future generations of both aircraft engines and land- based gas turbines. Nb-silicide-based composites are potential alloy candidates because they present a good balance of prop- erties required for high-temperature applications [1,2]. Among the information for alloy design and potential evaluation for use as structural material, the phase equilibrium is one of the most important. The present thermodynamic optimization of the NbeB system is part of a research project, which stud- ies the phase relations in the Nb-rich corner of the NbeSieB system. The currently accepted NbeB phase diagram [3], shown in Fig. 1, presents the following stable phases: BCC (niobium), Nb 3 B 2 , NbB, Nb 3 B 4 , Nb 5 B 6 , NbB 2 , B (boron) and liquid L. This phase diagram is mainly based on the experimental data of Nowotny et al. [4] and shows some divergences with the diagram proposed by Rudy and Windisch [5], which is shown in Fig. 2. The main divergences are (i) Massalski pro- poses a peritectic formation for the Nb 3 B 2 , while Rudy and Windisch suggest that this phase is formed peritectoidically; (ii) Massalski proposes the stability of Nb 5 B 6 , based on results reported by Bolmgren and Lundstro ¨m [6], while Rudy and Windisch do not mention the presence of this phase in the mi- crostructures of their samples; (iii) Massalski proposes a homo- geneity range for NbB 2 much wider than the 65e70 at% B reported in Refs. [5,7e9]; and (iv) Massalski suggests the composition of the liquid in the B-rich eutectic to be located at approximately 90 at% B, while Rudy and Windisch propose 98 at% B. To solve these discrepancies, an experimental re-in- vestigation of the NbeB system was performed by Borges et al. [10,11], which confirmed the stability of Nb 5 B 6 and the phase relation in the Nb-rich region proposed by Rudy and Windisch, except for the composition of the liquid in * Corresponding author. Tel.: þ55 24 3344 3013; fax: þ55 24 3344 3020. E-mail address: fl[email protected] (F. Ferreira). 0966-9795/$ - see front matter Ó 2006 Elsevier Ltd. All rights reserved. doi:10.1016/j.intermet.2006.10.054 Intermetallics 15 (2007) 999e1005 www.elsevier.com/locate/intermet

Welcome message from author
This document is posted to help you gain knowledge. Please leave a comment to let me know what you think about it! Share it to your friends and learn new things together.
Transcript
Intermetallics 15 (2007) 999e1005www.elsevier.com/locate/intermet
Thermodynamic modeling of the NbeB system
Rockfeller Maciel Pecanha a, Flavio Ferreira b,*, Gilberto Carvalho Coelho a,Carlos Angelo Nunes a, Bo Sundman c
a Departamento de Engenharia de Materiais, DEMAR-EEL-USP, CP116, 12600-970, Lorena, SP, Brazilb Escola de Engenharia Industrial Metalurgica de Volta RedondaeUFFeTMC, Av. dos Trabalhadores,
420, CEP 27255-125, Volta Redonda, RJ, Brazilc Division of Physical Metallurgy, Royal Institute of Technology, S-10044, Stockholm 70, Sweden
Received 19 June 2006; received in revised form 2 October 2006; accepted 30 October 2006
Available online 20 April 2007
Abstract
In the present work, the NbeB binary system was thermodynamically optimized. The stable phases in this system are BCC (niobium),Nb3B2, NbB, Nb3B4, Nb5B6, NbB2, B (boron) and liquid L. The borides Nb3B2, NbB, Nb3B4 and Nb5B6 and the B (boron) were modeledas stoichiometric phases and the liquid L, BCC (niobium) and NbB2 as solutions, using the sublattices model, with their excess terms describedby the RedlicheKister polynomials. The Gibbs energy coefficients were optimized based on the experimental values of enthalpy of formation,low temperature specific heat, liquidus temperatures and temperatures of invariant transformations. The calculated NbeB diagram reproduceswell the experimental values from the literature.� 2006 Elsevier Ltd. All rights reserved.
Keywords: A. Intermetallics, miscellaneous; B. Phase diagrams; B. Thermodynamic and thermochemical properties; E. Phase diagram, prediction
1. Introduction
The development of new high-temperature materials is es-sential for future generations of both aircraft engines and land-based gas turbines. Nb-silicide-based composites are potentialalloy candidates because they present a good balance of prop-erties required for high-temperature applications [1,2]. Amongthe information for alloy design and potential evaluation foruse as structural material, the phase equilibrium is one ofthe most important. The present thermodynamic optimizationof the NbeB system is part of a research project, which stud-ies the phase relations in the Nb-rich corner of the NbeSieBsystem.
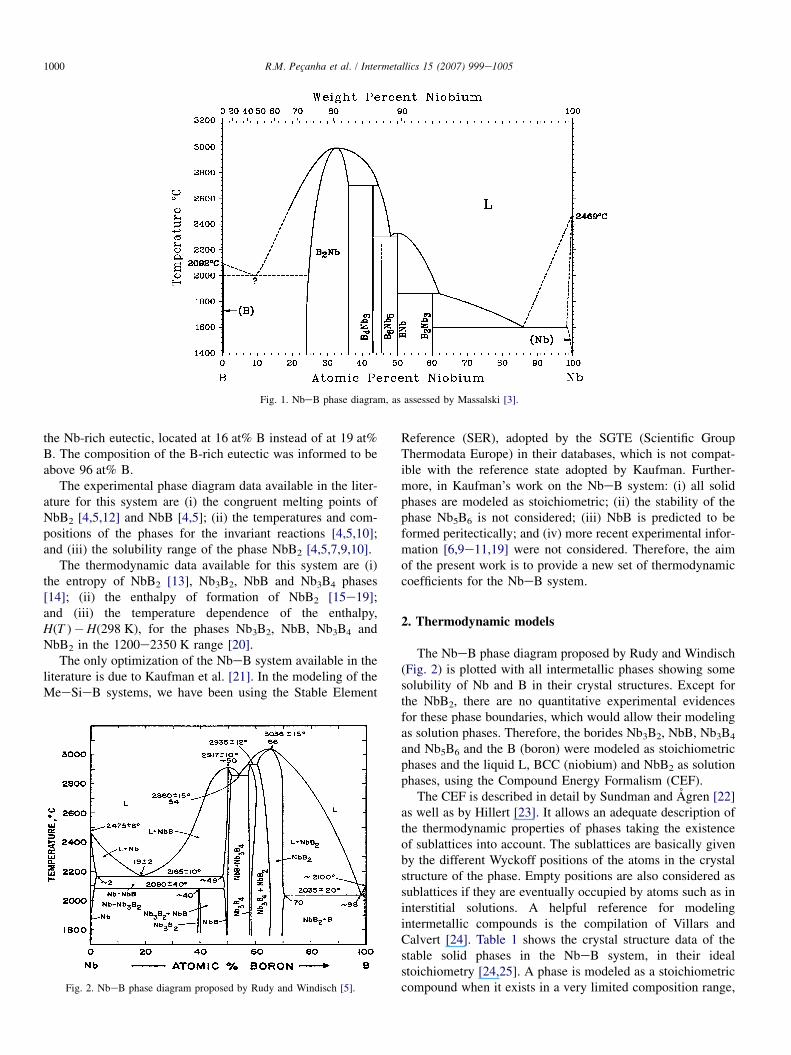
The currently accepted NbeB phase diagram [3], shown inFig. 1, presents the following stable phases: BCC (niobium),Nb3B2, NbB, Nb3B4, Nb5B6, NbB2, B (boron) and liquid L.
* Corresponding author. Tel.: þ55 24 3344 3013; fax: þ55 24 3344 3020.
E-mail address: [email protected] (F. Ferreira).
0966-9795/$ - see front matter � 2006 Elsevier Ltd. All rights reserved.
doi:10.1016/j.intermet.2006.10.054
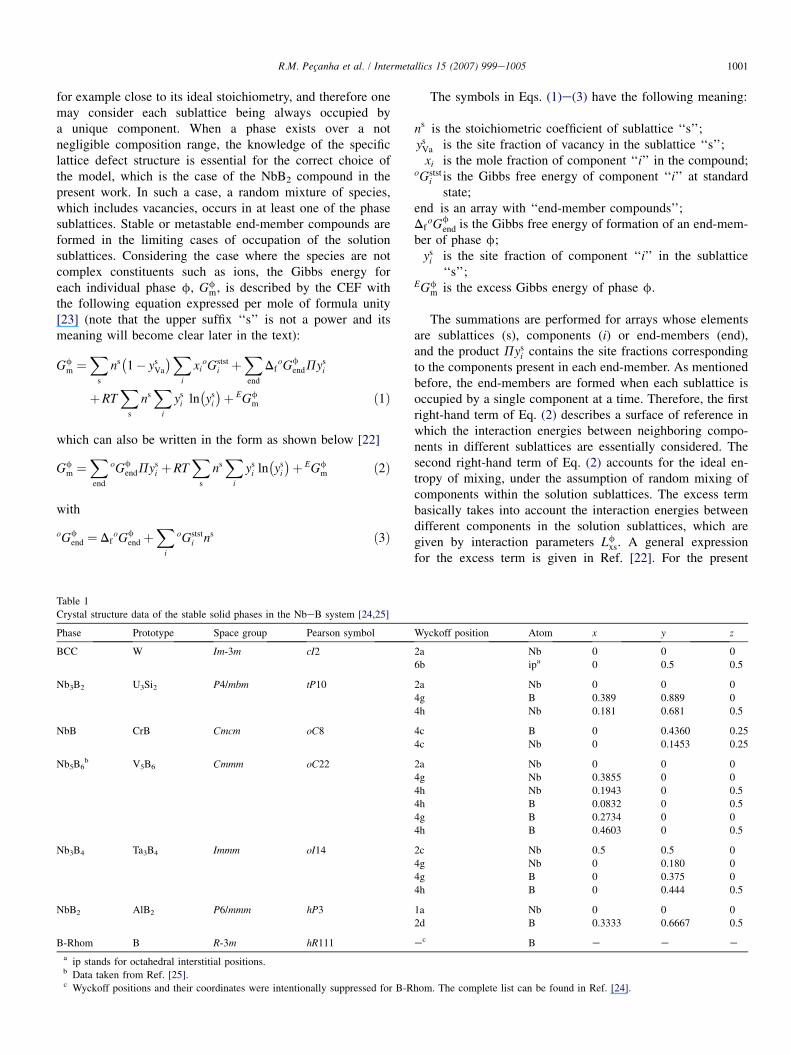
This phase diagram is mainly based on the experimentaldata of Nowotny et al. [4] and shows some divergences withthe diagram proposed by Rudy and Windisch [5], which isshown in Fig. 2. The main divergences are (i) Massalski pro-poses a peritectic formation for the Nb3B2, while Rudy andWindisch suggest that this phase is formed peritectoidically;(ii) Massalski proposes the stability of Nb5B6, based on resultsreported by Bolmgren and Lundstrom [6], while Rudy andWindisch do not mention the presence of this phase in the mi-crostructures of their samples; (iii) Massalski proposes a homo-geneity range for NbB2 much wider than the 65e70 at% Breported in Refs. [5,7e9]; and (iv) Massalski suggests thecomposition of the liquid in the B-rich eutectic to be locatedat approximately 90 at% B, while Rudy and Windisch propose98 at% B. To solve these discrepancies, an experimental re-in-vestigation of the NbeB system was performed by Borgeset al. [10,11], which confirmed the stability of Nb5B6 andthe phase relation in the Nb-rich region proposed by Rudyand Windisch, except for the composition of the liquid in
1000 R.M. Pecanha et al. / Intermetallics 15 (2007) 999e1005
Fig. 1. NbeB phase diagram, as assessed by Massalski [3].
the Nb-rich eutectic, located at 16 at% B instead of at 19 at%B. The composition of the B-rich eutectic was informed to beabove 96 at% B.
The experimental phase diagram data available in the liter-ature for this system are (i) the congruent melting points ofNbB2 [4,5,12] and NbB [4,5]; (ii) the temperatures and com-positions of the phases for the invariant reactions [4,5,10];and (iii) the solubility range of the phase NbB2 [4,5,7,9,10].
The thermodynamic data available for this system are (i)the entropy of NbB2 [13], Nb3B2, NbB and Nb3B4 phases[14]; (ii) the enthalpy of formation of NbB2 [15e19];and (iii) the temperature dependence of the enthalpy,H(T )�H(298 K), for the phases Nb3B2, NbB, Nb3B4 andNbB2 in the 1200e2350 K range [20].
The only optimization of the NbeB system available in theliterature is due to Kaufman et al. [21]. In the modeling of theMeeSieB systems, we have been using the Stable Element
Fig. 2. NbeB phase diagram proposed by Rudy and Windisch [5].
Reference (SER), adopted by the SGTE (Scientific GroupThermodata Europe) in their databases, which is not compat-ible with the reference state adopted by Kaufman. Further-more, in Kaufman’s work on the NbeB system: (i) all solidphases are modeled as stoichiometric; (ii) the stability of thephase Nb5B6 is not considered; (iii) NbB is predicted to beformed peritectically; and (iv) more recent experimental infor-mation [6,9e11,19] were not considered. Therefore, the aimof the present work is to provide a new set of thermodynamiccoefficients for the NbeB system.
2. Thermodynamic models
The NbeB phase diagram proposed by Rudy and Windisch(Fig. 2) is plotted with all intermetallic phases showing somesolubility of Nb and B in their crystal structures. Except forthe NbB2, there are no quantitative experimental evidencesfor these phase boundaries, which would allow their modelingas solution phases. Therefore, the borides Nb3B2, NbB, Nb3B4
and Nb5B6 and the B (boron) were modeled as stoichiometricphases and the liquid L, BCC (niobium) and NbB2 as solutionphases, using the Compound Energy Formalism (CEF).
The CEF is described in detail by Sundman and Agren [22]as well as by Hillert [23]. It allows an adequate description ofthe thermodynamic properties of phases taking the existenceof sublattices into account. The sublattices are basically givenby the different Wyckoff positions of the atoms in the crystalstructure of the phase. Empty positions are also considered assublattices if they are eventually occupied by atoms such as ininterstitial solutions. A helpful reference for modelingintermetallic compounds is the compilation of Villars andCalvert [24]. Table 1 shows the crystal structure data of thestable solid phases in the NbeB system, in their idealstoichiometry [24,25]. A phase is modeled as a stoichiometriccompound when it exists in a very limited composition range,
1001R.M. Pecanha et al. / Intermetallics 15 (2007) 999e1005
for example close to its ideal stoichiometry, and therefore onemay consider each sublattice being always occupied bya unique component. When a phase exists over a notnegligible composition range, the knowledge of the specificlattice defect structure is essential for the correct choice ofthe model, which is the case of the NbB2 compound in thepresent work. In such a case, a random mixture of species,which includes vacancies, occurs in at least one of the phasesublattices. Stable or metastable end-member compounds areformed in the limiting cases of occupation of the solutionsublattices. Considering the case where the species are notcomplex constituents such as ions, the Gibbs energy foreach individual phase f, Gf
m, is described by the CEF withthe following equation expressed per mole of formula unity[23] (note that the upper suffix ‘‘s’’ is not a power and itsmeaning will become clear later in the text):
Gfm ¼
X
s
ns�1� ys
Va
�X
i
xioGstst
i þX
end
DfoGf
endPysi
þRTX
s
nsX
i
ysi ln�ys
i
�þ EGf
m ð1Þ
which can also be written in the form as shown below [22]
Gfm ¼
X
end
oGfendPys
i þRTX
s
nsX
i
ysi ln�ys
i
�þ EGf
m ð2Þ
with
oGfend ¼ Df
oGfend þ
X
i
oGststi ns ð3Þ
The symbols in Eqs. (1)e(3) have the following meaning:
ns is the stoichiometric coefficient of sublattice ‘‘s’’;ys
Va is the site fraction of vacancy in the sublattice ‘‘s’’;xi is the mole fraction of component ‘‘i’’ in the compound;
oGststi is the Gibbs free energy of component ‘‘i’’ at standard
state;end is an array with ‘‘end-member compounds’’;Df
oGfend is the Gibbs free energy of formation of an end-mem-
ber of phase f;ys
i is the site fraction of component ‘‘i’’ in the sublattice‘‘s’’;
EGfm is the excess Gibbs energy of phase f.
The summations are performed for arrays whose elementsare sublattices (s), components (i) or end-members (end),and the product Pys
i contains the site fractions correspondingto the components present in each end-member. As mentionedbefore, the end-members are formed when each sublattice isoccupied by a single component at a time. Therefore, the firstright-hand term of Eq. (2) describes a surface of reference inwhich the interaction energies between neighboring compo-nents in different sublattices are essentially considered. Thesecond right-hand term of Eq. (2) accounts for the ideal en-tropy of mixing, under the assumption of random mixing ofcomponents within the solution sublattices. The excess termbasically takes into account the interaction energies betweendifferent components in the solution sublattices, which aregiven by interaction parameters Lf
xs. A general expressionfor the excess term is given in Ref. [22]. For the present
Table 1
Crystal structure data of the stable solid phases in the NbeB system [24,25]
Phase Prototype Space group Pearson symbol Wyckoff position Atom x y z
BCC W Im-3m cI2 2a Nb 0 0 0
6b ipa 0 0.5 0.5
Nb3B2 U3Si2 P4/mbm tP10 2a Nb 0 0 0
4g B 0.389 0.889 0
4h Nb 0.181 0.681 0.5
NbB CrB Cmcm oC8 4c B 0 0.4360 0.25
4c Nb 0 0.1453 0.25
Nb5B6b V5B6 Cmmm oC22 2a Nb 0 0 0
4g Nb 0.3855 0 0
4h Nb 0.1943 0 0.5
4h B 0.0832 0 0.5
4g B 0.2734 0 0
4h B 0.4603 0 0.5
Nb3B4 Ta3B4 Immm oI14 2c Nb 0.5 0.5 0
4g Nb 0 0.180 0
4g B 0 0.375 0
4h B 0 0.444 0.5
NbB2 AlB2 P6/mmm hP3 1a Nb 0 0 0
2d B 0.3333 0.6667 0.5
B-Rhom B R-3m hR111 ec B e e e
a ip stands for octahedral interstitial positions.b Data taken from Ref. [25].c Wyckoff positions and their coordinates were intentionally suppressed for B-Rhom. The complete list can be found in Ref. [24].
1002 R.M. Pecanha et al. / Intermetallics 15 (2007) 999e1005
work, it is sufficient to take the case of interaction energieswithin ‘‘excess solutions’’ formed under the consideration ofmixing of different components ‘‘i1’’ and ‘‘i2’’ in each solu-tion sublattice at a time while the other sublattices are occu-pied by single components ‘‘i’’. Using RedlicheKisterpolynomials for the interaction parameters [26], the excessterm may be described by:
EGfm ¼
X
xs
Pysi
X
v
vLfxs
�ys
i1� ysi2
�v ð4Þ
where vLfxs is the interaction parameter of order ‘‘v’’. The first
summation is performed for an array whose elements are allpossible ‘‘excess solutions’’ (xs) and the product Pys
i containsthe site fractions corresponding to the components present ineach ‘‘excess solution’’.
2.1. Gibbs energy for pure components
The temperature dependent Gibbs energy of each pure ele-ment is described by an equation of the general form:
oGfm �HSER
i ¼ aþ bT þ cT lnðTÞ þ dT2þ eT3þ fT�1 ð5Þ
where HSERi is the enthalpy of stable element ‘‘i’’ at 298.15 K.
2.2. Solution phase liquid
The liquid phase was modeled as a single sublattice substitu-tional solution. Therefore, the site fractions in Eq. (2) are equiv-alent to the molar fractions and the end-members are coincidentwith the pure elements, i.e. oGL
end1 ¼ oGLNb and oGL
end2 ¼ oGLB,
yielding the following expression for its Gibbs free energy:
GLm¼xNb
oGLNbþxB
oGLBþRT½xNb lnðxNbÞþxB lnðxBÞ�
þxNbxB
�0LL
Nb;Bþ1LLNb;BðxB�xNbÞþ2LL
Nb;BðxB�xNbÞ2�ð6Þ
2.3. Solution phase BCC
The Body Centered Cubic (BCC) crystal structure may bemodeled as a phase with two sublattices, namely the sublatticecorresponding to Wyckoff positions 2a (substitutional) andthat corresponding to octahedral interstitial positions 6b (Table1). Due to compatibility reasons within thermodynamic data-bases, this model is usually adopted even if no interstitial so-lution is formed in the specific system. For the BCC phase inthe NbeB system there is no experimental information aboutthe type of solution of B, whether interstitial or substitutional.However, it is known that the boron atoms occupy the intersti-tial sublattice in metals of BCC structure like Nb [27]. There-fore, also for the NbeB system, the model (Nb)(B,Va)3 waschosen yielding the following expression for its Gibbs energy:
GBCCm ¼ ys1
Nbys2Va
oGBCCNb:Vaþ ys1
Nbys2B
oGBCCNb:Bþ 3RT
�ys2
B ln�ys2
B
�
þ ys2Va ln
�ys2
Va
��þ ys2
B ys2Va
�0LBCC
Nb:B;Va
þ 1LBCCNb:B;Va
�ys2
B � ys2Va
�þ/
�ð7Þ
where oGBCCNb:Va and oGBCC
Nb:B correspond to:
oGBCCNb:Va ¼ oGBCC
Nb þ 3oGVa þDfoGBCC
Nb:Va
oGBCCNb:B ¼ oGBCC
Nb þ 3oGRhomB þDf
oGBCCNb:B
ð8Þ
The BCC phase is described within the limits of (Nb)(Va)3
and (Nb)(B)3, which correspond to the pure BCC-Nb, whenthe interstitial sublattice is empty, and to the metastable com-pound BCC-NbB3, when the interstitial sublattice is com-pletely filled with B atoms. Therefore, the Gibbs energy ofthe first end-member compound, oGBCC
Nb:Va; corresponds tothat of the pure component Nb, oGBCC
Nb :
2.4. Solution phase NbB2
The NbB2 phase exhibits a hexagonal structure (hP3, spacegroup P6/mmm, prototype AlB2) with two sublattices, with Nband B atoms occupying 1a and 2d positions, respectively. Asmentioned before, this phase shows an extensive homogeneityrange (65e70 at% B) [5,7e9]. Post et al. [28] compared thestructural characteristics of several diborides and proposedsubstitutional vacancies in both Nb and B positions as defectmechanisms to explain the homogeneity range of NbB2.Muzzy et al. [29], while studying AlB2-type, B-rich(Mo,Zr)xB2 by neutron diffraction, reported that the metal va-cant positions would accommodate the excess of boron in itsstructure. More recently, Nunes et al. [9] investigated the ho-mogeneity range of NbB2, also by neutron diffraction experi-ments, and confirmed Post’s hypothesis. Therefore, the model(Nb,Va)1(B,Va)2 was adopted for NbB2 in the present workwith its Gibbs energy described by the following equation:
GNbB2m ¼ ys1
Nbys2B
oGNbB2Nb:B þ ys1
Nbys2Va
oGNbB2Nb:Vaþ ys1
Vays2B
oGNbB2Va:B
þ ys1Vay
s2Va
oGNbB2Va:Va þRT
��ys1
Nb ln�ys1
Nb
�þ ys1
Va ln�ys1
Va
��
þ 2�ys2
B ln�ys2
B
�þ ys2
Va ln�ys2
Va
���þ EGNbB2
Nb;Va:B;Va ð9Þ
where
oGNbB2Nb:B ¼ oGBCC
Nb þ 2oGRhomB þDf
oGNbB2Nb:B
oGNbB2Nb:Va ¼ oGBCC
Nb þ 2oGVa þDfoGNbB2
Nb:Va
oGNbB2Va:B ¼ oGVa þ 2oGRhom
B þDfoGNbB2
Va:B
oGNbB2Va:Va ¼ oGVaþ 2oGVaþDf
oGNbB2Va:Va
ð10Þ
and the excess term is given as follows:
EGNbB2Nb;Va:B;Va ¼ ys1
Nbys1Vay
s2B
0LNbB2Nb;Va:B;Vaþ ys1
Nbys1Vay
s2Va
0LNbB2Nb;Va:Va
þ ys1Nbys2
B ys2Va
0LNbB2Nb:B;Va þ ys1
Vays2B ys2
Va0LNbB2
Va:B;Va ð11Þ
In Eq. (10), oGNbB2
Nb:Va and oGNbB2
Va:B correspond to the Gibbsenergy of pure Nb and B with hexagonal hp3 structure,respectively.
1003R.M. Pecanha et al. / Intermetallics 15 (2007) 999e1005
2.5. Stoichiometric phases
The crystal structures of the stoichiometric borides (Table 1)suggest the use of multiple sublattices for their modeling, as fol-lows: (1) for Nb3B2, (Nb)2(Nb)4(B)4; (2) for NbB, (Nb)4(B)4;(3) for Nb5B6, (Nb)2(Nb)4(Nb)4(B)4(B)4(B)4; and (4) forNb3B4, (Nb)2(Nb)4(B)4(B)4. However, in the present work, po-sitions occupied by the same element were considered energet-ically equivalent, reducing their description to 2-sublattices,using the smallest integers as stoichiometric indices. For eachstoichiometric phase, there is only one possible arrangement
Table 2
Optimized Gibbs energy coefficients for all phases of the NbeB system
Phase Model Parameter Coefficient
a b c
L (Nb,B) 0LLNb;B �158 000 þ19.5
1LLNb;B �21 500
2LLNb;B þ147 500
BCC (Nb)(B,Va)3 DfoGBCC
Nb:B þ20 0000LBCC
Nb:B;Va �74 000
Nb3B2 (Nb)3(B)2 DfoGNb3B2
Nb:B �295 300 �24.4 þ6.65
NbB (Nb) (B) DfoGNbB
Nb:B �128 150 �7.7 þ1.75
Nb5B6 (Nb)5(B)6 DfoGNb5B6
Nb:B �727 900 �73.6 þ14.0
Nb3B4 (Nb)3(B)4 DfoGNb3B4
Nb:B �469 900 �65.3 þ11.34
NbB2 (Nb,Va) (B,Va)2 DfoGNbB2
Nb:B �196 200 þ7.54 þ0.25
DfoGNbB2
Va:B þ100 416 �19.412
DfoGNbB2
Nb:Va þ10 000 þ2.40LNbB2
Nb;Va:B �106 000 þ33.00LNbB2
Nb:B;Va þ180 0000LNbB2
Va:B;Va þ200 0000LNbB2
Nb;Va:Va þ200 000
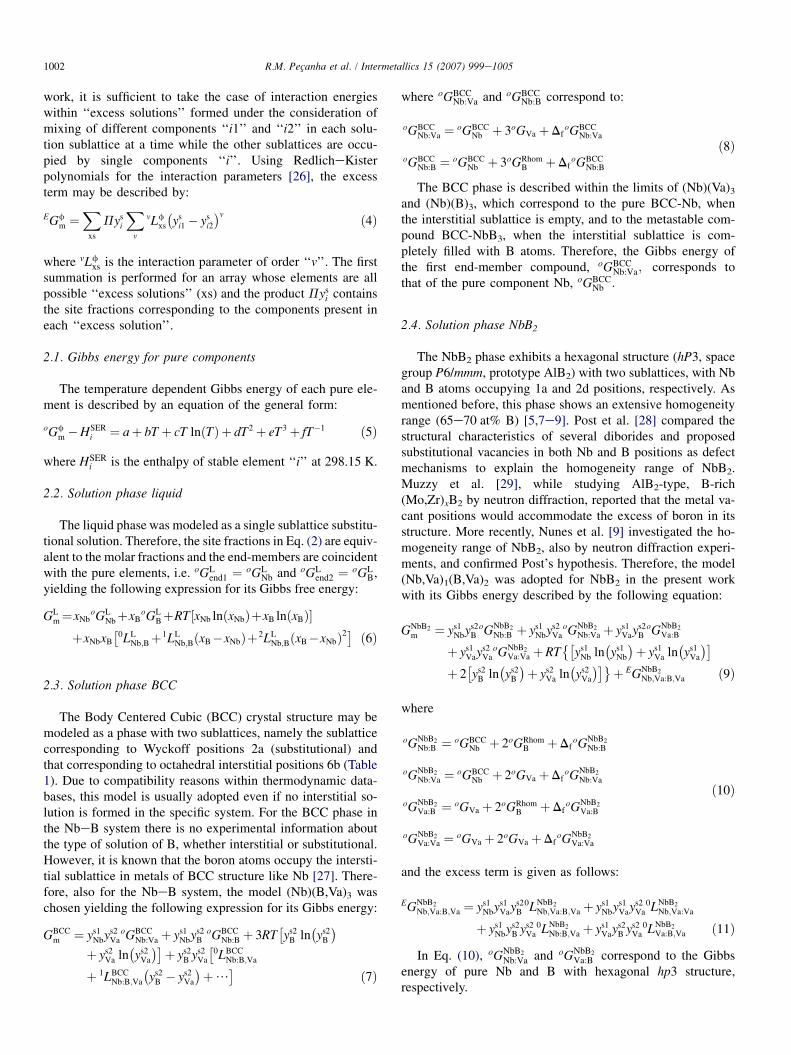
Fig. 3. Phase diagram of the NbeB system calculated with the coefficients of
the present work.
of the pure elements in the crystal structure of the compound.Therefore, the ideal and excess contributions to their Gibbs en-ergies are equal to zero, leading to the following expressions fortheir Gibbs energies:
Nb3B2
GNb3B2m ¼ 3oGBCC
Nb þ 2oGRhomB þDf
oGNb3B2Nb:B ð12Þ
NbB
GNbBm ¼ oGBCC
Nb þ oGRhomB þDf
oGNbBNb:B ð13Þ
Nb5B6
GNb5B6m ¼ 5oGBCC
Nb þ 6oGRhomB þDf
oGNb5B6Nb:B ð14Þ
Nb3B4
GNb3B4m ¼ 3oGBCC
Nb þ 4oGRhomB þDf
oGNb3B4Nb:B ð15Þ
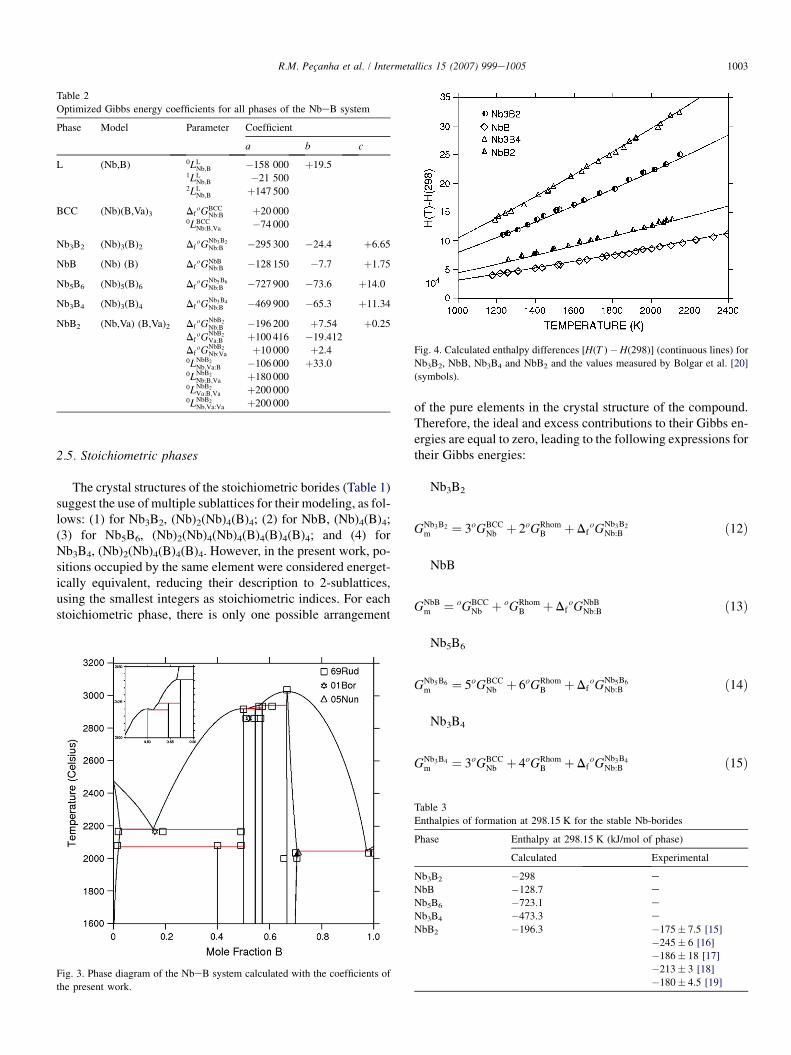
Fig. 4. Calculated enthalpy differences [H(T )�H(298)] (continuous lines) for
Nb3B2, NbB, Nb3B4 and NbB2 and the values measured by Bolgar et al. [20]
(symbols).
Table 3
Enthalpies of formation at 298.15 K for the stable Nb-borides
Phase Enthalpy at 298.15 K (kJ/mol of phase)
Calculated Experimental
Nb3B2 �298 e
NbB �128.7 eNb5B6 �723.1 e
Nb3B4 �473.3 e
NbB2 �196.3 �175� 7.5 [15]
�245� 6 [16]
�186� 18 [17]
�213� 3 [18]
�180� 4.5 [19]
1004 R.M. Pecanha et al. / Intermetallics 15 (2007) 999e1005
3. Optimization procedure (results and discussion)
The nLfij parameters in Eqs. (6), (7) and (11) (f¼ L,
BCC or NbB2) as well as the Gibbs energy of formationof the end-members in Eqs. (8) and (10) and of the stoichio-metric compounds in Eqs. (12)e(15) are described accord-ing to Eq. (5). Their coefficients a, b and c correspond tothe adjustable variables in the optimization procedure (seeTable 2).
The temperature dependent Gibbs energies of the pure ele-ments in their stable and metastable states were taken fromSGTE database [30] and are given in Appendix.
The model (Nb)1(B,Va)3 chosen for the BCC leads to thedefinition of the end-member NbB3, with its Gibbs energy offormation given by Df
oGBCCNb:B; for which no experimental
value is available. A positive value of 5000 J/mol of atomshas been often used, e.g. Ref. [31], for the Gibbs energy offormation of such metastable compounds, thus, a value of20 000 J/mol of phase was adopted here for Df
oGBCCNb:B.
The SGTE descriptions for hcp-Nb and hcp-B were adop-ted for the parameters Df
oGNbB2
Nb:Va and DfoGNbB2
Va:B in Eq. (10),respectively. The Gibbs energy of the end-member with
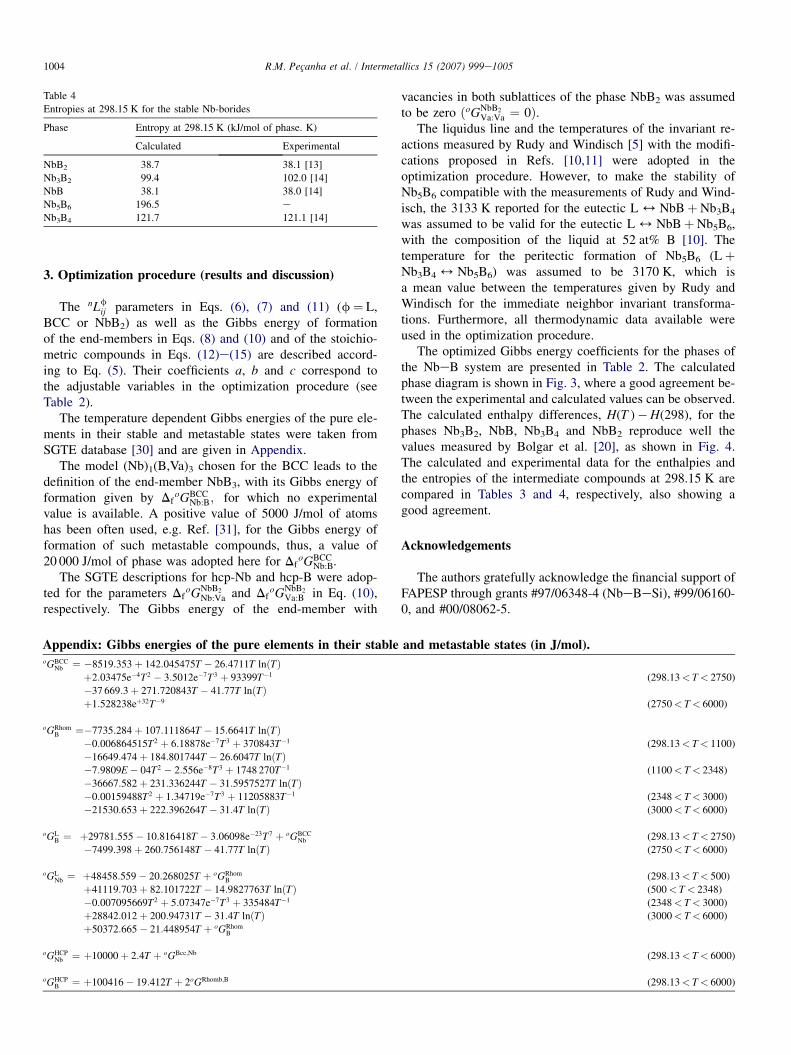
Table 4
Entropies at 298.15 K for the stable Nb-borides
Phase Entropy at 298.15 K (kJ/mol of phase. K)
Calculated Experimental
NbB2 38.7 38.1 [13]
Nb3B2 99.4 102.0 [14]
NbB 38.1 38.0 [14]
Nb5B6 196.5 e
Nb3B4 121.7 121.1 [14]
vacancies in both sublattices of the phase NbB2 was assumedto be zero ðoGNbB2
Va:Va ¼ 0Þ.The liquidus line and the temperatures of the invariant re-
actions measured by Rudy and Windisch [5] with the modifi-cations proposed in Refs. [10,11] were adopted in theoptimization procedure. However, to make the stability ofNb5B6 compatible with the measurements of Rudy and Wind-isch, the 3133 K reported for the eutectic L 4 NbBþNb3B4
was assumed to be valid for the eutectic L 4 NbBþNb5B6,with the composition of the liquid at 52 at% B [10]. Thetemperature for the peritectic formation of Nb5B6 (LþNb3B4 4 Nb5B6) was assumed to be 3170 K, which isa mean value between the temperatures given by Rudy andWindisch for the immediate neighbor invariant transforma-tions. Furthermore, all thermodynamic data available wereused in the optimization procedure.
The optimized Gibbs energy coefficients for the phases ofthe NbeB system are presented in Table 2. The calculatedphase diagram is shown in Fig. 3, where a good agreement be-tween the experimental and calculated values can be observed.The calculated enthalpy differences, H(T )�H(298), for thephases Nb3B2, NbB, Nb3B4 and NbB2 reproduce well thevalues measured by Bolgar et al. [20], as shown in Fig. 4.The calculated and experimental data for the enthalpies andthe entropies of the intermediate compounds at 298.15 K arecompared in Tables 3 and 4, respectively, also showing agood agreement.
Acknowledgements
The authors gratefully acknowledge the financial support ofFAPESP through grants #97/06348-4 (NbeBeSi), #99/06160-0, and #00/08062-5.
Appendix: Gibbs energies of the pure elements in their stable and metastable states (in J/mol).oGBCC
Nb ¼ �8519:353þ 142:045475T � 26:4711T lnðTÞþ2:03475e�4T2 � 3:5012e�7T3 þ 93399T�1
�37 669:3þ 271:720843T � 41:77T lnðTÞþ1:528238eþ32T�9
(298.13< T< 2750)
(2750< T< 6000)
oGRhomB ¼�7735:284þ 107:111864T � 15:6641T lnðTÞ
�0:006864515T2 þ 6:18878e�7T3 þ 370843T�1
�16649:474þ 184:801744T � 26:6047T lnðTÞ�7:9809E� 04T2 � 2:556e�8T3 þ 1748 270T�1
�36667:582þ 231:336244T � 31:5957527T lnðTÞ�0:00159488T2 þ 1:34719e�7T3 þ 11205883T�1
�21530:653þ 222:396264T � 31:4T lnðTÞ
(298.13< T< 1100)
(1100< T< 2348)
(2348< T< 3000)
(3000< T< 6000)
oGLB ¼ þ29781:555� 10:816418T � 3:06098e�23T7 þ oGBCC
Nb
�7499:398þ 260:756148T � 41:77T lnðTÞ(298.13< T< 2750)
(2750< T< 6000)
oGLNb ¼ þ48458:559� 20:268025T þ oGRhom
B
þ41119:703þ 82:101722T � 14:9827763T lnðTÞ�0:007095669T2 þ 5:07347e�7T3 þ 335484T�1
þ28842:012þ 200:94731T � 31:4T lnðTÞþ50372:665� 21:448954T þ oGRhom
B
(298.13< T< 500)
(500< T< 2348)
(2348< T< 3000)
(3000< T< 6000)
oGHCPNb ¼ þ10000þ 2:4T þ oGBcc;Nb (298.13< T< 6000)
oGHCPB ¼ þ100416� 19:412T þ 2oGRhomb;B (298.13< T< 6000)
1005R.M. Pecanha et al. / Intermetallics 15 (2007) 999e1005
References
[1] Bewlay BP, Jackson MR, Zhao J-C, Subramanian PR. Metallurgical and
Materials Transactions A 2003;34:2043e52.
[2] Zhao J-C, Westbrook JH. MRS Bulletin 2003;28:622e30.
[3] Massalski TB, editor. Binary alloy phase diagrams. 2nd ed., 3 vols..
Materials Park, OH: ASM International; 1990.
[4] Nowotny H, Benesovsky F, Kieffer R. Zeitschrift fur Metallkunde
1959;50:417e23.
[5] Rudy E, Windisch St. Ternary phase equilibria in transition metale
boronecarbonesilicon systems, AFML-TR-65-2, part I, vol. X. OH:
Wright-Patterson Air Force Base; 1966.
[6] Bolmgren H, Lundstroem T. Journal of the Less-Common Metals 1990;
159:L25e7.
[7] Nowotny H, Benesovsky F, Rudy E, Wittmann A. Monatshefte fur
Chemie 1960;91:975e90.
[8] Rudy E, Benesovsky F, Toth L. Zeitschrift fur Metallkunde 1963;
54:345e53.
[9] Nunes CA, Kaczorowski D, Rogl P, Baldissera MR, Suzuki PA,
Coelho GC, et al. Acta Materialia 2005;53:3679e87.
[10] Borges Jr. LA. MSc. thesis, FAENQUIL, Brazil; 2001.
[11] Borges Jr LA, Coelho GC, Nunes CA, Suzuki PA. Journal of Phase Equi-
libria 2003;24:140e6.
[12] Glaser FW. Transactions of the American Institute of Mining and Metal-
lurgical Engineers 1952;194:391e6.
[13] Westrum EF, Clay GA. Journal of Physical Chemistry 1963;67:2385e7.
[14] Blinder AV, Bolgar AS. Soviet Powder Metallurgy and Metal Ceramics
1991;30:1053e6.
[15] Huber Jr. EJ. 5th Quarterly report, AVCO-SR-63-183; 1963.
[16] Johnson GK, Greenberg E, Margrave JL, Hubbard WN. Journal of
Chemical and Engineering Data 1967;12:597e600.
[17] Reznitskii LA. Russian Journal of Physical Chemistry 1967;41:612e4.
[18] Kirpichev EP, Rubtsov YuI, Sorokina TV, Prokudina VK. Russian Journal
of Physical Chemistry 1979;53:1128e30.
[19] Meschel SV, Kleppa OJ. Metallurgical Transactions A 1993;24:947e50.
[20] Bolgar AS, Serbova MI, Serebryakova TI, Isaeva LP, Fesenko VV. Soviet
Powder Metallurgy and Metal Ceramics 1983;243:57e62.
[21] Kaufman L, Uhrenius B, Birnie D, Taylor K. CALPHAD 1984;8:25e66.
[22] Sundman B, Agren J. Journal of Physics and Chemistry of Solids
1981;42:297e301.
[23] Hillert M. The compound energy formalism. Journal of Alloys and Com-
pounds 2001;320:161e76.
[24] Villars P, Calvert LD. Pearson’s handbook of crystallographic data for in-
termetallic phases. 2nd ed., 4 vols.. Materials Park, OH: ASM Interna-
tional; 1991.
[25] Bolmgren H, Lundstrom T, Tergenius L-E. Journal of the Less-Common
Metals 1990;161:341e5.
[26] Redlich O, Kister AT. Journal of Industrial and Engineering Chemistry
1948;40:345e8.
[27] Kiessling R. Acta Chemica Scandinavica 1949;3:603e15.
[28] Post B, Glaser FW, Moskowitz D. Acta Metallurgica 1954;2:20e5.
[29] Muzzy LE, Avdeev M, Lawes G, Haas MK, Zandbergen HW,
Ramirez AP, et al. Physica C 2002;382:153e65.
[30] Dinsdale AT. CALPHAD 1991;15:317e425.
[31] Neto JGC, Fries SG, Lukas HL, Gama S, Effenberg G. CALPHAD
1993;17:219e28.
Related Documents