Thermionic emission • If a tungsten filament is heated to about 2000 o C, some of the electrons have sufficient kinetic energy to escape from the surface of the wire. • This effect is called thermionic emission. • It is quite easy to imagine this if we think about a metal wire as a lattice of ions in a

Thermionic emission
Dec 30, 2015
Thermionic emission. If a tungsten filament is heated to about 2000 o C, some of the electrons have sufficient kinetic energy to escape from the surface of the wire. This effect is called thermionic emission . - PowerPoint PPT Presentation
Welcome message from author
This document is posted to help you gain knowledge. Please leave a comment to let me know what you think about it! Share it to your friends and learn new things together.
Transcript
Thermionic emission
• If a tungsten filament is heated to about 2000 o C, some of the electrons have sufficient kinetic energy to escape from the surface of the wire.
• This effect is called thermionic emission.
• It is quite easy to imagine this if we think about a metal wire as a lattice of ions in a sea of free electrons. In effect we are boiling the electrons off.
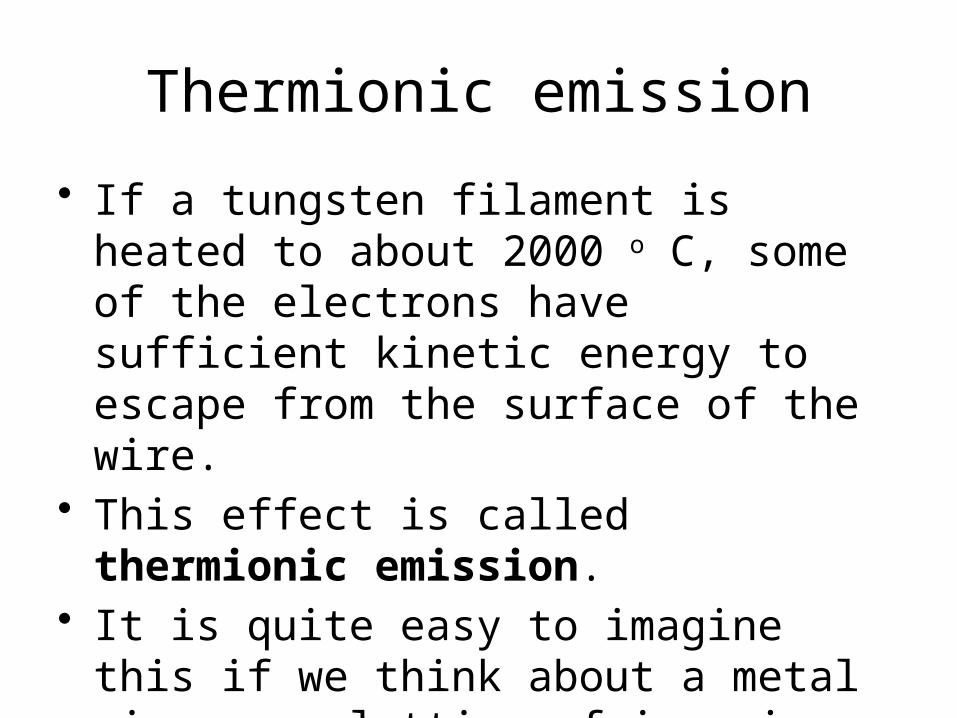
Thermionic Diode• In the vacuum tube there are
two electrodes• Cathode -ve Anode
+ve • When the filament is
switched on electrons start to flow from the cathode the tungsten filament and are attracted to the anode
• You need a vacuum as the electrons would collide with the gas particles. Also the filament would burn up
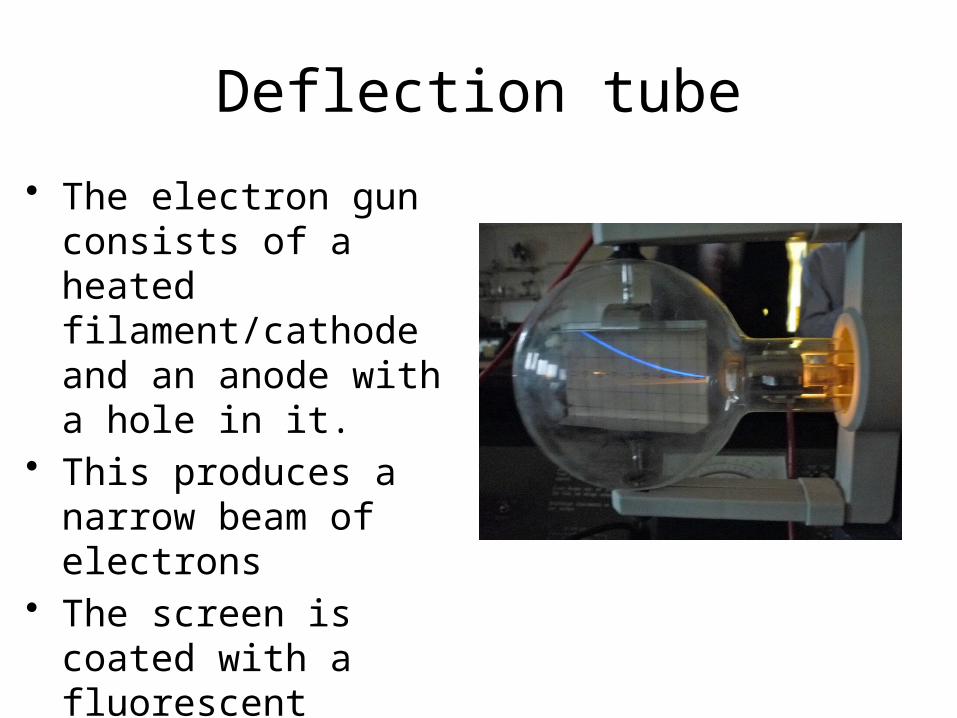
Deflection tube
• The electron gun consists of a heated filament/cathode and an anode with a hole in it.
• This produces a narrow beam of electrons
• The screen is coated with a fluorescent material which glow when electrons strike it.
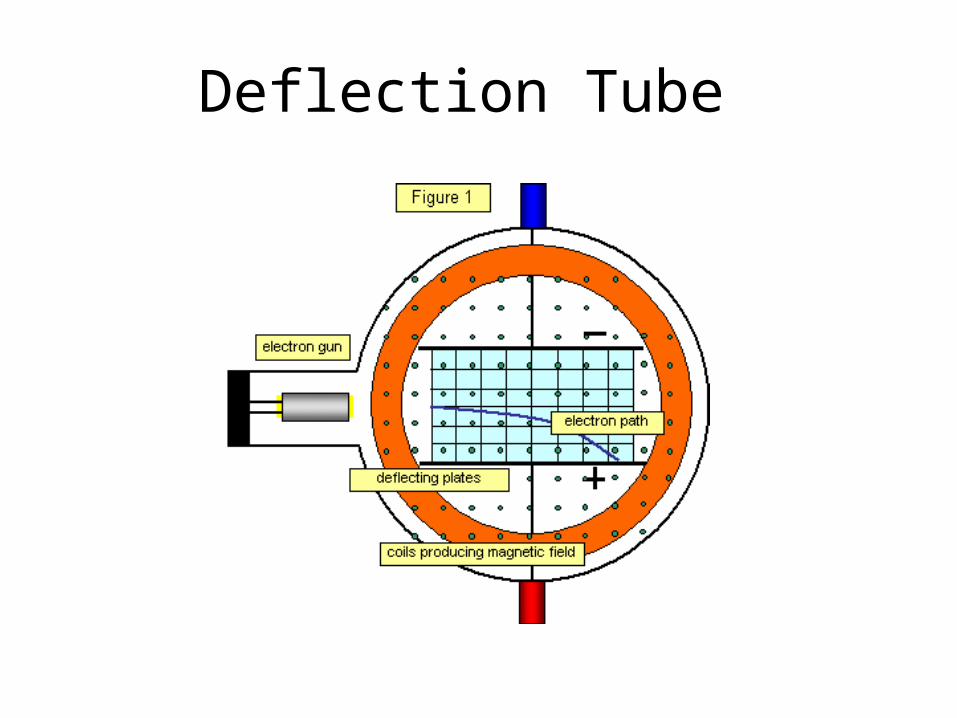
Deflection Tube
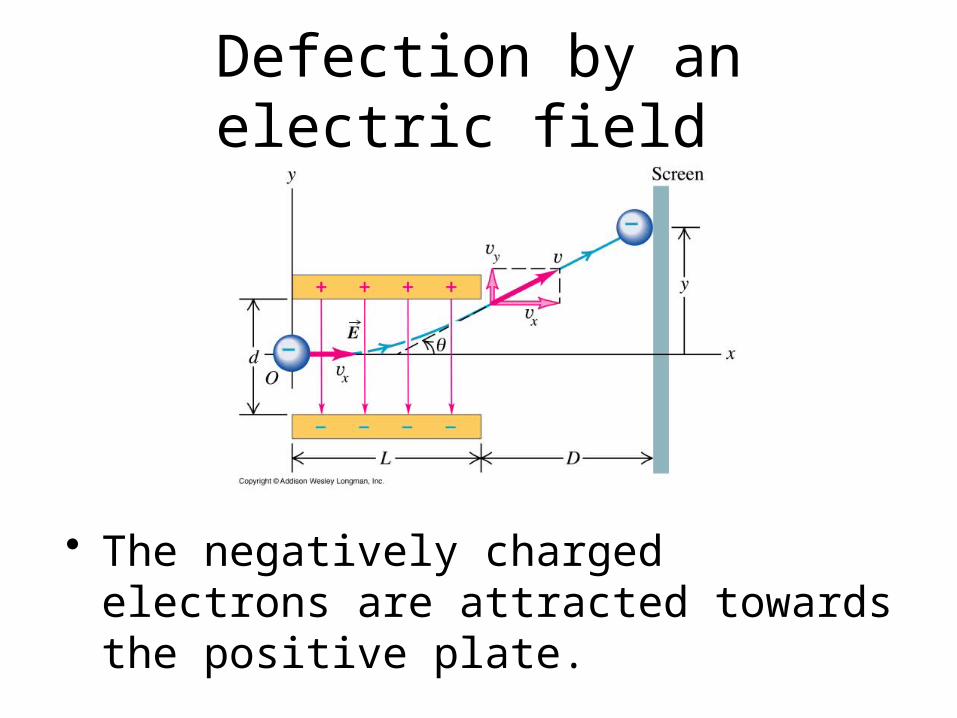
Defection by an electric field
• The negatively charged electrons are attracted towards the positive plate.
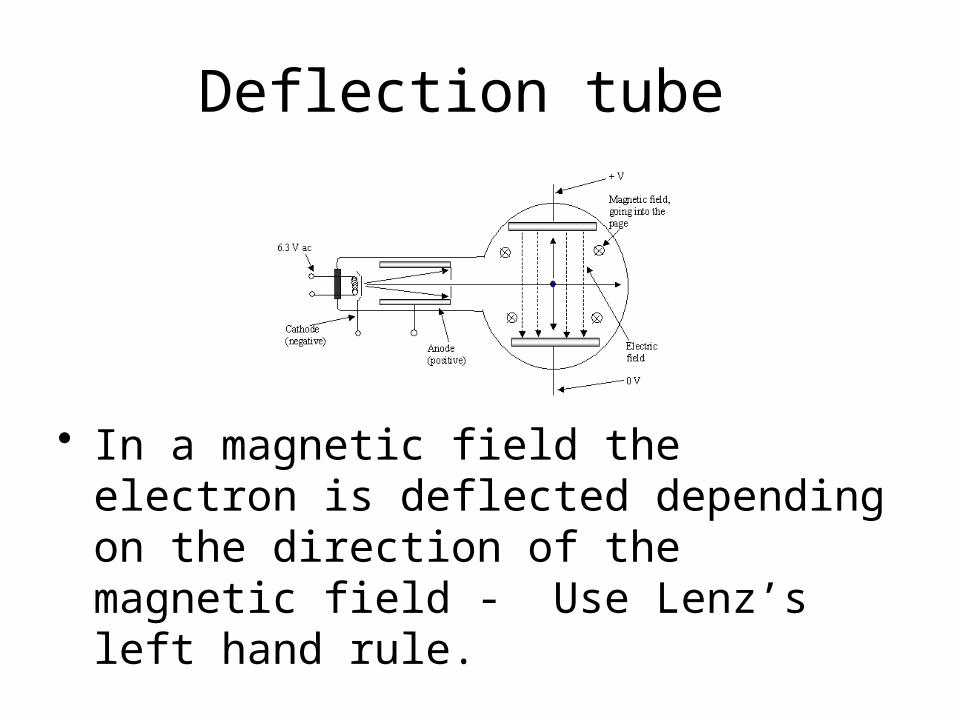
Deflection tube
• In a magnetic field the electron is deflected depending on the direction of the magnetic field - Use Lenz’s left hand rule.
Cathode Ray Tubes
Thermionic emission was the starting point for Joseph John Thomson to produce his cathode ray tube (CRT) in 1897, the descendants of which we used to see every day, before TFT (thin film transistor) TV sets became more common.
• Now do question 1 page 243
Using an Oscilloscope
Learning Objectives
To know what an oscilloscope is and how it works.
To know how to measure the pd of alternating current and direct current.
To know how to measure the frequency of an alternating current.
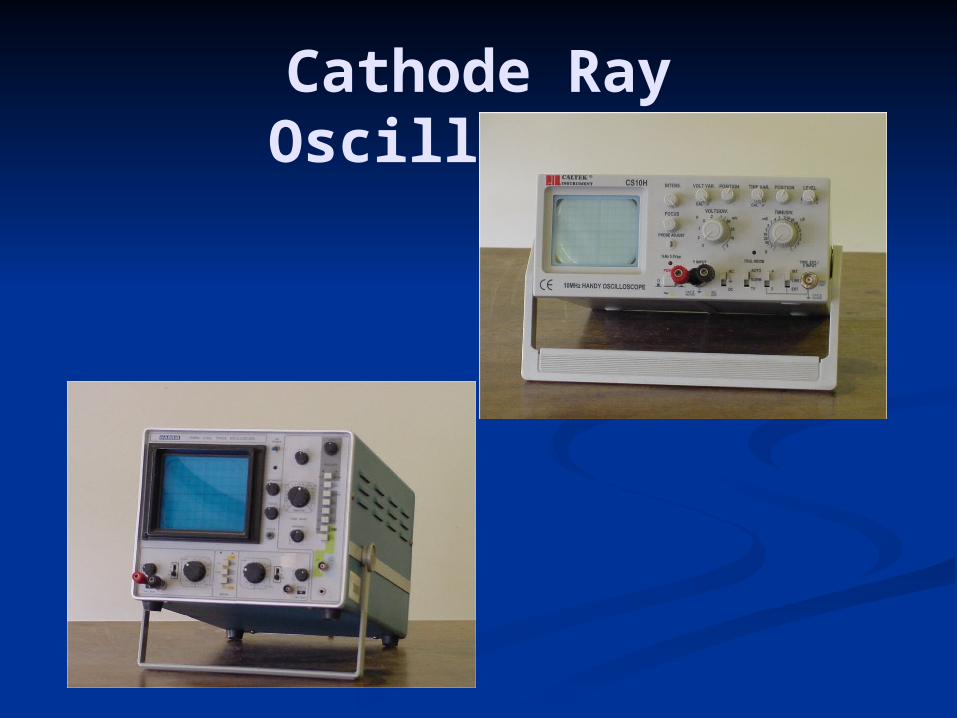
Cathode Ray Oscilloscope
Definition
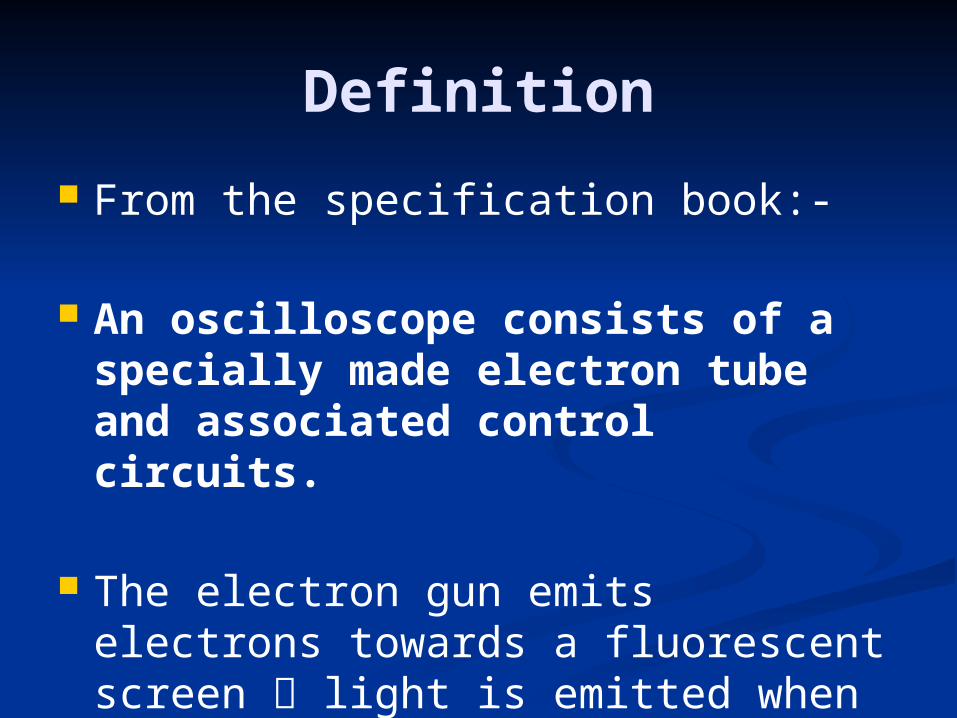
From the specification book:-
An oscilloscope consists of a specially made electron tube and associated control circuits.
The electron gun emits electrons towards a fluorescent screen light is emitted when electrons hit the screen this is what we see.

Tube Photograph
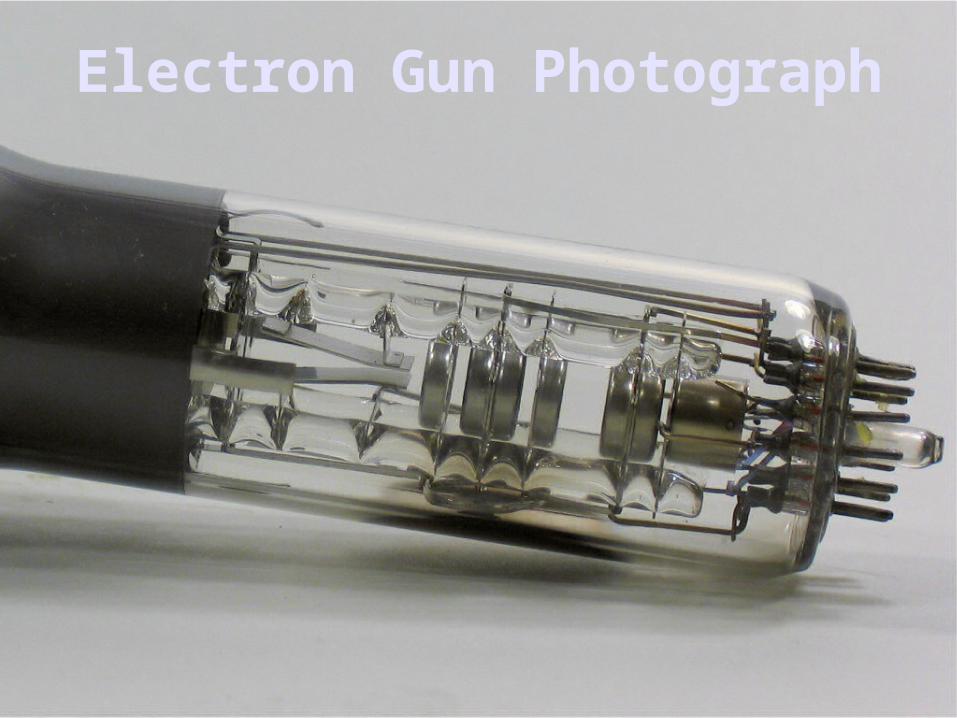
Electron Gun Photograph
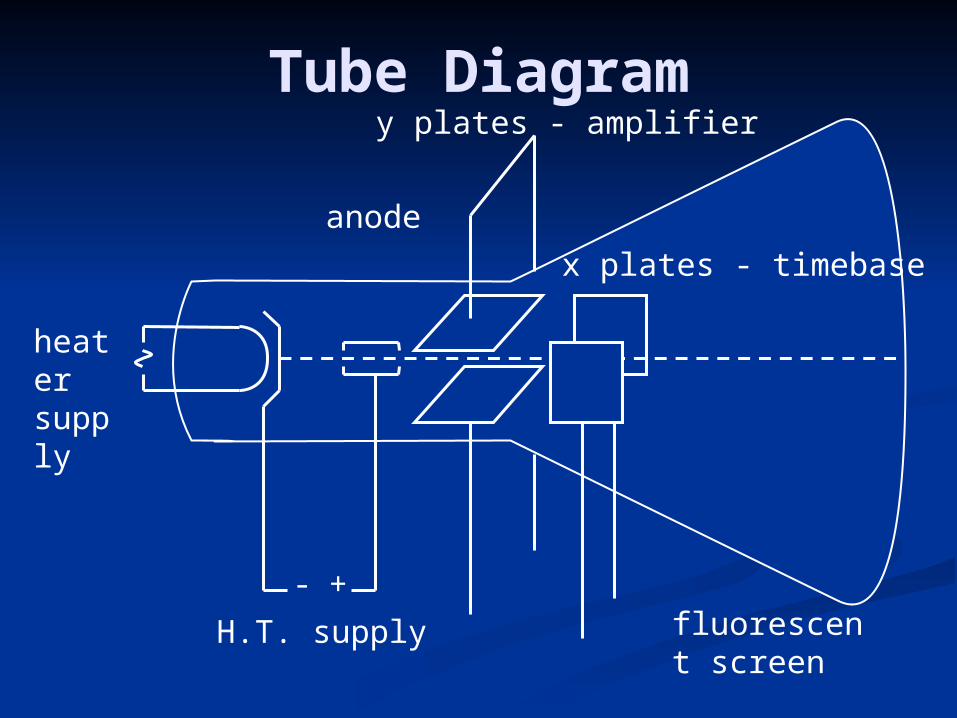
Tube Diagram
H.T. supply
heater supply
y plates - amplifier
+-fluorescent screen
anode
x plates - timebase
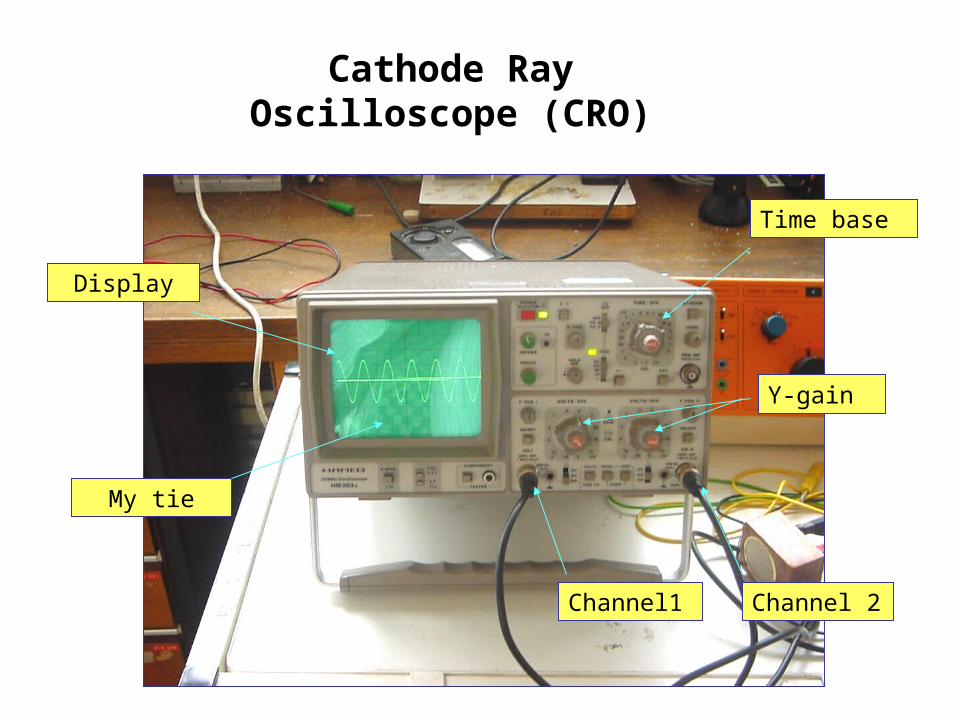
Cathode Ray Oscilloscope (CRO)
Display
Channel1 Channel 2
Time base
Y-gain
My tie

How does it work?
An oscilloscope consists of a specially made electron tube and associated control circuits.
An electron gun at one end of the glass tube emits electrons in a beam towards a fluorescent screen at the other end of the tube.
Light is emitted from the spot on the screen where the beam hits the screen.
How does it work?
When no p.d. is applied across the plates the spot on the screen is stationary.
If a pd is applied across the X-plates the beam of electrons is deflected horizontally and the spot moves across.
pd across Y-plates spot moves up and down.
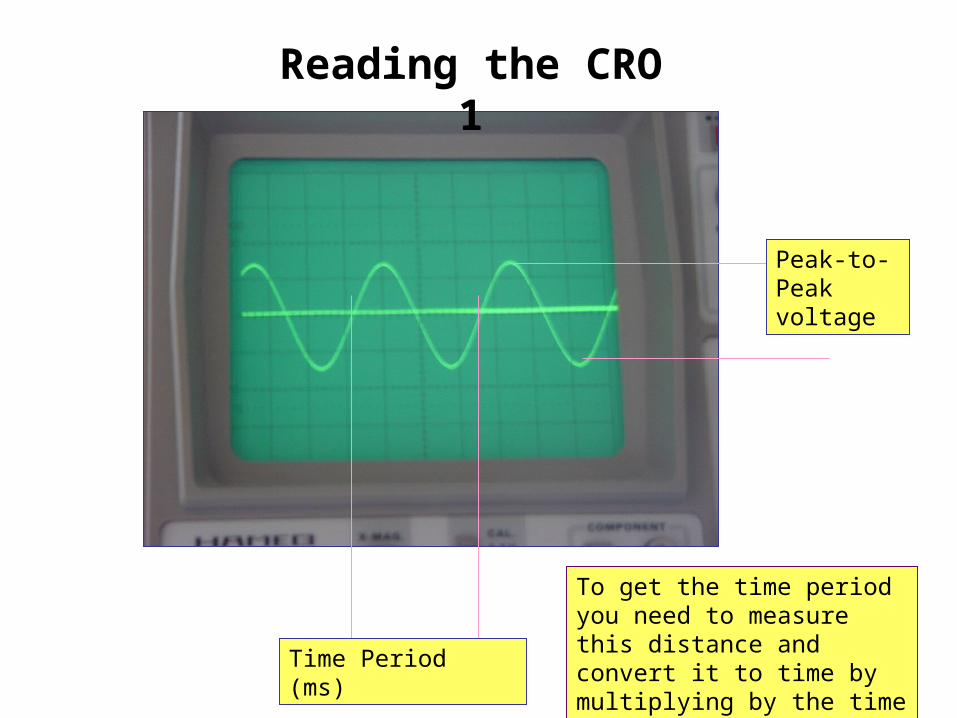
Time Period (ms)
Peak-to-Peak voltage
Reading the CRO 1
To get the time period you need to measure this distance and convert it to time by multiplying by the time base setting

Oscilloscope Controls
The x-plates are connected to a time base circuit which is designed to make the spot move across the screen in a given time then back again much faster. a bit like a trace on a heart monitor.
The y-plates are connected to the Y-input and this causes the spot to move up or down depending on the input pd.

summary
H.T. supply
heater supply
y plates
+-phosphor screen
anode
electron gun produces a beam
of electronslight produced on
the screen by electron beam
a p.d. across the y plates deflects the
trace vertically
a p.d. across the x plates deflects the trace horizontally
x plates
Oscilloscope Controls
The gain sets the scale for the y-axis, normally in volts per cm.
The time base sets the scale for the x-axis, normally in ms per cm.
Recall that frequency can be calculated from the period from the graph using: period
1frequency
Displaying a waveform1. The time base
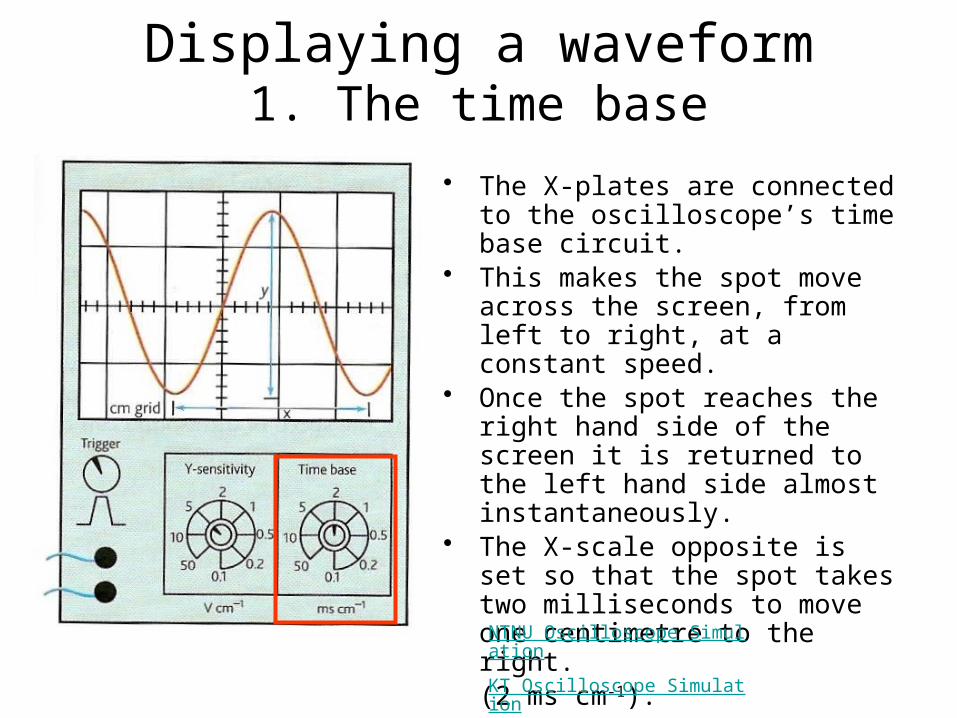
• The X-plates are connected to the oscilloscope’s time base circuit.
• This makes the spot move across the screen, from left to right, at a constant speed.
• Once the spot reaches the right hand side of the screen it is returned to the left hand side almost instantaneously.
• The X-scale opposite is set so that the spot takes two milliseconds to move one centimetre to the right. (2 ms cm-1).
NTNU Oscilloscope Simulation
KT Oscilloscope Simulation
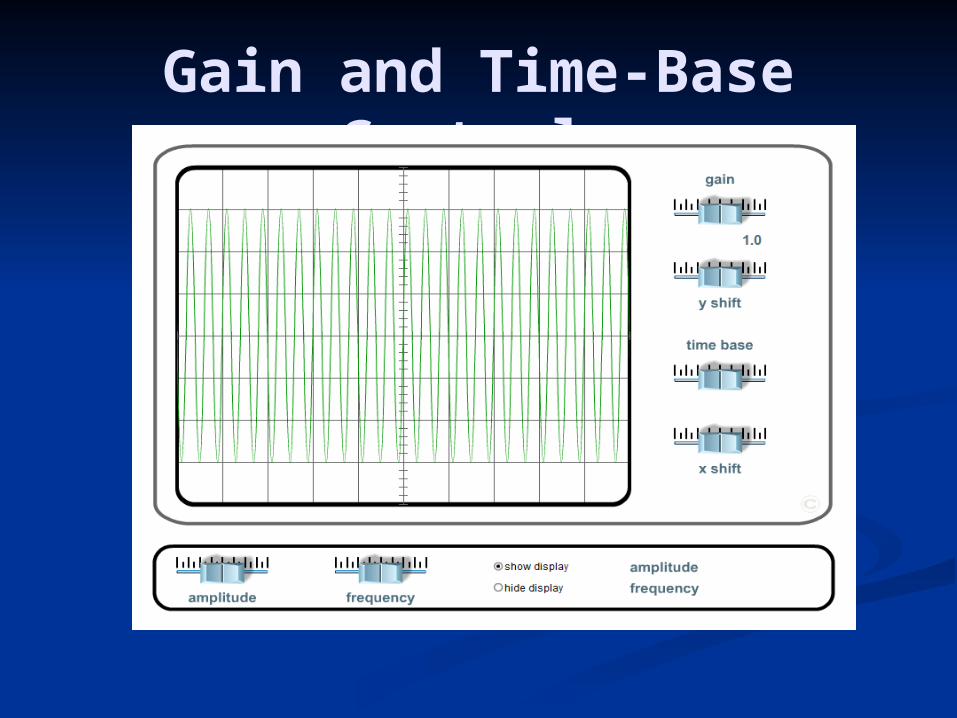
Gain and Time-Base Controls

Displaying a waveform2. Y-sensitivity or Y-gain
• The Y-plates are connected to the oscilloscope’s Y-input.
• This input is usually amplified and when connected to the Y-plates it makes the spot move vertically up and down the screen.
• The Y-sensitivity opposite is set so that the spot moves vertically by one centimetre for a pd of five volts (5 V cm-1).
• The trace shown appears when an alternating pd of 16V peak-to-peak and period 7.2 ms is connected to the Y-input with the settings as shown.
NTNU Oscilloscope Simulation
KT Oscilloscope Simulation
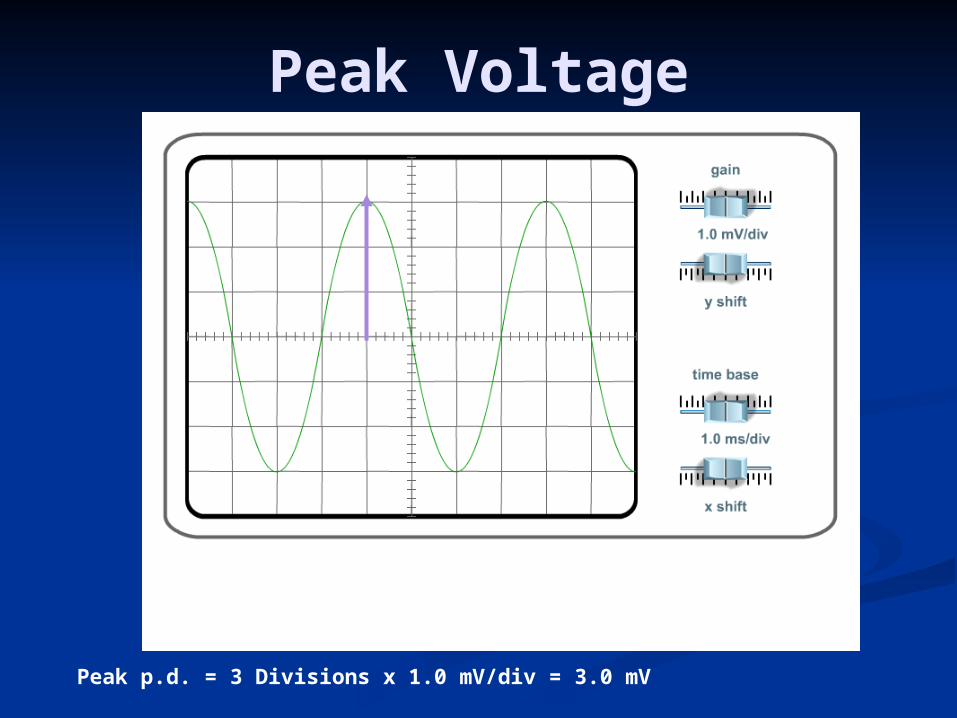
Peak Voltage
Peak p.d. = 3 Divisions x 1.0 mV/div = 3.0 mV

Period & Frequency
period = 4.0 divisions x 1.0 ms/div = 4.0 msfrequency = 1 / periodfrequency = 1 / 0.004 sfrequency = 250 Hz
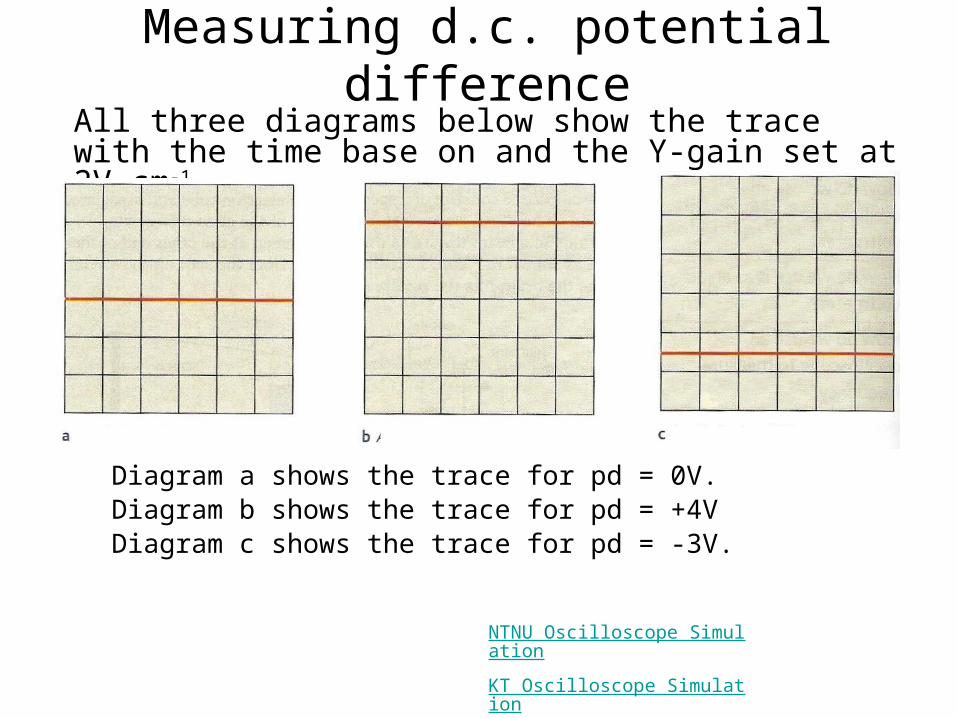
Measuring d.c. potential difference
Diagram a shows the trace for pd = 0V.Diagram b shows the trace for pd = +4VDiagram c shows the trace for pd = -3V.
NTNU Oscilloscope Simulation
KT Oscilloscope Simulation
All three diagrams below show the trace with the time base on and the Y-gain set at 2V cm-1.

Measuring a.c. potential differenceLet the time base setting be 10ms cm-1 and the Y-gain setting 2V cm-1.
In this case the waveform performs one complete oscillation over a horizontal distance of 2 cm. Therefore the period of the waveform is 2 x 10ms period = 20 ms
as frequency = 1 / periodfrequency = 1 / 0.020s = 50 Hz.
The peak-to-peak displacement of the waveform is about 5cm.Therefore the peak-to-peak pd is 5 x 2V Peak-to-peak pd = 10V
NTNU Oscilloscope Simulation
KT Oscilloscope Simulation
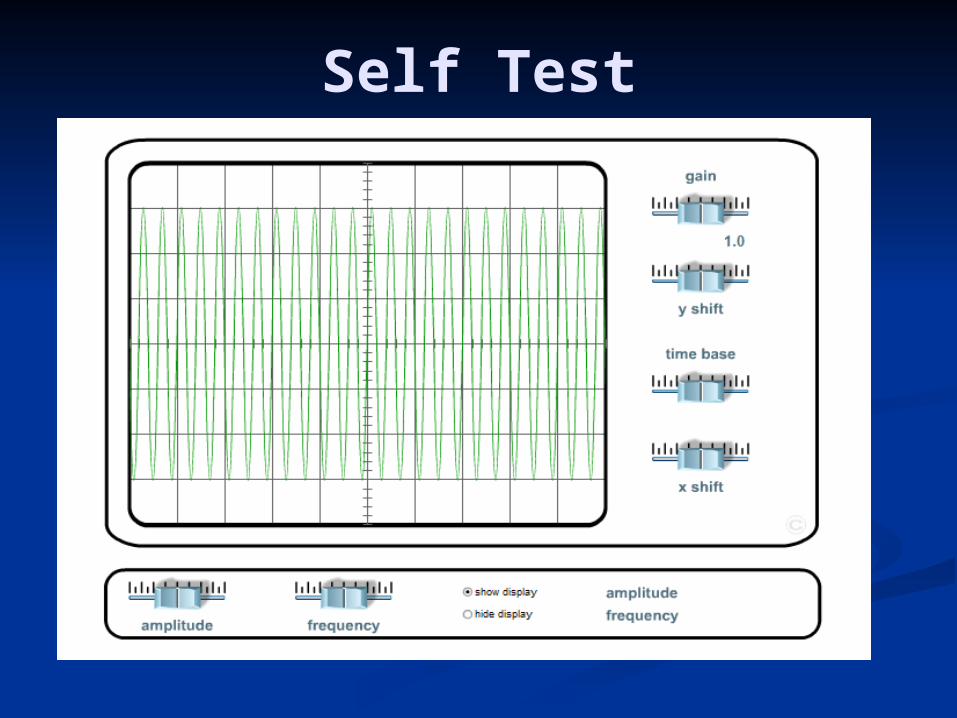
Self Test
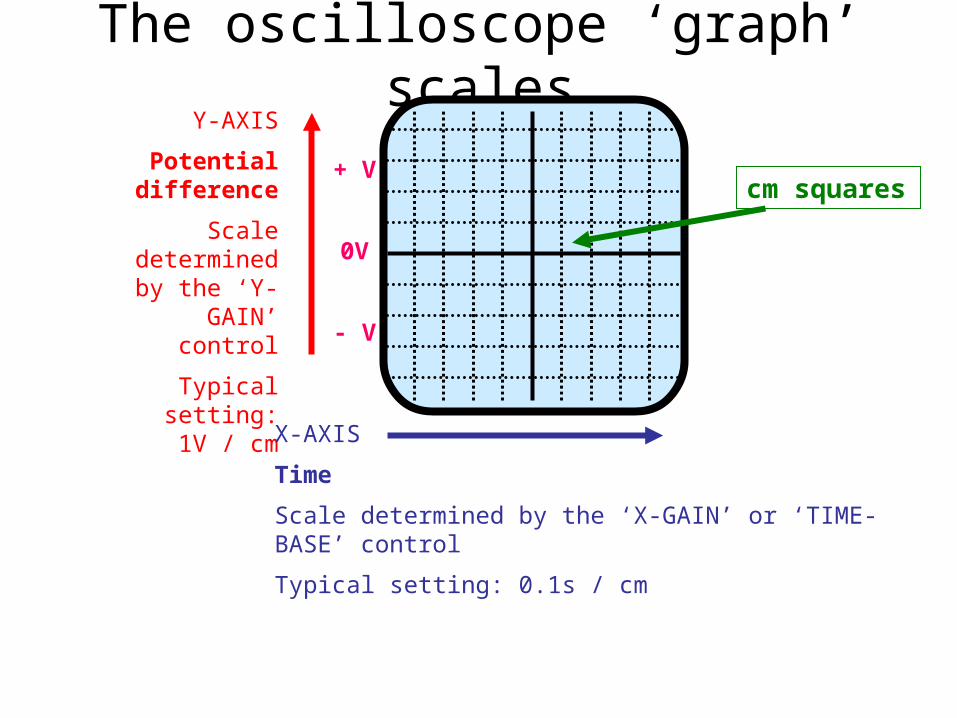
The oscilloscope ‘graph’ scalesY-AXIS
Potential difference
Scale determined by the ‘Y-GAIN’
control
Typical setting: 1V / cm
X-AXIS
Time
Scale determined by the ‘X-GAIN’ or ‘TIME-BASE’ control
Typical setting: 0.1s / cm
cm squares+ V
0V
- V
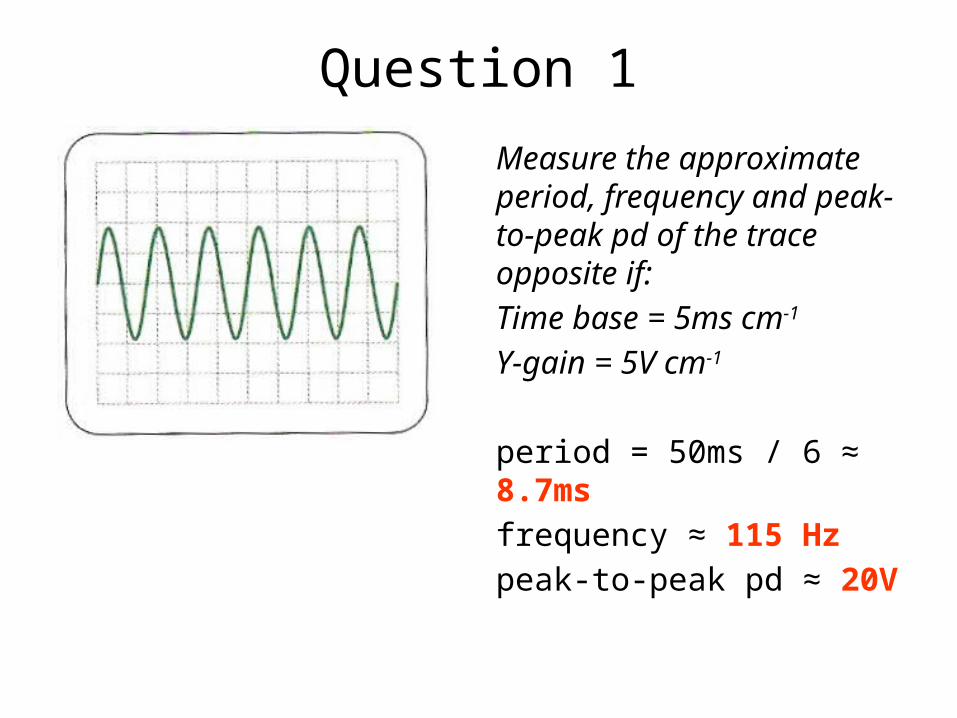
Question 1
Measure the approximate period, frequency and peak-to-peak pd of the trace opposite if:
Time base = 5ms cm-1
Y-gain = 5V cm-1
period = 50ms / 6 ≈ 8.7ms
frequency ≈ 115 Hz
peak-to-peak pd ≈ 20V
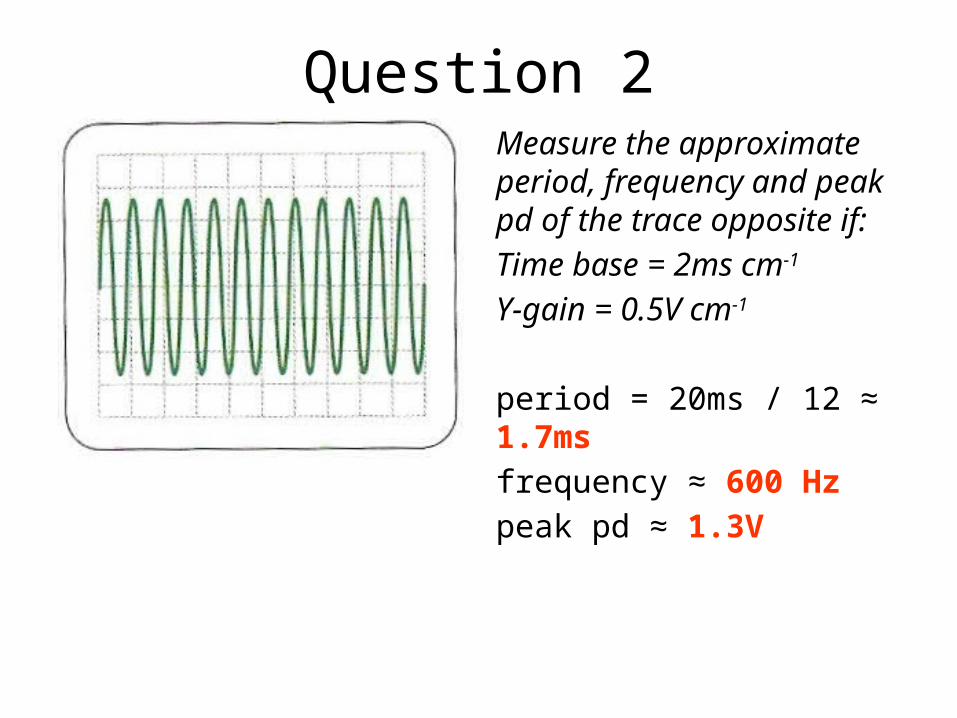
Question 2Measure the approximate period, frequency and peak pd of the trace opposite if:
Time base = 2ms cm-1
Y-gain = 0.5V cm-1
period = 20ms / 12 ≈ 1.7ms
frequency ≈ 600 Hz
peak pd ≈ 1.3V
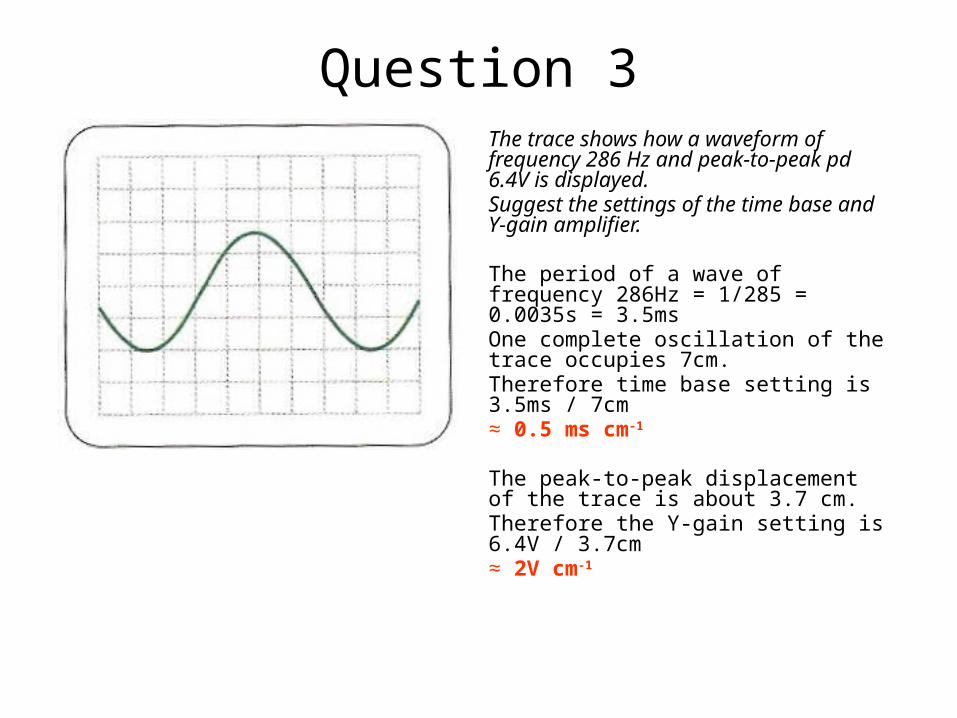
Question 3The trace shows how a waveform of frequency 286 Hz and peak-to-peak pd 6.4V is displayed.Suggest the settings of the time base and Y-gain amplifier.
The period of a wave of frequency 286Hz = 1/285 = 0.0035s = 3.5msOne complete oscillation of the trace occupies 7cm. Therefore time base setting is 3.5ms / 7cm ≈ 0.5 ms cm-1
The peak-to-peak displacement of the trace is about 3.7 cm.Therefore the Y-gain setting is 6.4V / 3.7cm ≈ 2V cm-1
Application
Measuring the speed of ultrasound.
Set up the oscilloscope so that the time base circuit triggers a transmitter to send out a pulse of ultrasonic waves.
The receiver can be connected to the Y-input of the oscilloscope so that the waveform can be seen on the screen when it is detected.
Internet Links• Oscilloscope - basic display function -
NTNU • Oscilloscope Simulation - by KT • Lissajous figures - Explore Science • Lissajous figures - by KT
Related Documents


![THERMIONIC EMISSION FROM OXIDE-COATED - [email protected]](https://static.cupdf.com/doc/110x72/62062d978c2f7b1730052693/thermionic-emission-from-oxide-coated-emailprotected.jpg)