HAL Id: hal-02170469 https://hal-univ-orleans.archives-ouvertes.fr/hal-02170469 Submitted on 25 Oct 2021 HAL is a multi-disciplinary open access archive for the deposit and dissemination of sci- entific research documents, whether they are pub- lished or not. The documents may come from teaching and research institutions in France or abroad, or from public or private research centers. L’archive ouverte pluridisciplinaire HAL, est destinée au dépôt et à la diffusion de documents scientifiques de niveau recherche, publiés ou non, émanant des établissements d’enseignement et de recherche français ou étrangers, des laboratoires publics ou privés. Distributed under a Creative Commons Attribution - NonCommercial| 4.0 International License Thermally-induced cracks and their effects on natural and industrial geomaterials Naïma Belayachi, Céline Mallet, Mounir El Marzak To cite this version: Naïma Belayachi, Céline Mallet, Mounir El Marzak. Thermally-induced cracks and their effects on natural and industrial geomaterials. Journal of Building Engineering, Elsevier, 2019, 25, pp.100806. 10.1016/j.jobe.2019.100806. hal-02170469

Welcome message from author
This document is posted to help you gain knowledge. Please leave a comment to let me know what you think about it! Share it to your friends and learn new things together.
Transcript
HAL Id: hal-02170469https://hal-univ-orleans.archives-ouvertes.fr/hal-02170469
Submitted on 25 Oct 2021
HAL is a multi-disciplinary open accessarchive for the deposit and dissemination of sci-entific research documents, whether they are pub-lished or not. The documents may come fromteaching and research institutions in France orabroad, or from public or private research centers.
L’archive ouverte pluridisciplinaire HAL, estdestinée au dépôt et à la diffusion de documentsscientifiques de niveau recherche, publiés ou non,émanant des établissements d’enseignement et derecherche français ou étrangers, des laboratoirespublics ou privés.
Distributed under a Creative Commons Attribution - NonCommercial| 4.0 InternationalLicense
Thermally-induced cracks and their effects on naturaland industrial geomaterials
Naïma Belayachi, Céline Mallet, Mounir El Marzak
To cite this version:Naïma Belayachi, Céline Mallet, Mounir El Marzak. Thermally-induced cracks and their effects onnatural and industrial geomaterials. Journal of Building Engineering, Elsevier, 2019, 25, pp.100806.�10.1016/j.jobe.2019.100806�. �hal-02170469�
Thermally-induced cracks N. Belayachi et al.
1
Journal of Building Engineering 1
2
Thermally-induced cracks and their effects on natural and 3
industrial geomaterials 4
5
Naima Belayachi(1) . Céline Mallet(1) . Mounir El Marzak(2)
6
7
8
Abstract 9
Thermal stress can result in significant changes in the mechanical and transport properties of 10
building materials, especially in terms of cracking. Three building materials were studied: two 11
concretes, a siliceous and a calcareous one, and a natural calcareous rock, the Tuffeau. The samples 12
were subjected to thermal shock, repetitive heating-cooling cycles, and high temperature heating in 13
order to analyze the effects of maximum temperature, cooling rate, and repetitive heating on the 14
three materials. The induced cracks were then characterized by physical and hydraulic 15
measurements, namely elastic wave velocities, porosity and effective thermal conductivity. Elastic 16
wave velocities were used to determine crack density while effective thermal conductivity was used 17
to determine crack connectivity. Cracks were also quantitatively described through direct 18
microstructural observations using scanning electron microscopy. Results show the effectiveness of 19
the different protocols in inducing cracks. Unexpectedly, repetitive heating-cooling cycles caused 20
the most significant sample damage, whatever the sample. A second main result is based on the 21
comparison of the different materials. It was found that the behavior of the two concretes was very 22
similar: the stronger the thermal treatment, the more the crack density and connectivity increased, 23
albeit with a slight difference in that the siliceous concrete appeared to be less resistant to sharp 24
thermal variations. This is interpreted as being linked to microstructural effects: in the siliceous 25
concrete, we observed cracks that nucleated around and inside grains, but not in the calcareous 26
concrete. Lastly, the behavior of the Tuffeau limestone was different from that of the concretes: 27
when crack density increased, the crack connectivity and the porosity both decreased. This different 28
behavior is interpreted in the light of microstructural observations of the crack apertures: the 29
thermally induced cracks in Tuffeau are too small to influence the effective thermal connectivity 30
measurement and to allow fluid flow during the porosity measurement, whereas in the concretes, 31
cracks were observed to be much more open. As an outlook, we discuss a possible equivalent test to 32
the normalized fire protocol, performed at high temperature, to test the fire resistance of materials. 33
34
Key words: Thermal treatment; Thermal cracking; Calcareous concrete; Siliceous concrete; Tuffeau 35
limestone; geophysical characterization 36
37
Corresponding author: Céline Mallet 38
E-mail: [email protected] 39
Tel.: +33 023 849 45 96 40
41 (1) Université d'Orléans, Université de Tours, INSA Centre Val de Loire - Laboratoire de Mécanique 42
Gabriel Lamé 43
Polytech Orléans, 8 rue Léonard de Vinci, 45072 Orléans, France 44 (2) Faculté des Sciences et Techniques de Tanger (FSTT), Maroc 45
46
© 2019 published by Elsevier. This manuscript is made available under the CC BY NC user licensehttps://creativecommons.org/licenses/by-nc/4.0/
Version of Record: https://www.sciencedirect.com/science/article/pii/S2352710218311422Manuscript_8c7ab9f52ae8ae4f0497621c905b4ab9
Thermally-induced cracks N. Belayachi et al.
2
1. Introduction 1
2
Cracks reduce the resistance and rigidity of materials, contribute to the deterioration of civil 3
engineering structures, change the material properties and compromise the safety and stability of 4
structures. Cracking can be caused by fatigue to repetitive loading (Kong and Li, 2019), or by 5
accidental or natural thermal variations (Belayachi et al., 2012; Samouh et al., 2019; Li et al., 6
2019). In the case of the accidental huge thermal variation due to fire, it has been observed that a 7
great amount of damage may also come from rapid cooling (Botte and Caspeele, 2017). All these 8
conditions have a strong impact on the functionality of the structural elements as they significantly 9
reduce the material’s performance. Thermally induced cracks can, for example, increase the 10
permeability of materials, which may increase the transport of aggressive agents (Hoseini et al., 11
2009; Wang et al., 2019). The most severe thermal condition for building materials is exposure to 12
fire (Sarker et al., 2014), and several studies have been performed to assess the fire resistance of 13
structural elements (Shah and Sharma, 2017; Li et al., 2018). However, it is essential to understand 14
the causes of the thermally induced cracks of materials frequently used in buildings under various 15
thermal conditions and not only in the extreme case of fire. Studying the effect of cracking is very 16
beneficial for project design as thermal effects raise many engineering issues that need to be 17
addressed in order to ensure resistance to fire or to seasonal variations in temperature (Xiong and 18
Liew, 2016 ; Novák and Kohoutková, 2017). 19
In the laboratory, the crack networks introduced by thermal stress are studied using different 20
protocols to represent the impact of fire, the rapid cooling and the seasonal temperature variations 21
(Lam Dos Santos et al., 2011). Rapid cooling is studied thanks to a protocol of thermal shocks 22
(Yavuz et al., 2006), while seasonal variations are studied through progressive heating-cooling 23
cycles (Khan et al., 2010; Lam Dos Santos et al., 2011). Some high temperature tests (Liu and Xu, 24
2015; Khan and Abbas, 2016; Liu et al., 2018), and normalized thermal treatments (ISO1999) can 25
be found in the literature to study the behavior of materials under extreme conditions. The objective 26
of these protocols is to determine the material strength under fire conditions (Xiong and Liew, 27
2016; Novák and Kohoutková, 2017). However, these useful protocols are constraining due to the 28
material required (an accurate high temperature oven). In addition, an accurate temperature curve 29
has to be followed (ISO1999 and Yermak et al., 2017). For these reasons, despite the importance of 30
the topic, few studies are reported in the literature on concrete or other building materials, 31
especially at high temperature (Mindeguia et al., 2010; Kodur and Agrawal, 2017). There is 32
therefore a need for an equivalent protocol to high temperature procedures in order to correlate the 33
results with tests simulating fire conditions. 34
35
The occurrence of thermally induced cracks is dependent upon the temperature, thermal expansion, 36
initial porosity and grain size of the material (Liu et al., 2018). In addition, the damage due to 37
cracks under temperature variation is a complex mechanism that involves a mixture of chemical, 38
physical and mechanical processes (Ghazi Wakili et al., 2007). Thus, it is important to study the 39
mechanisms of thermally-induced cracks in different materials. 40
Concrete is the most widely studied material because of its extensive use in different structures and 41
its low reaction to high thermal stress. Moreover, because of its low heating rate, concrete does not 42
reach temperatures that affect its mechanical characteristics. However, surface cracking and 43
spalling can lead to weakening of its properties (Yermak et al., 2017). 44
In traditional buildings, limestone is also often used, especially for its local availability. This 45
calcareous rock can be affected by temperature variations (sharp or not), which can lead to building 46
instabilities. Indeed, Al-Omari et al. (2014) showed that when coupled to a salt pollutant, heating-47
cooling cycles can be highly destructive for these calcareous stones. In addition, cracks are 48
observed on the wall surfaces and stone spalling is often present (Beck et al., 2016). It is therefore 49
crucial to study stone decay due to thermal variation in heritage buildings. 50
Thermally-induced cracks N. Belayachi et al.
3
1
2
It is important to be able to characterize cracks using non-destructive physical measurements in 3
order to be able to reproduce these measurements in the field. In the present study, elastic wave 4
velocity measurements were used to characterize the thermally induced crack networks. These 5
geophysical measurements allow for describing the crack density, a physical damage parameter 6
introduced by Walsh (1965a, b) (see the recent review by Guéguen and Kachanov, 2011). In 7
addition, more recently, measurements of electric or thermal conductivities are often considered in 8
order to describe the material transport properties (Han et al., 2015), especially the crack network 9
connectivity. Porosity and microstructural observations were also carried out in order to complete 10
the crack characterization. 11
12
The study has two main objectives: (i) to compare the crack network characteristics introduced by 13
different thermal treatments and the effect of the nature of the material; (ii) to see if another 14
protocol could give an equivalent cracking to that obtained after the normalized thermal treatment. 15
To do so, and because the microstructure has a great influence on the crack pattern (Nasseri et al., 16
2009), three materials were used: a natural one, Tuffeau limestone, used in traditional or historical 17
buildings, and two concretes with different aggregates, siliceous and calcareous. According to Xing 18
et al. (2011) and Calmeiro Dos Santos and Rodrigues (2016), the nature of the aggregates will 19
significantly affect the behavior of concrete after exposure to fire. Their studies indicated that the 20
strength of calcareous concrete was more affected under 400°C and that above this threshold, the 21
siliceous aggregate should be the most affected. The applications of the present study are twofold: 22
to contribute to knowledge of the fundamental mechanics of crack network descriptions and to the 23
applied engineering issue of understanding the effect of fire on building materials and more 24
generally the effects of thermal variation. 25
26
27
2. Methodology 28
29
2.1. Materials 30
31
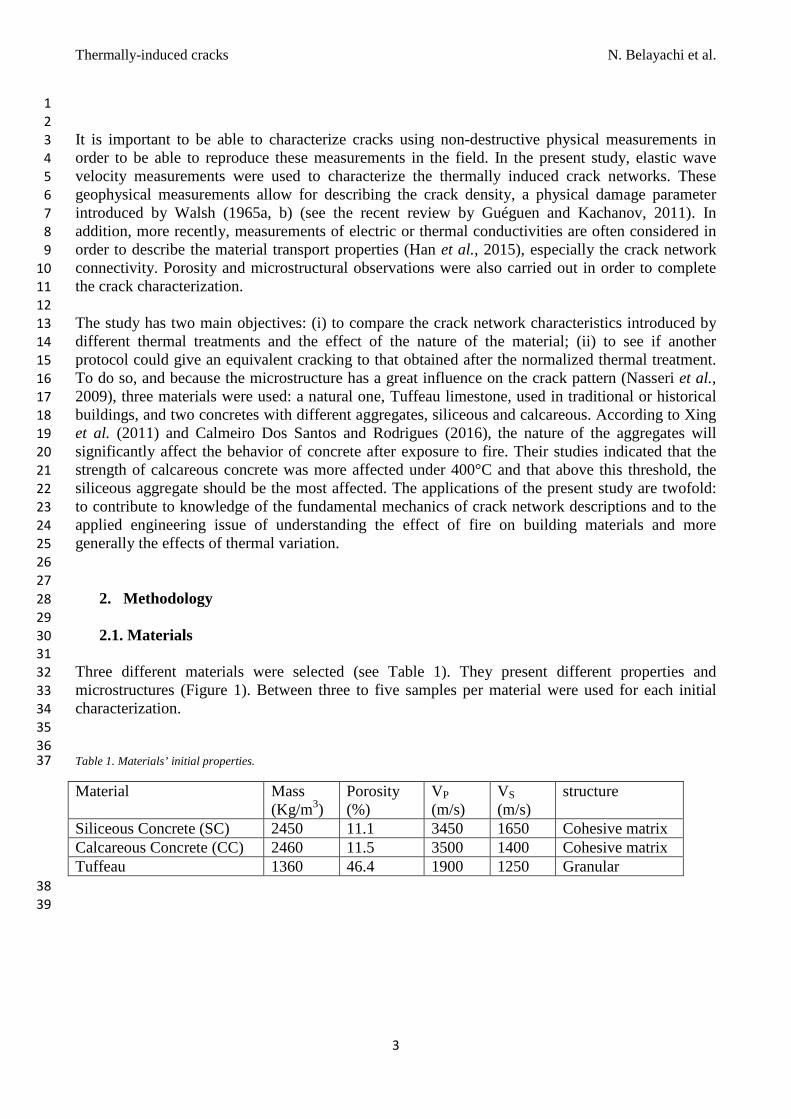
Three different materials were selected (see Table 1). They present different properties and 32
microstructures (Figure 1). Between three to five samples per material were used for each initial 33
characterization. 34
35
36
Table 1. Materials’ initial properties. 37
Material Mass (Kg/m3)
Porosity (%)
VP (m/s)
VS (m/s)
structure
Siliceous Concrete (SC) 2450 11.1 3450 1650 Cohesive matrix Calcareous Concrete (CC) 2460 11.5 3500 1400 Cohesive matrix Tuffeau 1360 46.4 1900 1250 Granular 38
39
Thermally-induced cracks N. Belayachi et al.
4
1 2
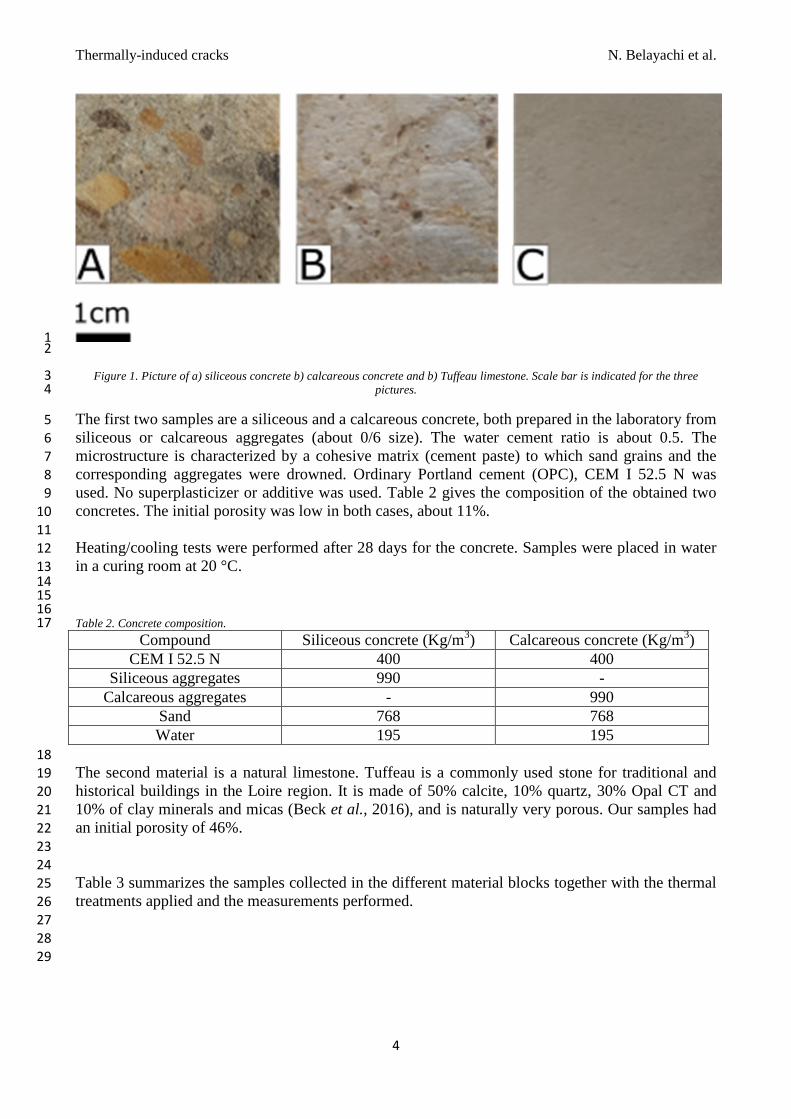
Figure 1. Picture of a) siliceous concrete b) calcareous concrete and b) Tuffeau limestone. Scale bar is indicated for the three 3
pictures. 4
The first two samples are a siliceous and a calcareous concrete, both prepared in the laboratory from 5
siliceous or calcareous aggregates (about 0/6 size). The water cement ratio is about 0.5. The 6
microstructure is characterized by a cohesive matrix (cement paste) to which sand grains and the 7
corresponding aggregates were drowned. Ordinary Portland cement (OPC), CEM I 52.5 N was 8
used. No superplasticizer or additive was used. Table 2 gives the composition of the obtained two 9
concretes. The initial porosity was low in both cases, about 11%. 10
11
Heating/cooling tests were performed after 28 days for the concrete. Samples were placed in water 12
in a curing room at 20 °C. 13
14
15
16
Table 2. Concrete composition. 17
Compound Siliceous concrete (Kg/m3) Calcareous concrete (Kg/m3) CEM I 52.5 N 400 400
Siliceous aggregates 990 - Calcareous aggregates - 990
Sand 768 768 Water 195 195
18
The second material is a natural limestone. Tuffeau is a commonly used stone for traditional and 19
historical buildings in the Loire region. It is made of 50% calcite, 10% quartz, 30% Opal CT and 20
10% of clay minerals and micas (Beck et al., 2016), and is naturally very porous. Our samples had 21
an initial porosity of 46%. 22
23
24
Table 3 summarizes the samples collected in the different material blocks together with the thermal 25
treatments applied and the measurements performed. 26
27
28
29
Thermally-induced cracks N. Belayachi et al.
5
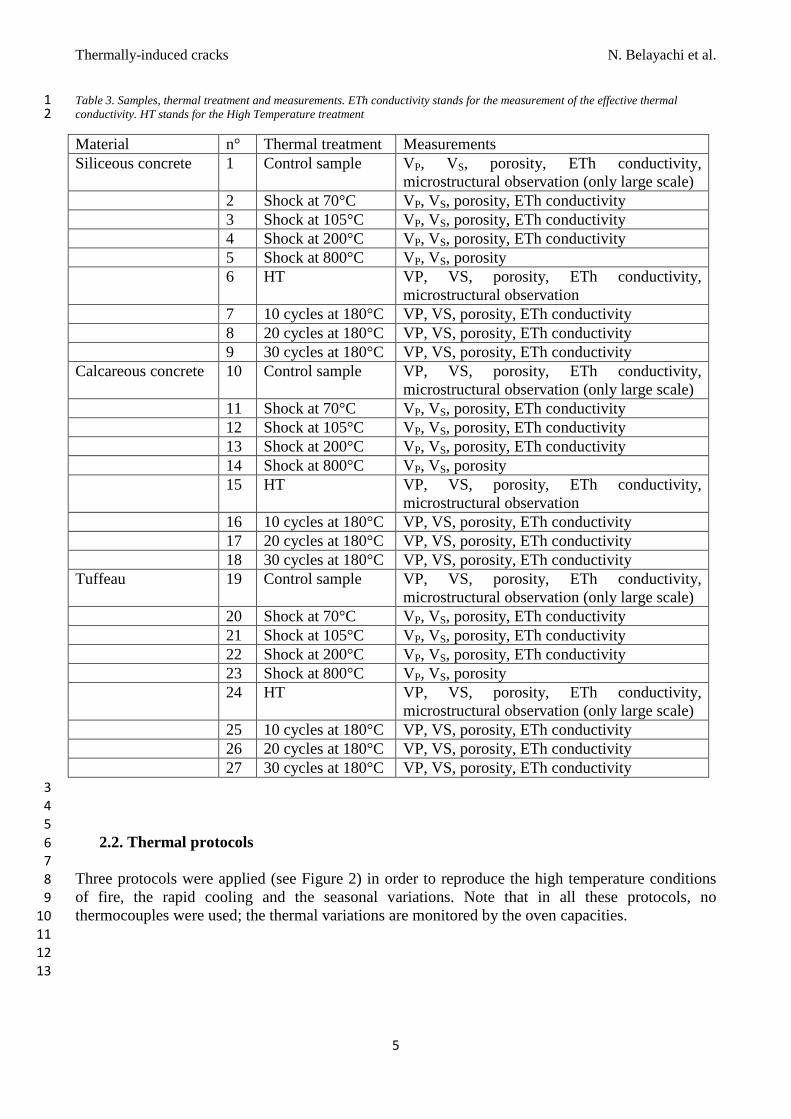
Table 3. Samples, thermal treatment and measurements. ETh conductivity stands for the measurement of the effective thermal 1
conductivity. HT stands for the High Temperature treatment 2
Material n° Thermal treatment Measurements Siliceous concrete 1 Control sample VP, VS, porosity, ETh conductivity,
microstructural observation (only large scale) 2 Shock at 70°C VP, VS, porosity, ETh conductivity 3 Shock at 105°C VP, VS, porosity, ETh conductivity 4 Shock at 200°C VP, VS, porosity, ETh conductivity 5 Shock at 800°C VP, VS, porosity 6 HT VP, VS, porosity, ETh conductivity,
microstructural observation 7 10 cycles at 180°C VP, VS, porosity, ETh conductivity 8 20 cycles at 180°C VP, VS, porosity, ETh conductivity 9 30 cycles at 180°C VP, VS, porosity, ETh conductivity Calcareous concrete 10 Control sample VP, VS, porosity, ETh conductivity,
microstructural observation (only large scale) 11 Shock at 70°C VP, VS, porosity, ETh conductivity 12 Shock at 105°C VP, VS, porosity, ETh conductivity 13 Shock at 200°C VP, VS, porosity, ETh conductivity 14 Shock at 800°C VP, VS, porosity 15 HT VP, VS, porosity, ETh conductivity,
microstructural observation 16 10 cycles at 180°C VP, VS, porosity, ETh conductivity 17 20 cycles at 180°C VP, VS, porosity, ETh conductivity 18 30 cycles at 180°C VP, VS, porosity, ETh conductivity Tuffeau 19 Control sample VP, VS, porosity, ETh conductivity,
microstructural observation (only large scale) 20 Shock at 70°C VP, VS, porosity, ETh conductivity 21 Shock at 105°C VP, VS, porosity, ETh conductivity 22 Shock at 200°C VP, VS, porosity, ETh conductivity 23 Shock at 800°C VP, VS, porosity 24 HT VP, VS, porosity, ETh conductivity,
microstructural observation (only large scale) 25 10 cycles at 180°C VP, VS, porosity, ETh conductivity 26 20 cycles at 180°C VP, VS, porosity, ETh conductivity 27 30 cycles at 180°C VP, VS, porosity, ETh conductivity 3
4
5
2.2. Thermal protocols 6
7
Three protocols were applied (see Figure 2) in order to reproduce the high temperature conditions 8
of fire, the rapid cooling and the seasonal variations. Note that in all these protocols, no 9
thermocouples were used; the thermal variations are monitored by the oven capacities. 10
11
12
13
Thermally-induced cracks N. Belayachi et al.
6
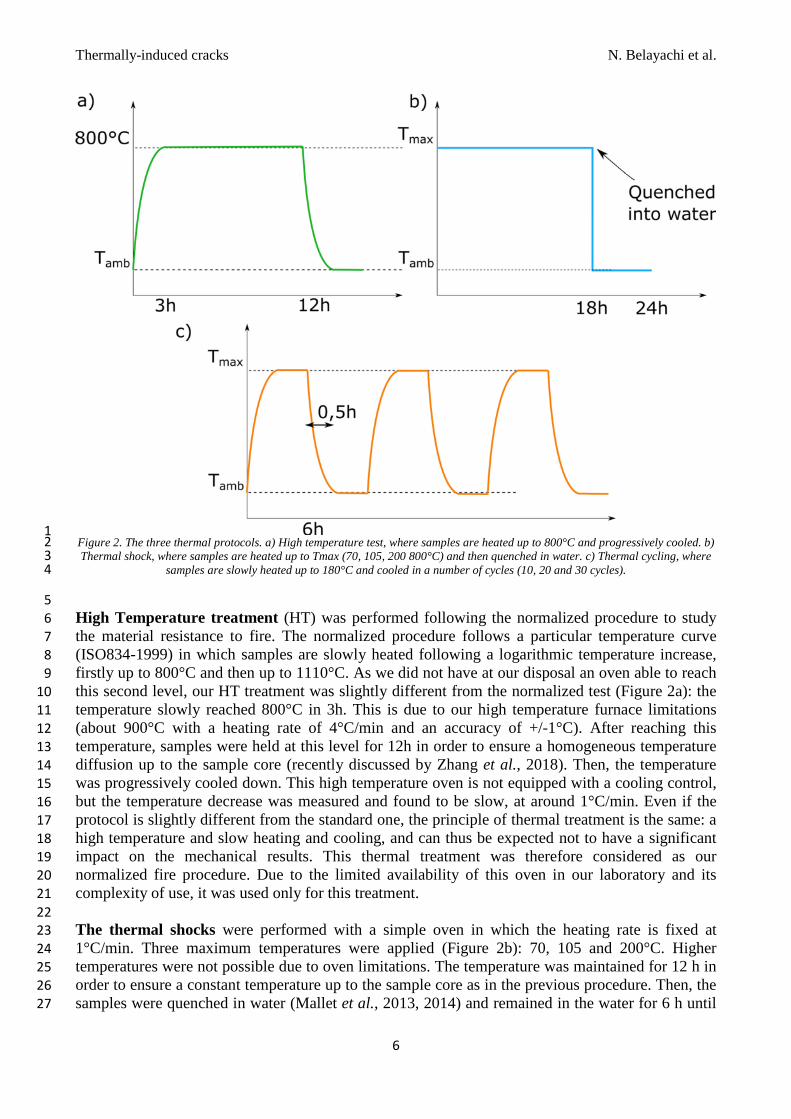
1 Figure 2. The three thermal protocols. a) High temperature test, where samples are heated up to 800°C and progressively cooled. b) 2
Thermal shock, where samples are heated up to Tmax (70, 105, 200 800°C) and then quenched in water. c) Thermal cycling, where 3
samples are slowly heated up to 180°C and cooled in a number of cycles (10, 20 and 30 cycles). 4
5
High Temperature treatment (HT) was performed following the normalized procedure to study 6
the material resistance to fire. The normalized procedure follows a particular temperature curve 7
(ISO834-1999) in which samples are slowly heated following a logarithmic temperature increase, 8
firstly up to 800°C and then up to 1110°C. As we did not have at our disposal an oven able to reach 9
this second level, our HT treatment was slightly different from the normalized test (Figure 2a): the 10
temperature slowly reached 800°C in 3h. This is due to our high temperature furnace limitations 11
(about 900°C with a heating rate of 4°C/min and an accuracy of +/-1°C). After reaching this 12
temperature, samples were held at this level for 12h in order to ensure a homogeneous temperature 13
diffusion up to the sample core (recently discussed by Zhang et al., 2018). Then, the temperature 14
was progressively cooled down. This high temperature oven is not equipped with a cooling control, 15
but the temperature decrease was measured and found to be slow, at around 1°C/min. Even if the 16
protocol is slightly different from the standard one, the principle of thermal treatment is the same: a 17
high temperature and slow heating and cooling, and can thus be expected not to have a significant 18
impact on the mechanical results. This thermal treatment was therefore considered as our 19
normalized fire procedure. Due to the limited availability of this oven in our laboratory and its 20
complexity of use, it was used only for this treatment. 21
22
The thermal shocks were performed with a simple oven in which the heating rate is fixed at 23
1°C/min. Three maximum temperatures were applied (Figure 2b): 70, 105 and 200°C. Higher 24
temperatures were not possible due to oven limitations. The temperature was maintained for 12 h in 25
order to ensure a constant temperature up to the sample core as in the previous procedure. Then, the 26
samples were quenched in water (Mallet et al., 2013, 2014) and remained in the water for 6 h until 27
Thermally-induced cracks N. Belayachi et al.
7
total cooling (NF-EN14066). They were then oven-dried and placed in a desiccator. The rock mass 1
evolution was monitored to ensure that complete drying was achieved. As the influence of the 2
cooling process is an important parameter that affects the mechanical properties and the crack 3
network (Botte and Caspeele, 2017), a fourth thermal shock was applied. Each sample put in the HT 4
oven was duplicated and one of the two was quenched in water after the 12 h at 800°C. This 5
thermal shock at such a high temperature was performed in order to examine the effect of cooling 6
rate. 7
8
Thermal cycle is a repetitive protocol (Figure 2c). Samples were placed in an oven that was 9
progressively heated up to 180°C in 30 min and then cooled after 6 h down to 20°C in 30 min. 10
These progressive 7-hour cycles were repeated 10, 20 and 30 times (Yavuz et al., 2006; Lam Dos 11
Santos et al., 2011). It is commonly considered in the literature that this protocol leads to 12
homogeneously damaged samples due to its progressive aspect (Wang et al., 2013). A perfectly 13
controlled oven was used that allows temperature regulation from -60°C to 200°C with a precision 14
of 0.1°C. This furnace can be programmed for automatic cycles. 15
16
After all the thermal treatments, the samples were preserved in an oven with controlled humidity 17
(dry, Hr=40%) and temperature (45°C). 18
19
2.3. Measurements 20
21
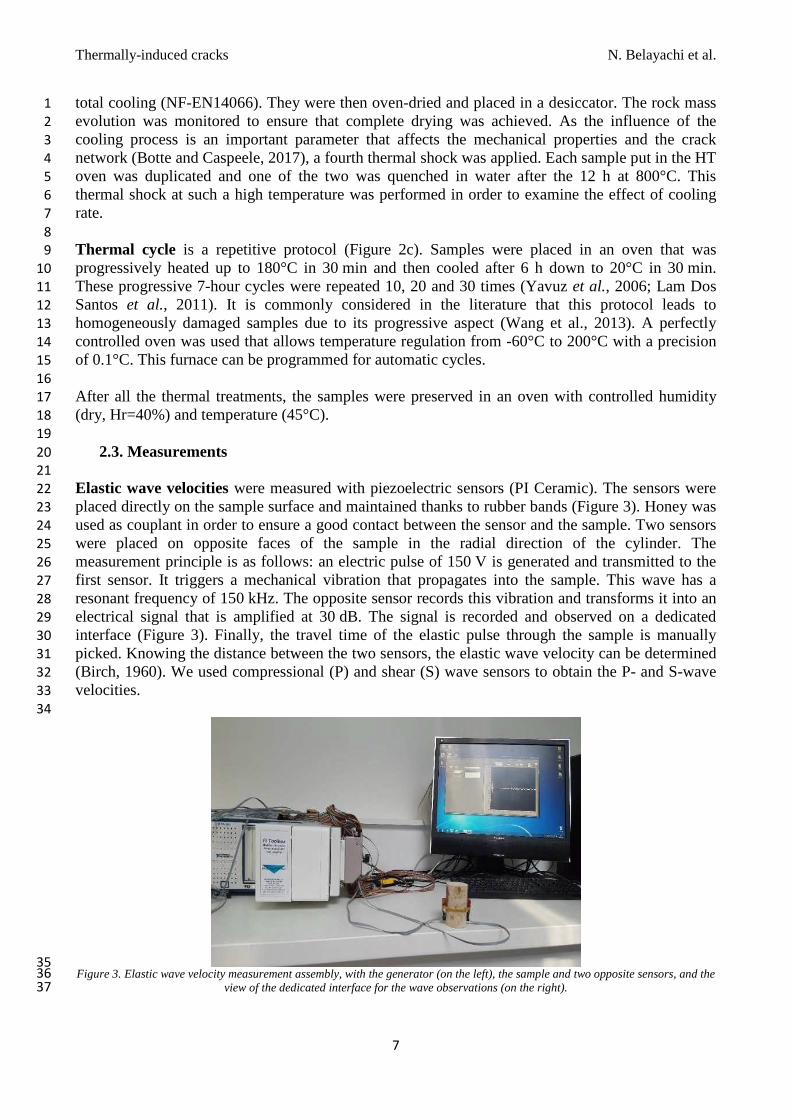
Elastic wave velocities were measured with piezoelectric sensors (PI Ceramic). The sensors were 22
placed directly on the sample surface and maintained thanks to rubber bands (Figure 3). Honey was 23
used as couplant in order to ensure a good contact between the sensor and the sample. Two sensors 24
were placed on opposite faces of the sample in the radial direction of the cylinder. The 25
measurement principle is as follows: an electric pulse of 150 V is generated and transmitted to the 26
first sensor. It triggers a mechanical vibration that propagates into the sample. This wave has a 27
resonant frequency of 150 kHz. The opposite sensor records this vibration and transforms it into an 28
electrical signal that is amplified at 30 dB. The signal is recorded and observed on a dedicated 29
interface (Figure 3). Finally, the travel time of the elastic pulse through the sample is manually 30
picked. Knowing the distance between the two sensors, the elastic wave velocity can be determined 31
(Birch, 1960). We used compressional (P) and shear (S) wave sensors to obtain the P- and S-wave 32
velocities. 33
34
35 Figure 3. Elastic wave velocity measurement assembly, with the generator (on the left), the sample and two opposite sensors, and the 36
view of the dedicated interface for the wave observations (on the right). 37
Thermally-induced cracks N. Belayachi et al.
8
The elastic wave velocities were determined with an accuracy of ±50 m/s. Note that this measurement 1
accuracy is due to the travel time picking and the signal sampling. The elastic modulus can be obtained 2
from these velocities considering a simple isotropic symmetry by: 3
��� =� + 4
3 � ���� =
,
where K and G are the bulk and shear modulus, respectively, and is the sample density. The 4
sample density was measured by weighing the samples before the thermal treatments. The densities 5
are given in Table 1. 6
7
Crack density is a mechanical damage parameter introduced by Walsh (1965a, b) in order to 8
quantify the effect of cracks on the elastic properties. In scalar definition and the isotropic case, it is 9
defined by the ratio of the sum of all cubed crack radii versus the total volume of the sample: 10
� =1������
�,
where �� is the radius of the ith crack and �� is the total volume of the sample. Then, still 11
considering the simple isotropic case, the crack density can be linked to elastic parameters (and thus 12
elastic wave velocities) by the following relationships derived from the study by Kachanov (1993): 13
��� = 1 + �
16�1 − ����1 − 2��
and 14
� = 1 + �
16�1 − ��/5��1 − ���9�1 − ��/2�
where the substript 0 refer to the initial sample (without cracking), and �� is the Poisson's ratio. 15
16
Effective Thermal conductivity was measured in order to describe the crack connectivity. As 17
shown by Xiong and Liew (2016), thermal or electrical conductivities are linked to the connectivity 18
of a crack network. When a sample is more porous, its effective thermal conductivity decreases. 19
Thus, when cracks are more numerous and connected, a decrease in conductivity can be expected. 20
This measurement was performed by the hotwire technique following ASTM D5930-97 and the 21
RILEM recommendation (AAC11-3). The Neotim apparatus used is equipped with a probe of 22
50 mm in length. The accuracy of the measurement is ±5% with a repeat accuracy of 3%. The 23
temperature range of the apparatus is from -20°C to 100°C. The measurement range of effective 24
thermal conductivity was 0.02 to 5 W/mK. For every measurement, the average conductivity was 25
obtained from 10 measurements in order to minimize the standard deviation. 26
27
Lastly, Porosity was measured, thanks to water saturation. It is only the water accessible porosity. 28
To do so, the sample mass has been measured and thus, the density could be follow. However, these 29
results are not presented here. They do not show discussable tendency as in the high temperature 30
investigation performed by Motra and Zertani (2018). We also performed some microstructural 31
observations under an optical microscope for qualitative descriptions. 32
33
34
3. Results 35
36
3.1. Elastic wave velocity and crack density 37
38
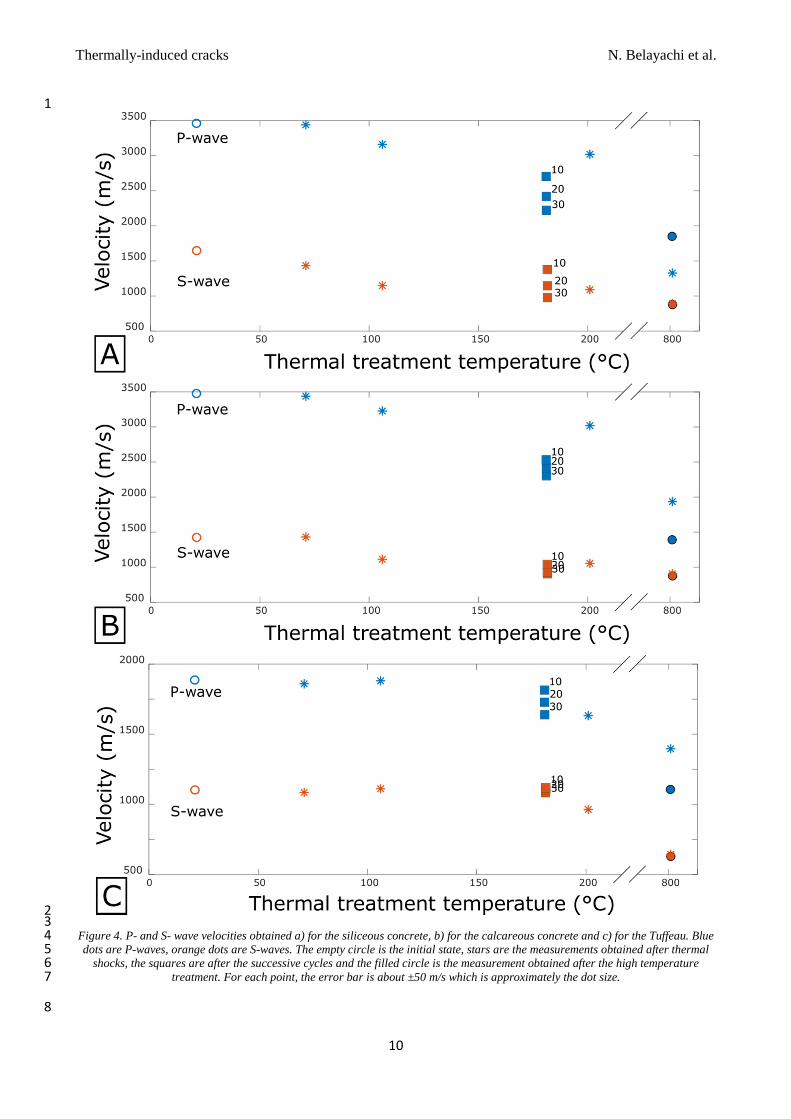
Figure 4 presents the P-wave (in blue) and S-wave (in orange) velocities measured after 39
the different thermal treatments. Figures 4a and b concern the siliceous and calcareous concretes, 40
Thermally-induced cracks N. Belayachi et al.
9
respectively, while Figure 4c concerns the Tuffeau limestone. The velocities measured on the initial 1
samples are represented as an empty circle. Results obtained after thermal shocks are plotted as 2
stars; after the thermal cycles, as squares (with an exponent corresponding to the number of cycles); 3
and after the HT treatment, as a filled circle. Note that for the S-wave, it is not easy to distinguish 4
the squares, but for every case, the results for the 10-cycle protocol are the highest velocities and 5
those with 30 cycles are the lowest. 6
Increasing the maximum temperature of the thermal shock decreased the elastic velocities, although 7
this is not very marked for the first three values of the Tuffeau limestone, as considering the error 8
bar of the elastic wave measurements (±50 m/s), a thermal shock of 70 or 105°C appeared to lead to 9
no velocity variations in this material compared to the initial state. In contrast, we always observed 10
a variation with the increasing number of cycles, whatever the sample. Concerning the high 11
temperature treatment, we can see that for the S-wave, the velocity reached is equivalent to the one 12
obtained after a thermal shock at 800°C. For the calcareous materials (calcareous concrete and 13
Tuffeau), the velocities measured after the HT treatment presented the biggest difference with the 14
initial state. This was not the case for the siliceous concrete where the thermal shock at 800°C led to 15
even lower velocities than with the high temperature treatment. In order to interpret the cracking 16
behavior in greater detail, we now focus on the crack density inferred from both P- and S-wave 17
velocities. 18
19
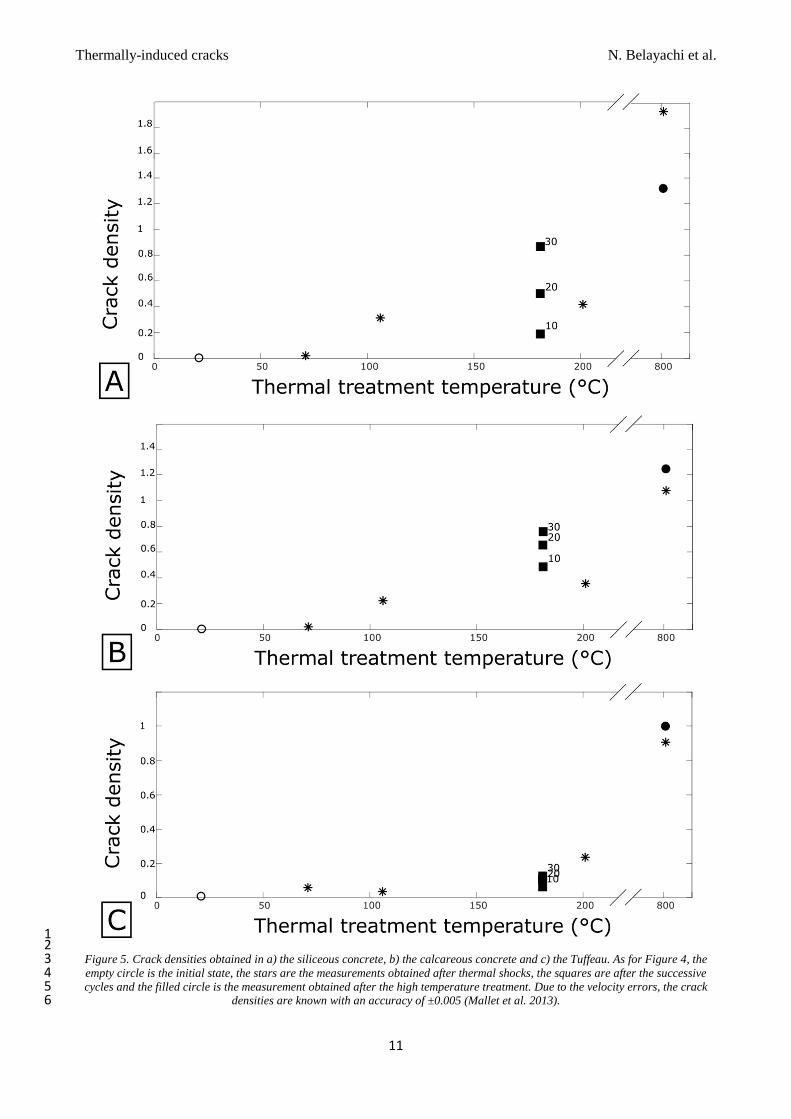
In Figure 5, the crack density is plotted with the same symbols as previously. Here also, Figures 5a 20
and b concern the siliceous and calcareous concretes, respectively, while Figure 5c concerns the 21
Tuffeau. Because it is known that crack density describes the mechanical damage due to cracks, this 22
Figure can be directly interpreted in terms of sample cracking. For the two calcareous samples (the 23
calcareous concrete and the Tuffeau), the maximum crack density was obtained after the high 24
temperature treatment, and the result obtained with the thermal shock performed at 800°C was the 25
closest to the HT results. For the siliceous concrete, it was the thermal shock at 800°C that caused 26
the most damage, and the result obtained after 30 cycles was the closest to the HT results. This 27
material appears to be much more affected by a sharp high temperature decrease than the calcareous 28
concrete, as expected according to the study by Calmeiro Dos Santos and Rodrigues (2016). 29
30
31
These results on thermal shock and repetitive cycles show that the concrete and Tuffeau samples do 32
not have the same behavior. 33
For the concretes, the slightest thermal chock immediately favors an increase in crack density. This 34
is not the case for Tuffeau where the first two thermal shocks present the same crack density as the 35
initial state (i.e. " = 0). For the concretes, the increasing number of cycles has a strong effect on 36
the crack density (particularly for the siliceous concrete) as can be seen from the great difference 37
between 10, 20 and 30 cycles, with crack density going from 0.2 to 0.8 for the siliceous concrete 38
and from 0.45 to 0.8 for the calcareous concrete. The repetitive cycles at 180°C strongly affect the 39
damage. Crack density is greater at lower temperature after 20 cycles. In addition, the cracking 40
obtained after 30 cycles is close to the crack density induced by the high temperature treatment (at 41
least compared to the result obtained on Tuffeau, and especially for the siliceous concrete). 42
The behavior of Tuffeau is different. The first shocks do not induce a marked increase in cracking 43
damage since for thermal shocks up to 105°C, the crack density is almost zero. It presents a slight 44
increase, but this is negligible considering the error bar on the elastic wave velocities (leading to a 45
crack density known with an accuracy of ±0.005 determined by Mallet et al., 2013). The increasing 46
damage due to the heating-cooling cycles is less than for the concrete. The first two thermal shocks 47
do not induce a damage increase compared to the initial state. Moreover, unlike the concrete, the 48
thermal shock at 200°C is the most damaging. This difference no doubt comes from the 49
microstructure of the sample, studied in the following section. 50
Thermally-induced cracks N. Belayachi et al.
10
1
2 3
Figure 4. P- and S- wave velocities obtained a) for the siliceous concrete, b) for the calcareous concrete and c) for the Tuffeau. Blue 4
dots are P-waves, orange dots are S-waves. The empty circle is the initial state, stars are the measurements obtained after thermal 5
shocks, the squares are after the successive cycles and the filled circle is the measurement obtained after the high temperature 6
treatment. For each point, the error bar is about ±50 m/s which is approximately the dot size. 7
8
Thermally-induced cracks N. Belayachi et al.
11
1 2
Figure 5. Crack densities obtained in a) the siliceous concrete, b) the calcareous concrete and c) the Tuffeau. As for Figure 4, the 3
empty circle is the initial state, the stars are the measurements obtained after thermal shocks, the squares are after the successive 4
cycles and the filled circle is the measurement obtained after the high temperature treatment. Due to the velocity errors, the crack 5
densities are known with an accuracy of ±0.005 (Mallet et al. 2013). 6
Thermally-induced cracks N. Belayachi et al.
12
1
3.2. Porosity and effective thermal conductivity 2
3
Figures 6 and 7 show the effective thermal conductivity and porosity versus the crack density 4
results obtained after the different thermal solicitations. The symbols are the same as for Figures 4 5
and 5. 6
7
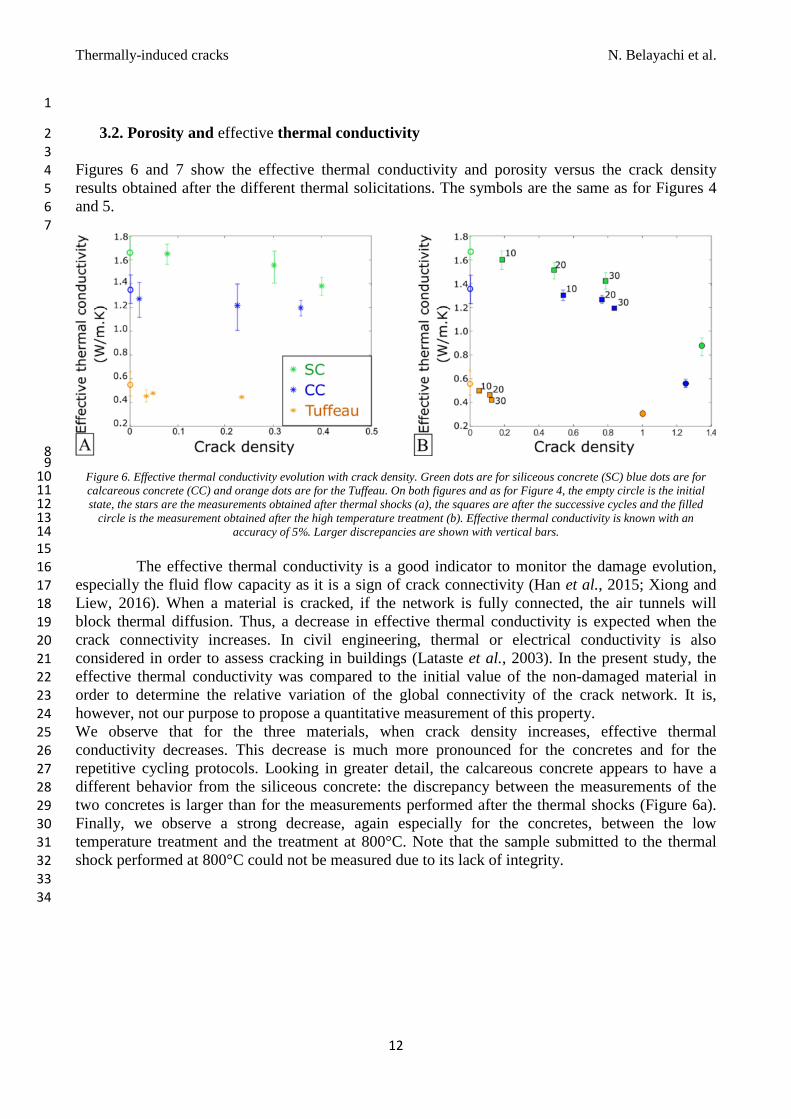
8 9
Figure 6. Effective thermal conductivity evolution with crack density. Green dots are for siliceous concrete (SC) blue dots are for 10
calcareous concrete (CC) and orange dots are for the Tuffeau. On both figures and as for Figure 4, the empty circle is the initial 11
state, the stars are the measurements obtained after thermal shocks (a), the squares are after the successive cycles and the filled 12
circle is the measurement obtained after the high temperature treatment (b). Effective thermal conductivity is known with an 13
accuracy of 5%. Larger discrepancies are shown with vertical bars. 14
15
The effective thermal conductivity is a good indicator to monitor the damage evolution, 16
especially the fluid flow capacity as it is a sign of crack connectivity (Han et al., 2015; Xiong and 17
Liew, 2016). When a material is cracked, if the network is fully connected, the air tunnels will 18
block thermal diffusion. Thus, a decrease in effective thermal conductivity is expected when the 19
crack connectivity increases. In civil engineering, thermal or electrical conductivity is also 20
considered in order to assess cracking in buildings (Lataste et al., 2003). In the present study, the 21
effective thermal conductivity was compared to the initial value of the non-damaged material in 22
order to determine the relative variation of the global connectivity of the crack network. It is, 23
however, not our purpose to propose a quantitative measurement of this property. 24
We observe that for the three materials, when crack density increases, effective thermal 25
conductivity decreases. This decrease is much more pronounced for the concretes and for the 26
repetitive cycling protocols. Looking in greater detail, the calcareous concrete appears to have a 27
different behavior from the siliceous concrete: the discrepancy between the measurements of the 28
two concretes is larger than for the measurements performed after the thermal shocks (Figure 6a). 29
Finally, we observe a strong decrease, again especially for the concretes, between the low 30
temperature treatment and the treatment at 800°C. Note that the sample submitted to the thermal 31
shock performed at 800°C could not be measured due to its lack of integrity. 32
33
34
Thermally-induced cracks N. Belayachi et al.
13
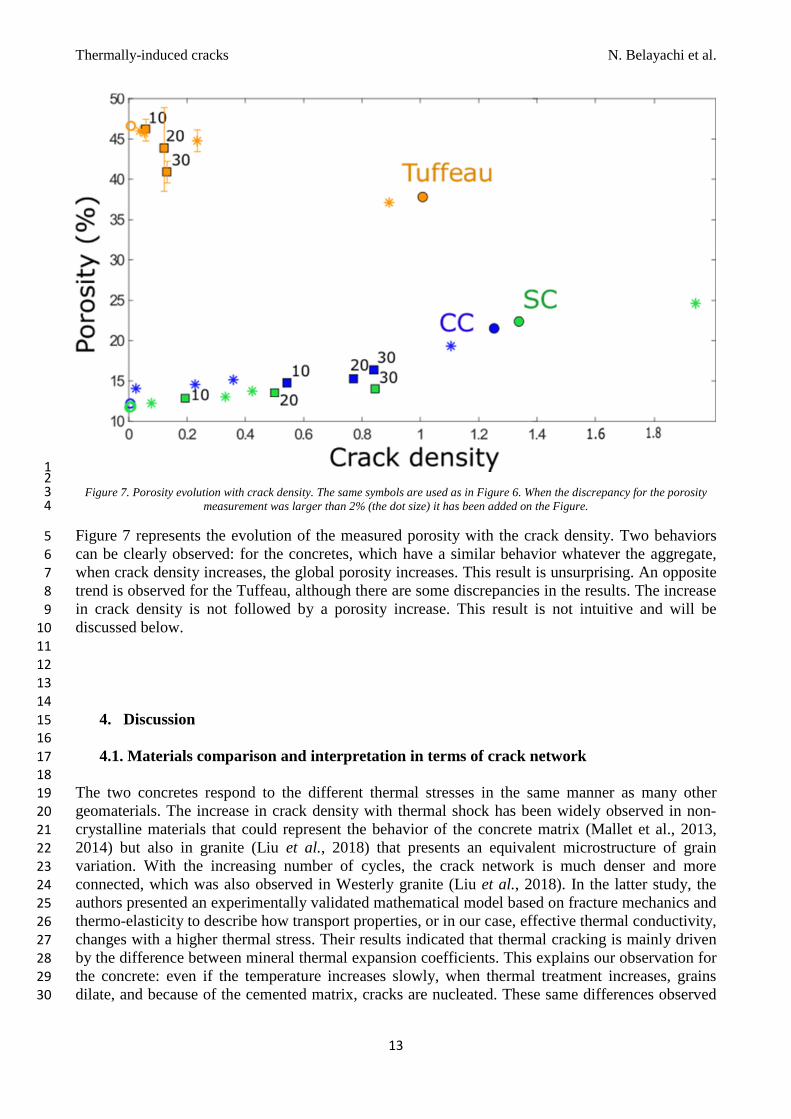
1 2
Figure 7. Porosity evolution with crack density. The same symbols are used as in Figure 6. When the discrepancy for the porosity 3
measurement was larger than 2% (the dot size) it has been added on the Figure. 4
Figure 7 represents the evolution of the measured porosity with the crack density. Two behaviors 5
can be clearly observed: for the concretes, which have a similar behavior whatever the aggregate, 6
when crack density increases, the global porosity increases. This result is unsurprising. An opposite 7
trend is observed for the Tuffeau, although there are some discrepancies in the results. The increase 8
in crack density is not followed by a porosity increase. This result is not intuitive and will be 9
discussed below. 10
11
12
13
14
4. Discussion 15
16
4.1. Materials comparison and interpretation in terms of crack network 17
18
The two concretes respond to the different thermal stresses in the same manner as many other 19
geomaterials. The increase in crack density with thermal shock has been widely observed in non-20
crystalline materials that could represent the behavior of the concrete matrix (Mallet et al., 2013, 21
2014) but also in granite (Liu et al., 2018) that presents an equivalent microstructure of grain 22
variation. With the increasing number of cycles, the crack network is much denser and more 23
connected, which was also observed in Westerly granite (Liu et al., 2018). In the latter study, the 24
authors presented an experimentally validated mathematical model based on fracture mechanics and 25
thermo-elasticity to describe how transport properties, or in our case, effective thermal conductivity, 26
changes with a higher thermal stress. Their results indicated that thermal cracking is mainly driven 27
by the difference between mineral thermal expansion coefficients. This explains our observation for 28
the concrete: even if the temperature increases slowly, when thermal treatment increases, grains 29
dilate, and because of the cemented matrix, cracks are nucleated. These same differences observed 30
Thermally-induced cracks N. Belayachi et al.
14
for the studied materials have been explained in the literature (see for example Ingham 2009 and 1
Zhang et al. 2017). 2
The difference between the two concretes could be explained by the different strength of the two 3
aggregates. In the high temperature treatment, the difference could also come from the alpha-beta 4
quartz transition observed after 575°C that can occur in siliceous concrete (Shapiro et al., 1967; 5
Carpenter et al., 1998). This well-known phenomenon which produces structural changes may 6
cause changes in volume and differential cracking that is even observed in amorphous materials 7
(Chakrabarti et al., 1995). 8
9
For the Tuffeau, there is no damage at the beginning of the thermal treatments. This is similar to 10
what is observed in many different limestones or sandstones, and can be explained by the calcite 11
matrix and the high porosity which allow the grains to dilate unhindered. It could also be an 12
explanation for the non-intuitive porosity variation of the Tuffeau. Because of the high initial 13
porosity (46%), when the samples are heated, grains can dilate, decreasing the void between them 14
as observed in the study by Bachrach et al. (2000). On the other hand, it must be borne in mind that 15
we are measuring water porosity. It is possible that the apertures in the created cracks are too small 16
for water to penetrate. It has been shown in porous sandstones that two mechanisms can occur 17
(Fortin et al., 2009): grains can “leave” their original place and “fall” into the pores, or small 18
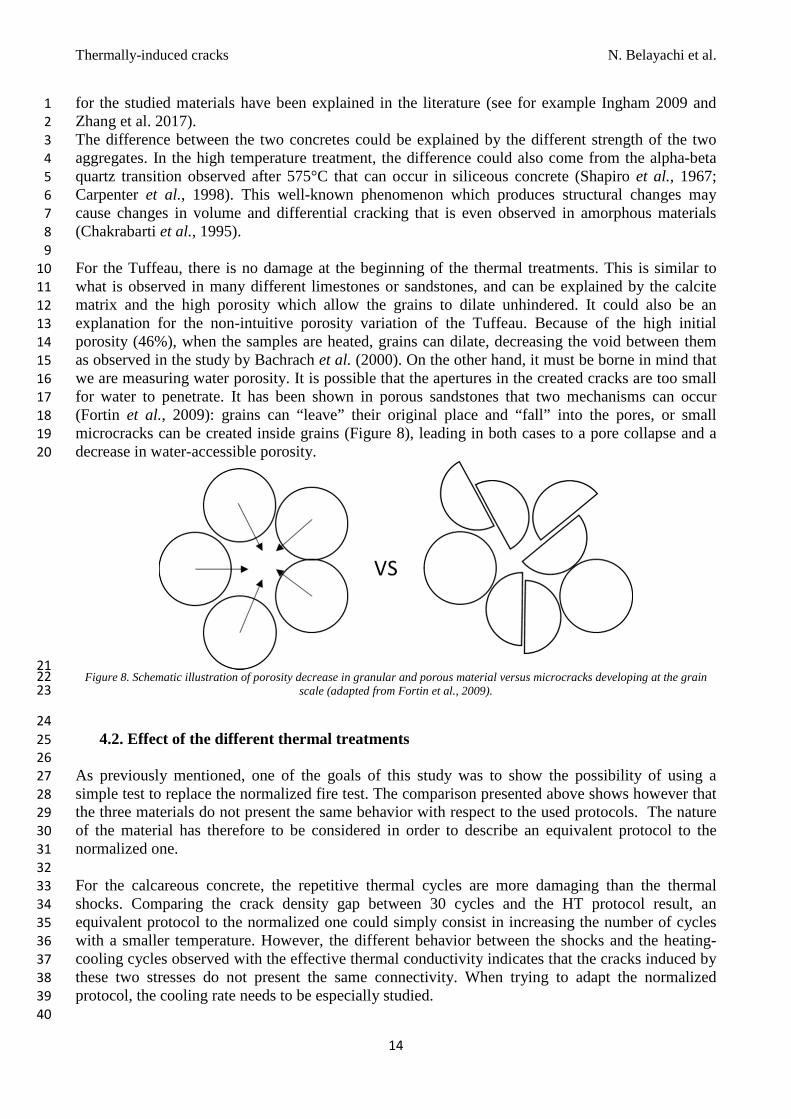
microcracks can be created inside grains (Figure 8), leading in both cases to a pore collapse and a 19
decrease in water-accessible porosity. 20
21 Figure 8. Schematic illustration of porosity decrease in granular and porous material versus microcracks developing at the grain 22
scale (adapted from Fortin et al., 2009). 23
24
4.2. Effect of the different thermal treatments 25
26
As previously mentioned, one of the goals of this study was to show the possibility of using a 27
simple test to replace the normalized fire test. The comparison presented above shows however that 28
the three materials do not present the same behavior with respect to the used protocols. The nature 29
of the material has therefore to be considered in order to describe an equivalent protocol to the 30
normalized one. 31
32
For the calcareous concrete, the repetitive thermal cycles are more damaging than the thermal 33
shocks. Comparing the crack density gap between 30 cycles and the HT protocol result, an 34
equivalent protocol to the normalized one could simply consist in increasing the number of cycles 35
with a smaller temperature. However, the different behavior between the shocks and the heating-36
cooling cycles observed with the effective thermal conductivity indicates that the cracks induced by 37
these two stresses do not present the same connectivity. When trying to adapt the normalized 38
protocol, the cooling rate needs to be especially studied. 39
40
Thermally-induced cracks N. Belayachi et al.
15
For the siliceous concrete, the sample appears to be much more sensitive to sharp thermal 1
variations. Nevertheless, as for the calcareous concrete, at lower temperature, the repetitive cycles 2
give very similar results to those of the HT treatment. One possibility in this case, therefore, would 3
be to mix these protocols, involving a succession of sharp temperature variations of 200°C, 4
cyclically repeated. Alternatively, perhaps a single thermal shock at an intermediate temperature 5
around 400°C would be enough. 6
7
For Tuffeau it is much more complicated to propose an equivalent protocol as none of the thermal 8
treatments give similar results to those of the HT treatment. It seems that for this material it is not 9
possible to find an equivalent test because of its complex fire behavior. 10
11
4.3. Limitations of our interpretations 12
13
14
We interpreted the observed damage evolution and the property variations by considering cracking, 15
assessed by the variation in crack density and, as we will see, by some microstructural observations. 16
However, we are aware that complementary effects could arise, such as a decarbonation reaction for 17
the calcareous samples treated at 800°C. It has been shown that in the presence of calcite, some 18
decarbonation reactions coupled to microcracking significantly reduce the rock strength (see for 19
example the studies by Mollo et al., 2013 and Heap et al., 2013). In addition, some chemical 20
reactions may occur when the concrete is quenched in water. These other mechanisms may also be 21
part of the global process, but were beyond the scope of this paper. 22
23
There is another limitation of our interpretation linked to the use of the crack density parameter. 24
Thanks to the numerical studies by Grechka and Kachanov (2006) and the experimental study by 25
Mallet et al. (2014), an empirical threshold of around 0.25 can be fixed for the use of this 26
parameter. This does not mean that beyond this value we cannot calculate the crack density, but the 27
mechanical interpretation based on the effective medium theories are no longer valid. In this paper, 28
because our interpretations are based both on the elastic wave velocities and the crack density, we 29
chose to keep the observation of the variation in crack density. It should be borne in mind, however, 30
that its exact value is questionable after the above-mentioned threshold. Moreover, concerning 31
Tuffeau, its high initial porosity will affect the determination of the crack density. However, here 32
again, because we are comparing the initial state versus the damaged one, we are not looking for an 33
exact value, but rather a relative behavior. Indeed, following the studies of Schöpfer et al. (2009) 34
and Panza et al. (2019) relative crack density can still be investigated even for samples with an 35
initial high porosity. 36
37
38
4.4.Microstructural observations 39
40
The global microstructure of the Tuffeau and the concretes was observed in the initial state and after 41
the HT treatment (Figure 9). Note that we are only interested here in providing a qualitative 42
description. Thus no SEM images were produced. Despite the crack nucleation in the other thermal 43
treatments, the cracks were visible with the naked eye only for the HT process. We therefore 44
confined our observations to these samples. 45
46
Thermally-induced cracks N. Belayachi et al.
16
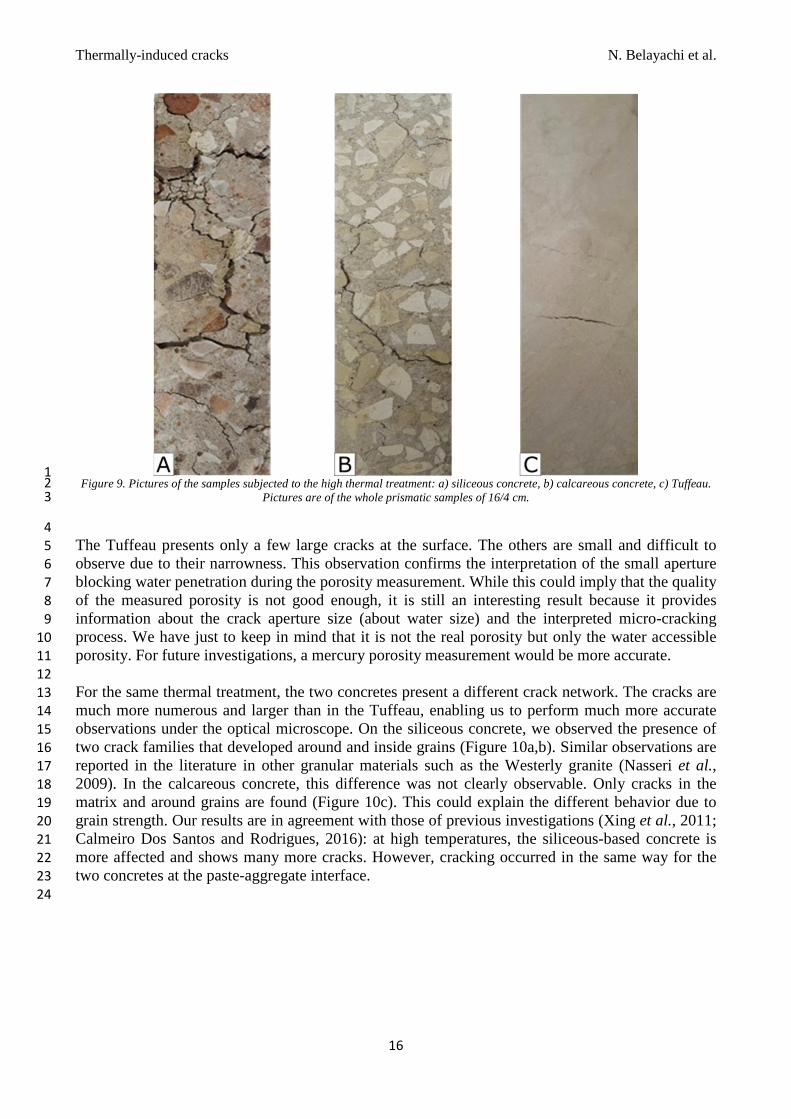
1 Figure 9. Pictures of the samples subjected to the high thermal treatment: a) siliceous concrete, b) calcareous concrete, c) Tuffeau. 2
Pictures are of the whole prismatic samples of 16/4 cm. 3
4
The Tuffeau presents only a few large cracks at the surface. The others are small and difficult to 5
observe due to their narrowness. This observation confirms the interpretation of the small aperture 6
blocking water penetration during the porosity measurement. While this could imply that the quality 7
of the measured porosity is not good enough, it is still an interesting result because it provides 8
information about the crack aperture size (about water size) and the interpreted micro-cracking 9
process. We have just to keep in mind that it is not the real porosity but only the water accessible 10
porosity. For future investigations, a mercury porosity measurement would be more accurate. 11
12
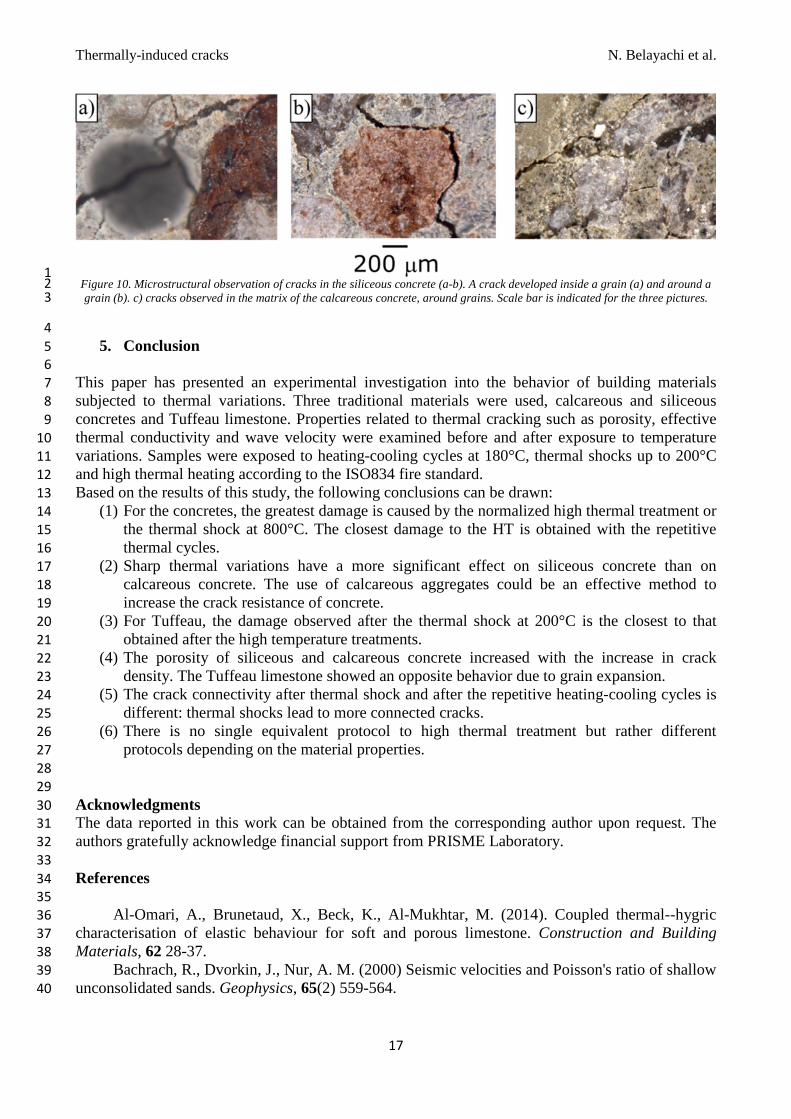
For the same thermal treatment, the two concretes present a different crack network. The cracks are 13
much more numerous and larger than in the Tuffeau, enabling us to perform much more accurate 14
observations under the optical microscope. On the siliceous concrete, we observed the presence of 15
two crack families that developed around and inside grains (Figure 10a,b). Similar observations are 16
reported in the literature in other granular materials such as the Westerly granite (Nasseri et al., 17
2009). In the calcareous concrete, this difference was not clearly observable. Only cracks in the 18
matrix and around grains are found (Figure 10c). This could explain the different behavior due to 19
grain strength. Our results are in agreement with those of previous investigations (Xing et al., 2011; 20
Calmeiro Dos Santos and Rodrigues, 2016): at high temperatures, the siliceous-based concrete is 21
more affected and shows many more cracks. However, cracking occurred in the same way for the 22
two concretes at the paste-aggregate interface. 23
24
Thermally-induced cracks N. Belayachi et al.
17
1 Figure 10. Microstructural observation of cracks in the siliceous concrete (a-b). A crack developed inside a grain (a) and around a 2
grain (b). c) cracks observed in the matrix of the calcareous concrete, around grains. Scale bar is indicated for the three pictures. 3
4
5. Conclusion 5
6
This paper has presented an experimental investigation into the behavior of building materials 7
subjected to thermal variations. Three traditional materials were used, calcareous and siliceous 8
concretes and Tuffeau limestone. Properties related to thermal cracking such as porosity, effective 9
thermal conductivity and wave velocity were examined before and after exposure to temperature 10
variations. Samples were exposed to heating-cooling cycles at 180°C, thermal shocks up to 200°C 11
and high thermal heating according to the ISO834 fire standard. 12
Based on the results of this study, the following conclusions can be drawn: 13
(1) For the concretes, the greatest damage is caused by the normalized high thermal treatment or 14
the thermal shock at 800°C. The closest damage to the HT is obtained with the repetitive 15
thermal cycles. 16
(2) Sharp thermal variations have a more significant effect on siliceous concrete than on 17
calcareous concrete. The use of calcareous aggregates could be an effective method to 18
increase the crack resistance of concrete. 19
(3) For Tuffeau, the damage observed after the thermal shock at 200°C is the closest to that 20
obtained after the high temperature treatments. 21
(4) The porosity of siliceous and calcareous concrete increased with the increase in crack 22
density. The Tuffeau limestone showed an opposite behavior due to grain expansion. 23
(5) The crack connectivity after thermal shock and after the repetitive heating-cooling cycles is 24
different: thermal shocks lead to more connected cracks. 25
(6) There is no single equivalent protocol to high thermal treatment but rather different 26
protocols depending on the material properties. 27
28
29
Acknowledgments 30
The data reported in this work can be obtained from the corresponding author upon request. The 31
authors gratefully acknowledge financial support from PRISME Laboratory. 32
33
References 34
35
Al-Omari, A., Brunetaud, X., Beck, K., Al-Mukhtar, M. (2014). Coupled thermal--hygric 36
characterisation of elastic behaviour for soft and porous limestone. Construction and Building 37
Materials, 62 28-37. 38
Bachrach, R., Dvorkin, J., Nur, A. M. (2000) Seismic velocities and Poisson's ratio of shallow 39
unconsolidated sands. Geophysics, 65(2) 559-564. 40
Thermally-induced cracks N. Belayachi et al.
18
Beck, K., Janvier-Badosa, S., Brunetaud, X., Török, A., Al-Mukhtar, M. (2016). Non-1
destructive diagnosis by colorimetry of building stone subjected to high temperatures. European 2
Journal of Environmental and Civil Engineering, 20(6) 643-655. 3
Belayachi, N., Hoxha, D., Do, D. P. (2012). Thermo-hydro-mechanical behavior of Tuffeau 4
stone masonry. European Journal of Environmental and Civil Engineering, 16(5) 557-570. 5
Birch, F. (1960). The velocity of compressional waves in rocks to 10 kilobars, part 1. Journal 6
of Applied Mechanics, 65 1083-1102. 7
Botte, W., Caspeele, R. (2017). Post-cooling properties of concrete exposed to fire. Fire 8
Safety Journal, 92 142-150. 9
Calmeiro Dos-Santos, C., Rodrigues, J. P. C. (2016). Calcareous and granite aggregate 10
concretes after fire. Journal of Building Engineering, 8 231-242. 11
Carpenter, M. A., Salje, E. K. H., Graeme-Barber, A., Wruck, B., Dove, M. T., Knight, K. S. 12
(1998). Calibration of excess thermodynamic properties and elastic constant variations associated 13
with the alpha-beta phase transition in quartz. American mineralogist, 83(1-2) 2-22. 14
Chakrabarti, A., Kuhlman, G. W., Rohde, K. A. (1995). High strength titanium aluminium 15
alloy improved fatigue crack growth resistance. US Patent No5,399,212. 16
Fortin, J., Stanchits, S., Dresen, G., Guéguen, Y. (2009). Acoustic Emissions Monitoring 17
during Inelastic Deformation of Porous Sandstone: Comparison of Three Modes of Deformation. 18
Pure And Applied Geophysics, 166 823-841. 19
Ghazi Wakili, K., Hugi, E., Wullschleger, L., Frank, T. (2007). Gypsum board in fire 20
modeling and experimental validation. Journal of Fire Sciences, 25(3) 267-282. 21
Grechka, V. Kachanov, M. (2006). Affective elasticity of fractured rocks: a snapshot of the 22
work in progress. Geophysics, 71(6) W45-W58. 23
Guéguen, Y., Kachanov, M. (2011). Effective elastic properties of cracked rocks - an 24
overview, in, mechanics of crustal rocks. CISM Courses and Lectures 533 73-125. 25
Han, T., Best, A. I., Sothcott, J., North, L. J., MacGregor, L.M. (2015). Relationships among 26
low frequency (2 hz) electrical resistivity, porosity, clay content and permeability in reservoir 27
sandstones. Journal of Applied Geophysics, 112 279-289. 28
Heap, M. J., Mollo, S., Vinciguerra, S., Lavallée, Y., Hess, K.-U., Dingwell, D., Baud, P., 29
Iezzi, G. (2013). Thermal weakening of the carbonate basement under Mt. Etna volcano (Italy): 30
implications for volcano instability. Journal of volcanology and geothermal research, 250 42-60. 31
Hoseini, M., Bindiganavile, V., Banthia, N., (2009). The effect of mechanical stress on 32
permeability of concrete: a review. Cement and concrete composites, 31(4) 213-220. 33
Ingham, J. P. (2009). Application of petrographic examination techniques to the assessment of 34
fire-damaged concrete and masonry structures. Materials characterization, 60 700-709. 35
ISO (834-1999) 834-1: 1999 fire resistance tests -elements of building construction- part I: 36
General requirements. Int Organ Stand. 37
Kachanov, M. (1993). Elastic solids with many cracks and related problems. Advances in 38
applied mechanics, 30 259-445. 39
Khan, M. S., Prasad, J., Abbas, H. (2010). Shear strength of RC beams subjected to cyclic 40
thermal loading. Construction and building materials, 24 1869-1877. 41
Khan, M. S., Abbas, H. (2016). Performance of concrete subjected to elevated temperature. 42
European Journal of Environmental and Civil Engineering, 20(5) 532-543. 43
Kodur, V., Agrawal, A. (2017). Effect of temperature induced bond degradation on fire 44
response of reinforced concrete beams. Engineering Structures, 142 98-109. 45
Kong, X., Li, J. (2019). Non-contact fatigue crack detection in civil infrastructure through 46
image overlapping and crack breathing sensing. Automation in construction, 99 125-139. 47
Lam Dos-Santos, J., Rosa, L., Amaral, P. (2011). Temperature effects on mechanical behavior 48
of engineered stones. Construction and Building Materials, 25(1) 171-174. 49
Thermally-induced cracks N. Belayachi et al.
19
Lataste, J., Sirieix, C., Breysse, D., Frappa, M. (2003). Electrical resistivity measurement 1
applied to cracking assessment on reinforced concrete structures in civil engineering. NDT & E 2
International, 36(6) 383-394. 3
Li, B., Mao, J., Shen, W., Liu, H., Liu, X., Xu, G. (2019). Mesoscopic cracking model of 4
cement based materials subjected to freeze-thaw cycles. Construction and building materials, 211 5
1050-1064. 6
Li, Z., Liu, Y., Huo, J., Rong, H., Chen, J., Elghazouli, A. Y. (2018). Experimental 7
assessment of fire-exposed RC beam-column connections with varying reinforcement development 8
lengths subjected to column removal. Fire safety journal, 99 38-48. 9
Liu, S., Xu, J. (2015). An experimental study on the physico-mechanical properties of two 10
post-high-temperature rocks. Engineering Geology, 185 63-70. 11
Liu, J., Li, B., Tian, W., Wu, X. (2018). Investigating and predicting permeability variation in 12
thermally cracked dry rocks. International Journal of Rock Mechanics and Mining Sciences, 103 13
77-88. 14
Mallet, C., Fortin, J., Guéguen, Y., Bouyer, F. (2013). Effective elastic properties of cracked 15
solids: an experimental investigation. International Journal of Fracture – Letters in Fracture and 16
Micromechanics, 182(2). 17
Mallet, C., Fortin, J., Guéguen, Y., Bouyer, F. (2014). Evolution of the crack network in glass 18
samples submitted to brittle creep conditions. International Journal of Fracture, 190(1-2) 111-124. 19
Mindeguia, J.C., Pimienta, P., Noumowé, A., Kanema, M. (2010). Temperature, pore pressure 20
and mass variation of concrete subjected to high temperature, experimental and numerical 21
discussion on spalling risk. Cement and Concrete Research, 40(3) 477-487. 22
Mollo, S., Heap, M. J., Dingwell, D. B., Hess, K. U., Iezzi, G., Masotta, M., Scarlatto, P., 23
Vinciguerra, S. (2013). Decarbonation and thermal microcracking under magmatic PTf CO2 24
conditions: the role of skarn substrata in promoting volcanic instability. Geophysical Journal 25
International, 195(1) 369-380. 26
Motra, H. B., Zertani, S. (2018). Influence of loading and heating processes on elastic 27
geomechanical properties of eclogites and granulites. Journal of rock mechanics and geotechnical 28
engineering, 10(1) 127-137. 29
Nasseri, M., Schubnel, A., Benson, P., Young, R. (2009). Common evolution of mechanical 30
and transport properties in thermally cracked westerly granite at elevated hydrostatic pressure. Rock 31
Physics and Natural Hazards, 166(5-7) 927-948. 32
NF-EN14066 (2013) Méthodes d’essai pour les pierres naturelles-Détermination de la 33
résistance au vieillissement accéléré par choc thermique, B10-630. 34
Novák, J., Kohoutková, A. (2017). Fire response of hybrid fiber reinforced concrete to high 35
temperature. Procedia Engineering, 172 784-790. 36
Panza, E., Agosta, F., Rustichelli, A., Vinciguerra, S. C., Ougier-Simonin, A., Dobbs, M., 37
Prosser, G. (2019). Meso-to-microscale fracture porosity in tight limestones, results of an integrated 38
field and laboratory study. Marine and Petroleum Geology, 103 581-595. 39
Samouh, H., Rozière, E., Loukili, A. (2019). Experimental and numerical study of the relative 40
humidity effect on drying shrinkage and cracking of self consolidating concrete. Cement and 41
concrete research, 115 519-529. 42
Sarker, P. K., Kelly, S., Yao, Z. (2014). Effect of fire exposure on cracking, spalling and 43
residual strength of fly ash geopolymer concrete. Materials and design, 63 584-592. 44
Schöpfer, M. P. J., Abe, S., Childs, C., Walsh, J. (2009). The impact of porosity and crack 45
density on the elastic, strength and friction of cohesive granular materials: Insights from DEM 46
modelling. International Journal of Rock Mechanics and Mining Sciences, 46 250-261. 47
Shah, A. H., Sharma, U. K., (2017). Fire resistance and spalling performance of confined 48
concrete columns. Construction and building materials, 156 161-174. 49
Thermally-induced cracks N. Belayachi et al.
20
Shapiro, S. M., O’Shea, D. C., Cummis, H. Z. (1967). Raman scattering study of the alpha-1
beta phase transition in quartz. Physical review letters, 19(361). 2
Walsh, J. (1965a). The effect of cracks in rocks on poisson's ratio. Journal of Geophysical 3
Research, 70(20) 5249-5257. 4
Walsh, J. (1965b). The effect of cracks on the uniaxial elastic compression of rocks. Journal 5
of Geophysical Research, 70(2) 399-411. 6
Wang, G., Yang, D., Zhao, Y., Kang, Z., Kang, Z., Zhao, J., Huang, X. (2019). Experimental 7
investigation on anisotropic permeability and its relationship with anisotropic thermal cracking of 8
oil shale under temperature and triaxial stress. Applied thermal engineering, 146 718-725. 9
Wang, XQ., Schubnel, A., Fortin, J., Guéguen, Y., Ge, H.K. (2013). Physical properties and 10
brittle strength of thermally cracked granite under confinement. Journal of Geophysical Research, 11
118 6099-6112. 12
Xing, Z., Beaucour, A.L., Hebert, R., Noumowe, A., Ledesert, B. (2011). Influence of the 13
nature of aggregates on the behaviour of concrete subjected to elevated temperature. Cement and 14
concrete research, 41(4) 392-402. 15
Xiong, M. X., Liew, J. R. (2016). Mechanical behaviour of ultra-high strength concrete at 16
elevated temperatures and fire resistance of ultra-high strength concrete filled steel tubes. Materials 17
& design, 104 414-427. 18
Yavuz, H., Altindag, R., Sarac, S., Ugur, I., Sengun, N. (2006). Estimating the index 19
properties of deteriorated carbonate rocks due to freeze-thaw and thermal shock weathering. 20
International Journal of Rock Mechanics and Mining Sciences, 43(5) 767-775. 21
Yermak, N., Pliya, P., Beaucour, A. L., Simon, A., Noumowé, A. (2017). Influence of steel 22
and/or polypropylene fibres on the behaviour of concrete at high temperature: Spalling, transfer and 23
mechanical properties. Construction and Building Materials, 132 240-250. 24
Zhang, Y., Sun, Q., Geng, J. (2017). Microstructural characterization of limestone exposed to 25
heat with XRD, SEM and TG-DSC. Materials characterization, 134 285-295. 26
Zhang, F., Zhao, J., Hu, D., Skoczylas, F., Shao, J. (2018). Laboratory investigation on 27
physical and mechanical properties of granite after heating and water-cooling treatment. Rock 28
Mechanics and Rock Engineering, 51(3) 677-694. 29
30
31
32
33
34
35
36
37
38
39
Related Documents