Thermally Conductive Polymer Composites for Electronic Packaging Applications by Muhammad Omer Khan A thesis submitted in conformity with the requirements for the degree of Master of Applied Science Mechanical and Industrial Engineering University of Toronto © Copyright by Muhammad Omer Khan 2012

Welcome message from author
This document is posted to help you gain knowledge. Please leave a comment to let me know what you think about it! Share it to your friends and learn new things together.
Transcript

Thermally Conductive Polymer Composites for Electronic Packaging Applications
by
Muhammad Omer Khan
A thesis submitted in conformity with the requirements for the degree of Master of Applied Science
Mechanical and Industrial Engineering University of Toronto
© Copyright by Muhammad Omer Khan 2012

ii
Thermally Conductive Polymer Composites for Electronic Packaging
Applications
Muhammad Omer Khan
Master of Applied Science
Mechanical and Industrial Engineering University of Toronto
2012
Abstract
Advancements in the semiconductor industry have lead to the miniaturization of components and
increased power densities, resulting in thermal management issues. In response to this shift,
finding multifunctional materials with excellent thermal conductivity and tailored electrical
properties are becoming increasingly important. For this research thesis, three different studies
were conducted to develop and characterize thermally conductive polymer composites. In the
first study, a PPS matrix was combined with different types of carbon-based fillers to determine
the effects of filler’s size, shape, and orientation on thermal conductivity. In the second study,
effects of adding ceramic- and carbon- based fillers on the tailored thermal and electrical
properties of composites were investigated. Lastly, the possibility of improving the thermal
conductivity by introducing and aligning polymer fibers in the composites was investigated. The
composites were characterized with respect to their physical, thermal, and electrical properties to
propose possibilities of application in the electronic packaging industries.

iii
Acknowledgments
I would like to thank my supervisors Prof. Hani Naguib and Prof. Francis Dawson for giving the
opportunity to conduct my MASc research in their laboratories. I really appreciated their
guidance and mentorship throughout the duration of the project.
I would like to thank my fellow colleagues in SAPL for helping me with my research whenever I
needed. I would like to especially thank Sunny Leung and Reza Rizvi for always being there
when I seemed to have roadblocks in my research. They were always very helpful with their
insightful input about my results. My other SAPL colleagues: Shahrzad Ghaffari, Eunji “nuna”
In, Janice Song, Aaron Guan, and Terence Lee and my undergraduate students: Ahmed
Mahmoud and Harvey Shi.
I would like to thank and dedicate this thesis to my parents; abbu and ammi. Without their
continuous love, encouragement, and advices, I would not have completed this thesis project. I
would like to thank my brothers for keeping me entertained with their company.
Last but not least, I thank Allah SWT for His countless blessings, guidance, and help.
iv
Table of Contents
Acknowledgments .......................................................................................................................... iii
Table of Contents ........................................................................................................................... iv
List of Tables ............................................................................................................................... viii
List of Figures ................................................................................................................................ ix
Chapter 1 Introduction .................................................................................................................... 1
1 Preamble ..................................................................................................................................... 1
1.1 Multifunctional Composite Materials for Electronic Packaging Applications ................... 2
1.2 Thesis Objectives ................................................................................................................ 3
1.3 Thesis Organization ............................................................................................................ 3
Chapter 2 Literature Survey and Theoretical Background ............................................................. 5
2 Introduction ................................................................................................................................ 5
2.1 Thermal Management and Electronic Packaging ............................................................... 5
2.2 Materials for Electronic Packaging ..................................................................................... 8
2.3 Thermally Conductive Polymeric Composites ................................................................... 9
2.3.1 Polymer Composites Embedded with Carbon-Based Particles ............................ 10
2.3.2 Polymer Composites Embedded with Hybrid Fillers ........................................... 16
2.3.3 Composites with Aligned Polymer Fibers ............................................................ 18
2.4 Theoretical Predictions for Thermal Conductivity of Composite Materials .................... 22
2.5 Interfacial Thermal Resistance ......................................................................................... 24
2.6 Summary of Guidelines .................................................................................................... 25
2.6.1 Material Selection ................................................................................................. 25
2.6.2 Matrix Materials .................................................................................................... 25

v
2.6.3 Filler Materials: ..................................................................................................... 26
2.6.4 Micromechanical Models Selection ...................................................................... 26
Chapter 3 Effects of Size and Structure of Micro- and Nano- Sized Carbon Fillers on Composite’s Properties ............................................................................................................ 28
3 Introduction .............................................................................................................................. 28
3.1 Experimental ..................................................................................................................... 28
3.1.1 Materials ............................................................................................................... 28
3.1.2 Sample Preparation ............................................................................................... 30
3.2 Sample Characterization ................................................................................................... 31
3.3 Results and Discussion ..................................................................................................... 32
3.3.1 Effects of Carbon Fillers on the Effective Thermal Conductivity ........................ 32
3.3.2 Effect of Carbon- Based Fillers on the Coefficient of Thermal Expansion .......... 35
3.3.3 Effect of Carbon- Based Fillers on Glass Transition Temperature ....................... 38
3.3.4 Effects of Carbon- Based Fillers on the Electrical Properties by Measuring Electrical Conductivity ......................................................................................... 40
3.3.5 Effect of Carbon- Based Fillers on the Dielectric Constant ................................. 42
3.3.6 Effect of Carbon- Based Fillers on the Mechanical Properties ............................. 44
3.4 Micromechanical Modeling of Thermal Conductivity ..................................................... 46
3.5 Summary ........................................................................................................................... 49
Chapter 4 Composites Embedded with Hybrid Fillers to Tailor Thermal and Electrical Properties .................................................................................................................................. 51
4 Introduction .............................................................................................................................. 51
4.1 Experimental ..................................................................................................................... 52
4.1.1 Materials ............................................................................................................... 52
4.1.2 Surface Modification ............................................................................................ 53
4.1.3 Composite Preparation .......................................................................................... 54
4.1.4 Test Specimen Preparation ................................................................................... 55
vi
4.2 Characterization ................................................................................................................ 55
4.2.1 Surface Modifications of hBN .............................................................................. 55
4.2.2 Composite Morphologies ...................................................................................... 56
4.2.3 Effective Thermal Conductivity ........................................................................... 56
4.2.4 Coefficient of Thermal Expansion ........................................................................ 56
4.2.5 Impedance ............................................................................................................. 56
4.3 Results and Discussion ..................................................................................................... 57
4.3.1 Surface Modification of hBN ................................................................................ 57
4.3.2 Effect of Hybrid Fillers on the PMC’s Effective Thermal Conductivity .............. 58
4.3.3 Effect of Hybrid Fillers on the PMC’s Coefficient of Thermal Expansion .......... 62
4.3.4 Effect of Hybrid Fillers on the PMC’s Impedance ............................................... 64
4.3.5 Dielectric Constant ................................................................................................ 68
4.4 Micromechanical Modeling of Thermal Conductivity ..................................................... 70
4.5 Possibility of Replacing Kapton with the Polymer Composites ....................................... 73
4.6 Summary ........................................................................................................................... 74
Chapter 5 Composites with Aligned Polymer Fibers ................................................................... 76
5 Introduction .............................................................................................................................. 76
5.1 Experimental ..................................................................................................................... 76
5.1.1 Materials ............................................................................................................... 76
5.1.2 Sample Preparation ............................................................................................... 77
5.1.3 Characterization .................................................................................................... 79
5.2 Results and Discussion ..................................................................................................... 80
5.2.1 Effect of Temperature and Orientation on the Alignment of Polymer Fibers ...... 80
5.2.2 Effect of GNP Content on the Effective Thermal Conductivity of the LCP/GNP Composites Fabricated by Aligning Polymer Fibers ........................... 84
5.2.3 Effect of Alignment of Polymer Fibers on the Impedance of LCP/GNP Composites ............................................................................................................ 87

vii
5.2.4 Effect of Alignment of Polymer Fibers on the Dielectric Constant of LCP/GNP Composites .......................................................................................... 88
5.3 Summary ........................................................................................................................... 89
Chapter 6 Conclusions and Recommendations ............................................................................. 91
6 Summary .................................................................................................................................. 91
6.1 Recommendations ............................................................................................................. 94
Bibliography ................................................................................................................................. 96

viii
List of Tables
Table 2-1: General Characteristics of Polymers used in Electronic Packaging .............................. 9
Table 3-1: Physical Properties of polyphenylene sulfide ............................................................. 29
Table 3-2: Physical Properties of carbon fiber, multi-wall nanotubes, and graphene nanoplatelets
............................................................................................................................................... 29
Table 3-3: A summary of the compositions of PPS filled with micro- and nano- sized carbon
fillers ..................................................................................................................................... 31
Table 3-4: Schematics of the samples used for characterization of PPS embedded with micro-
and nano- sized carbon fillers ............................................................................................... 31
Table 3-5: Percolation threshold calculated by fitting a curve to the experimental data .............. 42
Table 4-1: Physical properties of hBNPTX60 .............................................................................. 53
Table 4-2: Compositions of PPS-hBN-CF composites ................................................................. 54
Table 4-3: Compositions of PPS-hBN-MWNT composites ......................................................... 54
Table 4-4: Compositions of PPS-hBN-GNP composites .............................................................. 55
Table 4-5: Fractional loss in mass of hBN particles upon heating to 900 ˚C ............................... 58
Table 5-1: Physical Properties of LCP .......................................................................................... 77

ix
List of Figures
Figure 2-1: Examples of packaging of various electronic devices [12] .......................................... 7
Figure 2-2: Schematic of fillers forming conductive pathway in polymer matrix ....................... 12
Figure 2-3: Schematic for SWNT and MWNT [19] ..................................................................... 13
Figure 2-4: Discontinuous Carbon Fibers [30] ............................................................................. 14
Figure 2-5: Graphene Nanoplatelets [36] ..................................................................................... 15
Figure 2-6: Hexagonal Boron Nitride Spheres [64] ...................................................................... 18
Figure 2-7: Representation of structural differences between liquid crystal polymers and
conventional semi-crystalline polymers [69] ........................................................................ 21
Figure 3-1: Thermal Conductivity of Carbon-Based Filler reinforced PPS composites .............. 34
Figure 3-2: SEM micrographs of PPS/CF composite with 20 wt.% CF at (a) 100X; (b) 2500X;
and (c) 10000X ..................................................................................................................... 35
Figure 3-3: Coefficient of thermal expansion of composites at 50°C .......................................... 37
Figure 3-4: Coefficient of thermal expansion of composites at 150°C ........................................ 38
Figure 3-5: Tg of PPS filled with micro- and nano- sized carbon fillers ...................................... 39
Figure 3-6: SEM micrographs of PPS/MWNT composite with 20 wt.% MWNT at (a) 5000X (b)
20000X and (c) 50000X ........................................................................................................ 41
Figure 3-7: Change in electrical conductivity as the filler conent increases for PPS embedded
with carbon based fillers ....................................................................................................... 41
Figure 3-8: Effect of carbon-based fillers on the dielectric constant at 3×10⁵ Hz ........................ 43
Figure 3-9: SEM micrograph of PPS/GNP nanocomposite with 20 wt% GNP at 50X, 2000X, and
13,000X ................................................................................................................................. 45
Figure 3-10: Compressive Modulus of PPS filled with micro- and nano- sized carbon fillers .... 45
Figure 3-11: Theoretical predictions for thermal conductivity compared to experimental results
for PPS/CF composites ......................................................................................................... 47
Figure 3-12: Theoretical Predictions for thermal conductivity compared to experimental results
for PPS/MWNT composites ................................................................................................. 48
Figure 3-13: Theoretical predictions for thermal conductivity compared to experimental results
for PPS/GNP composites ...................................................................................................... 49
Figure 4-1: Hybrid fillers in polymer matrix ................................................................................ 52
Figure 4-2: Effect of using a silane-based coupling agent on PPS-hBN composites ................... 58

x
Figure 4-3: Effects of hybrid filler compositions on PMC's keff ................................................... 60
Figure 4-4: SEM Micrographs of (a) PPS-PTX60 with 33.3 vol.% hBN ..................................... 61
Figure 4-5: SEM Micrographs of PPS-hBN-CF composites with 33.3 vol.% hBNPTX60-CF
hybrid fillers with hBNPTX60-to-CF ratios of (a) 27:6.7; (b) 25:8.3; and (c) 22:11 ........... 61
Figure 4-6: SEM Micrographs of PPS-hBN-MWNT Composites with 33.3 vol.% hBNPTX60-
MWNT Hybrid Fillers with hBNPTX60-to-MWNT ratios of (a) 27:6.7 and (b) 25:8.3 ..... 62
Figure 4-7: Total surface area of secondary fillers (filler content = 33.3 vol.%) ......................... 62
Figure 4-8: Effects of hybrid filler composition on PMC's CTE (below the glass transition
temperature of PPS) .............................................................................................................. 63
Figure 4-9: SEM Micrographs of PPS-hBN-GNP Composites with 33.3 vol.% hBNPTX60-GNP
Hybrid Fillers with hBNPTX60-to-GNP ratios of (a) 27:6.7; (b) 25:8.3; and (c) 22:11 ...... 64
Figure 4-10: Effects of hybrid filler compositions on PMC's Impedance for PPS-hBNPTX60-CF
composites ............................................................................................................................. 66
Figure 4-11: Effects of hybrid filler compositions on PMC's Impedance for PPS-hBNPTX60-
MWNT composites ............................................................................................................... 67
Figure 4-12: Effects of hybrid filler compositions on PMC's Impedance for PPS-hBNPTX60-GNP
composites ............................................................................................................................. 68
Figure 4-13: Dielectric constant of PPS-based hybrid fillers ....................................................... 69
Figure 4-14: Theoretical predictions for thermal conductivity compared to experimental results
for PPS-hBN-CF composites ................................................................................................ 71
Figure 4-15: Theoretical predictions for thermal conductivity compared to experimental results
for PPS-hBN-MWNT composites ........................................................................................ 72
Figure 4-16: Theoretical predictions for thermal conductivity compared to experimental results
for PPS-hBN-GNP composites ............................................................................................. 73
Figure 4-17: The maximum temperature of the heat source measured for Aluminum heat sink
with a. no base plate b. with Kapton base plate and c) with PPS-33vol.% hBN .................. 74
Figure 4-18: The maximum temperature of the heat source measured for Aluminum heat sink
with a. PPS-33 vol.% (hBN:MWNT=3:1), b. PPS-33 vol.% (hBN:CF = 2:1), and c. PPS-33
vol.% (hBN:CF = 3:1) base plates ........................................................................................ 74
Figure 5-1: Fiber drawing system ................................................................................................. 78
Figure 5-2: Effect of Compression Sintering and Compression Moldingon the Thermal
Conductivity .......................................................................................................................... 81

xi
Figure 5-3: SEMs of 1 wt.% GNP/LCP composites filled with aligned fibers that were molten-
compression molded; (a) 100X and (b) 1000X ..................................................................... 82
Figure 5-4: SEMs of 1 wt.% GNP/LCP composites filled with randomly oriented fibers that were
molten-compression molded; (a) 100X and (b) 1000X ........................................................ 82
Figure 5-5: SEMs of 1 wt.% GNP/LCP composites filled with aligned fibers that were sintered-
compression molded; (a) 100X and (b) 1000X ..................................................................... 83
Figure 5-6: SEMs of 1 wt.% GNP/LCP composites filled with randomly oriented fibers that were
sintered-compression molded; (a) 100X and (b) 1000X ....................................................... 83
Figure 5-7: Comparison of thermal conductivity of LCP/GNP composites fabricated by
conventional method and by the polymer fiber alignment method ...................................... 85
Figure 5-8: SEM micrographs of neat LCP with aligned polymer fibers fabricated by
compression molding method; (a) 100X and (b) 1000X ...................................................... 86
Figure 5-9: SEMs of 1 wt.% GNP/LCP composites fabricated using the conventional method; (a)
100X and (b) 1000X ............................................................................................................. 86
Figure 5-10: SEM micrographs of 5 wt.% GNP/LCP composites with aligned polymer fibers
fabricated by compression molding method; (a) 100X and (b) 1000X ................................ 86
Figure 5-11: Impedance of LCP/GNP Composites Fabricated by Alignment of Polymer Fibers 88
Figure 5-12: The change in dielectric constant of LCP/GNP composites as a function of filler
content ................................................................................................................................... 89

1
Chapter 1 Introduction
1 Preamble
The continuous increase in power outputs along with the reduction of overall size of
components in the computer, microelectronics, automotive and aerospace industries have
resulted in the need for materials with multifunctional properties. These multifunctional
materials are desired to have thermal, electrical, and mechanical properties that are suitable
for the application-specific electronic components to provide higher efficiency without
compromising their performance.
The high power density of electronic components results in rapid heat generation. Therefore,
it is necessary to dissipate heat away from the components sufficiently fast enough in order
to keep their temperatures below critical values and prevent the device from permanent
damage. Metal-based heat sinks and heat spreaders have conventionally been used to
dissipate the excess heat and maintain the device's temperature to an acceptable value. Due
to metals' high mass- density, their uses are limited to heat sink applications for electronic
components. Many portable systems such as laptop computers, handheld telephones, and
avionics require low mass-density to minimize the damaging stresses resulting from shock
loads during shipping and handling. In addition, materials with their coefficients of thermal
expansion similar to those of ceramic substrates and semiconductors are favorable to
minimize the thermo-mechanical stress. In order to reduce the weight of the high power
density electronic devices, it is desired that the entire packaging of the device be made out of
heat dissipating material eliminating the need for heat sinks. Conventional metal-based
materials such as aluminum and copper alloys do not possess all the optimal properties
required for electronic packaging application [1].
In this context, the design and fabrication of multifunctional materials with 1) relatively low
mass-density; 2) coefficient of thermal expansion similar to metals; 3) lower electrical
conductivity than most metals; 4) higher thermal conductivity than polymers; and 5) high
compressive moduli are needed. These materials can be used to fabricate not only heat sinks

2
but also the entire casing and packaging of the high power density electronic devices. Such
materials would serve as a mean to promote heat dissipation as well as to reduce the weight
of the electronic devices.
1.1 Multifunctional Composite Materials for Electronic Packaging Applications
In order to tailor the aforementioned multifunctional properties of the material, one potential
direction is to develop composite materials that possess combined properties of two or more
materials. Composite materials have traditionally been used for structural applications.
Currently, ongoing research is being conducted on multifunctional composites that can be
used in thermal management and electronic packaging applications. For these applications,
high thermal conductivity is the most important objective when selecting materials. Most
metal matrix composites (MMCs) such as carbon fiber-reinforced aluminum or copper,
silicon carbide particle-reinforced aluminum, and diamond particle-reinforced aluminum do
not show substantial improvement in thermal conductivity. There are exceptions, such as,
vapor grown carbon fiber (VGCF) reinforced aluminum matrix composite exhibited a
thermal conductivity as high as 642 W/mK with a density of 2.44 g/cc [2]. However, a very
common disadvantage of all MMCs, including VGCF reinforced aluminum, is that they are
electrically conductive, which may not be suitable for many electronic packaging
applications due to the possibility of having short-circuits. Research has also been conducted
on a second type of composites, which are polymer matrix composites (PMCs), where
polymers are embedded with fillers. PMCs have a number of advantages, including their low
mass-density and the ability to be injection molded into complex shapes with tight
tolerances, eliminating the need for further machining that are often required with metal-cast
parts. Due to their multifunctionality, which includes enhanced thermal conductivity and
mechanical properties, these composites are gaining traction in a number of markets such as
aerospace, automotive, microelectronics, and thermal management industries [3-6]. These
multifunctional polymeric composites may result in materials for electronic packaging
having high thermal conductivities, coefficient of thermal expansion similar to that of
metals, light weight, high strength, increased reliability, and good manufacturability.
3
1.2 Thesis Objectives
The goals for multifunctional electronic packaging materials are that they should be light-
weight, injection moldable into complex shapes, and should have tailored electrical
conductivity. Polymers have properties that may help in achieving these goals; however,
they are poor thermal conductors, which is the required fundamental property for electronic
packaging application. One of the common methods to fabricate materials with
multifunctional properties is by having a composite of two or more materials. For the
electronic packaging application, a polymer matrix may be filled with conductive fillers to
obtain all the above mentioned multifunctional properties. A continuous conductive network
of particles throughout the matrix material can improve the effective thermal conductivity of
a polymer composite while keeping the intrinsic properties of a polymer.
For this research thesis, a number of different hypotheses were evaluated with the goal to
improve the effective thermal conductivity of the multifunctional composite material while
keeping the intrinsic properties of the polymer matrix. The main objectives of this research
thesis are summarized as follows:
1. To fabricate and characterize thermally conductive polymer composites with the
maximum possible thermal conductivity and minimum coefficient of thermal
expansion while keeping all the other intrinsic properties of polymers.
2. To fabricate and characterize thermally conductive polymer composites with tailored
electrical conductivity for application-specific electronic components.
3. To investigate the possibility of fabricating thermally conductive polymer
composites by introducing polymer fibers with no or minimum filler content.
1.3 Thesis Organization
The body of this thesis is separated into five chapters. A background and literature review is
presented in Chapter 2 on the following topics: thermal management and electronic
packaging, materials for electronic packaging, thermally conductive polymer composite and

4
common models to predict the thermal conductivity of composites. Chapters 3 presents the
study on fabrication and characterization of polymers embedded with different size and
structure of carbon-based fillers to improve thermal properties. Chapter 4 presents the study
on fabrication and characterization of polymer embedded with carbon- and ceramic- based
hybrid fillers in order to improve thermal as well as tailor electrical properties for specific
applications. Chapter 5 discusses the possibility of improving thermal properties of
composites by aligning polymer fibers embedded with minimum or no filler content. This
chapter also includes a method for fabricating LCP based composites by compounding fibers
with a draw ratio of 50 and an analysis of the properties of the resulting material. Finally, the
thesis concludes with an overview of this research and future recommendations.

5
Chapter 2 Literature Survey and Theoretical Background
2 Introduction
Since 1930’s, polymers have made significant advances in the markets of metals, wood,
glass, paper, leather, and vulcanized rubber that were conventionally used in most household
goods and industrial components as well as creating new markets of their own. The main
reason behind the widespread use of polymers is their unique set of properties such as
toughness, light weight, low cost, and ease of processing and fabrication. Even though
polymers are not the panacea of industry’s material problems, their unique set of properties
have made them one of the important classes of materials finding their way into widespread
use in the electronic industries [7].
The most common application of polymers in electrical and electronic devices is for
electrical insulation, which prevents the loss of signal currents and confines them to the
desired paths. These electrical insulation systems may exist in liquid, solid or gas form, and
the type of material used determines the life span of the device. Polymeric materials have
started to also perform structural roles by supporting the circuit physically, and providing
environmental protection from moisture, heat, and radiation to sensitive electronic devices.
The continuing improvements in the multifunctional properties of polymers over the years
have made them even more important to the electrical industry by extending their useful
range [7].
2.1 Thermal Management and Electronic Packaging Moore’s Law, the famous prediction that states that the number of transistors on a chip will
double about every two years, has held for four decades. The emerging three-dimensional
chip (3D) architecture [8] has offered a new opportunity to continue the CMOS
(complementary metal-oxide-semiconductor) performance trends for the next decade. It not
only serves as a promising solution to mitigate the interconnect problem in modern

6
microprocessor designs, but also enable much higher memory bandwidth for future 3D
microprocessors. Recent progress in the fabrication of high-aspect-ratio vertical
interconnects, called through-silicon vias (TSVs) [9-11], have opened new avenues for high
density area array interconnects between stacked processor and memory chips. Through the
integration of a very large System on a Chip (SoC) in multiple tiers, the average distance
between system components is reduced, leading to improved performance. However, the
surging performance and functions on a chip has come with a hidden cost – heat. The
continuous increase in component densities being packed onto a chip requires more power to
run it. A large portion of that power turns into heat, leading to the fast heat up of the chips, if
not properly cooled. Overheating results in hardware failure reducing chips’ reliability,
potentially leading to computer crashes, mangled files, graphical glitches, and even
permanent damage. In other words, the future of 3D Integrated Circuits crucially hinges on
the development of practical solutions for heat removal.
As it is known, the trend in packaging electronic systems and subsystems has been to reduce
size and increase performance. Higher levels of integration in semi-conductors and the
increased usage of hybrids and multichip modules (MCMs) are some examples. System-in-
Package (SiP) and few chip package (FCP) are also examples of high-density multichip
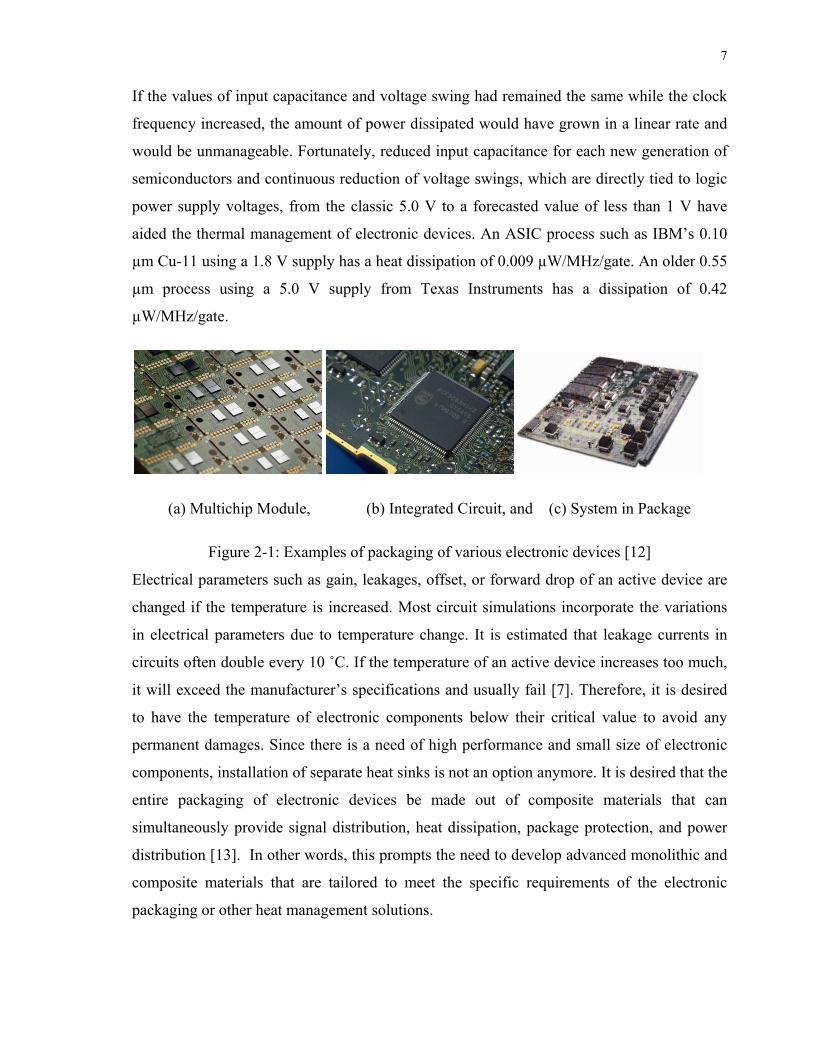
packaging. Few examples of packaging of electronic devices, components, and systems are
shown in Figure 2-1. The placement of more functions in a smaller package has an inevitable
result of higher heat densities, which requires that high priority be given to thermal
management in their design to maintain system performance and reliability. As clock rates
increase every year, the power dissipated in the semiconductors during switching is
increasing at a linear rate proportional to frequency.
.......................... 2-1
where,
C = input capacitance in farads
V = peak-to-peak voltage swing of signal in volts
f = switching frequency in hertz
7
If the values of input capacitance and voltage swing had remained the same while the clock
frequency increased, the amount of power dissipated would have grown in a linear rate and
would be unmanageable. Fortunately, reduced input capacitance for each new generation of
semiconductors and continuous reduction of voltage swings, which are directly tied to logic
power supply voltages, from the classic 5.0 V to a forecasted value of less than 1 V have
aided the thermal management of electronic devices. An ASIC process such as IBM’s 0.10
µm Cu-11 using a 1.8 V supply has a heat dissipation of 0.009 µW/MHz/gate. An older 0.55
µm process using a 5.0 V supply from Texas Instruments has a dissipation of 0.42
µW/MHz/gate.
(a) Multichip Module, (b) Integrated Circuit, and (c) System in Package
Figure 2-1: Examples of packaging of various electronic devices [12]
Electrical parameters such as gain, leakages, offset, or forward drop of an active device are
changed if the temperature is increased. Most circuit simulations incorporate the variations
in electrical parameters due to temperature change. It is estimated that leakage currents in
circuits often double every 10 ˚C. If the temperature of an active device increases too much,
it will exceed the manufacturer’s specifications and usually fail [7]. Therefore, it is desired
to have the temperature of electronic components below their critical value to avoid any
permanent damages. Since there is a need of high performance and small size of electronic
components, installation of separate heat sinks is not an option anymore. It is desired that the
entire packaging of electronic devices be made out of composite materials that can
simultaneously provide signal distribution, heat dissipation, package protection, and power
distribution [13]. In other words, this prompts the need to develop advanced monolithic and
composite materials that are tailored to meet the specific requirements of the electronic
packaging or other heat management solutions.
8
2.2 Materials for Electronic Packaging
The continuing increase in electronic packaging density has resulted in a need for materials
with high thermal conductivities. Furthermore, low mass-density is desirable in many
applications, including portable systems such as laptop computers, hand-held telephones,
and avionics. Reducing weight also minimizes potentially damaging stresses resulting from
shock loads that can occur during shipping and from other causes. Low cost is also a key
consideration. As traditional materials used in electronic packaging do not meet all of these
requirements, new multifunctional materials have been and are continuing to be developed
[1].
The multifunctional materials are desired to have thermal, electrical, and mechanical
properties that are suitable for the application-specific components. The high power density
of electronic components results in rapid heat generation. Metal-based heat sinks and heat
spreaders have conventionally been used to dissipate the excess heat and maintain the
device’s temperature to an acceptable value. Conventional materials such as aluminum and
copper alloys do not possess all the optimal properties such as low electrical conductivity,
ease of fabrication, and low mass-density required for electronic packaging [1]. In this
context, the design and fabrication of multifunctional materials with relatively low mass-
density, coefficient of thermal expansion similar to metals, lower electrical conductivity than
most metals, and higher thermal conductivity than polymers. These materials can be used to
fabricate not only heat sinks but also the entire electronic casing and packaging. They can
promote heat dissipation as well as reduce the weight of the electronic device. In order to
tailor the aforementioned multifunctional properties of the material, one potential way is to
develop polymer-matrix composites with functional fillers that will help improve polymers
properties.
The electronic packaging industry has been making use of composite material, defined as
two or more materials bonded together. These materials have traditionally been used for
structural applications such as printed circuit boards (PCBs) and encapsulants. However,
there is a potential of creating novel materials with unique set of desired functional
properties by mixing two or more constituents. Polymers filled with thermally conductive
particles that provide aforementioned multifunctional properties have been used in electronic
9
packaging for device encapsulation. Encapsulation of electronic devices protects them from
adverse environment and increases their long-term reliability. For example, polymer-matrix
composites (PMCs) in the form of E-glass fiber-reinforced polymer printed circuit board
(PCBs) are well-established packaging materials [1]. Traditionally, epoxy-based
encapsulants are filled with silica. Silica has a low thermal conductivity of 1.5 W/mK,
hence, these encapsulants show a very poor thermal performance. As the heat dissipation
requirements increase, improved thermally conducting packaging composite materials are
required [14].
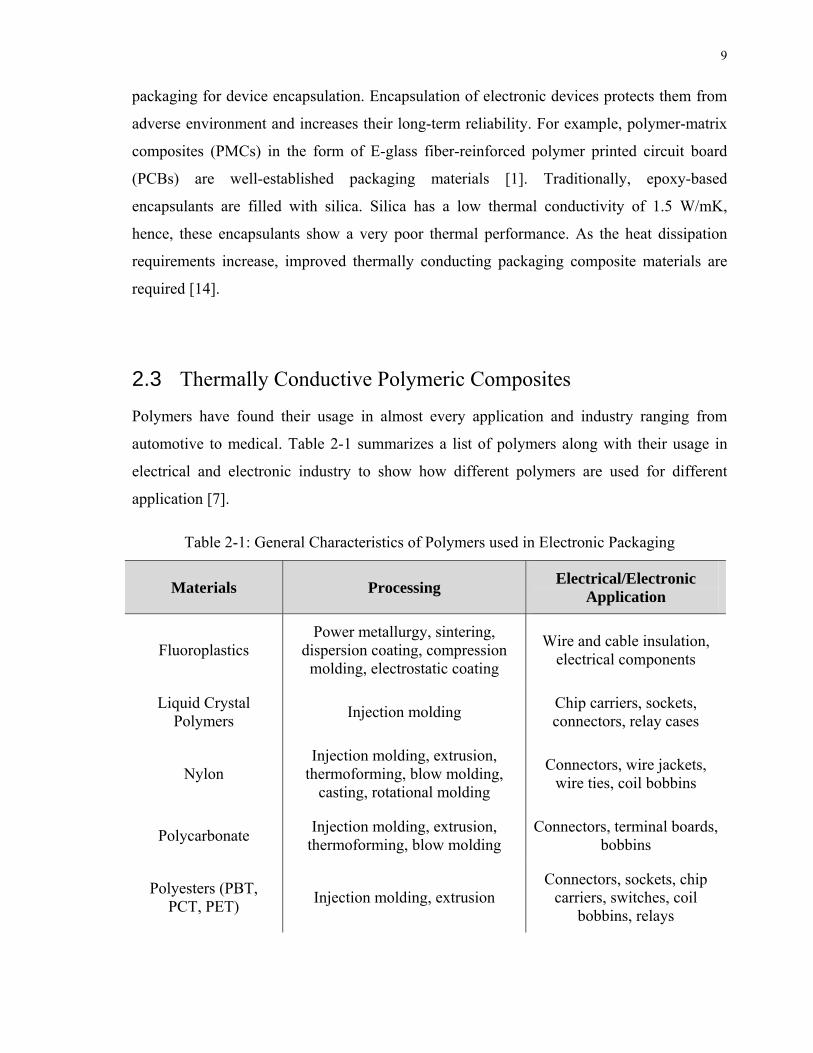
2.3 Thermally Conductive Polymeric Composites
Polymers have found their usage in almost every application and industry ranging from
automotive to medical. Table 2-1 summarizes a list of polymers along with their usage in
electrical and electronic industry to show how different polymers are used for different
application [7].
Table 2-1: General Characteristics of Polymers used in Electronic Packaging
Materials Processing Electrical/Electronic
Application
Fluoroplastics Power metallurgy, sintering,
dispersion coating, compression molding, electrostatic coating
Wire and cable insulation, electrical components
Liquid Crystal Polymers
Injection molding Chip carriers, sockets, connectors, relay cases
Nylon Injection molding, extrusion,
thermoforming, blow molding, casting, rotational molding
Connectors, wire jackets, wire ties, coil bobbins
Polycarbonate Injection molding, extrusion,
thermoforming, blow molding Connectors, terminal boards,
bobbins
Polyesters (PBT, PCT, PET)
Injection molding, extrusion Connectors, sockets, chip
carriers, switches, coil bobbins, relays

10
Polyimides Injection molding, casting,
compression molding
Insulation for electric motors, magnet wire, flat cable, integrated-circuit
applications
Polyphenylene sulfide Injection molding Connectors
Even though the above mentioned polymers are being used for electrical and electronic
devices, they all lack in their ability to conduct heat, a property fundamentally required for
electronic packaging application. Polymers often lack in areas where material’s superior
mechanical, thermal and electrical properties are desired. To overcome these obstacles,
polymers are filled with particles that enable them to fulfill the application-specific
requirements while keeping their low density, easy manufacturability, and low cost.
In this context, thermally conductive but electrically insulating polymer composites have
become increasingly important for the industry. Various kinds of fillers, such as metal, metal
oxide, carbon black, carbon fiber, carbon nanotube, ceramic, etc. have been studied
extensively to prepare thermally conductive polymer composites. Previous studies revealed
that the effective thermal conductivities (keff) possible with polymer matrix composites
(PMCs) are not as high as those of the other advanced materials, such as metal matrix
composites or ceramic matrix composites [15]. However, they have a number of advantages,
including ease of fabrication, low density, and, for some materials, relatively low material
costs. Therefore, a technological breakthrough that allows the fabrication of PMCs with
dramatic improvement in keff, without the compromise of the electrical insulating property of
polymers, will be vital to the technological advancement in the field of heat management for
electrical and electronic devices.
2.3.1 Polymer Composites Embedded with Carbon-Based Particles
Metal matrix composites (MMC) such as carbon fiber-reinforced aluminum or copper,
silicon carbide particle-reinforced aluminum, and diamond particle-reinforced aluminum do
not show substantial improvement in thermal conductivity. However, vapor grown carbon
fiber (VGCF) reinforced aluminum matrix composite exhibited a thermal conductivity as
high as 642 W/mK with a density of 2.44 g/cc [2]. A common disadvantage of all MMCs is

11
that they are electrically conductive, which may not be suitable for many electronic
packaging applications. Research has also been conducted on a second type of composites
i.e. polymer matrix composite (PMC) where polymers are embedded with fillers. Micro- and
Nano- sized carbon fillers, including multi-walled carbon nanotubes (MWNTs), carbon
fibers (CFs), and graphene nanoplatelets (GNPs) have been embedded in polymers to
develop multifunctional polymer composites [3]. Carbon filler-reinforced polymer
composites have a number of advantages, including their low density and the ability to be
injection molded into complex shapes with tight tolerances, eliminating the need for further
machining that are often required with metal-cast parts. Together with the added
multifunctionality, such as enhanced thermal conductivity as well as mechanical properties,
these composites are gaining traction in a number of markets such as aerospace, automotive,
and microelectronics industries for thermal management and electronic packaging
applications [3-5]. These multifunctional polymeric composites may result in materials for
electronic packaging having high thermal conductivities, coefficient of thermal expansion
similar to that of metals, light weight, high strength, increased reliability, and, above all,
good manufacturability. The commonly used reinforcing carbon-based fillers in these
composites are Multi Walled Carbon Nanotubes (MWNTs), Carbon Fibers (CF) and
Graphene Nanoplatelets (GNPs) because of their extremely good mechanical, thermal and
electrical properties. Figure 2-2 shows a schematic of how thermally conductive fillers may
create conductive pathways in the polymer matrix.

2.3
Ijim
pol
et a
The
cap
ther
nan
(SW
sea
con
betw
Figure 2
3.1.1 M
ma et al. [16
ymer nanoc
al. [17] in 1
e walls of th
pped at each
rmal prope
nocomposite
WNTs) and
amlessly wr
ncentrically n
ween SWNT
2-2: Schemat
Multi Walle
6] first report
omposites u
994. CNTs
hese tubes a
h end. CNTs
erties that
s [18]. The
multiwall n
rapped into
nested nano
Ts and MWN
tic of fillers
ed Carbon N
ted fabricati
using carbon
are long ho
are hexagon
s exhibit ex
make them
two main ty
nanotubes (M
o cylindrica
otubes, pleas
NTs.
forming con
Nanotubes
on of carbon
nanotubes a
ollow tubes w
al carbon in
xceptional co
m potentia
ypes of carbo
MWNTs). S
al tube wh
e see Figure
nductive path
s
n nanotubes
as filler mat
with a very
n shape (gra
ombination
al fillers f
on nanotube
WNTs cons
hereas MWN
e 2-3 below
hway in poly
(CNTs) in
terial were r
high length
aphite structu
of mechanic
for multifu
es are single
sist of a sin
NTs compr
w for a schem
ymer matrix
1991 where
eported by A
h to diameter
ure) and are
cal, electrica
unctional po
e-walled nan
ngle graphite
rise an arr
matic of diff
12
as first
Ajayan
r ratio.
e often
al, and
olymer
notubes
e sheet
ray of
ference

13
Figure 2-3: Schematic for SWNT and MWNT [19]
The structure of CNTs, i.e. the helical arrangement of the carbon atoms in hexagonal arrays
on their surface honeycomb lattices, gives rise to their unique properties. For example, the
topology, i.e. the closed nature of individual nanotube shells, determines the unique physical
properties of CNTs. Their structure is remarkably different from graphite because when
individual layers are closed on to themselves, certain aspects of the anisotropic properties of
graphite disappear [20]. Carbon nanotubes also have very high stiffness values as well as
very high thermal and electrical conductivities only along the axial direction. Therefore, the
introduction of a network of these nanofillers in polymers can convert the thermally and
electrically insulating materials into conductive materials [21]. For example, with the
extremely high thermal conductivity (k) of MWNTs (i.e., 3000 W/mK) [22], an earlier
theoretical work showed MWNT-reinforced polymer composites exhibited significant
improvement (i.e. about 5000% increase) in k over the neat polymers [23]. However, a
number of experimental studies reported that the promotion in k was less than a factor of two
for low loading (e.g., 1 wt.%) of CNTs; some other studies revealed no enhancement or even
a reduction in k relative to the neat polymer [24, 25]. In contrast, the dramatic improvements
(i.e. by 10 orders of magnitude) in electrical conductivity (σ) by the formation of conductive
networks of CNTs at even low loadings (e.g. < 1 wt. %) were routinely observed among
different researchers [26-27]. The significantly different trends for electrical and thermal
conductivity of CNT based composites suggest that two different phenomena are responsible
for the change in k and σ in CNT based composites.

14
Theoretical and experimental results have shown that the MWNTs have a high elastic
modulus of about 1TP; thermal conductivity of 3000 W/mK and an electrical conductivity
greater than 100 S/cm. Researchers have shown that the addition of MWNTs in composites
assists the transfer of heat by phonon carriers, which are heat follow through lattice
vibration, leading to a significant improvement in the value of k [28]. However, due to a
relatively high thermal interfacial resistance, the thermal conductivity (k) of the composite is
usually much lower than the theoretical value of the bulk material because k is also governed
by the interfacial thermal resistance. On the contrary, the electrical conductivity of the
composites reinforced with MWNTs increased by 10 orders of magnitude by forming
conductive networks of MWNTs [27], as reported by other researchers.
2.3.1.2 Carbon Fibers
Most carbon fibers have a k value close to that of copper i.e. ~ 400 W/mK. However, there
are commercially available carbon fibers that have a k of more than twice that of copper. In
addition to their high k, CFs have a relatively low mass density of 2100 kg/m3. They are also
potentially useful for packaging since they have elastic moduli as high as 965 GPa which is
more than an order of magnitude greater than that of aluminum. CFs having such prospective
properties are currently being used with polymers to form composites that can be injection
molded and have extremely high thermal conductivities [1]. Previous studies had shown
significant increase of k in polymer composites reinforced with CFs. For example, Kim et al.
[29] reported an increase from 0.29 W/mK to 3.1 W/mK in k for a Polyetheretherketone
(PEEK)-CF composite with the addition of 40 vol.% of CFs due to the increased contact
among microfibers in the presence of nanofibers.
Figure 2-4: Discontinuous Carbon Fibers [30]

15
2.3.1.3 Graphene Nanoplatelets
A monolayer of carbon atoms tightly packed into a two-dimensional honeycomb lattice is
referred to as Graphene. Graphene is a basic building block for graphitic materials of all
other dimensionalities; for example, they can be wrapped up into 0D buckyballs, rolled into
a 1D nanotube or stacked into 3D graphite [31]. Ghosh et al. [32] suggested that if equal
phonon velocities in CNTs and graphene are assumed, the k of graphene should be larger
than that in CNTs. The reported k of CNTs by different researchers would give the
graphene’s lower bound k estimate of ~4100-4800 W/mK. Based on the theoretical
calculations, the phonon group velocity in graphene is higher than that in CNTs, which leads
to a larger k. The extremely high thermal conductivity of graphene makes it a potential
candidate for thermal management applications by using it as fillers in polymer composites
that can be used as heat sinks. Multilayers of graphene sheets are much cheaper and are
expected to retain their heat conducting property. There have been studies conducted to
explore the behavior of k in polymer composites by adding graphene. The k of
Polypropylene (PP) showed an increase of 480% i.e. from 0.25 W/mK to 1.2 W/mK [33] by
adding up to 25 vol.% graphene. Reinforcing Nylon 6 with 20 vol.% graphene increased the
k from 0.3 W/mK to 4.1 W/mK [34]. Similar trends showing a dramatic increase in k for
polymer composites due to the addition of graphene were observed by Kim et. al. [35].
Figure 2-5: Graphene Nanoplatelets [36]

16
2.3.2 Polymer Composites Embedded with Hybrid Fillers
PMCs with high keff can be obtained by dispersing highly thermally conductive fillers in the
polymer matrix. Bigg et. al. [37] indicated that there is no additional improvement when the
ratio of filler’s thermal conductivity to matrix’s thermal conductivity is over 100 times.
Therefore, for fillers with thermal conductivities that are equal to or greater than 100 times
of the polymeric matrices’ thermal conductivities, the filler’s volume fraction may become a
critical factor governing the composite’s thermal conductivity. In general, composites with
low loadings of filler particles would allow the heat to flow uniformly through them since all
particles are well dispersed, but such low filler content limits the interconnection among the
filler particles. Increasing the filler content promotes the formation of preferential heat
conducting paths for dissipating heat through the composite [38-39].
Extensive studies have been conducted to promote PMC’s keff by different kinds of fillers.
For example, metal- [40-43], ceramics- [44-49], and carbon-based fillers [33, 50-52] have
been applied to fabricate PMCs. keff of PMCs fabricated in these studies were in the range of
0.5 W/mK to 2.0 W/mK when the filler content was lower than 33.3 vol.%. Although PMCs
with keff (i.e., 5.0 W/mK to 32.5 W/mK) were reported in literatures [43-45], it required
either the addition of 60-90 vol.% of thermally conductive fillers or the uses of electrically
conductive metal fillers. These would either compromise the processibility of the composites
or the electrical insulating property of PMCs, which are two key benefits, offered by PMCs
in heat management applications. In addition to filler contents, previous studies also
suggested that the development of thermally conductive networks hinges on the sizes and
shapes [39, 53], the aspect ratios [53-54], as well as the spatial and geometric arrangements
[55] of the fillers. Experimental studies revealed that smaller filler particles would result in
lower keff because of a larger polymer-filler interfacial area, causing phonon scattering and
hindering phonon transport [56]. Furthermore, fillers with high aspect ratio would enhance
the formation of heat conductive networks [40-41], promoting the composites’ thermal
conductivities.
Various studies on thermally conductive PMCs filled with ceramic fillers had incorporated
silicon carbide (SiC) [29], aluminum nitride (AlN) [46, 57], or hexagonal boron nitride
(hBN) [45-49] in polymer matrices. The relatively high hardness of SiC and AlN are
17
detrimental to the manufacturability of the composites. In contrast, hBN, which resembles
the two-dimensional covalent structure of graphite, has a low dielectric constant (i.e., ~4)
and is lubricious, which helps efficient wetting. These intrinsic properties are consistent with
the objectives of developing thermally conductive PMCs, which includes high thermal
conductivity, high electrical resistivity, and good processibility. While there are practical
limits on the maximum amount of thermally conductive fillers that can be used without
compromising the good processibility and mechanical performance of PMCs [58], strategies
that can promote the formation of random bridges or networks would be beneficial to
promote PMCs’ keff. Few researchers have investigated whether the addition of hybrid fillers
of different shapes and/or sizes would lead to higher PMC’s keff due to the formation of
effective thermal conductive path [54, 58-60]. However, these studies focused solely on the
effect of hybrid fillers on the PMC’s keff. In fact, the addition of secondary filler not only can
promote the keff of the PMCs but also can tailor the electrical resistivity of the PMCs if the
secondary filler is electrically conductive. This will be discussed in chapter 5. Thermally
conductive PMCs with tailored electrical resistivity can be used for ULSI, capacitors, and
electronic packaging materials.
2.3.2.1 Hexagonal Boron Nitride
Boron Nitride (BN), a wide band gap semiconductor, is known to have a high thermal
conductivity and better performance at high temperatures. It is also lightweight and cost
effective, which are both important qualities for electronic packaging materials [61].
Hexagonal boron nitride is comprised of planar sheets of covalently bonded boron and
nitrogen atoms, which make up the in-plane structure of the crystal [62]. The different layers
are held together in the through-plane direction through Van der Waals forces. Since the
crystal structure is anisotropic, the thermal conductivity varies based on the direction. The
in-plane thermal conductivity (k) has been estimated to be greater than 300 W/m-K, while
the through-plane k is much lower, around 3 W/m-K [62]. Hexagonal boron nitride’s
graphite-like structure also provides a lubricative effect which is desirable for processing.
Minimal tangential resistance, seen with this type of structure that results in minimum

18
coefficient of friction, is attributed to shearing of the weak bonding between planes, in turn
creating a low coefficient of friction and a high carrying load capacity [63].
Figure 2-6: Hexagonal Boron Nitride Spheres [64]
2.3.3 Composites with Aligned Polymer Fibers
Heat transfer by conduction involves transfer of energy within a material without any motion
of the material as a whole. Polymers transfer heat by lattice vibrations so that there is no net
motion of the media as the energy propagates through polymer matrix. Such heat transfer is
often described in terms of “phonons”, which are quanta of lattice vibrations. Metals are
much better thermal conductors than polymers because the same mobile electrons that
participate in electrical conduction also take part in the transfer of heat. Therefore, the one
way to increase electrical conductivity of a polymer matrix composite (PMC) is by the
addition of electrically conductive filler particles i.e. the higher the filler content the higher
the electrical conductivity. Furthermore, electrical conductivity of a PMC is not significantly
affected by the addition of conductive filler content beyond the percolation threshold. On the
other hand, the thermal conductivity in PMC is determined by the phonon transfer within the
matrix and the filler. The thermal conductivity of a material is temperature dependant and
the effect of temperature on polymers is of practical importance because electronic

19
packaging applications have relatively higher service temperatures. Generally, with increase
in temperature, thermal conductivity for amorphous polymers increases gradually in the
glassy region and decreases slowly or remains constant in the rubbery region. For crystalline
polymers, thermal conductivity decreases steadily with the increase in temperature below the
melting point. At temperature above the melting point, it behaves in a similar way as
amorphous polymers [65].
Thermal conductivity of polymers is also highly dependent on polymer chain segment
orientation. This is because thermal energy transports more efficiently along the polymer
chain. Crystalline polymers have highly ordered chain segments, and therefore have higher
thermal conductivity than amorphous polymers. Amorphous polymers may exhibit
anisotropic thermal transport properties if polymer chains are partially oriented, with thermal
conductivity along the chains higher than that perpendicular to the chains [65]. Thermal
conductivity of polymers may be increased by addition of fillers. However, addition of
conductive filler in PMC increases its thermal and electrical conductivities simultaneously.
The value of thermal conductivity substantially depends on the nature of filler distribution,
its structure, orientation relative to heat flux, and the ability to form chains in the matrix of
polymer [66]; whereas, the value of electrical conductivity only depends on the mere
presence of conductive fillers.
Kline et. al. concluded that the thermal conductivity level of the polymers depends largely
on whether they were amorphous or partially crystalline in nature in the range of 0 to 100˚C
[67]. In amorphous regions the thermal conductivity increases as the chain segments become
more mobile. At the glass transition temperature, the mobility and thus the conductivity
should increase rapidly. In partially-crystalline polymers, the conductivity in the crystalline
regions was evidently somewhat higher than that in the amorphous regions because of the
cooperation between movements of neighboring molecules in the crystallites. The crystalline
regions could thus strongly influence the composite conductivity of the polymer. As the
temperature rose in the crystallites toward the melting temperature, the overall conductivity
decreased rather sharply, although that of the amorphous regions was gradually increasing
[67]. Nysten et. al. reported that the thermal conductivity of stretched film with a draw ratio
of 40 of polyethylene (PE) along longitudinal direction was significantly higher than in the
transverse direction [68]. The increase of the thermal conductivity in stretched polymers was

20
generally attributed to the alignment of polymer chains in the crystalline phase. However,
the thermal conductivity of drawn polymers was strongly anisotropic. Hence, thermally
conductive and electrically insulative PMCs may be fabricated by introducing polymer fibers
that will transfer heat more efficiently and adding fillers below their percolation threshold to
keep the PMC electrically insulative. Liquid crystal polymer (LCP) shows evidence of
polymer fiber formation. This property of LCP may be used to fabricate composites with
aligned LCP polymer fibers.
2.3.3.1 Liquid Crystal Polymer (LCP)
Liquid crystal polymers (LCPs), a family of high-performance polymers, are distinguished
from semi-crystalline polymers by their special molecular structure that consists of rigid,
rod-like macromolecules ordered in the melt phase to form liquid crystal structures, as seen
in Figure 2-7.

21
Figure 2-7: Representation of structural differences between liquid crystal polymers and
conventional semi-crystalline polymers [69]
They were first discovered in 1950 [70]. They are formed as a consequence of molecular
asymmetry. Since two molecules cannot occupy the same space simultaneously [70], it
results in long, rigid, rod-like molecules. LCPs possess the properties of polymers and
liquids by being in a state of highly ordered condensed fluid that exists between crystalline
solids and isotropic liquids. They acquire the properties of solids and liquids via the
realignment of LCP molecules at elevated temperature. The properties of liquid crystal phase
combined with the specific properties of polymer have given rise to new potentials that are
impossible with conventional materials. Due to aromatic ring-structured compounds, LCP is
a highly crystalline material that is very stable after polymerization. Fibrous nature of liquid
crystal morphology results in excellent thermal stability, chemical and flame resistance, high
modulus, high melting point, and good impact strength. Therefore, LCP is suitable for and
widely used in electrical and electronic components, cables, and connectors for fiber optics,
apparatus for chemical processes, medical equipment, automotive and mechanical

22
engineering, and the aerospace industry [71]. It is believed that ceramics, metals, and other
polymers used in packaging applications may be replaced by LCP based composites.
Many researchers have conducted studies in order to improve composites’ properties by
reinforcing polymer matrix with LCP fibers. For example, Chinsirikul et. al. reported ~400%
increase in elastic modulus over that of neat PE matrix by blending PE with LCP. It was
reported that this property improvement appeared to be the result of self-reinforcement by
the LCP fibrillar morphology. In that study, LCP fibrils with high aspect ratios of ~ 100 or
higher were developed in the presence of a strong elongation flow field [72]. Another study
conducted by Kim et. al. reported significant increase in the tensile strength and modulus of
LCP/PEN/PET composite fibers. The increase was attributed to both the reinforcement
effect of polymer matrix by LCP and the development of more ordered and oriented
structures with well-distributed LCP [73]. Furthermore, Wong et. al. reported that the
difference in the thermal conductivities of LCP/CB composites in the three orthogonal
directions was the result of the molecular alignment within the LCP matrix. They also
reported that CB aggregates did not make dominant contributions to the thermal conductivity
as they did in electrical conductivity [74]. Hence, in light of these studies conducted it is
proposed that LCP fibers may be introduced and aligned in order to promote thermal
conductivity of PMC while keeping the filler content below the percolation threshold so that
PMC remain electrically insulative.
2.4 Theoretical Predictions for Thermal Conductivity of Composite Materials
In a solid material, there are two main mechanism of heat conduction: through lattice
vibration waves, which are called phonons, and through free electrons. The movement of
phonons is associated with a certain thermal energy, while free or conducting electrons
participate in electronic thermal conduction [75]. Transport of heat within a non-metallic
material occurs predominantly by phonon or lattice vibrations [76]. The fundamental models
to predict the thermal conductivity of polymer composites are Series, Parallel, and
Geometric Mean models, which are defined below.

23
Series Model: 1 ∅ ∅ .......................... 2-2
Parallel Model: ∅ ∅ .......................... 2-3
Geometric Mean Model: ∅ ∅ .......................... 2-4
where,
kc = thermal conductivity of continuous phase
kd = thermal conductivity of discrete phase
∅ = volume fraction of discrete phase
The series and parallel models are used to represent the upper and lower bounds of the
effective thermal conductivity, respectively. The series model considers a case where the
fillers are fully interconnected forming an internal network structure, generally
overestimating the keff-value. For the parallel model, each particle is assumed to be an
isolated entity; therefore, minimizing the effect of the dispersed phase and underestimating
keff. The geometric mean model is a combination of the parallel and series models, assuming
an equal proportion of each arrangement. This model is dependent on the weighted average
of the filler and matrix materials, and has no physical basis [77].
Maxwell Theoretical: The Maxwell model uses potential theory to obtain an “exact”
solution for the conductivity of randomly distributed and non-interacting homogeneous
spheres in a homogeneous continuous medium, as shown below
∅
∅ .......................... 2-5
This theory describing electrical conductivity was then adapted by Eucken for thermal
conductivity. Predictions obtained using this model are generally more accurate for low filler
concentrations, for scenarios where the particles do not network [78].
Lewis and Nielson Semi-Theoretical Model: Many studies have found the Lewis and
Nielson semi-theoretical model to be the best fit for solid-solid compositions. Lewis and

24
Nielsen modified the Halpin-Tsai [77] equation to include the effect of the shape of the
particles and the orientation or type of packing for a two-phase system [79].
∅
∅ .......................... 2-6
where
, 1 ∅
∅∅
The values of A and ∅ for many geometric shapes and orientation can be found in the
literature.
2.5 Interfacial Thermal Resistance
Earlier, it was thought that the only parameters affecting the effective thermal conductivity
of the composite were the thermal conductivity, the geometric distribution and the volume
fraction of each component but independent of their dimensions. Starting in 1980’s, it was
found out that poor mechanical or chemical adherence at the interface and a mismatch in the
coefficients of thermal expansion, such as that on cooling of the composite from the
temperature at which it was manufactured, an interfacial gap developed between the
dispersed and matrix phases [80]. It was reported that as the interfacial gap decreased the
interfacial thermal resistance decreased due to the re-establishment of interfacial contact
with increasing temperature. The most commonly used fillers can be classified widely into
three categories i.e. spherical, cylindrical, and flat-plate fillers. The effect of interfacial
thermal resistance on the effective thermal conductivity of composites with spherical or
cylindrical dispersed phase geometry could be modelled by minor modification of the
original Rayleigh and Maxwell theories. On the other hand, the series-circuit approach could
be used to model the effect of flat plate geometry fillers with heat flow perpendicular to the
interface [81].

25
2.6 Summary of Guidelines
There are many approaches associated with electronic packaging and the materials used for
its components. Each of these elements was discussed within this chapter including: a
general overview of thermal management and electronic packaging, materials for electronic
packaging, and thermally conductive polymer composites. Documentation on basic
principles as well as a comprehensive review of previous research has been included as a
guide for the selection of the best materials, fabrication techniques, and processing
parameters for this research thesis. Polymer matrix composites were selected for the basis of
this work. Carbon-based materials were decidedly the best filler material due to their high
thermal conductivity and ability to tailor electrical conductivity. Use of hybrid materials was
also suggested to introduce a positive synergistic effect. Introduction and alignment of
polymer fibers in LCP was also proposed to be a method to improve thermal conductivity.
2.6.1 Material Selection
Two types of polymer matrix materials – (i) polyphenylene sulfide (PPS), and (ii) liquid
crystal polymer (LCP) and four types of thermally conductive fillers – (i) hexagonal boron
nitride (hBN) (ii) carbon fiber (CF); (iii) multi-walled carbon nanotube (MWNT); and (iv)
graphene nanoplatelets (GNP) had been selected for this research. In addition, various novel
fabrication strategies were explored to stretch the value of composite keff.
2.6.2 Matrix Materials
For the electronic packaging applications being considered in this research thesis, it is
necessary for the polymer to have a high service temperature (> 180°C). In this context,
thermosetting plastics such as epoxy may be a natural choice because of the good thermal
stability and low cost. However, if taking the processibility and the recyclability of the
materials as other key criteria in choosing the base materials, engineering thermoplastics,
which exhibit superior mechanical and thermal properties over a wide range of conditions,
seems to be appropriate choices. After comparing the cost, thermal conductivity, and service

26
temperature of potential engineering thermoplastics, PPS and LCP were selected as the
matrix materials. The rationales behind the selection of these materials were that they are
thermoplastics that have sufficiently high service temperatures (i.e., about 180°C or above),
and can easily crystallize or align their molecular chains. In particular, PPS has high service
temperature and good ability to crystallize. Fortron 0203 and 0214 PPS, supplied by Ticona,
were used in experiments related to PPS-based composites discussed in this thesis report.
The particular grades of PPS were chosen because of their abilities of rapid crystallization
and their low viscosity, which allow a high loading of fillers. LCP (Ticona, Vectra A950)
was chosen of its ability to align its molecular chain in the liquid state. Both of them have a
service temperature of 200˚C, melting point of 280˚C and thermal conductivity of 0.22
W/mK.
2.6.3 Filler Materials:
The filler materials being selected in this research can be subdivided into ceramic fillers and
carbon fillers. The chosen ceramic filler is hexagonal boron nitride (hBN). It was chosen
because of its high thermal conductivity and low electrical conductivity. Furthermore, hBN
was chosen because its molecular structure resembles that of graphite. Therefore, it can act
as a solid lubricant and facilitate the melt compounding process of composites with high
filler contents. For carbon fillers, three types of fillers with different sizes or different
geometries were investigated. These fillers include carbon fibers (CFs), multi-walled carbon
nanotubes (MWNTs), and graphene nanoplates (GNPs). All of these three types of carbon
fillers have high thermal and electrical conductivities. GNPs are composed of the same
material as carbon nanotubes, and they share many of MWNT’s properties. It can be
described as an unrolled carbon nanotube. Its two-dimensional structure is expected to
enhance the interconnection of the fillers dispersed in the polymer matrix.
2.6.4 Micromechanical Models Selection
Intuitively, adding filler with a very high thermal conductivity should increase the thermal
conductivity of the composite significantly. However, experimental results by other

27
researchers showed lower than expected thermal conductivity of the composites embedded
with conductive fillers, some of which have about 4 orders of magnitude higher thermal
conductivity than the polymer. Research is being conducted to predict this loss in the
thermal conductivity at the interface. Models are needed to predict the thermal conductivity
of the composites for high filler content where there is filler-filler and polymer-filler
interfacial thermal resistance present. These types of models will allow us to predict the
thermal conductivity of composites embedded with filler content as high as 50 wt.%.The
series, the parallel, and the geometric-mean models are the simplest models that provide
upper, lower, and middle values for effective thermal conductivities of composites. On the
other hand, Maxwell theoretical model uses potential theory to obtain an “exact” solution for
the conductivity of randomly distributed and non-interacting homogeneous spheres in a
homogeneous continuous medium. A more realistic model is the Nielsen Semi-Theoretical
model that takes into account the effect of the shape of the particles and the orientation or
type of packing for a two-phase system. These are the most commonly used models in
literature and therefore, will be used to compare with the experimental data in this report.

28
Chapter 3 Effects of Size and Structure of Micro- and Nano- Sized
Carbon Fillers on Composite’s Properties
3 Introduction
Although extensive research efforts were made by various researchers [3, 82-86] to
investigate the roles of micro- and nano- sized carbon fillers in promoting the thermal,
electrical, or mechanical properties individually, the interrelations among mechanisms
through which the fillers enhance these multifunctional characteristics are scarce. In light of
this, this chapter systematically studies the multifunctional characteristics, including thermal,
electrical, and mechanical properties, of polyphenylene sulfide-based micro- and nano-
composites filled with CFs, MWNTs, and GNPs. Analyses were done to explore the
different requirements to develop carbon filler network in order to promote different
functional performances (e.g., thermal, electrical and mechanical) of the composites.
3.1 Experimental
3.1.1 Materials
For electronic packaging and thermal management applications, desirable materials should
have service temperature (Tserv) as high as 200°C [87]. Since a wide spectrum of emerging
applications of polymer composites demand the stability of the materials at high
temperature, polyphenylene sulphide (Fortron 0214, Ticona), which has a melting
temperature (Tmelt) of 280°C and a service temperature of 200°C, was chosen as the matrix
material. The thermally conductive fillers used were CFs (Cytec Industries, Thermalgraph
Pitch-based DKD X), MWNTs (CheapTubes Inc., Industrial Grade), and GNPs
(CheapTubes Inc., Grade 2). All materials were used as received without any further
modification. The physical properties of the polymer and fillers are summarized in Table 3-1
and Table 3-2, respectively.

29
Table 3-1: Physical Properties of polyphenylene sulfide
Physical Properties Values Units
Density (ρ) 1350 Kg/m3
Melting Temperature (Tm) 280 °C
Maximum Service Temperature (Tmax)
200 °C
Thermal Conductivity (k) 0.22 W/m-K
Dielectric Strength 18 kV/mm
Dielectric Constant – 10kHz 3.2 -
Coefficient of linear thermal expansion
52 m/m/°C
Table 3-2: Physical Properties of carbon fiber, multi-wall nanotubes, and graphene nanoplatelets
Physical Properties CF MWNT GNP
Density (ρ) 2200 kg/m3 2100 kg/m3 2000 kg/m3
Thermal Conductivity (k)
400-650 W/m-K 3000 W/m-K 3000 W/m-K
Electrical Conductivity
>3300 S/cm >100 S/cm ~20,000 S/cm
Shape Fibrous Hollow tube Platelet
Length 200 µm 10-30 µm 10 nm
Diameter 10 µm Inner: 5-10 nm
Outer: 20-40 nm
25 µm
30
3.1.2 Sample Preparation
Uniform dispersion of the filler particles in the polymer matrix was desired in order to form
a 3-D conductive network in the composites with high filler content, i.e., above the
percolation threshold. A twin-screw DSM Xplore 15 micro-compounder was used to
uniformly disperse the CFs, MWNTs, and GNPs in PPS. The filler contents were varied
from 1 wt.% to 20 wt.% for MWNTs and from 1 wt.% to 30 wt.% for CFs and GNPs. The
highest loadings of CFs, MWCNTs, and GNPs were chosen based on the maximum amounts
of fillers that could be processed by the micro-compounder. Table 3-3 summarizes the
compositions of the PPS-based composites with different fillers. The fillers and the polymer
powders were first dry-blended at room temperature. The mixture was then compounded by
the microcompounder at 300°C and 50 rpm for 6 minutes. The extrudates were cooled in a
water bath at room temperature. Consequently, they were pelletized and ground into fine
powders using a pelletizer and a freeze mill, respectively. The fine powders were
compressed at room temperature for 1 minute to ensure the samples were compact. The mold
was then heated to 310°C and the composite melt was compressed at 1500 psi for 20 minutes
into disk-like samples for thermal, mechanical, and electrical analyses.
Table 3-4 summarizes the dimensions of the samples that were used for various tests. The
mass fraction of the composites may be converted to volume fraction by using the densities
of the matrix and the filler materials. All samples prepared for thermal conductivity
measurements were machined and ground to improve the surface smoothness to improve the
accuracy of the measurements. Three 2 mm deep radial holes were drilled at 1 mm below the
top surface, in the middle, as well as at 1 mm above the bottom surface of the samples for
thermal conductivity measurements. Three thermocouples, with diameters of 0.076 mm,
were inserted into the holes for these samples for the measurements.

31
Table 3-3: A summary of the compositions of PPS filled with micro- and nano- sized carbon
fillers
Mass Fraction of PPS Mass Fraction of Filler Fillers
100% 0% -
99% 1% CF, MWNT, GNP
95% 5% CF, MWNT, GNP
90% 10% CF, MWNT, GNP
85% 15% MWNT, GNP
80% 20% CF, MWNT, GNP
70% 30% CF, GNP
Table 3-4: Schematics of the samples used for characterization of PPS embedded with micro- and nano- sized carbon fillers
Thermal Conductivity Coefficient of Thermal Expansion & Mechanical
Test
Electrical Conductivity
3.2 Sample Characterization
Effective thermal conductivity (keff), coefficient of thermal expansion (CTE), glass transition
temperature (Tg), impedance (Z), dielectric constant (ε), compressive modulus (Ecomp) and
morphology were measured and studied to investigate the multifunctional properties of PPS-
based micro- and nano- composites. Since electronic packaging application requires high
thermal conductivity, improvement in keff of the composites by at least 10 times over neat
PPS was sought. Composites’ CTE was desired to be similar to the devices’ CTE on which
20 mm 6 mm
20 mm10 mm
8 mm2.5 mm

32
they will be attached to reduce the occurrence of thermal stresses. In order for the composite
materials to be used for different electronic components such as ULSI, IC and capacitors,
composites were needed to be slightly electrically conductive with higher ε i.e. 3 < ε < 100
for charge accumulation. It should be noted that for electronic packaging materials, low
electrical conductivity is sought; however, dielectric measurement can be used to provide
material selection criteria for various electronic components. Improved tensile strength and
elastic modulus were also required to use the composites as a support structure for the
electronic components. The keff of the composites was measured by a thermal conductivity
analyzer (ASTM E1225-04) [88] at 150°C. CTE was measured by analyzing the dimension
change of the composite materials as they were heated from room temperature to 200°C at a
rate of 10°C /min by the Q400-series thermomechanical analyzer (TMA) from TA
Instruments. CTE’s were determined by determining the instantaneous rate of change of
sample’s dimension with respect to temperature at 50°C and 150°C. These temperatures
were selected to provide a range of CTE for the potential range of in-service temperatures of
composites. Tg was measured by determining the inflection point of the CTE versus
temperature graph. Z and ε were measured using a dielectric/impedance analyzer (Alpha-N-
Novocontrol Technologies) over a frequency range of 10-2 to 105 Hz with an applied AC
voltage of 1 V. The morphology of the composites was investigated by scanning electronic
microscopy (SEM, JEOL, model JSM6060) on the cross-sections of the samples that were
fractured in liquid nitrogen.
3.3 Results and Discussion
3.3.1 Effects of Carbon Fillers on the Effective Thermal Conductivity
The results obtained from effective thermal conductivity (keff) measurement of PPS based
composites filled with CF, MWNT, and GNP are depicted in Figure 3-1. The data for PPS
composites filled with 30 wt.% MWNT (i.e., 21.63 vol.% MWNT) is not included because
this composition was too viscous for the compounder to process. It was observed that the
addition of CF, MWNT, and GNP increased keff by 5 to 10 times at high filler loadings.

33
Comparing the keff of PPS-based composites with different carbon fillers, it can be observed
that GNPs promote the keff more effectively than CF and MWNT, while MWNT seems to
perform slightly better than CF. Several factors can be used to explain the keff results.
Although both types of fillers have 1-D structure, the smaller dimension, larger L/D ratio,
and higher k of MWNT enhanced the composite’s keff more effectively. For instance, a
cylindrical composite sample, which has a diameter of 2 cm and height of 1 cm, filled with
20 wt.% filler content would roughly have 2.66×10⁷, 3.08×10¹³, and 9.24×10¹⁰ individual
particles for CF, MWNT, and GNP fillers. Therefore, the total number of MWNT particles
was the highest per sample by several orders of magnitude. For the same cylindrical sample
with the same composition, total surface area of the three fillers would be 17.1×10⁻² m2,
58.04 m2, and 90.79 m2, respectively. This shows that there is relatively more interaction
between the polymer matrix and the fillers for PPS/GNP composites than PPS/CF and
PPS/MWNT composites resulting is relatively higher keff. The platelet geometry of GNP
fillers has a higher total surface area, allowing more polymer-filler interfaces to promote
phonon transfer through the composite. Furthermore, despite the similar k’s of GNP and
MWNT, the better performance of GNP than MWNT to promote keff is believed to be caused
by the different filler geometry. MWNT has extremely high k along the tube direction but
has much lower k across the tube (about 3.4 W/m/K) [83] whereas GNP is an unrolled
analogue of MWNT with high k in all directions. The random orientation of MWNTs in PPS
may suppress the potential for MWNT to promote the composite’s keff. In contrast, even
though GNP, which is a stack of sheets of covalently bonded carbons, is randomly oriented
in the PPS matrix causing a more satisfactory improvement in the keff of the composites due
to its superior k in all directions along the plane. Nevertheless, the increased keff by all three
types of the composites was still significantly lower than the k of the fillers. This can be
attributed to the anisotropic thermal properties of the fillers and the interfacial thermal
resistances associated with PPS-filler and filler-filler interfaces as discussed in chapter 3.

34
Figure 3-1: Thermal Conductivity of Carbon-Based Filler reinforced PPS composites
Analysis of fillers’ dispersion in the PPS matrix (Figure 3-2 to Figure 3-9) can provide
additional information to interpret the keff results of the composites. It is reported by
researchers that when MWNTs were mixed with polymer, they had dispersed throughout the
matrix in aggregates due to the entanglement of individual tubes [89-91]. The individual
MWNT properties may, therefore, no longer be applicable to the micron-scaled MWNT
aggregates dispersed in the PPS/MWNT composites. Zhang et. al. reported that the thermal
conductivity of MWNTs was found to be as low as 4.2 W/m/K when they were sintered into
bulk samples due to the thermal resistance at the MWNT-MWNT interface [83]. This could
be one of the reasons we see the keff of ~1 W/m/K for the PPS filled with 22 vol.% MWNT
composite. Moreover, the total number of GNPs per composite sample was three orders of
magnitude lower than that of MWNTs per sample. If the GNP-GNP interfacial thermal
resistance is assumed to be similar to the MWNT-MWNT interfacial thermal resistance, the
significant larger number of MWNTs per sample meant that the total interfacial thermal
resistance in the PPS/MWNT composites would be significantly higher than that of

35
PPS/GNP composites. This resulted in more significant phonon scattering and a lower keff
for PPS/MWNT than PPS/GNP composites despite their similar k. For the comparison
between PPS/CF and PPS/MWNT composites, Figure 3-2(c) shows a small gap between the
PPS matrix and the CF filler. This implies a poor wetting on the CF by the PPS matrix. In
contrast, Figure 3-6(c) indicates that MWNTs were completely wetted by the PPS matrix.
Therefore, weak adhesion of CF filler to the polymer can also attribute to its less pronounced
effect on keff of the PPS/CF composites.
Figure 3-2 illustrates the SEM micrographs, at magnifications ranging from 100X to
10000X, of PPS/CF composite loaded with 20 wt.% of CF. Figure 3-2(a) indicates the
presence of pores, ranging from 150 μm to 400 μm diameters, in the PPS matrix. This may
serve as a partial explanation of the relatively lower composite’s keff and E with the addition
of CF. Figure 3-2(b) illustrates that the CFs are dispersed individually and not agglomerated.
The higher magnification micrograph, i.e., Figure 3-2(c), reveals a poor wetting on the CF
by the PPS matrix. In other words, this confirms the weak adhesion of CF to the PPS matrix,
which again helps to explain the earlier discussion about relatively lower keff of PPS/CF
composites.
Figure 3-2: SEM micrographs of PPS/CF composite with 20 wt.% CF at (a) 100X; (b) 2500X; and (c) 10000X
3.3.2 Effect of Carbon- Based Fillers on the Coefficient of Thermal Expansion
To characterize the thermoplastic dimensional stability, linear coefficient of thermal
expansion (CTE) was tested through thermal mechanical analysis (TMA). The CTE of the
PPS based composites measured at 50°C and 150°C, i.e. below and above Tg, are shown in
Figure 3-3 and Figure 3-4, respectively. It was found that the CTE of the composites was

36
relatively constant below Tg; however, it increased linearly with respect to temperature
above Tg for all the composites. The CTE of neat PPS was measured to be 52 m/m/°C at
50°C, which is in accordance to the CTE value provided by the supplier. The composites
show a decrease of about 80% and 120% in their CTE values below and above Tg,
respectively, at high filler content. This decrease in CTE is believed to be caused by the
difference in the CTE of the micro- and nano- sized carbon based fillers and the PPS matrix.
Figure 3-3 and Figure 3-4 show that CF seem to have decreased the CTE of PPS most
significantly, followed by MWNT and GNP as the filler content increases. The difference in
the CTE’s of the three composites could be attributed to the fillers’ dispersion and geometry
in the matrix. CFs, due to their relatively lower L/D ratio, tended to affect the composite’s
CTE more significantly than the other two fillers as they did not agglomerate as much as
MWNT and GNP.
High CTE usually results in thermo-mechanical stress, when the materials are subjected to
temperature variations. High-performance polymer composites should be able to operate at
relatively high temperatures without losing their mechanical properties. Therefore, low CTEs
of the composites are desired, in order to match the CTE of the surrounding metal parts and
to reduce potential thermal stresses. The rule of mixture overestimates the CTE’s as it does
not take into account the polymer-filler and filler-filler interaction and the filler orientation.
Presently, commercial glass/epoxy (FR-4) composite is used as a packaging material in
electronics, having a much higher out-of-plane CTE ( > 60 µm/m/°C before Tg) than that of
copper (18 µm/m/°C) [92]. The CTE of composites are desired to have low CTE to reduce
the occurrence of thermal stresses. 30 wt.% GNP/PPS with their low CTE and high keff show
better dimensional stability and thermal conductivity compared with neat PPS, making it a
potential candidate for electronic packaging materials. However, no significant decrease in
CTE was observed for all the composites as the filler content increased. As mentioned in the
previous section, poor polymer-filler interfacial contact may have contributed to negligible
decrease in the CTEs.

37
Figure 3-3: Coefficient of thermal expansion of composites at 50°C

38
Figure 3-4: Coefficient of thermal expansion of composites at 150°C
3.3.3 Effect of Carbon- Based Fillers on Glass Transition Temperature
For polymeric composites, it is important to take into consideration their glass transition
temperature (Tg) because of their transition from a glassy state to a rubbery state on heating
especially in high temperature applications. Although we are using a high temperature
polymer and do not require higher Tg, any negative effects of adding fillers on the Tg should
be investigated. Figure 3-5 shows the effect of carbon- based fillers on the Tg of the PPS
composites. The Tg of neat PPS was reported to be 90°C by the supplier. Tg of the
composites as well as the neat PPS were measured by using the TMA. The meeting point of
tangents extrapolated from curves of CTE versus temperature at the points that showed the
start and end of the glass transition was taken as the Tg of the composite. These points were
roughly at 70°C and 110°C on the CTE versus temperature graphs. The hindrance of
mobility of the polymer chains caused by the presence of micro- and nano- sized filler

39
particles should ideally increase the Tg of the composites [93]. However, an insignificant
increase in Tg was observed for the three types of composites. In general, fillers are carbon
based and therefore do not directly contribute to the Tg of the matrix. Instead, the interaction
of the polymer chains with the surface of the particles can drastically alter the chain kinetics
in the region immediately surrounding the particle due to the presence of the interface. It is
reported by researchers that addition of fillers may not affect the Tg of the composites when
filler particles are significantly big, i.e., micron-scaled [93-95]. Therefore, micron sized
individual CFs, agglomerates of MWNTs and stacks of GNPs would have negligible effect
on the Tg of the PPS based composites as shown in Figure 3-5. Hence, these composited
would be suitable for use in the electronic packaging applications, as the addition of fillers
does not affect the Tg negatively.
Figure 3-5: Tg of PPS filled with micro- and nano- sized carbon fillers

40
3.3.4 Effects of Carbon- Based Fillers on the Electrical Properties by Measuring Electrical Conductivity
The electrical conductivity (σ), taken at the lowest frequency i.e. 10-2 Hz, of the composites
embedded with CF, MWNT, and GNP were measured. The effects of different fillers on
PPS-based composites are summarized in Figure 3-7 and Table 3-5. The dramatic change in
the σ by increasing the filler content indicates a percolation threshold for the fillers. Above
the compositions of the percolation threshold, the σ of the composites does not change
significantly. The electrical conductivity data were fitted to statistical percolation threshold
curves in the form of
.......................... 3-1
where, is Electrical Conductivity in S/cm, is the volume fraction, is the percolation
threshold and and t are constants. The σ curves of all the composites show that the
percolation thresholds for all the three fillers are below 5 vol.% and they are very close to
each other. However, the aspect ratio and the number of individual particles of the fillers
present in the matrix affect their formation of 3-D network in the matrix. MWNTs due to
their large aspect ratio and high number of particles should form the 3-D network at very
low filler content where as percolation in PPS/CF composites should be achieved at high
filler content. GNP, which has the highest electrical conductivity among the three, increases
the σ of the PPS/GNP composites less effectively than MWNT and CF even though it should
have a lower percolation threshold. The better dispersion of the nanofillers and their better
adhesion to the PPS matrix are needed for the high electrical conductivity of the PPS based
composites. The curve fitting is only an approximation; however, it should be noted that the
percolation threshold depends upon the aspect ratio, number of particles, inherent electrical
conductivity, degree of dispersion of filler in the matrix, nature of interface and interaction
between the filler and matrix [96].
Figure 3-6 shows the SEM micrographs of PPS/MWNT composite with 20 wt.% of MWNT
at magnifications of 5000X, 20000X and 50000X, respectively. Figure 3-6(a) and (b)
indicate the presence of MWNT agglomerates in the PPS matrix. In Figure 3-6(c), individual
MWNTs of diameter about 20 to 40 nm entangled with each other and representing a
proportion of the aggregate can be observed. Together with the measurements of various

41
multifunctional properties, it is believed that mere presence of enough amounts of
electrically conductive fillers in the polymer matrix is a sufficient condition to promote the
material’s electrical conductivity. High electrical conductivity requires the existence of a
good network of electrically conductive fillers.
Figure 3-6: SEM micrographs of PPS/MWNT composite with 20 wt.% MWNT at (a) 5000X (b) 20000X and (c) 50000X
Figure 3-7: Change in electrical conductivity as the filler conent increases for PPS embedded
with carbon based fillers

42
Table 3-5: Percolation threshold calculated by fitting a curve to the experimental data
Composite Percolation Threshold
PPS/CF 4.55 wt.%
PPS/MWNT 4.76 wt.%
PPS/GNP 5.00 wt.%
3.3.5 Effect of Carbon- Based Fillers on the Dielectric Constant
Use of carbon- based filler reinforced polymer composites have been studied as they exhibit
relatively high electrical properties in addition to high mechanical and thermal properties.
High aspect ratio of filler helps in attaining the percolation threshold at very low filler
concentrations, i.e., 0.05-0.1 wt.% for polystyrene/CNT composites [4] and 1-2 wt.% for
polyphenylene sulphide PPS/CNT composites [97]. Even though the percolation threshold
values are relatively low for MWNT reinforced polymer composites, the difficulty of
dispersing MWNT along with their high cost make them less than ideal fillers for ULSI, IC,
and capacitor materials. Composites with high dielectric constant (ε), i.e. greater than 100,
are suitable for capacitors; ε less than 3 is desirable for ULSI; whereas 3 < ε <100 is needed
for electronic packaging applications.
Figure 3-8 shows the dielectric constants for the neat PPS and its carbon composites
measured at 300 kHz. It should be noted that these are the effective dielectric constants i.e.
they do not take into consideration the presence of conductive fillers in the samples. It can
be observed that the dielectric constants (ε) of composites increased with increasing filler
content. Highest improvement in the ε is demonstrated by GNP reinforced PPS based
composites followed by MWNT and then CF. The increase in composites’ ε is primarily due
to the interfacial polarizations [98]. Other factors affecting the ε of different carbon-based
fillers reinforced PPS composites can be attributed to fillers’ dispersion. As we can see from
the figure, GNP shows the highest improvement in ε followed by MWNT and then CF
similar to the impedance results due to the level of connectivity of the fillers and their
electrical conductivity, as mentioned in the previous section. Since the high ε would be

43
beneficial for flexible capacitors, the PPS/GNP composites would be best for these
applications.
Considering the different abilities by CF, MWNT, and GNP to enhance the composites’ keff
and ε, it can be concluded that the choice of them as fillers hinges on the targeted
applications of the composites. For applications where both thermal and electrical
conductivity are desired, it seems that GNP is a more appropriate choice of fillers. However,
if the applications demand thermally conductive but electrically insulating properties (e.g.,
electronic packaging), it is apparent that CF is a natural choice because of its relatively high
keff and lower ε and σ. Furthermore, PPS/GNP composites with filler content more than 10
wt.% may be used for capacitors, and PPS/MWNT may be suitable for electronic packaging
applications.
Figure 3-8: Effect of carbon-based fillers on the dielectric constant at 3×10⁵ Hz

44
3.3.6 Effect of Carbon- Based Fillers on the Mechanical Properties
Figure 3-10 shows the effect of filler types and contents on the elastic modulus (E) measured
in compression tests. It can be seen that the addition of CF and MWNT yielded small
improvement in E, while the addition of GNP led to no change in E. However, it must be
noted that the friction between the specimen and the testing block as the specimen axially
expanded under compression might have led to potential errors in the measurements. The
compressive modulus of neat PPS was not readily available; however, the tensile modulus of
neat PPS as reported by the supplier is 3800 MPa. The results in Figure 3-10 clearly show
that the 1-D structure of CF and MWNT efficiently contribute to the composites elastic
modulus whereas the 2-D structure of GNP seems to have no effect on the PPS/GNP
composite’s E. Furthermore, the increase in the E of the composites is relatively low when
the fillers’ E is taken into consideration. This huge difference can be attributed to the fact
that the fillers in the composites are randomly dispersed and not aligned axially along the
samples’ length. It is believed that difference in the rigidity of the fillers may have been one
of the factors for different E. As mentioned in the earlier sections, it is believed that the
micro size of CFs make them more rigid than the other two fillers resulting in relatively
higher E of the composites. It is believed that the tube-like structure of the MWNT makes
them more rigid than the nano- sized “wrinkled” stacks of GNP resulting in the higher
composites’ E of PPS/MWNT than PPS/GNP composites. However, taking all of these
factors into consideration, the 1-D structure of CF and MWNT had more pronounced
improvement on composites’ E over neat polymer.
Figure 3-9 illustrates the SEM micrographs at magnifications of 50X, 2000X, and 13,000X
of PPS/GNPs composite filled with 20 wt.% of GNP. Figure 3-9 shows the presence of
voids in the composite. These voids are circular in shape with a diameter of about 100 µm.
Therefore, the thermal conductivity of PPS/GNP composites can be further improved if the
presence of these air voids that act as barriers to heat conduction through the composite can
be minimized. Figure 3-9(b) shows the SEM micrograph of the sample composite at higher
magnification of 2000X. The graphene nanoplatelets, which are 25 µm in size, are uniformly
dispersed in the polymer matrix. The electrical conductivity of the composite may be
increased by the presence of electrically conductive fillers. However, in order to increase the
thermal conductivity of the composite, the interfacial resistance between the polymer and the

45
filler must be minimized. Figure 3-9(c) illustrates a magnified image of a single GNP
showing presence of wrinkled GNPs. Wrinkled GNPs could also have been one of the
reasons for no change in the E of the PPS/GNP composites.
Figure 3-9: SEM micrograph of PPS/GNP nanocomposite with 20 wt% GNP at 50X, 2000X, and 13,000X
Figure 3-10: Compressive Modulus of PPS filled with micro- and nano- sized carbon fillers

46
3.4 Micromechanical Modeling of Thermal Conductivity
Micromechanical models, as described in Section 2.4, were compared to experimental data
for PPS based composites filled with three different fillers i.e. CF, MWNT, and GNP, as
shown in Figure 3-11 to Figure 3-13. The series and parallel models represent the maximum
and minimum theoretical keff, while the remaining curves are contained within these limits.
For all the three fillers, the geometric mean model predicts the keff more accurately than the
series and parallel models. Maxwell theoretical model that uses potential theory to obtain an
“exact” solution for the conductivity of randomly distributed and non-interacting
homogenous spheres in a homogeneous continuous medium underestimates the keff for
composites filled with the three carbon-based fillers. The reason of this big discrepancy
could be that neither the three fillers are spherical in shape nor are they randomly distributed.
Furthermore, as evident by the SEMs, fillers are present in the polymer matrix in aggregates.
The only model that takes into consideration the effect of the shape of the particles and the
orientation of packing for a two-phase system is the Nielsen model. For this model, the
packing factor of ∅ 0.52, which is the constant for three dimensional random fibers, was
chosen. For the type of fillers, all three fillers i.e. CF, MWNT, and GNP were assumed to
randomly oriented rods with very different aspect ratios. Based on these assumptions, the
Nielsen model predicts the keff most accurately for PPS embedded with carbon-based fillers
at low filler content. At high filler content, the Nielsen model starts to deviate significantly
from the experimental data due to the assumption that the fillers are dispersed uniformly and
that they do not form aggregates. Since none of the models takes into consideration the
formation of aggregates and the possibility of filler-filler and polymer-filler interfacial
thermal resistance, more accurate models are desired to better predict the thermal
conductivity of the composites.

47
Figure 3-11: Theoretical predictions for thermal conductivity compared to experimental
results for PPS/CF composites

48
Figure 3-12: Theoretical Predictions for thermal conductivity compared to experimental
results for PPS/MWNT composites

49
Figure 3-13: Theoretical predictions for thermal conductivity compared to experimental
results for PPS/GNP composites
3.5 Summary
As the electronic industry moves toward miniaturization, one of the most important
challenges is to remove the heat generated as the chip’s power consumption increases. Thus,
thermal management in electronic circuits is becoming an integral part of the design. This
chapter investigates the increase in effective thermal conductivity (keff), electrical
conductivity (σ), and compressive modulus (E) of poly-phenylene sulphide (PPS) filled with
carbon-based fillers such as carbon fibers (CF), multi-walled carbon nanotubes (MWNT),
and graphene nanoplatelets (GNP). PPS/GNP composites seemed to have the highest keff
whereas PPS/MWNT and PPS/CF showed similar keff values for the same filler loading. The
σ for PPS/CF composites was the lowest whereas PPS/GNP showed higher values for the

50
same filler content. After comparing σ, keff, E, Tg, CTE and SEM micrographs of the three
types of composites, it was concluded that different requirements are needed in CF, MWNT,
and GNP filler network to promote different functional performances of the composites.
Even though the filler contents were higher than their percolation threshold, keff was not
increased significantly, i.e., a sudden jump in the thermal conductivity was not observed.
This potentially implies that there are other underlying factors such as filler-filler contact
resistance, polymer-filler interfacial resistance, and filler orientation that govern the keff. It
was also concluded that the nano-size of GNP and its 2-D structure, both of which
contributed to significantly higher surface area, were among the reasons for higher keff
allowing more phonons to transfer through the PPS/GNP composite. Fillers with large
surface area provide more interaction with the polymer matrix resulting in the formation of
good conductive network. The difference in the σ of the composites was solely dependent on
the amount of filler particles present in the PPS matrix as well as the electrical conductivity
of the filler. As long as the filler content was over the percolation threshold, the σ increased
dramatically due to better conductive network. However, the percolation threshold itself was
influenced by the size of the fillers, i.e., micron size CF achieved the percolation threshold at
relatively higher filler content than nano- size MWNT and GNP. Fillers with a low aspect
ratio played a role in changing the compressive modulus (E) and coefficient of thermal
expansion (CTE) of the composites. CFs, having the lowest aspect ratio among the three
fillers, showed significant change in the E and CTE of the composites. Individual CFs,
agglomerated MWNTs, and stacks of GNPs, all of which are micron- sized, did not affect
the Tg of the composites since much smaller size of the fillers is believed to cause enough
hindrance in the mobility of polymer chains that would increase the Tg. SEMs of the three
types of the composites showing the dispersion of individual CFs, agglomerated MWNTs,
and stacks of GNPs in the PPS matrix gave another perspective on the differences in their
results. Therefore, imperfect alignment of the fillers, imperfect wetting of the fillers by the
polymer, imperfect bonding in the interface between the fillers and the polymer and
imperfect bonding between individual fillers affected the multifunctional properties of the
PPS based carbon filler reinforced composites. It can be concluded that the GNP fillers are
the most efficient fillers among all other carbon-based filler to promote thermal conductivity
for electronic packaging applications.

51
Chapter 4 Composites Embedded with Hybrid Fillers to Tailor Thermal
and Electrical Properties
4 Introduction
The future of Integrated Circuits with three-dimensional chip architecture hinges on the
development of practical solutions for heat management to the excessive amount of heat
generation. In this context, new polymer-matrix composites (PMCs), which have good
processibility, high effective thermal conductivity (keff), and low but tailored electrical
conductivity (σ) would be needed. This chapter aims to explore the synergy of hybrid filler,
hBN platelet with carbon-based fillers, on promoting the keff of the polyphenylene sulfide
(PPS) composites. This chapter also explores promotion of interconnectivity among the
fillers in the PPS matrix, leading to higher keff, by the uses of hybrid fillers. The opportunity
to use carbon-based fillers as the secondary fillers to tailor the PMCs’ σ is discussed.
Furthermore, the effects of hybrid fillers on the PMCs’ coefficient of thermal expansion are
presented. Few SEM micrographs of PPS embedded with hybrid fillers are shown in Figure
4-1.
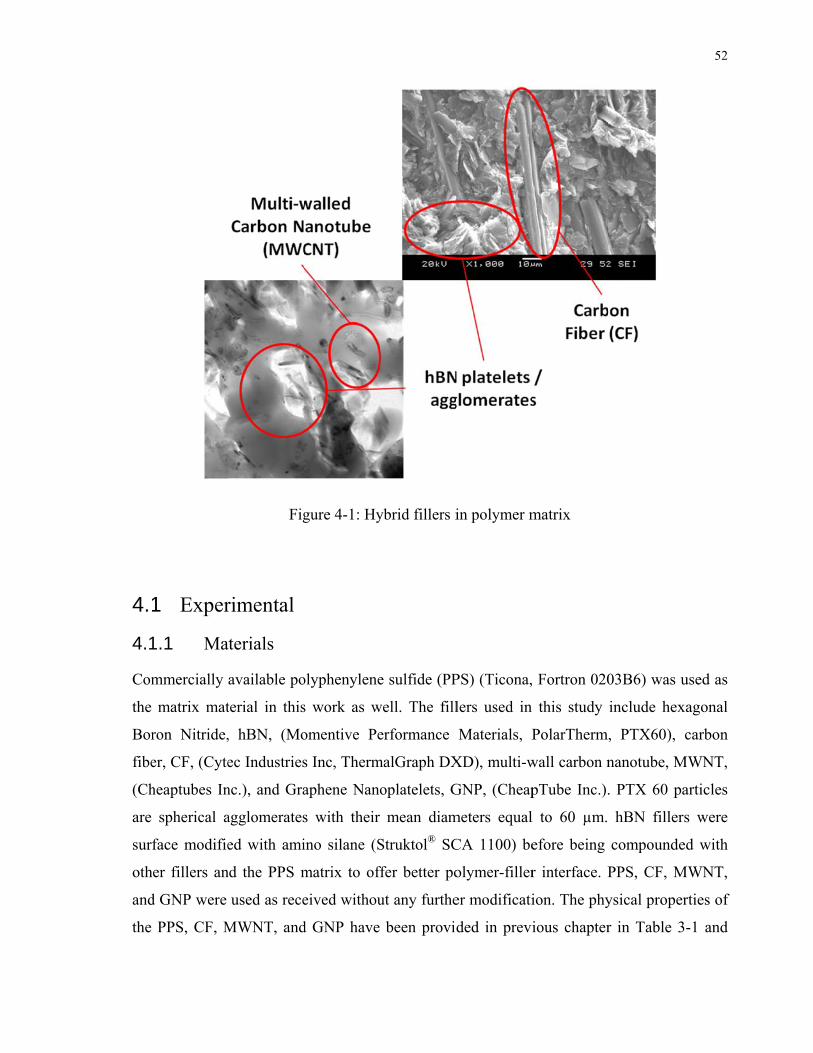
4.
4.1
Com
the
Bor
fibe
(Ch
are
sur
oth
and
the
1 Exper
1.1 Ma
mmercially
matrix mat
ron Nitride,
er, CF, (Cyte
heaptubes In
spherical a
face modifie
her fillers an
d GNP were
PPS, CF, M
Fig
rimental
aterials
available po
terial in this
, hBN, (Mo
ec Industries
nc.), and Gra
agglomerates
ed with ami
nd the PPS m
used as rece
MWNT, and
gure 4-1: Hy
olyphenylene
s work as w
omentive Pe
s Inc, Therm
aphene Nano
s with their
ino silane (S
matrix to off
eived withou
d GNP have
ybrid fillers i
e sulfide (PP
well. The fill
erformance
malGraph DX
oplatelets, G
mean diam
Struktol® SC
ffer better po
ut any furthe
been provid
in polymer m
PS) (Ticona,
lers used in
Materials, P
XD), multi-w
GNP, (Cheap
meters equal
CA 1100) be
olymer-filler
er modificati
ded in previ
matrix
Fortron 020
this study
PolarTherm
wall carbon n
pTube Inc.).
l to 60 µm.
efore being
r interface. P
ion. The phy
ious chapter
03B6) was u
include hex
, PTX60),
nanotube, M
. PTX 60 pa
hBN fillers
compounde
PPS, CF, M
ysical proper
r in Table 3
52
used as
xagonal
carbon
MWNT,
articles
s were
ed with
MWNT,
rties of
-1 and

53
Table 3-2; however, the physical properties of hBNPTX60 have been summarized here in
Table 4-1.
PPS was chosen as the matrix material because of its high service temperature (i.e., 200°C),
which is needed in various heat management applications. For the primary filler, hBNPTX60
(i.e., spherical agglomerates) was chosen for several reasons: (i) it is electrically insulating;
(ii) it resembles the layered structure of graphite, making it extremely soft, and thereby
easier to be compounded at high loading; and (iii) its spherical geometry leads to isotropic
filler properties. For the secondary fillers, CF, MWNT, and GNP were chosen because of
their high aspect ratios and excellent thermal and electrical properties.
Table 4-1: Physical properties of hBNPTX60
Physical Properties PTX60
Density (ρ) 2280 kg/m3
Thermal Conductivity (k) 300+ W/m-K
Dielectric Strength 53 kV/mm
Shape Spherical agglomerates
Size 60 µm
4.1.2 Surface Modification
Amino silane ((C2H5O)3SiC3H6NH2), which is a versatile coupling agent and provides a
superior bond between inorganic fillers and organic polymers, was used to modify the
surface of hBN. Amino silane was first dispersed in a 50-50 ethanol-water solution. hBN
powders were then added to the solution and mixed by a magnetic stirrer for 10 minutes. The
samples were filtered and dried for over 12 hours at ~60ºC. For all the surface modifications
of hBN, 8 parts of amino silane were added to 100 parts of hBN as suggested by supplier of
the silane.
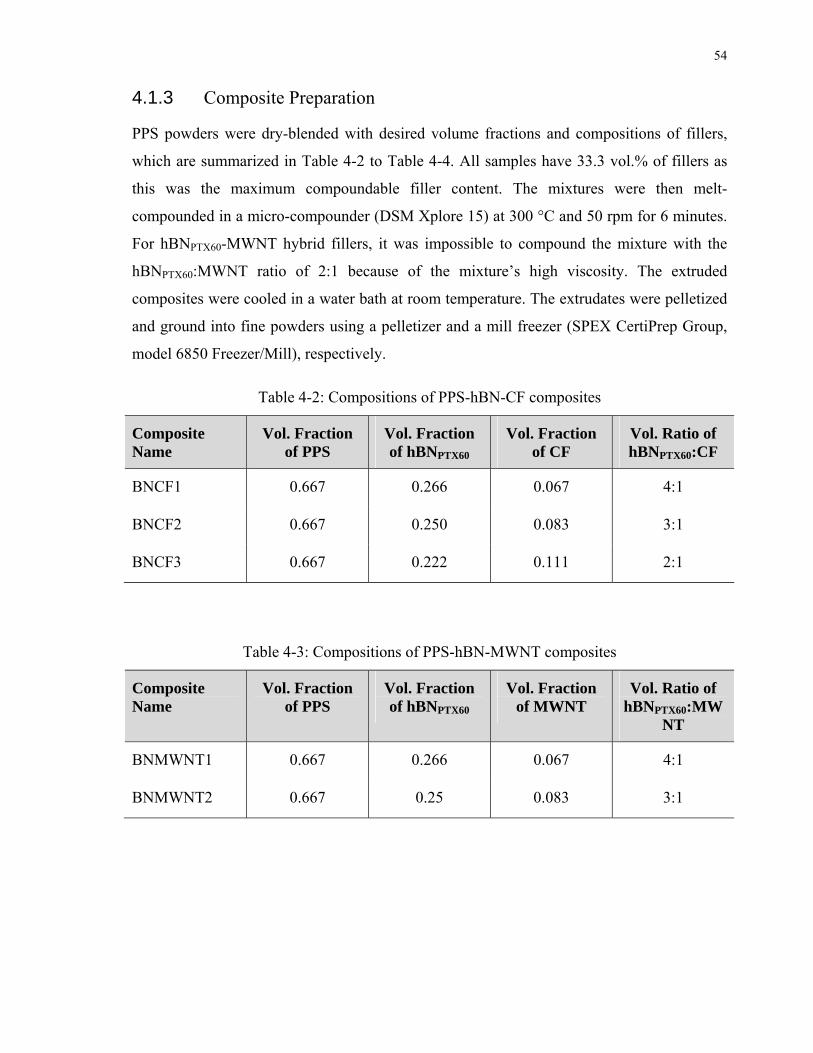
54
4.1.3 Composite Preparation
PPS powders were dry-blended with desired volume fractions and compositions of fillers,
which are summarized in Table 4-2 to Table 4-4. All samples have 33.3 vol.% of fillers as
this was the maximum compoundable filler content. The mixtures were then melt-
compounded in a micro-compounder (DSM Xplore 15) at 300 °C and 50 rpm for 6 minutes.
For hBNPTX60-MWNT hybrid fillers, it was impossible to compound the mixture with the
hBNPTX60:MWNT ratio of 2:1 because of the mixture’s high viscosity. The extruded
composites were cooled in a water bath at room temperature. The extrudates were pelletized
and ground into fine powders using a pelletizer and a mill freezer (SPEX CertiPrep Group,
model 6850 Freezer/Mill), respectively.
Table 4-2: Compositions of PPS-hBN-CF composites
Composite Name
Vol. Fraction of PPS
Vol. Fraction of hBNPTX60
Vol. Fraction of CF
Vol. Ratio of hBNPTX60:CF
BNCF1 0.667 0.266 0.067 4:1
BNCF2 0.667 0.250 0.083 3:1
BNCF3 0.667 0.222 0.111 2:1
Table 4-3: Compositions of PPS-hBN-MWNT composites
Composite Name
Vol. Fraction of PPS
Vol. Fraction of hBNPTX60
Vol. Fraction of MWNT
Vol. Ratio of hBNPTX60:MW
NT
BNMWNT1 0.667 0.266 0.067 4:1
BNMWNT2 0.667 0.25 0.083 3:1

55
Table 4-4: Compositions of PPS-hBN-GNP composites
Composite Name
Vol. Fraction of PPS
Vol. Fraction of hBNPTX60
Vol. Fraction of GNP
Vol. Ratio of hBNPTX60:GNP
BNGNP1 0.667 0.266 0.067 4:1
BNGNP2 0.667 0.50 0.083 3:1
BNGNP3 0.667 0.222 0.111 2:1
4.1.4 Test Specimen Preparation
The fabrication method for these samples was similar to the previous ones. The melt-
compounded composites were compression-molded, at 310°C, into disc-shaped samples of
20 mm diameter. Samples prepared for thermal conductivity measurements were 10 mm
thick while those prepared for dielectric analysis were 2 mm thick.
4.2 Characterization
Surface modifications of hBN and the fillers morphologies of the composites were studied in
this work. Furthermore, multifunctional properties and different characteristics of various
samples, including effective thermal conductivity (keff), electrical conductivity (σ), and
coefficient of thermal expansion (CTE) of all samples were investigated. All reported
measurements were determined by analyzing three samples.
4.2.1 Surface Modifications of hBN
A thermogravimetric analyzer (TGA, TA Instruments, model Q50) was used to qualitatively
investigate the amount of amino silane bonded to the hBN fillers’ surfaces. hBNPTX60 (i.e.,
spherical agglomerates), with or without surface modifications, were heated to 900°C at
20°C/min under nitrogen gas flow protection. The weight loss upon the heating were
recorded and analyzed.

56
4.2.2 Composite Morphologies
The dispersion of the filler systems in the compression molded samples was examined on a
scanning electron microscope (SEM, JEOL, model JSM6060) operated at 20 kV. Sample
cross-sections were obtained by cooling and fracturing the composites in liquid nitrogen.
The cross-sections were sputter coated with platinum prior to the SEM analyses.
4.2.3 Effective Thermal Conductivity
A thermal conductivity analyzer (in accordance to ASTM E1225-04) [99] was used to
measure keff at 150°C. The analyzer measures the sample’s k by comparing the temperature
gradient across the sample to that across a pair of stainless steel 304 reference bars. Heat
sink silicone compound was applied at the interfaces between the sample and the reference
bars to enhance the thermal contact and reduce the thermal resistance.
4.2.4 Coefficient of Thermal Expansion
The coefficient of thermal expansion (CTE) was measured using a Thermomechanical
Analyzer (TMA, TA Instruments Q400). The composites were heated to 200°C at a rate of
10 °C/min. The CTEs were determined from the slope of the plot at 50°C and 150°C,
depicting change in dimension and temperature.
4.2.5 Impedance
The Impedance (Z) of the composites were obtained by a dielectric/impedance analyzer
(Novocontrol Technologies, model Alpha-N). A root-mean-square (rms) voltage of 1V was
applied over a frequency of 10-2 to 10-5 Hz. The measurements were used to determine if the
electrical insulating properties of the PPS had been suppressed by the inclusion of various
filler systems.

57
4.3 Results and Discussion
4.3.1 Surface Modification of hBN
Amino silane ((C2H5O)3SiC3H6NH2) is a common coupling agent used to improve the bond
between inorganic and organic fillers. It was used in this study to modify the surface of some
of the composites containing hBN. As previously discussed, high thermal interfacial
resistance exists when filler materials are added into a polymer matrix. One suggested
method of improving the interfacial adhesion was through the chemical functionalization of
both the polymer and filler. Upon evaluating data regarding the thermal conductivity of
treated polymer composites, the results were not as expected. As seen in Figure 4-2, the
addition of amino silane to the hBNPTX60 did not yield favorable results. Studies have also
shown decreases in thermal conductivity with excessive amounts of silane [3]. If the coating
of silane on the surface of the particle is too large, then it may act as a thermal barrier and
decrease the thermal conductivity. In a study by Yung et. al., it was reported that 1 wt.%
coupling agent was sufficient to enhance thermal conductivity, but 2 wt.% was
counterproductive causing decreased thermal conductivities [3]. The opposite may also be
true, where hBN was not coated enough to have strong polymer-filler interfaces in the
composites.
The fractional loss in weight of hBNPTX60, with and without surface modification by amino
silane, is shown in Table 4-5. Since the organic coupling agent is volatile compared to hBN,
the fractional loss in weight of the silane-treated hBN particles after heating to a high
temperature relates to the amount of silane present. TGA results revealed that the amounts of
volatile/decomposable materials on the as-received hBN particles were negligible. For the
treated hBN particles, the amounts of weight loss on the silane treated hBNPTX60 particles
were much higher.

58
Figure 4-2: Effect of using a silane-based coupling agent on PPS-hBN composites
Table 4-5: Fractional loss in mass of hBN particles upon heating to 900 ˚C
hBNPTX60 Filler Fraction Mass Loss
as received < 0.05%
surface modified 1.13%
4.3.2 Effect of Hybrid Fillers on the PMC’s Effective Thermal Conductivity
Figure 4-3 shows the effect of filler compositions on keff of the PPS-based composites
embedded with 33.3 vol.% of hybrid fillers. The keff PPS-hBN composites filled with
hBNPTX60 only were increased from 0.22 W/mK of the neat PPS to 1.77 W/mK, respectively.
SEM micrographs of PPS-hBNPTX60 composite are shown in Figure 4-4. Although hBNPTX60
particles are 60 µm spherical agglomerates, Figure 4-4 reveals that the agglomerates had
been broken down into very fine (< 10 µm) during compounding and compression molding.
The smaller hBN platelets in the PPS-hBNPTX60 composite would lead to a higher filler

59
population density than the PPS-hBNPTX60 composite if the fillers remained spherical. This
would enhance the formation of thermally conductive network in the PPS matrix, and
thereby increased the PMC’s keff.
Furthermore, the effects of adding electrically conductive secondary fillers with high aspect
ratios (i.e., CF, MWNT, and GNP) to the PPS-based composites filled with hBNPTX60 on keff
were investigated. Figure 4-3 indicates that the inclusion of CF as secondary filler led to
limited increases in the PMC’s keff when hBNPTX60-to-CF volume ratios were 27:6.3 and
25:8.3 despite the bridging of hBN fine platelets by CF as illustrated in Figure 4-5. It is
believed that hBNPTX60 and CF would not be an appropriate hybrid filler combination to
promote PMC’s keff. In contrast, keff measurements indicated that MWNT and GNP were
effective secondary fillers. Figure 4-3 shows that PPS-based composites filled with
hBNPTX60 and MWNT and hBNPTX60 and GNP exhibited substantial promotion in the
composite’s k. Comparing to keff of 1.77 W/mK for the PPS-based composites with single
hBNPTX60 fillers, the values of keff for composites filled with 27:6.7, 25:8.3, and 22:11
volume ratios of hBNPTX60 and MWNT, and hBNPTX60 and GNP hybrid fillers were
increased to as much as 2.7 W/mK.

60
Figure 4-3: Effects of hybrid filler compositions on PMC's keff
Comparing the three combinations of hybrid fillers, which include (i) hBNPTX60 with CF, (ii)
hBNPTX60 with MWNT, and (iii) hBNPTX60 with GNP, the synergistic effects were found to
be the best for the composites with hBN with GNP, followed by that with hBN with MWNT.
However, hybridizing hBN with CF showed limited improvement over composites filled
with the same loading of single hBN fillers. Because the ratios of filler’s thermal
conductivity to the matrix’s thermal conductivity are over 100 times for hBN, CF, MWNT,
and GNP the additional improvement in the PMC’s keff values for composites filled with
hBNPTX60 with GNP should not be caused by the higher k of the GNP [37]. In contrast, the
promotion of PMC’s keff is believed to be attributed to the shapes and sizes of the secondary
fillers. Among the three types of secondary fillers (i.e., CF, MWNT, and GNP), GNP has the
highest aspect ratio (i.e., ~2500). For CF and MWNT, their aspect ratios (i.e., ~20, and
~1000 respectively) are less than that of GNP; however, MWNT have higher aspect ratio
than CF, leading to its higher surface area in the PMC than CF. Using the dimensions of the
fillers, their total surface area in the composites were estimated, and the results are shown in
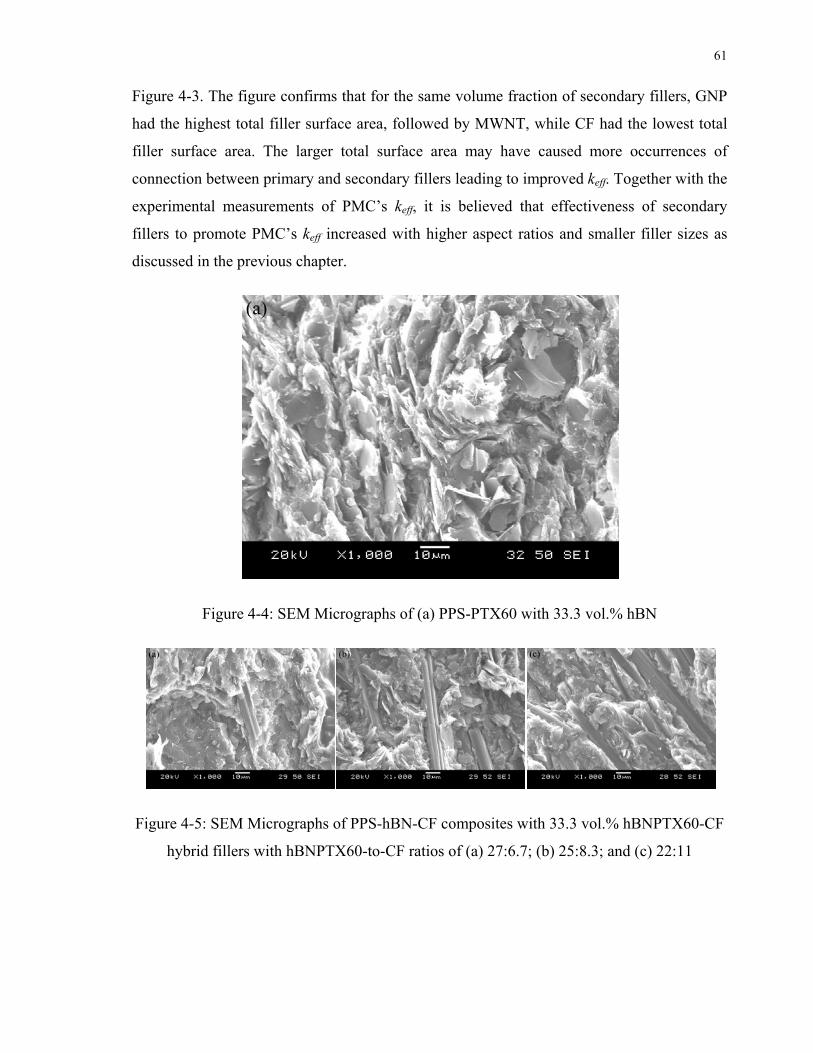
61
Figure 4-3. The figure confirms that for the same volume fraction of secondary fillers, GNP
had the highest total filler surface area, followed by MWNT, while CF had the lowest total
filler surface area. The larger total surface area may have caused more occurrences of
connection between primary and secondary fillers leading to improved keff. Together with the
experimental measurements of PMC’s keff, it is believed that effectiveness of secondary
fillers to promote PMC’s keff increased with higher aspect ratios and smaller filler sizes as
discussed in the previous chapter.
Figure 4-4: SEM Micrographs of (a) PPS-PTX60 with 33.3 vol.% hBN
Figure 4-5: SEM Micrographs of PPS-hBN-CF composites with 33.3 vol.% hBNPTX60-CF
hybrid fillers with hBNPTX60-to-CF ratios of (a) 27:6.7; (b) 25:8.3; and (c) 22:11
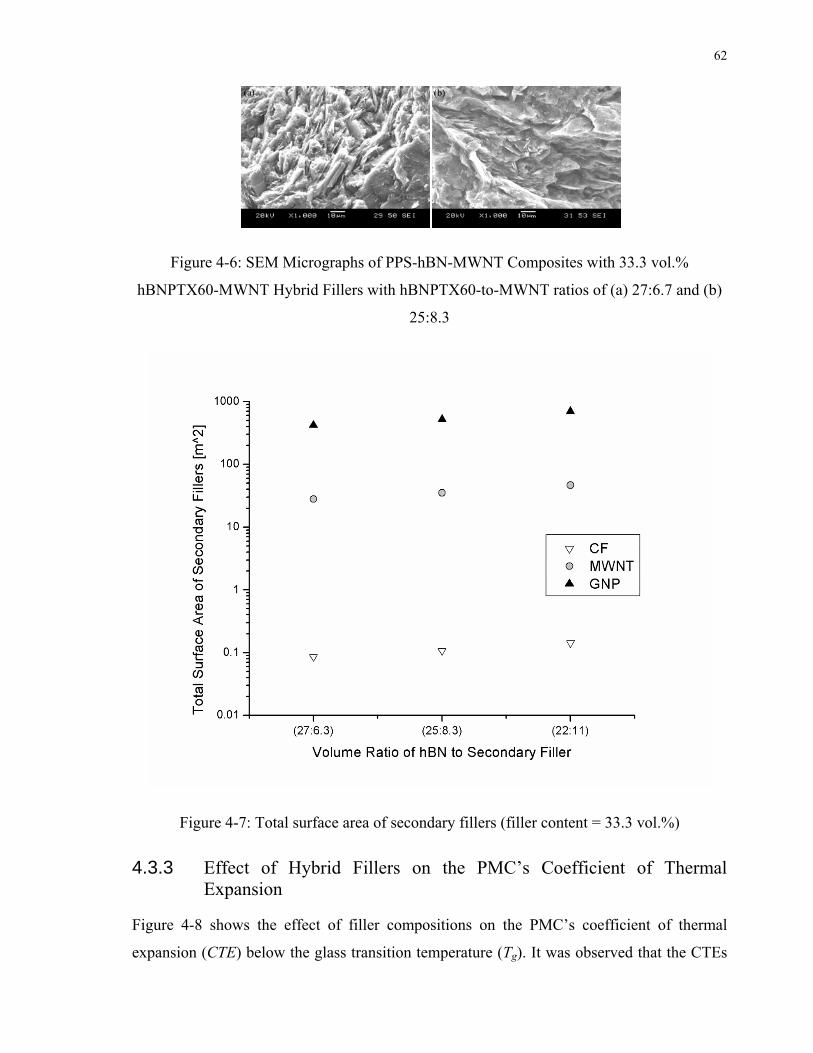
62
Figure 4-6: SEM Micrographs of PPS-hBN-MWNT Composites with 33.3 vol.%
hBNPTX60-MWNT Hybrid Fillers with hBNPTX60-to-MWNT ratios of (a) 27:6.7 and (b)
25:8.3
Figure 4-7: Total surface area of secondary fillers (filler content = 33.3 vol.%)
4.3.3 Effect of Hybrid Fillers on the PMC’s Coefficient of Thermal Expansion
Figure 4-8 shows the effect of filler compositions on the PMC’s coefficient of thermal
expansion (CTE) below the glass transition temperature (Tg). It was observed that the CTEs

63
of all PMCs were lower than that of the neat PPS. The particle size distribution and size have
been reported as factors that might influence the CTE of the composite system [100].
Moreover, the hybrid fillers also allowed more efficient packing of the fillers in the PPS
matrix, leading to slightly lower CTE. This efficient packing of fillers is more obvious when
CTE of BN:GNP is studied. The similar structure but very different size of BN and GNP
allowed for more efficient packing of hybrid fillers. SEM micrographs in Figure 4-9 confirm
the presence of efficient packing of BN and GNP in the polymer matrix. Nevertheless, since
the total filler contents for all composites fabricated in this work were maintained to be
constant (i.e., 33.3 vol.%), their CTEs were very close to each other for the same set of
hybrid fillers.
Figure 4-8: Effects of hybrid filler composition on PMC's CTE (below the glass transition
temperature of PPS)

64
Figure 4-9: SEM Micrographs of PPS-hBN-GNP Composites with 33.3 vol.% hBNPTX60-GNP Hybrid Fillers with hBNPTX60-to-GNP ratios of (a) 27:6.7; (b) 25:8.3; and (c) 22:11
4.3.4 Effect of Hybrid Fillers on the PMC’s Impedance
The impedance (Z) of the PMCs embedded with different hybrid filler systems was
measured and the results are plotted in Figure 4-10 to Figure 4-12. All of the graphs show
that Z of PPS-based composites filled with only hBN remained low and similar to that of
neat PPS. In other words, the electrical insulating properties of PPS would not be
compromised with the addition of hBN. Figure 4-10 shows that, when the hBNPTX60 to CF
volume ratios were 26:6.3 and 25:8.3, the impedance of the PPS-hBNPTX60-CF composites
were also very similar to that of PPS-based composites filled with only hBN. However,
when the hBNPTX60 to CF volume ratio changed to 22:11, the PMC’s Z decreased
significantly. For this filler composition, the volume fraction of CF was 11.1 vol.%, which
was higher than the percolation threshold (i.e., 9.0 vol.% for CF) reported by Chingerman et
al [101], resulting in the dramatic decrease in the PMC’s Z. Furthermore, for the two PMCs
filled with hBNPTX60 and MWNT, their Z were significantly lower than those of all other
composites. The volume fractions of MWNT in the PPS-hBNPTX60-MWNT composites were
6.7 vol.% and 8.3 vol.% when the hBNPTX60 to MWNT volume ratios were 26:6.3 and
25:8.3, respectively. Therefore, the MWNT contents in both composites were significantly
higher than the percolation threshold reported in literature [102]. Furthermore, the frequency
independent behavior of PPS-hBN-MWNT composites’ Z reinforced the idea of the
formation of continuous conductive pathways that interconnected the MWNTs between the
two electrodes in the dielectric analyzer. In short, the Z measurements of various hybrid
filler system suggested that the choice and amount of secondary fillers can not only promote
the PMC’s keff but also serve as parameters to tailor the its Z. Similar phenomenon was

65
observed with the PPS-hBNPTX60-GNP composites where 6.7 vol.% of GNP showed similar
Z to that of Neat PPS and PPS-hBNPTX60 composites. Whereas, 11 vol.% of GNP showed
drastic decrease in Z of the PPS-hBNPTX60-GNP composites showing that the GNP content is
well above the percolation threshold. Furthermore, Figure 4-12 reveals that the percolation
threshold of GNP in PPS-hBNPTX60-GNP is somewhere between 6.7 vol.% and 8.3 vol.% of
GNP, which is significantly higher than that of MWNT and significantly lower than that of
CF. This is believed to be due to the structure of MWNT that allows it to form connective
pathways in the composites at very low filler content, as discussed in the previous chapter.
Even though the amount of MWNT in PPS-hBNPTX60-MWNT composites was above the
percolation threshold, it only led to few orders of magnitude decrease in Z without resulting
in the same degree of increase in the PMC’s keff. It is believed that the inter-filler contacts
(i.e., hBNPTX60-hBNPTX60, MWNT-MWNT, and hBNPTX60-MWNT) might also have
considerable thermal contact resistance, suppressing the potential to significantly enhance
PMC’s keff by the thermally conductive fillers. In other words, strategies to reduce such
thermal contact resistance among embedded fillers would need to be further investigated to
unleash the full potential of PMCs in the electronic packaging industry as the addition of
silane did not seem to be efficient.
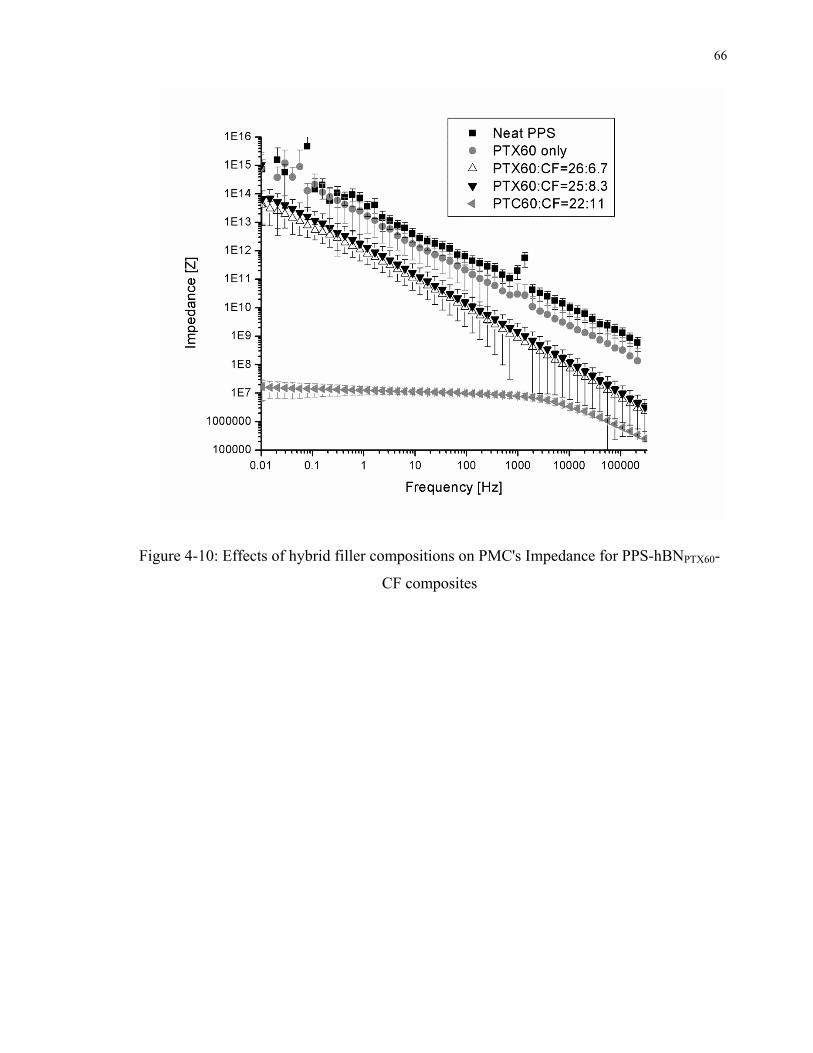
66
Figure 4-10: Effects of hybrid filler compositions on PMC's Impedance for PPS-hBNPTX60-
CF composites

67
Figure 4-11: Effects of hybrid filler compositions on PMC's Impedance for PPS-hBNPTX60-
MWNT composites

68
Figure 4-12: Effects of hybrid filler compositions on PMC's Impedance for PPS-hBNPTX60-
GNP composites
4.3.5 Dielectric Constant
For electronic packaging applications, low electrical conductivity is required; however,
measure of dielectric constant can be beneficial in static charge dissipation. Figure 4-13
shows the dielectric constants of PMC embedded with different hybrid fillers. It is observed
that the composites filled with only hBNPTX60 did not have an increase in dielectric constant
(ε) at all. This shows that PMC’s embedded with only hBNPTX60 fillers can be used for
applications where high thermal conductivity and low dielectric constant (< 3) is desired i.e.
for Ultra Large Integrated Circuits (ULSI). No significant increase in ε of PPS-hBNPTX60-CF
composites was observed and the keff of these composites was very similar to that of PPS-
hBNPTX60 composites. However, ε did increase to about 10 for the composites with 11 vol.%
of CF fillers. This shows that these composites may be used for electronic packaging

69
materials, for which 3 < ε < 50 is sought to dissipate static discharge. PPS-hBNPTX60-
MWNT composites showed the most increase in ε with the value reaching 80 for 11vol.% of
MWNT. These composites can; therefore, be used for capacitors as well as electronic
packaging applications. On the other hand, ε of PPS-based composites filled with GNP
showed a range of 10-40. This shows that PPS-hBNPTX60-GNP composites are good
materials for electronic packaging application. The volume fractions of GNP in the PPS-
hBNPTX60-GNP composites were 6.6%, 8.25%, 11%, which are beyond its percolation
threshold [102]. It is concluded that the ε of PPS filled with hybrid fillers can be tailored by
varying the secondary filler content in the composites. As seen in the figure, not only
increasing the secondary filler content increased the ε but the type of filler also played major
role. Therefore, a particular combination of hBN and electrically conductive secondary filler
may be chosen to obtain thermal and electrical properties for ULSI, capacitor, and/or
electronic packaging applications.
Figure 4-13: Dielectric constant of PPS-based hybrid fillers

70
4.4 Micromechanical Modeling of Thermal Conductivity
Figure 4-14 to Figure 4-16 depict the results of Nielsen, parallel, and geometric models
compared to the experimental data. Since Nielsen and geometric-mean models had shown
more accurate results for PPS embedded with carbon-based filler, they were used here along
with parallel model to show the lower bound of the keff. As we know, the series model
overestimates and parallel model underestimates the thermal conductivity of the composites
as they are the theoretical upper and lower limits, respectively. However, geometric-mean
model very closely predicts the thermal conductivity of all the composites. All of these
models show a trend of increase in thermal conductivity with the increase in secondary filler
content i.e. CF, MWNT, and GNP. The reason for this trend is that the secondary fillers have
significantly higher thermal conductivity than hBN. However, none of the models takes into
consideration the interaction between the hybrid fillers and the resulting conductive
pathways. A more accurate model that takes into account the presence of two or more fillers
along with their size, structure, and orientation would more accurately predict the thermal
conductivity of these composites.

71
Figure 4-14: Theoretical predictions for thermal conductivity compared to experimental
results for PPS-hBN-CF composites

72
Figure 4-15: Theoretical predictions for thermal conductivity compared to experimental
results for PPS-hBN-MWNT composites

73
Figure 4-16: Theoretical predictions for thermal conductivity compared to experimental
results for PPS-hBN-GNP composites
4.5 Possibility of Replacing Kapton with the Polymer Composites
In natural convection and radiation, the optimum configuration of heat sink can be
investigated by numerical study. Some measurements were conducted to see the effect of
replacing currently used Kapton tape with the polymer composites. It was observed that
aluminum heat sinks with polymer composite base plate showed higher decrease in the
maximum temperature than the heat sink with Kapton base plate. Some infra-red images of
this new heat sink design are shown in Figure 4-17 and Figure 4-18 . Since the proposed
polymer composites are electrically insulative and thermally conductive, they will be ideal
materials to replace currently used Kapton tape.

74
Figure 4-17: The maximum temperature of the heat source measured for Aluminum heat
sink with a. no base plate b. with Kapton base plate and c) with PPS-33vol.% hBN
Figure 4-18: The maximum temperature of the heat source measured for Aluminum heat
sink with a. PPS-33 vol.% (hBN:MWNT=3:1), b. PPS-33 vol.% (hBN:CF = 2:1), and c.
PPS-33 vol.% (hBN:CF = 3:1) base plates
4.6 Summary Polyphenylene sulfide (PPS) based composites filled with hybrid fillers, consisting of
hexagonal boron nitride (hBN) with multi-walled carbon nanotube (GNP) were found to
have enhanced effective thermal conductivity (keff), while composites filled with hBN and
pitch-based carbon fiber (CF) had limited increase in keff. In the hybrid system, the secondary
filler promotes the interconnection among the primary fillers through the formation of a
structured network to facilitate the heat conduction across the materials. On the other hand,
for each combination of hybrid filler systems, there exists an optimal volume ratio between
the hybridizing fillers. Experimental results demonstrated that secondary fillers that have
higher aspect ratio and smaller size (e.g., GNP) were more effective in promoting the
composite’s thermal conductivity.

75
Furthermore, when carbon-based secondary fillers (e.g., CF, MWNT, and GNP) were used,
the composites’ impedance (Z) decreased significantly when the volume fractions of these
electrically conductive fillers were over the percolation threshold. This phenomenon was
caused by the formation of electrically conductive pathways throughout the composite
samples. In other words, it would be possible to control the type and loading of electrical
conductive filler as the secondary filler in order to tailor the electrical conductivity of a
polymer matrix composite (PMC).
Despite the significant decrease in Z for PMCs filled with GNP as the secondary filler, these
PMCs did not exhibit the same degree of increases in their keff. Such results suggest that
considerable thermal contact resistance might also exist at the polymer-filler contacts. In
other words, continuous research efforts by adding more efficient compatiblizer would need
to be made in developing strategies to lower this resistance in order to take advantage the
full potential of polymer PMCs in the electronic packaging industry.

76
Chapter 5 Composites with Aligned Polymer Fibers
5 Introduction
Polymer composite materials embedded with various conductive fillers with many
application possibilities have extensively been developed recently. The advantages of these
materials over traditional materials (metals and other) are reduced density and increased
processability due to polymer matrix [66]. However, addition of large amount of conductive
fillers to increase the thermal conductivity makes the composite counter-productive as the
processibility is severely affected and electrical conductivity is increased. For electronic
packaging applications, new composite materials that have high thermal but low electrical
conductivities are desired. It is known that the thermal and electrical conductivity of a
material depends on two different mechanisms i.e. by lattice vibration or by the presence of
free electrons, respectively. Therefore, it is proposed that polymer fibers may be introduced
and aligned in a composite in order to increase the thermal conductivity but keeping the
electrical conductivity low. This chapter discusses the fabrication of composites with aligned
polymer fibers and their effect on composite’s thermal conductivity while keeping it
electrically insulative with the addition of filler content below the percolation threshold.
Liquid crystal polymer (LCP), which has higher thermal conductivity than PPS as well as
other unique properties that help in fiber formation, was chosen as the matrix material. GNP
was chosen as the filler material due to its ability to improve thermal conductivity
remarkably better than other fillers (such as BN, CF, and MWNT).
5.1 Experimental
5.1.1 Materials
Due to the high thermal stability, shear-thinning effect, and the ability to align the molecules,
liquid crystal polymer (LCP) was selected as the matrix of the composite. High thermal
stability was an important factor in the selection of matrix because electronic components
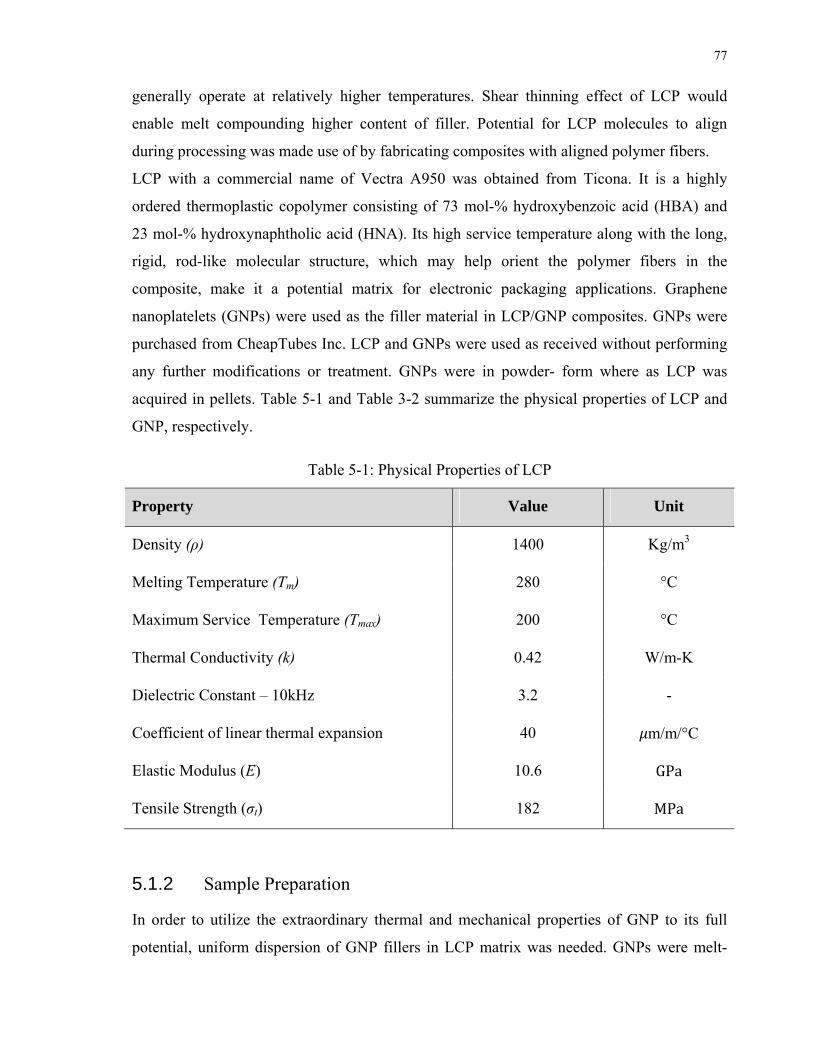
77
generally operate at relatively higher temperatures. Shear thinning effect of LCP would
enable melt compounding higher content of filler. Potential for LCP molecules to align
during processing was made use of by fabricating composites with aligned polymer fibers.
LCP with a commercial name of Vectra A950 was obtained from Ticona. It is a highly
ordered thermoplastic copolymer consisting of 73 mol-% hydroxybenzoic acid (HBA) and
23 mol-% hydroxynaphtholic acid (HNA). Its high service temperature along with the long,
rigid, rod-like molecular structure, which may help orient the polymer fibers in the
composite, make it a potential matrix for electronic packaging applications. Graphene
nanoplatelets (GNPs) were used as the filler material in LCP/GNP composites. GNPs were
purchased from CheapTubes Inc. LCP and GNPs were used as received without performing
any further modifications or treatment. GNPs were in powder- form where as LCP was
acquired in pellets. Table 5-1 and Table 3-2 summarize the physical properties of LCP and
GNP, respectively.
Table 5-1: Physical Properties of LCP
Property Value Unit
Density (ρ) 1400 Kg/m3
Melting Temperature (Tm) 280 °C
Maximum Service Temperature (Tmax) 200 °C
Thermal Conductivity (k) 0.42 W/m-K
Dielectric Constant – 10kHz 3.2 -
Coefficient of linear thermal expansion 40 m/m/°C
Elastic Modulus (E) 10.6 GPa
Tensile Strength (σt) 182 MPa
5.1.2 Sample Preparation
In order to utilize the extraordinary thermal and mechanical properties of GNP to its full
potential, uniform dispersion of GNP fillers in LCP matrix was needed. GNPs were melt-

78
compounded with LCP in DSM Xplore 15 microcompounder to uniformly disperse the
fillers in the matrix. In order to keep the composites’ electrical conductivity low, the GNP
content in LCP was kept below 5 wt.%. As discussed in Section 4.3.4, the percolation
threshold of GNP lie between 5 wt. % and 10 wt.%. LCP and GNP were melt- mixed in the
micro-compounder at 300 ˚C for 10 minutes at 100 rpm. The twin-screws were rotated at a
high rpm in order to get the stacked graphene sheets separated into individual sheets
resulting in its uniform dispersion. The drawing system depicted in Figure 5-1 was used to
extrude composite fibers from the compounder. After melt-mixing LCP and GNP in the
compounder at 100 rpm for 10 mins, the rpm was reduced to 1 rpm and the drawing system
was utilized to pull out the fibers and spin them into spools. Spools of neat LCP, 1 wt.%
GNP/LCP and 5 wt.% GNP/LCP were compounded and spun.
Figure 5-1: Fiber drawing system
To be consistent with our previous experimental studies, it was required that cylindrical
samples, 1 cm in height and 2 cm in diameter, were compression molded or sintered for
thermal conductivity measurements. The extruded fibers were cut into 10 cm long stacks and
were sintered for 1 hr into thin films using a compression molder at 250˚C at 5000 psi. The
sintered films were then cut into 1 cm long thin sheets with variable widths. These thin
sheets were stacked in a cylindrical mold such that the fibers were aligned vertically (i.e.
along the heat flux direction). The mold was stacked with 3 g of sintered films because this
was the maximum mass that could be stacked. The remaining mold volume corresponding to
a mass of about ~1.5 g was filled with individual extruded fibers, with a draw ratio of 50, cut
into small pieces of about 1-3 cm in length. A total mass of ~ 4.5 g was required for each
sample. The draw ratio can be defined as the ratio between the nozzle’s diameter to the

79
extruded fiber’s diamter. These samples were then compression molded by heating them up
to 310 ˚C at 3000 psi for 20 mins. The top and bottom surfaces of these samples were sanded
to make them flat. After the samples were tested for thermal conductivity, they were cut in
half. One half was used for SEM images and the other half was sanded to be used for
electrical conductivity measurements.
There was a concern that the composites may lose the vertical alignment of polymer fibers in
the disks during the compression molding process. Therefore, it was proposed that a set of 1
wt.% GNP/LCP be made by compression sintering them to 250˚C (SA) and a set of samples
be made by compression molding them to 310˚C (MA2), to comprehensively study the
effect of alignment of polymer fibers on the thermal and electrical properties. Furthermore,
in order to see the true effect of alignment of the thermal and electrical properties, two more
sets of 1 wt.% GNP/LCP were made i.e. (1) by conventional method that was used in the
previous studies (C) and (2) by compression molding and compression sintering randomly
oriented extruded fibers (MR, and SR respectively). To completely study the effect of the
filler content on the material’s properties neat LCP (MA1) and 5wt.% GNP/LCP (MA3)
composites with aligned polymer fibers were compression molded. Therefore, the
comparison between the samples MA1, MA2, and MA3 would provide the effect due to
change in filler content. The comparison between the samples C, MA2, and MR would
provide the effect of alignment. By comparing samples MA2 and SA, and MR and SR effect
of melting and sintering the samples could be obtained. And lastly, comparing samples MA2
and MR, and SA and SR effect of aligning extruded fibers along the heat flow direction
versus randomly orienting the extruded fibers could be observed.
5.1.3 Characterization
The multifunctional properties studied in this chapter are the effective thermal conductivity
(keff), impedance (Z), and dielectric constant (ε). The morphology of LCP/GNP composites
was also explored to study the possible correlation between the phase morphology and the
multifunctional properties. The k of the composites was measured by a thermal conductivity
analyzer (ASTM E1225-05) [99] at 150 ˚C. The Z and ε were measured using a dielectric
analyzer (Alpha-N-Novocontrol Technologies) over a frequency range of 10-2 to 105 Hz with

80
an applied AC voltage of 1 V. The morphology of the composites was investigated by
looking at the cross-section of the composites that were fractured in liquid nitrogen and then
analyzed with a scanning electron microscopy, JEOL SEM model JSM6060.
5.2 Results and Discussion
5.2.1 Effect of Temperature and Orientation on the Alignment of Polymer Fibers
Figure 5-2 shows the thermal conductivity (k) of four sets of 1 wt.% GNP/LCP composites
fabricated by different methods. Extruded fibers with a draw ratio of 50 were used to
compression mold/sinter all four sets of samples i.e. MA2, SA, MR, and SR. MA2 and SA
sets of samples were fabricated by aligning the extruded fibers with a draw ratio of 50 along
the direction of heat flux i.e. axially along the disk. MA2 was heated up to 310 ˚C i.e. it was
compression molded whereas SA was heated up to 250 ˚C i.e. it compression sintered. Sets
of samples MR and SR were fabricated by randomly filling the cavity of the mold with 1 – 3
cm long extruded fibers of draw ratio 50. MR was heated up to 310 ˚C i.e. it was
compression molded whereas SR was heated up to 250 ˚C i.e. it was compression sintered.
Figure 5-2 illustrates that the compression molded samples showed better results than the
compression sintered samples for both sets of composites filled with aligned and randomly
oriented fibers. The reason could be the strong polymer-polymer interface in the
compression molded composites resulting in higher phonon transfer across the sample. The
compression sintered compoisites would have poor polymer-polymer iterface due to lack of
continuous polymer chain networks. Furthermore, sets of samples with aligned polymer
fibers showed better keff than randomly oriented fibers. As predicted, the improvement can be
attributed to the alignment of polymer fibers along the heat flux promoting the transfer of
phonon more efficiently.

81
Figure 5-2: Effect of Compression Sintering and Compression Moldingon the Thermal Conductivity
The difference in keff values are supported by the SEM images shown in Figure 5-3 through
Figure 5-6. Figure 5-3 and Figure 5-4 show the SEM micrographs of compression molded 1
wt.% GNP/LCP composites filled with aligned and randomly oriented fibers, respectively.
The common feature in both composites was the presence of voids. As discussed in earlier
chapters, these voids are the result of limitation of the fabrication method; i.e. when the
material is melted in the mold, the material starts to leak leaving less than required amount
of material in the mold. Hence, voids develop in the samples when the mold is cooled down.
These voids are of more importance for this study as they tend to distort and affect the
alignment of polymer fibers. Another common feature in theses samples is that the fracture
surfaces look very similar. The aligned samples show very little evidence of global
alignment of fibers even though local polymer fiber alignment can be observed in both
alinged and random samples. The presence of voids may have distorted the possibility of
having global polymer fiber alignment in molten-compression molded samples.
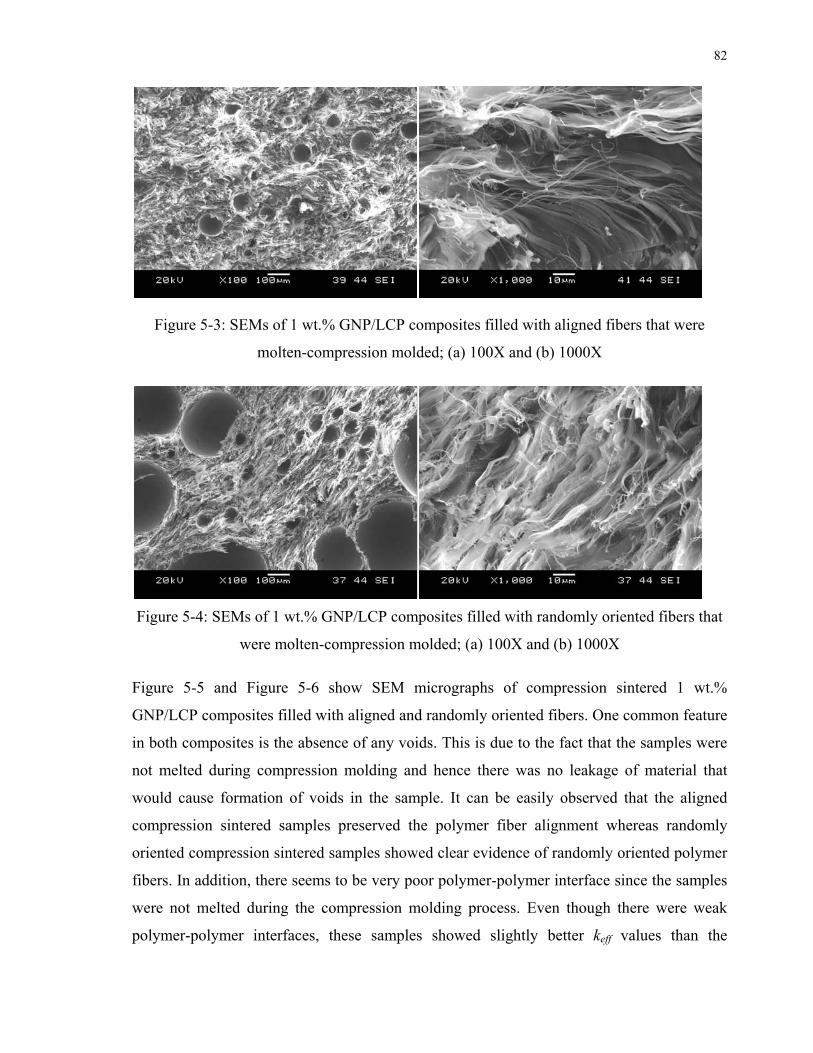
82
Figure 5-3: SEMs of 1 wt.% GNP/LCP composites filled with aligned fibers that were
molten-compression molded; (a) 100X and (b) 1000X
Figure 5-4: SEMs of 1 wt.% GNP/LCP composites filled with randomly oriented fibers that
were molten-compression molded; (a) 100X and (b) 1000X
Figure 5-5 and Figure 5-6 show SEM micrographs of compression sintered 1 wt.%
GNP/LCP composites filled with aligned and randomly oriented fibers. One common feature
in both composites is the absence of any voids. This is due to the fact that the samples were
not melted during compression molding and hence there was no leakage of material that
would cause formation of voids in the sample. It can be easily observed that the aligned
compression sintered samples preserved the polymer fiber alignment whereas randomly
oriented compression sintered samples showed clear evidence of randomly oriented polymer
fibers. In addition, there seems to be very poor polymer-polymer interface since the samples
were not melted during the compression molding process. Even though there were weak
polymer-polymer interfaces, these samples showed slightly better keff values than the

83
samples made using conventional method due to the fiber extrusion that caused molecular
chains alignment.
Figure 5-5: SEMs of 1 wt.% GNP/LCP composites filled with aligned fibers that were
sintered-compression molded; (a) 100X and (b) 1000X
Figure 5-6: SEMs of 1 wt.% GNP/LCP composites filled with randomly oriented fibers that
were sintered-compression molded; (a) 100X and (b) 1000X
It can be concluded that the alignment of polymer fibers effectively improved the keff of the 1
wt.% GNP/LCP composites. Furthermore, compression molded samples showed the best
results even though there seems to be potential of further improvement in the keff value by
reducing the possibility of void formation that seemed to have distorted the alignment. It was
also observed that although the compression sintered samples preserved the polymer fiber
alignment, they lacked efficient fiber-fiber interface. Therefore, for the filler content study,
compression molded fabrication method was selected.

84
5.2.2 Effect of GNP Content on the Effective Thermal Conductivity of the LCP/GNP Composites Fabricated by Aligning Polymer Fibers
Figure 5-7 shows the keff values of neat LCP, 1 wt. % GNP/LCP, and 5 wt.% GNP/LCP
fabricated by the alignment method, and neat LCP, 1 wt.% GNP/LCP and 10 wt.%
GNP/LCP fabricated by the conventional method. This graph clearly shows that the
alignment of polymer fibers greatly improved the k value of the LCP/GNP composites. As
can be observed, the keff of 1 wt.% GNP/LCP with aligned polymer fibers is significantly
higher (~130%) than the keff of 10 wt.% GNP/LCP. Furthermore, it is observed that the keff of
neat LCP can also be improved by just aligning the polymer fibers i.e. the k of neat LCP was
almost doubled due to alignment of polymer fibers. Figure 5-9 shows that there is no
evidence of LCP fibers in the 1 wt.% GNP/LCP composites that were fabricated by
conventional method. On the other hand, clear presence of polymer fibers was observed in
Figure 5-5 that showed the SEMs of 1 wt.% GNP/LCP fabricated using extruded fibers with
the draw ratio of 50.

85
Figure 5-7: Comparison of thermal conductivity of LCP/GNP composites fabricated by
conventional method and by the polymer fiber alignment method
Furthermore, it was observed that the degree of alignment increased as the filler content
increased. As evident by the Figure 5-5, Figure 5-8, and Figure 5-10, the global alignment of
polymer fibers increases significantly as the filler content was increased. These figures also
show that the formation of micro-size voids in the composites severely disrupted the
possibility of preserving alignment of polymer fibers throughout the sample. The increase in
keff can; therefore, be explained by the presence of aligned polymer fibers that help in
transfer of phonons from one end of the sample to the other. However, it seems that the full
potential of alignment to improve keff was not utilized due to the formation of voids and the
loss of alignment by compression molding.

86
Figure 5-8: SEM micrographs of neat LCP with aligned polymer fibers fabricated by
compression molding method; (a) 100X and (b) 1000X
Figure 5-9: SEMs of 1 wt.% GNP/LCP composites fabricated using the conventional
method; (a) 100X and (b) 1000X
Figure 5-10: SEM micrographs of 5 wt.% GNP/LCP composites with aligned polymer fibers
fabricated by compression molding method; (a) 100X and (b) 1000X

87
5.2.3 Effect of Alignment of Polymer Fibers on the Impedance of LCP/GNP Composites
Figure 5-11shows the change in impedance for different composites over a frequency range
of 10-2 Hz and 105 Hz. It is observed that the impedance of neat LCP, 1 wt.% GNP/LCP
fabricated by conventional method and 1 wt.% GNP/LCP fabricated by aligning the polymer
fibers are very similar. Also, the impedance (Z) of 5 wt.% GNP/LCP composites did not
decrease substantially proving that the percolation threshold of GNP had not reached yet. It
can be concluded that alignment of polymer fibers has no effect on the impedance. As
mentioned earlier, the different mechanism of thermal and electrical conductivity in material
are the reasons for increase in k and no change in Z of the composites aligned with polymer
fibers. For a polymer to become electrically conductive, presence of electrically conductive
particles is required in order to provide a network of mobile electrons. On the other hand,
ordered network of polymer chains rather than a network of filler particles is responsible for
higher k in polymers as reported by other researchers [72-74]. As discussed in the previous
chapters, the percolation threshold of GNP in a polymer is between 5 wt.% and 10 wt.%;
hence, no significant decrease in Z was observed for 5 wt.% GNP/LCP composites.
However, it is expected that the Z will reduce significantly as the GNP content is increase
above beyond its percolation threshold, which may have changed due to alignment of fibers.
Therefore, it is proposed that the alignment of LCP fibers in LCP/GNP composites can be
used to increase k but keeping the Z unchanged for electronic packaging applications where
thermally conductive and electrically insulative materials are desired.

88
Figure 5-11: Impedance of LCP/GNP Composites Fabricated by Alignment of Polymer
Fibers
5.2.4 Effect of Alignment of Polymer Fibers on the Dielectric Constant of LCP/GNP Composites
Figure 5-12 shows the change in dielectric constant (ε) for composites fabricated by aligning
extruded polymer fibers. It can be observed that the only change in dielectric constant is due
to the increase in the GNP content. For example, the ε was increased from 3 for neat LCP to
5 for 1 wt.% GNP/LCP, and to 10 for 5 wt.% GNP/LCP composites. However, no
significant change was noticed for the 1 wt.% GNP/LCP composites fabricated by
conventional and alignment methods. As mentioned earlier, this could be due to different
thermal and electrical conductivity mechanisms. Nevertheless, these composites are suited
for electronic packaging applications as the k is relatively high with low filler content and
the ε is greater than 3.

89
Figure 5-12: The change in dielectric constant of LCP/GNP composites as a function of filler
content
5.3 Summary
This chapter discussed the fabrication of composites with aligned polymer fibers and their
effect on composite’s thermal conductivity while keeping them electrically insulated with
the addition of filler content below the percolation threshold. Liquid crystal polymer (LCP)
that has higher thermal conductivity than PPS and has unique properties that help in fiber
formation was chosen as the matrix material. GNP was chosen as the filler material due to its
ability to improve thermal conductivity remarkably better than other fillers (such as BN, CF,
and MWNT). It was observed that thermal and electrical conductivity of a material depends
on two different mechanisms i.e. by lattice vibration and by the presence of free electrons,
respectively, since polymer fiber alignment had substantial improvement on keff but no effect
on Z. Voids formation in the samples distorted the alignment of polymer fibers resulting in

90
lower than expected k. Even though sintered samples did not show any voids they lacked
good polymer-polymer interfaces in order to achieve high keff values. Overall, compression
molded samples showed higher keff values than compression sintered samples. It is
concluded that the alignment of LCP fiber can possibly be used to increase the keff of
composites with the addition of filler content lower than the percolation threshold to keep
the composites electrically insulated while helping in the improvement of keff.

91
Chapter 6 Conclusions and Recommendations
6 Summary
There has been long-standing interest in flexible polymer materials for electronic packaging,
which are both thermally conductive and electrically insulating under various conditions.
Although being good electrical insulators, polymers are, in general, poor thermal conductors.
One solution to this problem is to design and fabricate polymer composites that have
improved thermal conductivity. Other advantages of polymer based electronic packaging
materials are low cost, ease of processibility, and chemical stability, which are all desired
properties. Even though many articles have been published on the improvement of thermal
conductivities of polymers by fillers and several on the electrical conduction mechanism and
models, little has been done on polymer materials providing both thermal conductivity and
electrical resistance under high temperature and high load conditions. It was, therefore, the
purpose of this thesis to fabricate different polymer composite systems to meet the above
challenges and characterize, in terms of their thermal, electrical, mechanical and
morphological characteristics. Three main studies were conducted:
1) High temperature polymer was mixed with carbon-based fillers of different sizes and
structures to study their effects on thermal and electrical properties.
2) Thermally conductive polymer composites with tailored electrical properties were
fabricated and characterized for electronic components with different requirements.
3) Composites with aligned polymer fibers were fabricated to study the possibility of
improving thermal conductivity while keeping the electrical conductivity low.
In the first study, high temperature engineering polymer, polyphenylene sulphide (PPS), was
melt-mixed with carbon– based fillers of different sizes and structures, such as carbon fiber
(CF), multiwall carbon nanotubes (MWNT), and graphene nanoplatelets (GNP). The filler
contents were varied from 0 wt.% to 30 wt.%. It is believed that thermal resistance at

92
polymer-polymer and polymer-filler interfaces may have caused keff to be a lot lower than
what was expected by the theoretical predictions. GNP, which had highest aspect ratio,
showed the most improvement in the thermal conductivity (keff) of the PPS based carbon-
filled composites. Furthermore, the higher total surface area of GNP fillers may have caused
the keff to be greater than the PPS filled with CF and MWNT particles. On the other hand,
electrical conductivity of all of these composites was increased substantially. Impedance
graphs for the composites showed that the percolation threshold for PPS/MWNT lies
between 1 wt.% and 5 wt.%, for PPS/GNP between 5 wt.% and 10 wt.%, and for PPS/CF
between 10 wt.% and 15 wt.%. These percolation threshold values were compared with the
statistical percolation model. Dielectric constants also increased directly proportional to the
filler content for all composites. Coefficient of thermal expansion, glass transition
temperature, and compressive modulus were not affected by the increase in the filler content.
It is believed that poor interfacial contact and the presence of voids may have contributed to
little-to-no effect on these properties.
In the second study, PPS was combined with 33 vol.% of hybrid fillers. Hexagonal boron
nitride, hBN, was the primary filler, used to improve the thermal conductivity whereas CF,
MWNT, and GNP were used as the secondary fillers to tailor the electrical properties of PPS
based composites. hBN is a much softer ceramic-based material, which also has a graphite-
layer structure providing a lubricating effect, and therefore, is more desirable for
manufacturing. It is believed that the improvement of keff was not only a result of increased
filler content, but also a synergistic effect of the hybrid fillers. For example, PPS filled with
33 vol.% of only hBN showed significantly lower keff (~ 150%) than the composites filled
with a combination of hBN and other carbon-based fillers. Among all the hybrid composites,
the combination of hBN and GNP showed the best keff. Dielectric analysis determined that
PPS-hBN-CF composites would be ideal for electronic packaging; PPS-hBN-MWNT
composites show good thermal and electrical properties for capacitors whereas PPS-hBN-
GNP composites showed thermal and electrical properties suitable for ULSI as well as
electronic packaging. The uniform dispersion of hybrid-fillers in the polymer matrix aided
in the formation of continuous conductive pathways, in turn increasing the keff of the
composites with tailored electrical properties by varying the hybrid filler ratio. A silane-
based coupling agent was also used in hopes of improving the interfacial thermal resistance

93
between the filler and matrix, along with improving the dispersion of particles within the
polymer. The addition of silane to the surface of hBN did not yield the desired results, and
further research in this area will have to be conducted.
The third study was conducted on exploiting the different mechanism of thermal and
electrical conductivity in a polymer matrix. The possibility of improving the thermal
conductivity and keeping the polymer’s electrical conductivity low by forming and aligning
the polymer fibers was investigated. Liquid crystal polymer (LCP), which was used as the
matrix material, was combined with GNP, which had showed best results in previous
studies. Samples were fabricated and characterized to see the effect of temperature on
polymer fiber alignment and the effect of filler content and the extrusion of fibers with a
draw ratio of 50 on the thermal and electrical properties. It was concluded that the filler
alignment was difficult to retain after the samples were compression molded. However, the
composite samples that were compression sintered were able to preserve the polymer fiber
alignment but the poor polymer-polymer interface resulted in relatively lower keff.
Furthermore, it was concluded that the electrical conductivity was not affected by the filler
alignment and was only increased as the filler content increased. Therefore, the different
mechanisms of thermal and electrical conductivity were discussed in order to analyze the
potential of fabricating polymer composites with aligned fibers by adding fillers at
concentrations lower than the percolation threshold.
Finally, data collected from micromechanical modeling was compared to the experimental
results for solid, single filler composites, in regards to their effective thermal conductivities.
None of the models fit the experimental data exactly. Nielsen’s was the only model used that
took shape, aspect ratio, and packing factor into consideration, and as such generally fit the
measured data the best. Most of the models underestimated the effective thermal
conductivity of the composites at low filler concentrations, likely because they assume the
fillers are discrete rod particles. All of the models also did not take interfacial thermal
resistance into account, which was a larger issue for high filler content composites.
In summary, the effective thermal conductivity (keff) of PPS/CF composites improved by
20%/vol.%, PPS/BN by 25%/vol.%, PPS/BN/CF by 25%/vol.%, PPS/MWNT by
30%/vol.%, PPS/BN/MWNT by 30%/vol.%, PPS/GNP by 35%/vol.%, PPS/BN/GNP by

94
37%/vol.%, and keff of aligned LCP/GNP improved by 100%/vol%. This shows that GNP
was an effective filler to improve keff, furthermore, the polymer fiber alignment shows great
potential to improve the keff of the composites to be used in the electronic packaging
industries. The polymer composite systems discussed in this report provide a starting point
to fabricate materials for electronic packaging thermal management, including high thermal
conductivities; low tailored coefficients of thermal expansion; weight savings of at least 50
percent; high strength and stiffness; and cost reductions. Composite materials are in a state
of continual development that will provide even greater benefits; hence, some
recommendations for future work are summarized in the next section.
6.1 Recommendations
The effective thermal conductivity of the composites was greatly affected by the
overwhelming presence of the interfacial thermal barrier. The resistance at the surface
between the matrix and filler materials provided a strong hindrance to even greater increases
in keff. An effective method of reducing phonon scattering, as a result of interfacial
resistance, is needed to improve the heat dissipation within a composite. A possible solution
to this problem could include a better coating of coupling agents on the surface of the filler
materials, allowing improved bonding of the particles to the matrix. Further studies to
develop a more effective method of coating the fillers could lead to a decrease in difference
between calculated keff values and experimental data.
Fabrication method for these composites should be modified to tackle the issues that may
have caused materials’ properties to deviate from the theoretical predictions. Nano-sized
fillers should be dispersed as uniformly as possible in order to form 3-D conductive network
at lower filler content. With current fabrication method, filler aggregates could be seen in the
SEM micrographs resulting in a higher than theoretical percolation threshold. Furthermore,
the SEMs revealed formation of voids in the samples. The current mold that is used for
compression molding does not prevent the leakage of materials upon melting. An improved
design of a compression mold is desired in order to reduce the presence of voids that could
have significantly affected the potential of the proposed composites to be used in the
electronic packaging industries.

95
The use of hybrid fillers in the formation of 3-D networks to tailor thermal and electrical
properties has a great potential in the electronic packaging industry. Only one filler
concentration, i.e. 33 vol.%, was investigated for the composites embedded with hybrid
fillers to see the maximum possible thermal conductivity. A more detailed parametric study
could be conducted in order to comprehensively determine the best set of hybrid fillers and
the optimal filler ratio in order to tailor the thermal and electrical properties for various
electronic components. Another approach to obtaining high thermal conductivity while
keeping the electrical conductivity low is by forming and aligning the polymer fibers along
the direction of heat flux. An improved fabrication method needs to be utilized in order for
the material to retain and preserve the polymer fiber alignment after they are molded into test
samples. Optimal parameters such as residence time, temperature, and pressure need to be
investigated to fabricate composites embedded with aligned polymer fibers.
Finally, finite element models (FEM) and rapid prototypes should be employed to determine
the effects of using the proposed multifunctional composite materials within typical heat
sink conditions. This process will aid in determining the feasibility of using these composites
and act as validation to this experimental work. The FEM models can also be further
developed and validated with the experimental data found in this research thesis, improving
the predictions. The materials proposed here could either be used as a compliment to the
current standards or as its own independent component, and therefore should be tested
within each capacity.

96
Bibliography
[1] C. Zweben, "Advances in Composite Materials for Thermal Management in Electronic
Packaging," JOM Journal of the Minerals , Metals, and MAterials Society, vol. 50, no.
6, pp. 47-51, 1998.
[2] Y.-M. Chen and J.-M. Ting, "Ultra high thermal conductivity polymer composites,"
Carbon, vol. 40, no. 3, pp. 359-362, 2002.
[3] M. Endo, M. S. Strano and P. M. Ajayan, "Potential applications of carbon
nanotubes," in Carbon Nanotubes. Advanced Topics in the Synthesis, Structure,
Properties and Applications, Berlin, Germany, Springer-Verlag, 2008, pp. 12-61.
[4] F. Mighri, M. A. Huneault and M. G. Champagne, "Electrically conductive
thermoplastic blends for injection and compression molding of bipolar plates in fuel
cell application," Polymer Engineering and Science, vol. 44, no. 9, pp. 1755-1765,
2004.
[5] J. Njuguma and K. Pielichowski, "Polymer nanocomposites for aerospace
applications: Properties," Advanced Engineering Materials, vol. 5, no. 11, pp. 769-
778, 2003.
[6] H. Wolf and M. Willert-Porada, "Electrically conductive LCP-carbon composite with
low carbon content for bipolar plate application in polymer electrolyte membrane fuel
cell," Journal of Power Sources, vol. 153, no. 1, pp. 41-46, 2006.
[7] C. A. Harper, Electronic Packaging and Interconnection Handbook, McGraw Hill,
2004.
[8] Y. Xie, in VLSI Design, 2010, pp. 446-451.
[9] N. Sillon, A. Astier, H. Boutry, L. Di Cioccio, D. Henry and P. Leduc, in Proceedings

97
IEDM Technical Digest, 2008.
[10] J. Van Olmen, A. Mercha, G. Katti, C. Huyghebaert, V. Van Aelst, E. Seppala, Z.
Chao, S. Armini, J. Vaes, R. Teixeira, M. Van Cauwenberghe, P. Verdonch, K.
Verhemeldonck, A. Jourdain, W. Ruythooren and M. de Potter de ten Broeck, in
Proceesing IEDM Technical Digest, 2008.
[11] N. Miyakawa, E. Hashimoto, T. Maebashi, N. Nakamura, Y. Sacho, S. Nakayama and
S. Toyoda, ACM Journal of Emerging Technologies in Computing Systems, vol. 4, pp.
1-15, 2008.
[12] Soxal, "Reflow Soldering (Inert Gas / Nitrogen) > SOXAL," Soxal, [Online].
Available: http://www.soxal.com/en/electronics-components-and-
packaging/applications-eca/reflow-soldering.html. [Accessed 29 03 2012].
[13] J. Lau, C. P. Wong, J. L. Prince and W. Nakayama, Electronic Packaging: Design,
Materials, Process, and Reliability, New York: McGraw Hill, 1998.
[14] C. P. Wong and S. Bollampally, "Thermal Conductivity, Elastic Modulus, and
Coefficient of Thermal Expansion of Polymer Composites Filled with Ceramic
Particles for Electronic Packaging," Journal of Applied Polymer Science, vol. 74, no.
14, pp. 3396-3403, 1999.
[15] C. Zweben, in Proceedings Semiconductor Thermal Measurement and Management
Symposium, 2002.
[16] S. Iijima, Nature (London), 354, p. 6348, 1991.
[17] P. Ajayan, O. Stephan, O. Colliex and D. Trauth, Science, 265, p. 5176, 1994.
[18] M. Moniruzzaman and K. Winey, Macromolecules, 39, p. 16, 2006.
[19] IBMC, "Immunologie et Chimie Therapeutique / Vectorisatioin," IBMC, [Online].
Available: http://www-ibmc.u-strasbg.fr/ict/vectorisation/nanotubes_eng.shtml.

98
[Accessed 29 03 2012].
[20] P. Ajayan and O. Zhou, Macromolecules, 39, p. 5176, 2006.
[21] O. Breuer and U. Sundaraj, Polymer Composites, 25, p. 630, 2004.
[22] R. Kuriger and M. Alam, Experimental Heat Transfer, 15, p. 19, 2002.
[23] S. Huxtable, D. Cahill, S. Shenogin, L. Xue and R. Ozisik, Nature Materials, 2, p.
731, 2003.
[24] K. Winey, T. Kashiwagi and M. Mu, MRS Bull, 32, p. 348, 2007.
[25] M. Jakubinek, M. Whitie, P. Watts and D. Carey, Materials Resource Society
Symposium Proceedings, 1022, p. 1103, 2007.
[26] H. Zhong and J. R. Lukes, Physical Review B, 74, p. 125402, 2006.
[27] W. Bouhofer and J. Kovacs, Composites Science Technology, vol. 69, p. 1486, 2009.
[28] E. T. Thostenson, Z. Ren and T.-W. Chou, Composites Science and Technology, vol.
61, 2001.
[29] S. Kim, D. Kim, D. Kim, M. Kim and J. Park, Solid State Phenomena, pp. 1079-1082,
2007.
[30] 3yKM, "Discontinuous Carbon Fibers," Zukm, [Online]. Available:
http://zukm.ru/eng/katalog_html/187/. [Accessed 29 03 2012].
[31] A. Gein and K. Novoselov, Nature Material, vol. 6, pp. 183-191, 2007.
[32] S. Ghosh, I. Calizo, D. Teweldebrhan, E. Pokatilov, D. Nika, A. Baladin, W. Bao, F.
Miao and C. Lau, Applied Physics Letters, vol. 92, 2008.
[33] K. Kalaitzidou, H. Fukushima and L. Drzal, Carbon, vol. 45, pp. 1446-1452, 2007.

99
[34] H. Fukushima, L. Drzal, B. Rook and M. Rich, Journal of Thermal Analysis and
Calorimetry, vol. 85, pp. 235-238, 2006.
[35] H. Kim, A. Abdala and C. Macosko, Macromolecules, vol. 43, pp. 6515-6530, 2010.
[36] PRLOG, "Graphene NanoPlatelets now on sale at EBAY," PRLOG, [Online].
Available: http://www.prlog.org/10165169-graphene-nanoplatelets-now-on-sale-at-
ebay.html. [Accessed 29 03 2012].
[37] D. Bigg, Advances in Polymer Science, vol. 119, pp. 1-30, 1995.
[38] R. McCullough, Composites Science Technology, vol. 22, pp. 3-21, 1985.
[39] K. Yung and H. Liem, Applied Polymer Science, vol. 106, pp. 3587-3591, 2007.
[40] I. Tavman, Powder Technology, vol. 91, pp. 63-67, 1997.
[41] N. Sofian, M. Rusu, R. Neagu and E. J. Neagu, Thermoplastic Composite Materials,
vol. 14, pp. 20-23, 2001.
[42] Y. Mamunya, V. Davydenko, P. Pissis and E. Lebedev, European Polymer Journal,
vol. 38, pp. 1997-1897, 2002.
[43] H. Tekce, D. Kumlutas and I. J. Tavman, Reinforced Plastic Composites, vol. 26, pp.
113-121, 2007.
[44] Y. Agari, A. Ueda, M. Tanaka and S. J. Nagai, Journal of Applied Polymer Science,
vol. 40, pp. 929-941, 1990.
[45] H. Ishida and S. Rimdusit, Thermochimica Acta, vol. 320, pp. 177-186, 1998.
[46] J. Gu, Q. Zhang, J. Dang, J. Zhang and Z. Yang, Polymer Engineering Science, vol.
49, pp. 1030-1034, 2009.
100
[47] T. Li and S. Hsu, Journal of Physical Chemistry B, vol. 114, pp. 6825-6829, 2010.
[48] K. Sato, H. Horibe, T. Shirai, Y. Hotta, H. Nakano, H. Nagai, K. Mitsuishi and K.
Watari, Journal of Material Chemistry, vol. 20, pp. 2749-2752, 2010.
[49] T. Terao, C. Zhi, Y. Banda, M. Mitome, C. Tang and D. Golberg, Journal of Physical
Chemistry, vol. 114, pp. 4340-4344, 2010.
[50] C. Guthy, F. Du, S. Brand, K. Winey and J. Fischer, Transactions of ASME, vol. 129,
pp. 1096-1099, 2007.
[51] J. King, B. Johnson, M. Via and C. Ciarkowski, Polymer Composites, vol. 31, pp. 497-
506, 2010.
[52] H. Tu and L. Ye, Journal of Applied Polymer Science, vol. 116, pp. 2336-2342, 2010.
[53] H. Ng, X. Lu and S. Lau, Polymer Composites, vol. 26, pp. 778-790, 2005.
[54] G. Lee, J. Lee, S. Lee, M. Park and J. Kim, Journal of Material Science, vol. 40, pp.
1259-1263, 2005.
[55] G. Milton and K. Golden, in Proceedings Thermal Conductivity Congress, 1983.
[56] N. Tsutsumi, N. Takeuchi and T. Kiyotsukuri, Journal of Polymer Science Part B:
Polymer Physics, vol. 29, pp. 1085-1093, 1991.
[57] Y. Xu and D. Chung, Composite International, vol. 4, pp. 243-256, 2000.
[58] G. Lee, M. Park, J. Kim, J. Lee and H. Yoon, Composite Part A Applied Science
Manufacturing, vol. 37, pp. 727-734, 2006.
[59] Y. Xu, D. Chung and C. Mroz, Composite Part A Applied Science and Manufacturing,
vol. 32, pp. 1749-, 2001.

101
[60] D. Kim, M. Kim, J. L. J. Lee, K. Kim, B. Lee, J. Park and S. Kim, Material Science
Forum, pp. 483-486, 2007.
[61] W. Zhou, S. Qi, Q. An, H. Zhao and N. Liu, "Thermal conductivity of boron nitride
reinforced polyethylene composites," Materials Research Bulletin, vol. 42, pp. 1863-
1873, 2007.
[62] C. Raman, "Boron nitride in thermoplastics: effect of loading, particle morphology
and processing conditions," in NATAS Annual Conference on Thermal Analysis and
Application, 2008.
[63] L. Rapoport, Y. Feldman, M. Homyonfer, H. Cohen, J. Sloan and J. Hutchison,
"Inorganic fullerene-like material as additives to lubricants: structure function
relationship," Wear, pp. 975-982, 1999.
[64] Momentive, "Momentive Performance Materials - PTX60," Momentive, [Online].
Available:
http://www.momentiveperformancematerials.com/Internet/Ceramics/Brand/PolarTher
m/PTX60?productid=e566d1fad90dd110VgnVCM1000001725340a____. [Accessed
29 03 2012].
[65] J. E. Mark, Physical properties of polymers handbook, Springer Science, 2007.
[66] A. Lazarenko, L. Vovchenko, Y. Prylutskyy, L. Matzuy, U. Ritter and P. Scharff,
"Mechanism of thermal and electrical conductivity in polymer-nanobarnon
composites," Materialwissenschaft und Wekstofftechnik, vol. 40, no. 4, pp. 268-272,
2009.
[67] D. E. Kline, "Thermal conductivity studies of polymers," Journal of polymer science,
vol. L, pp. 441-450, 1961.
[68] B. Nysten, P. Gonry and J. Issi, "Intra- and interchain thermal conduction in
polymers," Synthetic metals, vol. 69, pp. 67-68, 1995.

102
[69] Ticona, "Vectra LCP," [Online]. Available: http://www.ticona.com/vectra. [Accessed
1 03 2012].
[70] L. Sperling, "Modern Polymer Topics," in Introduction to physical polymer science,
Hoboken, NJ, John Wiley & Sons, 2005.
[71] "Vectra LCP," Ticona, [Online]. Available: http://www.ticona.com/products/vectra.
[Accessed 15 03 2012].
[72] L. Chinsirikul, T. Hsu and I. Harrison, "Liquid Crystalline Polymer (LCP) Reinforced
Polyethylene Blend Blown Film: Effects of Counter-Rotating Die on Fiber Orientation
and Film Properties," Polymer Engineering and Science, vol. 36, no. 22, p. 2708,
1996.
[73] J. Y. Kim and S. H. Kim, "Structure and property relationship of thermotropic liquid
crystal polymer and polyester composite fibers," Journal of applied polymer science,
vol. 99, pp. 2211-2219, 2006.
[74] Y. W. Wong, K. L. Lo and F. Shin, "Electrical and thermal properties of composite of
liquid crystalline polymer filled with carbon black," Journal of applied polymer
science, vol. 82, pp. 1549-1555, 2001.
[75] W. C. Jr., Fundamentals of Materials Science and Engineering: An Integrated
Approach., Hoboken, NJ: John Wiley & Sons, Inc., 2005.
[76] Y. Xu, D. D. L. Chung and C. Mroz, "Thermally Conducting Aluminum Nitride
Polymer-Matrix Composites," Composites: Part A, vol. 32, pp. 1749-1757, 2011.
[77] J. T. R. R. R.C. Progelhof, Polymer Engineering and Science, pp. 615-625, 1976.
[78] in A Treatise on Electricity and Magnetism, Dover, New York, 1954, p. Chapter 9.
[79] L. T. Lewis, Journal of Applied Polymer Science, 14, p. 1449, 1970.
103
[80] G. Y. D. H. L. B. B.R. Powell Jr., Journal of the American Ceramic Society,63, p.
581, 1980.
[81] L. F. J. D.P.H. Hasselman, Journal of Composite materials, 21, pp. 508-515, 1987.
[82] H. Zhong and J. Lukes, "Interfacial thermal resisitance between carbon nanotubes:
molecular dynamics simulations and analytical thermal modeling," Physical Review B
(Condensed Matter and Materials Physics), vol. 74, no. 12, 2006.
[83] H. Zhang, J. Li, K. Yao and L. Chen, "Spark plasma sintering and thermal
conductivity of carbon nanotube bulk materials," Journal Applied Physics, vol. 48, no.
12, pp. 1-5, 2005.
[84] S. Agarwal, M. Khan and R. Gupta, "Thermal conductivity of polymer
nanocomposites made with carbon nanofibers," Polymer Engineering Science, vol. 48,
no. 12, pp. 2474-2481, 2008.
[85] J. King, M. Via, F. Morrison, K. Wiese, E. Beach, M. Cieslinski and G. Bogucki,
"Characterization of exfoliated graphite nanoplatelets/polycarbonate composites:
electrical and thermal conductivity, and tensile, flexural, and rheological properties,"
Journal of Composite Materials, 2011.
[86] R. Kuriger and M. Alam, "Thermal conductivity of thermoplastic composites with
submicrometer carbon fibers," Exp Heat Transfer, vol. 15, no. 1, pp. 19-30, 2002.
[87] "Fortron Polyphenylene Sulphide (PPS)," [Online]. Available: www.ticona.com.
[Accessed 23 11 2011].
[88] S. N. Leung, M. O. Khan, E. Chan, H. Naguib, F. Dawson, V. Adinkrah and L.
Lakatos-Hayward, "Development of thermally conductive and electrically insulating
polymer composites for electronic packaging applications," in ANTEC, Boston, MA,
2011.

104
[89] G. Lee, S. Jagannathan, H. Chae, M. Minus and S. Kumar, "Carbon nanotube
dispersion and exfoliation in polypropylene and structure and properties of the
resulting composites," Polymer, vol. 49, no. 7, pp. 1831-1840, 2008.
[90] J. Yang, T. Xu, A. Lu, Q. Zhang, H. Tan and Q. Fu, "Preparation and properties of
poly (p-phenylene sulfide)/multiwalled carbon nanotube composites obtained by melt
compounding," Composites Science Technology, vol. 69, no. 2, pp. 147-153, 2009.
[91] P. Zhao, K. Wang, H. Yang, Q. Zhang, R. Du and Q. Fu, "Excellent tensile ductility in
highly oriented injection-molded bars of polypropylene/carbon nanotubes
composites," Polymer, vol. 48, no. 19, pp. 5688-5695, 2007.
[92] R. Tummala, E. Rymaszewski and A. Klopfenstein, Microelectronics Packaging
Handbook: Technology Drivers, 1997.
[93] B. Ash, L. Schadler and R. Siegel, Materials Letters, vol. 55, no. 83, 2002.
[94] R. Rizvi, M. O. Khan and H. Naguib, "Development and characterization of solid and
porous polylactide-multiwall carbon nanotube composites," Polymer Engineering
Science, vol. 51, no. 1, pp. 43-53, 2011.
[95] R. Goyal, P. Jadhav and A. Tiwari, "Preparation and properties of new polyphenylene
sulfide/AlN composites for electronic packaging," Journal of Electronics Materials,
vol. 40, no. 6, pp. 1377-1383, 2011.
[96] N. Das, S. Yamazaki, M. Hikosaka, T. Chaki, D. Khastgir and A. Chakraborty,
"Electrical conductivity and electromagnetic interference shielding effectiveness of
polyaniline-ethylene vinyl acetate composites," Polymer International, vol. 54, no. 2,
pp. 256-259, 2005.
[97] P. Ajayan, O. Stephan, C. Colliex and D. Trauth, "Aligned carbon nanotube arrays
formed by cutting a polymer resin-nanotube composite," Science, vol. 265, no. 5176,
pp. 1212-1214, 1994.
105
[98] R. Goyal, S. Samant, A. Thakar and A. Kadam, "Electrical properties of
polymer/expanded graphite nanocomposites with low percolation," Journal of Physics
D, vol. 43, no. 36, 2010.
[99] S. Leung, M. Khan, E. Chan, H. Naguib, F. Dawson, V. Adinkrah and L. Lakatos-
Hayward, "Analytical Modeling and characterization of heat transfer in thermally
conductive polymer composites filled with spherical particulates," Composites Part B:
Engineering, vol. submitted, 2011.
[100] F. Ahmad, J. Mariatti, Samayamutthirian and M. Khairun Azizi, Composite Science
Technology, vol. 68, pp. 346-353, 2008.
[101] M. W. W. E. H. K. J. A. S. K. H. Clingerman, "Development of and additive equation
for predicting the electrical conductivity of carbon-filled composites," Journal of
Applied Polymer Science, vol. 88, no. 9, pp. 2280-2299, 2003.
[102] A. Vavouliotis, E. Fiamegou, P. Karapappas, G. Psarras and V. Kostopoulos, Polymer
Composites, vol. 31, pp. 1874-1880, 2010.
[103] J. K. W. Bauhofer, Composites Science and Technology, 69, p. 1486, 2009.
[104] R. O. P. E. T. Swartz, Reviews of Modern Physics, 61, pp. 605-668, 1989.
[105] R. Mazo, "Theoretical studies on low temperature phenomena," Yale University,
Ph.D. thesis, 1955.
[106] D.Bruggeman, Annals of Physics, 24, p. 636, 1935.
[107] J. P. J.Ashton, Technomic Publications and Co., 1969.
[108] Z. G. Z. W. Y. F. E. L. E. G. S. U. S. Choi, Applied Physics Letters, 79, p. 2252, 2001.
[109] D. Q.S. Zheng, Journal of the Mechanics and Physics of Solids, 49, p. 2765, 2001.
106
[110] G. L. Y. L. M. L. Ce-Wen Nan, Applied Physics Letters, 85, pp. 3549-3551, 2004.
[111] R. B. D. R. C. H. G. Ce-Wan Nan, Journal of Applied Physics, 81, 1997.
[112] D. G. C. S. S. G. S. M. S. a. P. K. Scott T. Huxrable, Nature Materials, 2, 2003.
[113] M. Kim, H. Kim, S. Byun, S. Jeong, Y. Hong, J. Joo, K. Song, J. Kim, C. Lee and J.
Lee, "PET fabric/polypyrole composite with high electrical conductivity for EMI
shielding," Synthetic Metals, vol. 126, no. 2-3, pp. 233-239, 2002.
[114] M. O. Khan, S. N. Leung, E. Chan, H. Naguib, F. Dawson, V. Adinkrah and L.
Lakatos-Hayward, "The multifunctional characteristics of carbonaceous filler-
reinforced poly(phenylene sulfide) composites," in SPE ANTEC Conference, Boston,
MA, 2011.
[115] R. Prasher, J. Chang, I. Sauciuc, S. Narsimhan, D. Chau, A. Chrysler, A. Myers, S.
Prstic and C. Hu, International Technological Journal, vol. 9, p. 285, 2005.
Related Documents