arXiv:astro-ph/0501301v1 14 Jan 2005 To appear in ApJ Thermal X-Ray Emission from Shocked Ejecta in Type Ia Supernova Remnants II: Parameters Affecting the Spectrum Carles Badenes 1 , Kazimierz J. Borkowski 2 and Eduardo Bravo 3,4 ABSTRACT The supernova remnants left behind by Type Ia supernovae provide an excel- lent opportunity for the study of these enigmatic objects. In a previous work, we showed that it is possible to use the X-ray spectra of young Type Ia supernova remnants to explore the physics of Type Ia supernovae and identify the relevant mechanism underlying these explosions. Our simulation technique is based on hydrodynamic and nonequilibrium ionization calculations of the interaction of a grid of Type Ia explosion models with the surrounding ambient medium, cou- pled to an X-ray spectral code. In this work we explore the influence of two key parameters on the shape of the X-ray spectrum of the ejecta: the density of the ambient medium around the supernova progenitor and the efficiency of col- lisionless electron heating at the reverse shock. We also discuss the performance of recent 3D simulations of Type Ia SN explosions in the context of the X-ray spectra of young SNRs. We find a better agreement with the observations for Type Ia supernova models with stratified ejecta than for 3D deflagration models with well mixed ejecta. We conclude that our grid of Type Ia supernova remnant models can improve our understanding of these objects and their relationship to the supernovae that originated them. 1 Department of Physics and Astronomy, Rutgers University, 136 Frelinghuysen Rd., Piscataway NJ 08854- 8019; [email protected] 2 Department of Physics, North Carolina State University, Box 8202, Raleigh NC 27965-8202; [email protected] 3 Departament de F ´ isica i Enginyeria Nuclear, Universitat Polit` ecnica de Catalunya, Diagonal 647, Barcelona 08028, Spain; [email protected] 4 Institut d’Estudis Espacials de Catalunya, Campus UAB, Facultat de Ci` encies. Torre C5. Bellaterra, Barcelona 08193, Spain

Welcome message from author
This document is posted to help you gain knowledge. Please leave a comment to let me know what you think about it! Share it to your friends and learn new things together.
Transcript
arX
iv:a
stro
-ph/
0501
301v
1 1
4 Ja
n 20
05
To appear in ApJ
Thermal X-Ray Emission from Shocked Ejecta in Type Ia
Supernova Remnants II:
Parameters Affecting the Spectrum
Carles Badenes1, Kazimierz J. Borkowski2 and Eduardo Bravo3,4
ABSTRACT
The supernova remnants left behind by Type Ia supernovae provide an excel-
lent opportunity for the study of these enigmatic objects. In a previous work, we
showed that it is possible to use the X-ray spectra of young Type Ia supernova
remnants to explore the physics of Type Ia supernovae and identify the relevant
mechanism underlying these explosions. Our simulation technique is based on
hydrodynamic and nonequilibrium ionization calculations of the interaction of a
grid of Type Ia explosion models with the surrounding ambient medium, cou-
pled to an X-ray spectral code. In this work we explore the influence of two
key parameters on the shape of the X-ray spectrum of the ejecta: the density of
the ambient medium around the supernova progenitor and the efficiency of col-
lisionless electron heating at the reverse shock. We also discuss the performance
of recent 3D simulations of Type Ia SN explosions in the context of the X-ray
spectra of young SNRs. We find a better agreement with the observations for
Type Ia supernova models with stratified ejecta than for 3D deflagration models
with well mixed ejecta. We conclude that our grid of Type Ia supernova remnant
models can improve our understanding of these objects and their relationship to
the supernovae that originated them.
1Department of Physics and Astronomy, Rutgers University, 136 Frelinghuysen Rd., Piscataway NJ 08854-
8019; [email protected]
2Department of Physics, North Carolina State University, Box 8202, Raleigh NC 27965-8202;
3Departament de Fisica i Enginyeria Nuclear, Universitat Politecnica de Catalunya, Diagonal 647,
Barcelona 08028, Spain; [email protected]
4Institut d’Estudis Espacials de Catalunya, Campus UAB, Facultat de Ciencies. Torre C5. Bellaterra,
Barcelona 08193, Spain
– 2 –
Subject headings: hydrodynamics — ISM — nuclear reactions, nucleosynthesis,
abundances, — supernova remnants — supernovae:general — X-rays:ISM
1. INTRODUCTION
The advent of modern X-ray observatories such as Chandra and XMM-Newton has pro-
duced a spectacular increase in both the quantity and the quality of the observations of Type
Ia supernova remnants (SNRs). Yet, these excellent observations have led only to a modest
improvement in our knowledge of the physics of Type Ia supernovae (SNe). Important issues
such as the nature of the progenitor systems, the last stages of their evolution prior to the
SN explosion or the physical mechanism behind the explosion itself still remain obscure (see
Hillebrandt & Niemeyer 2000; Branch & Khokhlov 1995, for reviews). In a recent paper
(Badenes et al. 2003, henceforth Paper I), we examined the prospects for the identification
of the explosion mechanism in Type Ia SNe through the analysis of the X-ray spectra of
young SNRs. We assembled a grid of Type Ia SN explosion models, simulated their interac-
tion with a uniform ambient medium (AM) and calculated the predicted X-ray spectra from
the ensuing SNRs. The calculated X-ray SNR spectra varied dramatically from model to
model, demonstrating that it is possible to use young Type Ia SNRs to probe the details of
the Type Ia SN explosion mechanism.
In this paper, we expand the results that were introduced in Paper I. Our objective
is to examine the relationship between Type Ia SN explosions and the X-ray spectra of
their SNRs within the framework of hydrodynamic, ionization, and spectral simulations. By
comparing our models with observations, we aim at improving our understanding of both
Type Ia SNe and young, ejecta-dominated SNRs. In § 2, we review the simulation scheme
used in Paper I, and we discuss the influence of two important parameters which we had not
hitherto explored: the amount of collisionless electron heating at the reverse shock and the
density of the uniform AM that interacts with the ejecta. In § 3 we examine the performance
of recent 3D Type Ia SN explosion models in the context of SNRs, and we discuss the ability
of these 3D models to reproduce the fundamental properties of the X-ray spectra of Type Ia
SNRs. Our conclusions are presented in § 4. In order to facilitate the comparison between
our models and X-ray observations of SNRs, we have generated a library of synthetic spectra.
This library is presented and discussed in the Appendix. In a forthcoming paper (Badenes et
al., in preparation), we will make a detailed comparison between our models and the X-ray
spectrum of the Tycho SNR.
– 3 –
2. PARAMETERS AFFECTING THE X-RAY SPECTRUM
2.1. From SN to SNR: the Simulation Scheme
Although the X-ray spectra of young Type Ia SNRs contain much information about
the structure and composition of the material ejected by the SNe that originated them, this
information is generally difficult to extract. The ejecta material consists almost entirely of
heavy elements that are impulsively heated to X-ray emitting temperatures as the reverse
shock propagates inwards in the reference frame of the expanding ejecta. The propagation
of the reverse shock is in turn intimately related to the density structure of the ejecta,
which results in an intricate dynamical behavior of the SNR early in its evolution (see
Dwarkadas & Chevalier 1998). If there is a significant degree of stratification in the elemental
composition of the ejecta, different chemical elements are shocked at different evolutionary
times, after different periods of free expansion, and therefore emit X-rays under different
physical conditions. This results in a very complex spectrum, which is hard to model and
interpret.
The approach taken in Paper I was based on a grid of 1D Type Ia SN explosion models
that included all the mechanisms currently under debate for the single degenerate Type
Ia SN scenario: deflagrations, delayed detonations, pulsating delayed detonations and sub-
Chandrasekhar explosions. The dynamics of the interaction of each explosion model with
a uniform ambient medium (AM) of density ρAM = 10−24 g · cm−3 was followed with a 1D
hydrodynamic code. The dynamic evolution of each fluid element in the shocked ejecta
(i.e., the time evolution of density ρ and specific internal energy per unit mass ε), together
with its chemical composition as determined by the SN explosion model, were used as the
input to ionization calculations. These calculations included the interactions between ions
and electrons in the shocked plasma, and they provided time-dependent nonequilibrium
ionization (NEI) states and electron temperature. Using these ionization states and electron
temperatures, spatially integrated synthetic X-ray spectra were generated with a spectral
code by adding the weighted contributions from each fluid element in the shocked ejecta.
For a more detailed explanation, see Paper I and the references therein.
Within this simulation scheme, the X-ray spectrum from the shocked ejecta is deter-
mined by: (1) the density and chemical composition profiles of the SN ejecta from the
explosion model, (2) the age of the SNR, (3) the amount of collisionless electron heating
at the reverse shock, and (4) the density of the uniform AM. In Paper I, we analyzed the
importance of (1) and (2); the impact of (3) and (4) is the focus of this Section.
– 4 –
2.2. Collisionless Electron Heating at the Reverse Shock
The unknown efficiency of collisionless electron heating in SNR shocks is one of the
main uncertainties affecting the calculated X-ray spectra of SNRs. Direct application of the
Rankine-Hugoniot relations at the shock front yields
Tp =3mpv
2s
16k(1)
for each population of particles p, where mp is the particle mass, vs is the shock velocity and
k is Boltzmann’s constant. Because of the large difference between electron and ion masses,
the electrons are expected to be much colder than the ions, and the quotient of postshock
specific internal energies defined as
β ≡εe,s
εi,s=
ZsTe,s
Ti,s(2)
is expected to be close to 0, where Zs is the preshock ionization state (i.e., the number of
free electrons per ion in the unshocked ejecta). However, Cargill & Papadopoulos (1988)
argued that plasma waves can redistribute energy among cold electrons and hot ions at the
shock, bringing the value of β close to Zs (for a discussion of collisionless electron heating
see Laming 2000).
So far, the observational evidence hints at a decreasing level of thermal equilibration with
increasing shock speeds or Mach numbers in the forward shocks of SNRs (see Rakowski et al.
2003, and references therein). In the forward shock of Tycho, Ghavamian et al. (2001) found
a value of Te/Ti ≤ 0.1 by analyzing the optical Balmer emission, while Vink et al. (2003)
estimated a much lower value at the forward shock of SN1006 from X-ray observations. The
only constraint on the value of β in the reverse shock of a young Type Ia SNR comes from
the absorbed spectrum of the Schweizer and Middleditch star behind SN1006, where the
amount of thermal energy deposited in the electrons was found to be negligible (Hamilton
et al. 1997). The model spectra presented in Paper I were calculated assuming no collisionless
electron heating at the reverse shock, effectively setting β to the lowest possible value,
βmin = Zs · me/mi, where mi is the average ion mass in a fluid element. It is clear from the
works cited above that, while full thermal equilibration between ions and electrons at the
shock (i.e., β = Zs) is not compatible with the observations, values of β larger than βmin
cannot be excluded.
The effect of varying amounts of collisionless electron heating at the forward shock on
the X-ray spectrum emitted by the shocked AM of SNRs in the Sedov stage was discussed in
Borkowski et al. (2001); here, we shall analyze the impact of a small (but nonzero) amount
– 5 –
of collisionless electron heating at the reverse shock on the properties of the shocked ejecta.
We will illustrate this effect using a delayed detonation model as an example. Of all the
classes of one-dimensional Type Ia explosion models, delayed detonations have been the most
successful in reproducing the light curves and spectra of Type Ia SNe (Hoflich & Khokhlov
1996), and therefore it is of much interest to analyze the details of the X-ray emission that
these models predict for Type Ia SNRs. Within the delayed detonations, we chose model
DDTe because it has the largest amount of intermediate mass elements (Si, S, etc.) in the
ejecta. This should make it easier to estimate the effects that collisionless electron heating
at the reverse shock has on the prominent X-ray lines from these elements.
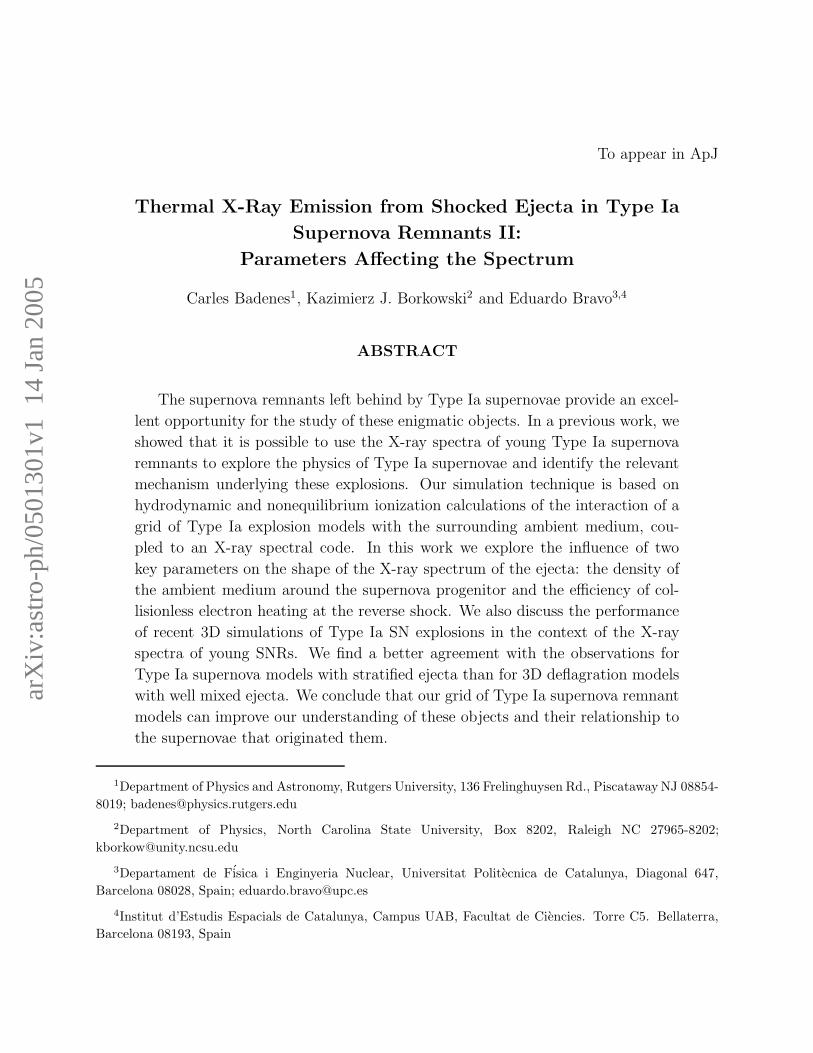
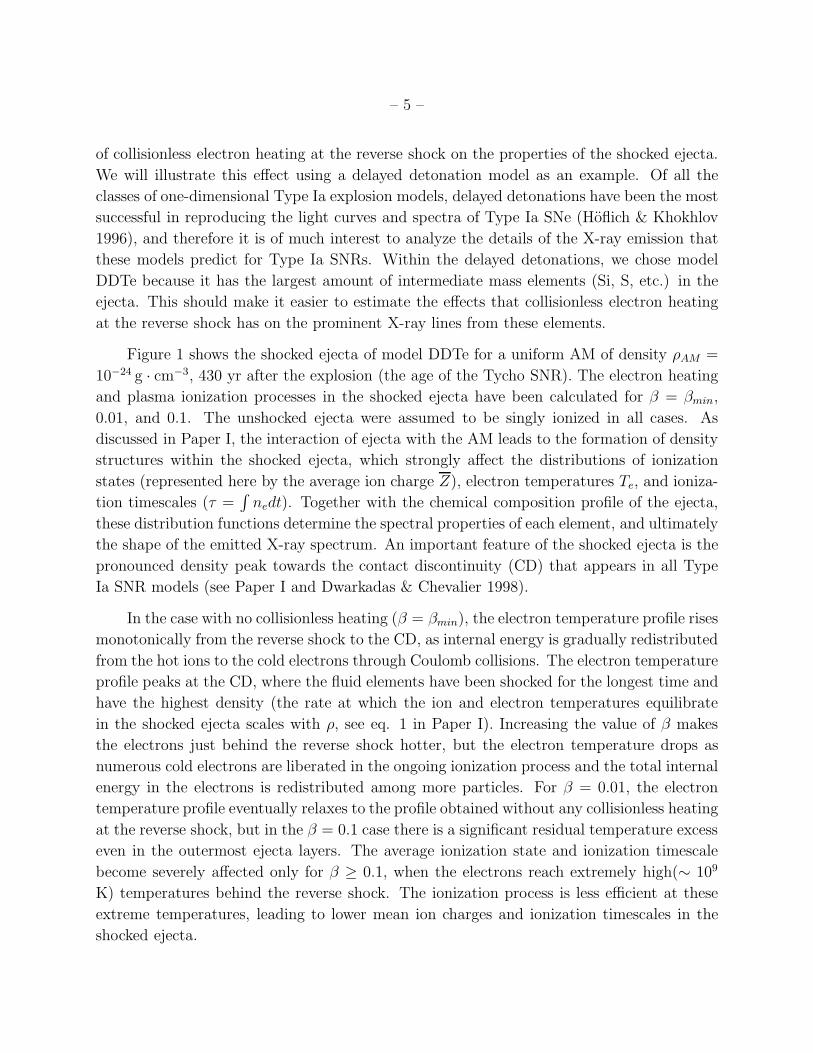
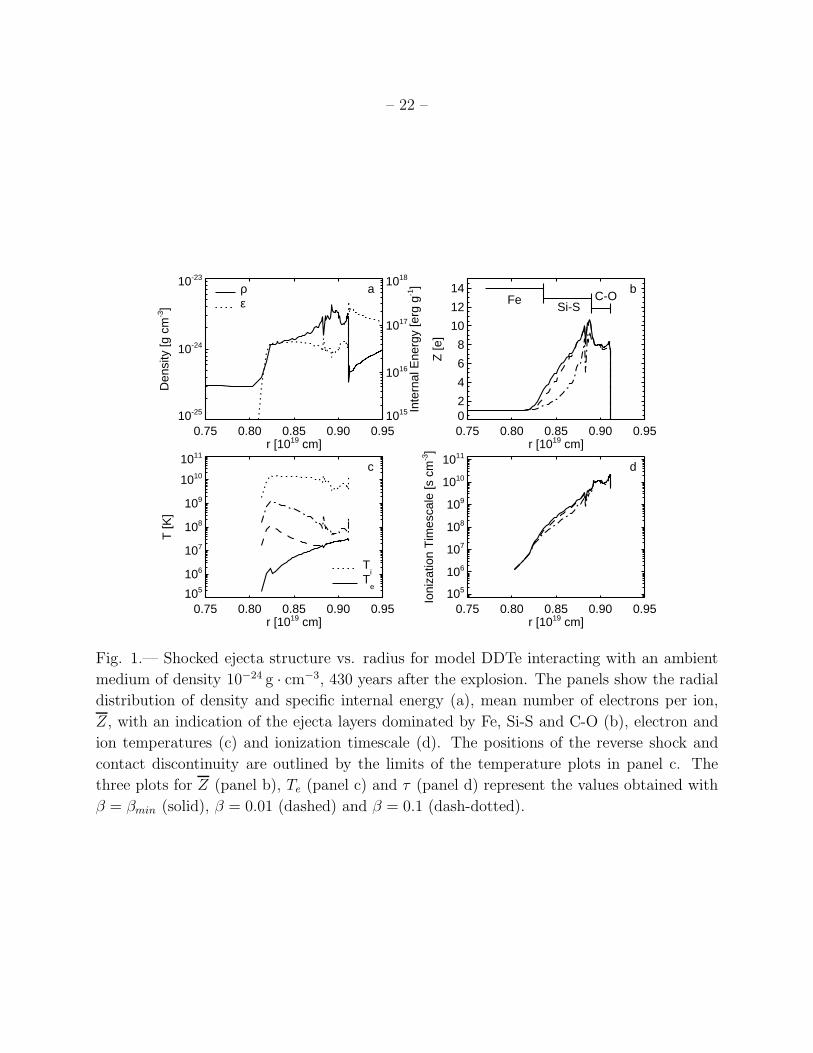
Figure 1 shows the shocked ejecta of model DDTe for a uniform AM of density ρAM =
10−24 g · cm−3, 430 yr after the explosion (the age of the Tycho SNR). The electron heating
and plasma ionization processes in the shocked ejecta have been calculated for β = βmin,
0.01, and 0.1. The unshocked ejecta were assumed to be singly ionized in all cases. As
discussed in Paper I, the interaction of ejecta with the AM leads to the formation of density
structures within the shocked ejecta, which strongly affect the distributions of ionization
states (represented here by the average ion charge Z), electron temperatures Te, and ioniza-
tion timescales (τ =∫
nedt). Together with the chemical composition profile of the ejecta,
these distribution functions determine the spectral properties of each element, and ultimately
the shape of the emitted X-ray spectrum. An important feature of the shocked ejecta is the
pronounced density peak towards the contact discontinuity (CD) that appears in all Type
Ia SNR models (see Paper I and Dwarkadas & Chevalier 1998).
In the case with no collisionless heating (β = βmin), the electron temperature profile rises
monotonically from the reverse shock to the CD, as internal energy is gradually redistributed
from the hot ions to the cold electrons through Coulomb collisions. The electron temperature
profile peaks at the CD, where the fluid elements have been shocked for the longest time and
have the highest density (the rate at which the ion and electron temperatures equilibrate
in the shocked ejecta scales with ρ, see eq. 1 in Paper I). Increasing the value of β makes
the electrons just behind the reverse shock hotter, but the electron temperature drops as
numerous cold electrons are liberated in the ongoing ionization process and the total internal
energy in the electrons is redistributed among more particles. For β = 0.01, the electron
temperature profile eventually relaxes to the profile obtained without any collisionless heating
at the reverse shock, but in the β = 0.1 case there is a significant residual temperature excess
even in the outermost ejecta layers. The average ionization state and ionization timescale
become severely affected only for β ≥ 0.1, when the electrons reach extremely high(∼ 109
K) temperatures behind the reverse shock. The ionization process is less efficient at these
extreme temperatures, leading to lower mean ion charges and ionization timescales in the
shocked ejecta.
– 6 –
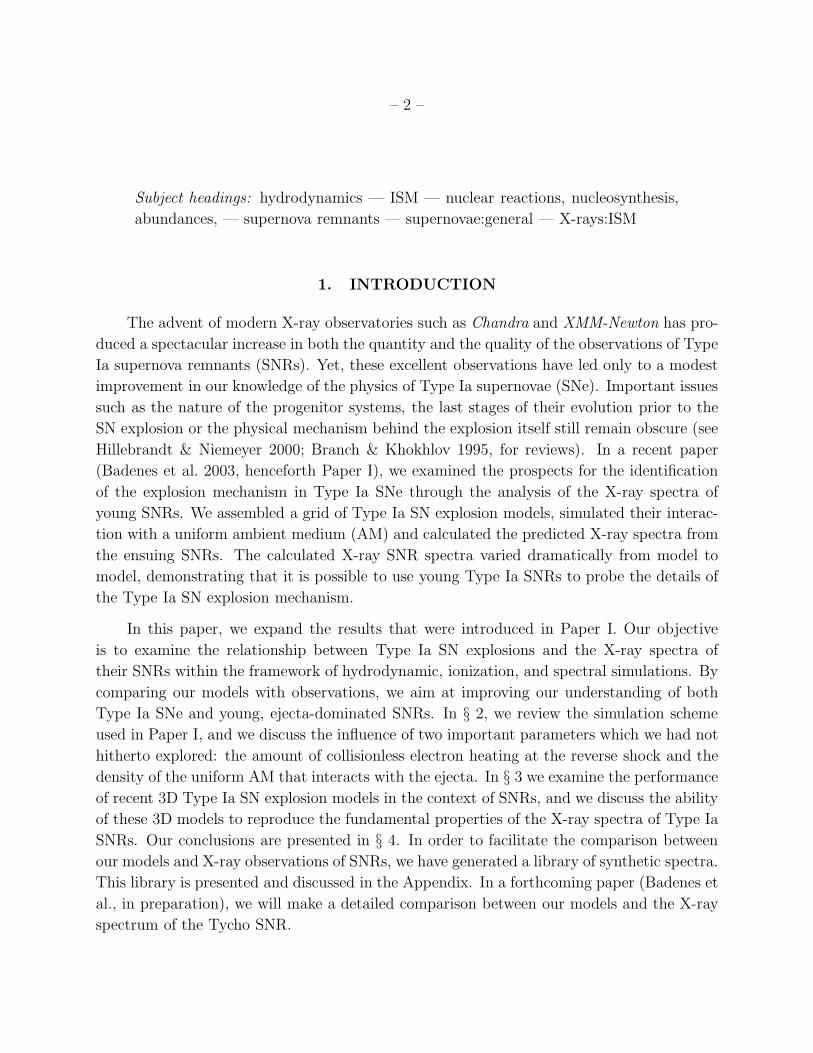
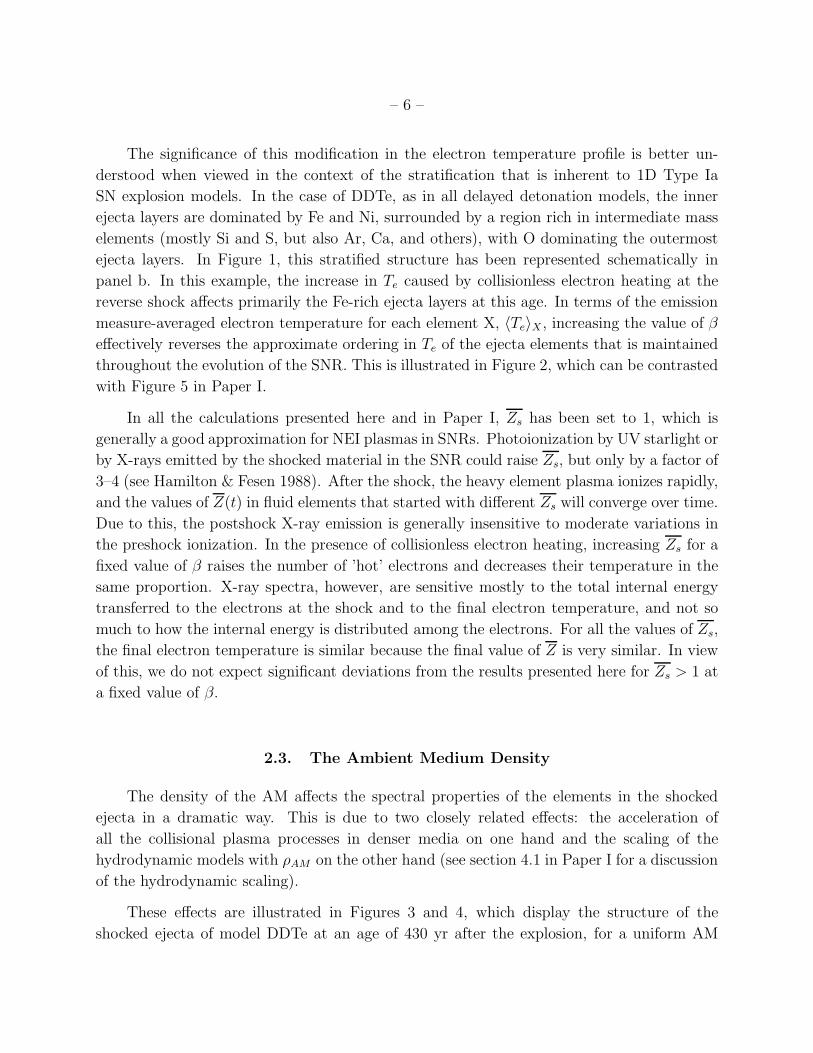
The significance of this modification in the electron temperature profile is better un-
derstood when viewed in the context of the stratification that is inherent to 1D Type Ia
SN explosion models. In the case of DDTe, as in all delayed detonation models, the inner
ejecta layers are dominated by Fe and Ni, surrounded by a region rich in intermediate mass
elements (mostly Si and S, but also Ar, Ca, and others), with O dominating the outermost
ejecta layers. In Figure 1, this stratified structure has been represented schematically in
panel b. In this example, the increase in Te caused by collisionless electron heating at the
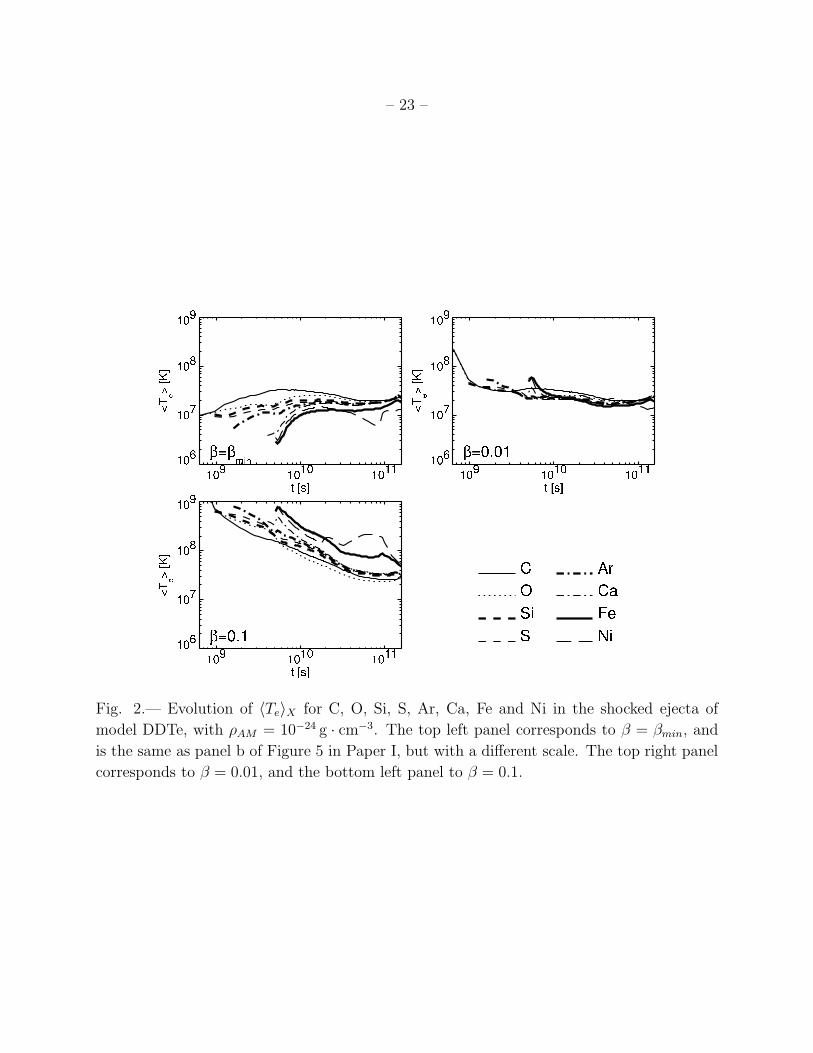
reverse shock affects primarily the Fe-rich ejecta layers at this age. In terms of the emission
measure-averaged electron temperature for each element X, 〈Te〉X , increasing the value of β
effectively reverses the approximate ordering in Te of the ejecta elements that is maintained
throughout the evolution of the SNR. This is illustrated in Figure 2, which can be contrasted
with Figure 5 in Paper I.
In all the calculations presented here and in Paper I, Zs has been set to 1, which is
generally a good approximation for NEI plasmas in SNRs. Photoionization by UV starlight or
by X-rays emitted by the shocked material in the SNR could raise Zs, but only by a factor of
3–4 (see Hamilton & Fesen 1988). After the shock, the heavy element plasma ionizes rapidly,
and the values of Z(t) in fluid elements that started with different Zs will converge over time.
Due to this, the postshock X-ray emission is generally insensitive to moderate variations in
the preshock ionization. In the presence of collisionless electron heating, increasing Zs for a
fixed value of β raises the number of ’hot’ electrons and decreases their temperature in the
same proportion. X-ray spectra, however, are sensitive mostly to the total internal energy
transferred to the electrons at the shock and to the final electron temperature, and not so
much to how the internal energy is distributed among the electrons. For all the values of Zs,
the final electron temperature is similar because the final value of Z is very similar. In view
of this, we do not expect significant deviations from the results presented here for Zs > 1 at
a fixed value of β.
2.3. The Ambient Medium Density
The density of the AM affects the spectral properties of the elements in the shocked
ejecta in a dramatic way. This is due to two closely related effects: the acceleration of
all the collisional plasma processes in denser media on one hand and the scaling of the
hydrodynamic models with ρAM on the other hand (see section 4.1 in Paper I for a discussion
of the hydrodynamic scaling).
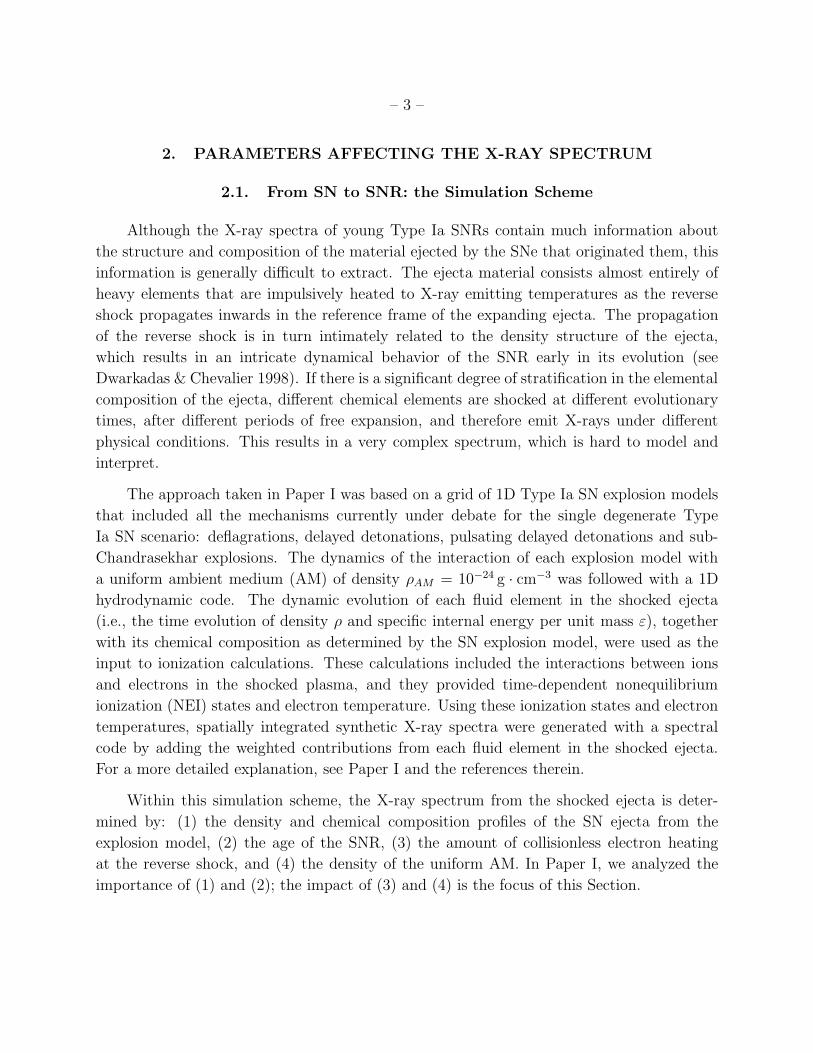
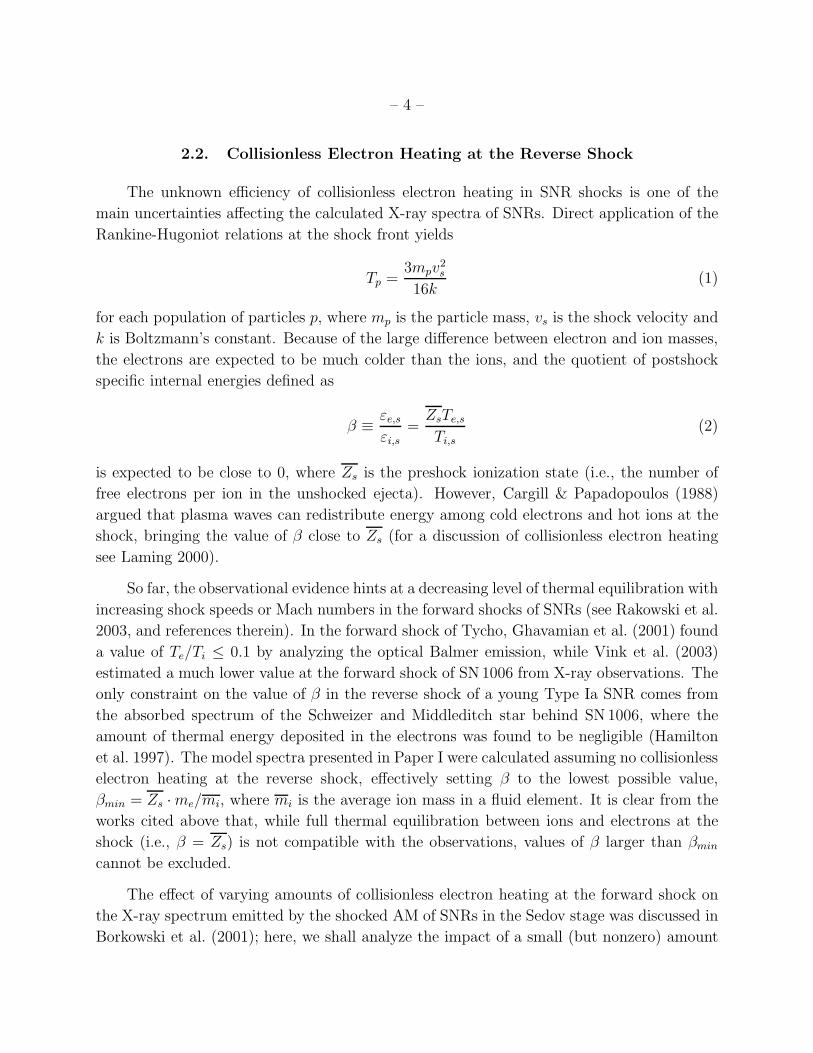
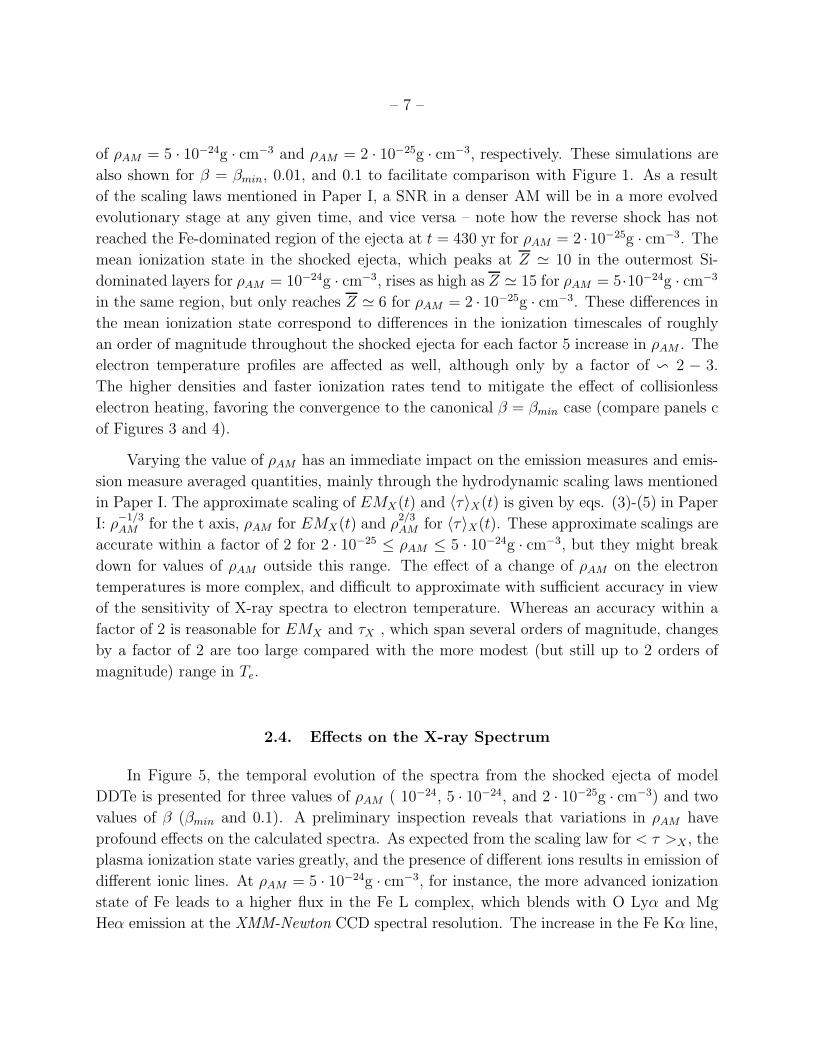
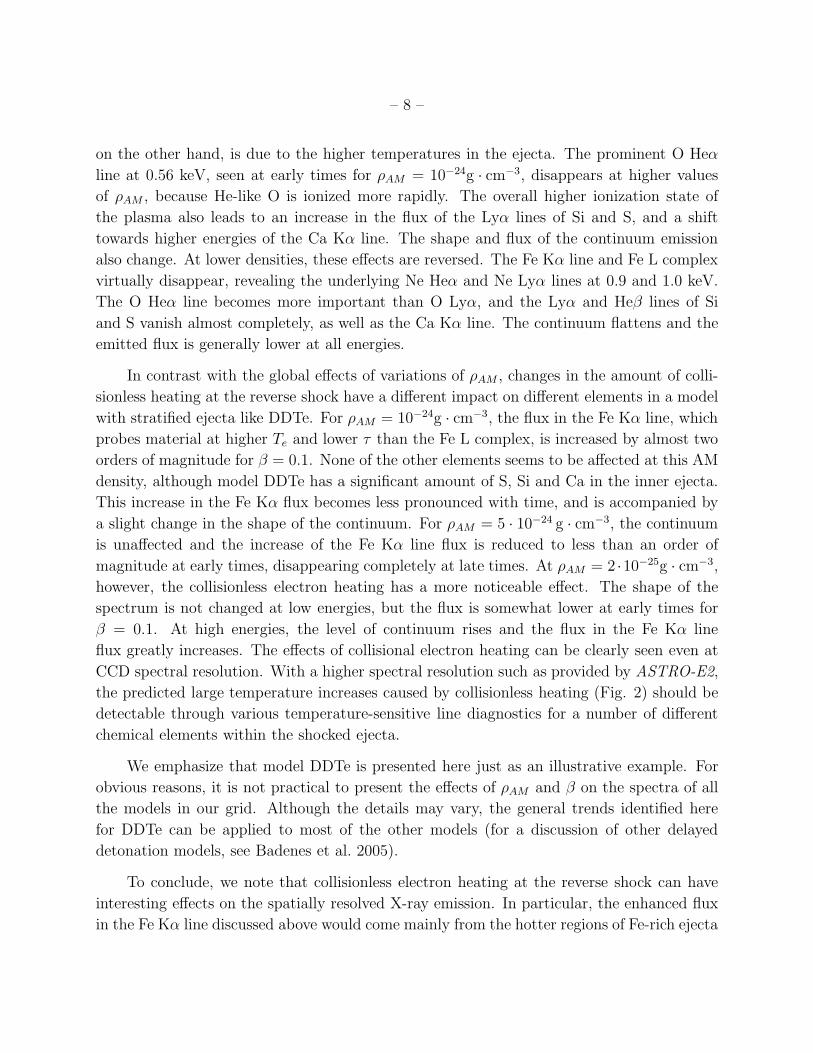
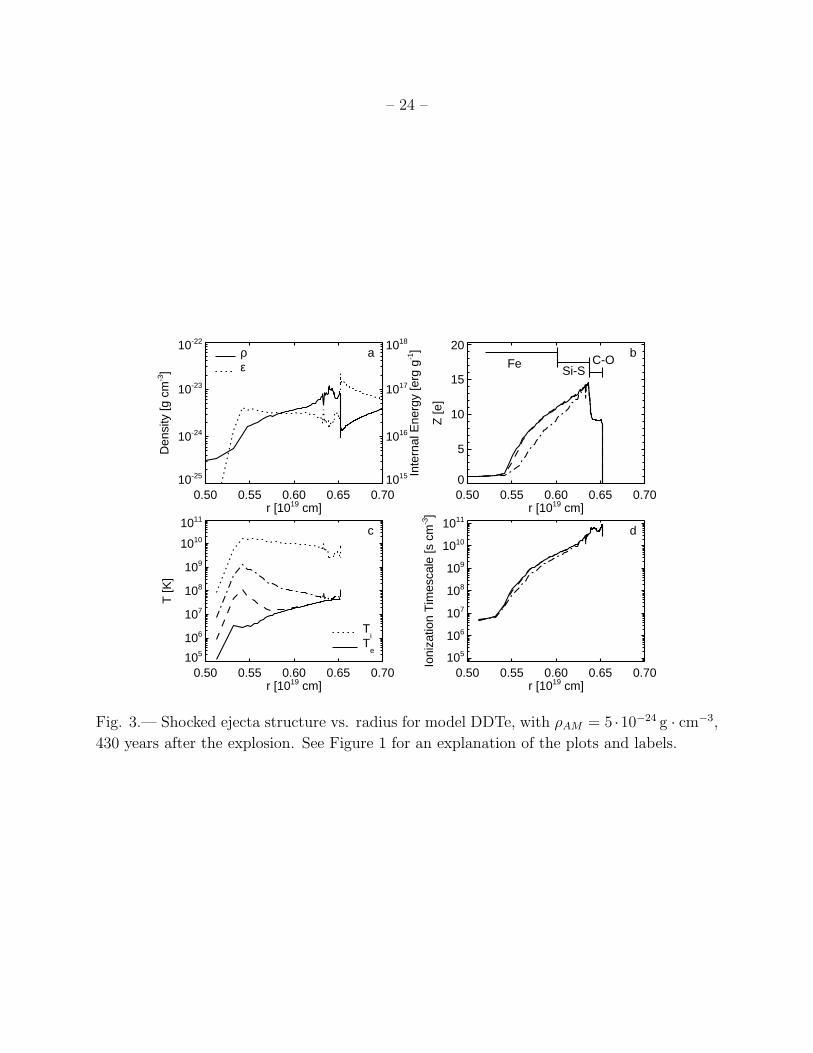
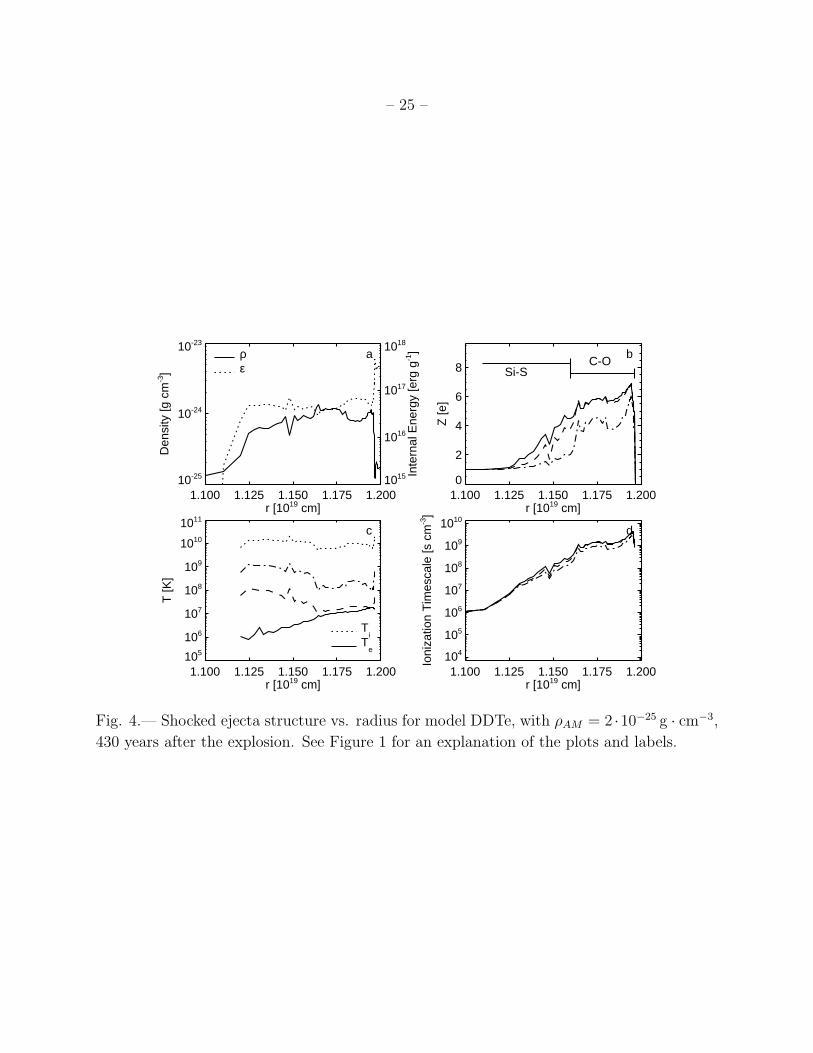
These effects are illustrated in Figures 3 and 4, which display the structure of the
shocked ejecta of model DDTe at an age of 430 yr after the explosion, for a uniform AM
– 7 –
of ρAM = 5 · 10−24g · cm−3 and ρAM = 2 · 10−25g · cm−3, respectively. These simulations are
also shown for β = βmin, 0.01, and 0.1 to facilitate comparison with Figure 1. As a result
of the scaling laws mentioned in Paper I, a SNR in a denser AM will be in a more evolved
evolutionary stage at any given time, and vice versa – note how the reverse shock has not
reached the Fe-dominated region of the ejecta at t = 430 yr for ρAM = 2 ·10−25g · cm−3. The
mean ionization state in the shocked ejecta, which peaks at Z ≃ 10 in the outermost Si-
dominated layers for ρAM = 10−24g · cm−3, rises as high as Z ≃ 15 for ρAM = 5·10−24g · cm−3
in the same region, but only reaches Z ≃ 6 for ρAM = 2 · 10−25g · cm−3. These differences in
the mean ionization state correspond to differences in the ionization timescales of roughly
an order of magnitude throughout the shocked ejecta for each factor 5 increase in ρAM . The
electron temperature profiles are affected as well, although only by a factor of ∽ 2 − 3.
The higher densities and faster ionization rates tend to mitigate the effect of collisionless
electron heating, favoring the convergence to the canonical β = βmin case (compare panels c
of Figures 3 and 4).
Varying the value of ρAM has an immediate impact on the emission measures and emis-
sion measure averaged quantities, mainly through the hydrodynamic scaling laws mentioned
in Paper I. The approximate scaling of EMX(t) and 〈τ〉X(t) is given by eqs. (3)-(5) in Paper
I: ρ−1/3AM for the t axis, ρAM for EMX(t) and ρ
2/3AM for 〈τ〉X(t). These approximate scalings are
accurate within a factor of 2 for 2 · 10−25 ≤ ρAM ≤ 5 · 10−24g · cm−3, but they might break
down for values of ρAM outside this range. The effect of a change of ρAM on the electron
temperatures is more complex, and difficult to approximate with sufficient accuracy in view
of the sensitivity of X-ray spectra to electron temperature. Whereas an accuracy within a
factor of 2 is reasonable for EMX and τX , which span several orders of magnitude, changes
by a factor of 2 are too large compared with the more modest (but still up to 2 orders of
magnitude) range in Te.
2.4. Effects on the X-ray Spectrum
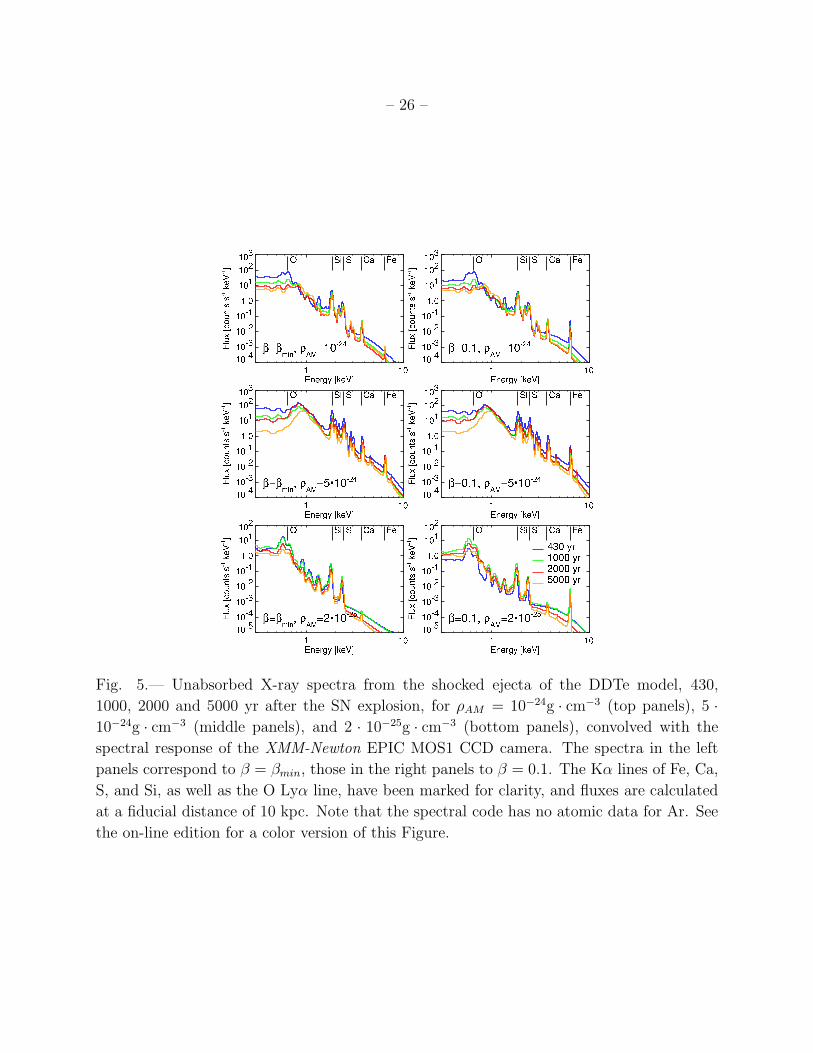
In Figure 5, the temporal evolution of the spectra from the shocked ejecta of model
DDTe is presented for three values of ρAM ( 10−24, 5 · 10−24, and 2 · 10−25g · cm−3) and two
values of β (βmin and 0.1). A preliminary inspection reveals that variations in ρAM have
profound effects on the calculated spectra. As expected from the scaling law for < τ >X , the
plasma ionization state varies greatly, and the presence of different ions results in emission of
different ionic lines. At ρAM = 5 · 10−24g · cm−3, for instance, the more advanced ionization
state of Fe leads to a higher flux in the Fe L complex, which blends with O Lyα and Mg
Heα emission at the XMM-Newton CCD spectral resolution. The increase in the Fe Kα line,
– 8 –
on the other hand, is due to the higher temperatures in the ejecta. The prominent O Heα
line at 0.56 keV, seen at early times for ρAM = 10−24g · cm−3, disappears at higher values
of ρAM , because He-like O is ionized more rapidly. The overall higher ionization state of
the plasma also leads to an increase in the flux of the Lyα lines of Si and S, and a shift
towards higher energies of the Ca Kα line. The shape and flux of the continuum emission
also change. At lower densities, these effects are reversed. The Fe Kα line and Fe L complex
virtually disappear, revealing the underlying Ne Heα and Ne Lyα lines at 0.9 and 1.0 keV.
The O Heα line becomes more important than O Lyα, and the Lyα and Heβ lines of Si
and S vanish almost completely, as well as the Ca Kα line. The continuum flattens and the
emitted flux is generally lower at all energies.
In contrast with the global effects of variations of ρAM , changes in the amount of colli-
sionless heating at the reverse shock have a different impact on different elements in a model
with stratified ejecta like DDTe. For ρAM = 10−24g · cm−3, the flux in the Fe Kα line, which
probes material at higher Te and lower τ than the Fe L complex, is increased by almost two
orders of magnitude for β = 0.1. None of the other elements seems to be affected at this AM
density, although model DDTe has a significant amount of S, Si and Ca in the inner ejecta.
This increase in the Fe Kα flux becomes less pronounced with time, and is accompanied by
a slight change in the shape of the continuum. For ρAM = 5 · 10−24 g · cm−3, the continuum
is unaffected and the increase of the Fe Kα line flux is reduced to less than an order of
magnitude at early times, disappearing completely at late times. At ρAM = 2 ·10−25g · cm−3,
however, the collisionless electron heating has a more noticeable effect. The shape of the
spectrum is not changed at low energies, but the flux is somewhat lower at early times for
β = 0.1. At high energies, the level of continuum rises and the flux in the Fe Kα line
flux greatly increases. The effects of collisional electron heating can be clearly seen even at
CCD spectral resolution. With a higher spectral resolution such as provided by ASTRO-E2,
the predicted large temperature increases caused by collisionless heating (Fig. 2) should be
detectable through various temperature-sensitive line diagnostics for a number of different
chemical elements within the shocked ejecta.
We emphasize that model DDTe is presented here just as an illustrative example. For
obvious reasons, it is not practical to present the effects of ρAM and β on the spectra of all
the models in our grid. Although the details may vary, the general trends identified here
for DDTe can be applied to most of the other models (for a discussion of other delayed
detonation models, see Badenes et al. 2005).
To conclude, we note that collisionless electron heating at the reverse shock can have
interesting effects on the spatially resolved X-ray emission. In particular, the enhanced flux
in the Fe Kα line discussed above would come mainly from the hotter regions of Fe-rich ejecta
– 9 –
close to the reverse shock (see the shape of the electron temperature profile in Figures 1, 3,
and 4 for values of β above 0.01). This scenario is compatible, at least qualitatively, with the
finding that the Fe Kα emission peaks at a smaller radius than the Fe L and Si Heα emission
in the X-ray CCD images of both the Tycho (Hwang et al. 1998) and Kepler (Cassam-Chenai
et al. 2004) SNRs. Collisionless electron heating provides a simpler explanation to the rise
of the electron temperature profile towards the reverse shock than the relic of an interaction
with a circumstellar medium invoked by Dwarkadas & Chevalier (1998) for the Tycho SNR.
3. X-RAY SPECTRUM FROM THREE DIMENSIONAL TYPE Ia
EXPLOSION MODELS
3.1. Type Ia SN Explosions in 3D: Fundamental Properties
In Paper I, we introduced a grid of eight one dimensional Type Ia SN explosion models
that included examples of all the paradigms currently under debate: sub-Chandrasekhar
explosions, deflagrations, delayed detonations, and pulsating delayed detonations. This re-
duced grid is just a representative sample of a more extensive grid of 19 models, which
constituted the base for the study of Type Ia SNRs conducted by Badenes (2004). The re-
maining 11 grid models are intermediate cases obtained by varying the parameters involved
in the calculation of each explosion paradigm. We have included these models in the Ap-
pendix, both for reference in future works and for the convenience of those readers who want
to use our synthetic SNR spectra for their own research. This grid is one representation of
our current understanding of one dimensional Type Ia explosion models, upon which most
of our knowledge of the physics of Type Ia SNe is based.
In view of the recent developments in the field, however, it has become clear that 1D
calculations will soon be superseded by the three dimensional models that have begun to
appear in the literature (Reinecke et al. 2002; Gamezo et al. 2003; Travaglio et al. 2004;
Garcia-Senz & Bravo 2005). These works have focused on pure deflagrations in 3D, proving
that they are capable of producing robust explosions, but the ability of these models to
explain the observations of Type Ia SNe has not been fully established yet. A common
feature in all 3D deflagration models, and the most remarkable difference with respect to
1D models, is the uniform mixing of unburnt C and O material with 56Ni and the other
products of nuclear burning throughout the ejecta. This mixing is due to the deformation
of the flame front caused by Rayleigh-Taylor instabilities, an effect which seems unavoidable
in 3D deflagrations. There has been some concern that the presence of large amounts of
C and O in the inner layers of ejecta would lead to a spectral evolution inconsistent with
optical observations (Gamezo et al. 2003), but complex spectral simulations are required to
– 10 –
verify this claim (Baron et al. 2003). Alternatives to the 3D deflagration scenario are being
explored right now, including delayed detonations in 3D (Garcia-Senz & Bravo 2003; Gamezo
et al. 2004b,a) and two new explosion paradigms: gravitationally confined detonation (Plewa
et al. 2004) and pulsating reverse detonation (Bravo et al. 2005), but none of these models
has been completely understood yet. Here, we study 3D deflagration models in the context
of the X-ray spectra of young SNRs to provide an independent method of assessing their
viability for Type Ia explosions.
We use a one dimensional average of model B30U, a 3D deflagration from Garcia-Senz
& Bravo (2005), to illustrate what can be expected from this class of models. The chemical
composition and density profile of this model are presented in the Appendix, and they are
very similar to those of the models obtained by Gamezo et al. (2003) and Travaglio et al.
(2004), even though the computational techniques and the resolution of the calculations are
different in each case (see Table 1 in Bravo et al. 2005, for a more detailed comparison of
these works). This shows that three dimensional deflagrations are relatively well understood,
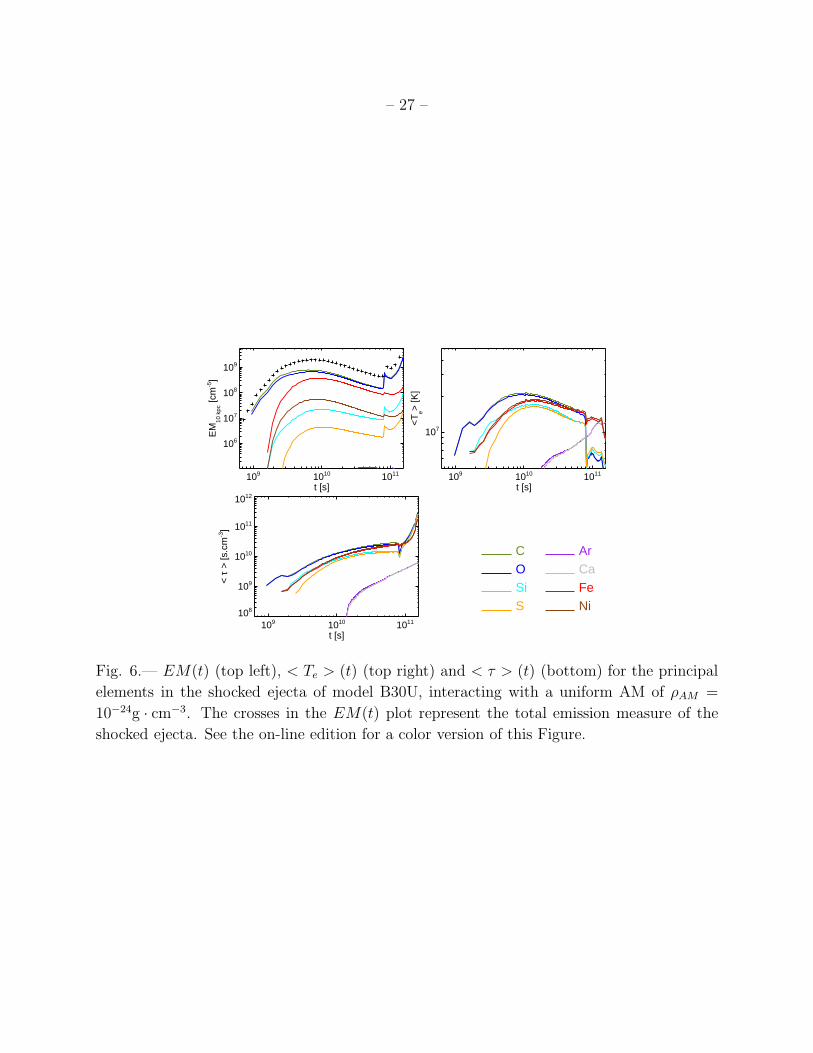
and supports our use of model B30U as a representative example of this class. The evolution
of the emission measures and emission measure-averaged ionization timescales and electron
temperatures of the principal elements in the ejecta of B30U are shown in Fig. 6 for an inter-
action with ρAM = 10−24g · cm−3 and β = βmin. Interpretation of differences between these
plots and Figures 4, 5, and 6 of Paper I is not straightforward, because the 3D calculations
are not fully self-consistent with the 1D models of the grid (the effect of the energy deposited
by the decay of 56Ni on the density profile, for instance, has not been taken into account).
Nevertheless, the main features of the evolution of the shocked ejecta do not depend on such
details. The most striking property of this model is the similarity in the spectral properties
(〈Te〉 and 〈τ〉) of Fe and Si throughout the evolution of the SNR. This is in marked contrast
to 1D models, where the stratification of the ejecta leads to significant differences between
Fe and Si. The abrupt changes in several plots seen at t ∼ 8 · 1010 s are due to the impact
of the reverse shock on a remnant of unburnt white dwarf material formed in model B30U
(for details, see Garcia-Senz & Bravo 2005).
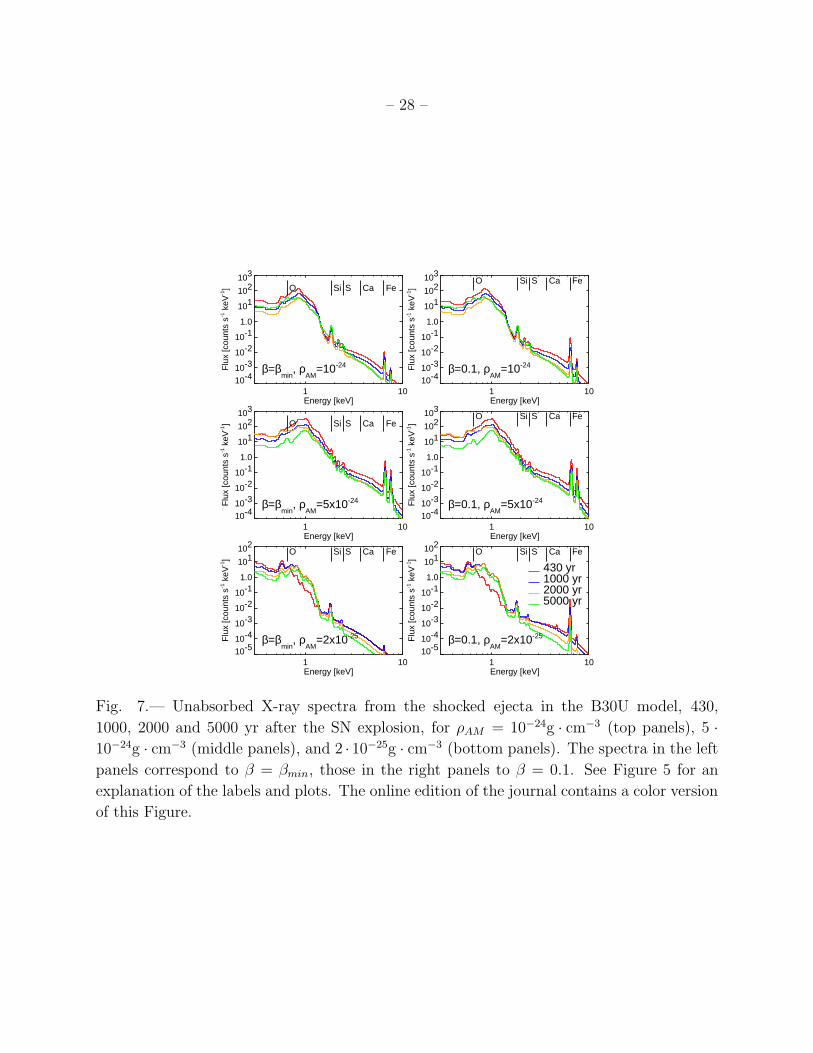
In Figure 7, we show the ejecta spectra of model B30U at the same values of t, ρAM
and β as in Figure 5 for model DDTe. The most remarkable properties of these spectra are
the high Fe L-shell flux and the presence of the prominent Ni Kα line at ∼ 7.5 keV (except
at the lowest AM densities). This is due to the large amounts of Fe and Ni that are found
in the outermost layers of B30U, where the density of the shocked ejecta is highest. The
results are a long Fe ionization timescale, which leads to the enhanced Fe L-shell flux, and
a high Ni emission measure leading to a strong Ni Kα emission. Such a strong Ni Kα line
has never been observed in thermal X-ray spectra of SNRs. Another interesting feature is
the relative weakness of the Si and S Kα lines. The reason for this is twofold: first, 3D
– 11 –
deflagrations produce smaller amounts of Si, S and other intermediate mass elements than
the conventional 1D delayed detonations; second, equivalent widths of the Si and S lines are
smaller because of the strong continuum produced by the large amount of C and O that is
present throughout the ejecta. These spectral characteristics exhibited by model B30U are
common to all 3D deflagrations with well mixed ejecta.
3.2. Comparison with X-ray observations of SNRs
We compare the results of our simulations for the 3D deflagration model B30U with
the basic properties of Type Ia SNRs. The prediction of similar emission measure-averaged
electron temperatures and ionization timescales for Si and Fe can be easily tested by exam-
ining X-ray observations. We have searched the literature for young SNRs with published
good-quality X-ray spectra that have been classified as Type Ia. Six objects meet these
requirements: the historical remnants of Tycho, Kepler and SN1006, and three Large Mag-
ellanic Cloud SNRs: N103B, 0509-67.5, and DEM L71. We note that the classification of
Kepler’s SNR as Type Ia is controversial (e.g., Blair 2004). The remnant of SN1006 is not
suitable for our purposes because it lacks strong Fe emission (Koyama et al. 1995). In the
case of DEM L71, although the X-ray spectrum of this SNR has been analyzed in some
detail (see Hughes et al. 2003; van der Heyden et al. 2003), we found no published estimates
of temperatures and ionization timescales for Fe and Si in the ejecta. The results of the
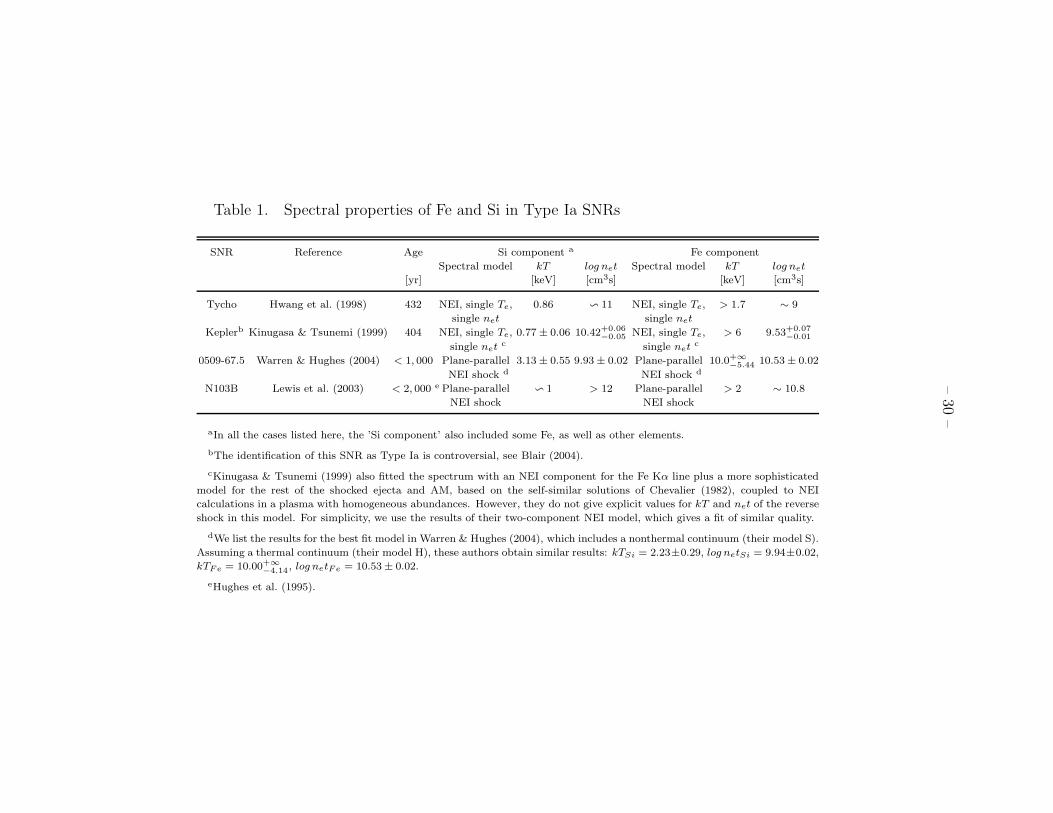
analysis of the integrated spectrum for the other four SNRs are summarized in Table 1.
The spectral properties of all the SNRs considered here show that an important fraction
of the Fe in the shocked ejecta is emitting under conditions different from those of the Si.
The authors of the works referenced in Table 1 accounted for this by either adding a spectral
component made of pure Fe to their fits or by using plane-parallel models that allowed
to treat Fe and Si separately by assigning different values of net and kT to each element.
Since the analysis techniques, models, and data quality were different in each case, these
results can only be compared either with our models or among themselves in a qualitative
way. Nevertheless, a clear trend can be observed in all four SNRs considered here: the Fe
component was always hotter than the Si component by at least a factor of 2. The Fe was
at a lower ionization timescale in three out of four objects: Tycho, Kepler, and N103B. In
0509-67.5, however, the Fe component has a higher ionization timescale than Si. In this case,
the statistics of the Fe Kα line were poor, and the ionization timescale of Fe was constrained
mostly by fitting the Fe L complex. Warren & Hughes (2004) note that their fit to the
Fe L complex emission was not complete, because a strong line had to be added by hand.
Improved atomic physics and higher resolution data would be highly desirable to confirm
– 12 –
this result for 0509-67.5.
Since the emission measure averaged ionization timescales and electron temperatures
of Si and Fe do not differ by more than 30% in model B30U (see Figure 6), we conclude
that this model is in conflict with the observations listed on Table 1, at least within the
limitations of our simulations. This conclusion is extensible to any model in which Fe and Si
are well mixed throughout the ejecta, and therefore can be applied to all the 3D deflagration
models for Type Ia SNe discussed in the previous section. As we have seen in § 2, a plasma
state with 〈Te〉Si < 〈Te〉Fe and 〈τ〉Si > 〈τ〉Fe arises naturally in Type Ia SN models with
stratified ejecta, such as 1D delayed detonations or pulsating delayed detonations, that
undergo a moderate amount of collisionless electron heating at the reverse shock. The
ionization timescales of Fe and Si in 0509-67.5 are clearly incompatible with this scenario,
but in this case Warren & Hughes (2004) found a very low amount of Fe in the shocked
ejecta, with Fe to Si abundance ratios below 0.07. While this is very difficult to interpret in
the context of well-mixed Type Ia SN ejecta, it could be more easily explained if the reverse
shock were just entering the Fe-dominated region in stratified ejecta. A detailed comparison
of our models with this SNR would be required to confirm this hypothesis.
We emphasize that our simulations based on one dimensional averages are too simple
to rule out well-mixed 3D Type Ia SN explosion models. We do not account for a number of
processes that might result in the Fe and Si in the ejecta emitting under different conditions,
like the Ni bubble effect (Basko 1994; Blondin et al. 2001) or the formation of clumps in
the ejecta (Wang & Chevalier 2001). Nevertheless, we find that the observations of Type
Ia SNRs seem easier to explain in the light of Type Ia SN explosion models with stratified
ejecta.
4. DISCUSSION AND CONCLUSIONS
In this paper, we have examined several important aspects of the X-ray spectral models
for the ejecta in Type Ia SNRs that were introduced in Badenes et al. (2003). We have
explored the impact of the amount of collisionless electron heating at the reverse shock,
β, and the density of the ambient medium, ρAM , on the integrated X-ray emission from
the ejecta in Type Ia SNR models of different ages. We found that even small amounts of
collisionless electron heating can modify the electron temperature profile inside the ejecta
in a significant way, leading to a region of hot material at low ionization timescales close
to the reverse shock. In the context of Type Ia SN explosion models with stratified ejecta,
this modified temperature profile can affect the emission from the inner layers rich in Fe
for a broad range of dynamical ages, increasing the flux in the Fe Kα complex. This could
– 13 –
explain why the Fe Kα emission peaks at smaller radii than Fe L in both the Tycho (Hwang
et al. 1998) and Kepler (Cassam-Chenai et al. 2004) SNRs. The density of the AM also
has a strong impact on the X-ray emission from the ejecta. For higher values of ρAM , the
SNR is in a more advanced evolutionary stage at a given age, and the ionization timescale of
the shocked ejecta increases significantly. At lower values of ρAM , the ionization timescales
decrease and the evolutionary stage is less advanced. We have provided approximate scaling
laws to estimate these effects, and discussed their impact on specific emission lines and line
complexes through an example.
We have also reviewed the fundamental properties of the recent deflagration models for
Type Ia SNe calculated in 3D, and their performance in the context of the X-ray spectra of
SNRs. Using our 1D simulation scheme, we have shown that the mixing of fuel and ashes
throughout the ejecta, which is a common feature of these 3D explosion models, results in all
the elements in the shocked ejecta of the SNR having very similar spectral characteristics. In
particular, the emission measure averaged ionization timescales and electron temperatures
of elements like Fe and Si are always very close to each other. This is in conflict with the
observations of Type Ia SNRs in our Galaxy and the Magellanic Clouds, where the Fe and
Si in the shocked ejecta are found to be emitting under different physical conditions. Within
the limitations of our 1D simulation scheme, these observations are easier to explain with
Type Ia explosion models that have stratified ejecta than with models that have well mixed
ejecta like 3D deflagrations.
We believe that our models represent a significant improvement over current methods
of analyzing and interpreting the X-ray emission from the shocked ejecta in SNRs. In order
to facilitate the comparison between our models and observations, we have built a library of
synthetic spectra, which is available from the authors upon request. This library is presented
in the Appendix, where more Type Ia SN explosion models are introduced, and some aspects
relevant to the comparison between the synthetic spectra and observations are discussed. A
detailed example of this kind of comparison in the framework of the ejecta emission from
the Tycho SNR will be the subject of a forthcoming paper (Badenes et al., in preparation).
We wish to thank Jack Hughes and Jessica Warren for detailed discussions concerning
0509-67.5. We also acknowledge conversations with Una Hwang and Martin Laming on
several aspects of the research presented here. We are grateful to the anonymous referee
for suggestions that helped to improve the quality of this manuscript. This research has
been partially supported by the CIRIT and MCyT in Spain, through grants AYA2000-
1785, AYA2001-2360, and AYA2002-04094-C03. CB would like to acknowledge support
from GENCAT (grant 2000FI 00376) and IEEC in Barcelona, and from grant GO3-4066X
from SAO at Rutgers. KJB is supported by NASA grant NAG 5-7153.
– 14 –
A. A LIBRARY OF SYNTHETIC SPECTRA FOR THE ANALYSIS OF
EJECTA EMISSION IN TYPE Ia SNRs
In this Appendix, we introduce our library of synthetic spectra for the ejecta emission
in Type Ia SNRs. The objective of this library is to provide observers with a complete set
of synthetic spectra for the ejecta emission in SNRs, calculated from an extensive grid of
Type Ia SN explosion models, at different values of t, ρAM , and β. At present, our library
includes more than 800 synthetic spectra in sequences like those presented in Figures 5 and
7 for models DDTe and B30U. For each model, we have generated synthetic spectra for
several values in the ranges 430 ≤ t ≤ 5000 yr; 2 · 10−25 ≤ ρAM ≤ 5 · 10−24g · cm−3; and
βmin ≤ β ≤ 0.1. In § A.1, we discuss these synthetic spectra in the context of the tools
that are currently used for the analysis of ejecta emission in SNRs. In§ A.2 we comment on
potential applications for our models. In § A.3, some important caveats and limitations of
the models are discussed. Finally, in § A.4, we introduce a number of Type Ia SN explosion
models that, together with those presented in Paper I, complete the exploration of the
parameter space for thermonuclear supernovae.
A.1. Rationale
The spectral analysis of the ejecta emission in young SNRs is a complex problem. De-
spite the spectacular increase in the quality of the observations, it has proved very difficult
to extract the relevant physical parameters from these observations in a reliable way with the
available tools. A frequent approach involves the fitting of several more or less sophisticated
NEI components with varying abundances, electron temperatures, and ionization timescales
to the observed X-ray spectra (several examples have been cited in § 3.2). The results of
applying this approach are not unique, and frequently very hard to interpret, because aver-
age parameters (like Te or net) are assigned to a plasma whose physical properties have an
enormous dynamic range, and where different chemical elements often emit under different
conditions (see Figures 1, 3, and 4). The determination of elemental abundances in the entire
volume of shocked plasma, which is crucial for establishing the connection between the SNRs
and the SN explosions that originated them, is particularly unreliable when it is based on
this approach. Often, NEI models just provide estimates for the emission measures of the
elements, under the assumption of a homogeneous composition, and the difference between
the ratios of these emission measures and the true abundance ratios in the plasma can be
several orders of magnitude (see section 4.2 of Paper I).
The synthetic spectra presented in Paper I and in the present work open new possibilities
for the interpretation of X-ray observations of Type Ia SNRs. Without claiming to include
– 15 –
all the complex physical processes at play in young SNRs (see § A.3), these synthetic spectra
provide a much more accurate representation of the state of the shocked ejecta in young
Type Ia SNRs than the simple NEI models currently available within software packages like
XSPEC. Moreover, since the synthetic spectra are calculated from realistic SN explosion
models, the connection between the observed spectrum and quantities like the explosion
energy or the amount of each element present in the ejecta are easy to establish. The
trade off is that the comparison between our synthetic spectra and X-ray observations is not
necessarily a straightforward procedure.
A.2. Comparing Models and Observations
Several strategies with varying degrees of sophistication can be followed to compare
our models to observations. A somewhat crude possibility is to focus on derived quantities
like 〈Te〉 and 〈τ〉, as we have done in § 3.2. While this can lead to interesting results, it is
far better to perform more direct spectral comparisons using the library of synthetic spectra
that we present here. The most effective way to apply this library will depend on the specific
observational constraints for the SNR under study. In some cases, like the historical Galactic
SNRs, the age will be known accurately, but the distance (and hence the total integrated
X-ray flux and the radius of the forward shock) will be more uncertain. In other cases,
like the SNRs in the Magellanic Clouds, the distance will be known, but the age will not.
Reliable independent estimates for ρAM may or may not be available. In each case, there will
be more than one way to reduce the dimensionality of the problem. Rather than providing a
recipe which may not be adequate for a specific case, we make here some suggestions which
might prove useful in a more general context.
First, it is important to note that each synthetic spectrum is based on an underlying
hydrodynamic model, so quantities such as the radius of the forward and the reverse shocks
and their expansion parameters are available for each spectral model (see Figure 3 and eqns.
(3), (4), and (5) in Paper I). In principle, it is possible to reverse the problem, find out
which hydrodynamic models agree better with the observations and thus reduce the number
of synthetic spectra to consider. In doing so, however, the limitations of 1D adiabatic
hydrodynamics must be considered (see the following section). Second, the selection of
a particular synthetic spectrum from our library to represent the ejecta component in an
observed X-ray spectrum may not be trivial. The substantial uncertainties in the atomic
data and the relative simplicity of the models with respect to real SNRs will probably make
it impossible to attain a statistically valid fit. Synthetic spectra like ours are more vulnerable
to these factors, because there is little room for self-adjustment, in contrast to conventional
– 16 –
NEI models with variable abundances. If the emissivity of a particular line is underestimated
in the spectral code used to generate our library, for instance, this cannot be compensated
by artificially enhancing the abundance of that particular element, as in a conventional NEI
model. Yet, even if some specific details of the observed spectrum cannot be reproduced, it is
often possible to find a model whose overall characteristics are in reasonable agreement with
the observations. Under these circumstances, a procedure needs to be devised in order to
measure the degree of success of a specific synthetic spectrum. An example shall be provided
in a forthcoming paper on the Tycho SNR (Badenes et al., in preparation).
A.3. Approximations and Caveats
Our models are just a simplified representation of the complexity of young SNRs, and
their limitations have to be considered when making comparison with observations. The
crucial approximations were reviewed in sections 3.5 and 5 of Paper I, but it is important to
revisit several issues here.
The most important simplification is certainly the assumption of spherical symmetry.
Any description of young SNRs in the framework of 1-D models is necessarily incomplete,
because it does not include important processes such as ejecta clumping and dynamic in-
stabilities at the contact discontinuity between shocked ejecta and shocked AM (Chevalier
et al. 1992; Wang & Chevalier 2001). The degree of ejecta clumping is crucial, and it is
clear that our 1D models (and in particular, the distribution of τ and Te for each element)
would be invalidated if clumps with a large density contrast like those proposed by Wang
& Chevalier (2001) were to dominate the emission measure of the shocked ejecta in Type
Ia SNRs. In this case, gross inconsistencies are expected to emerge from comparison of 1-D
models with observations. The degree of ejecta clumping strongly affects the morphology of
the X-ray emission, and examination of this morphology in Type Ia SNRs should shed light
on this issue. Multi-dimensional hydrodynamical simulations coupled with X-ray emission
calculations could prove useful for this.
Another important issue whose impact on the X-ray spectra is hard to estimate is the
effect of cosmic ray acceleration at the shocks. There is some indication that this process
might affect the dynamics and X-ray spectra of the shocked AM without significantly mod-
ifying those of the shocked ejecta (Decourchelle et al. 2000), but more detailed simulations
are needed to shed light on this question (see Ellison et al. 2005, for a discussion).
To conclude this section, we comment on the importance of radiative losses, which have
received some attention lately in the work of Blinnikov et al. (see Blinnikov et al. 2004, and
– 17 –
references therein). In Section 4 of Hamilton & Sarazin (1984), it was shown that radiative
losses always lead to catastrophic cooling in heavy element plasmas, driving the shocked
material to infrared- and optically-emitting temperatures. Because no optically emitting
knots with a composition dominated by heavy elements have been observed in Kepler, Tycho,
or SN1006 (see Blair et al. 1991; Smith et al. 1991), we conclude that radiative losses are not
dynamically important in young Type Ia SNRs under usual conditions. Radiative losses are
not included in our models in a self-consistent way, but we have extended the a posteriori
monitoring of radiative losses described in section 3.5 of Paper I to the more unfavorable
case of ρAM = 5 ·10−24g · cm−3. Our previous conclusions have been verified: radiative losses
only affect the outermost layers of the models with the steepest ejecta density profiles. The
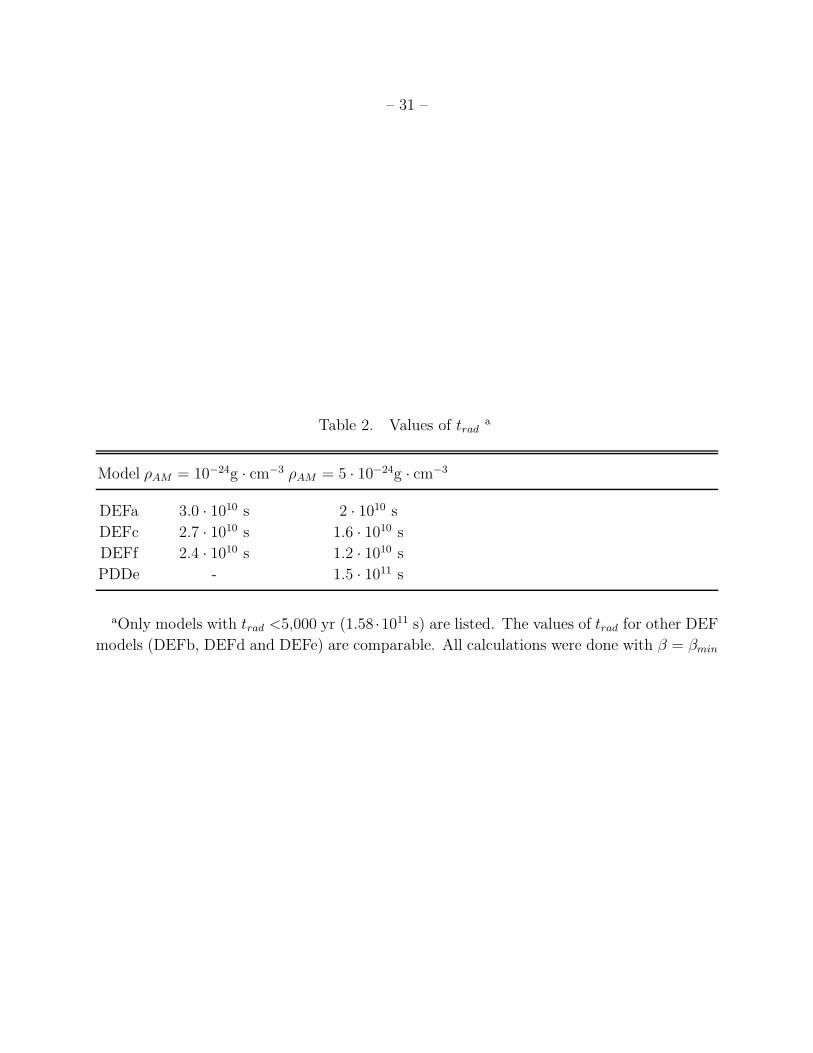
values of trad, as defined in Paper I (the time when the calculated losses exceed 10% of the
specific internal energy in at least 5% of the ejecta mass) for models with trad <5,000 yr are
provided in Table 2. In these models, our calculations for the properties (density, electron
temperature, ionization state, and X-ray emission) of the layers that undergo radiative losses
are not reliable close to or beyond trad, and some amount of infrared or optical emission should
be expected from this region of the ejecta. The fact that such emission is not observed in
Kepler, Tycho or SN1006 suggests that models which predict substantial radiative losses in
the ejecta are in conflict with observations of these historical SNRs.
A.4. The Complete Grid of Type Ia SN Explosion Models
A.4.1. One Dimensional Models
Among the eight one dimensional Type Ia SN explosion models introduced in Paper I,
one was a sub-Chandrasekhar explosion (SCH), one was a pure detonation (DET), two were
pure deflagrations (DEFa and DEFf), two were delayed detonations (DDTa and DDTe), and
two were pulsating delayed detonations (PDDa and PDDe). These explosion paradigms, and
the details involved in the calculation of the models, are described in Paper I (Section 2 and
Appendix). For the deflagrations, delayed detonations and pulsating delayed detonations,
the models presented in Paper I were extreme cases, obtained by considering the highest and
lowest reasonable values of the parameters involved in each calculation. In the case of the
deflagration models, the relevant parameter is κ, which controls the propagation velocity of
the subsonic flame. For the delayed detonation and pulsating delayed detonation, the pa-
rameters are ρtr, which determines the density at which the transition from deflagration to
detonation occurs, and ι, which determines the flame velocity in the deflagration stage. All
these parameters are defined in the Appendix of Paper I. By varying these parameters, we
have generated four more deflagrations (DEFb, DEFc, DEFd, and DEFe), four more delayed
– 18 –
detonations (DDTb, DDTbb, DDTc, and DDTd), and three more pulsating delayed detona-
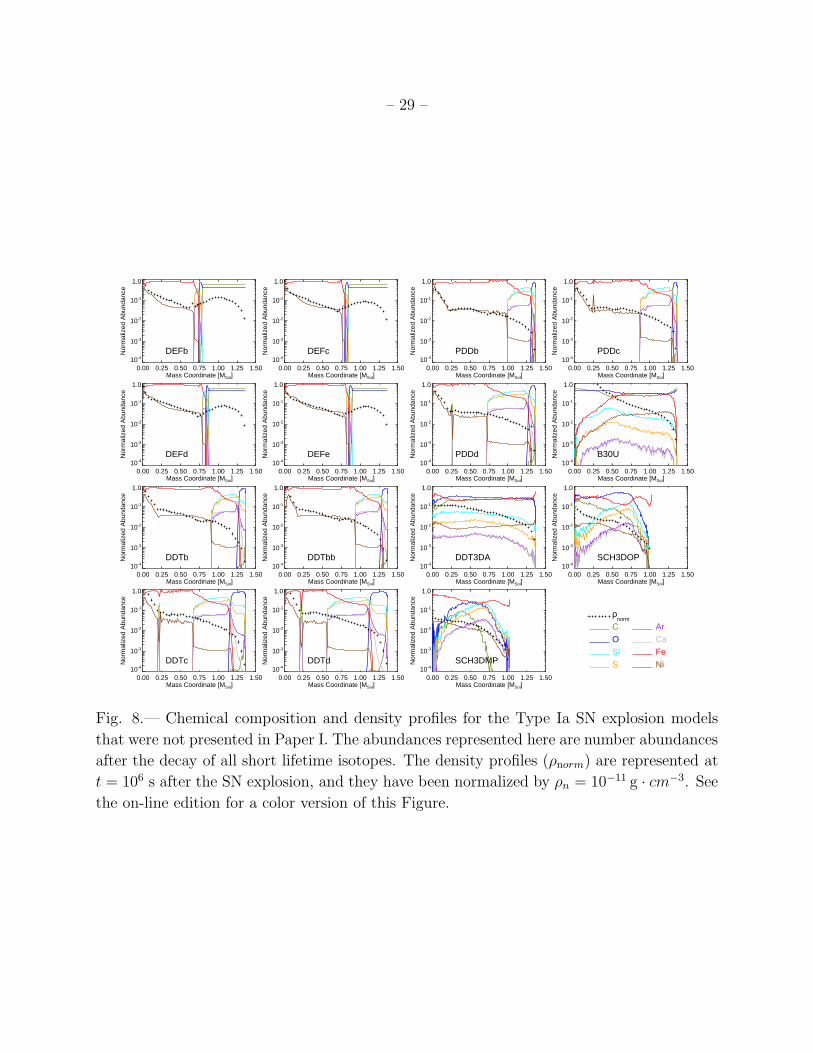
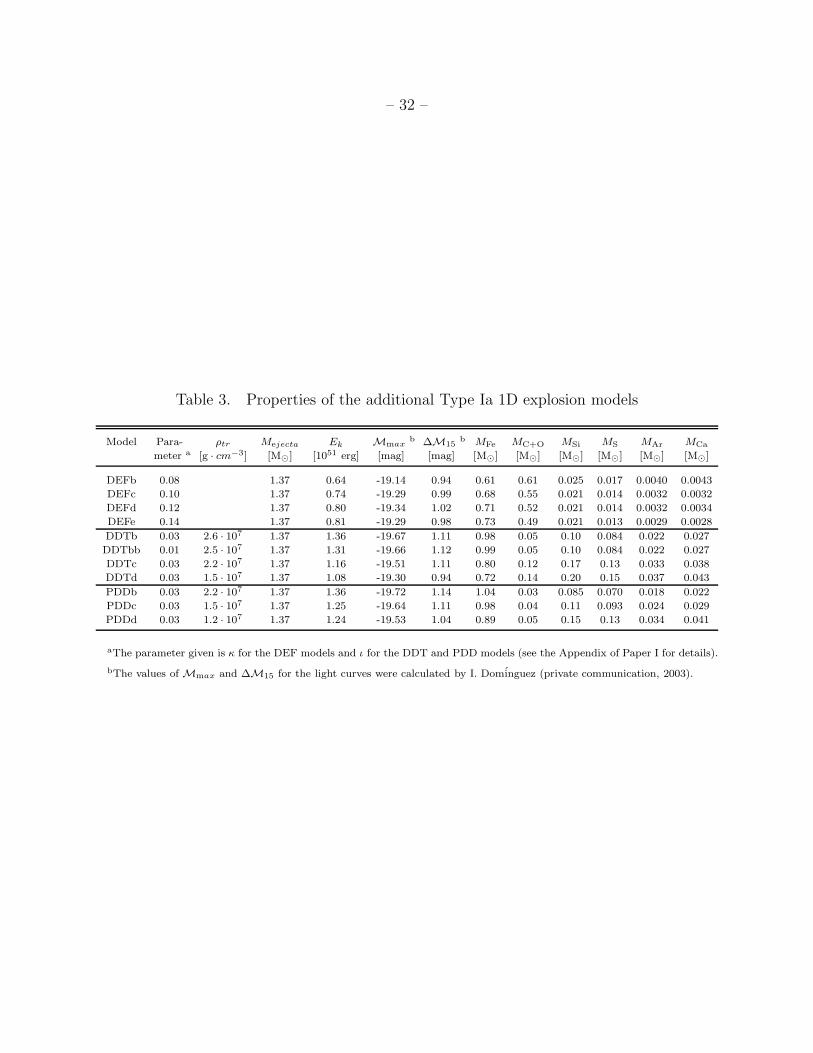
tions (PDDb, PDDc, and PDDd). In Table 3 and Figure 8, we present the nucleosynthetic
output, chemical composition profiles and density profiles of these intermediate models that
complete the exploration of the parameter space.
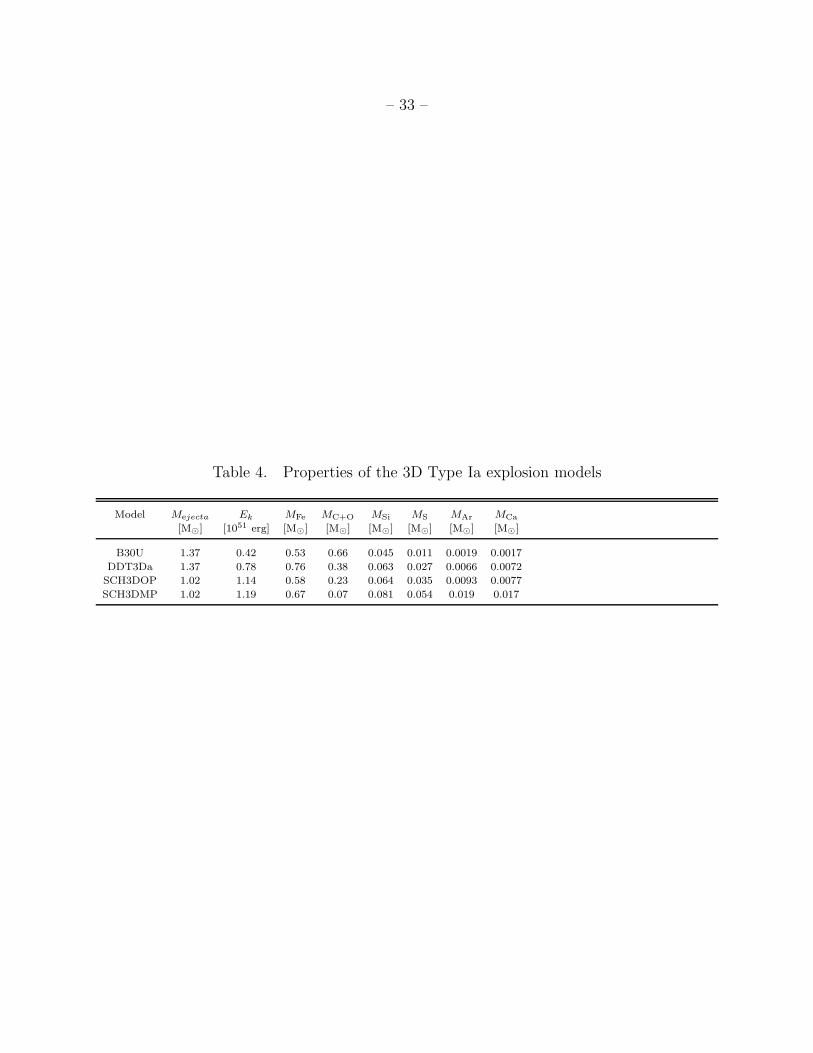
A.4.2. Three Dimensional Models
A brief discussion on the state of the art in 3D calculations of thermonuclear SN explo-
sions can be found in § 3.1 of this work; for a review see Bravo et al. (2005). Without going
into the details of how these 3D models are calculated, here we present four one-dimensional
mappings of 3D models that are representative of the current trends. Their main characteris-
tics are given in Figure 8 and Table 4. Model B30U is a 3D deflagration from Garcia-Senz &
Bravo (2005), very similar to the models by Gamezo et al. (2003) and Travaglio et al. (2004)
(see discussion in § 3). Model DDT3DA is a 3D version of the delayed detonation paradigm
(Garcia-Senz & Bravo 2003). In this model, a detonation was artificially inducted in those
regions were the flame resulting from the turbulent deflagration phase was well described
by a fractal surface of dimension larger than 2.5. We note that this particular model also
results in very well mixed ejecta, and in fact the properties of its X-ray emission in the SNR
phase are very similar to those of model B30U. Other delayed detonations in 3D calculated
with different assumptions for the induction of the detonation result in more stratified ejecta
(Gamezo et al. 2004b,a). For a comparison between these two kinds of three dimensional
delayed detonations, see Table 1 and the accompanying text in Bravo et al. (2005). Finally,
two 3D sub-Chandrasekhar models from Garcia-Senz et al. (1999) have also been included
in the grid. Model SCH3DOP is a sub-Chandrasekhar explosion calculated in 3D where
the layer of degenerate He was ignited at one single point, while in SCH3DMP the ignition
happened at five different points. It is worth noting that none of the 3D models has been
followed for a sufficient time to account for the effects of the decay of 56Ni on the density
profiles.
– 19 –
REFERENCES
Badenes, C. 2004, PhD thesis, Universitat Politecnica de Catalunya
Badenes, C., Bravo, E., Borkowski, K., & Dominguez, I. 2003, ApJ, 593, 358 [Paper I]
Badenes, C., Bravo, E. & Borkowski, K. 2005, Adv. Space Res., submitted
Baron, E., Lentz, E., & Hauschildt, P. 2003, ApJ, 588, L29
Basko, M. 1994, ApJ, 425, 264
Blair, W. 2004, in 1604-2004: Supernovae as Cosmological Lighthouses, ed. M. Turatto,
L. Zampieri, S. Benetti, & W. Shea. (ASP Conference Series), in press [astro-
ph/0410081]
Blair, W., Long, K., & Vancura, O. 1991, ApJ, 366, 484
Blinnikov, S., Bakalanov, P., A.V.Kozyrcva, & Sorokina, E. 2004, in 1604-2004: Supernovae
as Cosmological Lighthouses, ed. M. Turatto, L. Zampieri, S. Benetti, & W. Shea.
(ASP Conference Series), in press [astro-ph/0409396]
Blondin, J., Borkowski, K., & Reynolds, S. 2001, ApJ, 557, 782
Borkowski, K., Lyerly, W., & Reynolds, S. 2001, ApJ, 548, 820
Branch, D. & Khokhlov, A. 1995, Phys. Rep., 256, 53
Bravo, E., Badenes, C. & Garcia-Senz, D. 2005, in Interacting Binaries: Accretion, Evolution
and Outcomes, ed. L.A. Antonelli, L. Burderi, F. D’Antona, T. Di Salvo, G.L. Israel,
L. Piersanti, O. Straniero & A. Tornambe. (AIP Conference Series), in press, [astro-
ph/0412155]
Cargill, P. & Papadopoulos, K. 1988, ApJ, 329, L29
Cassam-Chenai, G., Decourchelle, A., Ballet, J., Hwang, U., Hughes, J., & R.Petre. 2004,
A&A, 414, 545
Chevalier, R. 1982, ApJ, 258, 790
Chevalier, R., Blondin, J., & Emmering, R. 1992, ApJ, 392, 118
Decourchelle, A., Ellison, D., & Ballet, J. 2000, ApJ, 543, L57
Dwarkadas, V. & Chevalier, R. 1998, ApJ, 497, 807
– 20 –
Ellison, D., Decourchelle, A., & Ballet, J. 2005, A&A, 429, 569
Gamezo, V., Khokhlov, A. & Oran, E. 2005, ApJ, submitted [astro-ph/0409598]
Gamezo, V., Khokhlov, A. & Oran, E. 2004, Phys. Rev. Lett., 92, 1102
Gamezo, V., Khokhlov, A., Oran, E., Chtchelkanova, A., & Rosenberg, R. 2003, Science,
299, 77
Garcia-Senz, D. & Bravo, E. 2003, in From Twilight to Highlight: The Physics of Supernovae,
ed. W. Hillebrandt and B. Leibundgut (Berlin: Springer), 158 [astro-ph/0211242]
Garcia-Senz, D. & Bravo, E. 2005, A&A, in press, [astro-ph/0409480]
Garcia-Senz, D., Bravo, E. & Woosley, S. E. 1999, A&A, 349, 177
Ghavamian, P., Raymond, J., Smith, R., & Hartigan, P. 2001, ApJ, 547, 995
Hamilton, A. & Fesen, R. 1988, ApJ, 327, 178
Hamilton, A., Fesen, R., Wu, C., Crenshaw, D., & Sarazin, C. L. 1997, ApJ, 481, 838
Hamilton, A. & Sarazin, C. 1984, ApJ, 287, 282
Hillebrandt, W. & Niemeyer, J. 2000, ARA&A, 38, 191
Hoflich, P. & Khokhlov, A. 1996, ApJ, 457, 500
Hughes, J., Ghavamian, P., Rakowski, C., & Slane, P. 2003, ApJ, 582, L95
Hughes, J., Hayashi, I., Helfand, D., Hwang, U., Itoh, M., Kirshner, R., Koyama, K., Mark-
ert, T., Tsunemi, H., & Woo, J. 1995, ApJ, 444, L81
Hwang, U., Hughes, J., & Petre, R. 1998, ApJ, 497, 833
Kinugasa, K. & Tsunemi, H. 1999, PASJ, 51, 239
Koyama, K., Petre, R., Gotthelf, E., Hwang, U., Matsuura, M., Ozaki, M., & Holt, S. 1995,
Nature, 378, 255
Laming, J. M. 2000, ApJS, 127, 409
Lewis, K., Burrows, D., Hughes, J., Slane, P., Garmire, G., & Nousek, J. 2003, ApJ, 582,
770
Plewa, T., Calder, A.C., & Lamb, D.Q. 2004, ApJ, 612, L37
– 21 –
Rakowski, C., Ghavamian, P., & Hughes, J. 2003, ApJ, 590, 846
Reinecke, M., Hillebrandt, W., & Niemeyer, J. 2002, A&A, 391, 1167
Smith, R., Kirshner, R., Blair, W., & Winkler, P. 1991, ApJ, 375, 652
Travaglio, C., Hillebrandt, W., Reinecke, M., & Thielemann, F.-K. 2004, A&A, 425, 1029
van der Heyden, K., Bleeker, J., Kaastra, J., & Vink, J. 2003, A&A, 406, 141
Vink, J., Laming, M., Gu, M., Rasmussen, A., & Kaastra, J. 2003, ApJ, 587, L31
Wang, C.-Y. & Chevalier, R. 2001, ApJ, 549, 1119
Warren, J. & Hughes, J. 2004, ApJ, 608, 261
This preprint was prepared with the AAS LATEX macros v5.2.
– 22 –
0.75 0.80 0.85 0.90 0.95r [1019 cm]
10-25
10-24
10-23
Den
sity
[g c
m-3]
1015
1016
1017
1018
Inte
rnal
Ene
rgy
[erg
g-1]ρ
εa
0.75 0.80 0.85 0.90 0.95r [1019 cm]
02
4
6
8
10
12
14
Z [e
]
FeSi-S
C-Ob
0.75 0.80 0.85 0.90 0.95r [1019 cm]
105
106
107
108
109
1010
1011
T [K
]
Te
Ti
c
0.75 0.80 0.85 0.90 0.95r [1019 cm]
105
106
107
108
109
1010
1011
Ioni
zatio
n T
imes
cale
[s c
m-3]
d
Fig. 1.— Shocked ejecta structure vs. radius for model DDTe interacting with an ambient
medium of density 10−24 g · cm−3, 430 years after the explosion. The panels show the radial
distribution of density and specific internal energy (a), mean number of electrons per ion,
Z, with an indication of the ejecta layers dominated by Fe, Si-S and C-O (b), electron and
ion temperatures (c) and ionization timescale (d). The positions of the reverse shock and
contact discontinuity are outlined by the limits of the temperature plots in panel c. The
three plots for Z (panel b), Te (panel c) and τ (panel d) represent the values obtained with
β = βmin (solid), β = 0.01 (dashed) and β = 0.1 (dash-dotted).
– 23 –
Fig. 2.— Evolution of 〈Te〉X for C, O, Si, S, Ar, Ca, Fe and Ni in the shocked ejecta of
model DDTe, with ρAM = 10−24 g · cm−3. The top left panel corresponds to β = βmin, and
is the same as panel b of Figure 5 in Paper I, but with a different scale. The top right panel
corresponds to β = 0.01, and the bottom left panel to β = 0.1.
– 24 –
0.50 0.55 0.60 0.65 0.70r [1019 cm]
10-25
10-24
10-23
10-22
Den
sity
[g c
m-3]
1015
1016
1017
1018
Inte
rnal
Ene
rgy
[erg
g-1]ρ
εa
0.50 0.55 0.60 0.65 0.70r [1019 cm]
0
5
10
15
20
Z [e
]
FeSi-S
C-Ob
0.50 0.55 0.60 0.65 0.70r [1019 cm]
105
106
107
108
109
1010
1011
T [K
]
Te
Ti
c
0.50 0.55 0.60 0.65 0.70r [1019 cm]
105
106
107
108
109
1010
1011
Ioni
zatio
n T
imes
cale
[s c
m-3]
d
Fig. 3.— Shocked ejecta structure vs. radius for model DDTe, with ρAM = 5 ·10−24 g · cm−3,
430 years after the explosion. See Figure 1 for an explanation of the plots and labels.
– 25 –
1.100 1.125 1.150 1.175 1.200r [1019 cm]
10-25
10-24
10-23
Den
sity
[g c
m-3]
1015
1016
1017
1018
Inte
rnal
Ene
rgy
[erg
g-1]ρ
εa
1.100 1.125 1.150 1.175 1.200r [1019 cm]
0
2
4
6
8
Z [e
]
Si-SC-O
b
1.100 1.125 1.150 1.175 1.200r [1019 cm]
105
106
107
108
109
1010
1011
T [K
]
Te
Ti
c
1.100 1.125 1.150 1.175 1.200r [1019 cm]
104
105
106
107
108
109
1010
Ioni
zatio
n T
imes
cale
[s c
m-3]
d
Fig. 4.— Shocked ejecta structure vs. radius for model DDTe, with ρAM = 2 ·10−25 g · cm−3,
430 years after the explosion. See Figure 1 for an explanation of the plots and labels.
– 26 –
Fig. 5.— Unabsorbed X-ray spectra from the shocked ejecta of the DDTe model, 430,
1000, 2000 and 5000 yr after the SN explosion, for ρAM = 10−24g · cm−3 (top panels), 5 ·
10−24g · cm−3 (middle panels), and 2 · 10−25g · cm−3 (bottom panels), convolved with the
spectral response of the XMM-Newton EPIC MOS1 CCD camera. The spectra in the left
panels correspond to β = βmin, those in the right panels to β = 0.1. The Kα lines of Fe, Ca,
S, and Si, as well as the O Lyα line, have been marked for clarity, and fluxes are calculated
at a fiducial distance of 10 kpc. Note that the spectral code has no atomic data for Ar. See
the on-line edition for a color version of this Figure.
– 27 –
109 1010 1011
t [s]
106
107
108
109
EM
10 k
pc [c
m-5]
109 1010 1011
t [s]
107
<T
e> [K
]
109 1010 1011
t [s]
108
109
1010
1011
1012
< τ
> [s
.cm
-3]
COSiS
ArCaFeNi
Fig. 6.— EM(t) (top left), < Te > (t) (top right) and < τ > (t) (bottom) for the principal
elements in the shocked ejecta of model B30U, interacting with a uniform AM of ρAM =
10−24g · cm−3. The crosses in the EM(t) plot represent the total emission measure of the
shocked ejecta. See the on-line edition for a color version of this Figure.
– 28 –
1 10Energy [keV]
10-410-310-210-1
1.0
101102103
Flu
x [c
ount
s s-1
keV
-1] O Si S Ca Fe
β=βmin
, ρAM
=10-24
1 10Energy [keV]
10-410-310-210-1
1.0
101102103
Flu
x [c
ount
s s-1
keV
-1]
O Si S Ca Fe
β=0.1, ρAM
=10-24
1 10Energy [keV]
10-410-310-210-1
1.0
101102103
Flu
x [c
ount
s s-1
keV
-1] O Si S Ca Fe
β=βmin
, ρAM
=5x10-24
1 10Energy [keV]
10-410-310-210-1
1.0
101102103
Flu
x [c
ount
s s-1
keV
-1]
O Si S Ca Fe
β=0.1, ρAM
=5x10-24
1 10Energy [keV]
10-510-410-310-210-1
1.0
101102
Flu
x [c
ount
s s-1
keV
-1]
O Si S Ca Fe
β=βmin
, ρAM
=2x10-25
1 10Energy [keV]
10-510-410-310-210-1
1.0
101102
Flu
x [c
ount
s s-1
keV
-1]
O Si S Ca Fe
β=0.1, ρAM
=2x10-25
430 yr1000 yr2000 yr5000 yr
Fig. 7.— Unabsorbed X-ray spectra from the shocked ejecta in the B30U model, 430,
1000, 2000 and 5000 yr after the SN explosion, for ρAM = 10−24g · cm−3 (top panels), 5 ·
10−24g · cm−3 (middle panels), and 2 · 10−25g · cm−3 (bottom panels). The spectra in the left
panels correspond to β = βmin, those in the right panels to β = 0.1. See Figure 5 for an
explanation of the labels and plots. The online edition of the journal contains a color version
of this Figure.
– 29 –
0.00 0.25 0.50 0.75 1.00 1.25 1.50Mass Coordinate [MSol]
10-4
10-3
10-2
10-1
1.0
Nor
mal
ized
Abu
ndan
ce
DEFb
0.00 0.25 0.50 0.75 1.00 1.25 1.50Mass Coordinate [MSol]
10-4
10-3
10-2
10-1
1.0
Nor
mal
ized
Abu
ndan
ce
DEFc
0.00 0.25 0.50 0.75 1.00 1.25 1.50Mass Coordinate [MSol]
10-4
10-3
10-2
10-1
1.0
Nor
mal
ized
Abu
ndan
ce
DEFd
0.00 0.25 0.50 0.75 1.00 1.25 1.50Mass Coordinate [MSol]
10-4
10-3
10-2
10-1
1.0
Nor
mal
ized
Abu
ndan
ce
DEFe
0.00 0.25 0.50 0.75 1.00 1.25 1.50Mass Coordinate [MSol]
10-4
10-3
10-2
10-1
1.0
Nor
mal
ized
Abu
ndan
ce
DDTb
0.00 0.25 0.50 0.75 1.00 1.25 1.50Mass Coordinate [MSol]
10-4
10-3
10-2
10-1
1.0
Nor
mal
ized
Abu
ndan
ce
DDTbb
0.00 0.25 0.50 0.75 1.00 1.25 1.50Mass Coordinate [MSol]
10-4
10-3
10-2
10-1
1.0
Nor
mal
ized
Abu
ndan
ce
DDTc
0.00 0.25 0.50 0.75 1.00 1.25 1.50Mass Coordinate [MSol]
10-4
10-3
10-2
10-1
1.0
Nor
mal
ized
Abu
ndan
ce
DDTd
0.00 0.25 0.50 0.75 1.00 1.25 1.50Mass Coordinate [MSol]
10-4
10-3
10-2
10-1
1.0
Nor
mal
ized
Abu
ndan
ce
PDDb
0.00 0.25 0.50 0.75 1.00 1.25 1.50Mass Coordinate [MSol]
10-4
10-3
10-2
10-1
1.0
Nor
mal
ized
Abu
ndan
ce
PDDc
0.00 0.25 0.50 0.75 1.00 1.25 1.50Mass Coordinate [MSol]
10-4
10-3
10-2
10-1
1.0
Nor
mal
ized
Abu
ndan
ce
PDDd
0.00 0.25 0.50 0.75 1.00 1.25 1.50Mass Coordinate [MSol]
10-4
10-3
10-2
10-1
1.0
Nor
mal
ized
Abu
ndan
ce
B30U
0.00 0.25 0.50 0.75 1.00 1.25 1.50Mass Coordinate [MSol]
10-4
10-3
10-2
10-1
1.0
Nor
mal
ized
Abu
ndan
ce
DDT3DA
0.00 0.25 0.50 0.75 1.00 1.25 1.50Mass Coordinate [MSol]
10-4
10-3
10-2
10-1
1.0
Nor
mal
ized
Abu
ndan
ceSCH3DOP
0.00 0.25 0.50 0.75 1.00 1.25 1.50Mass Coordinate [MSol]
10-4
10-3
10-2
10-1
1.0
Nor
mal
ized
Abu
ndan
ce
SCH3DMP
ρnorm
COSiS
ArCaFeNi
Fig. 8.— Chemical composition and density profiles for the Type Ia SN explosion models
that were not presented in Paper I. The abundances represented here are number abundances
after the decay of all short lifetime isotopes. The density profiles (ρnorm) are represented at
t = 106 s after the SN explosion, and they have been normalized by ρn = 10−11 g · cm−3. See
the on-line edition for a color version of this Figure.
–30
–
Table 1. Spectral properties of Fe and Si in Type Ia SNRs
SNR Reference Age Si component a Fe component
Spectral model kT log net Spectral model kT log net
[yr] [keV] [cm3s] [keV] [cm3s]
Tycho Hwang et al. (1998) 432 NEI, single Te, 0.86 ∽ 11 NEI, single Te, > 1.7 ∼ 9
single net single net
Keplerb Kinugasa & Tsunemi (1999) 404 NEI, single Te, 0.77 ± 0.06 10.42+0.06−0.05 NEI, single Te, > 6 9.53+0.07
−0.01
single net c single net c
0509-67.5 Warren & Hughes (2004) < 1, 000 Plane-parallel 3.13 ± 0.55 9.93 ± 0.02 Plane-parallel 10.0+∞
−5.44 10.53 ± 0.02
NEI shock d NEI shock d
N103B Lewis et al. (2003) < 2, 000 e Plane-parallel ∽ 1 > 12 Plane-parallel > 2 ∼ 10.8
NEI shock NEI shock
aIn all the cases listed here, the ’Si component’ also included some Fe, as well as other elements.
bThe identification of this SNR as Type Ia is controversial, see Blair (2004).
cKinugasa & Tsunemi (1999) also fitted the spectrum with an NEI component for the Fe Kα line plus a more sophisticated
model for the rest of the shocked ejecta and AM, based on the self-similar solutions of Chevalier (1982), coupled to NEI
calculations in a plasma with homogeneous abundances. However, they do not give explicit values for kT and net of the reverse
shock in this model. For simplicity, we use the results of their two-component NEI model, which gives a fit of similar quality.
dWe list the results for the best fit model in Warren & Hughes (2004), which includes a nonthermal continuum (their model S).
Assuming a thermal continuum (their model H), these authors obtain similar results: kTSi = 2.23±0.29, log netSi = 9.94±0.02,
kTF e = 10.00+∞
−4.14, log netF e = 10.53 ± 0.02.
eHughes et al. (1995).
– 31 –
Table 2. Values of trada
Model ρAM = 10−24g · cm−3 ρAM = 5 · 10−24g · cm−3
DEFa 3.0 · 1010 s 2 · 1010 s
DEFc 2.7 · 1010 s 1.6 · 1010 s
DEFf 2.4 · 1010 s 1.2 · 1010 s
PDDe - 1.5 · 1011 s
aOnly models with trad <5,000 yr (1.58 ·1011 s) are listed. The values of trad for other DEF
models (DEFb, DEFd and DEFe) are comparable. All calculations were done with β = βmin
– 32 –
Table 3. Properties of the additional Type Ia 1D explosion models
Model Para- ρtr Mejecta Ek Mmaxb ∆M15
b MFe MC+O MSi MS MAr MCa
meter a [g · cm−3] [M⊙] [1051 erg] [mag] [mag] [M⊙] [M⊙] [M⊙] [M⊙] [M⊙] [M⊙]
DEFb 0.08 1.37 0.64 -19.14 0.94 0.61 0.61 0.025 0.017 0.0040 0.0043
DEFc 0.10 1.37 0.74 -19.29 0.99 0.68 0.55 0.021 0.014 0.0032 0.0032
DEFd 0.12 1.37 0.80 -19.34 1.02 0.71 0.52 0.021 0.014 0.0032 0.0034
DEFe 0.14 1.37 0.81 -19.29 0.98 0.73 0.49 0.021 0.013 0.0029 0.0028
DDTb 0.03 2.6 · 107 1.37 1.36 -19.67 1.11 0.98 0.05 0.10 0.084 0.022 0.027
DDTbb 0.01 2.5 · 107 1.37 1.31 -19.66 1.12 0.99 0.05 0.10 0.084 0.022 0.027
DDTc 0.03 2.2 · 107 1.37 1.16 -19.51 1.11 0.80 0.12 0.17 0.13 0.033 0.038
DDTd 0.03 1.5 · 107 1.37 1.08 -19.30 0.94 0.72 0.14 0.20 0.15 0.037 0.043
PDDb 0.03 2.2 · 107 1.37 1.36 -19.72 1.14 1.04 0.03 0.085 0.070 0.018 0.022
PDDc 0.03 1.5 · 107 1.37 1.25 -19.64 1.11 0.98 0.04 0.11 0.093 0.024 0.029
PDDd 0.03 1.2 · 107 1.37 1.24 -19.53 1.04 0.89 0.05 0.15 0.13 0.034 0.041
aThe parameter given is κ for the DEF models and ι for the DDT and PDD models (see the Appendix of Paper I for details).
bThe values of Mmax and ∆M15 for the light curves were calculated by I. Dominguez (private communication, 2003).
– 33 –
Table 4. Properties of the 3D Type Ia explosion models
Model Mejecta Ek MFe MC+O MSi MS MAr MCa
[M⊙] [1051 erg] [M⊙] [M⊙] [M⊙] [M⊙] [M⊙] [M⊙]
B30U 1.37 0.42 0.53 0.66 0.045 0.011 0.0019 0.0017
DDT3Da 1.37 0.78 0.76 0.38 0.063 0.027 0.0066 0.0072
SCH3DOP 1.02 1.14 0.58 0.23 0.064 0.035 0.0093 0.0077
SCH3DMP 1.02 1.19 0.67 0.07 0.081 0.054 0.019 0.017
Related Documents


![Atmospheric Effects On Ejecta Emplacementejection velocity), ejecta size, and atmospheric pressure (i.e., density). Schultz and Gault [1979] compared this critical ejecta size for](https://static.cupdf.com/doc/110x72/6064ee3cd22347643a4f2160/atmospheric-effects-on-ejecta-ejection-velocity-ejecta-size-and-atmospheric-pressure.jpg)


![METALLIC ARTIFACT REMNANTS IN A SHOCK ...layer (Fig. 2), which is interpreted as impact ejecta sustained by a big, now established Lake Chiemsee tsunami [9]. A short overview of the](https://static.cupdf.com/doc/110x72/60ab82d86184e026cd704b14/metallic-artifact-remnants-in-a-shock-layer-fig-2-which-is-interpreted-as.jpg)