Thermal transport around tears in graphene G. C. Loh, E. H. T. Teo, and B. K. Tay a) School of Electrical and Electronic Engineering, Nanyang Technological University, Singapore 639798 (Received 29 October 2010; accepted 18 December 2010; published online 24 February 2011) Tears in any material act as barriers to phonon transport. In this study, molecular dynamics simulations are employed to investigate thermal transport around tears in graphene. Specifically, thermal boundary conductance across different tear orientations and lengths is computed. Analysis of vibrational density of states suggests that long-wavelength acoustic phonons within the spectrum range 0–700 cm 1 are vital to thermal transport across the tears. Different phonon scattering phenomena are observed for both tear orientations. It is proposed that the dissimilitude of the scattering processes encountered by phonons carrying energy around the tears to the opposite end explains why thermal transport is generally more efficient for longitudinal tears in our simulations. V C 2011 American Institute of Physics. [doi:10.1063/1.3549735] I. INTRODUCTION Thermal energy is transported predominantly by elec- trons and phonons. In semiconductors, the primary heat car- riers are wavelike lattice vibrations, or phonons. Through recent academic and industrial efforts, it has been discovered that materials such as carbon nanotubes and graphene 1–7 have excellent intrinsic thermal conductance. However it is imperative to note that utilizing these materials is only a par- tial step to ensure the efficient removal of heat. At interfaces between materials, phonon transmission is often not perfect. As the efficiency of interfacial transport may dictate the effective thermal conductance, especially in complex nano- structures with numerous interfaces, it is increasingly perti- nent that this physical phenomenon is explored further. Thermal boundary resistance, or Kapitza resistance, is an interfacial resistance that exists due to a mismatch of the lattice-vibrational spectra of the two media. Not all phonons transmit through the interface, and the probability of trans- mission is governed essentially by the matching of the vibra- tional spectra and the phonon velocities. Two well known models provide theoretical and numerical interpretations to this phenomenon. The first tool is the acoustic mismatch model (AMM) 8,9 which defines the interfacial thermal resist- ance to be a function of phonon density on both media. 10 The transmission coefficient from medium 1 to medium 2 is given by 11 s r1!2 ¼ 4Z 2 Z 1 ðZ 1 þ Z 2 Þ 2 ; (1) where Z i refers to the acoustic impedance, and is the product between the density q and phonon velocity c of medium i. As a manifestation of the phonon dynamics, and an extension of Fourier’s law, thermal boundary resistances (TBRs) can also be calculated by quantifying the temperature drop at the interface, and the thermal flux across it. The following rela- tionship applies R K ¼ DT J ; (2) where DT is the temperature drop, and J is the thermal flux through a cross-sectional area per unit time. 11 The second tool is the diffuse mismatch model (DMM) 12 which postulates that scattering at the interface is completely diffusive in nature. In other words, the scattered phonons lose all memory of polarization and incident angle. 13 Essentially, only energy is conserved through the interface. In addition, within this model, elastic scattering is commonly assumed, suggesting that a phonon of frequency x will only scatter with another phonon of the same frequency. Therefore, pho- non transmission is entirely determined by the phonon popu- lation of the lower Debye frequency material. Basically, there is more species mixing at elevated temperatures. The interface roughness is greater, magnifying the probability of diffusive scattering. Consequently, at high temperatures, DMM generally predicts a more accurate thermal boundary resistance than AMM. However, as a matter of fact, DMM results can still disagree with experimental data by more than an order of magnitude. It is suggested that the discrepancies may be due to reasons including multiple elastic phonon scat- tering at the interface, 14,15 the presence of inelastic scatter- ing, 13 electron-phonon resistances, 16 and different definitions of interface roughness. 14,17 Other than interfaces, thermal boundary resistances also exist in defected materials. Although defects, especially point defects, are strictly not “boundaries”, the scattering of phonons at these defects begets a temperature discontinuity, similarly observed at boundaries. This thermal barrier abates the efficiency of heat sinks to direct away thermal energy, effectively reducing the overall thermal conductivity. In the work by Terrones, 18 graphene-related defects are presented, including structural, topological, doping-induced, nonsp 2 -carbon, and high-strain folding defects. Structural defects distort the lattice structure; topological defects or Stone–Thrower–Wales (STW) defects are created when a carbon–carbon bond is rotated 90 within four neighboring hexagons, inducing the transformation of two pentagons and two heptagons; doping-induced defects refer to the presence a) Author to whom correspondence should be addressed. Electronic mail: [email protected]. 0021-8979/2011/109(3)/043508/6/$30.00 V C 2011 American Institute of Physics 109, 043508-1 JOURNAL OF APPLIED PHYSICS 109, 043508 (2011) Downloaded 24 Feb 2011 to 155.69.4.4. Redistribution subject to AIP license or copyright; see http://jap.aip.org/about/rights_and_permissions

Welcome message from author
This document is posted to help you gain knowledge. Please leave a comment to let me know what you think about it! Share it to your friends and learn new things together.
Transcript

Thermal transport around tears in graphene
G. C. Loh, E. H. T. Teo, and B. K. Taya)
School of Electrical and Electronic Engineering, Nanyang Technological University, Singapore 639798
(Received 29 October 2010; accepted 18 December 2010; published online 24 February 2011)
Tears in any material act as barriers to phonon transport. In this study, molecular dynamics
simulations are employed to investigate thermal transport around tears in graphene. Specifically,
thermal boundary conductance across different tear orientations and lengths is computed. Analysis
of vibrational density of states suggests that long-wavelength acoustic phonons within the spectrum
range 0–700 cm�1 are vital to thermal transport across the tears. Different phonon scattering
phenomena are observed for both tear orientations. It is proposed that the dissimilitude of the
scattering processes encountered by phonons carrying energy around the tears to the opposite end
explains why thermal transport is generally more efficient for longitudinal tears in our simulations.VC 2011 American Institute of Physics. [doi:10.1063/1.3549735]
I. INTRODUCTION
Thermal energy is transported predominantly by elec-
trons and phonons. In semiconductors, the primary heat car-
riers are wavelike lattice vibrations, or phonons. Through
recent academic and industrial efforts, it has been discovered
that materials such as carbon nanotubes and graphene1–7
have excellent intrinsic thermal conductance. However it is
imperative to note that utilizing these materials is only a par-
tial step to ensure the efficient removal of heat. At interfaces
between materials, phonon transmission is often not perfect.
As the efficiency of interfacial transport may dictate the
effective thermal conductance, especially in complex nano-
structures with numerous interfaces, it is increasingly perti-
nent that this physical phenomenon is explored further.
Thermal boundary resistance, or Kapitza resistance, is
an interfacial resistance that exists due to a mismatch of the
lattice-vibrational spectra of the two media. Not all phonons
transmit through the interface, and the probability of trans-
mission is governed essentially by the matching of the vibra-
tional spectra and the phonon velocities. Two well known
models provide theoretical and numerical interpretations to
this phenomenon. The first tool is the acoustic mismatch
model (AMM)8,9 which defines the interfacial thermal resist-
ance to be a function of phonon density on both media.10
The transmission coefficient from medium 1 to medium 2 is
given by 11
sr1!2 ¼4Z2Z1
ðZ1 þ Z2Þ2; (1)
where Zi refers to the acoustic impedance, and is the product
between the density q and phonon velocity c of medium i.As a manifestation of the phonon dynamics, and an extension
of Fourier’s law, thermal boundary resistances (TBRs) can
also be calculated by quantifying the temperature drop at the
interface, and the thermal flux across it. The following rela-
tionship applies
RK ¼DT
J; (2)
where DT is the temperature drop, and J is the thermal flux
through a cross-sectional area per unit time.11
The second tool is the diffuse mismatch model (DMM)12
which postulates that scattering at the interface is completely
diffusive in nature. In other words, the scattered phonons lose
all memory of polarization and incident angle.13 Essentially,
only energy is conserved through the interface. In addition,
within this model, elastic scattering is commonly assumed,
suggesting that a phonon of frequency x will only scatter
with another phonon of the same frequency. Therefore, pho-
non transmission is entirely determined by the phonon popu-
lation of the lower Debye frequency material. Basically,
there is more species mixing at elevated temperatures. The
interface roughness is greater, magnifying the probability of
diffusive scattering. Consequently, at high temperatures,
DMM generally predicts a more accurate thermal boundary
resistance than AMM. However, as a matter of fact, DMM
results can still disagree with experimental data by more than
an order of magnitude. It is suggested that the discrepancies
may be due to reasons including multiple elastic phonon scat-
tering at the interface,14,15 the presence of inelastic scatter-
ing,13 electron-phonon resistances,16 and different definitions
of interface roughness.14,17
Other than interfaces, thermal boundary resistances also
exist in defected materials. Although defects, especially
point defects, are strictly not “boundaries”, the scattering of
phonons at these defects begets a temperature discontinuity,
similarly observed at boundaries. This thermal barrier abates
the efficiency of heat sinks to direct away thermal energy,
effectively reducing the overall thermal conductivity.
In the work by Terrones,18 graphene-related defects are
presented, including structural, topological, doping-induced,
nonsp2-carbon, and high-strain folding defects. Structural
defects distort the lattice structure; topological defects or
Stone–Thrower–Wales (STW) defects are created when a
carbon–carbon bond is rotated 90� within four neighboring
hexagons, inducing the transformation of two pentagons and
two heptagons; doping-induced defects refer to the presence
a)Author to whom correspondence should be addressed. Electronic mail:
0021-8979/2011/109(3)/043508/6/$30.00 VC 2011 American Institute of Physics109, 043508-1
JOURNAL OF APPLIED PHYSICS 109, 043508 (2011)
Downloaded 24 Feb 2011 to 155.69.4.4. Redistribution subject to AIP license or copyright; see http://jap.aip.org/about/rights_and_permissions
of substituted atoms; non-sp2-carbon defects comprise
vacancies, adatoms, edge sites, and interstitials; high-strain
folding defects are formed when adjacent graphene layers
are annealed to form loops. In this work, we emphasize on
the non-sp2-carbon defect of tears. A vital difference
between tears and normal interfaces is the presence of cova-
lent bonds. Here we assume that covalent bonds are broken
at a tear, and the only interactions between the affected
atoms are noncovalent bonds such as van der Waals. At
interfaces, both covalent and noncovalent bonds may exist.
Graphene is a type of carbon allotrope in which the
atoms are arranged in a two-dimensional honeycomb lat-
tice.19 It is the fundamental building block for all common
types of graphitic allotropes: zero-dimensional fullerene,
one-dimensional carbon nanotube, and three-dimensional
bulk graphite. Its superior electrical conductivity19 and unri-
valled thermal conductivity have sparked a lot of interest in
various scientific niches. Recently attempts to reduce gra-
phene to desired sizes and geometries include20 (1) subse-
quent steps of electron beam lithography and plasma
etching,21,22 (2) chemically exfoliating graphene nanoribbons
from graphite,23 (3) using scanning tunneling microscopy
(STM) to electrochemical-etch graphite,24 (4) catalytic reac-
tion of Fe and Ni particles on graphene,25,26 (5) unzipping
carbon nanotubes by chemical oxidation,27,28 and (6) using
scanning probe microscopic manipulation to cut oxidized
graphene sheets.20 Nevertheless, there is a strong likelihood
that defects will undesirably exist in the resultant nanosized
graphene. Any of the aforementioned reducing procedures
may create partial tears at random locations on the material,
altering the intrinsic material properties of graphene.
This study aims to delineate the effects of tearing on
thermal transport in graphene. Specifically, factors such as
the length and orientation may well be crucial in the under-
standing of phonon transport around tears. Due to the resem-
blance of graphene and carbon nanotubes, since they are
both built from the honeycomb lattice, we can draw parallel-
ism between the two materials.
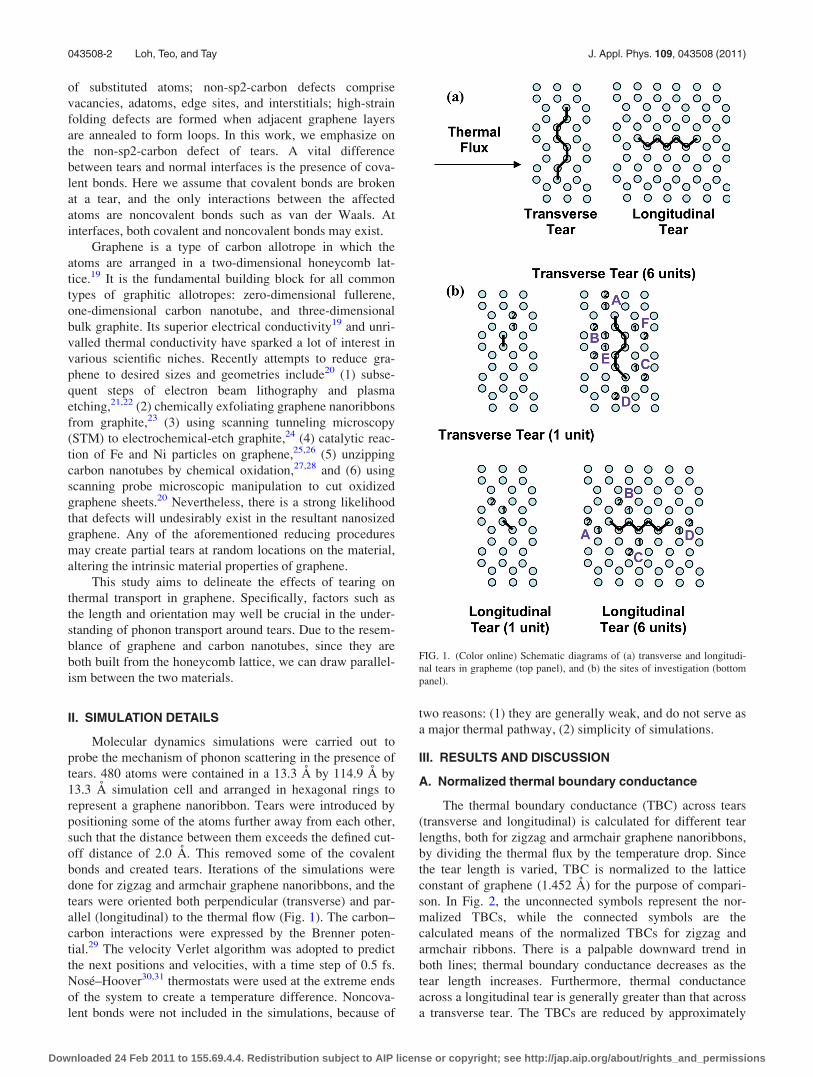
II. SIMULATION DETAILS
Molecular dynamics simulations were carried out to
probe the mechanism of phonon scattering in the presence of
tears. 480 atoms were contained in a 13.3 A by 114.9 A by
13.3 A simulation cell and arranged in hexagonal rings to
represent a graphene nanoribbon. Tears were introduced by
positioning some of the atoms further away from each other,
such that the distance between them exceeds the defined cut-
off distance of 2.0 A. This removed some of the covalent
bonds and created tears. Iterations of the simulations were
done for zigzag and armchair graphene nanoribbons, and the
tears were oriented both perpendicular (transverse) and par-
allel (longitudinal) to the thermal flow (Fig. 1). The carbon–
carbon interactions were expressed by the Brenner poten-
tial.29 The velocity Verlet algorithm was adopted to predict
the next positions and velocities, with a time step of 0.5 fs.
Nose–Hoover30,31 thermostats were used at the extreme ends
of the system to create a temperature difference. Noncova-
lent bonds were not included in the simulations, because of
two reasons: (1) they are generally weak, and do not serve as
a major thermal pathway, (2) simplicity of simulations.
III. RESULTS AND DISCUSSION
A. Normalized thermal boundary conductance
The thermal boundary conductance (TBC) across tears
(transverse and longitudinal) is calculated for different tear
lengths, both for zigzag and armchair graphene nanoribbons,
by dividing the thermal flux by the temperature drop. Since
the tear length is varied, TBC is normalized to the lattice
constant of graphene (1.452 A) for the purpose of compari-
son. In Fig. 2, the unconnected symbols represent the nor-
malized TBCs, while the connected symbols are the
calculated means of the normalized TBCs for zigzag and
armchair ribbons. There is a palpable downward trend in
both lines; thermal boundary conductance decreases as the
tear length increases. Furthermore, thermal conductance
across a longitudinal tear is generally greater than that across
a transverse tear. The TBCs are reduced by approximately
FIG. 1. (Color online) Schematic diagrams of (a) transverse and longitudi-
nal tears in grapheme (top panel), and (b) the sites of investigation (bottom
panel).
043508-2 Loh, Teo, and Tay J. Appl. Phys. 109, 043508 (2011)
Downloaded 24 Feb 2011 to 155.69.4.4. Redistribution subject to AIP license or copyright; see http://jap.aip.org/about/rights_and_permissions

40% with the increase of tear length from 1 to 6 units. We
will explore and explain the rationale behind these observa-
tions. We have to accentuate that it is misleading to compare
across orientations for the same tear length—although both
orientations may have 1 unit of tear, the absolute length is
not exactly identical. What is more important is to reveal the
trend when tear length is varied.
B. Vibrational density of states
The vibrational density of states (VDOS) is calculated
by performing a Fourier-transform on the velocity autocorre-
lation function. The local density of states (LDOS) around
the tear provides crucial information on the phonon modes
that are scattered at the particular locations, and the degree
of scattering. Although the exact mode conversions are
unknown, some speculation can be made. In addition, the
strengthening or weakening of the different modes at various
locations discloses essential information on the behavior of
phonons when they approach line defects such as tears. Criti-
cal locations where local density of states is computed are
deemed to be at opposite ends of the tear, parallel to the flow
of thermal energy [Fig. 1(b)], i.e., Zigzag/Transverse/6 tear
units/Site B (abbreviated as ZT6-B), ZT6-E, ZT6-F, ZL6-A,
ZL6-D. The figure also shows that LDOS are obtained at first
and second nearest neighbors of the torn site, with the
numerals 1 and 2 in the figure referring to the first and sec-
ond nearest neighbor, respectively. It will be presented later
that most of the scattering occurs within the distance 2.51 A
(distance of second nearest neighbor from atom). Minute dif-
ferences do exist between second nearest neighbor LDOS at
different sites, indicating the presence of scattering at least
beyond the second nearest neighbors, but the extent of scat-
tering is relatively nondescript.
To identify the modes, the LDOS for the three dimen-
sions are calculated separately. The relative strength of the
three sets of LDOS allows us to speculate if a certain mode
is in-plane transverse (iT), longitudinal (L), or out-of-plane
transverse (oT) in orientation. It is vital to note that this oper-
ation is only a prediction. By comparing these one-
dimensional LDOS and Raman spectroscopic data,32 the ori-
entation and type (acoustic/optical) of the modes are ascer-
tained (Fig. 3). In general, the in-plane modes are the main
carriers of thermal energy, while the out-of-plane modes
have low group velocities.33
Figure 4(b) shows the LDOS at first and second nearest
neighbors for ZT6-E. It is evident that the first nearest neigh-
bor G-band at around 1600 cm�1 is in-plane transverse opti-
cal–dominant (iTO) (Fig. 3). The G-band appears due to the
doubly degenerate zone center E2g mode.34,35 Dresselhaus32
reported that unlike single-walled carbon nanotubes
(SWNTs), the G-band for graphite does not consist of two
features. It is further described in the work by Jorio36 that
confinement and curvature of these degenerate modes in
SWNTs induce them to split into the two features.
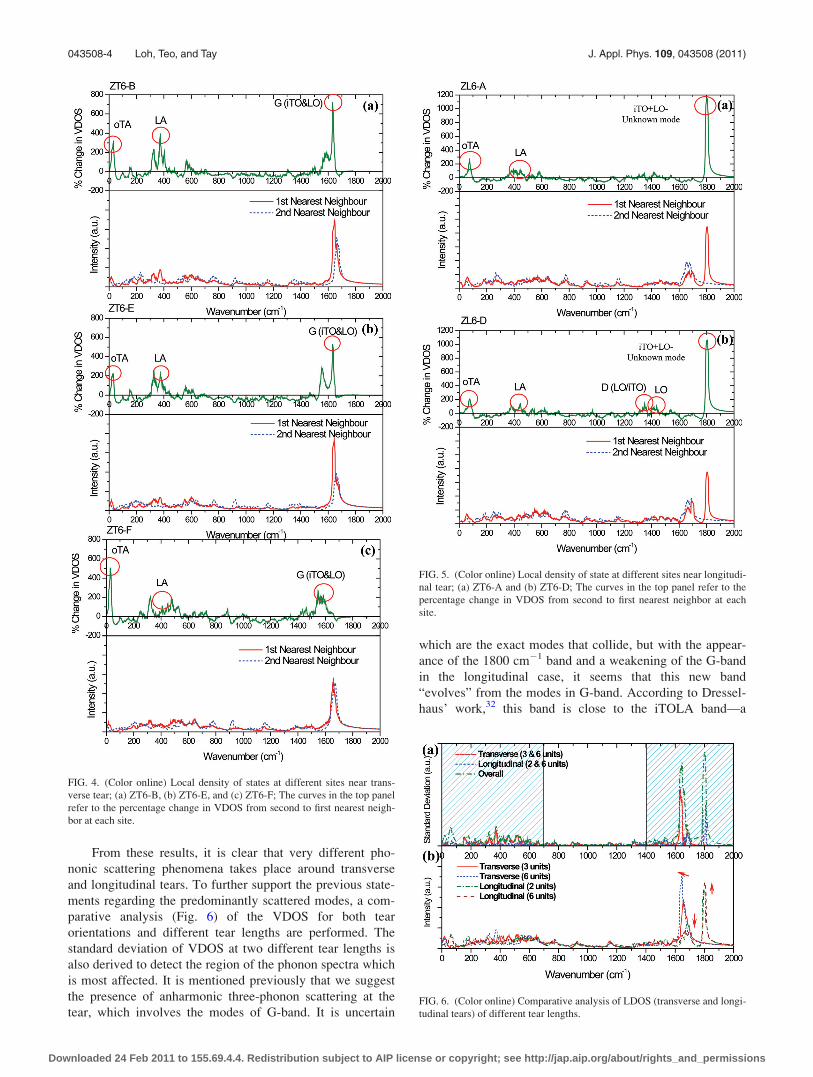
The percentage change in VDOS from second to first
nearest neighbor is computed for each case. For a transverse
tear (Fig. 4), in each case (ZT6-B, ZT6-E, ZT6-F), the out-
of-plane acoustic (oTA), longitudinal acoustic (LA) modes,
and G-band are enhanced. The G-band is slightly red-shifted
near the tear. Although there are differences for sites B, E,
and F, these differences are minute, and the general observa-
tions remain. Furthermore, similar features of all the second
nearest neighbor LDOS (Figs. 4 and 5) suggest that phonon
scattering occurs mainly within an approximate distance of
2.51 A from the tear.
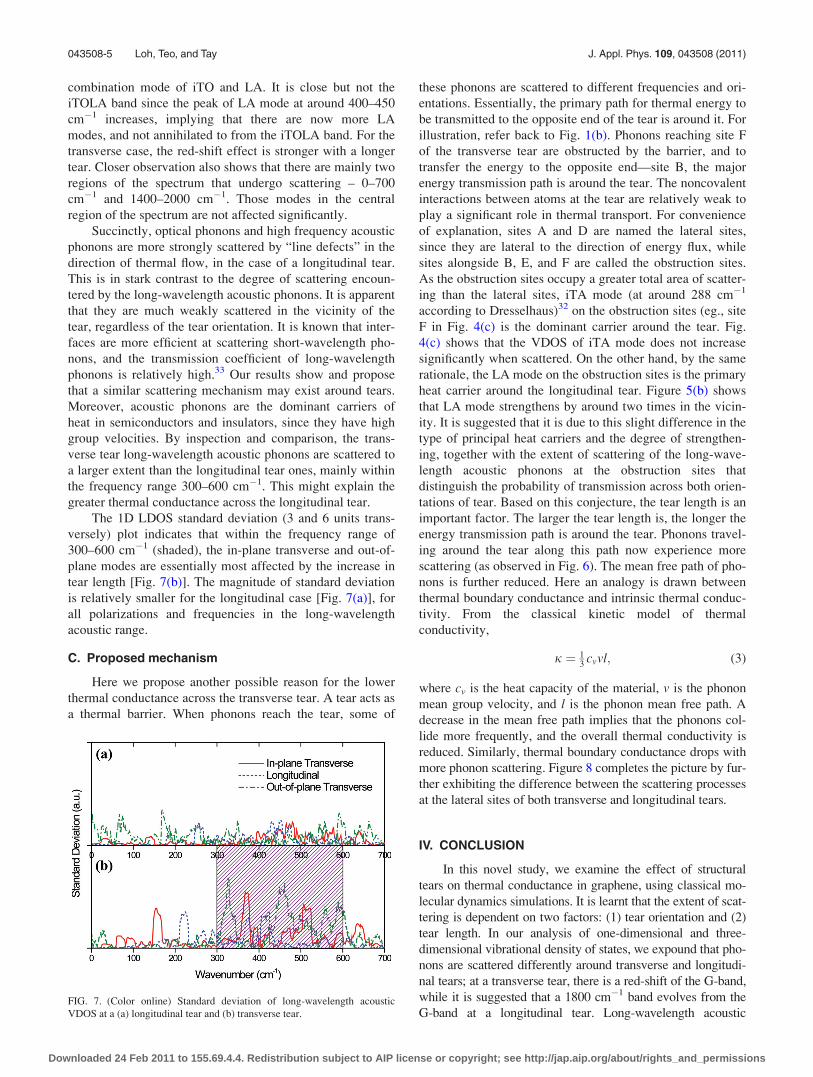
For a longitudinal tear (Fig. 5), oTA and LA modes are
strengthened nearer the tear (comparison of VDOS intensity
at first and second nearest neighbor positions), but an un-
identified mode at around 1800 cm�1 is created. The G-
band reduces in intensity. It is hypothesized that the fall in
the G-band intensity, (G-band comprises both in-plane
transverse and longitudinal modes, from the one-dimen-
sional VDOS) suggests that some of the modes in G-band
are involved in anharmonic three-phonon interaction, to cre-
ate the modes in the 1800 cm�1 band. Some of the G-band
modes may be annihilated, and some acoustic modes are
created as a result. The mode nature prediction indicates
that the 1800 cm�1 band is both longitudinal and in-plane
transverse in orientation.
FIG. 2. (Color online) Relationship between normalized thermal boundary
conductance and tear length unit.
FIG. 3. (Color online) Prediction of mode orientation of ZT6-E.
043508-3 Loh, Teo, and Tay J. Appl. Phys. 109, 043508 (2011)
Downloaded 24 Feb 2011 to 155.69.4.4. Redistribution subject to AIP license or copyright; see http://jap.aip.org/about/rights_and_permissions
From these results, it is clear that very different pho-
nonic scattering phenomena takes place around transverse
and longitudinal tears. To further support the previous state-
ments regarding the predominantly scattered modes, a com-
parative analysis (Fig. 6) of the VDOS for both tear
orientations and different tear lengths are performed. The
standard deviation of VDOS at two different tear lengths is
also derived to detect the region of the phonon spectra which
is most affected. It is mentioned previously that we suggest
the presence of anharmonic three-phonon scattering at the
tear, which involves the modes of G-band. It is uncertain
which are the exact modes that collide, but with the appear-
ance of the 1800 cm�1 band and a weakening of the G-band
in the longitudinal case, it seems that this new band
“evolves” from the modes in G-band. According to Dressel-
haus’ work,32 this band is close to the iTOLA band—a
FIG. 4. (Color online) Local density of states at different sites near trans-
verse tear; (a) ZT6-B, (b) ZT6-E, and (c) ZT6-F; The curves in the top panel
refer to the percentage change in VDOS from second to first nearest neigh-
bor at each site.
FIG. 5. (Color online) Local density of state at different sites near longitudi-
nal tear; (a) ZT6-A and (b) ZT6-D; The curves in the top panel refer to the
percentage change in VDOS from second to first nearest neighbor at each
site.
FIG. 6. (Color online) Comparative analysis of LDOS (transverse and longi-
tudinal tears) of different tear lengths.
043508-4 Loh, Teo, and Tay J. Appl. Phys. 109, 043508 (2011)
Downloaded 24 Feb 2011 to 155.69.4.4. Redistribution subject to AIP license or copyright; see http://jap.aip.org/about/rights_and_permissions
combination mode of iTO and LA. It is close but not the
iTOLA band since the peak of LA mode at around 400–450
cm�1 increases, implying that there are now more LA
modes, and not annihilated to from the iTOLA band. For the
transverse case, the red-shift effect is stronger with a longer
tear. Closer observation also shows that there are mainly two
regions of the spectrum that undergo scattering – 0–700
cm�1 and 1400–2000 cm�1. Those modes in the central
region of the spectrum are not affected significantly.
Succinctly, optical phonons and high frequency acoustic
phonons are more strongly scattered by “line defects” in the
direction of thermal flow, in the case of a longitudinal tear.
This is in stark contrast to the degree of scattering encoun-
tered by the long-wavelength acoustic phonons. It is apparent
that they are much weakly scattered in the vicinity of the
tear, regardless of the tear orientation. It is known that inter-
faces are more efficient at scattering short-wavelength pho-
nons, and the transmission coefficient of long-wavelength
phonons is relatively high.33 Our results show and propose
that a similar scattering mechanism may exist around tears.
Moreover, acoustic phonons are the dominant carriers of
heat in semiconductors and insulators, since they have high
group velocities. By inspection and comparison, the trans-
verse tear long-wavelength acoustic phonons are scattered to
a larger extent than the longitudinal tear ones, mainly within
the frequency range 300–600 cm�1. This might explain the
greater thermal conductance across the longitudinal tear.
The 1D LDOS standard deviation (3 and 6 units trans-
versely) plot indicates that within the frequency range of
300–600 cm�1 (shaded), the in-plane transverse and out-of-
plane modes are essentially most affected by the increase in
tear length [Fig. 7(b)]. The magnitude of standard deviation
is relatively smaller for the longitudinal case [Fig. 7(a)], for
all polarizations and frequencies in the long-wavelength
acoustic range.
C. Proposed mechanism
Here we propose another possible reason for the lower
thermal conductance across the transverse tear. A tear acts as
a thermal barrier. When phonons reach the tear, some of
these phonons are scattered to different frequencies and ori-
entations. Essentially, the primary path for thermal energy to
be transmitted to the opposite end of the tear is around it. For
illustration, refer back to Fig. 1(b). Phonons reaching site F
of the transverse tear are obstructed by the barrier, and to
transfer the energy to the opposite end—site B, the major
energy transmission path is around the tear. The noncovalent
interactions between atoms at the tear are relatively weak to
play a significant role in thermal transport. For convenience
of explanation, sites A and D are named the lateral sites,
since they are lateral to the direction of energy flux, while
sites alongside B, E, and F are called the obstruction sites.
As the obstruction sites occupy a greater total area of scatter-
ing than the lateral sites, iTA mode (at around 288 cm�1
according to Dresselhaus)32 on the obstruction sites (eg., site
F in Fig. 4(c) is the dominant carrier around the tear. Fig.
4(c) shows that the VDOS of iTA mode does not increase
significantly when scattered. On the other hand, by the same
rationale, the LA mode on the obstruction sites is the primary
heat carrier around the longitudinal tear. Figure 5(b) shows
that LA mode strengthens by around two times in the vicin-
ity. It is suggested that it is due to this slight difference in the
type of principal heat carriers and the degree of strengthen-
ing, together with the extent of scattering of the long-wave-
length acoustic phonons at the obstruction sites that
distinguish the probability of transmission across both orien-
tations of tear. Based on this conjecture, the tear length is an
important factor. The larger the tear length is, the longer the
energy transmission path is around the tear. Phonons travel-
ing around the tear along this path now experience more
scattering (as observed in Fig. 6). The mean free path of pho-
nons is further reduced. Here an analogy is drawn between
thermal boundary conductance and intrinsic thermal conduc-
tivity. From the classical kinetic model of thermal
conductivity,
j ¼ 13
cvvl; (3)
where cv is the heat capacity of the material, v is the phonon
mean group velocity, and l is the phonon mean free path. A
decrease in the mean free path implies that the phonons col-
lide more frequently, and the overall thermal conductivity is
reduced. Similarly, thermal boundary conductance drops with
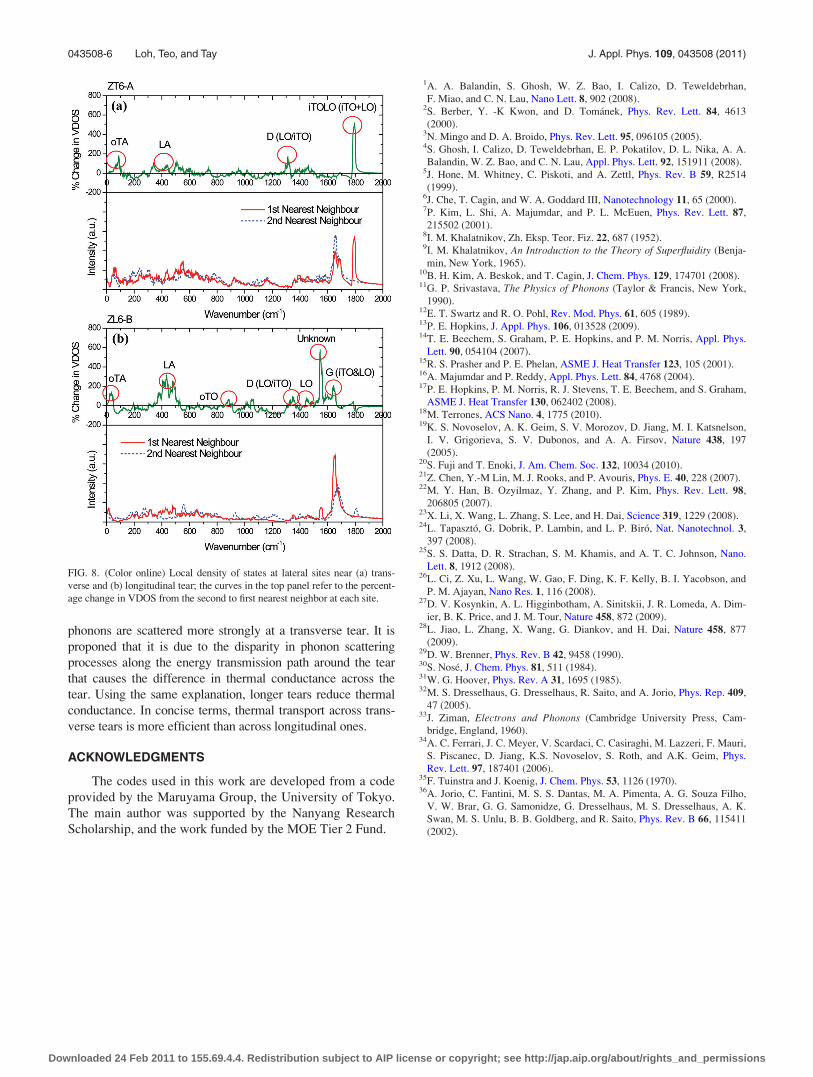
more phonon scattering. Figure 8 completes the picture by fur-
ther exhibiting the difference between the scattering processes
at the lateral sites of both transverse and longitudinal tears.
IV. CONCLUSION
In this novel study, we examine the effect of structural
tears on thermal conductance in graphene, using classical mo-
lecular dynamics simulations. It is learnt that the extent of scat-
tering is dependent on two factors: (1) tear orientation and (2)
tear length. In our analysis of one-dimensional and three-
dimensional vibrational density of states, we expound that pho-
nons are scattered differently around transverse and longitudi-
nal tears; at a transverse tear, there is a red-shift of the G-band,
while it is suggested that a 1800 cm�1 band evolves from the
G-band at a longitudinal tear. Long-wavelength acousticFIG. 7. (Color online) Standard deviation of long-wavelength acoustic
VDOS at a (a) longitudinal tear and (b) transverse tear.
043508-5 Loh, Teo, and Tay J. Appl. Phys. 109, 043508 (2011)
Downloaded 24 Feb 2011 to 155.69.4.4. Redistribution subject to AIP license or copyright; see http://jap.aip.org/about/rights_and_permissions
phonons are scattered more strongly at a transverse tear. It is
proponed that it is due to the disparity in phonon scattering
processes along the energy transmission path around the tear
that causes the difference in thermal conductance across the
tear. Using the same explanation, longer tears reduce thermal
conductance. In concise terms, thermal transport across trans-
verse tears is more efficient than across longitudinal ones.
ACKNOWLEDGMENTS
The codes used in this work are developed from a code
provided by the Maruyama Group, the University of Tokyo.
The main author was supported by the Nanyang Research
Scholarship, and the work funded by the MOE Tier 2 Fund.
1A. A. Balandin, S. Ghosh, W. Z. Bao, I. Calizo, D. Teweldebrhan,
F. Miao, and C. N. Lau, Nano Lett. 8, 902 (2008).2S. Berber, Y. -K Kwon, and D. Tomanek, Phys. Rev. Lett. 84, 4613
(2000).3N. Mingo and D. A. Broido, Phys. Rev. Lett. 95, 096105 (2005).4S. Ghosh, I. Calizo, D. Teweldebrhan, E. P. Pokatilov, D. L. Nika, A. A.
Balandin, W. Z. Bao, and C. N. Lau, Appl. Phys. Lett. 92, 151911 (2008).5J. Hone, M. Whitney, C. Piskoti, and A. Zettl, Phys. Rev. B 59, R2514
(1999).6J. Che, T. Cagin, and W. A. Goddard III, Nanotechnology 11, 65 (2000).7P. Kim, L. Shi, A. Majumdar, and P. L. McEuen, Phys. Rev. Lett. 87,
215502 (2001).8I. M. Khalatnikov, Zh. Eksp. Teor. Fiz. 22, 687 (1952).9I. M. Khalatnikov, An Introduction to the Theory of Superfluidity (Benja-
min, New York, 1965).10B. H. Kim, A. Beskok, and T. Cagin, J. Chem. Phys. 129, 174701 (2008).11G. P. Srivastava, The Physics of Phonons (Taylor & Francis, New York,
1990).12E. T. Swartz and R. O. Pohl, Rev. Mod. Phys. 61, 605 (1989).13P. E. Hopkins, J. Appl. Phys. 106, 013528 (2009).14T. E. Beechem, S. Graham, P. E. Hopkins, and P. M. Norris, Appl. Phys.
Lett. 90, 054104 (2007).15R. S. Prasher and P. E. Phelan, ASME J. Heat Transfer 123, 105 (2001).16A. Majumdar and P. Reddy, Appl. Phys. Lett. 84, 4768 (2004).17P. E. Hopkins, P. M. Norris, R. J. Stevens, T. E. Beechem, and S. Graham,
ASME J. Heat Transfer 130, 062402 (2008).18M. Terrones, ACS Nano. 4, 1775 (2010).19K. S. Novoselov, A. K. Geim, S. V. Morozov, D. Jiang, M. I. Katsnelson,
I. V. Grigorieva, S. V. Dubonos, and A. A. Firsov, Nature 438, 197
(2005).20S. Fuji and T. Enoki, J. Am. Chem. Soc. 132, 10034 (2010).21Z. Chen, Y.-M Lin, M. J. Rooks, and P. Avouris, Phys. E. 40, 228 (2007).22M. Y. Han, B. Ozyilmaz, Y. Zhang, and P. Kim, Phys. Rev. Lett. 98,
206805 (2007).23X. Li, X. Wang, L. Zhang, S. Lee, and H. Dai, Science 319, 1229 (2008).24L. Tapaszto, G. Dobrik, P. Lambin, and L. P. Biro, Nat. Nanotechnol. 3,
397 (2008).25S. S. Datta, D. R. Strachan, S. M. Khamis, and A. T. C. Johnson, Nano.
Lett. 8, 1912 (2008).26L. Ci, Z. Xu, L. Wang, W. Gao, F. Ding, K. F. Kelly, B. I. Yacobson, and
P. M. Ajayan, Nano Res. 1, 116 (2008).27D. V. Kosynkin, A. L. Higginbotham, A. Sinitskii, J. R. Lomeda, A. Dim-
ier, B. K. Price, and J. M. Tour, Nature 458, 872 (2009).28L. Jiao, L. Zhang, X. Wang, G. Diankov, and H. Dai, Nature 458, 877
(2009).29D. W. Brenner, Phys. Rev. B 42, 9458 (1990).30S. Nose, J. Chem. Phys. 81, 511 (1984).31W. G. Hoover, Phys. Rev. A 31, 1695 (1985).32M. S. Dresselhaus, G. Dresselhaus, R. Saito, and A. Jorio, Phys. Rep. 409,
47 (2005).33J. Ziman, Electrons and Phonons (Cambridge University Press, Cam-
bridge, England, 1960).34A. C. Ferrari, J. C. Meyer, V. Scardaci, C. Casiraghi, M. Lazzeri, F. Mauri,
S. Piscanec, D. Jiang, K.S. Novoselov, S. Roth, and A.K. Geim, Phys.
Rev. Lett. 97, 187401 (2006).35F. Tuinstra and J. Koenig, J. Chem. Phys. 53, 1126 (1970).36A. Jorio, C. Fantini, M. S. S. Dantas, M. A. Pimenta, A. G. Souza Filho,
V. W. Brar, G. G. Samonidze, G. Dresselhaus, M. S. Dresselhaus, A. K.
Swan, M. S. Unlu, B. B. Goldberg, and R. Saito, Phys. Rev. B 66, 115411
(2002).
FIG. 8. (Color online) Local density of states at lateral sites near (a) trans-
verse and (b) longitudinal tear; the curves in the top panel refer to the percent-
age change in VDOS from the second to first nearest neighbor at each site.
043508-6 Loh, Teo, and Tay J. Appl. Phys. 109, 043508 (2011)
Downloaded 24 Feb 2011 to 155.69.4.4. Redistribution subject to AIP license or copyright; see http://jap.aip.org/about/rights_and_permissions
Related Documents