Thermal tolerance of two seagrass species at contrasting light levels: Implications for future distribution in the Great Barrier Reef Catherine J. Collier, a,* Sven Uthicke, b and Michelle Waycott a a School of Marine and Tropical Biology, James Cook University, Townsville, Queensland, Australia b Australian Institute of Marine Science, Townsville, Queensland, Australia Abstract This study assessed metabolism, growth, and survival of two seagrass species at three different seawater temperatures (27uC, 30uC, and 33uC) under saturating (400 mmol photons m 22 s 21 ) and limiting (40 mmol photons m 22 s 21 ) light over 1 month. Halodule uninervis grown at 33uC was within its physiological optimum temperature range, exhibiting 2.33 higher photosynthetic rates than at 27uC, and increased net shoot carbon (C) production (up to 103 higher) at saturating light levels. In contrast, 33uC exceeded the optimum temperature threshold for Zostera muelleri, resulting in critical metabolic imbalances with large reductions in photosynthesis and increases in leaf respiration. This led to substantially lower growth rates (0–2% of those at 27uC) and lower final biomass (only 10% of that at 27uC) in the 33uC treatment after 1 month. This decline at higher temperatures occurred at both light levels, but it was more severe in limiting light, where the C balance went into deficit. H. uninervis in the Great Barrier Reef (GBR) exists well within its optimal temperature range and should continue to thrive at projected future temperatures, at least under saturating light levels. In contrast, Z. muelleri currently exists near its upper thermal threshold, and future temperature increases of the magnitude investigated here would likely lead to the contraction of the range of this species from the northern GBR—potentially by more than 1000 km. This could have ecologically significant ramifications, because Z. muelleri is often the only GBR species that currently inhabits muddy estuarine areas, which are critical fisheries habitats. Seagrasses are marine flowering plants, and they are globally distributed and ecologically valued for their high rates of productivity, coastal nutrient cycling, and as a habitat that supports fisheries species and as a direct food source for obligate seagrass feeders such as dugongs (Orth et al. 2006; Heck et al. 2008; Unsworth and Cullen 2010). In tropical regions, including the Indo-Pacific, where coastal marine resources provide up to 100% of daily protein needs for the communities living along the coast, seagrasses are a vital fisheries habitat (Unsworth and Cullen 2010). Seagrass-dominated ecosystems also support productivity and biodiversity of adjacent habitats, particularly man- groves and coral reefs (Heck et al. 2008). Global seagrass loss and the factors contributing to it are therefore of critical concern for the sustainability of these coastal ecosystems and the communities and industries supported by them (Orth et al. 2006; Waycott et al. 2009). Plant metabolism is responsive to temperature in a largely predictable manner, whereby the balance between carbon uptake (photosynthesis) and consumption (respira- tion) is affected. The photosynthetic processes of higher plants are highly sensitive to temperature, with increases in photosynthesis occurring up to a physiological optimum, followed by sharp reductions in photosynthetic efficiency after temperatures exceed specific thresholds (Berry and Bjorkman 1980; Bulthius 1987; McDonald 2003). Respira- tion rates can continue to rise with increasing temperatures, even after photosynthesis starts to decline. When this happens, the availability of fixed carbon through photo- synthesis no longer balances C requirements as tempera- tures rise, and the plants go into deficit (i.e., the ratio of photosynthesis to respiration, or P : R, , 1). Such metabolic imbalances in plants are generally associated with the remobilization of storage reserves, as well as adjustment of morphology and productivity as a means to reduce respiratory requirements (Chapin et al. 1987; Ralph et al. 2007; Collier et al. 2009), but the consequences of temperature-induced metabolic imbalances for seagrasses are largely untested. The optimum temperatures for photosynthesis and for maximizing P : R ratios are also not known for many—particularly tropical—seagrass species (Bulthius 1987; Campbell et al. 2006; Rasheed and Unsworth 2011). Many environmental factors influence plant growth and physiology, but there is typically one factor that principally limits growth (Schulze et al. 2002). Seagrasses have relatively high minimum light requirements, yet their predominance in coastal habitats exposes them to condi- tions of low and highly variable light (Dennison 1987; Waycott et al. 2009). Natural variability in the light environment occurs through daily and lunar cycles as incident light and water depth change, and runoff and resuspension of bottom sediments can cause chronic and acute reductions in light (Ralph et al. 2007). This variable light environment is a particularly strong feature of the local environment in northern Australia, including the Great Barrier Reef (Carruthers et al. 2002; De’ath and Fabricius 2010). Declining water quality has led to conditions in which light levels have become the primary limiting factor in many seagrass meadows, and although this tends to have local effects, it is a globally significant problem (Waycott et al. 2009). Seagrasses have adapted to their highly variable light environment primarily by meeting respiratory and growth requirements with a * Corresponding author: [email protected] Limnol. Oceanogr., 56(6), 2011, 2200–2210 E 2011, by the Association for the Sciences of Limnology and Oceanography, Inc. doi:10.4319/lo.2011.56.6.2200 2200

Welcome message from author
This document is posted to help you gain knowledge. Please leave a comment to let me know what you think about it! Share it to your friends and learn new things together.
Transcript

Thermal tolerance of two seagrass species at contrasting light levels: Implications for
future distribution in the Great Barrier Reef
Catherine J. Collier,a,* Sven Uthicke,b and Michelle Waycotta
a School of Marine and Tropical Biology, James Cook University, Townsville, Queensland, AustraliabAustralian Institute of Marine Science, Townsville, Queensland, Australia
Abstract
This study assessed metabolism, growth, and survival of two seagrass species at three different seawatertemperatures (27uC, 30uC, and 33uC) under saturating (400 mmol photons m22 s21) and limiting (40 mmol photonsm22 s21) light over 1 month. Halodule uninervis grown at 33uC was within its physiological optimum temperaturerange, exhibiting 2.33 higher photosynthetic rates than at 27uC, and increased net shoot carbon (C) production(up to 103 higher) at saturating light levels. In contrast, 33uC exceeded the optimum temperature threshold forZostera muelleri, resulting in critical metabolic imbalances with large reductions in photosynthesis and increasesin leaf respiration. This led to substantially lower growth rates (0–2% of those at 27uC) and lower final biomass(only 10% of that at 27uC) in the 33uC treatment after 1 month. This decline at higher temperatures occurred atboth light levels, but it was more severe in limiting light, where the C balance went into deficit. H. uninervis in theGreat Barrier Reef (GBR) exists well within its optimal temperature range and should continue to thrive atprojected future temperatures, at least under saturating light levels. In contrast, Z. muelleri currently exists near itsupper thermal threshold, and future temperature increases of the magnitude investigated here would likely lead tothe contraction of the range of this species from the northern GBR—potentially by more than 1000 km. Thiscould have ecologically significant ramifications, because Z. muelleri is often the only GBR species that currentlyinhabits muddy estuarine areas, which are critical fisheries habitats.
Seagrasses are marine flowering plants, and they areglobally distributed and ecologically valued for their highrates of productivity, coastal nutrient cycling, and as ahabitat that supports fisheries species and as a direct foodsource for obligate seagrass feeders such as dugongs (Orthet al. 2006; Heck et al. 2008; Unsworth and Cullen 2010). Intropical regions, including the Indo-Pacific, where coastalmarine resources provide up to 100% of daily protein needsfor the communities living along the coast, seagrasses are avital fisheries habitat (Unsworth and Cullen 2010).Seagrass-dominated ecosystems also support productivityand biodiversity of adjacent habitats, particularly man-groves and coral reefs (Heck et al. 2008). Global seagrassloss and the factors contributing to it are therefore ofcritical concern for the sustainability of these coastalecosystems and the communities and industries supportedby them (Orth et al. 2006; Waycott et al. 2009).
Plant metabolism is responsive to temperature in alargely predictable manner, whereby the balance betweencarbon uptake (photosynthesis) and consumption (respira-tion) is affected. The photosynthetic processes of higherplants are highly sensitive to temperature, with increases inphotosynthesis occurring up to a physiological optimum,followed by sharp reductions in photosynthetic efficiencyafter temperatures exceed specific thresholds (Berry andBjorkman 1980; Bulthius 1987; McDonald 2003). Respira-tion rates can continue to rise with increasing temperatures,even after photosynthesis starts to decline. When thishappens, the availability of fixed carbon through photo-synthesis no longer balances C requirements as tempera-tures rise, and the plants go into deficit (i.e., the ratio of
photosynthesis to respiration, or P : R, , 1). Suchmetabolic imbalances in plants are generally associatedwith the remobilization of storage reserves, as well asadjustment of morphology and productivity as a means toreduce respiratory requirements (Chapin et al. 1987; Ralphet al. 2007; Collier et al. 2009), but the consequences oftemperature-induced metabolic imbalances for seagrassesare largely untested. The optimum temperatures forphotosynthesis and for maximizing P : R ratios are alsonot known for many—particularly tropical—seagrassspecies (Bulthius 1987; Campbell et al. 2006; Rasheed andUnsworth 2011).
Many environmental factors influence plant growth andphysiology, but there is typically one factor that principallylimits growth (Schulze et al. 2002). Seagrasses haverelatively high minimum light requirements, yet theirpredominance in coastal habitats exposes them to condi-tions of low and highly variable light (Dennison 1987;Waycott et al. 2009). Natural variability in the lightenvironment occurs through daily and lunar cycles asincident light and water depth change, and runoff andresuspension of bottom sediments can cause chronic andacute reductions in light (Ralph et al. 2007). This variablelight environment is a particularly strong feature of thelocal environment in northern Australia, including theGreat Barrier Reef (Carruthers et al. 2002; De’ath andFabricius 2010). Declining water quality has led toconditions in which light levels have become the primarylimiting factor in many seagrass meadows, and althoughthis tends to have local effects, it is a globally significantproblem (Waycott et al. 2009). Seagrasses have adapted totheir highly variable light environment primarily bymeeting respiratory and growth requirements with a* Corresponding author: [email protected]
Limnol. Oceanogr., 56(6), 2011, 2200–2210
E 2011, by the Association for the Sciences of Limnology and Oceanography, Inc.doi:10.4319/lo.2011.56.6.2200
2200

combination of photosynthetic C fixation and reallocationof reserves (Ralph et al. 2007). There are a number ofdifferent processes and scales at which this balance can beachieved. For example, the efficiency of light capture andphotosynthesis can be increased to boost photosyntheticrates (Enrıquez 2005), while at the same time, the demandsfor fixed C can be lowered by reducing growth rates and theamount of biomass retained by the plant (Fourqurean andZieman 1991; Collier et al. 2009). Plant-scale responses thataffect meadow structure, density, and productivity aresignificant at a broader ecological level because they arecritical to the habitat and food value of seagrass meadows.
Halodule uninervis is a tropical seagrass species commonthroughout the Indo-Pacific and east African coast,whereas Zostera muelleri (syn. Zostera capricornii) is atropical to temperate species occurring in Australia andNew Zealand only (Fig. 1) (Lee Long et al. 2000; Waycottet al. 2004). The two species only overlap in distribution innortheastern Australia and the Great Barrier Reef (GBR).In the GBR, the mean annual temperature is 25.8uC(Lough 2007), and in the hottest month (usually aroundFebruary), mean monthly temperatures range from 27.5uCin the southern GBR to 31.5uC in the north (Fig. 1). Sea-surface temperature in the GBR is projected to increasebetween 1uC and 3uC by 2100 under the Intergovernmental
Panel on Climate Change (IPCC) A2 scenario (Lough2007). At the higher end of this range, summer watertemperatures would exceed 33uC. Although temperaturescan reach 33uC in seagrass meadows under extremeconditions in the GBR (e.g., low tide), they do not persist,and therefore long-term summer temperatures of 33uC willbe well above temperatures that occur within the distribu-tional range of Z. muelleri.
The objectives of this work were to: (1) test the thermaltolerance of two seagrass species with different geograph-ical distributions to water temperatures at the lower andhigher ends of the range projected to occur in the GBRwithin the current century, (2) identify the effects of lightlimitation on plant responses to these temperature increas-es, and (3) infer, using the observed thermal tolerances,likely changes to the future distributions of these speciesdue to climate change. We hypothesized that H. uninerviswould have a higher temperature threshold than Z. muelleriand that exceedance of the optimum metabolic temperaturethresholds would be expressed at a plant scale.
Methods
Two seagrass species, Halodule uninervis Ascherson(Cymodoceaceae) and Zostera muelleri Irmisch ex Ascher-
Fig. 1. (A) Annual maximum monthly sea-surface temperature in the Indo-Pacific region (2002–2009, http://www.bio-oracle.ugent.be) and the distribution of Halodule uninervis and Zostera muelleri (Waycott et al. 2004). (B) Sea-surface temperature in northeastAustralia showing the Great Barrier Reef and the study site.
Seagrass thermal tolerance 2201

son (Zosteraceae), were tested for the combined effects ofincreased water temperature and reduced light intensity.The two species were collected from intertidal meadows atCockle Bay and Picnic Bay (19u10.889S, 146u50.639E),Magnetic Island, northern Great Barrier Reef, in Septem-ber 2009. At this site, daily mean water temperature rangesfrom 19uC to 31.5uC throughout the year (C. Collierunpubl. data), maximum monthly temperature is 29.6uC to30.5uC (Fig. 1), and light intensity is 15.2 mol m22 d21
(annual average; C. Collier unpubl. data).The experiments were run for 1 month to align with
maximum monthly temperature data (current and futurepredicted) used to establish the treatment levels (Fig. 1).Three temperature treatments were applied in a large-scaleaquarium experiment: 27uC, 30uC, and 33uC. The lighttreatments were ‘‘high light’’ (400 mmol quanta m22 s21)and ‘‘low light’’ (40 mmol quanta m22 s21), set on a 12-hnight and day cycle. The half-saturation constant (Ek) wasderived from rapid light curves measured with a pulseamplitude modulated fluorometer at time 1, 2, and 3 andwas on average 102 mmol quanta m22 s21 and 40 mmolquanta m22 s21 in high and low light for H. uninervis andwas 138 mmol quanta m22 s21 and 90 mmol quanta m22 s21
for Z. muelleri. Therefore, the high-light treatment was wellabove saturating irradiance, and the low-light treatmentwas below saturating irradiance.
Plugs of seagrass were collected using a 10-cm (internaldiameter) polyvinyl chloride (PVC) corer, which was pushedinto the sediment to a depth of 10 cm, and the intact plug ofseagrass and sediment was placed in a plastic pot and linedwith a plastic bag, which was pulled up and secured over theseagrass to retain humidity during transport to the aquaria.The seagrass was kept in an outdoor flow-through aquariumfor 2 weeks prior to the experiment. Two weeks of‘‘acclimation’’ were provided to allow recovery from anypossible ‘‘shock’’ associated with harvesting of plants,including severing of rhizomes and possible disruption toroots in the sediment. The experiment was conducted in anindoor flow-through aquarium system at the AustralianInstitute of Marine Sciences. For each temperature treat-ment, there was a single header tank in which the water washeated and then dispersed. A computer-controlled ther-mometer regulated temperature to within 0.5uC of the targettemperature. Water was supplied by a nearby coastal intakeas a continuous through-flow (i.e., not recycled), and flowwas maintained at a rate of , 9 mL s21 with completeexchange of the water in the treatment aquaria every 45 min.Light was supplied from a single halogen lamp mountedover the top of each tank, and the low-light treatmentinvolved placing light-reducing black shade-cloth betweenthe light source and the water surface.
There were four replicate 50-liter tanks for eachtemperature treatment. Each tank was divided into ahigh-light and a low-light treatment using Perspex dividers,which were randomly assigned within the tanks. A separateinflow tap led to each side of the Perspex divider, and foroutflow, the water from one section passed through a smallmesh window (1-mm mesh) at the top of the divider intothe other section. In each light and temperature treatment,there were two subreplicate pots of each species and the
data from these subreplicates were averaged (mean) forlater analysis.
The experiment was run for a total of 35 d from 10October 2009. Ambient temperature was , 27uC, and thetemperature treatments were initiated on 10 October at 11:00h, with the target temperatures of 27uC, 30uC, and 33uCreached at 05:00 h on 11 October. During the experiment,measurements were made in four blocks of time: days 26 to21 (time 0), days 1–6 (time 1), days 17–23 (time 2), and days28–34 (time 3). Growth was measured at each time accordingto Short and Duarte (2001). Ten shoots from each pot weremarked at the top of the sheath with a needle. The length ofgrowth (mm) was measured after 5 to 7 d on the shootswithout removing them from the pots.
Photosynthetic rates and respiration rates were measuredat time 1 and time 3 on the upper 20–40 mm of the youngestmature leaf of a random shoot from each subreplicate potusing optical oxygen sensors (‘‘optodes,’’ PreSens, Sensorspots-Pst3) and a PreSens Oxy 4 four-channel fiber-opticoxygen meter. Small custom-made glass chambers (6.62 mL)were set in an array of four (i.e., four separate chambersallowing four parallel measures) and incubated at thetreatment water temperature (27uC, 30uC, 33uC) using aflow-through water system connected to a water bath(Lauda, Ecoline RE 106). Each chamber was stirred with aglass-coated magnetic stirrer bar, and in each chamber, therewas a perforated plastic shelf separating the stirrer from theseagrass material. The leaves were placed on top of the shelfin a U-shape, which resulted in minimal contact of the leafwith the glass chamber or plastic shelf. Oxygen consumption(dark respiration) was measured over a 20- to 30-min periodin the dark. Photosynthetic rates were then measured on thesame leaf fragment in the light (treatment light intensity,either 40 or 400 mmol quanta m22 s21) over 20 to 30 min.Oxygen concentration data in the chambers were loggedevery 30 s, and respective respiration and production rateswere calculated by fitting a linear regression to the data.Regressions omitted the initial period of incubation (, 5 to15 min) until rates had stabilized. Respiration rates ofbelowground rhizomes were also measured, but at time 3only, because removal of the rhizome is destructive. A smallpiece of rhizome (5–10 mm) and associated roots wereremoved from the sediment, rinsed at treatment tempera-ture, and then transferred to incubation chambers.
Each optode was calibrated prior to initial measurementsusing a two-point method (100% O2 in air: using a wetsponge in the respiration chamber to saturate air; 0% using a1% Na2SO3 solution). Individual chambers were cleanedwith ethanol between incubations to prevent biofilm buildup,and at least 1 blank chamber was run on each measuring dayto test for blank respiration. At the end of the experiment, theremaining biomass was collected, separated into above- andbelowground biomass, dried at 80uC, and weighed.
Metabolic rates were calculated according to thefollowing:
Lf PhsG mmol O2 g{1dry weight dry wtð Þh{1� �
~Lf PhsN{Lf Resp ð1Þ
where Lf PhsG is the gross photosynthetic rate of leaves,
2202 Collier et al.

i.e., with loss from respiration removed, Lf PhsN (mmol O2
g21 dry wt h21) is the net rate of O2 production of theleaf material (measured value, with respiration included),Lf Resp (mmol O2 g21 dry wt h21) is the respiration rate inthe leaves, and dry wt is the mass of leaf material in dryweight.
Total C budget of the shoot was calculated for time 3only when biomass measures were also made. Firstly,biomass per shoot (WtShoot, g shoot21) was calculated fromthe sum of:
WtLf~biomassA=Gr
shootsð2Þ
and
Wtrhiz~biomassB=Gr
shootsð3Þ
where leaf weight (WtLf, g shoot21) is the weight of leafmaterial in each shoot, biomassA/Gr is the biomass ofaboveground material (leaves and live sheath, g dry wtpot21), rhizome weight (Wtrhiz, g shoot21) is the weight ofrhizome in each shoot, biomassB/Gr is the biomass ofbelowground parts (rhizome and roots, g dry wt pot21),and shoots is the number of shoots per pot (shoots pot21).
Total leaf photosynthetic O2 production for a 24-hperiod was then calculated:
Prod24~ Lf PhsG|12hð Þ{ Lf Resp|24ð Þ ð4Þ
where Prod24 is the rate of photosynthetic O2 production ofthe leaves after respiration rates of the leave are subtractedfor 24 h (mmol O2 g dry wt21 d21).
The respiration rate of the rhizome for a 24-h period wasthen calculated:
RespRhiz24(mmol O2 g dry wt{1d{1)~RespRhiz|24 ð5Þ
where RespRhiz24 is respiration rate in the rhizome over24 h, and RespRhiz is the hourly rate of respiration in therhizome (mmol O2 g dry wt21 h21).
Finally, the total production of carbon for the entireshoot (shoot, leaf + rhizome) over a 24-h period (C ProdN
mg C shoot21 d21) was calculated from:
C ProdN(mg C shoot{1 d{1)~ Prod24{Resp24ð Þ=P:Q:½ �
|(Mol WtC=1000)|Wtshoot
ð6Þ
where P.Q. is the photochemical quotient of tropicalseagrasses (P.Q. 5 1; Pollard and Greenway 1993) andMol WtC is the molecular weight of carbon (12).
Statistical analysis—Metabolic data for time 1 and Time3, and biomass data for time 3 were analyzed separately foreach species using a two-way analysis of variance (AN-OVA) testing for the fixed effects of temperature (threelevels) and light (two levels). Repeated measures ANOVA(RM ANOVA) was used for growth rates, with tempera-ture and light as fixed effects (between-subjects effects) overtime (within-subjects effects). The variance–covariance
matrices were tested using Mauchly’s test of sphericity,and if the assumption was not met, the Greenhouse-Geisserepsilon adjustment was applied to the degrees of freedom.Temperature effects were interpreted using Tukey’s post-hoc analysis with light levels combined if no temperatureand light interaction was observed or at each separate lightlevel if an interaction occurred. Data were checked forhomogeneity of variance using Levene’s test, and if theyfailed (p . 0.05), data were square-root or log transformed.If the transformation was not successful at improving thevariance in the data, the ANOVA was performed but withsignificant p values set to 0.01 to minimize the risk of a type1 error (Underwood 1997). Transformations and p valuesare shown for all significant results.
Results
Metabolic rates and whole plant carbon budgets—For thetropical species H. uninervis, the effects of light andtemperature on leaf photosynthesis (Lf PhsG mmol O2 g21
dry wt h21; Eq. 1) and leaf respiration (Lf Resp mmol O2
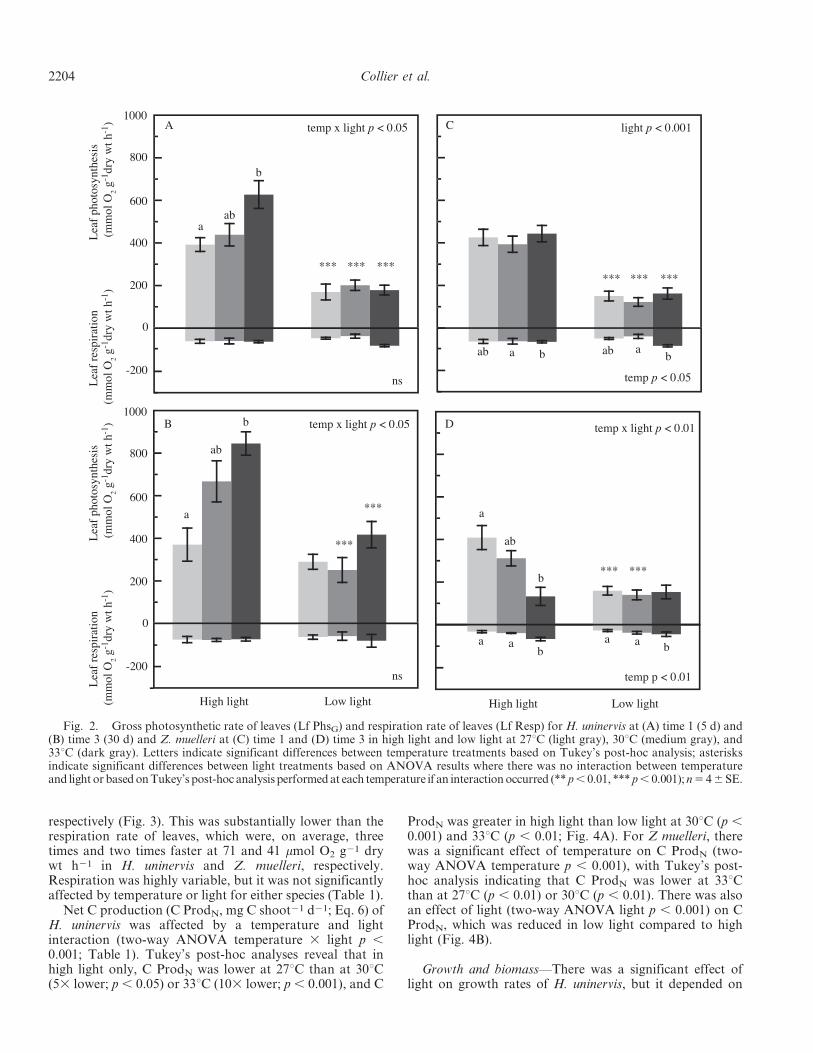
g21 dry wt h21) were similar after 5 d (time 1) and 30 d(time 3). There was no effect of temperature or light on LfResp at time 1 or time 3 (Fig. 2A,B). For Lf PhsN,however, there was a significant temperature and lightinteraction (time 1 temperature 3 light p , 0.05; time 3temperature 3 light p , 0.05; Table 1). Post-hoc analysisindicated that: in high light, Lf PhsG was significantlyhigher at 33uC than 27uC (time 1 Tukey’s p , 0.05; time 3 p, 0.01), but there was no difference between temperaturesin low light, and Lf PhsG was faster in high light than lowlight at all temperatures at time 1 but only at 30uC (p ,0.05) and 33uC (p , 0.01) at time 3 (Fig. 2A,B). Insummary, the photosynthesis to respiration ratio (P : R) ofleaves only of H. uninervis was 5.6, 8.8, and 11.2 at 27uC,30uC, and 33uC in high light, but it showed less variation inlow light at 4.9, 6.5, and 7.0 at time 3.
Lf Resp in Z. muelleri was affected by temperature atboth time 1 and time 3 (two-way ANOVA time 1,temperature p , 0.05; time 3 temperature p , 0.01;Table 1) with Tukey’s post-hoc analysis revealing higher LfResp at 33uC compared to the 30uC at time 1 (p , 0.05) andat time 3 compared to both 27uC (p , 0.01) and 30uC (p ,0.05) (Fig. 2C,D). Lf PhsG was significantly affected bylight at time 1 (two-way ANOVA p , 0.001) and was lessthan half the rate in low light compared to high light for alltemperatures (Fig. 2C). At time 3, there was a significantinteraction between temperature and light on Lf PhsG (two-way ANOVA p , 0.01): Tukey’s post-hoc analysisindicated that Lf PhsG was reduced at 33uC compared to27uC (p , 0.01), but only in high light, and Lf PhsG wassignificantly faster in high light than low light at 27uC (p ,0.01) and 30uC (p , 0.01), but at 33uC, there was nodifference between light treatments. In summary, the P : Rratios of Z. muelleri decreased with temperature: 14.1, 8.5,and 2.1 at 27uC, 30uC, and 33uC in high light and 8.3, 3.8,and 3.7 in low light at time 3.
Respiration rates in the rhizomes (RespRhiz) weremeasured at time 3 only, and were, on average, 22 and19 mmol O2 g21 dry wt h21 in H. uninervis and Z. muelleri,
Seagrass thermal tolerance 2203
respectively (Fig. 3). This was substantially lower than therespiration rate of leaves, which were, on average, threetimes and two times faster at 71 and 41 mmol O2 g21 drywt h21 in H. uninervis and Z. muelleri, respectively.Respiration was highly variable, but it was not significantlyaffected by temperature or light for either species (Table 1).
Net C production (C ProdN, mg C shoot21 d21; Eq. 6) ofH. uninervis was affected by a temperature and lightinteraction (two-way ANOVA temperature 3 light p ,0.001; Table 1). Tukey’s post-hoc analyses reveal that inhigh light only, C ProdN was lower at 27uC than at 30uC(53 lower; p , 0.05) or 33uC (103 lower; p , 0.001), and C
ProdN was greater in high light than low light at 30uC (p ,0.001) and 33uC (p , 0.01; Fig. 4A). For Z muelleri, therewas a significant effect of temperature on C ProdN (two-way ANOVA temperature p , 0.001), with Tukey’s post-hoc analysis indicating that C ProdN was lower at 33uCthan at 27uC (p , 0.01) or 30uC (p , 0.01). There was alsoan effect of light (two-way ANOVA light p , 0.001) on CProdN, which was reduced in low light compared to highlight (Fig. 4B).
Growth and biomass—There was a significant effect oflight on growth rates of H. uninervis, but it depended on
Fig. 2. Gross photosynthetic rate of leaves (Lf PhsG) and respiration rate of leaves (Lf Resp) for H. uninervis at (A) time 1 (5 d) and(B) time 3 (30 d) and Z. muelleri at (C) time 1 and (D) time 3 in high light and low light at 27uC (light gray), 30uC (medium gray), and33uC (dark gray). Letters indicate significant differences between temperature treatments based on Tukey’s post-hoc analysis; asterisksindicate significant differences between light treatments based on ANOVA results where there was no interaction between temperatureand light or based on Tukey’s post-hoc analysis performed at each temperature if an interaction occurred (** p , 0.01, *** p , 0.001); n 5 4 6 SE.
2204 Collier et al.
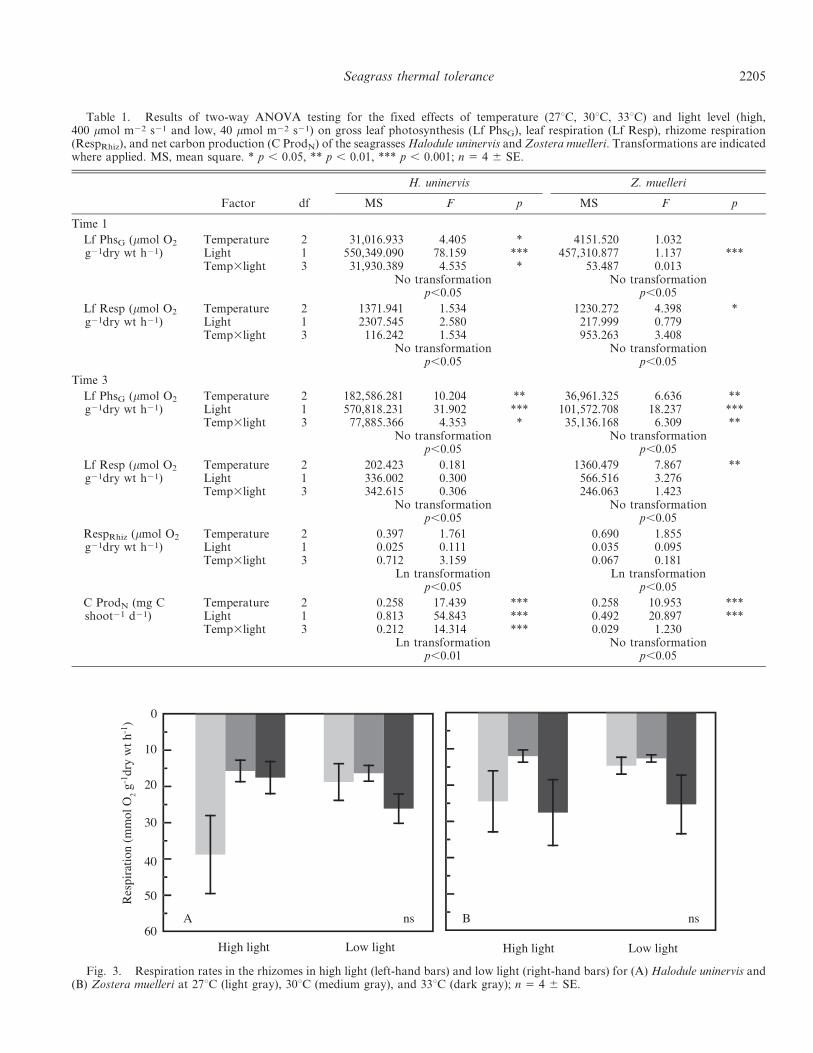
Table 1. Results of two-way ANOVA testing for the fixed effects of temperature (27uC, 30uC, 33uC) and light level (high,400 mmol m22 s21 and low, 40 mmol m22 s21) on gross leaf photosynthesis (Lf PhsG), leaf respiration (Lf Resp), rhizome respiration(RespRhiz), and net carbon production (C ProdN) of the seagrasses Halodule uninervis and Zostera muelleri. Transformations are indicatedwhere applied. MS, mean square. * p , 0.05, ** p , 0.01, *** p , 0.001; n 5 4 6 SE.
Factor df
H. uninervis Z. muelleri
MS F p MS F p
Time 1
Lf PhsG (mmol O2
g21dry wt h21)Temperature 2 31,016.933 4.405 * 4151.520 1.032Light 1 550,349.090 78.159 *** 457,310.877 1.137 ***Temp3light 3 31,930.389 4.535 * 53.487 0.013
No transformation No transformationp,0.05 p,0.05
Lf Resp (mmol O2
g21dry wt h21)Temperature 2 1371.941 1.534 1230.272 4.398 *Light 1 2307.545 2.580 217.999 0.779Temp3light 3 116.242 1.534 953.263 3.408
No transformation No transformationp,0.05 p,0.05
Time 3
Lf PhsG (mmol O2
g21dry wt h21)Temperature 2 182,586.281 10.204 ** 36,961.325 6.636 **Light 1 570,818.231 31.902 *** 101,572.708 18.237 ***Temp3light 3 77,885.366 4.353 * 35,136.168 6.309 **
No transformation No transformationp,0.05 p,0.05
Lf Resp (mmol O2
g21dry wt h21)Temperature 2 202.423 0.181 1360.479 7.867 **Light 1 336.002 0.300 566.516 3.276Temp3light 3 342.615 0.306 246.063 1.423
No transformation No transformationp,0.05 p,0.05
RespRhiz (mmol O2
g21dry wt h21)Temperature 2 0.397 1.761 0.690 1.855Light 1 0.025 0.111 0.035 0.095Temp3light 3 0.712 3.159 0.067 0.181
Ln transformation Ln transformationp,0.05 p,0.05
C ProdN (mg Cshoot21 d21)
Temperature 2 0.258 17.439 *** 0.258 10.953 ***Light 1 0.813 54.843 *** 0.492 20.897 ***Temp3light 3 0.212 14.314 *** 0.029 1.230
Ln transformation No transformationp,0.01 p,0.05
Fig. 3. Respiration rates in the rhizomes in high light (left-hand bars) and low light (right-hand bars) for (A) Halodule uninervis and(B) Zostera muelleri at 27uC (light gray), 30uC (medium gray), and 33uC (dark gray); n 5 4 6 SE.
Seagrass thermal tolerance 2205

time (RM ANOVA time 3 light p , 0.001; Table 2).Tukey’s post-hoc analysis indicated that there was nodifference between light treatments at time 0, but at times 1(p , 0.05), 2 (p , 0.001), and 3 (p , 0.001), growth ratewas significantly faster in high light compared to low light(Fig. 5A).
For Z. muelleri, there was a highly significant effect oftemperature on growth rates that was affected by time (RMANOVA time 3 temperature p , 0.001; Table 2), andpost-hoc analyses indicated no significant differencebetween temperature treatments at time 0, but on all otherdays, growth in the 33uC treatments was slower than allother treatments (Tukey’s p , 0.001). There was also asignificant effect of light in the between-subjects test (RMANOVA light p , 0.001; Table 2), where leaf growth wasslower in the low-light compared to the high-lighttreatments.
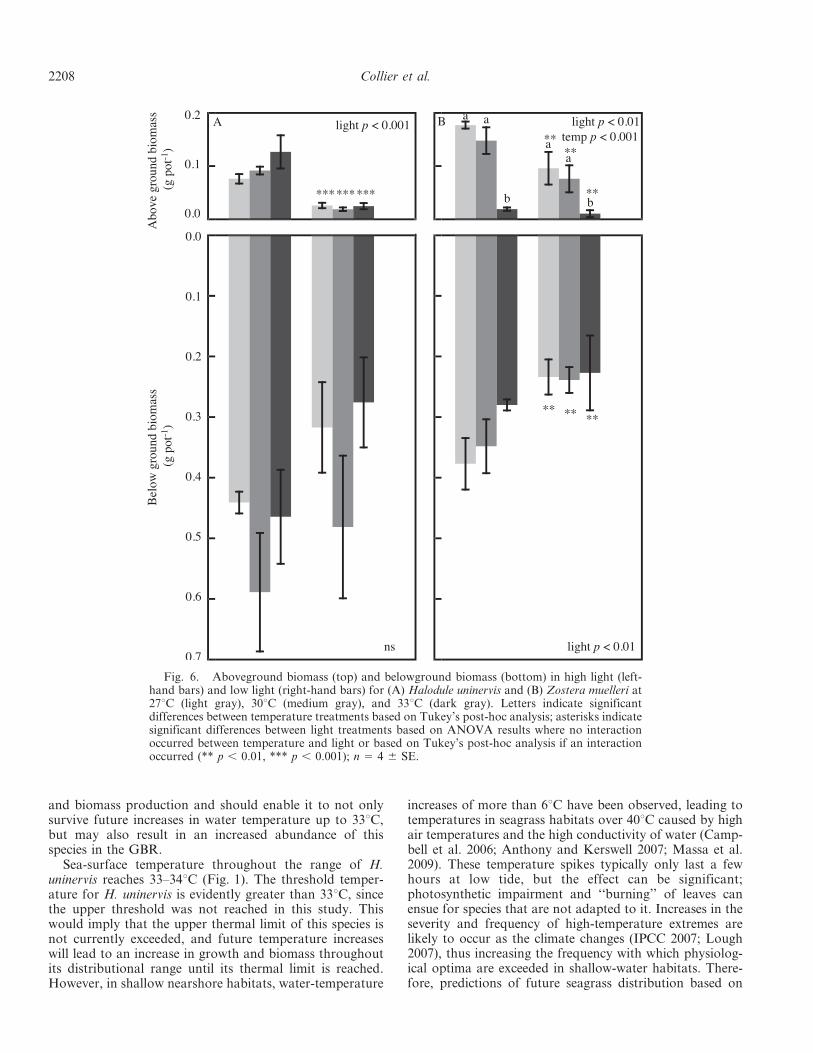
Biomass was measured only at the conclusion of theexperiment (time 3). For H. uninervis, there was a
significant effect of the light treatment (two-way ANOVAlight p , 0.001; Table 3) on aboveground biomass, withless biomass in low light than in high light for alltemperatures (Fig. 6A). There was no significant effect oftemperature or light on the belowground biomass of H.uninervis. In Z. muelleri, there was a significant effect oftemperature (two-way ANOVA temperature p , 0.001;Table 3) on the aboveground biomass, with Tukey’s post-hoc analysis indicating that biomass was reduced at 33uCcompared to both 27uC and 30uC (Tukey’s post-hoc p ,0.001; Fig. 6B). There was also a significant effect of lighton the aboveground biomass (two-way ANOVA light p ,0.001; Table 3) and on the belowground biomass (two-wayANOVA light p , 0.01; Table 3), with reduced biomass inlow light compared to high light. The belowgroundbiomass was considerably larger than the abovegroundbiomass, ranging from 3.73 (33uC high light) to 253 more(30uC low light) in H. uninervis and from 2.13 (27uC highlight) to 213 (33uC low light) more in Z. muelleri
Fig. 4. Net shoot production (C ProdN mg C shoot21 d21) for (A) Halodule uninervis and (B) Zostera muelleri in high light and lowlight at time 3 (30 d) at 27uC (light gray), 30uC (medium gray), and 33uC (dark gray). Letters indicate significant differences betweentemperature treatments based on Tukey’s post-hoc analysis; asterisks indicate significant differences between light treatments based onANOVA results where no interaction occurred between temperature and light or based on Tukey’s post-hoc analysis if an interactionoccurred (** p , 0.01, *** p , 0.001); n 5 4 6 SE.
Table 2. Results of two-way RM ANOVA testing for the fixed effects of temperature (27uC, 30uC, 33uC) and light level (high,400 mmol m22 s21 and low, 40 mmol m22 s21) on leaf growth (mm d21) of the seagrasses Halodule uninervis and Zostera muelleri.Transformations are indicated where applied. MS, mean square; Sqrt, square root. *** p , 0.001.
Test Effects
H. uninervis Z. muelleri
df MS F4 p MS F4 p
Within-subjects effects Time 3 1.280 31.897 *** 5.572 90.058 ***Time3temperature 6 0.094 2.344 1.913 30.916 ***Time3light 3 1.194 29.748 *** 0.120 1.945Time3temperature3light 6 0.057 1.414 0.075 1.209
Between-subjects effects Temperature 2 0.051 1.548 5.538 121.594 ***Light 1 6.714 204.977 *** 0.845 18.551 ***Temperature3light 2 0.091 2.772 0.021 0.461
Ln transformation Sqrt transformationp,0.01 p,0.05
2206 Collier et al.

(Fig. 6A,B). Changes to morphological characteristics ofthe shoots, including a reduction in leaves per shoot andleaf length, were large contributors to the reduction inaboveground biomass; there was little difference in shootdensity among treatments (C. Collier unpubl.).
Discussion
This study has demonstrated that H. uninervis and Z.muelleri, although overlapping in their distributionthroughout the GBR, have distinctly different temperaturethresholds, which could affect their distributions andrelative dominance if sea temperatures increase accordingto projections.
H. uninervis can be considered a truly tropical species: itsphotosynthetic rates, overall net carbon production, andconsequently growth and biomass increased with temper-ature from 27uC to 33uC. These responses are consistentwith those of other higher plants following increases in
temperature that fall within their physiological optimumtemperature range (Berry and Bjorkman 1980; McDonald2003). However, photosynthetic sensitivity to high temper-ature is greatest at saturating light levels (Berry andBjorkman 1980; Bulthius 1987), as demonstrated in thisstudy by the response of H. uninervis. In contrast, at lowand limiting light levels, photosynthetic rates of H.uninervis were drastically reduced, and temperature hadlittle effect on net photosynthesis. As a result, in limitinglight, there was no difference in overall carbon (C)production with increasing temperature and no tempera-ture effect on growth and biomass, which were bothreduced compared to the high-light treatments. In low andlimiting light, photosynthesis and respiration rates areexpected to have a lower threshold temperature than inhigh light (Berry and Bjorkman 1980), but this thresholdtemperature was not reached in these experiments. Habitatconditions that provide saturating light levels to H.uninervis enable faster rates of photosynthesis, growth,
Fig. 5. Leaf growth rate (mm d21) of (A) Halodule uninervis and (B) Zostera muelleri at 27uC (circles), 30uC (square), and 33uC(triangle) in high light (white fill) and low light (dark fill) at time 0 (T0, 0 d) through to time 3 (T3, 32 d) . Significant (p , 0.05) results ofRM ANOVA and post-hoc analyses are shown. Asterisks indicate significant differences between light treatments (* p , 0.05, ** p ,0.01, *** p , 0.001); n 5 4 6 SE.
Table 3. Results of a two-way ANOVA testing for the fixed effects of temperature (27uC, 30uC, 33uC) and light level (high,400 mmol m22 s21 and low, 40 mmol m22 s21) on aboveground and belowground biomass of the seagrasses Halodule uninervis andZostera muelleri. Transformations are indicated where applied. MS, mean square; Sqrt, square root. ** p , 0.01, *** p , 0.001.
Factor df
H. uninervis Z. muelleri
MS F p MS F p
Aboveground biomass (g pot21) Light 1 0.150 64.730 *** 0.055 11.253 **Temperature 2 0.003 1.202 0.143 29.045 ***Light3temperature 2 0.003 1.330 0.003 0.545
Sqrt transformation Sqrt transformationp,0.05 p,0.01
Belowground biomass (g pot21) Light 1 0.118 4.327 0.076 11.869 **Temperature 2 0.069 2.530 0.007 1.171Light3temperature 2 0.004 0.135 0.005 0.797
No transformation No transformationp,0.05 p,0.05
Seagrass thermal tolerance 2207
and biomass production and should enable it to not onlysurvive future increases in water temperature up to 33uC,but may also result in an increased abundance of thisspecies in the GBR.
Sea-surface temperature throughout the range of H.uninervis reaches 33–34uC (Fig. 1). The threshold temper-ature for H. uninervis is evidently greater than 33uC, sincethe upper threshold was not reached in this study. Thiswould imply that the upper thermal limit of this species isnot currently exceeded, and future temperature increaseswill lead to an increase in growth and biomass throughoutits distributional range until its thermal limit is reached.However, in shallow nearshore habitats, water-temperature
increases of more than 6uC have been observed, leading totemperatures in seagrass habitats over 40uC caused by highair temperatures and the high conductivity of water (Camp-bell et al. 2006; Anthony and Kerswell 2007; Massa et al.2009). These temperature spikes typically only last a fewhours at low tide, but the effect can be significant;photosynthetic impairment and ‘‘burning’’ of leaves canensue for species that are not adapted to it. Increases in theseverity and frequency of high-temperature extremes arelikely to occur as the climate changes (IPCC 2007; Lough2007), thus increasing the frequency with which physiolog-ical optima are exceeded in shallow-water habitats. There-fore, predictions of future seagrass distribution based on
Fig. 6. Aboveground biomass (top) and belowground biomass (bottom) in high light (left-hand bars) and low light (right-hand bars) for (A) Halodule uninervis and (B) Zostera muelleri at27uC (light gray), 30uC (medium gray), and 33uC (dark gray). Letters indicate significantdifferences between temperature treatments based on Tukey’s post-hoc analysis; asterisks indicatesignificant differences between light treatments based on ANOVA results where no interactionoccurred between temperature and light or based on Tukey’s post-hoc analysis if an interactionoccurred (** p , 0.01, *** p , 0.001); n 5 4 6 SE.
2208 Collier et al.
SST will be complex, and responses in shallow habitats willdeviate from those predicted in less dynamic water bodies.
At the sampling site, water temperature can reach 30–30.5uC in summer (December–February). A maximumincrease of 3uC is projected by 2100 under the A2 scenario,taking mean water temperatures to 33uC (Lough 2007), and,therefore, H. uninervis should remain within its physiologicaloptimum temperature range within the GBR. We mightexpect this species to colonize areas further south along theeast Australian coast as warmer temperatures extend to thesouth, expanding its distribution to central New SouthWales; however, this assumes that its southern distribution isnot constrained by other habitat conditions, includingappropriate substrate, light, salinity, nutrient availability,and suitable disturbance regimes.
In contrast to the responses of H. uninervis, Z. muelleriwas severely affected by the 33uC temperature treatment; itsphotosynthetic rates plummeted and respiration ratesincreased at 33uC compared to 30uC. Plants can withstandnegative carbon (C) balances for short durations bydrawing on storage reserves, but Z. muelleri also madegrowth and structural modifications at 33uC, whichreduced the energetic costs of maintenance of the plant(Fourqurean and Zieman 1991). These responses areconsistent with other higher plants when physiologicaloptimum temperatures have been exceeded (Berry andBjorkman 1980). The photosynthetic mechanisms becameimpaired to such a degree at 33uC that Z. muelleri could notbenefit from the saturating light levels of the high-lighttreatment. This change in photosynthetic rate was notimmediate, however; within the first 5 d (time 1), this 30–33uC threshold was absent for photosynthesis, and only asmall reduction in respiration was observed. The Z.muelleri plants used in these experiments were collected aconsiderable distance from their northern distributionallimit; however, summer maximum sea-surface temperaturevaries only slightly (0.5–1uC) over this distance (Fig. 1).The region where samples were collected occurs towardsthe northern, tropical limit of this species distribution, andthus they are less likely to have broad phenotypictolerances compared with that of populations situatedwithin the center of the species distribution. The geneticdiversity within the region is likely to be reduced due to thecentral-marginal theory, where edge of range populationsoften exhibit reduced genetic diversity and narrowerphenotypic tolerances to environmental stressors (Vucetichand Waite 2003). However, specific testing of plants fromextreme northern populations (i.e., those exposed to higherwater temperature) is needed to evaluate if they are betteradapted to higher temperatures.
The ecological roles of H. uninervis and Z. muelleri arenot interchangeable (Carruthers et al. 2002), and displace-ment of Zostera from northern seagrass ecosystems wouldaffect the overall functioning of the seagrass communities itoccupies. Projected increases in water temperature for theGBR (up to 3uC by 2100 under A2 scenario; Lough 2007)could see maximum monthly water temperature in theGBR from the Torres Strait to Mackay increase to wellover 33uC (Fig. 1). This could potentially result in acontraction of the distribution of Z. muelleri by more than
1000 km and result in local extinction in the northern GBR.Such a loss could have ecologically significant ramificationsbecause this species tends to occupy habitats that few otherspecies can inhabit—it is typically found in shallow, muddyestuarine waters (Lee Long et al. 1993; Carruthers et al.2002). In these habitats, there may be no equivalent speciesthat can act as a functional replacement amongst thetropical species because it often forms monospecificmeadows, tolerating conditions that are not suitable forother seagrass species. The environmental factors thatcurrently limit the distribution of the tropical estuarine andcoastal species (e.g., Enhalus acroides) are not known,making it difficult to predict their responses to futureenvironmental change and their potential to act as afunctional replacement for Z. muelleri.
The two species studied here—Halodule uninervis, whichis predominantly tropical, and Zostera muelleri, which ispredominantly temperate—exhibited contrasting responsesto increasing water temperatures. They also representmembers of different seagrass families, possessing differentevolutionary histories. Their responses may reflect thesedifferent histories, and different physiological strategies forsurvival in the marine environment, which are as yetunresolved for these taxa. In addition, light levels were alsocritical to their response to increasing temperature: Saturat-ing light was required for H. uninervis to respond positivelyto increasing temperature, whereas Z. muelleri responded bygoing into carbon deficit at limiting light levels, although itmaintained a positive balance under saturating light. Thishas important implications for the management of thesespecies into the future, as maintaining and improving waterquality—and thus maximizing light levels—will enhanceresilience of both species to elevated temperatures.
AcknowledgmentsWe thank A. Negri and R. Berkelmans for assistance running
the aquaria systems, and A. Giraldo Ospina and D. Tracey forassistance with seagrass collection and seagrass measurementthroughout. We are grateful to S. Kininmonth for his assistance inpreparing temperature Geographical Information Systems mapsbased on the data provided at http://www.oracle.ugent.be/. Wealso thank the reviewers of this manuscript for their feedback.This work was funded by the Marine and Tropical SciencesResearch Facility, Department of Environment, Heritage and theArts (Australian government).
References
ANTHONY, K. R. N., AND A. P. KERSWELL. 2007. Coral mortalityfollowing extreme low tides and high solar radiation. Mar.Biol. 151: 1623–1631, doi:10.1007/s00227-006-0573-0
BERRY, J., AND O. BJORKMAN. 1980. Photosynthetic response andadaptation to temperature in higher plants. Ann. Rev. PlantPhysiol. 31: 491–543, doi:10.1146/annurev.pp.31.060180.002423
BULTHIUS, D. A. 1987. Effects of temperature on photosynthesisand growth of seagrasses. Aquat. Bot. 27: 27–40, doi:10.1016/0304-3770(87)90084-2
CAMPBELL, S. J., L. J. MCKENZIE, AND S. P. KERVILLE. 2006.Photosynthetic responses of seven tropical seagrasses toelevated seawater temperature. J. Exp. Mar. Biol. Ecol. 330:455–468, doi:10.1016/j.jembe.2005.09.017
Seagrass thermal tolerance 2209
CARRUTHERS, T. J. B., W. C. DENNISON, B. J. LONGSTAFF, M.WAYCOTT, E. G. ABAL, L. J. MCKENZIE, AND W. J. LEE LONG.2002. Seagrass habitats of northeast Australia: Models of keyprocesses and controls. Bull. Mar. Sci. 71: 1153–1169.
CHAPIN, F. S., A. J. BLOOM, C. B. FIELD, AND R. H. WARING. 1987.Plant responses to multiple environmental factors. Bioscience37: 49–57, doi:10.2307/1310177
COLLIER, C. J., P. S. LAVERY, R. J. MASINI, AND P. J. RALPH. 2009.Shade-induced response and recovery of the seagrass Posido-nia sinuosa. J. Exp. Mar. Biol. Ecol. 370: 89–103, doi:10.1016/j.jembe.2008.12.003
DE’ATH, G., AND K. FABRICIUS. 2010. Water quality as a regionaldriver of coral biodiversity and macroalgae on the GreatBarrier Reef. Ecol. Appl. 20: 840–850, doi:10.1890/08-2023.1
DENNISON, W. C. 1987. Effects of light on seagrass photosynthesis,growth and depth distribution. Aquat. Bot. 27: 15–26,doi:10.1016/0304-3770(87)90083-0
ENRıQUEZ, S. 2005. Light absorption efficiency and the packageeffect in the leaves of the seagrass Thalassia testudinum. Mar.Ecol. Prog. Ser. 289: 141–150, doi:10.3354/meps289141
FOURQUREAN, J. W., AND J. C. ZIEMAN. 1991. Photosynthesis,respiration and whole plant carbon budget of the seagrassThalassia testudinum. Mar. Ecol. Prog. Ser. 69: 161–170,doi:10.3354/meps069161
HECK, K. L., T. J. B. CARRUTHERS, C. M. DUARTE, A. R. HUGHES,G. KENDRICK, R. J. ORTH, AND S. W. WILLIAMS. 2008. Trophictransfers from seagrass meadows subsidize diverse marine andterrestrial consumers. Ecosystems 11: 1198–1210, doi:10.1007/s10021-008-9155-y
INTERGOVERNMENTAL PANEL ON CLIMATE CHANGE (IPCC) 2007.Summary for policymakers, p. 12–17. In S. Solomon, D. Qin,M. Manning, Z. Chen, M. Marquis, K. B. Averyt, M. Tignor,and H. L. Miller [eds.], p. 12–17. Climate change 2007: Thephysical science basis. Contribution of Working Group I tothe fourth assessment report of the Intergovernmental Panelon Climate Change. The Intergovernmental Panel on ClimateChange.
LEE LONG, W. J., R. G. COLES, AND L. J. MCKENZIE. 2000. Issuesfor seagrass conservation management in Queensland. Pac.Conserv. Biol. 5: 321–328.
———, J. E. MELLORS, AND R. G. COLES. 1993. Seagrassesbetween Cape York and Hervey Bay, Queensland, Australia.Aust. J. Mar. Freshw. Res. 44: 19–31.
LOUGH, J. 2007. Climate and climate change on the Great BarrierReef, p. 15–50. In J. E. Johnson and P. A. Marshall [eds.],Climate change and the Great Barrier Reef. Great BarrierReef Marine Park Authority.
MASSA, S., S. ARNAUD-HAOND, G. PEARSON, AND E. SERRAO. 2009.Temperature tolerance and survival of intertidal populationsof the seagrass Zostera noltii (Hornemann) in southernEurope (Ria Formosa, Portugal). Hydrobiologia 619:195–201, doi:10.1007/s10750-008-9609-4
MCDONALD, M. S. 2003. Photobiology of higher plants. JohnWiley and Sons.
ORTH, R. J., AND OTHERS. 2006. A global crisis for seagrassecosystems. Bioscience 56: 987–996, doi:10.1641/0006-3568(2006)56[987:AGCFSE]2.0.CO;2
POLLARD, P. C., AND M. GREENWAY. 1993. Photosyntheticcharacteristics of the seagrasses (Cymodocea serrulata, Tha-lassia hemprichii and Zostera capricorni) in a low-lightenvironment with a comparison of leaf-marking and lacu-nal-gas measurements of productivity. Aust. J. Mar. Freshw.Res. 44: 127–139.
RALPH, P. J., M. J. DURAKO, S. ENRIQUEZ, C. J. COLLIER, AND M.A. DOBLIN. 2007. Impact of light limitation on seagrasses. J.Exp. Mar. Biol. Ecol. 350: 176–193, doi:10.1016/j.jembe.2007.06.017
RASHEED, M. A., AND R. K. F. UNSWORTH. 2011. Long-termclimate-associated dynamics of a tropical seagrass meadow:Implications for the future. Mar. Ecol. Prog. Ser. 422: 93–103,doi:10.3354/meps08925
SCHULZE, E. D., E. BECK, AND K. MULLER-HOHENSTEIN. 2002.Plant ecology. Springer.
SHORT, F. T., AND C. M. DUARTE. 2001. Methods for themeasurement of seagrass growth and production, p. 155–182.In F. T. Short and R. Coles [eds.], Global seagrass researchmethods. Elsevier Science.
UNDERWOOD, A. J. 1997. Experiments in ecology: Their logicaldesign and interpretation using analysis of variance. Cam-bridge Univ. Press.
UNSWORTH, R. K. F., AND L. C. CULLEN. 2010. Recognising thenecessity for Indo-Pacific seagrass conservation. Conserv.Lett. 3: 63–73, doi:10.1111/j.1755-263X.2010.00101.x
VUCETICH, J. A., AND T. A. WAITE. 2003. Spatial patterns ofdemography and genetic processes across the species’ range:Null hypotheses for landscape conservation genetics. Con-serv. Genet. 4: 639–645, doi:10.1023/A:1025671831349
WAYCOTT, M., K. MCMAHON, J. MELLORS, A. CALLADINE, AND D.KLEINE. 2004. A guide to tropical seagrasses of the Indo-WestPacific. James Cook Univ.
———, AND OTHERS. 2009. Accelerating loss of seagrasses acrossthe globe threatens coastal ecosystems. Proc. Natl. Acad. Sci.USA 106: 12377–12381, doi:10.1073/pnas.0905620106
Associate editor: Anthony W. D. Larkum
Received: 07 May 2011Accepted: 04 August 2011Amended: 09 August 2011
2210 Collier et al.
Related Documents