Thermal Properties of Choline Chloride/Urea System Studied under Moisture-Free Atmosphere Gilmore, M., Swadzba-Kwasny, M., & Holbrey, J. D. (2019). Thermal Properties of Choline Chloride/Urea System Studied under Moisture-Free Atmosphere. Journal of Chemical and Engineering Data, 64(12), 5248- 5255. https://doi.org/10.1021/acs.jced.9b00474 Published in: Journal of Chemical and Engineering Data Document Version: Peer reviewed version Queen's University Belfast - Research Portal: Link to publication record in Queen's University Belfast Research Portal Publisher rights © 2019 American Chemical Society. This work is made available online in accordance with the publisher’s policies. Please refer to any applicable terms of use of the publisher. General rights Copyright for the publications made accessible via the Queen's University Belfast Research Portal is retained by the author(s) and / or other copyright owners and it is a condition of accessing these publications that users recognise and abide by the legal requirements associated with these rights. Take down policy The Research Portal is Queen's institutional repository that provides access to Queen's research output. Every effort has been made to ensure that content in the Research Portal does not infringe any person's rights, or applicable UK laws. If you discover content in the Research Portal that you believe breaches copyright or violates any law, please contact [email protected]. Download date:14. Jan. 2022

Welcome message from author
This document is posted to help you gain knowledge. Please leave a comment to let me know what you think about it! Share it to your friends and learn new things together.
Transcript
Thermal Properties of Choline Chloride/Urea System Studied underMoisture-Free Atmosphere
Gilmore, M., Swadzba-Kwasny, M., & Holbrey, J. D. (2019). Thermal Properties of Choline Chloride/UreaSystem Studied under Moisture-Free Atmosphere. Journal of Chemical and Engineering Data, 64(12), 5248-5255. https://doi.org/10.1021/acs.jced.9b00474
Published in:Journal of Chemical and Engineering Data
Document Version:Peer reviewed version
Queen's University Belfast - Research Portal:Link to publication record in Queen's University Belfast Research Portal
Publisher rights© 2019 American Chemical Society.This work is made available online in accordance with the publisher’s policies. Please refer to any applicable terms of use of the publisher.
General rightsCopyright for the publications made accessible via the Queen's University Belfast Research Portal is retained by the author(s) and / or othercopyright owners and it is a condition of accessing these publications that users recognise and abide by the legal requirements associatedwith these rights.
Take down policyThe Research Portal is Queen's institutional repository that provides access to Queen's research output. Every effort has been made toensure that content in the Research Portal does not infringe any person's rights, or applicable UK laws. If you discover content in theResearch Portal that you believe breaches copyright or violates any law, please contact [email protected].
Download date:14. Jan. 2022
1
Thermal properties of choline chloride:urea system
studied under moisture-free atmosphere
Mark Gilmore, Malgorzata Swadzba-Kwasny* and John D. Holbrey*
The QUILL Research Centre, School of Chemistry and Chemical Engineering, Queen’s
University of Belfast, Belfast, BT9 5AG, United Kingdom.
ABSTRACT: Physical chemistry of an archetypal deep eutectic solvent system, choline
chloride:urea, was studied using dry components under moisture-free conditions. The phase
diagram reveals that the eutectic melting point is 304.95 K (higher than any of the previously
reported values to date), and a previously-unrecognised phase region in the solid-liquid phase
diagram, corresponding to a C1➝C2 transition (351.62 K) from α-choline chloride to β-choline
chloride. Viscosities and densities, measured for the eutectic composition as a function of
temperature, were compared with all data available in the literature, and discrepancies are
discussed. Thermal stability studies reveal that the eutectic composition undergoes a thermal
decomposition at temperatures as low as 363.15 K (mass loss rate of 0.411 wt% h-1), which calls
for a careful consideration when using these solvents at elevated temperatures.
2
Introduction
The term deep eutectic solvent (DES) was introduced in 2003 by Abbott and co-workers.1 to
describe low temperature liquids formed from mixtures of choline chloride with ureas. Although
a formal definition has not been provided, DESs are typically mixtures of simple organic salts
acting as hydrogen-bond acceptors (e.g. choline chloride) and small organic molecules acting as
hydrogen bond donors (urea), which have the capacity to form a eutectic mixture, preferably
liquid at room temperature. Using low-toxicity, off-the-shelf components, DESs provided an
attractive low-cost and low-toxicity alternative to traditional ionic liquids, with a promising
potential for industrial uses.2,3
The archetypical DES is the mixture of choline chloride and urea in 1:2 molar ratio (𝜒ChCl =
0.33) and has been used in a wide range of applications,4 from metal electrodeposition,5 metal-
catalysed organic synthesis6 and nanomaterial preparation7 to separations and extraction
applications.8–11 Considering the breadth of applications, and the very specific meaning of the
term “eutectic” in reference to physical chemistry, the key thermal analytical data for choline
chloride:urea (ChCl:Ur) mixtures are surprisingly inconsistently reported across the
literature.1,12–14 In particular, the melting points used to construct the phase diagram vary
between papers, including the eutectic melting point. Furthermore, solid thermal stability data
are scarce, and estimates of the thermal stability of this system are vastly different across the
literature and, because ChCl:Ur mixtures are often used of at elevated temperature to overcome
their relatively high viscosities, understanding of its long-term stability is of key importance for
practical application.
3
With respect to the eutectic composition (𝜒ChCl = 0.33), in the first paper on ChCl:Ur DES,1 the
eutectic prepared by mixing at 353.15 K was found to freeze at 285.15 K. The phase diagram
was prepared using off-the-shelf components, without pre-drying, and the mixtures were
reported to contain <1 wt% water, determined by 1H NMR spectroscopy. Considering the
molecular weight differential between ChCl:2Ur (259.76 g mol-1) and H2O (18.01 g mol-1), this
corresponds to one H2O molecule for about seven ChCl:2Ur clusters, which is likely to have
significant influence on properties. Another early phase diagram, constructed by Morrison et
al.,13 for ChCl:Ur mixtures synthesised by solventless mixing at 373.15-423.15 K. In contrast to
Abbott et al.,1 using differential scanning calorimetry (DSC) measuring from 213.15 K to 398.15
K with a temperature gradient of 1 K min-1, the melting point of the eutectic, determined from
the DSC peak onset point, was found to be 290.15 K.
Looking specifically at the influence of water on the ChCl:Ur DES, Shah et al.14 prepared the
𝜒ChCl = 0.33 mixture from choline chloride and urea dried overnight in a vacuum oven (under
unspecified conditions) adding both components to a vial (with no reference to the exclusion
moisture) followed by mixing in a sealed vial at 353.15 K for 1 h. This composition was
assumed to be absolutely dry (literally described as having zero molecules of water present),
although no analytical data were provided for water content, and reported to have a melting point
of exactly 281.15 K from DSC measurement.
In the most rigorous study reported to date,12 described preparation of DES using starting
materials dried under vacuum (10 Pa, 24 h, room temperature) and then allowed to react at
353.15 K (no exclusion of moisture mentioned at this stage) to give residual water contents
below 2000 ppm, and typically around 1000 ppm, measured by Karl-Fisher coulometry. The
solidus temperature of the eutectic point was measured using a thermostatic bath, with cooling
4
rates of 0.025 or 0.25 K min-1, were reported as 301.45 and 302.85 K, respectively. The liquidus
temperature, determined by observation using heated-stage polarised optical microscopy at the
same ramp rates were 303.25 and 301.65 K, respectively. Using DSC, only solidus transitions
were observed at 296.65 and 297.65 K (for cooling rates of 0.025 or 0.25 K min-1,respectively)
that were at lower temperatures that from the optical observations.
Strikingly, although most studies mention hygroscopic nature of this DES, there are no examples
which have explicitly addressed the exclusion of moisture throughout the entire preparation and
testing.
The viscosity of the ChCl:Ur eutectic (𝜒ChCl = 0.33) is 2.1 Pa s at 293.15 K, which is far
greater than viscosities of many ionic liquids (for example, 1-ethyl-3-methylimidazolium triflate
has viscosity of 0.05 Pa s at 293.15 K15), which additionally contributes to this DES being used
at elevated temperatures, commonly above 373.15 K.16 Solventless synthesis of the ChCl:Ur
system at 373.15-423.15 K have been reported13 and examples of high-temperature
applications16–18 ranging from pre-treatment for the nanofibrillation of wood cellulose,18 as
catalysts for chemical fixation of CO2 as cyclic carbonates,16 to ionothermal syntheses19–22 have
been described. As such, these DES are often described as having high thermal stability,23–25 in
analogy to ionic liquids. However, on the other hand, the thermal stability of pure urea is rather
low: whereas thermogravimetric studies with relatively higher heating rates place the Tg close to
the melting point (403.15-408.15 K),26 TGA studies at more moderate heating rates of 1 K min-1
show thermal decomposition from 378.15 K. Although the thermal stability of ammonium
halide:urea melts has been reported to be superior to that of pure urea, ascribed to formation of
strong, stabilising hydrogen bonds,27 it should be evident that high-temperature applications must
be approached with caution. Interestingly, this low thermal stability of ChCl:Ur DES has been

5
acknowledged in some cases and uses to advantage – viz. ceria syntheses at 353.15-373.15 K,
where urea decomposition is used to rationalise the reaction mechanism and outcome.19
In this contribution, we set out to report thermal analysis data for the ChCl:Ur system, with
carefully controlled water content, adopting best practice in drying and moisture-free handling of
the studied samples.
Experimental
A summary of the chemicals used in this study are provided in Table 1.
Table 1. CAS Registry Number, supplier, mass fraction purity, purification method and analysis
of all chemicals used in this work
Component CAS Reg. No.
Supplier Mass fraction
Further purification
Analysis method
Choline chloride ((2-hydroxyethyl)trimethyl-ammonium chloride)
67-48-1
Sigma-Aldrich
0.98 Dried under vacuum
1H NMR, TGA, DSC
Urea 57-13-6
Sigma-Aldrich
>0.99 Dried under vacuum
1H NMR, TGA, DSC
Methanol 67-56-1
Fisher Scientific
0.998 As received 1H NMR
Preparation of choline chloride:urea mixtures
Appropriate quantities of each component (Table 2) were combined in a 50 cm3 round-
bottomed flask with a small quantity of methanol, then was stirred at ambient temperature
(500 rpm) until a homogenous, colourless liquid formed. Methanol and traces of water were
6
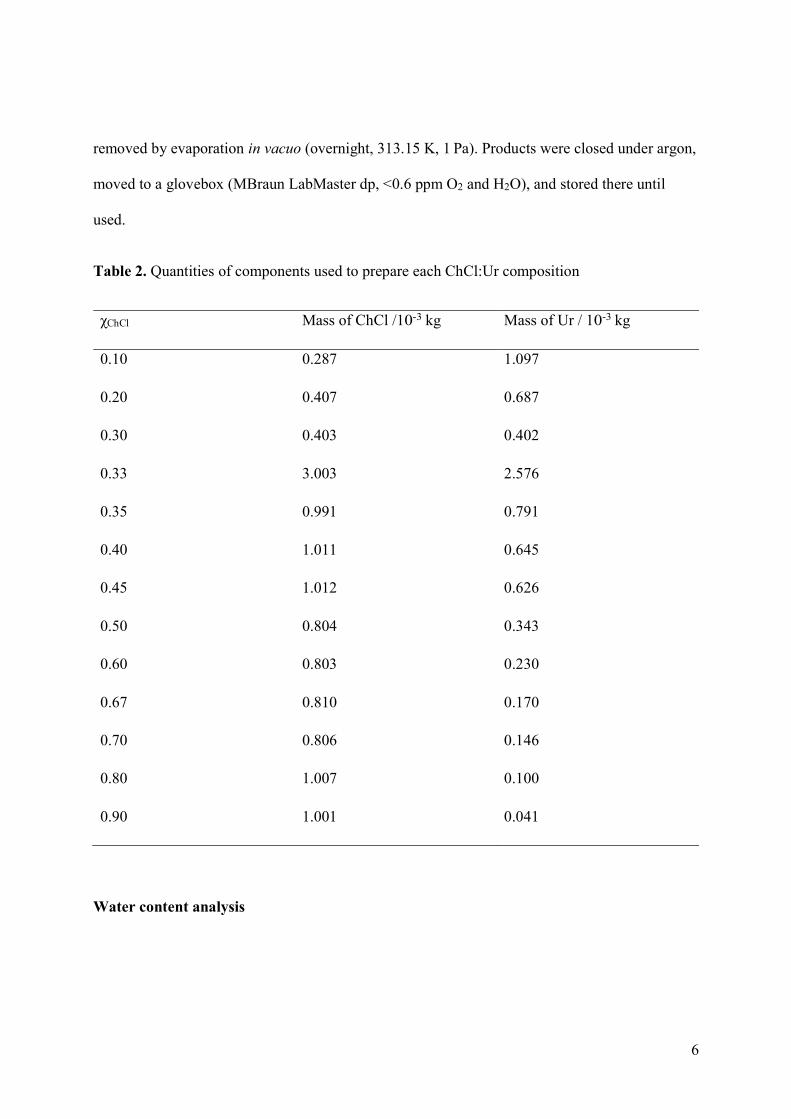
removed by evaporation in vacuo (overnight, 313.15 K, 1 Pa). Products were closed under argon,
moved to a glovebox (MBraun LabMaster dp, <0.6 ppm O2 and H2O), and stored there until
used.
Table 2. Quantities of components used to prepare each ChCl:Ur composition
χChCl Mass of ChCl /10-3 kg Mass of Ur / 10-3 kg
0.10 0.287 1.097
0.20 0.407 0.687
0.30 0.403 0.402
0.33 3.003 2.576
0.35 0.991 0.791
0.40 1.011 0.645
0.45 1.012 0.626
0.50 0.804 0.343
0.60 0.803 0.230
0.67 0.810 0.170
0.70 0.806 0.146
0.80 1.007 0.100
0.90 1.001 0.041
Water content analysis
7
Water content was measured for samples that were liquid near ambient temperature, using a
coulometric Karl Fisher titrator (Metrohm 899).
In the glovebox, ca. 0.5 cm3 of each were drawn up into a 1 cm3 syringe, the tip of which was
sealed with parafilm, and removed from the glovebox. Immediately before the measurement, the
parafilm was removed and a needle was placed on the tip of the syringe. The sample-containing
syringe was weighed, then approximately 0.10-0.25 g of the sample was injected into the Karl-
Fisher titrator, and immediately after - the syringe was re-weighed to find the mass of the added
drops. This mass was then entered into the titrator, to enable the water content to be determined
as a mass fraction (in ppm).
Solid-liquid phase transitions analysis
Phase transitions were studied using differential scanning calorimetry (DSC) and polarised
optical microscope (POM).
DSC experiments were performed using a TA Instruments DSC Q2000 fitted with RCS 90
cooling system. In the glovebox, samples were loaded into TA Tzero aluminium pans with TA
Tzero hermetic lids. The sealed and removed from the glovebox. Masses of empty and filled
pans were recorded (±0.0002 g), from which masses of samples were calculated. In a typical
DSC experiment, minimum two scans were recorded, cycling the temperature between 233.15
and 353.15 K, at 0.1 to 5 K min-1.
POM studies were carried out using an Olympus BX50 microscope fitted with Cannon 500D
digital camera. Microscope slides containing DESs samples were prepared in the glovebox and
sealed using high-vacuum silicone grease (Dow Corning). The samples were removed from the
8
glovebox and placed on a Peltier stage, fitted with a thermocouple, heating, and liquid nitrogen
cooling. The samples were cooled to 273.15 K , at ca. 5 K min-1, held at this temperature for 5
min, then heated at 1 K min-1, until completely liquefied. Upon heating, the samples were
observed through the microscope and digital images of the sample were periodically captured,
with temperature noted for each image. The polarisable lenses on the microscope were used to
detect birefringence in the sample (indicative of crystalline species). The onset of melting, phase
transitions and liquidus points were recorded in duplicate.
Densities were measured using a vibrating tube densitometer Mettler Toledo DM40. In the
glovebox, samples were taken up into a 5 cm3 syringe and sealed with parafilm, then the syringe
was removed from the glovebox. Immediately before the sample was injected into the density
meter the parafilm was removed. The syringe remained in the inlet during the measurement and
the outlet was capped to ensure no atmospheric moisture could contact the sample during the
measurement. Densities were measured within the temperature range of (293.15−363.15) K, at
10 K increments and 298.15 K.
Viscosities were measured using a Bohlin Gemini cone and plate rotational rheometer. In the
glovebox, samples were taken up into a 5 cm3 syringe and sealed with parafilm, then the syringe
was removed from the glovebox. Immediately before the sample was placed onto the viscometer
plate and covered with a cone, the parafilm was removed. Viscosities were measured within the
temperature range of (293.15−368.15) K, at approximately 6 K increments. During the
measurement, the edges of the sample sandwiched between the cone and the plate of the
viscometer are exposed to the ambient atmosphere, however potential for absorption of moisture
is minimised by the low contact area and short measurement times (ca. 5 min). No abnormalities
in the VFT fits of the data were observed.
9
Thermal stability analysis
Thermal stability was investigated by thermogravimetric analysis (TGA), and the
decomposition products characterised using headspace GC-MS.
TGA curves were recorded using TA Instruments TGA Q5000. The masses of single-use TA
aluminium cup and a TA aluminium lid were recorded using the TGA microbalance
(±0.0000001 g), which was then tared. The pans were transferred into the glovebox, filled with
ChCl:Ur samples and sealed. Once removed from the glovebox, the pans were placed in the
TGA autosampler carousel. The lid of each pan was pierced individually, 30 s before use. All
measurements were carried out under a stream of dry nitrogen (20 cm3 min-1) at a rate of 5 K
min-1. Dynamic TGA curves were recorded once heating a sample from 298.15-673.15 K, at 5 K
min-1. Isothermal TGA curves were recorded by heating each sample to 363.15 K (5 K min-1)
and holding at this temperature for 6 h.
GC-MS analyses were recorded using a Perkin Elmer Clarus 500. In the glovebox, the sample
of the eutectic was placed in a GC vial and crimped. Then, it was placed in a sand bath standing
on a hotplate in the glovebox and held at 363.15 K for 24 h. Finally, the vial was removed from
the glovebox and the headspace gases were analysed using the GC−MS.
Estimated uncertainties for measurements are provided in Table 3.
Table 3. Estimated uncertainties in measurements
Measurement Estimated uncertainty
Samples preparation 0.005
Density 0.003
10
Viscosity 0.035
DSC 1.0 K
TGA 1.0 K
POM 1.5 K
Results and discussion
Sample preparation and water content analysis
In the case of DES, solventless syntheses are without a doubt a more sustainable route than
those using a solvent. However, for the purpose of thermal analyses, it was decided to use small
amount of methanol to solubilise components of the ChCl:Ur mixtures, thereby eliminating the
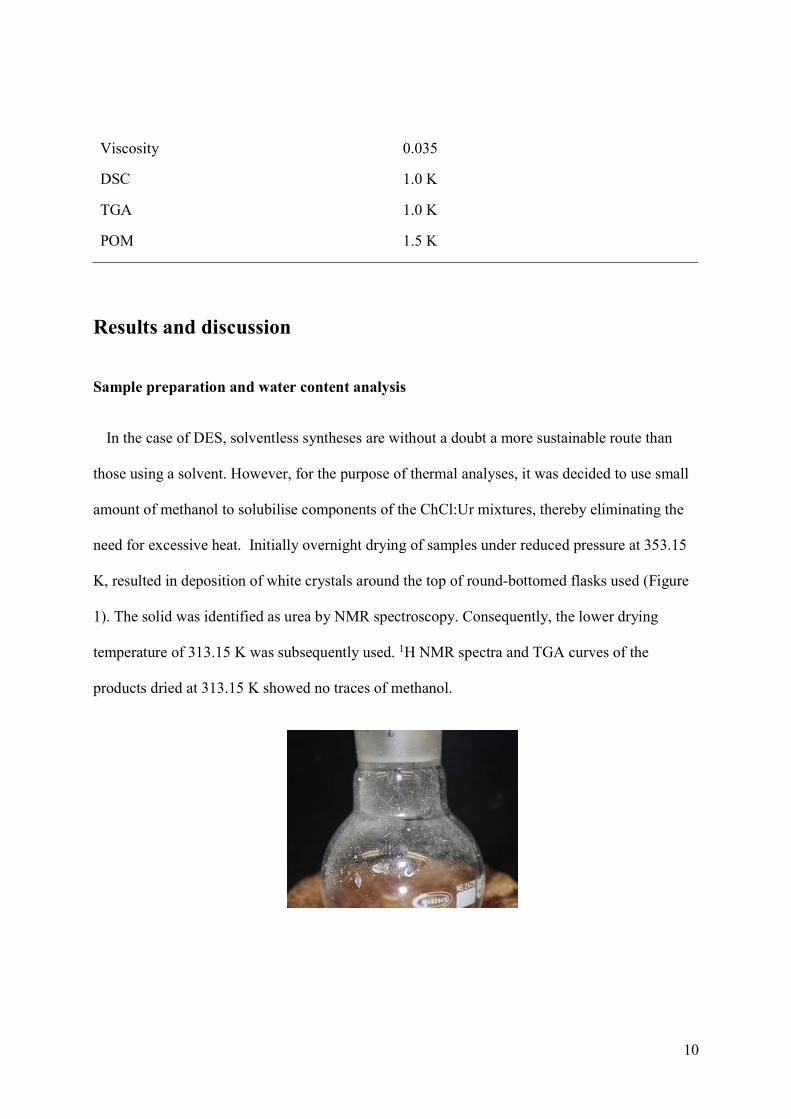
need for excessive heat. Initially overnight drying of samples under reduced pressure at 353.15
K, resulted in deposition of white crystals around the top of round-bottomed flasks used (Figure
1). The solid was identified as urea by NMR spectroscopy. Consequently, the lower drying
temperature of 313.15 K was subsequently used. 1H NMR spectra and TGA curves of the
products dried at 313.15 K showed no traces of methanol.
11
Figure 1. Urea crystals deposited on the neck of the flask after overnight drying at 353.15 K, under
reduced pressure.
Thirteen samples were prepared, of which the four compositions between χChCl = 0.33-0.45 were
homogenous liquids at ambient conditions, and a further three readily melted forming homogenous
liquids at slightly elevated temperature (Table 4). Moisture contents of these sample compositions
were measured in duplicate, using a Karl-Fisher coulometer (Table 4). Water contents (Table 4)
ranged from 100 to 500 ppm (<300 ppm on average, with a variance of 10-1400 ppm between
replicate measurements on the same samples) and did not appear to corelate with DES composition
(χChCl). In general, water content was an order of magnitude lower than that reported by Meng et
al.12
Table 4. Water content and appearance at ambient conditions of ChCl:Ur samples
χChCl Appearance Karl-Fisher results /ppm water
Run 1 Run 2 Average
0.20 Solid 260 - 260
0.30 Solid/liquid suspension 500 440 470
0.33 Liquid 60 170 115
0.35 Liquid 310 460 385
0.40 Liquid 120 220 170
0.45 Liquid 450 440 445
0.50 Gelatinous solid 70 140 105
12
Phase diagram
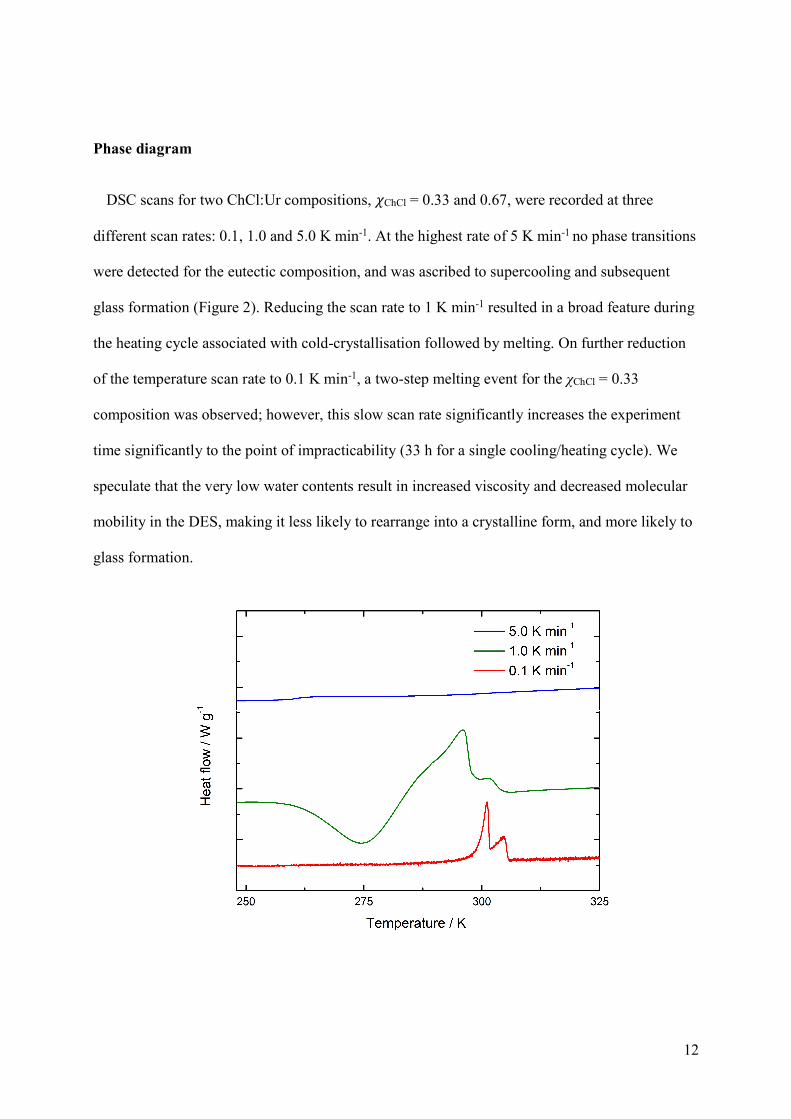
DSC scans for two ChCl:Ur compositions, 𝜒ChCl = 0.33 and 0.67, were recorded at three
different scan rates: 0.1, 1.0 and 5.0 K min-1. At the highest rate of 5 K min-1 no phase transitions
were detected for the eutectic composition, and was ascribed to supercooling and subsequent
glass formation (Figure 2). Reducing the scan rate to 1 K min-1 resulted in a broad feature during
the heating cycle associated with cold-crystallisation followed by melting. On further reduction
of the temperature scan rate to 0.1 K min-1, a two-step melting event for the χChCl = 0.33
composition was observed; however, this slow scan rate significantly increases the experiment
time significantly to the point of impracticability (33 h for a single cooling/heating cycle). We
speculate that the very low water contents result in increased viscosity and decreased molecular
mobility in the DES, making it less likely to rearrange into a crystalline form, and more likely to
glass formation.
13
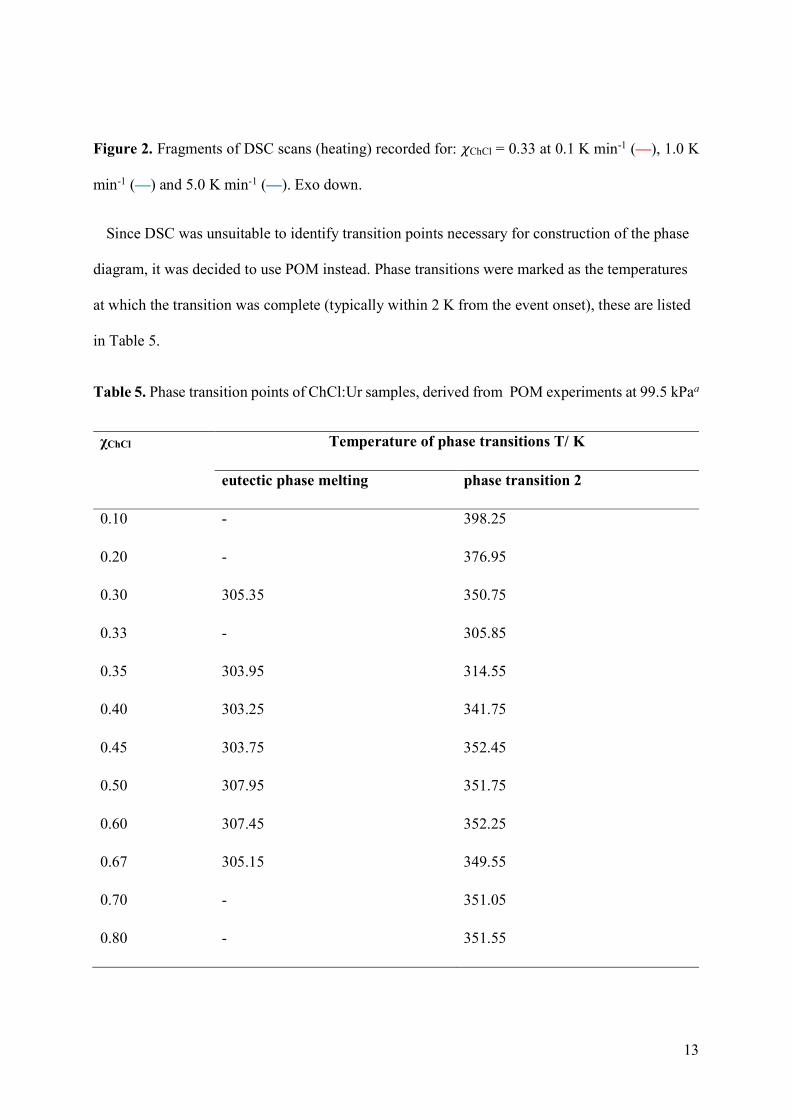
Figure 2. Fragments of DSC scans (heating) recorded for: 𝜒ChCl = 0.33 at 0.1 K min-1 (—), 1.0 K
min-1 (—) and 5.0 K min-1 (—). Exo down.
Since DSC was unsuitable to identify transition points necessary for construction of the phase
diagram, it was decided to use POM instead. Phase transitions were marked as the temperatures
at which the transition was complete (typically within 2 K from the event onset), these are listed
in Table 5.
Table 5. Phase transition points of ChCl:Ur samples, derived from POM experiments at 99.5 kPaa
χChCl Temperature of phase transitions T/ K
eutectic phase melting phase transition 2
0.10 - 398.25
0.20 - 376.95
0.30 305.35 350.75
0.33 - 305.85
0.35 303.95 314.55
0.40 303.25 341.75
0.45 303.75 352.45
0.50 307.95 351.75
0.60 307.45 352.25
0.67 305.15 349.55
0.70 - 351.05
0.80 - 351.55
14
0.90 - 352.75
aThe standard uncertainty, u, of phase transition temperatures, T, and pressure, P, are u(T) = 1.5 K and u(P) = 1.0 kPa
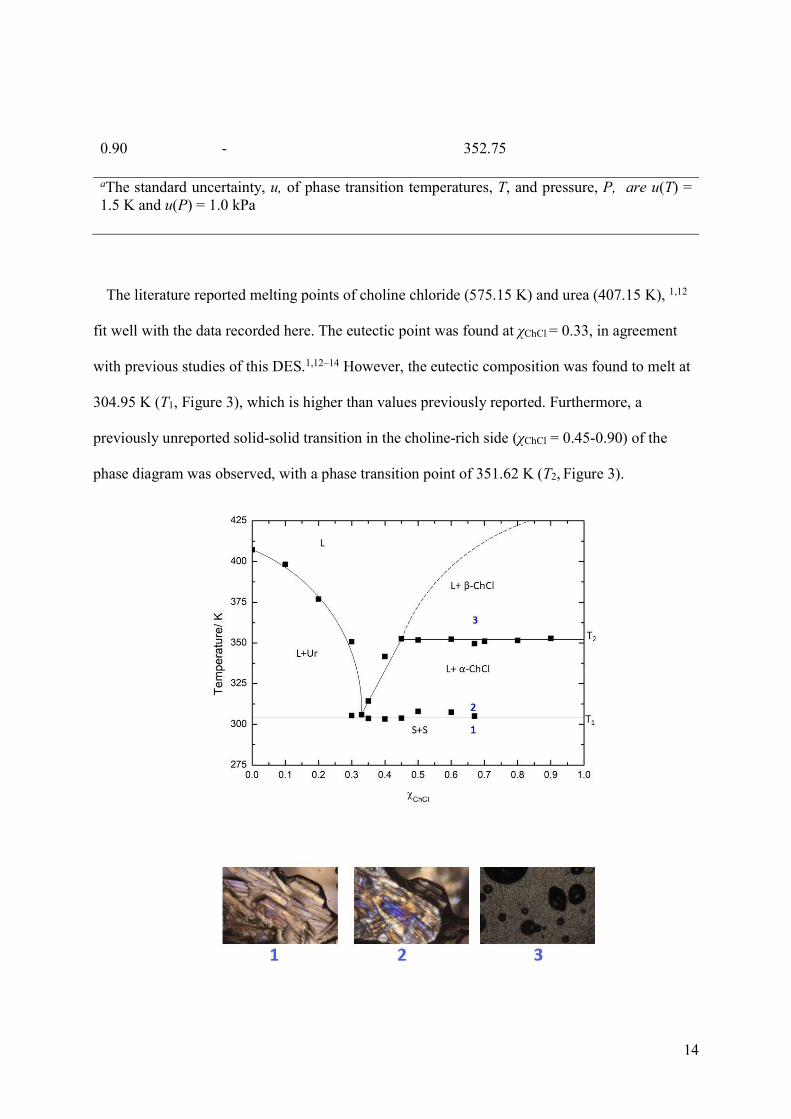
The literature reported melting points of choline chloride (575.15 K) and urea (407.15 K), 1,12
fit well with the data recorded here. The eutectic point was found at χChCl = 0.33, in agreement
with previous studies of this DES.1,12–14 However, the eutectic composition was found to melt at
304.95 K (T1, Figure 3), which is higher than values previously reported. Furthermore, a
previously unreported solid-solid transition in the choline-rich side (χChCl = 0.45-0.90) of the
phase diagram was observed, with a phase transition point of 351.62 K (T2, Figure 3).
15
Figure 3. Phase diagram of ChCl:urea, accompanied by POM images of the χChCl = 0.67 sample,
captured at 1) 298.15 K, 2) 308.15 K and 3) 353.15 K. Crystallites shown in the figure are up to 1
mm of length.
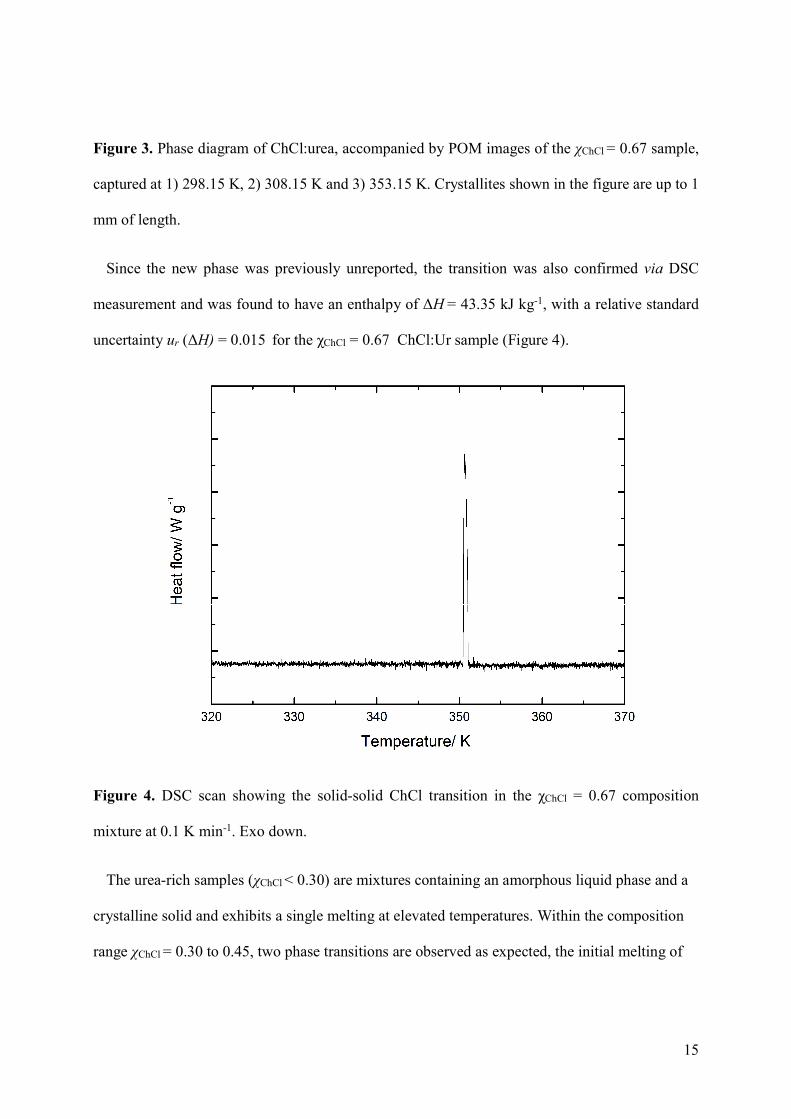
Since the new phase was previously unreported, the transition was also confirmed via DSC
measurement and was found to have an enthalpy of ΔH = 43.35 kJ kg-1, with a relative standard
uncertainty ur (ΔH) = 0.015 for the χChCl = 0.67 ChCl:Ur sample (Figure 4).
Figure 4. DSC scan showing the solid-solid ChCl transition in the χChCl = 0.67 composition
mixture at 0.1 K min-1. Exo down.
The urea-rich samples (χChCl < 0.30) are mixtures containing an amorphous liquid phase and a
crystalline solid and exhibits a single melting at elevated temperatures. Within the composition
range χChCl = 0.30 to 0.45, two phase transitions are observed as expected, the initial melting of
16
the eutectic and the subsequent clearing of the solid + liquid mixtures with the exception of the
eutectic point at χChCl = 0.33 (single melting point at T1 = 304.95 K). At temperatures above the
respective second phase transition, all samples formed homogenous liquids. In the third region,
χChCl = 0.50 to 0.67, there were three crystalline phases: the eutectic melting slightly below
305.15 K; the α−ChCl phase, transitioning at ca. 351.62 K to β−ChCl;28 and β−ChCl in the form
of weakly crystalline powder, co-existing with a liquid phase. As expected, β−ChCl crystals did
not melt until thermal decomposition was observed under the microscope in the form of bubbles
of gas (reaching complete decomposition ca. 533.15 k).
POM images of the three phases observed in the χChCl = 0.67 sample are shown in Figure 3. At
298.15 K, the sample appears as a single solid phase (Figure 3, 1). When the temperature of the
sample is increased to 308.15 K, melting of the eutectic portion occurs at T1, and the sample
contains a liquid and crystalline birefringent α−ChCl28 particles under crossed polarisers (Figure
3, 2). Upon heating to 353.15 K, the crystalline portion of the solid + liquid mixture at T2
undergoes a solid-solid transformation generating a new phase (β−ChCl)28 dispersed in a liquid
(Figure 3, 3).
Physical properties
The ChCl:Ur system is extremely hydroscopic and it has been shown that the eutectic
composition exposed directly to the atmosphere will eventually absorb up to 19% of water (by
mass).12 As with ionic liquids, lack of control over water content will affect physical properties,
with viscosity being much more susceptible to variation than density.29
17
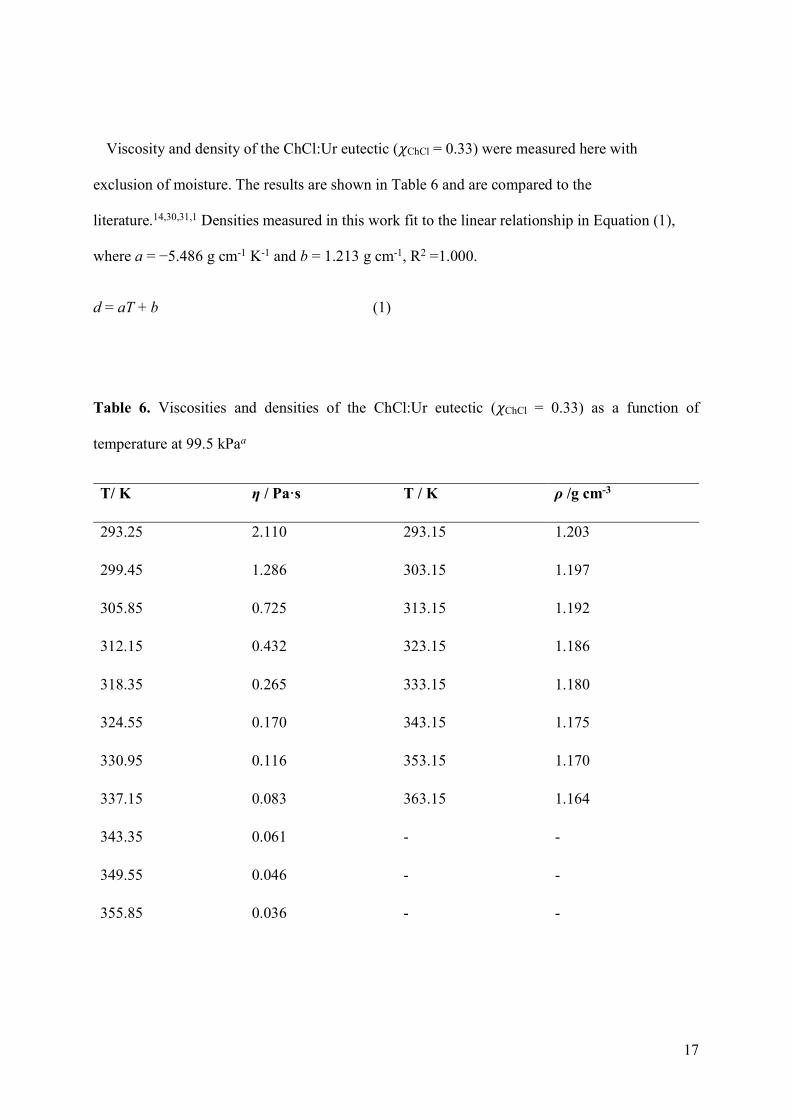
Viscosity and density of the ChCl:Ur eutectic (𝜒ChCl = 0.33) were measured here with
exclusion of moisture. The results are shown in Table 6 and are compared to the
literature.14,30,31,1 Densities measured in this work fit to the linear relationship in Equation (1),
where a = −5.486 g cm-1 K-1 and b = 1.213 g cm-1, R2 =1.000.
d = aT + b (1)
Table 6. Viscosities and densities of the ChCl:Ur eutectic (𝜒ChCl = 0.33) as a function of
temperature at 99.5 kPaa
T/ K η / Pa·s T / K ρ /g cm-3
293.25 2.110 293.15 1.203
299.45 1.286 303.15 1.197
305.85 0.725 313.15 1.192
312.15 0.432 323.15 1.186
318.35 0.265 333.15 1.180
324.55 0.170 343.15 1.175
330.95 0.116 353.15 1.170
337.15 0.083 363.15 1.164
343.35 0.061 - -
349.55 0.046 - -
355.85 0.036 - -
18
362.05 0.027 - -
368.25 0.021 - -
aStandard uncertainties, u, of T, P, η and ρ are u(T) = 1.0 K, u(P) = 1.0 kPa, ur(η) = 0.035 and ur(ρ) = 0.003
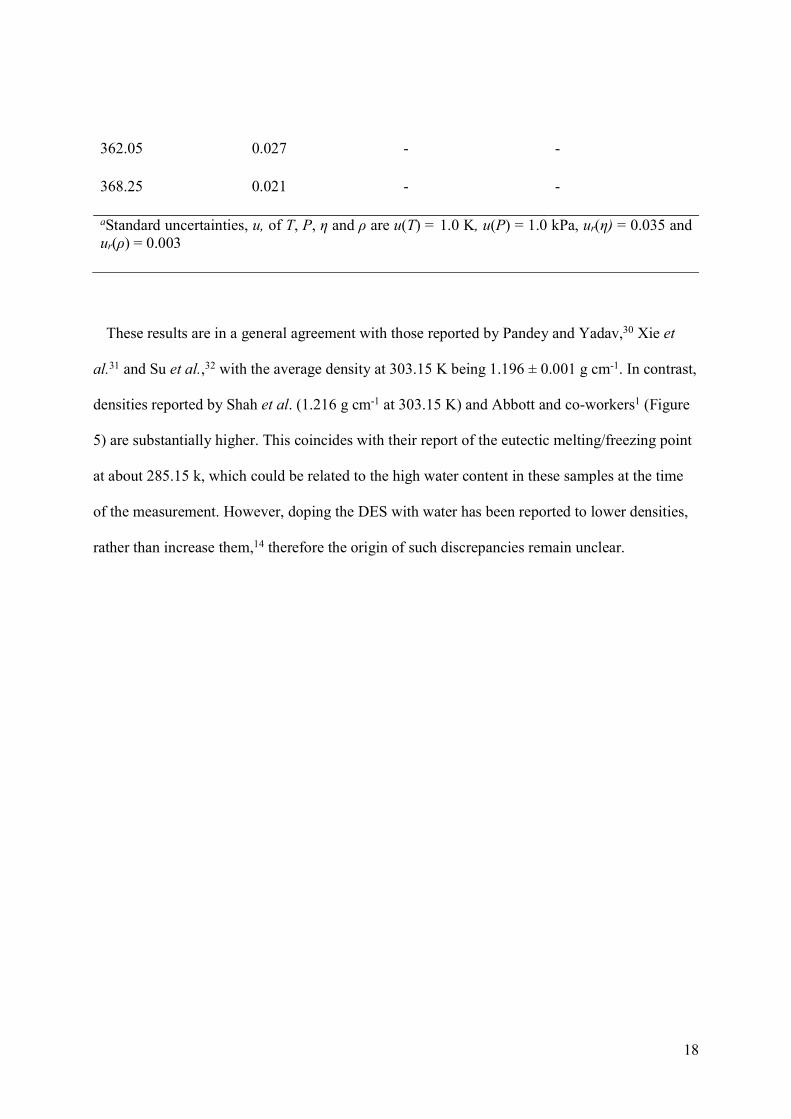
These results are in a general agreement with those reported by Pandey and Yadav,30 Xie et
al.31 and Su et al.,32 with the average density at 303.15 K being 1.196 ± 0.001 g cm-1. In contrast,
densities reported by Shah et al. (1.216 g cm-1 at 303.15 K) and Abbott and co-workers1 (Figure
5) are substantially higher. This coincides with their report of the eutectic melting/freezing point
at about 285.15 k, which could be related to the high water content in these samples at the time
of the measurement. However, doping the DES with water has been reported to lower densities,
rather than increase them,14 therefore the origin of such discrepancies remain unclear.
19
Figure 5. Comparison of density data recorded for the ChCl:Ur eutectic (𝜒ChCl = 0.33) as a function
of temperature in this work (■), by Abbott et al. (▲),1 Pandey and Yadav (■),30 Xie et al. (▲)31
Shah et al. (▲)14 and Su et al. (■).32
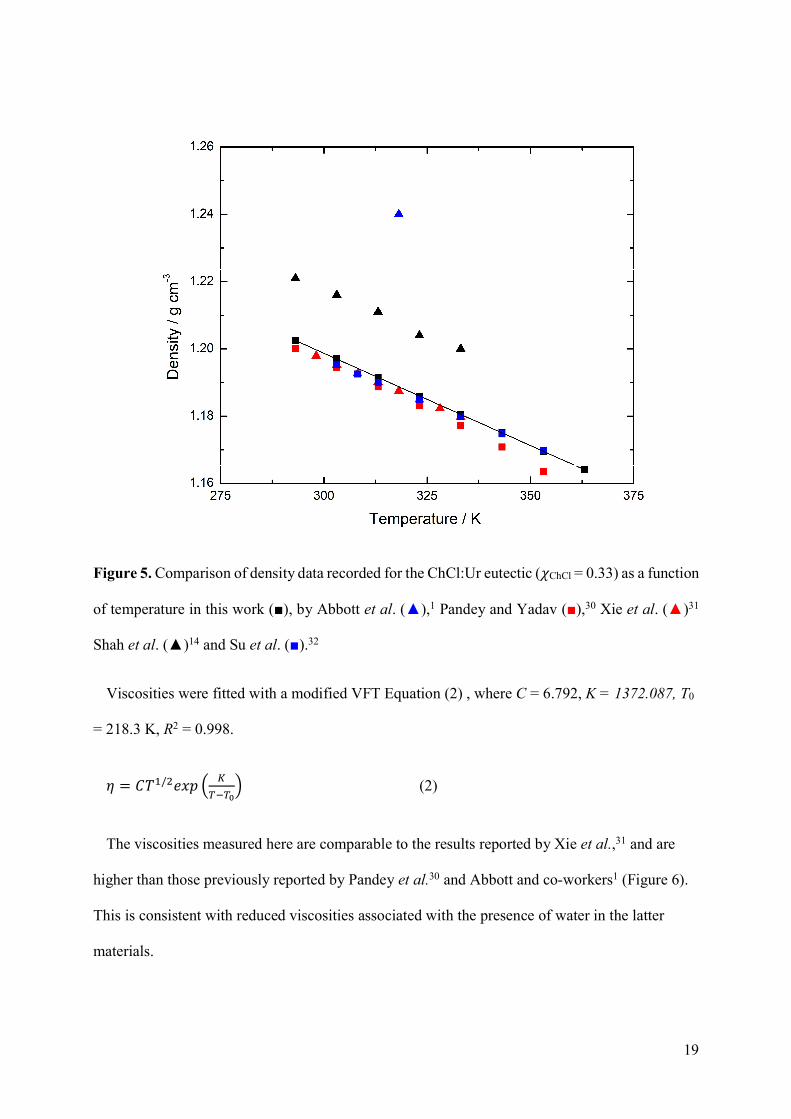
Viscosities were fitted with a modified VFT Equation (2) , where C = 6.792, K = 1372.087, T0
= 218.3 K, R2 = 0.998.
𝜂 = 𝐶𝑇 / 𝑒𝑥𝑝 (2)
The viscosities measured here are comparable to the results reported by Xie et al.,31 and are
higher than those previously reported by Pandey et al.30 and Abbott and co-workers1 (Figure 6).
This is consistent with reduced viscosities associated with the presence of water in the latter
materials.
20
Figure 6. Literature comparison of ln viscosity as a function of temperature for the χChcl = 0.33
ChCl:Ur DES, This publication, ■, Abbott et al.,1 ■, Pandey and Yadav,30 ■, Xie et al.,31 ■.
Thermal stability
Samples of ChCl:Ur exposed to elevated temperatures (353.15-363.15 k) for prolonged periods
of time have a strong ammoniacal odour, and crystalline solids deposit around the tops of vessels
that the materials are stored in. These observations were the basis of the initial assumption that
the thermal stability of the ChCl:Ur DES is poor. Thermal stability was studied in detail using
TGA at the two ChCl:Ur compositions, 𝜒ChCl = 0.33 and 0.67 (Figure 7).
21
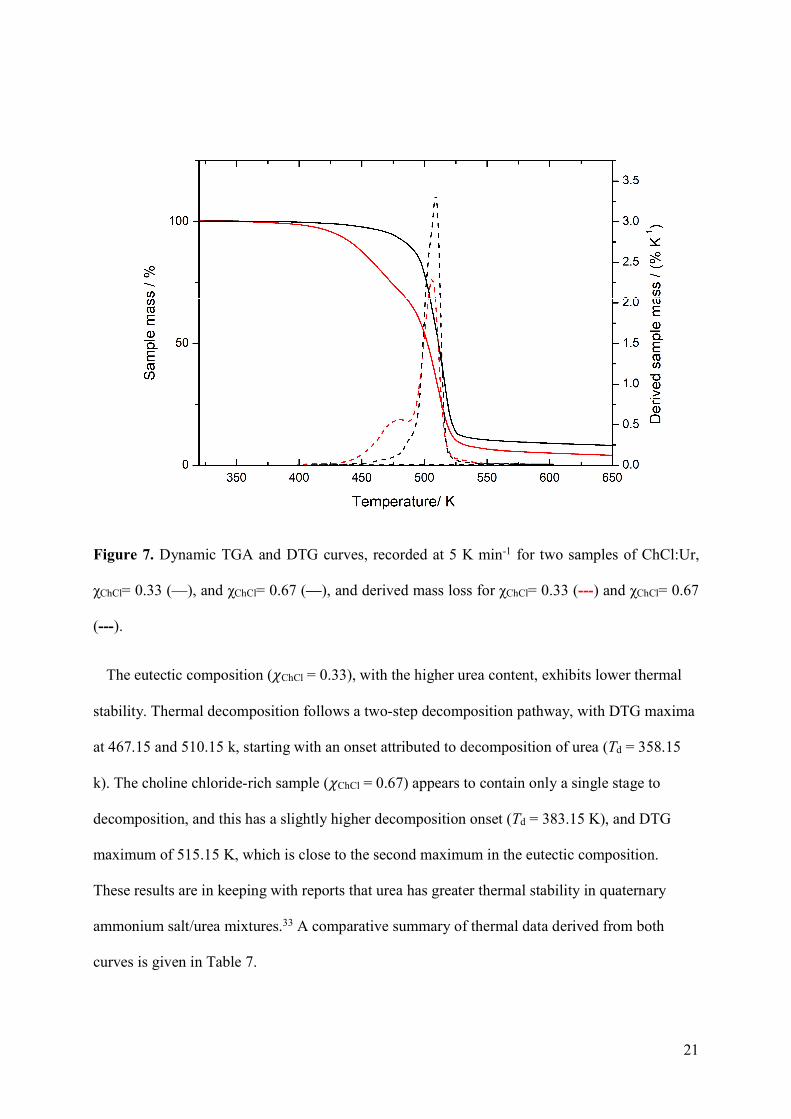
Figure 7. Dynamic TGA and DTG curves, recorded at 5 K min-1 for two samples of ChCl:Ur,
χChCl= 0.33 (—), and χChCl= 0.67 (—), and derived mass loss for χChCl= 0.33 (---) and χChCl= 0.67
(---).
The eutectic composition (𝜒ChCl = 0.33), with the higher urea content, exhibits lower thermal
stability. Thermal decomposition follows a two-step decomposition pathway, with DTG maxima
at 467.15 and 510.15 k, starting with an onset attributed to decomposition of urea (Td = 358.15
k). The choline chloride-rich sample (𝜒ChCl = 0.67) appears to contain only a single stage to
decomposition, and this has a slightly higher decomposition onset (Td = 383.15 K), and DTG
maximum of 515.15 K, which is close to the second maximum in the eutectic composition.
These results are in keeping with reports that urea has greater thermal stability in quaternary
ammonium salt/urea mixtures.33 A comparative summary of thermal data derived from both
curves is given in Table 7.
22
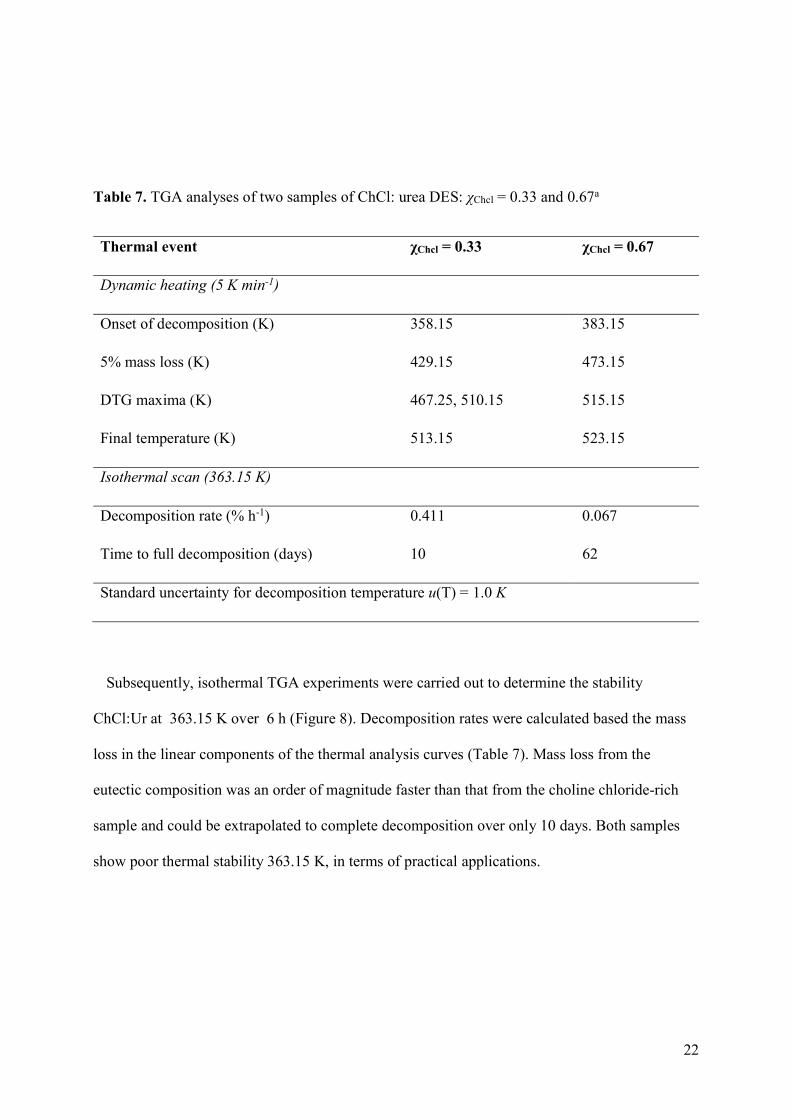
Table 7. TGA analyses of two samples of ChCl: urea DES: χChcl = 0.33 and 0.67a
Thermal event χChcl = 0.33 χChcl = 0.67
Dynamic heating (5 K min-1)
Onset of decomposition (K) 358.15 383.15
5% mass loss (K) 429.15 473.15
DTG maxima (K) 467.25, 510.15 515.15
Final temperature (K) 513.15 523.15
Isothermal scan (363.15 K)
Decomposition rate (% h-1) 0.411 0.067
Time to full decomposition (days) 10 62
Standard uncertainty for decomposition temperature u(T) = 1.0 K
Subsequently, isothermal TGA experiments were carried out to determine the stability
ChCl:Ur at 363.15 K over 6 h (Figure 8). Decomposition rates were calculated based the mass
loss in the linear components of the thermal analysis curves (Table 7). Mass loss from the
eutectic composition was an order of magnitude faster than that from the choline chloride-rich
sample and could be extrapolated to complete decomposition over only 10 days. Both samples
show poor thermal stability 363.15 K, in terms of practical applications.
23
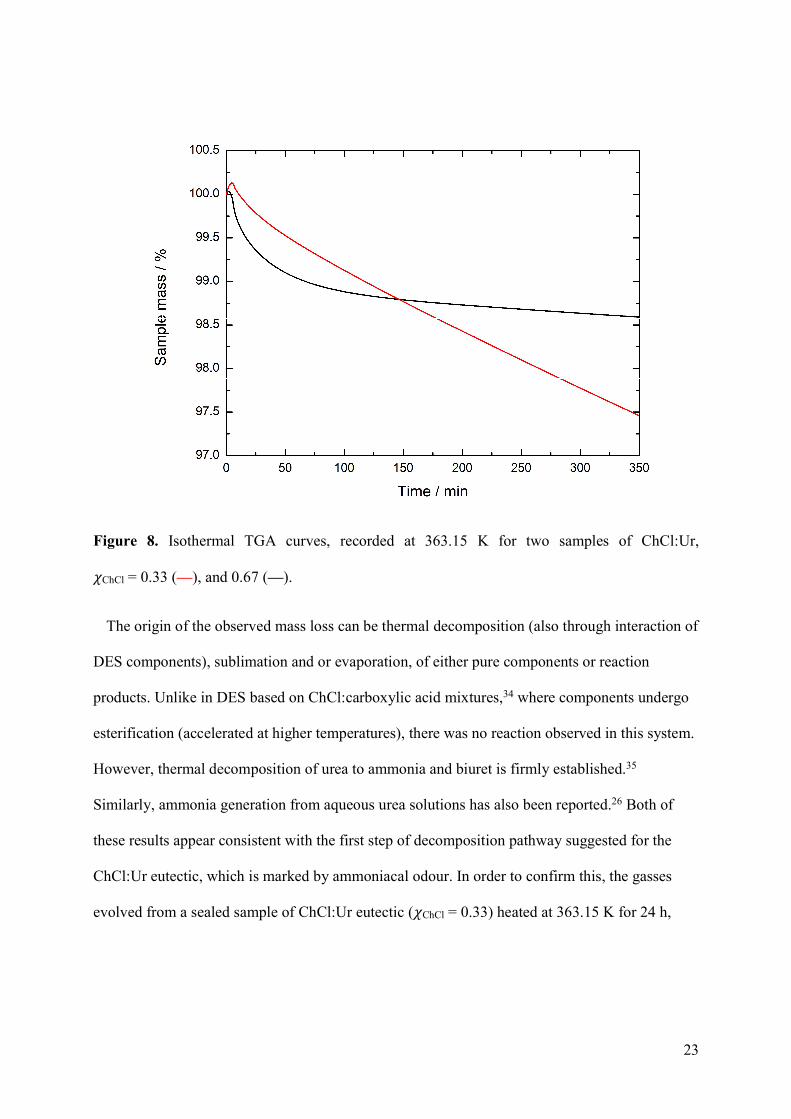
Figure 8. Isothermal TGA curves, recorded at 363.15 K for two samples of ChCl:Ur,
𝜒ChCl = 0.33 (—), and 0.67 (—).
The origin of the observed mass loss can be thermal decomposition (also through interaction of
DES components), sublimation and or evaporation, of either pure components or reaction
products. Unlike in DES based on ChCl:carboxylic acid mixtures,34 where components undergo
esterification (accelerated at higher temperatures), there was no reaction observed in this system.
However, thermal decomposition of urea to ammonia and biuret is firmly established.35
Similarly, ammonia generation from aqueous urea solutions has also been reported.26 Both of
these results appear consistent with the first step of decomposition pathway suggested for the
ChCl:Ur eutectic, which is marked by ammoniacal odour. In order to confirm this, the gasses
evolved from a sealed sample of ChCl:Ur eutectic (𝜒ChCl = 0.33) heated at 363.15 K for 24 h,
24
were analysed by GC-MS. The main component of the gaseous decomposition products was
found to be ammonia (m/z = 17).
Conclusions
A phase diagram for the low-moisture content ChCl:Ur system was constructed across the full
compositional range using DSC and POM to characterise the transitions. DSC gave very limited
insight into the phase behaviour, but more informative results were recorded using POM. The
eutectic melting point was found at 304.95 K, and a second phase transition, occurring at 351.62
K, was observed in the choline chloride-rich composition space and assigned as a crystal-crystal
transformation from α−ChCl to β−ChCl.28
Viscosities and densities, measured for the eutectic composition as a function of temperature,
were consistent with some literature reports,31,32 but were at odds with studies carried out on
samples that were not dried.1,14,30
Thermal stability of two ChCl:Ur compositions: the eutectic (𝜒ChCl = 0.33), and a choline
chloride-rich sample (𝜒ChCl = 0.67), was studied using TGA. Dynamic studies at 5 K min-1
revealed low decomposition onset in both samples, 358.15 and 383.15 K, respectively.
Isothermal studies have further confirmed thermal instability of both samples, with
decomposition rates at 363.15 K of 0.411 and 0.067 mass % per hour.
Acknowledgements
All authors thank Mrs Angela Brownlie for assistance with viscosity measurements and Mr
Phillip McCarron for GC-MS measurements.
25
AUTHOR INFORMATION
Corresponding Author
*E-mail: [email protected]
*E-mail: [email protected]
ORCID
Mark Gilmore: 0000-0003-3314-592X
Malgorzata Swadzba-Kwasny: 0000-0003-4041-055X
John D. Holbrey: 0000-0002-3084-8438
Funding
The authors acknowledge funding and support from the QUILL Research Centre (to MG).
Notes
The authors declare no competing financial interest.
REFERENCES
(1) Abbott, A. P.; Capper, G.; Davies, D. L.; Rasheed, R. K.; Tambyrajah, V. Novel Solvent
Properties of Choline Chloride/Urea Mixtures. Chem. Commun. (Camb). 2003, 1, 70–71.
(2) Alonso, D. A.; Chinchilla, R.; Pastor, I. M.; Ramón, D. J. Deep Eutectic Solvents : The
Organic Reaction Medium of the Century. European J. Org. Chem. 2016, 612–632.
(3) Škulcová, A.; Majová, V.; Šima, J.; Jablonský, M. Mechanical Properties of Pulp
26
Delignified by Deep Eutectic Solvents. BioResources 2017, 12 (4), 7479–7486.
(4) Smith, E. L.; Abbott, A. P.; Ryder, K. S. Deep Eutectic Solvents (DESs) and Their
Applications. Chem. Rev. 2014, 114 (21), 11060–11082.
(5) Abbott, A. P.; Ttaib, K. El; Frisch, G.; Mckenzie, K. J.; Ryder, K. S. Electrodeposition of
Copper Composites from Deep Eutectic Solvents Based on Choline Chloride. Phys. Chem.
Chem. Phys. 2009, 11, 4269-4277.
(6) Garcia-Alvarez, J. Deep Eutectic Mixtures : Promising Sustainable Solvents for Metal-
Catalysed and Metal-Mediated Organic. Eur. J. Inorg. Chem. 2015, 31, 5147–5157.
(7) Wagle, D. V; Zhao, H.; Baker, G. A. Deep Eutectic Solvents: Sustainable Media for
Nanoscale and Functional Materials. Acc. Chem. Res. 2014, 47, 2299-2308.
(8) Guo, W.; Wu, W.; Ren, S.; Tian, S.; Marsh, K. N. Separation of Phenol from Model Oils
with Quaternary Ammonium Salts via Forming Deep Eutectic Solvents. Green Chem. 2013,
15, 226–229.
(9) Garcia, G.; Aparicio, S.; Ullah, R.; Atilhan, M. Deep Eutectic Solvents: Physicochemical
Properties and Gas Separation Applications. Energy & Fuels 2015, 29, 2616–2644.
(10) Pang, K.; Hou, Y.; Wu, W.; Guo, W.; Marsh, K. N. Efficient Separation of Phenols from
Oils via Forming Deep Eutectic Solvents. Green Chem. 2012, 14, 2398-2401.
(11) Jablonský, M.; Andrea, Š.; Kamenská, L.; Vrška, M.; Šima, J. Deep Eutectic Solvents :
Fractionation of Wheat Straw. BioResources 2015, 10 (4), 8039–8047.
(12) Meng, X.; Ballerat-Busserolles, K.; Husson, P.; Andanson, J.-M. Impact of Water on the
27
Melting Temperature of Urea + Choline Chloride Deep Eutectic Solvent. New J. Chem.
2016, 40 (5), 4492–4499.
(13) Morrison, H. G.; Sun, C. C.; Neervannan, S. Characterization of Thermal Behavior of Deep
Eutectic Solvents and Their Potential as Drug Solubilization Vehicles. Int. J. Pharm. 2009,
378 (1–2), 136–139.
(14) Shah, D.; Mjalli, F. S. Effect of Water on the Thermo-Physical Properties of Reline : An
Experimental and Molecular Simulation Based Approach. Phys. Chem. Chem. Phys. 2014,
16, 23900-23907.
(15) Seddon K, Stark A, T. M. Viscosity and Density of 1-Alkyl-3-Methylimidazolium Ionic
Liquids. In Clean Solvents; 2002; pp 34–49.
(16) Zhu, A.; Jiang, T.; Han, B.; Zhang, J.; Xie, Y.; Ma, X. Supported Choline Chloride / Urea
as a Heterogeneous Catalyst for Chemical Fixation of Carbon Dioxide to Cyclic Carbonates.
Green Chem. 2007, 9 (2), 169–172.
(17) Yadav, U. N.; Shankarling, G. S. Synergistic Effect of Ultrasound and Deep Eutectic
Solvent Choline Chloride – Urea as Versatile Catalyst for Rapid Synthesis of β -
Functionalized Ketonic Derivatives. J. Mol. Liq. 2014, 195, 188–193.
(18) Sirviö, J. A.; Visanko, M.; Liimatainen, H. Deep Eutectic Solvent System Based on Choline
Chloride-Urea as a Pre-Treatment for Nanofibrillation of Wood Cellulose. Green Chem.
2015, 17 (6), 3401–3406.
(19) Hammond, O. S.; Edler, K. J.; Bowron, D. T.; Torrente-murciano, L. Deep Eutectic-
Solvothermal Synthesis of Nanostructured Ceria. Nat. Commun. 2017, 8 (May 2016), 1–7.
28
(20) Cooper, E. R.; Andrews, C. D.; Wheatley, P. S.; Webb, P. B.; Wormald, P.; Morris, R. E.
Ionic Liquids and Eutectic Mixtures as Solvent and Template in Synthesis of Zeolite
Analogues. Nature 2004, 430, 1012–1016.
(21) Parnham, E. R.; Drylie, E. A.; Wheatley, P. S.; Slawin, A. M. Z.; Morris, R. E. Ionothermal
Materials Synthesis Using Unstable Deep-Eutectic Solvents as Template-Delivery Agents.
Angew. Chem - Int. Ed. 2006, 45, 4962–4966.
(22) Carriazo, D.; Guti, M. C.; Ferrer, M. L.; Monte, F. Resorcinol-Based Deep Eutectic Solvents
as Both Carbonaceous Precursors and Templating Agents in the Synthesis of Hierarchical
Porous Carbon Monoliths. Chem. - A Eur. J. 2010, 22 (3), 6146–6152.
(23) Liao, H.; Jiang, Y.; Zhou, Z.; Chen, S.; Sun, S. Shape-Controlled Synthesis of Gold
Nanoparticles in Deep Eutectic Solvents for Studies of Structure – Functionality
Relationships In. Angew. Chem 2008, 120, 9240–9243.
(24) Zhao, H.; Baker, G. A.; Holmes, S. Journal of Molecular Catalysis B : Enzymatic. "Journal
Mol. Catal. B, Enzym. 2011, 72 (3–4), 163–167.
(25) Messa, F.; Perrone, S.; Capua, M.; Tolomeo, F.; Troisi, L.; Salomone, A. Towards a
Sustainable Synthesis of Amides : Eutectic Solvents †. Chem. Commun. 2018, 4 (54), 8100–
8103.
(26) Chen, J. P.; Isa, K. Thermal Decomposition of Urea and Urea Derivatives by Simultaneous
TG/(DTA)/MS. J. Mass Spectrom. Soc. Jpn. 1998, 46 (4), 299-303.
(27) Mirny, V. N.; Prisyazhny, V. D.; Pushkarev, V. A. Hydrogen-Bond and Thermal-Stability
of Mixed Carbamide Melts and Ammonium Halogenides. Ukr. Khim. Zh. (Russian Ed.)
29
1987, 53, 1027-1029.
(28) Petrouleas, V.; Lemmon, R. M. X-Ray Diffraction Study of Choline Chloride’s β Form. J.
Chem. Phys. 1978, 68, 2243-2246.
(29) Jacquemin, J.; Husson, P.; Padua, A. A. H.; Majer, V. Density and Viscosity of Several Pure
and Water-Saturated Ionic Liquids. Green Chem. 2006, 8 (2), 172-180.
(30) Yadav, A.; Pandey, S. Densities and Viscosities of (Choline Chloride + Urea) Deep Eutectic
Solvent and Its Aqueous Mixtures in the Temperature Range 293.15 K to 363.15 K. J.
Chem. Eng. Data 2014, 59 (7), 2221–2229.
(31) Xie, Y.; Dong, H.; Zhang, S.; Lu, X.; Ji, X. Effect of Water on the Density , Viscosity , and
CO 2 Solubility in Choline Chloride / Urea. J. Chem. Eng. Data 2014, 59, 3344–3352.
(32) Su, W. C.; Shan, D.; Wong, H.; Li, M. H. Effect of Water on Solubility of Carbon Dioxide
in (Aminomethanamide+2-Hydroxy-N, N ,N -Trimethylethanaminium Chloride ). J. Chem.
Eng. Data 2009, 54, 1951–1955.
(33) Delgado-mellado, N.; Larriba, M.; Navarro, P.; Rigual, V.; Ayuso, M.; García, J.;
Rodríguez, F. Thermal Stability of Choline Chloride Deep Eutectic Solvents by TGA /
FTIR-ATR Analysis. J. Mol. Liq. 2018, 260, 37–43.
(34) Rodriguez Rodriguez, N.; Van den Bruinhorst, A.; Kollau, L. J. B.; Kroon, M. C.;
Binnemans, K. Degradation of Deep-Eutectic Solvents Based on Choline Chloride and
Carboxylic Acids. ACS Sustain. Chem. Eng. 2019, 7, 11521–11528.
(35) Schaber, P. M.; Colson, J.; Higgins, S.; Thielen, D.; Anspach, B.; Brauer, J. Thermal
Decomposition (Pyrolysis) of Urea in an Open Reaction Vessel. Thermochim. Acta 2004,
30
424 (1–2), 131–142.
Related Documents