Research Collection Doctoral Thesis Toluene removal from waste air by combined biological and non- thermal plasma techniques Author(s): Sjöberg, Anders Publication Date: 1999 Permanent Link: https://doi.org/10.3929/ethz-a-002093505 Rights / License: In Copyright - Non-Commercial Use Permitted This page was generated automatically upon download from the ETH Zurich Research Collection . For more information please consult the Terms of use . ETH Library

Welcome message from author
This document is posted to help you gain knowledge. Please leave a comment to let me know what you think about it! Share it to your friends and learn new things together.
Transcript

Research Collection
Doctoral Thesis
Toluene removal from waste air by combined biological and non-thermal plasma techniques
Author(s): Sjöberg, Anders
Publication Date: 1999
Permanent Link: https://doi.org/10.3929/ethz-a-002093505
Rights / License: In Copyright - Non-Commercial Use Permitted
This page was generated automatically upon download from the ETH Zurich Research Collection. For moreinformation please consult the Terms of use.
ETH Library

Diss. ETH Nr. 13092
Toluene Removal from Waste Air byCombined Biological and Non-Thermal
Plasma Techniques
Dissertation submitted to the
SWISS FEDERAL INSTITUTE OF TECHNOLOGY (ETH) ZÜRICH
for the degree of
Doctor of Technical Sciences
Presented by
Anders Sjöberg
Dipl.-Chem. Ing., Lunds Tekniska Högskola, Lund
Born August 20, 1968
Citizen of Sweden
Accepted on the recommendation of
Prof. Dr. K. Hungerbühler, examiner
Prof. Dr. E. Heinzle, co-examiner
Dr. T. H. Teich, co-examiner
Zürich 1999

Danksagung
Als Erinnerung meiner Dissertationszeit wird nicht die Arbeit bleiben,
sondern die Menschen, welche ich während meiner Dissertation
kennengelernt habe und die mich unterstützt haben, meine Dissertation
fertig zu schreiben. Ausser der grössten Unterstützung und Freude meines
Lebens, die nicht namentlich erwähnt werden möchte, bin ich einer
ganzen Reihe von Menschen zu speziellem Dank verpflichtet.
Ein besonderer Dank an Professor Konrad Hungerbühler, der meine
Dissertation ermöglicht hat und mich während der ganzen Zeit mit Rat
und Tat, sowie mit speditivem Durchlesen verschiedener Manuskripte
unterstützt hat.
Speziellen Dank an Elmar Heinzle, der diese Arbeit initiiert hat und mich
weiterhin betreut hat, obwohl es ihn in den fernen Norden gezogen hat.
Seine Anregungen und vielen kreativen Ideen haben über weite Bereiche
zum Inhalt und zur Gestaltung meiner Dissertation beigetragen.
Ein grosser Dank an Timm Teich, der das Koreferat übernommen hat
und alle Manuskripte mit zeitaufwendiger Genauigkeit geprüft hat. Er hat
mich mit seinem grossen Fachwissen durch die Welt des Plasmas geführtund die "Plasmakapitel" wesentlich mitbeeinflusst.
Vielen Dank an Franz Mayer und Oemer Kut, die mich in täglichen
Gesprächen aufgemuntert und unterstützt haben. Danke an Franz Mayer
für die Hilfe mit analytischen und anderen praktischen Problemen und
Danke an Oemer Kut für das Durchlesen aller Manuskripte, die
Literaturrecherchen und alle guten Hinweise zu meiner Arbeit.
Hr. Rohrer und Hr. Rafflenbeul möchte ich für interessante Diskussionen
und Anregungen danken.
Max Wohlwend hat nicht nur nach der SOLA-Stafette gezaubert, sondern
hat auch in seiner Elektronikwerkstatt kleine elektronische Wunder
vollbracht: Danke!
Das Werkstatt-Team hat mir sehr geholfen beim Bauen verschiedener
Geräte und ich möchte Hr. Seinecke, Pascal Corrodi und Peter Steiner für
die gute Zusammenarbeit danken.
Danke an Francois Nilles, Richard Sherry und Cristina Maria, die mit
ihren Arbeiten einige Seiten zu meiner Disseration beigetragen haben.

Auch Danke an Patrik Rüdiger, der immer für eine gute Diskussion bereit
war und mir wichtige Hinweise gegeben hat.
Ein kollektives Danke an alle, die zum offenen und angenehmen
Arbeitsklima beigetragen haben. Für das speziell gute Büroklima waren
nicht nur die vielen Pflanzen, sondern auch Gerald Jödicke und Christoph
Blickenstorfer verantwortlich.
Danke an meinen Vater, der mir Schwedisch wieder beigebracht hat.
Ganz zuletzt einen Dank an die SBB, die mich während meiner
Dissertation ohne grössere Intermezzi zweimal rund um die Erde
transportiert hat.

Abstract 1
Zusammenfassung 2
Sammanfattning3
1. Introduction 4
1.1 Industrial Waste Gas Treatment Techniques 4
1.1.1 General Overview 4
1.1.2 Non-Thermal Plasma 8
1.1.3 Biological Waste Gas Treatment 10
1.2 Scope of this Thesis 12
1.2.1 Problem Definition 12
1.2.2 Aims12
1.2.3 Research Procedure 13
2. Fundamentals1 4
2.1 Bio-Trickling Filter 14
2.1.1 Biofilm15
2.1.2 Toluene Biodegradation16
2.1.3 Biodegradation Kinetics 18
2.1.4 Diffusion19
2.1.5 Gas-Liquid Mass Transfer 19
2.2 Non-Thermal Plasma 21
2.2.1 Dielectric Barrier Discharge 22
2.2.2 Mechanism of Gas Phase Toluene Oxidation by Electrical
Discharge23
2.2.3 Kinetics of the Gas Phase Oxidation 27
2.2.4 Reactions with Ozone in Aqueous Solution 29
3. Material and Methods 32
3.1 Experimental Set-Up32
3.1.1 Bio-Trickling Filter 32

3.1.2 Non-Thermal Plasma Reactor 36
3.1.3 Ozonation Batch Reactor 42
3.2 Analytical Methods 43
3.2.1 Gas Chromatography-Mass Spectrometry (GC-MS) 43
3.2.2 Ion Chromatography (IC) 44
3.2.3 Total Organic Carbon (TOC) 45
3.2.4 On-line Mass Spectrometry (MS) 45
3.2.5 Analytical Methods Used for Analysing the Aerosol Deposit 46
3.2.6 Simulation Software 47
3.3 Short Cut Life Cycle Assessment 47
4. Bio-Trickling Filter: Experimental Results 50
4.1 Characterisation of the Bio-Trickling Filter 51
4.1.1 Biomass Accumulation 51
4.1.2 Pressure Drop 52
4.1.3 Liquid Hold-Up 54
4.1.4 Oxygen Limitation 54
4.1.5 Carbon Mass Balance 55
4.1.6 Toluene Concentration Profiles 57
4.2 Elimination Capacity at Steady Inlet Gas Conditions 59
4.3 Elimination Capacity at Fluctuating Load 61
4.3.1 C02 Production under Dynamic Conditions 62
4.4 Discussion 64
5. Non-Thermal Plasma: Experimental Results and
Proposed Reaction Pathways 66
5.1 Removal Efficiency in the Dibarrier Discharge
Reactor 66
5.2 Inorganic By-Products Formed 68
5.3 Toluene Oxidation Products and Reaction Mechanism 69
5.3.1 Intermediate Oxidation Products Formed in the Gas Phase 70
5.3.2 Aerosol Formation 73

5.3.3 Proposed Reaction Pathways for the Gas Phase Oxidation 74
5.3.4 Intermediate Oxidation Products Formed by Ozonation in
Aqeous Solution 78
5.3.5 Proposed Reaction Pathways in Aqueous Solution 80
5.4 Discussion 83
6. Modelling 85
6.1 Ideal Reactor Models 85
6.1.1 The Continuously Stirred Tank Reactor 85
6.1.2 The Tubular Reactor 86
6.2 The Bio-Trickling Filter Model 86
6.2.1 The Steady-State One Phase Model 87
6.2.2 The Dynamic One Phase Model 90
6.2.3 The Dynamic Three-Phase Biofilm Model 94
6.2.4 Simulation of the C02 Production Using the Dynamic
Three Phase Model 98
6.2.5 Simulation of the C02 Production Using the Dynamic
Three Phase Model with Two Biofilm Layers 105
6.2.6 Discussion 107
6.3 The Non-Thermal Plasma Model 109
6.3.1 Mass Balances of the Steady-State Model 109
6.3.2 Simulation of the Toluene Removal 112
7. Scale-Up Evaluation 115
7.1 The Bio-Trickling Filter 116
7.1.1 Economic Assessment 117
7.1.2 Ecological Assessment 122
7.1.3 Sensitivity Analysis 124
7.2 The Non-Thermal Plasma 125
7.2.1 Economic Assessment 127
7.2.2 Ecological Assessment 130
7.2.3 Sensitivity Analysis 132
7.3 Bio-Trickling Filter Combined with Non-Thermal
Plasma 133
7.3.1 Case Study 1: Fluctuating Toluene Concentration 133
7.3.2 Case Study 2: Toluene in Mixture with Acetone 135
7.4 Discussion 136
8. Concluding Remarks 137
Symbol and Abbrevations 143
References 147
Appendix 162

1
Abstract
The bio-trickling filter and the non-thermal plasma are two oxidative
treatment techniques for waste gas streams with low concentrations of
volatile organic compounds (VOC). The low energy consumption of the
bio-trickling filter and the high flexibility of the non-thermal plasmamake a combination of the two techniques attractive, especially for the
treatment of waste gas streams with fluctuating load and composition. The
two systems were experimentally investigated using toluene as a model
compound to gain an understanding of the governing physical, chemical
and biological processes and to determine their energy efficiencies which
have to be taken into account for the evaluation of full scale plants.
The elimination capacity of the bio-trickling filter was limited by the
biological degradation rate. The measured CO2 production under transient
conditions could be described by a dynamic mathematical model including
substrate inhibition kinetics and biofilm diffusion. The numerical
simulation indicated that the biological activity is located in a thin upper
layer of the biofilm and that the lower layers act as sorption volume for
toluene.
Toluene was mineralised in a dibarrier discharge reactor via several
intermediate products, mainly organic acids and aldehydes. Comparison
with the ozonation products of toluene in aqueous solution strongly
suggested that oxidation pathways known for organic compounds in the
aqueous solution are also applicable for the gas phase oxidation. The
energy efficiency of the dibarrier discharge reactor could be described bythe ße-value (Rosocha et al., 1993), which depended on the toluene
concentration and the air humidity.
The economic and ecological evaluation of a full scale bio-trickling filter
and a dibarrier discharge reactor showed that the bio-trickling filter is
more efficient than the non-thermal plasma for purifying toluene-
containing waste gas streams. The economic working range of the bio-
trickling filter is limited to toluene concentrations lower than 1 g m-3. A
combined bio-plasma system may be advantageous in some special cases
for the purification of waste gas streams with fluctuations in load and
composition or with mixtures of well and poorly biodegradable
compounds.

2
Zusammenfassung
Der Bio-Trickling Filter und das nicht-thermische Plasma sind zwei
oxidative Abluftreinigungsverfahren für Abluftströme mit tiefen Konzen¬
trationen flüchtiger organischer Stoffe (VOC). Der tiefe Energieverbrauchdes Bio-Trickling Filters und die hohe Flexibilität des nicht-thermischen
Plasmas macht eine Kombination der beiden Verfahren interessant,
insbesondere für die Behandlung von Abluftströmen schwankender
Zusammensetzung und Konzentration. Die beiden Verfahren wurden mit
Toluol als Modellsubstanz experimentell untersucht, um die vorherrschenden
physikalischen, chemischen und biologischen Vorgänge besser zu verstehen.
Weiter wurden die Energieeffizienzen der beiden Verfahren bestimmt, die
für die Evaluation im grossen Masstab notwendig sind.
Die Abbaukapazität des Bio-Trickling Filters ist durch die biologische
Abbaugeschwindigkeit limitiert. Die gemessene CC^-Produktion konnte auch
mittels eines dynamischen mathematischen Modells mit Substrat-
inhibierungskinetik und Biofilmdiffusion beschrieben werden. Die
numerische Simulation deutete auf die Existenz einer oberen Biofilmschicht
mit hoher biologischer Aktivität und eine untere Sorptionsschicht für Toluol.
Toluol wurde im Barrieren-Entladungsreaktor auf dem Wege über mehrere
Zwischenprodukte, hauptsächlich Aldehyde und organische Säuren,
mineralisiert. Ein Vergleich zwischen diesen Zwischenprodukten und den
Ozonierungssprodukten von Toluol in der wässrigen Phase lässt auf ähnliche
Abbauwege für die Oxidation organischer Stoffe in der Gasphase schliessen.
Die Energieeffizienz des Barrieren-Entladungsreaktors konnte mittels des ße-Wertes beschrieben werden (Rosocha et al., 1993). Der ße-Wert war von der
Toluolkonzentration und die Luftfeuchte abhängig.
Die ökonomische und ökologische Evaluation bei Anwendung in grossem
Masstab zeigte, dass für die Reinigung toluolbeladener Abluftströme tiefer
Konzentration der Bio-Trickling Filter effizienter war als das nicht¬
thermische Plasma. Der ökonomische Arbeitsbereich des Bio-Trickling
Filters ist auf Toluol-Konzentrationen unter 1 g m-3 beschränkt. Eine
Kombination der beiden Verfahren kann für die Reinigung von
Abluftströmen schwankender Konzentration sowie für Abluftströme mit
Stoffgemischen unterschiedlicher biologischer Abbaubarkeit vorteilhaft sein.

3
Sammanfattning
Biotricklingfilter och icke-termiskt plasma är tvâ oxiderande metoder för
rening av luft med lâga koncentrationer av flyktiga organiska ämnen
(VOC). Genom att kombinera de tvâ luftreningsmetoderna kan man dra
fördel av biotricklingfiltrets lâga energiförbrukning och den icke-
termiska plasmans höga flexibilitet, speciellt vid rening av luft, dar
sammansättning och koncentrationer av VOC fluktuerar. För att bättre
första de styrande fysiska, kemiska och biologiska processerna
undersöktes de tvâ luftreningsmetoderna expérimentent med toluol som
modellsubstans. Även luftreningsmetodernas energiförbrukning
bestämdes, vilket gjorde det möjligt att bedöma förutsättningarna för
anläggningar i full skala.
Biotricklingfiltrets nedbrytningskapacitet begränsades av den biologiska
nedbrytningshastigheten. Produktionen av CO2 mattes under dynamiska
förhallanden och künde beskrivas med hjälp av substratinhiberingskinetikoch biofilmdiffusion i en dynamisk matematisk modell. Den numeriska
simuleringen visade att biofilmen förmodligen bestod av ett tunt övre
skikt med en hög biologisk aktivitet samt ett undre skikt som lagrade
toluol och fungerade som en toluolbuffert för den biologiska
nedbrytningen.
Toluol oxiderades till CO2 och vatten i den icke-termiska plasman via
fiera organiska mellanprodukter, huvudsakligen aldehyder och organiska
syror. En jämförelse mellan dessa mellanprodukter och de frân ozonering
av toluol i vattenfas visar, att nedbrytningsvägarna för toluol i vattenfas
med största sannolikhet även gäller för nedbrytning av toluol i gasfas.Den icke-termiska plasmans energiförbrukning künde beskrivas med ße
(Rosocha et al., 1993), vars värde berodde pâ toluolkoncentrationen och
luftfuktigheten.
Den ekonomiska och ekologiska bedömningen av biotricklingfiltret och
icke-termiska plasman i full skala visade, att biotricklingfiltret är mer
effektivt an den icke-termiska plasman för rening av luft innehâllande
toluol. Biotricklingfiltrets ekonomiska arbetsomräde är begränsad tili
toluolkoncentrationer lägre an 1 g m-3. Ett kombinerat bioplasmasystemkan i vissa fall vara fördelaktigt för rening av luft med fluktuerande
sammansättningar och koncentrationer av VOC eller för rening av luft
med blandningar av biologiskt lätt- och svärnedbrytbara ämnen.

4
1. Introduction
Waste gas streams are produced by human activities, i.e. from industry,
traffic, farming and private households. They are usually air streams
containing organic and/or inorganic compounds which are toxic or may
affect the environment in different ways, for instance by causing global
warming, formation of acid rain and smog, depletion of ozone layer,
unacceptable odours, etc.
An important group of waste gas compounds are non-methane volatile
organic compounds (NMVOC, below only referred to as VOC) which are
precursors of ozone and smog formation in the troposphere (Seinfeld,
1986). They may also contribute to the global warming and may be
directly harmful to human health even at low concentrations. The major
source of VOC emissions are industrial processes from where emissions
increased exponentially from early industrialisation until 1980 when
legislation was passed to force industry to reduce them (Evans, S., 1996).
Emissions have now stabilised but efforts are made to reduce them to the
levels of 1960 by replacing industrial processes and products by new ones
from which VOC emissions are reduced or even eliminated (Schnitzer,
1998; Hungerbühler et al., 1999). Until these novel processes have been
developed and implemented, emissions have to be reduced to meet legallimits by using different waste gas purification techniques (end-of-pipe
solutions) where VOCs are recycled or oxidised preferably into carbon
dioxide and water. The numerous processes governing the performance of
these purification techniques are poorly understood and they need to be
optimised to reduce energy consumption and increase removal capacity.
1.1 Industrial Waste Gas Treatment Techniques
1.1.1 General Overview
Chemical industry, painting facilities, food industry etc. are major sources
of VOC emissions to the atmosphere. VOCs are mainly used as solvents or
as reactants or they may be formed in chemical processes as by-products.
They escape to the atmosphere also from diffuse sources, such as leaking
pumps, or from specific processes, for instance drying.

5
Waste gas streams containing separable and recyclable compounds can be
treated with regenerative techniques, that is condensation, absorption,adsorption and membrane techniques (Reschke and Mathews, 1995).Before recycling, removed waste gas compounds often have to be treated
in additional process steps, for instance by distillation. Pollutants in
diluted waste gas streams or mixtures of waste gas compounds which
cannot be recycled economically must be destroyed. Oxidative techniquesare thermal oxidation, absorption with chemical oxidation, non-thermal
plasma and biological oxidation. All of the techniques mentioned above
can be used economically only in specific ranges of VOC concentrations
and waste gas flow rates (Table 1.1). Other factors limit the working
range too, such as waste gas temperature and the presence of inert
compounds or inhibiting compounds which can reduce the overall
removal capacity. The flexibility towards fluctuations in load and
composition varies between the different waste gas treatment techniques,where biological techniques have the lowest flexibility and incineration
has the highest (Table 1.1).
Selecting an end-of-pipe solution for a certain waste gas problem is
ultimately a compromise between what is technically feasible (must be
able to reduce emissions to meet legal limits) and the most economical
solution. The legal limits in Switzerland are set by the Swiss Clean Air
Act (LRV, 1985). It divides the VOCs into three different classes
according to their hazard to the environment and human health (Table
1.2). VOC emissions are limited by concentration if the mass flow exceeds
a specified limit. If the waste gas contains several compounds of the same
class, the sum of the individual concentrations is not allowed to exceed the
limit of that class. If the waste gas contains compounds of different
classes, the limits of the individual classes must be met and the total
concentration must not exceed 150 mg nr3.

6
Table 1.1. Comparison of oxidative waste gas purification techniquesfor diluted waste gas streams.
Concentration Air flow Energy consumption Flexibility11Process [g nr3] [1000m3h-!] [Wh m-3] comp./load
Non-thermal Plasma:
- Barrier Discharge3 <1 0.5-100 l-1300d 0/++
- Corona Discharge13 n.aj n.aj 4-154d 0/++
- Electron Beamc <0.3e n.a. l-24d 0/++
Incineration:
- Regenerativef 1-10 >2 2-30 ++/+
- Catalyticf 1-10 >2 2-30 +/++
Biological oxidation
- Bio-scrubberf <l-3 1-50 0.3-3 -/+
- Bio-trickling filter -/o
- Biofilter -/-
Rotor-adsorberS <2 10-250 2-5 +/+
Adsorptionf 1-25 >1 2-30 +/+
a (Evans, D. et al., 1993; Rosocha et al, 1993; Rohrer, 1996), b (Penetrante et al,
1996), c (Paur, 1993; Penetrante et al, 1996; Vitale et al, 1996),d Values calculated for
90% removal., e (Paur, 1993), f (Ciba, 1995), g Rotamill, Siegen, Germanyh Flexibility towards fluctuating composition (comp.) and load, - poor, 0 moderate, +
good, ++ very good, J In general, similar to barrier discharge but tolerant of dust and
condensation; energy efficiency similar or lower than barrier discharge.
n.a. no data available
Table 1.2. Emission limits of mass flow and concentration of VOCs
according to the Swiss Clean Air Act (LRV, 1985).
Class Examples of VOC Mass flow [kg h-1] Concentration [mg nr3]
1 dichloromethane 0.1 20
perchloroethylene2 toluene 2.0 100
xylene3 isopropanol 3.0 150
diethyl ether

7
Incineration
Thermal combustion is used economically only with VOC concentrations
of 10 g m-3 and higher. Combustion takes place between 750 and 900°C
usually with supplementary energy depending on the heat value of the
waste gas and on the raw gas temperature. Catalytic and regenerativecombustion takes place at 300-600°C and may already be run without
supplementary furnace gas at VOC concentrations of 0.8-3 g m-3 by pre¬
heating the inlet gas with the heat from the off gas (Carlowitz, 1996). The
catalyst is, however, subject to poisoning from sulphur, phosphor and
halogen containing compounds. Development of new catalysts has made
catalytic incineration of chlorinated compounds possible (Krumbäck,
1996) where hydrogen chloride (HCl) produced is removed in a scrubber.
Incineration is flexible towards fluctuations in load and composition but
needs supplementary furnace gas at low calorific value of the pollutant.
Adsorption
Adsorption is a batch operation where the waste gas compounds are first
enriched on the surface of a porous material (adsorbent) such as activated
carbon, molecular sieves (zeoliths) or polymer materials, until
equilibrium with the gas-phase is reached. Depending on the nature of the
adsorbed molecules, they can be desorbed with temperature or pressure
swing, with extraction or with steam (<500°C). Mixtures of desorbed
compounds can be recycled after treatment in a second process step, such
as distillation. If desorption is not possible, the adsorbent must be
regenerated oxidatively. Regeneration of the adsorbent is made with steam
at 850°C or with other oxidative reagents such as ozone (Shugarman,
1991). Adsorption is used for a wide range of substances and is flexible
towards fluctuations in load.
Absorption
Absorption is a continuous operation where VOCs are dissolved in a high
boiling point solvent, such as polyglykolether or silicon oil. The liquid is
usually distributed over a packing and is regenerated through distillation,
extraction, temperature or pressure swing. Desorbed waste gas

8
compounds can be recycled. Absorption is a flexible technique towards
peak loads but is limited to readily soluble compounds.
Many odorous substances, such as organic sulphur, nitrogen and
oxygenated compounds as well as nitrogen oxides (NOx), hydrogen
sulphide (H2S) and ammonia (NH3) which can be absorbed in water, can
simultaneously be oxidised in the aqueous phase. Oxidising agents are
ozone (O3), hydrogen peroxide (H2O2), potassium permanganate
(KMnOzO as well as sodium hypochlorite and sodium chlorite (NaOCl and
NaClÛ2) which produce different salts, carbon dioxide (CO2) and water as
end products (VDI, 1995). Advantages of the oxidative absorption is a
higher absorption capacity compared to physical absorption but toxic and
caustic substances must be handled and the absorption liquid must be
safely disposed of.
Heterogeneous photocatalysis using UV/TÎ02
Light in the near UV region with a wavelength <350nm can be used to
excite electrons in a semiconductor, usually titanium dioxide (TiÛ2).
Excited electrons migrate to the catalyst surface where they may react
with adsorbed gas molecules. Energy consumption may be low for certain
compounds but an economic evaluation of large scale plants is difficult to
make because most research has been done in small laboratory scale
reactors (Al-Ekabi et al., 1993). Today UV/Ti02 is mainly used for
indoor applications with very low waste gas concentrations.
1.1.2 Non-Thermal Plasma
Non-thermal plasma has been used for ozone generation for about 100
years and is now also emerging as a technique for the purification of low
concentration waste gas streams (Penetrante, 1993). The aim is to put the
energy mainly into generating highly energetic electrons which react with
matrix gas components, thus creating highly reactive radicals and excited
species at ambient gas temperature. At high VOC concentrations, direct
reactions of electrons with the VOC will also be of some importance, e.g.
by dissociative attachment. The electrons are generated by electron beam,
corona discharge, microwave plasma or barrier discharge (Figure 1.1). In
an electron beam, electrons are generated in a vacuum chamber and

9
emitted through a very thin titanium or aluminium foil into the waste gas
(Koch, 1994). Corona discharge uses either pulsed voltage or direct
current (DC) power supply, usually in a coaxial wire to cylinder or a
wire to plate reactor configuration (Chang, J.-S., 1993). The barrier
discharge reactor usually has a concentric cylinder or a plane-to-plane
configuration where one or both of the electrodes are covered with a
dielectric barrier, thus alternating current (AC) power supply must be
used (Rosocha et al., 1993; Kogelschatz, 1997). In a microwave plasma,the plasma is sustained by a microwave source (Hutchison and Wright,
1996).
The energy consumption of the different non-thermal plasma techniquesvaries under the same working conditions, where electron beam ionisation
seems to be the most energy efficient technique, especially for chlorinated
VOCs (Penetrante et al., 1996). Electron beam is, however, a more
complex technique and investment costs are higher than for the dielectric
barrier discharge reactor or the corona discharge reactor. Experience on
a large scale has been gained for the removal of NOx and SOx by a corona
discharge and a barrier discharge (Bittenson et al., 1998) as well as with
an electron beam (Mätzing, 1993). Large scale barrier discharge reactors
have also been built for odour control (Rohrer, 1996; Rafflenbeul, 1998).
Electron beam
Electron
emission
from heated
filament
Electron
transparentmetal foil
Waste gas
T^n *_
_iDC
1
e~e~
7e e" e
Plasma
IElectron
acceleration
in a high Clean gas
electric field
in vacuum
Barrier discharge
Waste gas
Corona discharge,point-to-plane
Waste gas
pulsedDC/AC
1e~e e~
Plasma
IClean gas
Figure 1.1. Three different non-thermal plasma techniques. AC =
alternating current, DC = direct current.

10
Non-thermal plasma techniques are flexible with respect to fluctuations in
load. At times of no load the discharge can be shut off thus saving energy.
They are less flexible towards fluctuations in composition where the
energy consumption may be high for the removal of certain VOCs.
1.1.3 Biological Waste Gas Treatment
Biological waste gas treatment uses immobilised bacteria and fungi or
bacteria in suspension to purify low concentration waste gas streams (van
Groenestijn and Hesselink, 1993). Biological waste gas treatment
techniques are classified into biofilters, trickling filters and bio-scrubbers
(Figure 1.2).
Biofilters have a simple construction with a layer of compost peat with
immobilised biomass and have proved useful for odour control in several
different applications (BUWAL, 1993; Heslinga, 1994). They can,
however, be unstable and difficult to control (Deshusses, 1994).
Bio-trickling filters are packed columns with an immobilised biomass and
a mobile water phase which makes them easier to control (Kirchner et al.,
1989; Diks and Ottengraf, 1994). At high loads of well biodegradable
compounds trickling filters tend, however, to clog due to high biomass
growth. Large scale bio-trickling filters have been used for odour control
as well as for removing solvents (Schippert, 1989; VDI, 1996).
Clogging is avoided in a bio-scrubber where the water flow in the
absorption column is high (>20 m3 nr2 h-1). Here absorption and
biological degradation are separated which makes the bio-scrubber more
flexible towards fluctuating waste gas streams. Due to the high liquid
recirculation rate and the extra aeration of the activated sludge, energy
consumption in the system may be high.
Biological waste gas treatment is cost and energy efficient but it is not
flexible with respect to fluctuations in load and composition. It also has a
low capacity for poorly water soluble compounds and it cannot purifywaste gas streams containing non-biodegradable compounds. The low
flexibility of biological waste gas treatment has been improved by
combining it with other conventional techniques (Table 1.3).

11
Biofilter Bio-Trickling filter Bio-scrubber
Clean gas
IHumidifier
tWaste gas
Waste gas
Waste water <]
Nutrients r>Fresh water
Absorber
Ajr Waste gas
Nutrients r>Fresh water
Waste water <j.
Figure 1.2. Schematic process schemes of the biological waste
treatment techniques.
gas
Table 1.3. Technical solutions to improvewaste gas treatment.
flexibility of biological
Low flexibility due
to:
Technical solutions References
Slow mass transfer
of poorly water
soluble compounds
Wash water mixed with high
boiling point silicon oils (Biosolv)
or activated carbon.
Combination with membrane
techniques
(Schippert, 1994)
(Reij et al., 1995)
Low flexibility
towards fluctuations
in load
Flattening of peak loads with an
pre-adsorption / desorption unit.
Breakthrough from biofilter
adsorbed and recirculated back at
times of no load
(Weber and Hartmanns,
1992)
(Rüdiger, 1998)
(Thissen, 1995)
No removal of
refractory
compounds
Use of specially adapted bacteria
Combination with UV/Ti02
Combination with plasma
(Kirchner et al., 1989; Diks et
al., 1994)
(van Groenestijn et al., 1994)
(Wittorf, 1997)
Long adaptation time
to new loads
Bioreactor connected to a waste
water treatment plant
(Stockhammer, 1992)

12
1.2 Scope of this Thesis
This thesis presents an investigation of the fundamental processes
governing the performance of the bio-trickling filter and the non-thermal
plasma, as well as the economical and ecological evaluation of the
combined biotreatment / plasma system.
1.2.1 Problem Definition
The advantage of low energy consumption of the biological process and
the high flexibility of the non-thermal plasma makes a combination of the
two processes attractive (Wittorf, 1997). The advantages of a combined
system have already been shown for waste water treatment where the non¬
thermal plasma is used to produce ozone which is added to the waste
water to oxidise poorly biodegradable compounds (Stockinger et al.,
1995). There are several possible reactor configurations of the combined
system. The non-thermal plasma may be used for indirect oxidation of the
VOCs by producing ozone which is mixed into the waste gas stream. By
leading the waste gas stream through the non-thermal plasma unit, the
VOCs can be directly oxidized in the plasma. The plasma reactor can then
be placed either subsequent to the biological step for mineralisation of
VOC not removed by the biological filter or it can be placed before the
biological step where the VOCs are partially oxidised to intermediate
organic oxidation products. These intermediates generally have higherwater solubility and biodegradability than the original VOCs and can
often be readily removed by the biological system.
The waste gas streams considered in this work are restricted to air
streams with low concentrations of organic solvents (< 2 g m-3) and with
peak loads of less than 10 g m-3. Toluene was chosen as model compoundsince it is a commonly used solvent in industry and is found in highconcentrations in the troposphere (BUWAL, 1994).

13
1.2.2 Aims
The aims of this thesis are to
- gain knowledge of the physical and biological processes governing the
performance of the bio-trickling filter
- determine the intermediate oxidation products of toluene in a dibarrier
discharge reactor
- determine the energy efficiency of the plasma process
- identify possible reactor configurations of the combined bio-trickling
filter/plasma system
- evaluate the working range, cost and ecological benefit of the combined
system.
1.2.3 Research Procedure
The fundamental processes and the removal efficiencies of toluene were
experimentally investigated in a laboratory scale bio-trickling filter and a
dibarrier discharge reactor. Mathematical models were developed to
describe their performance. The models were also used to calculate size
and energy consumption of large scale reactors. The working range of the
combined system in a large scale set-up was evaluated by calculating its
economic and ecological efficiency.

14
2. Fundamentals
2.1 Bio-Trickling Filter
The bio-trickling filter is used to purify low concentration waste gas streams
containing VOCs. The waste gas is led through a packed column where the
VOCs are absorbed and subsequently oxidised by immobilised micro¬
organisms in a biofilm (Figure 2.1). The packing serves as a carrier for the
biofilm and gives a large contact surface to the gas phase. The packing maybe structured or unstructured, like Raschig rings. Water is evenly distributed
over the packing to supply the biofilm with nutrients and to control pH. The
trickling liquid is recirculated and fresh water is added to prevent
accumulation of toxic substances. The gas flow can be either co-current or
counter-current to the liquid flow.
Three phases exist inside the column: gas phase, water phase (trickling
liquid) and biofilm (Figure 2.1). The VOCs are transported from the gas
phase to the biofilm surface where they are absorbed through a gas-liquid
boundary layer. The absorbed VOCs diffuse into the biofilm where they are
oxidised by the immobilised bacteria and other micro-organisms. End
products are mainly CO2, water and biomass. The biomass accumulates in the
biofilm whereas CO2 diffuses out of the biofilm and desorbs into the gas
phase. Excess biofilm accumulation can obstruct or even plug gas and liquid
flow channels. This is usually referred to as clogging which leads to
channelling, large pressure drop and decreased removal efficiency.
Therefore, biomass must be removed periodically from the packing, for
instance by back washing (Sorial et al., 1997).

15
Clean gas
T Gas PhaseConcentration
Biofilm profile of toluene
Waste gas
Wall
pH control ^—'Nutrient addition
Water PhaseConcentration
Packing profile of CO2
Figure 2.1. Schematic description of the bio-trickling filter in macro-
and microscale (adapted from Devinny et al. (1999)).
2.1.1 Biofilm
Micro-organisms easily attach to surfaces where they may accumulate and
form a biofilm (Characklis and Marshall, 1990). Biofilms are encountered
frequently in natural aquatic systems but may also be found on humans, for
instance plaque on teeth causing caries. Because of their stability towards
external influence they are often used in biotechnology for waste water and
waste gas treatment. Biofilms may, however, also cause problems like
corrosion in water piping.
A typical biofilm consists mainly of water (>95%), extracellular polymeric
substances (EPS) and immobilised micro-organisms, such as bacteria, fungi,
algae and protozoa (Characklis and Marshall, 1990). Bacteria produce EPS
to attach themselves to the surface and to other bacteria. The EPS mainly
consist of polysaccharides and proteins which form a porous three-
dimensional gel in which the micro-organisms are embedded (Blenkinsopp
and Costerton, 1991). The cells are, however, not uniformly distributed in
16
the gel but are more or less segregated (Gottschalk and Knackmuss, 1993).
The cells form a multitude of colonies and clusters which may develop
independently of each other depending on the local conditions. Substrates and
nutrients are transported from the biofilm surface towards the carrier wall,
thus concentration gradients across the biofilm depth or within cell clusters
are created, since transport is often slower than biological degradation (or
production) (Figure 2.1).
There is so far no universal model for transport of solutes in the biofilm
(Wanner, 1995). Solutes are mainly transported by diffusion within the
clusters. Diffusitivity is influenced by the biofilm properties, that is biofilm
porosity and density (Fan et al., 1990; Hinson and Kocher, 1996) which
varies with biofilm depth and loading (Trulear and Characklis, 1982;
Wanner, 1995). Between the clusters, however, a three dimensional structure
of wide pore channels may allow transport of solutes by convection (de Beer
and Stoodley, 1995).
The toluene degrading biofilms contain several bacteria able to degrade
toluene, mainly Pseudomonas and Enterobacter species (Schönduve et al.,
1996; Pedersen et al., 1997). The biological activity has been observed to be
concentrated in the upper layer (Arcangeli and Arvin, 1995; Schönduve et
al., 1996) as well as in the lower layers of the biofilm (Jones et al., 1997),
depending on the shear forces acting upon the biofilm surface. Toluene has a
toxic effect on the bacteria which results in a decreasing fraction of the
toluene degrading cells with time of exposure and with higher toluene
concentration (Mirpuri et al., 1997; Villaverde and Fernandez, 1997).
2.1.2 Toluene Biodegradation
In the bio-trickling filter, bacteria are primarily responsible for the
degradation of toluene which may occur under aerobic as well as under
anaerobic conditions (Arcangeli and Arvin, 1995). Both the aerobic and the
anaerobic respirations use toluene as an electron donor. The electrons are
carried through an electron transport pathway where energy is produced in
the form of adenosin triphosphate (ATP) (Schlegel, 1992). The aerobic

17
respiration uses oxygen as a terminal electron acceptor which is reduced to
water whereas the anaerobic respiration uses nitrate as electron donor which
is reduced to nitrite or nitrogen (J0rgensen et al., 1995; Chaudhuri and
Wiesmann, 1996). A common toluene degrading bacterium is Pseudomonas
putida which has been used to inoculate bio-trickling filters for toluene
removal (Pedersen and Arvin, 1997).
Under aerobic conditions, toluene is degraded in steps by different enzymes
in two different pathways, the so called toi and the tod pathways (Lee et al.,
1995). The first enzyme in the toi pathway is the xylene oxygenase which
oxidises toluene to benzyl alcohol whereas the first enzyme in the tod
pathway, the toluene dioxygenase, oxidises toluene to 2,3-dihydroxy-toluene
(Figure 2.2). These compounds are further oxidised in steps to CO2 or to
intermediate products used for the synthesis of new biomass.
Toi
xyleneoxidase
H2C-OH
CH3
Tod
benzyl alcohol
dehydrogenase
HC=0benzylaldehydehydrogenase
COOH
benzyl alcohol benzaldehyde
toluene
dioxygenase
CH3
A^OH@i
'
2,3-dihydroxy-toluene
ring cleavageproducts
Figure 2.2. The two initial aerobic metabolic pathways of toluene, the toi
and tod pathway. Adapted from Lee et al. (1995).

18
2.1.3 Biodegradation Kinetics
The most extensively used expression for describing growth of micro¬
organisms was proposed by Monod (1949)
^ = ^max^—77- P-US + Ks
where |i is the specific growth rate of the microorganisms [h-1], |imax the
maximum growth rate [fr1], S the concentration of the limiting substrate
[g nr3] and Ks the half saturation coefficient [g nr3]. The substrate uptake
rate, or pollutant degradation rate, can be assumed to be proportional to the
growth rate
_S_S + K,
R = Vm ;—^r- [2.2]
where R is the degradation rate [g m^h"1], Vmthe maximum degradation rate
[g m-3h4]. The model parameter Vm is proportional to the biomass
concentration and the maximum growth rate, jamax.
Toluene, however, inhibits growth at higher concentrations (Mirpuri et al.,
1997). This substrate inhibition can be described by the extended Monod
kinetics suggested by Andrews (1968)
Rtol = Vm^ [2.3]
YT+ Stol + Ks
where Kj is the inhibition constant [g nr3].
The production rate of CO2 is connected to the toluene degradation rate by
RC02 = YC02/tol Rtol + KC02 t2-4]
where Yco2/toi is the CO2 yield coefficient from toluene [g g1] and Kco2
[g m-3h-!] the contribution to the CO2 production from the degradation of
other carbon sources than directly from toluene, for instance the
decomposition products acetic acid and formic acid which were detected in
the circulating liquid, as well as from endogenous respiration (degradation of

19
storage compounds) (Villaverde and Fernandez, 1997). These alternative
carbon sources may have served as constant nutrient supply for the non-
toluene associated CO2 production. Endogenous respiration and the
degradation of other carbon sources (in the text below referred to only as
endogenous respiration) were assumed to be constant.
2.1.4 Diffusion
Diffusion is a way of transport which occurs in the direction of decreasingconcentration of the solute. It is mathematically described by Fick's law
where the diffusion rate is proportional to the concentration gradient
dS;
J = ADjw-1 [2.5]J' dz
where J is mass flux through an interface [g rr1], A the interfacial area [m2],
Djw the diffusivity of component j in water [m2 lr1], S the concentration of
compound j and z the axial distance [m]. The diffusitivity in biofilms is
usually smaller than that in water
Dj,B = * Dj,w M
where DjB is the diffusitivity of compound j in the biofilm and X is a
proportionality coefficient (k<l). The value of X has been found to vary
between 1 and 0.08 depending on the biofilm properties and its interaction
with the diffusing solute (Christensen and Characklis, 1990).
2.1.5 Gas-Liquid Mass Transfer
The mass transfer rate between gas and liquid phases is a diffusion limited
process and can be described by Fick's law according to the two-film theory.It approximates the real concentration profiles across the boundary layerwith a linear gradient in two thin films on either side of the interface. For
poorly water soluble compounds, such as toluene and CO2, only diffusion
resistance in the liquid film is considered

20
Jj =aVr DjwSi 'j,bulk
[2.7]
where J is the mass flux through the gas-liquid interface of compound j
[g fr1], Vr is reactor volume [m3], a the specific interfacial area [m2 nr3],
Sj,buik the liquid bulk concentration [g nr3], Sj* the equilibrium liquidconcentration at the gas-liquid interface [g nr3] and <5l the liquid film
thickness [m] (Figure 2.3). The diffusion rate through the liquid film is rate
limiting for poorly water soluble compounds, thus the interfacial
concentration on the gas side is assumed to be identical to the gas bulk
concentration. At the gas-liquid interface, the liquid concentration is in
equilibrium with the gas phase and can be calculated with Henry's law which
is valid for diluted solutions
* ^ i,bulkÇ
.-
5J~
H[2-8]
J
where Cj;buik is the gas phase bulk concentration of compound j [g nr3] and Hjthe dimensionless Henry's law constant of compound j.
Gas
bulk
Cj,bulk
Gas-Liquidinterface
Gas
film
Liquidfilm
Liquidbulk
Figure 2.3. Concentration profile across the gas and liquid films in the
two-film model. Cj* is assumed to be identical to Cj,buik-

21
2.2 Non-Thermal Plasma
Common for all plasmas is that they are partly ionised gases (1 molecule in
104 to 106) with equal numbers of positive and negative species (Chapman,
1980). They may exist under many different conditions, e.g. high
temperature, low pressure and are naturally encountered in solar corona,
flames, interstellar gas clouds and in the ionosphere. Man-made plasmas are
used in light sources, fusion reactors and in industrial processes such as
welding, etching, sputtering and waste treatment.
For waste gas treatment, usually non-thermal plasmas are used. Non-thermal
means that the free electrons, ions and neutral molecules in the plasma have
different kinetic energies, which also can be expressed in temperatures
according to the equation (Table 2.1)
mv 3 kRm T—— = ^— [2.9]
2 2
where m is the mass of the species [kg], v the electron, ion or molecule
velocity [m s-1], kBm Boltzmann's constant [J K"1] and T the temperature of
the species [K]. The kinetic energy of an electron is usually expressed in
electron volts [eV] where 1 eV = 1.6xl0"19 J.
Table 2.1. Typical energy distribution expressed in velocity and
temperature of the species in a non-thermal plasma
(Chapman, 1980).
Electrons Typical ions Typical neutral molecules
me = 9.M0-31kg
ve = 9.540-5 m s-l
Te = 23200 K = 2 eV
mion = 6.6-10-26 kg
vion = 5.2-10-2ms-1
Tion = 500 K ee 0.04 eV
mneu = 6.6-10-26 kg
vneu = 4.0-10-2ms-1
Tneu = 293 Ks0.025 eV

22
2.2.1 Dielectric Barrier Discharge
In a dielectric barrier reactor (Figure 2.4), the conducting electrodes are
separated by an insulating barrier which is limiting the amount of chargewhich can be transported in each discharge. The barrier particularly
prevents the development into a spark discharge with its associated acoustical
phenomena, hence the term silent discharge. With a dibarrier discharge of
the type used in this work each electrode is shrouded by an insulating layer
(borosilicate glass) chosen so that electrical breakdown can only occur in the
gas gap between the shrouded electrodes, not across the barrier (Carlins and
Clark, 1982). When the electric field across the gas gap exceeds a certain
value (in the range 30 to 70 kV cm-1) a local electric discharge can develop
(Braun et al., 1991; Pietsch, 1996): This requires initial electrons, at first
these may have had their origin in cosmic radiation, natural radioactivity or
detachment from negative ions. The electrons take up energy from the
applied field so that they can dissociate, excite and ionise the gas. The
ionisation provides the growth of the discharge, initially as an electron
avalanche, on reaching electron numbers greater than 108 as a kind of a
streamer. Electrons progress towards the (positive) counter-electrode, but
will be held up by - and accumulate on - the barrier. In this way, the local
electric field will collapse within 10 ns to a value which can no longer sustain
the discharge which will therefore extinguish. This is a localised
phenomenon and similar short-lived discharges will develop elsewhere
between the barriers. This leads to unipolar charge accumulation which will
eventually stop all further generation of discharges. To restart the process,
the polarity of the applied field must be reversed - continuous operation of a
barrier reactor can only be secured by applying an alternating field. Usually
frequencies between 50-60 Hz and a few kHz are used (Rosocha et al., 1993;
Rafflenbeul, 1998).

23
Purified gas
Dielectric A Electrode
i t t
Plasma
l^4Waste gas
+ +e~ + + f.
e-+ + e"l|-
+
+
+
Figure 2.4. The dibarrier discharge reactor and the electric discharge in
three steps: 1. build-up of the electric field, 2. streamer
propagation, 3. collapse of the electric field due to chargeaccumulation on the boundary surface.
2.2.2 Mechanism of Gas Phase Toluene Oxidation by Electrical
Discharge
The initial reactants are generated by inelastic collisions between neutral
molecules (matrix gas and VOC) and highly energetic electrons. These
electron impact reactions lead to the formation of additional electrons, ions,radicals and excited molecules (Table 2.2), which react further in secondaryreactions.
For an ionisation to occur, two conditions must be fulfilled: an electron must
hit a molecule and the electron must have enough energy to remove the most
weakly bound electron. This minimum energy requirement is called the
ionisation potential [eV]. The probability of collision depends on the gas
particle density, on the radius of the molecule and on the approach velocityof the electron (Chapman, 1980). These parameters are expressed in the
electron collision cross section which, together with the electron energy
distribution function, determines the energy efficiency of the dissociation and
ionisation processes (Eliasson et al., 1994).

24
Table 2.2. Important electron impact collisions in the plasma
e" + AB => AB+ + 2e" electron impact ionisation
e" + AB => AB" electron attachment
e- + AB => A" + B' dissociative attachment
e' + AB => A* + B* + e- dissociation
e- + AB => A+ + B* + 2e" dissociative ionisation
e- + A+ => A and A+ + B" => A + B or AB recombination
A+ + B=>A + B+ charge transfer
e~ + A => A* + e~ and A* => A + hv excitation / relaxation by photo emission
In diluted gas streams, direct electron impact dissociation of toluene is
unlikely because the probability of a collision is small (Neely et al., 1992).
More likely is the initial reaction of toluene with matrix gas radicals, ions or
excited molecules formed in the plasma.
Oxygen plays an important role in the oxidation of toluene (Chang, M. B.
and Chang, C.-C, 1995; Tezuka and Yajima, 1996; Chang, M. B. and Chang,
C.-C, 1997; Futamara et al., 1998; Miyagawa et al., 1998). There are
several very reactive oxygen radicals formed largely via molecular
excitation in the discharge depending on electron average energy (Cosby,
1993b; Eliasson et al, 1987)
e- + 02 -» 2 0(3P) + e- [2.10]
e- + 02 -> 0(3P) + O(iD) + e- [2.11]
and to a lesser extent (Cosby, 1993b)
e- + 02 -» 0(3P) + O(iS) + e" [2.12]
where 0(3P) are oxygen atoms in the ground state and 0(XD) and 0(!S) in an
excited state. 0(3P) has the longest lifetime in the reaction zone and reacts
with toluene by addition to the ring. The resulting aromatic products are m-,
o- and p-cresol and phenol (Gaffney et al., 1976). 0(3P) also reacts with
oxygen to produce ozone
0(3p) + 02 -^ 03 M = N2 or 02 [2.13]

25
Ozone generally reacts only slowly with organic compounds in the gas phaseand is of no importance in the oxidation of organic compounds in the
discharge (Atkinson and Carter, 1984; Atkinson, 1990; Yamamoto, T. et al.,
1996). Another important oxygen species formed in the discharge, but so far
less investigated, is the positive oxygen ion which is formed by electron
impact ionisation and charge transfer reactions (Mätzing, 1991)
e- + 02^02+ + 2e- [2.14]
X+ + 02^02+ + X [2.15]
where X represents species of nitrogen, water and carbon dioxide. Oxygenions play an important role in the decomposition of VOCs by further
reaction with water and oxygen forming highly reactive radicals (Ferguson
et al., 1979). Oxygen ion reactions with VOC molecules have been suggested
to be an important removal process of VOCs (Krasnoperov et al., 1997). The
reaction mechanism for oxygen ions with VOCs have so far only been
investigated for methane (van Doren et al., 1986) and no mechanisms have
been suggested for the reaction with aromatic compounds.
'OH radicals in ground or excited states are formed in the discharge from
water by electron impact dissociation and by reaction with excited oxygen
atoms or with water ions (Rowe et al., 1988)
e- + H20 -> 'OH + H* + e- [2.16]
O(iD) + H20 -* 2 'OH [2.17]
e- + H20 -> H20+ + 2e- [2.18]
H20 + N2+ -» H20+ + N2 [2.19]
H20 + 0+ -> H20+ + *0 [2.20]
H20+ + H20 -> H30+ + 'OH [2.21]
or with molecular positive oxygen ions (Fehsenfeld et al., 1971)
02+ + H20 -^-> 02+ (H20) [2.22]
02+ (H20) + H20 > H30+ + 'OH + 02 [2.23]
-^H30+ (H20)+'OH + 02 [2.24]

26
or by the reaction of H02* and NO which is always formed in the air
discharge (Peyrous et al., 1989)
H02-+ NO -4 'OH + N02 [2.25]
The peroxyl radical, *H02, may be formed by (Peyrous et al., 1989)
•H + 02 -^-> *H02 [2.26]
•OH + 03 -> *H02 + 02 [2.27]
Initial reactions of *OH radicals with toluene under atmospheric conditions
are well known (Seuwen and Warneck, 1995). The major share of the initial
reactions leads to *OH radical addition to the ring, forming o- and p-cresol,and the remainder reacts through hydrogen abstraction from the methyl
group to form benzaldehyde and benzyl alcohol. Hydrogen abstraction is,
however, the dominating reaction at temperatures above 380K (Perry et al.,
1977). *OH radicals are also lost in the reactive zone by recombination
(Bortner and Baurer, 1972; Atkinson et al., 1989; Peyrous et al., 1989)
•OH + 'OH -^ H202 M = N2, 02 or H20 [2.28]
•OH + *H02 -> H20 + 02 [2.29]
•OH + -H -> H20 [2.30]
•OH + -0^02 + *H [2.31]
and by reactions with other species in the reactive zone, for instance
(Bortner and Baurer, 1972; Atkinson et al., 1989; Peyrous et al., 1989)
•OH + H202 -» -H02 + H20 [2.32]
•OH + N02 -> HN03 [2.33]
•OH + NO -> HN02 [2.34]
•OH + N->-H + NO [2.35]
as well as by reaction with ozone (Equation 2.27).
Nitrogen excited states, nitrogen ions and nitrogen radicals are formed by
electron collisions in the reaction zone (Itikawa et al., 1986)
e- + N2 -» N2* + e- [2.36]

27
where * indicates the different excited states of nitrogen (A,B,C,D,a,a',b
etc.). Nitrogen is also to a small extent dissociated where the most probablereaction is (Cosby, 1993a)
e- + N2 -> N(2D) + N(4S) + e- [2.37]
where N(4S) is the ground state and N(2D) an excited state. Atomic and
molecular nitrogen ions are formed by (Dutton, 1975; Itikawa et al., 1986)
e- + N2 -» N+ + N + 2e- [2.38]
e- + N2 -> N2(X)+ + e- [2.39]
e- + N2 -> N2(B)+ + e- [2.40]
The most common excited nitrogen species is N2(A), which contributes to
toluene oxidation by reacting with 02, forming atomic oxygen (lannuzzi et
al, 1982)
N2 (A) + 02 -> 2 -O + N2 [2.41]
Nitrogen ions are present in the discharge only at low concentrations due to
the high ionising potential of N2 and rapid charge transfer reaction to 02.
The extent of nitrogen ion reactions with VOC molecules is unclear. Other
researchers have shown that removal of toluene in a pure nitrogen
atmosphere is possible, but with a much lower removal efficiency (Chang,
M. B. and Chang, C.-C, 1995; Futamura and Zhang, 1996; Chang, M. B.
and Chang, C.-C, 1997). The observed removal of VOCs in a nitrogen
atmosphere may also be attributed to electron impact dissociation of VOCs
(Futamura and Zhang, 1996).
2.2.3 Kinetics of the Gas Phase Oxidation
The accurate determination of the reaction rates of VOCs in the plasma is
difficult because of the heterogeneous nature of the plasma, where the fast
reactions take place in or near the streamer. The reactive species, that is
electrons, radicals and ions, also interact with each other as well as with
other neutral molecules than the VOCs. The local reaction conditions, that is
temperature and concentrations of reactive species, are functions of time and

28
space. The initial electron impact reactions take place within nanoseconds
producing radicals and other excited species. These react within
microseconds whereas more slowly reacting species, for instance ozone,
react with VOCs only within seconds or even hours depending on the nature
of the VOC (Eliasson et al., 1994).
These complex and linked kinetics can be simplified by assuming a non-
limited reaction space (Miziolek et al., 1994). The reaction space is then
spatially homogenous and the sum of all reactions leading to the destruction
of the VOC can be expressed using average parameters
rvoc =-kVoc [VOC] [R] [2.42]
where ryoc is the reaction rate of the VOC [molecules m-3s-1], [VOC] the
VOC concentration [molecules nr3], [R] the concentration of all VOC
oxidising species [molecules nr3] and kyoc the average reaction rate
coefficient for these reactive species [molecules-1m3s-1]. The amount of
reactive species is proportional to the specific power input, 8 [J s-im-3], which
is the power [W] divided by reactor volume [m3]. It determines the electron
concentration and dissociation rates of gas molecules (Rosocha et al., 1993).
In the homogenous steady-state plasma, the concentration of reactive species
[R] reaches equilibrium very quickly, thus their rate of formation is equal to
their rate of consumption
GRe = kV0C [VOC] [R] + kn [n] [R] [2.43]
where Gr is the energy efficiency of the radical production [number of
molecules J-1], [n] the concentration of other species than the VOCs, that is
neutral molecules, ions, radicals and electrons, which also react with the
reactive species [molecules nr3] and kn the corresponding reaction rate
coefficient [molecules-1m3s-1]. G is also called the g-value which usually is
expressed in number of molecules per lOOeV. There is a g-value for
formation of particular radicals and a g-value for destruction of particularmolecules (VOC etc.). Solving Equation 2.43 for [R] and substituting into
equation 2.42 gives
kVnr [VOC]
rvor= - GR e
^Çi [2.44]Y0C R
kvoc [VOC]+kn [n]

29
2.2.4 Reactions with Ozone in Aqueous Solution
Ozone produced in the discharge can be used to oxidise organic compoundsin aqueous solution. Ozone is a strongly polarised molecule with several
resonance structures, allowing it to behave as dipole, electrophile or a
nucleophile (Figure 2.5). It has a high oxidation potential (2.07 V) but reacts
very selectively with organic compounds and reaction rates range over many
orders of magnitude (Hoigné and Bader, 1983). In aqueous solution, ozone
either reacts directly with organic compounds (ozonolysis) or it decomposes
into various radical species which subsequently oxidise the organic
compounds (Hoigné, 1988; Bablon et al., 1991).
Figure 2.5. Two possible resonance structures of ozone (Bailey, 1978).
Ozonolysis. Ozone may act as an electrophilic reactant and add directly to
double or triple bonds of organic compounds. The main mechanism of
ozonolysis are the Criegee mechanism and the electrophilic addition (Bailey,
1982). In the Criegee mechanism, the ozone addition leads to a primary
ozonide which quickly decomposes to a carboxyl and a hydroxyl group or a
carbonyl group and hydrogen peroxide (Figure 2.6). Electrophilic addition
to a double bond can also proceed in two directions, with the ozonide
forming either a carbonyl compound or an epoxide (Figure 2.7).

30
J& O
O' *0 çf \)WxR \\ /,R
c=c —»- c-c —»
r' nr r' vr
primary ozonide
1, 2, 3-trioxalane
Figure 2.6. The Criegee mechanism of the ozone addition to a double
bond (March, 1985).
O"
I
l<-c-cx
or
62 ' V N
Figure 2.7. Schematic description of the electrophilic addition of ozone
to a double bond (Bailey, 1982).
Ozone decomposition. Parallel to ozonolysis, organic solutes are oxidised
by different inorganic radical species generated from the decomposition of
ozone (Staehelin and Hoigné, 1985). Ozone decomposition is initiated byhydroxyl ions (OH"), hydroperoxy ions (H02" ) and a few organic
compounds. These initial reactions lead to the formation of superoxideradicals (*027 *H02), which can react further with a second ozone molecule,
starting a radical chain cycle where superoxide radicals are reproduced over
several intermediate species as discussed by Stockinger (Stockinger, 1995)).The hydroxyl-radical ('OH) is the most reactive intermediate formed in this
radical chain cycle. It is reactive not only towards organic compounds but
also inorganic compounds (Hoigné and Bader, 1976; Buxton et al., 1988).

31
Carbonate and bicarbonate ions, for instance, break the radical chain by
converting 'OH-radicals into slowly reacting 'CO32- -radicals (Staehelin and
Hoigné, 1985). 'OH-radicals also react with phosphate ions but more slowlythan with carbonate ions (Buxton et al., 1988). Phosphate radicals formed
also have the ability to act as radical chain carriers (Staehelin and Hoigné,
1985).

32
3. Material and Methods
3.1 Experimental Set-Up
Three different experimental set-ups were used in this work: a continuous
bio-trickling filter, a non-thermal plasma reactor and a batch reactor for
ozonation of toluene in aqueous solution.
The inlet air flow of the bio-trickling filter and the non-thermal plasmareactor was dry compressed air (2.5% relative humidity at 25°C) controlled
by a thermal mass flow controller (Brooks 5850E, Emerson Electric Co.,
Hatfield, Pennsylvania). The toluene (99.7%, Riedel-de Haën AG, Seelze,
Germany) was pumped with an automatic dispenser (Metrohm Dosimat 665,
Herisau) directly into the air flow where it evaporated on a piece of filter
paper. The gas was subsequently mixed in a static mixer. The gas phaseconcentrations of toluene and CO2 from both set-ups were measured on-line
with a mass spectrometer (Chapter 3.3.4).
3.1.1 Bio-Trickling Filter
The experimental set-up consisted of a packed column and systems to control
gas and liquid flow, pH and temperature (Figure 3.1). The glass column
(Buechi, Uster) had an inner diameter of 10 cm and a total height of 170 cm.
It had six capped openings on the side, so called sample ports. The column
contained a structured packing (Mellapak 350, Sulzer AG, Winterthur) made
of stainless steel DIN 1.4301. It had a surface of 350 m2m-3 and was divided
into 5 segments placed on top of each other. The packing had a total heightof 105 cm.
The bio-trickling filter was inoculated with an adapted culture from a similar
bio-trickling filter (Rüdiger, 1998). The inoculum was first cultivated in
shake flasks before it was added to the reactor liquid. It was recirculated
over the packing and a biofilm formed on the packing already after a few
days. The bio-trickling filter was operated continuously during one year at
the conditions listed in Table 3.1.

33
The inlet gas was heated to 30°C before entering the bottom of the column,
using a heat coil wrapped around the static gas mixer. To avoid condensation
in the sampling capillary to the MS, the outlet gas was cooled in a glass heat
exchanger and the condensed water led back to reactor liquid. The gas pipes
were made of PVC or glass.
Toluene Air <l
\7
Liquid feed h>-
0.5M NaOH|>Liquid purge/J-
Figure 3.1. Reactor configuration of the bio-trickling filter. FC=flow
controller, LC=liquid level controller, MS=mass
spectrometer, P=pressure drop, pHC=pH controller, TC=
temperature controller.

34
Table 3.1. Description and standard operating conditions of the bio-
trickling filter.
Column cross section 0.00728 m2
Empty volume of the packing 0.00764 m3
Void packing volume 0.00749 m3
Temperature 30°C
PH 7.9
Gas flow 0.75-3.0 m-3^1
Superficial gas velocity 103-412 m h-1
Liquid flow 0.06 m-%-1
Superficial liquid velocity 8.2 m h"1
Inlet toluene conentration 0.25 - 0.4 g m"3
The reactor liquid was recirculated and spread over the packing at the top of
the column using a stainless steel distributor designed by Zuber (Zuber,
1995). The liquid trickled down over the packing and was collected at the
bottom of the column. The liquid height was sensed by two electrodes. The
signal was connected with a PI controller for a peristaltic pump (HeidolphRGL 85, Kelheim, Germany). One electrode was immersed in the liquid and
the other placed with the tip at the height of a set liquid level. When the
circuit closed the liquid was pumped to a small tank (1.2 1). It was stirred
with a magnetic stirrer (Heidolph MR 2002, Kelheim, Germany). The stirred
tank was used to measure pH (Conducta 7162 GS, Gerlingen, Germany) and
automatically adjust it by means of a pH controller (Mostec M8832N,
Liestal) by adding 0.5 M NaOH using a peristaltic pump (Watson-Marlow
101 U, Falmouth, England). The liquid feed containing minerals (Table 3.2)
was also added to the liquid in the stirred tank at a continuos flow rate of 150
ml h-1. The liquid level in the stirred tank was self-regulated by an overflow.
The liquid was pumped to the top of the column with a centrifugal pump.
The flow was controlled manually by a valve and a rotameter. The liquid
pipes were made of PVC and Teflon.

35
Table 3.2. Composition of the liquid feed.
K2HP04 0.28 g H
NH4CI 1.0 gl-1
MgS04 0.1 g 1-1
CaCl2 • 2 H20 0.01 g H
Trace element solution 1 mil'1
The trace element solution
ZnCl2 70 mg H
MnCl2 • 4 H20 100 mg H
CoCl2 6 H20 100 mg H
CuS04 • 5 H20 39 mg H
Na2Mo04 • 2 H20 50 mg H
Na2Se03 • 5 H20 26 mg H
NiCl2 100 mg H
Ammonium ferric(III) citrate, green (Fluka, Buchs) 4600 mg I"1
H3BO4 2860 mg H
HCl (37%) 0.7 ml H
The liquid temperature was measured by means of a thermosensitive
resistance (PT100) placed in the bottom sample port. The signal was
amplified (Amplifier M7829-AR, Mostec, Liestal) and sent to a process
control system (Münster+Diel Electronic GmbH, Overath, Germany) which
was programmed as a PI-controller. It regulated the temperature by turning
a heat coil on and off which was wrapped around the column.
The packing pressure drop was measured by a 1.5 m high U-tube filled with
water. It was connected to the bottom and top sample ports (65 cm of column
height).
The wet biomass and the liquid hold-up on the packing was determined
gravimetrically by suspending the whole column on a load cell (Z6-4,
Hottinger Baldwin Messtechnik, Darmstadt). This method was introduced
and tested by Zuber (Zuber, 1995). Before determining the biofilm wet
weight, the liquid flow was stopped and the liquid on the biofilm surface was
allowed to drip off for 30 minutes. The biofilm wet weight was the

difference to the weight of the column with no biofilm determined before
inoculation of the culture. The liquid hold-up was determined by measuringthe column weight at different water loads and subtracting the column weightwithout water load.
The wet weight and the porosity of each packing segment was determined byfirst letting the packing drip off for 30 minutes. The segments were then
removed from the column and put on a scale to determine the wet weight.The volume of each packing segment was measured by lowering it into a
vessel filled with water. The water overflow was collected and measured
volumetrically. The volume of each segment was added to calculate the bed
porosity
Column empty volume - Total Packing volumeBed porosity = [3.1]
Column empty volume
3.1.2 Non-Thermal Plasma Reactor
The experimental set-up consisted of a modified commercial dibarrier
discharge unit (PlasmaCat, Up-to-Date Technology, Oberurnen), which
included a transformer (HT 15K, Trafonic AG, Reussbühl), a frequency
generator (BMI S07, Reliance Electronic AG, Dierikon) and two differentlysized ionisation reactors, as well as a cold trap, an ozone scrubber and
systems to control the air flow, air humidity and air temperature (Figure
3.2). Gas piping and connections were made of Teflon or glass.
The discharge unit was operated at the conditions listed in Table 3.3. The
averaged voltage waveform as supplied to the reactor was sinusoidal; the
resulting current (after averaging) was also nearly sinusoidal (Figure 3.3).
The uneven curves were due to shortcomings of the power supply system
which had originally been constructed for larger discharge units. The
specific energy input was regulated by adjusting the air flow, keeping the
voltage constant. The small ionisation unit was built up of 3 rows of 12 to 13
copper rods coated with borosilicate glass (4 mm outer diameter) (Figure
3.4). The large ionisation unit contained 5 rows of 24 to 25 steel rods (2 mm

37
diameter) which were insulated with borosilicate glass tubes (4 mm outer
diameter, 2 mm inner diameter). The discharge zone was 49 mm wide in
both reactors. The shortest gap between the dielectric surfaces was 1.6 mm
in the small ionisation unit and 1.53 mm in the large ionisation unit which
gave an maximum electric field of approximately 40 kV cm-1.
The inlet air was humidified by bubbling it through a water container kept at
40°C. The inlet gas temperature was measured by a PT100 thermometer
connected to a PI controller regulating a water thermostat (Type 4200,
Haake, Karlsruhe). It regulated the inlet air temperature to 25°C via a heat
exchanger. The air humidity was measured at 25°C (HMP233, Vaisala Oy,
Finland). The air humidity sensor was calibrated using different saturated
salt solutions with defined water vapour pressures.
Ozone in the gas outlet disturbed the measurements of toluene by the mass
spectrometer. Ozone was therefore destroyed before the entry of the gas
sample into the MS by adding 3 ml min-1 of IM sodium nitrite solution to the
sample gas (500 ml min-1). The nitrite reacted with the ozone in a 4 m long
Teflon tube (4 mm inner diameter) before gas and liquid were separated in a
glass vessel. Less than 1% of toluene and carbon dioxide were lost in the
ozone scrubber.
Gas phase ozone was measured photometrically at 254 nm (Anseros Ozomat
Multi, Tübingen, Germany). A 0.2um Teflon filter was placed in front of the
cuvette to remove aerosol particles.
Gaseous organic oxidation products as well as nitric acid were collected in a
cold trap. The cold trap consisted of two 100 ml glass vials in series, cooled
to approximately -70°C by means of a mixture of dry ice and methanol. The
trapped compounds on the glass walls were dissolved in 9 ml bidistilled
water before analysis with GC-MS and ion chromatography. The trapping
efficiency was high for acids and nitrate but low for volatile compounds like
aldehydes. Reaction of the condensed gaseous organic compounds with ozone
during sampling can be excluded due to the low temperature. Ozone that
might have dissolved in the wash water was destroyed by adding 0.1 ml 0.1M
Na2S203 to the liquid sample.

38
Toluene>-©
Heater coil-
rAir|^_(rc)_A
Y
<§)
Tube for the
removal of ozone
MS
Water
thermostat
Figure 3.2. Reactor configuration of the dibarrier discharge reactor.
The discharge zone is marked with e-. FC=flow controller,
MS=mass spectrometer, T=PT100, RH=measurement of
relative humidity, A=current integrator, V=high voltage
probe, 03=ozone analyser.

39
1540
10
5 T —20
0 =< Ä 0
"5P P -20
10
15 -40
Time [ms]
4 6
Time [ms]
Figure 3.3. Voltage and current input to the small (left, 200Hz, average
of 256 cycles) and large (right, 212 Hz, average of 32
cycles) discharge unit. The current integral was measured as
the voltage over the measuring capacitor (Figure 3.5)
lass tube
air flow
Steel rod
Figure 3.4. Electrode configuration of the small ionisation unit viewed
from the side. Two rows were grounded and one row was
connected to the high voltage. In the large ionisation unit (5
rows of electrodes), three rows were grounded.

40
Table 3.3. Description and operating conditions of the dibarrier
discharge.
small ionisation unit large ionisation unit
Voltage peak 25 kV 22 kV
Voltage average 15 kV 14 kV
Frequency 202 Hz 212 Hz
Plasma energy input 6W 54 W
Maximum specific energy input 57 kJ nr3 250 kJ nr3
Empty volume of the discharge zone 62 cm3 285 cm3
Void volume of the discharge zone 45 cm3 261 cm3
Shortest gap between the dielectric surfaces 1.60 mm 1.53 mm
Gas flow 0.38-3.0 m3hrl 0.75-3.0 m3h-i
Gas residence time in the discharge zone 0.05-0.43 s 0.3-1.2 s
Inlet gas temperature 25°C 25°C
Maximum measured gas temperature at outlet 47°C 110°C
Inlet gas relative humidity 2%-100% 65%
The energy deposited in the discharge, W [J], was determined as the productof reactor voltage (Ur(t)) and current (i(t)) integrated over a specific time
(one cycle)
W= JUr(t)i(t)dt [3.2]
The integral was determined by means of the Lissajous figure method
(Manley, 1943; Kogelschatz, 1988). The reactor voltage was measured by
means of a high voltage probe (P6015, Tektronix Inc., Beaverton, Oregon)and the current was integrated in a charge integrator (Figure 3.5). The main
component of the charge integrator was a capacitor of 685 nF. The chargewas proportional to the voltage over the measuring capacitor (Um) which
was recorded versus the reactor voltage (Ur) by means of a digital
oscilloscope (4072 Gould, Hainault, England). Because the current is
displaced with respect to the reactor voltage, a rhomb shape oscillogram is
obtained (Figure 3.6). This is called a Lissajous figure and its area is
proportional to the energy input per cycle. The power was calculated by

41
P = f Cm JUr(t)Um(t)dt0
[3.3]
where P is the power [W], f the frequency [s-1], Cm the capacitance of the
measuring capacitor [F] and the integral value the area covered by the
Lissajous figure.
The increase of heat content in the gas flow was in the same range as the
energy input determined by the Lissajous figure. For small temperature
differences between the gas flow inlet and outlet, the energy inputdetermined by the Lissajous figure could be recovered in the gas flow. For
temperature differences around 20 degrees up to 50% less heat was
recovered probably due to the larger heat losses in the reactor.
>
1 i
30
20
10
—fe
10 20
Ur [kV]
30
Figure 3.5. Electrical
connections of the charge
integrator (dashed line box) and
the connections to the oscillographfor determining the energy input
by means of the Lissajous figuremethod. V = voltage divider or
probe.
Figure 3.6. The Lissajous figure
obtained for the large ionisation
unit at 12 kV average reactor
voltage.

42
3.1.3 Ozonation Batch Reactor
The experimental set-up used for batch ozonation of toluene in aqueous
solution consisted of a glass bubble column, a Teflon coated gear pump (MV-
Z P1830, Ismatec, Zürich) and on-line analytic instrumentation to measure
pH (7162 GS, Conducta GmbH, Gerlingen, Germany) as well as the aqueous
ozone concentration (Figure 3.7). The aqueous ozone concentration was
measured by an amperometric ozone electrode (model 26501, sensor 2301,
Orbisphere, Geneva). All experiments were carried out at room
temperature.
The glass column had a volume of 783 ml, a height of 36 cm and an internal
diameter of 5 cm. The gas stream was fed through a porous glass plate (16 to
30 Jim maximum pore diameter) at the bottom of the column. All tubings
contacting ozone (water and liquid) were made of Teflon or glass. The
valves were made of glass, Teflon or stainless steel.
The ozone generator (Fischer Model 500, Zürich, Switzerland) was fed with
830 ml mim1 dry oxygen. The outgoing gas flow contained 0.6% ozone from
which 10 ml min-1 was led through the column. The remaining ozone was
destroyed by bubbling it through a IM sodiumnitrite solution.
In all batch experiments bidistilled water was used with an initial toluene
concentration of 1 mM (92 g m-3). The reaction in the liquid sample was
stopped by adding 0.1 ml of 0.1M Na2S203. The reactor liquid level was
maintained at a constant value by replenishing with bidistilled water.

43
N/
<) KN02
/\
:û:
O
:9:o:
o::<?
:Q
o:
Ö
* ï
Sample'port
<
Figure 3.7. Reactor configuration for batch ozonation.
3.2 Analytical Methods
3.2.1 Gas Chromatography-Mass Spectrometry (GC-MS)
Aromatic oxidation products (cresols, benzyl alcohol) and aldehydes were
analysed by GC-MS. The sensitivity for aldehydes was improved byderivatisation (Glaze et al., 1989; Yu et al., 1998). To the 4 ml aqueous
sample (from the cold trap or the ozonation batch), 0.9 ml of 4 mM
(2,3,4,5,6-pentafluorobenzyl)hydroxylamine hydrochloride (PFBHA«HC1,
Aldrich, Switzerland) solution for the aldehyde derivation and 0.32 ml of lgF 4-bromophenol (99%, Fluka) solution as internal standard was added into
a sealable glass vial. After two hours of reaction at room temperature, the
aqueous solution was extracted twice with 0.75 ml n-hexane (95%, Romil
Chemicals, Shepshed, Leics., England).
The gas Chromatograph (Hewlett Packard, type 5890A, USA) was equippedwith a split-splitless injection system. 1 jll of sample was injected splitless at
265°C. Helium (purity class 5.0) was used as a carrier gas at a flow of 1 ml
mim1. Separation was made with a wide-bore column (DB-5, J&W Scientific,

44
30 m x 0.32 mm ID x 25 Jim film). The temperature programme applied was
2.5 min at starting temperature of 45°C, constant heating rate of 8°C mur1 to
240°C, 3 min holding at final temperature and cooling down. The connected
mass spectrometer was an Ion Trap Detector (electron impact ionisation,
model ITD 800, Finnigan MAT, USA).
The substances were identified by comparison of retention times and mass
spectra with standard aqueous solutions. These were prepared as the normal
samples described above. The linearity was poor for low concentrations and
four- to five-point calibrations were necessary to cover the whole
concentration range. The detection limit was less than 5 \iM for all
aldehydes.
3.2.2 Ion Chromatography (IC)
Organic acids as well as nitrite and nitrate were detected by ion
chromatography. To the 0.9 ml aqueous sample, 0.1 ml of 4 mM iodide
solution as internal standard was added. Samples from the bio-trickling filter
were filtered (0.2 p,m) before measurement.
The ion chromatography system consisted of a HPLC pump (Waters, USA),
a carbonate trap (ATC-1, Dionex), an ion exchange column (Ion Pac ASH, 4
mm diameter, Dionex, USA), a membrane suppressor (Anion Self-
Regenerating Suppressor 1, Dionex, USA) and a conductivity detection cell
(Dionex, USA). A 15 jil sample was injected. The eluent was bidistilled
water mixed with carbonate free solutions of 5 and 200 mM NaOH at a total
flow of 1.1 ml mim1. The gradient program is listed in Table 3.4.
The organic acids were identified by spiking the samples with 20 to 50 |ll of
1 mM standard aqueous solutions. The same standard solutions were used to
make three-point calibrations used for the quantification. The detection limit
was less than 10 \XM of all acids.

45
Table 3.4. Gradient program for the analysis of organic acids by ion
chromatography. The total liquid flow was 1.1 ml min-1.
Time [min] Gradient Water 5mMNaOH 200 mM NaOH
0-4.5 none 90% 10%
4.5 - 13 linear gradient from 10% to 0% 0% to 10%
13-24 linear gradient from 90% to 75% 10% to 25%
24-30 none 75% 25%
30-40 none 90% 10%
3.2.3 Total Organic Carbon (TOC)
The total organic carbon content in the aqueous solution was analysed using a
TOC-Analyser (TOC-5050 A, Shimadzu Corp., Japan) equipped with an
autosampler. The TOC-value was the difference between measured amount
of total carbon (TC) and the amount of carbonate. TC was determined by
catalytically oxidising the sample at 600°C and quantifying the formed CO2
by means of an infrared detector. The carbonate content was determined by
injecting the sample into 25% phosphoric acid and quantifying the evolved
CO2 with the same detector.
The TOC analyser was calibrated with standard solutions of carbonate and
phthalate (>99.5%, Fluka). The linearity was very good also for small TOC
concentrations.
3.2.4 On-line Mass Spectrometry (MS)
The gas phase concentrations of toluene and CO2 were measured
simultaneously using a quadropole mass spectrometer (Balzers PGM 407,
Balzers, Liechtenstein). The concentrations were measured every 15 seconds
and stored on a personal computer.
The gas samples were transported in a heated capillary (70°C, inner diameter
2 mm) at 500 ml min-1 to the MS gas inlet valve where the temperature was
kept at 90°C and the pressure held at 490 mbar. A small part of the gas

46
sample stream was split off into the ionisation chamber where the gas
molecules were dissociated by electron impact into charged fragments at a
pressure lower than 10"5 mbar. They were transported between four rods in
an alternating electric field which separated the charged fragments according
to their mass-to-charge ratio (m/z). Toluene was detected by the intensities of
IÏIC6H7/Z 91 and mc6Hs/Z 92 and CO2 by the intensity of mco2/Z 44. The
intensities were measured by means of a secondary electron multiplier
(SEM) with the multiplier voltage set to 1800 V. The intensities of toluene
and CO2 were normalised to the intensity of nitrogen (111N2/Z 28) which was
measured by a Faraday cup detector. The SEM is more sensitive than the
Faraday cup detector but drifted slightly and had to be recalibrated every
three to four weeks.
The MS was calibrated for N2, 02 (m02/Z 32), Ar (mAr/Z 40) and C02 using
a reference gas with known composition (10.024% CO2, balance dry air).
The calibration factors for toluene and water vapour (m/z 18) were
determined using the inlet gas for which the mass flow of each component
was known. The linearity was excellent and a one-point calibration was
found to be sufficient to cover the whole concentration range of interest.
3.2.5 Analytical Methods Used for Analysing the Aerosol Deposit
The biological oxygen demand (BOD) was determined using a standard
method (APHA-AWWA-WPCF, 1992) measuring the oxygen concentration
amperometrically (Oximeter 323, WTW, Weilheim, Germany).
The chemical oxygen demand (COD) was measured photometrically using a
commercial cuvette test based on a standard method with potassiumdichromate as oxidising agent (Nanocolor 100 D, Machery-Nagel, Düren,
Germany).
Size exclusion chromatography was made using a PL-Gel mixed C column
(7.5mm x 600mm x 5nm gel, Polymer Laboratories Ltd, England) at 45°C
with tetrahydrofuran as solvent and three detectors. The detectors used were
a differential refractometer (Knauer), a KMX-6 LALLS detector
(Chromatix) and a differential viscosimeter (Viscotek Mod. H 502).

47
3.2.6 Simulation Software
The differential equations formulated in Chapter 6 were solved numericallyusing the simulation software Simusolv© (Dow Chemical Company,Midland, Michigan) which is based on the Advanced Continuous Simulation
Language (ACSL) (Steiner et al., 1990). Simusolv contains a parameterestimation tool which uses the method of maximum likelyhood to fit
parameter values so that the model output fits experimental data. The
likelyhood function calculates the probability that a set of parameter values
can describe the experimental data. The parameter values are varied with the
objective to maximise the likelyhood function, that is to find the most
probable parameter values.
3.3 Short Cut Life Cycle Assessment
The ecological assessment method used here is a simplified version (called"short cut") of a more detailed life cycle assessment (LCA) made for
different waste gas treatment techniques (Meier, 1997). It considers only the
material and energy consumption contributing to 95% of the total ecologicalburden using standard background data generally accepted for LCA. The
ecological benefit is calculated as the amount of VOC [kg] removed
multiplied by a weighting factor (Table 3.5). The ecological burden is the
consumed raw material and energy as well as the production of by-productsmultiplied with a specific weighting factor (Table 3.5). The weightingfactors are calculated with a classification method (Eco-Indicatormod 95
(Meier, 1997)) which includes the potential for smog formation, global
warming, ozone layer depletion, photochemical ozone formation,
acidification, eutrophication, odour, human toxicity, ecotoxicity and other
impact categories. It is also weighted for the area considered and the number
of people affected.
The weighting factor for the electrical energy is different depending on
where the electricity is produced (Table 3.5). Electricity produced in
Switzerland (CH) has a high share of hydro- and nuclear power which, in
this method, have a lower ecological impact than the European electricity

48
mixture (UCPTE) which is predominantly produced by combustion of fossil
energy resources (Frischknecht et al., 1996).
The ecological burden of the bio-trickling filter was calculated with the same
short-cut method as used for biofilters (Meier, 1997). The method was
adjusted by excluding disposal and transportation of the packing material and
including the mass flow of TOC in the waste water (Table 3.6). A similar
short-cut method is suggested in Table 3.7 to calculate the ecological burden
of the non-thermal plasma. It is, however, not based on a detailed life cycle
analysis and should be considered as a rough estimation.
Table 3.5. Weighting factors for the calculation of the ecological
benefit and burden (Meier, 1997).
Weighting factor
Ecological [points per kg Ecological Weighting factor
Benefit removed VOC] Burden [points per unit]
Toluene 0.0895 steel (low alloyed) 0.01375 kg-1Acetone 0.0260 activated carbon (new) 0.0138 kg-1DCM 0.0731 waste water 0.0207 kg"1 TOC
PCE 0.717 electricity (UCPTE) 0.00102 kWh-1
electricity (CH) 0.000084 kWh"1
CC-2 (VOC final product) 0.00019 kg"1NOx as NO2 0.079 kg"1CO O.OOOSakg"1
aCalculated from the ratio of the weighting factors for CO and CO2 used in the Swiss
Ecopoints LCA-method (Meier, 1997)
UCPTE=Union pour la coordination de la production et du transport de l'électricité,
CH=Switzerland, DCM=dichloromethane, PCE=perchloroethene

49
Table 3.6. Factors included to calculate the ecological burden of the
bio-trickling filter. Adapted from Meier (Meier, 1997).
General data Materials Energy and degradation products
lifetime [years]
hours of operation [h year1]waste gas volume [m3h_1]
steel [kg]
polystyrene [kg]
electricity [kWh]
C02 [kg]
TOC [kg]
Table 3.7. Factors included to calculate the ecological burden of the
non-thermal plasma reactor.
General data Materials Energy and degradation products
lifetime [years]
hours of operation [h year1]waste gas volume [m3h_1]
steel [kg]
activated carbon [kg]
electricity [kWh]
C02 [kg]

50
4. Bio-Trickling Filter: Experimental Results
This chapter contains a characterisation of the biological activity and of the
bio-trickling filter. It also reports on the measured elimination capacity and
removal efficiency for toluene which is essential for the evaluation of a full
scale bio-trickling filter (Chapter 7.1). The elimination capacity is defined as
FgEC =
TT (Ctol,in " Ctol,out ) t4-1]vr
where EC is the elimination capacity [g m^h-1], Ctoi,in the toluene inlet gas
concentration [g nr3], Ctoi,out the toluene outlet gas concentration [g nr3], Fgthe gas flow [m3h-1] and Vr the reactor volume [m3]. The elimination capacity
is often displayed versus inlet load [g m-3h4]
Ctol,in FgLoad = [4.2]
Vvr
The removal efficiency is defined as
RE = 100(CtoUn " Ctol-out }
[A3]c^ tol,in
where RE is the removal efficiency [%].
The performance of the bio-trickling filter was studied over approximately
one year. During this time, excess biomass was removed from the packing on
four occasions. The bio-trickling filter was re-inoculated using the biomass
saved from the previous culture. The following results originate mainly
from the second and fourth culture.

51
4.1 Characterisation of the Bio-Trickling Filter
4.1.1 Biomass Accumulation
Biomass accumulated on the packing forming a biofilm up to 2 mm thick.
The biomass accumulation was measured by removing the packing elements
from the column and determining the wet weight of each element. This
includes not only the cell mass but also the water enclosed by the biofilm.
The water content ranged between 95.1% and 98.4% which was determined
at the end of two different cultures. The wet weight increased rapidly after
inoculation but its accumulation rate decreased during the time of operation
(Figure 4.1), probably due to the higher shear forces acting upon the
biofilm. The shear forces are proportional to the interpore gas velocity
(Peyton and Characklis, 1993) which will increase as the biofilm grows
thicker and reduces the bed porosity (Figure 4.1).
The biomass was not homogenously distributed on the packing but tended to
be more concentrated in the centre part of the reactor (Figure 4.2). In the
top part of the column, the biomass accumulated more slowly probably due
to the lower toluene concentration which decreased along the column height.
0
Bed porosity2nd Culture
4th Culture
10 20
Time [d]30 40
Figure 4.1. Bed porosity (4th culture) and biomass wet weight for two
different cultures.

52
The effect may also have been due to different hydrodynamic conditions
close to the liquid inlet. The low amount of biomass in the lower part of the
column can not be explained by toluene inhibition because the toluene
concentration was too low to cause any inhibition (0.40 g m-3). It may have
been due to channeling of the liquid flow which may have led to drying out
of the non-wetted part of the biofilm because of the low relative humidity
(2%) of the inlet air. This would have reduced the water activity in the
biofilm which leads to growth inhibitation (Schönduve et al., 1996; Mairitsch
and Friedl, 1997).
Figure 4.2.
.^
coCO
£ç
*->
(D
2
Bottom
Column height
CD
E
Biomass distribution on the packing (4th culture) as a
function of time and column height (1.05 m in five
segments)
4.1.2 Pressure Drop
The higher interpore gas velocity did not only cause high shear forces but
also caused the pressure drop to rise, which is proportional to the gas
velocity squared. The connection between high pressure drop and high shear
forces explains the strong correlation between the amount of suspendedbiomass in the recirculating liquid and the pressure drop (Figure 4.3).
Detachment of bacteria or parts of the biofilm is a commonly occurring

53
process which takes place at different rates mainly depending on the amount
of attached biomass and the hydrodynamic conditions (Speitel and DiGiano,
1987; Peyton and Characklis, 1993). At high interpore gas velocities, the
pressure drop is high and the high shear forces cause the microorganisms to
detach from the biofilm into the liquid. The pressure drop fell when the
packing was removed from the column for determining the bed porosity
(Chapter 3.1.2). This obviously opened new gas flow channels, although the
bed porosity did not change.
The pressure drop increased very rapidly and already ranged between 400
and 600 Pa/m after a few weeks of operation. This is about a factor of 10
higher than the pressure drop measured in other similar bio-trickling filters
described in the literature (VDI, 1996; Hekmat et al., 1997; Rüdiger, 1998).
The reason for this variance is unclear. The rapid clogging observed here
may have been due to too small a pore size of the packing, or due to a very
high accumulation rate of biomass. Excess production of extracellular
polymer substances with rapid clogging as result has been observed with
nitrogen limitation (Hekmat et al., 1997). Nitrogen limitation may have
occurred in those parts of the biofilm not wetted by the liquid flow due to
channelling of the liquid flow.
la 200 -
q. 150 4-o
CD
CO
CO
CD
100 --
0
Pressure dropSuspended biomass
10
Time [d]
15 20
COCO
CO
Eo
1q
Q.CO
CD
Figure 4.3. Pressure drop and suspended biomass concentration (g dry
weight per litre) in the recirculating liquid versus time (4th
culture).

54
4.1.3 Liquid Hold-Up
The gas phase fraction of the reactor volume decreased not only due to
reduced bed porosity but also due to the increased liquid hold-up. It was
determined by weighing the whole column with and without circulating
liquid and calculating the difference. It rose quickly in the beginning of the
culture, probably because the biofilm area increased, but decreased slightlyafter 25 days of operation (Figure 4.4). This may have been caused by
clogging of the liquid flow paths due to excess biomass growth.
15 -r
0 40 80
Time [d]
120
Figure 4.4. Liquid hold-up (normalised to the reactor volume) as a
function of time and liquid flow (2nd culture).
4.1.4 Oxygen Limitation
By analysing the circulating liquid, large amounts of acetic acid (12 g m-3)
and formic acid (2 g m-3) were detected. They may have originated from
decomposed polysaccharides which contain carboxyl groups (Schmitt et al.,
1995). Accumulation of organic acids has also been observed at oxygen
limitation (Devinny and Hodge, 1995). To determine if the biological activity
was limited by oxygen or not, the elimination capacity was measured at an
elevated inlet oxygen concentration, that is 30.9%. The elimination capacity

55
was, however, not improved compared to the elimination capacitydetermined at normal oxygen concentrations, that is 20.9% (Figure 4.5). The
acids may, however, still have been produced as a result of oxygen
limitation. The upper layer of the biofilm was a loose whitish thin gel,whereas the thicker layer below was more dense and had a darker colour
(brownish to black). This suggests that toluene was mainly degraded in the
upper thin layer where oxygen was not limiting. In the deeper layers of the
biofilm, however, anaerobic conditions may have been dominating, resultingin the acidic degradation products. A similar layered structure of the biofilm
has also been observed in other bio-trickling filters (Hugler et al., 1996).
day 6
02 cone.
0 400 800 1200
load [g m"3 h"1]1600
Figure 4.5. Elimination capacity (EC) at elevated oxygen concentration
(30.9%) compared to EC at normal oxygen concentration
(20.9%) on day 6 and 15 of the 4th culture.
4.1.5 Carbon Mass Balance
Toluene was the only carbon source, fed through the inlet gas. The carbon of
the removed toluene either accumulated in the reactor system as biomass or
left it through the gas phase as CO2 or through the purge liquid as carbonate,
suspended biomass or as dissolved organic compounds, such as short chain
organic acids and soluble polymers (Figure 4.6). Soluble polymers are
produced by filamentous bacteria or from the decomposition of dead bacteria
in the biofilm (Arcangeli and Arvin, 1995). The purge liquid was analysed

56
for its carbonate concentration, biomass content and its content of dissolved
organic substances, measured as total organic carbon (TOC). The carbon
yield coefficients of the different carbon containing end products were
calculated as the relation between the amount of carbon found and the
amount of carbon removed during a specific period of time (At, usually 3-4
days)
Ytoc=
StOC *WT0C
ACtol 4>tol Fe
Y =
ACC02 frcQ2 Fg + Shcq3- V03- *WC°2
ACtol «,,„, Fg
AXmm
AtDW *bio + AXliq *bio Ppurge
YWOmaSS =
ACtol $tol Fg[46]
where ACtoi is the average difference of the inlet and outlet toluene gas
concentrations during At [g nr3], <J)toi the carbon content of toluene, Fg the
gas flow rate [m3 h-1], AXfiim the increase of the wet weight of the packing
during At [g], DW the dry weight of the biofilm (3.0%±1.1% of the wet
weight), (f»bio the carbon content of the biofilm (43.0% as determined byelemental analysis), AXnq the average dry weight content of the purge liquid
during At [g nr3], Fpurge the purge liquid flow [m3 lr1], Stoc the
concentration of total organic carbon (TOC, biomass subtracted) in the purge
liquid [g nr3], ACco2 the average difference of outlet and inlet CO2 gas
concentrations during At, (j)co2 the carbon content of C02, <|>hco3- the carbon
content of HCO3- and Shco3- the carbonate concentration in the purge liquid
[g nr3]. The sum of all carbon yield coefficients should be unity
(Ybiomass+Yt0C+Yc02= 1 )
The values of the three yield coefficients as well as their sum fluctuated
strongly (Figure 4.7). This was mainly due to the frequent changes in
biological activity as well as biofilm growth and detachment. It was also due
to the large error in the determination of the biofilm growth by measuring

57
the biofilm wet weight since the water content of the biofilm varied. The
yield of CO2 from toluene during steady inlet conditions increased duringstart-up and stabilised at approximately 0.6 gcarbon/gcarbon which is in the same
range as found for a similar bio-trickling filter by Tautz et al. (1992).
Carbon in
Qol,inCC02,in
Carbon out
Ctol,out
CC02,out
C02 «TOC aBiofilm
STOC
SHC03
Figure 4.6. Schematic flow
chart over the carbon mass flows
into and out of the bio-tricklingfilter.
3 6 7 8 9 10151617
Time [d]
Figure 4.7. The calculated
carbon yields from toluene and
their sum as measured for the 4th
culture.
4.1.6 Toluene Concentration Profiles
The toluene concentration profile along the column height was measured by
inserting a long needle through the sample ports in the glass column into pre-
made holes in the packing. Sample air was withdrawn by vacuum and
analysed by means of the mass spectrometer.
The concentration profile along the column height was found to be
approximately linear (Figure 4.8) which is typical for a zero order kinetic
process (Kirchner et al., 1996). This indicates that the biological degradation
(Monod kinetics is zero order for concentrations much larger than the value
of Ks) was the rate limiting step at the measured inlet toluene gas

58
concentration (0.40 g m-3). At lower inlet gas concentrations, the removal
process may become mass transfer limited. The removal process then
becomes first order exhibiting exponential concentration gradients along the
column height.
"0JZ
c
E
o
Ü
0sz
c
E_5o
Ü
outlet
1
0.8
0.6 -
0.4 --
0.2 -
0 -
inlet
0.0
outlet
1 --
0.8 -
0.6 --
0.4 -
0.2 -
0 -
inlet
0.0
Day 22
0.1 0.2
4-
0.3
Day 36
0.4
0.1 0.2
Toluene [g m"3]0.3 0.4
inlet/outlet
2-3 cm from wall
at the wall
4-6 cm from wal
Figure 4.8. Column concentration profile of toluene after 22 days (left)
and 36 days (right) of the 4th culture. The superficial gas
velocity was 206 mh4,

59
The measured concentration profile after 36 days shows that the toluene
concentration varies strongly across the column cross section (Figure 4.8).
The gas flow was no longer plug flow but clogging of the packing had led to
channeling and variable gas velocities. Also the fact that after 22 days as well
as after 36 days the concentrations along the wall was higher than in the
centre of the packing points out the effects of channeling. The lower gas
velocities in the centre of the packing led to longer gas residence times which
resulted in the lower measured toluene gas concentrations, e.g. 0.15 g m-3 at
0.15 m column height and 2-6 cm from the column wall. The variable gas
flow pattern, however, does not influence the overall elimination capacity of
a zero order elimination process, as long as the surface area of the active
biofilm remains the same and the concentration inside the filter does not
approach zero.
4.2 Elimination Capacity at Steady Inlet Gas Conditions
The elimination capacities of the 2nd and the 4th culture were measured over
two weeks, at constant inlet toluene gas phase concentrations of 0.25 g m-3
and 0.40 g m-3, respectively, and at a superficial gas velocity of 206 m h"1
(Figure 4.9) The elimination capacity quickly rose during the first days as
the biofilm area increased and it reached full capacity after 3-4 days. The
elimination capacity of the 4th culture was also measured with and without
circulating liquid, but it did not significantly influence the elimination
capacity (Figure 4.10). The circulating liquid was, however, necessary to
supply the biofilm with nutrients and controlling pH and saving the biofilm
from drying out.
The fluctuations of the elimination capacity at steady state inlet gas
concentrations were very large. The fluctuations may have been a
consequence of the natural variations in the micro-organism population as
observed in other biofilm systems (Bohn, 1996). It may also have been due
to the constantly changing gas and liquid flow pattern caused by growth and
loss of biofilm. Clogging of the flow channels in the packing may have
caused a larger share of the gas flow to flow along the wall. Here the contact

60
area between biofilm and gas is much smaller than in the packing, thus the
elimination capacity is reduced. This effect may have been accentuated by the
small column diameter to height ratio. Clogging may also have caused
channelling of the liquid flow. It may have led to nitrogen limitation in those
parts of the biofilm not directly in contact with the liquid. Also pH will dropin these parts of the biofilm due to the accumulation of organic acids.
Phosphor and nitrogen limitation as well as low pH have been observed to
reduce the toluene degradation rate (Hekmat and Vortmeyer, 1994;
Schönduve et al, 1996; Hekmat et al., 1997; Sorial et al., 1997).
4th Culture, Ct0|,in 0.40 g m"3
2nd Culture, Ctoi,in0.25 g m-3
" 60 --
5 10 15
Time [d]20
Figure 4.9. Measured toluene
elimination capacities (EC) of the
2nd and the 4th culture versus
time at standard operatingconditions (Table 3.1) and steadyinlet toluene concentrations.
Liquid flow 0.06 m3 h"
o No liquid flow
^ 60 -\ aK!c UW> V-, A
Vo-320-f >y^
Üw
0-
o
1 1 1 1
5 10 15
Time [d]20
Figure 4.10. Toluene elimin¬
ation capacity (EC) of the 4th
culture with and without
circulating liquid and standard
operating conditions (Table 3.1).

61
4.3 Elimination Capacity at Fluctuating Load
The elimination capacity of peak loads was measured by applying short (10
minutes) pulses of higher inlet toluene gas concentrations at three different
superficial gas velocities. The elimination capacity increased with higherinlet peak concentrations up to a maximum value (Figure 4.11). The
maximum elimination capacity was in the same range as observed for toluene
in other similar bio-trickling filters (Ottengraf, 1986; Diks and Ottengraf,
1991a; Pedersen and Arvin, 1995; Heits et al., 1997; Laurenzis et al., 1998).
The dependence of the maximum elimination capacity on the superficial gas
velocity was, however, untypical. This may have been due to a greater liquid
hold-up caused by the higher gas superficial velocities. Since the bio-
trickling filter was operated counter-current, the liquid may have flooded the
smaller gas flow channels, thus decreasing the contact area between the
biofilm and the gas phase. The dependence of the maximum elimination
capacity on the superficial gas velocity may also have been caused by a
systematic error in the concentration measurements. Since the difference
between outlet and inlet gas concentrations of toluene was very small (less
than 5% relative difference) at high inlet concentrations, a relative analyticalerror of 1% would cause the elimination capacity to vary up to 14%. It was,
however, not possible to detect such a small systematic error since the
random error of the gas analytics was in the same range.
OLU 0
103 m h'1
206 m h-1
500 1000
Load [g m-3 h-1]1500
Figure 4.11. The highest measured elimination capacity (EC) for peakloads (4th culture) at standard operating conditions (Table
3.1) as a function of the superficial gas velocity.

62
4.3.1 C02 Production under Dynamic Conditions
The CO2 production rate is a measure of biological activity and is coupled to
the toluene degradation rate (Chapter 2.1.3). The CO2 yield coefficient from
the toluene degradation, Yco2/tob and the CO2 production from other carbon
sources, Kco2 in Equation 2.4, could be determined by measuring the CO2
production as a function of the toluene removal rate at steady-state by
changing the toluene inlet concentration (Figure 4.12). The value of Yco2/toi
was determined by the slope and Kco2 from the axis intersection.
00
I
E
c
.04—"
Ü
oo
Oo
200j
150 --
100 --
50 4
0
A
o
103 m/h
206 m/h
tol/C02=1.27±0.07
0 25 50 75
3u-1-
100
Toluene removal [g m h" ]
Figure 4.12. CO2 production of the 4th culture at steady toluene inlet
concentrations as a function of the toluene removal rate at
standard operating conditions (Table 3.1).
The CO2 production under transient conditions was measured by stopping the
toluene feed and measuring the toluene and CO2 outlet concentrations on-line
with the mass spectrometer. As expected, the toluene outlet concentration
always dropped quickly to low values when the feed was stopped (Figure
4.13, left half). The CO2 concentration also dropped but only for toluene
inlet concentrations lower than 1.6 g m-3. At higher toluene concentrations,
the CO2 production increased initially as the toluene feed was stopped

63
(Figure 4.13 and 4.14). After some minutes, it dropped again, havingformed a characteristic CO2 peak. This behaviour was reproducible at pH 7.8
as well as at pH 6.5, thus the observed increase of the CO2 production
originated from biological degradation of toluene and not from conversion
of carbonate to CO2 due to pH changes. The CO2 peak can be explained by
the inhibition of the toluene degradation rate at high concentrations of
toluene. Substrate inhibition of toluene has been observed before in batch
experiments with Pseudomonas putida (Mirpuri et al., 1997) but not in-situ
with a whole biofilm. The formation of the CO2 peaks is explained and
discussed in more detail in Chapter 6.2 where the CO2 production under
transient conditions is simulated using a dynamic mathematical model.
c
Inlet toluene cone, [g m"3]
0.3Time [h]
0.6
Figure 4.13. The responses of the toluene and CO2 outlet concentrations
(4th culture) from stopping the toluene feed at a low (0.8 g
m-3) and a high (6.4 g m-3) toluene inlet concentration at a
superficial gas velocity of 103 m h-1 and standard operatingconditions (Table 3.1).

64
n 2.2
J>1-8 +cm i 4 4r
01.4-1-
O 1.0
0.4
Toluene inlet conentration [g m" ]0.8 1.6 3.2 6.4 12.8
103 m h"1
« 1.3-
£
0)1-1 +
CM
Ö0.9 +
0.7206 m h
Time 15 min
Figure 4.14. The dynamic response of the CO2 outlet concentration when
stopping the toluene feed at different toluene inlet
concentrations (up to 12.8 g m-3 toluene at 103 m h-1 and up
to 6.4 g m-3 toluene at 206 m h-1). The upper line is the CO2
outlet concentration measured at a superficial gas velocity of
103 m h-1 and the lower line at 206 m h-1. The arrows
indicate when the toluene feed was stopped.
4.4 Discussion
Some of the observed phenomena could not be satisfactorily explained, such
as the strongly fluctuating elimination capacities. This is because the bio-
trickling filter was characterised only by measuring macroscopic parameters,such as biomass accumulation, pressure drop as well as the inlet and outlet
gas concentrations. The biological activity and the observed macroscopic
parameters are, however, governed by the microscopic conditions within the
biofilm which could not be anaytically investigated in this work. This makes
it difficult to understand and explain the dynamic behaviour of the bio-
trickling filter. Knowledge from other biofilm systems must be used with
caution since every biofilm is unique and two biofilms never look the same.

65
The experimental results indicate that an even water distribution over the
packing is important for a well functioning bio-trickling filter. The water
distribution in the experimental set-up can be improved by dividing the
packing into segments. Between the segments, the water flowing along the
wall is collected and re-distributed over the packing. In a full scale bio-
trickling filter, water flowing along the wall is probably a minor problemsince the column diameter to height ratio is larger.
For any industrial application, the low conversion of toluene into CO2 (0.6
gcarbon/gcarbon) must be taken into account. The waste gas problem is, to a
large extent, transformed into a wastewater problem since the carbon not
mineralised will leave the reactor through the purge liquid as dissolved
organic compounds or as organic particles, like cells or biofilm fragments.The treatment of the wastewater in a wastewater treatment plant must thus be
included when planning a full scale bio-trickling filter.

66
5. Non-Thermal Plasma: Experimental Results and
Proposed Reaction Pathways
This chapter is a report on the removal of toluene by gas phase oxidation
in the non-thermal plasma and on the intermediate oxidation products
produced in the gas phase and by ozonation in aqueous solution. The
possible reaction pathways leading to the intermediate products found are
also discussed.
5.1 Removal Efficiency in the Dibarrier Discharge Reactor
The removal of toluene by direct gas phase oxidation in the dibarrier
discharge reactor was studied at 25°C. The removal efficiency of toluene
depended on the air humidity (Figure 5.1), probably due to a higher
concentration of *OH radicals which are produced from electron impact
dissociation of water and other discharge related processes in humid air
(Chapter 2.2.2). The removal efficiency as a function of toluene
concentration and energy input, was determined at 65% relative humidity
(Figure 5.2). For the same energy input, higher degrees of removal were
achieved at lower toluene concentrations. The energy efficiency, however,
decreased with lower toluene concentration (Figure 5.3) because a larger
fraction of the reactive species reacted among themselves and/or with
other neutral molecules than toluene. The g-values were not considerably
influenced by the gas residence time (error bars in Figure 5.3).

CO>O
E
CD
CDi_
O)CD
Q
80j
60 --
40 --
20 --
0
0
67
2.5% relative humidity
100% relative humidity
20 40 60
Energy input [kJ m ]
80
Figure 5.1. Toluene removal as a function of energy input and air
humidity at 0.1 g m-3 of toluene and 25°C.
CO>o
ECD
CDCDi_
O)
CD
Q
80j
60 -
40 -
20 --
0 --
0
0.21 g m
+ + + +
50 100 150 200
Energy input [kJ m'3]
0.34 g m"
0.82 g m"
1.38 g m"
3.32 g m"
250
Figure 5.2. Degree of toluene removal as a function of initial toluene
concentration and energy input at 65% relative humidityat 25°C.

68
^ou -
^7-200 -
\^^
XL 150 - \ ^~^^
»
100 -
nL>^-==
q
50 -
JL 1L
0 - 1 1— 1
0
Toluene inlet cone, [g m" ]
-r 0.6
--0.4
-0.2
0
>CD
O
O
o
_ÇDo
E
CO
CD
_3CO>
Figure 5.3. Measured energy efficiencies in kWh per kg removed
toluene and in g-values at 25°C, 65% relative humidity
and at a energy input of 54 W. The error bars indicate the
influence of the gas residence time (0.31 to 1.05 s)
5.2 Inorganic By-Products Formed
Ozone was produced in concentrations up to 1.4 g m-3 at 0.1 g m-3 toluene
inlet concentration in dry gas (Figure 5.4). The g-values for the ozone
formation ranged between 1.8 and 6.4. Ozone formation was much
reduced in presence of toluene and water, maybe because 0(3P)-radicals,
which are necessary for the ozone production, were scavenged by OH-
radicals, toluene or other reactive species formed from toluene and water.
Water vapour also changes the discharge itself which also may have
contributed to the reduced formation of ozone (Teich, 1998).
Nitrate was detected in the cold trap corresponding to gas phase
concentrations of up to 10 mg nr3 (Figure 5.4). Nitrite was also detected,
but in concentrations about two orders of magnitude lower. Nitrate and
nitrite may have been formed from NO, NO2 or N2O5 reacting with *OH-
radicals or water to HN02 and HNO3 (Gentile and Kushner, 1995). NyOx,
including N2O, are formed in the reactive zone from different reactions
between nitrogen and oxygen (Gentile and Kushner, 1995). It seems that
less nitrate is formed at higher concentrations of toluene, maybe because
the probability of reaction of reactive oxygen species with nitrogen
compounds is reduced.

69
^ 0 20 40 60
Energy Input [kJ m"3]2.5% r.h.
100% r.h.
0.1 g m"
0.1 g m-3
-a- 0.8 g m"
-A- 0.8 g m"
80
Figure 5.4 Ozone (top) and nitrate (bottom) formation at different
toluene concentrations (0.1 and 0.8 g nr3) and relative
humidities (r.h.) at 25°C.
5.3 Toluene Oxidation Products and Reaction Mechanism
The formation of intermediate oxidation products of toluene was
experimentally investigated by direct gas phase oxidation in the dibarrier
discharge as well as by ozonation in aqueous solution. This allowed a
comparative study of the intermediate products formed and the oxidation
mechanisms involved.

70
5.3.1 Intermediate Oxidation Products Formed in the Gas
Phase
In order to study the formation of intermediate oxidation products in the
gas phase, toluene was oxidised at low plasma energy inputs, i.e. up to
63 kJ nr3. The major oxidation products were an aerosol deposit (Chapter
5.3.2), CO2 and organic acids with approximately the same relative shares
in humid and dry air. Identified aromatic products were benzyl alcohol,
benzaldehyde, benzoic acid and cresols (Table 5.1). These were formed in
very small amounts, except for benzoic acid. Amounts of aliphatic
aldehydes found were one order of magnitude smaller than the amounts of
organic acids detected, probably due to the lower reactivity of organicacids with respect to onward reactions. Oxidation products detected were
similar to those found from the discharge oxidation of xylene (Hirota et
al., 1995). The reaction pathways and mechanisms leading to the oxidation
products found are discussed in Chapter 5.3.3.
The formation of aldehydes and acids reached a saturation or decreased
with increasing energy input whereas the formation of C02 continued to
increase (Figure 5.5). This is typical for consecutive reactions
QH5CH3 -> CxHyOz -» C02 + H20 [5.1]
where CxHyOz are formed as intermediate oxidation products. The
detected organic compounds are thus assumed to be intermediate products
subject to further reactions in the mineralisation of toluene. The
mechanisms controlling the oxidation pathways depend on target
molecule, matrix gas and discharge conditions (Chapter 2.2.2).

71
Figure 5.5. Carbon content of unreacted toluene (thick line)
compared to carbon content of acids, aldehydes and
carbon dioxide formed (thin lines) in air with low
(broken lines) and high (continuous lines) relative
humidity (r.h.) at 25°C. The carbon content of the
deposits are excluded. The toluene inlet concentration was
0.1 g m-3.
The total carbon recovery was less than 70% which may be attributed to
formation of oxidation products not determined, e.g. carbon monoxide
(CO) which under similar experimental conditions has been found to be a
major oxidation product of toluene (Yamamoto, T. et al., 1993; Chang,
M. B. and Chang, C.-C, 1997). CO could not be analysed in the mass
spectrometer because its mass fragments are interfered with by nitrogen
(niN2/Z=28) and by compounds containing carbon (mc/Z=12) and oxygen
(mo/Z=16), that is toluene, CO2 and O2. Carbon was also lost through
aerosol formation, of which only the aerosol deposited in the reactor was
quantitatively determined (Chapter 5.3.3).

72
Table 5.1 Recovered carbon in detected products [%]. The
intermediate products were determined at 0.8 g m-3 and
1.6 g m-3 toluene and at 32 kJ nr3. Dry and humid air
means 2.5% and 100% relative humidity at 25°C,
repectively.
Experimental conditions Recovered carbon in products referred to toluene removed
Toluene Deposit co2 Benzyl Cresol Benzoate
Inlet gas removed [%] [%] alcohol [%] [%] [%]
0.8 g m-3, dry air 7% 38 7.2 n.d. n.d. 0.20
1.6 g m-3, dry air 5% 49 9.7 0.0005 0.0013 0.18
0.8 g nr3, moist air 11% no data 7.3 n.d. 0.0024 0.23
1.6 g ni"3, moist air 8% 31 6.9 0.0016 0.0047 0.14
n.d. means not detected
Table 5.1. (continued)
Recovered carbon in products referred to toluene removed
Acetate Formate Pyruvate Glyoxalate
[%] [%] [%] [%]
Maleinate
[%]
Oxalate
[%]
2.8 2.4 0.15 0.43 0.11 0.13
5.6 5.1 0.33 0.20 0.092 0.092
3.6 3.8 0.14 0.10 0.11 0.065
2.4 2.3 0.074 0.11 0.074 0.031
Table 5.1. (continued)
Recovered carbon inproducts_ referred to toluene removed
Benzaldehyde Formaldehyde Acetaldehyde Glyoxal
[%] [%] >] [%]
Methylglyoxal
[%]
0.012 0.0069 n.d. 0.0049 0.0030
0.010 0.0033 0.0004 0.0014 0.00066
0.012 0.0041 0.0004 0.0019 0.0040
0.015 0.0019 0.0003 0.0019 0.0034

73
5.3.2 Aerosol Formation
The observed aerosols were deposited as a yellow-brown film in the
reactor and in the tubing connected to the reactor outlet. Similar depositsfrom toluene oxidation in barrier discharge reactors have also been
observed by other researchers (Yamamoto, T. et al., 1993; Hirota et al.,
1995). The aerosol deposit was probably a mixture of different
compounds. The deposit contained an average of 42% carbon, 52%
oxygen, 1.3% nitrogen and the balance hydrogen as determined byelemental analysis. It contained 30% particulate matter which was not
soluble in water. The soluble part contained very small amounts of short
chained aldehydes and acids. The biological oxygen demand (BOD5) and
the chemical oxygen demand (COD) of the soluble part was analysed
(Chapter 3.2.5). The biological oxygen demand (BOD5, 0.27-0.31 g02 g-
l) was lower than chemical oxygen demand (COD, 0.92-1.16 g02 g"1),thus it was only partially biodegradable. A mass spectrum of the deposit
was analysed by electron impact (VG Tribrid, Micromass, Manchester,
England). The deposit was heated in vacuum and evaporated compoundswere analysed. The highest mass revealed was 194 (Figure 5.6), thus the
deposit is believed to contain highly oxygenated condensation products.Size exclusion chromatography (Chapter 3.2.5) revealed no polymeric
compounds. Yamamoto, T. et al. (1993) analysed the deposit with
infrared spectroscopy and found the functional groups OH, NH, C=0,
C=C, aromatics and indications of CN. A possible nitrogen containing
compound is methylamine which was found in aerosols produced in
discharges (Yamamoto, T. et al., 1996). Nitrogen may also be included bythe reaction of NOx with toluene (Atkinson, 1990). Investigation of a
similar deposit found after treating toluene in a pellet barrier reactor
made by Rückauf (1998), revealed a content of polyaromatic compounds,
biphenyls and alkanes. Ozone is known to oxidise the surface of soot
particles (Matter et al., 1995), and similar oxidation of aerosols and
deposit in the reaction zone seems feasible.
The mechanism of aerosol formation is not well understood (Chang, J.-S.,
1993). Ions produced in the discharge may induce aerosol formation and
enhance aerosol growth (Chang, J.-S., 1983). Furthermore, neutral
compounds are known to form aerosols in the atmosphere, e.g. nucleation
of difunctionally substituted alkane dérivâtes (Finlayson-Pitts and Pitts,
1986), recombination of aromatic or peroxy radicals (Franz, 1991) and

74
nucleation of HNO3 and water (Seinfeld, 1986). The formation of a
deposit has also been observed in reaction of 0(3P) with toluene (Gaffneyet al, 1976).
200
Figure 5.6. Mass spectrum of the volatile compounds in the deposit.
5.3.3 Proposed Reaction Pathways for the Gas Phase Oxidation
Several mechanisms and reactive species are responsible for the toluene
decomposition as described in Chapter 2.2.2. Initial reactions of toluene
with the *OH radical lead to addition to the ring or to a benzyl radical
through hydrogen abstraction from the methyl group (Figure 5.7). Benzylradicals react rapidly with oxygen molecules to benzylperoxy radicals.
The benzylperoxy radicals may react further by hydrogen abstraction or
with NO to form N02 and the benzoxy radical (Atkinson, 1990; Franz,
1991)
C6H5CH2- + 02 -> C6H5CH200'
C6H5CH200* + NO -> C6H5CH20' + N02
C6H5CH200' + -H02 -> C6H5CH200H + 02
[5.2]
[5.3]
[5.4]

75
Hydrogen abstraction by the benzylperoxy radical from another toluene
molecule, so called auto-oxidation, is slow at temperatures below 420K
(Elmaimouni et al., 1993). Benzylperoxy radicals rather abstract
hydrogen from hydroperoxy-radicals (*H02) or aldehydes. The
hydroperoxide formed may decompose to a benzoxy radical and an 'OH
radical (Atkinson, 1990)
C6H5CH2OOH -» C6H5CH20- + 'OH [5.5]
'CH2'H abstraction
benzyl radical
I
O2 addition
H2COO'reaction
with NO
benzylperoxyradical
CH3 'O or 'OH
'/VS addition
o\toluene
CH3
benzoxyNO2 radical
cresol
^abstraction
°2 addition
H02
HC=0
Obenzaldehyde
Figure 5.7. Suggested initial reactions of toluene leading to
benzaldehyde, benzyl alcohol and cresol detected in this
work. Adapted from Atkinson (1990).
Benzoxy radicals may react further by hydrogen abstraction to benzylalcohol (Franz, 1991), or by oxygen addition to benzaldehyde and *H02
(Atkinson, 1990)
C6H5CH20' + H-R -» C6H5CH2OH + R*
C6H5CH20' + 02 -> C6H5CHO + 'H02
[5.6]
[5.7]

76
Benzaldehyde formed from toluene is subject to hydrogen abstration by*OH radicals but probably not to ring addition (Figure 5.8) (Atkinson,
1990). The benzoyl radical formed may react further with oxygen to a
peroxy radical and subsequently with NO to form N02 and a benzoyloxyradical (Atkinson, 1990)
C6H5CHO + *OH -> C6H5CO* + H20
C6H5CO- + 02 -> C6H5C(0)00-
C6H5C(0)00'+ NO -> C6H5C(0)0-+ N02
[5.8]
[5.9]
[5.10]
Benzoyloxy radicals are easily decarboxylated but may also form benzoic
acid by hydrogen abstraction from an aldehyde (Neely et al., 1992;
Griffith and Barnad, 1995)
C6H5C(0)0' -> C6H5-+ C02
C6H5C(0)0' + RCHO-^ C6H5C(0)OH+ RCO*
[5.11]
[5.12]
HC=0
'H abstraction
benzaldehyde
*ooc=o
benzoyl radical
O2 addition
benzoyldioxy 'O or 'OH radical addition
radical
phenol quinone
(Q>c°2phenyl radical
I s\ decarboxylation
reaction with NO OC=0 / HOC=0
'H addition or
H abstraction
N02 benzoyloxyradical
Figure 5.8. Assumed reactions of benzaldehyde leading to detected
benzoic acid. Adapted from Atkinson (1990).

77
A termination reaction of the benzoyloxy radical with a H* radical would
also lead to benzoic acid. The phenyl radical formed may react further
with an oxygen molecule or with an 'O or 'OH to a phenol or a quinone
(Neely et al, 1992).
Further addition of 'O and 'OH to the ring leads to ring opening. A ring
opening mechanism for *OH radicals has been suggested by Atkinson et al.
(1980) where ring opening proceeds via an oxygen bridging intermediate.
The chemistry of the ring opening fragments is complex and poorlyknown. The oxidation mechanisms are assumed to be mainly radical
reactions of 'OH, *0, *H02 , *H, alkyl, alkoxy, peroxy, acyl and acyloxy
radicals, similar to those radical reactions suggested for ring opening
products of aromatic compounds in aqueous solution (see further Chapter
5.3.5, Figure 5.10).
A known atmospheric reaction of *OH radicals is hydrogen abstraction
from aldehydes (Atkinson, 1990), but addition of 'OH to C=C double
bonds or to peroxy radicals is also possible. Toluene oxidation productsfrom reaction with 'OH under atmospheric conditions are similar to those
found in this work, i.e. aromatic compounds, short-chained aldehydes and
formic acid (Bierbach et al., 1993; Yu et al., 1997).
'O radicals may react with ring opening products by hydrogen abstraction
and addition to C=C double bonds forming aldehydes, epoxides and 'OH
radicals (Hucknall, 1985). Hydrogen abstraction by 'O has, however,
roughly a 3 times higher activation energy than hydrogen abstraction by'OH (Griffith and Barnad, 1995).
Alkoxy and peroxy radicals are precursors to aldehydes (Franz, 1991).
Peroxy radicals primarily react by hydrogen abstraction but may also
recombine to aldehydes and alcohols or add to C=C double bonds. Alkoxyradicals are more reactive than peroxy radicals and may form aldehydes
(Atkinson, 1990) by:
- decomposition to aldehyde and alkyl radical
- reaction with oxygen to form an aldehyde and *H02 radical.
Aldehydes are subject to hydrogen abstraction but probably not to
decarbonylation (Hucknall, 1985; Neely et al., 1992).
Formation of carboxylic acids in the gas phase probably proceeds via the
corresponding aldehydes. In the aqueous phase, peroxy radicals are also
known to decompose to acids, depending on the precursor (von Sonntag et

78
al., 1997). Acids are relatively unreactive in the gas phase (Atkinson,
1990) but may be subject to hydrogen abstraction. Pyruvic acid has been
observed to photolyse rapidly under atmospheric conditions to
acetaldehyde and CO2 (Grosjean, 1985).
Secondary ions and radicals, e.g. H30+ and *H02 may be formed in the
reaction zone (Chapter 2.2.2). *H02 may participate in the oxidation of
toluene. These reactions have, however, not yet been studied well
(Hucknall, 1985) and are probably slow due to high activation energies
(Griffith and Barnad, 1995). Suggested reactions in the atmosphere with
hydroperoxy radicals (Atkinson et al., 1980) are
ROO' + *H02 -> ROOH + 02 [5.13]
RH + *H02 -> R* + H202 [5.14]
Carbon monoxide and carbon dioxide are mainly formed from the
decomposition of acyl and acyloxy radicals (Franz, 1991)
RC'=0 ->R' + CO [5.15]
RC(0')=0 -* R' + C02 [5.16]
At temperatures below 55OK, acyl radicals may react with oxygen,
decomposing to C02 rather than to CO (Griffith and Barnad, 1995).
Decomposition of formaldehyde may also result in formation of CO
(Atkinson, 1990)
H2CO + 'OH -> HCO' + H20 [5.17]
HCO* + 02 -» CO + *H02 [5.18]
5.3.4 Intermediate Oxidation Products Formed by Ozonation in
Aqeous Solution
Ozonation of toluene was carried out in buffered solutions (100 g m-3
PO43-) as well as in unbuffered solutions at various pH (Table 5.2). In the
buffered solutions the pH dropped more slowly than in the unbuffered
solution which led to very low dissolved ozone concentration due to the
reaction of ozone with hydroxyl ions (Chapter 2.2.4). The fast
decomposition of ozone resulted probably in a higher concentration of
*OH-radicals, which may explain the slightly faster oxidation rate of
toluene in the buffered solution.

79
Table 5.2. Experimental conditions of the ozonation batch. Initial
concentration of toluene was 92 g m-3 in all experiments.
Buffer Initial pH pH at 90% Ozonation time for Dissolved O3
toluene removal 90% toluene removal [h] [g nr3]no 6.1-10.1 3.8-3.9 4.37-4.62 0.1-0.5
phosphate 8.9 7X) 3M <0.005
Approximately the same amounts of aliphatic aldehydes and organic acids
were found in the unbuffered solutions, whereas in the buffered solutions,the amounts of detected glyoxal and methylglyoxal were about one order
of magnitude lower than the amount of organic acids detected (Table 5.3).This may have been caused by a higher reactivity of these aldehydestoward *OH-radicals or by the fact that less aldehydes were formed due to
the low concentration of ozone. The only aromatic compound identified
was benzaldehyde which was formed in approximately the same amounts
in buffered and unbuffered solutions. The oxidation products detected
here were similar to those found in ozonation of other aromatic
compounds (Table 5.4).
Table 5.3. Detected organic ozonation products at 90% toluene
removal [g nr3]. Initial toluene concentration was 92 g m-3.
Product unbuffered phosphate buffer
acetate 24.0-26.4 22.8
formate 12.0-14.7 17.9
glyoxalate 4.4-28.9 31.8
maleinate 2.3 3.5
malonate 8.3 4.2
oxalate 3.6 5.4
pyruvate 16.7 4.4
X acids 71.3-100.9 90.0
benzaldehyde 0.7-0.9 0.6
formaldehyde 0.33-0.42 0.21
glyoxal 17.4-19.7 0.70
methylglyoxal 11.5-15.8 -

80
5.3.5 Proposed Reaction Pathways in Aqueous Solution
In Figure 5.9 a reaction scheme of the initial attack on toluene is
suggested. The initial attack of ozone on an aromatic compound can either
take place on the functional group or on the aromatic ring (Decoret et al.,
1984). Ozone adds to the aromatic ring in a similar way as it adds to a
double bond. The mechanism is not known but may be according to the
Criegee mechanism (Figure 2.6) or to the mechanism of electrophilicaddition (Figure 2.7) (Bailey, 1982; Decoret et al., 1984). Ring addition
leads to phenolic and quionone type ring retaining products and/or ring
opening products containing carbonyl and carboxyl groups (Legube et al.,
1983).
Table 5.4. Ozonation products in aqueous solution of selected
aromatic compounds.
Substrate Identified Oxidation Products Reference
toluene benzoate, oxalate, C02 (Oehlschlaeger, 1978)
benzoate, formate (Renard, 1895)
benzaldehyde benzoate, maleinate, 2-oxo-propan-dioic (Legube et al., 1983)
acid, oxalate, formate
o-cresol salicylic acid (o-hydroxy-benzoic acid), (Wang et al., 1989)
propanic acid, glyoxalate, oxalate, acetate,
formate
phenol catechol, hydroquinone, maleinaldehyde (4- (Yamamoto, Y. et al., 1979)
oxo-2-butenoic acid), muconic acid (2,4-
hexadienediacid), muconaldehyde (6-oxo-
2,4-hexadienoic acid), glyoxal, glyoxalate,
oxalate, formate, CO?
*OH-radicals react with aromatic compounds through addition to the ringand through hydrogen abstraction from the alkyl group. Pulse radiolysis
experiments indicate that 'OH-radical ring addition dominates over
hydrogen abstraction (Dorfman et al., 1964). 'OH-radicals add to the
aromatic ring in a analogous way to 'OH-radical addition to double bonds,
forming a cyclohexadienyl radical which reacts further with 02 to a
peroxy radical (Dorfman et al., 1962). This peroxy radical decomposes to

81
phenolic compounds, benzoquinone and *027'H02-radicals or to ring
opening products (Kunai et al., 1986; Getoff and Solar, 1988). Hydrogenabstraction of the methyl group leads to a benzyl radical which reacts
further with molecular oxygen to a benzylperoxy radical. It probably
decomposes by a termination reaction with a second peroxy radical to
benzaldehyde or to a benzoxy radical, but elimination of *02/*H02-
radicals, addition to an internal double bond and hydrogen abstraction are
also potential decomposition reactions (Feuerstein et al., 1981; von
Sonntag and Schuchmann, 1991). Likely end products of the peroxy
radical decomposition are *027'H02-radicals, 02, H202, alkyl radicals,
ketones, aldehydes and carboxylic acids.
'H abstraction
by 'OH radical
\"CH2
o.benzyl radical
02 addition
1H2COO'
benzylperoxyradical
OH/O2 addition
methyl-m/p/o-benzoquinone
OH
cresol
HCO*
Reaction
with
another
RCO2-
radical
RCHO + 02
benzoxy radical
+ RCH2OH + 02
or
HC=0
* [OJ +RCHO + H202
benzaldehyde
Figure 5.9. Suggested initial reactions of toluene in aqueous solution.
Adapted from Decoret et al. (1984) and von Sonntag and
Schuchmann (1991).
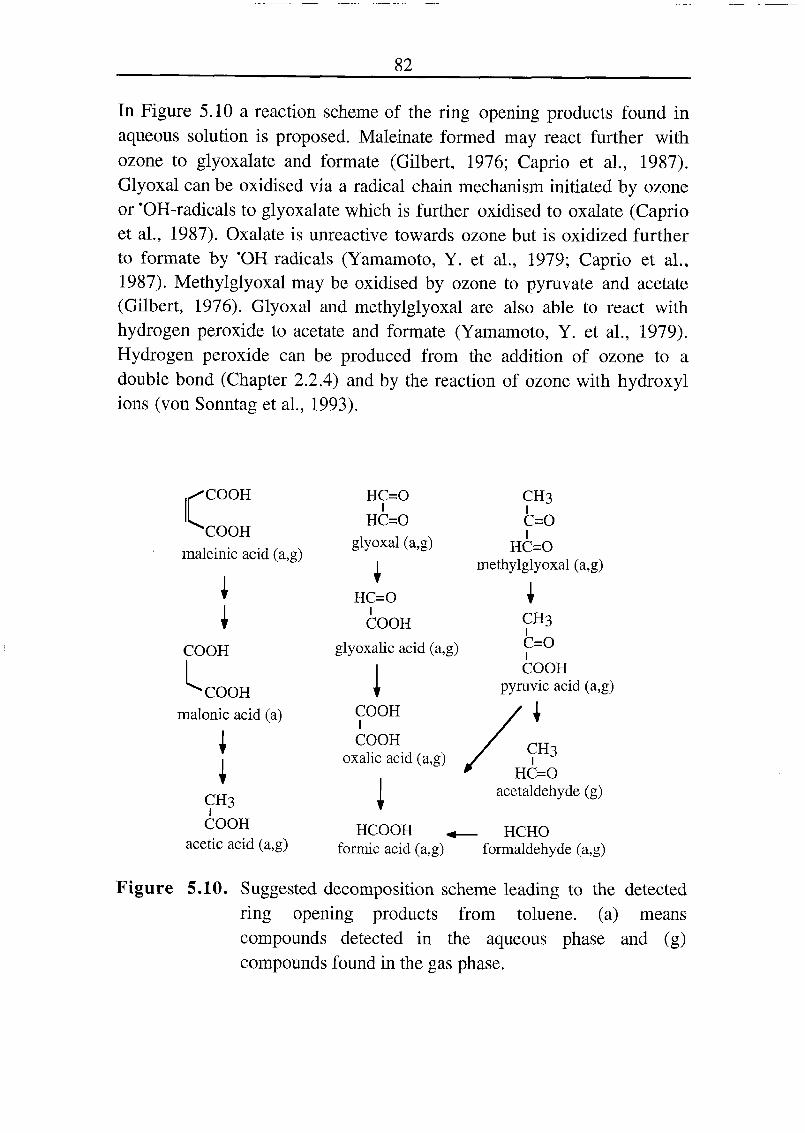
82
In Figure 5.10 a reaction scheme of the ring opening products found in
aqueous solution is proposed. Maleinate formed may react further with
ozone to glyoxalate and formate (Gilbert, 1976; Caprio et al., 1987).
Glyoxal can be oxidised via a radical chain mechanism initiated by ozone
or 'OH-radicals to glyoxalate which is further oxidised to oxalate (Caprioet al., 1987). Oxalate is unreactive towards ozone but is oxidized further
to formate by 'OH radicals (Yamamoto, Y. et al., 1979; Caprio et al.,
1987). Methylglyoxal may be oxidised by ozone to pyruvate and acetate
(Gilbert, 1976). Glyoxal and methylglyoxal are also able to react with
hydrogen peroxide to acetate and formate (Yamamoto, Y. et al., 1979).
Hydrogen peroxide can be produced from the addition of ozone to a
double bond (Chapter 2.2.4) and by the reaction of ozone with hydroxylions (von Sonntag et al., 1993).
/COOH
^COOHmaleinic acid (a,g)
I
ICOOH
^COOHmalonic acid (a)
I
I
ÇH3COOH
acetic acid (a,g)
HC=0
HC=0
glyoxal (a,g)
IHC=0
COOH
glyoxalic acid (a,g)
ICOOH
i
COOH
oxalic acid (a,g)
HCOOH
formic acid (a,g)
CH3I
c=oI
HC=0
methylglyoxal (a,g)
iCH3I
c=o
COOH
pyruvic acid (a,g)
acetaldehyde (g)
HCHO
formaldehyde (a,g)
Figure 5.10. Suggested decomposition scheme leading to the detected
ring opening products from toluene, (a) means
compounds detected in the aqueous phase and (g)
compounds found in the gas phase.

83
5.4 Discussion
In the ozonolysis of toluene in the aqeuous phase, the same oxidation
products were detected at low as well as at high pH, although the share of
"OH-radical reactions should be larger at high pH. The reaction pathwaysin Figure 5.10 have also been suggested for the ring opening products of
phenol at elevated pressure and temperatures in aqeous solution (Devlinand Harris, 1984). At these conditions the oxidation reactions are initiated
mainly by the oxygen radical, 'O. It seems that the reaction pathways of
the aromatic ring opening products may be initiated by several different
reactive species and that different reaction mechanisms lead to the same
oxidation products. This strongly suggests that the same reaction pathwaysknown for the oxidation of organic compounds in aqueous phase also
apply for the radical reactions of the same compounds in the gas phase
(Franz, 1991).
There are several reactive oxygen species created in the plasma, that is *0,*OH and 02+ (Chapter 2.2.2). It is difficult to reach conclusions on the
relative importance of these different species for the toluene
decomposition merely considering the intermediate products. The initial
concentration of *0 radicals in the reaction zone is approximately one to
three orders of magnitude higher than that of *OH radicals in humid air
(Jacob, 1993; Gentile and Kushner, 1995). The rate constant for the
reaction of 0(3P) with toluene is, however, about two orders of
magnitude smaller than that for 'OH at 298K (Atkinson and Lloyd, 1984),thus reaction rates of *0 and 'OH radicals with toluene (assuming second
order kinetics) should be approximately in the same range. The
concentration of 02+ in the discharge is about the same as that of 'OH
radicals (Jacob, 1993). The reaction rate with toluene is unknown but the
rate constant with CH4 is 510"12 cmV1 at 300K (van Doren et al., 1986).A similar rate constant with toluene would mean a reaction rate of the
same order as that of neutral radical reactions.
Besides the concentration of reactive species, the local reaction
temperature in the plasma can also play an important role in determiningthe dominant mechanisms. For instance, 'OH radicals are present only in
or near the streamer channel (Coogan and Sappey, 1996), where the
temperature locally may be of the order of 500K (Tochikubo, 1998). At
this high temperature, hydrogen abstraction and not ring addition is the

84
dominating reaction mechanism (Perry et al., 1977) which could explain
the small amounts of cresol observed.
Another mechanism for oxidation in the plasma not mentioned as yet is
photolysis, which for aldehydes is known to occur in the atmosphere
(Atkinson, 1990). Photolysis caused by radiation from relaxing molecules
may be an important mechanism for the decomposition of some
intermediate oxidation products but probably not for toluene itself.
Photolysis has been used to enhance VOC destruction in non-thermal
plasma processes (Falkenstein, 1997).
For the industrial application, a higher energy efficiency could be
achieved by utilizing the oxidation potential of ozone. This could be done
by adsorbing the organic compounds not oxidised in the plasma reactor on
activated carbon at the reactor outlet. Adsorbed compounds may then be
oxidised on the activated carbon by ozone. Ozone has been used to
regenerate activated carbon in other applications (Shugarman, 1991;
Paulsen, 1995). Also the use of metal catalyst, that is Mn203 combined
with silver, can be used to oxidise organic compounds at temperatures
above 125°C (Watanabe et al., 1996). Metal oxides, for instance Ag02,
NiO, C03O4, can also be used to oxidise VOC (Imamura et al., 1991).

85
6. Modelling
A model tries to explain, describe and to predict the behaviour of an
observed system. For engineering purposes, the model is described bymathematical terms which often are formulated as differential equations.
The mathematical models either describe the actual physical, chemical and
biological processes taking place in the system or they are empiricalcorrelations without relation to any natural phenomena. The purpose of
the model decides how close it has to describe reality. The mathematical
model can not always be solved analytically and then it has to be solved
numerically by computer simulation.
6.1 Ideal Reactor Models
The reactor models used here are considered ideal, that is phenomena like
back-mixing, dispersion, channelling and dead zones are not taken into
account. All reactor models are based on the laws of mass, energy and
momentum conservation, which means that all mass and energy entering
the system either leaves it or accumulates within it. Single components are
balanced by extending the mass balance equation with a kinetic term
describing the rate of mass conversion.
6.1.1 The Continuously Stirred Tank Reactor
The mass balance for a single component in an ideally mixed CSTR is
expressed in differential form as
d(VrCj)_
TT~~
g,in j,in"
g,out ^j,out + ^j ^r L°-1J
where d(Vr Cj)/dt is the change of mass of component j with respect to
time [g lr1], Vr is the reactor volume [m3], Cj the concentration of
component j [g nr3], Fg the flow rate [m3 lr1] and Rj the production or
consumption (when negative) rate [g nr3 lr1]. All concentrations in an
ideally mixed CSTR are assumed to be uniform, hence the concentration
in the outlet stream is the same as the concentration in the reactor.

86
6.1.2 The Tubular Reactor
In contrast to the CSTR, the concentrations in a tubular reactor vary
along reactor length. Assuming a constant flow rate F and expressing dV
as Ac*3h, the mass balance in differential form is
dC] Fs 9C;—- = - — + R : [6.2]at ac ah J
where Ac is the reactor cross sectional area [m2] and h the reactor length
(or height) [m]. This partial differential equation can be solved by
assuming a steady-state (3Cj/9t=0) which means that no time dependent
concentration changes occur. The differential equation is then solved by
integrating over reactor height. If the steady-state assumption is not valid,
the reactor length is often expressed in a finite-difference form by
approximating the tubular reactor with a series of CSTRs each formingindividual balance regions with the reactor height Ah. The accuracy of
this approximation increases with the number of CSTRs (Ah—>3h).
6.2 The Bio-Trickling Filter Model
The performance of the bio-trickling filter is described here by using two
models:
1) a steady-state model to simulate the elimination capacity at steady inlet
gas concentrations. It is used to calculate the size of a full scale bio-
trickling filter
2) a dynamic model to describe the dynamic behaviour of the CO2
production.
The gas flow in both models is assumed to be plug flow, thus the bio-
trickling filter can be modelled as an ideal counter-current tubular
reactor. The steady-state scale-up model contains equations for mass
transport in the gas phase by convection and a kinetic term for the toluene
degradation which is assumed to be the rate limiting step of the
elimination process. The dynamic model is divided into three sub-models:
the one, two and three phase models, to demonstrate the separate effects
of biodégradation kinetics and biofilm diffusion on the CO2 production
under transient conditions (Chapter 4.3.1). The three phase model

87
considers all three existing phases; gas phase, liquid phase and biofilm and
contains equations for mass transport in the gas phase by convection, gas
to liquid mass transfer, transport in the biofilm by diffusion as well as
toluene biodégradation.
6.2.1 The Steady-State One Phase Model
The purpose of the steady-state model was to calculate the gas residence
times needed in a full scale bio-trickling filter to reduce the inlet toluene
concentration to the legal limit. This model considers only one phase and
assumes that the degradation of toluene takes place in the whole reactor
volume
dCtol Ac—— = -
— Rtol [6-3]dh Fg
to1
where Rtoi is the toluene degradation rate per reactor volume [g m^h-1].
Both the Monod kinetics and the substrate inhibition kinetics (Chapter
2.1.3) could be used to calculate the toluene outlet concentrations and
removal efficiency. Neither the Monod kinetics nor the substrate
inhibition kinetics were, however, able to describe the influence of the
superficial gas velocity on the elimination capacity (Figure 6.1 and 6.2).
The Monod kinetics predicted the same maximum elimination capacity at
high loads for all gas velocities because of the zero kinetics assumed bythe Monod kinetics. For higher values of Ks, the maximum elimination
capacity was reached at higher loads (Figure 6.1). The substrate inhibition
kinetics also predicted the same elimination capacity at higher loads, but
only for values of IQ larger than 50 where the effect of the substrate
inhibition was negligible. For lower values of Kj, the elimination capacity
decreased at high concentrations of toluene (Figure 6.2).

88
150 -r
0
Figure 6.1.
500 1000
Load [g m"3h"1]1500
Simulated elimination capacities (thick lines) using the
Monod kinetics (Ks=0.2 g m-3) compared with experi¬
mental data (points with thin lines) for different
superficial gas velocities (SGV).
CO
E
150
100 --
S 50
0
0
Figure 6.2.
lower Ki
m /| i ^rît ~""—
-
if f*
Ift **'
W &£v '
-'1
-"-A -/ *
o- --J- o
^ SGV
---a-- 103 m/h—a-- 206 m/h—o- 412 m/h
I \ 1
500 1000
Load [g nrV1]1500
Calculated elimination capacities (thick lines) using the
substrate inhibition kinetics (Kj= 30 g m-3, Ks =0.1 g m-3)
compared with experimental data (points with thin lines)for different superficial gas velocities (SGV).
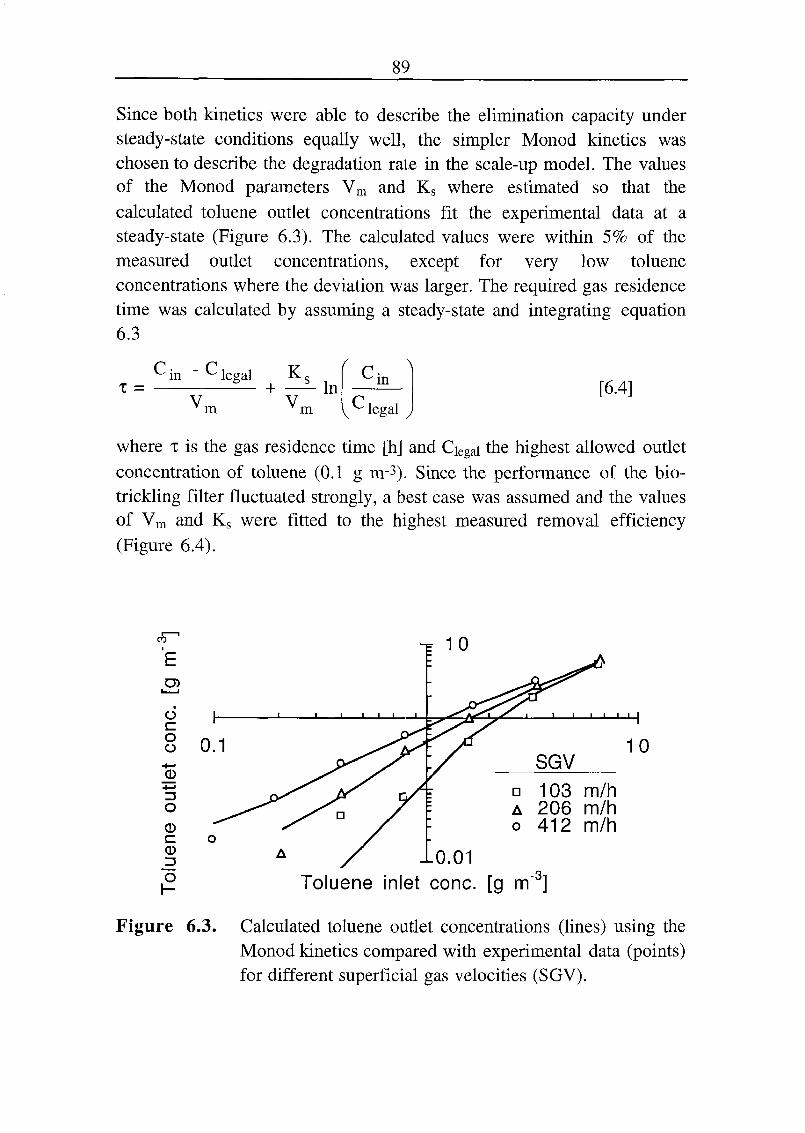
89
Since both kinetics were able to describe the elimination capacity under
steady-state conditions equally well, the simpler Monod kinetics was
chosen to describe the degradation rate in the scale-up model. The values
of the Monod parameters Vm and Ks where estimated so that the
calculated toluene outlet concentrations fit the experimental data at a
steady-state (Figure 6.3). The calculated values were within 5% of the
measured outlet concentrations, except for very low toluene
concentrations where the deviation was larger. The required gas residence
time was calculated by assuming a steady-state and integrating equation6.3
c c^ in ^ legal
T = +
K,
Vm
VIn
m
C;in
VC legal J
[6.4]
where t is the gas residence time [h] and Ciegai the highest allowed outlet
concentration of toluene (0.1 g m-3). Since the performance of the bio-
trickling filter fluctuated strongly, a best case was assumed and the values
of Vm and Ks were fitted to the highest measured removal efficiency
(Figure 6.4).
CO
E
OC
oÜ
-i—>
zz
o
CDc
CD3
1
!10
>/^ i i i1
0.1
A
DS
-0.01
10SGV
o
d 103 m/ha 206 m/ho 412 m/h
Toluene inlet cone, [g m'3]
Figure 6.3. Calculated toluene outlet concentrations (lines) using the
Monod kinetics compared with experimental data (points)for different superficial gas velocities (SGV).

90
CDü
C c
CDo E
C/3
CD CDs_
ECO •*—
CO
O
8 T
6 --
4 --
2 --
3u-1
0
0
Vm=52 g m"Jh
-3
2 4 6 8 10
Toluene inlet cone, [g m"3]
Figure 6.4. Gas residence times T calculated with equation 6.4 usingvalues of Vm and Ks fitted to the highest (thick line) and
the lowest (thin line) measured removal efficiencies.
6.2.2 The Dynamic One Phase Model
The purpose of the dynamic one phase model is to demonstrate the
importance of the kinetics to explain the observed CO2 production under
transient conditions and thereby gain understanding of the processes
governing the performance of the bio-trickling filter. To formulate the
dynamic model, the partial differential Equation 6.2 was solved by
dividing the column height into a sequence of 10 finite differences. The
column was divided into 10 axial layers and each layer was modelled as an
ideally mixed CSTR. The degradation of toluene was assumed to take
place in the whole reactor volume (one phase only) or on a catalyticsurface (Figure 6.5). The concentration on the catalytic surface was
assumed to be in equilibrium with the gas phase and calculated accordingto Henry's Law. The time constant of diffusion in the biofilm was thus
assumed to be much smaller than that of mass transport by convection in
the gas phase. The simulation results were the same for both models, so
only the one phase model will be treated further.
Assuming that the gas phase makes up the whole reactor volume, the mass
balance for toluene or CO2 in the Mth CSTR can be formulated as

91
dCj,Mdt
Fg (Cj,M-l -CJ,m)A
gAh
+ R [6.5]
where dCj^/dt is the gas phase accumulation term in the Mth axial CSTR
for compound j [g m^h"1], Cj,m the gas phase concentration [g nr3], Fg the
gas flow rate [m3^1], Ag the cross section area of the gas phase fraction
[m2], Ah the height of one axial segment [m] and Rj the degradation rate
of toluene or the production rate of CO2 [g m-%-1]. The degradation rate
of toluene can be computed using Monod kinetics or substrate inhibition
kinetics as described by Equations 2.2 and 2.3 in Chapter 2.1.5. The
production rate of CO2, Rco2, is coupled to the toluene degradation rate
as defined in Equation 2.4.
4Cj,M+l
-f-
+Cj,M
-4-
+Cj,M-l
-4-
Qol,M
Gas phase
Qol.M
One phase
Rtol - VmQol.M
Qol,M + Ks
CC02,M Rc02 = Rtol * Yc02/tol + Kc02
y
Two phases
Catalytic surface
/Stoi,M = Qol.M / Htol
^Rtol= aVm
StoiM + Ks
Cc02,M V RC02 = Rtol * YC02/tol + a Kco2
Figure 6.5. Schematic description of the dynamic gas phase model.
The column height is divided into M CSTRs. Toluene is
either degraded directly in the gas phase or on a catalyticsurface with the specific surface a [m2nr3]. Stoi,M is the
toluene concentration on the catalytic surface.

92
The time constant of the gas analysis system (transport capillaries and
mass spectrometer) was found to be in the same range as the gas residence
time in the column. This caused a lag between the real outlet
concentrations and the measured ones. This was accounted for in the
model as suggested by Ingham et al. (1994)
dCtol,meas ^tol,10 " Ctol,meas )^
;= [6.6]
dt Tms
where Ctoi,meas is the outlet concentration of toluene measured by the mass
spectrometer [g nr3], Ctoi,io the gas phase concentration in the last axial
CSTR [g nr3] and Tms the time constant of the gas analysis system. The
time constant was experimentally determined as 21.6 s by measuring step
changes of the inlet toluene concentration.
The CO2 production at toluene concentrations higher than 1.6 g nr3 could
be described only by substrate inhibition kinetics. In contrast to Monod
kinetics, it could describe the steady-state CO2 production and the
appearance of CO2 peaks under transient conditions (Figures 6.6 and 6.7).
The appearance of the CO2 peaks at toluene concentrations larger than
1.6 g m-3 was due to inhibition of toluene. As the concentration of toluene
in the reactor volume decreased (after turning off the toluene input) due
to decomposition, the inhibition effect of toluene was reduced which led
to an increased toluene degradation and CO2 production rate. This was
observed as an increase of the CO2 outlet concentration as the toluene feed
was stopped. The CO2 outlet concentration continued to increase until the
toluene concentration became too low and the toluene degradation rate
decreased due to substrate limitation. The CO2 production then decreased,
having formed the observed CO2 peak.
The value of the substrate inhibition constant, Ki, influenced the model
output only at high toluene concentrations. For low values of Kx, the CO2
outlet concentrations at a steady-state decreased and the amplitude of the
CO2 peaks increased (Figure 6.7). The value of Ks influenced the CO2
outlet concentration mainly at low toluene concentrations (<1.6 gm-3).The CO2 outlet concentration at low toluene concentrations decreased at
high values of Ks (Figure 6.7).
The one-phase model as well as the two-phase model (catalytic surface)
could, however, not describe the height, the width and the fall-off of the

93
CO2 peaks for all combinations of parameter values tested. The three-
phase model (see below) will show that biofilm diffusion must be included
in the model to be able to describe the CO2 peaks quantitatively.
O)
O)
Toluene inlet concentrations [g m"3]
c^ 2.2
E1.8 -
Ö 1"4
O
.0.4
1.3 --
1 .i-n
0.7
0TT
0.8 1.6
1 I .Vi
3.2
*—si
9
6.4
nA
12.8
|103 m h'1
Ik
L
r
^ÎCI
._—,
rTime [h]r
•-'O 206 m h"
r-^r2.0
Figure 6.6. Observed CO2 outlet concentration (open circles)
compared with simulated values (lines) at transient
conditions using Monod kinetics (Ks=0.2 g m-3) at two
different gas velocities. Arrows indicate the time at which
toluene feed was stopped.

93
CO2 peaks for all combinations of parameter values tested. The three-
phase model (see below) will show that biofilm diffusion must be included
in the model to be able to describe the CO2 peaks quantitatively.
Toluene inlet concentrations [g m"3]" 2.2-I-0-4 °-8 1-6 3-2 6-4 12-8
D)1.8 -
d 1"4
O
4 -# ^
,U=i
r- n
<? 1.3--
a 1-1 + Id °-9
o0.7
0
Figure 6.6.
r^-r
n- n
rTime [h]
f 't"t
103 m h"1
206 m h"
Observed CO2 outlet concentration (open circles)
compared with simulated values (lines) at transient
conditions using Monod kinetics (Ks=0.2 g m-3) at two
different gas velocities. Arrows indicate the time at which
toluene feed was stopped.

94
Toluene inlet concentrations [g m"3]0.4 0.8 1.6 3.2 6.4 12.8
lower K,"
2.2 4- ni9ner Ks
co
1.3 -
O) 1.1 -HÖ 0.9 f LÜ
0.7
0.0
Figure 6.7.
L
ri
Time [h]1.0
206 m h"
2.0
Simulation of the same situation as used for Figure 6.6
but employing substrate inhibition kinetics (Kx=30 g m-3,
Ks=0.2 g m-3). The arrows indicate the influence on the
model output of Kx and Ks. The CO2 outlet concentration
is lowered for increasing values of Ks at low toluene
concentrations and for decreasing values of Kx (high
inhibition effect) at high toluene concentrations.
6.2.3 The Dynamic Three-Phase Biofilm Model
The three-phase dynamic model contains the gas phase, liquid phase and
the biofilm and is used here to demonstrate the influence of diffusion of
toluene and CO2 on the CO2 production under transient conditions. The
real biofilm has a very complex and irregular structure which changeswith time. The following assumptions were used to overcome this
complexity in the formulation of the mathematical model (Ottengraf,1986; Rittmann and Manem, 1992; Devinny et al., 1999):
- The volumes of the gas phase, liquid phase and biofilm are constant.
This assumption is valid only for the short period of time during which
the measurements were conducted.

95
- The biofilm has a flat surface and the same thickness over the whole
packing.
- The active biomass is uniformly distributed within the biofilm.
- The solutes in the biofilm are transported perpendicular to the surface
of the biofilm carrier by diffusion only.
- The biofilm is covered with a thin static liquid film according to the
two-film mass transfer theory.
Additional to these assumptions, the model was further simplified by not
including the trickling liquid since it did not significantly influence the
CO2 production and by neglecting the influence of high salt concentrations
on the gas solubility (Schumpe et al., 1982). Moreover, CO2 produced in
the biofilm was assumed to exist only as dissolved gas, since the time
constant for the reaction of CO2 with water to dihydrogen-carbonate (25-
40 s, (Stumm and Morgan, 1996)) is larger than that for the diffusion of
C02 through the biofilm (5.9 s for DCO2=l-7T0-9 m2^1 and a biofilm
thickness of 100 (im). Unless the biofilm is much thicker than 100 plm or
the diffusion coefficient in the biofilm is much smaller than in water, the
produced CO2 has enough time to escape from the biofilm before it reacts
with water.
The partial differential Equation 6.2 was solved by dividing the column
height and biofilm depth into finite difference sections. The column was
divided into 10 axial layers (suffix M in Figure 6.8) and the biofilm was
divided into one liquid film contacting the gas phase and three biofilm
layers (suffix N in Figure 6.8). This partition resulted in 10 gas phase-,
10 liquid film- and 30 biofilm-compartments. Each compartment formed
an individual balance region. The concentration gradients in the liquid
film and the biofilm were calculated using the distances between the
centres of individual compartments (Figure 6.8).

96
Gas phase Gas-Liquid Liquid film
Interface
4Cj,M-l
-4-
S*j,M
Biofilm
OL sB
ÔL öl + Az
2 2 Az Az
Stol,M,NRtol,M,N = Vm—
(Sztol,M,N / Ki)+St0l,M,N+^s
RC02,M,N = Rtol,M,N * Yc02/tol + Kcj02
Figure 6.8. Schematic description of the three-phase biofilm model.
The vertical arrows indicate the transport of toluene and
CO2 by convection and the horizontal arrows indicate
transport by diffusion. Interfacial equilibrium is assumed
and the solutes are transported through the liquid film
before reaching the biofilm where toluene is degradedand CO2 is produced.
The gas phase mass balance of toluene and CO2 considers the mass flow
into and out of the Mth CSTR and absorption into the liquid interphase
dCj,M j,M-l
C;j,M
dt Ac 9 Ah+ D;
j,w afVr iSj,M" Sj,M,l
V, 'L
[6.7]
where dCj;M/dt is the gas phase accumulation rate of compound j [g nr3
h_1], Cj,M the gas phase concentration in the Mth axial CSTR [g nr3],

97
Fg the gas flow rate [m^rr1], Ac the column cross sectional area [m2], (p the
gas phase fraction of the reactor volume [-], Ah the column height of one
axial compartment [m], DjiW the diffusion rate constant in the aqeuous
phase [m2 lr1], af the specific biofilm surface (m2nr3), Vr the reactor
volume [m3], Vg the volume of the gas phase fraction [m3], S*j,m the
interface liquid concentration [g nr3], Sj,m,i the liquid film concentration
in the centre (5l/2) of the liquid layer [g nr3] and 5l the liquid film
thickness [m]. The time lag in the outlet gas phase concentrations of
toluene and CO2 caused by the mass spectrometer was accounted for
according to Equation 6.6.
The accumulation rates of toluene and CO2 in the liquid film contain
terms for the diffusion rate into and out of the liquid film
AVL dSj;M,ldt
=-Af Dj,w
S;
j,M Sj,M,l
»L
(Sj,M,l 'j,M,2
8L + Az[6.8]
where Sj,m,2 is the concentration in the centre (Az/2) of the first biofilm
layer [g nr3], AVL the volume of the liquid film segment [m3], Af the
biofilm surface [m2] and Az the thickness of the Nth biofilm segment [m].
Writing AVl as Af Ôl gives
dSj,M,l
dt=-D
J.w
S*'j,M,l
L
Sj,M,l " Sj,M,2
6L + AzôL[6.9]
The accumulation rate of toluene and CO2 in the biofilm contains terms
for the diffusion rate into and out of the Nth CSTR as well as a kinetic
term for the degradation of toluene or production of CO2; thus for the
first biofilm layer writing AVb as Af Az gives
dSj,M,2dt
=-DJ,B
Sj,M,l " Sj,M,2
Az2+ Az Ô
L
(sj,M,; - S;j,M,3
Az
+ Rj,M,2
[6.10]

98
where Sj,m,i is the toluene concentration in the first biofilm segment
[g nr3], Dj,b the diffusion rate constant in the biofilm [m2 lr1], and Rj,m,2the degradation rate of toluene (R negative) or production rate of CO2 (R
positive) [g m^h-1]. Toluene degradation was calculated with the substrate
inhibition kinetics (Equation 2.6) and CO2 production rate was calculated
according to Equation 2.7.
For the centre biofilm layer the accumulation rate is
dSj,M,3
dt= "DJ,B
KM,22S;
j,M,3+ Sj,M,4 )
+ R
Azj,M,3 [6.11]
There is no diffusion out of the last layer, thus the accumulation term of
the last layer is
dSjM,4
dt= -D:
J3
SjM,3 " SjM,4+ R;jM,4 [6.12]
6.2.4 Simulation of the CO2 Production Using the Dynamic
Three Phase Model
The dynamic three-phase biofilm model could describe the experimentaldata more or less well depending on the values of the model parameters.
The values of some model parameters could be experimentally determined
or were found in the literature (Table 6.1). The value of the specific film
area was assumed to be that of the packing, that is 350 m2nr3. The values
of the other parameters, that is Vm, Dtoi,B, DCo2,b, Ks, Kj, KCo2, Ôb and 5L
had to be estimated, so that the model output fits the experimental data.
Table 6.1. Predefined parameter values at 25°C.
Parameter Value Reference
Dtol.w 3.42-10-6 m2^1 (Hayduk and Laudie, 1974)
DC02,w 6.26-10-6 m2^1 (Gmelin, 1973)
Htol 0.263 - (Allen et al., 1998)
Hc02 0.94- (Gmelin, 1973)
Yc02/tol 1.27- experimentally determined (Chapter 4.3.1)
CP 0.8- experimentally determined (Chapter 4.1.1)

99
The parameter estimation tool in the simulation software was, however,
not able to estimate all unknown parameter values simultaneously.
Furthermore, these parameters were more or less correlated and several
combinations of parameter values gave the same model output. To find
the optimal parameter values for the dynamic three-phase model, the
unknown parameter values were first estimated to fit experimental data at
a steady-state using the simulation software tool for parameter estimation
("steady-state fit" in Figure 6.9). This resulted in several sets of optimal
parameter values of Vm, Dtoi,B, Dco2,b, Ks, Ki and Kco2 for ranges of
values of 5b and 5l- Subsequently, the best values of Ôb and 5l were
estimated by comparison of the dynamic model output with dynamic
experimental data ("dynamic fit" in Figure 6.9).
The "steady-state fit" procedure was as follows (Figure 6.9):
1) Values for the liquid film (Ôl) and biofilm thickness (Ôb) were selected
within a wide range (Figure 6.10).
2) Starting values for Vm, Dtoi,B, DCo2,b, Ks, Ki and KCo2 were guessed
(usually the values from the previous estimation).
3) The values of Vm, D^b, Dco2,B and Ks were estimated simultaneously
with the estimation software tool (Chapter 3.3.5) to fit the measured
steady-state outlet concentrations of toluene and CO2.
4) The value of Kco2 was changed and step 3 performed again. This was
repeated until the highest value of the likelyhood function was found.
The value of Kco2 differed slightly for the two different superficial
gas velocities and an average value was used in the numerical
simulation.
5) The value of Ki was changed and step 3 and 4 performed again. This
was repeated until the highest value of the likelyhood function was
found.
6) The values of the likelyhood function obtained in step 3 was recorded
as a function of the liquid film and the biofilm thickness. Steps 1 to 5
were repeated.

100
"Steady-state fit'
Select öl and oß
IGuess initial values of Vm,
Dtol,B, DC02,B andKs
ISelect Ki and KC02
Fit values of Vm, Dtol,B, Dc02,B and
Ks to steady-state experimental data
No
"Dynamic fit' £Select 8l and 8ß from the
white area in Figure 6.10.
Dynamic simulation with the
parameter values estimated above
No
Finish
Figure 6.9. Procedure used to find the optimal values of the
parameters in the three-phase model.

101
The dynamic three-phase model could best describe the measured outlet
concentrations of toluene and CO2 at a steady-state for liquid film depthsless than 4 pm and for biofilm depths less than 100 pm. (Figure 6.10). At
larger film depths the toluene removal rate became diffusion limited at
low toluene concentrations which resulted in a poor fit of the model
output to the experimental data and low values of the likelyhood function.
*=0.05 I 1 1 1 ^
o- 10 40 70 100 130"^
Biofilm thickness [jim]
Figure 6.10. Ranges of the biofilm and liquid film depths (5b and Ôl)defined from the parameter value estimation when fittingthe measured steady-state concentrations of toluene and
C02 ("steady-state fit" in Figure 6.9). Best fits (highvalues of the likelyhood function) were obtained in the
non-shaded area.
The parameter values found by fitting the model output to the steady-stateoutlet concentrations were used to simulate the CO2 production under
transient conditions. The best agreement between model dynamic outputand measured experimental data was obtained for a liquid film thickness
of 3 pirn and a biofilm thickness of 70 \xm (Figure 6.11). The estimated
values of all model parameters at these film depths are listed in Table 6.2.
The value of Ki is similar to that determined for pure cultures of
Pseudomonas putida, whereas the value of Ks is about two orders of
magnitude smaller (Oh et al., 1994; Mirpuri et al., 1997). This is because
the removal process was nearly diffusion limited at these film depths. The
parameter estimation then resulted in low values of Ks which avoided
diffusion limitation at low toluene concentration. For smaller liquid film

102
and biofilm depths, for instance 8b=10 \lm and Ôl=0.1 p,m, the values of
Ks were 5 to 18 times lower than those of the pure cultures of
Pseudomonas putida (Oh et al., 1994; Mirpuri et al., 1997). Low values
of Ks have also been observed for mixed cultures grown at low and steadyconcentrations of toluene, thus the value of Ks may depend on the
operating conditions (Arcangeli and Arvin, 1992).
t^i
ôL=3um, ôB=10Lxm-\
öi_=3um, ôB=70(im
*"* wU Ov\
^
0.0
ôL=0.3um, ÔB=10um
föL=0.3jim, ôB=70|im
—' 1
Time [h] o.3 o.o ' Time [h] o.3r
Figure 6.11. The influence of the biofilm and liquid film depths on the
dynamic CO2 response in the gas phase. The dynamic
model output (lines) simulated at a toluene concentration
of 12.8 g m-3 and a superficial gas velocity of 103 m lr1
compared to experimental data (points). The simulation
was made using the parameter values estimated at steady-
state conditions. The arrows indicate where the toluene
feed was stopped.
Table 6.2. Estimated parameter values for the dynamic three-phase
model.
Parameter Value Parameter Value
a 350 m2 nr3 Ks 0.059 g m-3
Kcj02 190 g m^h'1 Ki 50 g m'3
ÔL 3-10"6m Dtol,B 4.8-10"7m2h-1
ÔB 70-10-6 m DC02,B 8.8-IO-7 m2 h-1
Vm 436 g m^h"1

103
Comparison with the one-phase model. The three-phase model
calculates the same toluene and CO2 outlet concentrations as well as
elimination capacities for the steady-state as the one-phase model. Under
transient conditions, however, the three-phase model describes the CO2
production better where the CO2 peaks appear higher and wider (Figure
6.12). This is because the biofilm functions as a toluene and CO2 reserve,
retaining toluene after that it has disappeared from the gas phase.
"2.2 --
1,1.8-:
o 1
Toluene inlet concentrations [g m ]0.4 0.8 1.6 3.2 6.4 12.8
L L.103 m h
-1
la.
co
1.3 -
E
o)1.1
CM 0.9 - !O
O0.7U
1
206 m h"1
0r^r t"t' 't"t
Time [h]
-—l
Figure 6.12. Observed CO2 outlet concentration (open circles)
compared with simulated values (lines) under transient
conditions using the model parameter values in Tables 6.1
and 6.2. Arrows indicate the time at which the toluene
feed was stopped.
The values of Kj and Ks have the largest influence on the model output
under transient conditions. Their values correlate only marginally with
those of other parameters. The effect of toluene inhibition on the CO2
production rate, which means decreasing steady-state CO2 outlet
concentrations and the appearance of C02 peaks under transient
conditions, is enhanced when one lowers the values of Kj and Ks (Figure
6.13). This is so because low values of Kj and Ks allow the inhibition term
in Equation 2.6 to become more dominant at high toluene concentrations.

104
Low values of Ks also result in higher CO2 production rates at low
toluene concentrations (Figure 6.13).
The three-phase model could describe the performance under transient
conditions better than the one-phase model but still the amplitude, the
width and the fall-off of the CO2 peaks could not be described sufficientlywell. The two-layered biofilm described below shows that the storage of
toluene in the biofilm must be considered in the model to be able to
describe the CO2 peaks quantitatively.
C\J
peaks appear at lower Ct0ifor low values of Ks and Ki
-3iToluene inlet concentrations [g m ]
^2.2
1.8 -
O 1-4
O
1
0.4 0.8
higher Ks
1.6 3.2 6.4
l
n
O
12.8
*** iL
103 m h-1
higher K,
v 1 1 1
1.3E
0)1.1
J 0.9
Ü0.7
0
P
_J L_l-I l_
I
Time [h]
_l I I L.
206 m h'1
Figure 6.13. An equivalent simulation to that in Figure 6.12 but with
higher values of Ki and Ks (Kj=70 g m-3 and Ks=0.3 g
m-3). The arrows indicate the influence of Ki and Ks on
the CO2 production.

105
6.2.5 Simulation of the C02 Production Using the DynamicThree Phase Model with Two Biofilm Layers
The CO2 production under transient conditions could be described better
by adding a non-active biofilm layer between the active layer and the
wall. In the three-phase model, three additional biofilm layers were
introduced (Equation 6.10 without the degradation term) with the total
thickness ôNB (Figure 6.14). The non-active layer did not influence the
model output under steady-state but under transient conditions it
functioned as an additional toluene reserve. The two-layer biofilm model
could thus describe experimental data better for all biofilm depthsbetween 10 and 100 \im by adjusting the thickness of the non-active
biofilm layer (100-250 |lm). The value of the non-active biofilm layerthickness influenced the width and the amplitude of the CO2 peak (Figure
6.15).
Gas phase Gas-Liquid Liquid film
Interface
4
S*iM
Biofilm
Active Non-active
N=l N=2 N=3 N=4 N=5 N=6 N=7
Rtol=0
t r
Rtol>0
ttk '
-;i
itoL='^»^
sL 5b ÔNB
Figure 6.14. Schematic description of the two-layer biofilm model. A
sorption layer with no biological activity is added to the
biofilm model described in Figure 6.8.

106
2.1 --
ôL=0.3um, 6B=10|im ÖL=3(im, ÔB=70[im
:1.7 4
*
CM
81-34-
0.9
ôNB[M.m]
^10
250
0.0Vime [h] 0.3 0.0 Time [h] 0.3
Figure 6.15. The influence of the non-active biofilm thickness (Ônb) on
the model output (lines) compared with measured CO2
concentrations for different liquid film and biofilm
depths. The inlet toluene concentration was 12.8 g m-3 and
the superficial gas velocity 103 m h4.
Best agreement between the two-film model output and experimental data
was obtained for large biofilm depths, that is larger than 70 |im (Figure
6.16). The influence of the liquid film thickness on the CO2 peak was
negligible. The liquid film thickness did, however, influence the value of
Vm. This was due to the greater diffusion resistance caused by the large
liquid film thickness which was compensated by a greater concentration
gradient across the liquid film to obtain the same flux across the liquidfilm. The parameter estimation therefore resulted in high values of Vm
for large liquid film depths which resulted in a higher toluene degradation
rate and larger concentration gradients due to the lower toluene
concentrations in the biofilm.

107
"2.2 4-
E
D)1.8 -
Toluene inlet concentrations [g m ]0.4 0.8 1.6 3.2 6.4 12.8
31.4-rÜ 1
i 103 m h
H
CO
1.3 +E
o>1-1
'0.9- ',
O 0.7
i_ LJ 206 m h"1
0t'
'
t' 't' 't'
't' 'tH
Time [h]
Figure 6.16. The dynamic three-phase model with two biofilm layersunder transient conditions (lines) compared with
experimental data. The simulation was made for an active
biofilm thickness of 70 [im and a non-active biofilm
thickness of 100 |lm. The values of the other parameters
are listed in Tables 6.1 and 6.2. The arrows indicate the
time at which the toluene feed was stopped.
6.2.6 Discussion
Studying bio-trickling filters under transient conditions underlines the
importance of sorption processes in the biofilm (Deshusses, 1994). Bystudying the CO2 production under dynamic conditions, conclusions about
the toluene degradation kinetics could be made by discriminating between
different mathematical models. The models used here strongly simplifythe actual conditions in the bio-trickling filter by making several
assumptions. These assumptions influence the model output and the
potential of the model to describe observed phenomena. The largest
divergence from the real conditions is probably the assumption of plugflow. Channelling of the gas flow may explain why the model failed to
describe the dependence of the elimination capacity on the gas velocityand the slow decay of the CO2 peaks under transient conditions. To be

108
able to describe channeling, more detailed knowledge about the processes
leading to clogging and about the variable flow patterns would be
necessary.
The observed biofilm thickness in the bio-trickling filter was about 1 mm
after a few weeks of operation. This is much thicker than the values found
in the parameter estimation, maybe because no internal liquid flow in the
biofilm had been incorporated in the model. If included, the mass
transport within the biofilm will be faster and a larger share of the
biofilm would be active. The numerical simulation indicated the existence
of two biofilm layers; a central biologically active layer and a lower non-
active sorption volume. The exact values of the film depths, biofilm
diffusion coefficients and kinetic parameters could, however, not be
determined here since independent measurements were not available.
If the biofilm thickness is greater, the hydration reaction of CO2 to
carbonic acid will become important. At pH 7.8, carbonic acid converts
rapidly into hydrogen carbonate (pKa=6.35 (25°C) assuming all dissolved
CO2 as H2CO3). The diffusion rate in the biofilm is then determined
mainly by the diffusion coefficient of hydrogen carbonate which is
smaller than that of dissolved C02 (DHco3-=4.3-10-6 m2 lr1, (Gmelin,
1973)). The liquid to gas mass transfer rate of CO2 will, however, still be
determined by the diffusion rate of dissolved CO2 through the liquid film.

109
6.3 The Non-Thermal Plasma Model
Complete modelling of the transient processes of microdischarges as a
function of time and space involves the determination of the electron
collision cross sections, calculation of the electron energy distribution by
solving the Boltzmann equation and calculation of the reaction rate
coefficients which depend upon the reduced electric field (Eliasson et al.,
1994). Although some of the individual parameters mentioned available in
the literature, the large number of involved reaction species makes these
calculations complex and the simulation results are difficult to verify with
experimental measurements. The aim in this work is, however, not to
develop a mechanistic model but to simulate the measured removal
efficiency as a function of energy input.
6.3.1 Mass Balances of the Steady-State Model
The purpose of this steady-state model is to calculate the energy
consumption of a full size non-thermal plasma reactor. The model
assumes a homogenous reaction volume and an ideal tubular reactor
d[TOL] Act;—
= "
=— rtoi t6-13!dh F
g
where Fg is the gas flow [m3 s-1]. The reactive species oxidising toluene
are assumed not to be transported with the gas flow but to be consumed
immediately after they are formed. The kinetic term can then be written
as derived in Chapter 2.2.3
d[TOL] A ktol [TOL]= Grj 8 [6.14J
dh FgR
ktol [TOL]+kn [n]
We can distinguish between two cases. In the first case, the reactive
species mainly react with the pollutant, that is (ktoi [TOL]) >>(kn [n]). In
the second case, the reactive species mainly react with other species, such
as other neutral molecules, ions, radicals and electrons, rather than with
the VOC, that is (kn [n])»(ktoi [TOL]). The first case is more energy
efficient since a lower amount of reactive species per energy unit need be
produced to achieve the same removal rate. Plotting the outlet
concentration as a function of the inlet concentration for different values

110
of (ktoi[TOL])/(kn[n]) clearly distinguishes between the two cases (Figure
6.17). The two cases mentioned can be described by two empiricallyderived exponential equations (Figure 6.18):
for (ktoi [TOL]) >>(kn [n]) (Rosocha et al., 1993)
[TOL] out(
[TOL]= exp
m V
E
ß[6.15]
for (kn [n])»(ktoi [TOL]) (Krasnoperov et al., 1997)
[TOL] out
[TOL]= exp
in
f
\a [TOL]
[6.16]in ;
where E is the energy density [kJ nr3] and a and ß are compound specificfactors which determine how efficiently the VOC can be removed in the
plasma and which are, in contrast to ktoi and kn, relatively easy to
determine experimentally.
30 kJ m FOUoufUOL],,values of
ktoi[TOL]_
knln]
0.03-0.01
75-25----
48 In [TOL]in 50
Figure 6.17. The outlet concentration of toluene as a function of the
inlet concentration calculated with Equation 6.14 for
different values of (ktoi[TOL])/(kn[n]) and energy
densities. The calculations were made for an assumed gas
residence time of 1 s in the reactive zone and g-values for
the production of reactive species (Gr) of 96
molecules/lOOeV in the case of the lower values of
(ktoi[TOL])/(kn[n]) and of 0.22 molecules/lOOeV for the
higher values of (ktoiTOL])/(kn[n]).

Ill
30 kJ m-3 IJOUouFTroaifl-fl
Eqn. 6.15
---- Eqn. 6.16
43 A ' ' ' ' 1 ' ' ' ' 1
48 In [TOLin] 50
Figure 6.18. Comparison of the outlet concentrations calculated with
Equations 6.15 and 6.16 for two different energy
densities. The calculations were made for values of
cc=3.3-10-20 kJ molecule-1 and ße=50 kJ nr3.
Equation 6.15 is most commonly used in the literature and can be used to
describe, for instance, the removal of NO (Nasciuti, 1995). The ß-value is
the amount of energy needed to reduce the VOC inlet concentration by a
factor e-1 or by a factor of 10 (Penetrante et al., 1997). The two different
ß-values are correlated by ßio=ße ln(10).
Since the ß-values of many VOCs vary with concentration (Krasnoperov
et al., 1997), the ß-value should be used only within the concentration
range for which it had been determined. The a value in Equation 6.16 is,
however, supposed to be independent of the VOC concentration. The a
and ß values both depend on the reduced electric field which influences
the reaction rate coefficients. They also depend on the gas compositionand on temperature, which influence [n] and the reaction rate coefficients.
For instance, humid air enhances the removal efficiency of toluene but
reduces that of trichloroethylene, due to a different radical oxidation
mechanism (Evans, D. et al., 1993) and change of the electron energy
distribution in the presence of moisture. The temperature may also
influence ktoi and kn differently, depending on the activation energy, thus
the value of (ktoi[TOL])/(kn[n]) may change with temperature. The rate of
radical termination reactions, for instance OH' + OH*, also increases with
the square of OH* concentration since initial OH* concentration is
proportional to energy input, the OH* loss also increases proportional to
the square of energy input. This would decrease the value of

112
(ktoi[TOL])/(kn[n]) at higher energy inputs, in general agreement with
observations.
6.3.2 Simulation of the Toluene Removal
The experimentally determined toluene removal could be calculated usinga modified Equation 6.16. To simplify the comparison of the energy
efficiency with the bio-trickling filter, the concentrations were given in
the unit g m-3. The ße-value depended upon on the toluene concentration
(Figure 6.19) thus the degree of removal could be calculated by
r (^toi,out
=exp^ toLin 143 CtoUn + 112
[6.17]
This empirical function does not consider air humidity, temperature or
any variable reactor characteristics, such as the reduced electric field.
However, Equation 6.17 allows the description of the degree of removal
as function of the energy input for the toluene concentrations tested
(Figure 6.20).
In Figure 6.21, the ße-values determined in this work are compared to
those determined by other researchers using a barrier discharge
(Krasnoperov et al., 1997) and a pulsed corona discharge (van Paasen et
al., 1997). Toluene is more efficiently removed by the pulsed power
supply. This is due to the lower pulse risetime, which leads to a more
uniform discharge spread, and the lower pulse width, which permits
operation at a higher reduced electric field and reduces the energy deposit
after the discharge has been formed (Ingram, 1996). The energy loss in
the pulse generator may, however, be as large as 40%, thus decreasing the
overall efficiency (van Paasen et al., 1997).

113
CD
J3CO>
cd
600y
400 -
200 -
0
ßP = 143 Coi + 112
0 12 3
Toluene inlet cone, [g m"3]
Figure 6.19. Determined ße-values as a function of the toluene
concentration at 65% relative humidity.
CD
Q
0
0.34 g m"
0.82 g m"
1.38 g m"
3.32 g m"
100 200 300
Energy input [kJ m ]
Figure 6.20. Measured toluene removal at different concentrations
(points) compared with removal efficiencies calculated bymeans of equation 6.17 (lines).

114
„400 y
CO
E 300
own data-—-van Paasen et al, 1997
^EiDKrasnoperov et al, 1997
0.5
Toluene inlet cone, [g m"3]
Figure 6.21. Comparison of determined ße-values with those of other
researchers.

115
7. Scale-Up Evaluation
A complete evaluation of a full scale waste purification system considers
technical, social, economic as well as ecological aspects (Meier, 1997). In
this chapter, a full scale bio-trickling filter and barrier discharge are
evaluated from point of view of economy and ecology, demonstrating the
possible working ranges of the bio-trickling filter as well as of the non¬
thermal plasma and of their combination. The technical evaluation has
been treated elsewhere (Chapter 1.1).
The following assumptions and simplifications have been made:
- The investment cost and pressure drop caused by the pipe connections
to the emitting source are neglected.
- The waste air is assumed to be free of dust and aerosols, thus it does not
have to be pre-treated and it is assumed to have a constant temperature
of 20°C and a relative humidity of 65%.
- The lifetime was for all cases assumed to be 20 years and operatingtime 8400 hours/year.
The economic evaluation is based on the treatment cost per 1000m3 waste
gas
Inv.Cost + Op.Cost x LTTreatment cost = [7.1]
Fg x OT x LT
where Inv.Cost is the investment cost [$], Op.Cost the operational cost [$
year1], LT the lifetime [year], Fg the gas flow [m3 lr1] and OT the time of
operation [h year1]. The treatment cost does not include interest on
investment capital. Price information older than 1998 was recalculated to
the cost level of 1998 using the Marshall & Swift cost index factor which
is published monthly in Chemical Engineering News (1998 M&S index:
1061). All costs were converted into US$ using an average exchange rate
of the time period September 1997 to September 1998
(l$=1.49Sfr=1.82DM). The calculated treatment costs were comparedwith those of other waste gas purification techniques which also are used
for purification of low concentration waste gas streams (Table 7.1).
The ecological evaluation is based on the calculated Net Ecological Benefit
(NEB) which has been described elsewhere (Chapter 3.4). The energy

116
consumption of air blowers and liquid pumps was calculated using the
energy balance of incompressible media:
Pair blower = AP Fg ~ t7-2]
Ppump = P g Ah Fji
[7.3]
where Pair blower and PpUmp is the power consumption [W], Ap is the
pressure drop between gas inlet and gas outlet [Pa], Ah the pump height
[m], Fg and Fl gas and liquid flow, respectively [m3 s-1], p the liquid
density [kg nr3] and r| the pump efficiency factor which was assumed to
be 0.7.
Table 7.1. Treatment cost of different waste gas purification
techniques.
Waste gas flow [m3 lr1] Treatment cost [$/1000m3]
Bioscrubber n.a. 0.4-0.7 a
Biofilter n.a. 0.2-0.6a
Catalytic incineration 57'
000 1.9 b
Catalytic incineration n.a. 0.9-1.2a
Regenerative incineration n.a. 0.6-1.2a
Adsorption (act. carbon) 5000 2.5 b
Adsorption (act, carbon) rua. 0.7-1.0 a
n.a. = no data available, act.=activated a(Rafflenbeul, 1996), b(Meier, 1997)
7.1 The Bio-Trickling Filter
The treatment cost and ecological burden is largely determined by the size
of the bio-trickling filter. The size is a function of the gas flow and the
gas residence time needed to reduce the VOC inlet concentration to meet
legal limits. The gas residence time depends on inlet concentration,
biodegradability and water solubility of the VOC as well as on the specific
area of the packing and the gas inlet conditions, such as temperature. The
temperature should be between 10°C and 40°C, otherwise the gas must be
preheated or cooled (BUWAL, 1993). The column diameter, packing
height and liquid flow were calculated using typical operating conditions
of full scale bio-trickling filters (Table 7.2). The column height was
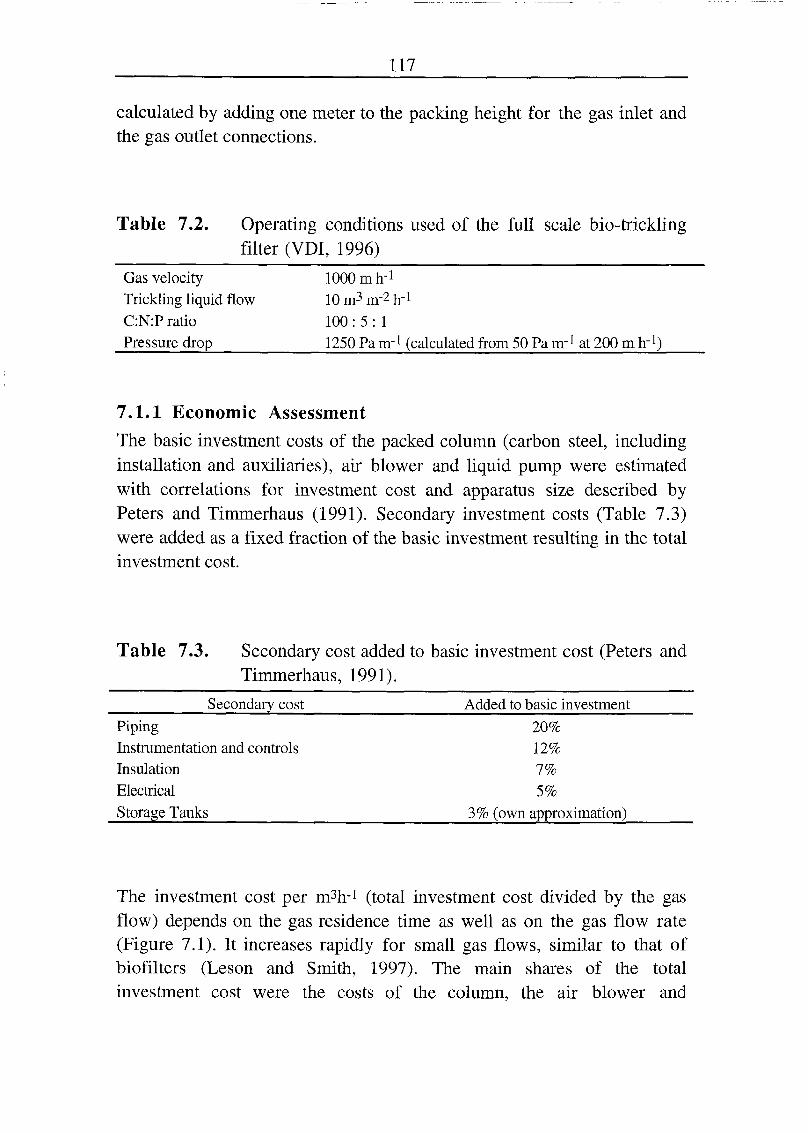
117
calculated by adding one meter to the packing height for the gas inlet and
the gas outlet connections.
Table 7.2. Operating conditions used of the full scale bio-tricklingfilter (VDI, 1996)
Gas velocity 1000 m rr1
Trickling liquid flow 10 m3 nr2 h"1
C:N:P ratio 100 : 5 : 1
Pressure drop 1250 Pa nr1 (calculated from 50 Pa nr1 at 200 m lr1)
7.1.1 Economic Assessment
The basic investment costs of the packed column (carbon steel, includinginstallation and auxiliaries), air blower and liquid pump were estimated
with correlations for investment cost and apparatus size described byPeters and Timmerhaus (1991). Secondary investment costs (Table 7.3)
were added as a fixed fraction of the basic investment resulting in the total
investment cost.
Table 7.3. Secondary cost added to basic investment cost (Peters and
Timmerhaus, 1991).
Secondary cost Added to basic investment
Piping 20%
Instrumentation and controls 12%
Insulation 7%
Electrical 5%
Storage Tanks 3% (own approximation)
The investment cost per m3^1 (total investment cost divided by the gas
flow) depends on the gas residence time as well as on the gas flow rate
(Figure 7.1). It increases rapidly for small gas flows, similar to that of
biofilters (Leson and Smith, 1997). The main shares of the total
investment cost were the costs of the column, the air blower and

118
secondary costs (Figure 7.2). The calculated investment cost per cubic
meter reactor volume is in the same range as manufacture's data, except
for small reactor volumes where calculated investment cost is a factor of
2 higher than manufacture's data (Table 7.4).
^ 200 t
E 150 ~\
\
Gas residence times
1 s
10 s
30 s
60 s
+
5 10 15
Gas flow rate [1000m3 h'1]
20
Figure 7.1. Calculated total investment cost as a function of gas flow
rate and gas residence time.
ÎS — 100
*- oO O
g £in CD
S E
Figure 7.2.
imm m
1s 10s 60s
1000 m"3h"1
S secondary cost D column
^blower pump
1s 10s 60s
20000 m'3 h"1
The relative shares of the calculated total investment cost
at different gas flow rates and gas residence times.

119
Table 7.4. Calculated investment cost (the highest cost for the
smallest reactor volume) compared with data from
manufacture's of bio-trickling filters and scrubbers.
Reactor volume Investment cost
[m3l [$/m3reactor]a
3-42 15800-5600 own calculations13
2-42 7040-6050 (Clairtech, 1998)
2-30 9400-1700 (Colasit, 1998)
a The higher investment cost corresponds to the smaller reactor volume.
b Calculated for 10 to 30s gas residence time and 0.4 gcarbon m"3-
Operating cost includes electrical energy consumption of the air blower
and the liquid pump, fresh water consumption, treatment of waste water,
addition of mineral salts and sodium hydroxide as well as personnelneeded for routine analytics, refilling storage tanks and cleaning the
packing (Table 7.5). The energy consumption of the air blower was
calculated only for the pressure drop caused by the packing. It was
assumed to be proportional to the gas velocity up to 1000 m h"1. The fresh
water consumption was calculated as the sum of the waste water producedand the water loss due to evaporation (100% relative humidity at the gas
outlet). The amount of waste water was calculated for a liquid residence
time of 24 hours of the total reactor liquid volume. It was calculated as
the sum of the liquid hold up on the packing (10%v/v, own
measurements) and the liquid sludge at the bottom of the column (0.3 m
of column height).
Table 7.5. Data used to calculate operational cost of the bio-trickling
filter.
Fresh water a 0.72 $ nr3
Waste water a 1.05 $ nr3
Personnelb 730 $ day1,4 days per month
NaOH addition c 0.2 kg kg-1 removed carbon
(NH4)2S04b 8.5 3 kg-1KH2P04 b 14 $ kg-1NaOHb 0.95 $ kg-1
a(Meier, 1997), b(Zuber et al., 1997), cour own measurements

120
The operation cost per m3 gas flow (operation cost per hour divided bythe gas flow) depends on the gas flow rate but less on the gas residence
time and the organic carbon concentration (Figure 7.3), mainly because
the cost of personnel is assumed to be independent of the bio-tricklingfilter size. Cost of personnel makes up the major share of operational cost
at low gas flows (Figure 7.4). At higher gas flows, that is 20'000 m3 lr1,
the cost of electrical energy (air blower and pump) reaches approximatelythe same share as that for the cost of personnel.
g- 0.0 -I 1 1 1 1
0 5 10 15 20
Gas flow rate [1000m3 h"1]
Figure 7.3. Operational cost as a function of gas flow, removed organiccarbon (gcarbon m-3) and gas residence time (Is and 60s).
co 1s 10s 60s 1s 10s 60s
1000 m3h"1 20000 m3h"1
SiPersonell ©Blower H Pump
gä Mineral salts Fresh water S Waste water
Figure 7.4. The relative shares of operational cost at different gas
flow and gas residence times and a carbon load of 0.4
gCarbon nr3.

121
The treatment cost follows the same trend as that for investment and
operational cost (Figure 7.5). The main share of the annual cost is the
operational cost (Figure 7.5). The annual cost for gas flows above 5000
m3 h-1 is in the same range as literature and manufacture's data for
biological waste gas treatment (compare Table 7.1).
ooo
^ 2 +
CO
oÜ
c
CD
E*->
COCD
1 -
0
Fig 7.5.
60s, 0.1-1 gCarbon m
0 5 10 15
Gas flow rate [1000m3h"1]
-r-50 ?£
oÜ
c:
CD
ECO
CD>
o
CD
CO
CD
20
Treatment cost (shaded areas) and share of investment
cost of the treatment cost (thick lines) as a function of gas
flow rate, gas residence time (Is and 60s) and organiccarbon concentration (0.1-1.0 gcarbon nr3).
The treatment cost for the removal of toluene was calculated using the
same operation conditions and parameter values as in the generalassessment (Figure 7.6). The gas residence time needed to reduce the inlet
concentration to legal limits (0.1 gm3) was determined using the
simplified steady-state model described in Chapter 6.2.1 with the Monod
parameters determined for the highest measured removal capacities (Vm=
112 g m-3 h-1, Ks=0.26 g m-3). The removal capacity is thus assumed to be
the same at 1000 m h4 as at the superficial gas velocities applied in the
experimental measurements (103-412 m h"1).
The working range of the bio-trickling filter will, however, be limited to
low concentrations of toluene, since the treatment cost of treatment by
regenerative incineration may become lower than that of the bio-tricklingfilter at toluene concentrations above 0.8 g m-3 (Rafflenbeul, 1998).

122
Fig 7.6.
0 5 10 15
Gas flow rate [1000m3 h"1]
20
Treatment cost for the removal of toluene with a bio-
trickling filter as a function of gas flow and toluene
concentration. The gas residence times ranged between 9 s
and 86 s.
7.1.2 Ecological Assessment
The ecological benefit of the bio-trickling filter is the amount of VOC
eliminated (kg nr3). The ecological burden is the sum of the amount of
steel (or polypropylene) needed for construction, electrical energy
consumed and CO2 produced (assuming 70% yield of the eliminated
carbon), and TOC in the waste water (assuming 30% yield of the
eliminated carbon) per m3 treated waste gas. The amount of construction
material needed for the whole bio-trickling filter (column and piping) was
estimated with manufacture's data of bio-trickling filter size and weight,where the whole weight was assumed to be only steel or polypropylene(Table 7.6).
Table 7.6. Empirical correlation of the weight of construction
materials
Steela, total weight
Polypropylene b, column weightarriair-tp^ii iqc^ bcrvjaeit ioo
1120kgm-3reactor
7.2-27kgm-3reactor(
a(Clairtech, 1998), b(Colasit, 1998)
c Calculated for a wall thickness of 8- 15mm, a column diameter of 2-4 m and a density of
polypropylene of 900 kg nr3

123
The net ecological benefit (NEB) was calculated for toluene as well as for
dichloromethane (DCM) and acetone for comparison (Figure 7.7). The
bio-trickling filter size was calculated in the same way as in the economic
assessment. The Monod coefficients for DCM (Vm=250 g m-3h-!, Ks=1.5 g
m-3) and acetone (Vm=275 g m-%-1, Ks=0 g m-3) were estimated from
other studies with bio-trickling filters (Diks and Ottengraf, 1991b;Kirchner et al., 1996). The net ecological benefit is positive for all
compounds at all concentrations and is, for the calculations made here,
independent of the gas flow rate. The ecological burden for poorlydegradable compounds is mainly caused by the construction material
(assumed to be steel), electricity consumption and for well biodegradablecompounds (acetone), by TOC in the waste water (Figure 7.8).
— 0mLU
0.5 1.5
VOC concentration [g m ]
Figure 7.7. Net ecological benefit as a function of VOC concentration.
100
oÜ C
80CD CD
O
a 60
CD.Q
40CO 01sz
CDO
20
Toluene DCM Acetone
Ssteel HC02 Delectricity S TOC
Figure 7.8. Shares of ecological burden at 0.5 g m-3 VOC concentration.

124
7.1.3 Sensitivity Analysis
This analysis investigates the relative influence of single parameters on the
treatment cost and net ecological benefit (NEB) for the case of toluene.
The single parameters were reduced or increased one at a time to a value
cited by other literature sources or to other realistic values (Table 7.7).
This analysis does not consider any combined effects when changing
several parameters simultaneously as in a global sensitivity analysis
(McRae et al., 1982).
Treatment cost
The treatment cost was influenced mainly by the life time, fresh water
consumption (approximately proportional to the liquid residence time)
and the mineral salt consumption (proportional to the C:N:P ratio).
Maybe lowering the operational time from 8400 hours/year to 6000
hours/year is not a very realistic assumption for a bio-trickling filter, but
it shows that the treatment cost actually increases although the operational
cost decreases. Comparing the treatment cost of similar waste gas
purification systems should thus be made for the same operational time.
Table 7.7 does not include the parameters influence of which on the
treatment cost was less than 10% when their values were changed by
±50%. These parameters were the trickling liquid flow, biomass
conversion factor, investment cost and reactor liquid volume. Opposite to
the net ecological benefit, the relative changes of the treatment cost varied
with the gas flow rate but less with the pollutant concentration in the
waste gas. Only the influence of the C:N:P ratio varied strongly with the
toluene concentration.
The lower C:N:P ratio in Table 7.7 had been used in a bioscrubber
removing a mixture of VOCs (Schippert, 1989) and a lower liquid
residence time was suggested by Zuber et al. (1997) for the removal of
DCM.
Net ecological benefit (NEB)
The NEB is mainly influenced by the weighting factor of the ecological
benefit, but is also strongly influenced by the mass flow of TOC in the
waste water and the weighting factor of the electrical energy consumption
(Table 7.7). The relative changes were independent of the gas flow rate.

125
Table 7.7. The relative change of treatment and net ecologicalbenefit for modified parameter values. The original
values are given in brackets.
Influence on:
Parameter New value
Treatment cost NEB
Fei Fsr20 Co.2 Ci.o
Life time (20) 10 years +14% +23% -3.1% -1.8%
Time of operation (8400) 6000 hours/year +34% +21% -1.1% -0.6%
Monod constant, Vm reduced by 25% +5% +11% -2.5% -1.4%
Pressure drop (50) 100 Pa/m +2% +8% -3.3% -1.9%
Liquid residence time (24) 6 hours +7% +32% <0.1% <0.1%
Personnel (4) 2 days/month -35% -10%
C:N:P (100:5:1) 100 : 0.65 : 0.2 -8% -28%
Toluene weighting factor reduced by 5% -5.9% -5.7%
Electricity (UCPTE) Swiss (CH) mix 3.8% 2.2%
TOC yield (0.3) 0.5 -6.3% -6.1%
Steel consumption increased by 50% -1.5% -0.9%
Fgi = 1000 m-3h-!, Fg20 = 20'000 m-%1, C0.2 = 0.2 g m"3, CL0 = 1.0 g m"3
7.2 The Non-Thermal Plasma
This full scale evaluation is made for a barrier discharge reactor
consisting of a power supply, waste gas ionisation unit and an activated
carbon filter to destroy the ozone formed. The most important parameter
for calculating treatment cost and NEB is the power consumption. It is a
function of waste gas flow, VOC inlet concentration and how efficient the
VOC is removed in the plasma. The power consumption for removingtoluene in humid air (65% relative humidity at 25°C) was calculated using
our own measured removal efficiencies (Chapter 6.3.1)
P = - Intoljn
V tol,out
(143 CtoUn + 112)T|
[7.4]
where the P is the energy consumption [kWh], Fg the gas flow [m3 lr1],
Ctoi,out the outlet concentration set by legislation [0.1 g m-3 for toluene]
and r\ is an efficiency factor considering energy losses in the power
supply and the dielectric. The major loss is in the power supply (Teich,
1998) which is assumed to be 5%, thus r| = 0.95 (Ozonek et al., 1997).
The parameter values used for calculating operational cost and ecological

126
burden are listed in Table 7.8. For comparison, the power consumptionwas also calculated for other compounds using the ße-values in Table 7.9.
The large differences of the ße-values are due to the different power
supplies (discussed in Chapter 6.3.2) and the different oxidation
mechansim of trichloroethylene (TCE) compared to that of toluene
(Evans, D. et al., 1993).
Table 7.8. Parameter values used for calculating treatment cost and
ecological burden
Specific power input 208 kW nr3 our own measurements
Gas velocity in the reactor 1000 m h"1 assumed
Pressure drop ionisation unit 140 Pa nr1 our own measurements
Pressure drop act. carb. unit 1300 Pa nr1 (Lurgi, )
Gas residence time in act. carb. unit 3s assumed
act. carb. = activated carbon
Table 7.9. ße-values of selected compounds.
Compound Reactor type ße [kJ nr3] Concentration
range [g nr3]
Reference
Toluene Barrier 141-255 0.2-1 our own data
Toluene Pulsed corona 20-95 0.2-1 (van Paasen et al., 1997)
TCE Barrier 33 0.55-2.7 (Rosochaetal., 1993)
Acetone Pulsed Corona 3543 1.9 (Penetrante et al., 1997)
DCM Pulsed Corona 1480 0.57 (Penetrante et al., 1997)
Phosgene and hydrogen chloride (HCl) are by-products formed treating
chlorinated organic compounds. They are easily removed in a scrubber
with water. The investment cost and operational cost for a scrubber is,
however, assumed to be low in comparison to that of the barrier
discharge reactor and is not separately accounted for. The energy
consumption of the scrubber is assumed to be low compared to that of the
ionisation unit and the scrubber is therefore also neglected in the
ecological assessment. Removed non-chlorinated organic compounds are
assumed to be completely oxidised to CO2 and H2O.

127
7.2.1 Economie Assessment
The total investment cost includes air blower, AC power supply, power
connections, ionisation unit, activated carbon, installation and engineering.The power supply makes up the major share of the investment cost (air
blower not included) which therefore can be estimated as a function of
installed power (Figure 7.9). This estimation is based on literature sources
containing investment cost estimates of barrier discharge reactors for
VOC control (Cummings and Coogan, 1997) and ozone generators
(Bellamy et al., 1991) as well as on cost information from Swiss and
German manufactures of ozone generators (Ozonia, 1998; Wedeco, 1998)
and barrier discharge reactors for odour control (Rohrer, 1996;
Rafflenbeul, 1998). Conventional ozone generators are unsuitable for
direct oxidation of VOCs (Rafflenbeul, 1998) but are constructed in a
similar way as barrier discharge reactors used for VOC control. The data
were fitted with an exponential function, commonly used for estimatinginvestment costs (Peters and Timmerhaus, 1991)
/ p \0.65
Investment cost [$] = 440000 — [7.5]U25j
where P is the installed power [kW]. Plants larger than 200-300 kW are
not built as one single unit but will rather consist of several smaller units
placed in parallel. Extrapolations of Equation 7.5 may be made for a
rough estimate of the investment cost for larger barrier discharge
reactors. In Table 7.10, such an extrapolated value is compared to the
estimated investment cost of a pulsed corona reactor, which generally is
more expensive than a barrier discharge reactor due to the higher cost of
the power supply, and the investment cost of an ozone generator.
Operational cost includes power consumption of the power supply as well
as the air blower (calculated for the pressure drop caused by the
ionisation unit and activated carbon filter). Cost of personnel was not
considered since the reactor can be fully automated and should need little
maintenance. The main share (>98%) of the operational cost is caused by
the power consumption of the ionisation unit. The operational cost for the
removal of toluene increases rapidly with inlet concentration to very high
levels (Figure 7.10). Also for TCE, which is more efficiently removed in
the plasma than toluene, the operational cost is high for concentrations
above 0.1 g m-3 (Figure 7.10).

128
Table 7.10. Comparison of investment cost estimates made with
extrapolation of Equation 7.5 for large reactors.
Installed power Eqn. 7.5 [$] Ref. Price [$] Reference
2.8MW
20MW
3.3-105 4.5-105 Ozone generator (Bellamy et al, 1991)
11.9-105 18.3105 Pulsed corona (Civitano, 1993)
<&m
CO
oÜ
c
CD
E
CO
CD>c
1000 -r
800 --
600 -
400 -
200 +
0
0
Ozone Generation
o Ozonia
a Bellamyo Wedeco
D VOC Control
n Rafflenbeul
+Cummingsx Rohrer
100 200 300
Installed Power [kW]
400
Figure 7.9. Estimation of investment cost of barrier discharge
reactors.
cc
c
o
CO
CO
Eo
o
o
CD
O co
oÜ
VOC inlet cone, [g m"J]
Figure 7.10. Operational cost for the removal of toluene (own
measured ße-values at 65% relative humidity at 25°C) and
TCE (100% relative humidity at room temperature,
(Rosocha et al., 1993)) as a function of the inlet
concentration. The outlet concentrations were assumed to
be those of the legal limits, that is 0.1 g m-3 for toluene
and 0.02 g m-3 for TCE.

129
The treatment cost [$/1000m3] is nearly independent of the gas flow and is
mainly determined by the operational cost (Figure 7.11). Treating toluene
with a barrier discharge reactor is not economically competitive with the
bio-trickling filter, not even for strongly fluctuating waste gas streams
where the plasma can be turned off at times of no load (Figure 7.12).
Barrier
dischargeCO
O r—,
O "
Oc
CD
E
OBCDi_
I-
Oo
5
4
3
2
1
0
Biotrickling Filter
+
0.1 0.2 0.3 0.4 0.5
Toluene cone, [g m ]
Figure 7.11. Treatment cost of a barrier discharge reactor and a bio¬
trickling filter for the removal of toluene at 10'000 m3^1
calculated for own measured ße-values and removal
capacities. The outlet concentration was assumed to be the
legal limit, that is 0.1 g m-3.
E°
o
§ 4--
«à 3 --
CO
oo
c
CD
E+-»
COCD
-.r.T. 840 h/a— —4200 h/a=8400 h/a
t100 Ô5
0.1 0.2 0.3 0.4 0.5
Toluene cone, [g m ]
CO
oÜ
c
CD
E*—«
CO
CD>c
o
CDi_
03.C
CD
Figure 7.12. Treatment cost (thick line) of the barrier dischargereactor and share of investment cost (thin line) as a
function of the toluene inlet concentration and time of
operation.
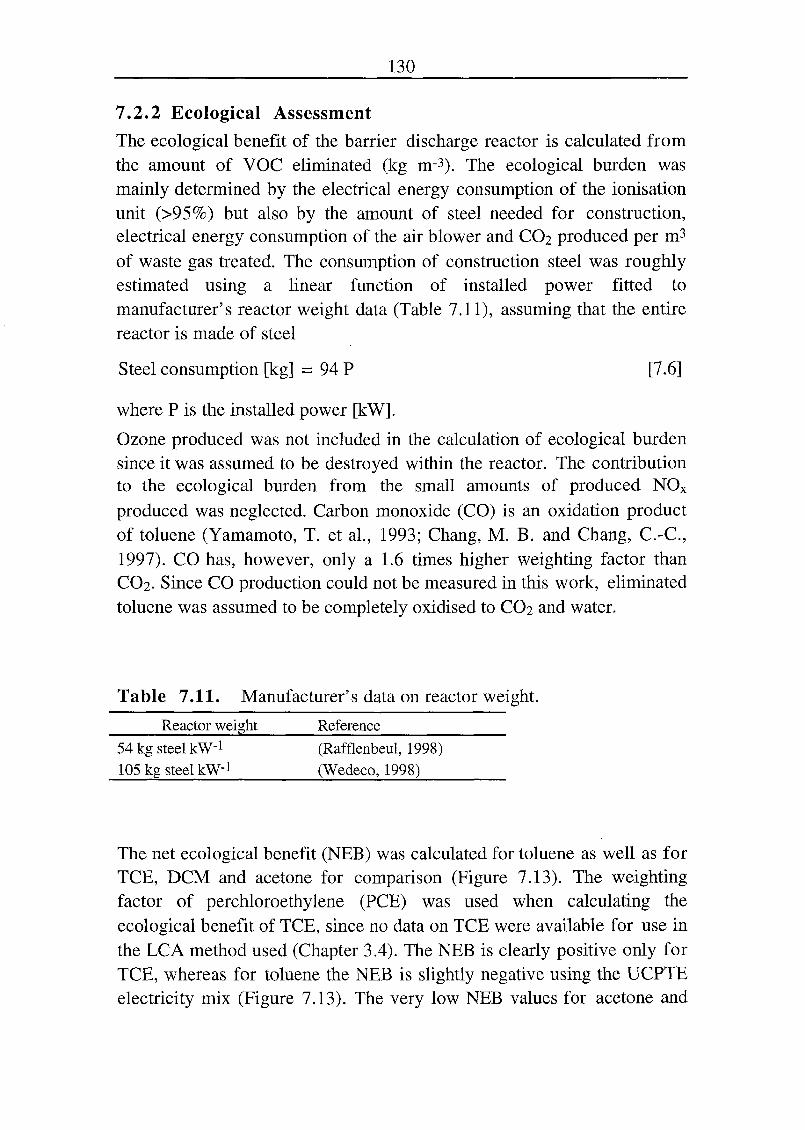
130
7.2.2 Ecological Assessment
The ecological benefit of the barrier discharge reactor is calculated from
the amount of VOC eliminated (kg nr3). The ecological burden was
mainly determined by the electrical energy consumption of the ionisation
unit (>95%) but also by the amount of steel needed for construction,
electrical energy consumption of the air blower and CO2 produced per m3
of waste gas treated. The consumption of construction steel was roughlyestimated using a linear function of installed power fitted to
manufacturer's reactor weight data (Table 7.11), assuming that the entire
reactor is made of steel
Steel consumption [kg] = 94 P [7.6]
where P is the installed power [kW].
Ozone produced was not included in the calculation of ecological burden
since it was assumed to be destroyed within the reactor. The contribution
to the ecological burden from the small amounts of produced NOx
produced was neglected. Carbon monoxide (CO) is an oxidation product
of toluene (Yamamoto, T. et al., 1993; Chang, M. B. and Chang, C.-C,
1997). CO has, however, only a 1.6 times higher weighting factor than
CO2. Since CO production could not be measured in this work, eliminated
toluene was assumed to be completely oxidised to CO2 and water.
Table 7.11. Manufacturer's data on reactor weight.
Reactor weight Reference
54 kg steel kW"1 (Rafflenbeul, 1998)
105 kg steel kW'1 (Wedeco, 1998)
The net ecological benefit (NEB) was calculated for toluene as well as for
TCE, DCM and acetone for comparison (Figure 7.13). The weightingfactor of perchloroethylene (PCE) was used when calculating the
ecological benefit of TCE, since no data on TCE were available for use in
the LCA method used (Chapter 3.4). The NEB is clearly positive only for
TCE, whereas for toluene the NEB is slightly negative using the UCPTE
electricity mix (Figure 7.13). The very low NEB values for acetone and

131
DCM are mainly due to the very high ße-values (low removal efficiency).For strongly fluctuating waste gas streams, the plasma reactor can be
turned off at times of low load. This has a positive influence on the NEB
which becomes positive for strongly fluctuating waste gas streams where
the annual operating time is reduced (Figure 7.14). The share of
electricity consumption as part of the ecological burden is for all cases
greater than 99%.
m
CO
c
"oQ.
CQLU
200j
100 --
0
-100 :-
-200 --
-300 -
0.5 1/1.5 2
A Toluene
DCM Acetone
D
VOC cone, [g m"3]
Figure 7.13. Net ecological benefit of the non-thermal plasmatreatment as a function of VOC concentration at 10'000
m3^1. The calculations were made using the UCPTE
electricity mix and for a operation time of 8400 h/a.
E
CO 21—'
c
oQ.
0
in
O- 9
^^~
fc '
0ÛLU -4
840 h/a
4200 h/a8400 h/a
Toluene cone, [g m ]
Figure 7.14. Net ecological benefit for fluctuating waste gas streams of
toluene as a function of operating time. The calculations
were made using the UCPTE electricity mix.

132
7.2.3 Sensitivity Analysis
This analysis was carried out in the same way as that of the bio-tricklingfilter. The influence of the operational time on treatment cost and NEB is
illustrated in Figures 7.12 and 7.14.
Treatment cost
Apart from the cost of electric energy, the treatment cost is mainlyinfluenced by the life time, ße-value and the energy efficiency of the
power supply. Table 7.12 does not include the pressure drop because its
influence on the treatment cost was less than 1 % when changing its value
by ±50%. The relative changes of the treatment cost varied with the gas
flow rate as well as with the waste gas concentration.
Net ecological benefit (NEB)
The NEB is mainly influenced by the choice of electricity mix, the energy
efficiency factor of the power supply, the ße-value and weighting factor
of the ecological benefit (Table 7.13). Changing to the Swiss electricitymix as well as reducing the ße-value by 50%, resulted in a positive NEB.
The pressured drop, steel and activated carbon consumption had less than
1% influence on the NEB when their values were changed by ±50% and
thus are not included in Table 7.13. The relative changes were
independent of the gas flow rate.
Table 7.12. The relative change of treatment cost for modified
parameter values. Original values are given in brackets.
Relative change:
Fg2 Fg20Parameter New value C0.15/C0.5 Q).15/Co.5
Life time (20) 10 years +32/+20% +17/+10%
ße-value reduced by 50% -44/-47% -46/-48%
Personnel (0) 1 day/month +20/+4% +2/+0.5%
Investment cost reduced by 50% -16/-10% -9/-5%
ri (0.95) 0.6 +49/+53% +52/+56%
Fg2 = 2'000 nPh-1, Fg2o = 20'000 m3^1, Co. 15 = 0.15 g m"3, C0.5 = 0.5 g m"3

133
Table 7.13. The change of net ecological benefit for other parameter
values. Original parameter values are given in brackets.
New values of the NEB
Q).i5 Q).5
Parameter New value NEB= -0.46 NEB= -4.58
Life time (20) 10 years -0.47 -4.65
ße-value reduced by 50% 0.35 -0.14
n (0.95) 0.6 -1.41 -9.76
Weighting factor reduced by 5% -0.52 -4.80
Electricity Swiss (CH) mix 1.01 3.50
Co.i5 = 0.15 g m'3, Co.5 = 0.5 g m-3
7.3 Bio-Trickling Filter Combined with Non-Thermal Plasma
This chapter contains two case studies where the treatment cost of the bio-
trickling filter in combination with the barrier discharge reactor is
calculated for the treatment of fluctuating waste gas streams and waste gas
streams with a mixture of two VOCs. The treatment cost was determined
only for those conditions where the calculated NEB was positive.
There are several possible reactor configurations of the combined system
(Wittorf, 1997). Placing the plasma before the bio-trickling filter is
advantageous only if the waste gas stream contains non-biodegradable
compounds which can be partially oxidised in the plasma reactor and
subsequently mineralised in the bio-trickling filter. In the case of toluene,
the amount of intermediate products was too low relative to the amount of
removed toluene to make this combination attractive (Chapter 5.3).
Therefore, only the combination with the plasma placed after the bio-
trickling filter will be considered here.
7.3.1 Case Study 1: Fluctuating Toluene Concentration
The waste gas stream considered in this case study is assumed to have a
base concentration with peaks of higher concentrations (Figure 7.15).
These peaks are characterised by the peak concentration and the duration
(peak period, expressed in percent of the total time of operation). At
times of base concentration only, the plasma reactor is turned off and the
toluene is removed by the bio-trickling filter. When a peak occurs, the
plasma reactor is turned on and the toluene not removed by the bio-

134
trickling filter is mineralised by the plasma reactor. This assumes an on¬
line VOC control system and that the plasma reactor can be turned on and
off without delay and loss in functionality. Pre-heating the ionisation unit
may be necessary to remove condensed water on the dielectric surface
which otherwise would prevent the barrier discharge reactor to function
normally. The additional cost caused by pre-heating is not included in the
calculations here.
In Figure 7.16, the treatment cost of the combined system is comparedwith that of a bio-trickling filter for treating fluctuating waste gas streams
containing toluene. The estimated investment cost of the bio-tricklingfilter depends on the peak concentration, whereas the operation cost
depends on the base and the peak concentrations. The treatment cost of the
combined system depends mostly on the peak period (Figure 7.16) due to
the high operating cost of barrier discharge unit. For peak periods below
2% of the total time of operation, the treatment cost of the combined
system is lower than that of the bio-trickling filter, for all peakconcentrations exceeding the base load.
co
-4—»
cd
Ö<uocoo
<uÖ<D
"oH
A Peak period [%]
. Peak cone.
0.8-6.2 g m"3
Base cone.
0.5 g m-3
co 3 T
O
O
O
^ 2 +03-
OÜ
1 --
100%
Time of operation
Figure 7.15. The waste gas
stream with fluctuating toluene
load investigated in the first case
study .
c
CD
E 0
CD
Biotricklingfilter onl
2% peak
period
1 % peakperiod
0 2 4 6 8
Toluene peak cone, [g m"3]
Figure 7.16. Calculated
treatment cost of the bio-tricklingfilter (thick line) compared to that
of the combined system (thin
lines) for a waste gas stream with
fluctuating toluene load. The
calculations were made for a base
concentration of 0.5 g nr3 and a
gas flow of 10'000m3h-i.

135
7.3.2 Case Study 2: Toluene in Mixture with Acetone
The waste gas stream considered in the second case study is a mixture of
acetone and toluene. The acetone concentration is assumed to be constant
and low (Figure 7.17). The base concentration of toluene is assumed to be
zero, thus the biological degradation activity of toluene is negligible. The
acetone is removed by the bio-trickling filter and the toluene peak by the
plasma reactor which is turned on only when a toluene peak occurs.
The treatment cost of the combined system is very high (Figure 7.18),
mainly due to the assumption that toluene is not biologically degraded.
This also prevents a direct comparison of the treatment cost with the bio-
trickling filter since it is not able to purify the waste gas stream from
acetone and toluene on its own. The treatment cost of the combined
system mainly depends on the duration of the peak periods but also on the
toluene peak concentration. The share of the treatment cost caused by the
bio-trickling filter for removing acetone was, for toluene peakconcentrations above 0.2-0.4 g m-3, less than half of the treatment cost.
co
-t—»
cd
<DOcoo
OO>
Toluene peak period [%]
Toluene.
0.4-1.6 gm-3
Acetone.
0.4 g m"3
100%
Time of operation
Figure 7.17. Schematic displayof the waste gas stream used in
case study 2.
coT 3j 10% toluene
peak p--1—-1ooo
CO
2
o 1 -- Bio-trick, filter only
c
E 0
0
—+—
0.5
H
1«J
£ Toluene peak cone, [g m"3]
Figure 7.18. The treatment cost
of the combined system (thin
lines) for the removal of acetone
and toluene. For comparison the
treatment cost of the bio-trickling
filter for the removal of acetone
(thick line) is shown. Toluene was
removed by the plasma reactor
only.

136
7.4 Discussion
This evaluation clearly shows that the bio-trickling filter is economicallyand ecologically more efficient than the barrier discharge reactor for
removing toluene. The evaluation has, however, only a limited practicalvalue since the result of the evaluation strongly depends on the data used.
Using literature data is advantageous since they are usually transparent
and based on a large data collection. It does, however, not consider any
local conditions, such as the gas composition and any special
manufacturing techniques which may considerably influence the
evaluation result. An economic and ecological assessment should therefore
be made "case-to-case" where the local conditions are also included.
The barrier discharge reactor used in this work was not optimised for
toluene removal. The poor energy efficiency may, however, improve
drastically in the future as new and more energy efficient plasma reactors
are developed. Using a more efficient plasma reactor would not only
improve its working range for treating low concentration waste gas
streams, but also increase the performance of the combined bio-plasma
system where the operational cost of the barrier discharge reactor made
up a large share of the treatment cost. The high treatment cost was also
caused by the high investment cost since it is necessary to invest in two
systems. Two systems will also increase the complexity for the user who
would rather choose to invest in one single technology. Adsorption is an
alternative to the combined system to purify the waste gas streams in the
two case studies. Adsorption is an accepted waste gas purification
technology for fluctuating low concentration waste gas streams and it
would probably have lower treatment costs than those calculated for the
combined system presented here (Rafflenbeul, 1998). Adsorption may
also be combined with a bio-trickling filter to dampen peak loads. This
combination is currently being studied in a parallell project (Rüdiger,
1998).

137
8. Concluding Remarks
Use of the non-thermal plasma is a flexible technique with respect to
fluctuations in load and composition but energy consumption may be highfor specific compounds. Contrary to the non-thermal plasma, the energy
consumption of the bio-trickling filter is low but degradation is limited to
readily water soluble and biodegradable compounds. It is also not flexible
with respect to peak loads and fluctuations in composition. The advantageof low energy consumption of the biological process and the high
flexibility of the plasma oxidation process, makes a combination of the two
processes attractive. The advantages of combined systems have alreadybeen shown for waste water treatment (Stockinger et al., 1995). One
possible combination for waste gas treatment is to use the plasma
subsequent to the biological step for mineralisation of VOC not removed
by the biological filter. The second possibility is to use the plasma before
the biological step and partially oxidise the VOCs to intermediate organicoxidation products. These oxidation products generally have higher water
solubility and biodegradability than the original VOCs. To improve one's
understanding of the removal processes active in the two systems, the
formation of toluene intermediate oxidation products in the plasma was
investigated and rigorous modelling of the bio-trickling filter was
performed. Also the energy efficiency of the plasma and removal capacityof the bio-trickling filter were studied using toluene as a model compoundto be able to asses the possibilities of a combined process.
The bio-trickling filter
The experimental results at steady inlet gas conditions confirmed the
findings made elewhere with other similar bio-trickling filters. The
biodégradation was the rate limiting step under steady state conditions and
the elimination capacity could be predicted using a one-phase model with
Monod kinetics.
It was possible to gain additional information about the kinetics and the
structure of the biofilm by measuring the CO2 production under dynamic
conditions and by simulating the performance using a dynamic biofilm

138
model. This was found to be a powerful non-destructive method to
investigate biofilm kinetics in-situ without influencing the biofilm by any
analytic devices. By discriminating between different mathematical models,
it could be shown that toluene inhibits the biodégradation rate at higherconcentrations and that the biofilm acts as a sorption volume for toluene.
The non-thermal plasma
The elimination rate of toluene was determined considering the specific
energy input but the rate was also influenced by the toluene concentration
and air humidity. It did not depend on the gas residence time in the
reaction zone. A large fraction of the reactive species reacted in the
reactive zone with other species than toluene which resulted in a low
energy efficiency.
An important oxidation mechanism was the reaction with *OH radicals. The
detected organic oxidation products were almost identical to those found by
ozonolysis of toluene in aqueous solution. This strongly suggests that
known oxidation pathways of aldehydes and organic acids in the aqueous
solution are also valid in the gas phase.
General working range of the combined biotreatment / plasma
system
With the available plasma system the amount of intermediate oxidation
products from toluene was too small to allow a useful combination with the
plasma placed before the bio-trickling filter. Instead, the working ranges
were determined only for the plasma placed subsequently to the bio-
trickling filter. From Chapter 7 it can be concluded that the treatment cost
and not the net ecological benefit (NEB) is the limiting factor determining
the working ranges. The NEB was negative only for waste gas conditions
where the treatment cost was much higher than that of other waste gas
purification technologies. NEB may be used as an additional criterion to
discriminate between waste gas purification technologies with similar
treatment cost. The working ranges presented below are assumed to be for

139
those waste gas concentrations where the treatment cost is less than
l$/1000m3. At higher treatment costs other waste gas purification
techniques, such as incineration or adsorption, may be more economically
efficient.
The working range of the full scale bio-trickling filter is assumed to
depend only on the biodegradability of the VOC which is described here bythe Monod kinetics (Ks=0.1 g m-3). Even for well biodegradable
compounds, the working range is predicted to be limited to waste gas
concentrations of less than 1 g m-3 (Figure 8.1), although limitation by
VOC or oxygen diffusion has not been considered.
The energy consumption makes up about half of the treatment cost by non¬
thermal plasma. The working range is therefore very much determined bythe energy efficiency with which the VOC is removed. In Figure 8.1 the
energy efficiency is given by the ße-value (Rosocha et al, 1993). The
working range is predicted to be for the treatment of very low VOC
concentration waste gas streams with well oxidisable compounds (Figure
8.1), for instance odour control or low concentrations of some chlorinated
solvents, for instance TCE, which are removed very efficiently in the
plasma (Rosocha et al., 1993; Penetrante et al., 1996).

140
E
>
C
CO
a>
02
«4—
O
CD
J3OS
>
Figure 8.1. Suggested general working ranges of the bio-tricklingfilter ( Ya ) and the non-thermal plasma (s? ) using the values
of Vm [g m^h"1! and ße [kJ nr3] as measure for oxidisability
of the VOCs in the bio-trickling filter and the non-thermal
plasma, respectively. In the shaded areas, the treatment cost
is lower than l$/1000m3. The dotted lines mark the
treatment cost of 1.5$/1000m3 for the bio-trickling filter
and the non-thermal plasma. The gas flow is assumed to be
10'000m3h-i.
The working range of the combined system for the removal of fluctuatingload is mainly determined by the energy effiency of the non-thermal
plasma (Figure 8.2 and 8.3). The biodegradability (represented in the
Figures 8.2 and 8.3 by different values of Vm) has a smaller influence on
the economic working range than the removal efficiency of the non¬
thermal plasma (represented in the Figures 8.2 and 8.3 by different values
of ß). Consequently, the peak period (the time of the peak load duration
expressed as fraction of the total operating time) has also a large influence
on the working range. The working ranges in Figure 8.2 and 8.3 are very
similar to those for a mixture of two compounds if one compound has a
steady base concentration and the second compound has a zero base
concentration.
0.1 1
VOC inlet cone, [g m"3]

141
_
Peak period =10%
Figure 8.2.
* ^ ~v *> -t
j.
Vm=100 g m"3h"1
'—-Vm=500 g m"3h"1'—')" 'r l' ' ' '!"—|
- '
" ' Y ""T
-3nPeak cone, [g m ]
10
Suggested general working range of the combined system
for fluctuating load of one or two compounds during peak
periods totalling 10% and a gas flow of lO'OOO m3h-!. The
two shaded areas represent the working ranges where the
treatment cost is less than l$/1000m3 for two different ße-values for compounds with fluctuating concentrations: for
the area ^ ße=20 kJ nr3 and for the area^ ße =100 kJ nr3.
The continuous and brokens thin lines show the working
range for two different values of Vm at specific ße-values.The thick line indicates where the peak concentration
equals the base concentration.
^
Peak period =30%
Vm=100 g m"3h"1
Vm=500 g m"3h"1
Peak cone, [g m"3]10
Figure 8.3. The same quantities as plotted in Figure 8.2 but presentedfor a peak duration of 30%.

142
Outlook
The performance of the bio-trickling filter in a steady state was influenced
most strongly by clogging. The processes governing the development of
clogging could, however, not be determined. In the literature, little work
has been published on how the micro-environment in the biofilm influences
the performance characteristics of the bio-trickling filter, such as e.g.
pressure drop. An investigation of this property would be possible by using
a small segmented packing where single packing elements can be removed
and investigated outside the column. A segmented packing would also allow
the investigation of the variable gas and liquid flow patterns. Such studies
are essential for the design of new bio-trickling filters.
The oxidation mechanism of toluene and its intermediate products in the
non-thermal plasma are still unclear. A more detailed study of the
governing reaction mechanisms could be done by direct gas phasemeasurements of the organic intermediate products using IR absorption and
of the radical species in the reactive zone using emission spectroscopy and
LIF. The evolution of species may also be investigated by rigorous
modelling of the plasma processes by solving the Boltzmann equation to
obtain the reaction rates of electrons followed by a kinetics simulation to
follow the further fate of the species generated and decomposed.
The working range of the combined system was limited mainly by the poor
energy efficiency of the non-thermal plasma process. The energy efficiencyof the non-thermal plasma may be improved by using a pulsed power
supply or by using a dielectric with catalytic acticity. More understandingof the reaction mechanism in the non-thermal plasma is required to
optimise the plasma process parameters for the removal of a specific
compound.

143
Symbols and Abbreviations
Abbreviations
AC alternate current
ACSL advanced continuous simulation language
BOD biological oxygen demand
CH Switzerland
COD chemical oxygen demand
cone. concentration
CSTR continuous stirred tank reactor
DC direct current
DCM dichloromethane
DW dry weight
EC elimination capacity
GC gas chromatography
GC-MS gas chromatography-mass spectrometry
HPLC high performance liquid chromatography
IC ion chromatography
MS mass spectrometry
LCA life cycle assessment
LIF Laser induced flouresence
Liq liquid
LT life time
NEB net ecological benefit
NMVOC non-methane volatile organic compounds
NOx nitrogen oxides (NO, NO2, N2O5)
OT time of operation
PCE tetrachloroethylene
PI proportional and integral controller
RE removal efficiency
SEM secondary electron multiplier
SGV superficial gas velocity
SOx sulphur oxides (SO, S02, SO3)
TC total carbon
TCE trichloroethylene
TOC total organic compound
UCPTE Union pour la coordination de la production et du transport de l'électricité
VOC volatile organic compounds

144
Symbols
A mz area
Ac m2 cross sectional area of the reactor
a m2nr3 specific area
C gm-3 gas phase concentration
C F capacitance
D m2 h"1 diffusion coefficient
E kJm-3 energy density
f s-1 frequency
F m3h-l flow
F m3 s-1 flow
g-value number of molecules/100ev a measure of the plasma energy efficiency
G number of molecules J-1 a measure of the plasma energy efficiency
h m height
H - dimensionless Henry's law constant
i A current
J g h'1 mass flux
k m3 molecules-1 s-1 two body reaction rate coefficient
kBm JK-l Boltzmann's constant
Kc02 g m-3h_1 endogenous CO2 production
Ks gm"3 half saturation coefficient
Ki gm"3 inhibition coefficient
m kg mass; mass referred to N2=28, 0=16, C=12
M molecules m-3 the concentration of all species in the plasma, that
is electrons, ions, radicals and neutral molecules
P Pa pressure
P W power
S gm"3 liquid concentration
r molecules nrV1 plasma oxidation rate
R g m-3h_1 biodégradation rate
[R] molecules m-3 concentration of reactive species in the plasma
t s time

145
T
[TOL]
V
u
vm
[VOC]
w
X
Y
z
Z
temperature
concentration of toluene in the plasma
volume
voltage
maximum degradation rate
concentration of VOC in the plasma
energy
biomass dry weight
yield coefficient
axial distance
number of elementary charges
a kJ molecules-1 a measure of the plasma energy efficiency
ß kJm-3 a measure of the plasma energy efficiency
ße kJm-3 the amount of energy needed to reduce the inlet
concentration by a factor of e-1
ßio kJm-3 the amount of energy needed to reduce the inlet
concentration by a factor of 10
A - difference operator
ÔL m liquid film thickness
ÔB m biofilm thickness
e Jh-1m-3 specific power input
«> - relative carbon content
9 - gas phase fraction
M- efficiency factor
X - proportionality constant
H h-1 specific growth rate
M-max h-1 maximum specific growth rate
V m s-1 velocity
P kg m-3 density
r s time constant
Subscripts
B biofilm
C02 carbon dioxide

146
e electron
g gas phase
HC03- hydrogen carbonate
in inlet
j refers to an arbitrary compound
L liquid
M gas phase compartment
m measuring capacitor
n refers to all species in the plasma, that is electrons, ions, radicals
and neutral molecules
N film layer
NB non-active biofilm
out outlet
r reactor
R radicals
TOC total organic carbon
toi toluene
w water
Superscripts* refers to equilibrium• radical specie

147
References
Al-Ekabi, H.; Butters, B.; Delany, D.; Holden, W.; Powell, T. and Story, J. (1993). "The
photocatalytic destruction of gaseous trichloroethylene and tetrachloroethylene over
immobilized titanium dioxide". In Photocatalytic Purification and Treatment of Water
and Air. Edited by His, D. F. and Al-Ekabi, H. Elsevier Science Publishers B. V.,
Amsterdam.
Allen, J. M.; Balcavage, W. X.; Ramachandran, B. R. and Shrout, A. L. (1998)."Determination of Henry's law constants by equilibrium partitioning in a closed
system using a new in situ optical absorbance method." Environ. Toxic. Chem.
17(7): 1216-1221.
Andrews, J. F. (1968). "A mathematical model for the continuous culture of microorganismutilizing inhibitory substances." Biotechnol. Bioeng. 10: 707-723.
APHA-AWWA-WPCF (1992). Standard Methods for the Examination of Water and Waste
Water. 18th Edition, APHA, Washington.
Arcangeli, J.-P. and Arvin, E. (1995). "Growth of an aerobic and an anoxic toluene-
degrading biofilm-a comparative study." Water Sei. & Technol. 32(8): 125-132.
Arcangeli, J. P. and Arvin, E. (1992). "Toluene biodégradation and biofilm growth in an
aerobic fixed-film reactor." Appl. Microbiol. Biotechnol 37: 510-517.
Atkinson, R. (1990). "Gas-phase tropospheric chemistry of organic compounds: a review."
Atmos. Environ. 24A(1): 1-41.
Atkinson, R.; Baulch, D. L.; Cox, A.; Hampson, R. F.; Kerr, J. J. A. and Watson, R.
(1989). "Evaluated kinetic and photochemical data for atmospheric chemistry."Supplement III, J. Phys. Chem. Ref. Data 18: 881.
Atkinson, R. and Carter, W. P. L. (1984). "Kinetics and mechanism of the gas-phasereactions of ozone with organic compounds under atmospheric conditions." Chem.
Rev. 84: 437-470.
Atkinson, R.; Carter, W. P. L.; Darnall, K. R.; Winer, A. M. and Pitts, J. N. J. (1980). "A
smog chamber and modelling study of the gas phase NOx-air photooxidation of
toluene and the cresols." Int. J. Chem. Kinet. 12: 779-836.
Atkinson, R. and Lloyd, A. C. (1984). "Evaluation of kinetic and mechanistic data for
modeling of photochemical smog." J. Phys. Chem. Ref. Data 13(2): 315-420.
Bablon, G.; Bellamy, W. D.; Bourbigot, M.-M.; Daniel, F. B.; Doré, M.; Erb, F.; Gordon,
G.; Langlais, B.; Laplanche, A.; Legube, B.; Martin, G.; Masschelein, W. J.; Pacey,G.; Reckhow, D. A. and Ventresque, C. (1991). "Fundamental aspects". In Ozone
in Water Treatment: Application and Engineering. Edited by Langlais, B., Reckhow,
D. A. and Brink, D. R. Lewis Publishers, Michigan, USA.
Bailey, P. S. (1978). Ozonation in Organic Chemistry. Vol. I, Nonolefinic Compounds.Academic Press, New York.

148
Bailey, P. S. (1982). Ozonation in Organic Chemistry. Vol. II, Olefinic Compounds.Academic Press, New York.
Bellamy, W. D.; Langlais, B.; Lykins, B. J.; Rakness, K. L.; Robson, C. M. and Schulhof,
P. (1991). "Economics of ozone systems: new installations and retrofits". In Ozone
in Water Treatment: Application and Engineering. Edited by Langlais, B., Reckhow,D. A. and Brink, D. R. Lewis Publishers, Michigan, USA.
Bierbach, A.; Barnes, I.; Becker, K. H.; Klotz, B. and Wiesen, E. (1993). "OH radical
initiated degradation of aromatic hydrocarbons". In Proc. 6th European Symp.Physico-Chemical Behaviour of Atmospheric Pollutants, Varese. European
Commision, Brussels 1994, pp. 129-136.
Bittenson, N.; Breault, R. W. and Becker, F. E. (1998). "Non-thermal plasmas for NOxcontrol". In Pan-American Workshop on Commercialization of Advanced Oxidation
Technologies, London Ont., Canada, pp. 99-108.
Blenkinsopp, S. A. and Costerton, J. W. (1991). "Understanding bacterial biofilms." Trends
Biotechnol. 9: 138-143.
Bohn, H. L. (1996). "Biofilter media". In Proceedings of the 89th Annual Meeting and
Exhibition of the Air and Waste Management Association. Air and Waste
Management Association, Pittsburgh, PA.
Bortner, M. H. and Baurer, T., Eds. (1972). Reaction Rate Handbook. DASIAC, Dep. of
Defence Nuclear Information and Analysis Center, Santa Barbara, CA.
Braun, D.; Küchler, U. and Pietsch, G. (1991). "Microdischarges in air-fed ozonizers."
J. Phys. D: Appl. Phys. 24: 564-572.
BUWAL (1993). Abluftreinigung mit Biofiltern und Biowäschern. Schriftenreihe Umwelt
Nr. 204 (Luft), Dokumentationsdienst, BUWAL, Bern.
BUWAL (1994). VOC- und PAH-Immisionsmessungen in der Schweiz (1991/1992).Umweltmaterialien Nr. 10 (Luft), Dokumentationsdienst, BUWAL, Bern.
Buxton, G. V.; Greenstock, C. L.; Helman, W. P. and Ross, A. B. (1988). "Critical review
of rate constants of hydrated electrons, hydrogen atoms and hydroxyl radicals (OH/O)in aqueous solution." J. Phys. Chem. Ref. Data 17(2): 513-886.
Caprio, V.; Insola, A. and Silvestre, A. M. (1987). "The ozonation of glyoxalic acid in
aqueous slution: chemical products and kinetics evolution." Ozone Sei. Eng. 9: 13-
22.
Carlins, J. J. and Clark, R. G. (1982). "Ozone generation by corona discharge". In
Handbook of Ozone Technology and Applications, Vol. 1. Edited by Rice, R. G. and
Netzer, A. Ann Arbor Science, New York.
Carlowitz, O. (1996). Thermische Verbrennung mit regenerativer Abgasvorvärmung. In
Fortschritte bei der thermischen, katalytischen, sorptiven und biologischen
Abgasreinigung, VDI Berichte Nr. 1034, Kommission Reinhaltung der Luft im VDI
und DIN, VDI-Verlag GmbH, Düsseldorf.

149
Chang, J.-S. (1983). "Aerosol particle growth rates in an ionized environment." J. Aerosol
Sei. 14(3): 391-393.
Chang, J.-S. (1993). "Energetic electron induced plasma processes for reduction of acid and
greenhouse gases in combustion flue gas". In Non-Thermal Plasma Techniques for
Pollution Control, NATO ASI Series G: Ecological Seiendes, Vol. 34A, pp. 1-32.
Edited by Penetrante, B. M. and Schultheis, S. E. Springer-Verlag, Berlin.
Chang, M. B. and Chang, C.-C. (1995). "Destruction and removal of volatile organic
compounds (VOCs) from gas streams with dielectric barrier discharge plasmas". In
Proceedings of the 88th Annual Meeting and Exhibition, Air & Waste Management
Association, Vol. 4B, pp.95-WP77B.05, San Antonio, Texas.
Chang, M. B. and Chang, C.-C. (1997). "Destruction and removal of toluene and MEK
from gas streams with silent discharge plasmas." AIChE J. 43(5): 1325-1330.
Chapman, B. (1980). Glow Discharge Processes. John Wiley & Sons, New York.
Characklis, W. G. and Marshall, K. C. (1990). "Biofilms: a basis for an interdisciplinaryapproach". In Biofilms. Edited by Characklis, W. G. and Marshall, K. C. John
Wiley & Sons, New York.
Chaudhuri, B. K. and Wiesmann, U. (1996). "Kinetic study of the anaerobic degradation of
toluene by a mixed culture." Acta Biotechnol. 16(1): 31-41.
Christensen, B. E. and Characklis, W. G. (1990). "Physical and chemical properties of
biofilms". In Biofilms. Edited by Characklis, W. G. and Marshall, K. C. John
Wiley & Sons, New York.
Ciba (1995). Personal communication. Ciba-Geigy, Schweizerhalle.
Civitano, L. (1993). "Industrial application of pulsed corona processing to flue gas". In
Non-Thermal Plasma Techniques for Pollution Control, NATO ASI Series G:
Ecological Seiendes, Vol. 34B, pp.281-308. Edited by Penetrante, B. M. and
Schultheis, S. E. Springer-Verlag, Berlin.
Clairtech (1998). Personal communication. Clairtech GmbH, Köln.
Colasit (1998). Personal communication. Colasit AG, Spiez, Switzerland.
Coogan, J. J. and Sappey, A. D. (1996). "Distribution of OH within silent discharge plasmareactors." IEEE Transactions on Plasma Science 24(1): 91-93.
Cosby, P. C. (1993a). "Electron-impact dissociation of nitrogen." J. Chem. Phys. 98(12):9544-9553.
Cosby, P. C. (1993b). "Electron-impact dissociation of oxygen." J. Chem. Phys. 98(12):9560-9569.
Cummings, M. A. and Coogan, J. (1997). "Cost effectiveness of silent discharge plasma for
point-of-use VOC emissions control in semiconductor fabrication". In ControllingIndustrial Emissions, Inst. Chem. Eng. Symp. Ser. 143, Rugby, UK, pp. 179-186.

150
de Beer, D. and Stoodley, P. (1995). "Relation between the structure of an aerobic biofilm
and transport phenomena." Water Sei. & Technol. 32(8): 11-18.
Decoret, C; Royer, J.; Legube, B. and Dore, M. (1984). "Experimental and theoretical
studies of the mechanism of the initial attack of ozone on some aromatics in aqueousmedium." Environ. Technol. Letters 5(5): 207-218.
Deshusses, M. (1994). Biodegradation of mixtures of ketone vapours in biofilters for the
treatment of waste air. Dissertation No. 10633, ETH Zürich.
Devinny, J. S.; Deshusses, M. A. and Webster, T. S. (1999). Biofiltration for Air Pollution
Control. Lewis Publishers, New York.
Devinny, J. S. and Hodge, D. S. (1995). "Formation of acidic and toxic intermediates in
overloaded ethanol biofilters." J. Air & Waste Manage. Assoc. 45(2): 125-131.
Devlin, H. R. and Harris, I. J. (1984). "Mechanism of the oxidation of aqueous phenol with
dissolved oxygen." Ind. Eng. Chem. Fundam. 23: 387-392.
Diks, R. M. M. and Ottengraf, S. P. P. (1991a). "Verification studies of a simplified model
for the removal of dichloromethane from waste gases using a biological trickling filter
(part I)." Bioprocess Engineering 6(3): 93-99.
Diks, R. M. M. and Ottengraf, S. P. P. (1991b). "Verification studies of a simplified model
for the removal of dichloromethane from waste gases using a biological trickling filter
(part II)." Bioprocess Engineering 6(4): 131-140.
Diks, R. M. M. and Ottengraf, S. P. P. (1994). "Technology of trickling filters". In VDI-
Verein Deutscher Ingenieure, Biologische Abgasreinigung, VDI Berichte Nr. 1104.
Edited by Kommission Reinhaltung der Luft im VDI und DIN. VDI-Verlag GmbH,Düsseldorf.
Diks, R. M. M.; Ottengraf, S. P. P. and Vrijland, S. (1994). "The existance of a biologicalequilbrium in a trickling filter for waste gas purification." Biotechnol. Bioeng. 44:
1279-1287.
Dorfman, L. M.; Taub, I. A. and Bühler, R. E. (1962). "Pulse radiolysis studies. I.
Transient spectra and reaction-rate constants in irriadiated aqeous solutions of
benzene." J. Chem. Phys. 36(11): 3051-3053.
Dorfman, L. M.; Taub, I. A. and Harter, D. A. (1964). "Rate constants for the reaction of
the hydroxyl radical with aromatic molecules." J. Chem. Phys. 41: 2954-2955.
Dutton, J. (1975). "A survey of electron swarm data." J. Phys. Chem. Ref. Data 4(3): 577-
856.
Eliasson, B.; Hirth, M. and Kogelschatz, U. (1987). "Ozone synthesis from oxygen in
dielectric barrier discharge." J. Phys. D: Appl. Phys. 20: 1421-1437.
Eliasson, B.; Egli, W. and Kogelschatz, U. (1994). "Modelling of dielectric barrier dischargechemistry." Pure & Appl. Chem. 66(6): 1275-1286.
Elmaimouni, L.; Minetti, R.; Sawerysyn, J. P. and Devolder, P. (1993). "Kinetics and
thermochemistry of the reaction of benzyl radical with O2 : investigations by

151
discharge flow/laser induced fluorescence between 393 and 433K." Int. J. Chem.
Kinet. 25: 399-403.
Evans, D.; Rosocha, L. A.; Anderson, G. K.; Coogan, J. J. and Kushner, M. J. (1993)."Plasma remediation of trichloroethylene in silent discharge plasmas." J. Appl. Phys.74(9): 5378-5386.
Evans, S. (1996). "Trotz beachtlichen Erfolgen der Luftreinhaltemassnahmen bleibt noch viel
zu tun." BUWAL-Bulletin 1: 24-27.
Falkenstein, Z. (1997). "Processing of C3H7OH, C2HCI3 and CCI4 in flue gases usingsilent discharge plasmas (SDPs), enhanced by (V)UV at 172 nm and 253.7 nm." J.
Adv. Oxid. Technol. 2(1): 223-238.
Fan, L.-S.; Leyva-Ramos, R. and Wisecarver, K. D. (1990). "Diffusion of phenol through a
biofilm grown on activated carbon particles in a draft-tube three-phase fluidized-bed
bioreactor." Biotechnol. Bioeng. 35: 279-286.
Fehsenfeld, F. C; Mosesman, M. and Ferguson, E. E. (1971). "Ion-molecule reactions in
an 02+-H20 system." J. Chem. Phys. 55(1): 2115-2120.
Ferguson, E. E.; Fehsenfeld, F. C. and Albritton, D. L. (1979). "Ion chemistry of the earths
atmosphere". In Gas Phase Ion Chemistry, Vol. 1. Edited by Bowers, M. T.
Academic Press, New York, pp. 45-82.
Feuerstein, W.; Gilbert, E. and Eberle, S. H. (1981). "Modellversuche zur Oxidation
aromatischer Verbindungen mittels Wasserstoffperoxid in der Abwasserbehandlung."Vom Wasser 56: 35-54.
Finlayson-Pitts, B. J. and Pitts, J. N. J. (1986). Atmospheric Chemistry. John Wiley &
Sons, New York, Chapter 12D.
Franz, G. (1991). "Oxidation". In Ullman's Encyclopedia of Industrial Chemistry, Vol.
A18, pp.271-295. Edited by Elvers, B., Hawkins, S. and Schulz, G. VCH,
Weinheim.
Frischknecht, R.; Hofstetter, P.; Knoepfel, L; Dones, R. and Zollinger, E. (1996).Ökoinventar für Energiesysteme. Third Edition, Laboratorium für Energisysterne,ETH Zürich, PSI Villigen, Zürich.
Futamura, S. and Zhang, A. (1996). "Factors and intermediates governing byproductdistribution for plasma chemical processing". In 1996 IEEE Industry ApplicationsConference Thirty-First IAS Annual Meeting, Vol. 3, pp.1818-1825, San Diego,California.
Futamura, S.; Zhang, A. and Einaga, H. (1998). "Involvement of active oxygen species in
plasma chemical decomposition of volatile organic compounds". In Proceedings of
the Asia-Pacific Workshop on Water and Air Treatment by Advanced Oxidation
Technologies: Innovation and Commercial Applications, 17-19 Dec. 1998, AIST
Tsukuba Research Center, Tsukuba, Japan, pp. 87-90.

152
Gaffney, J. S.; Atkinson, R. and Pitts, J. N. J. (1976). "Reaction of 0(3P) atoms with
toluene and 1-methylcyclohexane." J. Am. Chem. Soc. 98(7): 1828-1832.
Gentile, A. C. and Kushner, M. J. (1995). "Reaction chemistry and optimization of plasmaremediation of NxOy from gas streams." J. Appl. Phys. 78(3): 2074-2085.
Getoff, N. and Solar, S. (1988). "Radiation Induced Decomposition of Chlorinated Phenols
in Water." Radiât. Phys. Chem. 31(1-3): 121-130.
Gilbert, E. (1976). "Reactions of ozone with organic compounds in dilute aqueous solution:
identification of their oxidation products". In Second Intl. Symposium on Ozone
Technology, pp.253-261, Cincinatti, Ohio. Intl. Ozone Assoc.
Glaze, W. H.; Koga, M. and Cancilla, D. (1989). "Ozonation byproducts. 2. Improvementof an aqueous-phase derivatization method for the detection of formaldehyde and
other carbonyl compounds formed by the ozonation of drinking water." Environ. Sei.
Technol. 23: 838-847.
Gmelin (1973). Gmelin Handbuch, 8th Edition, Part C3. Verlag Chemie, GmbH, Weinheim
an der Bergstrasse.
Gottschalk, G. and Knackmuss, H.-J. (1993). "Bakterien und der Abbau von Chemikalien -
Natürliches und durch Kombination oder Konstruktion Erreichbares." Angew.Chemie. 105: 1437-1564.
Griffith, J. F. and Barnad, J. A. (1995). Flame and Combustion. Third Edition, Blackie
Academic & Professional, London.
Grosjean, D. (1985). "Reactions of o-cresol and nitrocresol with NOx in sunlight and with
ozone-nitrogen mixtures in the dark." Environ. Sei. Technol. 19: 968-974.
Hayduk, W. and Laudie, H. (1974). "Prediction of diffusion coefficients for non-electrolytesin dilute aqueous solution." AIChE Journal 20: 611-615.
Heits, H.; Laurenzis, A. and Werner, U. (1997). "Biologische Abgasreinigung mit
kontrolliertem Biomasseaustrag im periodisch rückgespülten Rieselbettreaktor."
Gefahrstoffe-Reinhaltung der Luft 57: 153-158.
Hekmat, D.; Linn, A.; Stephan, M. and Vortmeyer, D. (1997). "Biodegradation dynamics of
aromatic compounds from waste air in a trickle-bed reactor." Appl. Microbiol.
Biotechnol 48: 129-134.
Hekmat, D. and Vortmeyer, D. (1994). "Modelling of biodégradation processes in trickle-
bed bioreactors." Chem. Eng. Sei. 49, No 24A: 4327-4345.
Heslinga, D. C. (1994). "Biofiltration technology". In VDI-Verein Deutscher Ingenieure,
Biologische Abgasreinigung, VDI Berichte Nr. 1104. Edited by Kommission
Reinhaltung der Luft im VDI und DIN. VDI-Verlag GmbH, Düsseldorf.
Hinson, R. K. and Kocher, W. M. (1996). "Model for effective diffusivities in aerobic
biofilms." J. Environ. Eng. 122(11): 1023.

153
Hirota, K.; Mätzing, H.; Paur, H.-R. and Woletz, K. (1995). "Analyses of products formed
by electron beam treatment of VOC/air mixtures." Radiât. Phys. Chem. 45(4): 649-
655.
Hoigné, J. (1988). "The chemistry of ozone in water". In Process Technologies for Water
Treatment, pp. 121-143. Edited by Stucki, S. Plenum Publishing Corperation, New
York, USA.
Hoigné, J. and Bader, H. (1976). "The role of hydroxy radical reactions in ozonation
processes in aqueous solutions." Water Research 10: 377-386.
Hoigné, J. and Bader, H. (1983). "Rate constants of reactions of ozone with organic and
inorganic compounds in water -1." Water Research 17: 173-183.
Hucknall, D. J. (1985). Chemistry of Hydrocarbon Combustion. Chapman and Hall,
London.
Hugler, W. C; Cantu-De la Garza, J. G. and Villa-Garcia, M. (1996). "Biofilm analysis for
an odor-removing trickling filter". In Proceedings of the 89th Annual Meeting and
Exhibition of the Air and Waste Management Association. Air and Waste
Management Association, Pittsburgh, PA.
Hungerbühler, K.; Ranke, J. and Mettier, T. (1999). Chemische Produkte und Prozesse.
Grundkonzepte zum umweltorientierten Design. Springer-Verlag, Berlin.
Hutchison, J. and Wright, N. (1996). "VOC destruction in a microwave-energized plasma".In Case Studies in Environmental Technology. Edited by Sharrat, P. and Sparshott,M. Institution of Chemical Engineers, Rugby, Warwickshire, England.
lannuzzi, M. P.; Jeffries, J. B. and Kaufman, F. (1982). "Product channels of the N2(A3) +
02 interaction." Chem. Phys. Lett. 129: 570-574.
Imamura, S.; Ikebata, M.; Ito, T. and Ogita, T. (1991). "Decomposition of ozone on a silver
catalyst." Ind. Eng. Chem. Res. 30(1): 217-221.
Ingham, J.; Dunn, I. J.; Heinzle, E. and Prenosil, J. E. (1994). Chemical Engineering
Dynamics. VCH Verlagsgesellschaft mbH, Weinheim.
Ingram, M.W; Roush, R. and Hutcherson, R.K. (1996). "Pulse shape and the destruction of
toluene by a pulsed corona reactor". In Second International Symposium on
Advanced Oxidation Technologies, San Fransisco, CA, pp. 9.
Itikawa, Y.; Hayashi, M.; Ichimura, A.; Onda, K.; Salumoto, K.; Takayanagi, K.;
Nakamura, M.; Nishimura, H. and Takayanagi, T. (1986). "Cross sections for
collisons of electrons and photons with nitrogen molecules." J. Phys. Chem. Ref.
Data 15(3): 985-1010.
Jacob, M. (1993). Simulation of the complex plasma chemistry of a pulsed corona dischargein dry and humid air for surface modification of polypropylene films. MSc Thesis,
Michigan Technological University, Houghton, MI.

154
Jones, W. L.; Mirpuri, R. G.; Villaverde, S.; Lewandowski, Z. and Cunningham, A. B.
(1997). "The effect of bacterial injury on toluene degradation and respiration rates in
vapor phase bioreactors." Water Sei. & Technol. 36(1): 85-92.
J0rgensen, C; FUyvbjerg, J.; Arvin, E. and Jensen, B. K. (1995). "Stoichiometry and
kinetics of microbial toluene degradation under denitrifying conditions."
Biodegradation 6(2): 147-156.
Kirchner, K.; Schlachter, U. and Rehm, H.-J. (1989). "Biological purification of exhaust air
using fixed bed bacterial monocultures." Appl. Microbiol. Biotechnol 31: 629-632.
Kirchner, K.; Wagner, S. and Rehm, H.-J. (1996). "Removal of organic air pollutants from
exhaust gases in the trickle-bed bioreactor. Effect of oxygen." Appl. Microbiol.
Biotechnol 45: 415-419.
Koch, M. (1994). Decomposition of chlorinated organic compounds in gaseous hazardous
waste using a tunable plasma reactor. Dissertation, Massachusetts Institute of
Technology, Cambridge MA.
Kogelschatz, U. (1988). "Advanced ozone generation". In Process Technologies for Water
Treatment. Edited by Stucki, S. Plenum Press, New York, pp. 87-120.
Kogelschatz, U. (1997). "Potential of electrical gas discharges for pollution control of large
gas volumes". In International Symposium on Electrical Technologies for
Environmental Protection (TTEP 97), Lodz, Poland.
Krasnoperov, L. N.; Krishtopa, L. G. and Bozzelli, J. W. (1997). "Study of volatile organic
compounds destruction by dielectric barrier corona discharge." J. Adv. Oxid.
Technol. 2(1): 248-256.
Krumbäck, R. (1996). Katalytische Reinigung eines CKW-haltigen Abgasstromes.Fortschritte bei der thermischen, katalytischen, sorptiven und biologischen
Abgasreinigung, VDI Berichte Nr. 1034, Kommission Reinhaltung der Luft im VDI
und DIN, VDI-Verlag GmbH, Düsseldorf.
Kunai, A.; Hâta, S.; Ito, S. and Sasaki, K. (1986). "The role of oxygen in the hydroxylationreaction of benzene with Fenton's reagent. ^O tracer study." J. Am. Chem. Soc.
108: 6012-6016.
Laurenzis, A.; Heits, H.; Wübker, S.-M.; Heinze, U. and Friedrich, C. (1998). "Continuous
biological waste gas treatment in stirred trickle-bed reactor with discontinuous
removal of biomass." Biotechnol. Bioeng. 57(4): 497-503.
Lee, J.-Y.; Jung, K.-H. and Kim, H.-S. (1995). "Amplification of toluene dioxygenase
genes in a hybrid Pseudomonas strain to enhance the biodégradation of benzene,
toluene and p-xylene mixture." Biotechnol. Bioeng. 45: 488-495.
Legube, B.; Guyon, S.; Sugimitsu, H. and Dore, M. (1983). "Ozonation of some aromatic
compounds in aqueous solution: styrene, benzaldehyde, naphtalene, diethylphtalate,ethyl and chloro benzenes." Ozone Sei. Eng. 5(1): 151-170.

155
Leson, G. and Smith, B. J. (1997). "Petroleum environmental research forum field study on
biofilters for control of volatile hydrocarbons." J. Environ. Eng. 123(6): 556-562.
LRV (1985). Luftreinhalteverordnung SR 814.318.142.1, 16th December. Schweizerischer
Bundesrat, Bern.
Lurgi (1997). Datenblatt Richtwerte, 4mm Formkohle, trockene Luft (20°C, 1 bar), feste
Packung. Lurgi GmbH, Frankfurt a. M.
Mairitsch, K. and Friedl, A. (1997). "Wasserhaushalt von Biofilmen in der biologischen
Abluftreinigung". In Biological Waste Gas Cleaning, Proceedings of an International
Symposium, pp.149-156, Maastricht, the Netherlands, 28-29 April 1997.
Manley, T. C. (1943). "The electric characteristics of the ozonator discharge." Trans.
Electrochemical Soc. 84: 83-96.
March, J. (1985). Advanced Organic Chemistry. Third Edition, John Wiley & Sons, New
York.
Matter, D.; Mohr, M.; Fendel, W.; Schmidt-Ott, A. and Burtscher, H. (1995). "Multiplewavelength aerosol photoemission by excimer lamps." J. Aerosol Sei. 26: 1101-
1115.
Mätzing, H. (1991). "Chemical kinetics of flue gas cleaning by irradiation with electrons."
Adv. Chem. Phys 80: 315-402.
Mätzing, H. (1993). "Chemical kinetics model of S02 / NOx removal by electron beam". In
Non-Thermal Plasma Techniques for Pollution Control, NATO ASI Series G:
Ecological Seiendes, Vol. 34A. Edited by Penetrante, B. M. and Schultheis, S. E.
Springer-Verlag, Berlin.
McRae, G. J.; Tilden, J. W. and Seinfeld, J. H. (1982). "Global sensitivity analysis-a
computional implementation of the fourier amplitude sensitivity test (FAST)."
Computers & Chemical Engineering 6(1): 15-22.
Meier, M. A. (1997). Eco-efficiency evaluation of waste gas purification systems in the
chemical industry. LCA Documents, Vol. 2, Eco Informa Press, Bayreuth, Germany.
Mirpuri, R.; Jones, W. and Bryers, J. D. (1997). "Toluene degradation kinetics for
planktonic and biofilm-grown cells of Pseudomonas putida 54G." Biotechnol.
Bioeng. 53(6): 535-546.
Miyagawa, Y.; Ehara, Y.; Kishida, H. and Ito, T. (1998). "Effect of oxygen decomposing of
volatile organic compounds by silent discharge". In Proceedings of the Asia-Pacific
Workshop on Water and Air Treatment by Advanced Oxidation Technologies:Innovation and Commercial Applications, 17-19 Dec. 1998, AIST Tsukuba Research
Center, Tsukuba, Japan, pp. 83-86.
Miziolek, A. W.; Herron, J. T.; Mallard, W. G.; Hudgens, J. W.; Green, D. S.; Tsang, W.
and Chang, J.-S. (1994). "Importance of chemistry in non-thermal plasma control of
volatile organic compounds and air toxics". In Proceedings of the ELMECO '94
Meeting, Lublin, Poland.

156
Monod, J. (1949). "The growth of bacteria cultures." Annu. Rev. Microbiol. 3: 371-394.
Nasciuti, A. F. G. (1995). Verminderung von Stickoxiden aus Verbrennungsgasen durch
eine Barrieren-Entladung. Dissertation No. 11335, ETH Zürich.
Neely, W. C; Clothiaux, E. J.; Gross, C. A. and Newhouse, E. I. (1992). "Decompositionof organic compounds in a silent discharge plasma". In Incineration Conference:
Thermal Treatment of Radioactive, Hazardous Chemical, Mixed and Medical Wastes,
pp. 175-178, Albuquerque, New Mexico.
Oehlschlaeger, H. F. (1978). "Reactions of ozone with organic compounds". In
Ozone/Chlorine Dioxide Oxidation Products of Organic Materials, Intl. Ozonw.
Assoc, Vienna
Oh, Y.-S.; Shareefdeen, Z.; Baltzis, B. C. and Bartha, R. (1994). "Interaction between
benzene, toluene and p-xylene (BTX) during their biodégradation." Biotechnol.
Bioeng. 44: 533-538.
Ottengraf, S. P. P. (1986). "Exhaust gas purification". In Biotechnology, Vol. 8. Edited byRehm, H. J. and Reed, G. VCH Verlagsgesellschaft, Weinheim, Germany.
Ozonek, J.; Fijalkowski, S. and Polio, I. (1997). "Energy identification of energy utilization
effiency in an industrial process of ozone generation." Ozone Sei. Eng. 19(3): 201-
226.
Ozonia (1998). Personal communication. Ozonia AG, Dübendorf.
Paulsen, P. D. (1995). "Analysis of advanced oxidant enhancement of granular activated
carbon regeneration". In Abstracts of the World Environmental Congress, Ontario,
Canada.
Paur, H.-R. (1993). "Removal of volatile hydrocarbons from industrial off-gas". In Non-
Thermal Plasma Techniques for Pollution Control, NATO ASI Series G: EcologicalSeiendes, Vol. 34B, pp.77-89. Edited by Penetrante, B. M. and Schultheis, S. E.
Springer-Verlag, Berlin.
Pedersen, A. R. and Arvin, E. (1995). "Removal of toluene in waste gases using a biological
trickling filter." Biodegradation 6: 109-118.
Pedersen, A. R. and Arvin, E. (1997). "Toluene removal in a biofilm reactor for waste gas
treatment." Water Sei. & Technol. 36(1): 69-76.
Pedersen, A. R.; Möller, S.; Molin, S. and Arvin, E. (1997). "Activity of toluene degradingPseudomonas putida in the early growth phase of a biofilm for waste gas treatment."
Biotechnol. Bioeng. 54(2): 131-141.
Penetrante, B. M. (1993). "Preface". In Non-thermal Plasma Techniques for Pollution
Control, NATO ASI Series G: Ecological Seiendes, Vol. 34A. Edited by Penetrante,
B. M. and Schultheis, S. E. Springer-Verlag, Berlin.
Penetrante, B. M.; Hsiao, M. C; Bardsley, J. N.; Merrit, B. T.; Vogtlin, G. E. and
Wallman, P. H. (1996). "Electron beam and pulsed corona processing of volatile
organic compounds in gas streams." Pure & Appl. Chem. 68: 1083-1087.

157
Penetrante, B. M.; Hsiao, M. C; Merrit, B. T. and Vogtlin, G. E. (1997). "Comparison of
pulsed corona and electron beam processing of hazardous air pollutants." J. Adv.
Oxid. Technol. 2(2): 299-304.
Perry, R. A.; Atkinson, R. and Pitts, J. N. J. (1977). "Kinetics and mechanism of the gas
phase reaction of OH radicals with aromatic hydrocarbons over the temperature range
296-473K." J. Phys. Chem. 81(4): 296-304.
Peters, M. S. and Timmerhaus, K. D. (1991). Plant Design and Economics for Chemical
Engineers. 4th Edition, McGraw-Hill, New York.
Peyrous, R.; Pignolet, P. and Held, B. (1989). "Kinetic simulation of gaseous speciescreated by an electric discharge in dry and humid oxygen." J. Phys. D: Appl. Phys.22: 1658-1667.
Peyton, B. M. and Characklis, W. G. (1993). "A statistical analysis of the effect of substrate
utilization and shear stress on the kinetics on biofilm detachment." Biotechnol.
Bioeng. 41:728-735.
Pietsch, G. J. (1996). "Investigation and properties of the discharge in dielectric barrier
reactors." J. Adv. Oxid. Technol. 1(1): 61-66.
Rafflenbeul (1998). Personal communication. Rafflenbeul & Partner, Frankfurt a. M.
Rafflenbeul, R. (1996). "Eine günstige Kombination." Entsorga (April): 39-44.
Rafflenbeul, R. (1998). "Nichttermische Plasmaanlagen (NTP) zur Luftreinhaltung in der
Abfallwirtschaft." Müll und Abfall (30)(1): 38-44.
Reij, M. W.; de Gooijer, K. D.; de Bont, J. A. M. and Hartmans, S. (1995). "Membrane
bioreactor with a porous hydrophobic membrane as a gas-liquid contactor for waste
gas treatment." Biotechnol. Bioeng. 45: 107-115.
Renard, A. (1895). "Sur 1' ozotoluène." Hebd. Seances Acad. Sei. 121: 651.
Reschke, G. and Mathews, W. (1995). "Lösungsmittel-Rückgewinnung durch Adsorptionan Adsorberharzen." Chem. Ing. Tech. 67(1): 50-59.
Rittmann, B. E. and Manem, J. A. (1992). "Development and experimental evaluation of a
steady-state, multispecies biofilm model." Biotechnol. Bioeng. 39: 914-922.
Rohrer, J. (1996). Personal communication. Up-to-Date Technology, Oberurnen,
Switzerland.
Rosocha, L. A.; Anderson, G. K.; Bechtold, L. A.; Coogan, J. J.; Heck, H. G.; Kang, M.;
McCulla, W. H.; Tennant, R. A. and Wantuck, P. J. (1993). "Treatment of
hazardous organic wastes using silent discharge plasmas". In Non-Thermal Plasma
Techniques for Pollution Control, NATO ASI Series G: Ecological Seiendes, Vol.
34B, pp.281-308. Edited by Penetrante, B. M. and Schultheis, S. E. Springer-
Verlag, Berlin.
Rowe, B. R.; Vallée, F.; Queffelec, J. L.; Gomet, J. C. and Morlais, M. (1988). "The yieldof oxygen and hydrogen atoms through dissociative recombination of H20+ ions
with electrons." J. Chem. Phys. 88(2): 845-850.

158
Rückauf, A. (1998). Lecture held in The 1998 European Workshop on Water and Air
Treatment by AOT: Innovative and Commercial Applications. Lausanne, October 11-
14.
Rüdiger, P. (1998). Personal communication. Institut für Verfahrenstechnik und
Kältetechnik, ETH, Zürich.
Schippert, E. (1989). "Biowäscher nach einer Dosenlackieranlage". In Biologische
Abluftreinigung, VDI Bericht 735. Edited by Tagesbericht der VDI Kommision, VDI
Verlag, Düsseldorf.
Schippert, E. (1994). "Biowäschertechnologie". In VDI-Verein Deutscher Ingenieure,
Biologische Abgasreinigung, VDI Berichte Nr. 1104. Edited by VDI-Verlag GmbH,Düsseldorf.
Schlegel, H. G. (1992). Allgemeine Mikrobiologie. 7th Edition, Georg Thieme Verlag,
Stuttgart.
Schmitt, J.; Nivens, D.; White, D. C. and Flemming, H.-C. (1995). "Change of biofilm
properties in response to sorbed substances-an FTIR-ATR study." Water Sei. &
Technol. 32(8): 149-155.
Schnitzer, H. (1998). "Die auf einer Stromanalyse basierende Implentierung von
vorsorgendem integrierten Umweltschutz."Chemie Ingenieur Technik 70(1+2): 64-7 3.
Schönduve, P.; Sàra, M. and Friedl, A. (1996). "Influence of physiologically relevant
parameters on biomass formation in a trickle-bed bioreactor used for waste gas
cleaning." Appl. Microbiol. Biotechnol 45: 286-292.
Schumpe, A.; Quicker, G. and Deckwer, W.-D. (1982). "Gas solubilities in microbial
culture media." Adv. in Biochem. Eng. 24: 1-38.
Seinfeld, J. H. (1986). Atmospheric Chemistry and Physics of Air Pollution. John Wiley &
Sons, New York.
Seuwen, R. and Warneck, P. (1995). "Oxidation of toluene in NOx free air: productdistribution and mechanism." Int. J. Chem. Kinet. 28: 315-332.
Shugarman, L. E. (1991). "Ultraviolet/activated oxygen a new air pollution control
technology comes of age". In Air Pollution Control, Pittsburgh, Pennsylvania, USA.
Air & Waste Manage. Ass.
Sorial, G. A.; Smith, F. L.; Suidan, M. T.; Pandit, A.; Biswas, P. and Brenner, R. C.
(1997). "Evaluation of trickle bed air biofilter performance for BTEX removal."
J. Environ. Eng. 123(6): 530-537.
Speitel, G. E. and DiGiano, F. A. (1987). "Biofilm shearing under dynamic conditions."
Environ. Eng. ASCE 113(3): 464-475.
Staehelin, J. and Hoigné, J. (1985). "Decomposition of ozone in water in the presence of
organic solutes acting as promoters and inhibitors of radical chain reactions."
Environ. Sei. Technol. 19(12): 1206-1213.

159
Steiner, E. C; Rey, T. D. and McCroskey, P. S. (1990). Simusolv Reference Guide, Vol. 1
and 2. The Dow Chemical Company, Midland, Michigan.
Stockhammer, S. (1992). "Biowäscher: Aufbau, Verfahrensvarienten und Betriebs¬
erfahrungen". In Abluftreinigung mit Biofiltern und Biowäschern. Schriftenreihe
Umwelt nr. 204 (Luft) 1993, Konferenz d. techn. Akademie, Esslingen am 17/18
Sept., Samen. Dokumentationsdienst, BUWAL, Bern.
Stockinger, H. (1995). Removal of biorefractory pollutants in wastewater by combined
ozonation-biotreatment. Dissertation No. 11063, ETH Zürich.
Stockinger, H.; Heinzle, E. and Kut, O. M. (1995). "Removal of chloro and nitro aromatic
wastewater pollutants by ozonation and biotreatment." Environ. Sei. Technol. 29:
2016-2022.
Stumm, W. and Morgan, J. J. (1996). Aquatic Chemistry. Third Edition, John Wiley &
Sons, New York.
Tautz, H.; Bronnenheimer, R.; Frank, P. and Zeller, B. (1992). "Besonderheiten und
Betriebsereignisse eines Hochleistungsbiofilters." Entsorgungspraxis 10(11): 780-
791.
Teich, T. H. (1998). Personal communication. High Voltage Laboratory, ETH, Zürich.
Tezuka, M. and Yajima, T. (1996). "Oxidation of aromatic hydrocarbons with oxygen in a
radiofrequency plasma." Plasma Chemistry and Plasma Processing 16(3): 329-340.
Thissen, N. (1995). "Biologische Abluftreinigung in Kombination mit anderen Verfahren."
WLB Wasser, Luft und Boden 39(5): 51-54.
Tochikubu, F. (1998). Personal communication. High Voltage Laboratory, ETH, Zürich.
Trulear, M. G. and Characklis, W. G. (1982). "Dynamics of biofilm processes." J. Water
Pollution Control Fedn 54(9): 1288-1301.
van Doren, J. M.; Barlow, S. E.; DePuy, C. H.; Bierbaum, V. M.; Dotan, I. and Ferguson,E. E. (1986). "Chemistry and structure of the CH302+ product of the 02+ + CH4reaction." J. Phys. Chem 90(12): 2772-2777.
van Groenestijn, J. W.; Doddema, H.; Kok, H. and Koster, T. P. M. (1994). "Combined
photochemical treatment of off-gases.". In VDI-Verein Deutscher Ingenieure,Biologische Abgasreinigung, VDI Berichte Nr. 1104. Edited by Kommission
Reinhaltung der Luft im VDI und DIN. VDI-Verlag GmbH, Düsseldorf.
van Groenestijn, J. W. and Hesselink, P. G. M. (1993). "Biotechniques for air pollutioncontrol." Biodegradation 4: 283-301.
van Paasen, S. V. B.; Smulders, H. W. M.; Staring, A. J. P. M.; Ptasinski, K. J.; van
Gompel, F. M. and Heesch, E. J. M. (1997). "Decomposition of VOCs in a
continous high-voltage pulsed corona process". In 10th International Symposium on
High Voltage Engineering, Vol. 6, pp.365-368, Montreal, Québec.
VDI (1995). Abgasreinigung durch oxidierende Gaswäsche. VDI Berichte Nr. 2443,
Kommission Reinhaltung der Luft im VDI und DIN, VDI-Verlag GmbH, Düsseldorf.

160
VDI (1996). Biologische Abgasreinigung, BioWäscher und Rieselbettverfahren. VDI
Berichte Nr. 3478, Kommission Reinhaltung der Luft im VDI und DIN, VDI-VerlagGmbH, Düsseldorf.
Villaverde, S. and Fernandez, M. T. (1997). "Non-toluene-associated respiration in a
Pseudomonas putida 54G biofilm grown on toluene in a flat plate vapor phasebioreactor." Appl. Microbiol. Biotechnol 48: 357-362.
Vitale, S. A.; Bromberg, L.; Hadidi, K.; Falkos, P. and Cohn, D. R. (1996). "DecomposingVOCs with an electron-beam plasma reactor." Chemtech 26(April): 58-63.
von Sonntag, C; Dowideit, P.; Fang, X.; Mertens, R.; Pan, X.; Schuchmann, M. N. and
Schuchmann, H.-P. (1997). "The fate of peroxyl radicals in aqeous solution." Water
Sei. & Technol. 35(4): 9-15.
von Sonntag, C; Mark, G.; Mertens, R.; Schuchmann, M. N. and Schuchmann, H. P.
(1993). "Chemical principles behind the use of UV-radiation and/or oxidants (ozoneand hydrogen peroxide) in water pollution control". In CUTEC-Schriftenreihe,
Naßoxidative Abwasserbehandlung; Forschung-Entwicklung, Stand der Technik.
Edited by Vogelpohl, A. Clausthaler Umwelt-Akademie, Clausthal.
von Sonntag, C. and Schuchmann, H.-P. (1991). "The elucidation of peroxyl radical
reactions in aqeous solution with help of radiation-chemical methods." Angew.Chemie. Int. Ed. Engl. 30: 1229-1253.
Wang, Y.-T.; Pai, P.-C. and Latchaw, J. L. (1989). "Effects of preozonation on anaerobic
biodegradability of o-cresol." J. Environ. Eng. Div. 115(2): 336-347.
Wanner, O. (1995). "New experimental findings and biofilm modelling concepts." Water
Sei. & Technol. 32(8): 133-140.
Watanabe, N.; Yanashita, H.; Miayadera, H. and Tominaga, S. (1996). "Removal of
unpleasant odor gases using an Ag-Mn catalyst." Applied Catalysis B: Environmental
8: 405-415.
Weber, F. J. and Hartmanns, S. (1992). "Biological waste gas treatment with integrated
adsorption for the treatment of fluctating concentrations". In Biotechniques for Air
Pollution Abatement and Odour Control Policies, Vol. 51, Studies in Environmental
Science (Proceedings of an International Symposium, Maastricht, October 1991).
Edited by Dragt, A. J. and van Ham, J. Elsevier, Amsterdam.
Wedeco (1998). Personal communication. Wedeco GmbH, Herford, Germany.
Wittorf, F. (1997). "Kopplungseffekt: Bioplasma-Technologie-Chancen und Einsatz¬
möglichkeiten." Chemie Umwelt Technik 13: 20-24.
Yamamoto, T.; Chang, J.-S.; Berezin, A. A.; Kohno, H.; Honda, S. and Shibuya, A.
(1996). "Decomposition of toluene, o-xylene, trichloroefhylene and their mixture
using a BaTi03 packed-bed Plasma Reactor." J. Adv. Oxid. Technol. 1(1): 67-78.
Yamamoto, T.; Lawless, P. A.; Owen, M. K. and Ensor, D. S. (1993). "Decomposition of
volatile organic compounds by a packed-bed reactor and a pulsed-corona plasma

161
reactor". In Non-Thermal Plasma Techniques for Pollution Control, NATO ASI
Series G: Ecological Seiendes, Vol. 34B, pp.223-237. Edited by Penetrante, B. M.
and Schultheis, S. E. Springer-Verlag, Berlin.
Yamamoto, Y.; Niki, E.; Shiokawa, H. and Yoshio, Y. (1979). "Ozonation of Organic
Compounds. 2. Ozonation of phenol in water." J. Org. Chem. 44(13): 2137-2142.
Yu, J.; Flagan, R. C. and Seinfeld, J. H. (1998). "Identification of products containing -
COOH, -OH and -C=0 in atmospheric oxidation of hydrocarbons." Environ. Sei.
Technol. 32(6): 2357-2370.
Yu, J.; Jeffries, H. E. and Sexton, K. G. (1997). "Atmospheric photooxidation of
alkylbenzenes-I. Carbonyl product analyses." Atmos. Environ. 31(15): 2261-2280.
Zuber, L. (1995). Trickling filter and three-phase airlift bioreactor for the removal of
dichloromethane from air. Dissertation No. 11202, ETH Zürich.
Zuber, L.; Dunn, I. J. and Deshusses, M. A. (1997). "Comparative scale-up and cost
estimation of a biological trickling filter and a three-phase airlift bioreactor for the
removal of methylene chloride from polluted air." J. Air & Waste Manage. Assoc. 47:
969-975.

162
Appendix
The steady state one-phase model written for Simusolv in ACSL
programm-counter current bio trickling filter
initial
variable h
constant OUTPUT=50
constant Vm=112
constant Ks=0.26
constant Kco2=43
constant Y=1.27
constant Fg=0.75
constant Ac=0.00728
constant hmax=1.28
constant C0=0.39
constant C20=0.59
CINT=hmax/OUTPUT
END S'Initia!'
S'column height, m'
$'communication points'
$'max rate const g/m3/h'
$'half saturation constant g/m3'
$'endogenic C02 production, g/m3/h'
S'yield coeff gC02/gTol'
$'gasflow, m3h-l'
$'crossection area, m2'
S'column height,m (height of gas inlet+packing height)'
S'inlet toluene cone, g/m3'
$'inlet C02 cone, g/m3'
S'height increment, m'
DYNAMIC
DERTVATTVE
R=Vm*C/(C+Ks)
R2=R*Y+Kco2
dCdh=-R*Ac*/Fg
dC2dh=R2*Ac*/Fg
C=INTEG(dCdh,C0)
C2=INTEG(dC2dh,C20)
END $'Derivative'
S'Monod kinetic'
$'outlet toluene cone, g/m3'
S'outlet C02 cone, g/m3'
TERMT (h.ge.hmax)
END $'Dynamic'
END $'Program'

163
Dynamic three phase model written for Simusolv in ACSL
programm-counter current bio trickling filter
initial
variable t,t0=0.005 $'h'
constant Tmax=0.6
constant Tstop=0.4
constant Tlog=0.3
constant OUTPUT=120
constant NAST=10.0
constant NFL=4.0
constant NAL=3.0
constant Ac=0.00728
constant height=1.28
constant Vm=436
constant Ks=0.059
constant Ki=50
constant Y=1.27
constant Kco2=190
constant eta=0.8
constant a=350
constant Hy2=0.94
constant Hy=0.27
constant zLIQ=3E-6
constant zABS=100E-6
constant zBIO=70E-6
constant Dw=3.42E-6
constant Dw2=6.26E-6
constant Db=4.8E-7
constant Db2=8.8E-7
constant MS=0.006
constant Cin2=0.592
$'max time'
$'stops toluene feed'
$'time to start saving data'
$'communication points'
S'number of axial segments'
$'number of film layers'
S'number of absorption layers'
S'cross section area, m2'
$'column height, m (height of gas inlet+packing height)'
$'max degradation rate, g/m3/h'
$'half saturation constant, g/m3'
$'inhibition constant, g/m3'
$'yieldcoeffgC02/gTol'
S'endogenic C02 production, g/m2/h'
$'bed porosity, -'
$'film area, m2/m3'
$'Henrys Law constant, C02, -'
$'Henrys Law constant, toluene, -'
S'interphase liquid film thickness, m'
$'absorption layer thickness, m'
S'active biofilm thickness'
S'Diffusion coeff in water, toluene, m2/h'
$'Diffusion coeff in water, C02, m2/h'
S'Diffusion coeff in biofilm, toluene, m2/h'
$'Diffusion coeff in biofilm, C02, m2/h'
$'time delay mass spectrometer, h'
$'C02 inlet gas cone, g/m3'
Fg=0.75
Cin=Cini(l)
$'initial gas flow, m3/h'
$'initial toluene inlet cone, g/m3, in cmd-file'
array dC(10), C(10), C0(10)
array dC2(10), C2(10), C20(10)
array dS(70), S(70), S0(70)
array dS2(70), S2(70), S20(70)
$'toluene gas phase cone'
$'C02 gas phase cone'
$'toluene liq phase cone'
$'C02 liq phase cone'

164
array r(40),r2(40)
array Cini(18)
Vr=height*Ac
h=height/NAST
time=0
z=zLIQ
zB=zBIO/(NFL-l)
zA=zABS/NAL
$'toluene degradation and C02 production rate'
$'inlet toluene cone, g/m3, in cmd-file'
$'reactor volume, m3'
$'height of one column segment'
$'time used for plotting'$'thickness of liquid film layer'
$'thickness of one active biofilm layer'
$'thickness of one nonactive biofilm layer'
NAST1=NAST+1 $'11'
NAST2=NAST*(NFL-2) $'20'
NAST3=NAST2+1 $'21'
NAST4=NAST*(NFL-1) $'30'
NAST5=NAST4+1 $'31'
NAST6=NAST*(NFL) $'40'
NAST7=NAST6+1 $'41'
NAST8=NAST*(NFL+NAL-2) $'50'
NAST9=NAST8+1 $'51'
NAST10=NAST*(NFL+NAL-1) $'60'
NAST11=NAST10+1 $'61'
NAST12=NAST*(NFL+NAL) $'70'
DO INI1 aa=l,NAST
C0(aa)=Cin
C20(aa)=Cin2
INI 1..continue
C20out=Cin2
DOINI2aaa=l,NAST12
S0(aaa)=Cin/Hy
S20(aaa)=Cin2/Hy2
INI2..continue
$'set initial gas phase concentrations'
$'set initial film concentrations'
CINT=Tmax/OUTPUT $'integration step length'END $Tnitial'
START..continue
DYNAMIC
DERIVATIVE

165
'GAS PHASE'
procedural
dC(l)=l/etaG*(Fg/Ac;1:(Cin-C(l))/h-Dw*a*2/z*(C(l)/Hy-S(l)))
dC2(l)=l/etaG*(Fg/Ac*(Cin2-C2(l))/h-Dw2*a*2/z*(C2(l)/Hy2-S2(l)))DO DERI bb=2, NAST
dC(bb)=l/etaG*(Fg/Ac*(C(bb-l)-C(bb))/h-Dw*a*2/z:i:(C(bb)/Hy-S(bb)))
dC2(bb)=l/etaG*(Fg/Ac*(C2(bb-l)-C2(bb))/h-Dw2*a:|:2/z*(C2(bb)/Hy2-S2(bb)))DERI..CONTINUE
dC2out=(C2( 10)-C2out)/MS
END $'Procedural'
'LIQUID PHASE'
procedural
doDER2cc=l,NAST
dS(cc)=Dw/z*((C(cc)/Hy-S(cc))/(z/2)-(S(cc)-S(cc+NAST))/(z/2+zB/2))
dS2(cc)=Dw2/z*((C2(cc)/Hy2-S2(cc))/(z/2)-(S2(cc)-S2(cc+NAST))/(z/2+zB/2))DER2..continue
END $'procedural'
'ACTIVE BIOFILM FIRST LAYER'
procedural
do DER3 dd=NASTl,NAST2
r(dd)=Vm*S(dd)/(S(dd)*S(dd)/Ki+S(dd)+Ks)
r2(dd)=r(dd)*Y+kco2
dS(dd)=Db/zB*((S(dd-NAST)-S(dd))/(zB/2+z/2)-(S(dd)-S(dd+NAST))/zB)-r(dd)
dS2(dd)=Db2/zB*((S2(dd-NAST)-S2(dd))/(zB/2+z/2)-...
(S2(dd)-S2(dd+NAST))/zB)+r2(dd)
DER3..continue
END $'procedural'
'ACTIVE BIOFILM CENTRE LAYER
procedural
do DER4 ee=NAST3,NAST4
r(ee)=Vm*S(ee)/(S(ee)*S(ee)/Ki+S(ee)+Ks)
r2(ee)=r(ee)*Y+kco2
dS(ee)=Db/zB/zB*(S(ee-NAST)-2*S(ee)+S(ee+NAST))-r(ee)
dS2(ee)=Db2/zB/zB*(S2(ee-NAST)-2*S2(ee)+S2(ee+NAST))+r2(ee)
DER4..continue
END $'procedural'

166
'ACTIVE BIOFILM LAST LAYER'
procedural
do DER5 ff=NAST5,NAST6
r(ff)=Vm*S(ff)/(S(ff)*S(ff)/Ki+S(ff)+Ks)
r2(ff)=r(ff)*Y+kco2
dS(ff)=Db/zB*((S(ff-NAST)-S(ff))/zB-(S(ff)-S(ff+NAST))/(zB/2+zA/2))-r(ff)
dS2(ff)=Db2/zB*((S2(ff-NAST)-S2(ff))/zB-(S2(ff)-S2(ff+NAST))/(zB/2+zA/2))+r2(ff)DER5..continue
END $'procedural'
'NON-ACTIVE BIOFILM FIRST LAYER'
proceduraldo DER6 gg=NAST7,NAST8
dS(gg)=Db/zA*((S(gg-NAST)-S(gg))/(zB/2+zA/2)-(S(gg)-S(gg+NAST))/zA)
dS2(gg)=Db2/zA*((S2(gg-NAST)-S2(gg))/(zB/2+zA/2)-(S2(gg)-S2(gg+NAST))/zA)DER6..continue
END $'procedural'
'NON-ACTIVE BIOFILM CENTRE LAYER'
proceduraldo DER7 hh=NAST9,NAST10
dS(hh)=Db/zA/zA*(S(hh-NAST)-2*S(hh)+S(hh+NAST))
dS2(hh)=Db2/zA/zA*(S2(hh-NAST)-2*S2(hh)+S2(hh+NAST))
DER7..continue
END $'procedural'
'NON-ACTIVE BIOFILM PHASE LAST LAYER'
procedural
do DER8 ii=NASTl 1.NAST12
dS(ii)=Db/zA/zA*(S(ii-NAST)~S(ii))
dS2(ii)=Db2/zA/zA*(S2(ii-NAST)-S2(ii))
DER8..continue
END $'procedural'
C=INTVC(dC,CO)
C2=INTVC(dC2,C20)
C2out=INTEG(dC2out,C20out)
S=INTVC(dS,SO)
S2=INTVC(dS2,S20)
END $'Derivative'

167
if(T.le.Tlog)gotoL100
write(41,20)time,c2(10),cin $'stores data in data file'
20..FORMAT(3g9.4)
'stops feed at time tstop'
if(t.le.Tstop)goto LI00
Cin=0
goto L200
LI 00..continue
Cin=Cini(count)
L200..continue
time=time+Tmax/output $'total time,minutes'
TERMT (T.ge.Tmax)END $'Dynamic'
TERMINAL
count=count+l
if (count.eq.7)Fg=1.5if (count.eq.13) goto ENDPRG
Cin=Cini(count)
DOTER5jj=l,NAST
C0(jj)=Cin
TER5..continue
DOTER6jj=l,NAST4
S0GJ)=Cin/Hy
S20(jj)=Cin2/Hy2
TER6..continue
goto START
ENDPRG..continue
END $'Terminal'
END $'Program'
cmd-file
prepare t,time,c,c2,sa,s,ctol,cco2,cin,ceff,reff,c2out
proc pi
start
plot c2out,'type'=71 l,'xaxis'=time,'char'=46

168
end
proc peak242503
s Cini(l)=0.39, Cini(2)=0.78
s Cini(3)=1.6,Cini(4)=3.23,Cini(5)=6.42,Cini(6)=12.96s Cini(7)=0.19,Cini(8)=0.4
sCini(9)=0.80,Cini(10)=1.56,Cini(ll)=3.09,Cini(12)=6.27data
t time c2out c(10)
0.005 0.005 1.49 0.033
0.07 0.07 1.49 0.033
0.1 0.1 1.49 0.033
0.17 3.47 1.26 0.24
0.175 3.475 1.24 0.20
0.18 3.48 1.23 0.18
end
end

169
Curriculum Vitae
Anders Sjöberg
1968 Born on 20 of August in Â1, Kopparberg, Sweden
Citizen of Sweden
1975-1984 Primary and secondary school, Uddeholm and Hagfors,
Sweden
1984-1987 Gymnasium technical-natural sciences, Hagfors, Sweden
1987-1988 Military service, Sweden
1989-1992 Studies in chemical engineering at the Lund Institute of
Technology (LTH), Lund, Sweden
1992-1994 Studies in biotechnology at the Swiss Federal Institute of
Technology (ETH), Zürich. Diploma work: "Anaerober
Abbau von Trichlorethylen zu cw-Dichlorethylen in einer
kontinuerlichen Kultur mit on-line Massenspektrometer-
analytik"
1994 Degree of Master of Science in Chemical Engineering,
Lund, Sweden
1995-1999 Doctoral studies at the Chemical Engineering Department,
Swiss Federal Institute of Technology (ETH), Zürich. Titel:
"Toluene Removal from Waste Air by Combined Biological
and Non-Thermal Plasma Techniques"
1999 Doctor of Technical Sciences, Zürich
Related Documents


![A BIOLOGICAL TRICKLING FILTER SYST])! · A BIOLOGICAL TRICKLING FILTER SYSTEM FOR WATER REUSE IN· TROUT REARING By Dennis Anderson Research Biologist ABSTRACT A biological trickling](https://static.cupdf.com/doc/110x72/5b8887a27f8b9abe1e8b85e2/a-biological-trickling-filter-syst-a-biological-trickling-filter-system-for.jpg)