THERMAL OXIDATIOV STABILITY OF DIESEL FUELS ""0 INTERIM REPORT DTIC 00 BFLRF No. 205 CTE Iiuo• By L.L. Stavinoha J.G. Barbee D.M. Yost SBelvoir Fuels and Lubricants Research Facility (SwRI) Southwest Research Institute San Antonio, Texas Prepared for U.S. Army Belvoir Research, Development SMtraand Engineering Center Materials, Fuels and Lubricants Laboratory Fort Belvoir, Virginia and David W. Taylor Naval Ship Research and Development Center Annapolis Laboratory Annapolis, MD •.. Under C.., Contract No. DAAK70-85-C-0907 L.J -4_ Approved for public release; distribution unlimited ,-ZA February 1986 "-11 aC.. V II j ;,d i C -. * * -. -- •> . .. ',- '. ' -,." : , " .-. .- : " ••"•"-"-' _, . - •.• •.'' , : "" . ,". . " ,. """"• . -""]'- " -"" .

Welcome message from author
This document is posted to help you gain knowledge. Please leave a comment to let me know what you think about it! Share it to your friends and learn new things together.
Transcript

THERMAL OXIDATIOV STABILITYOF DIESEL FUELS
""0 INTERIM REPORT DTIC00 BFLRF No. 205 CTE
Iiuo• By
L.L. StavinohaJ.G. BarbeeD.M. Yost
SBelvoir Fuels and Lubricants Research Facility (SwRI)Southwest Research Institute
San Antonio, Texas
Prepared for
U.S. Army Belvoir Research, DevelopmentSMtraand Engineering Center
Materials, Fuels and Lubricants LaboratoryFort Belvoir, Virginia
and
David W. Taylor Naval Ship Research and Development CenterAnnapolis Laboratory
Annapolis, MD•.. Under
C.., Contract No. DAAK70-85-C-0907
L.J-4_ Approved for public release; distribution unlimited
,-ZA February 1986
"-11 aC..
V II j
;,d i
C -. * * -.-- •> . .. ',- '. ' -,." : , " .-. .- : " ••"•"-"-' _, . - •.• •.'' , : "" . ,". . " ,. """"• . -""]'- " -"" .
Disclaimers
The findings in this report are not to be construed a& an official Depait-ment of the Navy or Army position unless so designated by other au-thorized documents.
% Trade names cited in this report do not corkstitute an official endorsementor approval of the use of such commercial hardware or software.
DTIC Availability Notice
Qualified requestors may obtain copies of this report from the DefenseTechnical Information Center, Cameron Station. Alexandria, Virginia22314.
N -
"Disposi:.on Instructions
Destroy this report when no longer needed. Do not return it to theorigin-itor.
C42
LJ
-lC m
Unclassified ____
SECURITY CLASSIFICATION OF THIS PAGE
REPORT DOCUMENTATION PAGEI&. REPORT SECURITY CLASSIFICATION b. RESTRICTIV SA
Unclassified None ,-_20. SECURITY CLASSIFICATION AUTHORITY 3. DISTPIOUTION/AVAILABILITY OF REPORT
N/A Approved for Public Release;2b. OECLASSiFICATION/DOWNGRADING SCHEDULE Distribu tion Unl im it ed
4. PERFORMING ONGANI7ATION REPORT NUMBER(S) 5. MONITOPING ORGANIZATION REPORT NUMBER(S)
Interim BFLRF No. 2056d. NAME OF PERFORMING ORGANIZATION 16b. OFFICE SYMBOL 7a. NAME OF MONITORING ORGANIZATION
Beivoir Fuels and Lubricants Wa'loabW Belvoir Research, Development and1 Research Facility Engineering Center
6c. ADDRESS (City, State, and ZIP Code) 7b. ADDRESS (City, State, and ZIP Code)
Southwest Research Institute Attn: STRBE-VF6220 Culebra Road Fort Belvoir, VA 22060-5606San Antonio, TX 78284 ,.
Be. NAME OF FUNDING/SPONSORING 8b. OFFICE SYMBOL 9. PROCUREMENT INSTRUMENT IDENTIFICATION NUMBERORGANIZATION (if applicable) DAAK7O_82_COO01;W 25
David Taylor ITaval Ship MFG, Code 2709 DAAK70-85-C-0007; WD 18
8c. ADDRESS (City, State, and ZIP Code) 10. SOURCE Oz 'UNDING NUMBER$
Annapolis Laboratory PROGRAM PROJECT TASK WORK UNIT
Annapolis, MD ELEMENT NO. NO. NO. ACCESSION NO.
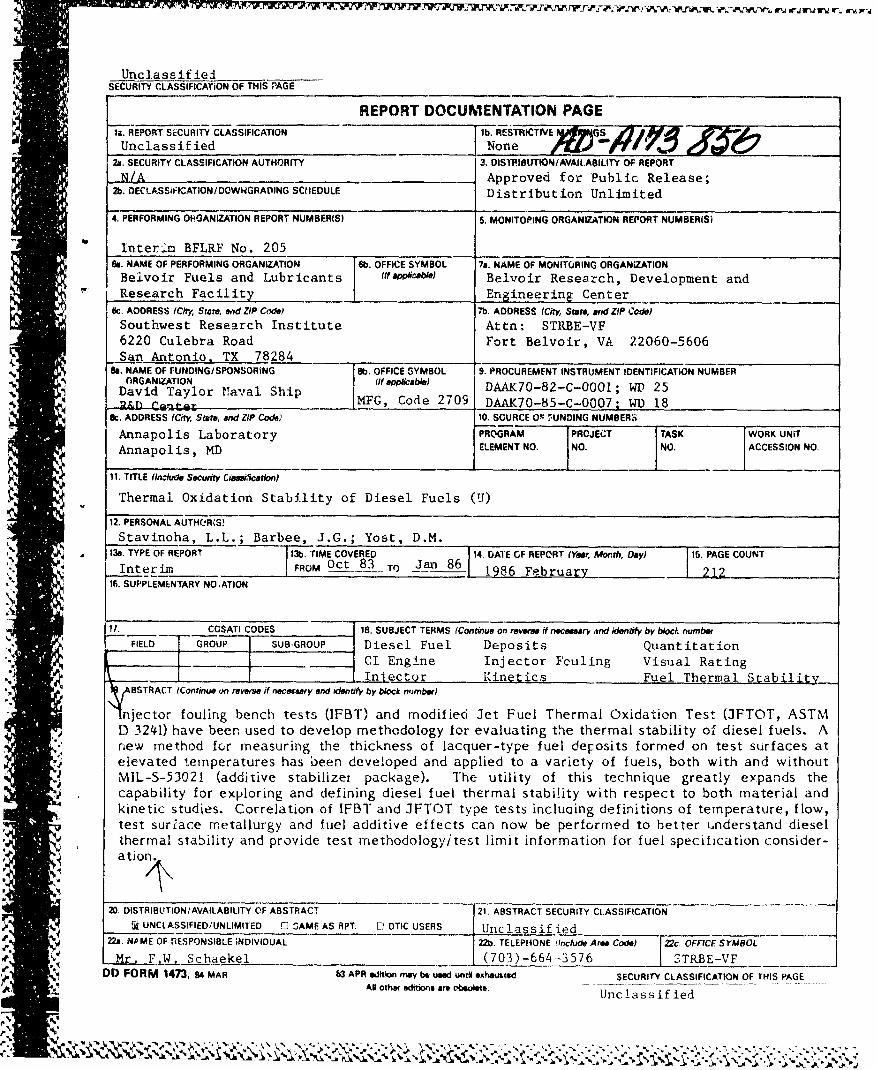
11. TITLE (Ilude Secu yt, ClwuisradtioA)
Thermal Oxidation Stability of Diesel Fuels (U)
12. PERSONAL AUTHOR(S?
Stavinoha, L.L.; Barbee, J.G.; Yost, D.M.13s. TYPE OF REPORT i13b. TIME COVERED 14. DATE OF REPCRT (Yeer, Month, Day) 15. PAGE COUNT
Interim FROM Oct 83 TO Jan 86 1 Fbra16. SUPPLEMENTARY NOATION
11. COSATI CODES 18. SUBJECT TERMS (Continue on revwere if neceseary and kiondy by block number
FIELD GROUP SUB-GROUP Diesel Fuel Deposits Quantitation___CI Engine Injector Fouling Visual Rating
Iniector Kinetics Fuel Thermal StabilityABSTRACT (Continue on reverse if necmery and identify by block number)
Injector fouling bench tests (IFBT) and modified Jet Fuel Thermal Oxidation Test (JFTOT, ASTMD 3241) have been used to develop methodology for evaluating the thermal stability of diesel fuels. Anew method for measuring the thickness of lacquer-type fuel deposits formed on test surfaces atelevated temperatures has been developed and applied to a variety of fuels, both with and withoutMIL-S-53021 (additive stabilizer package). The utility of this technique greatly expands thecapability for exploring and defining diesel fuel thermal stability with respect to both material andkinetic studies. Correlation of IFBT and JFTOT type tests incluaing definitions of temperature, flow,test suriace metallurgy and fuel additive effects can now be performed to better understand dieselthermal stability and provide test methodology/test limit information for fuel specification consider-ation.
D. OISTRIBUTION/AVAILABILITY OF ABSTRACT 21. ABSTRACT SECURITY CLASSIFICATION5_ UNCL ASSIFIED/UNLIMITED 0 SAME AS RPT. E] DTIC USERS Unclassified
S2l. N.OME OF nE~SPONSIBLE iNDIVIDUAL 22b. TELEPHONE (include Area Code) 22c. OFFICESYMBOL
e L_ . .W Schaekel _(703)-664 -3576 STRBE-VF'O FORM 1473, 4 MAR W3 APR edition may b6 used untV xheutted. SECURITY CLASSIFICATION OF THIS PAGE
• All ott'sd* ansar,.obo. Unclassified
,:'I' I%
FOREWORD
This work was performed at the Belvoir Fuels and Lubricants Research Facility
(SwRI) (formerly 11.S. Army Fuels and Lubricants Research Laboratory), Southwest
Research Institute, under DOD Contract Nos. DAAK70-82-C-0001 and DAAK70-
85-C-0007. The project was administered by the Fuels and Lubricants Division,
Materials, Fuels, and Lubricants Laboratory, U.S. Army Belvoir Research,
Development and Fngineering Center, Fort Belvoir, Virginia 22060-5606, with Mr.
F.W. Schaekel, STRBE-VF, serving as Contracting Officer's Representative. As a
cooperative effort, funding for this program was also provided by the U.S. Navy
David Taylor Naval Ship R&D Center with Mr, R. Str'jcko, Mobility Fuels Group,
Code 2759, serving as Technical Monitor. This report covers the period of
performance from 31 October 1983 to 31 January 1986.
S•._
DTICS F EC TE Accox Slj
S~~~~NOV 6 1986 •,.,:
jJuý; t.
__m-- , •B By
A 1 1
The title on the DD Form 1473 is correct,. 'st S)D.Per Mr. R. Strucko, DTNSRDC/Code 275.9
%k i
%I
ACKNOWLEDGEMENTS
Mr. Ed Frame (Belvoir F&L Research Facility) is acknowledged for his early
important contribution to the initiation of this project. While screening high-
temperature adiabatic lubricant candidates in late i981 using a modified CLR-
diesel (CLR-D) engine, Mr. Frame noted that occasional injector fouling occurred
and suggested that the CLR-D hot test engine might be useful as a possible
screening test for evaluating diesel fuel thermal stability. Mr. Frame's suggestion
led to the successful funding of this project in 1982.
The senior technical assistance of Ms. Lona Bundy in making laboratory measure-
ments and summarizing data has been invaluable to the authors of this report. Her
program scheduling ability will be important to continued activity ir, defining diesel
fuel thermal stability.
Ms. Janet Buckingham's (Southwest Research Institute) skillful use of statistical
analytical computer software provided many of the more important calculations
and graphs used in this report.
Dr. George H. Lee, i1 is acknowledged for his deligence in evaluating and modifying
the Hot Liquid Process Simulator with the help of Mr. George Wilson (Alcor, Inc.)
to perform JFTOT (ASTM D 3241) type tests.
Based on Mr. Jim Barbee's prototype deposit thickness measuring technique
utilizing dielectric strength breakdown voltage, the successful design and fabrica-
tion of the Thermal Stability Deposit Measuring Device by Messrs. Doug Michalsky
and James Luchemeyer is hereby gratefully acknowledged.
In addition, the Belvoir F&L Research Facility editorial staff is gratefully
acknowledged for their patience and fortitude in assembling and preparing the text
and data contained in this report. Thank you for yo-r conscientious support.
2
TABLE OF CONTENTS
Section Page
I. INTRODUCTION AND BACKGROUND ...................... 7
II. OVERVIEW OF REPORT SECTIONS AND TEST FUELS ......... 12
IIl. INJECTOR BENCH TEST DEVELOPMENT .................... 13
IV. D 3241 JFTOT APPLICATION TO DIESEL FUEL .............. 48
A. Measuring Thickness and Volume of Varnish-Like FuelDeposits Via Dielectric Strength ..................... 48
B. Measurement of Deposit Thickness by MetallurgicalCross-Sectioning of Entrapped Deposit ............... 52
C. Test Matrix ......................................... 54D. Kinetic Studies Utilizing Dielectric Method (Pre-
liminary Application) ............................... 73
V. APPLICATION OF HOT LIQUID PROCESS SIMULATORINSTRUMENTATION TO DIESEL FUEL THERMALSTABILITY ............................................ 79
VI. SUMMARY AND CONCLUSIONS ............................ 85
VII. RECOMMENDATIONS ........................................ 86
*Vill. REFERENCES .............................................. 87
APPENDICES
A. CLR-D HOT TEST ........................................ 89B. INJECTOR FOULING BENCH TEST METHODOLOGY FOR
DIESEL FUEL THERMAL STABILITY ..................... 95C. PRIMARY MATRIX TUBE DEPOSIT DATA ................... 107D. TUBE MEASUREMENT PLOTS AND VOLUME OF DEPOSIT
CALCULATIONS ....................................... 157"E. STAINLESS STEEL VERSUS ALUMINUM JFTOT DATA ........ 183
• F. JFTOT DATA COMPARING ADDITIVE EFFECTS ANDFLOW RATES .......................................... 195
3
LIST OF ILLUSTRATIONS
I CLR Injector Nozzle With Thermocouple ....................... 142 Details of CLR Injector Including Thermocouples ............... 143 CLR Injector Needle (Arrows Indicate Scored Surface) .......... 16"4 Injector Needle Showing Position of Templug .................. 165 Injector Fouling Bench Test Rig .............................. 166 Areas of Injector Needle Rated for Deposits ................... 177 Injector Needle Tip Deposit History .......................... 188 Injector Needle Shaft Deposit History ......................... 189 New Injector Nozzle ........................................ 24
10 Fouled Nozzle From Injector Fouling Bench TestApparatus .............................................. 24
11 Fouled Injector Nozzle From CLR-D Engine ................... 2412 Plugged Hole Showing Heavy Carbon Buildup ................... 2713 Second Plugged Hole Showing Heavy Carbon Buildup ............ 2714 Needle Tip Showing Carbon Buildup ........................... 27
S15 Relative Sizes and Areas of the Three InjectionSystems Examined ....................................... 31
16 Pintle Showing Pintle Stations .............................. 3617 TDR Rating of Pintle A ..................................... 3718 Dielectric Strength of Pintle A .............................. 3719 TDR Rating of Pintle B ..................................... 3820 Dielectric Strength of Pintle B ............................... 38"21 TDR Rating of Pintle C ..................................... 3922 Dielectric Strength of Pintle C ............................... 3923 CRC Vilual Rating Versus Test Time at 332 0 C
(630 F) ............................................... 4124 Visual Rating of CRC Injector Needle Valve Using
JFTOT Rating Scale ..................................... 4225 JFTOT Breakpoint Temperature (OF) Versus Time .............. 4526 JFTOT P (mm of Hg) at Breakpoint Temperature ............... 4627 Dielectric Strength Breakdown Voltage, Volts .................. 5828 Linear Regression Fit for Dielectric Thickness (Microm-
eter) Versus Optical Thickness Measurements for allFuel Data .............................................. 62
Z 9 Plot Illustrating Reaction Rates ................................ 6330 Highest Dielectric Breakdown Voltage (Average 3 Tubes)
Versus Test Temperature ................................. 6431 D 3241 Test Tube for 1% Sulfur; 2180C (425 0 F)
(Tube No. 524 T) ......................................... 6732 Dielectric Strength by Angle by Tube Length Compared to
Deposit Area Plot ....................................... 68-0 Test Tube Deposit Volumes for Four Fuels at Various D 32,' I
Test Temperatures ....................................... 6834 Visual Rating Versus Test Temperature ....................... 6935 Highest Spun Rating (Average 3 Tubes) Versus Test
Temperature ............................................. 7036 Dielectric Breakdown Voltage Versus Auger Ion Milling Time - 7137 Total of TDR Ratings Versus Volume by Dielectric Method ...... 78
J 'A
LIST OF ILLUSTRATIONS (CONT'D)
Figure Page
38 Illustration of Hot Liquid Process Simulator ................... 8039 JFTOT Data ............................................... 8140 Comparison of HLPS and Standard Values ..................... 8241 JFTOT Analysis Using 5-Micrometer Test Filters in
Cat I-H Fuel at Various Temperatukes ...................... 84
LIST OF TABLES
Table PEae
I High-Temperature CLR-Diesel Bosch Injector Fouling ........... .112 CLR-D Engine Operating Parameters ......................... 133 injector Fouling Bench Test Operating Conditions .............. 174 Results of Analysis of Fuel in the Injector Fouling
SBench Test ............................................. 19
5 Injector Needle Deposition Engine/Bench Test Compari-6 son (Cat I-H Fuel) ........................................ 20
S6 Results of the Analysis of Fuels in the InjectorFouling Bench Test ...................................... 21
7 Injector Needle Deposition Engine/Bench Test Compari-son (Cat I-H Fuel Aged for I Week at 80 C).................. 22
8 Injector Needle Deposition Engine/Bench Test Compari-son (Cat I-H Fuel Aged for 2 Weeks at 80 C) ................ 23
9 Injector Needle Deposition-Bench Test (Cat I-H Fuel) ........... 2510 Summary Data Using JP-7 (AL-12!24-F) in Bench Test and
Engine Tests ............................................ ?6I I Thermal Oxidation Stability Test (OFTOT) for Fuel
AL-12124-F ............................................. 2812 Fuel Analysis ............................................... 2913 IFBT Tip and Shaft Demerits for Two Runs of MIL-F-46162B
Referee Grade Diesel Fuel ................................ 3014 Injector Deposit Rating Results .............................. 31"15 Accelerated Stability Test Results ........................... 3316 Deposit Rating Test Results for Shale-Derived Diesel Fuel
"(FL-0410-F) ............................................. 34_I17 Properties of Shale Oil Diesel (FL-410-F) ...................... 34
18 Thermal Oxidation Tests to Determine Breakpoint .............. 3519 CRC Visual Ratings of Injector Pintle in CLR-D Hot Engine
Test .................................................... 40o20 MARK 9 TR on Bosch Piite................................ 43
21 MARK 9 TDR on Detroit Pintle ............................... 44
22 Thermal Oxidation Stability Test Data for Navy Base restFuel (AL-13279-F) ....................................... 44
23 Thermal Oxidation Stability Test Data for Navy Base TestFuel (AL-13279-F) ....................................... .46
5
LIST OF TABLES (CONT'D)
Tabie Page
24 Dielectric Breakdown Voltage and Optical ThicknessMeasurements ........................................... 57
25 Linear Regression Results ................................... 5926 Linear Regression Results Using Dielectric (Micrometer*)
Versus Optical Thickness Measurements for all Data .......... 6027 Linear Regression Results Using Dielectric (Volts) Versus
Optical Thickness Measurements ........................... 6028 Linear Regression Results for Dielectric (Micrometers*)
Versus Optical Thickness Measurements for all Data .......... 6129 Volume of Deposit Based on Dielectric Strength Breakdown
Voltage ................................................ 6630 Comparison of Volume of Deposit, Based on Dielectric Strength
Breakdown Voltage, on Stainless Steel Heater Tube andAluminum Heater Tube ................................... 75
31 Comparison of Stainless Steel and Aluminum JFTOT Tubes ...... 7632 Effects of Additive and Flow Rate ........................... 77
A6
/~
1. INTRODUCTION AND BACKGROUND
Compression ignition engine fuel injectors demand a certain degree of fuel thermal
oxidative stability to maintain proper operation and expected spray quality. This
stability requirement becomes more demanding as the injector is operated at
higher temperatures. Compared to conventional compression ignition (CI) engine
operation with the fuel being delivered at approximately 1490C (300 0 F), adiabatic
engine operation can deliver the fuel at 260 C (500 0 F). Hypergolic CI engine
combustion systems now in theoretical design stages will deliver fuel at 427 to
538 C (800° to 1000°F). The ability of a fuel to resist formation of deposits on
internal injector system surfaces is a form of thermal oxidative stability which
may be related indirectly to fuel storage stability.
Historically, injector fouling tests developed to correlate with fuel instability have
not been very successful. At a symposium in 1958 (later reported in STP 244) (1)*,
" 'MacDonald and Jones reported on an injector test stating that:
"Test fuel is passed through motor-operated, GM series 71 unit injectors
at fuel flow rate of 1.6 mL per minute at a spray tip temperature of0. 0
* 204 C (400 F). Test cycle consists of 20 hours on test, rack injectors
hot, return rack to off position, secure 4 hours, and rack cold prior to
starting next 20-hour cycle. Continue cycles until injector sticks.
*E Comments--at 4000F some fuels will cause sticking in less than 20
hours. Lowering spray tip temperature to 93 0 C (200 0 F) rates these
S ,fuels sati.bfactory. No fuel tested to date has caused sticking at this
lower temperature, which is believed to be indicative of actual engine
V operating temperature. One fuel which caused injector sticking at less
thý,n 20 hours at 400 F was run successfully for 1000 hours in an
operating engine (Bosch-type injectors). Reproducibility was poor and
did not correate with indicated stability of barge samples."
Meanwhile, work was orgoing at .he U.S. Army's Coating and Chemical Laboratory
(which was reported in February 1973) lookirg at thermal oxidative stability of
l UnderscoreI numbers in parentheses refer to references at the end of this report.
S....' %r
automotive diEsel fuels.(2) Fuel-oriented problems occurring in th, field prompted
this investigation. Because of the absence of any laboratory bench-scale tech-
niques designed to predict these fuel filter plugging and/or injector fouling
tendencies, initial experimentation was directed towards developing an accelerated
thermal-oxidation technique. To establish valid test conditions, actual diesel fuel
system temperatures were obtained from Engineering and Services (E&S) test
programs and also monitored under road dynamometer testing. A second attempt
involved the use of an ASTM-CRC Fuel Coker which was operated in a recycle
mode to simulate the geometry of automotive diesel fuel systems. Initial
experiments with this technique revealed *ts capability to differentiate diesel fuel
* quality in terms of thermal-oxidative stability. Since it was evident from the first
study that fuel temperature profiles were changing the quality o1 diesel fuel under
relatively short times of operation, a program was initiated with the Materials rest
Directorate (MTD) to develop a laboratory capability for evaluating this fuel
characteristic.(3) To accomplish this task, a laboratory rig was utilized to more
closely simulate those environmental conditions prevailing in diesel fuel injector
systems. A commercial fuel injector pump calibrating stand (Model SP8g00D)
located within the MTD facility was modified to permit the use of GMC 53 unit
injectors. To provide differentiation between satisfactory and unsatisfactory fuels,
the injector test stand was further modified as follows:
I) Heaters with adjustable temperature controls (above 93 C (200'F))
were installed in the fuel sump and return fuel line.
2) Fuel sump capacity was increased to at least 20 gallons and a variable
speed drive installed.
3) A diverter valve was installed on the injector effluent line.
In order to ditferentiate fuel quality, the fuel injector pump calibrating stand was
instrumented to monitor the following fuel temperatures:
I) Fuel in swuIp
2) Fueil to filter
3) F ell to inj c.tor
4) FuLe IfIrom ni njCc tor
5) Fuel to ret urn risuH1[.
Pressure differential across the test fuel filter was measured to define occurrences
of filter plugging. Also, the injector fuel flow rate was measured to determine any
h change in output due to injector fouling. The injector stand was operated at 2200
rpm to simulate full load engine operation, and the fuel temperature to the filter
was maintained at 1070 to 116 0 C (2250 to 240'F). To determine if this technique
could in fact differentiate between fuels possessing different thermal-oxidation
stability, three different fuels were subsequently evaluated.. The first was a diesel
fuel conforming to VV-F-800a grade DF-2, which was obtained from the MTD main
fuel dispensing tank and was used for test equipment setup and preliminary testing.
The other two samples were fuels that had exhibited fuel filter-plugging or some
degree of injector seizure/fouling tendency. More specifically, one sample of DF-2
had been obtained from Camp Pendleton, a U.S. Marine Corps facility, where
N "injector sticking problems had occurred during field maneuvers.(4) The other
sample, also a DF-2, was obtained from a U.S. Air Foice Strategic Air Command
Minuteman installation in which excessive filter plugging had occurred during their
normal emergency power generation operating proceoure.(5) In subsequent
evaluations of the two latter fuels in this modified injector stand, there was no
manifestation of fuel filter plugging nor injector fouling. However, chemical
analyses of the fuel samples before and after the individual tests revealed
significant increases in existent guin proportional to the duration of the test.
In recent reviews of accelerated stability techniques for diesel fuels (6,7), theauthors have implied that steam jet gum may be related to injector deposit/fouling
and combustion chamber deposits; but in a review of diesel fuel deterioration and
related problems in 1977 (8) and later at a 1980 Symposium (9), most Army diesel
"fuel system problems were reported as being found to be plugged primary fuel
filters. This has led to a major activity in preventing diesel fuel stability-related
problems. Recent incidences of fouled injectors have led to recognition of the
need to inspect injector equipmnent being returned to rebuild facilitic s to identify if
injector fouling (and subsequent inefficient fuel combustion) is occurring and to
what degree.
In late 1981 and early 19A2, while screening high-temperatume adiabatic lubricant
- candidates in a mrodified CL R--diesei (CLIR-D) engine, personnel at Belvoir Fuels
1 and Lubricants Researc-h Facility (BFLRF) at Soutil1wesVt ReseArch Institute (SwRI)
P .. -. .- .. ..... .- ..-....- .
occasionally observed fuel injector fouling. The modified CLR-D was operated
uncooled in the cylinder liner area with 1490 C (300°F) coolant temperature in the
head. Fouling cf the ",osch APE 113 futA *iiechto, occuried as plugged injector
holes which resulted in erratic engine operation. A brief inivostigation was
conducted to determine if the injector fouling was related to fuel properties. The
results are shown in Table I (with a picture insert) as injector hole plugging at test
hours, and a deposit demerit rating for the injector pintle shaft and tip. Jet Fuel
Thermal Oxidation Tester (3FTOT) rating and steam jet gum fuel characterization
properties are also shown for some of the test fuels in Table I. Fuel A (0P-7) was
evaluated because of its excellent JFTOT (ASTM D 3241) and gum (ASTM D 381)
properties. When using Fuel A, no injector hole plugging was observed at 28 hours
when the test was terminated. The injector pintle shaft and tip were inspected and
found to be relatively clean. Next -.A u-l (B) suspected to have worse injector
fouling performance, because of its higher gum content and JFTOT rating, was
tested. Injector hole plugging occurred at 18 hours with increased pintle shaft and
tip deposits. Then a new batch of t;e regular test fuel (C) used in the high-
temperature CLR-D engine was evaluated. No hole plugging was observed at 63
hours when the test was terminated. Previously, fuel for the CLR-D test was
supplied from a 55-gallon drum exposed to ambient -ummcr temperatures, 380C
(100°F), and refilled only when empty. Thus, fuel for several tests was aged in the
drum. As shown in Table 1, as Fuel C aged, the hours of operation until injector
fouling was observed decreased. A new batch ot unaged Fuel C was tested, and
injector fouling cd, not occur even after 92 hours. The results of the screeningwere encouraging for developing a methodology of determining injector fouling
tendencies of diesel fuels based on storage stability data. A program was initiated
in September 1q82 to develop a bench test for injector fouling evaluations of dieselfuel.
This report summarizes 3 years of effort in developing methodology to evaluate
thermal oxidative stability of diesel fuels.
10
A -. .
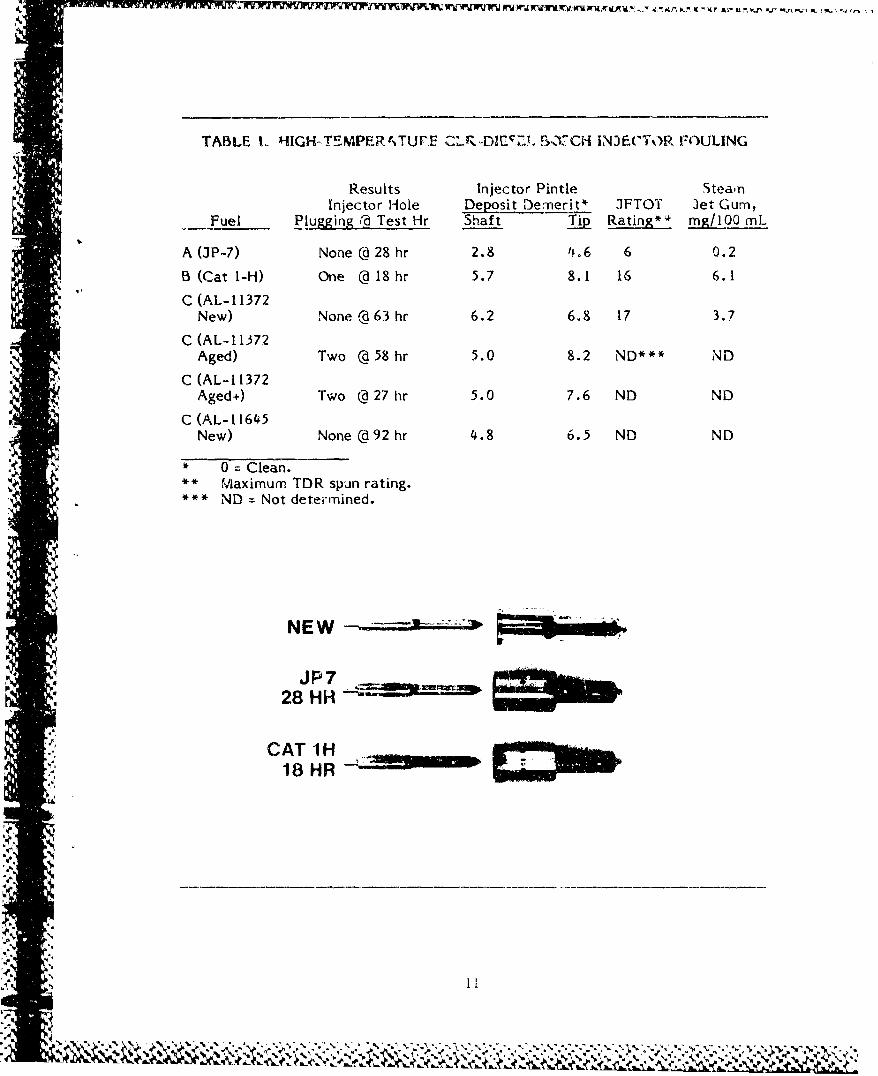
TABLE 1. HIGH-T!MPE.RUTUF.C- CLO•DMiFZI 5X37CH INJECOT)R FOIJLING
Results Injector Pintle Stea.nInjector Hole Deposit Dernerit* JFTOT 3et Gum,
Fuel Plugging i Test Hr Shaft li2 Rating*4 mgI/O0 mL
A (P-7) None d 28 hr 2.8 4. 6 6 0.2
B (Cat I-H) One @ 18 hr 5.7 8.1 16 6.1C (AL-11372
New) None @ 63 hr 6.2 6.8 17 3.7
C (AL-11372Aged) Two @ 58 hr 5.0 8.2 ND*** ND
C (AL-11372Aged+) Two @ 27 hr 5.0 7.6 ND ND
C (AL-11645New) None @92 hr 4.8 6.5 ND ND
S0 = Clean.** Maximum TDR spin rating.*** ND Not deteirmined.
N E W
28 HH
CAT 1H18HR
.... ",
Z.
*.p *'%
~ KA~JX~ 7 =7-Y-,,j ,xv'i .1N 7.jr %P. &r.
I. OVFRVIFW OF REPORT SECTIONS AND TEST FUELS
This report is composed of three major sections:
* Injector Bench Test Development
* D 3241 JFTOT Application to Diesel Fuel
* Application of Hot Liquid Process Simulator Instrumentation to Diesel
Fuel Thermal Stability
While work in all these sections occurred during the performance period covered by
this report, test fuel samples were not necessarily identical in each section. The
following generic-type test fuels were made available in general to the program.
* Cat I -H: Caterpillar I-H/1-G engine reference fuel procuredfrom Howell Hydrocarbons in San Antonio, TX, is a
straight-run diesel fuel made in batches over the past20 years
0 I%S: One-percent sulfur referee diesel fuel meeting Speci-fication MIL-F-46162B (all natural sulfur compound)
* * DFM: Diesel fuel rnarine meeting Specification MIL-F-
16884G
* Navy Base TestFuel No. I: Special test fuel procured under Specification MILLF-
16884H
e JP-7: Jet fuel procured under Specification miL-T-38219A
e EDS: Experimental coal-derived fuel
* Shaie Oil Diesel: Experimental shale oil-derived diesel fuel=9 Jet A-I: Experimental test fuel procured under ASTM D 1655,
"Specification for Aviation Turbine Fuels"
a Diesel Control: EPA specification for automotive emissions test fuel
procured from Phillips Petroleum Company, 2artles.-
,v*Ile, OK
"jA
Ini. INJECTOR BENCH TEST DEVELOPMENT
In late 1982, a project was initiated to develop an injector fouling bench test
(IFBT). In order to determine the operating conditions required for the fuel
injector fouling bench test rig, an initial attempt was made to determine the
operating temperatures of the fuel injector nozzle in the uncooled CLR-D engine.
By attaching thermocouples on the injector nozzle body and tip, it was feit the
operating temperatures of the injector needle could be estimated.
A groove was ground along the injector body and nozzle to route the thermocouple
wires out of the injector and the head of the engine. One theormocouple was spot-
welded on the body of the injector nozzle above the seating surface, while the
other was spot-welded to the injector tip below the seating surface (Figure 1). A
washer was machined to tit over the tip ard against the injector nozzle body to
provide a seating surface for the nozzle. The grooves on the tip and nozzle body inthe seating area were filled with a metallic epoxy to provide a seal and to protect
the thermocouple wires (Figure 2).
The engine was started and warmed up to the operating conditions noted during
previous tests when injector fouling occurred. The engine ran 90 minutes before
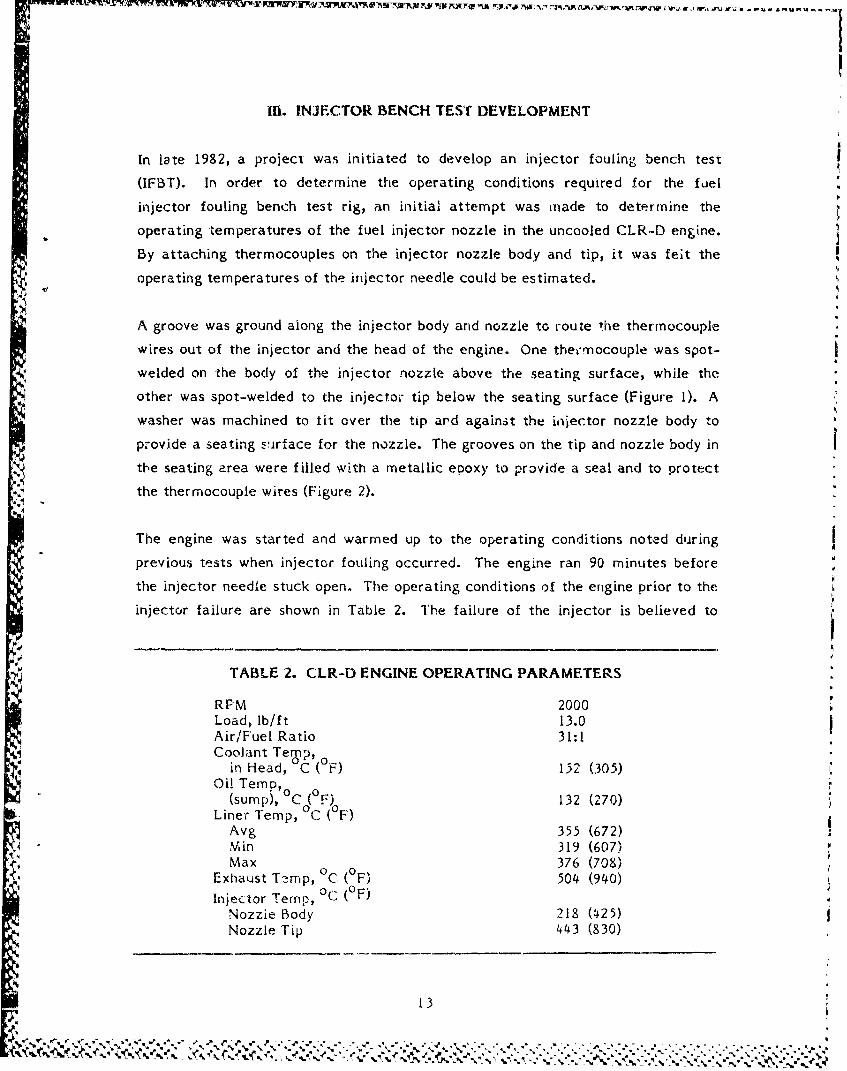
the injector needle stuck open. The operating conditions of the engine prior to the
injector failure are shown in Table 2. The failure of the injector is believed to
TABLE 2. CLR-D ENGINE OPERATING PARAMETERS
RPM 2000Load, lb/ft 13.0Air/Fuel Ratio 31:1Coolant Te p, 0
in Head, C ( F) 152 (305)Oil Temp,
(sump), 0 C (F) 132 (270)Liner Temp, C ( F)
Avg 355 (672)Min 319 (607)Max 376 (708)
Exhaust T2mp, C (OF) 504 (940)Injector Ternp, °C (OF)
Nozzie Body 218 (425)Nozzle Tip 443 (830)
13
Z - .
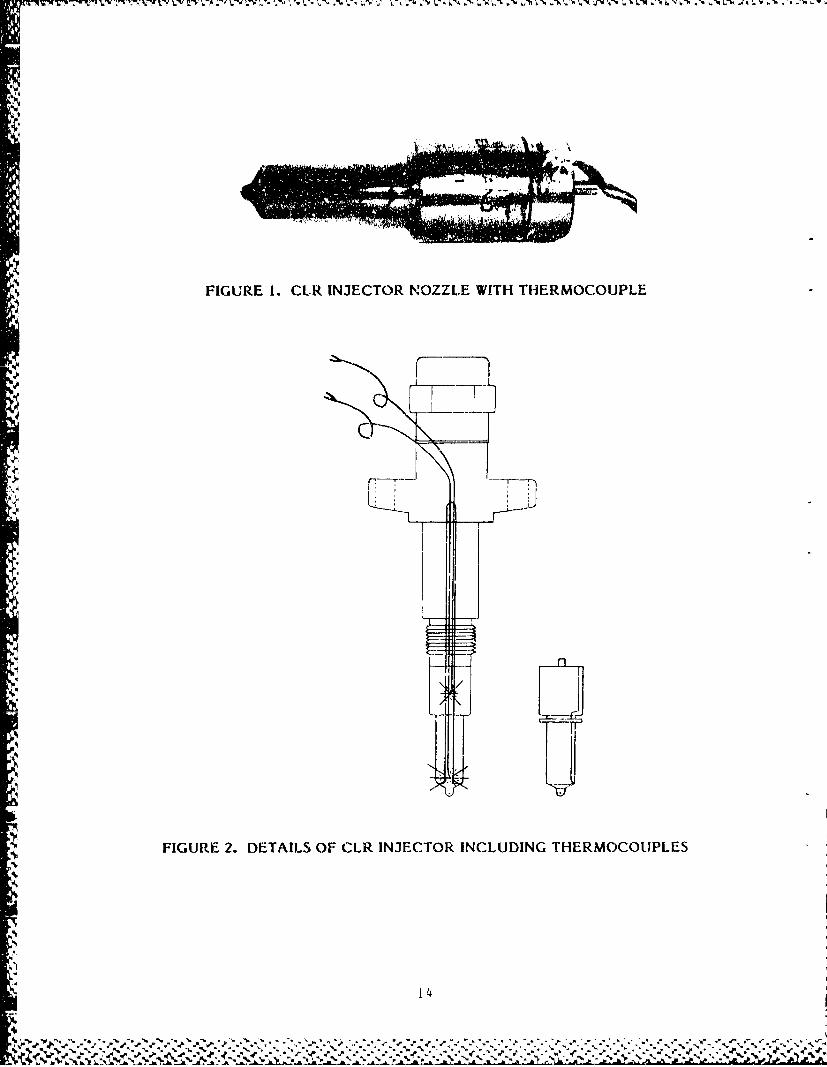
FIGURE 1. CL.R INJECTOR NOZZLE WITH THERMOCOUPLE
FIGURE 2. DETAILS OF CLR INJECTOR INCLUDING THERMOCOUPLES
14
-.
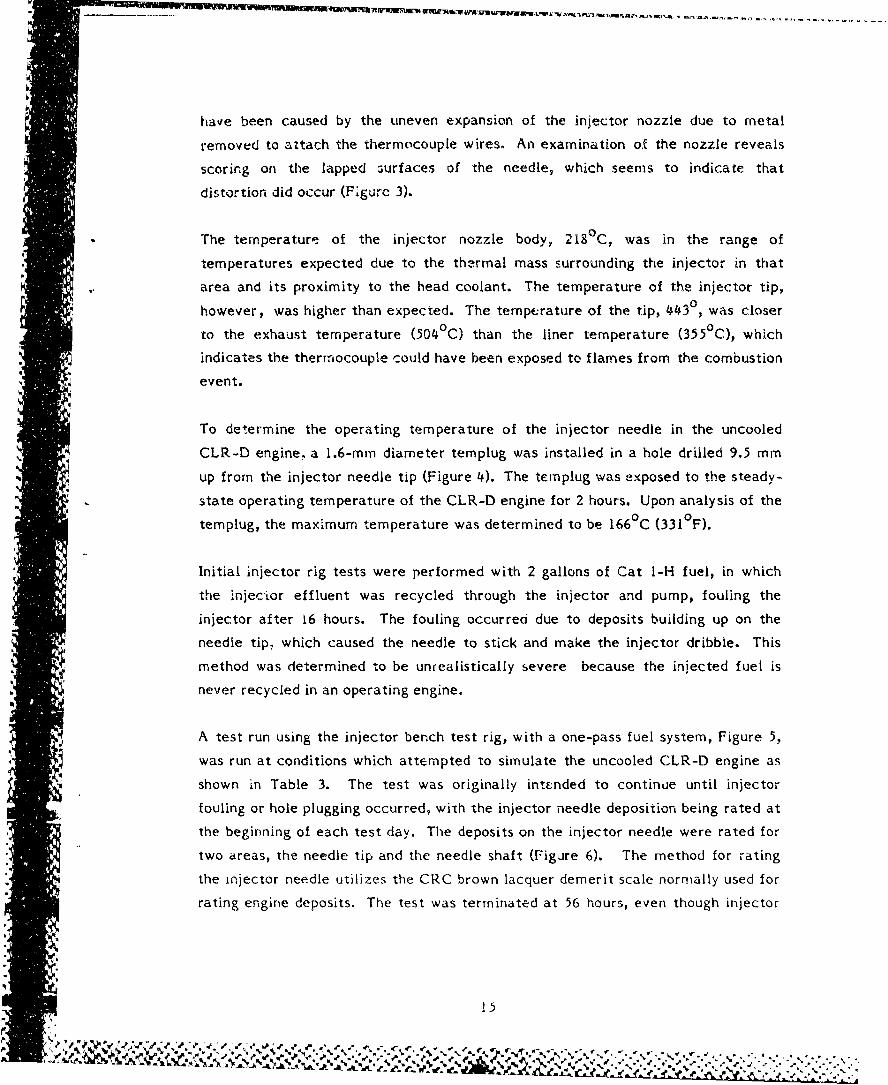
have been caused by the uneven expansion of the injector nozzle due to metal
removed to attach the thermocouple wires. An examination of the nozzle reveals
scoring on the lapped aurfaces ,of the needle, which seems to indicate that
distortion did occur (Figurc 3).
The temperature of the injector nozzle body, 2180 C, was in the range of
temperatures expected due to the thermal mass surrounding the injector in that
area and its proximity to the head coolant. The temperature of the injector tip,
however, was higher than expected. The temperature of the tip, 443 , was closer
to the exhaust temperature (504 C) than the liner temperature (355 C), which
indicates the thermocouple could have been exposed to flames from the combustion
event.
To determine the operating temperature of the injector needle in the uncooled
CLR-D engine, a 1.6-mm diameter templug was installed in a hole drilled 9.5 mm
up from the injector needle tip (Figure 4). The templug was exposed to the steady-
state operating temperature of the CLR-D engine for 2 hours. Upon analysis of the
templug, the maximum temperature was determined to be 166 0 C (331°F).
Initial injector rig tests were performed with 2 gallons of Cat I-H fuel, in which
the injecior effluent was recycled through the injector and pump, fouling the
injector after 16 hours. The fouling occurred due to deposits building up on the
needle tip, which caused the needle to stick and make the injector dribble. This
method was determined to be unrealistically severe because the injected fuel is
never recycled in an operating engine.
"A test run using the injector bench test rig, with a one-pass fuel system, Figure 5,
"was run at conditions which attempted to simulate the uncooled CLR-D engine as
shown in Table 3. The test was originally intended to continue until injector
fouling or hole plugging occurred, with the injector needle deposition being rated at
the beginning of each test day. The deposits on the injector needle were rated for
two areas, the needle tip and the needle shaft (Figure 6). The method for rating
the injector needle utilizes the CRC brown lacquer demerit scale normally used for
rating engine deposits. The test was terminated at 56 hours, even though injector
.1
APN *.I

I~ U-.1 W V~ ) W. W4 F" PA .- ' KI-X UP
FIGUR.E 3. CLR INJECTOR NEEDLE (ARROWS INDICATE SCORED SURFACE)
FIGURE 4. INJECTOR NEEDLE SH-OWING POSITION OF TEPAPLUG
FiGURE 5. INJECTOR FOULING BENCH TEST RIG
16(
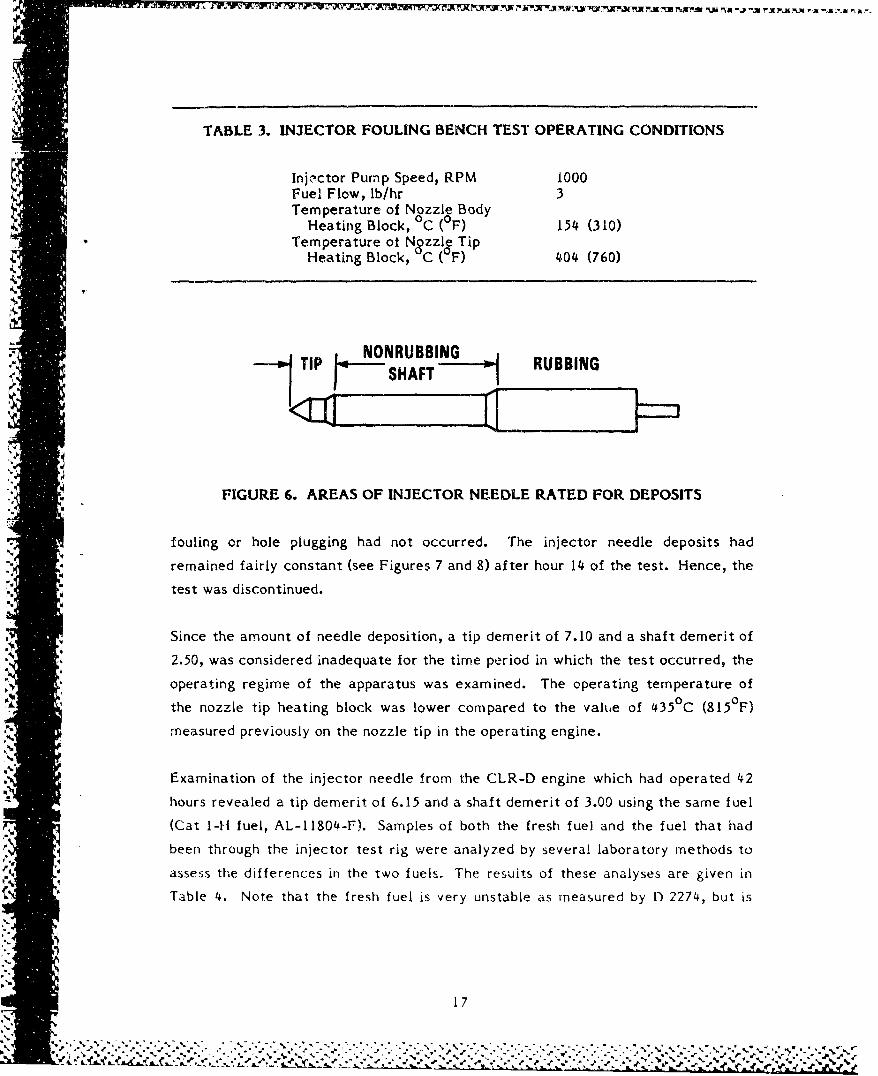
TABLE 3. INJECTOR FOULING BENCH TEST OPERATING CONDITIONS
Injector Pump Speed, RPM 1000Fuel Flow, lb/hr 3Temperature of Nozzle Body
Heating Block, °C ( F) 154 (310)Temperature of Nozzle Tip
Heating Block, °C (OF) 404 (760)
-TiP -NONRUHBBING -.b RUBBING
TPSHAFT RUBN
FIGURE 6. AREAS OF INJECTOR NEEDLE RATED FOR DEPOSITS
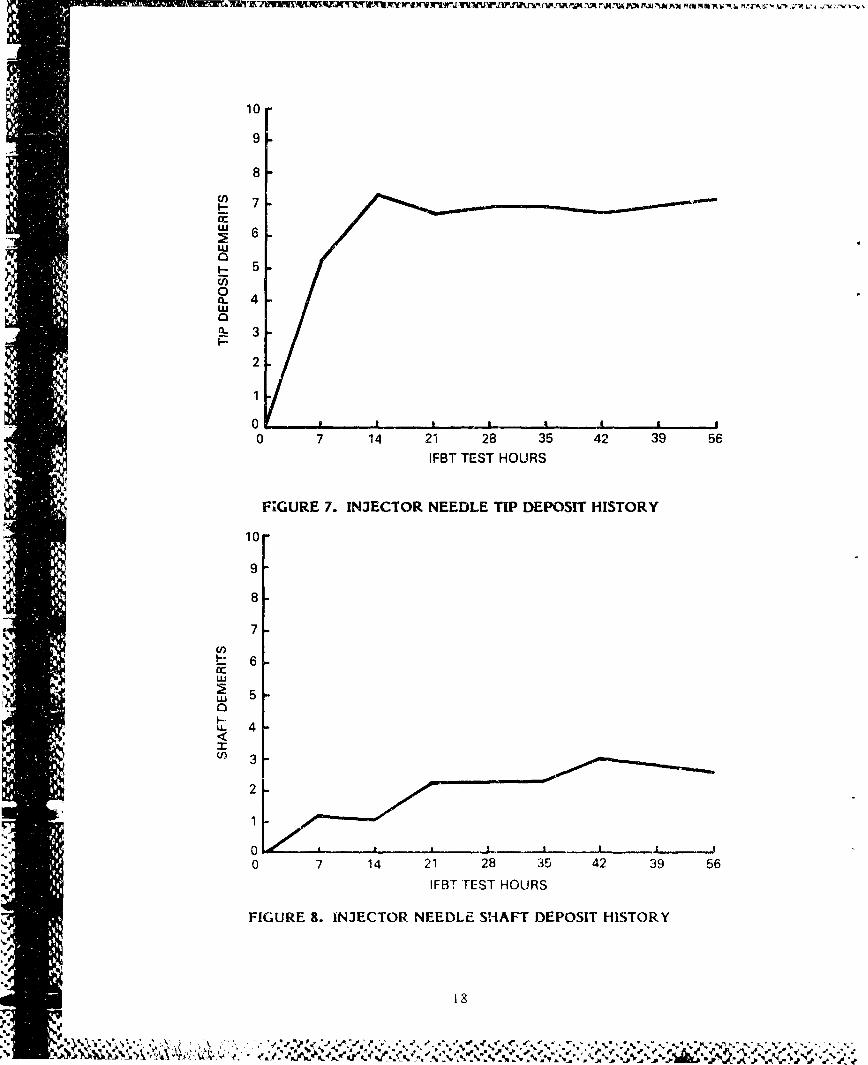
fouling or hole plugging had not occurred. The injector needle deposits had
"remained fairly constant (see Figures 7 and 8) after hour 14 of the test. Hence, the
test was discontinued.
SSince the amount of needle deposition, a tip demerit of 7.10 and a shaft demerit of
2.50, was considered inadequate for the time period in which the test occurred, the
operating regime of the apparatus was examined. The operating temperature of
the nozzle tip heating block was lower compared to the valLie of 4350C (8150F)
1% measured previously on the nozzle tip in the operating engine.
Examination of the injector needle from the CLR-D engine which had operated 42
hours revealed a tip demerit of 6.15 and a shaft demerit of 3.00 using the same fuel(Cat I-H fuel, AL-11804-F). Samples of both the fresh fuel and the fuel that had
*1 been through the injector test rig were analyzed by several laboratory methods to
w. assess the differences in the two fuels. The results of these analyses are given in
Table 4. Note that the fresh fuel is very unstable as measured by D 2274, but is
17
!,.-,..- ,
10
9
8
~-7
I- 5
0C 4
a. 3
2
1
0 -- -- I-
0 7 14 21 28 35 42 39 56IFBT TEST HOURS
F;GURE 7. INJECTOR NEEDLE TIP DEPOSIT HISTORY
lo
9
8
7
S6
S5
U) 3
2
1
00 7 14 21 28 35 42 39 56
IFBT TEST HOURS
FIGURE S. INJECTOR NEEDLE SHAFT DEPOSIT HISTORY
k/*q
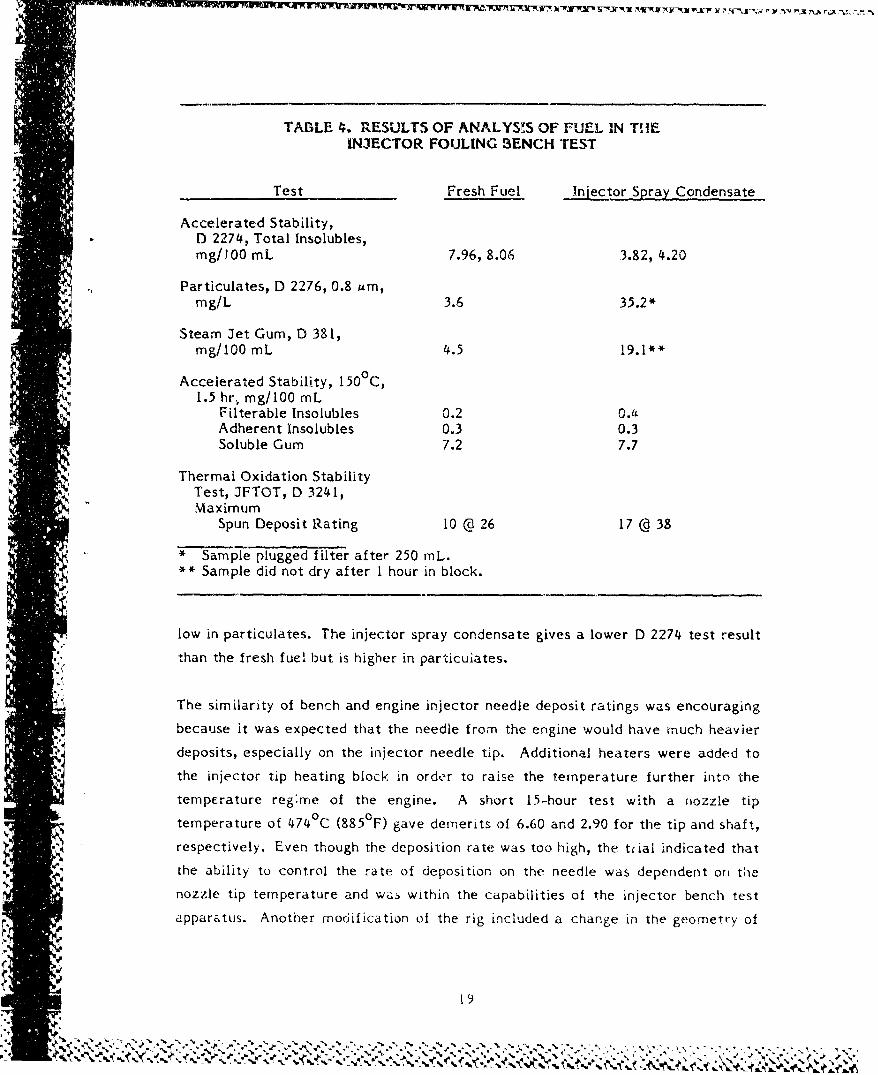
TABLE 4. RESULTS OF ANALYSIS OF FUEL IN THEINJECTOR FOULING BENCH TEST
Test Fresh Fuel Injector Spray Condensate
Accelerated Stability,)D 2274, Total Insolubles,
rng/O00 mL 7.96, 8.06 3.82, 4.20
Particulates, D 2276, 0.8 um,rng/L 3.6 35.2*
Steam Jet Gum, D 381,mg/100 mL 4.5 19.1**
Accelerated Stability, 150° C,"1.5 hr, mg/100 mL
Filterable Insolubles 0.2 0.1Adherent Insolubles 0.3 0.3Soluble Gum 7.2 7.7
Thermal Oxidation StabilityTest, JFTOT, D 3241,Maximum
Spun Deposit Rating 10 @ 26 17 @ 38
* Sample plugged filter after 250 mL.** Sample did not dry after 1 hour in block.
low in particulates. The injector spray condensate gives a lower D 2274 test result
*•, than the fresh fuel but is higher in particulates.
The similarity of bench and engine injector needle deposit ratings was encouraging
because it was expected that the needle from the engine would have much heavierq deposits, especially on the injector needle tip. Additional heaters were added to
the injector tip heating block in order to raise the temperature further into the
temperature reg:me of the engine. A short 15-hour test with a nozzle tip
temperature of 474 0 C (8850F) gave demerits of 6.60 and 2.90 for the tip and shaft,respectively. Even though the deposition rate was too high, the trial indicated that
the ability to control the rate of deposition on the needle was dependent on the
nozzle tip temperature and was within the capabilities of the injector bench test
"apparz.tus. Another modification of the rig included a change in the geometry of
19
-% %
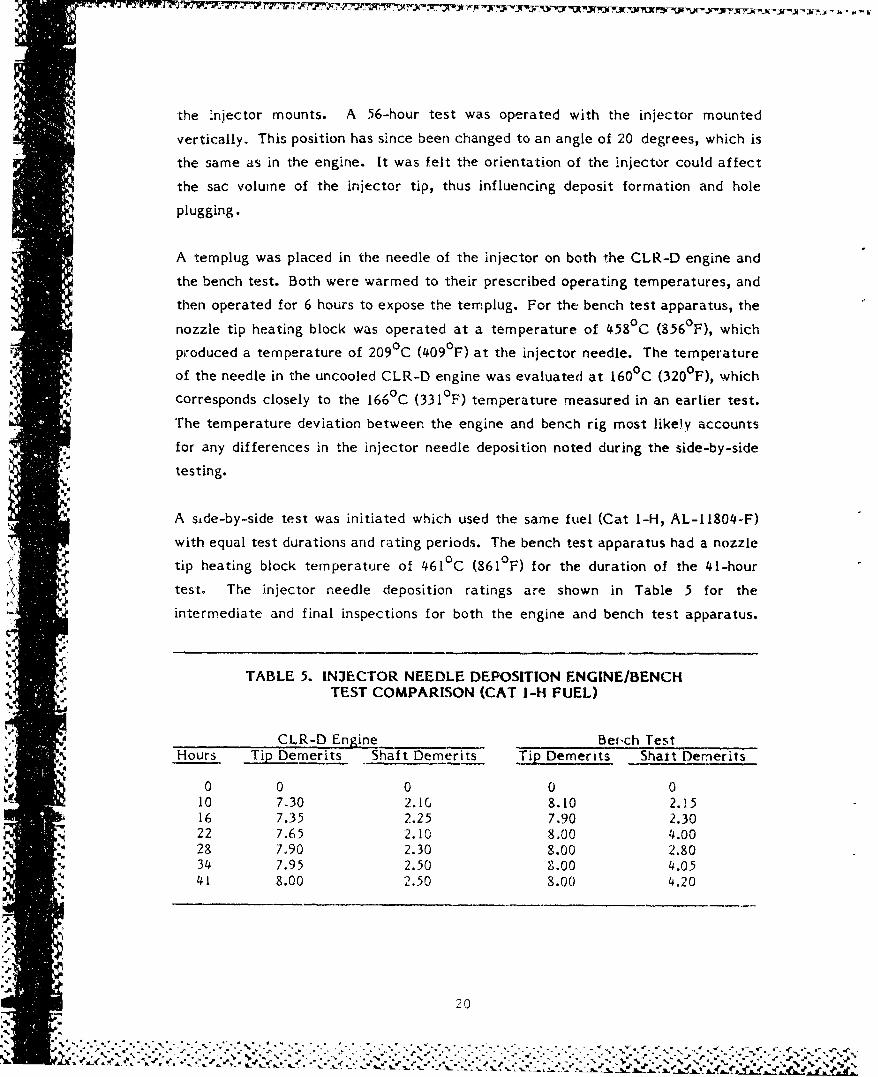
-the Injector mounts. A 56-hour test was operated with the injector mounted
vertically. This position has since been changed to an angle of 20 degrees, which is
the same as in the engine. It was felt the orientation of the injector could affect
the sac volume of the injector tip, thus influencing deposit formation and hole
plugging.
A templug was placed in the needle of the injector on both the CLR-D engine and
the bench test. Both were warmed to their prescribed operating temperatures, and
then operated for 6 hours to expose the templug. For the bench test apparatus, the
nozzle tip heating block was operated at a temperature of 458 0 C (856 0 F), which
produced a temperature of 209 0 C (409°F) at the injector needle. The temperature
of the needle in the uncooled CLR-D engine was evaluated at 160 C (320°F), whichp ~0 0corresponds closely to the 166 C (331°F) temperature measured in an earlier test.
The temperature deviation between the engine and bench rig most likely accounts
for any differences in the injector needle deposition noted during the side-by-side
testing.
A side-by-side test was initiated which used the same fuel (Cat l-H, AL-11804-F)
Y.. with equal test durations and rating periods. The bench test apparatus had a nozzle
tip heating block temperature of 461 C (861°F) for the duration of the 41-hour
test. The injector needle deposition ratings are shown in Table 5 for the
intermediate and final inspections for both the engine and bench test apparatus.
TABLE 5. INJECTOR NEEDLE DEPOSITION ENGINE/BENCHTEST COMPARISON (CAT I-H FUEL)
CLR-D Engine Beich TestHours Tip Demerits Shaft Demerits Tip Demerits Shalt Demerits
0 0 0 0 0V10 7ý30 2.10 8.10 2.1516 7.35 2.25 7.90 2.3022 7.65 2.10 8.00 4.0028 7.90 2.30 8.00 2.8034 7.95 2.50 8.00 4.0541 8.00 2.50 8.00 4.20
20
I !::.::..:;: ;:-:-::::!:::::.:)::.: : ,:: :,:- .::,: -.: . :-. :- .:::: ::::::: : <* :.:: :,:::::::,:-.::,:.: : -;-
The results indicate a higher rate of deposition with the bench test apparatus and a
tendency to develop a larger amount of injector needle shaft deposits. It is felt the
deviations in the deposition rate are attributable to the temperature differences of
the injector needles as noted earlier. Although deposits were formed, injector
fouling or hole plugging had not occurred at anytime during the testing in either
injector. For both injectors, the pop-off pressure remained the same, and the spray
pattern looked good.
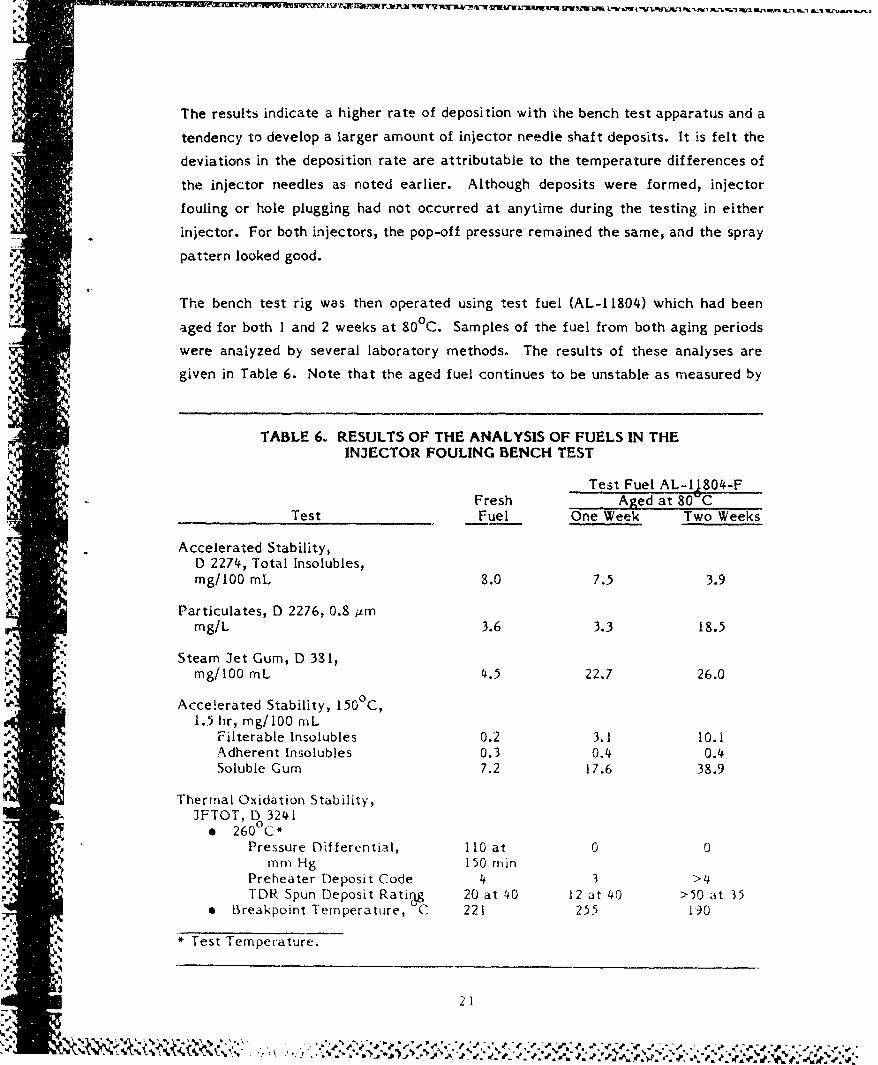
The bench test rig was then operated using test fuel (AL-11804) which had been
aged for both I and 2 weeks at 80 0 C. Samples of the fuel from both aging periods
were analyzed by several laboratory methods. The results of these analyses are
given in Table 6. Note that the aged fuel continues to be unstable as measured by
TABLE 6. RESULTS OF THE ANALYSIS OF FUELS IN THEINJECTOR FOULING BENCH TEST
Test Fuel AL-Ig0-'-F
*- Fresh Aged at 80"CTest Fuel One Week Two Weeks
Accelerated Stability,D 2274, Total Insolubles,mg/100 mL 8.0 7.5 3.9
Particulates, D 2276, 0.8 ,immg/L 3.6 3.3 18.5
Steam Jet Gum, D 381,mrg/100 mL 4.5 22.7 26.0
Acce.erated Stability, 150°C,1.5 hr, mg/O00 mL
tFilterable Insolubles 0.2 3.1 10.1Adherent Insolubles 0.3 0.4 0.4Soluble Gum 7.2 17.6 38.9
Thermal Oxidation Stability,JFTOT, D 3241
. 260 0 C*Pressure Differential, 110 at 0 0
mmr H g 150 mmiPreheater Deposit Code 4 3 >4TDR Spun Deposit Ratimg 20 at 40 12 at 40 >50 at 35
, Breakpoint Temperature, C 221 255 190
* Test Temperature.
IV/i I 21
•.,1•,0• ,3'>..• "-.,•, ... ' .'.., ,K,-..•''.•,•• •'''• .,• . . .• :• .:.-•.'.4".,..•....',.,-'... •.,
ASTM D 2274. The aged fuels show a significant increase in particulates and
steam jet gum as compared to the fresh fuel. The dramatic increase in the 1500 C
test results for the 1-week and 2-week aged samples may be significant.
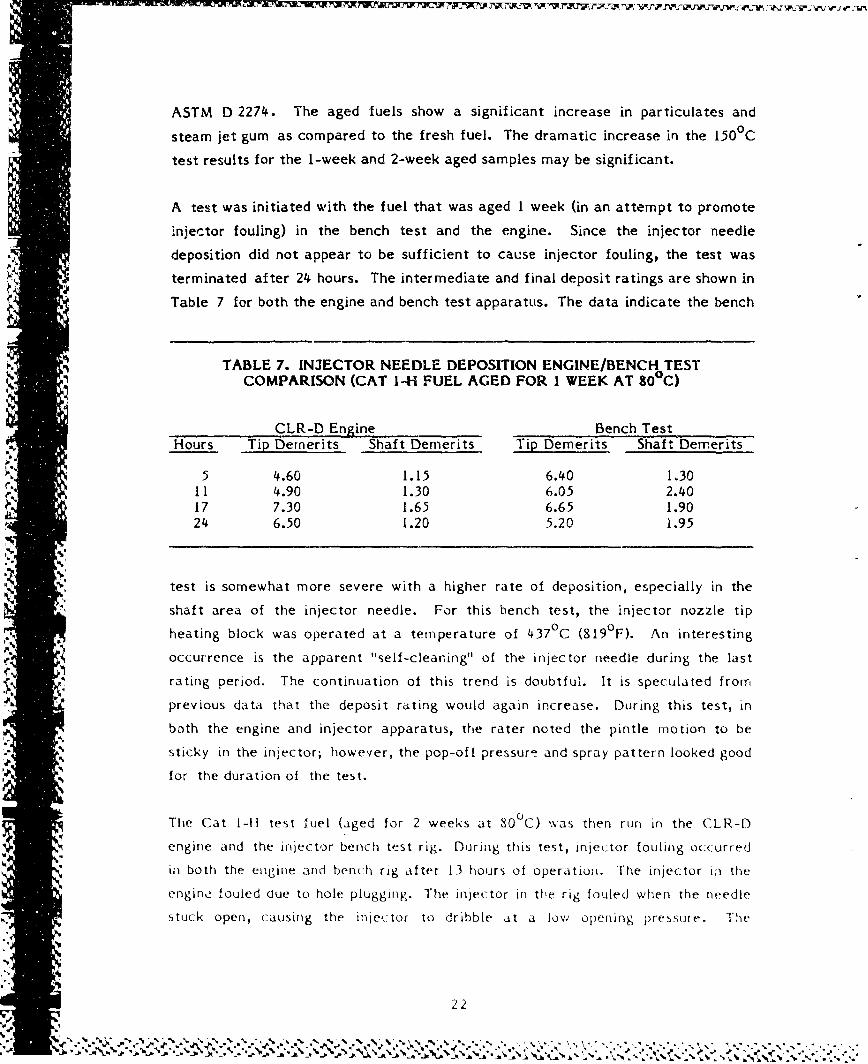
A test was initiated with the fuel that was aged I week (in an attempt to promote
injector fouling) in the bench test and the engine. Since the injector needle
deposition did not appear to be sufficient to cause injector fouling, the test was
terminated after 24 hours. The intermediate and final deposit ratings are shown in
Table 7 for both the engine and bench test apparatus. The data indicate the bench
TABLE 7. INJECTOR NEEDLE DEPOSITION ENGINE/BENCH TESTCOMPARISON (CAT I-H FUEL AGED FOR I WEEK AT 800 C)
CLR-D Engine Bench TestHours Tip Demerits Shaft Demerits Tip Demerits Shaft Demerits
5 4.60 1.15 6.40 1.30
11 4.90 1.30 6.05 2.4017 7.30 1.65 6.65 1.9024 6.50 1.20 5.20 1.95
test is somewhat more severe with a higher rate of deposition, especially in the
shaft area of the injector needle. For this bench test, the injector nozzle tip
heating block was operated at a temTperature of 4370 C (819 0 F). An interesting
occurrence is the apparent "self-cleaning" of the injector needle during the last
rating period. The continuation of this trend is doubtful. It is speculated from-_ previous data that the deposit rating would again increase. During this test, in
both the engine and injector apparatus, the rater noted the pintle motion to be
sticky in the injector; however, the pop-off pressure and spray pattern looked good
for the duration of the test.
The Cat I-H test Juel (aged for 2 weeks at 80 0 C) was then run in the CLR-D
engine and the injector bench test rig. During this test, injector fouling occurred
in both the engine and bench rig after 13 hours of operation. The injector in the
engine fouled due to hole plugging. The injector in the rig fouled when the needle
"stuck open, causing the injector to dribble at a low opening pressure. The
4 <s
22
% l %~% . . JR % N*
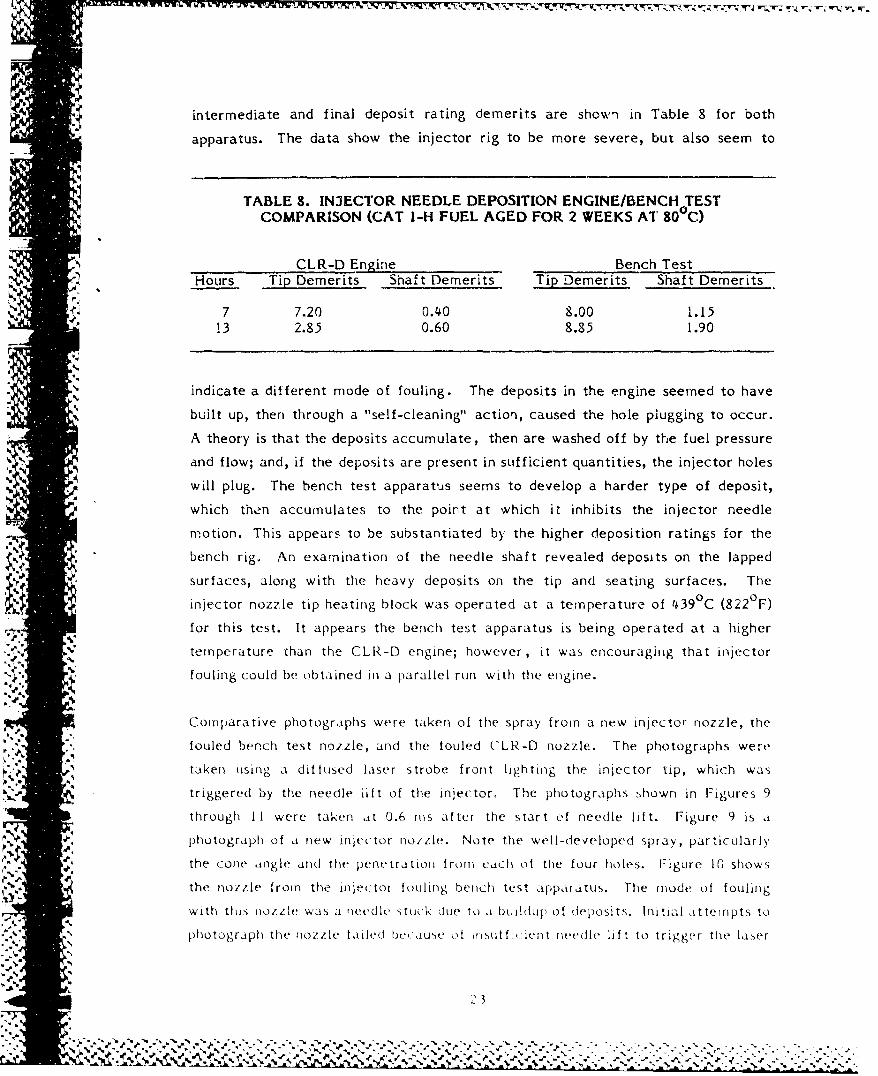
intermediate and final deposit rating demerits are shown in Table 8 for both
"apparatus. The data show the injector rig to be more severe, but also seem to
TABLE 8. INJECTOR NEEDLE DEPOSITION ENGINE/BENCH TESTCOMPARISON (CAT I-H FUEL AGED FOR 2 WEEKS AT 800C
CLR-D Engine Bench TestHours Tip Demerits Shaft Demerits Tip Demerits Shaft Demerits
% 7 7.20 0.40 8.00 1.1513 2.85 0.60 8.85 1.90
% indicate a different mode of fouling. The deposits in the engine seemed to have"% built up, then through a "self-cleaning" action, caused the hole plugging to occur.
A theory is that the deposits accumulate, then are washed off by the fuel pressure
and flow; and, if the deposits are present in sufficient quantities, the injector holes
will plug. The bench test apparatus seems to develop a harder type of deposit,
which then accumulates to the point at which it inhibits the injector needle
motion. This appears to be substantiated by the higher deposition ratings for the
bench rig. An examination of the needle shaft revealed deposits on the lapped
surfaces, along with the heavy deposits on the tip and seating surfaces. The
injector nozzle tip heating block was operated at a temperature of 439 0 C (822 0 F)
for this test. It appears the bench test apparatus is being operated at a higher
temperature than the CLR-D engine; however, it was encouraging that injector
fouling could be obtained in a parallel run with the engine.
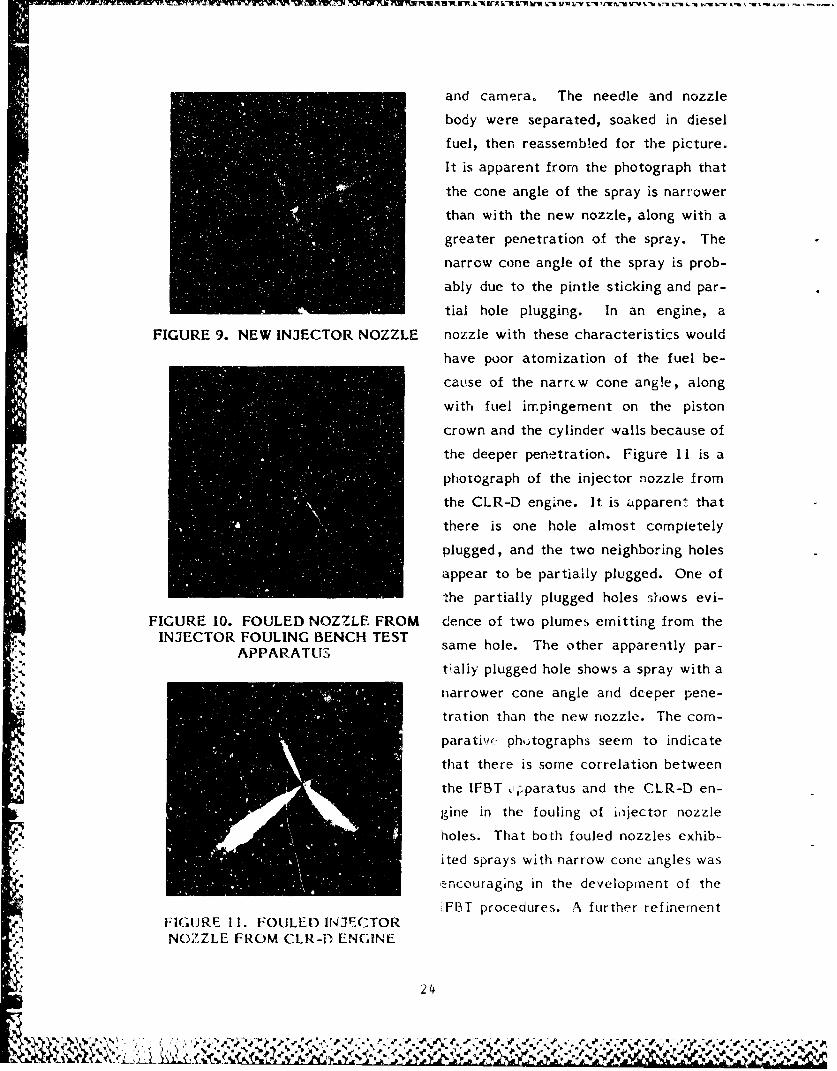
Comparative photographs were taken of the spray from a new injector nozzle, the
"fouled bench test nozzle, and the fouled CLR-D nozzle The photographs weretaken using a diffused laser strobe front lighting the injector tip, which was
triggered by the needle iift of the injector. The photographs .hown in Figures 9
through II were taken at 0.6 ins after the start of needle lift. Figure 9 is a
photograph Of a nlew inleCCtor no/zle. Note the well-developed spray, partiCk-larly
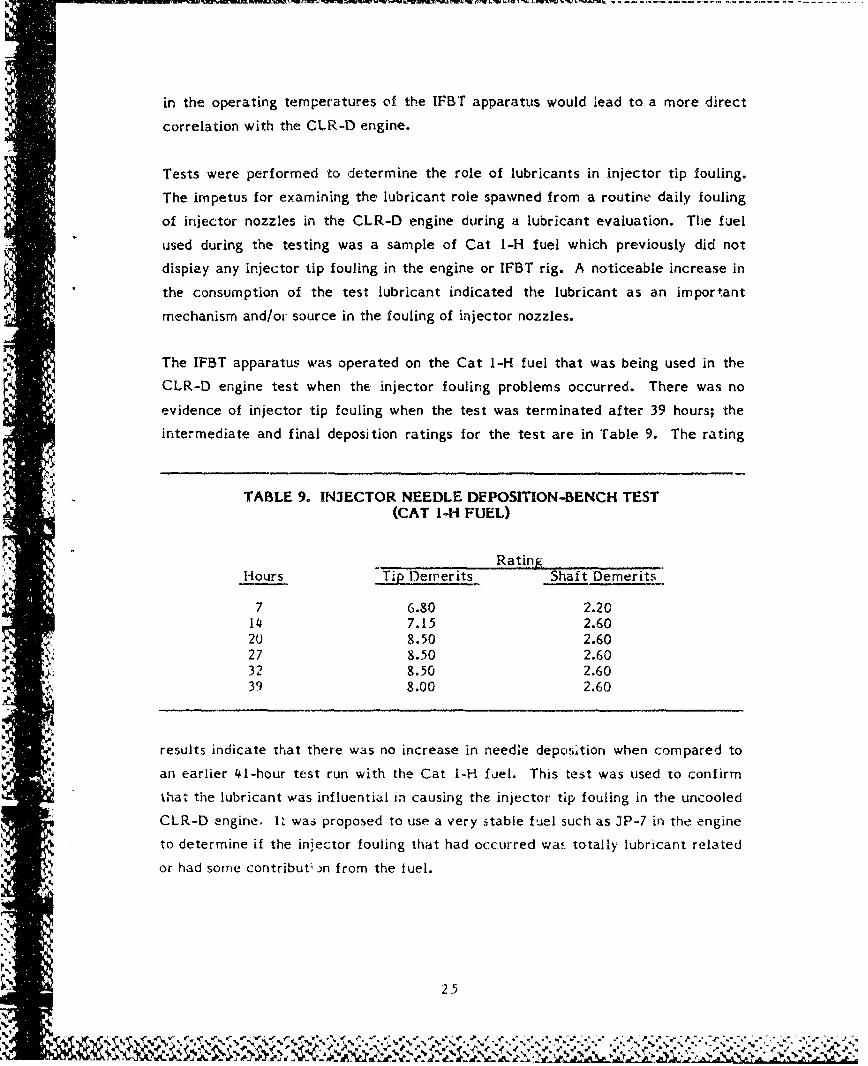
the cone angle and the penetration fromn each of the four holes. Figure 10 shows
the nozzle from the injector fouling bench test apparatus. The mode of fouling
with this nozzle was a needle struck due to i buildup of deposits. Initijl attempts to
"photograph the nozzle failed beciause of inskitf• cient rtwredle li ft to trigge r the la ser
) 3
%~
SiF. 2'
',•IIA
u~~.~-v v-~, w ir -uuv L-u 'fKR uv uk-* -U - - - -' - --
and camera. The needle and nozzle
body were separated, soaked in diesel
fuel, then reassembled for the picture.
It is apparent from the photograph that
the cone angle of the spray is narrower
than with the new nozzle, along with a
greater penetration of the spray. The
narrow cone angle of the spray is prob-
"ably due to the pintle sticking and par-
tial hole plugging. In an engine, a
FIGURE 9. NEW INJECTOR NOZZLE nozzle with these characteristics would
have poor atomization of the fuel be-
cause of the narrLw cone ang!e, along
with fuel impingement on the piston
crown and the cylinder walls because of
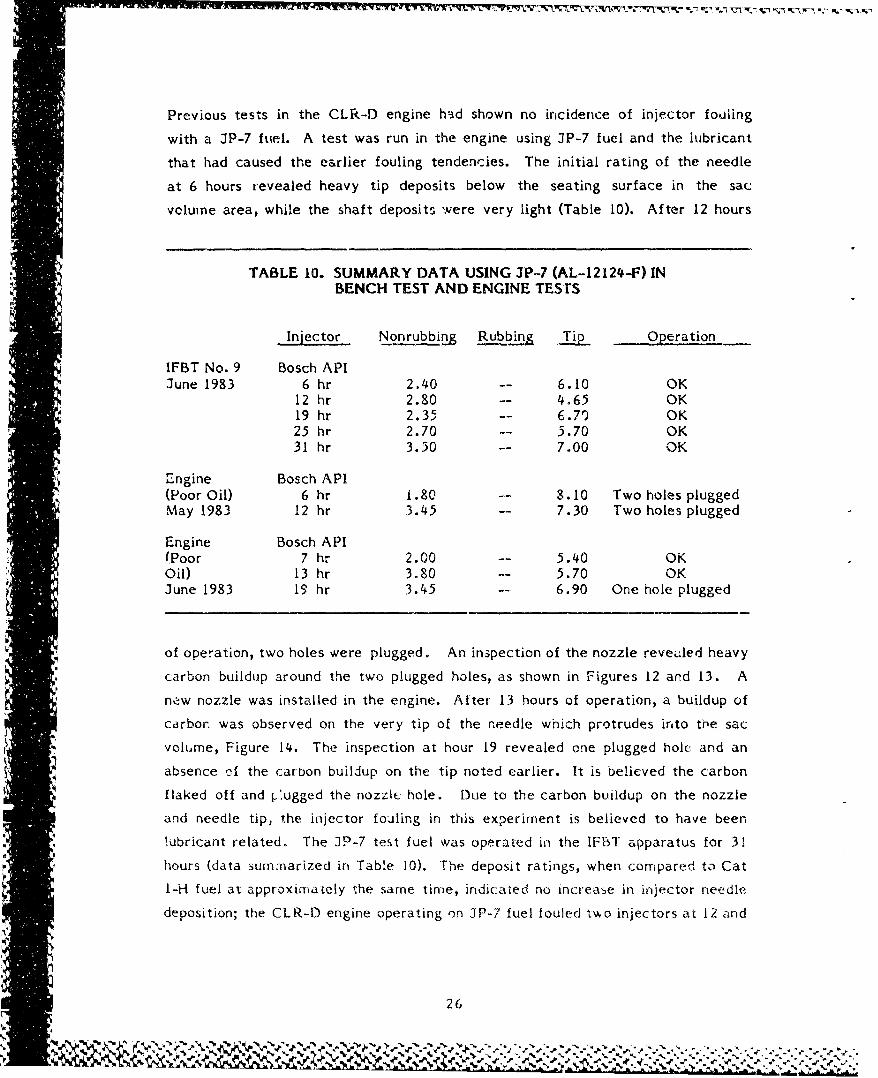
the deeper penetration. Figure 11 is a
photograph of the injector nozzle from
the CLR-D engine. It is apparent that
there is one hole almost completely
plugged, and the two neighboring holes
appear to be partially plugged. One of
the partially plugged holes shows evi-
FIGURE 10. FOULED NOZZLE FROM dence of two plumes emitting from theINJECTOR FOULING BENCHI TEST"INJECATR same hole. The other apparently par-S-- APPARATUS
tially plugged hole shows a spray with a
narrower cone angle and deeper pene-
tration than the new nozzle. The com-
parativ(, phk'tographs seem to indicate
that there is some correlation between
the IFBT ýyparatus and the CLR-D en-
gine in the fouling of injector nozzle
holes. That both fouled nozzles exhib-
ited sprays with narrow cone angles was
,ncouraging in the development of the
"!FBT procedures. A further refinementFIGUJRE 11. FOULED INJECTORNOZZLE FROM CLR-D ENGINE
24
% % %,
in the operating temperatures of the IFBT apparatus would lead to a more direct
correlation with the CLR,-D engine.
Tests were performed to determine the role of lubricants in injector tip fouling.
The impetus for examining the lubricant role spawned from a routine daily fouling
of injector nozzles in the CLR-D engine during a lubricant evaluation. The fuel
used during the testing was a sample of Cat I-H fuel which previously did not
display any injector tip fouling in the engine or IFBT rig. A noticeable increase in
the consumption of the test lubricant indicated the lubricant as an important
mechanism and/or source in the fouling of injector nozzles.
The IFBT apparatus was operated on the Cat I-H fuel that was being used in the
CLR-D engine test when the injector fouling problems occurred. There was no
evidence of injector tip fouling when the test was terminated after 39 hours; the
intermediate and final deposition ratings for the test are in Table 9. The rating
TABLE 9. INJECTOR NEEDLE DEPOSITION-BENCH TEST(CAT I-H FUEL)
RatingHours Tip Demerits Shaft Demerits
7 6.80 2.2014 7.15 2.6020 8.50 2.60
VI 27 8.50 2.6032 8.50 2.6039 8.00 2.60
results indicate that there was no increase in needle deposition when compared to
an earlier 41-hour test run with the Cat I-H fuel. This test was used to confirm
that the lubricant was influential in causing the injector tip fouling in the uncooled
CLR-D engine. I was proposed to use a very stable fuel such as JP-7 in the engine
to determine if the iniector fouling that had occurred was totally lubricant related
or had some contribut in from the fuel.
%n
% R.
Previous tests in the CLR-D engine had shown no incidence of injector fouling
with a JP-7 fuel. A test was run in the engine using JP-7 fuel and the lubricant
that had caused the earlier fouling tendencies. The initial rating of the needle
at 6 hours revealed heavy tip deposits below the seating surface in the sac
volume area, while the shaft deposits were very light (Table 10). After 12 hours
TABLE 10. SUMMARY DATA USING JP-7 (AL-12124-F) INBENCH TEST AND ENGINE TESTS
Injector Nonrubbing Rubbing Ti Operation
IFBT No. 9 Bosch APIJune 1983 6 hr 2.40 -- 6.10 OK
12 hr 2.80 -= 4.65 OK19 hr 2.35 -- 6.70 OK25 hr 2.70 -- 5.70 OK31 hr 3.50 -- 7.00 OK
E ngine Bosch API(Poor Oil) 6 hr 1 .80 - 8.10 Two holes pluggedMay 1983 12 hr 3.45 -- 7.30 Two holes plugged
Engine Bosch API(Poor 7 hr 2.00 -- 5.40 OKOil) 13 hr 3.80 5.70 OKJune 1983 19 hr 3.45 - 6.90 One hole plugged
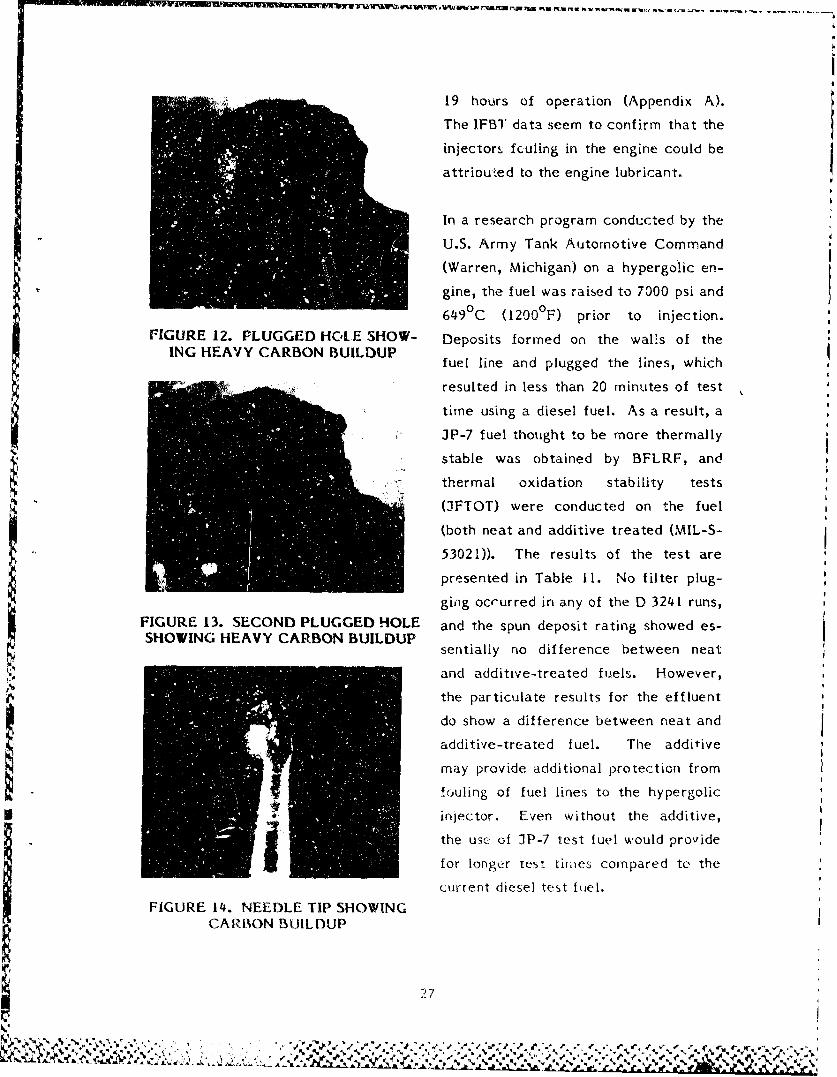
of operation, two holes were plugged. An inspection of the nozzle reveiled heavy
carbon buildup around the two plugged holes, as shown in Figures 12 and 13. A
naw nozzle was installed in the engine. After 13 hours of operation, a buildup of
carborn was observed on the very tip of the needle which protrudes into the sac
volume, Figure 14. The inspection at hour 19 revealed one plugged hole and an
absence of the carbon buildup on the tip noted earlier. It is believed the carbon
flaked off and r-Iugged the nozzlc hole. Due to the carbon buildup on the nozzle
and needle tip, the injector foiling in this experiment is believed to have been
lubricant related. The JP-7 test fuel was operated in the IFF5T apparatus for 31
hours (data summarized in Table 10). The deposit ratings, when coompared to Cat
I-H fuel at approximately the same time, indicated no increase in injector needle
deposition; the CLR-D engine operating on JP-7 fuel fouled two injectors at 12 Ind
26
% '% -
~ ~ '-Ile _
19 hours of operation (Appendix A).
The IFBT data seem to confirm that the
injectors fculing in the engine could be
attriDu•ed to the engine lubricant.
In a research program conducted by the
"U.S. Army Tank Automotive Command
(Warren, Michigan) on a hypergolic en-
gine, the fuel was raised to 7000 psi and
649 0 C (1200 0 F) prior to injection.FIGURE 12. PLUGGED HC, 'E SHOW- Deposits formed on the walls of the
ING HEAVY CARBON BUILDUP fuel line and plugged the lines, which
resulted in less than 20 minutes of test
time using a diesel fuel. As a result, a
C , JP-7 fuel thought to be more thermally
stable was obtained by BFLRF, and
thermal oxidation stability tests
(AFTOT) were conducted on the fuel
(both neat and additive treated (MIL-S-
53021)). The results of the test are
presented in Table 11. No filter plug-
ging occurred in any of the D 3241 runs,FIGURE 13. SECOND PLUGGED HOLE and the spun deposit rating showed es-SHOWING HEAVY CARBON BUILDUP
sentially no difference between neat
and additive-treated fuels. However,
the particulate results for the effluent
do show a difference between neat and
additive-treated fuel. The additive
may provide additional protection from
!ouling of fuel lines to the hypergolic
injector. Even without the additive,
the use of JP-7 test fuel would provide
for longer test times compared to the
current diesel test fuel.FIGURE 14. NEEDLE TIP SHOWING
CARBON BUILDUP
2.,7
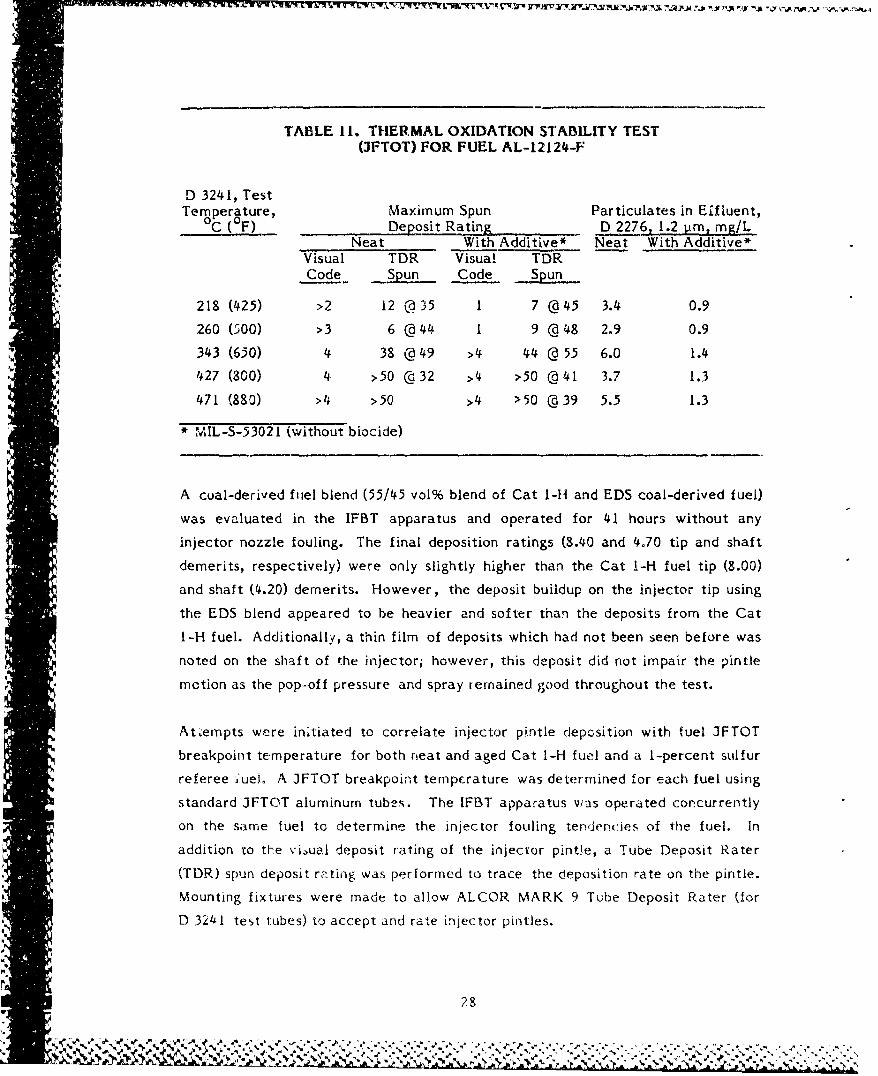
TABLE 11. THERMAL OXIDATION STABILITY TESTO(FTOT) FOR FUEL AL-12124-F
D 3241, TestTemperature, Maximum Spun Particulates in Eifluent,
°C (°F) Deposit Rating D 2276, 1.2 tym, mg/LNeat With Additive* Neat With Additive*
Visual TDR Visua! TDRCode Spun Code Spun
218 (425) >2 12 @ 35 1 7 @45 3.4 0.9
S260 (C00) >3 6 @44 1 9 @48 2.9 0.9
343 (650) 4 38 @49 > 4 44 @ 55 6.0 1.4
427 (800) 4 >50 @32 >4 >50 @41 3.7 1.3
471 (880) >4 >50 >4 >50 @39 5.5 1.3
"* MIL-S-53021 (without biocide)
A coal-derived fuiel blend (55/45 vol% blend of Cat I-li and EDS coal-derived fuel)
was evaluated in the IFBT apparatus and operated for 41 hours without any
injector nozzle fouling. The final deposition ratings (8.40 and 4.70 tip and shaft
demerits, respectively) were only slightly higher than the Cat 1-H fuel tip (8.00)
and shaft (4.20) demerits. However, the deposit buildup on the injector tip using
the EDS blend appeared to be heavier and softer than the deposits from the Cat
I-H fuel. Additionally, a thin film of deposits which had not been seen before was
noted on the shaft of the injector; however, this deposit did not impair the pintle
motion as the pop-off pressure and spray remained good throughout the test.
Attempts were initiated to correlate injector pintle deposition with fuel JFTOT
breakpoint temperature for both neat and aged Cat I-H fuel and a I-percent sulfur
referee J'uei. A JFTOT breakpoint tempcrature was determined for each fuel using
standard JFTOT aluminum tubes. The IFBT apparatus was operated concurrently
on the same fuel to determine the injector fouling tendencies of the fuel. In
addition to the vi.ual deposit rating of the injector pint!e, a Tube Deposit Rater
(TDR) spun deposit rating was performed to trace the deposition rate on the pintle.
Mounting fixtures were made to allow ALCOR MARK 9 Tube Deposit Rater (for
D 3241 test lubes) to accept and rate injector pintles.
28
IiII%
.c lf
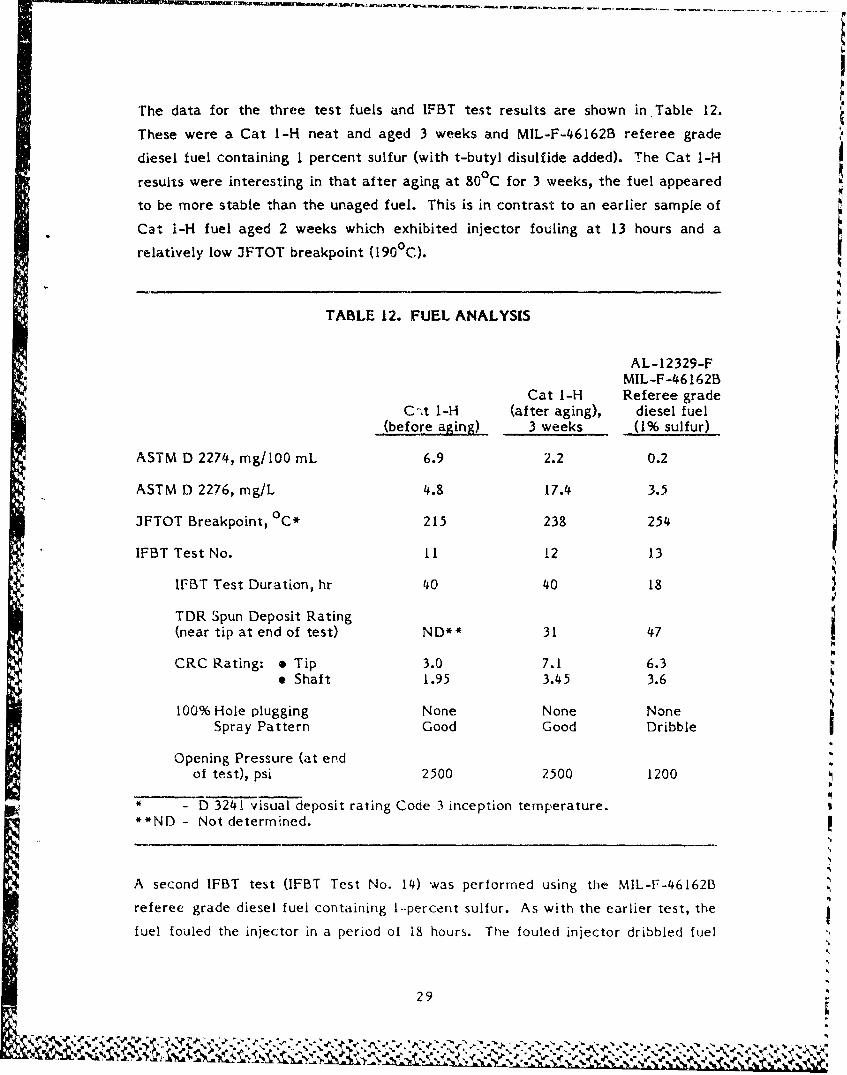
The data for the three test fuels and IFBT test results are shown in Table 12.
These were a Cat I-H neat and aged 3 weeks and MIL-F-46162B referee grade
diesel fuel containing I percent sulfur (with t-butyl disulfide added). The Cat I-H
results were interesting in that after aging at 80°C for 3 weeks, the fuel appeared
to be more stable than the unaged fuel. This is in contrast to an earlier sample of
Cat 1-H fuel aged 2 weeks which exhibited injector fouling at 13 hours and a
relatively low JFTOT breakpoint (1900C).
TABLE 12. FUEL ANALYSIS
AL-12329-FMIL-F-46162B
Cat I-H Referee gradeC-'t I-H (after aging), diesel fuel
(before aging) 3 weeks (1% sulfur)
ASTM D 2274, mg/I00 mL 6.9 2.2 0.2
ASTM D 2276, mg/L 4.8 17.4 3.5
JFTOT Breakpoint, °C* 215 238 254
IFBT Test No. 11 12 13
IFBT Test Duration, hr 40 40 18
TDR Spun Deposit Rating(near tip at end of test) ND** 31 47
CRC Rating: * Tip 3.0 7.1 6.3e Shaft 1.95 3.45 3.6
100% Hole plugging None None NoneSpray Pattern Good Good Dribble
Opening Pressure (at endof test), psi 2500 2500 1200
* - D 3241 visual deposit rating Code 3 inception temperature.**ND - Not determined.
A second IFBT test (IFBT Test No. 14) was performed using the MIL-F-46162B
referee grade diesel fuel containing I-percent sulfur. As with the earlier test, the
fuel fouled the injector in a period of 18 hours. The fouled injector dribbled fuel
29
~ -4.
r-mu'rrM InTR r-~-~-5-J--
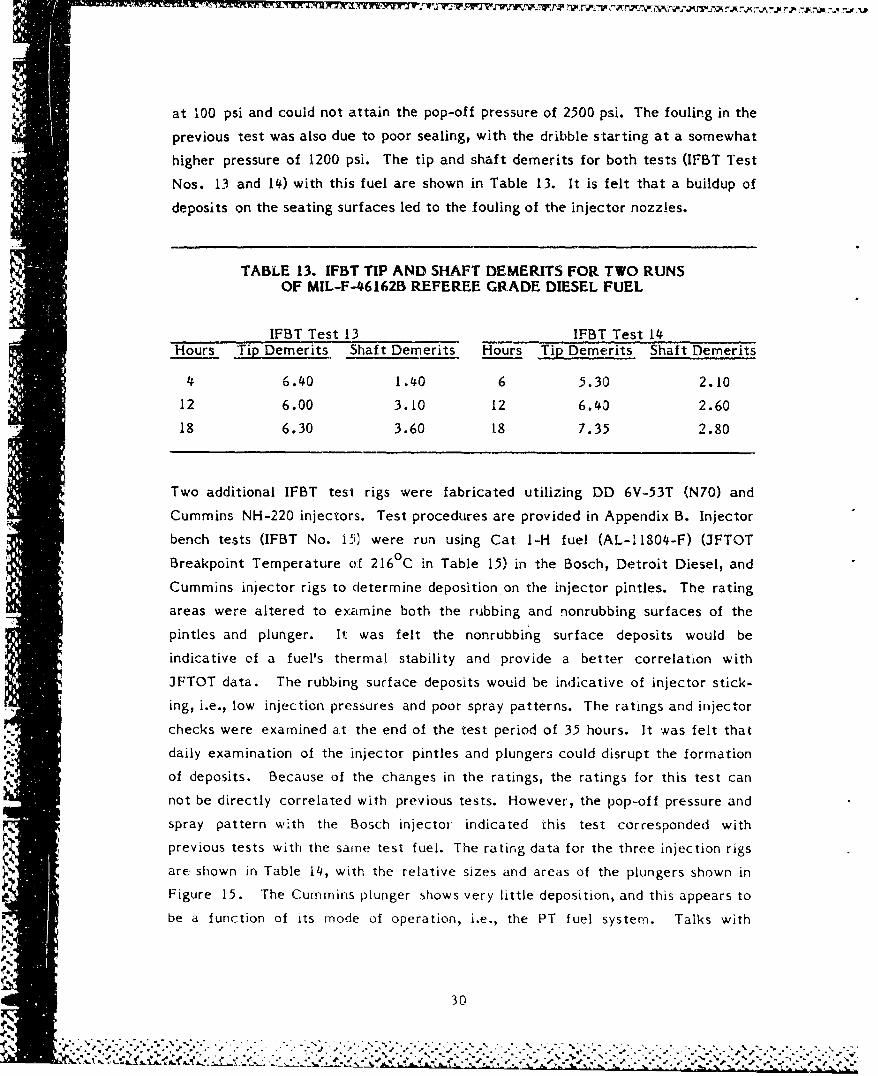
at 100 psi and could not attain the pop-off pressure of 2500 psi. The fouling in the
previous test was also due to poor sealing, with the dribble starting at a somewhat
higher pressure of 1200 psi. The tip and shaft demerits for both tests (IFBT Test
Nos. 13 and 14) with this fuel are shown in Table 13. It is felt that a buildup of
deposits on the seating surfaces led to the fouling of the injector nozzles.
TABLE 13. IFBT TIP AND SHAFT DEMERITS FOR TWO RUNSOF MIL-F-46162B REFEREE GRADE DIESEL FUEL
IFBT Test 13 IFBT Test 14Hours Tip Demerits Shaft Demerits Hours Tip Demerits Shaft Demerits
4 6.40 1.40 6 5.3') 2.10
12 6.00 3.10 12 6.40 2.60
"18 6.30 3.60 18 7.35 2.80
Two additional IFBT test rigs were fabricated utilizing DD 6V-53T (N70) and
Cummins NH-220 injectors. Test procedures are provided in Appendix B. Injector
bench tests (IFBT No. 15) were run using Cat I-H fuel (AL-11804-F) (JFTOT
Breakpoint Temperature of 216 0 C in Table 15) in the Bosch, Detroit Diesel, and
Cummins injector rigs to determine deposition on the injector pintles. The rating
areas were altered to examine both the rubbing and nonrubbing surfaces of the
pintles and plunger. It was felt the nonrubbing surface deposits would be
indicative of a fuel's thermal stability and provide a better correlation with
JFTOT data. The rubbing surface deposits would be indicative of injector stick-
ing, i.e., low injection pressures and poor spray patterns. The ratings and injector
checks were examined at the end of the test period of 35 hours. It was felt that
daily examination of the injector pintles and plungers could disrupt the formation
of deposits. Because of the changes in the ratings, the ratings for this test can
not be directly correlated with previous tests. However, the pop-off pressure and
spray pattern with the Bosch injector indicated this test corresponded with
previous tests with the same test fuel. The rating data for the three injection rigsare shown in Table 14, with the relative sizes and areas of the plungers shown in
Figure 15. The Cummins plunger shows very little deposition, and this appears to
be a function of its mode of operation, i.e., the PT fuel system. Talks with
30
<- , .-.-%,,--
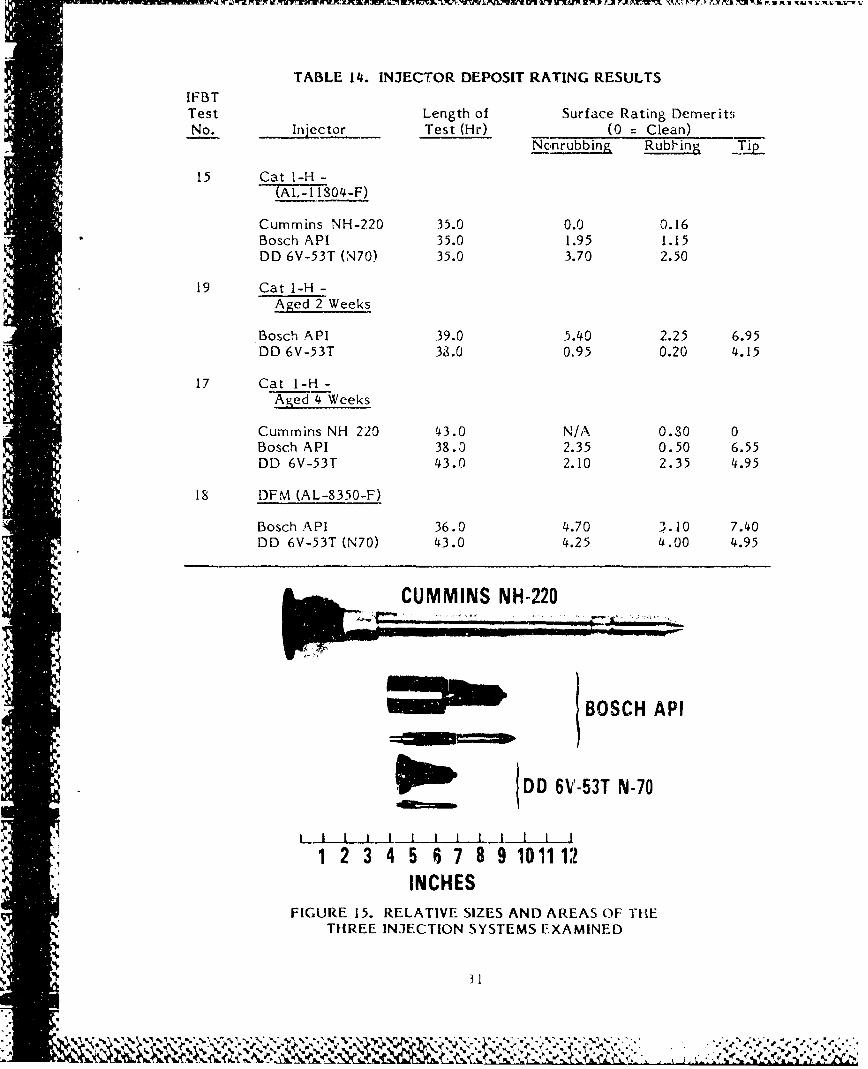
TABLE 14. INJECTOR DEPOSIT RATING RESULTSIFBTTest Length of Surface Rating DemeritsNo. Injector Test (Hr) (0 = Clean)
Nonrubbing Rubbing
15 CatlI-H-5- (AL-I 1804-F)
Cummins NH-220 35.0 0.0 0.16Bosch API 35.0 1.95 1.15DD 6V-53T (N70) 35.0 3.70 2.50
19 Cat I-H -Aged 2 Weeks
Bosch API 39.0 5.40 2.25 6.95DD 6V-53T 33.0 0.95 0.20 4.15
17 Cat I-H-Aged 4 Weeks
Cummins NH 220 43.0 N/A 0.80 0Bosch API 38.0 2.35 0.50 6.55DD 6V-53T 43.0 2.10 2.35 4.95
18 DFM (AL-8350-F)
Bosch API 36.0 4.70 3.10 7.40DD 6V-53T (N70) 43.0 4.25 4.00 4.95
CUMMINS NH-220
111111 BOSCH API
DD 6V-53T N-70tL. i.iL....I I I I I,, IJ.I I I...
1 2 3 4 5 6 7 8 9101112INCHES
FIGURE 15. RELATIVE SIZES AND AREAS OF THE-j THREE INJECTION SYSTEMS EXAMINED
3 1
personnel of Cummins Engine Co. indicate injector coking occurs primarily at
motoring conditions, in which the plunger compresses mostly air, and tip
temperatures have been measured to be as high as 871°C (160 0°F). With the PT
system, fuel flow is never shut off. Even at motoring conditions, a small amount of
fuel is used for cooling. The fuel, if thermally unstable, combined with cylinder
gases (air, unscavenged exhaust, lubricant) blowing up into the nozzle, tip, can
cause injector coking. The DD 6V-53T nozzle appears to be the most severe. The
nozzle stresses the fuel by circulating it for cooling, which could account for the
increased pintle deposition.
In addition to the injector deposit rating results for Cat I-H in Table 14, data are
also provided for Cat I-H aged at 800C for 2 and 4 weeks and a high-sulfur DFM.Accelerated stability test results for these four fuels are summarized in Table 15.
The results of the 2-week aged Cat I-H demerit ratings appear to have been
influenced by nonconformal operating temperatures. The injector effluent tem-
peratures were 23.C. higher for the Bosch API rig and 29 0 C lower for the Detroit
Diesel rig than the other test fuels.
The 4-week aged Cat I-tt fuel (AL-g1804-F) was examined in each of the three
Iinjection rigs. The deposit rating on the Cummins plunger was similar to the other
test fuels examined. The Detroit Diesel 6V-53T unit injector revealed deposit
ratings similar to the unaged Cat I-H test; however, the spray pattern was not
fully developed. The Bosch API pintle also revealed ratings similar to the unaged
Cat I-H fuel.
"The other test completed was with a high-sulfur DFM (AL-8350-F). The fuel was
rnot examined in the Cummins injector, because the Jeposition mechanisms could
not be duplicated with the Cummins bench test rig. Both the Bosch API arid
Detroit Diesel 6V-53 injector pintles revealed deposit ratings heavier than the base
Cat I-H fuel.
Injector fouling bench tests were run on a middle distillate fuel derived from shale
(FL-410-F) using the Bosch API and the Detroit Diesel 6V-53 injector rigs. The
deposit rating test results are shown in Table 16. The shale-derived fuel was
obtained from the Department of Energy and had been prepared by Sun Tech, Inc.
from a feedstock that was a partially hydrotreated Geokinetic. crude shale oil
32
_ 4 . . . I
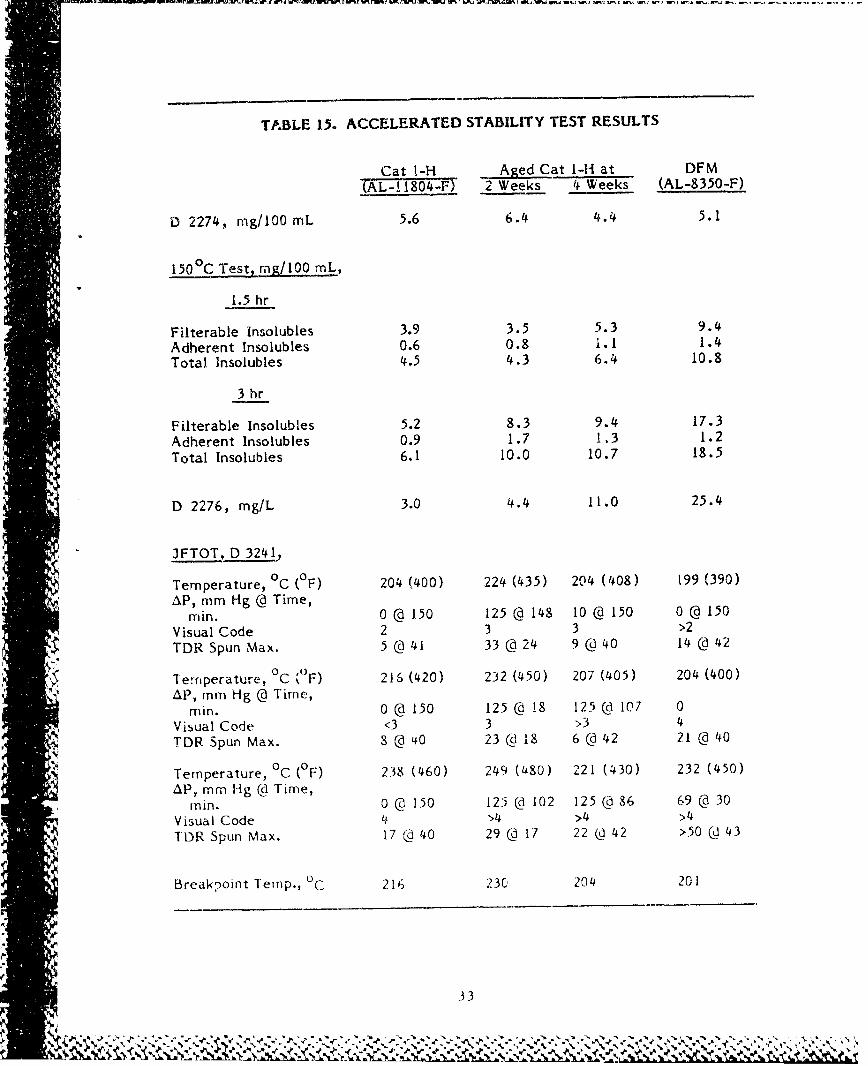
TABLE 15. ACCELERATED STABILITY TEST RESULTS
Cat I-H Aged Cat 1-H at DFM(AL-1I804-F) 2 Weeks 4 Weeks (AL-8350-F)
D 2274, mg/100 mL 5.6 6.4 4.4 5.1
150 °C Test rng/100 mrL,
1.5 hr
Filterable Insolubles 3.9 3.5 5.3 9.4
Adherent Insolubles 0.6 0.8 1L.1 1.4
Total Insolubles 4.5 4.3 6.4 10.8
3 hr
Filterable Insolubles 5.2 8.3 9.4 17.3
Adherent Insolubles 0.9 1.7 1.3 1.2
Total Insolubles 6.1 10.0 10.7 18.5
D 2276, mg/L 3.0 4.4 11.0 25.4
JFTOT. D 3241,
Temperature, 0 C (0 F) 204 (400) 224 (435) 204 (408) 199 (390)AP, mm Hg @ Time,
min. 0 @ 150 125 @ 148 10 @ 150 0 @ 150
Visual Code 2 3 3 >2
TDR Spun Max. 5 @ 41 33 @ 24 9@40 14@42
'errperature, 0C (0 F) 216 (420) 232 (450) 207 (405) 204 (400)AP, mm Hg @ Time,
min. 0 @ 150 125 @ 18 125 @ 107 0
Visual Code <3 3 >3 4TDR Spun Max. 8 @ 40 23 @ 18 6 @ 42 21 @ 40
Temperature, °C (OF) 238 (460) 249 (480) 221 (430) 232 (450)Pmm Hg (d Time,mP,. 0 @ 150 125 @ 102 125 @ 86 69 @ 30
Visual Code 4 >4 >4 >4TDR Spun Max. 17 d 40 29 (d 17 22 @ 42 >50 d 43
Breakpoint Temp., 0 c 216 23C 204 201
.33
7ý- eN:kL 0'. o t
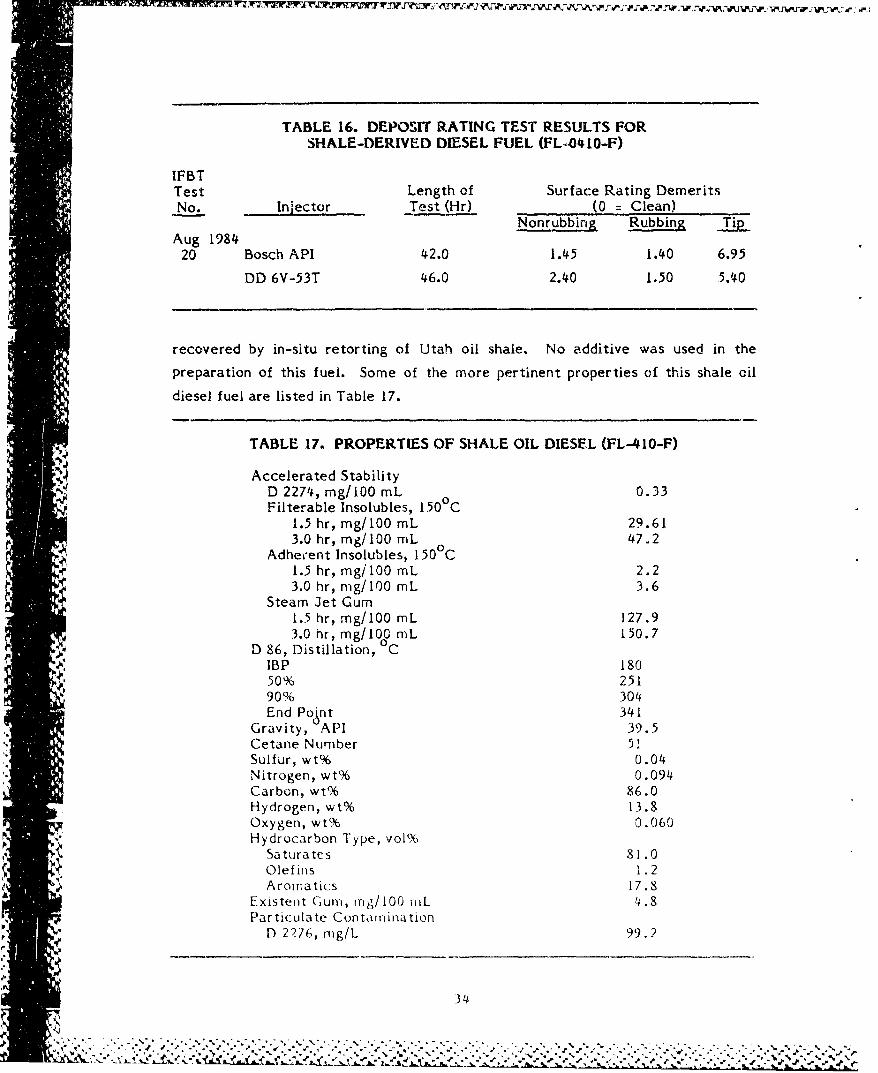
TABLE 16. DEPOSIT RATING TEST RESULTS FORSHALE-DERIVED DIESEL FUEL (FL04 10-F)
"IFBTTest Length of Surface Rating DemeritsNo. Injector Test (Hr) (0 = Clean)
Nonrubbing Rubbing lipAug 1984
20 Bosch API 42.0 1.45 1.40 6.95
DD 6V-53T 46.0 2.40 1.50 5.40
recovered by in-situ retorting of Utah oil shale. No additive was used in the
preparation of this fuel. Some of the more pertinent properties of this shale oil
diesel fuel are listed in Table 17.
TABLE 17. PROPERTIES OF SHALE OIL DIESEL (FL-410-F)
Accelerated StabilityD 2274, mg/100 mL 0.33Filterable Insolubles, 150 C
1.5 hr, mg/100 mL 29.613.0 hr, mg/lO0 mL 47.2
1.5 hr, mgil00 mL 2.23.0 hr, rng/100 mL 3.6
Steam Jet Gum1.5 hr, mg/lO0 mL 127.93.0 hr, mg/10OG rL 150.7
D 86, Distillation, CIBP 18050% 25190% 304End PoPnt 341
Gravity, API 39.5Cetane Number 51Sulfur, wt% 0.04Nitrogen, wt% 0.094Carbon, wt% 86.0Hydrogen, wt% 13.8Oxygen, wt% 0.060Hydrocarbon Type, vol%
Saturates 81.0Olef ins 1.2Aromatics 17.8
Existent Gum, mng/100 mL 4.8Particulate Contamination
D 2276, mg/L 99.2
34
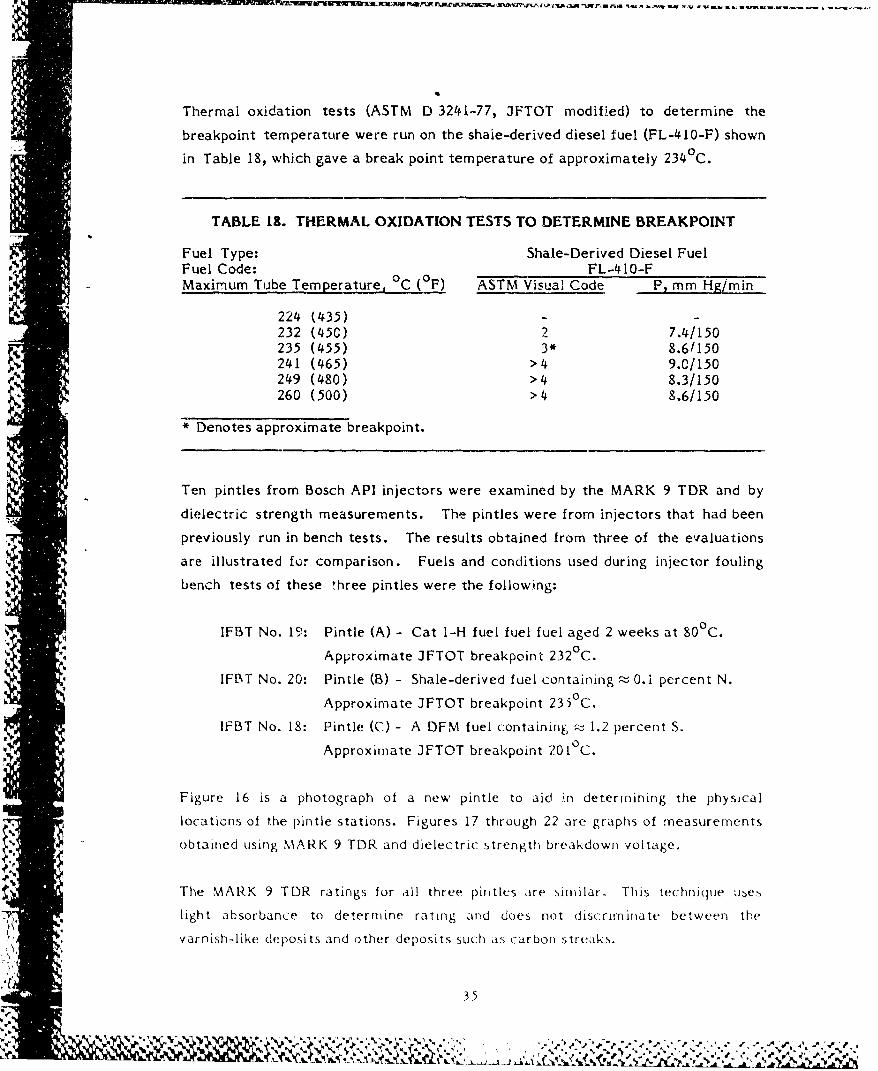
Thermal oxidation tests (ASTM D 3241-77, JFTOT modified) to determine the
breakpoint temperature were run on the shale-derived diesel fuel (FL-410-F) shown
in Table 18, which gave a break point temperature of approximately 2340C.
TABLE 18. THERMAL OXIDATION TESTS TO DETERMINE BREAKPOINT
Fuel Type: Shale-Derived Diesel FuelFuel Code: FL-410-FMaximum Tube Temperature, 0 C ( 0 F) ASTM Visual Code P, mm Hg/min
224 (435) - -232 (45C) 2 7.4/150235 (455) 3* 8.6/150241 (465) >4 9.0/150249 (480) >4 8.3/150260 (500) >4 8.6/150
* Denotes approximate breakpoint.
Ten pintles from Bosch API injectors were examined by the MARK 9 TDR and by
dielectric strength measurements. The pintles were from injectors that had been
previously run in bench tests. The results obtained from three of the evaluations
are illustrated for comparison. Fuels and conditions used during injector fouling
bench tests of these three pintles were the following:
IFBT No. 19: Pintle (A) - Cat I-H fuel fuel fuel aged 2 weeks at 80°C.
Approximate JFTOT breakpoint 232 C.IFBT No. 20: Pintle (B) - Shale-derived fuel containing z 0.i percent N.
Approximate JFTOT breakpoint 235 0 C.
IFBT No. 18: Pintle (C) - A DFM fuel containinF, 1.2 percent S.
Approximate JFTOT breakpoint 201 C.
Figure 16 is a photograph of a new pintle to aid in determining the physical
locations of the pintle stations. Figures 17 through 22 are graphs of measurements
obtained using MARK 9 TDR and dielectric strength breakdown voltage.
The MARK 9 TDR ratings for all three pintics are similar. This technique use.
-, light absorbance to determine rating and does not discriminate between the
varnish-like deposits and other deposits such as carbon streaks.
35
... .. A " " "" - " "- % "'S'' ""- -
$tLei
z
U,
z'I P1 1U
LOL
0,
50
40
3 30N-
<20
10
0 o ----- I35 40 45 50 55 60 65 70 75
PINTLE STATION, MILLIMETERS
FIGURE 17. TDR RATING OF PINTLE A
"350
,.- 300
0>
>250
Z 200
I--a ~150uJ
_J
50
& A
35• 40 45 50 55 60 65 A1 75PiNTLE SlArION, MIILIMETERS
FIGURE 18. DIELECTRIC STRENGTH OF PINTILE A
, W
50
40
0 300-
< 20
10
35 40 45 50 55 60 65 70 75PINTLE STATION, MILLIMETERS
FIGURE 19. TDR RATING OF PINTLE B
350-
u300k--
0
loI-
0035 40 45 50 55 60 65 70 75
PINTLE STATION, MILLIMETERS
FIGURE 20. DIELECTRIC STRENGTH OF PINT LE B
I.L
"I''r
38
"or-
i-'-
50 r-'-"
40
0 30
0-i lie,H
S20
10
035 40 45 50 55 60 65 70 75
PINTLE STATION, MILLIMETERS
FIGURE 21. TDR RATING OF PINTLE C
350
300-J
0> 250
z 200Li
U 150
C-)
u- 100Lu
550
35 40 45 50 55 60 65 70 75
PINTLE STATION, MILLIMETERS
FIGURE 22. DIELECTRIC STRENGTH OF PINTLE C
39
Dielectric strength breakdown voltage testing is more selective in that the
detected deposits must be of an electrically insulating nature such as the varnish-
like deposits which are formed on JFTOT tubes. The dielectric testing of these
pintles revealed that there are distinct differences between the pintles when
evaluated for this type of deposit. Pintles A and B have only a slight buildup of
electrically insulating deposits near the tip, while Pintle C has a very pronounced
deposit near the tip area.
Navy Base Test Fuel--To evaluate the thermal oxidative stability of the Navy base
test fuel No. I (AL-13279-F), three approaches were used, CLR-D hot engine test,
injector fouling bench test, and jet fuel thermal oxidation test (modified for diesel
iuel testing).
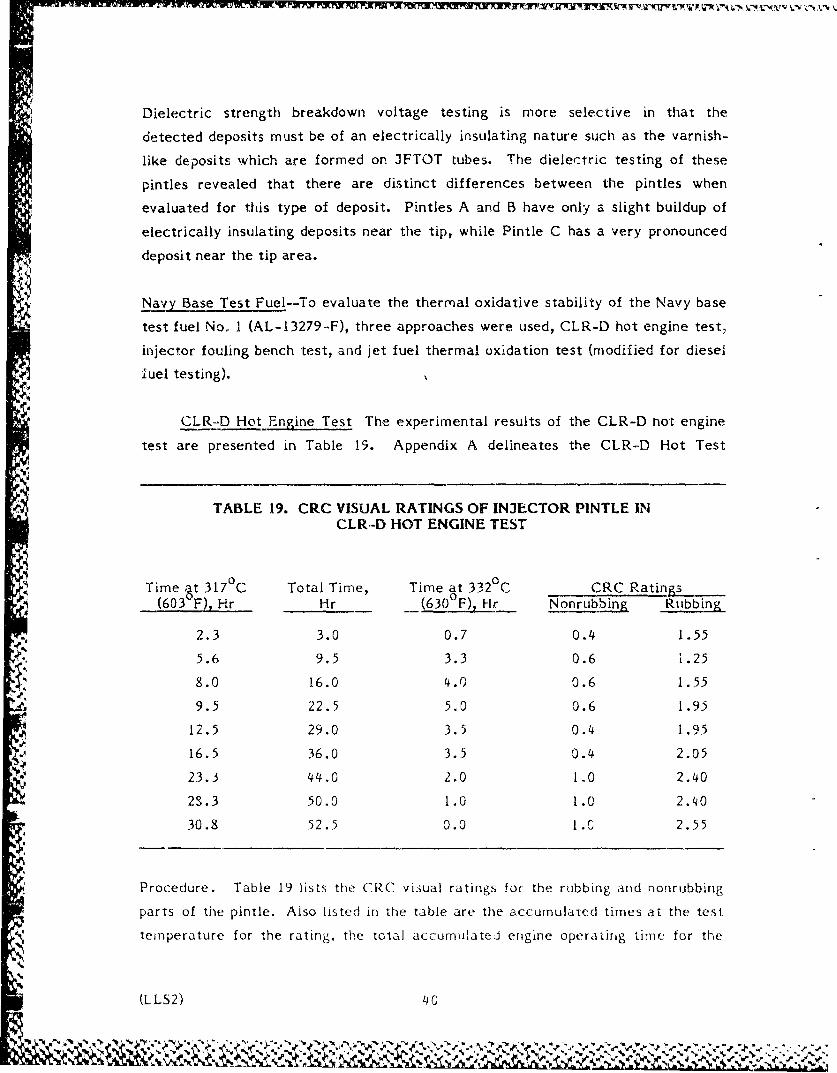
CLR-D Hot Engine Test The experimental results of the CLR-D not engine
test are presented in Table 19. Appendix A delineates the CLR-D Hot Test
TABLE 19. CRC VISUAL RATINGS OF INJECTOR PINTLE INCLR-D HOT ENGINE TEST
Time ,t 317 0 C Total Time, Time at 332 0 C CRC Ratings(603 F), Hr Hr (630°F), Hr Nonrubbin Rtbbing
2.3 3.0 0.7 0.4 1.55
5.6 9.5 3.3 0.6 1.25
8.0 16.0 4.0 0.6 1.55
9.5 22.5 5.0 0.6 1.95
12.5 29.0 3.5 0.4 1.95
16.5 36.0 3.5 0.4 2.05
23.3 44.0 2.0 1.0 2.40
2S.3 50.0 1.0 1.0 2.40
30.8 52.5 0.0 I.C 2.55
Procedure. Table 19 lists the CRC visual ratings for the rubbing and nonrubbing
parts of the pintle. Also listed in the table are the accumulated times at the test
temperature for the rating, the total accumulate. engine operating time for the
(LLS2) 40
' " • • z•'. ••- .••'r. • ' " • • : .. _ -- "' % 1 • • • ' •. • ' • • _•' . • • :, • • • • -W N "
rating, and the time to reach the desired average liner temperature of 332 C
(6300F). During the engine warm-up periods, the average liner temperature
rapidly reached 260 0 C (500°F) (within 30 miputes) so that the average temperature
ovar the total test duratiorn was in excess of 260°C (500 0 F).
Engine failure occurred at a total accumulated test time of 52.5 hours. This
corresponded to an accumulated time at 332uC (630°F) of 30.8 hours. The engine
failure occurred due to excessive deposits in the ring belt area of the piston and
the resulting sticking of the rings.
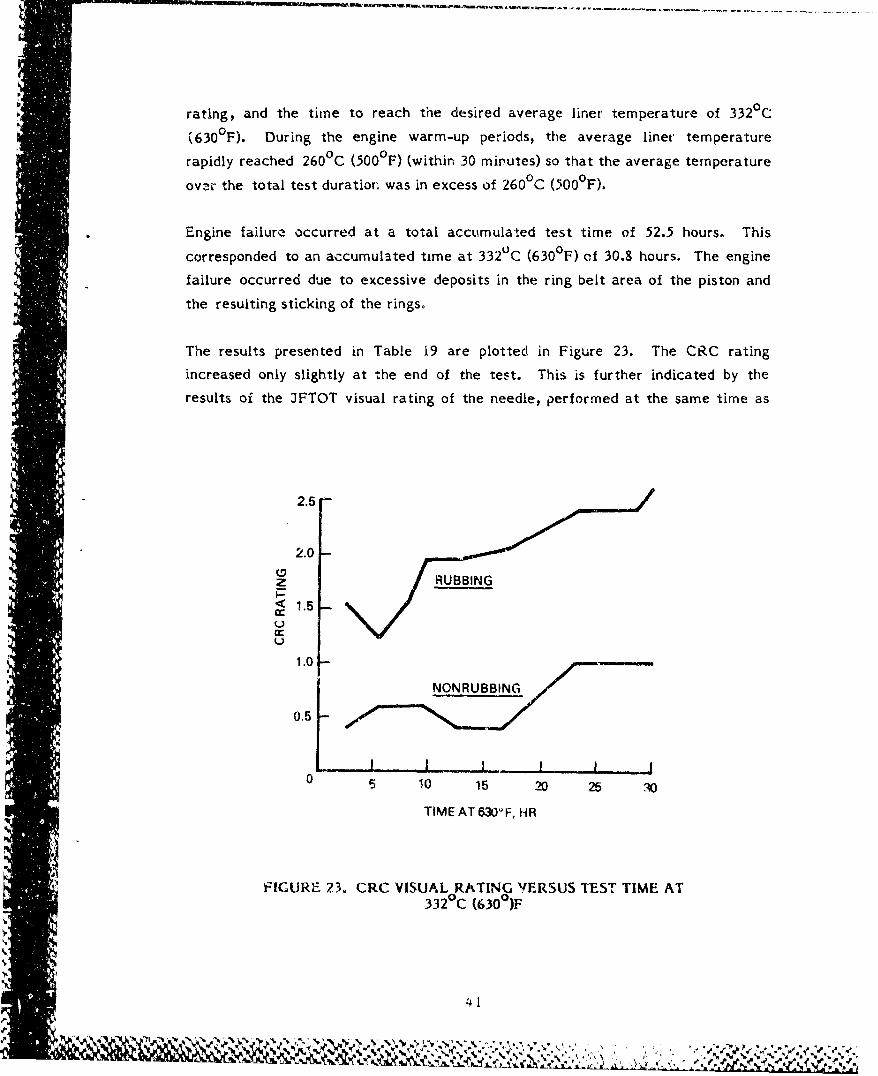
The results presented in Table 19 are plotted in Figure 23. The CRC rating
increased only slightly at the end of the test. This is further indicated by the
results oi the JFTOT visual rating of the needle, performed at the same time as
2.5
2.0
Sz aRUBBING
< 1.5
U
1.0 -
NONRUBBING,
0.5 - 4
r5 , 10 15 20 25
*, TIME AT 630' F, HR
FIGURE, 23. CRC VISUAL RATING VERSUS TEST TIME AT332 C (6300)F
4 1
'a,
.• I
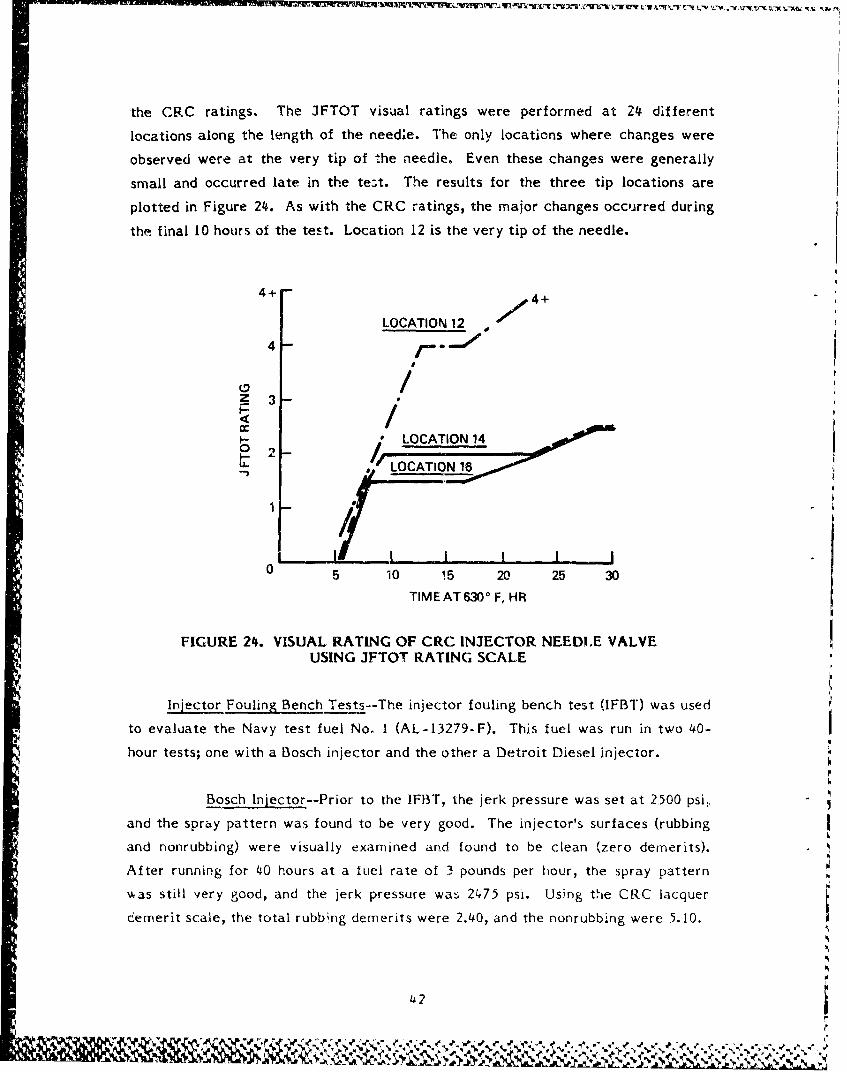
the CRC ratings. The JFTOT visual ratings were performed at 24 different
locations along the length of the needle. The only locations where changes were
observed were at the very tip of the needle. Even these changes were generally
small and occurred late in the test. The results for the three tip locations are
plotted in Figure 24. As with the CRC ratings, the major changes occurred during
the final 10 hours of the test. Location 12 is the very tip of the needle.
4+ -4+
LOCATION 12
4
4-
0 /4 -33 -
<I
I- -~ LOCATION 14
*uLOCATION 16
5 10 15 20 25 30
TIME AT 6300 F, HR
FIGURE 24. VISUAL RATING OF CRC INJECTOR NEEDLE VALVEUSING JFTOT RATING SCALE
Injector Fouling Bench Tests--The injector fouling bench test (IFBT) was used
to evaluate the Navy test fuel No. I (AL-13279-F). This fuel was run in two 40-
hour tests; one with a Bosch injector and the other a Detroit Diesel injector.
Bosch Injector--Prior to the IFBT, the jerk pressure was set at 2500 psi,
and the spray pattern was found to be very good. The injector's surfaces (rubbing
and nonrubbing) were visually examined and found to be clean (zero demerits).
After running for 40 hours at a fuel rate of 3 pounds per hour, the spray pattern
\kas still very good, and the jerk pressure was 2475 psi. Using the CRC lacquer
Idemerit scale, the total rubbing demerits were 2.40, and the nonrubbing were 5.10.
'-•
%p
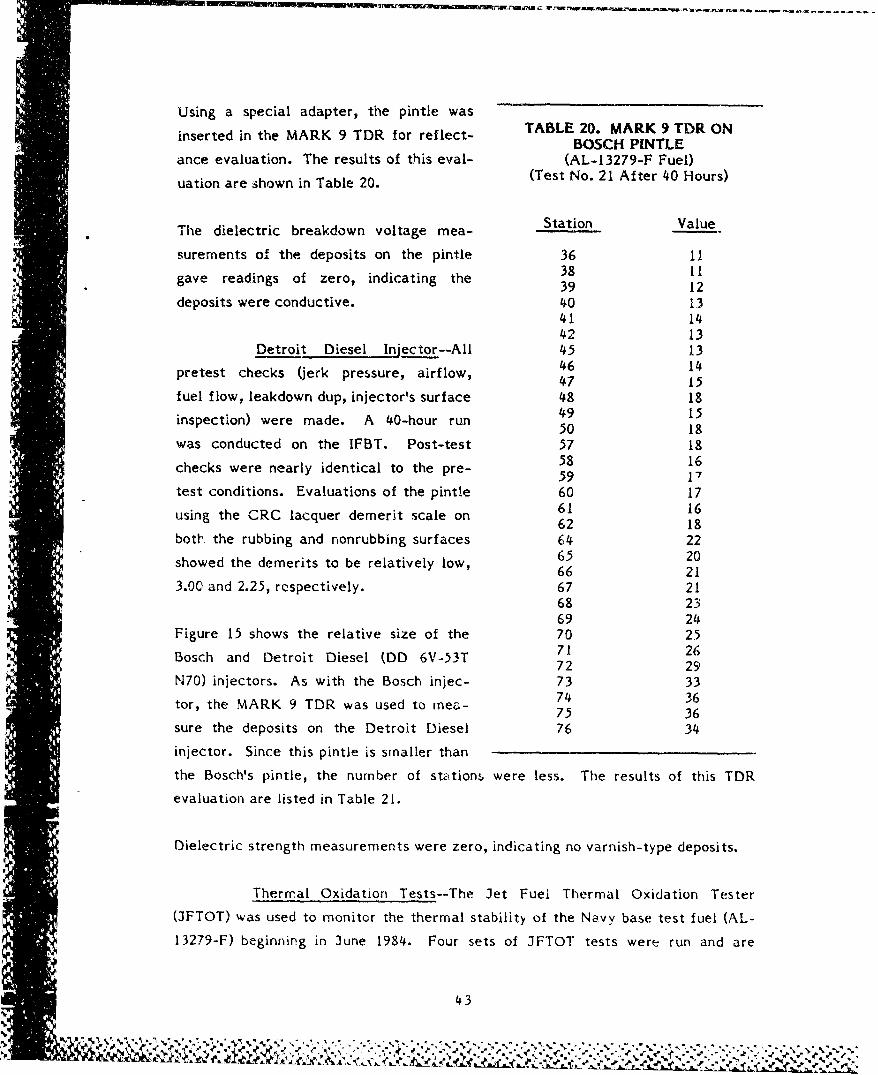
Using a special adapter, the pintle wasinserted in the MARK 9 TDR for reflect- TABLE 20. MARK 9 TDR ONiedn e A 9 RoreBOSCH PINTLE
ance evaluation. The results of this eval- (AL-13279-F Fuel)
uation are shown in Table 20. (Test No. 21 After 40 Hours)
The dielectric breakdown voltage mea- Station Value
surements of the deposits on the pintle 36 11
gave readings of zero, indicating the 38 1239 12
deposits were conductive. 40 1341 1442 13
Detroit Diesel Injector--All 45 13
pretest checks (jerk pressure, airflow, 46 1547 15
fuel flow, leakdown dup, injector's surface 48 18
inspection) were made. A 40-hour run 49 1550 18
was conducted on the IFBT. Post-test 57 18
checks were nearly identical to the pre- 58 1659 17
test conditions. Evaluations of the pintle 60 1761 16
using the CRC lacquer demerit scale on 62 18
both the rubbing and nonrubbing surfaces 64 2265 20showed the demerits to be relatively low, 66 21
3.00 and 2.25, respectively. 67 2168 2369 24
Figure 15 shows the relative size of the 70 25i ~712(Bosch and Detroit Diesel (DD 6V-53T 72 26
• ,72 29N70) injectors. As with the Bosch injec- 73 33
tor, the MARK 9 TDR was used to mea- 74 3675 36
sure the deposits on the Detroit Diesel 76 34
injector. Since this pintle is smaller than
the Bosch's pintle, the number of station! were less. The results of this TDR
evaluation are listed in Table 21.
Dielectric strength measurements were zero, indicating no varnish-type deposits.
Thermal Oxidation Tests--The Jet Fuel Thermal Oxidation Tester
(JFTOT) was used to monitor the thermal stability of the Navy base test fuel (AL-
13279-F) beginning in June 1984. Four sets of JFTOT tests were run and are
43
0% A
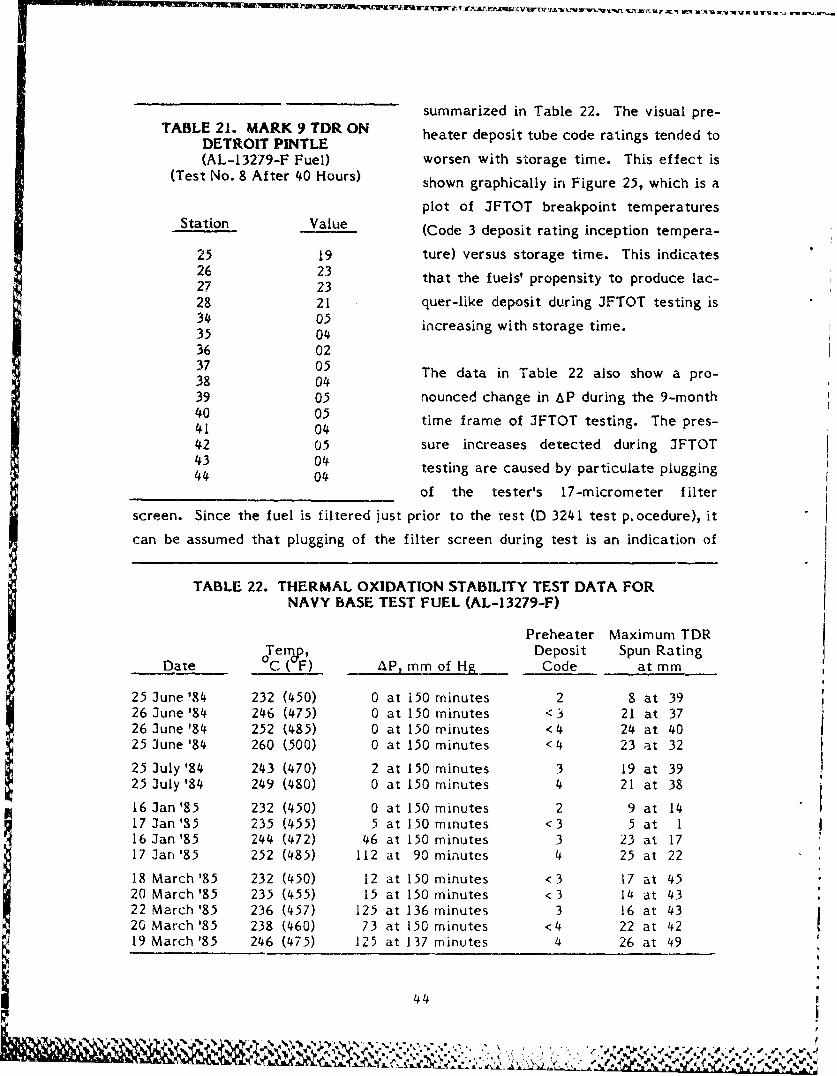
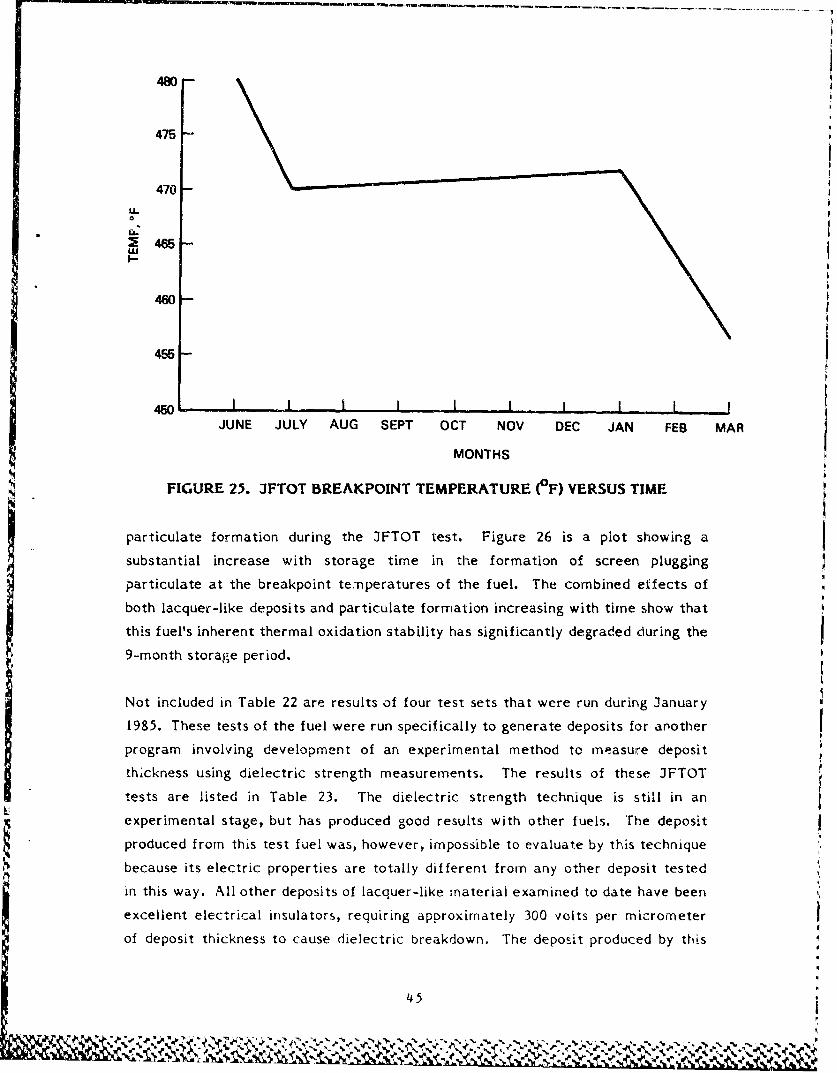
summarized in Table 22. The visual pre-TABLE 21. MARK 9 TDR ON heater deposit tube code ratings tended to
DETROIT PINTLE(AL-13279-F Fuel) worsen with storage time. This effect is
(Test No. 8 After 40 Hours) shown graphically in Figure 25, which is a
plot of JFTOT breakpoint temperaturesStation Value (Code 3 deposit rating inception tempera-
25 19 ture) versus storage time. This indicates26 23 that the fuels' propensity to produce lac-27 2328 21 quer-like deposit during JFTOT testing is.34 05 increasing with storage time.35 0436 0237 05 The data in Table 22 also show a pro-38 0439 05 nounced change in AP during the 9-month40 05 time frame of JFTOT testing. The pres-41 0442 05 sure increases detected during JFTOT43 04 testing are caused by particulate plugging44 04 of the tester's 17-micrometer filter
screen. Since the fuel is filtered just prior to the test (D 3241 test pocedure), it
can be assumed that plugging of the filter screen during test is an indication of
TABLE 22. THERMAL OXIDATION STABILITY TEST DATA FORNAVY BASE TEST FUEL (AL-13279-F)
Preheater Maximum TDRTeiy, Deposit Spun Rating
Date C (OF) AP, mm of Hg Code at mm
25 June '84 232 (450) 0 at i50 minutes 2 8 at 3926 June '84 246 (475) 0 at 150 minutes <3 21 at 3726 June '84 252 (485) 0 at 150 minutes <4 24 at 4025 June '84 260 (500) 0 at 150 minutes <4 23 at 3225 July '84 243 (470) 2 at 150 minutes 3 19 at 3925 July '84 249 (480) 0 at 150 minutes 4 21 at 38
16 Jan '85 232 (450) 0 at 150 minutes 2 9 at 1417 Jan '35 235 (455) 5 at 150 minutes <3 5 at I16 Jan '85 244 (472) 46 at 150 minutes 3 23 at 1717 Jan '85 252 (485) 112 at 90 minutes 4 25 at 22
18 March '85 232 (450) 12 at 150 minutes <3 17 at 4520 March '85 235 (455) 15 at 150 minutes <3 14 at 4322 March '85 236 (457) 125 at 136 minutes 3 16 at 4320 March '85 238 (460) 73 at 150 minutes <4 22 at 4219 March '85 246 (47.5) 125 at 137 minutes 4 26 at 49
44
V -9%v,,.. . *,.. . . .. , - , .. , .- , , ,. .
480
475
470aa
~465
460
455
450o I I I i i I IJUNE JULY AUG SEPT OCT NOV DEC JAN FEB MAR
MONTHS
FIGURE 25. JFTOT BREAKPOINT TEMPERATURE (OF) VERSUS TIME
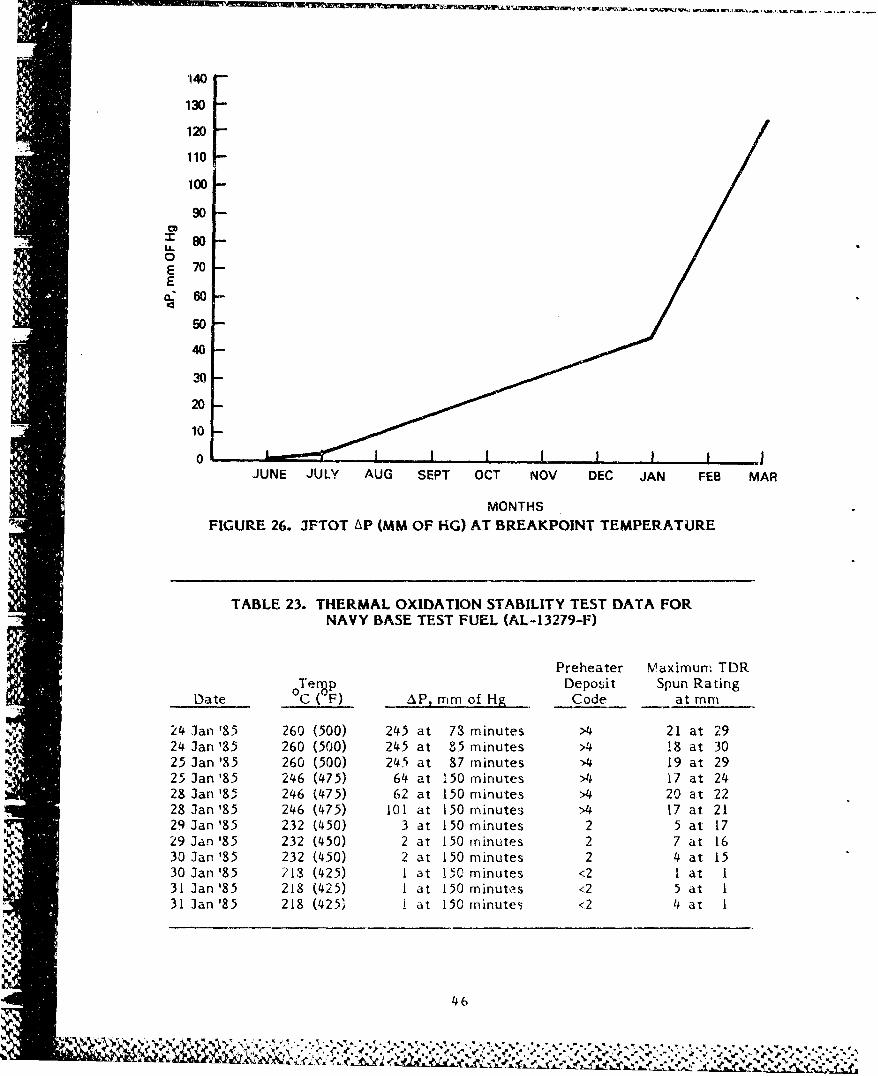
particulate formation during the JFTOT test. Figure 26 is a plot showing a
substantial increase with storage time in the formation of screen plugging
particulate at the breakpoint temperatures of the fuel. The combined effects of
both lacquer-like deposits and particulate formation increasing with time show that
this fuel's inherent thermal oxidation stability has significantly degraded during the
9-month storagle period.
Not included in Table 22 are results of four test sets that were run during January
1985. These tests of the fuel were run specifically to generate deposits for another
program involving development of an experimental method to measure deposit
thickness using dielectric strength measurements. The results of these JFTOT
tests are listed in Table 23. The dielectric strength technique is still in an
experimental stage, but has produced good results with other fuels. The deposit
produced from this test fuel was, however, impossible to evaluate by this technique
because its electric properties are totally different from any other deposit tested
in this way. All other deposits of lacquer-like materiai examined to date have been
excellent electrical insulators, requiring approximately 300 volts per micrometer
of deposit thickness to cause dielectric breakdown. The deposit produced by this
45
;Lr
'140
'130 -
120D
110i-
100
90
80DU-0E 70Eq:60
50 -
20-
10
0 1 - IIII - IIII ---JUNE JULY AUG SEPT OCT NOV DEC JAN FEB MAR
MONTHSFIGURE 26. 3FTOT AP (MM OF KG) AT BREAKPOINT TEMPERATURE
TABLE 23. THERMAL OXIDATION STABILITY TEST DATA FORNAVY BASE TEST FUEL (AL-13279-F)
Preheater Maximum TDR0 Temp Deposit Spun Rating
Date C (OF) AP, mm of Hg Code at mm
24 Jan 85 260 (500) 245 at 78 minutes >4 21 at 2924 Jan '85 260 (500) 245 at 85 minutes >4 18 at 3025 Jan '85 260 (500) 245 at 87 minutes >4 19 at 2925 Jan'85 246 (475) 64 at 150 minutes >4 17 at 2428 Jan '85 246 (475) 62 at 150 minutes >4 20 at 2228 Jan '85 246 (475) 101 at i50 minutes >4 17 at 2129 Jan '85 232 (450) 3 at 150 minutes 2 5 at 1729 Jan '85 232 (450) 2 at 150 minutes 2 7 at 1630 Jan 185 232 (450) 2 at 150 minutes 2 4 at 1530 Jan '85 213 (425) 1 at .150 minutes <2 I at 131 Jan'85 218 (425) 1 at 150 minutes <2 5 at I31 Jan'85 218 (425) 1 at 150 minutes <2 4 at 1
46
fuel is, however, somewhat electrically conductive. Auger spectrometer evalua-
tion is being performed to determine which constituent of the deposit is degrading
its insula!-ing properties. The deposit also has an unusual visual appearance when
examined in the lightbox used for JFTOT visual evaluation. The deposit showed a
blue coloration with a powdery material on the surface which was removed by
lightly rubbing the surface. Work is continuing within the dielectric test develop-
ment program to determine the cause of the unusual appearance.
The results from both the injector fouling bench test and the CLR-D hot engine
test indicate that the Navy Base Test Fuel (AL-13279-F) is stable to thermal
oxidation, since all the various rating methods show relatively low amounts of the
lacquer-like deposit formation.
Results from the 3et Fuel Thermal Oxidation Tester show that the fuels' thermal
stability decreased during the sLorage period since breakpoint temperature de-
creased over the 9-month period. The fuels' instability may be more pronounced
than was indicated by the above evaluations since the ratings are dependent on
lacquer-like deposit foimation and the test results are not necessarily affected by
particulate formation. The JFTOT tests did detect significant pressure rise from
particulate plugging of the filter screen during the later months of storage, and It
must be concluded that the thermal instability of this fuel manifests itself as both
lacquer-like deposit formation and particulate formation.
Summary of IFBT Development--In summary, injector nozzle rating methodology
has been developed for the IFBT Bosch and Detroit Diesel injectors. The Bosch
injectors are rated for pop--off pressure before and after test, and nozzle hole flow
rating before and after test. The DD unit injectors are rated for injector pressure,
fuel flow rate, leak down, and nozzle hole flow rating, all before and after test.
The nozzle flow rating apparatus constructed was based or. ISO standard 4010-
1977(E).
The injector fouling bench test methodology needs to be expanded to cover higher
temperatires and should be correlated with engine tests covering a wider tempera-
ture range •han did the CLR-D hot engine test. An air-cooled zest engine now in
operation for lubricant development meets this requiremant. The injectors in the
47
7-.
% *1 P
air-cooled engine are very similar in appearance to that of the CLR-D. A broader
fuel matrix covering very unstable diesel fuel (including fluid catalytically cracked
light cycle oil) should be employed to provide a large data matrix capable of being
correlated to JFTOT-type test results employing not only visual rating methods but
more importantly, both TDR Spun Rating and dielectric strength breakdown
voltage for quantitation. Fuel test flow rate, temperature, test surface
metallurgy, and fuel additive effects must be included in this evaluation.
IV. D 3241 JFTOT APPLICATION TO DIESEL FUEL
A. Measuring Thickness and Volume of Varnish-Like Fuel Deposits Via DielectricStrength
1. Background
Many approaches have been evaluated for measurement of thermal oxidation-
derived varnish-like fuel deposits. The JFTOT (ASTM D 3241) visual rating, using a
lightbox with color standards, is the most commonly used method. While this visual
rating method is suitable for go/no-go evaluation of fuel deposits, in most cases, it
does have several inherent limitations. The rating scale has a very narrow dynamic
range since a deposit can only be rated into one of six categories (0, 1, 2, 3, 4, 4+).
The results are somewhat subjective, since each operator assigns the rating based
on his individual perception of "best match" to the color standards. Abnormal and
peacock (rainbow colored) deposits are rated as such. Color is not necessarily a
good guide to deposit quantitation since a thin dark-colored deposit could be rated
the same as a thicker but lighter colored deposit. Deposits with a matte surface
cai, also appear darker than glossy surface deposits when compared visually. The
greatest limitation of the visual rating is its inability to define actual thickness,
volume, or mass of the deposit. Without at least one of these pararneteis being
defined, it is almost impossible to determine activation energies or reaction rate
information. A plot of reaction rate and activation energy would, if obtainable,
allow much better jadgments to be made as to the fuel's thermal-depositing
potential or suitability for a particular application. This information would also be
invaluable in studies of reaction mechanisms within the research !aboratory
environment.
43
To overcome some of the limitations in visual rating, a photo-optical measuring
device known as the MARK 8A and MARK 9 Tube Deposits Rater (TDR) was
produced by Alcor. The TDR eliminates the problem of operator subjectivity in
color matching to the standards, and it allows a much wider rating scale of 0 to 50
measurement units. The TDR does not overcome any of the other problems
common to visual rating such as the effects of deposit color or texture, and the
TDR is incapable of directly producing deposit thickness, volume, or mass data.
In a 1973 report, it was noted that the light reflectance method for rating tube
deposits was found to be more precise than the visual method.(.0) Although thereis a general relationship between the two rating methods, they are not exactly
interchangeable. The visual rating method and the Alcor MARK 8A Tube Deposit
Rater (TDR) were compared to each other and to measurements of the deposit
thickness using an Auger Electron Spectrometer Ion Gun milling technique in a
1975 report.(01) Both the! visual rating method and the MARK 8A TDR were found
to correlate with deposit thickness measurements to a limited degree. Deposits
that have a spectrum of colors (i.e., peacock or rainbow-type deposits) were found
to be considerably thicker (one to three orders of magnitude) than Code 3 deposits.
Calibration of the ion gun technique using carbon films provided a conversion
W, factor of 0.028 angstroms/microamp seconds to calculate deposit thickness, i.e.,
thickness = 0.028 (milling rate in microamps) (milling time in seconds) for normal
deposits, a Code 3 visual rating amounted to approximately 80 to 180 angstroms.
Peacock deposits were found to be very thick, ranging as high as several thousand
angstroms. For normal deposits, a Code 3 visual rating was equivalent to a TDR
rating of about 17 or 18, ignoring peacock deposits.
The usefulness of TDR ratings for determining the activation energy of JP-5 fuels
was demonstrated in a recent report.(12)
In 1977, Rolls Royce Ltd. (at Bristol, United Kingdom) investigated a burn-off
technique for the measurement of the total carbonaceous material on a JFTOT
tube.(l3) Esso Research Center (Abingdon, England) extended the sensitivity of
this method by developing tube-cleaning techniques and improved detection for
measuring carbon dioxide in conjunction with Rolls Royce Ltd. in a recent
report.(l4) Deposit weights ranging from 40 to 250 mg of carbon are reported for
49
''pA

three fuels for which activation energies were calculated. The weight of carbon
measured at the JFTOT breakpoint temperatures (Code 3 inception temperature)
was found to be 40 and 70 /Ag for two different fuels. No correlation could be
obtained between deposit weight and maximum TDR ratings, or integrated values
of TDR response over the deposit area; however, for any given fuel, it was found
that the weight of carbon and the maximum TDR values increased directionally
with JFTOT test temperature. An approximate deposit thickness of 7500 ang-
stroms was calculated based on a nominal weight of 100 mg of carbon deposited
over a 20-mm length of JFTOT tube, assuming a density of 0.7 g/mL. Similar work
done at Shell Research Ltd. using carbon burnoff pointed out two major drawbacks:
the precision of the technique was stated to be poor and the burning off of the
carbonaceous material present on new tubes tended to reduce the amount of
material subsequently deposited during a test.(15) Rating tube deposits by carbon
content, rather than the standard visual rating, did not improve the correlation
between JFTOT and single-tube heat-transfer rig tests. Using carbon content, it
was shown that fuel performance in the JFTOT is dependent on both flow rate and
tube metallurgy. The fuel flow rate in the JFTOT and the use of aluminum test
tubes could contribute to the poor correlation between the JFTOT and the "more
reliable" test rigs that utilize higher flow rates and stainless steel test sections.(15)
To overcome some of the problems associated with the optical rating approaches, a
new method of evaluating deposits has been developed using dielectric strength of
tube deposits as a method for quantitation of these deposits.
2. Dielectric Strength Test Method
While investigating electrical resistivity as a possible approach to evaluating
JFTOT fuel deposits, it was determined that the deposits behaved as an excellent
electrical insulator. It appeared that this insulating property could potentially beexplored as a means of measuring the deposit thickness as a function of the voltage
K required to "brez ! down" the insulating property of the deposits. A bench test rig
was assembled from available components for limited initial testing to determine
the feasibility of this approach. The bench test rig consisted of a variable DC
power supply covering the 0- to 550 volt range. The negative lead from the power
supply was attached to the JFTOT test tube by a clip at a clean end of the tube. A
50
%T0 ..1 %-~ %. . ý,'- , " 1 VJ0"V
lOOK Q resistor was placed in a series between the power supply and the positive
lead to limit the maximum current flow; and to reduce potential shock hazard. The
positive lead was then attached to a 1/16-inch diameter stainless steel wire which
was mounted to a pi- t. The stainless-steel wire served as an electrode which
could be laid (perper jicular) across the JFTOT tube, in contact with the de.,?sit,
other spots could be checked by moving the electrode to another location on the
tube. Since the round stainless steel wire was laid across the deposit, perpendicu-
lar to the round tube, only a small contact area was produced. A voltmeter was
placed across the power supply, and a second voltmeter was placed across the OOK
Q resistor. Since no voltage would be detected as a voltage drop across the resistor
until current flows between the electrode and the JFTOT tube, voltage detected
across the resistor indicated break down of the deposit.
In operation, the power supply was set to 0 volts, the electrode placed across the
spot to be tested, and the voltage was slowly increased while observing the
voltmeter attached across the lOOK Qi resistor. This mneter would continue to read
0 volts regardless of actual voltage being applied to the deposit, until dielectric
break down of the deposit occurs and current begins to flow. At that point, the
meter jumps up scale and the power supply voltage which was required to break
down the deposit is recorded from the voltmeter attached across the power supply.
The supply voltage is then returned to 0 volts, the electrode moved to the next
location, and the process repeated.
A group of used JFTOT tubes from a v-riety of previous tests was obtained; this
was a "blind" group of samples since test conditions and fuel types wtre unknown.
The tubes were visually rated for depcsit, then tested for deposit dielectric
strength. The dielectric tests producei results covering a surprisingly wide
dynamic range. Tubes with Code I or 2 ratings generally produced dielectric
readings of 0 to 10 volts, Code 3 tubes frorn 10 to 20 volts, Code 4 from 20 volts to
4 approximately 400 volts and some tubes rated 4+ exceeded the limit of the power
supply at 550+ volts. Since increase in breakdown voltage for ar, insulating
material is in direct linear proportion to its thickness, the dielec tric evaluation
seemed to be resolving thickness variations covering two orders of magnitude.
Based on the encouraging results of this initial evaluation of the dielectric
technique, a matrix of JFTOT tests was defined to allow more detailed evaluation
of the dielectric technique.
51
-~ Wi
B. Measurement of Deposit Thickness Oy Metallurgical Cross-Sectioning ofEntrapped Depos t
I. Background
As discussed previously, a variety of indirect approaches to evaluate deposits ha.,e
been evaluated by different investigatorý, These approaches include the visual
rating, TDR rating, Auger ion milling, determination of deposit carbon content, and
dielectric strength measurement. Since all of these approaches are indirect, and
all rely on certain prior assumptions of the deposit's material properties Dehaviok, a
more direct measurement approach was needed in order to calibrate the indirectly
measured values of the various techniques to the directly measured deposit
thickness. An approach was developed to allow entrapment of the deposit by
enshrouding it in nickel plating. The Yube can then be ground and polished in cross-
section, and the deposit ooserved and measured at high magnification in an
electron microscope.
2. Electron Microscope 'Measurement Technique
An approach which allowed a more direct physical measurement of the deposit
thickness was to cut the test tube to remove the deposit's coated section, keeping
careiul record of the removed sections relative station locations and marking one
end of the section with a reference mark for circumferential orientation. The
section with the deposit intact was then cleaned by Freon washing, placed in a
vacuu i evaporation unit, and approximately 40 angstroms of silver was coated
onto the tube outer diameter (OD) surface to serve as an electrically conductive
film over the fuel deposits. The tube was then placed in an electrolytic nickel
plating bath and approximately 0,05 mm of plating was deposited onto the thin
silver coating. This process effectively trapped the fuel deposit between thealuminum tube and the silver/nickel plate. The tube section was then encapsulatedin metallurgical mounting compound in an upright position to provide further
backing and support for the plating layer during grinding and polishing operations.
The location of the tubes circumferential reference mark was transferred to the
OD of the mount, and the mount's thickness was measured and recorded to allow
indexing to relative tube stations as the tube was ground down in increments to
reach the stations of interest. Rough grinding to reach a particular location of
.52IzIe ý
interest was done with 240 grit, followed by 400 and 600 gric. Polishing was then
performed using 6-micron diamond polish followed by I-micron diamond polish on
smooth Pylon cloth covered polishing wheels. No further polishing was performed
as the desire in this case was to produce a relatively flat surface without the edge
rounding that can sometimes occur when polishing is continued using finer
abrasives on napped metallurgical polishing cloths.
Following the polishing operation, the circumferential reference location was
scribed onto the polished face of the mount near the OD of the polished tube
section. Several plastic replicas were then taken of the polished surface using
Bioden replicating film before the mount was ground further to reach the next
region of interest. The plastic replicas were then prepared in the usual manner for
transmission electron microscope (TEM) examination by coating the plastic from ashallow angle with palladium for contrast enhancement of surface texture, then
coating a carbon film evenl) over the plastic to produce a carbon replica cf the
plastic replica's surface. The tube OD size was too large to allow fitting the entire
replica of the tube into the TEM, so the carbon/plastic replica was cut into four
ar,- like quadrants for observation and the relative circumferential positions
represented by each quadrant was recorded. The plastic replica was then dissolved
away with solvent, leaving the intact carbon replica which was recovered on a
copper TEM grid and placed in the TEM for examination. The fuel deposit could be
easily identified in most cases as a narrow textured band trapped between the
aluminum tube and the silver/nickel plating when observed at magnifications of
10,OOQX or greater. Photographs taken at appropriate magnifications allow
thickness measurements to be taken directly from t',e photographs and the actual
thickness determined by dividing the photograph's measured 'thickness by the
magnification factor of the photographs. This technique worked quite well for fuel
deposits that were > 1000 an-stroms thick since the deposit thickness was relatively
even over the observed field of view whe2n this thickness of coating was observed.
Thinner fuel deposit layers (<I000 angstroms) could be observed in the microscope
but were more difficult to measure. The thinner deposits (<5C0 angstroms) were
often irregular in thickness and in some cases discontinuous, making the determina-
tion o.I average thickness difficult.
53
This measurement technique, while somewhat time consuming, is p- oably the best
overall means of determining deposit thickness since it allows visualization of the
deposits and requires only that the TEM magnification ranges be properly cali-
brated. It is unsuitable for measuring tube deposits having visual ra•iings of Code 3
and lower, but can be used on Code 3 deposits if they are evenly distributed. It is a
particularly useful approach if an Arrhenius-type plot of the deposit thickness
versus temperature is to be produced for A series of tests producing deposits of
Code 3 and greater. If the Arrhenius-type plot produces a linear slope, the line can
be extrapolated into the less than visual Code 3 thickness ranges with reasonable
expectations of accuracy.
The specimens can also be examined directly in a scanning electron microscope
(SEM) without the tedious replication steps inherent in TEM preparations. The SEM
must, however, be capable of crisp image resolution up to 20,OOOX magnification,
and backscatter detection is desirable to improve contrast between the organic
deposit and the metals.
C. Test Matrix
1. Purpose and Approzach
To evaluate the dielectric method of deposit measurement and to allow comparison
of this method to other rating approaches, a fuel test matrix was established using
four primary fuels: Cat I-H engine reference fuel, I-percent sulfur fuel (MIL-F-
46162), a commercial let A-I, and a diesel reference control fuel. Two ;econdaryfuel blends were also tested; Jet A-I spiked with 5 vol% tetralin and Jet A-I spiked
with tetralin and thiophene at 5 vol% each.
The six fuels were each tested at five ternperature ranges on the JFTOT tester (D
3241), giving a totai of 30 fuel/temperature variables. Each of the 30 test
conditions was run in triplicate so the total matrix involved testing and evaluation
of 90 JFTOT tubes.
The triplicate testing of each test condition was performed for several reasons. It
allowed observation of the repeatability of results from the triplicate tests, and if
54
some scatter were noted in the data, the wveraging of results from the triplicate
tests could more closely approximate the norm for the test conditions. Having
tubes from triplicate tests also allowed backup tubes to be available if problems
were encountered during evaluation of deposit using destructive evaluation tech-
nicues (i.e., sectioning, Auger ion milling, etc.).
The five te.t temperatures for each iuel were selected in an attempt to preduce
one 3FTOT test near the fuei's breakpoint (visual Code 3 inception temperature),
two tests below the breakpoint te nperature, and two tests above the breakpoint
tempe'rature.
Alter testing, ýach of the 90 .3FTOT tubes was given a detailed evaluation by visual
rating method, TDR rating method, and the dielectric breakdown method. Selected
twbes and otocations were th2n sectioned and examined by electron microscope to
measure deposit thickn;ess, and other locatiors were selected to allow limited
evaluation of' Auger spectrometer/ion mil!Ving as a means of determining deposit
thickness.
To reduce any scatter that might be introducea due tr, surface finish variations of
the as-received aluinlaum JFTOT tubes, all the tubes were polished prior to testing
with l-mic'on diamcond compound to produce a consistent surface finish. They
were then cleaned in an ultrasonic bath, rinsed with acetone, rinsed with heptane,
and dried. Tube indexing was indiscriminate after the 27FTOT test for this matrix;
subsequent JFTOT tests used an indexing method which provided for a zero degree
scribe mark on thK end of test tube (facing the instrument operator) or 180 degrees
from the face of the JFTOT instrument behind the test tube specimen.
2. Matrix Results and Comparison of Ra'itnTechni.ues
a. General
The measUrements data for the 90 test tube matrix are provideo in Appencdix C.
The test temperatures selected to produce deposits of less than visual Code 3 weie,
in some cases, too low since they produced no detectable deposit. The ranking of
55

the four primary fluels by breakpoint temperature was consistent with expected
results. The 1-percent sulfur diesel fue! had the lowest breakpoint temperature,
followed by Cat I-H, and the diesel control, with Jet A-I having the highest
breakpoint temperature.
The two secondary f uel blends of Jet A-i spiked with tetralin or tetraiin plus
thiophene produced abno~rmal d,ýposits at lower testing temperatures (as opposed to
higher test. temperatures) which made a fair comparison of the rating techniques
impossibY. These abnormal deposits were not the normally encountered varnish-
like deposits, they appeared as a "light blue"~ or lipeach-colored" deposit which
loosely adrnered to the tube, and, in most casns, could be removed by lightly wiping
the tube with a cloth. The presence of this abnormal deposit produced signif icantly
higher ratings with visual arid TDF thanl were obtained by dielectric. At highertemperatures, these fuel blends produced normal ý,arnish-like deposits which
affected vistial, TDR. and dielectric 7atings in the normal expected man'ner. Data
obtained fromn these fuels are included in Appendix C, but is not included in the
following comparison. of testing techniques due to the "abnormarl" nature of the
lower temperature deposits produced by these s3econdary spiked fuel blends.
b. Dielectric Breakdown Method
Base6 on the data presented in Figure 27, for the I-percent sulfur fuel at foiir
D 3241 test temperatures, one micrometer of deposit thi,.;ness is shown to equate
to a dielectric strength breakdown voltage of approxirnatety 350 volts.
A linear regression analysis was performed on the dielectr-Ic versus optical
thickness measurements of the I-percent sulfur reference fuel data. These 36 data
values are listed .ýn Table 24. The dielectric voltage measurements were converted
to micromete2rs by dividing each value by 350 (see column A in Table 24). The
derived linear re&ression model for this set of data is as ftoiiows:
K Aielect::i:c:: Thckoo(0004475) 1- (0.9774131 x Opt~icaTickness) Iwere calculated from this regression mode!.
.56
AM''~~~~~~~ -*- S wo W0.1xý C. i
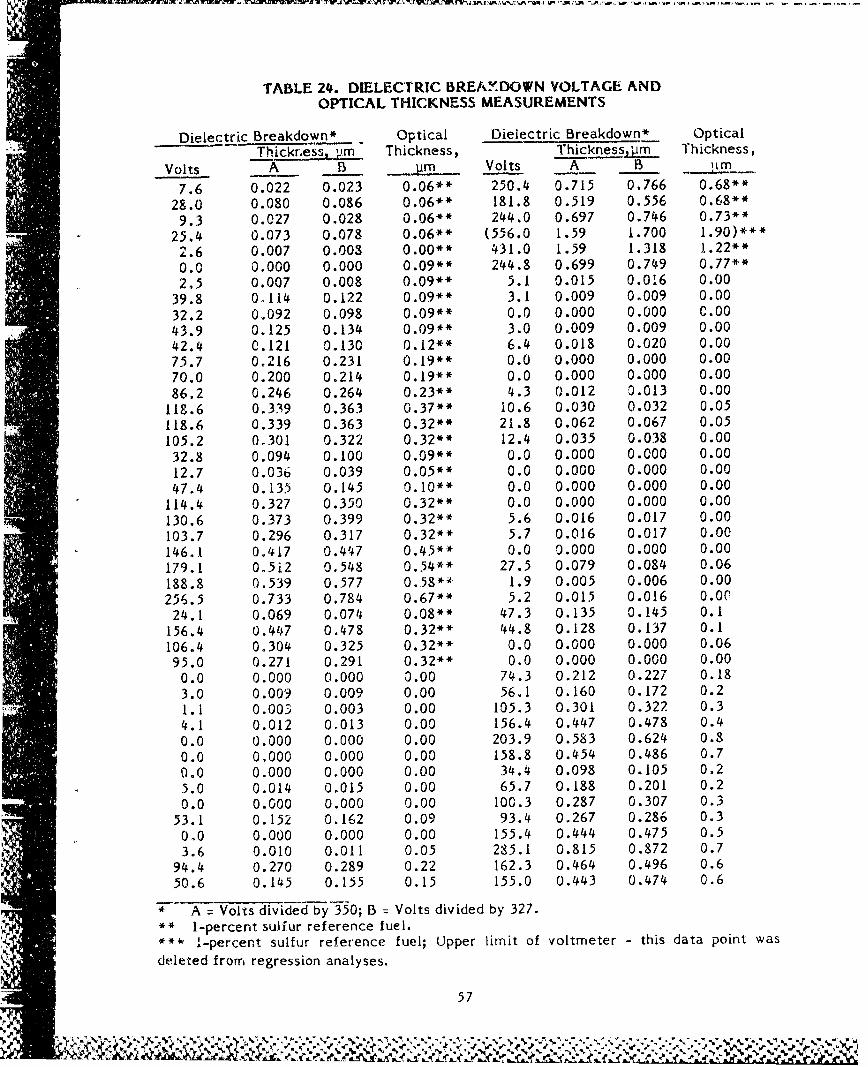
TABLE 24. DIELECTRIC BREAKDOWN VOLTAGE ANDOPTICAL THICKNESS MEASUREMENTS
Dielectric Breakdown* Optical Dielectric Breakdown* Optical
ThicknessT7ý Thickness, Thickne sspLm Thickness,
Volts A B - Volts A B !1m
7.6 0.022 0.023 0.06** 250.4 0.715 0.766 0.68**28.0 0.080 0.086 0.06** 181.8 0.519 0.556 0.68**9.3 0.027 0.028 0.06** 244.0 0.697 0.746 0.73**
25.4 0.073 0.078 0.06** (556.0 1.59 1.700 1.90)***2.6 0.007 0.00 0.00** 431.0 1.59 1.318 1.22"*0.0 0.000 0.000 0.09** 244.8 0.699 0.749 0.77**2.5 0.007 0.008 0.09** 5.1 0.015 0.016 0.00
39.8 0,114 0.122 0,09** 3.1 0.009 0.009 0.0032.2 0.092 0.098 0.09** 0.0 0.000 0.000 C.0043.9 0.125 0.134 0,09** 3.0 0.009 0.009 0.0042.4 0.121 0.130 0.12"* 6.4 0.018 0.020 0.0075.7 0.216 0.231 0,19** 0.0 0.000 0.000 0.00
70.0 0.200 0.214 0.19*4 0.0 0.000 0.000 0.0086.2 0.246 0.264 0,23** 4.3 0.012 0.013 0.00
118.6 0.339 0.363 0.37** 10.6 0.030 0.032 0.05118.6 0.339 0.363 0.32** 21.8 0.062 0.067 0.05105.2 0o301 0.322 0.32** 12.4 0.035 0.038 0.0032.8 0.094 0.100 0,09** 0.0 0.000 0.000 0.0012.7 0.036 0.039 0,05** 0.0 0.000 0.000 0.0047.4 0.135 0.145 0.10** 0.0 0.000 0.000 0.00
114.4 0.327 0.350 0.32** 0.0 0.000 0.000 0.00130.6 0.373 0.399 0.32** 5.6 0.016 0.017 0.00103.7 0.296 0.317 0.32** 5.7 0.016 0.017 0.00146.1 0.417 0.447 0.45** 0.0 0.000 0.000 0.00179.1 0.5i2 0.548 0.54** 27.5 0.079 0.084 0.06188.8 0.539 0.577 0.58** 1.9 0.005 0.006 0.00256.5 0.733 0.784 0.67** 5.2 0.015 0.016 0.0024.1 0.069 0.074 0.08** 47.3 0.135 0.145 0.1
156.4 0.447 0.478 0.32** 44.8 0.128 0.137 0.1106.4 0.304 0.325 0.32** 0.0 0.000 0.000 0.0695.0 0.271 0.291 0.32** 0.0 0.000 0.000 0.000.0 0.000 0.000 0.00 74.3 0.212 0.227 0.183.0 0.009 0.009 0.00 56.1 0.160 0.172 0.21.1 0.003 0.003 0.00 105.3 0.301 0.322 0.34.1 0.012 0.013 0.00 156.4 0.447 0.478 0.40.0 0.000 0.000 0.00 203.9 0.583 0.624 0.80.0 0.000 0.000 0.00 158.8 0.454 0.486 0.70.0 0.000 0.000 0.00 34.4 0.098 0.105 0.25.0 0.014 0,015 0.00 65.7 0.188 0.201 0.20.0 0.000 0.000 0.00 100.3 0.287 0.307 0.3
53.1 0.152 0.162 0.09 93.4 0.267 0.286 0.3010 0.000 0.000 0.00 155.4 0.444 0.475 0.53.6 0.010 0.011 0.05 285.1 0.815 0.872 0.7
94.4 0.270 0.289 0.22 162.3 0.464 0.496 0.650.6 0.145 0.155 0.15 155.0 0.443 0.474 0.6
A Volts divided by 350; B Volts divided by 327.1-percent sulfur reference fuel.I is-dtaroinewa
,,, a-percent sulfur reference fuel; Upper limit of voltmeter = this data point was
deleted from regression analyses.
57
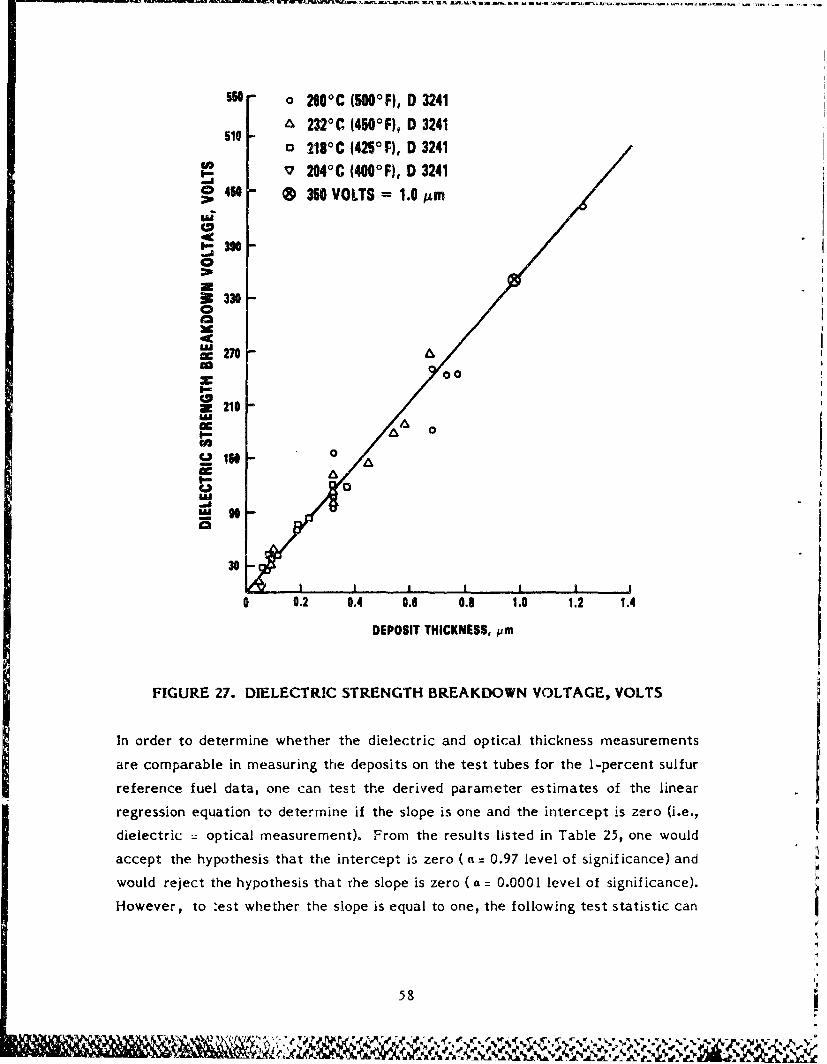
WP . 3 rau. -.. W~WV W ~ f~~tf .W In - - -n,, s t. . - -aa _-,- w..r_ .. _
o 260 0C (150 0F), D 3241si 232 0C (4500F), D 3241
1 218 0C (4250F), D 3241
S7 204 0C (4000F), D 3241o46 ® 350 VOLTS =1.0 Am
=39
S3300
=270Ca 00
z 210U'S= oI- -A.0
0 0.2 0.4 0.6 0. 1.0 1.2 1.4
DEPOSIT THICKNESS, ,•m
FIGURE 27. DIELECTRIC STRENGTH BREAKDOWN VOLTAGE, VOLTS
In order to determine whether the dielectric and optical thickness measurements
are comparable in measuring the deposits on the test tubes for the I-percent sulfur
reference fuel data, one can test the derived parameter estimates of the linear
regression equation to determine if the slope is one and the intercept is zero (i.e.,
dielectric = optical measurement). From the results listed in Table 25, one would
accept the hypothesis that the intercept is zero ( a = 0.97 level of significance) and
would reject the hypothesis that T:he slope is zero ( a = 0.000 1 level of significance).
However, to :est whether the slope is equal to one, the following test statistic can
58
UW %
aMA I
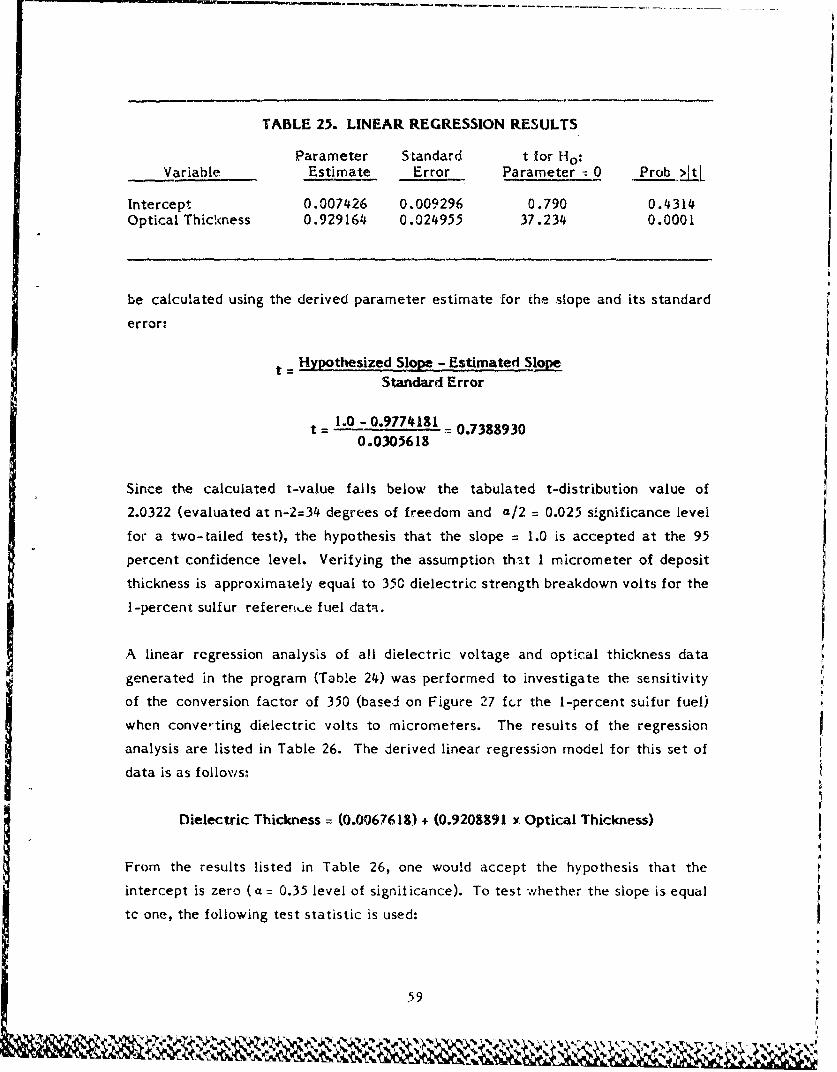
TABLE 25. LINEAR REGRESSION RESULTS
Parameter Standard t for H.:Variable Estimate Error Parameter - 0 Prob >lIL
Intercept 0.007426 0.009296 0.790 0.4314Optical Thickness 0.929164 0.024955 37.234 0.0001
be calculated using the derived parameter estimate for Ehe slope and its standard
error:
Hypothesized Slope - Estimated Slp
Standard Error
1.0 - 0.9774181t = = 0.73889300.0305618
Since the calculated t-value falls below the tabulated t-distribution value of
2.0322 (evaluated at n-2=34 degrees of freedom and a/2 = 0.025 si.gnificance level
for a two-tailed test), the hypothesis that the slope = 1.0 is accepted at the 95
percent confidence level. Verifying the assumption th.at 1 micrometer of deposit
thickness is approximately equai to 350 dielectric strength breakdown volts for the
I-percent sulfur referen,-e fuel data.
A linear regression analysis of all dielectric voltage and optical thickness data
generated in the program (Table 24) was performed to investigate the sensitivity
of the conversion factor of 350 (based on Figure 27 fr the 1-percent sulfur fuel)
when converting dielectric volts to micrometers. The results of the regression
analysis are listed in Table 26. The derived linear regression model for this set of
data is as follows;
Dielectric Thickness = (0.0067618) + (0.9208891 x Optical Thickness)
From the results listed in Table 26, one would accept the hypothesis that the
intercept is zero (a = 0.35 level of significance). To test whether the slope is equal
tc one, the following test statistic is used:
59
1- 1, 4
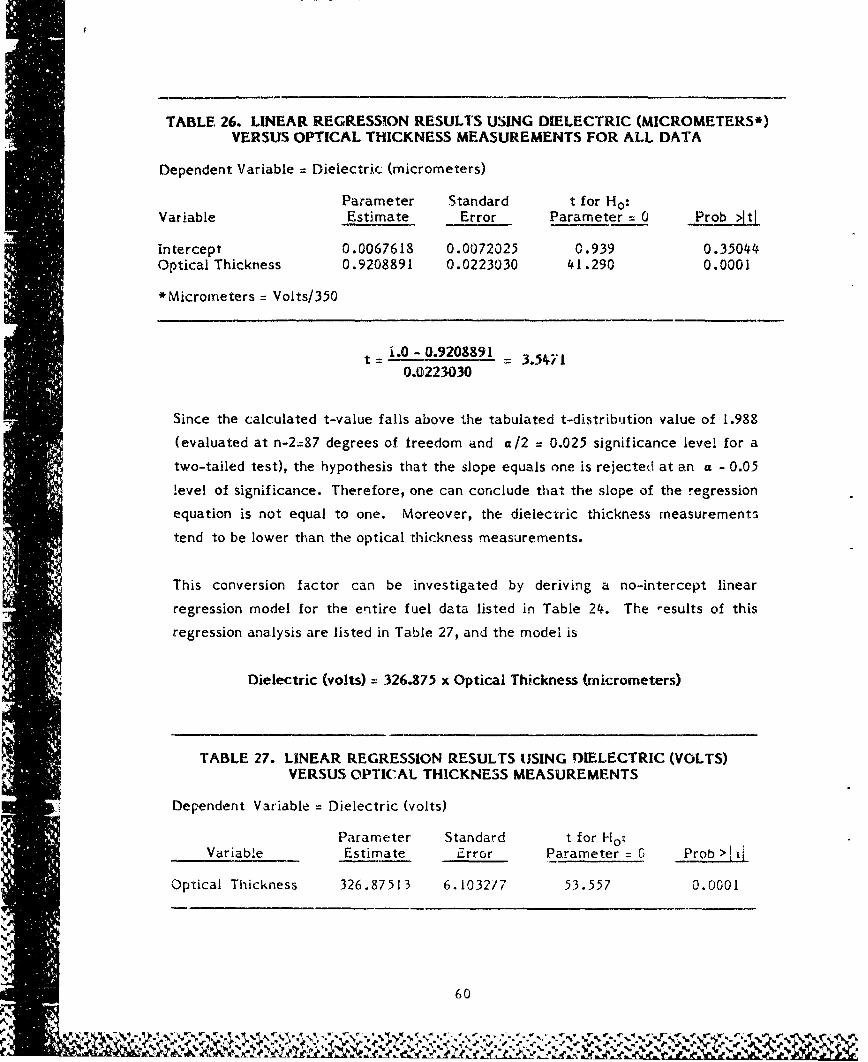
TABLE 26. LINEAR REGRESSION RESULTS USING DIELECTRIC (MICROMETERS*)
VERSUS OPTICAL THICKNESS MEASUREMENTS FOR ALL DATA
Dependent Variable = Dielectric (micrometers)
Parameter Standard t for Ho:Variable Estimate Error Parameter = 0 Prob Lti
Intercept 0.0067618 0.0072025 0.939 0.35044Optical Thickness 0.9208891 0.0223030 41.290 0.0001
* Micrometers = Volts/350
Si.0 0.9208891 = 3.4710.0223030
Since the calculated t-value falls above the tabulated t-distribution value of 1.988
(evaluated at n-2=87 degrees of freedom and a/2 = 0.025 significance level for a
two-tailed test), the hypothesis that the slope equals one is rejected at an a - 0.05
level of significance. Therefore, one can conclude that the slope of the regression
equation is not equal to one. Moreover, the dielectric thickness measurements
tend to be lower than the optical thickness measurements.
This conversion factor can be investigated by deriving a no-intercept linear
regression model for the entire fuel data listed in Table 24. The results of this
regression analysis are listed in Table 27, and the model is
Dielectric (volts) = 326.875 x Optical Thickness (micrometers)
TABLE 27. LINEAR REGRESSION RESULTS USING UIELECTRIC (VOLTS)VERSUS OPTICAL THICKNESS MEASUREMENTS
Dependent Variable = Dielectric (volts)
Parameter Standard t for Fo,,Variable Estimate Error Parameter 0 Prob > I E
Optical Thickness 326.87513 6.1032/7 53.557 0.0001
60
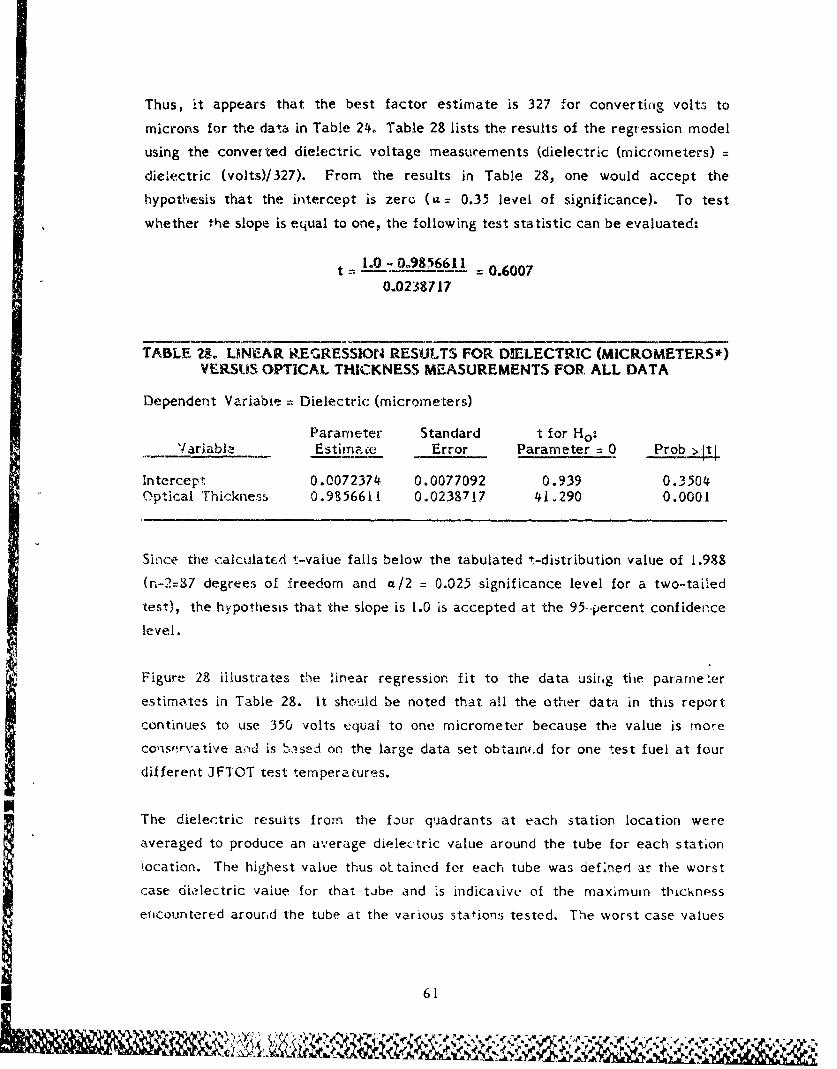
Thus, it appears that the best factor estimate is 327 for converting volt:- to
microns for the data in Table 24. Table 28 lists the results of the regression model
using the conver ted dielectric voltage measuremnents (dielectric (micrometers) =
dielectric (volts)/327). From the results in Table 28, one would accept the
hypothesis That the intercept is zero (a = 0.35 level of significance). To test
whether the slope is equal to one, the following test statistic can be evaluated:
I=-1.0 - 0.9856611 =0.60070.0238717
TABLE 29. LUNAR REGRESSION4 RESULTS FOR DIlELECTRIC (MICROMETERS*)
VERSUS OPTICAL THICKNESS MEASUREMENTS FOR, ALL DATA
Dependent Variable =. Dielectric (micrometers)
Parameter Standard t for H0 :
'iari.abla- Estimace Error Paramneter= 0 Prob >1t
Intercept 0.0072374 0.0077092 0.939 0.3504Optical Thic-kness 0.9856611 0.0238717 41.290 0.0001
Since the calculatedi !-value falls below the tabulated i-distribution value of 1.988
(r.-1=87 degrees of freedom and a/2 = 0.025 significance level for a two-tailed
test), the hypothesis that the slope is 1.0 is accepted at the 95-percent confidence
level.
Figure 28 illustrates the 'linear regression fit to the data usitng the pararne~er
estimates in Table 28. It shcould be noted that all the other data in this report
continues to use 350 volts equal to one micrometer because the value is mor-e
consoervative all'd is '1case-d on the large data set obtaln(d for one test fuel at four
different JFIOT test tempera. ures.
The dielertric results from the fbur quadrants at each station location were
averaged to produce an average dielectric value around the tube for each station
l.ocation. The highest value thus obtained for each tube was def~ned aE thle worst
case dielIectric value for that tibe and Is indicative of the maximum thickness
.4 encountered around the tube at the various stations tested. The worst case values
61
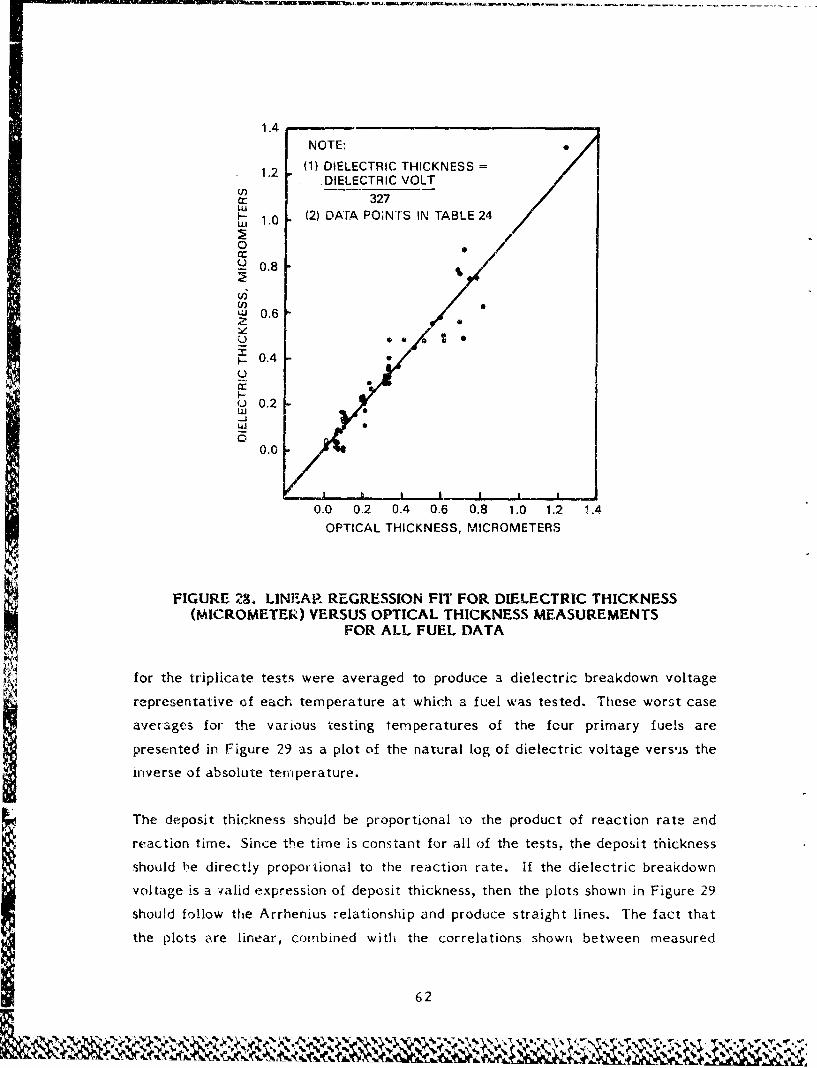
1.4NOTE:
1.2 (1) DIELECTRIC THICKNESSDIELECTRIC VOLT
Cr 327
u 1.0 (2) DAM POINTS IN TABLE 24
0
Q0.8
0.6Ua
S0.4 -
U 0.2
0.0 / S
0.0 0.2 0.4 0.6 0.8 1.0 1.2 1.4OPTICAL THICKNESS, MICROMETERS
FIGURE 28. LIN-AP. REGRESSION FIT FOR DIELECTRIC THICKNESS(MICROMETER) VERSUS OPTICAL THICKNESS MEASUREMENTS
FOR ALL FUEL DATA
for the triplicate tests were averaged to produce a dielectric breakdown voltage
representative of each temperature at which a fuel was tested. These worst case
averages for the various testing temperatures of the four primary fuels are
presented in, Figure 29 as a plot of the natural log of dielectric voltage versus the
inverse of absolute temnperature.
The deposit thickness should be proportional io the product of reaction rate and
reaction time. Since the time is constant for all of the tests, the deposit thickness
should he directly propor tional to the reaction rate. If the dielectric breakdown
voltage is a valid expression of deposit thickness, then the plots shown in Figure 29
should follow the Arrhenius relationship and produce straight lines. The fact that
the plots are linear, combined with the correlations shown between measured
62
ON %~
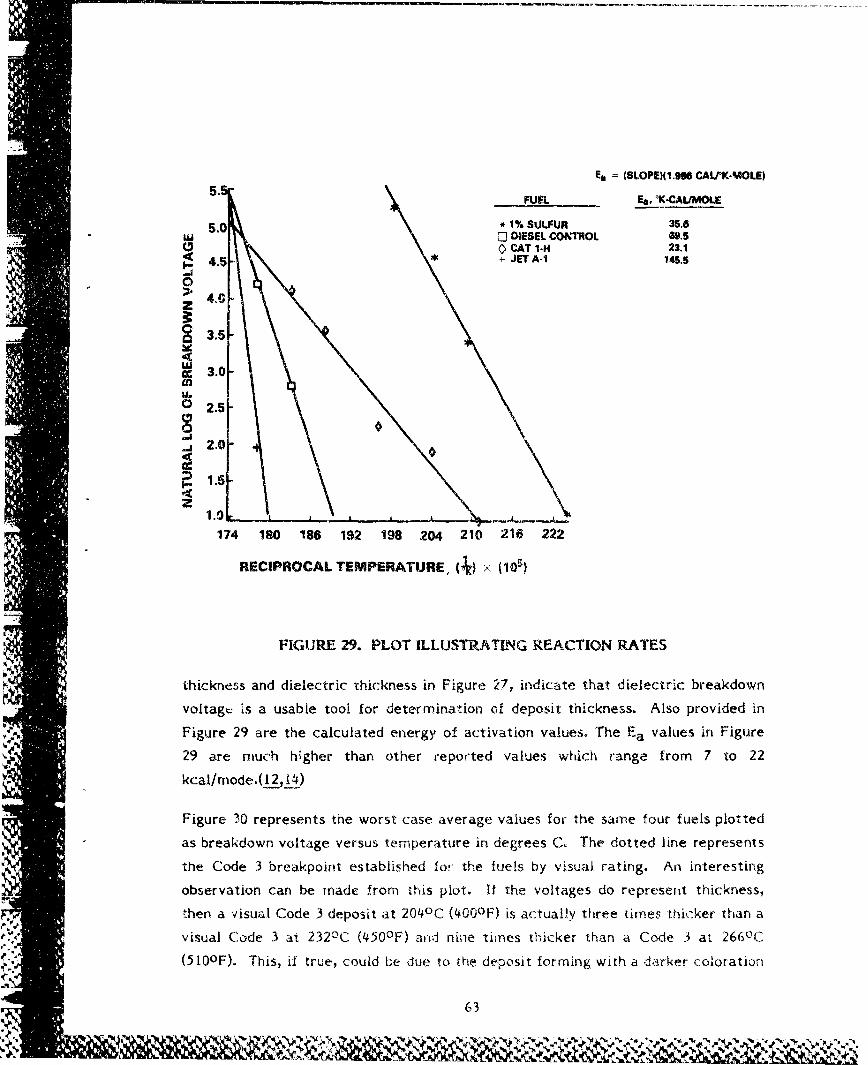
Ea (SLOPE)(1.966 CALMK.MOLE)
5 FUEL Ea, °K-CALIMOLE
5.0 * 1% SULFUR 3S.6wu [I DIESEL CONROL 9.5
< CAT 14H 23.14.5 + JETA1 145.5
-.J0 S4.0
0a 3.5
cc 3.0
C) 2.5-
2.0
z
174 180 186 192 198 204 210 216 222
RECIPROCAL TEMPERATURE, (O) x (105)
FIGURE 29. PLOT ILLUSTRATLNG REACTION RATES
thickness and dielectric thickness in Figure 27, indicate that dielectric breakdown
voltagt is a usable tool for determination of deposit thickness. Also provided in
Figure 29 are the calculated energy of activation values. The Ea values in Figure
29 are much h~gher than other reported values which range from 7 to 22
kcal/mode.(12,_.)
Figure 30 represents the worst case average values for the same four fuels plotted
as breakdown voltage versus temperature in degrees C, The dotted line represents
the Code 3 breakpoint established for the fuels by visual rating. An interesting
observation can be made from this plot. II the voltages do represent thickness,
then a visual Code 3 deposit at 204 0 C (400 0 F) is actually three times thik,-ker than a
visual Code 3 at 232 0 C (450 0 F) aod nine times thicker than a Code 3 at 266 0 C(510OF). This, if true, could be due to the deposit forming with a darker coloration
6-3
NV
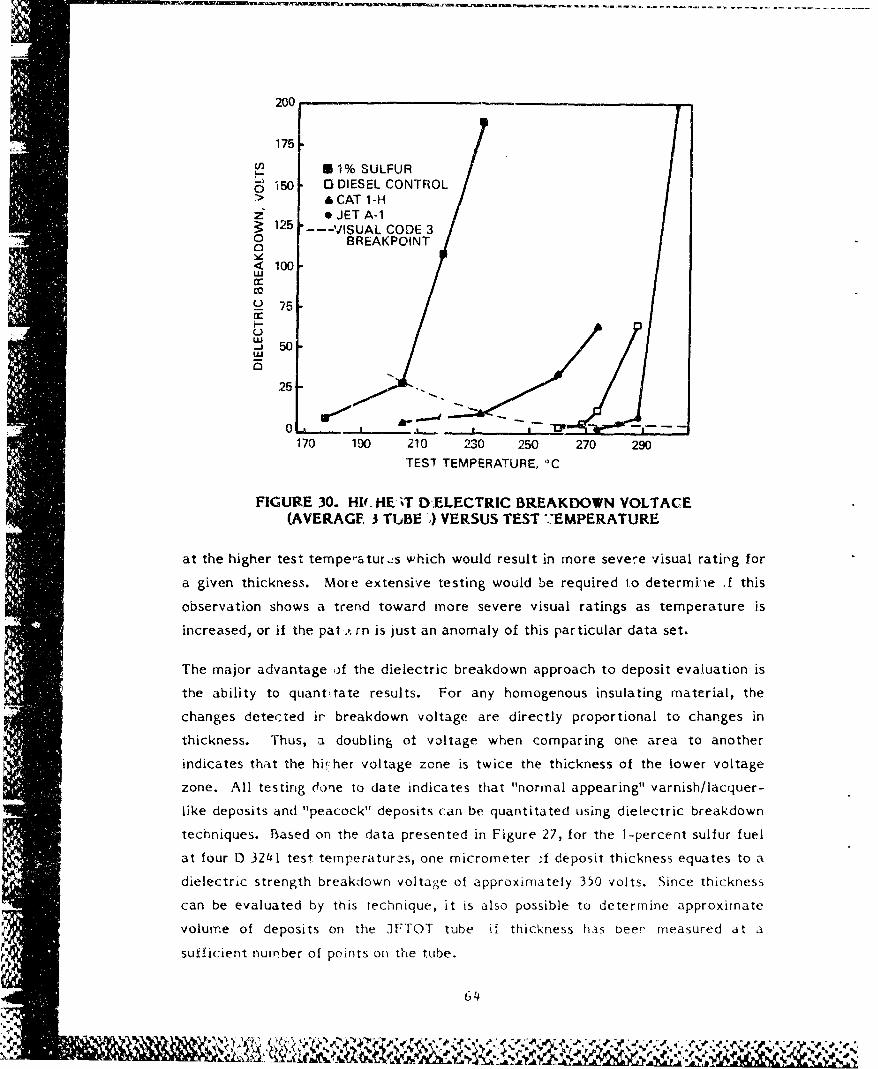
200
175
U 1% SULFURC) 50 0DIESEL CONTROL
&CAT 1-He oJET A-1
• 125 ---- VISUAL CODE 30 BREAKPOINTa
<100
ý2 75cc
50
25
170 190 210 230 250 270 290TES-T TEMPERATURE, oC
FIGURE 30. HIY. HET D ELECTRIC BREAKDOWN VOLTACE(AVERAGE 3 TUBE I) VERSUS TEST .EMPERATURE
at the higher test temper'aturs which would result in more severe visual rating for
a given thickness. Mote extensive testing would be required io determiie .J this
observation shows a trend toward more severe visual ratings as temperature is
increased, or if the pat .t rn is just an anomaly of this particular data set.
The major advantage of the dielectric breakdown approach to deposit evaluation is
the ability to quanti.tate results. For any homogenous insulating material, the
changes detected ir breakdown voltage are directly proportional to changes in
thickness. Thus, a doubling of voltage when comparing one area to another
indicates that the hif her voltage zone is twice the thickness of the lower voltage
zone. All testing done to date indicates that "normal appearing" varnish/lacquer-
like deposits and "peacock" deposits can be quantitated using dielectric breakdown
techniques. Based on the data presented in Figure 27, for the i-percent sulfur fuel
at four D 3241 test ternperatur-as, one micrometer -A deposit thickness equates to a
dielectric strength breakdown voltage of approximately 350 volts. Since thickness
can be evaluated by this technique, it is also possible to determine approximate
volumne of deposits on the JFT(OT tube il thickness has oeer measured at a
sufficient number of points on the tube.
64
N N NA
To determine volume of deposit for the tubes in this test matrix, longitudinal
traverses were made along each tube, taking a voltage reading every 2 millimeters
along the length (Appendix C). Four individual traverses were made, rotating the
tube 90 degrees each time a traverse was completed. This gave thickness
information representing four quadrants around the tubes' circumference. !t is
important to generate thickness information from at least these four locations
around the tube since the deposit is sometimes thicker on one side of a tube, and
the thickness distribution around the tube must be known to calculate volume.
Table 29 summarizes volumes of deposit calculated for all JFTOT tubes in the
matrix which produced detectable amounts of deposit. The method used to
calculate the volumes of deposit is explained in Appendix D. The volumes listed
under each individual quadrant in Table 29 represent the deposit volume that would
be calculated if only the one quadrant had been measured and even distribution
around the tube was assumed. The volumes listed under "average" in Table 29 were
calculated based on average thickness for the four quadrants at each 2-mm station
and are thus a more accurate presentation of total volume present on the tube.
This table illustrates not only the expected increase of deposit volume as testtemperatures are increased for each fuel, but also shows the variations in deposit
formed in each quadrant, as well as variations that were encountered between the
triplicate tests at each temperature. Similar variations between triplicate tests
were noted by visual rating and TDR rating. The cause of this occasional variation
in triplicate tests is unknown. (Note: D 3241 repeatability and reproducibility data
are not available.)
Figure 31 is .:A plot of t[he av.rge thickness by breakdown voltage at each 2-umm
station, and TDR spun rating down the length ol the test tube (Number 5240F) at
each 2-rn cl station for the I percent sulur test tuel run by D 3241 at '218 0C
(425 0 F}. Aiso provided in Figure '33). is the visual code rating at each 2-rmn sta~tion.
"f"igure 31: visuc1 .lly o ' iire, the ',t,rage oeposit thickness at each 2-imnm station as
an area piol to the plot of the die.lectri,.: strength breakdown voltage at each 2-•um
staticni in each ol the ;our qu:.rdrant, gi7,ien by aingles .ýn de(,rees, i.e., 0V, 900, 1800,
and 270°. This [)!(.'re. ional plot iS inIormative in s1howing the depoSit
Sthickness vat jation l'u-owJ' te te st tube .111d do'&~n !he lent-.th of t ie test tube.
Plots si ril , to F1 i- ure i,,)vtded in A. ptwenid x 1) t selected '1) 3241 test
ternpeatures, tor ciil six m , n. to, t ,i-ki. hi.Is.
mmm % - P"Vi % -t
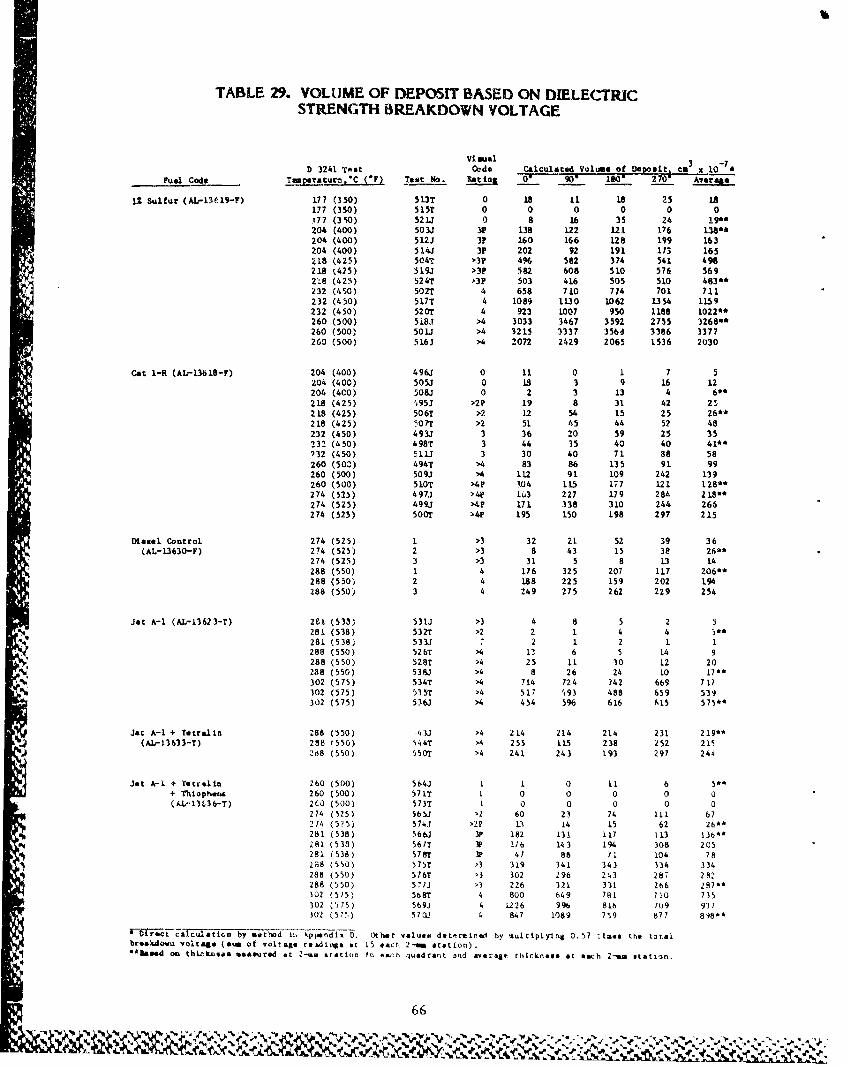
TABLE 29. VOLUME OF DEPOSIT BASED ON DIELECTRICSTRENGTH BREAKDOWN VOLTAGE
Vi al3 7D 3241 Test Code Calculated Volume of empoett cm x 10-7
Fuel CodeTprturr,.C (F) Test No. Rating - - 90 180 270- Averae
1Z Sulfur (AL-I3619-F) 177 (350) 513T 0 18 11 18 25 is177 (350) 515T 0 0 0 0 0 0M77 (350) 523J 0 8 16 35 24 !9*
204 (400) 503J 3p 138 122 121 176 138C*204 (400) 512J 3? 160 166 128 199 163204 (400) 514J 3P 202 92 191 173 165218 (425) 504T >3P 4,6 582 374 541 496218 (425) 319J >3P 582 608 510 576 569218 (425) 524T ,3P 503 416 505 510 483**232 (450) 5021 4 658 710 774 701 711232 (450) 517T 4 1089 1130 1062 1354 1159232 (450) 520T 4 923 1007 950 1188 1022C*260 (500) 5181 >4 3033 3467 3592 2755 32680*260 (500) 501J >4 3215 3337 356d 3386 3377260 (500) 516J >4 2072 2429 2065 1536 2030
Cat 1-Hl (AL-13618-P) 204 (400) 4961 0 11 0 1 7 5204 (400) 505J 0 is 3 9 16 12204, (400) 508J 0 2 3 13 4 6**218 (425) 4951 >2P 19 8 31 42 25218 (425) 506T >2 12 54 15 25 26t*218 (425) 5071 >2 51 45 44 52 48232 (450) 493J 3 36 20 59 25 35232 (450) 498T 3 44 35 40 40 41C*732 (450) 5114 3 30 40 71 88 58260 (500) 494T >4 83 86 135 91 99260 (500) 509J >4 112 91 109 242 139260 (500) 510T >4P 104 115 177 121 128**274 (525) 497J >4P 1u3 227 179 284 2l8**274 (525) 4993 >4p 171 338 310 244 266274 (525) SOOT >4P 195 150 198 297 215
Dtiesl Control 274 (525) 1 >3 32 21 52 39 36(AL-13630-F) 274 (525) 2 >3 8 43 15 3e 260*
274 (525) 3 >3 31 5 8 13 14288 (550) 1 4 176 325 207 117 206**288 (530) 2 4 188 225 159 202 194288 (550, 3 4 249 275 262 229 254
Jet A-1 (AL-13623-T) 281 (533) 5311 >3 4 8 5 2 5281 (538) 532T >2 2 1 4 4 3**281 (538) 533J 2 2 1 2 1 1
288 (550) 526T >4 13 6 5 14 9288 (550) 528T >4 25 11 30 12 20288 (550) 538J >4 8 26 24 10 17'*302 (575) 534T >4 714 724 742 669 7 17302 (575) 535T >4 517 193 488 659 539302 (575) 536J >4 454 596 616 615 575**
Jet A-I + Tetralin 288 (550) 43J >4 214 214 214 231 2 1 9**(AL-13633-T) 288 (550) 544T >4 255 115 238 252 215
2d8 (550) 550T >4 241 243 193 297 244
jet A-I + "tetrwlin 260 (500) 564J 1 1 0 11 6 5**+ Thloph•na 260 (500) 571T 1 0 0 0 0 0
(M,,-13(3 6-T) 2c0 (500) 573T 1 0 0 0 0 0274 (525) 56!1 >2 60 23 74 Ill 67214 (5?5) 574J >2p 1- 14 15 62 26*281 (538) 5661 3p 182 131 117 1L3 13b**28l (538) 561T 3P 116 143 194 308 205281 (538) 578T ]p 41 88 71 104 78288 (550) 575T 13 319 341 343 334 334288 (550) 576T >3 302 296 243 287 282288 (550) 57/J >3 226 321 331 266 287*302 (575) 5681 4 800 649 781 110 735302 ('05) 5691 4 1226 996 816 /09 937302 "5"¶.) 570L, 4 847 1089 719 877 84860
- a on by utwt -hd 1-n hpp*ndtx D. Other value. dettrmeined by sul rtplyimg 0.57 1imes the totalbrelkdoowu voltage (*um of voltage reAdlngs at 15 each 2-mm statlon)."bsend on thLck•saa aeatured at 2-m station fn eachi quadrant and averag# thickness at each 2-gam statlon.
66
10 N N 1K
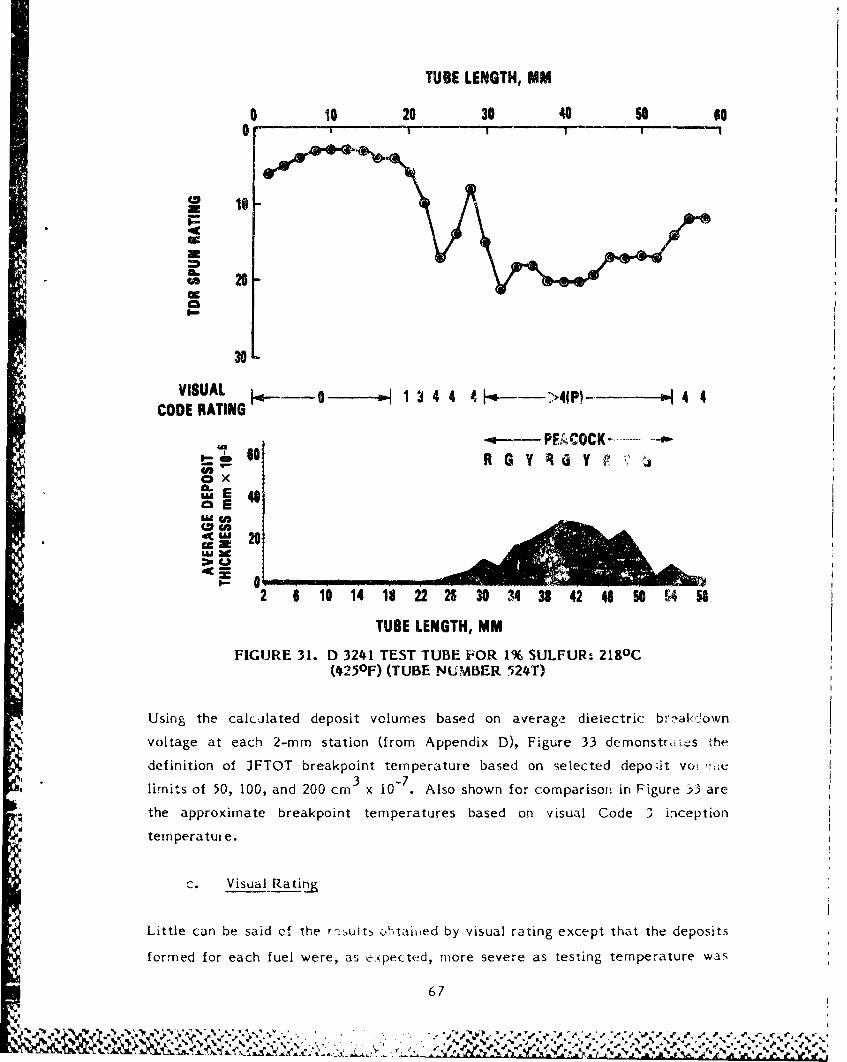
TUBE LENGTH, MM
o 10 20 30 40 50 60
0
10
IU
i VISUAL k--o-----01 3 4 4 4 I•---- >4IP)- -- 4 4CODE RATING
6 0 - PFACO CK..... .
so40X,OLE 40
"0 E
W FA
• 02 6 10 14 18 22 26 30 34 38 42 40 50 4 5
TUBE LENGTH, MM
FIGURE 31. D 3241 TEST TUBE FOR 1% SULFUR: 218 0 C(425 0 F) (TUBE NUfMBER 524T)
Using the calcalated deposit volumes based on average dielectric b,'•aV-.'!own
voltage at each 2-mm station (from Appendix D), Figure 33 demonstrc.es the
definition of JFTOT breakpoint temperature based on selected depos;it vuw ,iC
limits of 50, 100, and 200 cm x 10-. Also shown for comparison in Figure 33 are
the approximate breakpoint temperatures based on visual Code 3 inception
temperatut e.
c. Visual Rating
Little can be said of the 'csults ., htaioed by visual rating except that the deposits
formed for each fuel were, as e.xpectod, more severe as testing temperature was
67
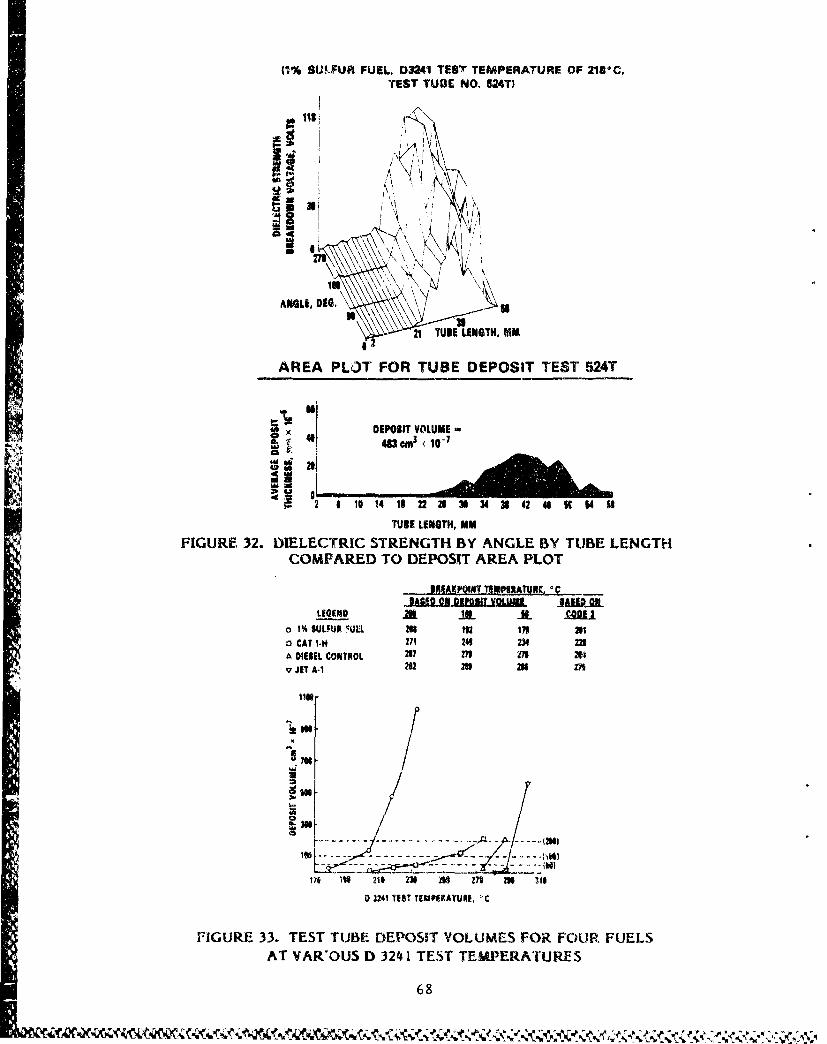
(¶% SUWFUR FUEL. D3241 TESTr TEMPERATURE OF 2180C.TEST TUBE NO. 524T)
ANGLE, 010,
1139
A\ <I
d 21
21 TUBE LENGTH , MM
AREA PLA T FOR TUBE DEPOSAT TEST 524T
i! DEPOBIT VOLUME -
60 I1014 15222 Ul31 34 N 42 U K 540S
TUBE LENGTH, MM
FIGURE 32. DIELECTRIC STRENGTH BY ANGLE BY TUBE LENGTHCOMPARED TO DEPOSIT AREA PLOT
RIIRAKPOIRT TEMISPEATURI.I °
LEGEID Jl AL _L x Malo 1% SULFUR 5UEL ZN 112 111 201O CAT 1I-H 271 244 234 223A DIESEL CONTROL 237 27 270 25
SJET A-1 2m 25 288 M
1-:1
17f 1SS 213 223 245 Z7• ZN lie
0 2241 TEST THAPFRATURI, 'C
FIGURE 33. TEST TUBE DEPOSIT VOLUMES FOR FOUR FUELS
AT VAR'OUS D 3241 TEST TEMPERATURES
68
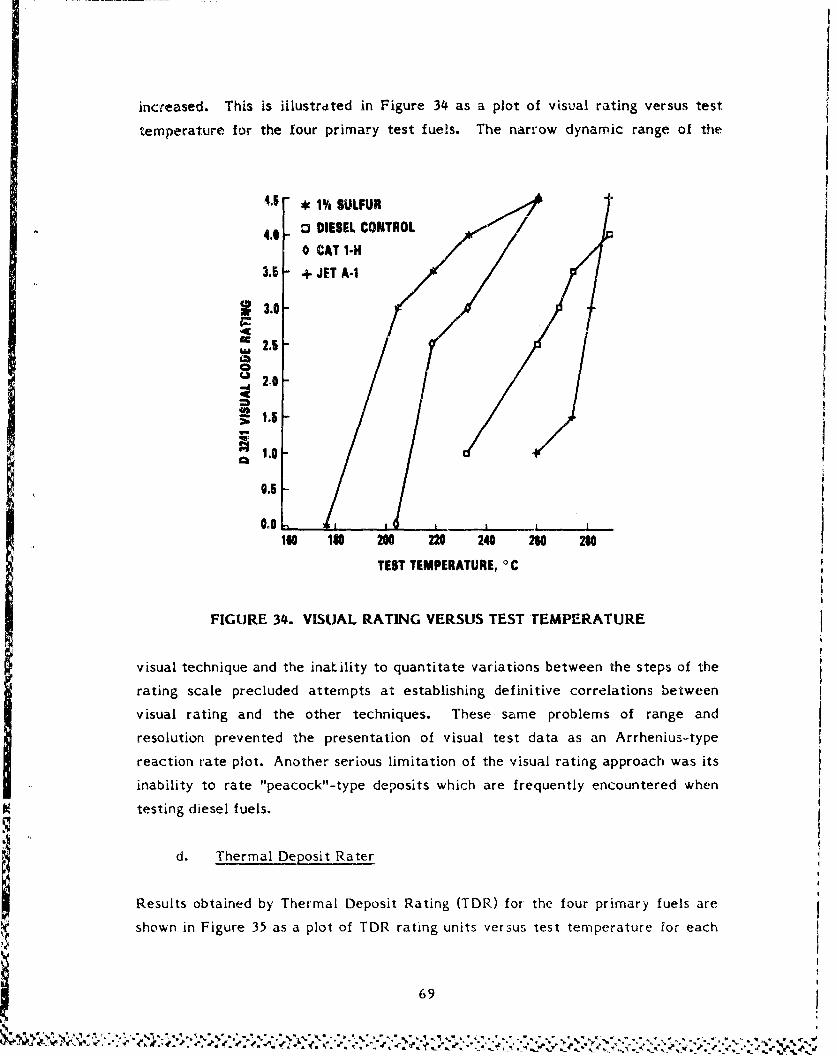
increased. This is illustrated in Figure 34 as a plot of visual rating versus test
temperature for the four primary test fuels. The narrow dynamic range of the
4.6 * 1% SULFUR
4.0 o3 DIESEL CONTROL
0 CAT 1-H
3.5 + JET A-i
S3.0
S2.52,0
S1.5-
12.0
01.5
0.020 2
if$ ISO 200 220 240 260 280
TEST TEMPERATURE, ° C
FIGURE 34. VISUAL RATING VERSUS TEST 'EMPERATURE
visual technique and the inaLility to quantitate variations between the steps of the
rating scale precluded attempts at establishing definitive correlations between
visual rating and the other techniques. These same problems of range and
resolution prevented the presentation of visual test data as an Arrhenius-type
reaction rate plot. Another serious limitation of the visual rating approach was its
inability to rate "peacock"-type deposits which are frequently encountered when
testing diesel fuels.
d. Thermal Deposit Rater
Results obtained by Thermal Deposit Rating (TDR) for the four primary fuels are
shown in Figure 35 as a plot of TDR rating units versus test temperature for each
69
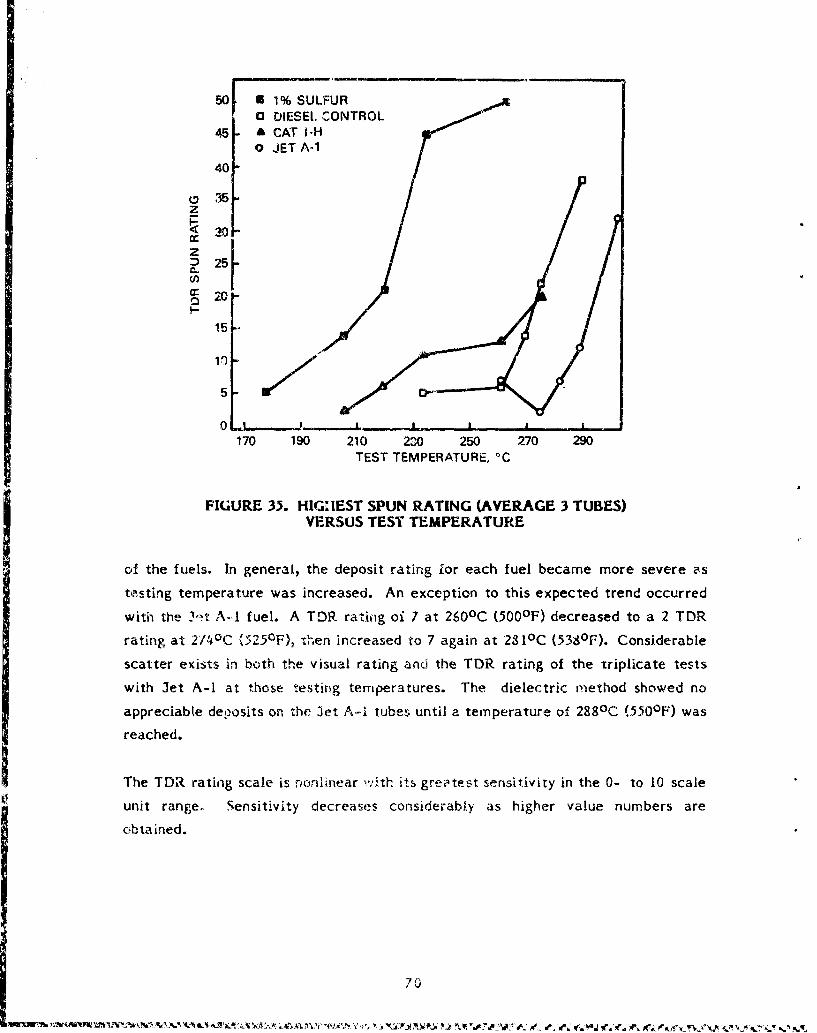
50 U 1% SULFURO DIESEl. CONTROL
45 - & CAT I-H0 JET A-1
40
~35zI-
730
D 25F
a: 20-
15
0 .. J- L170 190 210 230 250 270 290
TEST TEMPERATURE, °C
FIGURE 35. HIG: IEST SPUN RATING (AVERAGE 3 TUBES)VERSUS TEST TEMPERATURE
of the fuels. In general, the deposit rating for each fuel became more severe as
testing temperature was increased. An exception to this expected trend occurred
with the !,-t A-,I fuel. A TDR rathig oi 7 at 260 0 C (500 0 F) decreased to a 2 TDR
rating at 214 0 C (525 0 F), then increased to 7 again at 281 0 C (538 0 F). Considerable
scatter exists in both the visual rating and the TDR rating of the triplicate tests
with Jet A-I at those testing temperatures. The dielectric method showed no
appreciable deposits on the 3et A-i tubes until a temperature of 288 0 C (550 0 F) was
reached.
The TDR rating scale is nonlinear vith its greatest sensitivity in the 0- to 10 scale
unit range. Sensitivity decreases considerably as higher value numbers are
obtained.
70
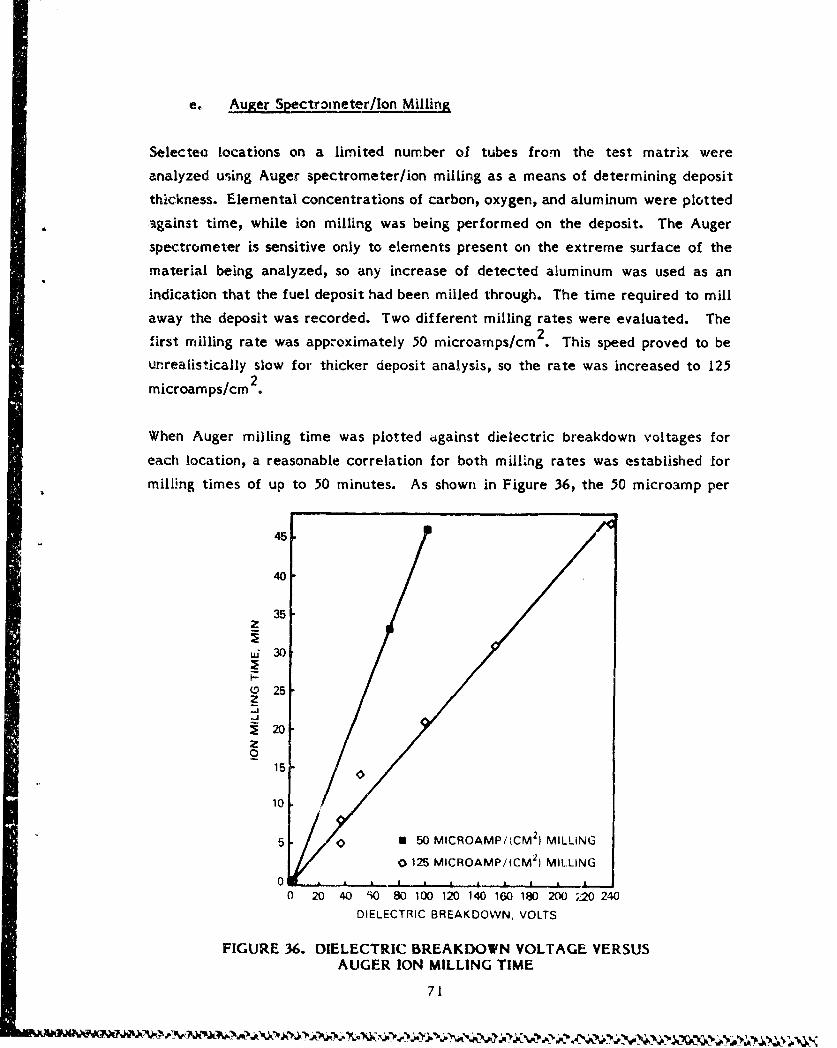
e. Auger Spectroineter/Ion Milling
Selectea locations on a limited number of tubes from the test matrix were
analyzed using Auger spectrometer/ion milling as a means of determining deposit
thickness. Elemental concentrations of carbon, oxygen, and aluminum were plotted
* against time, while ion milling was being performed on the deposit. The Auger
spectrometer is sensitive only to elements present on the extreme surface of the
material being analyzed, so any increase of detected aluminum was used as an
indication that the fuel deposit had been milled through. The time required to mill
away the deposit was recorded. Two different milling rates were evaluated. The2f irst milling rate was approximately 50 microamps/cm . This speed proved to be
unrealistically slow for thicker deposit analysis, so the rate was increased to 125
microamps/cm 2.
When Auger milling time was plotted tigainst dielectric breakdown voltages for
each location, a reasonable correlation for both milling rates was established for
milling times of up to 50 minutes. As shown in Figure 36, the 50 microamp per
45
"40
35z
Lj 30
Q 25z
Z 20
015
10
5 0 50 MICROAMP/(CM 2) MILLING
1 0 125 MICROAMP/(CM2) MILLING
0 - ----0 20 40 90 80 100 120 140 160 180 200 ;20 240
DIELECTRIC BREAKDOWN, VOLTS
FIGURE 36. DIELECTRIC BREAKDOWN VOLTAGE VERSUS
AUGER ION MILLING TIME
71
S= " •)• ••'% ••• " •• • •••,•• %•,••' '• • •NA•"••

cm2 rate indicates a linear removal rate, but insufficient data points were
generated to confirm this linearity. The plot for 125-microamp per cm2 milling
rate shows good linearity for the six points on its plot. If the dielectric voltages
are converted to thickness values based on 350 volts = 1 micrometer of thickness,
the slope of the line for 125 microamps per cm2 indicates a removal rate of 0.014
micrometer per minute of ion milling time. Two data points involving deposits
which required over 2 hours to mill through are not presented in Figure 36. These
two locations required considerably longer milling times than their dielectrically
determined thickness would predict. This may indicate that the plotted line for the
125-microamp per cm2 milling rate begins to deviate from linear response
somewhere between 50 minutes and 120 minutes of milling time. More data points
in this milling time range would be required to establish a definitive milling rate
for these thicker deposits.
f. Comparison of Techniques
None of the rating techniques evaluated is a panacea suitable for universal rating
of thermal oxidation deposits. Under certain conditions, each of the techniques
gives an inaccurate evaluation. The conditions that cause erroneous readings seem,
in most cases, to relate to the formation of "abnormal deposits" which are
distinctively different from the normal varnish-like deposit in coloration, and are
easily differentiated from normal deposits by an experienced rater. The peacock
deposits which are commonly formed when testing diesel fuels appear to be normal
deposits in nature. The peacock coloration is not a true color change in the deposit
itself, instead appearing to be an effect of light passing through layers of deposit
representing one-fourth wavelength multiples of the light's wavelength.
The visual rating approach, while suitable for go/no-go testing requirements based
on prior experience of fuel performance at various rating levels, is unsuitable for
research studies due to its narrow scale range, its subjective color matching, and
its inability to evaluate peacock deposits. Visual rating is, however, an excellent
approach for spotting the "abnormal" deposits which could cause errors in TDR or
dielectric evaluations.
72
The TDR spun rating method is an improvement over the visual rating in several
ways. It has a much broader scale range (0 to 50), is not subjective in nature, and
produces similar readings for different operators. The major weaknesses in the
TDR approach are that a thin dark deposit will be rated just as severely as a
thicker but more transparent deposit. Variations in tube surface finish can affect
tube reflectivity introducing error in the reflected light measurement, and the 0-
to 50-scale of measuring units is nonlinear in response, with reduced sensitivity to
change as the numbers increase in value. These weaknesses make quantitation and
correlation of test results rather difficult.
The dielectric method shows considerable promise as a research tool for compari-
son of deposits. It is not as sensitive to very thin deposits as TDR, but shows
tremendous potential for evaluation of deposits in the range of visual Code 3 and
greater. The only way this method can produce significant errors is if the deposit
has unusual electrical properties as compared to normal deposits. Most deposits
with unusual electrical properties can be detected by comparing dielectric value to
TDR rating. The fact that a deposit produces very low dielectric values but high
TDR values is a strong indication that the deposit is not the normally encountered
varnish-like deposits which function well as electrical insulators and should thus be
classified as abnormal deposits. The major advantage of the dielectric method is
its ability to equate breakdown voltages to approximate thickness and volumes.
The Auger spectrometer/ion milling approach to thickness measurement appears,
from the limited data generated within this program, to have potential to evaluate
deposit thickness. This approach deserves further evaluation as it may prove to be
the best method available for measuring and quantifying the relatively thin
deposits of visual Code 3 and less. The primary disadvantages to this approach is
that it requires access to a very costly instrument that may be unavailable to most
investigators, and the time required to check multiple locations by this approach
can become excessive.
D. Kinetic Studies Utilizing Dielectric Method (Preliminary Application)
. ,Background
Preliminary testing was performed to illustrate the potential research applications
of the dielectric method to studies involving variables that can influence reaction
73
mechanisms or kinetics. These tests were designed to evaluate the effects of
JFTOT tube alloy, test fuel flow rates, and additive blends on deposit formation.
Personnel from SwRI;s Robotics and Automation Section of the Electronic Systems
Division have designed and built a compact, portable prototype system to facilitate
gathering of breakdown voltage data from 3FTOT tubes. This system is known as
the thermal stability Deposit Measuring Device, or DMD. In this system, JFTOT
tubes are inserted into a holder and secured by a thumb screw. The holder has
provisions for rotating the tube from 0 to 360 degrees. A linear translation stage
holds a probe mechanism that can be positioned to an accuracy of 0.1 mm over a
range of about 60 mm, the length of the JFTOT tube deposit region. Thus, the
probe can be positioned accurately at any point on the surface of a deposit on the
tube. A voltage ramp varying from 0 to 900V maximum is applied across a JFTOTsample from electrical connections on the tube holder and the probe. Three
separate analog peak-voltage detector circuits monitor the voltage applied across
the sample. The ranges of the peak detectors ;ar± 0 to 20V, 0 to 200V and 0 to
2000V. An "auto-ranging" control circuit select:: the proper peak detector to
monitor and displays the output of that detecwor on a digital voltage panel meter.
At the point in time of dielectric breakdown of a deposit, the voltage across the
sample dect eases sharply, approaching a short circuit condition. The peak detector
circuit, however, mnaintains the maximum voltage attained, which is the breakdown
voltage. Presently, these data are manually recorded. A sirngle push button is used
to reset the system and initiate the next test. The DMD was used to generate alldielectric data in this section of the report. Thie results of stai.oless -teel versus
aluminum JFTOT tube tests are included in Appendix E.
2. Effects of JFTOT Tube Al!o!,
TLble 30 is a summary of test results obtain,-d when three of the fuels used in the
test inatrix of aluminum tubes were tested u.ing stainless steel JFTOT tubes.
The Cat 1-H fuel, when tested with stainless steel tubes, produced an abnormal
deposit with coltoration ranging from white l:o blue or green tones. The fact that
this unusual deposit was produced on each of the triplicate tests with stainless
steel tubes is strong evidence that thc alloy has affected the ch;iracter of the
74
% e l
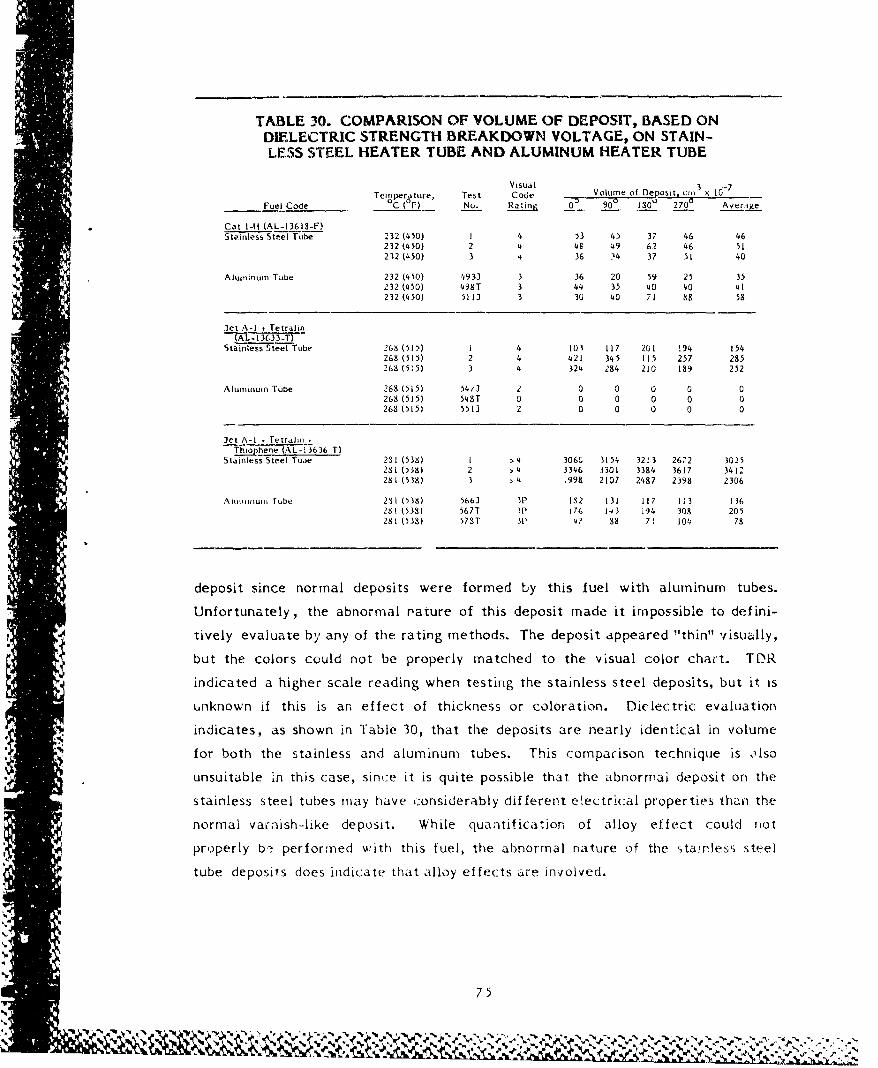
TABLE 30. COMPARISON OF VOLUME OF DEPOSIT, BASED ONDIELECTRIC STRENGTH BREAKDOWN VOLTAGE, ON STAIN-LESS STEEL HEATER TUBE AND ALUMINUM HEATER TUBE
Visual 3Temperature, Test Code Volugme of Deposit cm1 x 1c,
Fuel Code C ( r. Nu. Rating 0_ 90 s0o' 270' Ave rje
Cat I-H (AL-I3618-F)Stdinless Steel Tube 232 (450) I 4 53 45 37 46 46
232 t450) 2 4 48 49 62 46 51232 (450) 3 4 36 14 37 51 40
Aluminum Tube 232 (450) 4933 3 36 20 59 25 35232 (450) 498T 3 44 35 40 40 41232 (450) 511-1 3 30 40 71 88 58
let A-I + Tetralin(A L- -13U3-T)
Stainless Steel Tube 26v (515) 1 4 103 117 201 !94 154268 (515) 2 4 421 345 115 257 285268 (515) 3 4 324 284 210 189 252
Aluminum Tube 268 (515) 54/3 2 0 0 0 0 0268 (515) 548T 0 0 0 0 0 0268 (515) 5513 2 0 0 0 0 0
let A-I * TetralmiThiophene (AL-13636 T)
Stainless Steel Tuie 281 (538) I >4 306C 3154 32!3 2672 3025281 (538) 2 >4 3346 3301 3384 3617 3412281 (538) 3 4 1998 2107 2487 2398 2306
AIluTiinuuu Tube 231 (538) 5663 311 12 131 117 113 136281 (538) 567T 31 176 143 i94 308 205251 (535) 57ST 31, 41 88 71 104 78
deposit since normal deposits were formed ty this fuel with aluminum tubes.
Unfortunately, the abnormal nature of this deposit made it impossible to defini-
tively evaluate by any of the rating methods. The deposit appeared "thin" visually,
but the colors could not be properly matched to the visual color chart. TDR
indicated a higher scale reading when testing the stainless steel deposits, but it is
unknown if this is an effect of thickness or coloration. Diclectric evaluation
"indicates, as shown in Table 30, that the deposits are nearly identical in volume
for both the stainless and aluminum tubes. This compacison technique is Olso
*unsuitable in this case, since it is quite possible that the abnormai deposit on the
stainless steel tubes may have considerably different e~ectrical properties than the
normal varnish-like deposit. While quantification of alloy effect could not
properly br performed with this fuel, the abnormal nature of the stanles; steel
tube deposits does indicate that alloy effects are involved.
S7 5
N k,-
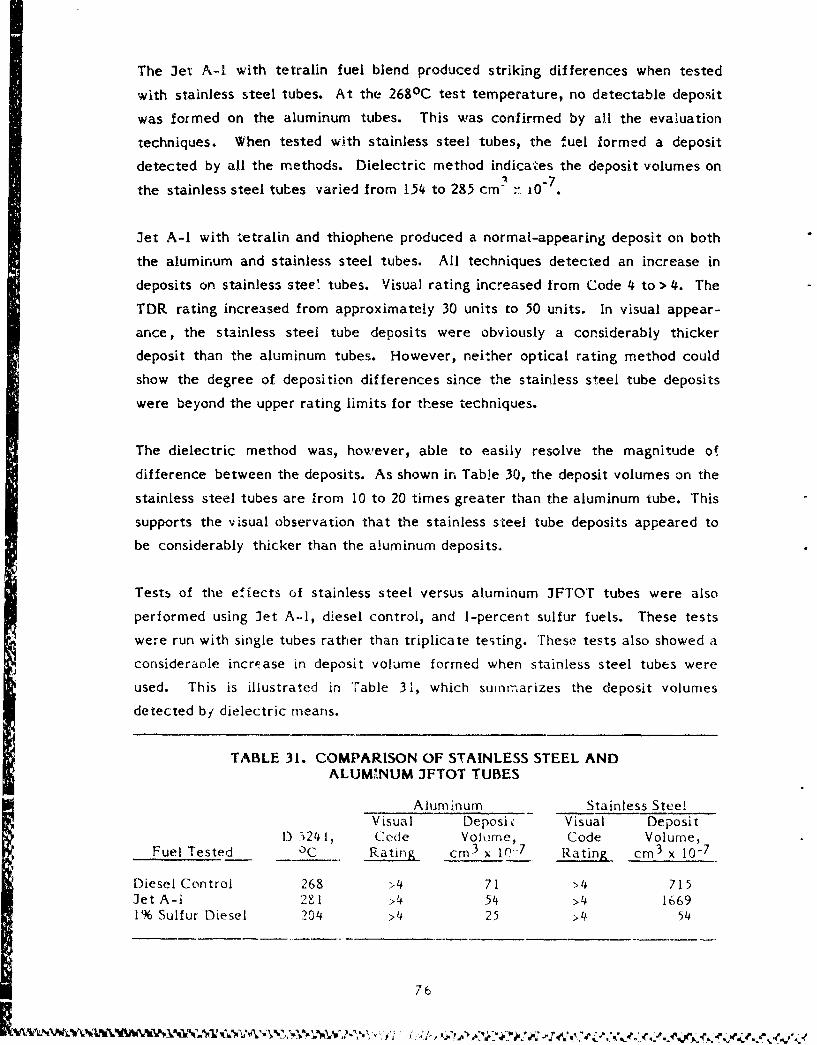
The Jet A-I with tetralin fuel blend produced striking differences when tested
with stainless steel tubes. At the 2680 C test temperature, no detectable deposit
was formed on the aluminum tubes. This was confirmed by all the evaluation
techniques. When tested with stainless steel tubes, the fuel formed a deposit
detected by all the methods. Dielectric method indicates the deposit volumes on- -7
the stainless steel tubes varied from 154 to 285 cm r 10"
Jet A-I with tetralin and thiophene produced a normal-appearing deposit on both
the aluminum and stainless steel tubes. All techniques detected an increase in
deposits on stainless stee' tubes. Visual rating increased from Code 4 to > 4. The
TDR rating increased from approximately 30 units to 50 units. In visual appear-
ance, the stainless steel tube deposits were obviously a considerably thicker
deposit than the aluminum tubes. However, neither optical rating method could
show the degree of deposition differences since the stainless steel tube deposits
were beyond the upper rating limits for these techniques.
The dielectric method was, however, able to easily resolve the magnitude of
difference between the deposits. As shown irn Table 30, the deposit volumes on the
stainless steel tubes are from 10 to 20 times greater than the aluminum tube. This
supports the visual observation that the stainless steel tube deposits appeared to
be considerably thicker than the aluminum deposits.
Tests of the effects of stainless steel versus aluminum JFTOT tubes were also
performed using Jet A-I, diesel control, and 1-percent sulfur fuels. These tests
were run with single tubes rather than triplicate testing. These tests also showed a
consideranle increase in deposit volume formed when stainless steel tubes were
used. This is illustrated in 'Fable 31, which summarizes the deposit volumes
detected by dielectric means.
TABLE 31. COMPARISON OF STAINLESS STEEL ANDALUMnNUM JFTOT TUBES
Aluminum Stainless SteelVisual Deposi c Visual Deposit
D 3241, Code Volume, Code Volume,Fuel Tested 0 C Rating cm 3 x 1P 7 Rating cm 3 x 10⁻⁷
Diesel Control 268 >4 71 >4 715Jet A-i 281 ->4 54 >4 16691% Sulfur Diesel 204 >4 25 >4 54
76
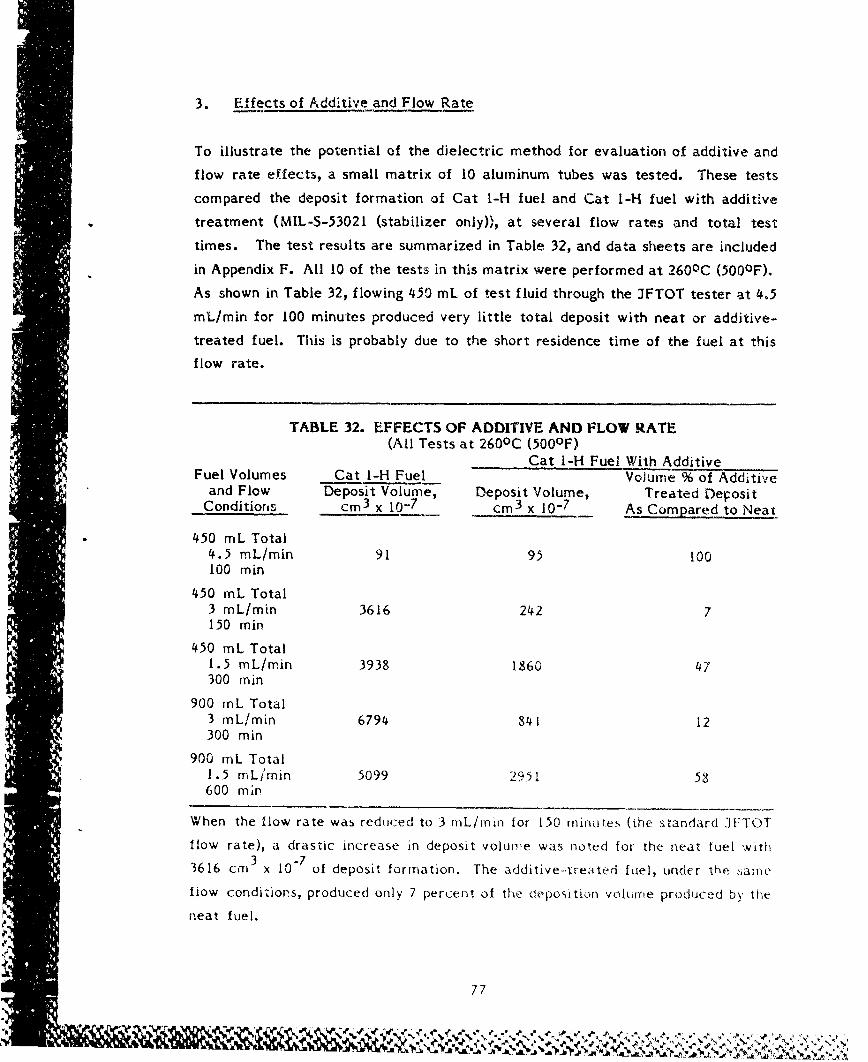
3. Effects of Additive and Flow Rate
To illustrate the potential of the dielectric method for evaluation of additive and
flow rate effects, a small matrix of 10 aluminum tubes was tested. These tests
compared the deposit formation of Cat 1-H fuel and Cat I-H fuel with additive
treatment (MIL-S-53021 (stabilizer only)), at several flow rates and total test
times. The test results are summarized in Table 32, and data sheets are included
in Appendix F. All 10 of the tests in this matrix were performed at 2600 C (500 0 F).
As shown in Table 32, flowing 450 mL of test fluid through the JFTOT tester at 4.5
mL/min for 100 minutes produced very little total deposit with neat or additive-
treated fuel. This is probably due to the short residence time of the fuel at this
flow rate.
TABLE 32. EFFECTS OF ADDITIVE AND FLOW RATE(All Tests at 260 0C (500 0 F)
Cat I-H Fuel With AdditiveFuel Volumes Cat I-H Fuel Volume % of Additive
and Flow Deposit Volume, Deposit Volume, Treated DepositConditions cm3 x 10-7 cm 3 x 10⁻⁷ As Compared to Neat
450 mL Total4.5 mL/min 91 95 100100 min
450 mL Total3 mL/min 3616 242 7150 min
450 mL Total1.5 mL/min 3938 1860 47300 min
900 mL Total3 mL/min 6794 841 12300 min
900 rnL Total1.5 mL/min 5099 2951 58"600 min
When the flow rate was reduced to 3 mL/min for 150 "i*nues (the standard IFTOT
flow rate), a drastic increase in deposit volume was noted for the neat fuel with
3616 cm 3 x 10"7 of deposit formation. The additive-.reated fuel, unkr th'e
hiow conditions, produced only 7 percent of the deposition volume produced by thi
neat fuel.
77
a ~ p X ¶.S'IS N S 'L t76r , L w .
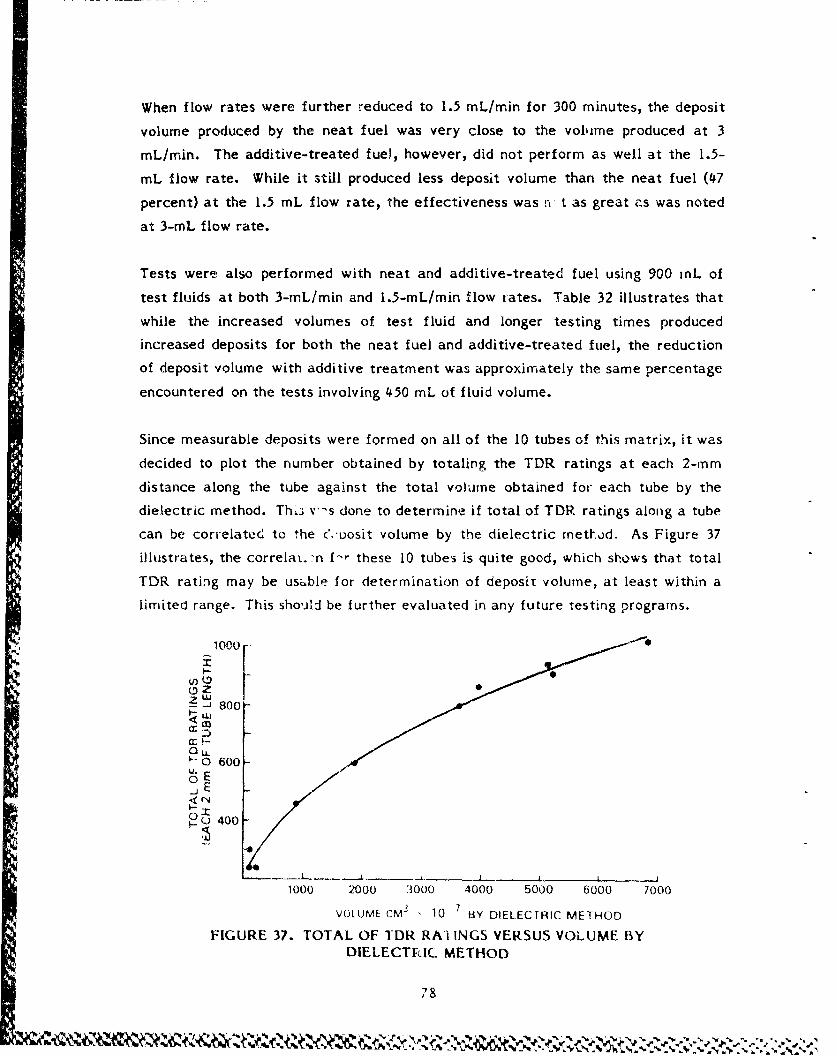
When flow rates were further reduced to 1.5 mL/min for 300 minutes, the deposit
volume produced by the neat fuel was very close to the volume produced at 3
mL/min. The additive-treated fuel), however, did not perform as well at the 1.5-
mL flow rate. While it still produced less deposit volume than the neat fuel (47
percent) at the 1.5 mL flow rate, the effectiveness was n• t as great as was noted
at 3-mL flow rate.
Tests were also performed with neat and additive-treated fuel using 900 inL of
test fluids at both 3-mL/min and 1.5-mL/min flow rates. Table 32 illustrates that
while the increased volumes of test fluid and longer testing times produced
increased deposits for both the neat fuel and additive-treated fuel, the reduction
of deposit volume with additive treatment was approximately the same percentage
encountered on the tests involving 450 mL of fluid volume.
Since measurable deposits were formed on all of the 10 tubes of this matrix, it was
decided to plot the number obtained by totaling the TDR ratings at each 2-ram
distance along the tube against the total volume obtained for each tube by the
dielectric method. Th,; v-s done to determine if total of TDR ratings along a tube
can be correlated to the c','uosit volume by the dielectric metod. As Figure 37
illustrates, the correlai. 'n f-r these 10 tubes is quite good, which shows that total
TDR rating may be uszble for determination of deposit volume, at least within a
limited range. This should be further evaluated in any future testing programs.
1000[
g 800
r 2-or-
0Q 600U.
6E
OX
. 400
1000 2000 3000 4000 5000 6000 7000
VOLUME CM3 , 10 7 BY DIELECTRIC METHOD
FIGURE 37. TOTAL OF TDR RAI INGS VERSUS VOLUME BYDIELECTFIC METHOD
78
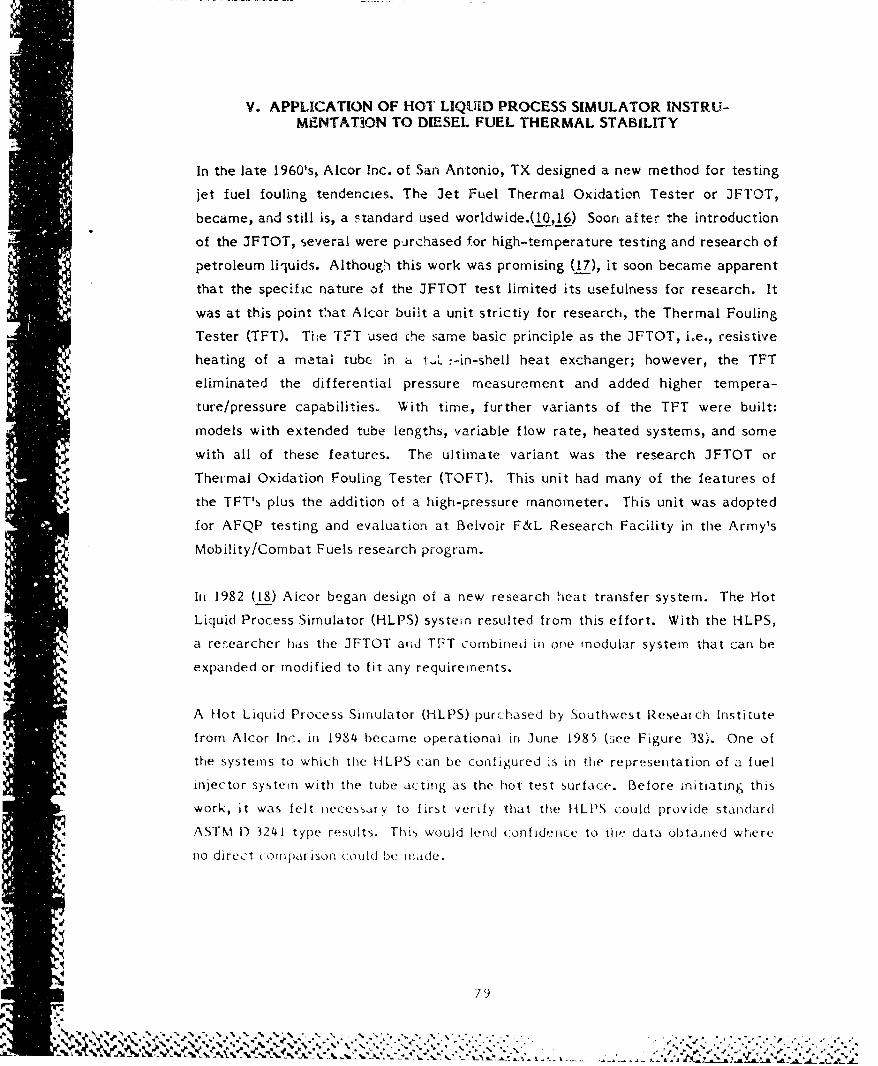
V. APPLICATION OF HOT LIQUID PROCESS SIMULATOR INSTRU-MENTATION TO DIESEL FUEL THERMAL STABILITY
In the late 1960's, Alcor Inc. of San Antonio, TX designed a new method for testing
jet fuel fouling tendencies. The Jet Fuel Thermal Oxidation Tester or JFTOT,
became, and still is, a standard used worldwide.(10,16) Soon after the introduction
of the JFTOT, several were porchased for high-temperature testing and research of
petroleum liquids. Althoughi this work was promising (17), it soon became apparent
that the specific nature of the JFTOT test limited its usefulness for research. It
was at this point that Alcor built a unit strictly for research, the Thermal Fouling
Tester (TFT). The TFT used che same basic principle as the JFTOT, i.e., resistive
heating of a metal tube in a ':L :-in-shell heat exchanger; however, the TFT
eliminated the differential pressure measurement and added higher tempera-
ture/pressure capabilities. With time, further variants of the TFT were built:
models with extended tube lengths, variable flow rate, heated systems, and some
with all of these features. The ultimate variant was the research JFTOT or
Thermal Oxidation Fouling Tester (TOFT). This unit had many of the features of
the TFT's plus the addition of a high-pressure manometer. This unit was adopted
for AFQP testing and evaluation at Belvoir F&L Research Facility in the Army's
Mobility/Combat Fuels research program.
In 1982 (18) Alcor began design of a new research heat transfer system. The Hot
Liquid Process Simulator (HLPS) system resulted from this effort. With the HLPS,
a researcher has the JFTOT and TFT combined iM one modular system that can be
expanded or modified to fit any requirements.
A Hlot Liquid Process Simulator (HLPS) purchased by Southwest Reseatch Institute
from Alcor Inc. in 1984 became operational in June 1985 (see Figure 38). One of
the systems to which the HLPS can be configured Is in the representation of a fuel
injector system with the tube acting as the hot test surface. Before initiating this
work, it was felt nec.essary to first verify that the ttLPS could provide standard
ASTM 1) 3241 type results. This would lend confidence to tlh, data obtained where
no direct comparison could be in'de.
d
79
oI'l[Im '
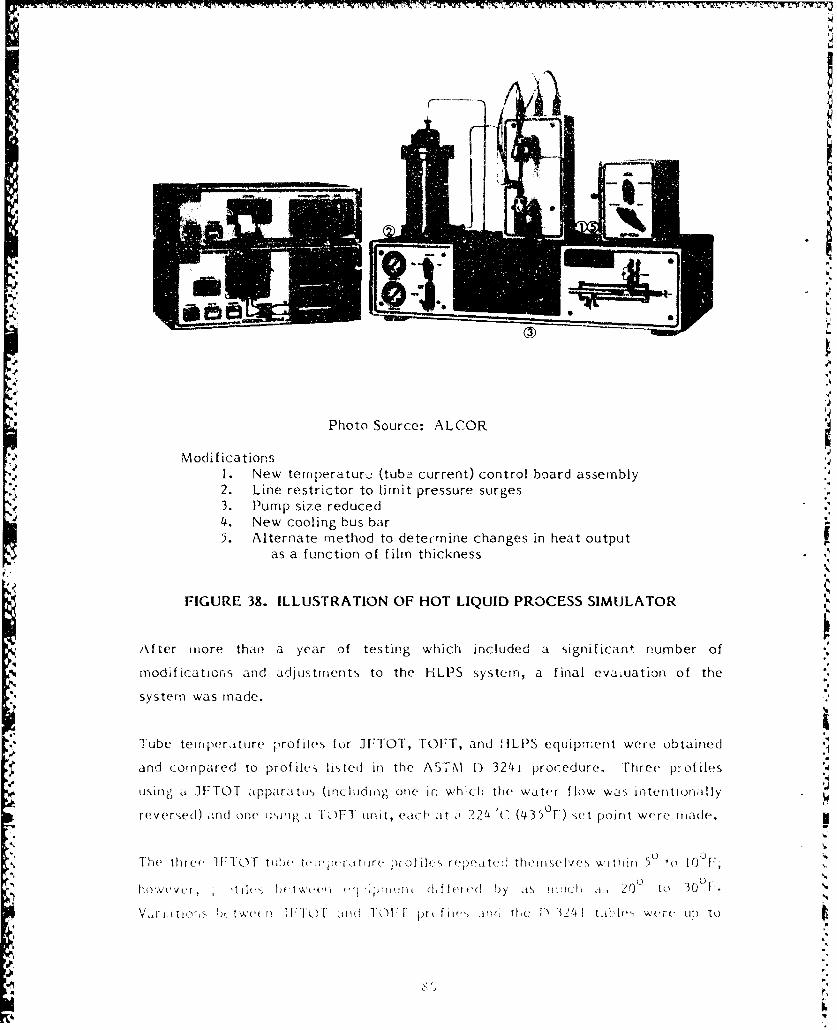
U I
Photo Source: ALCOR
Modi ficationsI. New temperature: (tub2 current) control board assembly2. Line restrictor to limit pressure surges3. Purnp size reduced4. New cooling bus bar5. Alternate method to deter-mine changes in heat output
as a function of film thickness
FIGURE 38. ILLUSTRATION OF HOT LIQUID PROCESS SIMULATOR
After inore than a year of testing which included a significanw number of
modifications and adjustments to the HLPS system, a final evaluation of the
systemn was mnade.
Tube temnper•,tUre: profiles for 3F'TOT, TOFT, and HLPS equ~ipmenCrt were obtained
and comnpared to profiles listed in the AWT\ 1) 3241i procedure. Three p: ofile--s
kj11ý ig ]F31TOT •.ippar t [I, (inclu~ding• one ir, wh:c-h the water flow was intentioniffly
reverý,ed) ',nd one using a F'01:T unit, e•c+, at 0! 22!4 •C (4 3 5°oF) Set point we.re m~ade.
The thre(,, I T . tu!)(, t,,•iij ,r..tiir( profil•.,- repc)•,tte!! theil"s, ve•, w-'thiil 5' o 10'-[
'V r
d~fete ý) iý m~j-h ,, 0 C 3
r 'ttIo , v )1' 11d To I 1 )r ,etl 'I " 1
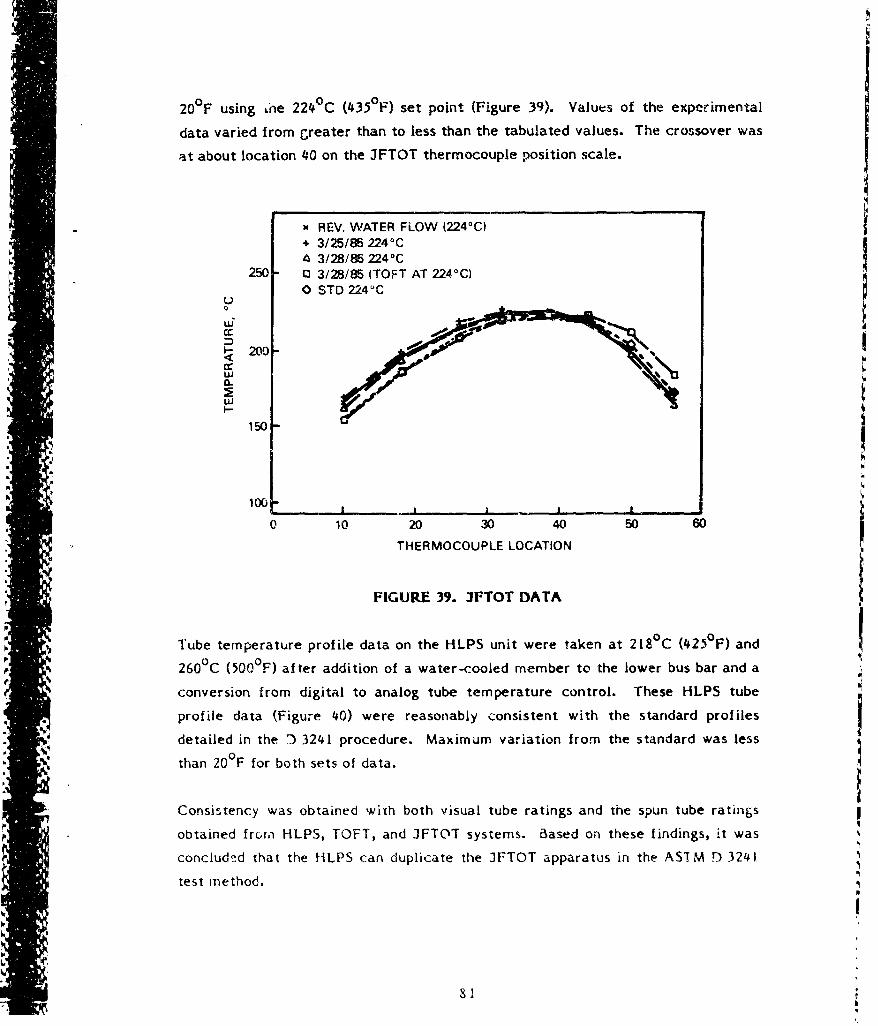
20°F using Lne 224 0 C (435 0 F) set point (Figure 39). Values of the experimental
data varied from Greater than to less than the tabulated values. The crossover was
at about location 40 on the 3FTOT thermocouple position scale.
x REV. WATER FLOW (2240C)+ 3/25/85 2240 C"& 3/28/85 224 0C
250 E3 3/28/85 (TOFT AT 2240 C)0 STD 224 0C
'1 150
100
0 10 20 30 40 50 60
THERMOCOUPLE LOCATION
FIGURE 39. 3FTOT DATA
Tlube temperature profile data on the KLPS unit were taken at 218 0 C (425$°F) and
260°C (500°F) after addition of a water-cooled member to the lower bus bar and a
conversion from digital to analog tube temperature control. These HLPS tube
profile data (Figure 40) were reasonably consistent with the standard profiles
detailed in the ) 3241 procedure. Maximum variation from the standard was less)• than 20°F for both sets of data.
Consistency was obtained with both visual tube ratings and the spun tube ratings
obtained fromr HLPS, TOFT, and JFTOT systems. Based on these findings, it was
concludi:d that the HLPS can duplicate the JFTOT apparatus in the ASIM D 324)
test method.
81
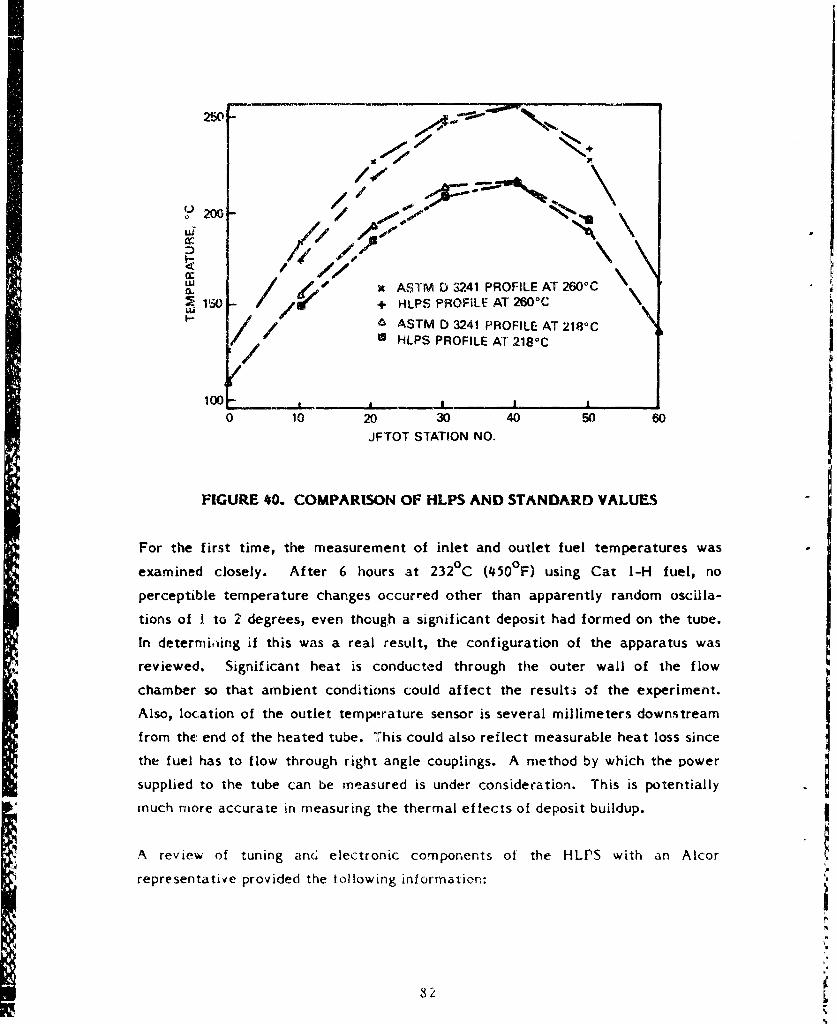
250-
/4-r_
<%. w % \\~200-/
: x ASTM D 3241 PROFILE AT 260°CL130 + " HLPS PROFILE AT 2600C
& ASTM D 3241 PROFILE AT 218°C
,l HLPS PROFILE AT 218-C
/,
100 - ._ L I I
0 10 20 30 40 50 60JFTOT STATION NO.
FIGURE 40. COMPARISON OF HLPS AND STANDARD VALUES
For the first time, the measurement of inlet and outlet fuel temperatures was
examined closely. After 6 hours at 232 C (450°F) using Cat I-H fuel, no
perceptible temperature changes occurred other than apparently random oscilla-
tions of I. to 2 degrees, even though a significant deposit had formed on the tuDe.
In determining if this was a real result, the configuration of the apparatus was
reviewed. Significant heat is conducted through the outer wall of the flow
chamber so that ambient conditions could affect the results of the experiment.
Also, location of the outlet temperature sensor is several millimeters downstream
from the: end of the heated tube. This could also reflect measurable heat loss since
the fuel has to flow through right angle couplings. A method by which the power
supplied to the tube can be measured is under consideration. This is potentially
much more accurate in measuring the thermal effects of deposit buildup.
A review of tuning an( electronic components of the HLPS with an Alcor
representative provided the tollowing information:
82
-!. The gain and proportional bands (PB) are related in that the gain
controls total power (current) available (via the SCR) to heat the tube
while the PB indicates the percent of attenuated power being used.
IThus, to obtain a higher PB reading, the gain must be reduced.
2. The gain control regulates avai.able SCR triggering from 4 to 20 ma In
the second of two control loops. Minor adjustments to the first loop
may be obtained using a front panel control.
3. Location of the gain control is next to and either above or behind the
bias control depending on whether the caicUt board is vertically or
horizontally mounted.
4. When lowering the gain control significantly, the PB should be reduced
to less than 50 percent using the keypads. If the gain still needs to be
reduced and the PB has gone over 90 percent, the keypad to reduce the
PB. All changes should be made in the manual mode.
S5. The bias control is adjusted so that a zero volt output will be obtained
when "out I" is a zero percent.
6. Normal settings are PB 80-90 percent, rate .01 (should be kept there),
reset 4.5. The latter controls the number of times per minute control
calculations are applied to adjust instrument conditions.
7. Calibration mode of the control module (Obtained by pressIkig the upper
right and lower left keypads simultaneously) will reset the EROM
(working memory) to the same conditions prescribed by the base
memory.
8. Data output units may be changed, e.g., from OF to °C by first pressiig
sir: ultaneously the upper left and upper and lower right keypads of the
control module. Press the upper left keypad ur til the parameters to be
changed appear on the LED s;creen, then press the forward backward
keypad,.; until the appropriate unit appears (C,F, etc.). Exit to ihe
83
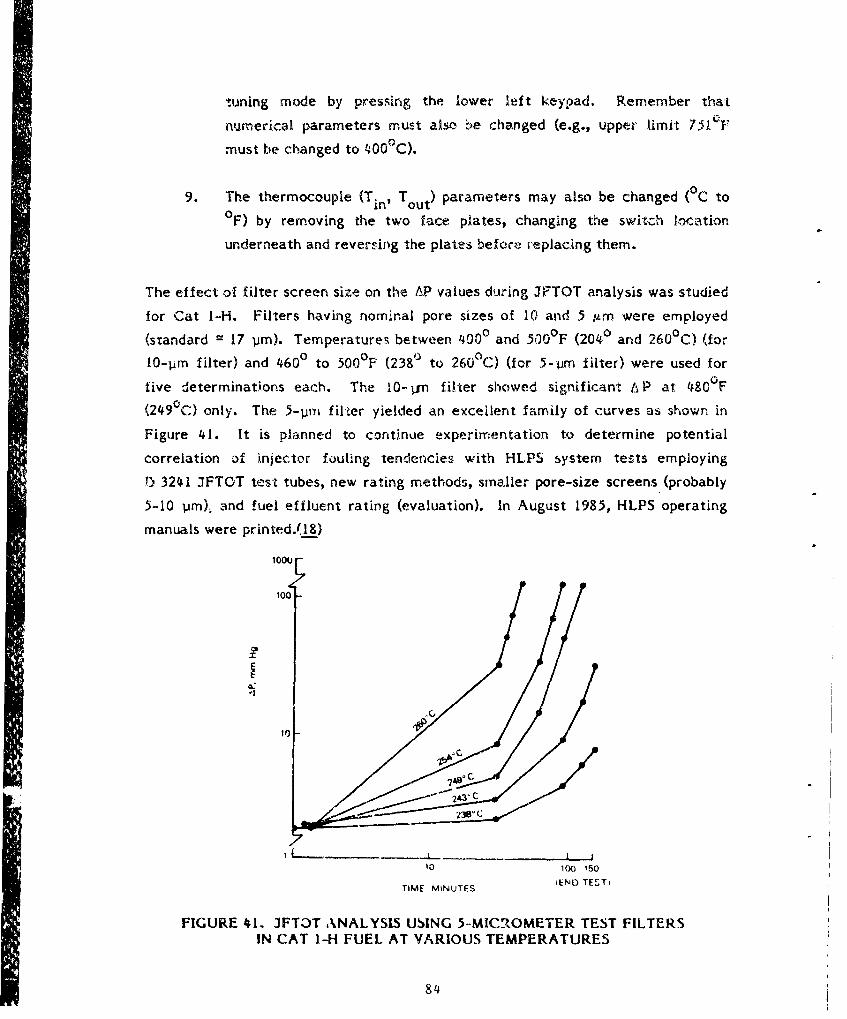
"tuning mode by pressing the lower left keypad. Remember that
numerical parameters must also te changed (e.g., upper limit 7510 F
must be changed to 400°C).
9. The thermocouple (Tin, T out) parameters may also be changed (°C toOF) by removing the two face plates, changing the switch location
underneath and reversing the plates before ireplacing them.
The effect of filter screen size on the AP values during JFTOT analysis was studied
for Cat I-H. Filters having nominal pore sizes of 10 and 5 1Am were employed
(standard = 17 pim). Temperatures between 4000 and 500O0F (2040 and 260 0 C) (for
il-pnm filter) and 4600 to 500 0 F (238' to 260'C) (for 5- 'm filter) were used for
rive determinations each. The 10-11n filter showed significant A P at 480 0 F
(249 0 CC) only. The 5-1 im filter yielded an excellent family of curves as shown in
Figure 41. It is planned to continue experimentation to determine potential
"correlation of injector fouling tendencies with HLPS system tests employing
1) 3241 JFTOT test tubes, new rating methods, smaller pore-size screens (probably
5-10 arn), and fuel effluent rating (evaluation). In August 1985, HLPS operating
manuals were printed.(18)
1000ý
1001- 1
TIME MNUTES END TErTi
FIGURE 41. JFT3TANALYSLS USING 5-MICrkOMETER TEST FILTERS
IN CAT I-H FUEL AT VARIOUS TEMPERATURES
84
VI. SUMMARY AND CONCLUSIONS
Experience "-,r with the Injector Fouling Bench Test (IFBT) using the CLR-D
injectors and the DD 6V-53T injectors suggest that this is a viable approach to
evaluate the deposit-forming tendencies of diesel fuels at elevated temperatures.
The CLR-D hot engine test injector evaluations are difficult to reproduce on the
IFBT due to combustion products' (including lubricants) contribution to injector
tip/hole deposits. The injector tip hole plugging (fouling) in the engine tests (and
IFBT) is a very random event which is difficult to repeat. Deposition on the
injector pintle and in the holes of the injector body tip should receive the major
evaluation emphasis as a function of injector fouling.
Fuel thermal instability products contributing to injector (internal and external) tip
deposits are complicated by both fuel combustion and lubricant combustion
phenomena. These "carbon residue" evaluations which contribute to injector and
nozzle fouling would be better evaluated in microburner residue tests.
Visual rating methods for both IFBT and JFTOT tests lack sufficient quantitationand dynamic range to be very useful in evaluating the thermal stability of dieselfuels. Air flow techniques for measuring injector hole deposition are being adopted
for further evaluation in future IFBT tests. Both TDR Spun and dielectric strength
breakdown voltage provide a better quantitative measure of pintle deposits and
I3 JFTOT test tube deposits.
85
85

VR. RECOMMENDATIONS
Effort in this program in the near term should be focused on an expanded data
matrix which would include very unstable fuels (including fluid catalytic cracked--
light cycle oil) as well as the high-sulfur referee and Cat I-H engine reference
fuels. Temperature severity in IFBT tests must cover a sufficient range and
duration for correlating with 3FTOT-type tests. Engine testing, if done at all,
should utilize an air-cooled engine capable of operating over a range of injector
temperatures, both above and below that of the CLR-D hot engine test injector
temperature range. Test fuel flow regimes, test surface metailurgy, and fuel
additives should be important considerations in IFBT/JFTOT-type test correlations
leading to the recommendation for fuel specification test and test limit definition.
In the long term, both bench test and modified JFTOT-type testing need to be
expanded from compression-ignition engine injector considerations to include the
ground turbine nozzle (in AGT-1500 engines) which utiiize diesel fuels.
Limitation of the dielectric strength breakdown voltage technique for quantitating
high-temperature deposit needs to be explored and defined.
86
Yvm. REFERENCES
1. MacDonald, J.W. and Jones, R.T., "Predictive Type Tests for Storage
Stability and Compatibility of Diesel Fuels," STP No. 244, pp. 5-14, 1916
Race St., Philadelphia, PA, February 1959.
2. LePera, M.E., "Thermal-Oxidative Stability of Automotive Diesel Fuels,"
CCL Report No. 321, Interim Report, Coating and Chemical Laboratory,
Aberdeen Proving Ground, MD, February 1973.
3. Final Letter Report of Research Test of Diesel Fuel Injector Fouling
Tendencies, RDT&E No. (not available), USATECOM No. 7-EG-535-000-003,
30 October 1969.
4. Letter Report AMXSH-TP From Sharpe Army Depot Dated 7 November 1967,
Subject: Diesel Fuel Contamination at Camp Pendleton.
5. "Interim Progress Report on Whitman AFB Missile Site Fuels," U.S. Army
Fuels and Lubricants Research Laboratory, San Antonio, TX, 6 February
1968.
6. Stavinoha, L.L., Westbrook, S.R., and Brinkman, D.W., "Accelerated Stability
Test Techniques for Diesel Fuels," DOE/B-/10043-12, U.S. Department of
Energy, October 1980.
7. Stavinoha, L.L. and Westbrook, S.R., "Accelerated Stability Test Techniques
for Middle Distillate Fuels," Distillate Fuel Stability and Cleanliness, ASTM
STP 751, L.L. Stavinoha arid C.P. Henry, eds., American Society for Testing
and Materials, pp. 3-21, 1981.
8. Stavinoha, L.L. and LePera, M.E., "A Review of Diesel Fuel Deterioration
and Related Problems," Interim Report AFLRF No. 88, AD A043566, May
1977.
9. Stavinoha, L.L., Westbrook, S.R., and LePera, M.E., "Army Needs for Diesel
Fuel Stability and Cleanliness," Distillate Fuel Stability and Cieanliness,
87
ASTM STP 751, L.L. Stavinoha and C.P. Henry, eds., American Society for
Testing and Materials, pp. 103-125, 1981.
10. Bert, J.A. and Painter, L., "JFTOT--A New Fuel Thermal Stability Test" (A
Summary of Coordinating Research Council Activity), SAE Paper No. 730385,
1973.
11. Martel, C.R. and Bradley, R.P., "Comparison of Rating Techniques for JFTOT
Heater Tube Deposits," NTIS No. AD-A023524, October 1975.
12. Purvis, W.3. and Meehan, R.J., "Evaluation of Jet Fuel Deposit Kinetics - Lot
IV,"' NAPC-PE-107C, March 1984, Naval Air Propulsion Center, Trenton, NJ.
13. Vere, R.A., "Aviation Fuel Thermal Stability Measurements," Proceedings of
Conference on Long-Term Storage Stabilities of Liquid Fuels, Nahum Por,
editor, December 1983.
14. Datschef ski, D. and Farthing, T.G.R., "Evaluation of JFTOT Tube Deposits by
Carbon Burnoff," SAE Paper No. 851994.
15. Kendall, D.R. and Mills, J.S., "The Influence of JFTOT Operating Parameters
on the Assessments of Fuel Thermal Stability," SAE Paper No. 851871,
SP-633, Society of Automotive Engineers, October 1985.
16. ASTM D 3241-82, "Test Method for Therrm~al Oxidation Stability of Aviation
Turbine Fuels" (JFTOT Procedure), American Society for Testing and Mate-
rials, Current Editing Approved 27 August 1982, Published October 1982,
Originally Published as D 3241.73T.
i7. JFTOT Evaluation Panel, "Research Technique for Thermal Stability by
Modified Jet Fuel Thermal Oxida ion Test (JFTOT)," CRC Project No.
CA-43-67, October 1977, Coordinating Research Council, Inc., New York,
NY.
18. "HLPS I," Operalion Manual, Alcor, Inc., March 1985.
88

U
APPENDIX A
CLR-D HOT TEST
894L
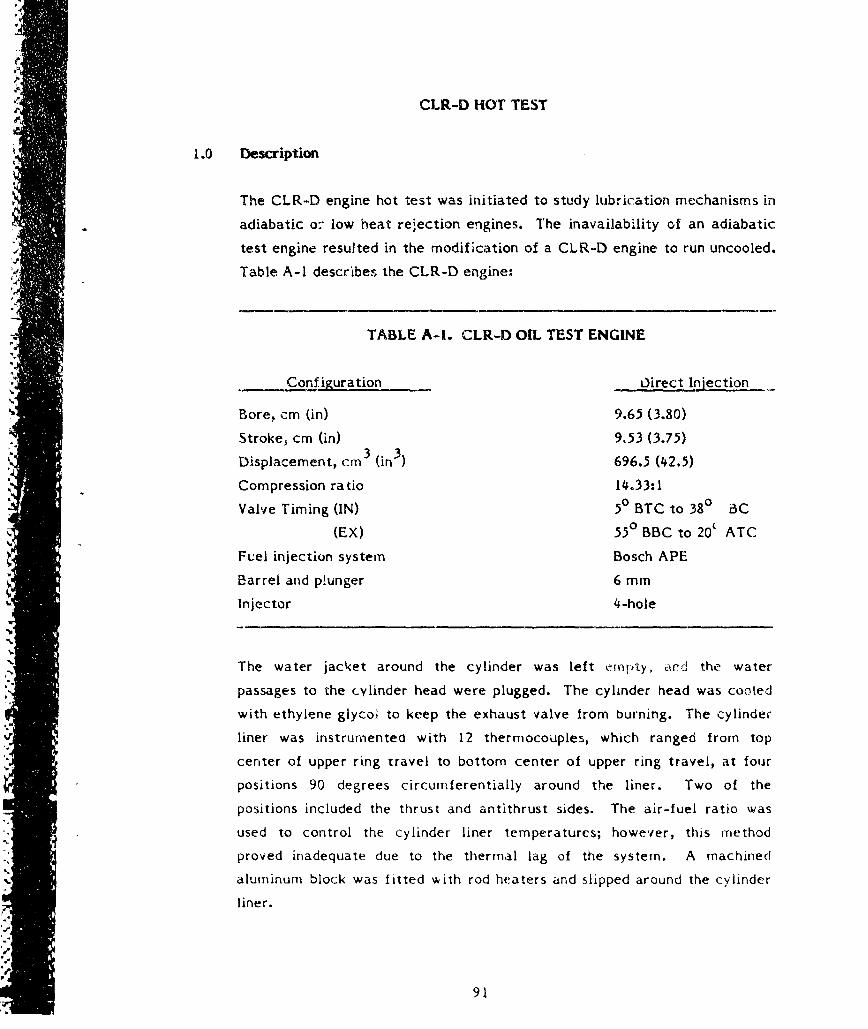
CLR-D HOT TEST
1.0 Description
The CLR-D engine hot test was initiated to study lubrication mechanisms in
adiabatic o: low heat rejection engines. The inavailability of an adiabatic
test engine resulted in the modification of a CLR-D engine to run uncooled.
Table A-i describes the CLR-D engine:
TABLE A-I. CLR-D OIL TEST ENGINE
Configuration 0irect Injection
Bore, cm (in) 9.65 (3.80)
Stroke, cm (in) 9.53 (3.75)
Displacement, cm3 (in ) 696.5 (42.5)
Compression ra tio 14.33:1
Valve Timing (IN) 5 BTC to 38 i3C
(E x) 550 BBC to 20' ATC
Fuel injection system Bosch APE
Barrel and p!unger 6 mm
Injector 4-hole
"The water jacket around the cylinder was left emnplty, and the water
- passages to the cylinder head were plugged. The cylinder head was cooled
with ethylene glycoi to keep the exhaust valve from burning. The cylindei.
liner was instrumentea with 12 thermocouples, which ranged from top
center of upper ring travel to bottom center of upper ring travel, at four
positions 90 degrees circumferentially around the liner. Two of the
positions included the thrust and antithrust sides. The air-fuel ratio was
used to control the cylinder liner temperatures; however, this method
proved inadequate due to the thermal lag of the system. A machined
aluminum block was fitted ,ith rod heaters and slipped around the cylinder
liner.
9.1
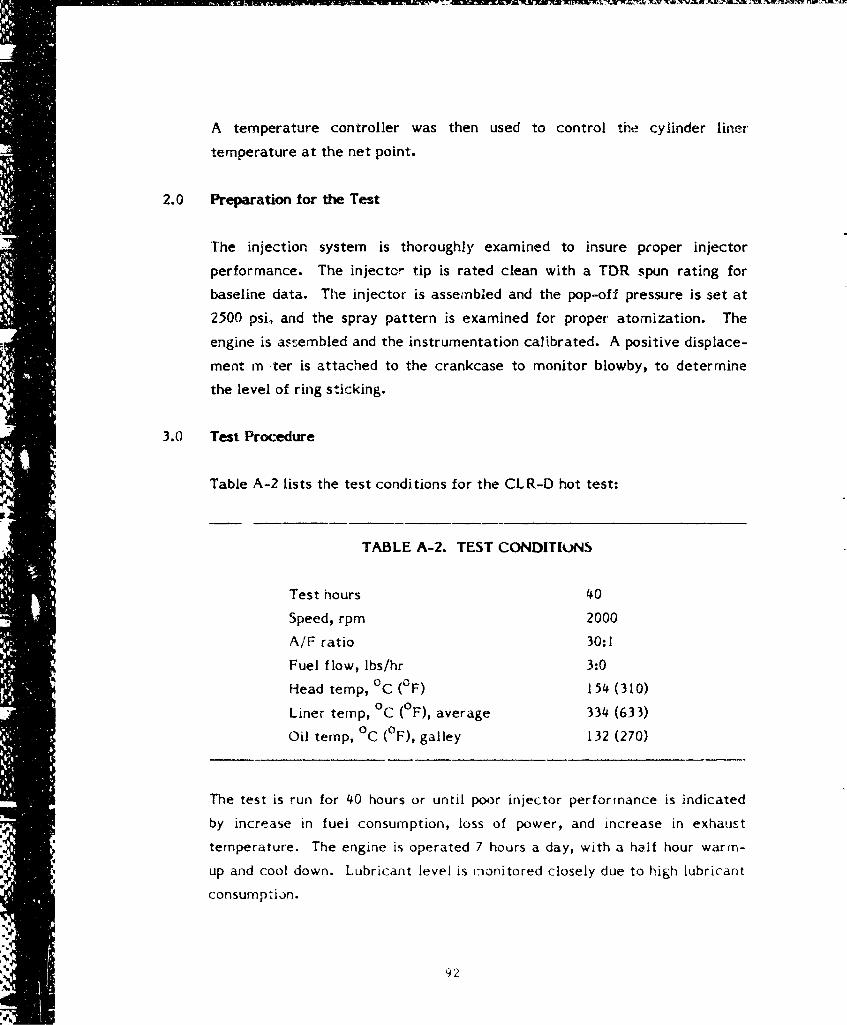
A temperature controller was then used to control the cylinder liner
temperature at the net point.
2.0 Preparation for the Test
The injection system is thoroughly examined to insure proper injector
performance. The injector tip is rated clean with a TDR spun rating for
baseline data. The injector is assembled and the pop-off pressure is set at
2500 psi, and the spray pattern is examined for proper atomization. The
engine is assembled and the instrumentation calibrated. A positive displace-
ment rn ter is attached to the crankcase to monitor blowby, to determine
the level of ring sticking.
3.0 Test Procedure
Table A-2 lists the test conditions for the CLR-D hot test:
TABLE A-2. TEST CONDITIUNS
Test hours 40
Speed, rpm 2000
A/F ratio 30:1
Fuel flow, lbs/hr 3:0
Head temp, 0 C (OF) 154 (310)
Liner temp, °C (OF), average 334 (633)
Oil ternp, 0 C (OF), galley 132 (270)
The test is run for 40 hours or until poor injector performance is indicated
by increase in fuel consumption, loss of power, and increase in exhaust
temperature. The engine is operated 7 hours a day, with a half hour warm-
up and cool down. Lubricant level is rilonitored closely due to high lubricant
consumption.
92
4:M
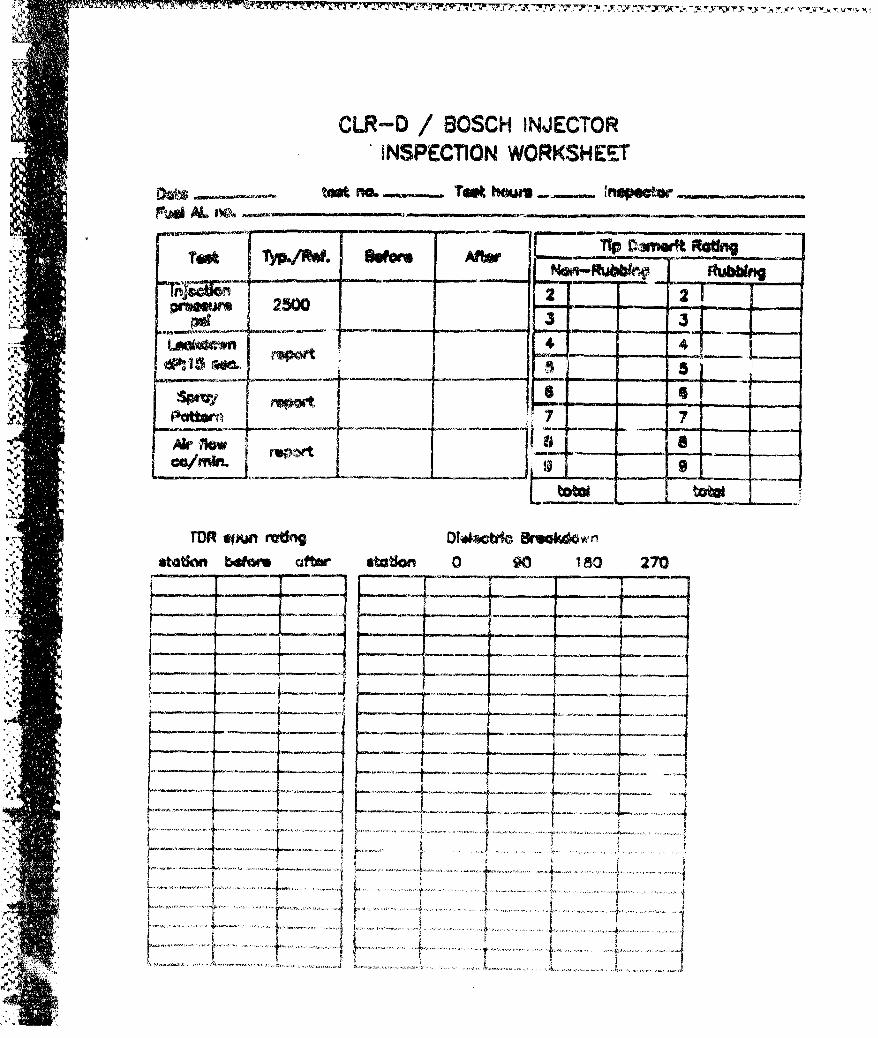
CLR-D / BOSCH INJECTORINSPECTION WORKSHEET
Fbva AL~ flewiw S w a~w
=Totn TY40O "Far Aftr090 10 7
"2 2
2500
44 4
MVRsofn rmttng Diaot~tic Brokdow n
station before cdftwr station 0 900 270
rrIIi
4' I
...>. ........... ....
APPENDIX B
INJECTOR FOULING BENCH TEST METHODOLOGY FORDIESEL FUEL THERMAL STABILITY
! I
INJECTOR FOULING BENCH TEST METHODOLOGY FORDIESEL FUEL THERMAL STABILITY
1.0 Scope
1.1 This methodology is being developed for evaluating the thermal oxidative
deposition/sticking and/or fouling tendencies (under accelerated test conditions) of
diesel injector.
1.2 This methodology will be used to determine the tendency of diesel fuel to
cause sticking and/or fouling of injector parts in service operation.
n , 2.0 Apparatus
a 2.1 References
2.1.1 CLR-D Engine Manual
2.1.2 Detroit Diesel Series 53 Service Manual
2.1.3 Cummins P-T Injector System Manual
2.1.4 ISO 4010-1977 (E)
2.2 Injector Systems
2.2.1 The injector systems used for IFBT evaluations represent the three most
common injection systems used in diesel engines. The three IFB3T apparatus were
developed to examine the sensitivity of each unique injection system to fuel
thermnal stability.
2.2.!.1 The CLIR-D IFBr apparatus represents a jerk purnp-line--nozzle type of
injection system. The jerk pump meters and pressurizes the fuel, which is carried
to a remote nozzie by a high pressure line. All fuel recirculation c irs in the jerk
;'a pump and the bypassed fuel does riot see high injector temperatur.
'a, 9/
:'i i ~ i,• i,• - ,• -. -.. •. -. . ,- -, .. •, - • • . - . -. . . .. - , . - -, •, -, - - . . . . . ,• • . ,, ,, . •., . ... ...t
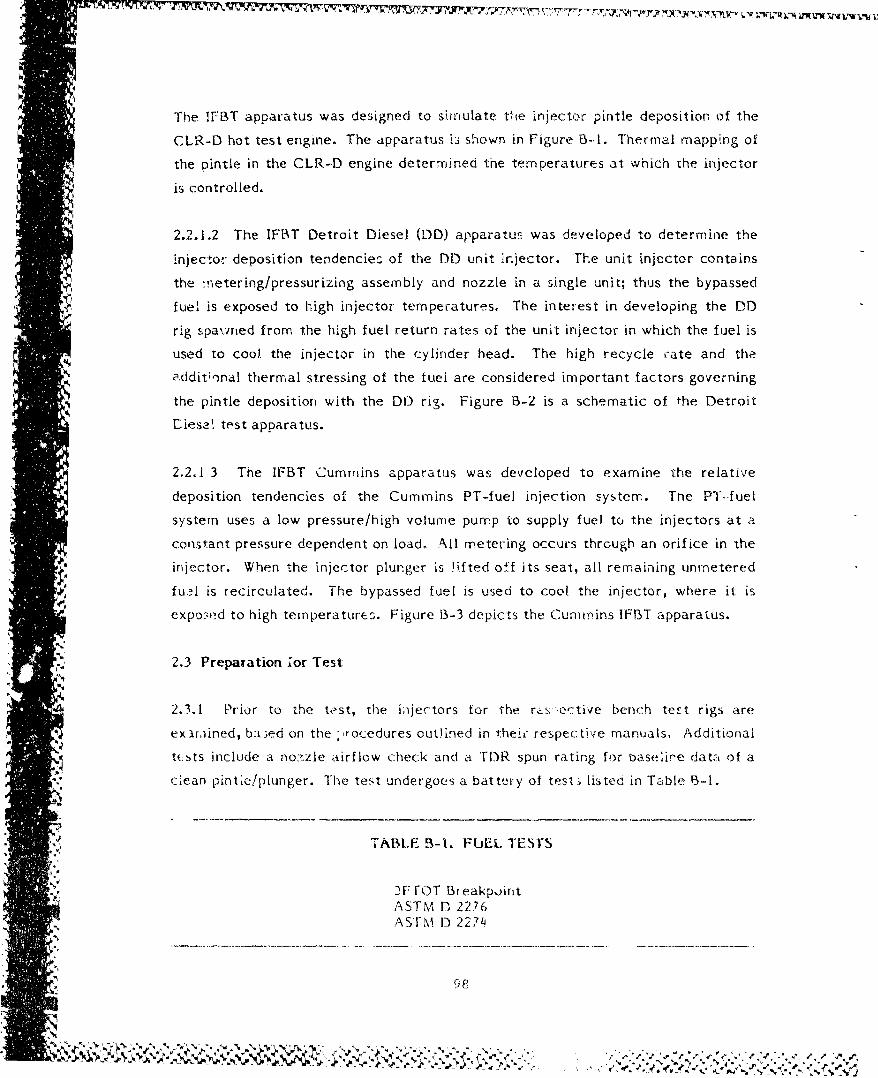
The IFBT apparatus was designed to shiulate tie injector pintle deposition of the
CLR-D hot test engine. The apparatus is shown in Figure B-i. Thermal mapping of
the pintle in the CLR-D engine determined the temperatures at which the injector
is controlled.
2.2.1.2 The IFLAT Detroit Diesel (DD) apparatus was developed to determine the
"injectop' deposition tendencies of the DD unit injector. The unit injector contains
the metering/pressurizing assembly and nozzle in a single unit; thus the bypassed
fuel is exposed to high injector temperatures. The interest in developing the DD
rig spa.ined from the high fuel return rates of the unit injector in which the fuel is
*4 used to cool the injector in the cylinder head. The high recycle r-ate and the
addit;•nal thermal stressing of the fuel are considered important factors governing
% the pintle deposition with the DO rig. Figure B-2 is a schematic of the Detroit
Eiesel test apparatus.
2,2.1 3 The IFBT Cummins apparatus was developed to examine the relative
deposition tendencies of the Cummins PT-fuel injection system. The PT.fuel
system uses a low pressure/high volume pump to supply fuel to the injectors at a
constant pressure dependent on load. All metering occurs through an orifice in the
injector. When the injector plurnger is !ifted oHf its seat, all remaining unmetered
fu,ýl is recirculated. The bypassed fuel is used to cool the injector, where it is
exposed to high temperatures. Figure B-3 depicts the Cummins IFBT apparatus.
2.3 Preparation !or Test
2.3.1 Prior to the test, the injectors for the r,s,ective bench test rigs are
t exarmined, ba;ed on the ,rocedures outlined in theic respective manuals, Additional
tWs•ts include a nozzle airflow check and a TDR spun rating for "aseire data of aclean pintie/piunger. The test undergoes a battery of test-; listed in Table B-I.
* TABLE B-I. FUEL TESTS
JF rOT Br eakpointASTM B 2276
ASTM D 2274
S9 e
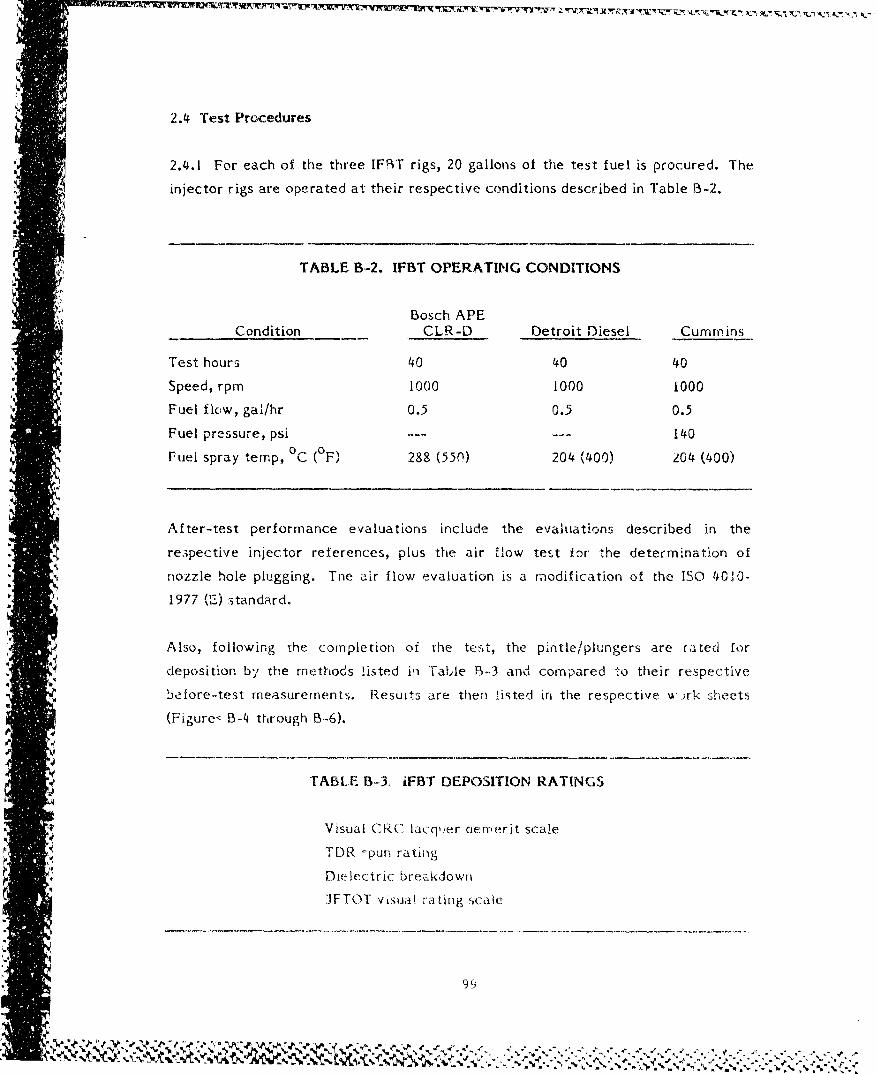
r!
2.4 Test Procedures
2.4.1 For each of the three IFw rigs, 20 gallons of the test fuel is procured. The
injector rigs are operated at their respective conditions described in Table B-2.
TABLE B-2. IFBT OPERATING CONDITIONS
Bosch APECondition CLR-D Detroit Diesel Cummins
Test hours 40 40 40
Speed, rpm 1000 1000 1000
Fuel flow, gal/hr 0.5 0.5 0.5
Fuel pressure, psi ........ 140
Fuel spray temp, 0C (OF) 288 (550) 204 (400) 204 (400)
After-test performance evaluations include the evaluations described in the
re3pective injector references, plus the air flow test for the determination of
nozzle hole plugging. Tne air flow evaluation is a modification of the 150 4010-
1977 (E) standard.
Also, following the completion oi the test, the pintle/plungers are rated for
deposition by the methods listed ii Table B-.3 and compared to their respective
before-test measurements. Resuits are then listed in the respective w irk sheets
(Figureý B-4 through B-6).
9 TABLE B-3. iFBT DEPOSITION RATINGS
Visual CRC lacq.er aemerit scale
TDR 'pun rating
Dielectric brea:kdown
IFTOT vtisualM rating scale
99
NZ~~~ ~ 1"44\M K
N~. 1% -%? %4 ~
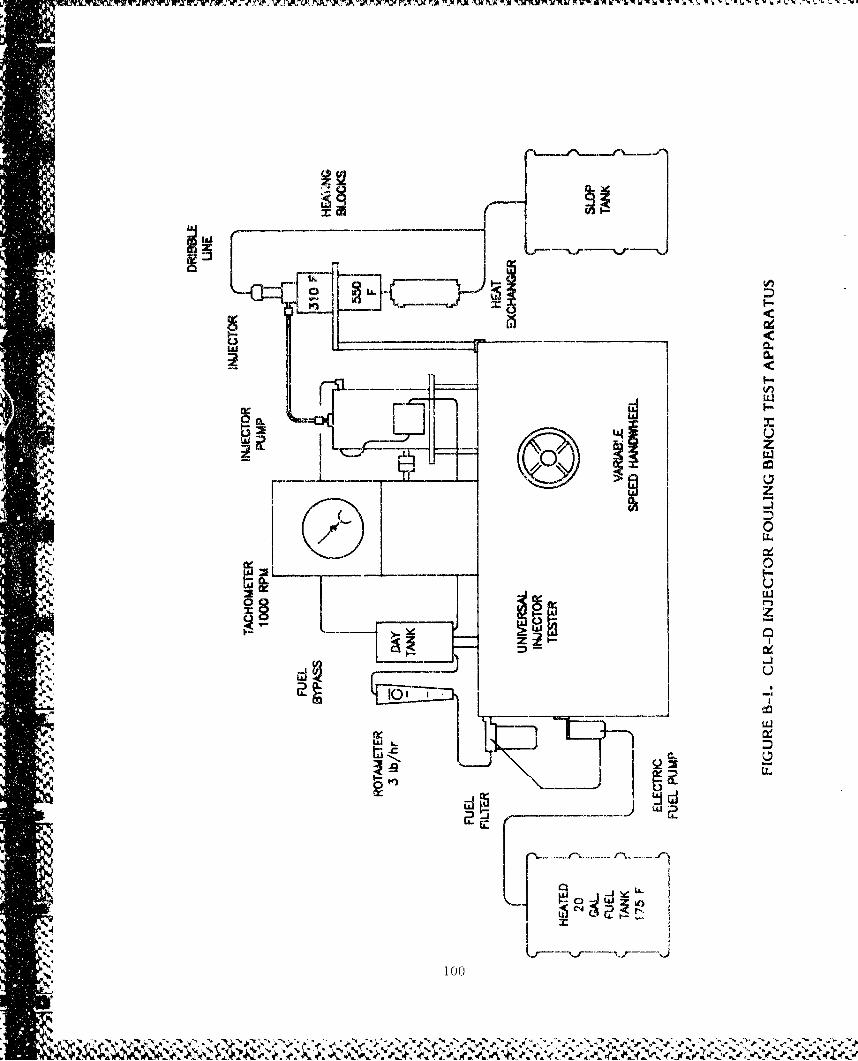
2. U4
LIJ
CLC/ L0'tn ?L*
100
e d, e-
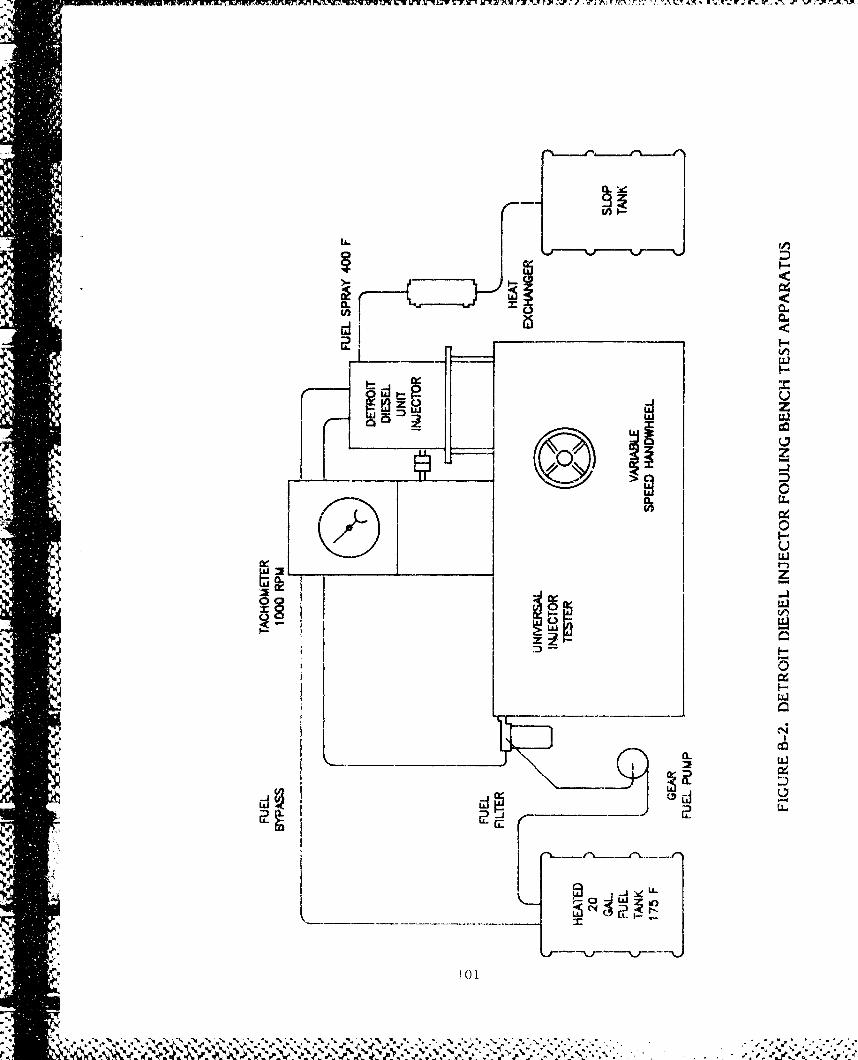
I fa~kw~7~ ~Wl .1 1 77 J77 vF V ITN .
-vj
In'-
C4 r-
1-0-
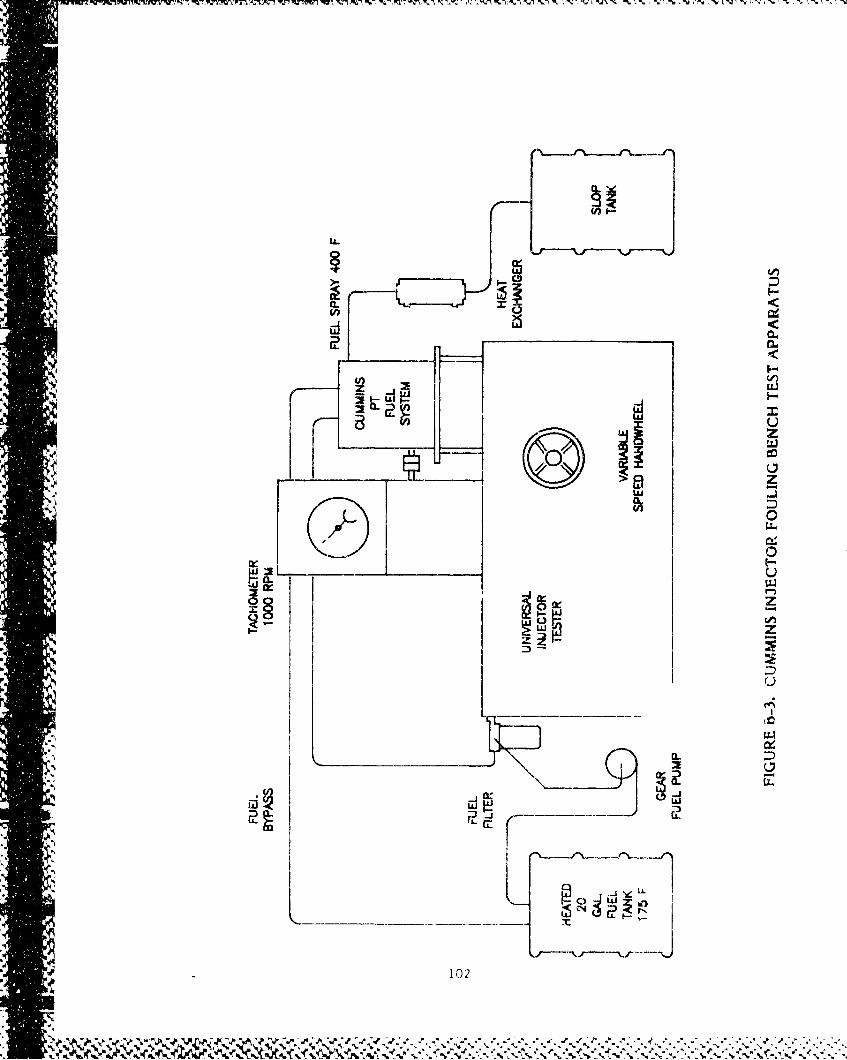
Ld
U z
> z
LUI
z
wC
- C
U.
102.
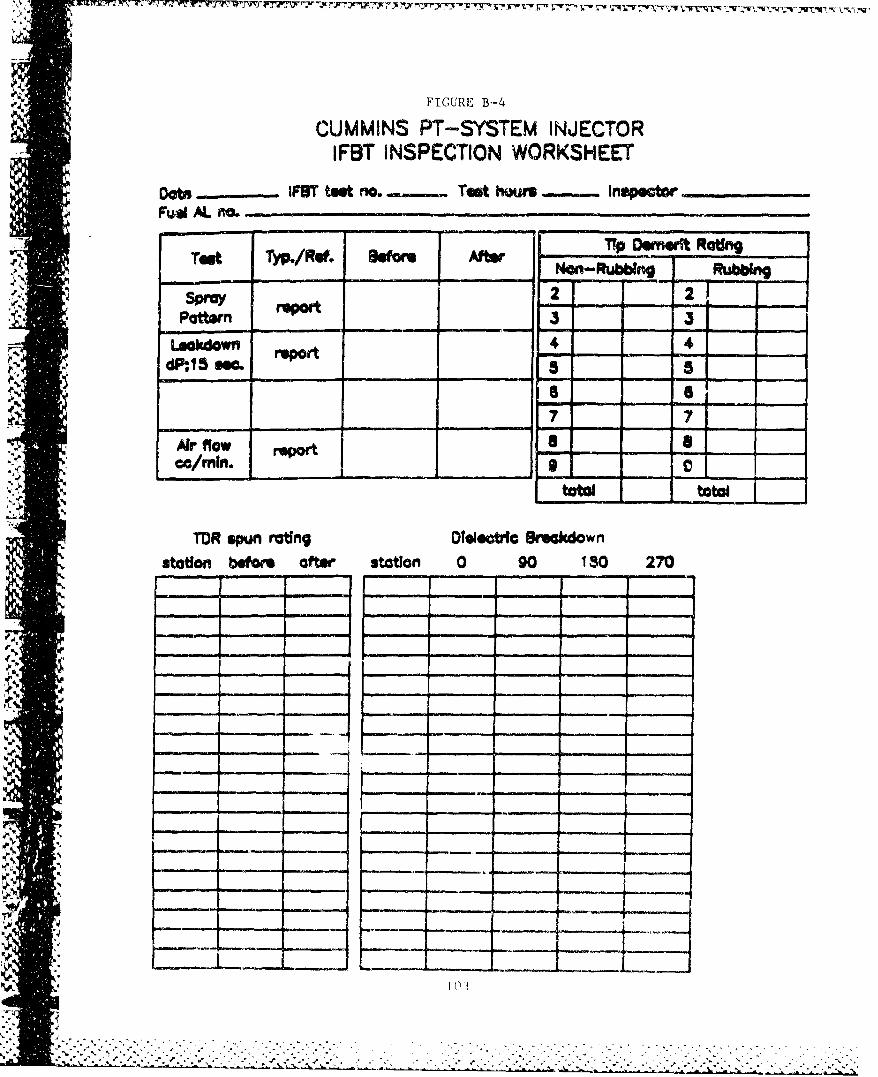
47-
FIGURE B-4
CUMMINS PT-SYSTEM INJECTORIFBT INSPECTION WORKSHEET
Dote IFl test no.... Tei't ho-ur -. Inspe .. ..
Trp Dwrnerft Rating_Nn-RUbbing -- bbing2 2
s-paa-
Pattern 3 3
ocdn emt4 4
6ra7 7
"Ai,*r Raow 8oo a
station boor aftse station 0 90 13•0 270
a a1
--- ii n - - - - ai-
Ttt
TDI sl_
stto eoeatrsain 0 9 8 7':- -
5q- -
---
"i_ 7- I
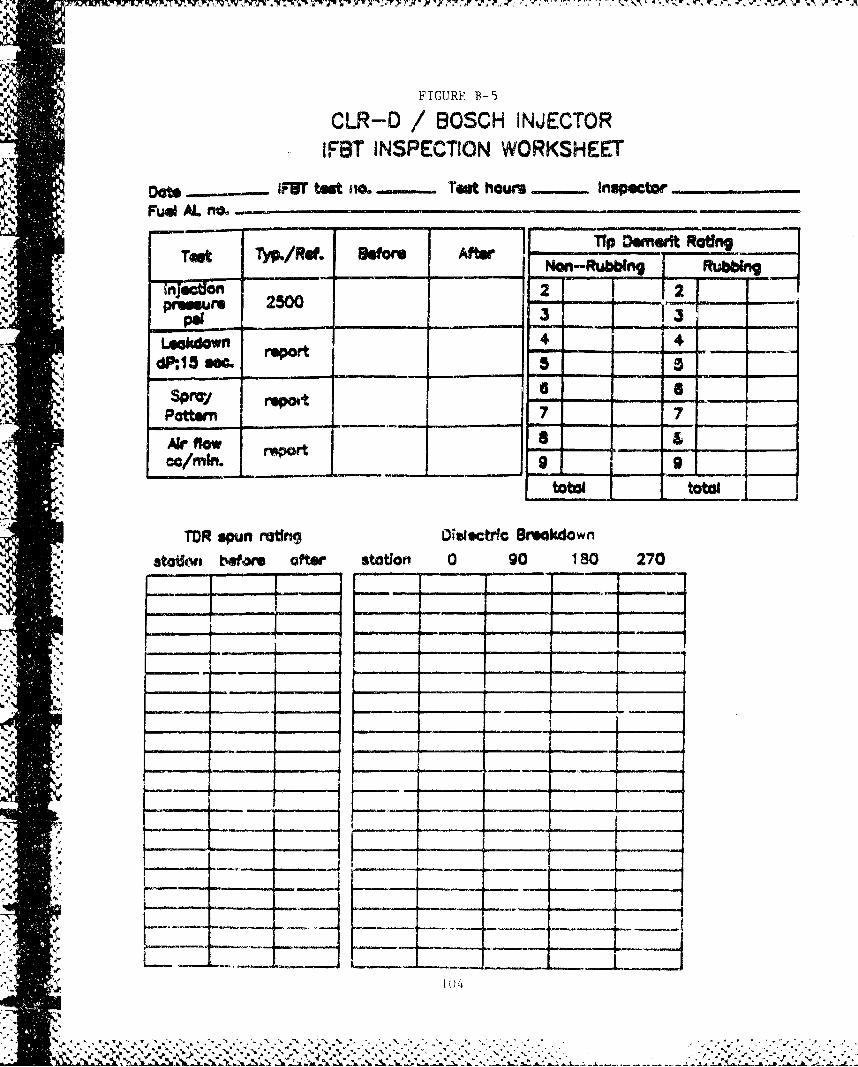
FIGURE B-5
CLR-D / BOSCH INJECTORIFBT INSPECTION WORKSHEET
Dots IFNT test i,-.. Test hours - InspetrFuel AL mo
nF's"ep Demeult Radng.-TypRe. Bt reNon-Rubbin Rubbing
2500 _____-____ 1 f - 4Leakdown epr 44dP1.see... 5.
PPattern report__ 7 -7
Air flow6 roport - - _
cc/min. _
totoU total
MTR spun rtftrn Dialuctrlc Breakdown
st•on Weare ofter statio 0 90 180 270
'-T. . . . . . .
S_ _+
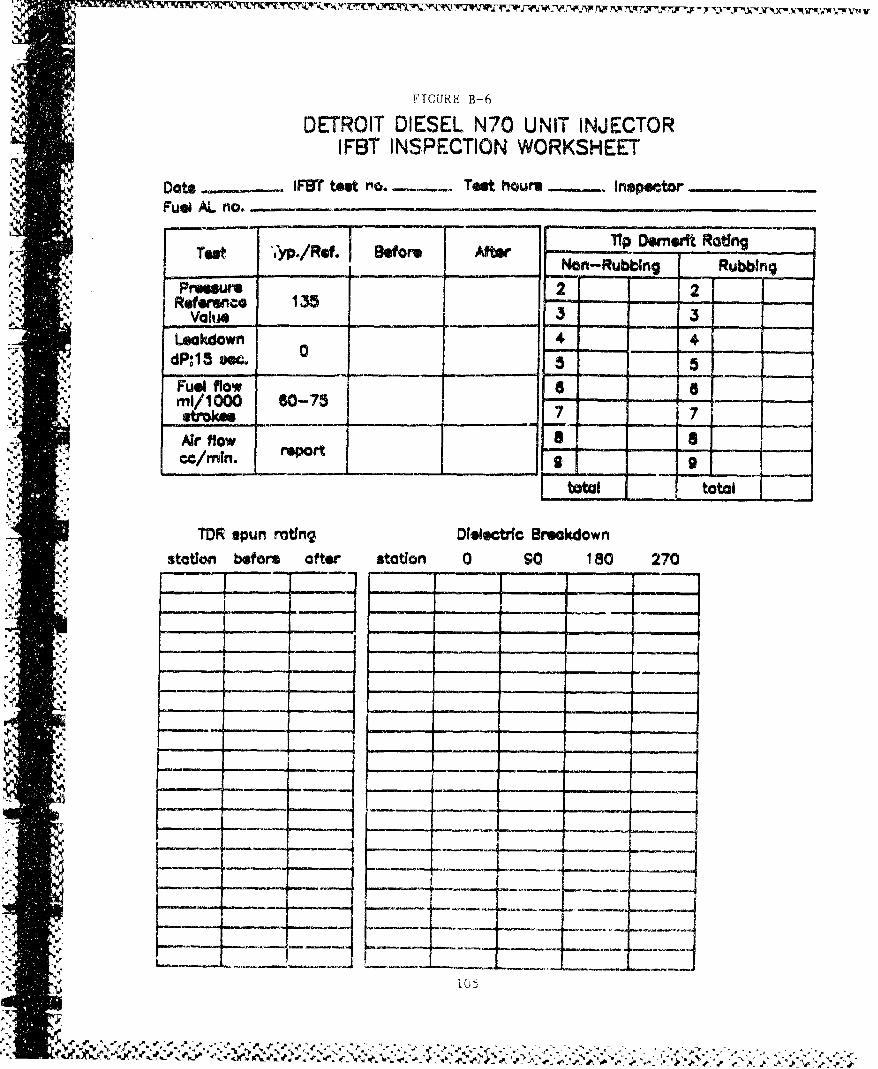
1'T(UR" B-0
DETROIT DIESEL N70 UNIT INJECTORIFBT INSPECTION WORKSHEET
Dote - iF9W tet no. Test hours ~. inspectorFusi AL no.
T rest 'yp./Rst. Befor After 'p Demert Rating,'. - - Non-Rub ng Rubb•ng
Preelpu 2 21Reference 133"Value h
Leakdown 4 405dP:-15Se.c05,Fuel flowI
II10 07 7 7strokesAir flow Iepo8=I/mln. report '---.z
total total
MTR spun mtlng Dielectric Breakdownstation before after station 0 90 180 270
- a a . -. . n -
-c - - , �,-
'S
N
S.,
'S.;.S...
-S.
S...:.
*5�
* APPENDIX Ch
PRIMARY MATRIX TUBE DEPOSIT DATA
�. 'S..
�,' %
-.
S...J.
'S...S.-,..
S..-.
.5.
H) /'S.-
5'
.................................. 5.�5S.* - .. . S.. S. . *�
........................................................-------------------------------------------------------......................................................
-S. ft � 5 *�.s .. AV4.S.'.iS½ -. � �. -S. � �J5
�j5 -. *J.
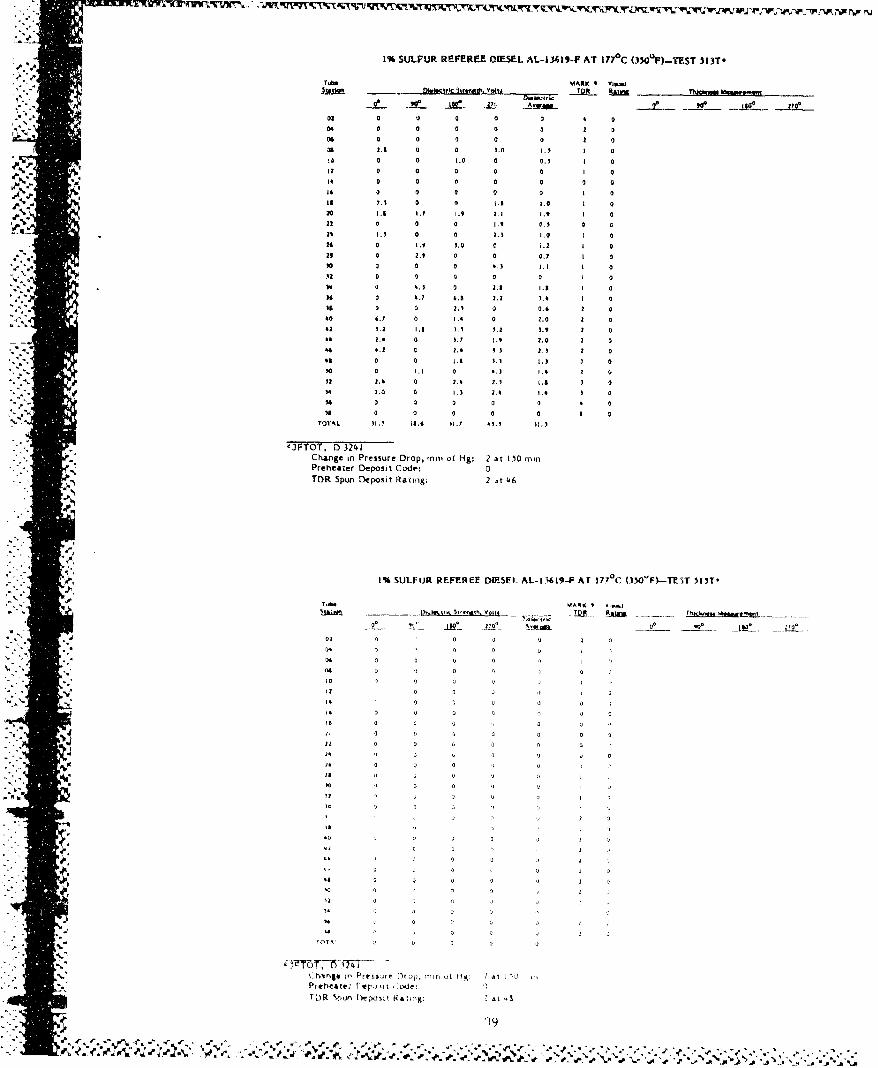
1% SULFUR REFEREE OIESEL AL-I3419-F AT 177rC (350L)FI-TEST 313T.
TubI MARK 9 vIaiW
irs.D - RAUMor jirrad.. Vqflj .. W-S? ,__ .t ,, 21 _.Aga• _.c ri .j ....
02 0 0 0 0 0 004 0 a a 0 2 0
06 a 0 2 00l 2.3 0 0 J.0 1.3 2 0
10 0 0 1.0 0 0.3 012 0 0 0 0 0 0
25 0 Q 0 0 0 0 0% 16 0 0 0 a 1 0
iS 2.1 0 0 1.1 1.0 120 2.3 I.? 1.9 2.2 1.9 1 022 0 0 0 1.9 0.3 0 0
20 2.0 0 0 2.) 1.0 1 026 0 I.4 i.o a .2 1 0
-2 0 2.9 0 0 0.7 I 010 0 0 0 5,3 1.I 0
35 2 . .t 1.i 1 1m5 0 5.7 5.3 2.2 3.4 2 a113 0 0 2.3 0 0.5 2 0
50 6.7 0 1.4 0 2.0 2 0
42 3.2 1.8 3.3 3.2 3.9 2 02. c 3.? 1.9 2.0 2 0
41 2 0 2.0 3.3 2.3 2 0
53 0 "1 0. ".3 1. 2 050• 0 1.1 0 5.3 2.532 2.5 0 2.#l 2.3} I.0 3314 2 ,0 0 2.3 2.5 I.5 3 0
35 0 0 0 0 3 08 0 0 0 0 0 a 0
TOTAL 31.3 23.6 32.7 *3. 3 32.)3
'JFTOT, ) 3241Change in Pressure Drop, innI of Hg: 2 at 150 minPreheater Deposit Code: 0
3, TDR Spun Deposit Rauingý 2 at 46"NA-,
Rak
'iP, ~~1% SULFUR REFEREE Di•.5EI. AL-11619-F AT 377°C (3)0,F).--TE;T 5t5T*
01 RK 0 V.a&0
.t.. 0Y. D I~. .MM _
4 02 0 0 12 U4 , 1
2 o 1 1 o 0
20~ ~~~ 02 1 2 121
i "s
4,
-2 .2 12• 12 0 o
TOT 1 2 0 2 121
tr'rhei te: in Prese Drup mir A lv, At I "I :
1DR ',,un [*powt Rating; ?At .8
e %,
€20"* U 12 "'1 ~ 2' U , 2,, . , .3,, , . ,. . .2.2 1 . . . 12 I. .5," , 22, ,~ 2,,, ,• W J, 2 , 12 12,• , 1. " . , ,, , . , ' i ,, t . . . . .
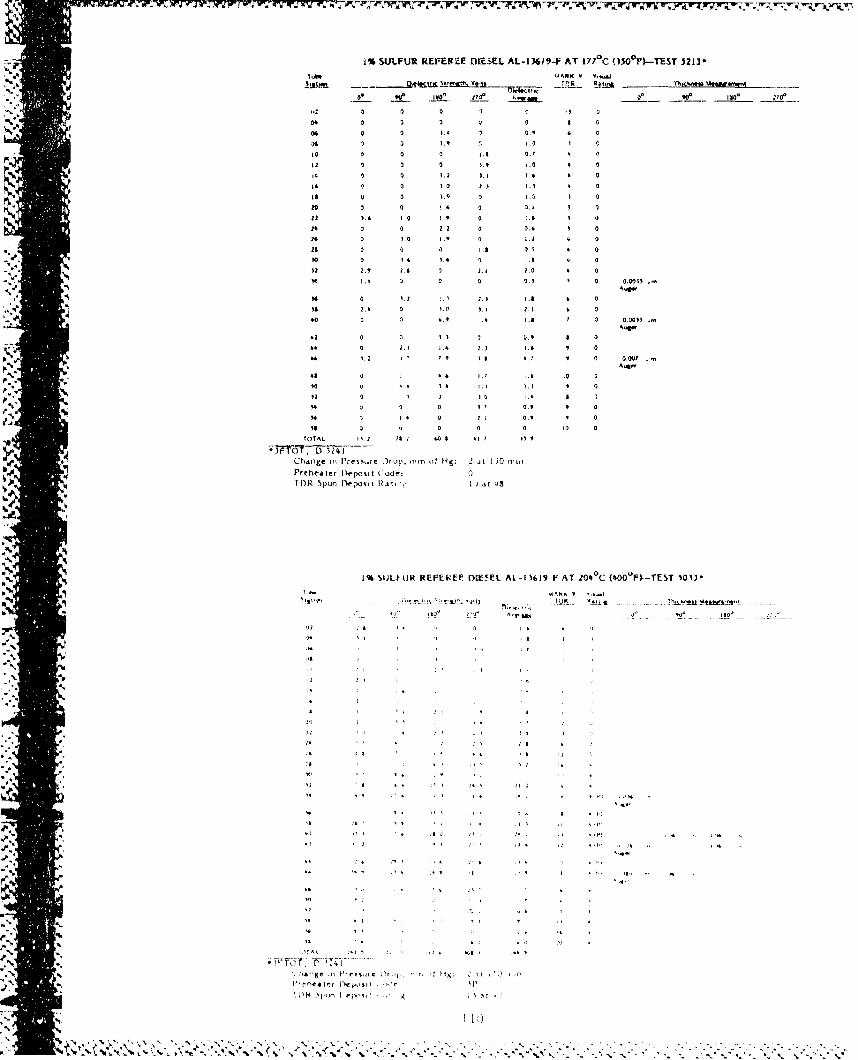
M% SULFUR REFEREE 01EEl.E AL-13619-F AT 1177C (150 0 F)-ThST 521]'5,49 0k MON 9 V.ý9
~~ ODE~~~ Rot,. __ h& m~r
9%~~- 04 2 2 2 *
~N9R06 o
10 D 0 0 23 0.7 i
12 1 0 .90 2
it 2 0 9.2 1A.94
20 0 0 9.0 21 9 0
22 .6 1.0 .9 0 2.4 9
20 0 27 0 0.4 1 0
24 0 9.0 '.9 0 1.2 0
23 0 0' 0 S8 2 0-410 0 9. 1. 21 . 0
02 2. . . 2 .0 1A 0
09 04fa
is 2.4 2 9 .1 2.0
90 0.09.1 2 033
74- 0 .9 4 21 lA 9 0'
9 4 O27. . 4.7 90 0 0.79 0N 04w
%* 1 0 9 . 2. 0.9 0
¶9 0 0 92 0. 9 0
9. 0 u 0 0 0 20 0TOTAL 292 is 2 4 1. . 7 99 I
Cha~t n g2e in Pressure Drop, Torn of HKg: 2 it 1 50 frk
Preheater IDeposit (-ode:0
~~JI ~TDR Spun tlrpsc~ a ai: ).t 43
39% ~1% SJLIAJR REFEREE DfE5EL At -i13619F AT 204'Ci (900'F)--TEST 10133
9 % 44 .. 9
1) 14 1 .l " K

M% SUL.FUR REFEREE DIESEL AL-13619-.F AT 2O040C (0OO0F)--TEST 512J
Tube MARK 9ý Vioooj
04 a 0 0 0 0 0
04 0 0 0 0 0 1 0
06 0 0 0 0 0 0 0
12 0 0 0 0 0 0 0
to 0 0 0 0 0 0 0
12 0 0 0 0 0 0
It 0 0 0 0 0 0 0
20 0 0 0 0 0 1 0
22 0 0 0 0 0 0 0
20 0 0 0 a 0 0 0
22 0 0 0 0 0 1 2
2it 0 0 .0 .0 0 0
)0 04.0 0.0 4.0 9.0 12.3 04
02 40,1 20., 2.0 4.0 17.7 a 0
314 10.0 00.0 2.7 0.0 12.0 30
M4 6.0 00.2 2.8 2.1 01.0 9 14 (Pt
311 2.0 00.0 00.3 411.9 M02 It IltM
00 07.1 7.0 *0.9 00.3 00.2 10 'INI02 01.5 24.0 11.6 50.0 02.6 13 't P)00 1.0 04.0 00.0 %0.a 02.9 10 .0(IN
04 42.0 00.9 10.1 0.0 28.0 to 40(P)
48 12.0 7.9 20.9 48.0 211.6 6 A
M0 7.9 2.0 04.0 00.0 20.7 0 0
32 20.0 C 0.0 20.0 M0. 6 0
04 1.0 11.0 0.0 9.0 4.8 10
04 12.0 15.) .2.0 2.0 7.3 to 6
09 0 0 0 0 14 0
TOTAL 031.0 291.1 200.2 341,6 0236,
"*FTO?, 34
Change in Pressure Drop, mm of Hg: 0.5 at 151) min*Preheater Deposit Code: 3P
TDR Spun Deposit Rating: 15 at 40
1)% SULFUR REFEREE DIESEL AL-1 3619-F AT 204'C (1o 00P)-TEST 5110-
ToO. MARK 9 Vi I
02 0 0 0 0 0 0 0
00 1.3 0 1.7 00.9 1 0
04~~~ o. . 0
10 0 0 0 1) 0 0
120 2 0 0 0
12 0. 0i 0 2.0 0 0
20, 0. 0 1., 2 0 20A 0 0
is 0 0 1.4 0 0.1 0 0
20 G 0 0.0 2.0 I 0 0 0
22 0 .2 0 10 0.1 0
20 0 0 0 0.' .
21 11 0 0 20.0 2 0
is0 1 .0 0.0 0 0
90 .7 0 3.7 3 0 .7 it
1221.5 1 0 , I J1.7 0.0 t.
100 20. 26.9 20.1 22.0 a
¶0 26.. 2.0 21.2 20.2 0 0
0 20.2 . 2."1 14 0. P 10
,0 2 2201 12 01 U 1 it 02IN
02 .39 P. 23)67 2 00
04 62. .0 .2 I ,I 2
rPA 62)2 20 14 22 '
02FOT D 2. 12412 42 00
2.ilualg in~ Pre¶)ope (IP.2p, f,~2 of! HIK:
Preheater rk.ýpoiit xit;e,(
TDR Sptn Hapol ~t,ýýg: .1al i2
*~'0- - 0.04 ~4%
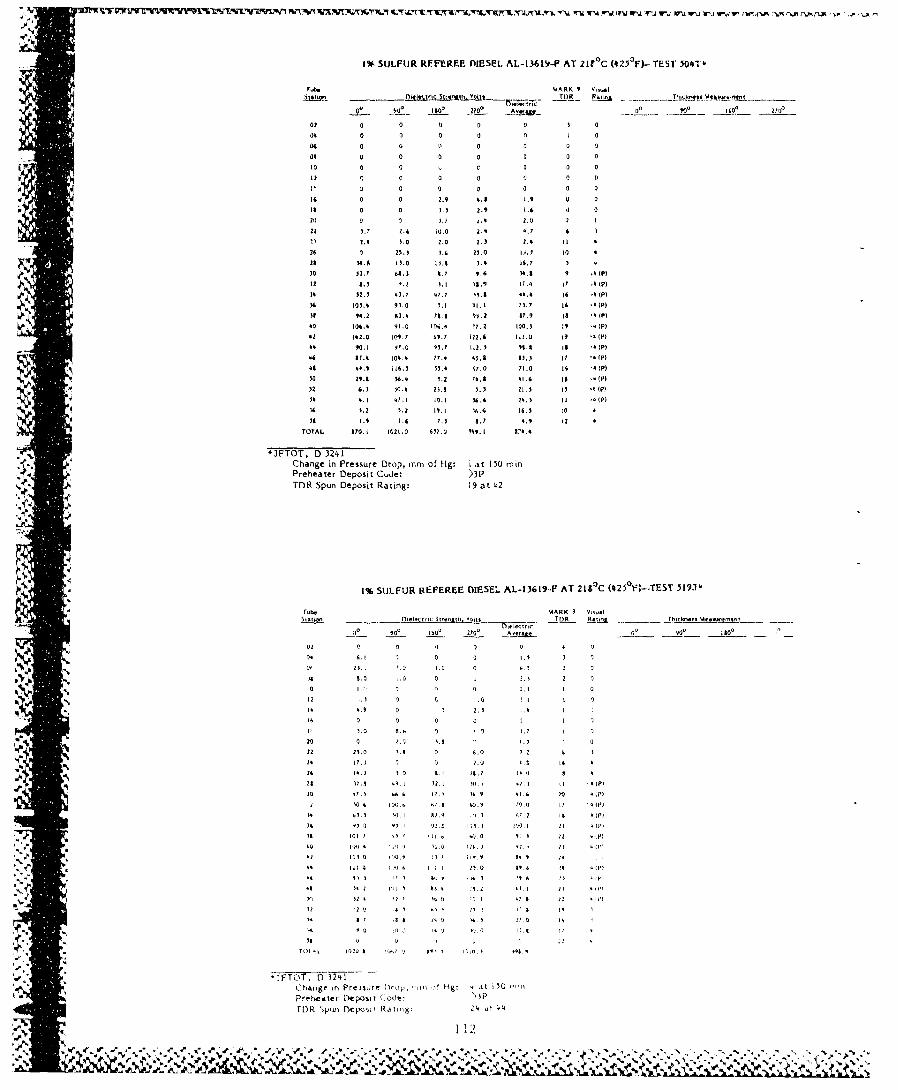
1%. SULFUR REFEREE DIESEL AL-13619-F AT 2IroC (*2317)- TESi' 41'
Tub. MARK 9 0.,iua
02t0o! - A t- 1570 ~ i i -- _ _ ?A" - - .
02 0 0 0 0 0 3 0
04 0 0 0 0 0 0
09 a 0 il 0 a 0 0
08 0 0 0 0 0 0 0
[0 0 0 C0 0 0
80 0 0 0. 0. 0 0
24 0 0 2 .9 .8 .
29 0 0 3. 1 2.9 :.6
20) 0. 2. 1.0 0221. 2.4 0o.0 J.0 9.7 9
Z .9 1.0 2.0 2.0 2.9 221
26 0 23.3 7.4 01.0 10,.1 10 9
23 14.6 10.0 013 1.9 19.7 3 4
00 0 027 2.1 933 .7 9.4 14.8 9 .9 (P)
It 8.1 9.2 0.1 43.9 IT.. I 7 b .(P)09 52.0 40. 7 47.7 )11.3 88.9 (4 '48(P)
2934 101.9 91.0 1.1 g1.2 71.7 it '4 (P)
41 ) 99.2 91.9 793 a Oo,2 87.9 II a 8(P)90 10.49 912.0 (06.9 07. 2 700.1 9 .. (P)92 (92.0 IC.7 6g. 7 122.6 (12.0 (9 94(P)
89 90.I 17.0 .91.7 112. 3 99.9 is 48(P)
U4f.9 ( 09.9 77.8 6S.1 3313 27 49(P)
30 29.9 5c4. 5.2 o.$ 941, is '(P)
)4 98.8 (241 33,8 97.0 72.0 24 '9(P)
06.12 1.2 19.1 'M .4 14.1 (0is 1 .9 l.9 7,0 3.7 8.9 (2
TOTAL 970.1 1021. 93 7.0 999.2 C8
-JPTOT, D 3241Change in Pressure Drop, tTm of 11g: i at 15U minPreheater Deposit Code: >3PTDR Spun Deposit Rating: 19 at 42
07'
4 0461 9
tb A8 R 9. 1.isual
10 90 110 270 Dincri
Iftl_ 90 280
02 0 0 0 0 0 1
208. 0 0 L 2..8 1 ,3 1
22 21.0 10 0 2.7 2 9
5 7). 0 0 00. S
$0 22' .7 0 W9 1 0.0 2 7 4P0614.9 1 3 '21 0, 1 I1 I'
"" 0 0 I 1 90 , I 0 F
20 II 01 70 7. 92. 0 2 p
28 ~ ~ ~ ~ 1 172 0 0 20 40 1
3IIý O 00. 1 42 I .2 9P
90tgei *7.i3ýr 4ao.4 i f.) o Hg: 9 42. at 1 11
30rette Deposit c. Ml e.:. 100 17
-- a99 )I~0 i. ii 130 39 '9 (7%
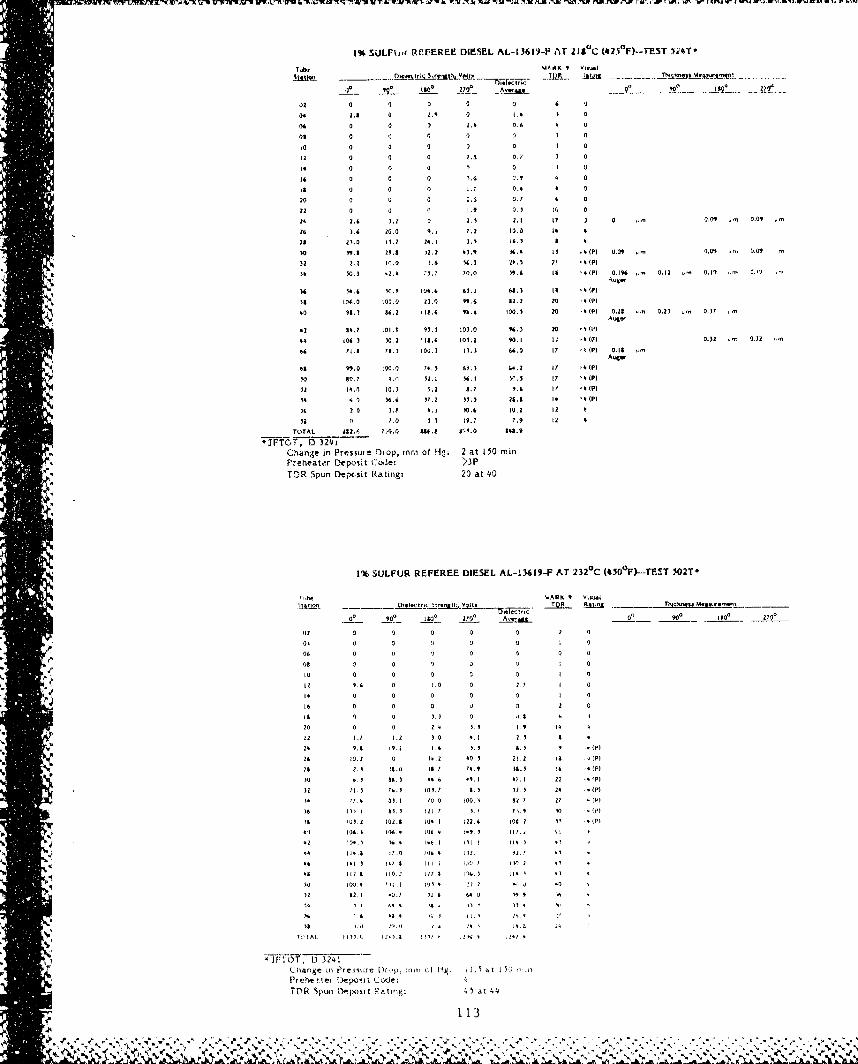
1%SULFtod PAIFEREE DIESEL AL-13619-F AT 21&0 C (ej2¶ 0 F)-TES5T¶i#IT*
Oh MARK 9 Oonai
a9 .8 0 v. 0 0.4 1 0
94 0 0 0 0.9 0.6 9 0
08 0 01 0 0 0 9 0
20 0 0 0 0 0 9 0
11 0 0 0 0. , 9 0
1t 0 0 0 00 0 0
24 0 0 0 '.6 0.0 0 0
11 0 0 0 0 . 0.9 0
00 0 0 0 I's 0.? 4 0
22 0 0 0 1.9 0.9 itj 0
04 2.6 ).1 0 20.1 2.2 1? 1 0 . 00 ,' ,0 i,
24 9.4 20.0 t. 1 7.2 20.0 It 9
211 09. 13.2 29.2 ,1 04.1 a 9
110 99.8 09.8 10.2 09.9 064. 29 .4(P) 0.09 ,m0.2 I oo .0q
92 0.0 10.0 9.6 M4.1 19.9 P0 '4(P9
39 90.9 40.9 73.7 10.0 09.4 28a 4 (92 0.1%4 o 0.00 o 0.19 029 .o
94 54.6 W90. 004.4 49.2 68s.9 28 41P)
08 10CC0 000.0 09.0 "9.6 82.0 00 94(P2
90 98.0 86.2 1111.4 9%94 000.9 20 -4 (9) 0.28 O., .09V 0,97 o
92 89.7 101.1 99.9 009.0 94.0 00 .1(0)
9 104 1 W20. 108.4 109.2 90.2 1,, .002) 0.90 o 0.92 .'
04 70.8 78.1 100.3 001.3 64.0 27 k42P) 0.08 o
62 98 0.0 000.0 79.9 6314. L... 2 '49(2)
90 BT0.7 4.0 90.0 M4.I 90'.9 00 '(P)00 09.0; 00.9 9.2 8.7 9.4 0' '4(P)
99 6 3 96.4 9 7.0 99.9 00.8 29 (P)
94 2 0 9.A 9.0 9 0.4 00,2 00 9
04 7.0 9 1 29.7 7.9 02
TOTAL 419.0 720.0 11t1.8 430.0 892.9
CIFT, D~ 324LCoiange in Pressure Drop, mmr of H2. 2 at 150 minPreheater Dieposit Clode: >3PTOR Spun Depcsit Rating: 20 at 40
1% SULFUR REFEREE DIESEL AL-136139-F AT 2320 C (4500 P)--TEST 502T*
r'4 MAK 9 604*
0 0 0 0, 0o
00 0 0 0 0 0 0 0
09 0 0 00 a
080 0 00 0 0 0
001 0 0 0 9
0.. 09.4 10 0 0 0.7 2 10140 0 0 0 004 0 0 0 0 0 0 0
it 0 0 9.9 01.
20~~~. 0(P24). .9 0
30 H.9.6'
24 00.0 0. 0.1. 901.9 000H44P
.4 0 0t.9 08.0 980 0. 6.9 04 t'P27
90~ ~ ~ ~ ~ ~~' 2. 89 4. 90 9. 2 99
92~3 22. 799 097 89 09 0 4 9
T,9 77. 09. a 00 203 9. 7 0.
96ff 07 9. 2. 9' 809 90 4
Ch neI78 eir r ) ta 032 202.8 009. 20.4 i 100 99597
p~ reh 90 004. 06.9si 009de 4 9. 002 4
M R 09.9I 04.9~lj 040.2'g 4;0. 02 at 4
If 1 13909. 70 00. 9. 00 9
% 4 00 9. 00 20 40 9
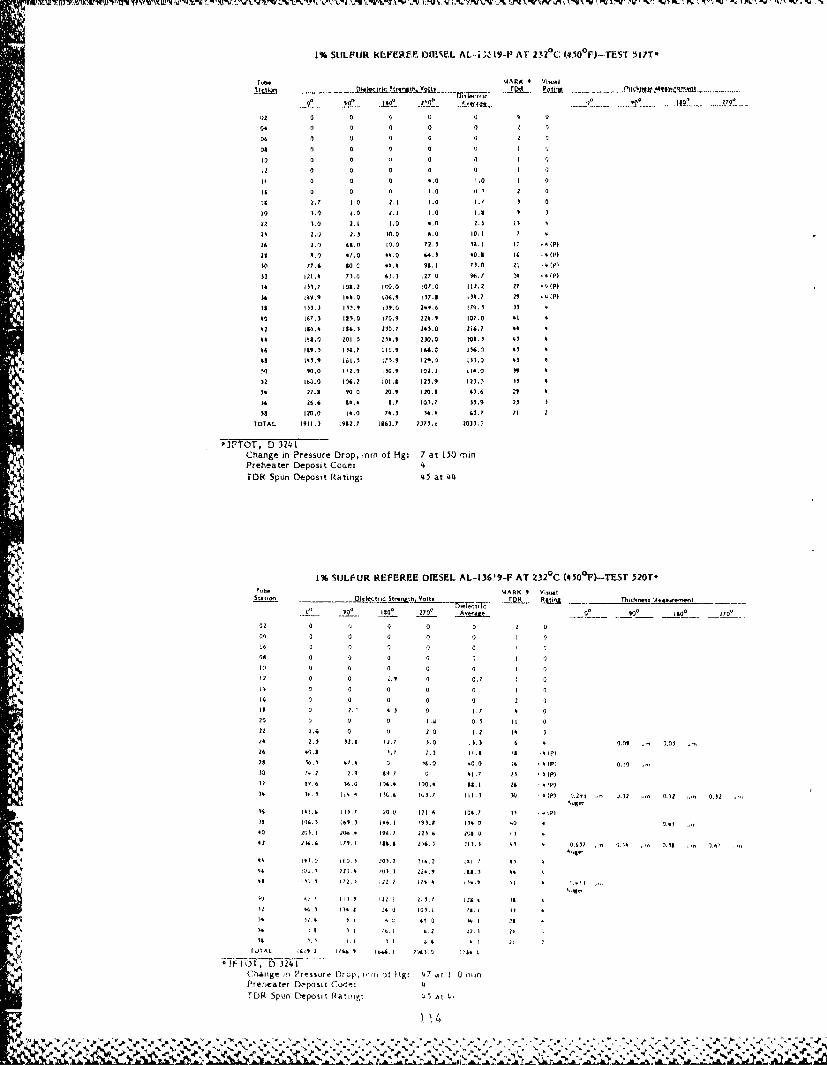
1% SULFUR k(EFEaFF. HIESEL AL-*; Is-F AT' 232'CC (4¶O%)-TEST j11T*
MARCa I Vi-,a
Muon .. ~ - i319li& zknho~oIO U~. !om - . NIn Mny ...I........
AK -,j4
- Vaa' --!31- 3 -41 11t. - 0'
04 7 0 a a l 0
06 a 0 a z 1
at a 0 (3 a I
a0 a a a a 1 a
11 0, 1,0 21 0 a 1 7
10 10 .0 2. 4.a i. 1 3
16 10 0. .0 1.0 1, I
2n. 2. 70 6.0 1011 7
24 2.0 63.0 a0.a 72.1 is. 1 17 .9(7
21 4.0 47.0 44.0 GA.1 40.3 16 14 (H
1so 77990 44 131 71.0 21 (0')
1121.4 71.0 63.1 1.7 a ft.) 1 4 (tPI,
TO 0.7 103.2 'W. 0 to.0 112.2 Z? IN(
36 1410. ( 44.0 126,9 (37.8 314.7 29 .4 Pl
Is 13).) W379 IWO0 241.6 7N.3. 131
40 16.) 370o 170.9 224.9 107.0 61 4
42 114.4 816.$ 200.7 245.0 236.7 44 4
44 141.0 201.5 234.9 2)0.0 203.1 63 4
46 119.3 (14.7 II1.9 (6. (36.0i 43 4
43 143.9 113 (31 2. 03 4
Y)0 90.0 ('2.0 509 (02.1 14.0 1
12 (42.0 10(.2 01 .3 121.9 101) )13 4345 22.3 90.0 00.9 120.3 03.6 29 4
)6 24.6 Wt. 3.7 103.7 33.9 23 1
$0 (20.0 4o.0 74.3 16.4 65.7 7
TOTAL (9(1.3 !"2.7 t363.7 2373.1 20331..
*Jn'T0T D 3241Change in Pressure Drop, Tinm of Hg: 7 at 150 minPreheater Deposit Cacie: 4TD& Spun Deposit Rating: 45 at 44
1% SULFUR REFEREE DIESEL AL-136-9-F AT 232(C (930 fl-TEST 520T-
Sainoielearn streMýh Volts TOR Rpsing ThclnAtonuvmt
10Lag 0to 270'27
02 0 ii 2 0 0 2 004 0 0 0 0 0 0
G6 2 0 0 2 0011 0 11 c a
(2 (1 0 Z.9 0 0.7 0
(6 0 a a a 0
20 0 Q2 01 (.3 11
22 ?.4 a a a (. 2 14 324 2.3 )2,9 (2.7 30 .).3 6 9.0v , .0.3 i
26 4033...1I l II .~
23 ~~ýi 141 4. 40 40o (6 -;? 0.10
00 l2. 2.9 81.7 2 4(. 20 .4(73 2 36 14.0 (06.9. (00.4 $3. 26 .4
14 1.3 (4.. (126 1,.7 ((.3 1(1 0'( 0.29f -in U.31 Qn .12 in 0.)2l
41 (1 (1.7 20.0 (21.4 (04.7 It .4(71(4 (2. i64.3 (.46.1 1911.1 (134'a 40 4
40 201.,1 206.. (96.7 223ý6 23
42 246.6 179.1 134.3 26.7 (.11 4 a~7 . 1 i .3 . (4
10 4.0 t0 o 5.'0 2 2,6.2 (1.1" 43
I4 IN (22 123ý1 1224.9 .31 4
t2 ci 1 ((7 v Ill.: 2(1? (23 1
77 44.3 (442 Ž6 1 (01.1 1.i I
f0i4 11 7t 42 1", 441 Ps.
01704 (t ( 2, (36 2 b6 4143
c.hange I i 1'rrssure Dlrop, (((2 oft Hg: 47 am 1 0 mnnPreheater trm'posim Co01,: A
fOR Spun Depoot Na I,, .,:45ar 4.
1.1
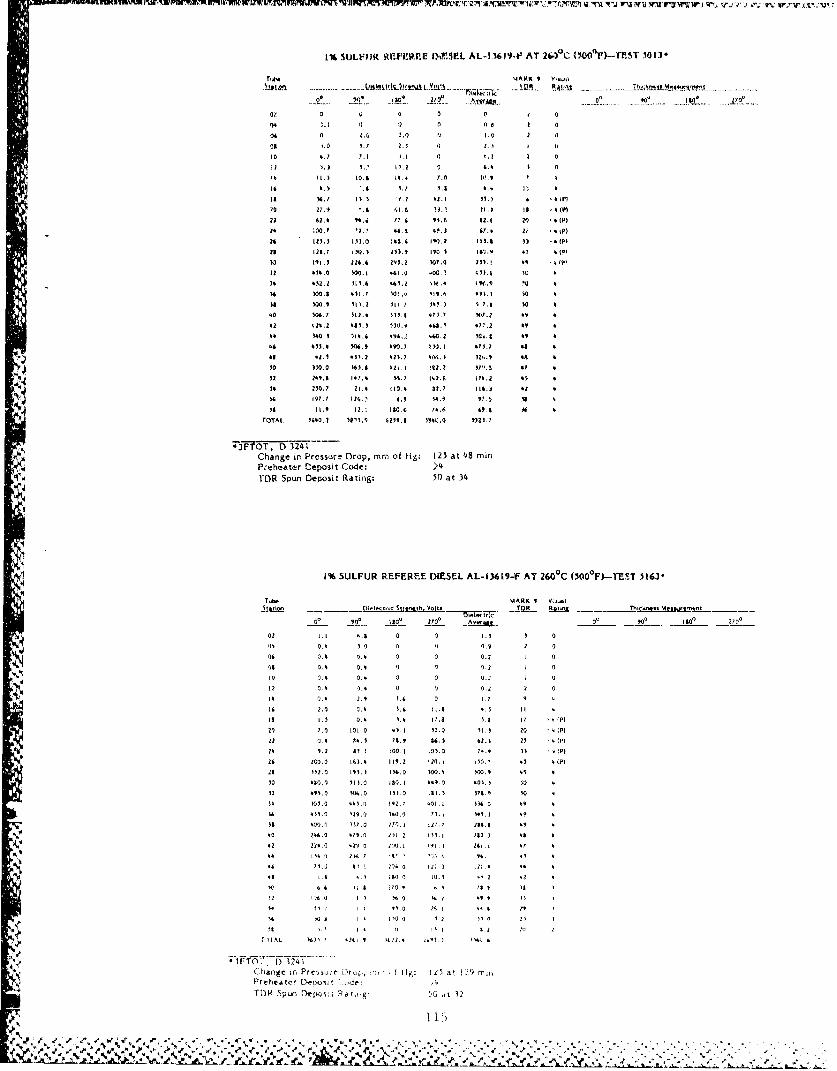
3%t SULFVOit 1UFLtPE~ *lhSrL AL-I,361¶Fk AT 20.54 C (00 0 Fr)--TST.30OIP
1051001 . -11- AIR.11119fd !o-14A-1- h~6fM 4 y¶~y
50 0 1. LO 00 0
013 1. 1. 1. 0 o.
10 3.7 7.1 JI 0 '3 2 0
12) 1. 3 I.. t5ll 0 63 3 0
23 L2 3 11 I 23. 7. 10,.29 7
22 6.3 1.6 7 6. l".2 152.4 2 0 .(PI
30 21.3 26.6 IV43.2 )01.0 23l'! 39 .43
33 14.0 W0. 1 462 .0 400.? 403.5 %0Q
3M 332.2 ý3234 36.12 $0f .3 24.9 -0
16 300.2 Ili1.7 301.ý4 129,A 331.2 $0 4
38 504 3229 .2 I 2 il ? 3. 0 ,) 97.2 $0 3
40 104.7 W2.4 m33s 037.7 17.7 3V 3
32 k223.2 383.3 3310.4y 3I.~ A 371.2 34
33 340.3 023.3 306.2 444.2 3Md. 3 9 3
6 4135.3 303.3 t 3, 0307 .2 31 . 38j 1
63 93.1 333.2 323,7 -A046.3 321 11114 t
3i 8 221.9 22. too. 734.6 3393 m67003. 344030. 38543. 6219.81 394C.0 "123.7
'JF-TOT ,D 1)2-41.-Chanoge ir. PreosurT Drop, mm of lig: 125 at 48 mmPceheater Deposit Code: >4TOR Spun Deposit Rating: 50) at 34
1 % SULFUR REFEREE DIESEL AL-136i9-F AT 260 0C (500%)-TEST 5163'
T4. AR 04 V-1a
02 2.2 . 0 0 .0 o 7' Aaaa09 3 7
l 03 .' 3.0 1 0 0 0.9 2 00I6 0,3 0.3 0 0 0.2 1 0
G8 0.3 0.4 0 0 0.2 1 0
20 0.3 0.. 0 0 ).: Z 2 022 0.3 -).3 0 0 0.2 2 0
142.9 3.6 0 2.72t20 02.0 1.2 it.O 12.1 20 2
26 1.0 0.4 3.3 2214 5. 1 12 aP
321. o 39 I.5 6.2 27 122P)
2' 1.2 &1 1001 Q10 1-q ) (P
23 I00.20 26).4 119.2 220.2 5. 4 P
23 512.0 233.3 353.0 200.3 300.9 43 0
10 '810.0 323).0 280.21 434 0 030.3 00 4
32 #93.0 504. 0 153.0 232.1 373.1 30 3
3) 3 03.0 .443.0 242.7 002.2 B6 0 339
33 435.0 '23.0 110.0 71.2 33s.3) 49 4
33 300.0 237.0 770.2 2 27 1 138.31 *49
91 110 06.1 0 374. 0 1222'a.2 1 33. 23' "! 2 36 33 3,'17
32 223.0 321 0c 22. '9. 232. 7 4
's ,A 2. I2 .30 0 20. 49 2 '2
X, 6,6 22.2 170. Is I3 1 48
X2 00 21 11,( 1.9 221
13 11 1 . 11. 14. 433 29
$044 2 70 '2 '2 0
Chan0ge0 In Prroouof i Iop k< , (g Z5 a 2.9 1)it,
Preheater D-2.012 I ti .2
TOP(1 Spun Depcott Patw,g- '0it 3
or3 ~ ~ ,..2 >>V Vx

11A SULFUR REFE"REE DIESE.L AL-IM519-F AT 260'C (.500%F)--TEST 51534
06 2.1 Z .1 2. .247. 4 0
02 2.1 i1) 2.4 2.1 I'll 4 a
)0 1.0 1.) ..I 2.4 .
11 t .4 4.7 7.0 1.7?
1* 4.1 7.e 0 1.4 1.9 12
Is 24. 1 19.1 10.6 10.4 17.4 17 0.0* *
II 1 0.1 194.2 47. 1 Z1.7 1Z.9 0I '4(P)
IQ 74.4 "7.) 77.6 62.2 67.4 IS -'%(P)
22 71.8 156.4 10C.4 77.0 107.8 15 'ti P) 0.12 . 0.12 1.12 -
2* 74.61 1".0 97.) 017.0 111.7 to 47(P)
20I.0. 128.4 2)0.4 51.7 174.7 17 4 (P) 0.41 ..n .44 .-
is 121.2 171, 7 0.7 725.0 172. 7 *4 4)M
740 12.7 2*4.0 774 W8.6 '741.0 49 e(1' 07),
V 0 474.0 '74 6 ) 391.0 '446. 70 * 1.45 1r .,14
33746.U '774 .036 710.0 '444.1 10 *
74 11.0 '704 .7* 792.3 .414.7 70 *
555 74 44 -774 7721.0 '774.5 70
d.40 '.76 714.0 .774 40.0 .457 70.l 4
4z 7 M74. 0 '7> 141.0 '19. 0 4 0.4* >
44 5.%0 471.0 445.0 V7) '*'.7 *9 *22
44 W).0 '77 M).0 77.0 6444.0 49 4
48 454.0 774A 04t.0 4. 53 4
70 11..0 04.15. .7 I70.4 7 4 1.77 ~37 .9 240.0 114.0 1.4 101.9 40 4
TTAro $121.7 £041 4 0702. 4 4522.9 7477.2
*JFTOT, D 3241Charge in Pressure Drop, mm of Hg: 125 at 28 min
Preheater Deposit Code: >4TOR Spun Deposit Rating: 50 at 38
1 1
K~Q&Jv'$.N~•X•< %.v~: -x~.A i'•-.Lh.N:~ 1 24%:kt:s- " SA~.%
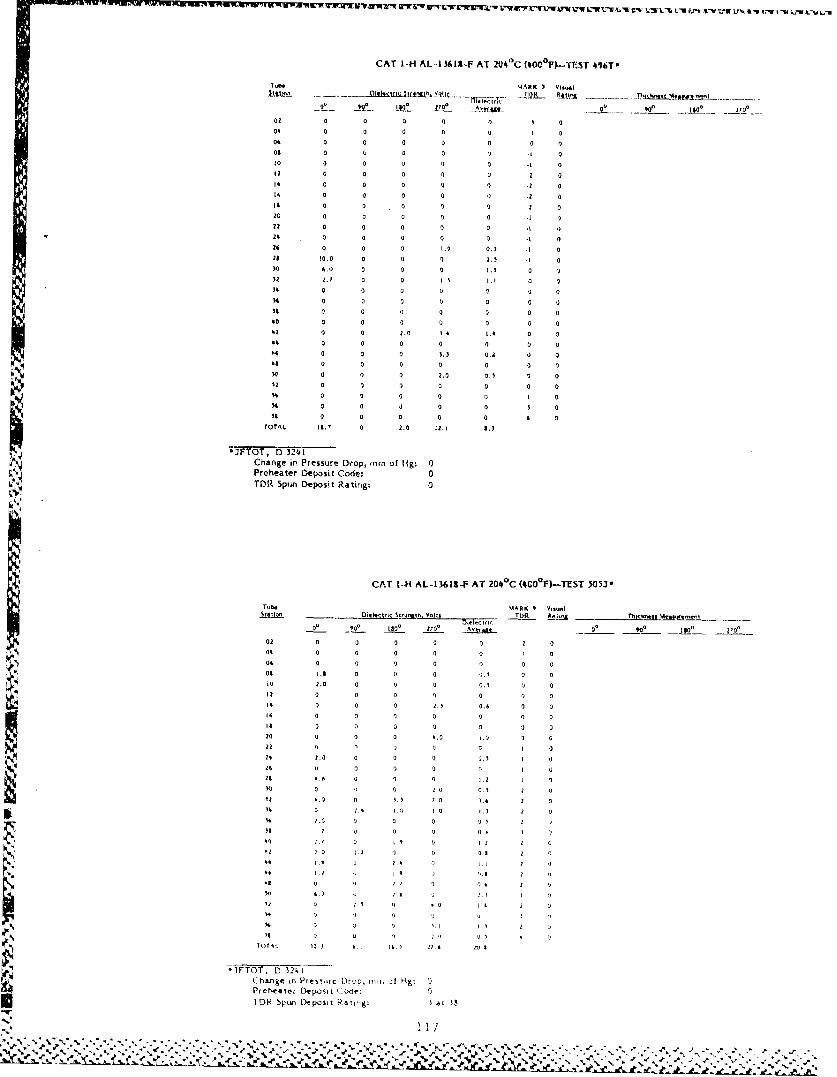
CAT AI-H AL--1I618-P AT ZQ40C(t4o 0 r)ý-mrsr 4i6T-
Sub. MARK U bri-
02 0 0 0 a 1) 1 a
04 0 U a U 0 1 0G6 0 0 0 0 1) UO2 0 o a a 1) -i U10 0 0 0 U 0 -1 012 a a 0 o U .2 0
it 0 0 0 U U .2 0IA 0 a a aa .
az 0 a a -
24 U 0 U U 0 -I24 U a 1.9 0.3 -1 U20 10.0 0 0 U 2.5 .1 030 6.0L U U U 1.1 0 U32 2.7 U U 1.$ 1., 3 U34 U U 0 U U U U34 U U U 0 0 U U
40 U U U U U U UU2 U 2.0 1.4 1.4 0 0
t4 0 U 0 U U U U44 0 0 U 3. 3 0GA 0 U
30 U U a 2.0 0.3 0 002 0 0 0 0 0 U
14 U 0 0 0 1 014 U 0 U 0 0 3 a
is a U 0 U 0 4 U
TOTAL IS.' 0 2.0 12.1 8.3
Change in Pressure Drop, mnm of Hg:. IPreheater Deposit Code: 0
I.,TOIL Spun Deposit Rating: 0
CAT 144H AL-1 3619-F AT 2040 C (4000Fl-TEST 5053*
Tub* MARK 9 V.isl
02 0 U U U 2 U
04 0 U U U U U U
.9 2.0 0 U U 0.3 U 0
14 0 0 U 0. .6 0 U
14 U U U U U U 0
U0 U U 4.0 l.0 1 U22 U 0 U U 1 U24 2.U 0 U U ).S I U26 U 0 U U U I U28 06 U
.030 U U. U 20 0.nit 4. 0 3.5 LU 34
34 U. 2.4 . i 1..0 1.142. U UU. U
42~ ~ 2. .2 U3.0. 1 24 0 1.1 2 (
44 1.2 ( 1) 1.E 1
.9 4.U
-.-f TOT, D 324iCha-nge im Presiurt Drop, *rn 21l HK: 0Preheater IDepoooCode 0TDR Spun Dtpostt Ratig: Ial is
vi1
% % Ne % %.
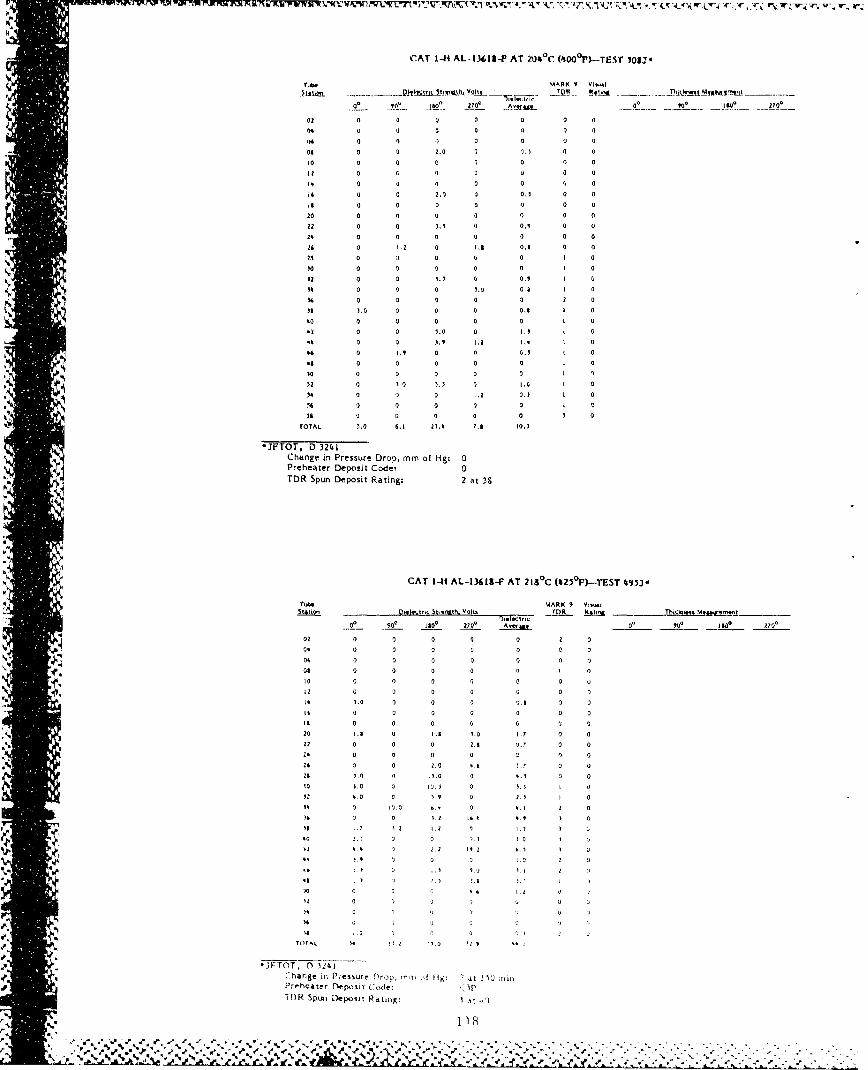
CAT 1-ti AL-.13618-F AT 20# 0c (',000r-TET IOU2w
MARK I Vibdi
02 a 0 0 0
04 0 0 a 2 0 0 a
%4 0 0 0 3 0 a i)
08 a 43 2.0 a 01 1 0 0
10 0 0 42 0 0 0 0
12 0 G3 0 0 2 U
13 40 0 0 0 0 0 i
i6 0 2.0 0 0.1 0 a
200 0 0 43 0 (0
22 a 0 0. 0 0. 0 0
03 i 0 0. 0 0. 0 Q
13 0 ., 0 1, o'.a21 0 o 0 00 o 021 0 0 0 0 0 I 0
12 0 0 0. 43 0. I 0
IL,13 0 20 08 a
M 3 0 0 0 2 0
13 2.0 0 0 0 0.8 2 (0
30 0 0 0 0 0 I 0
30 0 43 1.0 0 1,1 1 0
93 0 1.9 l.a 1.4 I 0
33 0 .9 0 0 0.1 1 0
48 0 0 0 0 0 1 0
0 0 0 0
ON TOTAL 0.0 3.1 21.3 7.8 10.1
*JFTOT, D 3241Change in Pressure Drop, mm of Hg: 0Preheater Deposit Codet, 0
.5TOR Spun Deposit Rating: 2 at 3S
CAT 1-41 AL-13613-P AT 2130C (t250 F)-TEST 495j-
9 rt MARK (0Vsal.
00 90 go - 20 27000 Aie tri 0 -]o 0 70,
02 __ 0 01 I0 0(070
02 0 0 0 0 0 0 0
06 0 0 0 0 0 0 0
ol 0 0 0 0 43 1 0
0o 0 0 0 G3 0 0 03
12~ I 0 0 0 0 0 0 0
1) .0 0 0 0 0.5 0 03 0 0 0 0 0 0 0
ii0 0 0 0 0 (t 0
20 1.3 0 1.& 7.0 1 7 0 03, 2 0 0 0 2.3 4. 0 0
23 0 0 0 0 40 0 0
23 0 0 2.0 4.3 !.? 0 0023 1 0 0 (1.0 0 3.13 0 0
t0 2.0 0 10.) 0 0.1 I
12 4.0 c3 0.9 43 2.0 1 0
It 0 10.0 33 0 4.1 2 0
14 0 0 0. 3. .9 I 4
dr~~~ 30U4 7 (
5 * 33 4.1 14 1 . 0.43 7zi v I
33FTO I) 3- 43 4 1. . (
10hng in 43s~r f43.p min A. .43i 0t ) ti 92-va e 0ewu 0o c 43 I 3 3
09R Spu 0eoi Rating: a.,
13 ~~~ 1.83430
%O~l %? % 2 %0 42
3$%
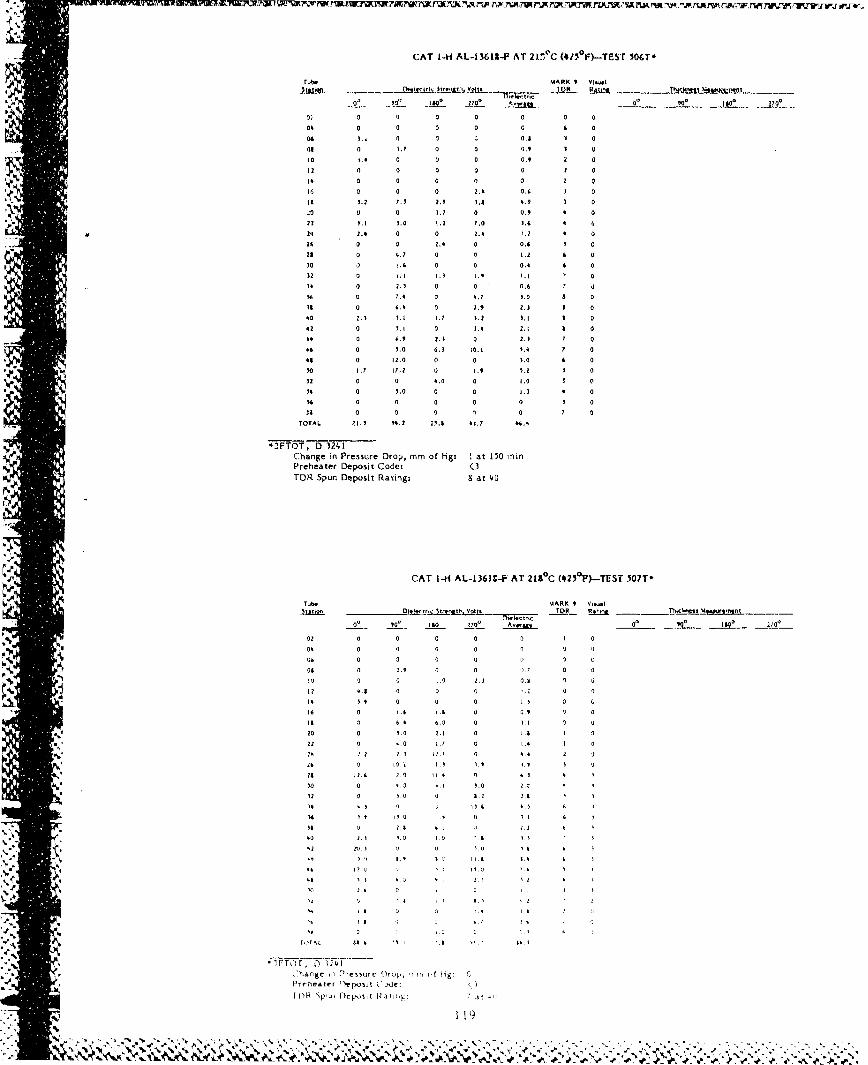
CAT 1-Hl AL-I 3611-4F AT 20,C (1"'F)-TEST 506T-
Tut. MARK 9V-
0. 0 0 0 0 0 0 0
08l 0 0 0 0 0 6 0
04 1., 0 a0 0 .8 0 0
0R 0 8.7 0 0 0.2 2 0
:0o 1" '0 00 0 0.9 2 0'10 0 0 0 0 0 2 0
II ,2 ? .' I0'20 0 0 27 0 01 8 0
02 3. .0 2.2 7.0 1.4 8 0
*24 2.8 0 0 2.8 1.2 8 0
24 6 2.8 0 0.6 2 0
28 0 4.7 0 0 2.2 6 0
30 0 .6 0 0 0.8 6 0)2 0 111 1.1 1.9 1.1 080 0 2.7 0 0 0.6 7 j
24 0 7.8 0 4.7 20 a 0
is 0 6.8 0 29 .1 8 040 Z. 3 1.1 2.7 1.2 2.1 8 0
82 0 1. 1 0 0.8 2.1 b 0
a8 6.9 2.1 0 2.8 7 0
88 0 1.0 6.2 10.2 1.0 7 088 0 12 .0 0 0 2.0 6 0
10 ., 27.2 0) 1.9 5.Z 0
22 0 0 8.0 0 2.0 0 028 0 1.0 0 0 2.1 8 0% a 4 0 0 0 0 3 0
1& 0 0 0 n 0 7 0TOTAL 72.1. 84.2 22.8 82.7 4.8
*2PTOT, D 3241Change in Pressure Drop, mm of Hg: ! at 150 minPreheater Deposit Code: <3TDa Spun Deposit Rating: 3 at 40
4, CAT 1-41 AL-1361C-F AT 218'C (*250 F)-TI3ST W07T-
02 0 0 0 0 0 2 0
08 0 0 0 0 0 204 0 0 0 0 2' 0
08 0 2.9 0 0 -)7 0 0¶ 00 0 1.0 2.2 0.9 9 G
12 4.$ 0 0 0 1.2 0 0
4 28 29 0 0 0 1 5 0 2.
16 0 1.6 1.1 0 0,9 0 0
I8s 6 8 6.0 0 1, 1 0 0
**20 0 2.0 2.2 0 2.8 1 0
422 0 1. .1 0 2.8 2 01422 2 2.7 0 4.8 2
28~ ~ 22. 2.ZI .2 11
82 0 2. 0 .
28 .. 8 0 . U 8 .
24) I. 2U2 . .
88 ~~~ 0 .i 2 2
8~O I0 L . 8.0 2. 8
Chng '2 rs r Drop. o f 0Hg!
Prheler 21 je 84 *2 1.8 2
TDF I/U- 2 81 0 '4
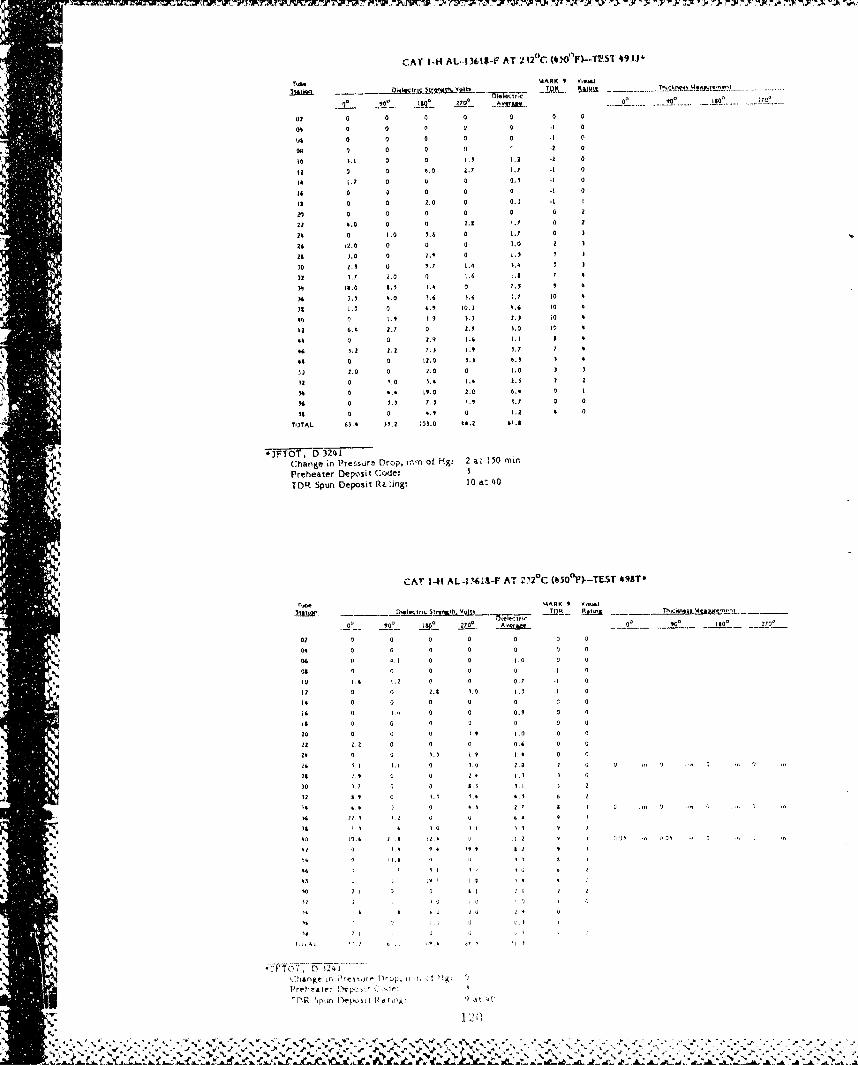
4. ~~~~CAT I-H AL..I3611-IF AT 2,12""C -1ES1*9J
9",0 Ito. _jSO ___~,,
al 0 0 00 1
04 0 0 0 70 . 0
V6 0 0 0 0 0 -
000 a0 0 (1. 0
303.1 0 0 1, . .2 .2 0
320 0 4.0 Z.1 1.7 .
14., 0 0.-1 1
60 '30 0 0 -1 0
Is 0 0 2.0 2 0.2 .0 4
a0 0 a 0 0 0 z
22 4.0 0 0 2.1 .7Y 0 2
24 0 2 .0 3.6 0 L.7 0 3
26 12.0 0 0 0 3.0 2 1
21 00 0 0* 0.
32 1.7 2. 0 1 . .
34, Is.0 ,34 1 .
i.6 0 40
4" ,9 1. 0 6. 2.3 23 L
42 6.4 2.7 0 2.9 3.0 to 4
46 0) 0 2.90 .6 1.1 6
463.2 2.2 7.3 ) .9 3.7 I
411 0 12 12.0 2.31 4.3 3 4Q. 2.0 0 0.0 0 1.0 3 3
52 a 7 0 3.4 1.4 2.3 2 2
34 0 4.4 19.0 2.0 6.4 0 I
434 0 3.3 7.3 .4 3. 0 0
is 0 0 4.3 0 1.2 4 0
TOTAL 63,4 3) 2 103.0 44.0 0 .1
Chtriane in Pressurt Drop, mr. ot Hgz 2 a, IMI minPreheater Depoisit Code: 3
TDLR Spun Deposit RL. ing: 10 aý 40
CAT 141 AL-116i11-F AT -32'C (45O0'F)-TEST 49&T-
IT 4400K 9 V-41
D1-tl.o,,c S343l36 Vo~ ts r ! __ - ThJIq, __
00 ,o~ ~ 070 ,ettroc o 0
402 0 0 a 0 0 0 0
404 0 0 3 0 0 0 0
06 0 41 0 0 1.0 0 0
.,09 0 0 0 0 1) -1 a
10 1.6 0 ~ 0 0 0.7 -1 0
44412 0 0 0.4 3.0 1.1 .1 0
14 0 0 0 0 0 r, 0
14 0 ,0 0 0 0.9 0 0
is0 0 0 0 0 0 0
20 0 0 0 1.3 1.0 0 0
2 2 0.0 0 o 0 0.6 0 0
0 4 G 0 3.3 1.9 4 0 0
04, s.1 3.1 0 3.0 0 .3 2 0 000
28 113 0 0 04 1. 3 0
40 3.7 0 0 8.0 I.
is I4 0 3.3 44 t.3 'I
'0 0. 04 2. 1 0 4 1 03 , .0 ,
40 0 4 * 3.3 I1 3
Chang 74 n 0e wr D 4.4 n, I Hg:
44h!ar 0lpc l ( 3 I 3 1 4
Tf, P tio :a
.0W0 .4 7 I3 .
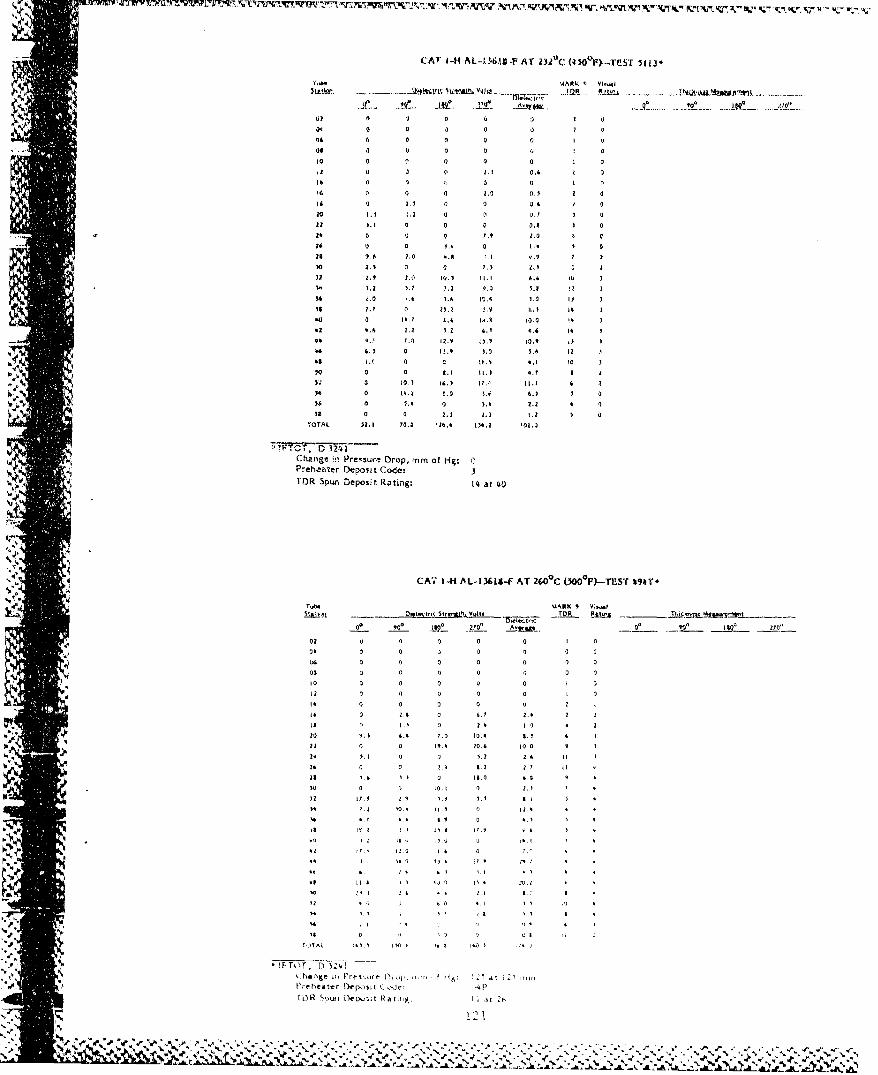
CAT. i -H AL-A06,14 F AT 23277C (4 0P)-TCST 3113~
MAR9K 7 Vi"o4
000 0 0 0 7 0
9 .0 a 0 0 0. 1 0
tc 0 0 0 0
10 0 ~0 1. 072 1 020 0 07 07 0.0 0
Z4 07 0 7
24 0 a, 0~ 0 0210 1.1 2.10 0 '..' 7
00 2.3 0 0 0 .7
09 0. 0. 0 Hi .l 0.0 76
3.2 0 .2 90 %.1 079.0. 0.0 1. ,
10 a0 1,7 0 ý 0 7.1 to.7 14
90 .1 1.7 12.V 0ý.' 0.9 31 7
00 .0 00 7 .4 10, .0 0
93 0 (1, 4.9 s.. 0,
97 9. 10.0 0.0 0.!t H0.1 10
96 90 W it F , .0 775 0
.7 0 0 a. 0
TOTAL. 70.7 70.0 Q4.4 13-.Z 107.0
Change ooPre'our Drop, mm of Hg:00,Preheater Dtepooot Code: 3
TOR Spun Deposit Rating: 14 at 403
040
I::CA7 144 AL-136IS-F AT 26 0 C ('3Oo0F)-TEST 1#4r
Tub. MARK I 0 -
00 10 to,~ 0700 A00Jj 0 ~ 14 to'0 ,
07 2 0 0 0 1 0
09b 0 0 a 0 0 0
000 0 0 0 0 0 0 0
09 7 0 0 0 0 0
1 0 0 9 0 0 0 0 000 0 0 0 0 I 0
09 0 0. 0 , 0Z.4I09 0 0.9 0 67 1.9 720 0 .7 10 10.4 0.0 600 1. 0. 79.0 10.9 9.7, 0
p.~~ Z& 0 0 079 0.0 00
0.0 [3.
w0 10.0 .1
t. 7 017.1 01 7. . 5
II 1. 709 01 0 1-.1 0 0
'~-0
at. is0. . 09 I , .
TOT0 010 a9 9 .0 . 9
T 090 ' 0 . 7 .
k 1a ge o Pr-.7w O .;jý IT" ,: I7 i
Preheater I)cpcoso 7 7' oe: O
TIR SouroBeoxot ilatog I I a 2t,
a"2~00 9k
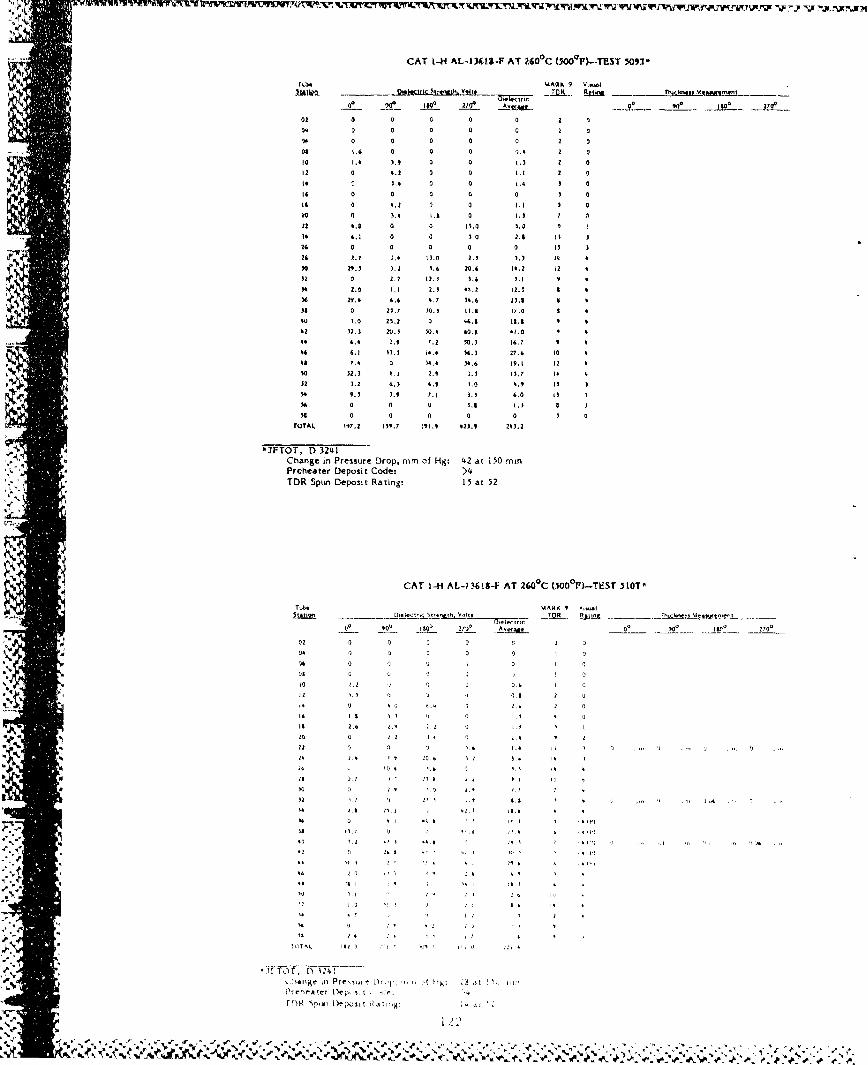
CAT 1-H AL-13415-F AT 2600C C1000F)--TEST 3a9s'
00 1100 va*- ISO*iq~0 ~ 9" 0 270P
02 0 0 0 0 0 2 30'. 0 0 0 0 0 0
06 0 0 0 0 0 2 0Do 7.0 0 0 0 0)., 0 0110 1.0 3.9 0 0 (.3 0 0
12 0 4.2 0 0 2.1 2 020 0 3.0 0 1.4 3 0
14 0 0 0 4 0 3 0Is 0 '.0 0 0 111 3 0k0 0 3.0 l.a 0 2.) 7 02 O'.0 0 0 11.0 1.0.00 4.2 0 0 2 0 2.6 2
24 1 0 0 a 0 0 13 3
76 0.0 ).0 20.0 2.3 3.0 K ~ 0
30 09.0 . 3. 0 10.4 20.6 1.2 22 0Pt32 0 0.0 2 2. 3 3.4 3.2 0
30 0.0 2.2 0.3 00N. 2 2.3 3 0x4 20.04 4.4 .7 30 2013 a
is 0 20.7 20. I:a I U 1 000 3.0 23.0 0 44.2 1123.
02 3.3 222.3 30.01 00.3. %2. 1 000 6.0 21.3 17.2 30.0 20.7 0
00 7.0 0 20.0 34.0 23,2 20 0
30 02,) 0.2 0,0 2 I32ll 200 3.2 1.3 6.39 . 0 2 13
309.3 3.9 7.2 1 2.0 4.0 13 3
so 0 0 0 0 0. 1 0
TOTAL 197.0 [$9.7 230.4 023.9 200.2
4 tFT-OT, Dt 3-2410Change in Pressure Drop, nmm of Hg: 42 at 150 min
Prcheater Depoait Code: >4
TDR Spun Deposit Rating: 15 at 52
-. R .
-00 g0o, 79 Aeo 0 0 19 270-
02 0 0 0 0 1' 0
04 '2 0 1*004 0 U '1-0 3
4 .10 21 0 0 0 0.4 1
14 1. 0 2 0 . 0
II .4 .6 2 0 .
21 00 1. 1. .
0 ' ~~~ ~~242. 20 Io 03 0
I~~~~ I3 2.I~2-0 4 1
a 30 ' 23 1 2' 12
34I 0 2 23 I 0 1 -0 292
9h ik 4 l 03.1ur' 0I 2i "K 2 20 4t 02'll
00hr te I 2 )-'7! [0 -, 13 .,22:2,, . I ' 2 .' 2
32 0 20 3~X)i Rd' l7mg 02
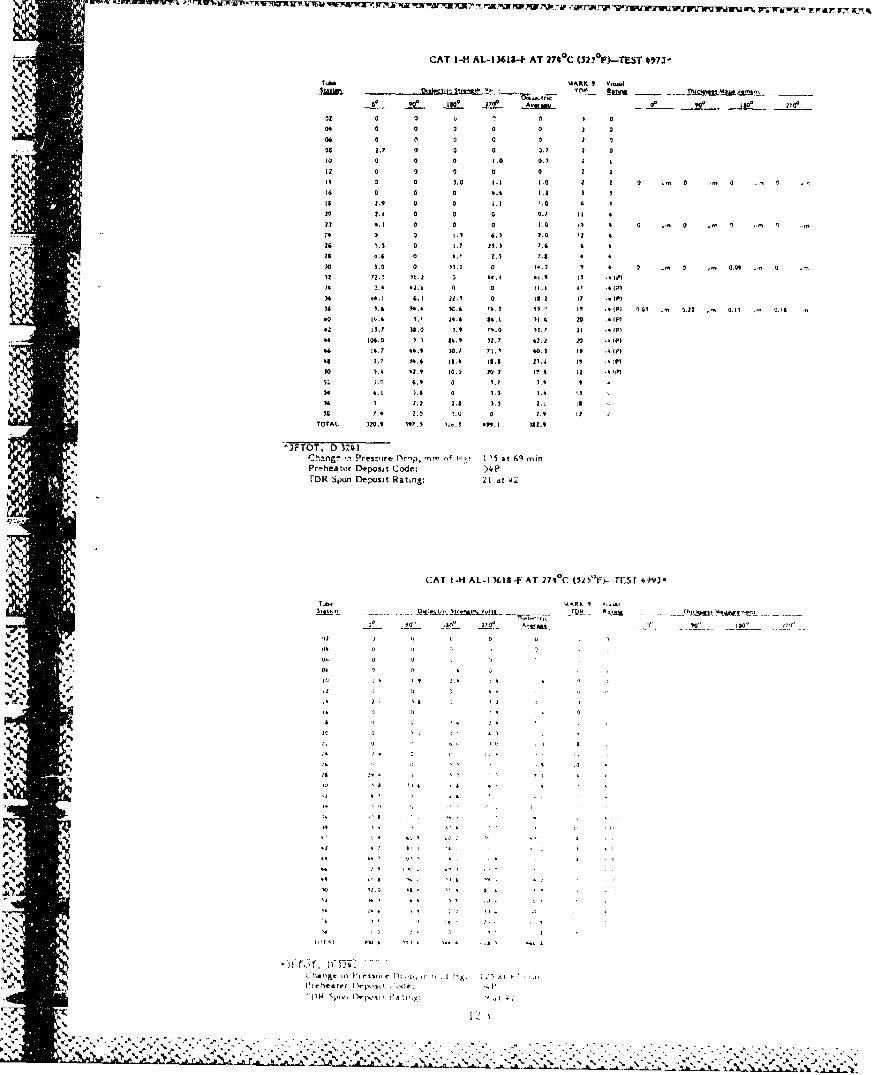
CAT I-H AL-13611-F AT 2710 C (523 0 P),-ThST 4973-
0%Tube MARK 9 VIutI% "'Ciz4, ftin -~s Su- hu'lan. -
% 1 ,0 sa 2
%02 0 a 1, 004 0 0 0 0 0 3 0
M 2.? 0 0 0 1.? 2 010 (1 0 0 4.0 0.3 a I12 2 0 0 2 0 z 2IS 0 2 ).0 4.1 1.0 2 7 0 ,m 0 ... 0 ,
(6 0 0 0 6.4 1.0 4 3Is 2.9 0 0 1.1 3.0 6 1in 2.A 0 a a a.? 11
T2 0 11 0. 0. .
26 .3. a 1.? 20.3 Y.6Z& 4.6 0 4. 1 Z.3 1 . 4
a0 ).0 0 331 4.3 4 0 0n 2 a 0.24 a
32 72.3 31.2 a 44, 1 *.. t(1 .. (0)* . 41 4 2.4 42.1 a 2 ti.1 I7 .4(2)
(,4 W4 #41 .1 22.3 0 181 10 I? MP)6 3.4 04.4 50.46 7e. W3.? I3 ? e lil 0.23 ., .232 . 0.13 ,, 04
40 (4.4 3.) 24.4 £41 31.4 20 tIP)
42 13.? 39"3 3.4 753.0 31.7 2 1 M9P44 106.0 3.) 54.9 32.7 42.2. 20 .- P)
44 14.7 44.4 )0.7 71.7 603 19 (P7)It45 2J7 H4.4 144 15.4 23.4 (9 4(P3
)% 0 3.4 t2.9 (2-1 10.2 03 (2 .23% I).c 4.4 a0. .
S 60 2.2 2.4 . 2.a (4 67.4 2.0 !. 0 2 2.3 t 2
TOTAL. 420.9 0"7.31 116.1 3 1 is 2..9
0 JFTOT, D 3241a' Chang- CO Press' ire fDr-p, "-in nM 1,5 at 649 min% Preheater Deposit Code: '>4 P4'. 'DR Spun Deposit Rating: 21 at 4i
C.AT 1-ki AL-tM IS-P AT 2710'C (5> Tv- ESf 4lJ-
T.. AIRK4 9 0,,a(
1, to' ?),
%4 -r W 0 0 '
'C ''1. 4 (9 .' 4 .4Is
'C%. 0 ~ 0 4
40') j4(
N40 4
ting 1 '4es- 0l~o it I
_M 0A - I4
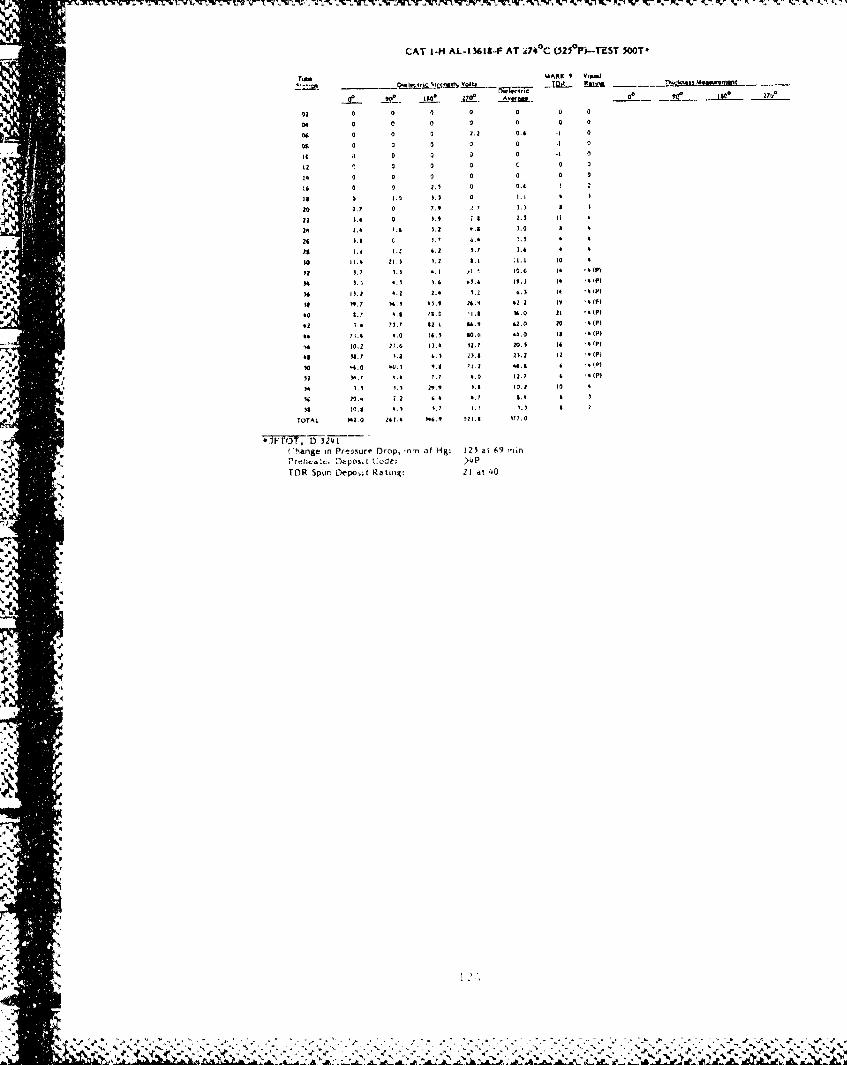
CAT 1-H AL-1361"- AT i740C (S25 0Fi-TEST SoOT-
MARK 9 V,..1
K 20 0 0 0 00 0
OK 0 L 0 0
040 0 a 0.0 .K - 0
FA 0 0 0 0 .
IC0 0 0 c 0 - 0
43 K0 0 a 0 0 0
16 0 0 .51 0.L I
to 0.? 0 7.9 . .
000. 0 ).t LI 0.$I
20 00.3 h 0 .1.6)Z .1 1.0 a0
06 002 70 . .0 10.t It .4(p
%0 9. 45 4. 65.4 30. 0 6 00 lp)
64,A 7. 33. 1.z 6.3, 1 00 lOP;
is7. 7. 30. Z34. 42. 00 IV - (P)
.6 0.0 00.4 00. 71 2.7 00.5 Il P 9
46 MS5.7 0.2 6.) 0534 00.0 10 M7P
10 -4.0 6005 '.3 70. A 7~ 6.3 K 10)'
M3. 0 5.? 7.4 7.? 7 .0 00. 7 & (30 )
'56 20.7 ;.2 Ž. 7.3 00.0 0
51 0.8 0. K. 7 K.? 1 .7 K 7
TOTAL 572.0 M6.3 54.9 500.3 177.0
Chanoge in Pressure Drop, -om of Hg: 125 at 69 minfPr.007.ac Ditpci. t Code; >4PTDR Spun Depo..:t Rating: 21 at 40
lK
41.
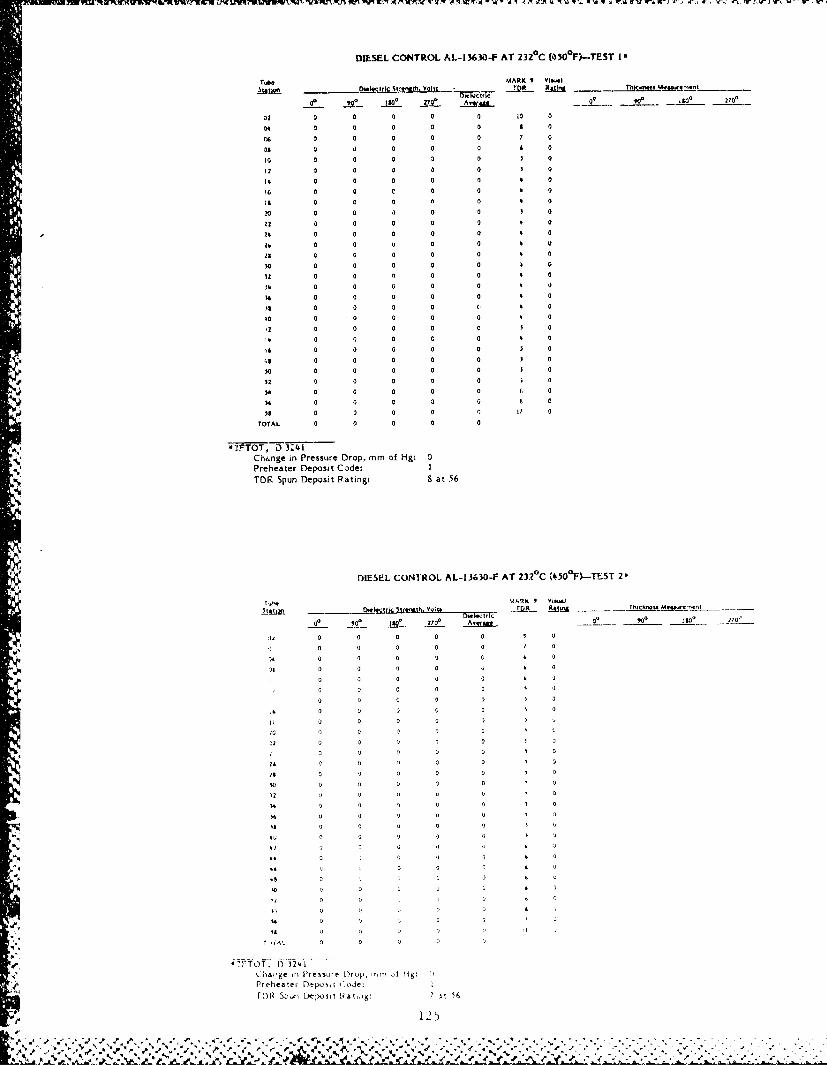
LIVRLl6.tw 'fl4 -. L W0-UT3 WVM iWNI lez Irv W-4 7"4 -l WIr 11' wY
DIESEL CONTROL AL-1 3630-IF AT 232 OC (030*F)-TEST I-
Tube MARK 9 Vi-I
02 0 220 0A~. 0?2L 00 05 a ____
04 a a 0 0 a a(A a a 0 0 0 7 a
a2 0 0 a a a 1 a
a4 a a 0 0 0 4 a
is 0 a a 0 a 4 a
20 0 0 1) a a 0
22 a a 0 0 a 4 0
lb a a (0 a a0
is a a a 0 a020 a a 0 0 0 1 0
It a a 0 a a 4 0
%4 0 0 2 0 0 4 0
is 0 a a 0 4 01a a 0 0 0 4 0
-22 0 0 0 C 0
0a a a a a04 0 0 0 0 0 0 0
24 0 a 0 0 0 2 0
20 0 0 0 0 0 3 0
32 a a 0 a a
14 0 0 0 0 0 0
14 0 0 0 0 0 t 0
18 0 0 0 0 13 17 0
TOTAL 0 0 0 0 0
*'IFTOT, D3Z41Ch~nge in Pressure Drop. mm of Hg: 0Preheater Deposit Code:ITDR Spurn Deposit Rating: 9 at 56
DIESEL CONIJROL AL-I3630-F AT 232'C (450'F)-TEST 2-
0 0 0 0 0 2
000 3 0 0 2. 0
12 2 0 0 0 2
0 0 0 03 3
3 0 0 0
a 0 0
U 0 0
20 3 0 0 u 0 0 2
22~ 00 0 3
0~~ 0 3 0
3 U U 0 0
28 3 G 0 0 3
is 0 -j u 0 3
12 0 u 0 0
)4 1) 0 0 o
*0 o 2j 0 6
10 12 D u o2 0
isU c'., I2 I
5,~- 7 4-3
22agei l-icisurr D~rop, i-22 ol HKg:
Preheate, [)atpusi ( cie
A&0 1.02%
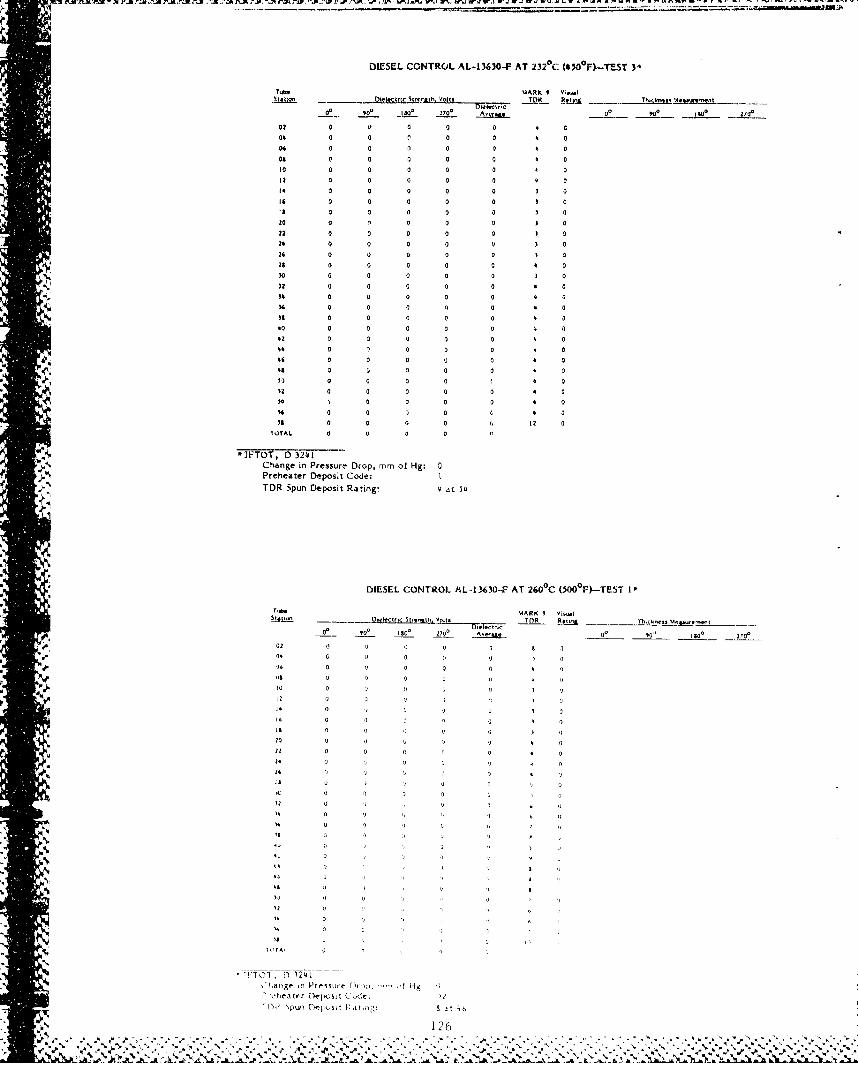
DIESEL CONTROL AL-13630-F AT 232 0 C (430 0 F)-TEST 3'
Toh. MARK 9 V....
04 0 0 0 0 a 004 0 0 0 0 0 4 003 0 0 0 0 0 9 00S (10 0 0 0 0 0
10 0 0 0 0 0 4 012 0 0 0 0 0 3 014 0 0 0 0 0 3 0
16 0 0 0 0 0 0
20 0 0 0 0a22 0 0 0 0 0 024 0 a (2 0 0 3 0
03 0 0 (2 0 09 023 0 0 0 0 0 4 0)0 0 0 0 0 0 3 002 0 0 0 0 0 9 01 4 0 0 0 0 0 4 0
34 a3 0 a 0 0 4 038 0 0 0 0 0 9 090 0 0 0 0 0 0 090 0 0 0 0 0 9 099 0 a 0 0 9 093 0 0 0 0 0 4 0
S93 0 0 0 0 0 4 0
5 9) 0 0 0 0 4 030 0 0 0 0 0 9 0
)43 0 0 a 0 9 006 0 0 0 0 0 9 038 0 0 0 0 6 12z 0
TOTAL 0 0 0 0 1
-JFTOT, D ý24I-Change in Pressure Drop, mm of Hg: 0I'Preheater Deposit Code:.~ 4TDR Spun Deposit Rating, 4 ato 54
DIESEL CONTROL AL -13630-F AT 260'C (500 0 F)-TEST I0
9 MARK 9 VooolS400 ..~. ~ o~~otS t,. moo Volt$ TIOR Ft.-opTCOO9.O
0O
00 0 0 270, A-ouaq0 0' 90 20
02 0 j0 0 0 0
04 0 0 0 0 0
)4 0 0 0 0
2 1 0 0 0 3 0
20 0 0 0 0
22 0 0 0 9 0
-t2 1- 04 1
110L "N 'S
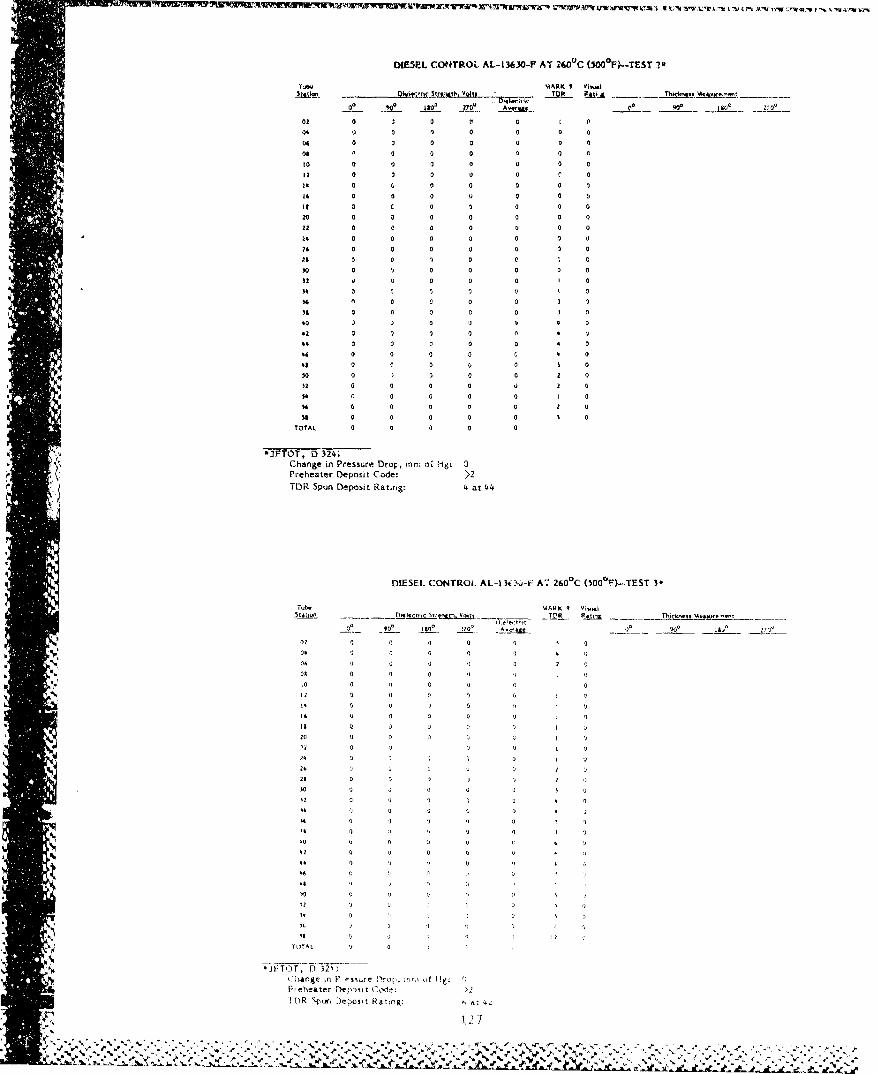
D"ESEL COTROL AL-1 3630-P AT 2600C (500 0E-ThST I-*
Tabj MARK 9 Vi-ua
0 -. 2L ba 2700 _______270__
02 0 a 0 Ita(% It a 0t I 0 0 504 0 a It a It It a0411 f 0 0 It 0 0to It 0 0 0 0 0 a
12 0t 0 t It a c ait ( 0 0 0 It 0 0It 0 0 It UtI 0 0
20 0 It 0 0 0 0 022 0 0 0 It 5 0 050 0 a a a a 0 (174 t a It 0 0 a a29 t a (3 a C c aIto 0 4 a a a a a32 0 0 5 0 It I It14 7 0 0 a a I
40 3 0 a 0 a*2 a a a a 0to a a I 0 4 0
It 0 0 0 4 S I
00 a ' o' 0 0 Ca 0 0 I
50 It a 0 0 0 2 0312 0 It 0t 2 It 054 0 0t 5 t0I IIt a a S astl It 5 0 0 (25 5
TOTAL It a a It 0
*3FTOT, D 3241Change in Pressure Drop,, mm oi lig: 0Preheater Deposit Coder >2TDR Spun Deposit Rating: 4 as 44
DIESEL CONTROL. AL- IM-Ai-F- A-.: 2600C (500'FW-TEST 3*
Tub. aIA K 9 VkvAI
02 0 0 0 0
0 5 IU~Aro 0 7t La ai09 a 0 a a aQ
*0 as a a 0 a02 04 0 a a f)aa
S09 0 a a) U
4 0 a aU23 0 0 a a 9 I
Ito 0 a a a a
2 0 0 a a
.1s a 000a a ,
DR Spu e;cs a t ag 41 4-,N~~~ *4 a a
N-a a
OS a
a a aa 4e
X7 !V WVA ,I -7 'V-yLt¶,UMtnK'wrUwR yd- r 'r rL
DIESEL CONTROL AL-I13630-F AT 2"t (3L50F)-ThST I-
Tuhw MARK I Vialo
02 0 0 0 0 0 3
to 0 0 0 a 0 3 a
12 a a a 0 0 2 00t 3 0 0 0 0 2 0
160 0 a G a z GIs a 0 0 2 aa0 a 0 a 0 0
2. a a a a a 3 a
30 1.0 a a 2.6 a,, 6 232 0 3.) 1.0 1.5 2.1 t I 234 L.a 0 a a 0.s a 3)G 2.0 2.1 ;.a a 2.3 12 3
to0X 3.7 0 1.1 2.2 15 3
02 1.7 i.0 3.0 5.0 3.% [31 1 c%4I 12.3 0.0 2.3 1.0 3.3 It
48 2.0 3.9 0 2.2 2.1 I
a0 .1. 2.0 Z.0 a .a to 232 a0 Y.a a t.) 2.3 9 2 'at 1.0 a a 0.o 3 2
so a a a a a a1a0is a a 0 a a
VOTAL 3?.0 23.0 10.0 Ml. 27.11
*JFTOT, D 3241Change in Pressure Drop, mrr of Hig: 0
9Preheater Deposit Code: 3TDR Spun Deposit Ratirng: 15 at 42
D)ESEL CONTROL AL. 13630-F AT .63 C (313 F)--.TES:T 2' .
MIARK V Y:&.t
OvI~tric Stnot. Ooit TO Ratial 7±±cow~\eu2)k m ......
01 181t70
IZ CI 0 2 0 0
0~ ~ 0 2 2 2 (2 3
20 2 9 0
20~ ~ 20 2 0 2
2012 2
)50 2 2
t02 l2
322) .. 2 7 7
.7.

DE-SEL CONTROL AL-11630-F AT 261 0C (s1s 0Fh-rnSr 3a
lTub MAARK 9 Visit
a0 0~ j4 0 ut 00 2 t -2
* 09 02 a a a) 21
04 a 0 a a0 I L
a2 Q a a a 0 0 0
14 a a a a a a a1t a a a a a a a
0 a a a a a a29 0 a a 0 a
2t a a a a a 2 020 a a 0 a aP
34 a 0 a a a 3
38 a a a a a 9
42 a a a a a 11a 1 a a a It 3
46 2 0 0 a a to 3t0 a a a a tAl
32 a a a a a 3 z5t 0 a a a a 2%4 0 0 0 a a 0is 0 a a a a 14 a
TOTAL a a a a0
-JFTOT, D 3241Change in Pressure Drop, mm of Hg: 0Preheater Deposit Code:3
TOR Spur, Depoa~t Ri-?tiig: i I at 44
DIESEL CONTROL AL--13630-P AT 274'C (525 0 F)-TEST I
heb. V'Olta 9 V.Ita
20 90 isa0
z20-01__ Aip 0 90' 04) U
a4 a a 0 a a
12
Is 0 0
SZ as a a a04~~~ a 0
0 0 0 a
a0 a a 2 a
A0 2. a i 1a 0
25 aI' ria a a 2 i ar
'7R 2. a .3 ¶a ,
N9 i .
%0 V o 9 ¶
is k a.- U 50
DIESEL CONT2A)L AL-I 3638l-P AT 274, 0C (323*F)--TFST 2-
Toe.MARK 'P YI.1
_____ 018ta _____ 27
0U 0 0 (10 .
0# 0 0 0 0 0 0 0
04 0 0 U (I f.4 0
03 0 0 a 0 0 0 0
to 0 0 1) 0 cl 4 0
12 a 0 0 0 4 0
It 0 0 0 0 0 0
14 0 0 G 0 0 0
II 0 0 0 0 0 4 0
02P 0 0 0 0 0 5 0
22 a 0 0 0 0 0
24 0 0 a 0 0 It 0
2. 0 0 0 0 0 7 2
29 0 0 0 0 0 9 0
3o 0 7 0 0 0 0o 0
37 0 0 0 0 0 12 0
)ho 0 0 0 0 15 2
31 010 0 8.1 2.1 1.6 11
39 0.4 7. 2 .1 o. .0 2
40 3.4 11.0 0 4.2 7.2 22
42 0 2.) .0 2.0 2.3 22 3
44 0 31.% 2.C 20.9 13.7 00
44 0 4. "4 4.3 '0.1 2213 2. 0 0 100 34 I 3
t0 ., 14, .3 42 3.
32 0 2.0 2.9 2.! 1.3 03 2
34 0 0 1.0 0 0.) 13 2
%4 0 0 0 0 0 13 2
U2 0 0 0 0 0 14 0
4TOTAL 00.4 74.2 20.9 63.s 42.9
*JFTOT, D 3241Chang~n. in Pressure Drop, mm of Hg-. I at 150 minlPreheater Deposit Code. >3TOR Spiýro Deposit Rating: 22 at 44
DIESEL. CONTROL AL-13630-F AT 2Y4-~C (32.5uP)-TEsr 3-
T,Wb MARK 9 Vo~.-Ot~~oo~T AŽAtoR1~fo0 K 4!.e Thj-,.400 M t*g2,TL.
00 10 j30 0 0' 100
00 0 0 0
04 0 0 0
Olt 0 0 '0 0 0
t0o 0 0 0 0 )
2 0 0 0 0
0 ~4 0 0 0I 0
2t 1 1 .1 0 2
11F( -5 j f
0.lg '0 0rs '!r Dr p ?14fHý t1"0
% N
DIESEL CONTROL AL-13630,.F AT 2Z3S0C (5o0rF)--TsT 1*
Tubfe MARK I Vjsul"31.1kkimnctr tclringah. Volts TOR. WaKa Th mA4.njzS-M-l v-- f-2--_0 so" 210"'
02 0 0 a 0 4 o D04 0 0 0 0 0 4 006 0 0 a 0 0 4 004 0 0 0 0 0 t 0
10 0 0 0 0 0 012 0 a a 0 a a
1a a a a 3ts 0 0 0 a 0 2 0LIs 0 0 0 0 0
20 0 0 0 0 0 2 022 0 a 0 0 0 2 0
24 0 0 0 0 0 a a26 0 0 0 0 a £ 0
30 0 1.0 0 a 0.) 13 232 2.7 4.9 0 3. 1 2.7 20 ait 0 .a 0 5.4 2.7 21 a
34 34.8 2.0 16.6 .9 14.3 21 432 ot. • a9.0 24.3 4.2 317. II 340 w4.£ 90.0 49.9 39.1 4. 1 3U 4
42 6.0 94.z 3.0 440.0 33.9 318 444 42.4 S0.7 44.4 4.2 33.4 38 4446 )6.6 47.9 0.2 3.0 0.0 37 aIts 4.y 17.4 4.6 21. I 42.31 26
30 24.0 %.31 37.& 0 34.1 I1 3IN 52 J.0 0 2.0 33.4 9.7 10 034 12.0 23.0 1.1 36.31 39.7 10 0
I 56 a 0 2.1 1.0 1.1 II 0S3.0 3.3 1.0 0 2.3 24 4TOTAL 309.3 3,9.3 34634 204.0 342. 2
' 3FTOT, U03241Change in Pressure Drop, mm of Hg: I at i50 minPreheater Deposit Code: 4
TDR Spun Deposit Rating: 38 at 44
a0
DIESEL CONTROL AL-i 3630-F AT 2880
C (50*0
F)--IEST 2'
cc t4SRK 9 V IIrS41lTt TOR
0° --90,. ISO' •° .27* A+--Jli _ 0°-2 7e• •'+
02 a 0 0 0 0 4O. 0 o 0 :04, 0 0 G Il 0
tl 0 0 Ci C 4i
t C l 0 a 1 0N2* i • l l ... .C, +l Cl +1
16 0 0 0 A 0
4 ~ ~ ~ 0Ul C ) l I
10 0l C l AC 4 Cl4 20 A AC 0l C lC
Ci C Cl 'I l I Ci
42 I Cl l IVI4 . C C I 2 . .I 1 i 4
34 + o Cl i 1 . 1.2 j .2 1
C a g In+ Pr ssr 1 c p ý,i i I HK i l )C)
•4 h1 12' 2' Coe ii 494 '25
.2 l *C 4i;i ¶r l II Cl Cl 1
TL' SpnI.jxR tn: At49 L
1:1 • II 1 *2I 1 .1 ? I I
'9. i24 CJif r) 1. CI .1
14s i +1 i • .C C 1 2s .2 i44 .3 j iC C3t1I I I it)l
i P re heater £) •p ,cat l it: e. Cl
T L40 5
p14 [k>poi t Rat0 t• IC I I l 24 14t
• . %", %# " , " + -,/ A t. • -,S... . ,•.. .. :: , •. • J+ +'L *+ "•i ,, + , ,," ," •" Z d' • J -'+," + ,• '''J /"%'
DIESEL CONTROL AL-13630-F AT 2880
C (550°Fi-TEST 3PTub. MARK 9 Vial
00 0 0 0 0 0 3S0
04 0 0 0 0 0 2 004 0 0 0 0 0 2 006 0 0 0 0 0 2 020 0 0 o 0 0 I 010 0 0 0 0 0 1 023 0 0 0 0 0 I 016 0 0 0 0 0 1 013 0 0 c 0 0i0 0 0 0 0 020 0 0 0 0 0 2 003 0 0 0 0 0 2 0
26 0 0 0 0 0 4 029 0 0 0 0 0 6 290 0 1.0 0 0 0.0 19 502 0.2 20-0 5.2 9. 10.2 0204 5.0 5.0 0 2.9 90 21
36 03.1 .9. 2.5. . 20.2 02 a2 502.2 521.3 12.1 :4.,5 30.2 I I
02 74.0 56.0 42.3 5l.9 61.21 M 4a3 0.2 09.7 109.5 45.7 62.7 3 4 0.0 ,m 0.2-0,3 in
36 82.0 59.6 28.3 71.3 62.9 35
,0 28.0 5.6 92.2 20.4 00.6 12 392 0.0 28.0 12.11 .7 12.4 9 003 0.0 9.6 5.9 0 3.0 9 046 2,0 4.2 7.2 0.0 4.2 20 003 20.0 35.2 93.1 6.0 512 95 0
TOTAL 636.9 430.0 660.2 401.6 432.7
*3FTOT, D 3241Change in Pressure Drop, mm of Hg: I at J 30 minPreheater Deposit Code: 4TDR Spun Deposit Rating: 38 at 44
VlS11 12
..,
%
JJ 'A' >
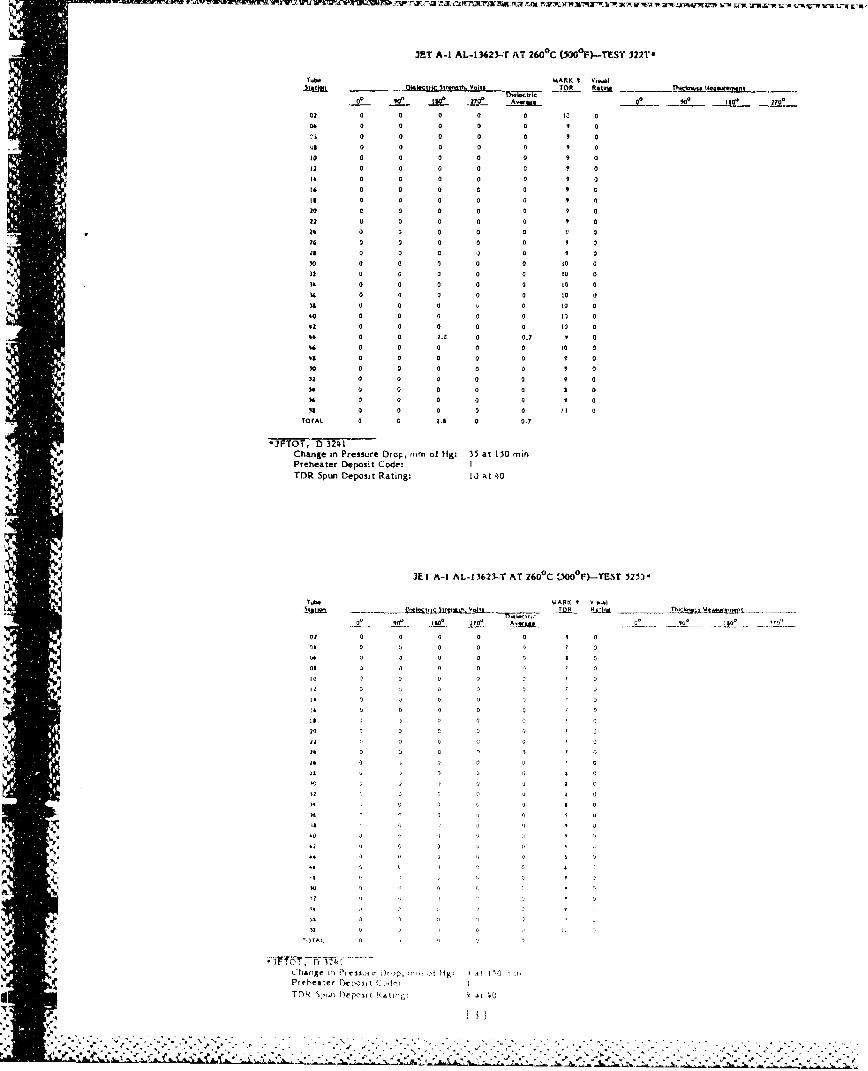
3ET A-I AL-I.3623-T AT 2600 C (5OF)--TES" ST'
MARK T VawaiOlskcstrkc $trmntk YOMt & AO
00 a 0 I 0
0 O 0 0 0 9 2Ca 0 0 0 0 0 9 0
0. a 0 0 0 9 0
0 0 0 0 0 0 9 0
12 0 0 0 0 0 1N 0
1i 0 0 0 0 0 9 0
iM 0 0 0 0 0 9 0
II 0 0 0 0 0 9 0
2a 0 0 0 0 a a 0
22 0 0 0 0 0 9 0
,. •&0 0 0 0 024 0 a a
2 0 0 0 u 0 JO 0a0 a a a 0 a0
12 0 a a a 0 to a
3 0 0 0 0 0 to 0
! 0 0 0 0 0 tO 039 a a a a a 3 a
to 0 0 0 0 0 1i 0
42 0 0 0 0 0 0 0
44 0 0 2.C 0i 0i.7 -P44 0 0 0 0 0 i0 0
4o 0 0 a 0 0 9 0
30 0 0 0 0 0 1 034 0 0 0 0 a a 0
04C 0 0 0 0 0 05s a a a 0 a ii c
TOMA 0 C 2.1 0 0.7
-r~;D3241Change in Pressure Drop, mm ot Hig: 35 at 150 minPreheater Deposit Code: ITDR Spun Deposit Rating: 10 at 40
J ET A-I AL-I 3623-T AT 2600 C 500 F)--TEST 32523
LOe OA0 0iGa_°._ a__i .io _..'sILo° lYss. o_ 700•U ._- __ _ Th... rwt _S MC0JoiS .. ...7_ •_
"0�0 a 0l a 0 0
0i0 1 U U 0 o 7
06 0 0 0 L}
Ilk U 0 o
rol0 UL , U
Ch rg L P SUý U)lp ! U Ui, I I I t l
iflrt e U U U U Ut
lea sI C 7

3ET A-1 AL-1323-T AT 26 0 C (500°F)--TEST 52*
Tuob MARK 9 VI-ul.
D..le~~lriC -h TDR R"fW- TicAs 2e~rnsS 0 9?0 IIo._.? 27 -t . A ._vr.•L. 0o 9o 230o ,270
0.1 0 0 0 0 2 0
0T 0 0 0 0 n 1 0
04 0 0 0 0 0 i 0
04 0 0 0 0 0 1 0
2. 0 0 0 0 0 1 0
12 0 0 0 0 0 0
I4 0 0 0 0 0 0
I0 0 0 0 0 0 0
Is 0 0 0 0 0 2 0
20 0 0 0 0 0 2 0
2U 0 0 0 o 0 0
24 0 0 U 0 0 I 0
26 0 0 0 0 0 1 0
22 0 0 0 0 0 1 0
30 0 0 0 0 0 1 0
i2 0 0 0 0 0 1 0
00 0 0 0 0 0 0
)0 0 0 0 0 0
33 0 0 0 0 0 2 0
40 0 0 0 0 0 2 0
42 0 0 0 0 0 2 0
*4 0 0 0 0 0 0:16• 0 0 0 0 0 0
44 0 0 0 0 0 0
0 0 0 0 0 0
32 0 0 0 0 0 I 0
02 0 0 0 0 0 U
TOTAL 0 0 " 0 0
S;WIFTOT, D 3241
Chenge in Pressure Drop, mm of Hg: I at 15 mOrin
Preheater Deposit Code: ISTDR Spun Oeposit Raying: 2 at 40
JET A-1 AL-13623-T AT 274°C (525F)--TEST 5293"
I(
T1b 01.K 0 Vsa
as 0 sa3
t o I
" Put t * 3
II, 0 ¼• Cl
iN
%& %
25¼ 0 0-
20i:f•S , i ' 0': ¼ ¼.. .... ..
* .•• •% • " • •* {• ' ', ,• ••., • " ' '.,3 • 72 -•. , , ' , ' ' , -7 '
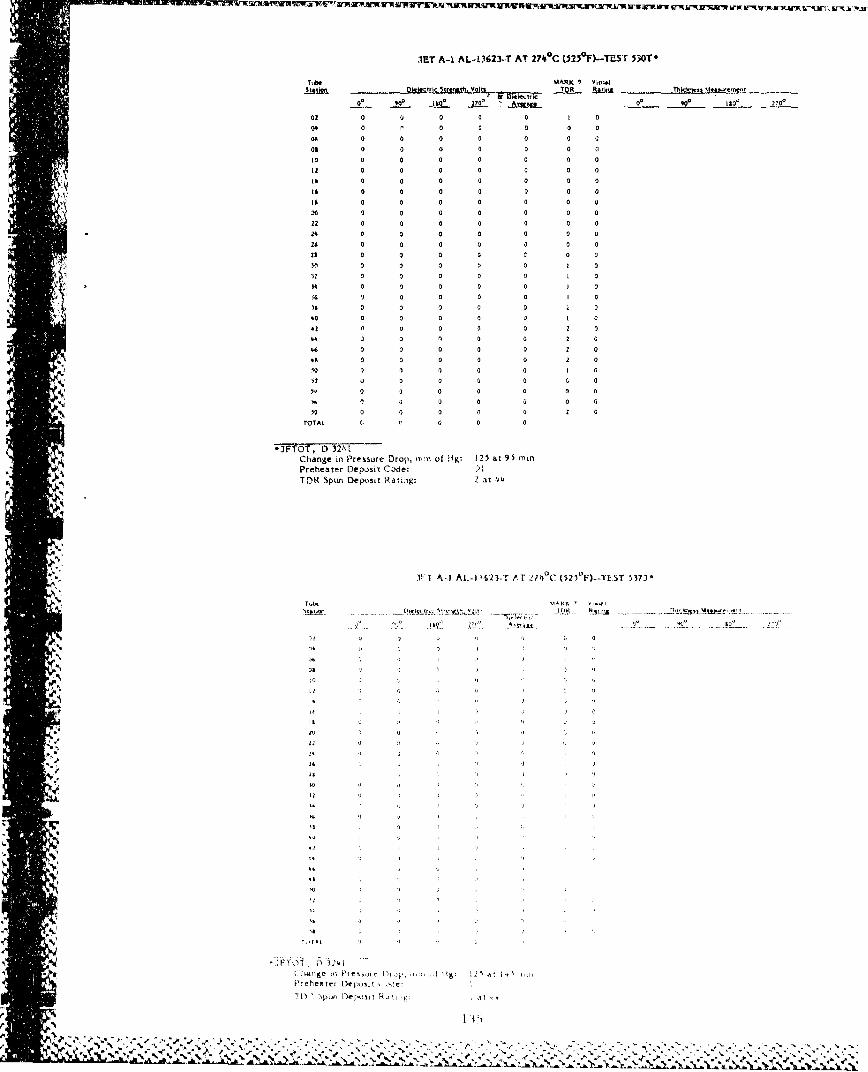
JET A4k AL-13623--T AT 27 0 C (5250F)-.TESr 53OT-
MARK 9O RaVi-Ik O L~~
02 0 I 0 0 0 0
04 0 p' 0 0 0 0 0
00 0 0 0 0 0 0 c
011 0 0 0 0 0 0 01
10 0 0 0 0 0 0 0
12 0 0 0 0 0 0 0
0 0 0 0 0100,I0 0 0 0 0 0 0
10 0 0 00 0 020 0 0 0 00 0 0
00 0 0 0 0 0 0 0
00 0 0 0 0 0 0
005 0 0 0 0 0 0 0
20 0 0 0 0 0 0 0
28 0 0 0 0 0 0 0
00 0 0 0 0 0 I 0
14 '0 0 0 00 0
is 0 0 0 0 0 0A 0
0 0
tOTAL C,. 0 0
i75fi2hh t -Chang~e in Pressure Drop, frim of HF,: 125 at0 95 minPreheater Deposix Code:T DR Sfpurs Deposit Rating~: 7 at 44
WIT A I At. 62 3,T -rt :U11C (.51IF)-TE.ST )373
_________ 1[)l
10AL.' 1 S
02r0 3
~It eJ , ,e
.5 Li
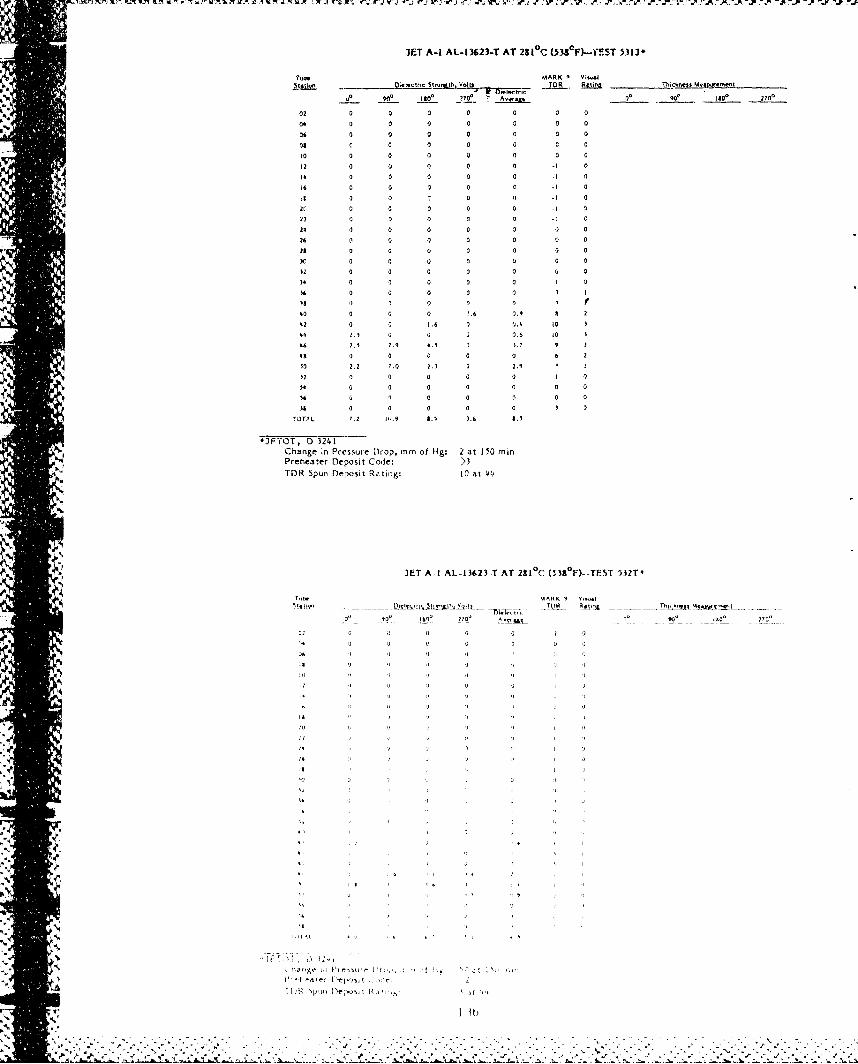
JET A-1 AL-13623-T AT 281 0 C (5333 0P)-TST 3313-
T~m MARK 9 0 -
Qiel Orqn St2Ih 0 ot TOR ____ Thickenss MeaoN.z-~t
U* -"0 -It' 1270_ rA i 00 9e0 1400 27n*-
k02 0 0 0 0 0 0 0
04 00 a
06 0 0 0 0 0 0 0
08 c 0 0 0 0 a 0
:0 0 0 a 0 0 -0 0
20 0 0 0 0 0 -2 0
14 0 0 0 0 0 42 0
ý6 0 0 0 0 0 -1 01 1 0 .~ 0 3 -1 02c 0 G 0 0 0 -
22 0 0 0 0 1
24 0 0 0 0 0 1 0
26 0 0 0 0 0 0 0
28 0 0 0 0 0 0 0
)c a 0 0 0 U 0 0
12 a 0 0 0 0 0 0
06 0 0 0 0 a 0
18 0 0 0 0.1
42 .0 .0 16. 0 0.7 10 1
44 0. 0 0 0 0. 6 000 2.25 7.0 2.0 09.
32 0 0 0 0 0 1 0
05 0 0 0 0 0 0
06 0 1 0 0 27 0 0
31 0 0 0 0 0 3 0
TOTAL 7.2 112.. 8.0 1 .6 8.03
ThTO0T, 0 3241Change in pressure Drop, mm of Hg: 2 at 150 minPreheater Deposit Code: >3TOR Spun Deposit Re.tinog: 10 at 44
JET A-1 AL-13623-T AT 281 0 C (53A20F)i-TE-ST 532T-
V. ,g, MARK 9 O,,-I
0o~u TOR Pt..,ntoeo±
0 0. IV)' vu,' AN0I.. 19 to'. 19. .70'
02 0 U 0 0 0 0 02*0 0 C, 0 0 2
1 2 2 2 22 .
I" 'i 1 P - 'l
% %9. .3 .j
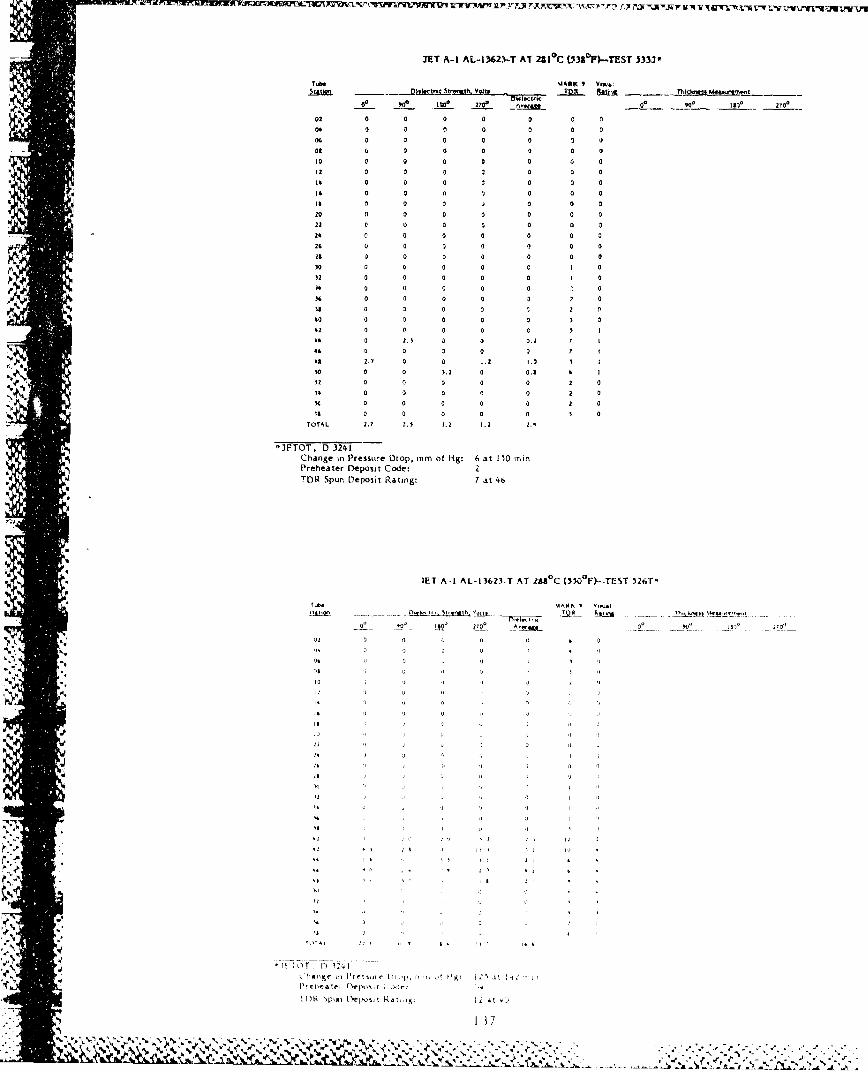
TAIxv!I71 -?ips ?%yfl -34'w ~ 1f -(&tY IIl MW
JET A-1 AL-13623-T AT 231 0C (53tPF)-TEST 5333J-
TubeMARK 9 Vi~w
op 9.20 Iwo 07 00 00 20
N.~27 00 0 0 0
02 0 0 0 0 0 0 0
04 0 C 0 0 0 0 0
01 0 0 0 0 0 0 0)
0t 0 0 0 0 0 0 010I 0 0 0 0 0 0 0
12 0 0 0 0 0 0 0
1: 0' 0 0 1 0 0 0. 0Is ii 0 0 j 0
20 0 0 0 0 0 0 0.422 Q 0 0 0 00 000 0 0 0 0 0 0 0
26 0 0 0 0 0 0 021 0 0 0 0 0 0
10 0 0 0 00 I 0
12 0 0 0 0 0 1 0
10 0 0 0 0 a 0
04 0 0 0 0 0
A-I AL-.6 - AT 28 C. (550 F1 -TS 1 T
Qt2n0l0n0
a04 0A~0
0 0_ 1 12 P!0 t
0 '4 0 0 0 0
94F T D 3241
S. IMARK>I
4 12 al ! 2 9ýI.-
"24 M De,1 , Rd i3K At 40 '
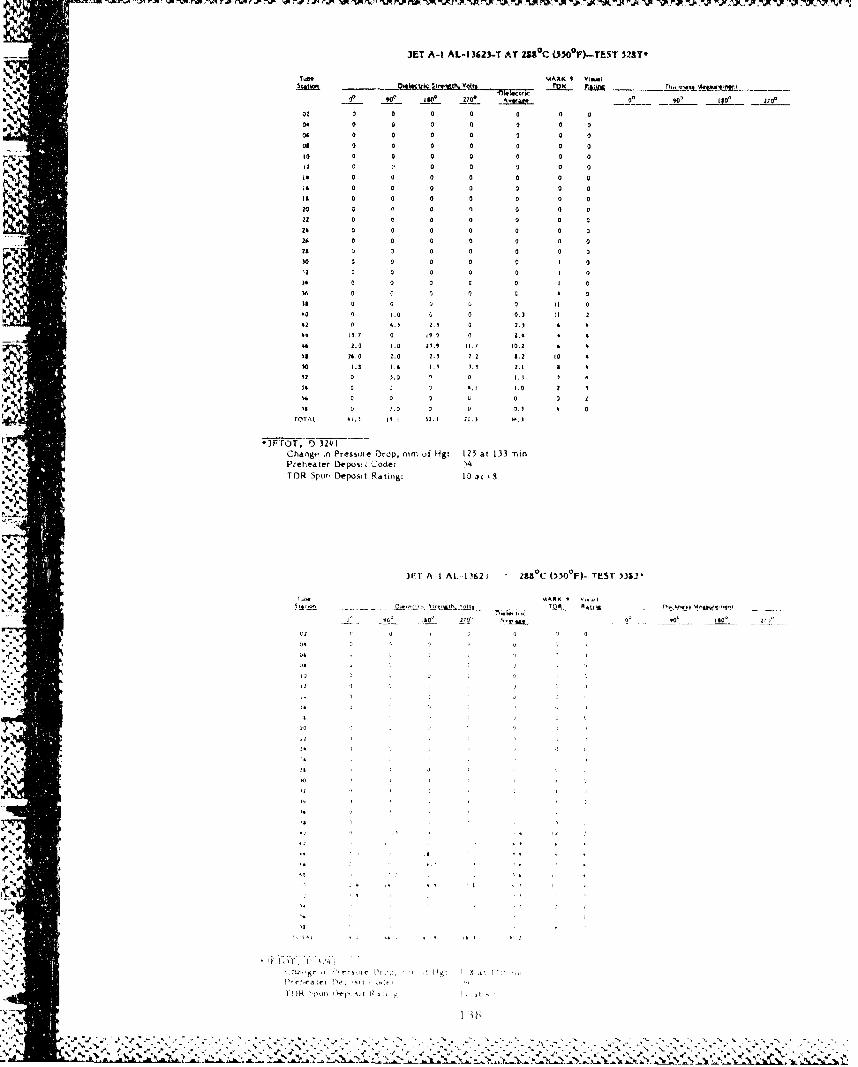
JET A-1 AL-1 3623-T AT 283 0 C (550 0F).-TEST 52*T-
T ul s4AftK 9 Vi-I
0IP 27 0±EO 0 a0 a. l 0. 0
02 3 0 0 0 0 0 0
10 0 0 0 0 0 0 012 0 a 0 0 aa6 a a a a
16 ii a a 0 0 a a
to 0 0 0 0 0 0 014 00 0 0 0 0 078 0 0 0 0 0 0
20 0 0 0 a a a 0
026 0 0 0 0 0 a 021 0 a a a 0 a 0
0 0 0 0 a
18 0 0 0 0 0
300 0 .0 0 2 '0. I
M / 0 a 9. a a. a 42.0 1.0 21. 0jý 10. I
32 0 .0 01 a 1. 10h ~~430 . 0 .0. II
6 * 0 0 4. 2. 0 2.1
1 " 10 . 4 1 .1. 7. 1 $ 8
*-JFTQT,-'5 324!Change In Preasute Drop, mm. of Hg: 125 at 133:nin
t.Preheater bepastý Zode: >ý41014 Spur Deposit Rating: 10 at 's
-ttat
'S..
at, 094
2iru 'r1aa, - I2. t o
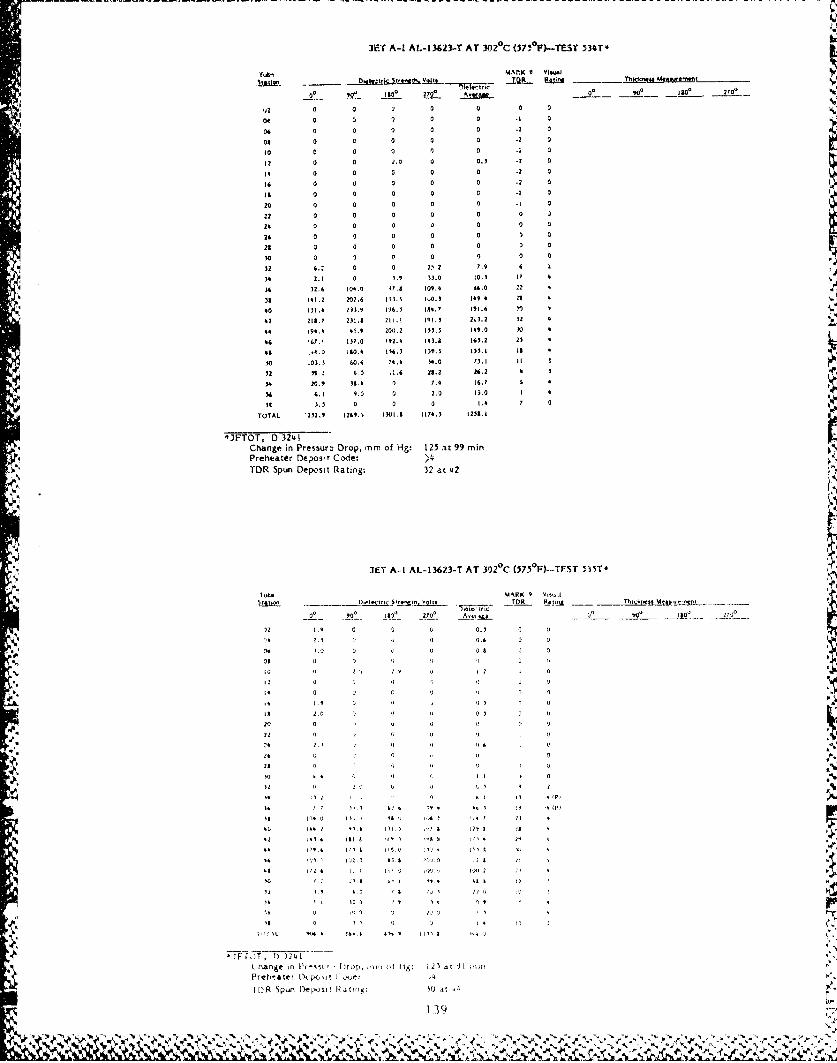
2JET A-1 Al.-13623--T AT 302'C W3$IIP)-TEST 534T-
00 0 [Be0 2770 ______ 00 063 3 270*
u2 0 0 u 0 0 0 0
04 0 0 0 0 0 -1 0
36 0 0 0 0 0 -2 0
0s 0 0 0 0 0 .2 0
10 0 0 0 0 0 -2 0
12 0 0 2.0 0 0.) -Z 0
14 0 a 0 0 -2 0
16 0 11 0 0 0 -2 0
Is 0 0 0 r -1 0
00 0 0 0 0 0 0l134 2. 0 3<2 30 0. 07 0
26 30. 0. 07, OO 60 02
22 14. 2a. 1 .0 .0. 10, 03 4
40 10. 13. 94, 13. 1). 30 0 3
42 2 .0.7 03. a1. . 2 33.2 3.9 0 i3
44 23.1 43. 21.9. 33.0 109.0 17 4
42 2377. 70 2313 211. 1 43.2. 213.2 32) 4 1
43 109.0 110.4 1%6,3 309.5 103.1 Is
.30 103.3 60.4 74,14 34.0 72.1 11
32 "A 6.0 11.6 n0.2 26.2 4 3
36 20.1. 30.4 0 7.4 16.7 6 4
36 6.1 9.0 0 2.0 03.0 1
rOTAL '2532.9 12639. 1301.2 1174.3 12233.1
*JFTOT, 0 3241Change in Pressura Drop, mm of fig: 1253at99 minPreheater Deposit Coie: >14TDR Spun Deposit Rating: 32 at 42
JET A-I AL-13623-T AT 3,020 C. (575
0F)--ThST 535T-
I 204 MARK 9 V,- I
'121.9 0 00.39 0
4 1 0. 2, 0 00.6 0 0
.606 .0 0 0 0 .0.8 0 0
240Ol 2' 0 0
to' I I 0, o
2. 2 0 .
34 27 9 2 2 .6 13 32
70 G3 03 17. .u' 22 2
34 21. l 150 .. '1 All0 4
I4 0022 . 13 '21 23 <
41 0. 00 2 . 0
1 0 0 33 1 v 23 21
T, 121 NL -4.1.& "" I
1. 22.arl in0 P7"''702 Drop . .... 222 H60I3: I0 tl 9I 2,1
Pleh~ster IOpi(oll I ,o.2
139.
%3 2~
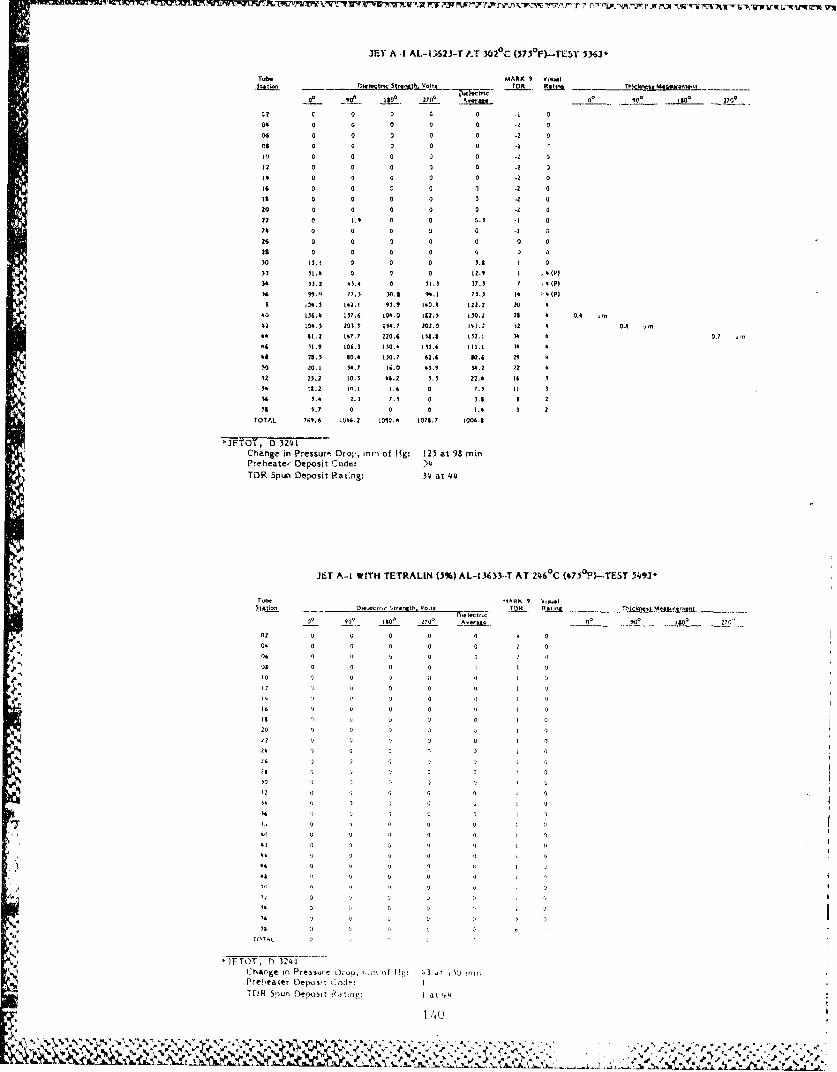
JET A .1 At.-1J623-T 1,.T .302 0C (3730 F)-Tt.ST 534J'*
r~b. MARX I I-o1_____ T~oo OR . 4f !iil~ O~W0003
00 1a S 270'_ [so,___ 0 20
00 C 0 0 c 0 .1 0
a4 0 0 0 0 0 -2 0011 a 0 0 0 0 -aW1 0 0 0 0 -202 0 0 0 0 0 -2 a012 0 a a 0 a -z 3
16 0 a a a *o aII a 0 2 0 3 .2 a
20 0 0 0 0) 0 -2 022 0 .9 0 a 0.3 .1 a20 0 0 0 0 0 -1
26 0 0 3 0 a 0 223 0 0 6 01 0 0 a
30 5.t a a a 0 3. a315 1l. a a 12.9 1 I
34 33.2 43.0 0 31.3 37.5 7 4s(p)i34 937 77.3 30.2 16. 73.3 14 0(p)R .04.5 ta.1 93.9 140.4 122.2 20to0 130.* 137.6 10.0. 132.3 150.1 23 0.4
00 a0..) 203.7 230.7 202.0 151.2 )2 4 0.) 300 81.2 147.7 220,0 113.11 152.1 30 4 0.7 o'
"04 11.9 103.3 130.4 531.0 111.1 70 444 20.3 30.4 130.7 62.0 00.3 23 4
""o 30 .1 34.7 16.0 43.9 30.2 22 0
52 23.2 10.0 00.2 3.3 22.0 16 1
30 11.2 10.1 1,6 0 7.) 11 3
34 3.0 2.3 7.3 0 3.3 3 2
33 3.7 01 0 0 1.0 3 2
TOTAL 769.6 000. 2 1010.0, 1073.7 1006.3
-JFTOT, 0 3241oChange in Pressurt Dro1 ', mr-s of Hg: 125 at 98 min
.0Preheate- Deposit Code: >4TDR Spun Deposit Rat*ng: 34 at 44
JET A-1 WITH TETRALIN (5%) AL-13633.-T AT 246'C (4750 F)-.TEST 5493-
T~oO. 14,iiK 9 V-,1o
0. 00 t130 270- AOM O 4300
02 0 0 0 00 0 0-'00 0 0 0 0 0 z 0
00 1 7 00 9
10 0 U 0 0 I 0
is U 0 Q 1 0 I '
20 0 0) 0 7 ~ I 0
IS c7i 0 0 I 0
34 020 0 0 0I 0
20U 0 0 I
13 ' 0 0 0 0 0
12 0 Q0 I
34 0 0 U I0 0i 1
00 0 0 1
TOTA0L'7
Chng inPesueoo, i-n of li:'3dt r
PrO boa Ir Bepo.' 0~d-rr.,P Sopun [oenosii HRaz~n: ai 44'~
140
n." ~0'~5; 0, VN~ ~ \~ ogN~o ~'V '. '~.0~*~*
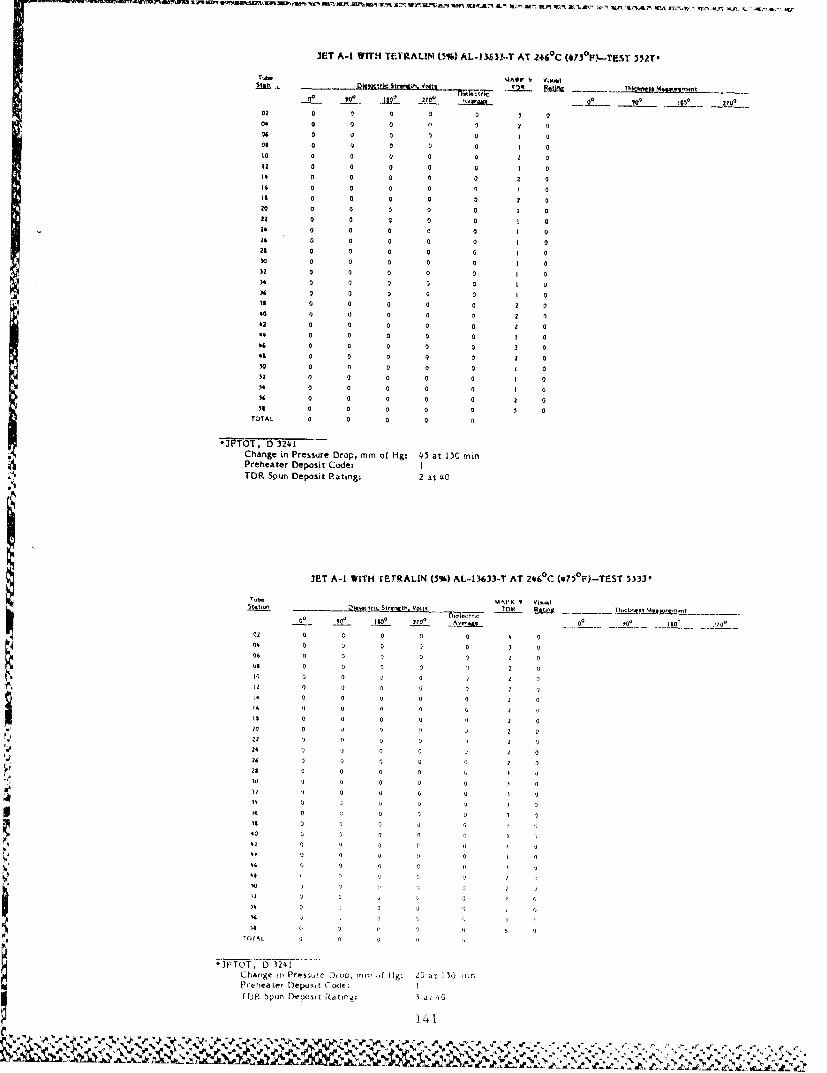
JEtT A-1 WITH TEl RALIN (5%) AL-1365M7T AT 246'C (t750 Pý-TE5T 5SZT*
Tub. MAPV i Visue
__ to 119t-0 x_ ~0* _
00 0 0 0 0 0 004 0 0 0 1 0 i
04 0 0 0 130 I 008l 0 0 0 0 0 I 0)t0 0 0 (1 0 0 2 032 0 0 0 0 0 1 016 0 0 0 0 0 2 014 0 0 0 0 1 0Is 0 0 0 0 0 2 020 0 0 0 0 0 3 022 0 0 G 0 0 1 004 0 0 0 a 0 1 024 0 0 0 0 0 I 021 0 0 0 0 0 I 0110 0 0 0 0 0 I 032 0 0 0 0 0 I 034 0 0 0 a 0 I (I144 0 0 0 G 0 I 0Is 0o 0 0 0 0 2 040 0 0 0 0 0 2 042 0 0 0 0 0 1 0to 0 0 0 0 0 2 044 0 0 0 0 0 2 0to 0 0 0 0 0 2 0so 0 (1 0 0 0 I 030 0 '0 0 0 0 I 0
040 0 0 0 0 1 1134 0 0 0 0 0 0 030 0 0 0 0 0 0 0
TOTAL 0 0 0 0 01
IJFTOT, D 3241Change in Pressure Drop, mm of Hg: 45 at 15C minPreheater Deposit Code:ITDR Spuin Deposit Rating: 2 at 40
JET A-I WITH TETRALIN 05%) AL-I13633-T AT 246 0C (.75%)ý-TEST 5533*
!ub. MAI'4 9 VIisa
0__ 270 Avroz 0 0 0, 70'02 0 0 0 0 0 4 004 0 U U 0 304 0 0 U 0 2 U
08 0 0 0 02
to0 0 0 0 0az U 0 2 U
04 0 0 0 1 0240 0 0 0 1 0
is 0 0 0 0 2 0Iii U U 0 U 2 U
30U U U 0
Z 4 U U U G U 03 4 0 0 0 G38 U 0 0 U o
40 U 0 0 042~ 0 0
V U U U 001
46 0 U U
'10 0 U ) U U
34Q U U
JFOT 0 Q240
Change iri Pressure DHUI. rin, mmf lHg: 29at I SO innjrPreheater Depooýt C~xle:T U K S p u n D v w w 5 ) 2 0 1 ( 0 t h ) : 3 A 4:
"? ": 'A,- t '~/ .
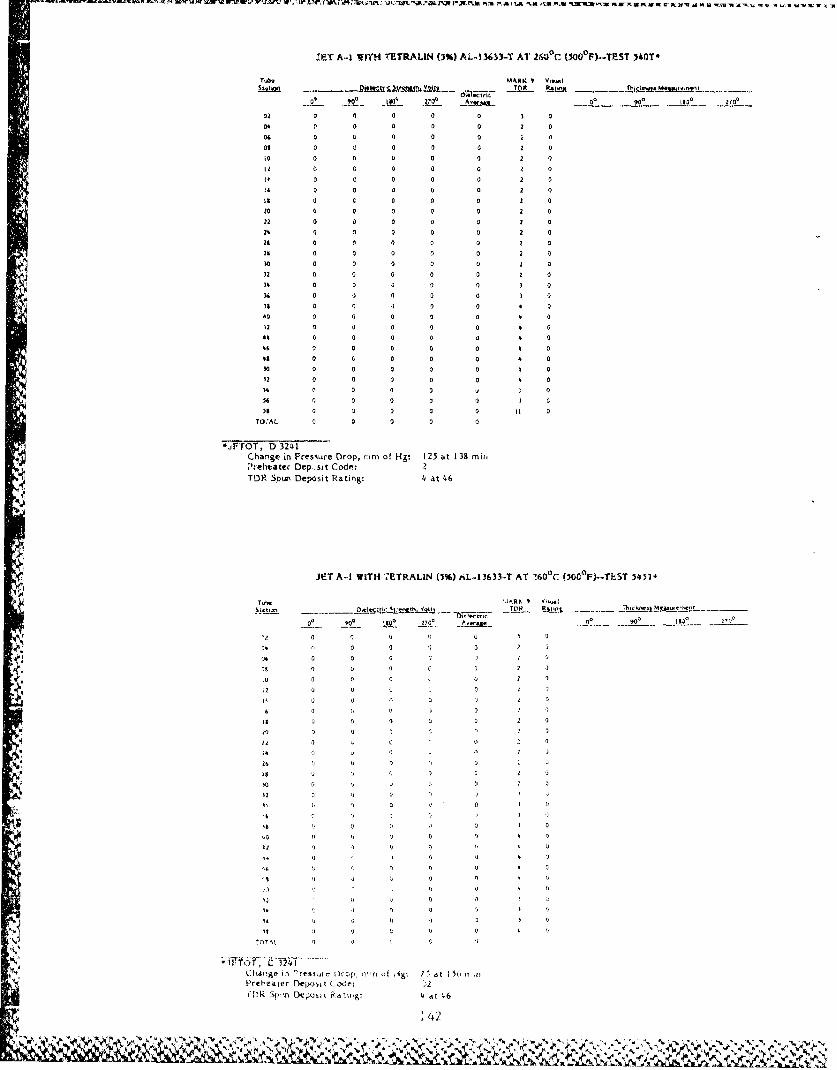
XT A-1 WmIT TETRALIN (3%) AL-.1%WT-- Al' 2600fC (500 0Fl--TEST 540T'
MARK tVitoa-il~t11t~h1q. 6 TOR Elum3~~w~jj~j ~
a 0 0 0 0 0
0 90 o0~ 200 Ao'0j 0 0O 3
00i 0 0 3 0 0 0at 3' 0 0 0 0 2 0
It 0 0 0 0 2 0
04, 0 0 0 2 0
:6 0 0 0 0 0 2 0II 3 3 0 0 3 2 0
6 0 0 3 n 0) 2 0
lb3 0 0 0 2 0
20 0 0 .3 0 2 0
ZG 0 0 0 0 3 2 0
24 0 0 0 0 3 2 0
06 0 0 0 0 0 2 0
320 0 3 0 3 3 2 0
34 0 0 0 0 3 3 0432 0 n 0 0
34 0 0 a 3 0
30 0 a3 0 0 3 0)2 0 0 3 0 0 4 040 0 0 0 3 3 4
32 0 3 0 0 0 4 0
44 0 0 0 3 4 3
40 0 0 3 0 0 4 0
12 0 0 0 00 0
54 3 0 0 0 UJ n
56 3 0 0 0 0 3 0
58 0 0 0 0 3 1I 0
TO:AL 0 0 0 0 3
-;jFTOTf,- 0 24-1-Change in Press.ure Drop, r.tm of HZ: 125 ait 138 mi;4"Prelieater Dep-sit Code: 2TOP Spun Deposit Rating: 4 at 46
JET A-] WITH 7ETRALIN (5%) nL-.13633-T AT 1600 C (5000 PF)--T-,hT 5431-
30 210O 73
V0 03 1 1 '
AG 0~r 0 2 3
Kb 0 3 0 2
00~ 0 0
Is 0 '
21 2 0 .
230 3 0.
33 3 3 C 3 2o
34 0 3 C ~ 2 .
20 3 3 3 33 20
Chaoig 38 i 3ss, 0 3.p m 3, ig I I atIViI t
33c 33 '3! '3 Co<i, '.2
32~ 3z Ocoi 0ag a3 t 3 4 6
03 3 2 3 3 3,42
V4 N 3 V3 'W4, 3
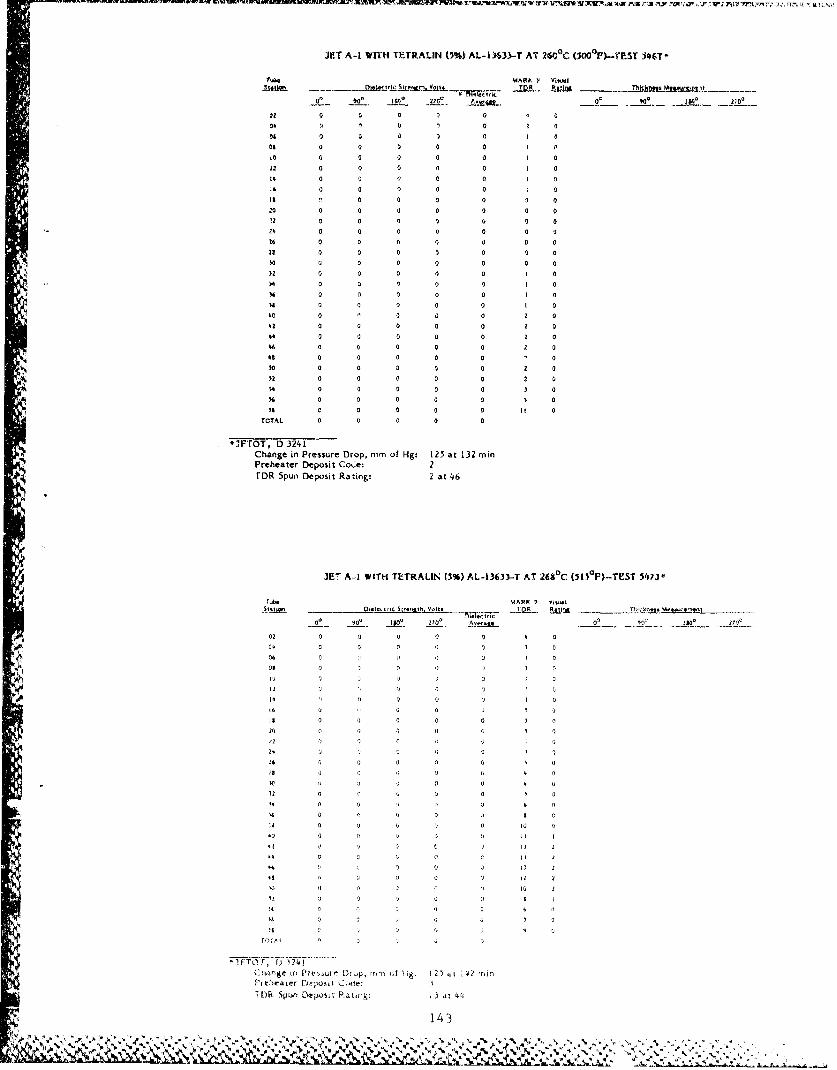
JET A-1 WITH TETRALIN (5%) AL-.ýI633-T AT 260'C (SoO'F)-TEST J4(,T-
0~*MARK 0 ito
00 Ig0 o*o 27e~ 0, M I0 lo0t
02 0 0 0 0 0 0 0
04 11 0 a 2 004 0 0 0 0 0 a
09 0 0 0 0 0 I 0
0o 0 0 0 0 a 0
12 0 0 0 0 a
t4 0 0 (i 0 0it 0 0 0 0 0 0
is 0 0 0 0 0 a 0
20 0 0 0 0 0 0 0i2 0 0 0 0 0 02k 0 0 0 0 0 0 a
04 0 0 (1 0 0 0 0
21 0 0 0 0 0 0 030 U 0 0 0 0 0 0
00 0 0 0 0 0 0
04 0 0 0 0 0 1 014 0 0 0 0 0 1 0
39 0 0 0 0 0 0
40 0 ' 0 G 0 0 042 0 0 0 0 0 2 004 0 0 0 0 0 2 a
*6 a 0 0 0 0 2 0.0 0 0 a 0 0 0
*0 00 0 0 0 0 2 000 0 0 0 0 0 2 054 0 0 0 0 0 3 0
06 0 0 0 0 0 4 0
*55 c 0 0 0 0 11 0
TOTAL 0 0 0 0 0
*JFTOT, 0 3241Change in Pressure Drop, mm of Hg: 125 at 132 minPreheater Deposit Cocke: 2TDR Spun Deposit Rating: 2 at 46
3E- AA. WITH TEiTRALIN (5%) AL-13633-Tr AT 269'C (515 0 F`ý-TEST 5413hO
tub. ý0AAOK 7 -
000 2100f A ,y-
0a0 0 Q U
011 1 0 I C
Is 0 G 0 000
M2 0 0 0 0
/20 0 C 0 4 0
240 v Q 0 to 0
Q* U, 0 00 0
U* 0 10 C
34 o 0 01 0 0a
4s 0 0 0
00p f T. T2 Y0 ......
DR 0p L0exs P a 0 t 2 l &
0.4 ~ ~ 1 3 I
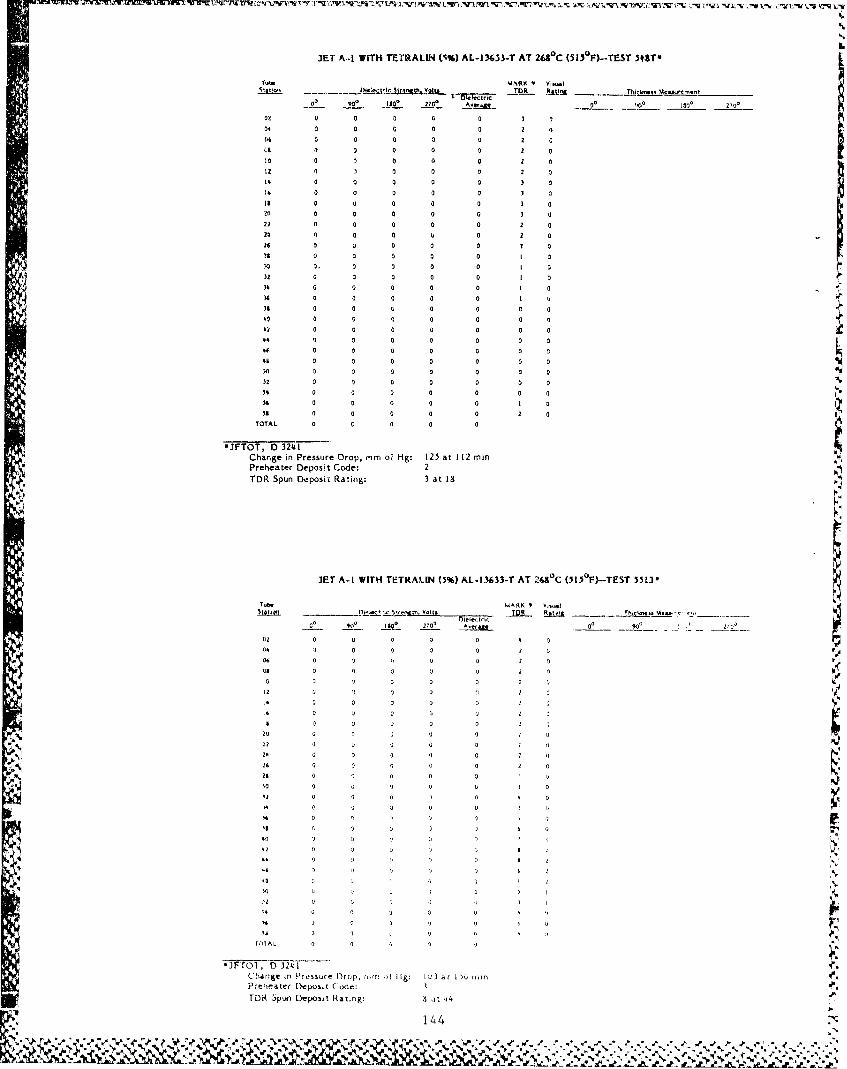
JET A-I WITH TErRALIN 05%) AL-13633-T AT 2Gt*C (5I?"F)--TEST MT-a16
MARK Iv-
0W 0 3 0 0 3
as0 0 0 a 0 2 0
a 0 a 0 2 oto a a 0 0 2 0
i2 a 0 0 0 0 2 014 0 0 0 0 a 3 014 0 0 0 0 a 3 ato a a a 0 0 3 a20 0 0 0 0 0 3 0
22 0 a 0 0 2 0
TOTA a a a a a211 0 a00a 0 0
0 0 031 ~ ~ ~ a a
'TTD321 0 2 0Chng in Prssr Drp mm o0 Hg 120t2Prhete Deoi Coe 2
0M 0 0 0 0 0 a 0
05 09 0 0 2 0 0 0
06 0 0 ai 0 0 2 005 0 0 0 0 0 2 0
TTL0 0 a 0
-J 2T0T0 06'-304T -0
T36 0 9 0 9 0V-1
0 0 '9 0
06 0 0g 0 0 2
T D R 0p u D e o i 0a ri 0 :
Q1 140
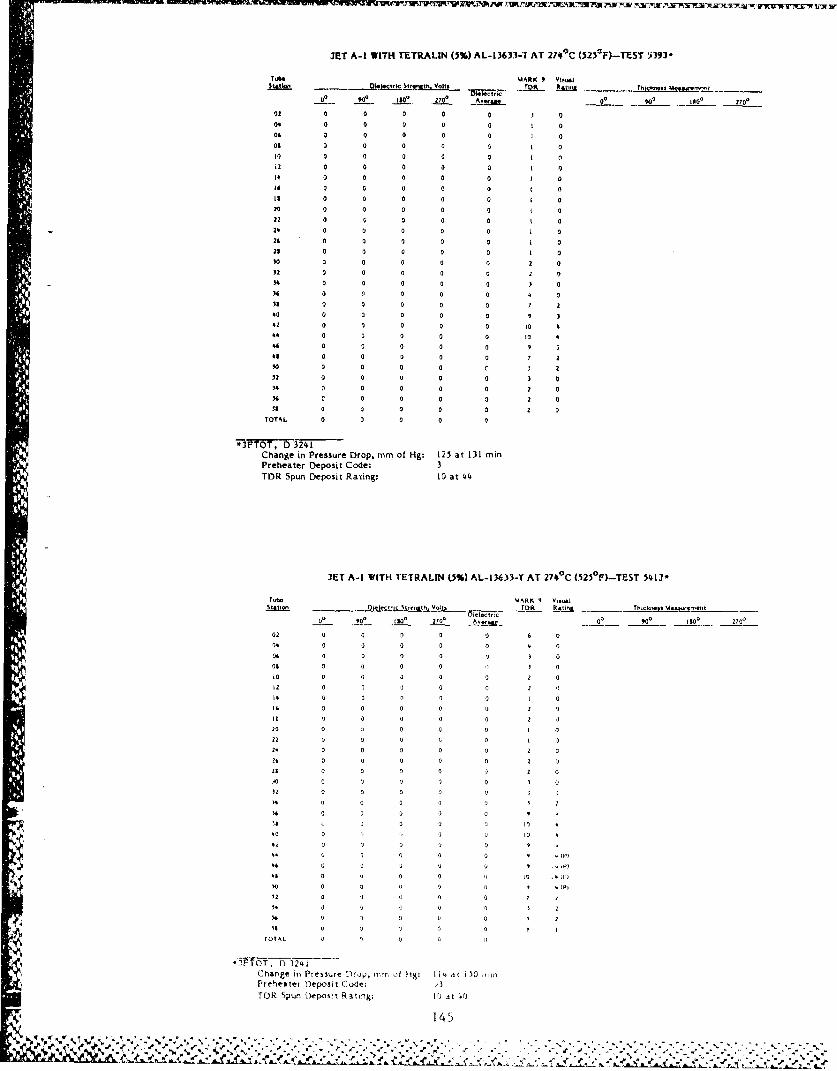
-- ~~~~~VL'I -- -rwwuzj sWtAiWTUA]U!2lwaN~wr~rr'wrw r
JET A-1 WITH TETRALIN (5%) AL-13633-f AT 271#0C (529'fl-TEST flJe-
T~b. MARK 9 Vk-oj
00 0Lý 0 ~ rj 00 923 ISO, 2__ ___ _
02 0 90 0 70 Uvea 00 0O 100 2002 0 0 0 2 0 1 006 0 0 0 0 0 I 006 0 0 0 0 0 1 0
to 0 0 0 0 0 I 0k2 0 0 0 0 0 I 7
12 0 0 0 0 0 I 0IS 0 0 0 2 0 I 0
is 0 0 a 0 0 1 010 0 0 0 0 0 1 020 0 0 0 0 0 1 022 0 0 0 0 0 I 0
2* 0 0 0 0 0 I 023 0 0 0 0 0 I 02w U 0 0 0 0 2 032 0 0 0 0 0 2 012 0 0 0 0 0 2 036 0 0 0 a 0 1 0is 0 0 0 0 0 b 013 0 0 0 0 0 7 2
42 0 0 0 0 0 10 0
44 0 0 0 0 0 0a *0 0 0 0 0 9 0
43 0 0 0 0 0 7 000 0 0 0 0 r 3 202 0 0 0 0 0 3 0
50 0 0 0 0 0 2 036 a 0 0 a 2 0
M3 a a a 0 0 2 0rOTAL 0 0 0 0 0
27FTOT, D 3241Change in Pressure Drop, mm of Hg: 125 at 131 minPreheater Deposit Code: 3TOR Spun Deposit Rating: 10 at 44
JET A-A WITH TETRALIN (5%) AL-13633-T AT 274 0C (5-25,)-TEST 5413.
Tube MARK 9 VisiIStation .. Qj.Ie tric Stre. th. Vot. To Rotin hcnesUaijoet
U. I0se0 2700 Do~ua 0o ISO' 270
02 0 0 n 0 0 6 004 0 0 0 0 0 I. 0
06 0 0 0 0 0 0as 0 0 0 0 1 010 0 1) 0 0 0 a
12 0 0 0 0 0 2 1)It 0 0 0 0 0 I 0
46 0 0 0 0 0 2 0ItL 0 0 0 0 0 z 020 0 U 0 0 0 1 a
22 0 1) 0) G 0 i 024 0 0 0 0 0 2 0
06 D 0 0 0 0 2I23 0 0 0 0 0 2 0tO 0 0 0 0 0 1 0
340 0 00 0
at 0 0 0 0 4
160 0 0 0 U 4
i00 0 ' 0 0 109#0 0 0 i 0P)
46 0 0 U 0 0 9 .'.5 & 0 0 0 0 .0 SP
12 0 0 0 00 7 2
%40 0 0 t 20is 13 0 0 09 I
tOTAL Q Q
Change in Pressure Drop, [Tm Of fH8: 1 4 A0t I.50 10
F'refoeaoet 0eposit Code:ATOR SpurnO epo)st Rating: 10 at 40
4 145
A-? -A:! . : -. ' t
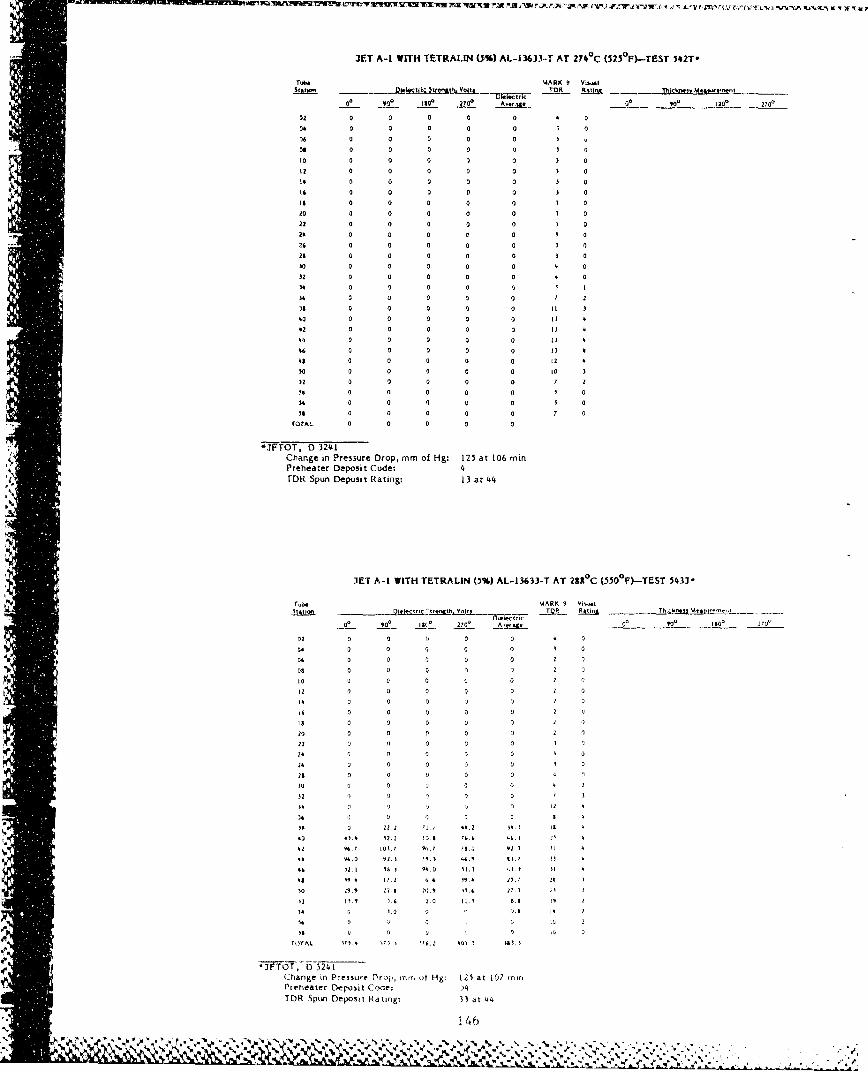
JET A-I WITH T!TRALUN (5%) AL-13633-T AT 271#'C (525 0 F)-TEST .542T-
T3" ARI" 9 Vio~.a
02o~ 0 0j~ 00 0rmato 0*3 4O h0gT~3o1,0.g~n0o 0 a 0 0 1 0
10 0 40 0 20 0 30 00 2
a2 a 0 a 0a
14 a a a 0 0 3 a
1s 0 0 0 0 0 0
20 0 0 0 0 a 3 a22 a a a a 0 3 0
26 0 a a a o 3 a22 0 a a a 0 3 0
a0 0 a a a 0112 0 0 0 0 0 0
34 a a 0 a C, a02 0 0 0 a a 2
40 0 0 0 0 0 7 2
42 0 0 0 a 0 13 440 0 0 0 0 a )
42 0 0 a 7) 0 13 4
40 0 0 0 a a t 240 0 0 0 0 0 30 3
52 0 0 0 0 0 2 2
0 0 0 0 a a32 0 0 1 0 0 7 2
59 0 0 0 0 0 7 0
TOTA7 0 0 0 0 0
-JTOTT, 0 3241Charge in Preso;ure Drop, mm of Hg: 125 at 106 minPreheater Deposit Code: 4TrDR Spun Deposit Rating: 13 at 44
JET A-1 WITH TETRALIN (5%) AL-I13633-T AT 289'C (5 )TE 5433*
Oo.MARK7 9 Viong
04 0 0 0 0 0 2 0
03 4 0 0 07
~ 06 0 0 0 0 0 2 7
32 0 0 0 0 0 a 73
to 0 c 0 0 0 a 0
12 0 0 0 0 0 0 0
II0 0 0 0 0 2 0
i0 0 0 0 0 0 2 0
20 0 73 0 0 0 2 0
a. 0U 3 0
24 0 01 0
26 0 0 0 0 0 1 7
20 0 0 9 0 71 4
32 a 'a U 0 0 4 2
34 0 7 2 0 2 4
10 06. 2. 71. 7 03. 15 1 D 1
30 03.0 lb, 9 70 3 j~ 'A. I. 0l
34 32 1.9 30. 97.0 131.3 9.3. 1
13 3U )7.0 00 3a. 25. 2 2
50 U4. 22. U7. 30 70 ,
34 )TA 171 ', 7," w0' k2
3FT-OTo '5S24 1Change ' n Pressuire D7rop, InI, oft Hl&: 125 at 107 37770
Preracater Deposit Code: 24TDR Spun Deposuit Rating: 33 at 44
146
e ""?1,, " .- e . .%. .13
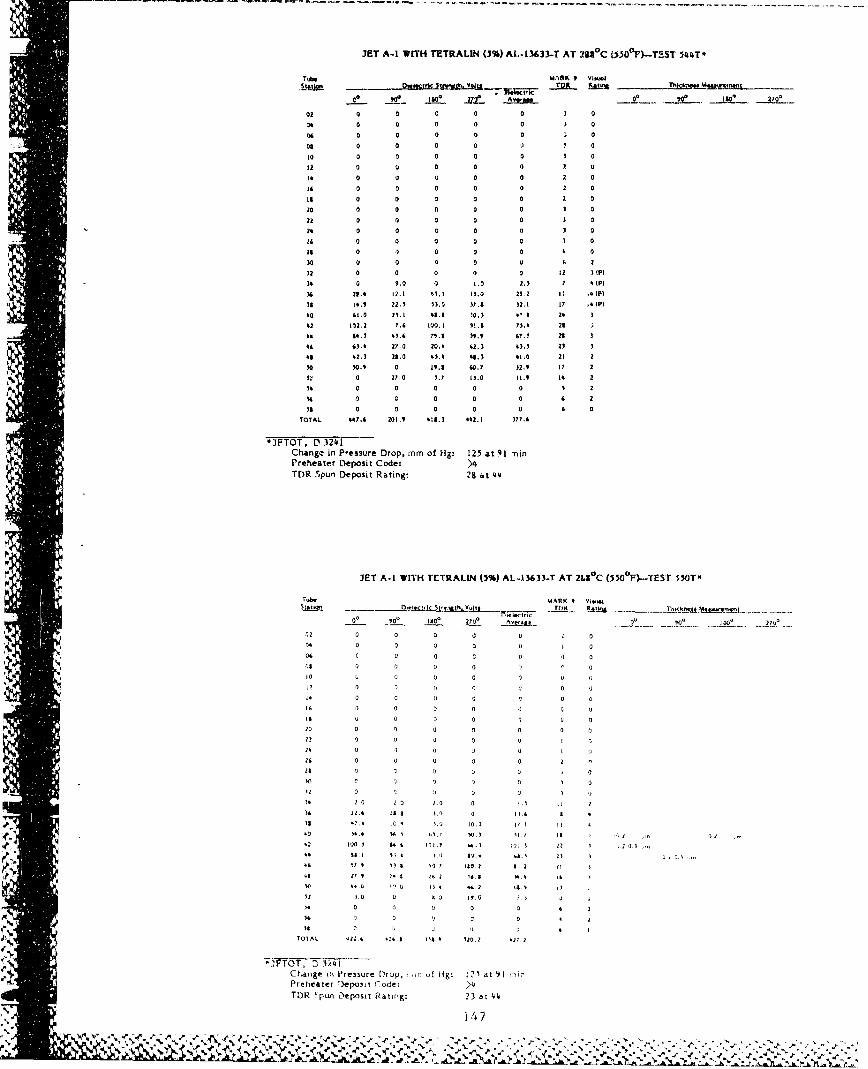
3ET A-I WITH TETRALIN 0%) AL-.13633-T AT 2&S0 C 050*1`)-TEST 544T*
Tube MARK.P 9 V3..A3
02 a 0 a 0 a 3 0
04 0 0 0 0 a 3 0
0s a a 0 0 2 ato 0 0 0 0 0 3 0
12 a a a 0 G R a33 a a a a a 2 0
16 0 0 a a 2 0Is a a a 0 a 2 a20 a a a 30 a 3 02k 0 0 a a a 3 0
24 0 0 a a 0 3 028 a a) 0a 3 a
30 2 0 '0 a 0 a 6 a32 0 0 0 0 a a z 3 M
34k 2 9.0 0 3.0 2. 3 7 3(PM
'5 2.9 22.I0 M 33. 7.8 23193P3.0 23.. 31.1 499 0.) 4. 3 23
32 302.3 7.3 300. 339.3 73.3 2333 53.3 30.3 72.4 09.9 37.0 23 334 43.3 27.0 20.3 32.3 33.3 23 338 32.3 22.0 33.3 411.3 31.0 21 030 30.$ a 19.3 60 .7 32.9 :7 20? 0 27.0 0. 7 13.0 331.9 33 233 0 0 a 0 0 S. 2
04 0 0 0 0 2 4 258 a 0 0 0 0 6 0
TOTAL 337.6 203.9 318.0 332.3 377.3
*IFTOT, 0 3241Change in P~essure Drop, mrm of H&: 125 at 91 minPreheater Deposit Code- >TDR Spun Deposit R~ating-. 28 at 44
iET A-1 WITH TETRALIN 05%) AL-13633-T AT 21.9'C (550'F)--TEST 350T3
Tub. M A RK 9 Vi -13
02 0 0 0 0
02 0 0 0 a U
24 U 0 0 0
130 7. 0 U 0it 3 9 0 0 0
340 0 0 0 0 0 2
35 60 0 0 0 0
Is 0 0 2 0 0 020 0 0 0 0 0 0
2i 0 0 0 .
24 0 0 0 20 228 0 0
is 0 0 00 9
:01 0 1
3320 0 3 0 (.1 i
).4 22.3 22.3 3. 2i 304is .2.. '73 .0 10.3 17 1 H
30 MA. 04. 60.1 w0 it. 33 'I ..
'2 .0 0 3. 90 3. 2
Ch~ange 303 Pressure floop, vt Hg ( (: 125i at 91 nipPreheater )Jeposit (-ci~ >3jTTOR 'pun3 i~epost R&ating; 23 at 44
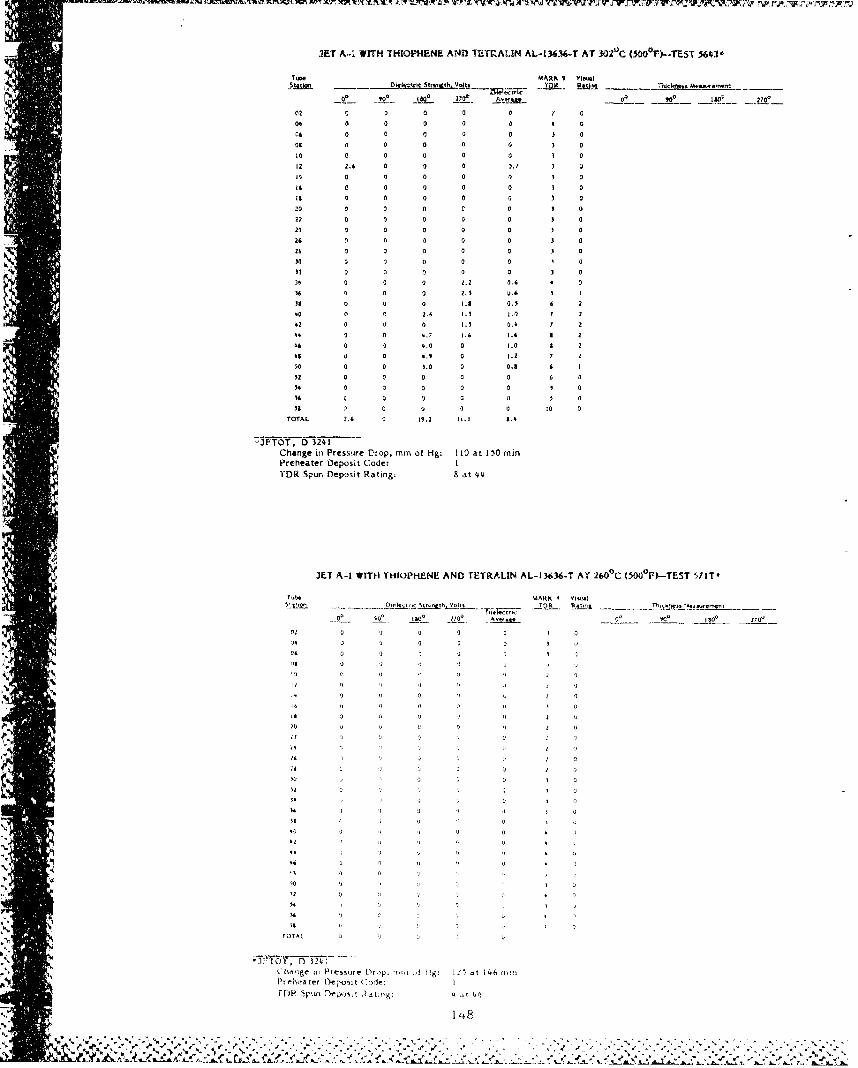
X3T A.-I WETH TI4IOPHENE AND TETIZZALLN AL-13636--T AT 302'C (500*F)-TEST 564:16
Tu~eMARK 9 Vim.60.~~.Iclit0l s 0*oopg*8. Vjo YDR_8 uiftTh~o# M.-.-t.n
C 0 y0 0
06 0 0 0 0 4 0C4 0 a 0 a 0 0
as 0 0 0 0 0
10 0 0 0 00 3 0
12 2.6 0 0 0 0. 0
0 0 0 0 0 3 0It a 0 0 0 0 0
Is 1 0 0 a a
20 3 0 c Q
20 2 0 0 G 021 0 0 0 0 0 3 0
26 1. 0 0 0 0 0
z8§0 03 0
3t 0 0 0 2.2 0.6 4 0
36 0 0 20 2.3t 0 0 0 1.2 0.0 6 2
40 0 0 2.6 1.1 !.0 1 242 0 0 0 1.0 0.6 7 208 0 3 4.7 1.6 1.6 8 2
86 0 0 4.0 0 1.0 1 2
86 0 0 8.9 0 1.2 7 200 0 0 0.0 0 0.0 6
32 0 0 0 0 0 6 0
38 0 0 0 0 0 0 056 C 0 0 0 3 0
58 0 C 0 0 0 t0 0TOTAL 2.6 0 19.2 11.1 8.4
)Y7.6-D3241Change ino Prewi~re Drop, mmr of Hg: 1it) at 150 minPreheater Dleposit Code:IYDR Spun Deposit Ratirog2 3 at 44
JET A-1 WITH THI)PHENE AND TETRALIN AL-13636-T AT 260'C (500'F)L-TEST V IT'
T b. MAKK I Y-1*8
'740 800 17022 .,. 00 80,
02 0 0 0 0 0 106 4 0 00 2
2' 2 0 0 0 2 0
20 2) 2 2 020
1 0 2 22 222 10
20 '2 22 0 2 2 2
"2022 2i 2 2 0'
Ch20 tP e 'ur r p u I tig 125 22 14 22
P0h at~ De 20 '2 2 C o 22
24P Sp, vi DIw , 22 a t 0
00 o 20 0 0148
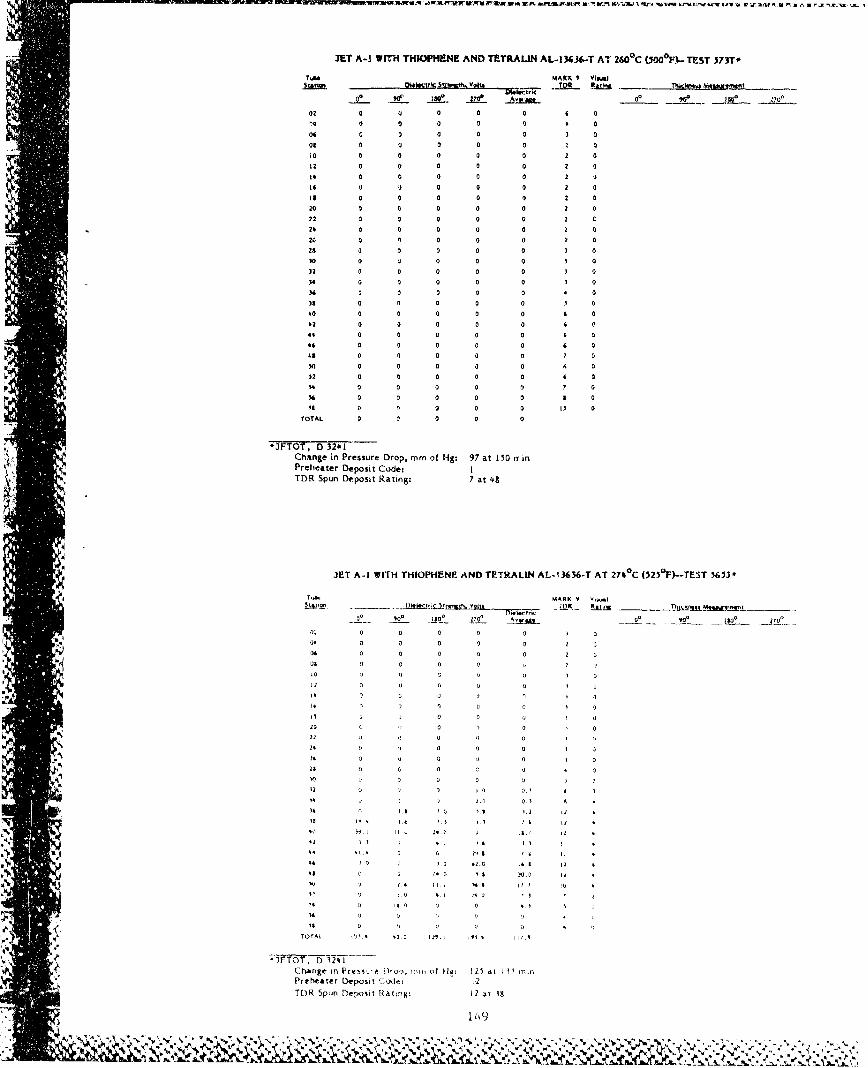
JET A-1 WITH THIOPHE-NE AND TETRALIN AL-13636-T AT 2400 C (MOO0F)- TEST 373T*
TAh* 1MARX 5 VSI
Q ~ Ise 2L70.,? .. UCL 00 O 000 7'
02 0 0 0 0 0 4 0
0 0 0 0 0 % 0
06 c 0 0 0 0 0 0
09 0 a 0 0 0 0 0
:0 O 0 00 0 0 a 0 2 00
to 0 0 0 0 0 2 0
16 0 0 0 0 0 2 0
Is a 0 0 0 2 0
20 0 0 0 0 2 0it22 0 0 0 0 0 2 a4,22 0 0 0 0 0 2 C
2* 0 0ý 0 0 0 2 0
09 a 0 0 0 028 0 0 0 0 0 0
32 0 0 0 0 0 0 0321 0 0 0 0 0 3 0
3 4 0 0 0 0 0 0 034 0 0 0 0, 0 1 0
to 0 0 0 0 0 4 0*0 0 0 0 0 0 6 0
*2 0 0 0 0 0 4 0*0 0 0 0 0 0 6 2
ka 0 0) 0 0 0 7 0l
m3 0 0 0 0 0 7 cl
6 2 0 0 0 0 0 4 0
54 0 0 0 0 0 7 0
34 0 0 0 0 0 a 0
IS 0 n 0 0 0 i3 0
TOTAL 0 0 0 0 0
Change in Pressure Drop, mm of Hg: 97 at 150 min*Preheater Deposit Code: I
I.TOR Spun Deposit Rating: 7 at 48
N ~JET A-1 WITH THIOPHENE AND TPTRALIN AL-f 3636-T AT 2740 C (5250P)-TEST 5653J
* r 0 ~MARK 90 Vo.I
0 0
0; 0 0 0 0 U 0
04 0 0 0 0 0 2
030 0 0 1
21 U 0 UUU
LU0 0 0U
1: 0 U U a , 1
20 U 0 U 0 2
23 0 AU,
1212 Uý 2iL 0
00 to U . .1 ,
00 .0 .U .3.2 I
10 Lo U 1 '& L
A~TUA -02 L U I 1 ' 1 L
00 01 t. 1. LSt UUU410. 3 L
03 Uste Deoi --. 0Ae '2 0.0
TDR pu 20o Ratin U 120 dt .3L3
0.L
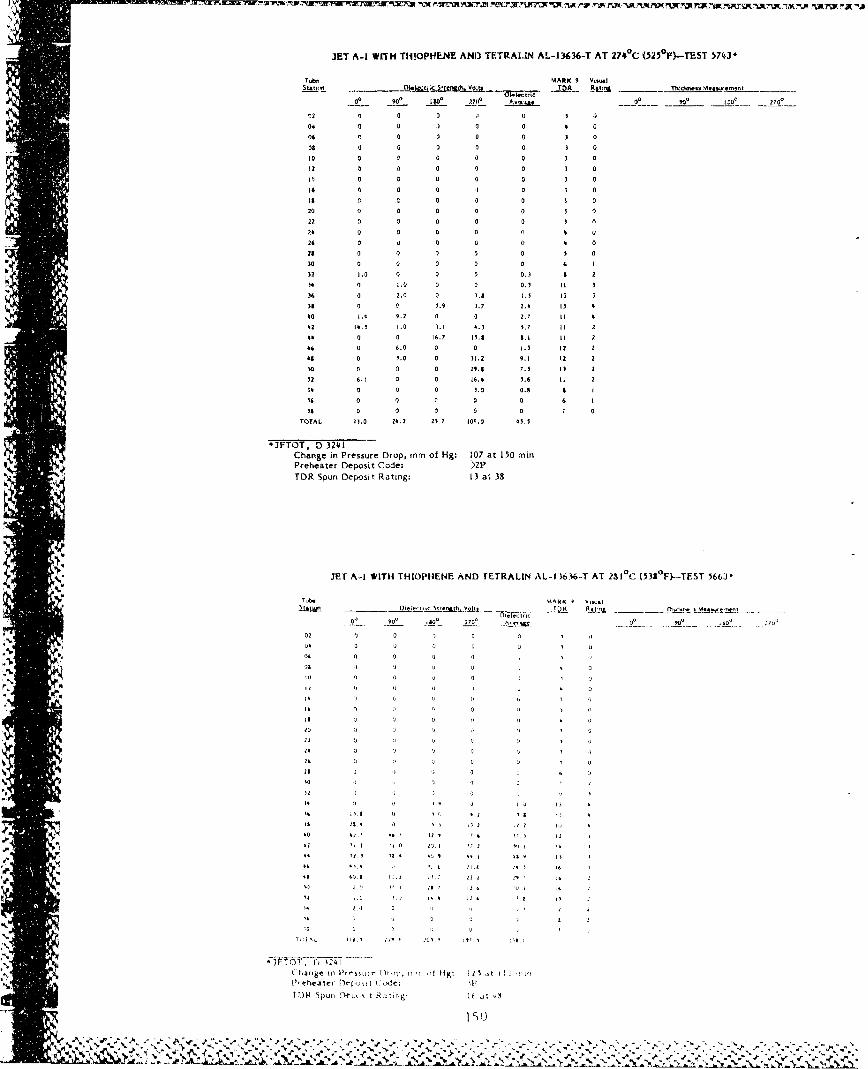
JET A-1 WITH T111!OPHNE AND TFTRAIJN AL-i 3636-T AT 274'C (525 0 P)-TEST 5743*
MARK 9 Vi-oI
00 90P Ito* 27(p A-Ut0 ~~ 20
02 0 0 0 0 1
09 0 0 0 00 4 004 0 0 0 00 3 0
03 0 0 0 0 0 3 0
10 o 0 0 a 0 3 0!2z 0 0 0 0 3 0M 0 0 0 0 0 3 046 0 0 0 1I 0 3 0
is a0 0 0 0 0 0
I.20 0 0 0 0 0 0 0
22 0l 0 0 a 0 3 n
0 0 0 0 0 4 U24 0 0 0 0 4 0
23 0 0 0 0 0 3 0
30 0 a 0 0 0 6 1
32 1.0 0 0 0 0.0 1 2
34 0) 1.0 0 0 0.3 11
34 0 2.0 0 3.0 1.5 13 3
33 0 0 0.9 31. 2.4 13 440 1.4 0.2 0 0 2.7 11
42 14,0 1.0 .1 4.3 37 I
44 0 0 16.7 15.1; 9.1 11 2
36 01 6.0 0 0 1.0 12 2
33 0 L.0 0 31.2 9.1 12 2
50 0 0 0 2.3 .3 I 2
32 6. 1 0 0 46.4.4 I 2
03 0 0 0 3.0 0.4 1 1
$4 0 0 0 0 0 6 1
33 0 0 0 0 0 7 0
TOTAL 23.0 24.2 237 10q.0 43.3
-JFTOT, 0 3241Change in Pressure Drop, mm of Hg: 107 at 150 minPreheater Deposit Code. >2PTOR. Spun Deposit R~ating: 13 at 38
JET A-1 WITH THIOPMENE AND IETRALIN AL- _I '%-T AT 2S I 0 C (5338"F)--TEST 5663.
0101
02 0 0 0 00 0
701
04 I U
04 0 0 00 09
;JTTb .- W 12-4-1 4
ha ti i l res r M op m j 0f 14 g; I0 ý
MR Spu jt 0 0
-~~ U4 . 0P.¶
I% 0N0 0 0
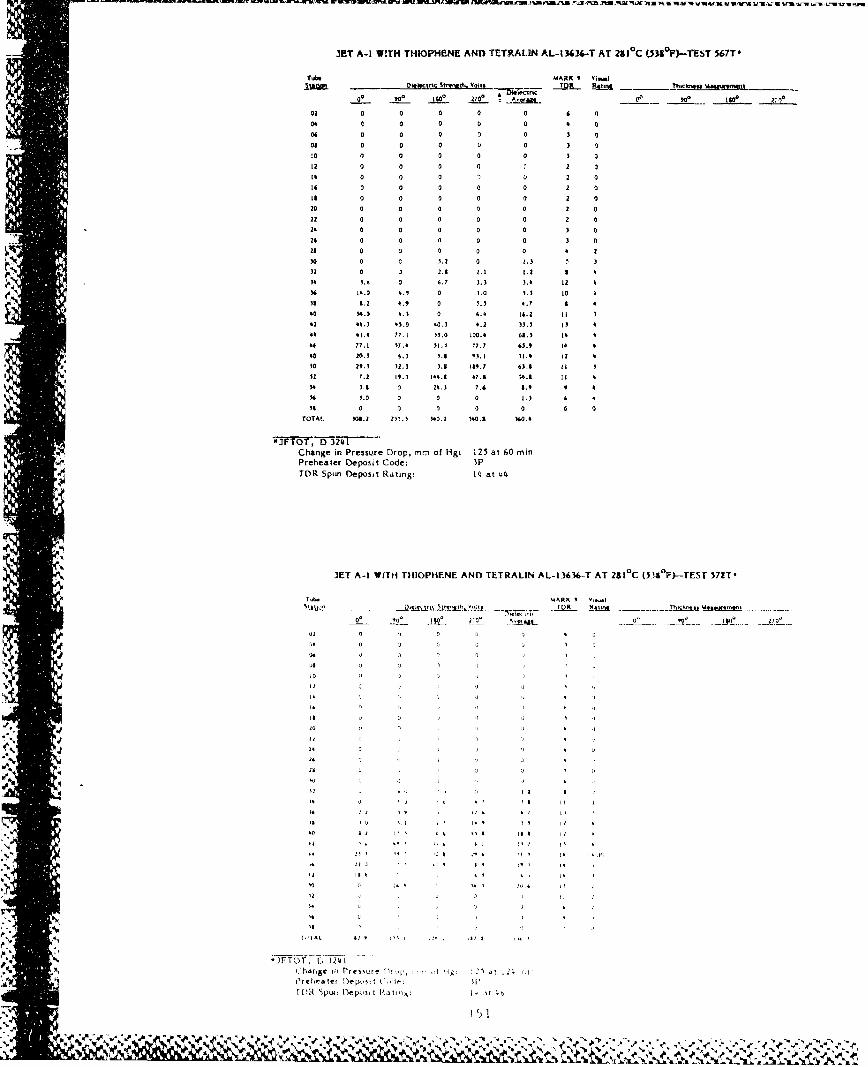
JET A-1 WZTH THIOPHENE AND TETftAUN AL-13636-T AT 231'C (53SP)-TE5T 567T4
Tube MIARK 9 Vi.ý.1.- M~ Dlq.Stlc SON.,..4. V91ty iicti TQKo- ________ _ Thj5.ooCaouew
09 [so,80 270* Z'-a 'P 0 J~
02 a 0 0 0 0
04 0 0 0 0 0 704 a 0 0 0 0 3 0
08 C 0 0 U 0 3 0
10 0 a 0 0 0 1 0
12 0 0 0 C 2 C
14 0 0 0 0 2 0
It 0 0 0 C 0 2 C
Is 0 C C C C 2 C
20 0 C a C 0 2 022 0 0 0 C C C 024 0 0 C C 0 3 C26 0 0 C1 0 a 3 0
28 C C C 0 0 4
30 0 3 .2 C 1.332 a .2 2.8 L.1 1.2 8 4
34 3.4 0 6.7 1.3 3.4 12 t
36 14.0 4.9 C 3.0 3. IC C38 8.2 4.9 C .0.40 34.0 4.) C 6.4 14.2 It 3
42 44.3 43.0 40.3 4.2 33.3 13 4
44 41.4 77.1 33.0 100.4 62.3 14 t
44 77.1 37.4 31.3 77.7 65.t 14 444 20.3 4.3 3.8 -1.1 )1.6 12 4
0 2.31 32. 3. 837 438 I 3
)4 3.0 0 0 9 13 6 4
31 C a C 0 0 6 0
TOTAL. 308.2 211.3 300.2 340.8 3060,
*3FTO 3T4 3241Change in Pressure D~rop, mm of Hg: 125 at 60min
kPreheater Deposit Code: 3PTDR Spun Deposit Rating: 14 at 44
X~T A-1 WITH THIOPHENE AND TETRALIN AL-I 3636-T AT 231oC (53Z"F)-TEST 57ST-
O~.4ARK( I '
02 C 0 04 0
04 0 0JU
.0 j 1 , 1 A ll
E, 12411
Ch ng m 0rsw e 'ry .. .)f 0i, ti2 1
8rh a e 1) po t k I" 3.A 0C I --
T1012 S 2w 4e, l ýIt :a r
OK .. M0k 0N ~'%4 0
24 0 a 1 L
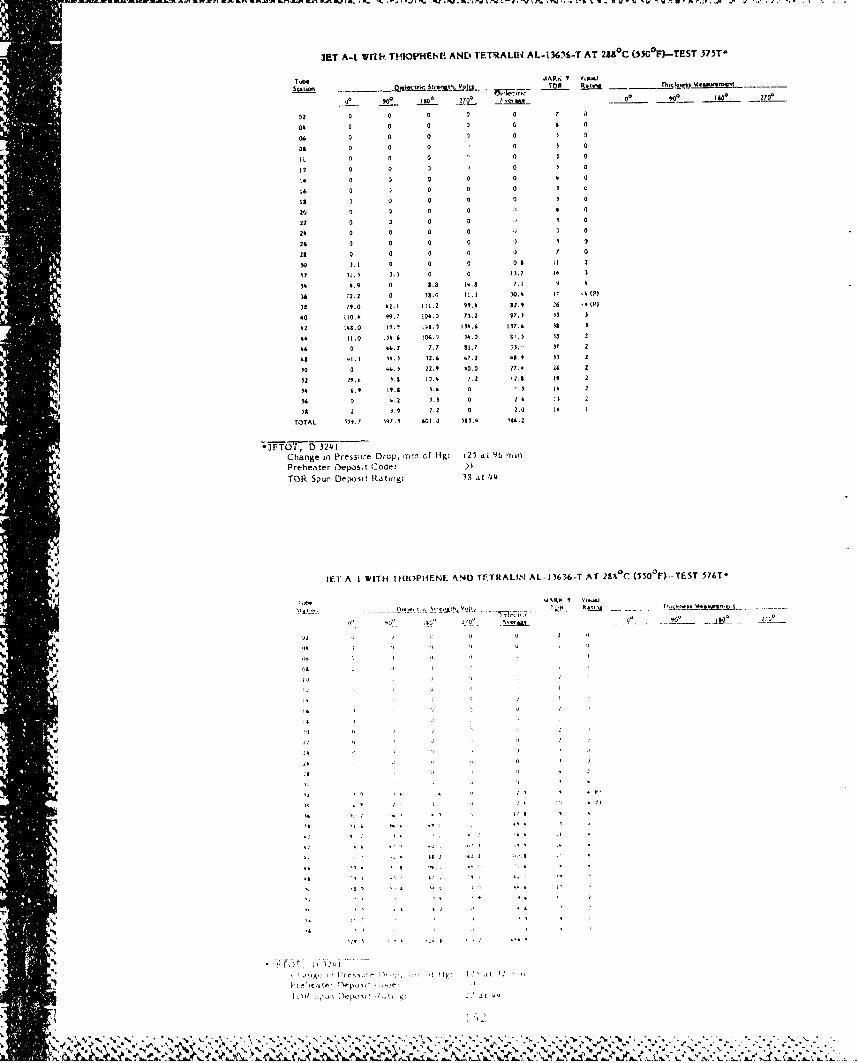
3ET A-1 WIlh ITHIOPHEl'tEAND TETIRALIN AL-13636S-T AT 2It C (3300*F)-TEST S7ThT
4 1,6 AAR,. T Oisu.
L-12000
02 0 a 0 0 0 7 1)
04 0 0 0 0 0 6 0
06 0 0 0 0 0 3 a
031 0 0 0 0 5 0
jIL 0 0 03 0
7 0 0 0 10 3 0
0 00 a 0 4 0
6 1 0 0 0 0 3 0
Is 0 0 a 0 0
20 0 0 0 0 0 6 0
Z2 0 0) 0 0 ¶ 0
24 0 0 0 0 1 0
26 0 0 0 0 5i 0
23 0 0 0 0 0 7 0
30 3.!1 0 0 0 0 3 It z
12 31.5 3.3 0 0 /37 14 0
34 6 .9 0 39 .8 1 4.9 . 9 6
M4 72.2 0 33.0 11.) 30.6 17 'k (P)
)z 19,0 4?. 1 111.2 99.6 32.9 26 . (P)
40 110.6 99.7 104.9 73. 2 97.3 tO3
42 143.0 119.9 1".0 394.6 137.6 tO
64 11.0 1136 & !06.0 065.0 £1.3 33 2
66 0 66.0 7.7 3I.7 0.3.1 07 2
11 4 41.ý1 5*.31 12.6 67,0 439v 33 2
00 0 4.3. 10.9 40.0 27 .. 26
32 29.6 3.3 10.6 7. 22 I'l036 6.9 193 0 '3 1
m4 0 1. . 2 6 :0 3
'I 01 2.0 .0 0 0.0 16 I
TOTAL '519.7 379 601.3 333.6 036.0
JFTOT,5 D32-41Change in Pressure Drop, mrn c Hg: M2 aZ 96 mrin~Preheater i~cepoo.t Code: ý
TOR Spun Deposit Rating: 38 at /44
JET A-I WITH TIMOPHENE AND TETF&ALIN AL-1 3636-T AT 29110 C (50FýTS 56T-
'.9*&R I43 V-,.a
Ilal., , .1 5r6../j9t~V/9I ____ 11.9 6
.n - .... !/5n~ 4E/~2.
"*140/q' 0.______
9 000
99 .2 1 . 40 2
6 II %
6 16.
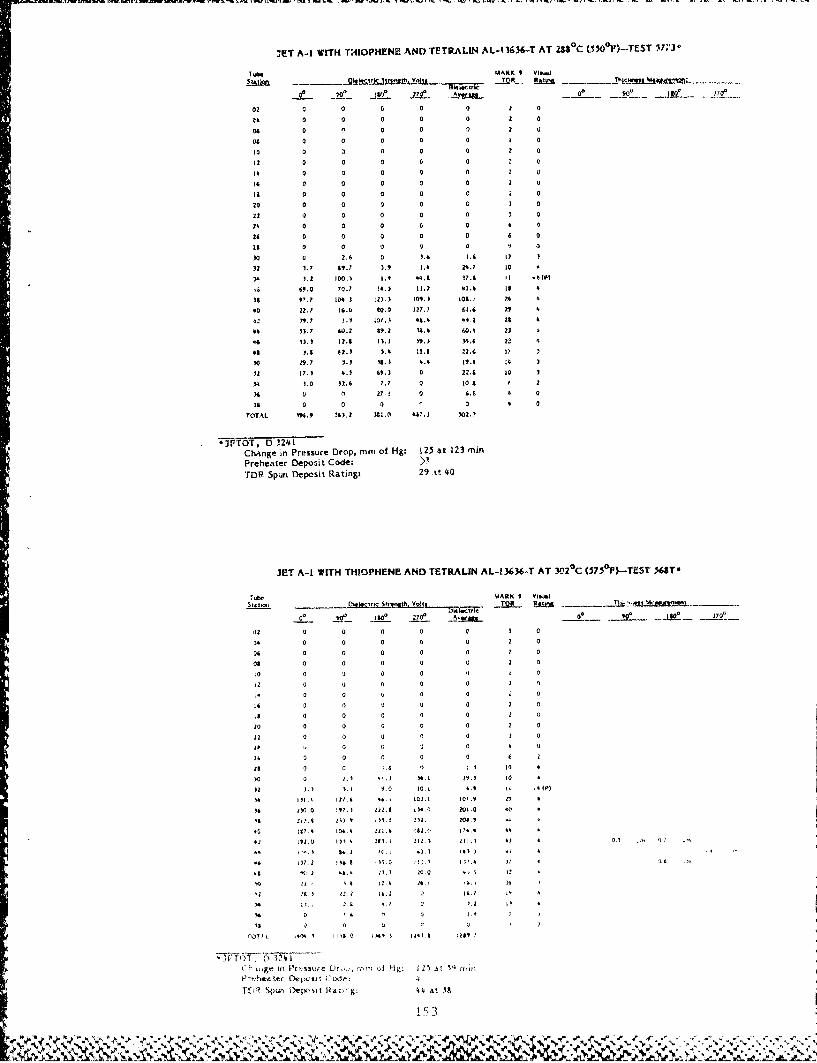
XET A-1 WITH T:4IOPHENZ~ AND TETRALIN AL-036W4T AT 2U 0 C (.MO0Fý--TEST 377J2-
b. 4ANK 9 I*..2
02 0 0 0 0 0 2 0
00 0 0 0 0 0 2 0
00 0 (1 0 0 0) 2 a
00 0 0 0 0 0 1 0
10 0 a 0 0 0 2 0
12 0 0 0 0 0 0 0
4 0 0 0 0 0 2 0
16 a 0 0 0 0 2 0
is 0 0 0 0 a 2 0
20 0 0 a 0 0 3 0
lz a 0 0 0 a 0
74 0 0 0 0 0 1
26 0 0 0 0 0 6 0
is 0 0 o 0 o '2
t0 a 2.4 0 0.6 1.6 12
32 0.7 49.? 3.9 1.4 24.7 10
34 1.2 100.5 1.0 40,8 07.6 It tp
69.0 70.7 14.) 11.2 41.4 is 4
is 97.? 10,3 21.) 101. I08.Y M 4
40 211.1 16.0 t0.0 127. 61.6 20 4
4-1 My. 1.1 laf.4 40.4 441.0 ?3 6
44 53,7 610.2 30.0 M0.4 60.4 Z)
46 50.0 12.A 10.1 59.J 31.6 22
48 1,2 *0.5 0.4 10's P26
50 29.7 0.0 01.) 4.6 20.3 16
02 17.5 4.0 40.0 0 22.0 t0 1
00 0.0 02.4 7.7 0 to's 2
16 0 0l V7-1 0 6,4 4 0
28 0 0 0 0 1
TOTAL M 00.9 0602 001.0 407.1 1 02.'
Ch~inge in Pressure Drop, rnnro of Hg: 123 at 123 minPreheoiter Deposit Code:TDR Spsun Deposit Rating* 29 t4t 40
3ET A-1 WITH THIO!'HENE AND TETRALIN AL-136-3-T AT 3020C (573*P)-TEST 51T-
.46* MARK6 9 Viv.W.
012 0 0 0 f) 0a
34 0 0 0 0 2 a
D6 0 o 0) 0 0 o
t0 0C) 0 1 0
12 0 0) 0 0 2 0
14 0 0 0 o 0
j4i 0 0 0t 0 0 2 0
3s 0 o 0 0a 2 Q1
22 0a 0 a 0 0
00 0 ' 2. 1~.) 54.1 19.5 t0o
22 0.53 s.1 9.0 t0. 1 4.6 0 .46
)6 Ill" IVA. *6.1 10o. 1 l0'.9 27
34 2,1. 214.6 111.7 01. o 700.6 00
.G trA 101411.6 180.0 114.. 44
42 10.0 111.1 115. 1 212.$ ll1') 62 4 o.1
f- I0. 06. z '0. .1 ..2 1410) 41 4
.4 I)72 6. 0 7.0W fill.% 110.4 )7 411.
00 201 1.4 1. 4 *,0.1 4.., it I
'2.5 0.2. 16.2 0) l6.1 ,
14 II 2.9 4. .1 5. 1I
54 0 4 7 0 .
15R3
% %4J' 4.04~O O * * 4~. ~ l4 ~ ' ~ ~ ~ " '
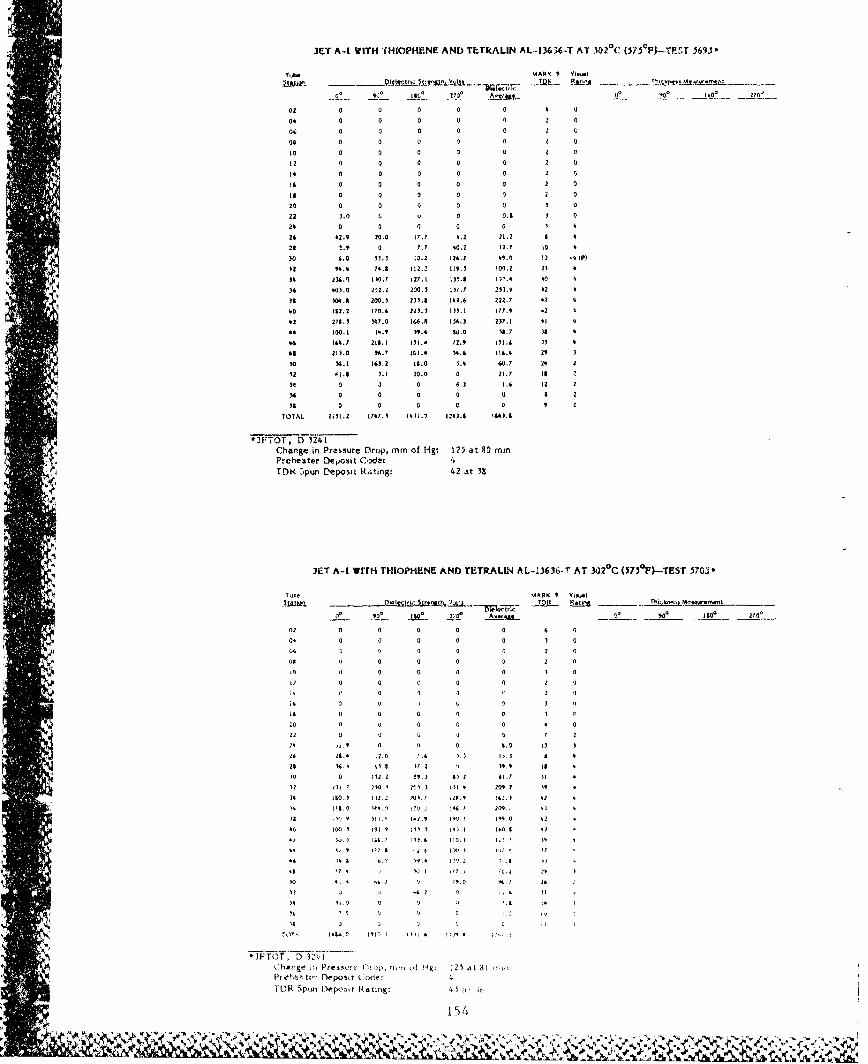
JET A-1 WITHT4 THIPHEN'E AND TETRALIN AL 4.363 6-T AT 302 C (375 0 F)--.YPSI 5693-
TkAb MARK0 Vi.b.I
02 5 0 0 0 0 3 3
03 0 0 0 330 0 0
a; 0 0 0 Q
go 0 0 a 0 2 0
10 0 01 0 33 2 a
12 a 0 0 1 0
L6 0 0 0 0 0 2 0
Is 0 0 a 0 a
2 0 0 0 0 0 0 1 0 )22 3 .0 G 0 0. 0
23 0 0 0 a 0 3
26 4Z.9 30.0 17.1 3.2 31.2 1
23 0.9 0 1.7 30.2 32.7 30
YO 50.0 5)1. !0.2 123.2 4,.0 13 -4 (P)
"1 9.4 73.3 112..' 119.1 100.2 23 3
334 234.) 130.? WA7, 1315. 07.4 #0034 W05.0 2-2.2 200.5 137,7 233.3 #0
33 V04.4 200.5 M2.8 139.6 222.7 30
40 162.2 170.6 221.3 M3.1 177.9 42
32 271.5 314.0 38.19 13M.) 217. 41
33 100.1 13.9 39.6 W120 50.7 33 3
434 333.7 711.1 153.3 12.9 01I.4 25
33 213.0 337 103.3 54,3 36.3 29 010 5%.1 . 1 3..2 I.0 1.3 60J7 2#
32 61.3 5.3 20.0 0 71.7 Is3
111 0 3 0 4.3 3.3 12 293 0 0 0 0 0 a 2
13 a 0 0 0 0 9 2TOTAL 31M.2 3174.1 14)1.1 1308, 4431.8
Change in Proeoure flrup, mm of tig: 125 at 80 min*Preheater Devosit C,:ýe: if
TDR 3{pun Deposit Ra~ting, 42 at 38
X;
JET A-I wITH THIOPHENE AND TETRALIN AL-13636-- AT 302'C (575 0 P)-TEST 570J.
Thta MARK 9 V3.-I
33 0 0 0 0 0 a
00 0 0 0 1 0
-~ 0 0 0 2 0
as3 0 0 0 22 0
0 3 0 0 0 0 3 0
12 0 0 c 0 0 1
!k0 0 0 32 0
;6 0 0 1 31 0 3
It 0 0 0 00 31
a0 0 0 0 0 3 0
II20 0 0 G. 0 2 7 2?4 1i.9 0 0 0 3.0 1323 2 1.3 2. '3 0.1 5 I ,.3 A
is 16.0 6.5's 37.2 ".0 Is, 3
0a 0 352.2 29 3 33.2 U3.7 U
02 333. 250.'1 1003.3 3514 201.7 )9 3
34 130.1 33.0 ?03.7 039.0 333.3 02 0
I& 77 'C 3.' 30.1. 31*0 IWVO 32 3
331 100.5 393 9 355.5 313.1 330.3 07
II 0.3 1 284.7 3133, 330.3 31 3 30 it
44 3, 1 . 30 A 1w.3 I 3.0 21
1.40 110 1 "' 3) n' I
Preh.30013C 3 Dreposit 3):, 'r.lYl ¶a ,
1(31 Spuns L33eoo Rating: 0. 212 a!;
151433 %3 0 ~%
~ Ž~.A
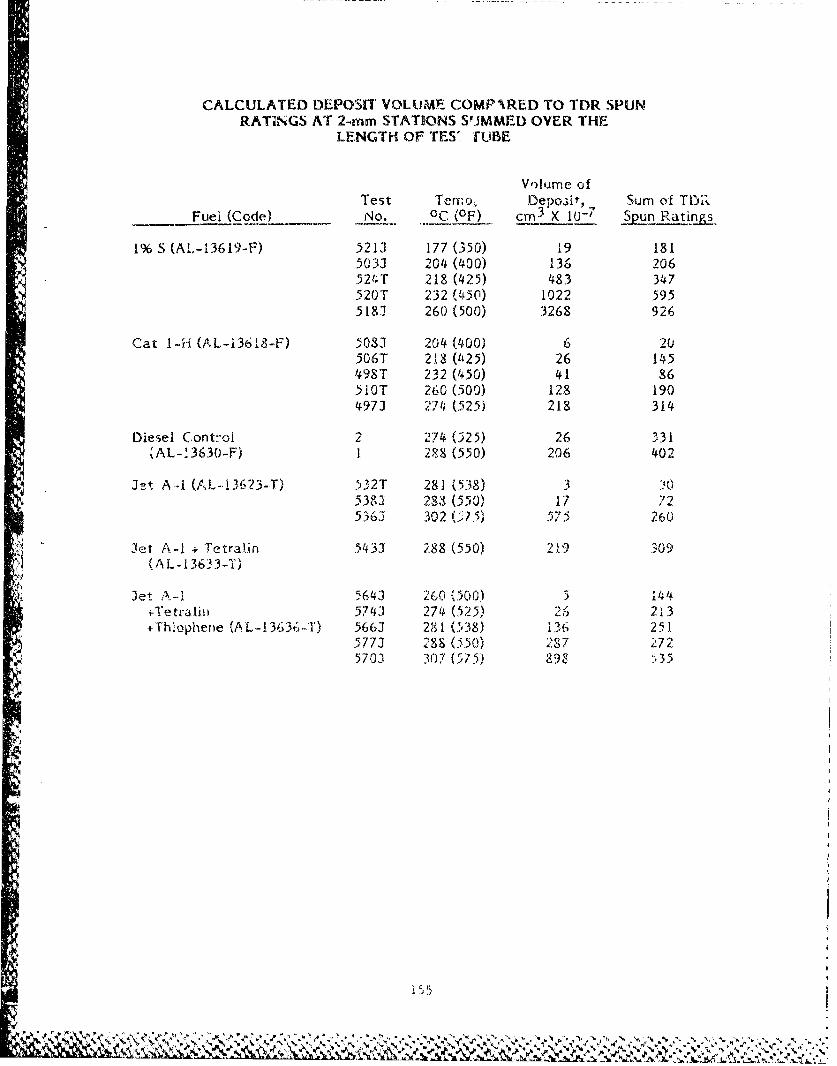
CALCULATED DEPOSIT VOLUME COMP ARED TO TDR SPUNRATINGS AT 2-mm STATIONS SUJMMED OVER THE
LENGTH OF TES' tUBE
Volume ofTest Terno, Deposi, Sum of TMiý
Fuel_(Code) No. °C (OF) cm 3 X 1U'- riun Ratinjts
1% S (AL-13619-F) 5213 177 (350) 19 1.81503J 204 (400) 136 206524T 218 (425) 483 347520T 232 (450) 1022 5955181 260 (500) 3268 926
Cat I-4 (AL-i3618-F) 5083 204 (400) 6 20506T 218 (it25) 26 145498'r 232 (i450) 41 86510T 260(500) 128 1904971 274 (525) 218 314
Diesel Control 2 274 (025) 26 331(AL-'3630-F) 1 288 (550) 206 402
3-•t A.-I (AL-,13623-T) 532T 281 (538) 3538J 288 (550) 17 ?2536i 302 (5?55) 375 260
Jet A-I + Tetrali, 5433 288 (550) 219 309(AL-13633-T)
Jet A-1 5643 260 (500) 5 14q'Tetratii 5743 274 (525) 213
+Thiopheine (AL,-! 3636-T) 566J 281 (538) 136 2515773 -88 (5,50) 287 272.5703 307 (575) 89• 5.35
i55
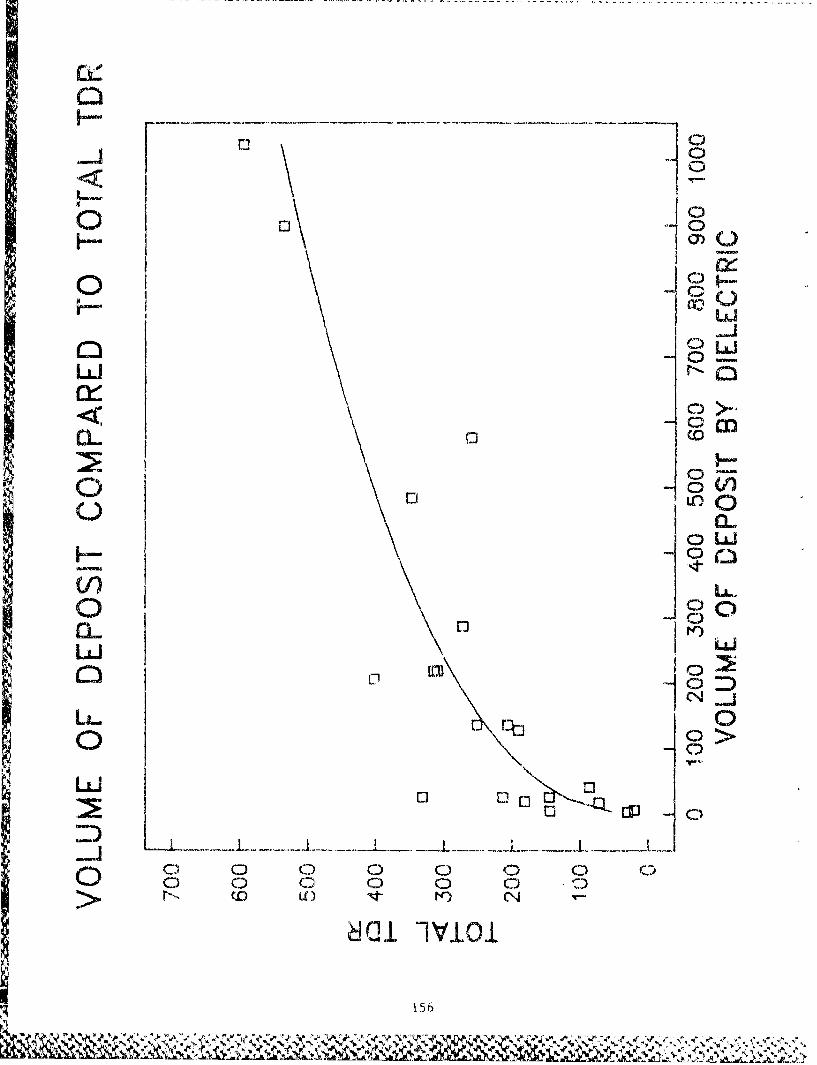
HC-
0
(0
0 V
00Nw
(IC)
CLAJ
o 0>
LiJ
00 0 0l 0 0 0> ~ ~ ~ dl IVIQ)LO Nt n
I5
4
"N
'4
',
N
S~151
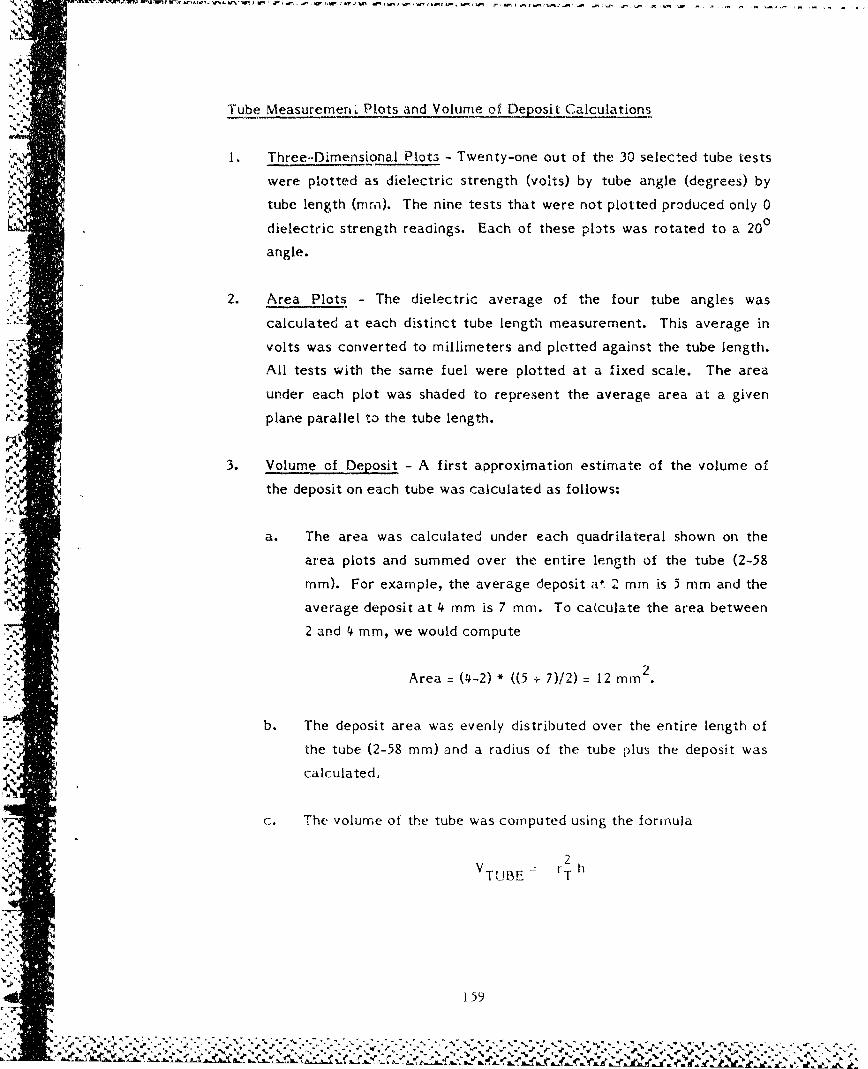
Tube Measuremern. Plots and Volume of Deposit Calculations
1. Three-Dimensional Plots - Twenty-one out of the 30 selected tube tests
were plotted as dielectric strength (volts) by tube angle (degrees) by
tube length (mra). The nine tests that were not plotted produced only 0
dielectric strength readings. Each of these plats was rotated to a 200
angle.
2. Area Plots - The dielectric average of the four tube angles was
calculated at each distinct tube length measurement. This average in
volts was converted to millimeters and plotted against the tube length.
All tests with the same fuel were plotted at a fixed scale. The area
under each plot was shaded to represent the average area at a given
plane parallel to the tube length.
3. Volume of Deposit - A first approximation estimate of the volume of
the deposit on each tube was calculated as follows:
a. The area was calculated under each quadrilateral shown on the
area plots and summed over the entire length of the tube (2-58
rmm). For example, the average deposit a. 2 mm is 5 mm and the
average deposit at 4 mm is 7 mm. To calculate the area between
2 and 4 mm, we would compute
Area - (4-2) * ((5 + 7)12) : 12 m m2
b. The deposit area was evenly distributed over the entire length of
the tube (2-58 mm) and a radius of the tube plus the deposit wascalculated,,
c. The volume of the tube was computed using the formula
2V r rh
TUBE T
159
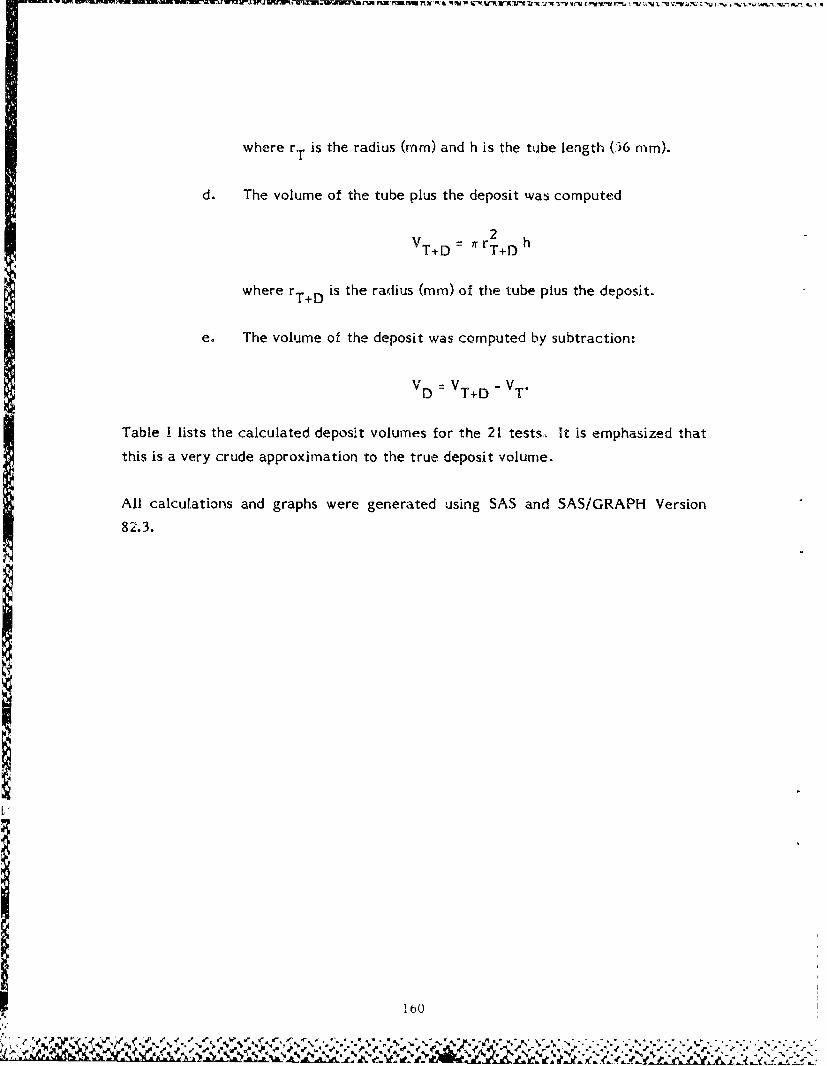
where rT is the radius (rmm) and h is the tube length (J6 mm).
d. The volume of the tube plus the deposit was computed
2
T, D -rT+D h
where rT+D is the radius (mm) of the tube plus the deposit.
e. The volume of the deposit was computed by subtraction:
VD = VT+D - VT.
Table I lists the calculated deposit volumes for the 21 tests. It is emphasized that
this is a very crude approximation to the true deposit volume.
All calculations and graphs were generated using SAS and SAS/GRAPH Version
82.3.
160
or W,-
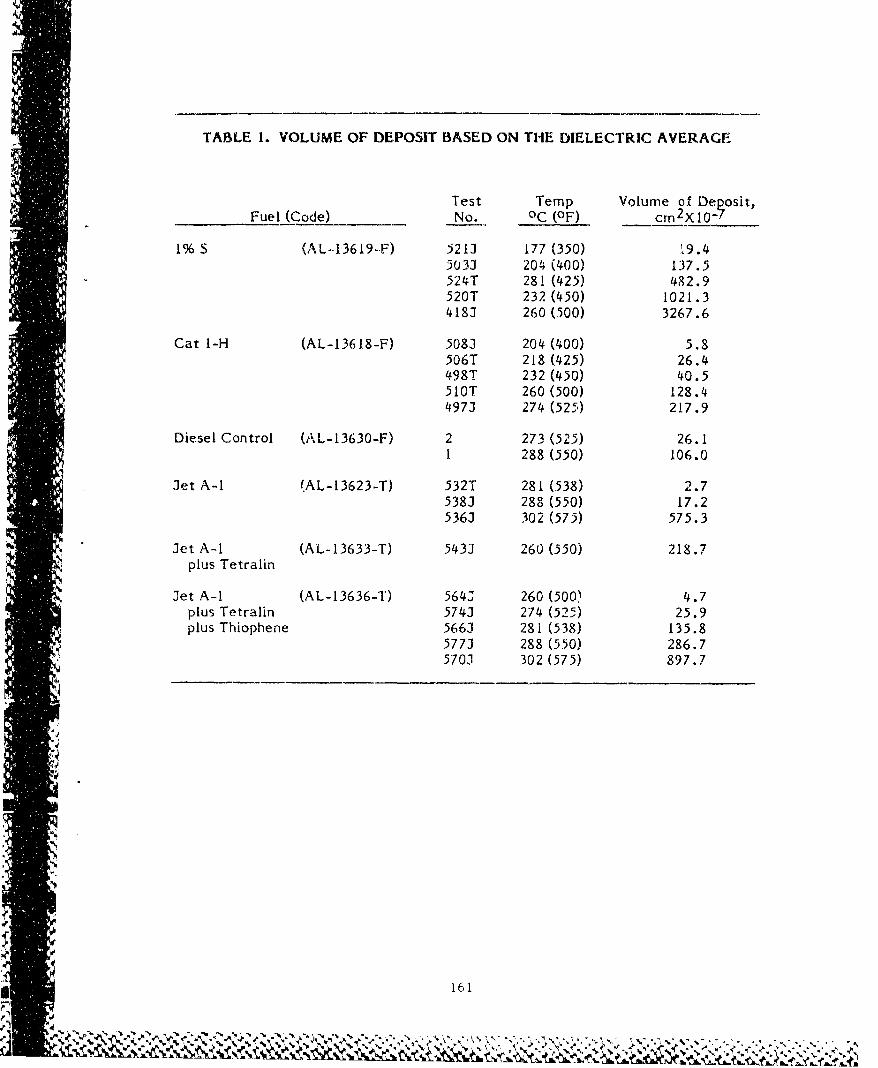
TABLE 1. VOLUME OF DEPOSIT BASED ON THE DIELECTRIC AVERAGE
Test Temp Volume of Deposit,Fuel (Code) No. oC (OF) crn 2X10⁷-
i%S (AL- 13619-F) 5213 177 (350) '.9.4503J 204 (400) 137.5524T 281 (425) 482.9520T 232 (450) 1021.34183 260 (500) 3267.6
Cat I-H (AL-13618-F) 5083 204 (400) 5.8506T 218 (425) 26.4498T 232 (450) 40.5510T 260 (500) 128.44973 274 (525) 217.9
Diesel Control (AL-13630-F) 2 273 (525) 26.11 288 (550) 106.0
3et A-I (AL-13623-T) 532T 281 (538) 2.75383 288 (550) 17.25363 302 (575) 575.3
3et A-I (AL-13633-T) 5433 260 (550) 218.7
plus Tetralin
3et A-I (AL-13636-T) 564J 260 (500) 4.7plus Tetralin 5743 274 (525) 25.9plus Thiophene 5663 281 (538) 135.8
5773 288 (550) 286.7570,31 302 (575) 897.7
16 |•r'•161
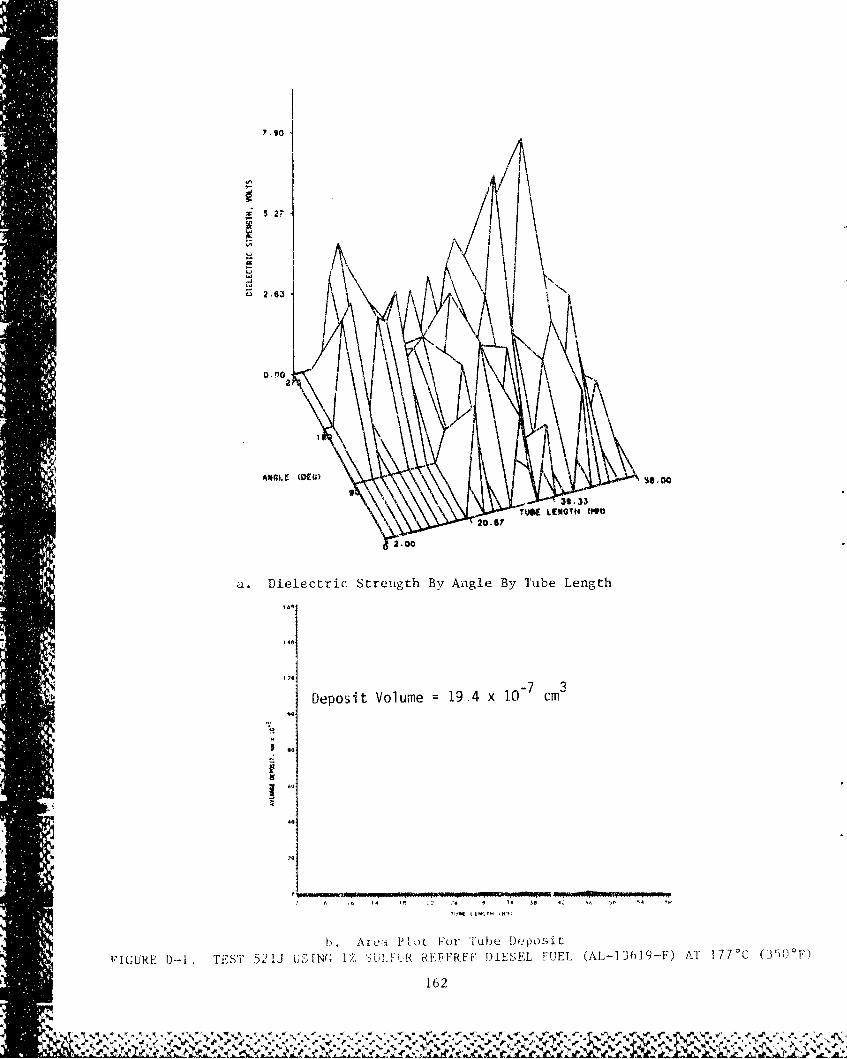
5,7
2.0
a. Dielectric Strength By Angle By Tube Length
140*
40.
Deposit Volume =19 4 x 1.0 -7Cm3
40
40 5
1). Are: Not. For Tube Deposit
FIGURE 01,- TEST 52J Ul I'N'O 1ý / ULIFlIR REFE REE Jj DE.L FUEL (Al -1I619-T ) AT' 177 0 C C 3I) Wl
162
"% % %
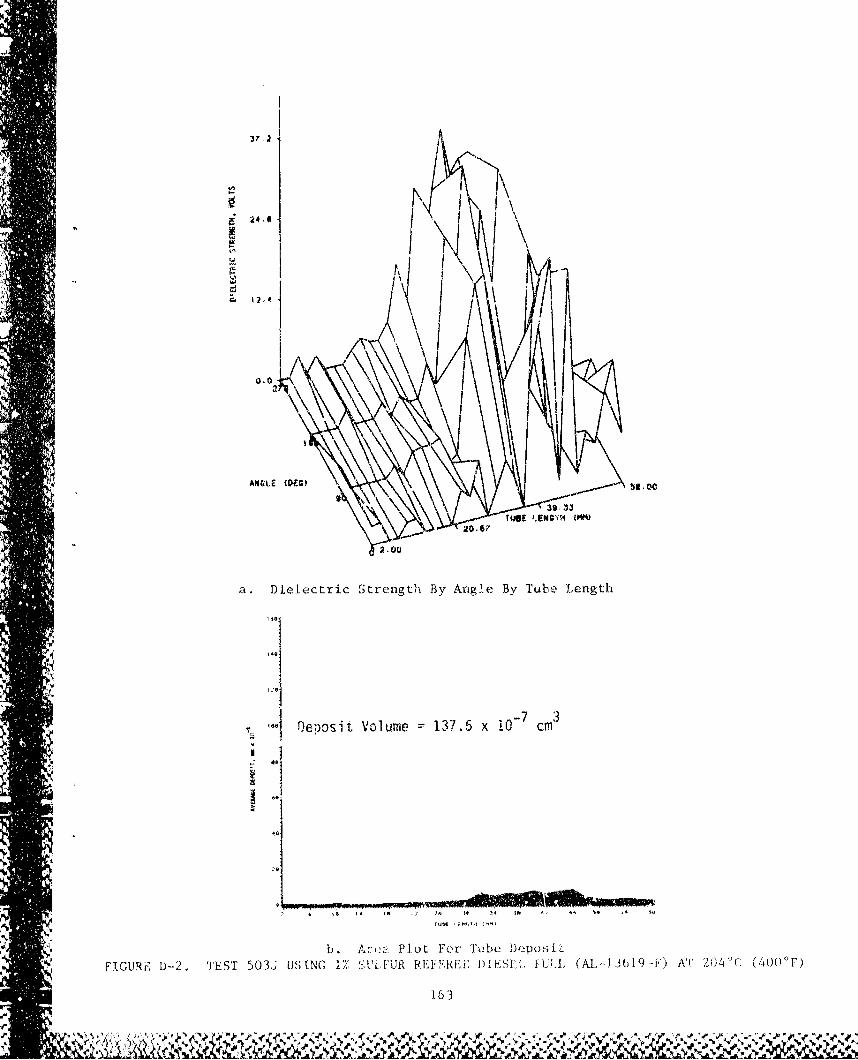
20.67
2,00
a. Dielectric S•trength By Angle By Tube 'Length
I •., ODeposit Volume -- 137.5 x cm
.4,0
"*b. A -.-2• Plot For J be I,*poiýýý f
S~FIGURE D)--2,, TEST 503J USING 17, SULFUR kF;R f;II S(,fIJ:L (..,.J•9 F T 2 4-( 4 0 F
S2163
i
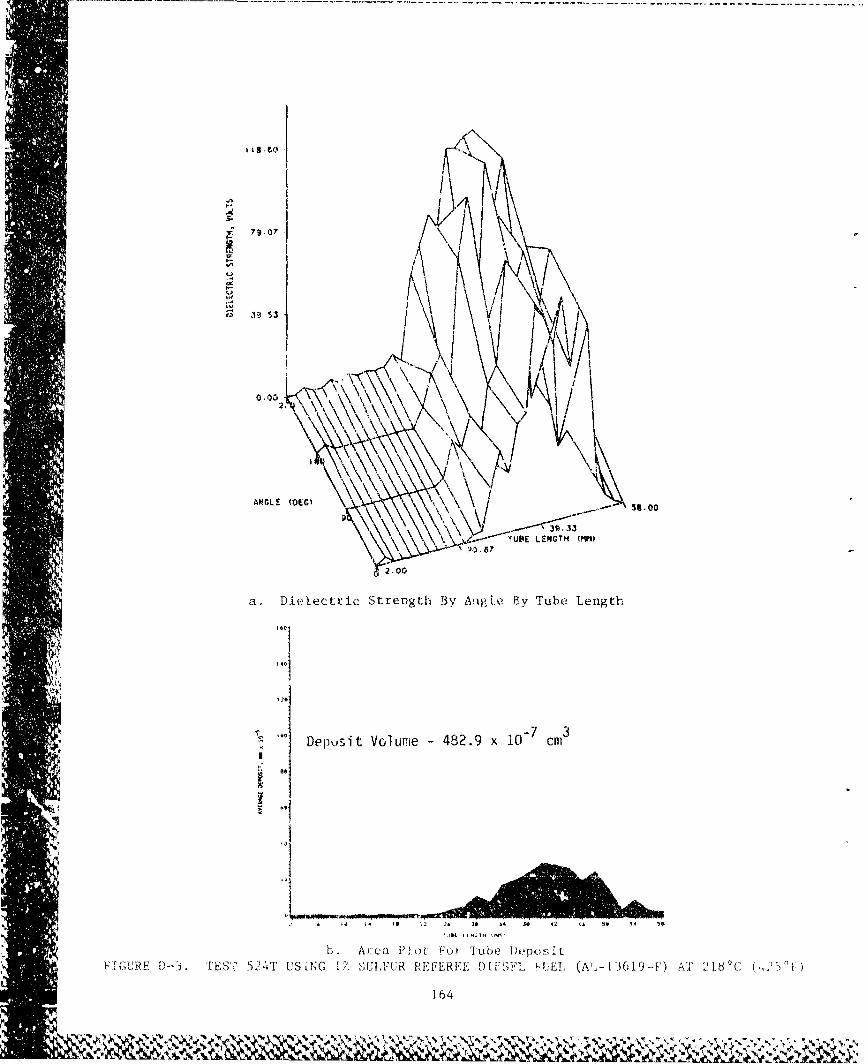
j 79,Q7
4 ,1 L -
S.-: -" UPE LENGTH (MM•)
4w
2.00
a. Dielectric Strength By Angl~e By Tube Length-,
SDelpusit Volume -482.9 x 10- cm3
1-
a 4 I 2 .• Is ý4 3l8 42 14 IV 54
ib A•e ilJ.t Fo0 Ttib e 1) ..p s t
F,,GURE T)- IES 54T US -NG iZ ýAUIFUR REFrERE.E DIF;SF-1' FUE., AL -!6 9-' AT 21.,10C ( ' [.
4164
I& ljV/
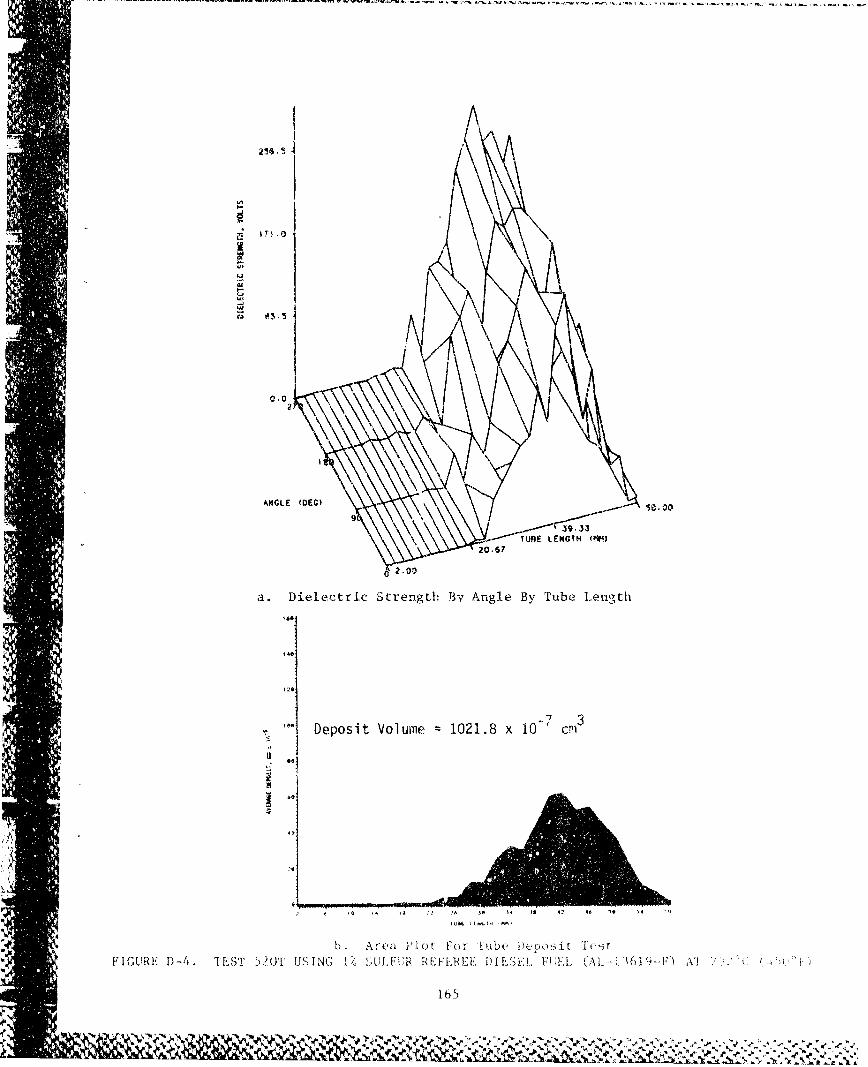
0.0
ANGLE (DEG) .
\9 (usE LENGTH mm
2.00
a. Dielectric Strength By Angle By Tube Length
* 20
'1-7 31061 Deposit Volume 1021.8 x 10 cp
42 4
b Acea Plot For fi be De pos it T%-0FIGURE D-4.. 'IEST 52'T USING 1Z SULtf 1E FLREE- OILfJI }IF IT \AI I<N--V 1 Y'2 .'
165
-Ný li> 70,~ mt½
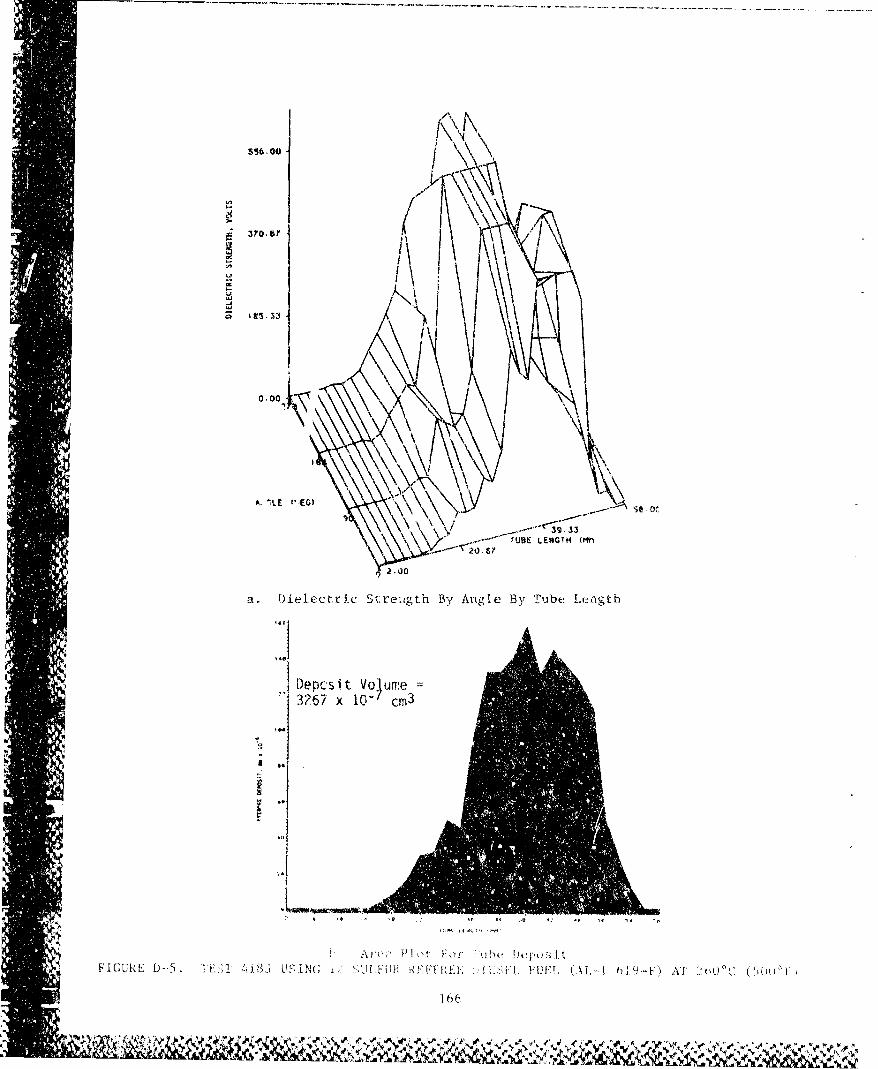
3o.bo,
k %E. (' EG)se ý
- '~UBE LENOTH (Mlt
2 .tJ0
a, Dielectric Streiigth By Angle By TubeLigt
Depcs it VoJ ur~e3267 x 10-- cm3
Ike
tf P] ov For kib De-positt
FIGUTE~~~~~~~~~~~~~ D-5 46'iUiG i'1 lFI A- 1-)A 6
16
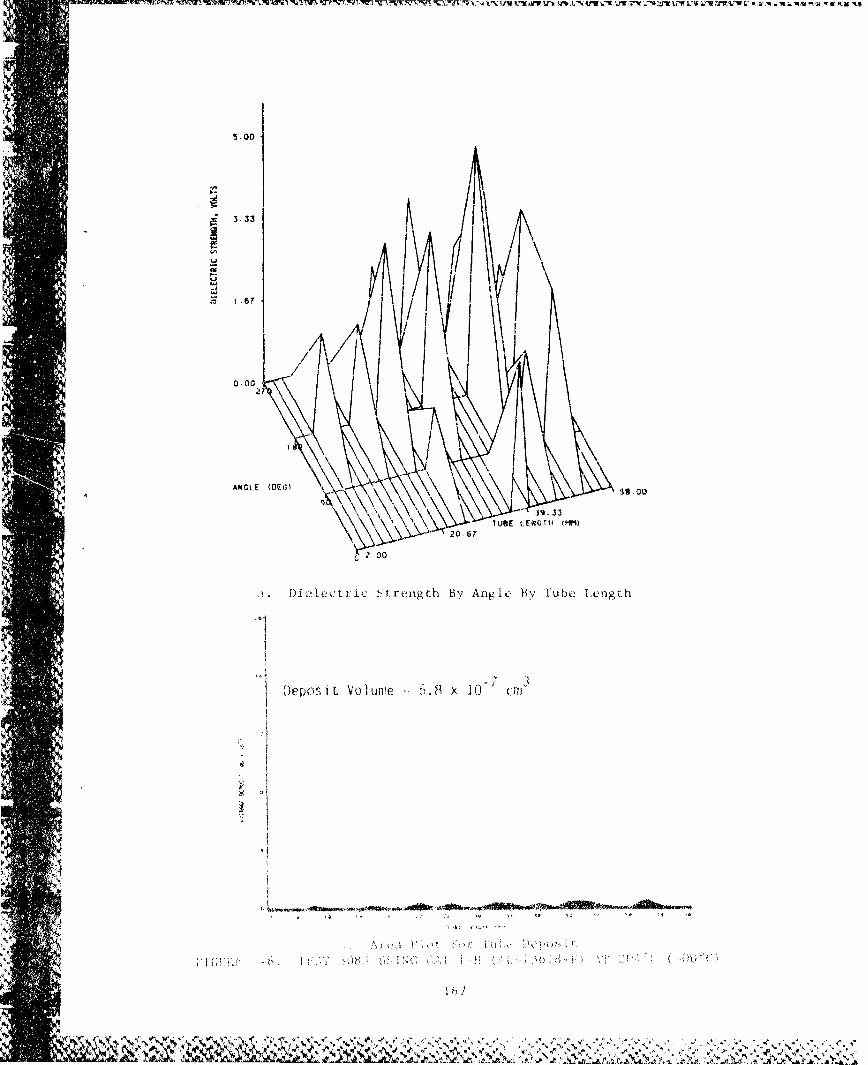
wurns Ww v r nn a ;nZr~w' V71- WI n ri nv ;4 TIEUfl~ WI i
G5200
A/i
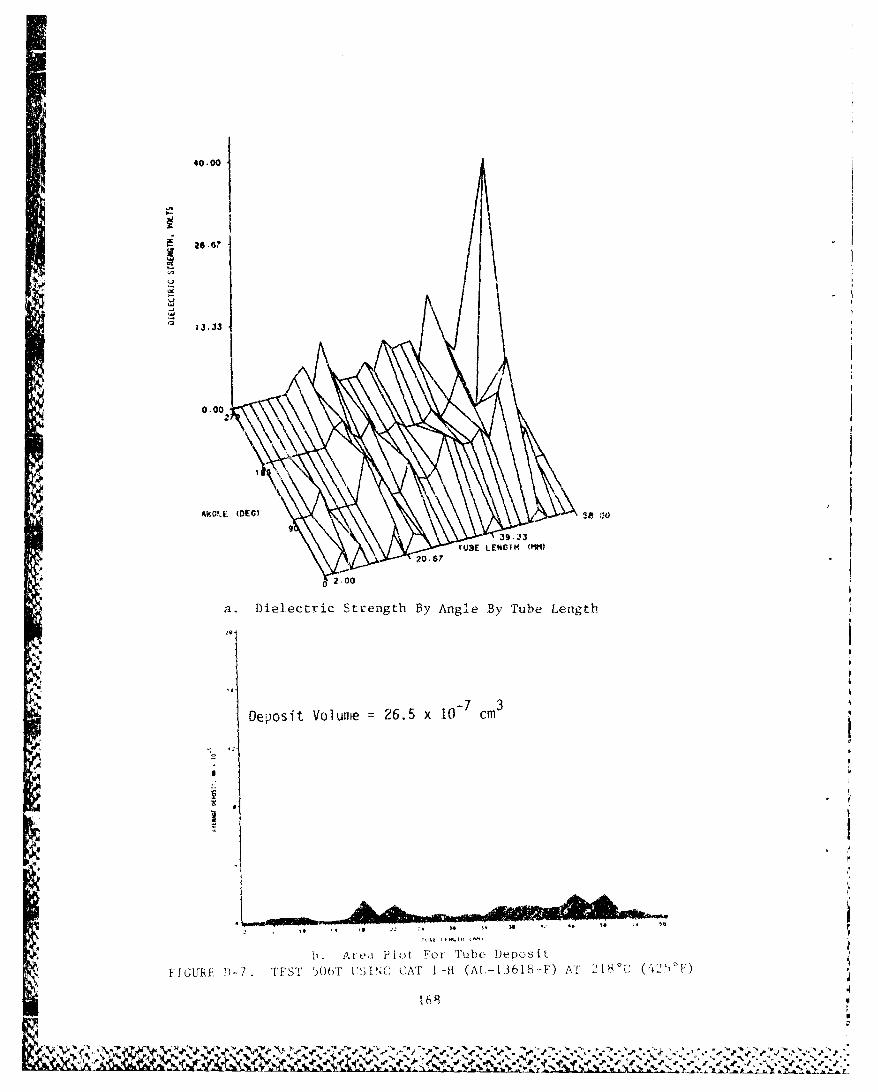
I I40.00
26.6-
L 13.33
0.00
AKEIE (DEC) s
p9
S39. 33TUME LENGTH (MMt)
S2.0020
7
a. Dielectric Strength By Angle By Tube Length
Deposit Volume = 26.5 x 10⁻⁷ cm3
I,. Ale., Plot T'01 T~tbe Deýpo'sit
4 '61
F'1GLTE D 7 'I,, f. S'I 5o)' 1'1 11N CAT 1 - (A -. 6 8 F) AT, 18vC ( 5'ýF)
"O"J.4
~ ~ N ~V
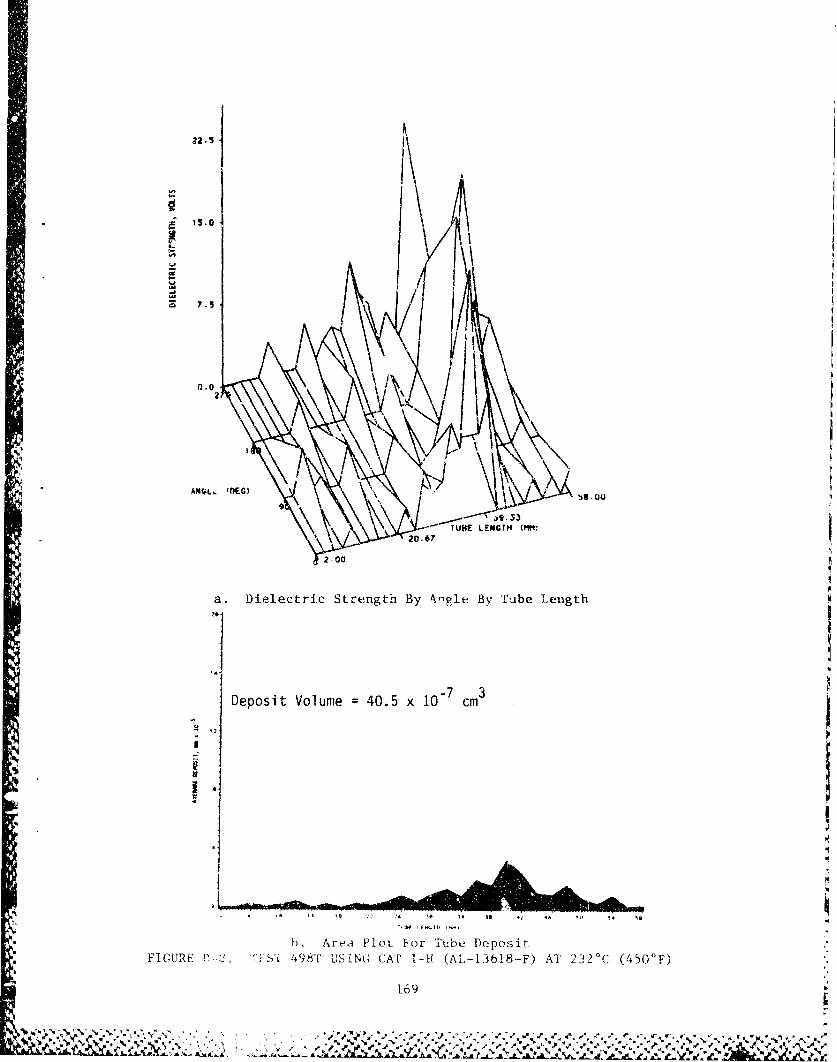
22.Sj
05.0
20-6
.0 .5
Deposit Volume 40.5 x 0.7 cm. 3
20.2
1# 144A1
2.00
Are Plot: or Tube, DepositFIGURE P- :ISIt 498T USING CAT I -If (AL,-13618.-F) AT 2320C (450 0 F)
169
*' N_ C- if ory~ V V V .- ~..A L~~~.h~~~L~~ T~~j %./ ..- ~ AA-A I ,'
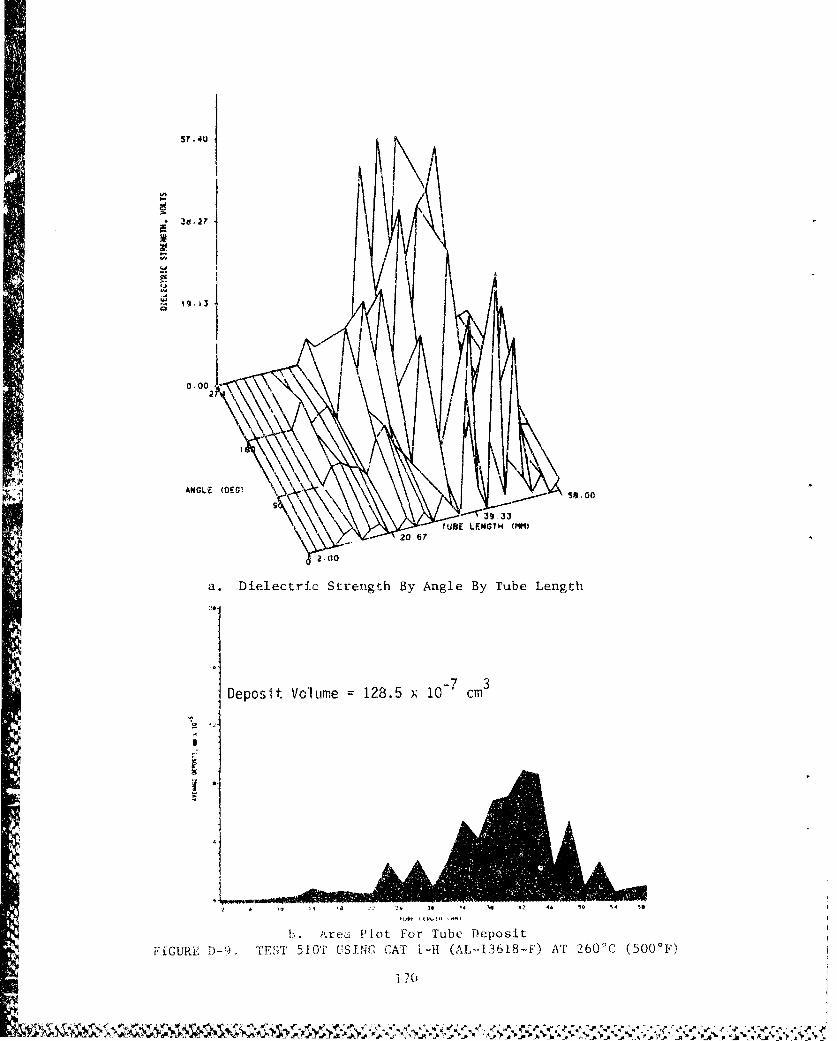
57.40
a2
0.0021
ANGLE (DEG) 58.00
TUOE LFWGT&4 (MM)~k • ~~~20,67 o . o . ,S2.t0o
a. Dielectric Strength By Angle By Tube Length
Deposit Volume 128.5 x 10⁻⁷ cm
2 t2•,iŽ i sA 4 42 46 50 ¶4 a 1
b. tkrea Plot For Tube Deposit
FIGURE D-9. TEST 510 T T .SINC CAT i-H (AL-13618-F) AT 2600C (500 0 F)
170
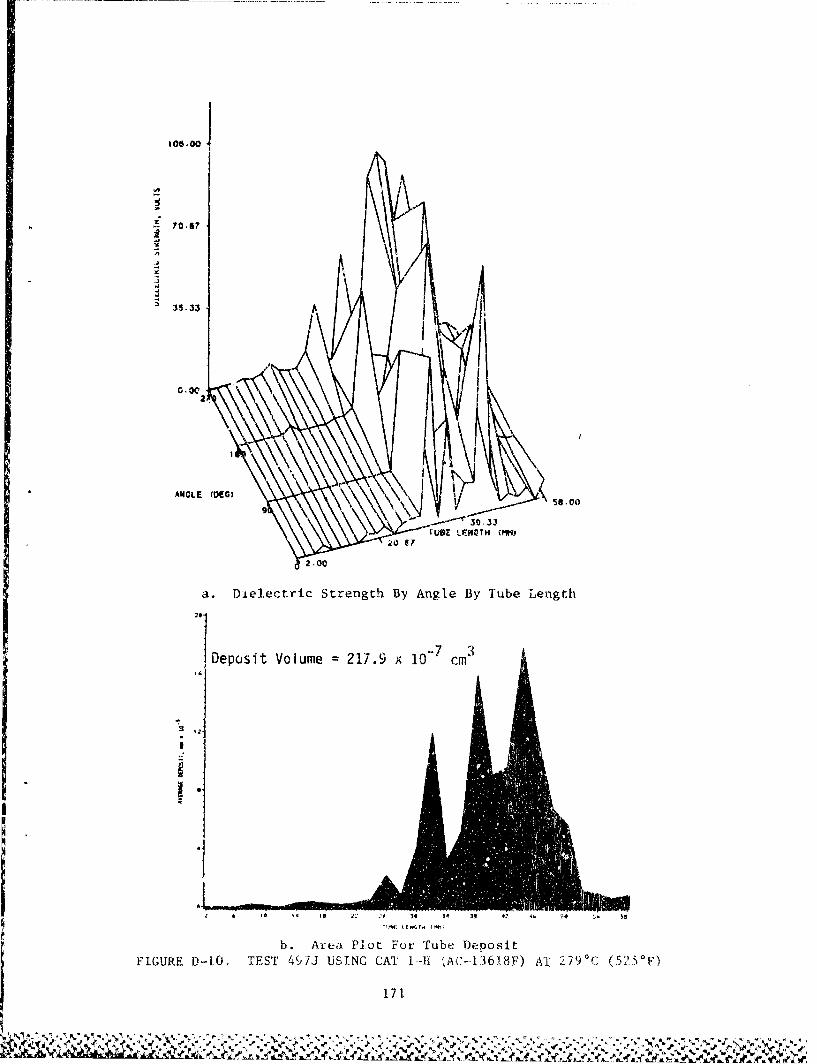
106-00
35.33
2
ANGLE COEGI
9 ~ - 58.0030 33
WOE LFPfCN (MM)
2.00
a. Di~electric Strength By Angle By Tube Length
"10eposit Volume =217.9 x 10- cm3
I.V %I%
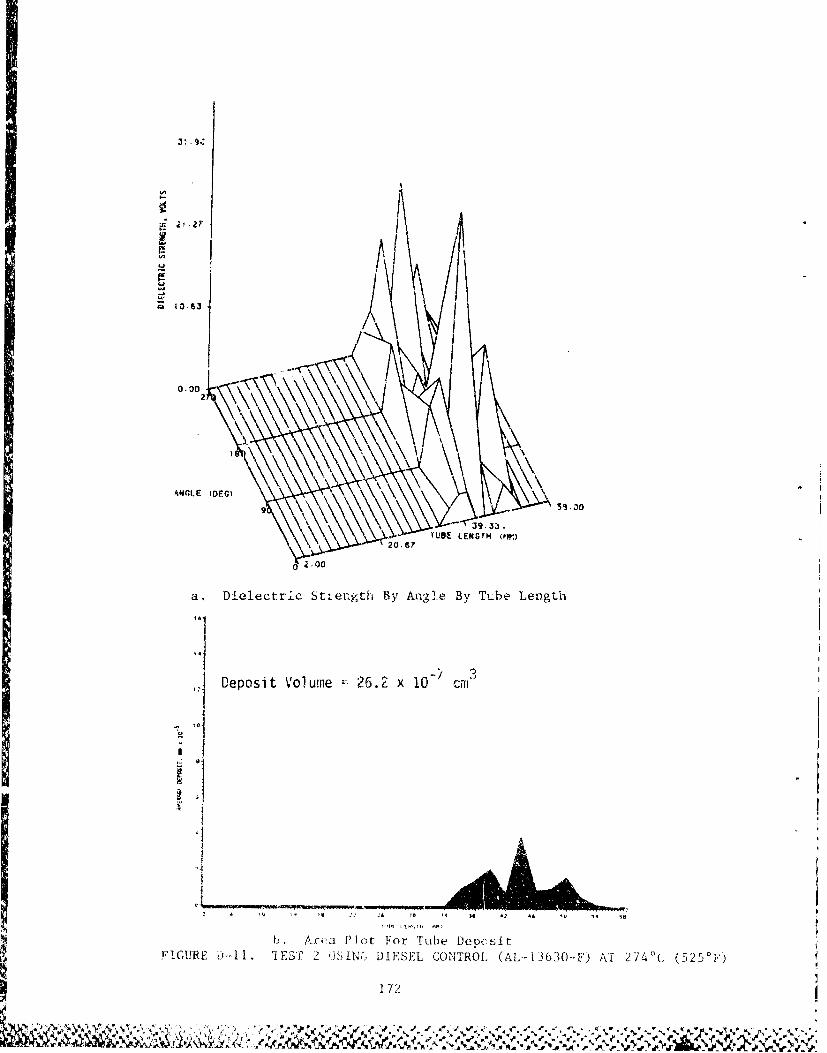
0,.0
- .1(-9.33.20 -7 UBE LEN G TM 0'1•,)
0.00
a. Dielectric Sttength By Angle By Tube Length
-? 4
,1 Deposit Volume " 26.2 x 10- cmr
-6 !0 4 ~.29 41 0 ..
D be ks- Pitt For T6be .2epcx1 t
FIGURE 0-,,11. t'ES, 2 ¼,1N. DIESEL CONTROL (AL--3630-F) AT 274°c (525 0(2 ')
!72
",, ++ .. .+ ,P .P • +P+ , ,. ." .' • , • ,',, " • ,t .,S,' ,' , , %..4 % ,,'e
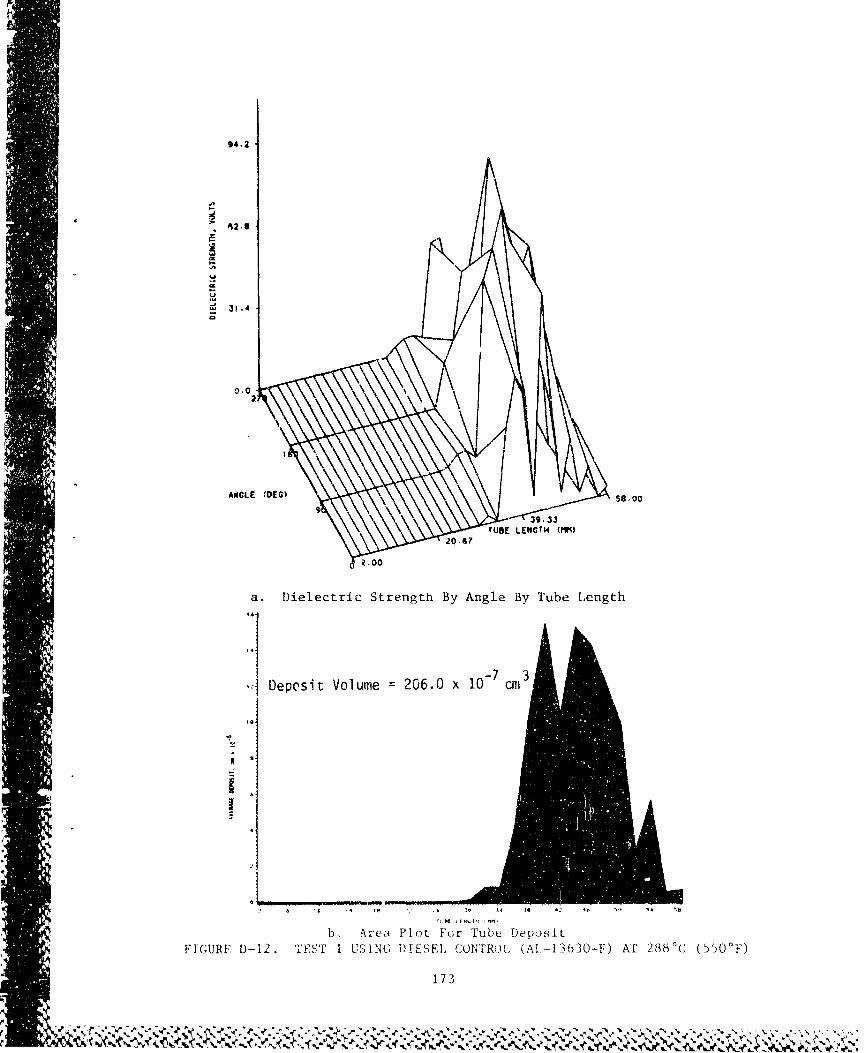
94.2
31.4
0.02
o ,o
ANGLE (DEG) 58.00
939,33
TUBE LENGTH (MM)"20 •6
S2.00
a. Dielectric Strength By Angle By Tube Length
Deposit Volume = 206.0 x 10⁻⁷ cm3
C ~ ~~~ '1 1.___________
b. A rea Plot For Tube Deposit
FIGURE D-12. TEST I USING DIESEL CONTROL (AL-13630-F) Al 288°C (55) 0°F)
173
'I%t . A C % .
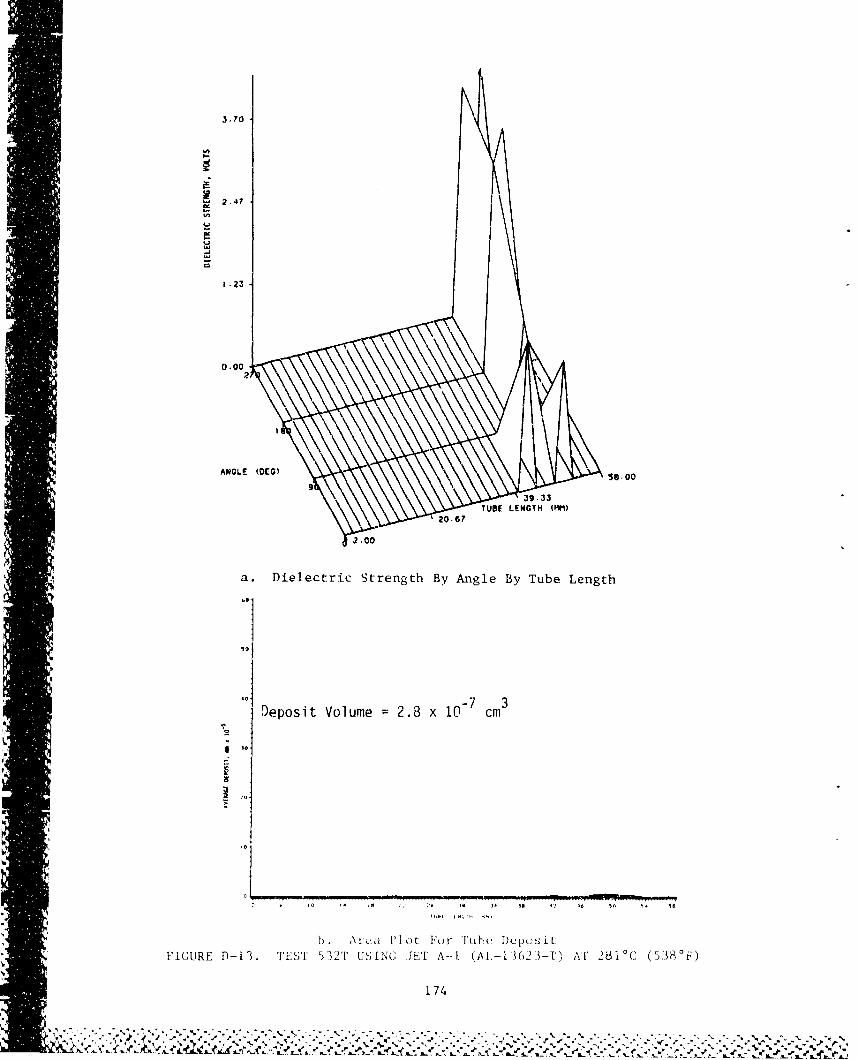
3.70
S2.4?
1 .23
05800
a. Dielectric Strength By Angle By Tube Length
40Deposit Volume 2.8 x 10- cm3
ji 3S
-~~~~~1 i .c Ift4 I 3 S 4 4 o '
b . trc i2 lot' For TuO DcU siFIGURE D-i 3. TE ST 5'32'1, US ING JET A~--I. (Al-i 362 3--TU AT 281 0 c, (5380i.')
174
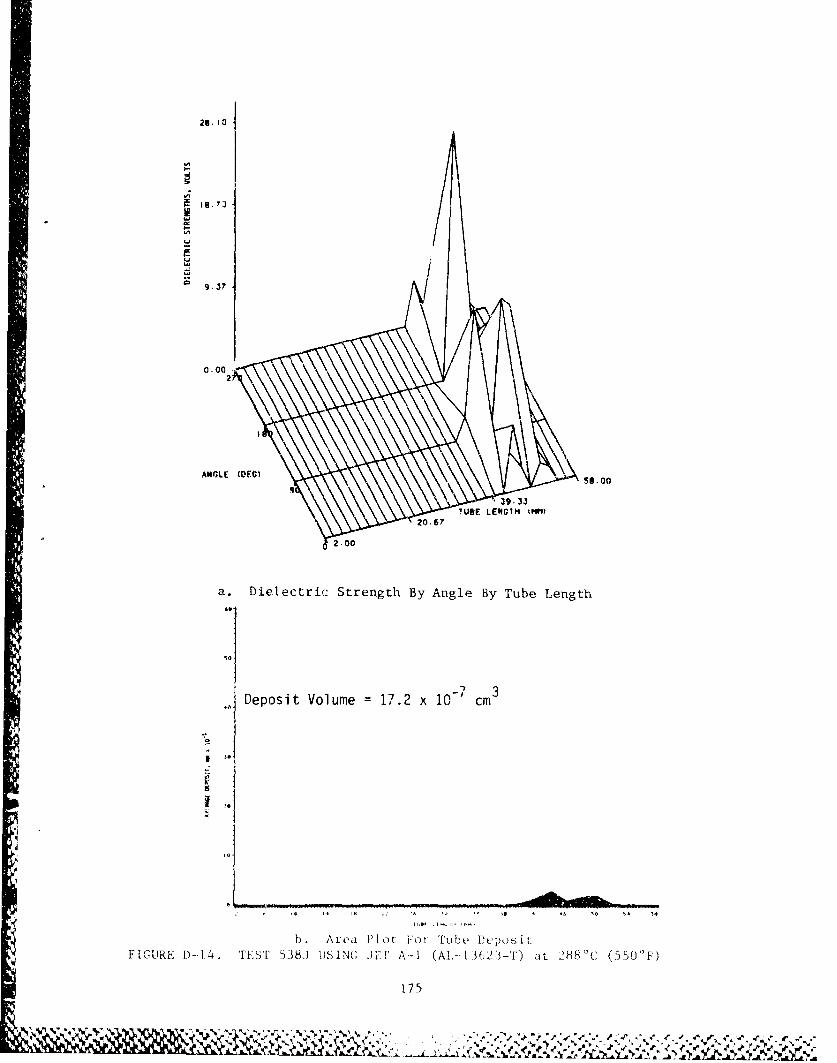
28. 10
S18.73
= 9.3?
056.0
a. Dielectric Strength By Angle By Tube Length2-67
Deposit Volume = 17.2 x 10' cm
I 'i1
bh Area Plot d'or Tube PeposiL-FIGURE D-.14. TEST 538.1 US ING JE F A-1 (A!,- .),2.3-T) ot 288C (550'F)
175
e~ Avr e P
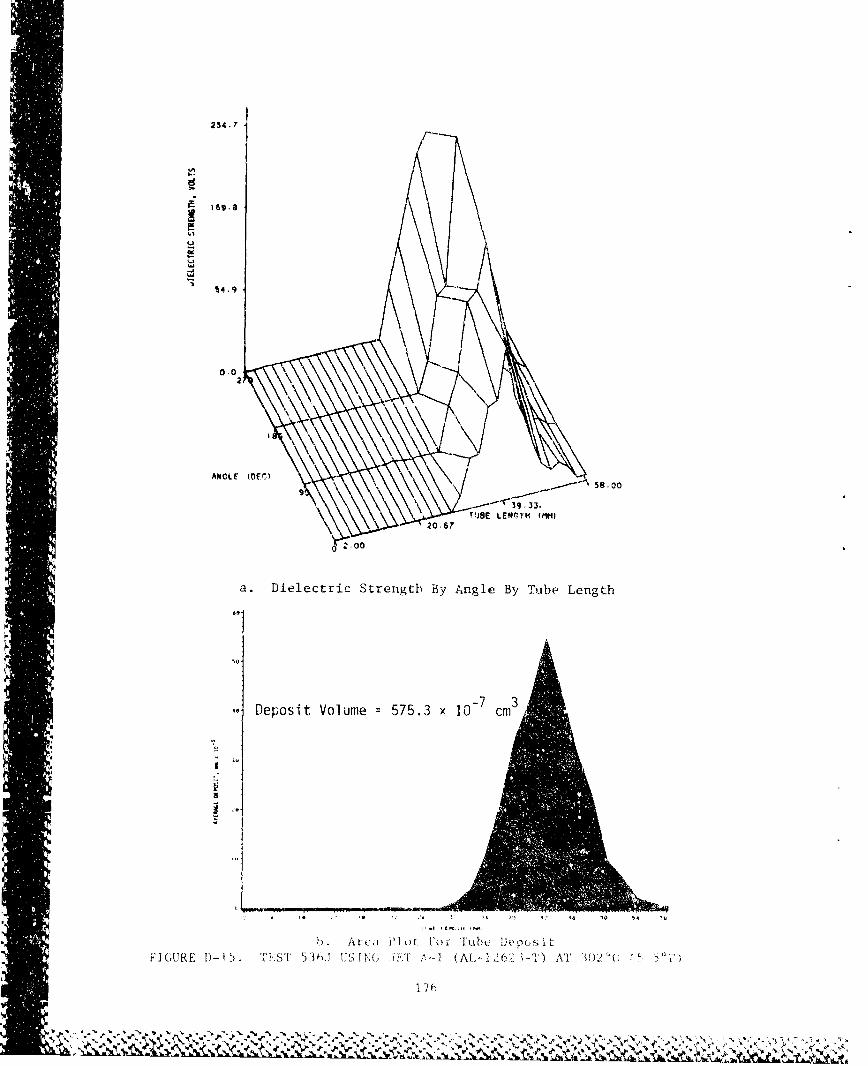
S4.-
UU
"J 4.9
0.02
S~~~ANGLE • (CC.)
•.O
9 TUSE LEW GTM (MM)
S20,62
2.0.0
a. Dielectric Strength By Angle By Tube Length
601
Deposit Volume 575.3 x 10⁻⁷ cm3
b Area i ) ot F k i, luhbe 11"(0 S O tF I ~ U R E I ) - 1 5 . T Fi S T 5 3 h 1, U .; S I N G ( H T V,--A ( A L -i 2 I - T ) A '1 3 0 2-S~1
7
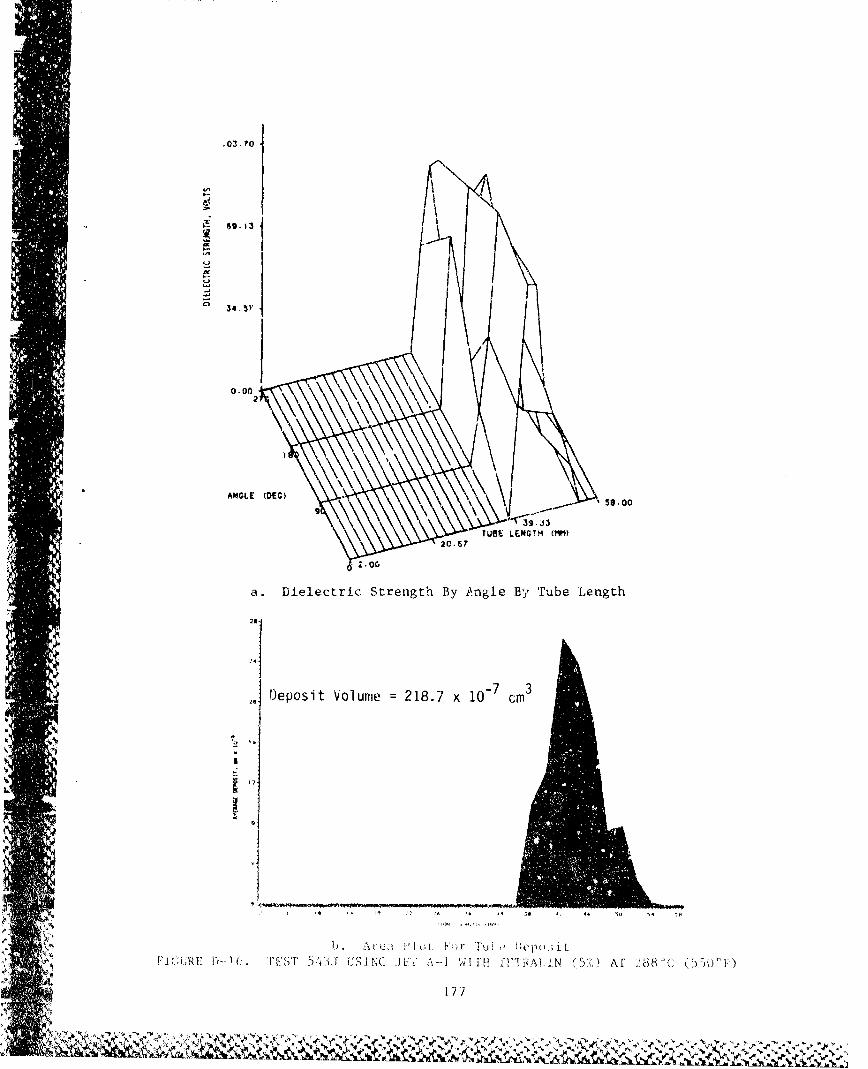
.03. ?0
.- $9.13
34.S
0.00
AN~GLE (DEC) 90
259.0
a. Dielectric Strength By Angle By 'rube Length
20
24
Deposit Volume =218.7 x 10- cm 3
1 4
19' A~-, '9LYU
(9JR -T 41f1 ,NC F I 1R ,fN 5 A 68ýC )ýO F
9.s
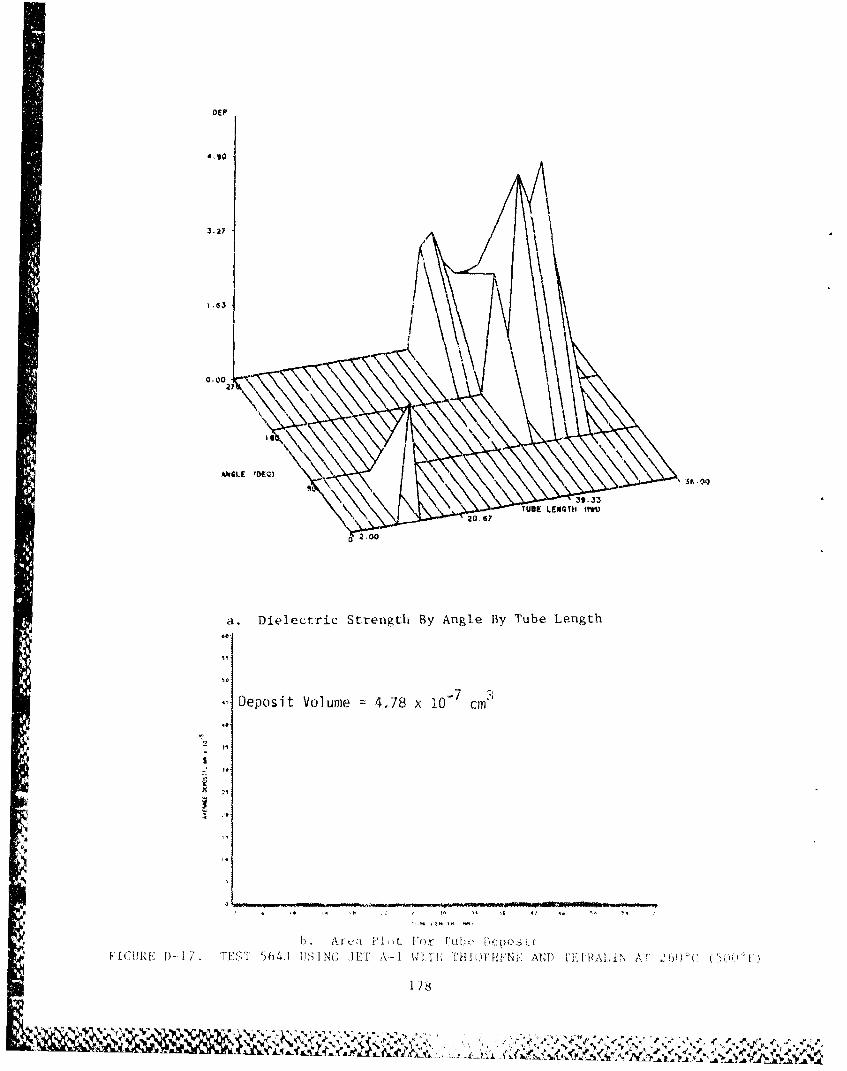
OEP
4.90
3.21
0.00
TUB LENGH Ma 2.00
a. Dielectric Strength By Angle By Tube Length
Deposit Volume 4,78 x 10⁻⁷ cm"'0
, 3*
b. i i i 0 PIt, 1 1* r U'
"FI-_.jCUjRE D- 17 TEST 504,1 l,<iN(, I' A-I WJ•"1 '!'T1IPHA-N AND "iLH.AiN A!' 2 D)C( . :
, 178
0.0
20.
II
I.--
I ANGLE[ (DEG) 52. 00
39.J3
"O LNIrNO• (MM)}0 2.00
a. Dielectric Strength By Angle By Tube Length
Deposit Volume =25.9 X 10 -7C
"U "KE T E 1ý I A i•11 j m ..,
. ,. J ) \ V.N'!I i11I+t\NJN [1 N :*'-I_... G ;+F ) l • , "'•Z • 7 '.. ' " •+L . • , . • t _ : 4 I[}I ' } I. . ...•.'~ •' ; • [ •['':::I ] < ([ ' + " : ( : ,
'2
C 4(t
19/FLL
-II0
27
ANGLE (DEG)
N /.-. g0
TUIE tUNGTH; (MM)' 20 fit
a Aieleczric Strength By Angle By Tube Length
.. I
Deposit Volume 135.8 x 10 Ccm3
F i( tLR(1: --1). TFXI 't: K, KN ; 1) - 1\--9I I1 [i I'li I i'ii.iNE ANI) 1 AIA I N A . ' ''
t 80I
1 127,?0
US
LA
9--
tj
42.57
0.00
ANGLE (DEI)
is 30
2 ~UBE LGT4 C ,Y
0 23
a. Dielectric Strenigth By Angle By Tube Length
Deposit Volume 286.7 x 10 cm3
S,.:
4,
: It"" A-(. I~ r I IJFN F< N 1) 'JFiVRP[ I N I' C , K-
V)
I-.
1-j
C-.
9 56 00
a. Dielectric Strengthi By Angle By Tube Length
51Deo i Volume' 2 .5 94 9
89 2\i ICi C1113 l i'j~
~~.'.¶~~ A~.A r'~~AtR 4. 1t . p - - 4
I- .
I-
- .- APPENDIX E
"t ~STAINLESS STEEL VERSUS ALUMINUM JFTOT DATA
!.4
.4.S
V-• 8
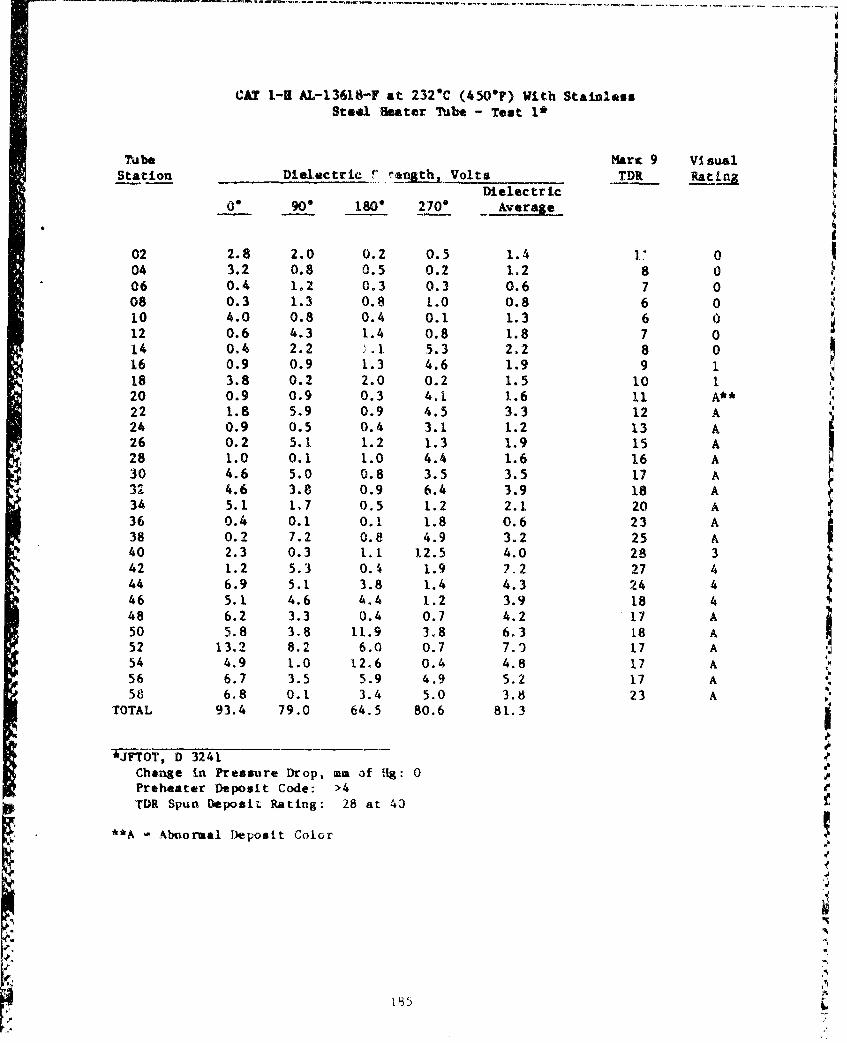
CAT 1-9 AL-13618-F at 232C (450°F) With StainlessSteal Beater Tube - Test 1*
Tube Marc 9 VisualStation Dielectric r ,en• Lhx Volts TDR RatLn&
DielectricS90 180"r 270*
02 2.8 2.0 0.2 0.5 1.4 1. 004 3.2 0.8 0.5 0.2 1.2 8 0C6 0.4 1.2 0.3 0.3 0.6 7 008 0.3 1.3 0.8 1.0 0.8 6 010 4.0 0.8 0.4 0.1 1.3 6 012 0.6 4.3 1.4 0.8 1.8 7 014 0.4 2.2 ý .I 5.3 2.2 8 016 0.9 0.9 1.3 4.6 1.9 9 118 3.8 0.2 2.0 0.2 1.5 10 120 0.9 0.9 0.3 4.1 1.6 11 A**22 1.8 5.9 0.9 4.5 3.3 12 A24 0.9 0.5 0.4 3.1 1.2 13 A26 0.2 5.1 1.2 1.3 1.9 15 A28 1.0 0.1 1.0 4.4 1.6 16 A30 4.6 5.0 0.8 3.5 3.5 17 A
3d4.6 3.8 0.9 6.4 3.9 18 A34 5.1 1.7 0.5 1.2 2.1 20 A36 0.4 0.1 0.1 1.8 0.6 23 A38 0.2 7.2 0.8 4.9 3.2 25 A40 2.3 0.3 ill 12.5 4.0 28 342 1.2 5.3 0.4 1.9 ?.2 27 444 6.9 5.1 3.8 1.4 4.3 24 446 5.1 4.6 4.4 1.2 3.9 18 448 6.2 3.3 0.4 0.7 4.2 17 A50 5.8 3,8 11.9 3.8 6,3 18 A52 13.2 8.2 6.0 0.7 7.1 17 A
54 4.9 1.0 12.6 0.4 4.8 17 A56 6.7 3.5 5.9 4.9 5.2 17 A58 6.8 0.1 3.4 5.0 3.8 23 A
TOTAL 93.4 79.0 64.5 80.6 81.3
Wj-TOT, D 3241Change in Pressure Drop, am of Hg: 0Preheater Deposit Code: >4TDR Spun Deposit Rating: 28 at 40
**A, Abnormal Deposit Color
ft.

CAT 1,-H AL-13618-F at 232%C (450"F) With StainlessSteel Heater Tube - Test 2*
Tube Mark 9 Visual
Station Dielectric Strength, Volts TDR RatingDielectr`ic
00 90_ 1801, 2700 a e
02 0.5 0.6 2.9 1.3 1.3 11 104 0.6 0.1 0.7 1.3 0.7 9 106 0.6 1.1 1.0 0.1 0.7 8 108 0.7 1.4 1.4 0.1 0.9 8 110 4.3 0.3 8.3 1.9 3.7 8 112 1.8 0.1 1.5 0.7 1.0 8 114 1.i 0.1 0.9 2.5 1.2 9 116 2.9 0.M 0.8 1.3 10 118 1.9 4.3 1.6 0.7 2.1 10 A**20 1.6 4.3 1.5 3.6 2.7 12 A22 0.7 2.7 0.6 5.0 2.2 13 A24 1.6 3.7 0.8 0.1 1.5 13 A26 2.5 5.2 4.8 0.4 3.2 15 A28 1.5 5.0 3.2 2.5 3.0 16 A30 3.8 3.1 2.6 4.0 3.4 18 232 1.5 4.0 4.7 2.7 3.2 19 234 0.1 0.7 5.7 1.3 2.0 20 236 4.6 0.5 5.2 5.2 3.9 24 338 7.5 4.3 5.1 5.7 5.7 27 340 0.3 1.7 6.3 5,3 3.4 31 342 0.1 1.7 7.9 1.9 2.9 31 444 5.4 0.5 4.7 4.2 3.7 28 446 6. . 0.5 9.2 4.8 5.2 23 448 3.8 1.7 3.8 5.6 3.7 21 450 4.2 8.2 2.7 4.4 4.9 20 A52 4.6 11.5 2.0 0.8 4.7 21 A54 5.3 13.1 10.6 4.8 8.4 22 k56 8.7 0.3 0.8 4.4 3.5 27 458 5.1 4.4 7.0 4,3 5.2 32 4
TOTAL 83.6 86.0 107.9 80.0 89.3
S*JFTOT D 3241
Change in Pressure Drop, mm of Hg: 0Prehe&ter Deposit Cnde: >4TDIF Spun Deposit Rating: 26 at *•4
**A - Abno'rai Deposit. Co,)or
I •3
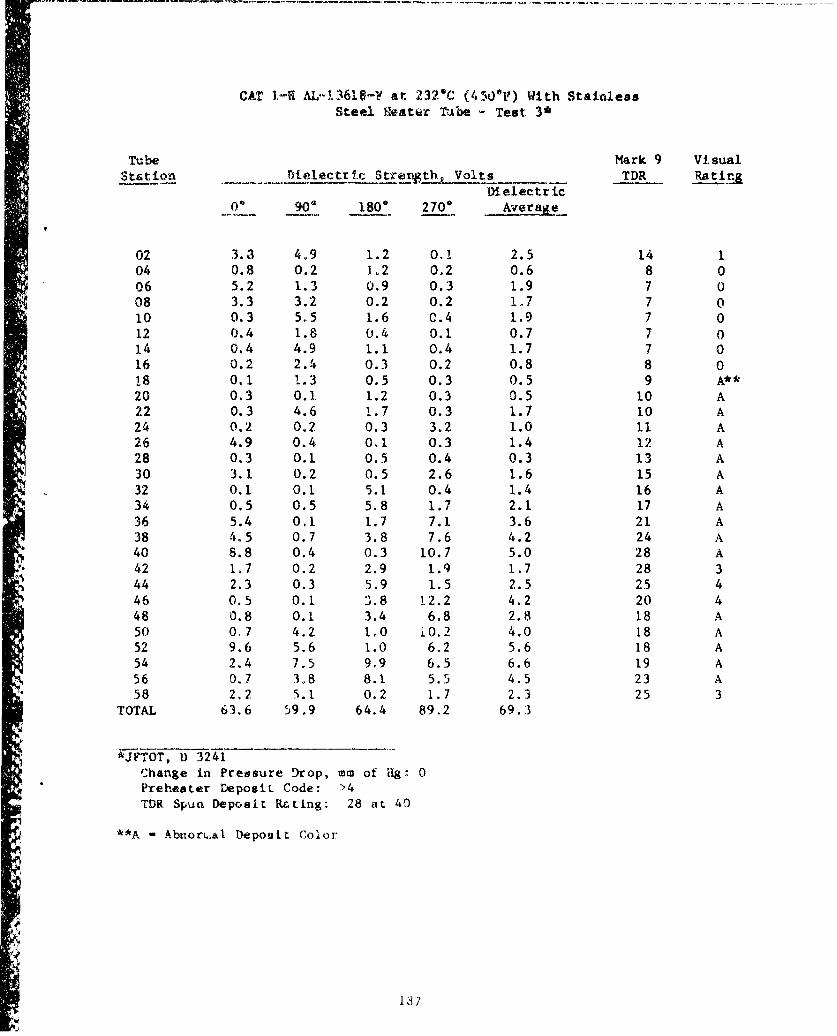
CAT I.-H AL-13618-F at 232% (45O0il) With StainlessSteel fleatwr Thbe - Test 3*
rTube Mark 9 VisualStto ielectrc Stert~th, Volts. TDR Ratirg
Dielectric00 90_ 1800 270* Average
02 3.3 4.9 1.2 0.1 2.5 14 104 0.8 0.2 1.2 0.2 0.6 8 006 5.2 1.3 0.9 0.3 1.9 7 008 3.3 3.2 0.2 0.2 1,.7 7 010 0.3 5,5 1.6 0.4 1.9 7 012 0.4 1.8 0.4 0.1 0.7 7 014 0.4 4.9 1.1 0.4 1.7 7 016 0.2 2.4 0.3 0.2 0.8 8 018 0.1 1.3 0.5 0.3 0.5 9 A**20 0.3 0.1, 1.2 0.3 0.5 10 A22 0.3 4.6 1.7 0.3 1.7 10 A24 0.2 0.2 0.3 3.2 1.0 11 A26 4.9 0.4 01I 0.3 1.4 12 A28 0.3 0.1 0.5 0.4 0.3 13 A30 3.1 0.2 0.5 2.6 1.6 15 A
32 0.1 0.1 5.1 0.4 1.4 16 A34 0.5 0.5 5.8 1.7 2.1 17 A
36 5.4 0.1 1.7 7.1 3.6 21 A38 4.5 0.7 3.8 7.6 4.2 24 A40 8.8 0.4 0.3 10.7 5.0 28 A42 1.7 0.2 2.9 1.9 1.7 28 344 2.3 0.3 5.9 1.5 2.5 25 446 0.5 0.1 .8 12.2 4.2 20 448 0.8 0.1 3.4 6.8 2.8 18 A50 0,7 4.2 1.0 i0.2 4.0 18 A52 9.6 5.6 1.0 6.2 5.6 18 A54 2.4 7.5 9.9 6.5 6.6 19 A
56 0.7 3ý8 8.1 5.5 4.5 23 A58 2.2 5.1 0.2 1.7 2.3 25 3
TOTAL 63.6 59.9 64.4 89.2 69.3
*JFTOT, D 3241
Change in Pressure Drop, mm of Hg: 0Preheater Deposit Code: >4TDR Spun Deposit RMting: 28 at 40
1
**A - Abnor aI Depostt Color
1J7
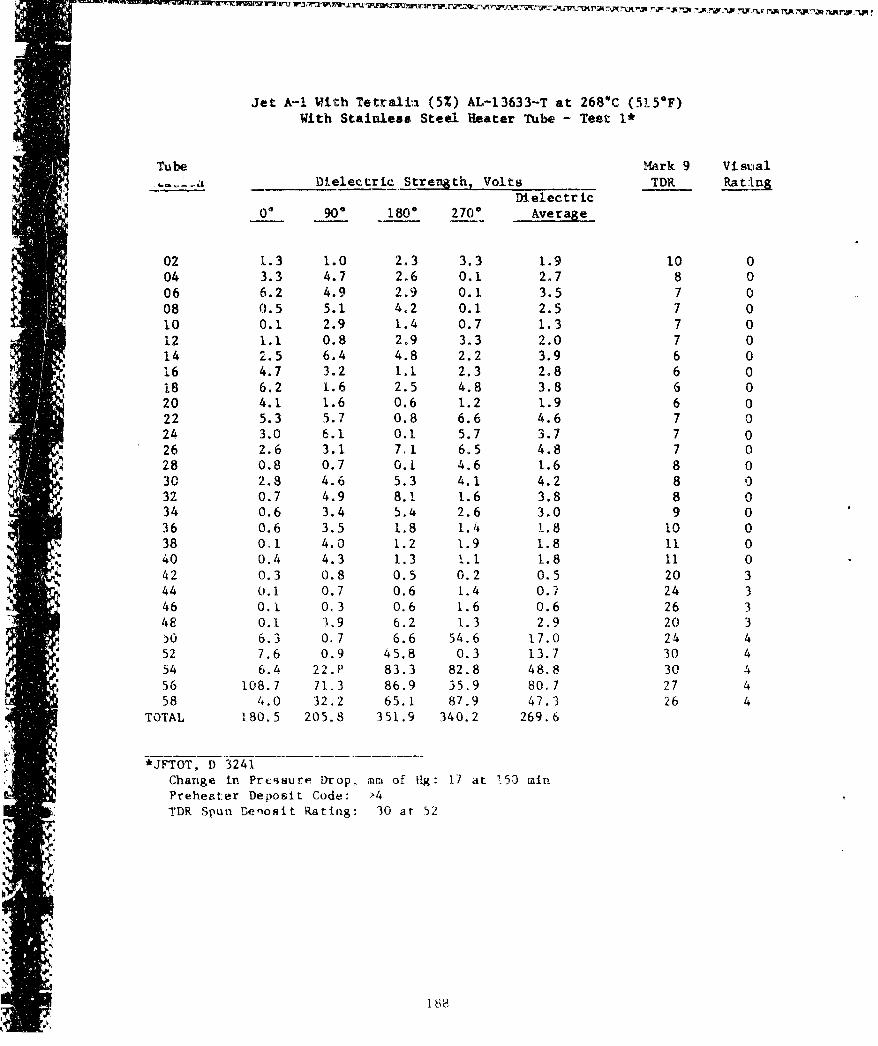
Jet A-1 With Tetralla (5%) AL--13633-T at 268% (5150F)With Stainless Steel Heater Tube - Test 1*
Tube Mark 9 Vi smal._,,__ Dielectric Strength, Volts TDR Ra t~lng
Dielectric00 900 1800 270* Average
02 1.3 1.0 2.3 3.3 1.9 10 004 3.3 4.7 2.6 0.1 2.7 8 0
06 6.2 4.9 2.9 0.1 3.5 7 008 0.5 5.1 4.2 0.1 2.5 7 010 0.1 2.9 1.4 0.7 1.3 7 012 1.1 0.8 2.9 3.3 2.0 7 014 2.5 6.4 4.8 2.2 3.9 6 016 4.7 3.2 1.1 2.3 2.8 6 018 6.2 1.6 2.5 4.8 3.8 6 020 4.1 1.6 0.6 1.2 1.9 6 022 5.3 5.7 0.8 6.6 4.6 7 024 3.0 6.1 0.1 5.7 3.7 7 026 2.6 3.1 7,1 6.5 4.8 7 028 0.8 0.7 0.1 4.6 1.6 8 030 2.8 4.6 5.3 4.1 4.2 8 032 0.7 4.9 8.1 1.6 3.8 8 034 0.6 3.4 5.4 2.6 3.0 9 036 0.6 3.5 1.8 1.4 1.8 10 038 01i 4.0 1.2 1.9 1.8 11 040 0.4 4.3 1.3 [. 1.8 11 042 0.3 0.8 0.5 0.2 0.5 20 344 0.1 0.7 0.6 [.4 0.? 24 346 0.1 0.1 0.6 1.6 0.6 26 348 0.1 3.9 6.2 1.3 2.9 20 3j0 6.3 0M7 6.6 54.6 17.0 24 452 7.6 0.9 45.8 0.3 13.7 30 454 6.4 22.P 83.3 82.8 48.8 30 456 108.7 71.3 86.9 35.9 80.7 27 458 4.0 32.2 65.1 87.9 47.3 26 4
TOTAL 180.5 205.8 351.9 340.2 269.6
*JFTOT, D 3241Change in Preisure Drop, mm of Hg: 17 at '.0 min
Preheater Deposit Code: >4TDR Spun Seoosit Rating: 30 at 52
1 88
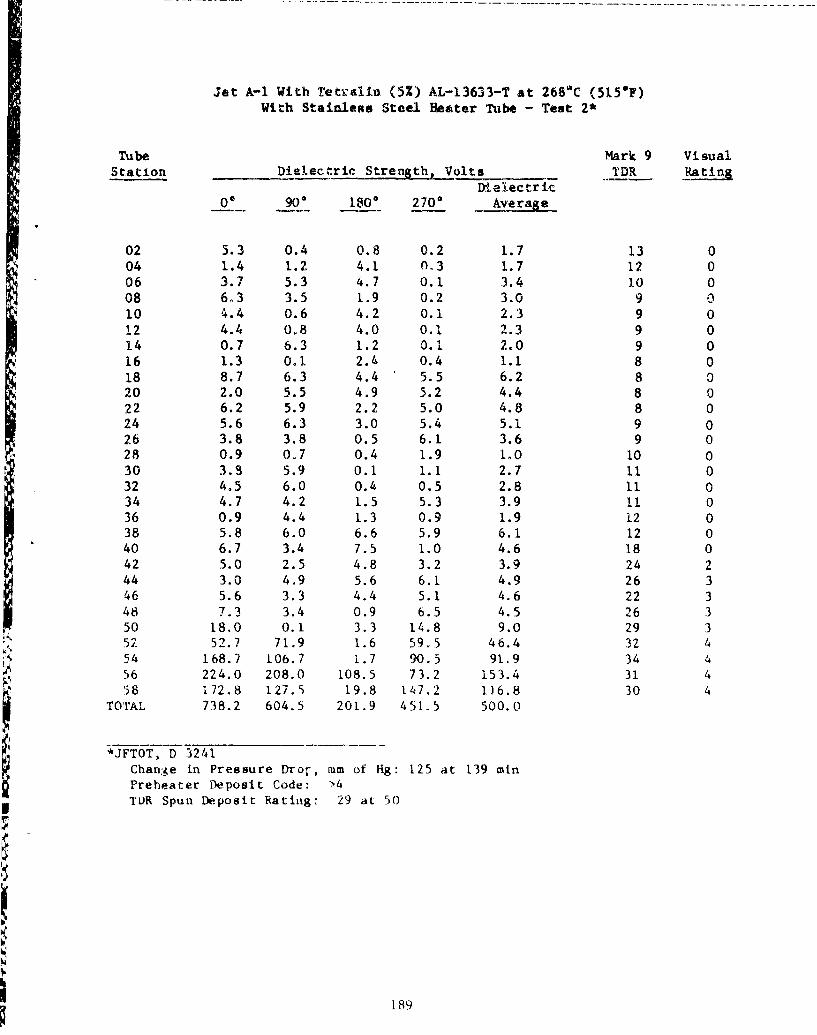
Jet A-i With Tetralin (5%) AL-13633-T at 268%C (5150F)With Stainless Steel Heater Tube - Test 2*
Tube Mark 9 VisualStation Dielectric Strength, Volts _ _TDR Rating
Dielectric0 900 1806 2700 Average
02 5.3 0.4 0.8 0.2 1.7 13 004 1.4 1.2 4.1 n.3 1.7 12 006 3.7 5.3 4.7 0.1 3.4 10 008 6A3 3.5 1.9 0.2 3.0 9 010 4.4 0.6 4.2 0.1 2.3 9 012 4.4 0.8 4.0 0.1 2.3 9 014 0.7 6.3 1.2 0.1 2.0 9 016 1.3 0.1I 2.4 0.4 1.1 8 018 8.7 6.3 4.4 5.5 6.2 8 020 2.0 5.5 4.9 5.2 4.4 8 022 6.2 5.9 2.2 5.0 4.8 8 024 5.6 6.3 3.0 5.4 5.1 9 026 3.8 3.8 0.5 6.1 3.6 9 028 0.9 0M7 0.4 1.9 1.0 10 030 3.9 5.9 0.1 1.1 2.7 11 032 4.5 6.0 0.4 0.5 2.8 11 034 4.7 4.2 1.5 5.3 3.9 11 036 0.9 4.4 1.3 0.9 1.9 12 038 5.8 6.0 6.6 5.9 6.1 12 040 6.7 3.4 7.5 1.0 4.6 18 042 5.0 2.5 4.8 3.2 3.9 24 244 3.0 4.9 5.6 6.1 4.9 26 346 5.6 3.3 4.4 5.1 4.6 22 348 7.3 3.4 0.9 6.5 4.5 26 350 18.0 0.1 3.3 1.4.8 9.0 29 352 52.7 71.9 1.6 59.5 46.4 32 454 168.7 106.7 1.7 90.5 91.9 34 456 224.0 208.0 108.5 73.2 153.4 31 458 172.8 127.5 19.8 147.2 116.8 30 4
TOTAL 738.2 604.5 201.9 451.5 500.0
*JFTOT, D 3241
Chan:ge in Pressure Dro-, mm of Hg: 125 at 139 mInPreheater Deposit Code: >4TOR Spun Deposit Rating: 29 at 50
9
189
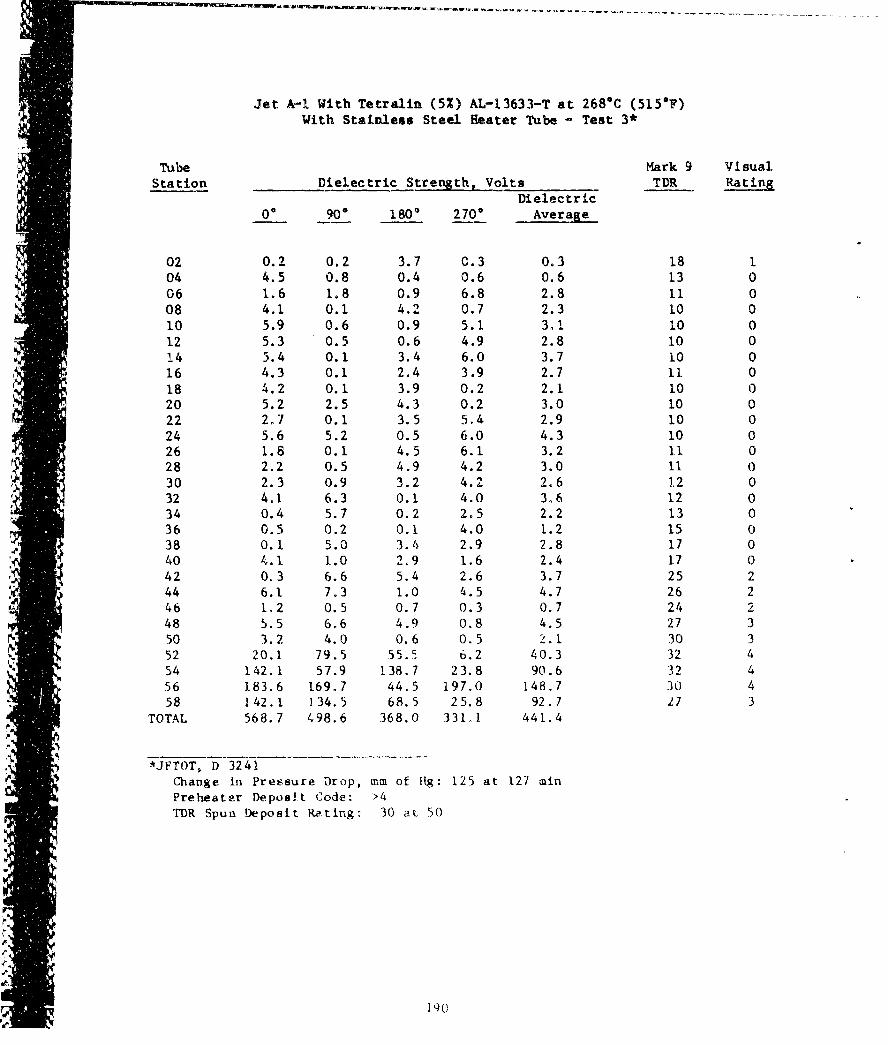
Jet A-I With Tetralin (5%) AL-13633-T at 2680C (5150F)With Stainless Steel Heater Tube - Test 3*
Tube Mark 9 VisualStation Dielectric Strength, Volts TDR Rating
Dielectric0' 900 1800 270' Average
02 0.2 0.2 3.7 0.3 0.3 18 104 4.5 0.8 0.4 0.6 0.6 13 006 1.6 1.8 0.9 6.8 2.8 11 008 4.1 0.1 4.2 0.7 2.3 10 010 5.9 0.6 0.9 5.1 3.1 10 012 5.3 0.5 0.6 4.9 2.8 10 014 5.4 0.1 3.4 6.0 3.7 10 016 4,3 0.1 2.4 3.9 2.7 11 018 4.2 0.1 3.9 0.2 2.1 10 020 5.2 2.5 4.3 0.2 3.0 10 022 2L7 0.1 3.5 5.4 2.9 10 024 5.6 5.2 0.5 6.0 4.3 10 026 1.8 0.1 4.5 6.1 3.2 11 028 2.2 0.5 4.9 4.2 3.0 11 030 2.3 0.9 3.2 4. 2 2.6 1.2 032 4.1 6.3 0.1 4.0 3,.6 12 034 0.4 5.7 0.2 2.5 2.2 13 036 0.5 0.2 0.1 4.0 1.2 15 038 0.1. 5.0 3.4 2.9 2.8 17 040 4.1 1.0 2.9 1.6 2.4 17 042 0.3 6.6 5.4 2.6 3.7 25 244 6.1 7.3 1.0 4.5 4.7 26 246 1.2 0.5 0.7 0.3 0.7 24 248 5.5 6.6 4.9 0.8 4.5 27 3"50 3.2 4.0 0.6 0.5 2.1 30 352 20.1 79.5 55.5 6.2 40.3 32 454 142.1 57.9 138.7 23.8 90.6 32 456 183.6 169.7 44.5 197.0 148.7 30 458 142.1 134.5 68.5 25.8 92.7 27 3
TOTAL 568.7 498.6 368.0 331,1 441.4
*JFTOT, D 3241
Change in Pressure Drop, mm of Hg: 125 at 127 rminPreheater Deposit Code: >4TDR Spun Deposit Retlng: 30 at 50
190

Jet A-I With Thiophene and Tetralin &L-13636-T at 281*C (538 6F)With S•ainless Steel Heater Tbe- Teit' 1*
Tube Mark 9 VisualStation Dielectric StretitŽj ,olt s TDR Ra lqn
Di-lectric00 90E) 1800 270 A,0a
02 1.4 1.4 0.5 0.8 1.0 17 204 3.6 0.4 1.5 0.6 t.5 1-6 206 2.7 0.4 1.9 1.5 1.6 14 208 3.6 0.6 4.8 2.7 2.9 13 210 5.0 0.4 1.1 2.4 2.2 13 212 1.7 0.5 1L8 0.5 1.1 13 214 3.6 0.1 5.1 0.3 2.3 14 216 5.1 0.3 4.5 0.4 2.6 15 218 4.5 1.0 6.9 0o3 3,1 15 220 5.5 3.2 4.3 0.1 3.3 16 222 6.1 0.4 4.4 0.1 2.7 1.8 224 5.0 0.8 4.1 0.1 2.5 19 226 2.1 0.6 5.3 4.7 3.2 27 228 5.9 0.3 4.8 2.8 3.4 26 330 5.7 0.9 0.9 1.8 2.3 20 332 7.8 1.1 4i5 3.1 4.1I 21 334 23.0 1.1 13.5 2.3 10.0 25 336 74.7 3.7 85.7 1.7 41.5 28 338 71.5 6.8 125.7 2.2 52.3 3i >340 178.3 8.9 150.7 2.0 85.0 35 >3
4 42 267.0 170.6 278.0 93.3 202.2 40 1444 378.0 310.0 374.0 245.0 326.8 42 >446 443.0 434.0 448.0 382.0 426.8 49 >448 559.0 524.0 540.0 412.0 508.8 50 >450 539.0 616.0 581.0 560.0 574.0 5.0 >452 630.0 687.0 651o0 62L.0 647.3 50 >454 b73.0 945.0 785.0 662.0 766.3 50 >456 755.0 947,0 731,0 737.0 792.5 50 >458 708.0 867.0 8116.0 944.0 833.P 50 >4
TOTAL 5369.0 5533.0 5636.0 4687.0 5307.C
* *JFTOT, D 3241
Change in Pressure Drop,1 mm of Hg: 125 at 94 winPreheater Deposit Code: >4TDR Spun Deposit Rating: 50 at 4R
1
a 191
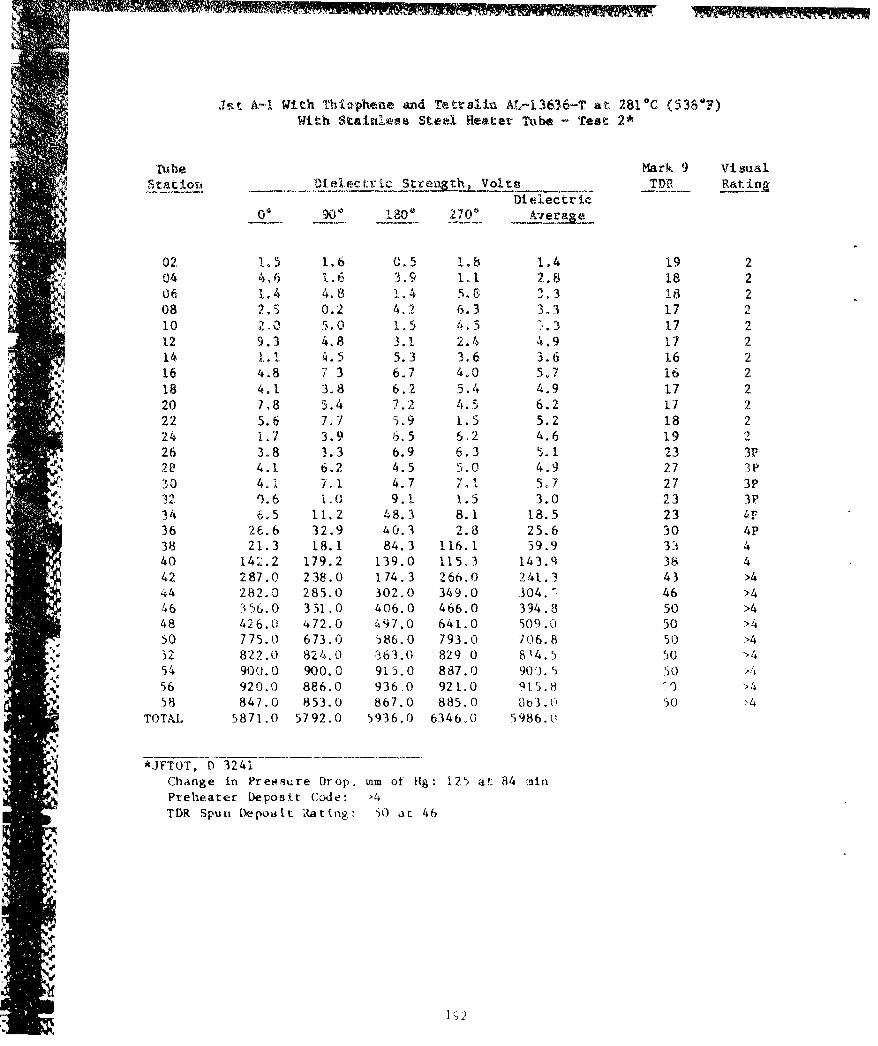
Jt A-1 With Thiophene and Tetrsliu A.-13636-T at 281C (536"F)With Stainless Steel Heater Tube - Test 2*
"rube Mark 9 VisualStation vos thRaVolRt in
Dielectric06 9010 80 210~ A-1r
02 1.5 1.6 0.5 1.8 1.4 19 204 4,6 . 16 3.9 1.1 2.8 18 206 1,4 4,8 1.4 5, 33 18 208 2,5 0.2 4.2 6.3 3.3 17 210 'Z -0 5.,0 1o5 4.5 3.3 17 2
12 9.3 4.8 3.1. 2.4 4.9 17 214 1. 1 4. 5 5.3 3.6 3.6 16 216 4.8 7.3 6.7 4.0 5,7 16 218 4.1 3.8 6.2 5.4 4.9 17 220 7,8 5.4 7.2 4.5 6.2 17 222 5.6 7.7 5.9 1.5 5.2 18 224 1.7 3.9 6.5 6ý2 4.6 19 226 3.8 3.3 6.9 6.3 5.1 23 3P2P 4.1 6.2 4.5 55.0 4.9 27 3P30 4.1 7.1 4.7 7.,1 5,7 27 3P
32 .6 1.0 9i 1.5 3.0 23 3P34 6.5 11.2 48.3 8.1 18.5 2336 26.6 32.9 40.3 2.8 25.6 30 4P38 21.3 18.1 84.3 116.1 39.9 33 440 142.2 179.2 139.0 115,3 143.9 38 442 287.0 238.0 174.3 266.0 241.3 43 >444 282.0 285.0 302.0 349.0 304. " 46 >446 3 56.0 351.0 406.0 466.0 394.8 50 >448 426.0 472.0 497.0 641.0 509.0 50 >450 775.0 673.0 586.0 793.0 706.8 50 >432 822.0 824.0 i63.0 829.0 814.5 50 '454 900.0 900.0 915.0 887.0 900. 5 50 >456 920.0 8E6.0 936.0 921.0 915.8 '0 >4
V 58 847.0 853.0 867.0 885.0 803.0 50 '4TOTAL 5871.0 5792.0 5936.0 6346.0 5986.0
*JFTOT, 0 3241Change in Preesure Drop, mm of Hg: 125 at 84 min
N Preheater Deposit Cade: >4TDR Spun Depokit 1tating: 50 at 46
"'Sc,
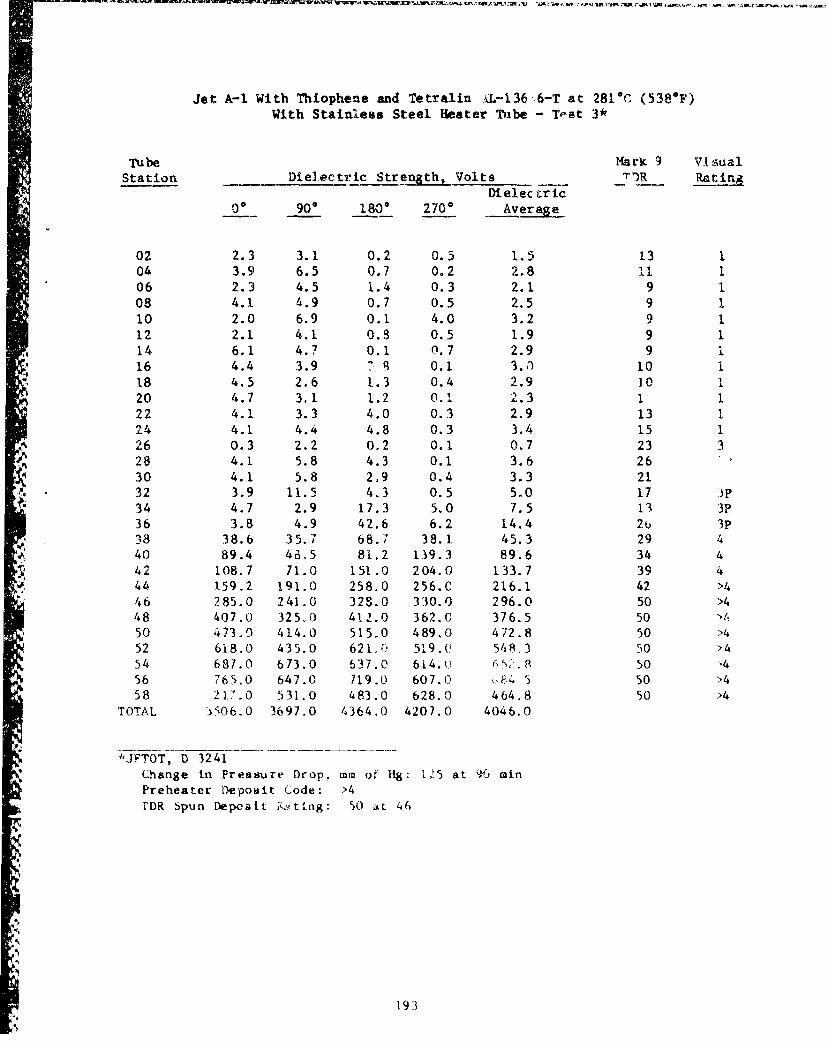
Jet A-i With Thiophene and Tetralin £L-136`6-T at 281°C (538"F)With Stainless Steel Heater Tube - Test 3*
Tube Mark 9 VA sualStation Die]ectric Strength, Volts TDR Rating
Dielec aTLEo 0 90o 1800 270o AvtEae_
02 2.3 3.1 0.2 0.5 1.5 13 104 3.9 6.5 0.7 0.2 2.8 11 1
06 2.3 4.5 1.4 0.3 2.1 9 108 4.1 4.9 0.7 0.5 2.5 9 110 2.0 6.9 0.1 4.0 3.2 9 i12 2.1 4.1 0.8 0.5 1.9 9 1
14 6.1 4.7 0.1 0.7 2.9 9 i16 4.4 3.9 7 8 0.1 3.0 10 118 4.5 2.6 1.3 0.4 2.9 10 120 4.7 3,1 1.2 0.1 -2.3 1 122 4.1 3.3 4.0 0.3 2.9 13 124 4.1 4.. 4.8 0.3 3.4 15 126 0.3 2.2 0.2 0.1 0.7 23 3
"" 28 4.1 5.8 4.3 0.1 3.6 26
30 4.1 5.8 2.9 0.4 3.3 21- 32 3.9 11.5 4.3 0.5 5.0 17 ip
34 4.7 2.9 17.3 5,0 7.5 13 3P
36 3.8 4.9 42.6 6.2 14.4 2t, 3P38 38.6 35.7 68.7 38.1 45.3 29 440 89.4 46,5 81.2 139.3 89.6 34 442 108.7 71.0 151.0 204.0 133.7 39 444 159.2 191.0 258.0 256.C 216.1 42 >44 46 285.0 241.0 323.0 330.0 296.0 50 >448 407.0 325,0 41.2.0 362.0 376.5 50 '>1
50 473.0 414.0 515.0 489.0 472.8 50 >452 618.0 435.0 621, 519.0 548.3 50 >454 687.0 673.0 637.0 614. o R 50 '456 765,0 647.0 719.0 607.0 4 5 50 >458 21.7.0 531.0 483.0 628.0 464A8 50 >4
TOTAL )506.0 3697.0 4364.0 4207.0 4046.0
'JFTOT, D 3241Change in Pressure Drop. mm of Hg: 125 at '0 minPreheater Oeposit Code: >4
rDR Spun Deposit i*4tlng: 50 at 46
193
!V
APPE'DIX F
JFTOT DATA COMPARkING ADDITIVE EFFECTS AND FLOW RATES
9
"p.
% %
S..•
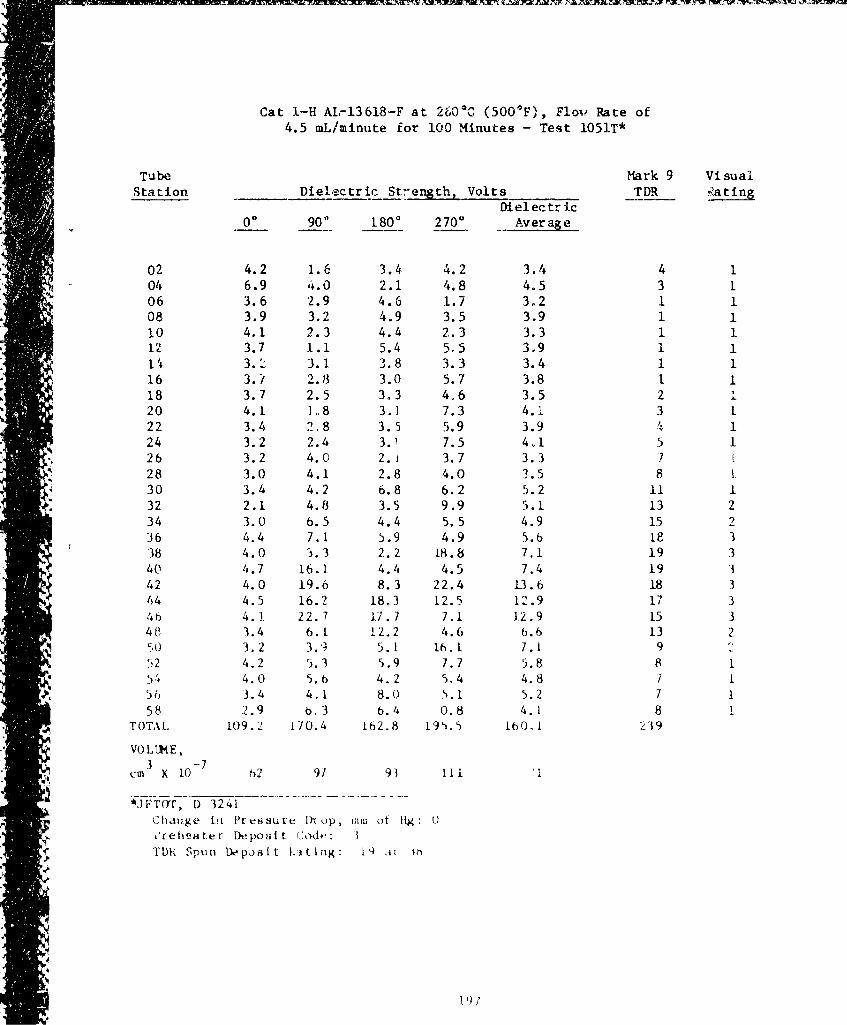
Cat 1-H AL-13618-F at 2600 C (500*F), Flov Rate of4.5 mL/minute for 100 Minutes - Test 1051T*
Tube Mark 9 VisualStation Dielctric StrengthL Volts TDR Rain
Dielectr icS0 90aA 1800 2700 Average
02 4.2 1.6 3.4 4.2 3.4 4 104 6.9 4.0 2.1 4.8 4.5 3 106 3.6 2.9 4.6 1.7 3.2 1 108 3.9 3.2 4.9 3.5 3.9 1 110 4.1 2.3 4.4 2.3 3.3 1 112 3.7 1.1 5.4 5.5 3,9 1 1lI 3. 2 3.1 3.8 3.3 3.4 1 116 3.' 2.3 3.0 5.7 3.8 1 118 3.7 2.5 3.3 4.6 3.5 2 120 4.1 1.8 3.] 7.3 4. 3 i22 3.4 2.8 3.5 5.9 3.9 4 124 3.2 2.4 3.1 7.5 4A1 5 1
*26 3.2 4.0 2. 1 3.7 3.3 728 3.0 4.1 2.8 4.0 3.5 8 130 3.4 4.2 6.8 6.2 5.2 11132 2.1 4.8 3.5 9.9 5. 1 13 234 3.0 6.5 4.4 5.5 4.9 15 216 4.4 7.1. 5.9 4.9 5. b 18 338 4.0 3.3 2. 2 L8.8 7.1 19 340 4.7 16.1 4.4 4.5 7.4 1.9 34 42 4.0 19.6 8. 3 22.4 13.6 18 344 4.5 16.2 18.3 12.5 12.9 17 3S46 4.). 22.7 17.7 7.1 1.2.9 15 346 3.4 6.1 12.2 4.6 6.6 13 2(:.0 3.2 3.9 5.1 16.1 7. 1 952 4.2 5.3 5.9 7.7 5.8 8 15.4 4.0 5.6 4. 2 5.4 4.8 7 15 56 3.4 4.1 8.0 5.1 5.2 7 158 2.9 6. 3 6.4 0.8 4.1 8 1
TOTAL 109.2 1.70.4 162.8 195.5 160..1 239
VO LL E,
cm x 10.7 62 91 91 11 i 11
*JF~yr 1)32417
Sciaftge in FPressure Dxop, mn of Il U:• t'~reheat~er Deposi;t ,'d -3
TD T I) "11 Spun Dposit KLlting: 1,4 it in•
1 9 7
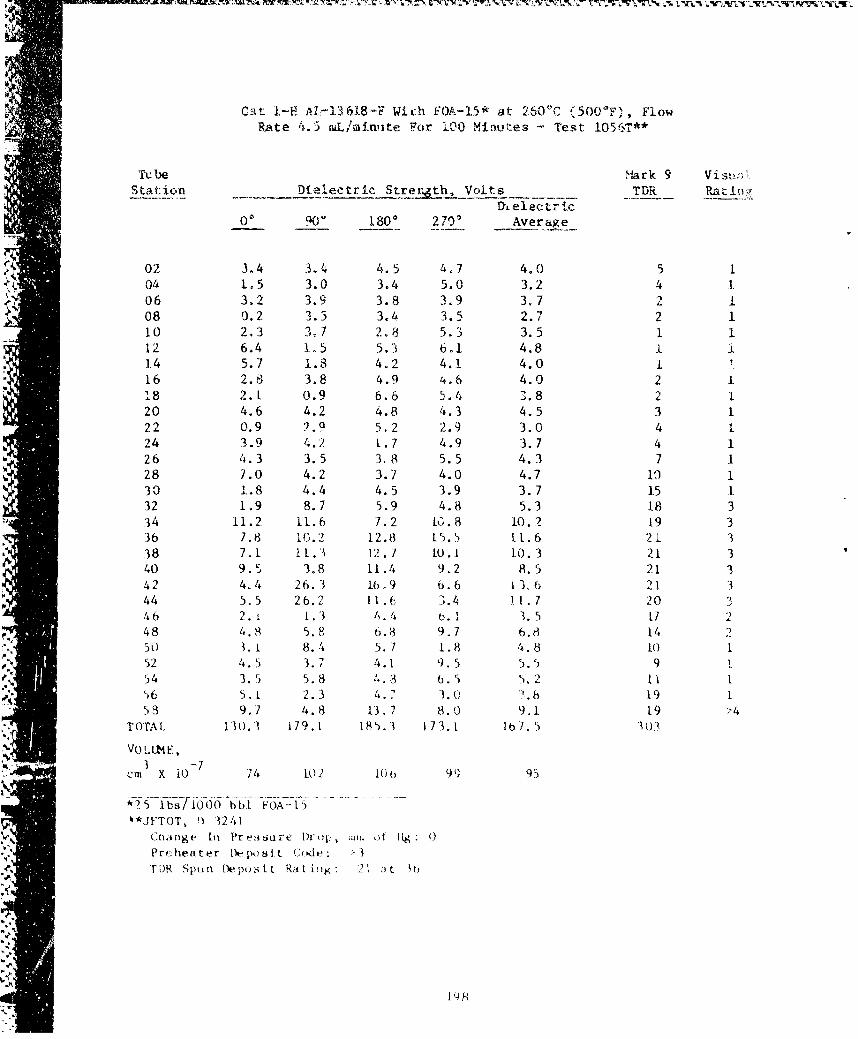
WCat I-H A.-13618-F Wich FOA-15* al. 260"'C '500"F), FlowRate 4.5 ruL/minute For 100 Minlutes - Test 105ŽT**
IV be Mark 9 Visu.Station Dielectric Strerth_, Vol ts TDR Rat•_i
D'electr ic
0• 90• 180" 270' Average
02 3.4 3.4 4.5 4.7 4.0 5 104 1,5 3.0 3.4 5.0 3.2 4 106 3.2 3.9 3.8 3.9 3.7 2 108 0.2 3.5 3.4 3.5 2.7 2 110 2.3 3,7 2,8 5.3 3.5 1 112 6.4 1,5 5.3 6.1. 4.8 1 i1.4 5.7 1.8 4.2 4.1. 4.0 i16 2.8 3.8 4.9 4.6 4.0 2 118 2.1 0.9 6.6 5.4 3.8 2 120 4.6 4.2 4.8 4.3 4.5 3 122 0.9 ?.9 5.2 2.9 3.0 424 3.9 4.2 1.7 4.9 3.7 4 126 4.3 3.5 3. 8 5.5 4.3 7 128 7.0 4.2 3.7 4.0 4.7 10 130 1.8 4.4 4.5 3.9 3.7 15 132 1,9 8.7 5.9 4.8 5.3 18 334 11.2 11.6 7.2 i). 8 10.2 1-9 336 7.8 10.2 12.8 15.5 L[.6 21 338 7.1 11. 1-2.7 LO.1 1.0. 3 21 340 9. 3.8 11.4 9.2 8. 5 21 342 4.4 26.3 1).9 6.6 13.6 21 344 5.5 26.2 11.61 3.4 ! 1.7 2046 2.1 [.3 4.4 t. 1 3.5 17 248 4.8 5.8 8.8 9.7 6.8 14 250 . 1 8.4 5.7 1.8 4.8 10 152 4.5 3.7 4.1 9.5 5.5 9 1
54 3.5 5.8 4. 3 6.5 5.2 11 156 5.1 2.3 4.. 3.0 4.b 19 153 9.7 4.8 13.7 8.1) 9.1 19
TOTAL. 130.3 179.1 185.3 L73.1 I)7. 5 130
VO LUM E,3
x /l) 14 LO2 10( 99 95
*,- - fb -i$d b.bl F.A- 15i*JFTOT, 3241
Criange in Presisurc Drop, of 1t.Preheater DepcsOt (code: IFtR SpunI iDe)Sitt Rat in: 21 at lu
I II•I193
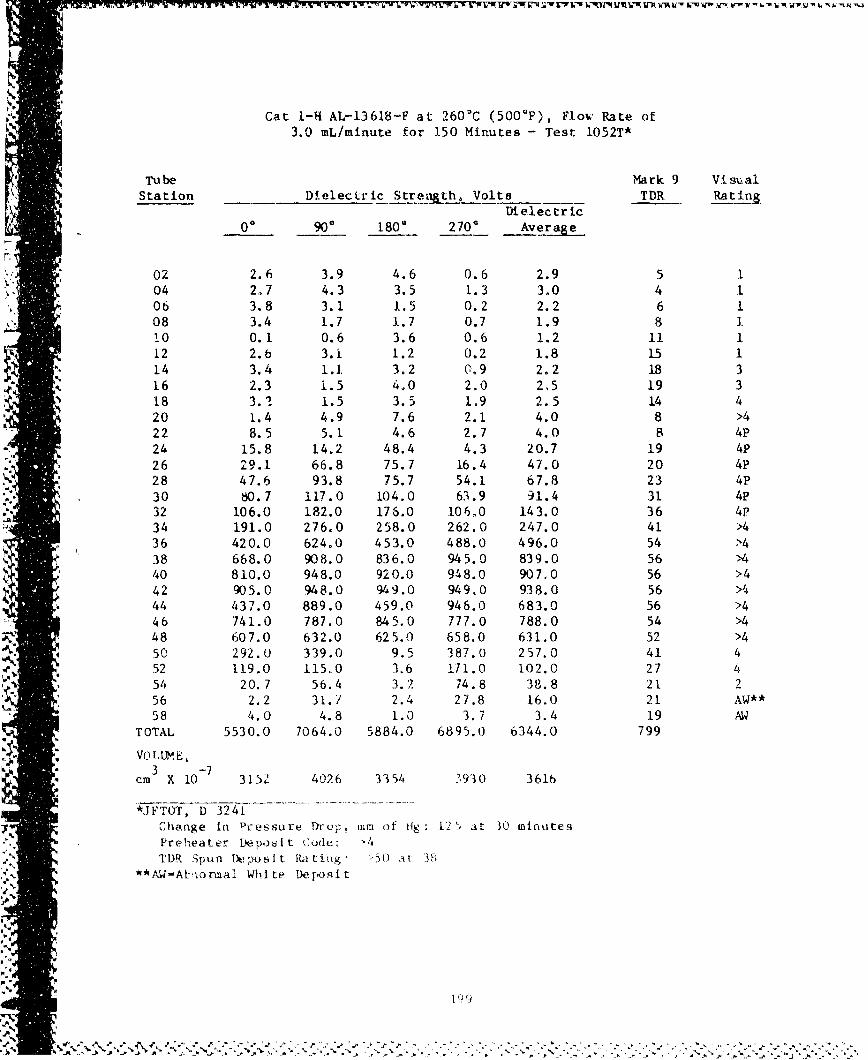
Cat I-H AL-13618-F at 260C (500"F), Flow Rate of3.0 mL/minute for 150 Minutes - Test 1052T*
Tube Mark 9 VisualStation Dielectric Stre th Volts TDR Rat ing.
Dielectric0* 90* 1800 270* Average
02 2.6 3.9 4.6 0.6 2.9 5 104 2.7 4.3 3.5 1.3 30 4 106 3.8 3.1 1.5 0.2 2.2 6 108 3.4 1.7 1.7 0.7 1.9 8 1!0 0.1 0.6 3.6 0.6 1.2 11 112 2.b 3.1 1.2 0.2 1.8 15 114 3.4 1.1. 3.2 0.9 2.2 18 316 2.3 1.5 4,0 2.0 2.5 19 318 3. , 1.5 3.5 1.9 2.5 14 4
S20 1.4 4.9 7.6 2.1 4.0 8 >422 8.5 5.1 4.6 2.7 4.0 8 4P24 15.8 14.2 48.4 4.3 20.7 19 4P"26 29.1 66.8 75.7 16.4 47.0 20 4P28 47.6 93.8 75.7 54.1 67.8 23 4P"30 80.7 117.0 104.0 63.9 91.4 31 4P32 106.0 182.0 176.0 106,0 143.0 36 4p34 191.0 276.0 258.0 262.0 247.0 41 >436 420.0 624.0 453.0 488.0 496.0 54 >438 668.0 908.0 836.0 945.0 839.0 56 >440 810.0 948.0 920.0 948.0 907,0 56 >442 905.0 948.0 9/49.0 949,0 938.0 56 >4
44 437.0 889.0 459.0 946.0 683.0 56 >446 741.0 787.0 845.0 777.0 788.0 54 >448 607.0 632.0 625.0 658.0 631.0 52 >450 292.0 339.0 9.5 387.0 257.0 41 452 1.19.0 115.0 3,6 17/.0 102.0 27 454 20.7 56.4 3.2 74.8 38.8 21 256 2.2 31./ 2.4 27.8 16.0 21 AW**58 4.0 4.8 1.0 3.7 3.4 19 AW
TOTAL 5530.0 7064.0 5884.0 6895.0 6344.0 799
VOI.UME,3
cm X 10 3152 4026 3354 3930 3616
*JF T OT, D 3241
Change in Pressure Drop, inm of dg I2'" at 30 mnlnutesPreheater Deposlt Code: >4TDIR Spun [)epsilt Ra•tig: >W5 al, Oh
**Aid-Atkonual White Deposit
11.?
% ~
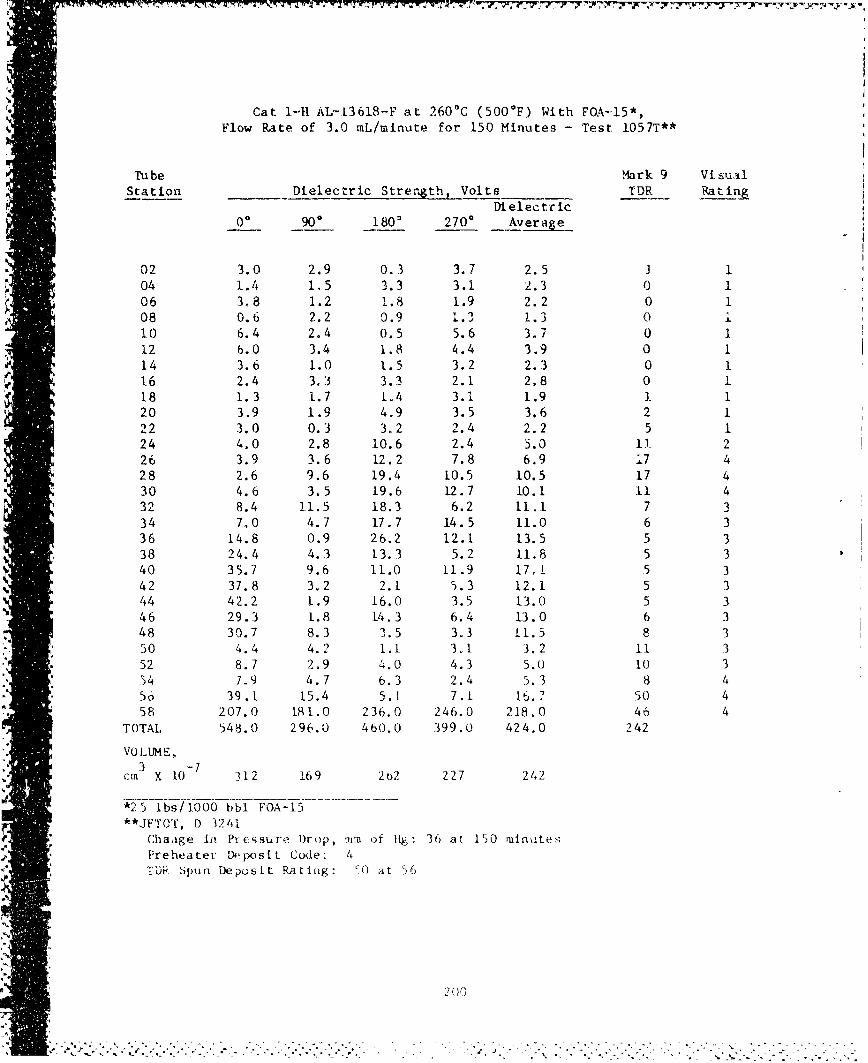
Cat 1-H AL-L3618-F at 2600 C (500 0 F) With FOA.--15*,Flow Rate of 3.0 mL/minute for 150 Minutes - Test 1057T**
Tube Mark 9 VisualStation Dielectric Strength, Volts---__ TDR Rat in•
Dielectric00 900 1803 270' Average
02 3.0 2.9 0.3 3.7 2.5 1 1
04 1.4 1.5 3.3 3.1 2.3 0 106 3.8 1.2 1.8 1.9 2.2 0 108 0.6 2.2 0.9 1.3 1.3 0 i10 6.4 2.4 0.5 5.6 3.7 0 112 6.0 3.4 1.8 4.4 3.9 0 114 3.6 1.0 1.5 3.2 2.3 0 116 2°4 3.3 3.3 2.1 2.8 0 i18 1.3 1.7 1.4 3.1 1.9 1 120 3.9 1.9 4.9 3.5 3.6 2 1
22 3.0 0.3 3.2 2.4 2.2 5 124 4.0 2.8 10.6 2.4 5.0 1] 226 3.9 3.6 12.2 7.8 6.9 .7 428 2.6 9.6 19.4 10.5 10.5 17 430 4.6 3.5 19.6 12.7 10.1 11 432 8.4 11.5 18.3 6.2 11.1 7 3
34 7.0 4.7 17.7 14.5 11.0 6 336 14.8 0.9 26.2 12.1 13.5 5 338 24.4 4.3 13.3 5.2 11.8 5 340 35.7 9.6 11.0 11.9 17,1 5 342 37.8 3.2 2.1 5.3 12.1 5 344 42.2 1.9 16.0 3.5 13.0 5 346 29.3 1.8 14.3 6.4 13.0 6 348 30.7 8.3 3.5 3.3 11.5 8 350 4.4 4.2 1.1 3.1 3. 2 11 352 8.7 2.9 4.0 4.3 5.0 10 354 7.9 4.7 6.3 2.4 5. 3 8 456 39.1 15.4 5.1 7.1 16.7 50 458 207.0 181.0 236.0 246.0 218.0 46 4
TOTAL 548.0 296.0 460.0 399.0 424.0 242
VOLUME,
3 7cm X 10 312 169 2o2 227 242
*25 Ibs/1OO0 bbl FOA-15**JFTOTC, D 3241
Chaage In Pressure Drop, imu of 141 : 36 at P50 mlnate sPreheater Df.,posit C.de 4TDR Spun Deposit Rating: '0 at: 56
'p0(
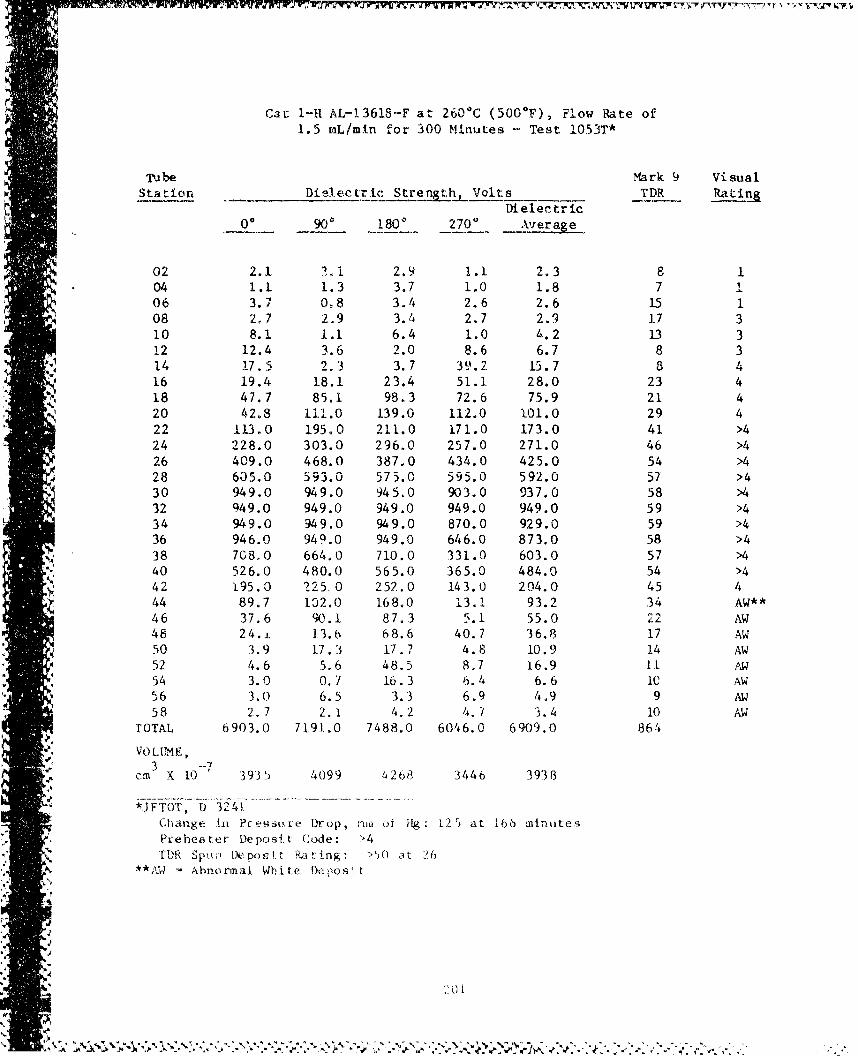
Cat 1-11 AL-13618--F at 260"C (500*F), Flow Rate of1.5 mL/min for 300 Minutes - Test 1053T*
Tube Mark 9 VisualStation Dielectric Stren ht- Volts TDR Rating
Dielectric
00 900 180" 2700 Avere
02 2.1 1 2.9 1.1 2.3 8 104 1.1 1.3 3.7 1.0 1.8 7 i06 3.7 0,8 3.4 2.6 2.6 15 108 2,7 2.9 3.4 2.7 2.9 17 310 8.1 1.1 6.4 1.0 4.2 13 312 12.4 3.6 2.0 8.6 6.7 8 314 17.5 2.3 3.7 39.2 13.7 8 4
S16 19,4 18.1 23.4 51.1 28.0 23 418 47.7 85.1 98.3 72.6 75.9 21 420 42.8 111.0 139.0 112.0 .101.0 29 422 113.0 195.0 211.0 171.0 173.0 41 >424 22.8.0 303.0 296.0 257.0 271.0 46 >426 409.0 468.0 387.0 434.0 425.0 54 >428 605.0 593.0 575.0 595.0 592.0 57 >430 949.0 949.0 945,0 903.0 937.0 58 >4"32 949.0 949.0 949.0 949.0 949.0 59 >434 949.0 949.0 949.0 870.0 929.0 59 >436 946.0 949.0 949.0 646.0 873.0 58 >438 7G8,0 664.0 710.0 331.0 603.0 57 >4
C 40 526.0 480.0 565.0 365.0 484.0 54 >442 195.0 225 0 252.0 143.0 204.0 45 444 89.7 102.0 168.0 13.1 93.2 34 AW**46 37.6 90.1 87.3 5.1 55.0 22 AW48 24.1 13.6 68.6 40.7 36.8 17 AW50 3.9 17.3 17.7 4.8 10.9 14 AW52 4.6 5.6 48.5 8 7 16.9 11 AU
54 3.0 0.1 16.3 6.4 6.6 IC AW56 3.0 6.5 3.3 6.9 4.9 9 AW58 2,7 2.1 4.2 4.7 3.4 10 AW
tOTAL 6903.0 7191.0 7488.0 6046.0 6909.0 864
! VOt. ImE,
cm X 10- 3935 4099 4268 3446 393 8
~jFi0,O' D -,32-4-1.Change in Pcessrue Drop, van of 'ig. L25 at 166 minutesPreheatet Depos.it Code: .>4TDR Spuii keposit IL,-ing : .j0 at 26
"A*A4 A xbnotrta1 White !}pos:..
A
•" u I1
•i ,*• \ N 'q''' •.•". ,, .'*.2;-.•% , ,•" ,"•, -".'v ',,• • • .•.' -,, .- •' ' .- ,. . .
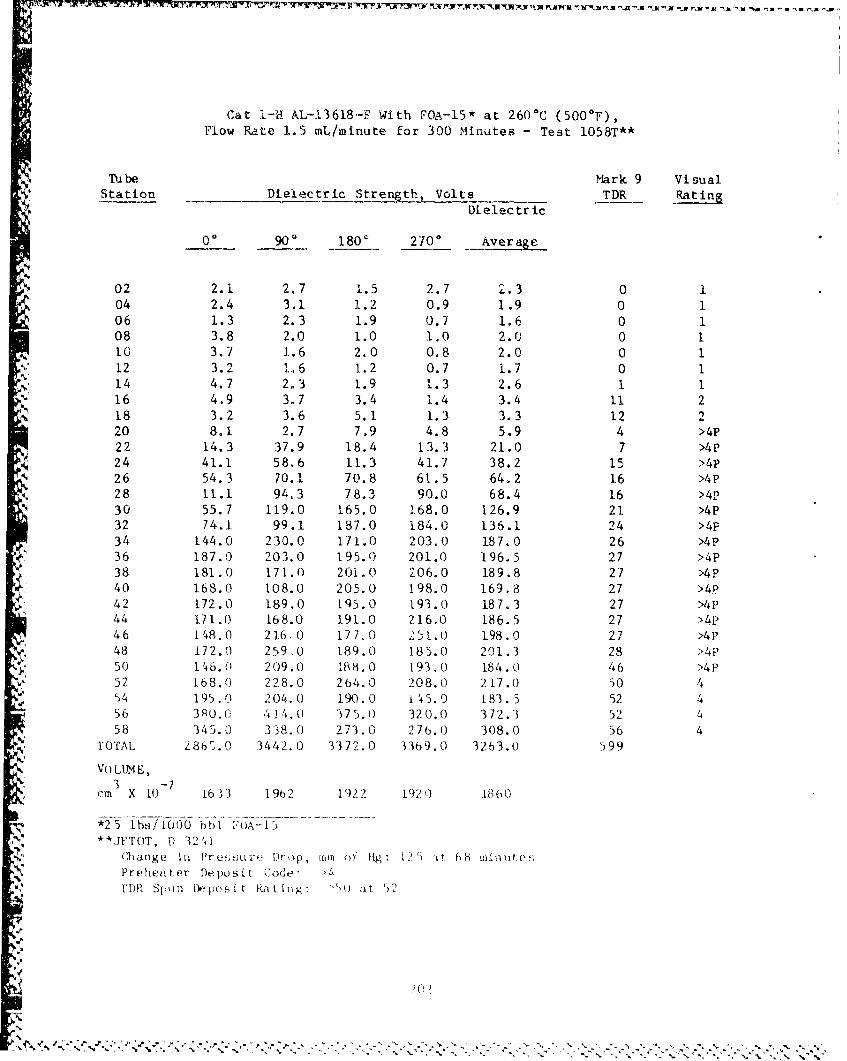
Cat -I-. AL-13618-F With FOA-15* at 260 0 C (500 0 F),Flow Rate 1.5 mL/minute for 300 Minutes - Test I058T**
Tube Mark 9 VisualStation Dielectric Strength, Volts TDR Rating
Ditelectric
00 900 180" 2700 Average
02 2.1 2.7 1.5 2.7 2.3 0 104 2.4 3.1 1.2 0.9 1.9 0 106 1.3 2.3 1.9 0.7 1.6 0 108 3.8 2.0 1.0 1.0 2.0 0 110 3.7 1.6 2.0 0.8 2.0 0 112 3.2 1,6 1.2 0.7 1.7 0 114 4.7 2.3 1.9 1.3 2.6 1 116 4.9 3.7 3.4 1.4 3.4 11 218 3.2 3.6 5.1 1.3 3.3 12 220 8.1 2.7 7.9 4.8 5.9 4 >4P22 14.3 37.9 18.4 13.3 21.0 7 >4P24 41.1 58.6 11.3 41.7 38.2 15 >4P26 54.3 70.1 70.8 61.5 64.2 16 >4P28 11.1 94.3 78.3 90.0 68.4 16 >4P30 55.7 119.0 165.0 168.0 126.9 21 >4P32 74.1 99.1 187.0 184.0 136.1 24 >4P34 144.0 230.0 171.0 203.0 187.0 26 >4P36 187.0 203.0 195.0 201.0 196.5 27 >4P38 181.0 171.0 201.0 206.0 189.8 27 >4P40 168.0 108.0 205.0 198.0 169.8 27 >4P42 172.0 189.0 195.0 193.0 187,3 27 >4P
44 171.0 168.0 191.0 216.0 186.5 27 >4P46 148.0 216, 0 177, ?. 0 598.() 27 >4P48 172.0 259.0 189.0 185.0 201.3 28 >4P50 1•6.0 209.0 188.0 193.0 184.0 46 >4P52 168.0 228.0 264.0 208.0 217.0 50 454 195.0 204.0 190.0 i'45.0 183.5 52 456 3 80.0 14. 0 575.0 320.0 372.3 52 458 345.0 338.0 273.0 276.0 308.0 56 4
TOTAL 2868.0 3442.0 3372.0 336 9.0 3263.0 599
VOLUME,3 0-7
Cm X 10 16 3 1 9b2 19 2 2 192) 186)
*25 IbsiloO0 Obi •OA-1I"**JPTOT, 11 3241
€.Oh•ange i~n Pr to:snr. Drop, mm o 1 g: a t 68 i
Preheat er Depo sit Code-,TDR Spn [Dposit Rating: Ko) at 2
20
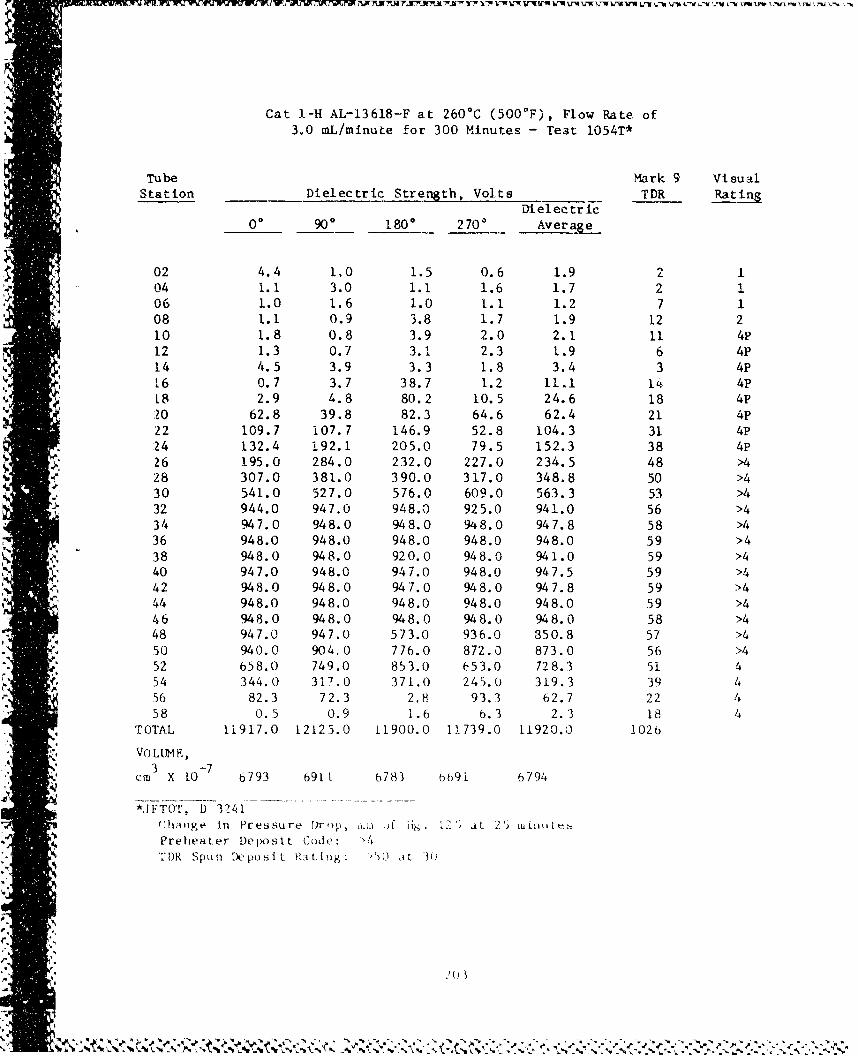
Cat I-H AL-13618-F at 260 0 C (500 0 F), Flow Rate of3.0 mL/minute for 300 Minutes - Teat 1054T*
Tube Mark 9 VisualStation Dielectric Strength, Volts TDR Rating
Dielectric.
00 900 180" 2700 AverajeL
4 02 4.4 IO0 1.5 0.6 1.9 2 104 1. 1 3.0 1.1 1.6 1.7 2 106 1.0 1.6 1.0 1.1 1.2 7 108 1.1 0.9 3.8 1.7 1.9 12 210 1.8 0.8 3.9 2.0 2.1 11 4P12 1.3 0.7 3.1 2.3 1.9 6 4P14 4.5 3.9 3.3 1.8 3.4 3 4PL6 0.7 3.7 38.7 1.2 11.1 14 4P18 2.9 4.8 80.2 10.5 24.6 18 4P20 62.8 39.8 82.3 64.6 62.4 21 4P22 109.7 107.7 146.9 52.8 104.3 31 4P24 132.4 192.1 205.0 79.5 152.3 38 4P26 195.0 284.0 232.0 227.0 234.5 48 >428 307.0 381.0 390.0 317.0 348.8 50 >430 541.0 527.0 576.0 609.0 563.3 53 >432 944.0 947.0 948.0 925.0 941.0 56 >434 947.0 948.0 948.0 948.0 947.8 58 >436 948.0 948.0 948.0 948.0 948.0 59 >4"38 948.0 948.0 920.0 948.0 941.0 59 >440 947.0 948.0 947.0 948.0 947.5 59 >442 948.0 948.0 947.0 948.0 947.8 59 >444 948.0 948.0 948.0 948.0 948.0 59 >446 948.0 948.0 948.0 948.0 948.0 58 >448 947.0 947.0 573.0 936.0 350.8 57 >450 940.0 904,0 776.0 872.0 873.0 56 >452 658.0 749.0 853.0 6.53.0 728.3 51 4
54 344.0 317.0 371.0 245.0 319.3 39 456 82.3 72.3 2.8 93.3 62.7 22 458 0.5 0.9 1.6 6.3 2.3 18 4
TOTAL 11917.0 12125.0 11900.0 11739.0 11920.0 1026
SVOLUME,3 -7
* cm X L0 6793 6911 b783 6691 6794
*J FTTT1' D 32 41Ch.-mge In Pressure Drop, Lii of li•. * '.2' at 25 w i ut,Preheater Deposit Code: >4
TIDR Spun Dc p I) L t 1 t iang ' () t
(iD !Spi t ~~: cZP 'I~ Z*~2-:ZZ

wPvWWV XT Z~ LW'N2'i1 C1
Cat 1-H AL-13618-F With FOA-15* at 260"C (500 0 F),Flow Rate of 3.0 mL/minute for 300 Minutes - Test 1061T**
Tube Mark 9 VisualStation Dielectric StreLgth, Volts TDR Rating
Dielectric_0 90 0 1800 2700 Average
02 1.1 0.2 1.4 1.1 1.0 0 i04 1.0 0.7 0.2 2.2 1.0 0 106 0.9 0.2 1.3 1.2 0.9 0 108 1.5 0.1 1.2 1.1 1.0 0 110 0.3 1.3 1.8 0.7 1.0 0 112 i.1 1.9 1.9 1.4 1.6 0 114 0.4 0.8 2.9 2.1 1.6 0 116 2.4 2.8 0.5 4.1 2.5 1 118 1.3 1.6 1.6 1.1 1.4 6 120 0.1 5.8 1.1 2.4 2.4 13 2"22 0.5 4.7 0.9 3.2 2.3 8 3P24 3.6 1.9 2.0 8.3 4.0 4 3P26 4.5 4.2 0.8 15.2 6.2 10 3P28 8.8 37.2 3.9 27.9 19.5 18 3P30 9.6 39.5 6.6 49.9 26.4 17 3P32 68.8 58.2 45.1 69.7 60.5 1.8 3P34 75.4 63.2 45.1 77.9 65.4 20 >436 144.0 143.8 53.6 135.7 119.3 25 >438 175.2 178.7 43.1 130.4 131.9 26 >440 137.4 127.8 6.8 123.9 99.0 26 >442 177.4 145.6 70.2 134.2 131.9 26 >444 122.9 30.5 46.4 125.1 81.2 25 >446 102.9 1.5 74.9 97.9 69.3 21 AG***48 104.7 11.7 43.9 108.1 67.1 19 AG50 20.3 12.2 89.1 84.9 51.6 18 AG52 18.7 7.4 40.1 46.6 28.2 19 AG54 78.2 5.9 75.3 60.2 54.9 33 456 131.0 171.9 167.8 L28.5 149.8 54 458 342.0 377.0 319.0 133.4 292.9 56 >4
TOTAL 1736.0 1438.0 1149,0 1578.0 1.476.0 463
VOLUME,3 -7
cm X 10 990 820 655 899 841
* 25 ibs/lO00 bbi FOA--15**JFTOT, D 3241
i• ,,L•change in Pressure Drop, jim of Hg: 12 5 at 140 mI.nutesPreheater Deposit Code: 4TI)R Spun Deposit Rating: 33 at 54
S**AG• TAbnormat Green Deiposit
a,20
S~20 4
.'il' I %-, '..%•• \ , • .• •,,-'=•\,•.% .'.-. -'£•%L-'•,- '.,%•- .',1% "•.••'¢J• • .'-.,',,"-.%.'.."-.""..'. -'•'" .' " ,•.. ' " . " ")',.-
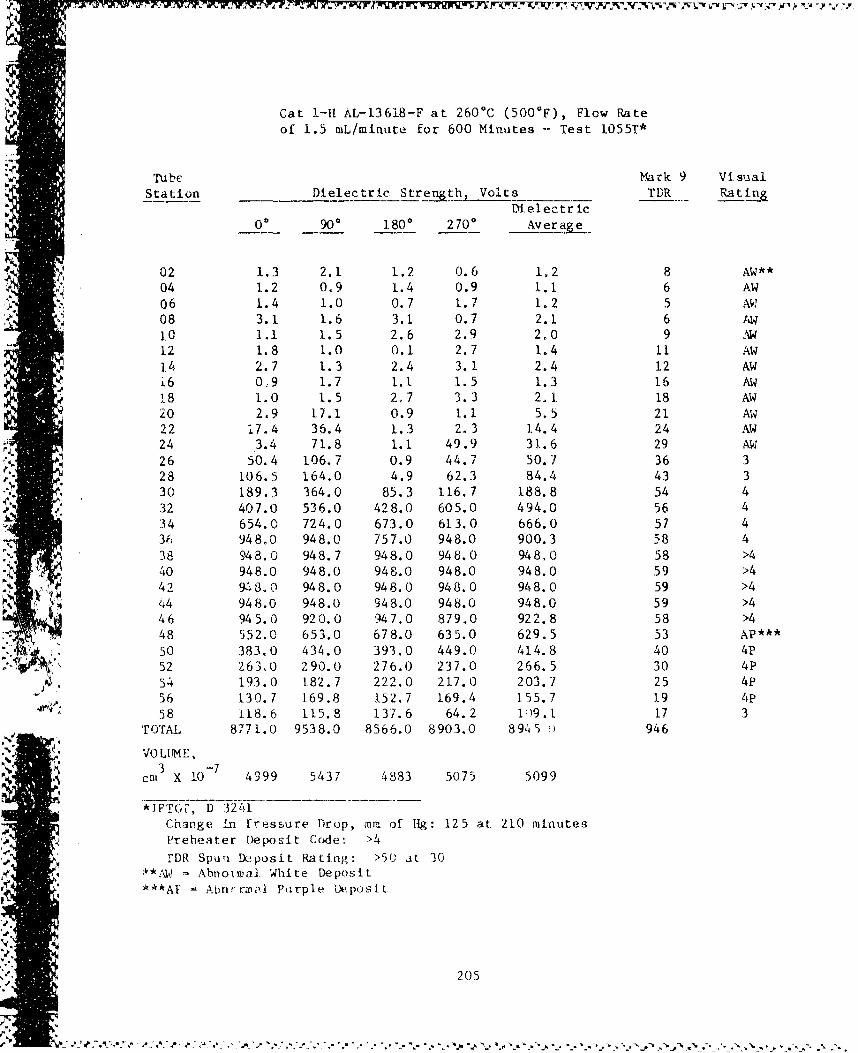
Cat 1-H AL-13618-F at 260*C (500*F), Fl~cw Rateof 1.5 mL/minute for 600 Minutes-- Test 1055T*
Ti bc Mark 9 VisualStation Dielectric Stregh Volts TDR Rating
Dielectric00 900 1800 2700 Av er as e__
02 1.3 2.1 1.2 0.6 1.2 8 AW**04 1.2 0.9 1.4 0.9 I1. 6 AW06 1,4 1.0 0.7 1.7 1.2 5 AW08 3.1 1.6 3.1 0.7 2.1 6 tW10 1.1 1.5 2.6 2.9 2,0 9 M12 1.8 1.0 0.1 2.7 1.4 11 AW1.4 2.7 1.3 2.4 3.1 2.4 12 AWi6 0-9 1.7 1.1 1.5 1.3 16 AW18 1.0 1.5 2.7 3.3 2.1. 18 AW20 2.9 17.1 0.9 1.1 5.5 21 AW22 17.4 36.4 1.3 2.3 1.4.4 24 AW24 3.4 71.8 1.1 49.9 31.6 29 AW"26 50.4 106.7 0.9 44.7 50.7 36 328 106.5 164.0 4.9 62.3 84.4 43 3
, 30 189.3 364.0 85.3 116.7 188.8 54 432 407.0 536.0 428.0 605.0 494.0 56 434 654.0 724.0 673.0 613.0 666.0 57 436 948.0 948.0 757.0 948.0 900.3 58 438 948.0 948.7 948.0 948.0 948.0 58 >440 948.0 948.0 948.0 948.0 948.0 59 >442 9A 8.0 948.0 948.0 948.0 948.0 59 >4e,4 948.0 948.0 948.0 948.0 948.0 59 >4
46 945.0 920.0 947.0 879.0 922.8 58 >448 552.0 653.0 678.0 635.0 629,5 53 AP***50 383.0 434.0 393.0 449.0 414.8 40 4P52 263.0 290.0 276.0 237.0 266.5 30 4P54 193.0 182.7 222.0 217.0 203.7 25 4P56 130.7 169.8 152.7 169.4 155.7 19 4P58 118.6 115.8 137.6 64.2 1i9. 1 17 3
TOTAL 8771.0 9538.0 8566.0 8903.0 894 5 946
VOLUME,3 -7
cm x 10 4999 5437 4883 5075 5099S~*JFTGY, D 3241
Change in Eressure Drop, mm of Hig: 125 at. 210 minutesPreheater Deposit Codeý: >4
rDR Spun Deposit Rating: >50( at 30**AW = Abnomal. White DepositS***AY Abnvrmal Purple Deposit
205
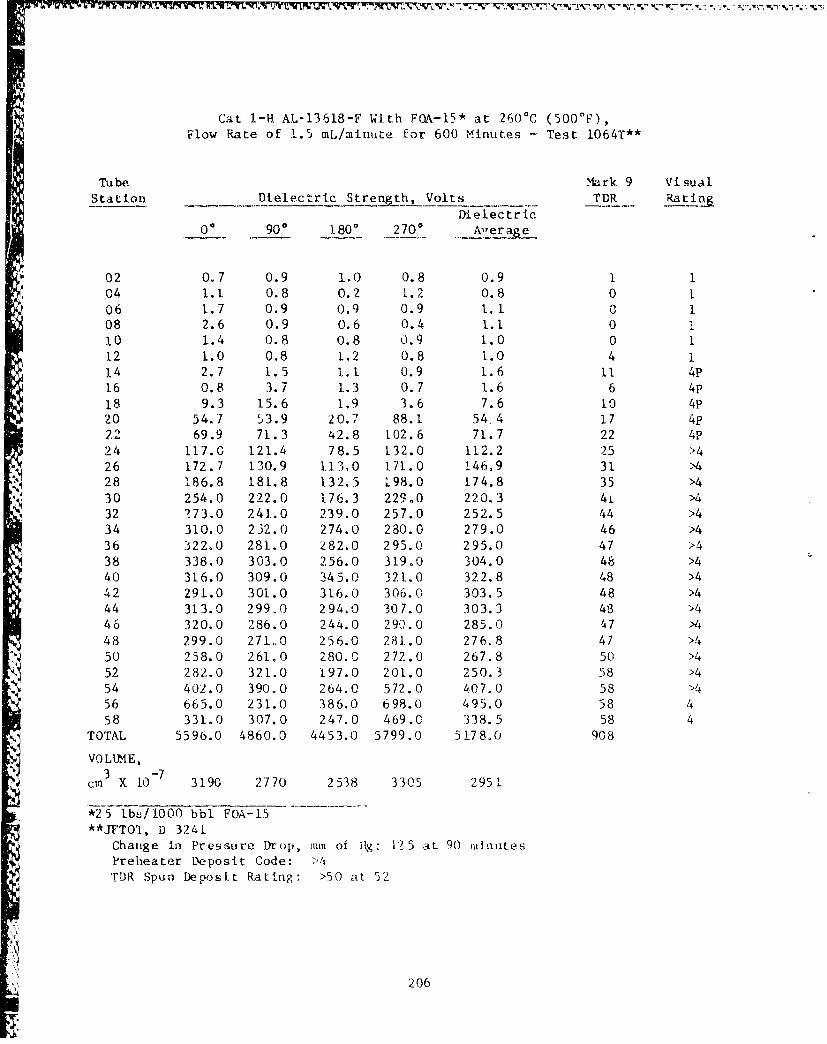
Cat 1-H AL-13618-F With F'0A-15* at 260'C (500'F),Flow Rate of 1.5 mL/minute for 600 Minutes - Test 1064T**
Tube Mark 9 VisualStation Dielectric Strength, Volts TDR Ratin&
Dielectric00 9g0 1800 2700 Alrerage
02 0M7 0.9 1.0 0°8 0.9 1. 104 1.1 0.8 0.2 1.2 0.8 0 106 1.7 0.9 0.9 0.9 111 0 108 2.6 0.9 0.6 0.4 1.1 0 i10 1.4 0.8 0.8 0.9 1.0 0 112 1.0 0.8 1.2 0.8 1.0 4 114 2.7 1.5 1,1 0.9 1.6 11 4P16 0.8 3.7 1.3 0. 7 1.6 6 4P18 9.3 15.6 1.9 3.6 7.6 10 4P20 54.7 53.9 20.7 88.1 54, 4 17 4P2.2 69.9 71.3 42.8 102.6 71.7 22 4P24 117.0 121.4 78.5 132.0 112.2 25 >426 172.7 130.9 113.0 171.0 146,9 31 >428 186.8 181.8 132.5 198.0 174.8 35 >4
30 254.0 222.0 176.3 229.0 220.3 41 >432 273.0 241.0 239.0 257.0 252.5 44 >434 310.0 232.0 274.0 280.0 279.0 46 >436 322.0 281.0 282.0 295.0 295.0 47 >438 338,0 303.0 256.0 319.0 304.0 48 >440 316.0 309.0 345.0 321.0 322.8 48 >442 291.0 301.0 316.0 306.0 303.5 48 >4
44 313.0 299.0 294.0 307.0 303.3 48 >446 320.0 286.0 244.0 2990. 0 285.0 47 >448 299.0 271.0 256.0 281.0 276.8 47 >450 258.0 261.0 280.0 272.0 267.8 50 >452 282.0 321.0 197.0 201.0 250.3 58 >454 402.0 390.0 264.0 572.0 407.0 58 >456 665.0 231.0 386.0 698.0 495.0 58 458 331.0 307.0 247.0 469.0 338.5 58 4
TOTAL 5596.0 4860.0 4453.0 5799.0 5178.0 908
VOLUME,3 -
cm X 10-7 3190 2770 2538 3305 2951
"*25 lbs/1000 bbl FOA-15**JFTOT, D 3241
Change in Pressure Drop, mm of Rlg: 125 at 90 minutesPreheater Deposit Code: >4TDR Spun Deposit Rating: >50 at 52
206
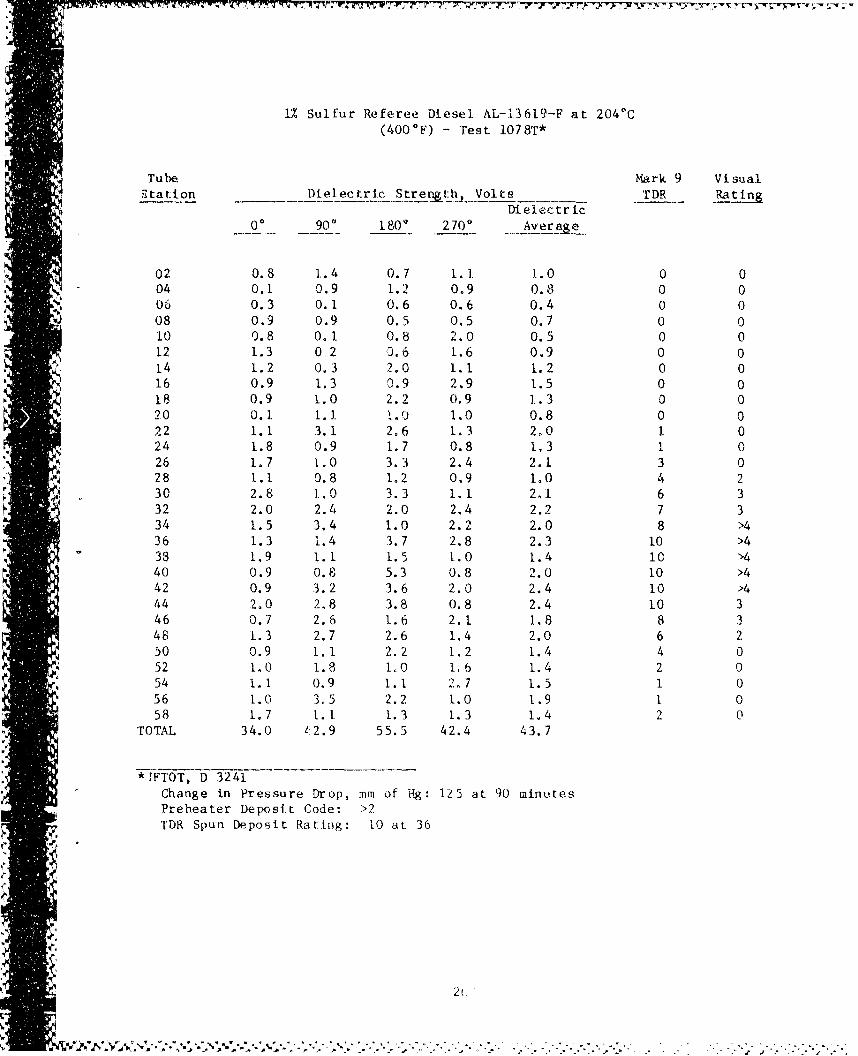
7 .7- 7 ". Z77- W &¶. 7I 1 -77t m Lr -"W-' 7
UY. Sulfur Referee Diesel AL-13619-F at 204'C(400'F) - Test 1078T*
Tube Mark 9 VisualStation Dielectric Str er Volts TDR Rating
Dielectric_0_ 9g0 180 - 2700 Aver ap
02 0.8 1.4 0.7 1.1 1.0 0 004 0.1 0.9 1.2 0.9 0.8 0 006 0.3 0.1 0.6 0.6 0.4 0 008 0.9 0.9 0.5 0.5 0.7 0 010 0.8 0.1 0.8 2.0 0.5 0 012 1.3 0,2 0.6 1.6 0.9 0 014 1.2 0.3 2.0 1.1 1.2 0 016 0.9 1.3 0.9 2.9 1.5 0 018 0.9 1.0 2.2 0.9 1.3 0 020 0.1 1.1. i.O 1.0 0.8 0 022 1.1 3.1 2.6 1.3 210 1 024 1.8 0.9 1.7 0.8 1,3 1 026 1.7 1.0 3.3 2.4 2.1 3 028 1.1 0.8 1,2 0.9 1.0 4 2
30 2.8 1.0 3.3 1 .1 2.1 6 332 2.0 2.4 2.0 2.4 2.2 7 334 1.5 3.4 1.0 2.2 2.0 8 >436 1.3 1.4 3.7 2.8 2.3 10 >4
a 38 1.9 1.1 1.5 1.0 1.4 10 >440 0.9 0.8 5.3 0.8 2.0 10 >4
42 0.9 3.2 3.6 2.0 2.4 10 >444 2.0 2,8 3.8 0.8 2.4 10 346 0.7 2.6 1.6 2.1 1.8 8 348 1.3 2.7 2.6 1.4 2.0 6 2"50 0.9 1.1 2.2 1.2 1.4 4 052 1.0 1.8 1.0 1.6 1.4 2 054 1.1 0.9 1.1 2.7 1.5 1 056 1.0 3.5 2.2 1.0 1.9 1 058 1.7 1.1 1.3 1.3 1.4 2 0
TOTAL 34.0 12.9 55.5 42.4 43.7
*TFTOT, D 3241
Change in Pressure Drop, mm of Hg: 125 at 90 minutesPreheater Deposit Code: >2TDR Spun Deposit Rating: 10 at- 36
'" "
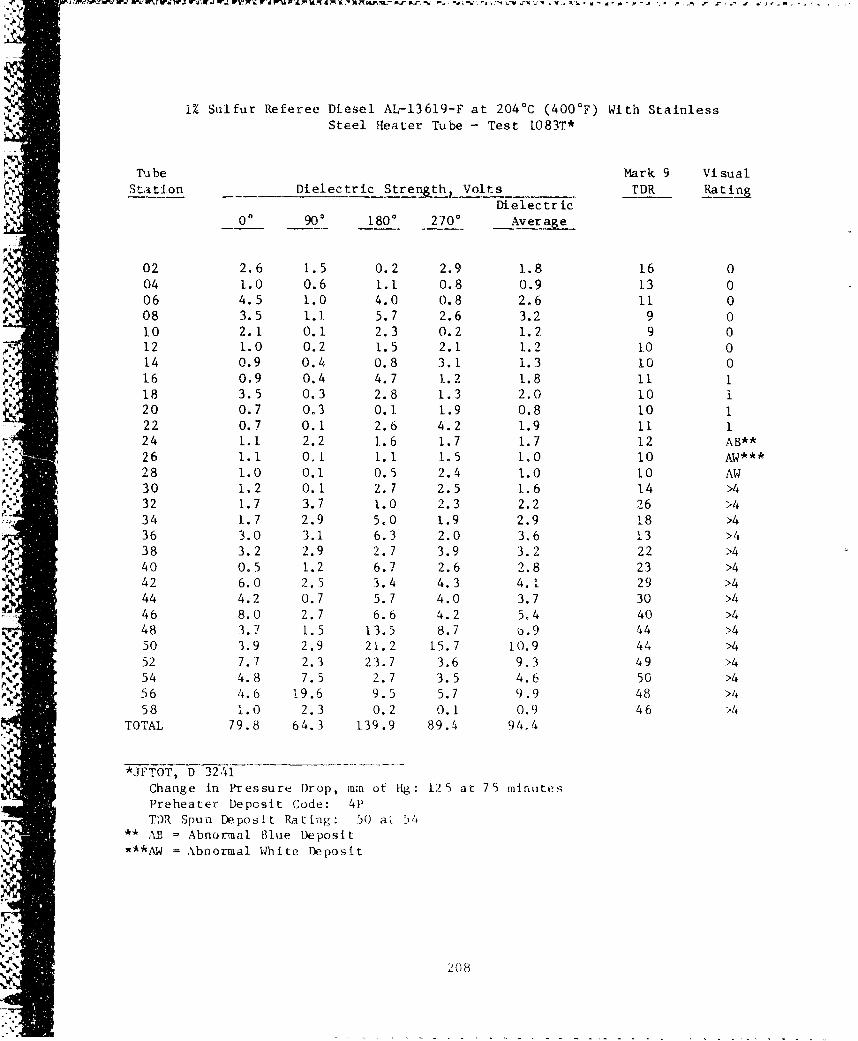
1% Sulfur Referee Diesel AL-13619--F at 204 0 C (400 0 F) With StainlessSteel Heater Tube - Test 1083T*
Tube Mark 9 VisualStation Dielectric Stren th, Volts TDR Rating
Dielectric04 900 180° -2700 Average
02 2.6 1.5 0.2 2.9 1.8 16 004 1.0 0.6 1.1 0.8 0.9 1.3 006 4.5 1.0 4.0 0.8 2.6 11 008 3.5 1.1. 5.7 2.6 3.2 9 010 2.1 0.1 2.3 0.2 1.2 9 012 1.0 0.2 1.5 2.1 1.2 10 014 0.9 0.4 0.8 3.1 1.3 10 016 0.9 0.4 4.7 1.2 1.8 11 118 3.5 0.3 2.8 1.3 2.0 10 i20 0.7 0M3 0.1 1.9 0.8 10 122 0.7 0.1 2.6 4.2 1.9 11 124 1.1 2.2 1.6 1.7 1.7 12 AB**
26 1.1 O.1 1. 1 1.5 1.0 10 AW**28 1.0 0.1 0.5 2.4 1.0 10 AW30 1.2 0.1 2. 7 2.5 1.6 14 >432 1.7 3.7 1.0 2.3 2.2 26 >434 1.7 2.9 5.0 1.9 2.9 18 >436 3.0 3.1 6.3 2.0 3.6 13 >438 3.2 2.9 2.7 3.9 3.2 22 >440 0.5 1.2 6.7 2.6 2.8 23 >442 6.0 2.5 3.4 4.3 4. 1 29 >444 4.2 0.7 5.7 4.0 3.7 30 >446 8.0 2.7 6.6 4.2 5.4 40 >448 3.7 1.5 13.5 8.7 6.9 44 >450 3.9 2.9 21.2 15.7 10.9 44 >452 7.7 2.3 23.7 3.6 9.3 49 >454 4.8 7.5 2.7 3.5 4.6 50 >456 4.6 19.6 9.5 5.7 9.9 48 >458 1.0 2.3 0.2 0.1 0.9 46 >4
TOTAL 79.8 64.3 139.9 89.4 94,4
*JFTOT, D 3241Change in Pressure Drop, nur of Hg: 125 at 75 minutesPreheater Deposit Code: 4P.TDR Spun Deposlt Rating: 50 at 54
** AB = Abnormal. Blue Deposit***AW = Abnormal White Deposit
% %'.
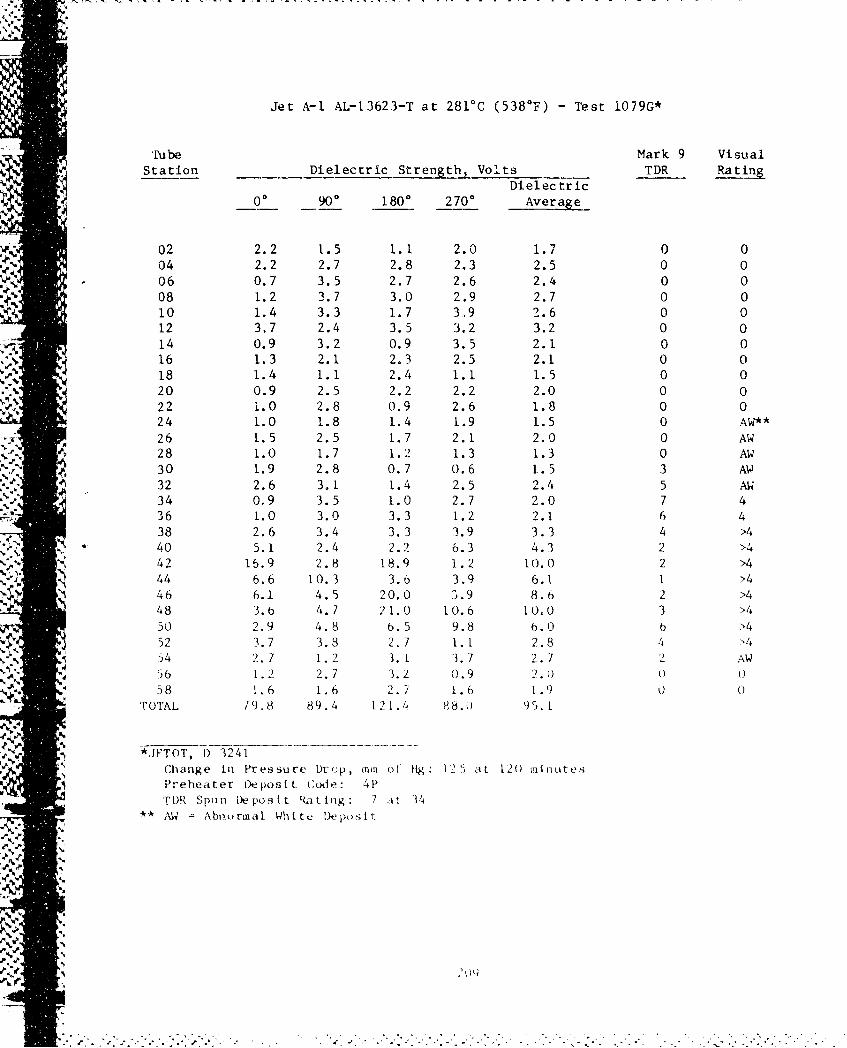
Jet A-i AL-13623-T at 281%C (538*F) - Test 1079G*
'rube Mark 9 VisualStation Dielectric Strength, Volts TDR Rating
Dielectric
00 900 1800 2700 Average
02 2.2 1.5 1.1 2.0 1.7 0 004 2.2 2.7 2.8 2.3 2.5 0 006 0.7 3.5 2.7 2.6 2.4 0 008 1.2 3.7 3.0 2.9 2.7 0 0
10 1.4 3.3 1.7 3,9 2.6 0 012 3.7 2.4 3.5 3.2 3.2 0 014 0.9 3.2 0.9 3.5 2.1 0 016 1.3 2.1 2.3 2.5 2.1 0 018 1.4 1.1 2.4 1.1 1.5 0 020 0.9 2.5 2,2 2.2 2.0 0 022 i.0 2.8 0.9 2.6 1.8 0 024 1.0 1.8 1.4 1.9 1.5 0 AW**26 1.5 2.5 1.7 2.1 2.0 0 AW28 1.0 1.7 1.2 1.3 1.3 0 AW30 1.9 2.8 0.7 0.6 1.5 3 AW32 2.6 3.1 1.4 2.5 2.4 5 AW34 0.9 3.5 1.0 2.7 2.0 7 436 1.0 3.0 3.3 1.2 2.1 6 438 2.6 3.4 3.3 3.9 3.3 4 >4
S40 5.1 2.4 2.2 6.3 4.3 2 >442 15.9 2.8 18.9 1.2 10.0 2 >444 6.6 10.3 3.6 3.9 6.1 1 >446 6.1 4.5 20.0 3.9 8.6 2 >448 3.6 4.7 21.0 10.6 10,0 3 >450 2.9 4.8 6.5 9.8 6.0 6 >452 3.7 3.8 2.7 1.1 2.8 4 >454 2. 7 1.2 3. 1 3.7 2.7 2 AW56 1.2 2.7 3.2 0.9 2.0 ) 058 1.6 1.6 2.7 1.6 1.9 U 0
TOTAL 19.8 89.4 121.4 88.0 95.1
• •*J4TOT, 1) 3241
Change in Pressure Drop, ini of Hg: 12 at 120) minutesPreheater Deposit (ode: 4PTr)R Spun Deposit Rating: 7 att 34
** AW Abnurmal White Dkposlit
%-mF
I- to
W.'
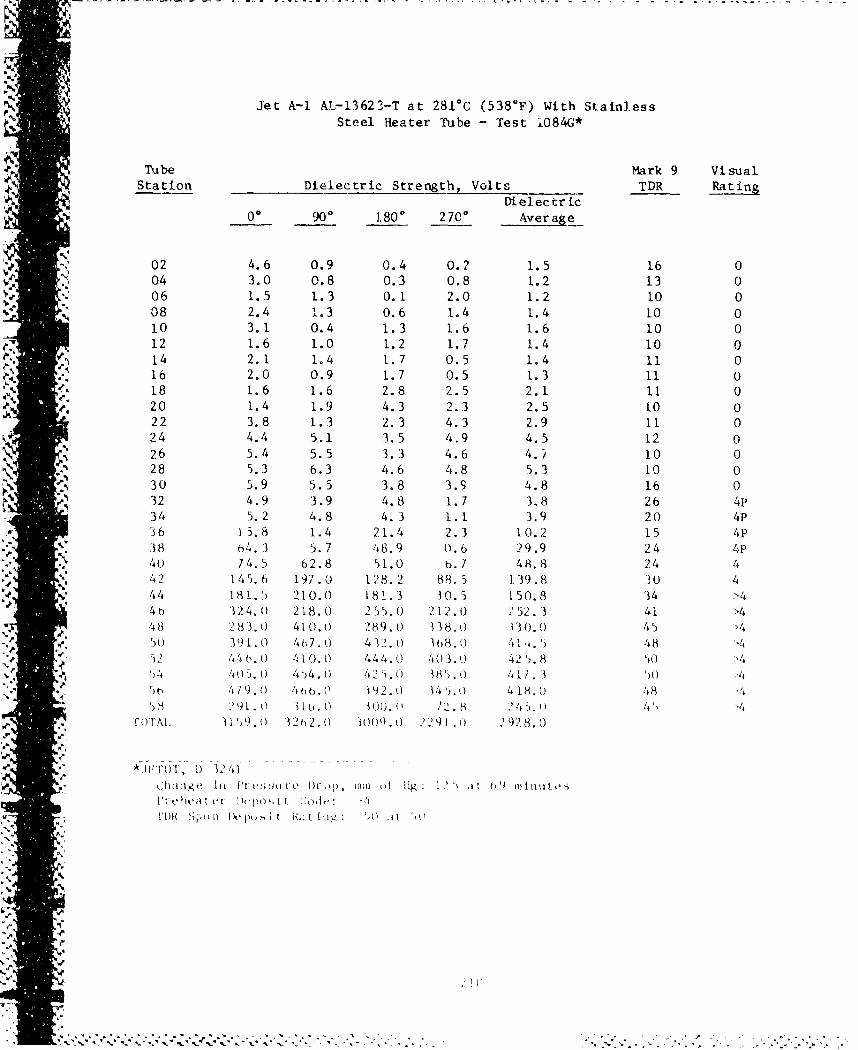
Jet A-i AL-13623-T at 281 0C (538 0 F) With Stainless
Steel Heater Tube - Test 1084G*
Tube Mark 9 VisualStation Dielectric Strength, Volts TDR Rating
Dielectric00 900 1.800 2700 Average
02 4.6 0.9 0.4 0.2 1.5 16 004 3.0 0.8 0.3 0.8 1.2 13 0"06 1.5 1.3 0.1 2.0 1.2 10 0
N 08 2.4 1.3 0.6 1.4 1.4 10 01.0 3.1 0.4 1.3 1.6 1.6 10 012 1.6 1.0 1.2 1.7 1.4 10 014 2.1 1.4 1.7 0.5 1.4 11 0"16 2.0 0.9 1.7 0.5 1.3 11 018 1.6 1.6 2.8 2.5 2.1 11 020 1.4 1.9 4.3 2.3 2.5 10 022 3.8 1.3 2.3 4.3 2.9 11 024 4.4 5.1 3.5 4.9 4.5 12 026 5.4 5.5 3.3 4.6 4.2 10 028 5.3 6.3 4.6 4.8 5.3 10 0
S30 5.9 5.5 3.8 3.9 4.8 16 01 01 32 4.9 3.9 4.8 1.7 3.8 26 4p
34 5.2 4.8 4. 3 1.1 3.9 20 4P'36 15.8 1.4 21.4 2.3 10.2 15 4P38 64. 3 5.7 48.9 0.6 29.9 24 4P40 74.5 62.8 51.0 6.7 48,8 24 4
42 145.6 197.0 128.2 88.5 139.8 30 444 181.5 1210.0 181.3 30.5 150.8 34 >4
4b 324.{0 218.0 255.0 212.0 252. 3 41 >448 283.{0 410.0 289.0 338.0 1 V0.0 45 >4
,50 391.0 4f,7.0 432.0 108.0 41 5 4852 441.0 /4100,0 444.0 403.0 42 5.8 50
4 405. 0 454.0 425. 185).0 411. 3 50 Z4
65 479.0 4tbb.@ 392.0 145.0 4 18.0! 48 "4'8 291. I o. o 100. 0 72.8 2.o 4"4
TrOTAL 3159.0 ) 22.0 3009.0 2291.0 2928.0
*,1) 3 41
-. " , . atge -i- re Drop, 1..... .t 1.g: 12 '1 at 69 1.ilIl i, h•.I et - 1) pos-.1 tt CL)d e 4
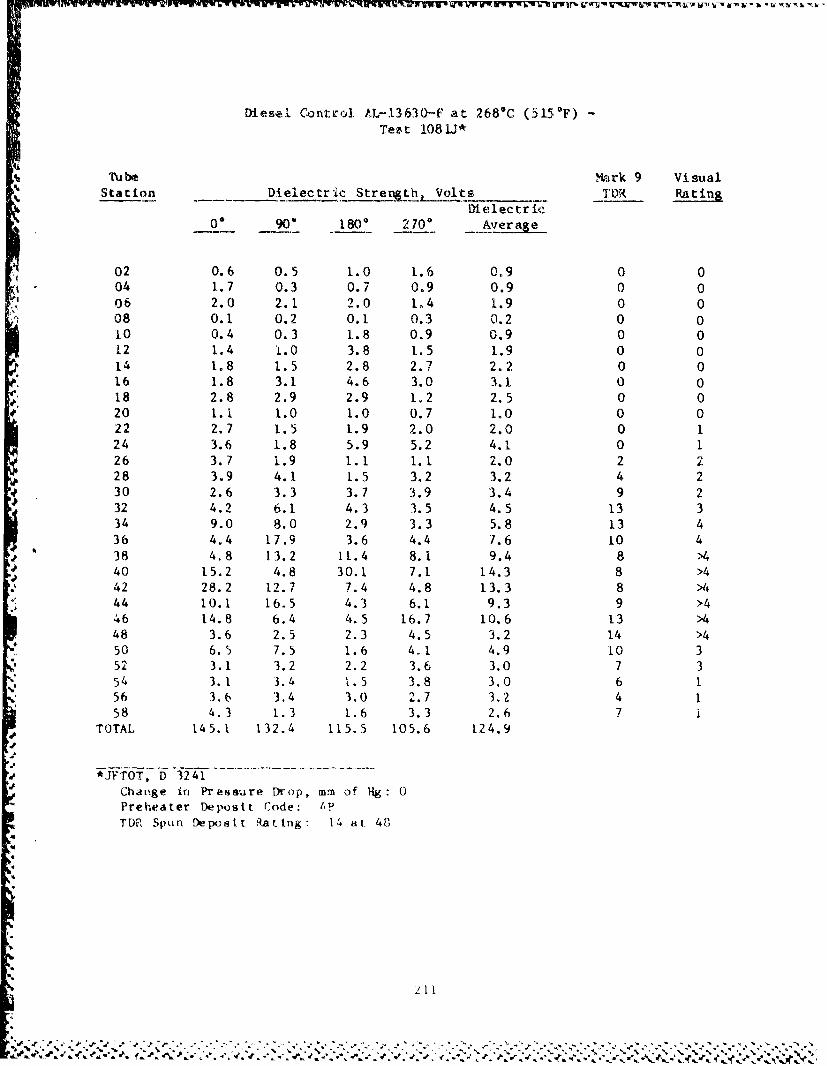
Dies.al Control AL-13630-F at 2680C (515"F) -
Teet 108 LJ*
TTube M'ark 9 VisualStation Dielectr Ic Strenth,_ olt. . TDR Rating
Dielectric06 90 - 1800 2700 Average
02 0.6 0.5 1.0 1.6 0,9 0 004 1.7 0.3 0.7 0.9 0.9 0 006 2.0 2.1 2.0 1.4 1.9 0 008 0.1 0.2 0,1 0.3 0.2 0 010 0.4 0.3 1.8 0.9 0.9 0 012 1.4 1.0 3.8 1.5 1.9 0 014 1.8 1.5 2.8 2.7 2.2 0 016 1.8 3.1 4.6 3.0 3.1 0 018 2.8 2.9 2.9 1.2 2.5 0 020 1.1 1.0 1.0 0.7 1,0 0 022 2.7 1.5 1.9 2.0 2.0 0 124 3.6 1.8 5.9 5.2 4.1 0 126 3.7 1.9 1.1 1.1 2.0 2 228 3.9 4.1 1.5 3.2 3.2 4 230 2.6 3.3 3.7 3.9 3.4 9 232 4.2 6.1 4.3 3.5 4.5 13 334 9.0 8.0 2.9 3.3 5.8 13 436 4.4 17.9 3.6 4.4 7.6 10 438 4.8 13.2 11.4 8.1 9.4 8 >440 15.2 4.8 30.1 7.1 14.3 8 >442 28.2 12.7 7.4 4.8 13.3 8 >4"44 10.1 16.5 4.3 6.1 9.3 9 >446 14.8 6.4 4.5 16.7 10.6 13 >448 3.6 2.5 2.3 4.5 3.2 14 >450 6.5 7.5 1.6 4,1 4.9 10 352 3.1 3.2 2.2 3.6 3.0 7 354 3. 1 3.4 1.5 3.8 3.0 6 156 3.6 3.4 3.0 2.7 3.2 4 158 4.3 1.3 1.6 3.3 2.6 7 1
TOTAL 145.1 132.4 115.5 105.6 124.9
*JFTOT, D 3241
Change in Pressure Drop, mm of Hg: 0Preheater Deposit Code: 1.TDR Spun Deposit Rattng" 14 at 4P
4.
b21

Diesel Control AL-13630-F at 269 0 C (515"F) WithStainless Steel Heater Tube - Test 1082J*
Tube Mark 9 V .sualStation Dielectric Stre.•th Volts TDR Rat in
Dielectric00 900 I1O 270' Averae
02 2 7 1.3 2.1 2.0 2.0 14 004 3.2 3.3 1.6 3.1 2.8 14 006 1.2 2.1 2.7 1.5 1.9 13 008 0.7 0.5 0.3 0.1 0.4 14 010 2.7 1.4 0.8 0.3 1.3 14 C112 1.2 1,1 0.6 1.3 1.1 15 014 0.5 0.5 1.9 0.5 0.9 15 016 0.6 0.5 1.7 1.4 1.1 15 018 2,0 1.5 1.7 1.0 1.6 14 020 0.6 0.7 0,4 1.1 0.7 15 022 2.9 2.1 3.0 2.1 2.5 16 024 2.3 1.7 3.8 2.6 2.6 18 026 0. 5 1.0 4.9 1.0 1.9 20 028 0.5 2.1 3.0 2.4 2.0 22 0
30 1.5 1.9 2.6 2.2 2.]. 23 332 1.6 3.6 5.1 3.0 3.3 23 334 3.9 5.5 7.7 1.6 4.7 23 335 7.2 8.4 4.6 0.9 5.3 25 438 3.7 7.0 6.8 0.9 4.6 28 440 2.2 12.9 4.6 0.7 5.1 33 4
.... 42 2.5 15.3 5.5 0.5 6.0 27 41$10 44 1.1 22.5 14.6 2.1 10.1 20 4
46 5.1 46.4 31.5 0.4 20.9 31 448 24.7 87.2 57.9 7.9 44.4 34 4s0 1.41.8 104.5 122.1 42.t 102,6 41 452 191.0 198.0 198.0 241.0 207.0 50 >454 266.0 177.8 208.0 245.0 224.2 50 >456 318.0 297.0 306.0 276.0 299.3 10 >458 241.0 249.0 376.0 304.0 292.5 50 >4
'TOTAL 1233.0 1257.0 1380.0 1149.0 1255.0
*JFTOT, D 3241
Change in Pressure Drop, mm of Hg: 1 at 150 minutesPreheater Deposit Code: A4PTDR Spun Deposit Rating: 50 at 52
~1* 212
N. I
DLSTRlFMJTION LiST
DEPARTMENT (3F DEFENSE CDRUS ARMY MATERIEL DEVEL &
DEFENSE DOCUMENTATION C IR READINESS COMMANDCAMERON STATION 12 ATTN: AMCLD (DR ODOM)ALEXANDRIA VA 22314 AMCDE-SG
AMCDE-SSDEPT. OF DEFENSE AMCQA-EArmN QASO (A&L) (MR DY'CKMAN) I AMCSM-WST (LTC DACEY)WASHINGTON DC 20301-8000 5001 EISENHOWER AVE
ALEXANDRIA VA 22333-0001CDRDEFENSE FUEL SUPPLY CTR CDRATTN: DFSC-Q (MR MARTIN) .1 US ARMY TANK-AUTOMOTIVE CMDCAMERON STATION ATTN.- AMSTA-RG (MR WHEELOCK) IALEXANDRIA VA 22304-6 160 AMSTA-TSL (MR BURG)I
AMSTA-GIDOD AMSTA-MTC (MR. GAGLIO),ATTN: DUSDRE (RAT) (Dr. Dix) I AMSTA-MC, AMSTA-MVIATTN: ROOM 3-D-1089, PENTAGON I AMSTA-UBP (MR MCCARTNEY) 1,WASHINGTON DC 20301 AMSTA-MLF (MR KELLER) I
WARREN IMI 48397--5000DEFENSE ADVANCED RES PROJ
AGENCY DIRECTORDEFENSE SCIENCES OFC I US ARMY MATERIEL SYSTEMS1400 WILSON BLVD ANALYSIS ACTIVITYARLINGTON VA 22209 ATTN, AMXSY-CM (MR NIEMEYER) I
AMXSY-CRIABERDEEN OROVINCK GROUND MD
DEPARTMENT OF THE ARMY 21005-500",
HG, DEPT OF ARMY DIRECTORATTN: DALO-TSE (COL BLISS) I APPLIED TECHNOLOGY LAB
DALO-TSZ-B (MR KOWALCZvYK) I UJ.S. ARM Y'R&T LAB (AVSCOM)DALO-AV I ATTN. SAVDL- ATL.-ATP (,MR MORROW) IDAMO-FDR (MAJ KNOX) I SAVDL-ATL-ASVIDAMA-ARZ' (DR CHURCH) I FORT EUS rIS VA 23604-5577DAMA-ART (LTC RINEHART) I
WASHINGTON 0C 20310 DIRECTORUS ARMY MATERIEL. CMD
CDR MATERIEL SUPPORT ACTIVITYU.S. ARMY BELVOIR RESEARCH, ATTN: AMXTfB-T (MR STOLARICK) I
4DEVELOPMENT & ENGINEERING CTR FORT LEWIS WA 98433ATTN: STRSL>VF 10
STRBE-WC 2 CDRFORr BELVOIR VA 22060--5606 US ARMY GIENERAL MATERIAL &
PETROLEUM ACTIVITYATTN: STRGP-F (MR A-SHBROOK) I
STRGP-F`E, BLDG 85-3STR(GP-FT
NEW CUM'BER LAND PA 3i707-5008
BFIPF N'o. 0
HQ, DEPT. OF ARMY CDRATTN: DAEN-DRM 1 US ARMY EUROPE & SEVENTH ARMYWASHINGTON DC ?0310 ATTN, AEAGG-FMD
AEAGD-TECDR APO NY 09403US ARMY RES & STDZN GROUP
(EUROPE) CDRATTN: AMXSN-UK-RA (DR OERTEL) I THEATER ARMY MATERIAL MGMT
AMXSN-UK-SE (LTC NICHOLS) ! CENTER (200TH)-DPGMr BOX 65 DIRECTORATE FOR PETROL MGMT
FPO NEW YORK 09510 ATTN: AEAGD-MMC-PT-QAPO NY 09052
CDR, US ARMY AVIATION R&D CMDATTN: AMSAV-EP (MR EDWARDS) I CDR
AMSAV-NS I US ARMY RESEARCH OFC4300 GOODFELLOW BLVD ATTN: SLCRO-ZCST LOUIS MO 63120-1798 SLCRO-.EG (DR MANN)
SLCRO-CB (DR GHIRARDELLI) ICDR P O BOX 12211US ARMY ABERDEEN PROVING RSCH TRIANGLE PARK NC 27709-2211
GROUNDATTN: STEAP.MT-U I PROG MGR, TACTICAL VEHICLEABERDEEN PROVING GROUND MD ATTN: AMCPM-TV21005 WARREN MI 48397
CDR DIRUS ARMY YUMA PROVING GROUND US ARMY AVIATION R&T LABATTN: STEYP-MT-TL-M (AVSCOM)
(MR DOEBBLER) I ATTN: SAVDL-AS (MR WILSTEAD)YUMA AZ 85364-9130 AMES RSCHi CTR
MAIL STOP 207-5PROJ MGR, BRADLEY FIGHTING MOFFET FIELD CA 94035
VEHICLE SYSATTN: AMCPM-FVS-M I CDR.
SWARREN MI 48397 TRADOC COMBINED ARMS TESTACT!VITY
PROG MGR, M113 FAM!LY OF VEHICLES ATTN: ATCT-CAATfN: AMCPM-MII3-T i FORT HOOD TX 76544WARREN MI 48397
CDRPROJ MGR, MOBILE ELECTRIC POWER 105-T S & T BATTALIONATTN: AMCPM-MEP-TM I 5TH INFANTRY DV (MECH)7500 BACKLICIK ROAD FORT POLK LA 71459SPRINGFIELD VA 221 50
CDR.PROJ OFF, AIFPHIBICUS ADr4 WATER 0 S ARMY DE.POT SYSTEMS CMD
CRAFT ATTN: AMSDS-RM-EF(OATTN: AMCPM,,AWC-R I CHAMBERSBURG PA 172014300 GOODF;ELLOW BLVDST LO' ITS MO 63120
BFrLRIE No. 205'Page 2 of 5
CDR DIRECTORUS ARMY LEA US ARMY RSCH & TECH LABATTN: OALO-LEP I (AVSCOM)NEW CUMBERLAND ARMY DEPOT PROPULSION LABORATORYNEW CUMBERLAND PA 17070 ATTN: SAVDL-PL-D (MR ACURIO)
21000 BROOKPARK ROADCDR CLEVELAND OH 44135-3127US ARMY GENERAL MATERIAL &
"PETROLEUM ACTIVITY CDRATTN: STRGP-FW (MR PRICE) I US ARMY NATICK RES & DEV LABBLDG 247, DEFENSE DEPOT TRACY ATTN. STRNA-YE (DR KAPLAN)TRACY CA 95376 STRNA-U
NATICK MA 01760-5000PROJ MGR, LIGHT ARMORED VEHICLESATTN: AMCPM-LA-E I CDRWARREN MI 48397 US ARMY TRANSPORTATION SCHOOL
ATTN: ATSP-CD-MS (MR HARNET)CDR FORT EUSTIS VA 23604-5000US ARMY ORDNANCE CENTER &
SCHOOL PROJ MGR, PATRIOT PROJ OFFICEATTN: AT3L-CD-CS I ATTN: AMCPM-MD-T-CABERDEEN PROVING GROUND MD U.S. ARMY MISSILE COMM,4AND21005 REDSTONE ARSENAL AL 35898
CDR CDRUS ARMY FOREIGN SCIENCE & TECH US ARMY QUARTERMASTER SCHOOL
CENTER ATTN: ATSM-CDATTN: AMXST-MT-1 I ATSM-TD
,iAMXST-BA I ATSM-PFSFEDERAL BLDG FORT LEE VA 23801CHARLOTTESVILLE VA 22901
HQ, US ARMY ARMOR CENTER ANDPROJECT MANAGER, LIGHT COMBAT FORT KNOX
VEHICLES ATTN: ATSB-CDATTN: AMCPM-LCV-TC I FORT KNOX KY 40121WARREN, MI 48397
CDR1HQ, US ARMY T&E COMMAND COMBINED ARMS COMBATATTN: AMSTE-TO-O I DEVELOPMENT ACTIVITY
AMSrFE-CM-,R--O I ATTN: ATZL-CAT-EABERDEEN PROVING GROUND MD ATZL-CAT-A21005 5006 FORT LEAVENWORTH KA 66027-5300
CDR, US ARMY TROOP SUPPORT CDRCOMMAND US ARMY LOGISTICS CTR,
ATTrN: AMSTR-ME I ATTN: AI'CL-MS (MR A MARSHALL)AMSTR-S 1 ATCL-C
4300 GOODFELLOW BLVD FORT LEE VA 23801-6000ST'LOUIS MO 631.20-1798
BFLRF No. 20l5P age .3 o f 5
PROJECT MANAGER DEPARTMENT OF THE NAVYPETROLEUM & WATER LOGISTICSATTN: AMCPM-PWS CDR4.300 GOODFELLOW BLVD NAVAL AIR PROPULSION CENTERST LOUIS MO 63120-1798 ATTN: PE-33 (MR D'ORAZIO)
PE-33 (MR KARPOVICH)CDR P 0 BOX 7176US ARMY FIELD ARTILLERY SCHOOL TRENTON NJ 06828ATTN: ATSF-CDFORT SILL OK 73503-5600 CDR
NAVAL SEA SYSTEMS CMDCDR ATTN: CODE 05M4 (MR R LAYNE)US ARMY ENGINEER SCHOOL WASHINGTON DC 20362-51021ATTN: ATZA-.TSM-G 1
ATZA-CDM 1 CDRATZA-CDD DAVID TAYLOR NAVAL SHIP R&D CTR
FORT BELVOIR VA 22060-5606 ATTN: CODE 2830 (MR BOSMAJIAN) ICODE 2759 (MR STRUCKO) t0
CDR CODE 2831 1US ARMY INFANTRY SCHOOL ANNAPOLIS MD 21402ATTN: ATSH-CD)-MS-M IFORT BENNING GA 31905-5400 CG
FLEET MARINE FORCE ATLANTICCDR ATTN: G4 (COL ROMMANTZ)US ARMY AVIATION CTR & FT RIJCKER NORFOLKVA 23511ATTN: ATZQ-DIFORT RUCKER AL 36362 CDR
NAVAL SHIP ENGINEERING CENTERPROG MGR., TANK SYSTEMS ATTN: CODE 6764ATTN: AMCPM-.MIEt-SM 1 PHILADELPHIA PA 19112
AMCPM-M60 tWARREN MI 48397 PROJ MGR, M60 TANK DEVELOPMENT
ATTN: USMC-LNOCDR US ARMY TANK-AUTOMOTIVEUS ARMY ARMOR & ENGINEER BOARD COMMAND (TACOM)ATTN: ATZK-AE,-AR 1 WARREN Ml 48397
ATZK-AE-.LTFORT KNJX KY 40121 CDR
NAVAL AIR SYSTEMS CMDCDR ATTN: CODE 53645 (MR. MEARNS)6TH MATERIEL MANAGEMENT CENTER WASHINGTON DC 2036119TH SUPPORT BRIGADEAPO SAN FRANCISCO 96212-0172 CDR
NAVAL RESEARCH LABORATORYCHIEF, U.S. ARMY LOGISTICS ATTN: CODE 6170ASSISTANCE OFFICE, FORSCOM ('ODE 6180 1ATrN: AMXLA--FO (MR PITTMAN) CODE 61 10(0-' -R HARVEY) IFT MCPHERSON GA 30330 WASHINGTON DC 20375
1 ) R
IAVAL FACILITIES ENGR CTRA TTN: (ODE 1202P, (N.iR R BtI RRIR S)200 ,ST)TOVAL ST
BFLRF No. 205 ALEXANDRIA VA 22 Q22
Page 4 of 5
. ... . .. .~ . -~T~F - -~'~ --
CDR CDRNAVAL AIR ENGR CENTER WARNER ROBINS AIR LOGISTICATTN: CODE 92727 1 CTRLAKEHURST NJ 08733 ATTN: WRALC/MMTV (MR GRAHAM) I
ROBINS AFB GA 31098COMMANDING GENERALUS MARINE CORPS DEVELOPMENT CDR
& EDUCATION COMMAND USAF 3902 TRANSPORTATIONATTN: D074 (LTC WOODHEAD) I SQUADRONQUANTICO VA 22134 ATTN: LGTVP (MR VAUGHN)
OFFUTT AIR FORCE BASE NE 68113OFFICE OF THE CHIEF OF NAVAL
RESEARCH CDRATTN: OCNR-126 (MR ZIEM) I HQ 3RD USAFARLINGTON, VA 22217-5000 ATTN: LGSF
APO NEW YORK 09127CHIEF OF NAVAL OPERATIONSATTN: OP 413 1 CDRWASHINGTON DC 20350 DET 29
ATTN: SA-ALC/SFMCDR CAMERON STATIONNAVY PETROLEUM OFC ALEXANDRIA VA 22314ATTN: CODE 43 (MR LONG) ICAMERON STATIONALEXANDRIA VA 22304-6180 OTHER GOVERNMENT AGENCIES
NATIONAL AERONAUTICS ANDDEPARTMENT OF THE AIR FORCE SPACE ADMINISTRATION
VEHICLE SYSTEMS AND ALTERNATEHQ,USAF FUELS PROJECT OFFICE"ATTN: LEYSF I ATTN: MR CLARKWASHINGTON DC 20330 LEWIS RESEARCH CENTER
CLEVELAND OH 4413.5HQ AIR FORCE SYSTEMS CMDATTN: AFSC/DLF I DEPARTMENT OF TRANSPORTATION
i ANDREWS AFB MD 20334 FAEDERAL AVIATION ADMINISTRATIONATTN: AWS-.110
CDR 800 INDEPENDENCE AVE, SWUS AIR FORCE WRIGHT AERONAUTICAL WASHINGTON DC 20590
LABATTN: AFWAL/POSF (MR CHURCHILL) I UIS DEPARTMENT OF ENERGYWRIGHT-PATTERSON AFB OH 45433 CE-151
ATTN: MR ECKLUNDCDR FORRESTAL BLDG.SAN ANTONIO AIR LOGISTICS 1000 INDEPENDENCE AVE, SW
CTR WASHINGTON DC 20585ATTN: SAAL*/!SFI* (MR MAKRIS) I
SAALC/MMPRR I ENVIRONMENTAL PROTECTIONKELLY AIR FORCE BASE TX 78241 AGENCY
AIR POLLUTION CONTROLS2365 PLY YOUTH ROADANN ARBOR MI 48105
"BFtlRF No. 205P; e 5 o f 5
Related Documents


