Fluid Phase Equilibria 208 (2003) 171–188 Thermal diffusion sensitivity to the molecular parameters of a binary equimolar mixture, a non-equilibrium molecular dynamics approach Guillaume Galliéro a,∗ , Bernard Duguay b , Jean-Paul Caltagirone a , François Montel c a Laboratoire MASTER-ENSCPB, Université de Bordeaux I, 16 Avenue Pey-Berland, F-33607 Pessac Cedex, France b Laboratoire LPCM (UMR-5803), Université de Bordeaux I, 351 Cours de la Libération, F-33405 Talence Cedex, France c TotalFinaElf EP, CSTJF, Avenue Larribau, F-64018 Pau, France Received 16 August 2002; received in revised form 15 November 2002; accepted 21 January 2003 Abstract The goal of this study is to analyse how the thermal diffusion process is dependent on molecular parameters when describing a fluid mixture. To estimate the associated transport coefficient, which is the thermal diffusion factor α T , a non-equilibrium molecular dynamics algorithm has been applied on equimolar binary mixtures of Lennard–Jones (LJ) particles in supercritical conditions. Firstly, it is shown that this model is able to correctly estimate α T for simple alkane mixtures, provided there are a sufficient number of particles and long enough simulations. Then, using various mixing rules, the separate influences of the mass, the moment of inertia, the atomic diameter and the interaction strength have been studied. Results indicate that the molar fraction of the component, having the smallest mass and moment of inertia as well as the biggest radius and the strongest potential, tends to increase in the hot area. Elsewhere, simulations for various cross-interaction parameters show that α T is extremely sensitive to the intermolecular pair potential between unlike particles. Finally, results on methane/normal alkane mixtures indicate that a simple sum between the separate contributions provides a reliable evaluation of α T only when the molecular parameter ratios between the two components are close to 1. © 2003 Elsevier Science B.V. All rights reserved. Keywords: Lennard–Jones mixture; Mixing rules; Molecular simulation; Non-equilibrium molecular dynamics; Thermal diffusion; Soret effect 1. Introduction When a thermal gradient is applied on a homogeneous fluid mixture, linear irreversible thermodynamics predicts that a composition gradient will take place as a heat flux occurs [1]. This effect, thermal diffusion, also called the Soret effect in a condensed phase, that characterises the cross-effect which couples mass flux ∗ Corresponding author. Tel.: +33-5-56-84-28-31; fax: +33-5-84-66-68. E-mail address: [email protected] (G. Galli´ ero). 0378-3812/03/$ – see front matter © 2003 Elsevier Science B.V. All rights reserved. doi:10.1016/S0378-3812(03)00030-X

Welcome message from author
This document is posted to help you gain knowledge. Please leave a comment to let me know what you think about it! Share it to your friends and learn new things together.
Transcript
Fluid Phase Equilibria 208 (2003) 171–188
Thermal diffusion sensitivity to the molecular parametersof a binary equimolar mixture, a non-equilibrium
molecular dynamics approach
Guillaume Galliéroa,∗, Bernard Duguayb, Jean-Paul Caltagironea, François Montelca Laboratoire MASTER-ENSCPB, Université de Bordeaux I, 16 Avenue Pey-Berland, F-33607 Pessac Cedex, France
b Laboratoire LPCM (UMR-5803), Université de Bordeaux I, 351 Cours de la Libération, F-33405 Talence Cedex, Francec TotalFinaElf EP, CSTJF, Avenue Larribau, F-64018 Pau, France
Received 16 August 2002; received in revised form 15 November 2002; accepted 21 January 2003
Abstract
The goal of this study is to analyse how the thermal diffusion process is dependent on molecular parameters whendescribing a fluid mixture. To estimate the associated transport coefficient, which is the thermal diffusion factorαT,a non-equilibrium molecular dynamics algorithm has been applied on equimolar binary mixtures of Lennard–Jones(LJ) particles in supercritical conditions. Firstly, it is shown that this model is able to correctly estimateαT forsimple alkane mixtures, provided there are a sufficient number of particles and long enough simulations. Then,using various mixing rules, the separate influences of the mass, the moment of inertia, the atomic diameter andthe interaction strength have been studied. Results indicate that the molar fraction of the component, having thesmallest mass and moment of inertia as well as the biggest radius and the strongest potential, tends to increase in thehot area. Elsewhere, simulations for various cross-interaction parameters show thatαT is extremely sensitive to theintermolecular pair potential between unlike particles. Finally, results on methane/normal alkane mixtures indicatethat a simple sum between the separate contributions provides a reliable evaluation ofαT only when the molecularparameter ratios between the two components are close to 1.© 2003 Elsevier Science B.V. All rights reserved.
Keywords:Lennard–Jones mixture; Mixing rules; Molecular simulation; Non-equilibrium molecular dynamics; Thermaldiffusion; Soret effect
1. Introduction
When a thermal gradient is applied on a homogeneous fluid mixture, linear irreversible thermodynamicspredicts that a composition gradient will take place as a heat flux occurs[1]. This effect, thermal diffusion,also called the Soret effect in a condensed phase, that characterises the cross-effect which couples mass flux
∗ Corresponding author. Tel.:+33-5-56-84-28-31; fax:+33-5-84-66-68.E-mail address:[email protected] (G. Galliero).
0378-3812/03/$ – see front matter © 2003 Elsevier Science B.V. All rights reserved.doi:10.1016/S0378-3812(03)00030-X
172 G. Galliero et al. / Fluid Phase Equilibria 208 (2003) 171–188
and temperature gradient, is an intriguing process. Even if this phenomenon has been studied for almost150 years, “it is the only hydrodynamic transport mechanism that lacks a simple physical explanation”[2]. The amplitude of this cross-effect is represented by a phenomenological transport coefficient, thethermal diffusion factor,αT. Despite its relative weakness compared to mutual diffusion in most cases,relevant values are needed in various fields, in particular, in the petroleum industry where an accuratedescription of the spatial arrangement of a multi-component mixture is a key point to properly describethe initial state of a petroleum reservoir[3,4].
Unfortunately, as thermal diffusion is often blurred by thermal convection, experimental values aredifficult to obtain. Even the sign of thermal diffusion of a given mixture studied by different authorscan be opposite[5]. But it seems that during the last decade, thanks to new experimental methods[6]and microgravity results[7], reliable values could be provided, and consensus reached between authors[6,8,9]. In order to estimate this cross-transport coefficient, various theories have been developed butas the experimental values are scarce and sometimes not reliable, it is hard to test them accurately.These theories can be divided into two families, the thermodynamic methods which imply the evaluationof complex thermodynamic quantities[10–12], and the kinetic approaches[13,14], which are mostlyapplied to gas states. The kinetic approaches give excellent results in dilute gas, but fail in dense phases.Concerning the thermodynamics models, it seems that they can be efficient for liquid and high pressuregas mixtures of small molecules[10,12]. But they are very sensitive to the equation of state (EOS) and asthe inputs from the EOS are, for the moment, not sufficiently accurate, it is hard to produce quantitativeresults on thermal diffusion[10]. Besides, various models have been developed in order to explain thisphenomenon physically[15–17]. Recently, using molecular dynamics (MD) results, an explanation interms of contributions to the microscopic heat fluxes was proposed[18–20], but there is still a lack of asimple physical overall explanation of the mechanism that drives this cross-effect[2].
During the past two decades, MD numerical approach has provided an alternative route in the analysisof the thermal diffusion process, especially at moderate and high densities[21,22]. Recently, thanks tonon-equilibrium molecular dynamics (NEMD) simulations, promising results to improve the comprehen-sion of the microscopic mechanisms that govern thermal diffusion in bulk fluid[23–26]as well as in porousmedium[27,28] have been found. Therefore, we have written a parallel program of boundary-drivenNEMD to study the Soret effect. This method, which mimic real experimental conditions by changing thetemperature at the boundaries, allows us to directly compute the thermal diffusion factor using the heatexchange (HEX) algorithm[18]. As these methods are very demanding in CPU time, equimolar binarymixtures of simple molecules have been used, modelled by smooth spheres or by geometrically con-strained dipoles of smooth spheres (diatomic), without any internal degree of freedom interacting througha Lennard–Jones (LJ) potential. This allows, using appropriate mixing rules, to systematically study theinfluence of the various parameters that describe the binary mixture for a given thermodynamic state.
Firstly, we compare our computations with previous MD results that use a more comprehensive de-scription of the molecule, as well as with some recent experimental results. Then, we investigate theinfluence of the systematic variation of a given physical parameter ratio, the massm1/m2, the moment ofinertiaI1/I2, the atomic diameterσ 1/σ 2 and the interaction strengthε1/ε2 while keeping the others equalto 1. If the law of the corresponding state is respected, by changing one of these ratios at a time, we areable to study how exactly the thermal diffusion depends on them separately. We exploit this advantage toprovide a possible physical explanation of the thermal diffusion sign in each case. In addition, we studythe influence of the cross-interaction parameters and describe how strongly these parameters affect themagnitude of the separation. In order to evaluate couplings between these separate contributions, we carry

G. Galliero et al. / Fluid Phase Equilibria 208 (2003) 171–188 173
out simulations where two or three molecular parameters are changed simultaneously. We finally showhow the results in “real” alkane mixtures could be deduced in some cases from the separate contributionsof each molecular parameter.
2. Theory and method
2.1. Thermal diffusion
The thermodynamics of irreversible process (TIP) provides a formalism to describe the couplingsbetween the different types of transport in multi-component systems[1]. Such a description links thefluxes with the thermodynamic forces linearly. According to the principles of TIP, when a non-reactingbinary mixture in mechanical equilibrium is subject to a temperature gradient, the phenomenologicalmass fluxJ of one of the species is:
J = −ρD12 ∇w − ρw(1 − w)DT ∇T , (1)
whereD12 and DT are the mutual and thermal diffusion coefficients of the mixture, respectively,ρ
the average molar density,w the mass fraction of the studied component andT the temperature. If atemperature gradient is applied to a homogeneous mixture in mechanical equilibrium without gravity, thesystem will be driven toward a non-equilibrium steady state where the mass flux will vanish (J = 0). Atthis stationary state, the two contributions to the mass flux inEq. (1), due to mutual and thermal diffusion,balance each other. RewritingEq. (1)at the steady state, multiplied by the average temperature, we obtain:
T
(DT
D12
)= −
(T
w(1 − w)
)(∇w
∇T
). (2)
This relation gives us an expression in terms of mass fraction and temperature gradients, for the thermaldiffusion factorαT = TDT/D12, that characterises the amplitude of the phenomena.
As component 2, throughout this work, is the reference one, if we consider an equimolar binary mixture,and linear gradients in the simulation box,Eq. (2)is reduced to:
αT = −4T
( x1
T
), (3)
wherex1 is the molar fraction of the first component. So, followingEq. (3), a positiveαT means thatthe particles of species 1 move toward the cold region of the system. Thanks to this relation, during thenon-equilibrium steady state, the boundary-driven NEMD allows a direct computation of the thermaldiffusion factor.
2.2. Computational details
All simulations are performed on 1500 LJ centres of force, except when indicated. The LJ potentialUij , that describes interactions between moleculesi andj, is defined as:
Uij = 4εij
((σij
rij
)12
−(
σij
rij
)6)
, (4)

174 G. Galliero et al. / Fluid Phase Equilibria 208 (2003) 171–188
whereεij is the potential strength,σ ij the atomic diameter andrij the intermolecular separation. In orderto keep the bond length between the two centres of force constant, in diatomic molecules, the ‘shake’method[29] is applied. For interactions between unlike molecules, the modified Lorentz–Berthelot rulesare used:
ε12 = (1 − kij )√
ε1ε2, (5)
σ12 = (1 − lij )(12(σ1 + σ2)), (6)
wherekij andlij are the cross-interaction parameters. A cut-off distancerc = 2.5σ is applied. A recentstudy has shown that this cut-off distance seems to be sufficient to properly compute the thermal diffusionprocess[30]. The equations of motion are solved using the Verlet velocity algorithm with a timesteph =5 × 10⁻¹⁵ s. Simulations are performed on run lengths of at least 107 steps (50 ns). The first 2.5 × 10⁶
steps of the non-equilibrium simulations are discarded to computeαT, considering this as sufficient toreach the steady state. Periodical boundary conditions are applied.
Concerning the non-equilibrium simulations, a boundary-driven NEMD scheme, sometimes namedreverse NEMD or direct NEMD[23,24]is applied. This method implies creating a thermal gradient insidethe simulation box by imposing a constant heat flux while keeping the periodical boundary conditions.Among various existing approaches[18,23,28], the HEX algorithm, due to Hafskjold et al., seems to bethe most stable and efficient one[18]. When applying this algorithm to the simulation box, when thesteady state is reached, a linear profile of concentration establishes itself and thanks to (3), the thermaldiffusion factor, can be directly evaluated.
2.3. Law of the corresponding states
In order to follow the law of the corresponding states and so to separate the purely thermodynamics andthe molecular parameters contributions, simulations are performed in reduced thermodynamics variables.The reduced temperature is defined asT ∗ = kBT /εx , wherekB is the Boltzman constant andεx aninteraction strength coefficient characteristic of the mixture. The reduced density isρ∗ = Nσ 3
x /V, with Nbeing the number of particles,V the volume of the simulation box andσx a typical atomic diameter of thestudied mixture. The reduced pressure is deduced from the computed pressureP, thanks toP ∗ = Pσ 3
x /εx .Three different schemes have been applied in order to obtain values forσx andεx :
• A simple one, used by Reith and Müller-Plathe[23], takingσx = σ12 andεx = ε12, where the cross-LJparameters are calculated thanks to (5) and (6). This approach will be called the cross-parameters (CP)method in next sections.
• The most common one, the van der Waals one of fluid approximation (vdW1)[31], in which σ 3x =
�i�jxixjσ3ij andεxσ
3x = �i�jxixj εijσ
3ij , wherexi is the molar fraction of the componenti.
• A very recent one[32], which is a modified version of the vdW1 for the dense phase, withσ 3x =
�i�jxixj ((1/2)(σ 3ni + σ 3n
j ))1/n andεxσ3x = �i�jxixj εijσ
3ij , wheren is a parameter proportional to
the packing factor. This last approach will be named vdW1(3n) throughout this paper.
All simulations are performed in supercritical conditions, except when indicated, at a reduced densityρ∗ = 0.4227 and a reduced temperatureT ∗ = 2.273. Computation on pure methane gives a reducedpressureP ∗ = 1.017. This corresponds to a pressure of 39.6 MPa, a temperature of 330.8 K and a densityof 217.6 kg m−3 for this pure component.

G. Galliero et al. / Fluid Phase Equilibria 208 (2003) 171–188 175
3. Results
3.1. Preliminary results
Because boundary-driven NEMD is quite CPU time consuming, the limiting size and time simulationlength necessary to obtain reliable results are a key point in order to perform a systematic study. We haveshown that various methods produce results in agreement with each other for long enough simulations,around 37.5 × 10⁻⁹ s [19]. But another major problem arises when using MD: the dependency of thetransport coefficients on the size of the simulated system. It is known that for transport properties,simulations on a too small system can affect the calculated values[33,34]. Therefore, we have performedsimulations on an equimolar mixture of methane andn-decane, modelled by LJ spheres, atT ∗ = 2.273andr∗ = 0.4227 for various number of particles ranging from 150 to 5000. The LJ parameters used arethose from[35].
Transport coefficient values that are drawn inFig. 1have been reduced by those obtained for the biggestsystem (5000 particles),α∗
T = αT/1.4 andλ∗ = λ/(1.925× 10−2), whereλ is the thermal conductivity.Fig. 1shows that, obviously,α∗
T andλ∗ strongly decrease with the size of the system. A possible explanationis that in the small size systems long wavelength modes are suppressed[34]. Thus, taking into accountcomputation time and validity of the results, simulations throughout this work have been carried out on1500 particles.
Another important point, before going into a systematic study of the thermal diffusion factor with thevarious molecular parameters of a given mixture, is to determine whether or not the use of LJ spheres isable to provide a reasonable estimation of the thermal diffusion process. Our program was first checked
Fig. 1. Reduced thermal conductivities (�) and reduced thermal diffusion factors (�) for various system sizes.
176 G. Galliero et al. / Fluid Phase Equilibria 208 (2003) 171–188
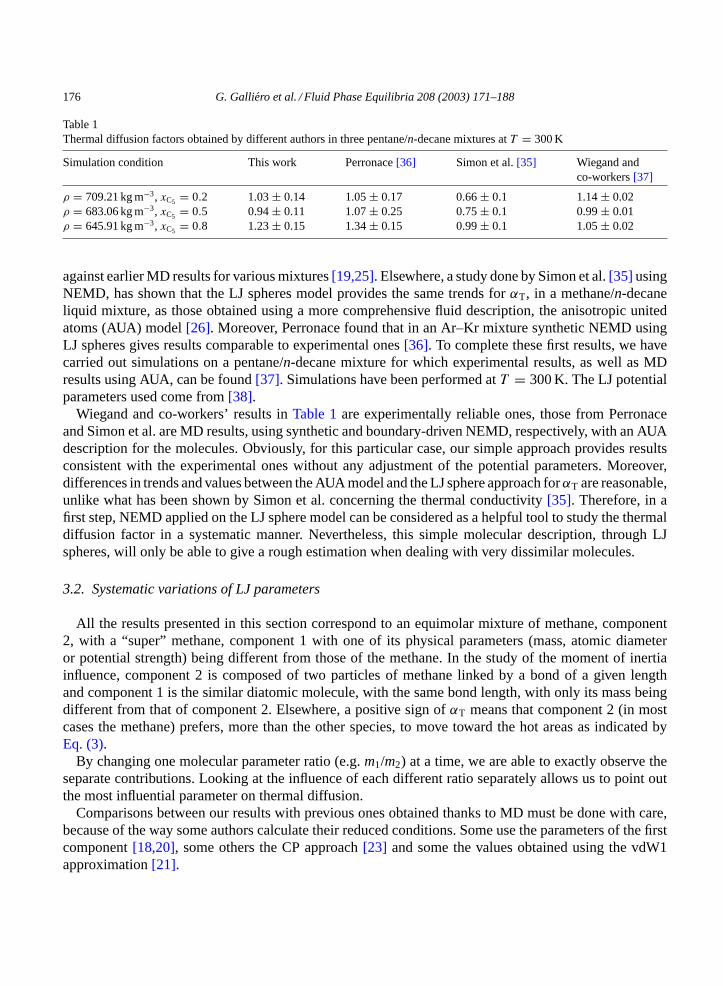
Table 1Thermal diffusion factors obtained by different authors in three pentane/n-decane mixtures atT = 300 K
Simulation condition This work Perronace[36] Simon et al.[35] Wiegand andco-workers[37]
ρ = 709.21 kg m−3, xC5 = 0.2 1.03± 0.14 1.05± 0.17 0.66± 0.1 1.14± 0.02ρ = 683.06 kg m−3, xC5 = 0.5 0.94± 0.11 1.07± 0.25 0.75± 0.1 0.99± 0.01ρ = 645.91 kg m−3, xC5 = 0.8 1.23± 0.15 1.34± 0.15 0.99± 0.1 1.05± 0.02
against earlier MD results for various mixtures[19,25]. Elsewhere, a study done by Simon et al.[35] usingNEMD, has shown that the LJ spheres model provides the same trends forαT, in a methane/n-decaneliquid mixture, as those obtained using a more comprehensive fluid description, the anisotropic unitedatoms (AUA) model[26]. Moreover, Perronace found that in an Ar–Kr mixture synthetic NEMD usingLJ spheres gives results comparable to experimental ones[36]. To complete these first results, we havecarried out simulations on a pentane/n-decane mixture for which experimental results, as well as MDresults using AUA, can be found[37]. Simulations have been performed atT = 300 K. The LJ potentialparameters used come from[38].
Wiegand and co-workers’ results inTable 1are experimentally reliable ones, those from Perronaceand Simon et al. are MD results, using synthetic and boundary-driven NEMD, respectively, with an AUAdescription for the molecules. Obviously, for this particular case, our simple approach provides resultsconsistent with the experimental ones without any adjustment of the potential parameters. Moreover,differences in trends and values between the AUA model and the LJ sphere approach forαT are reasonable,unlike what has been shown by Simon et al. concerning the thermal conductivity[35]. Therefore, in afirst step, NEMD applied on the LJ sphere model can be considered as a helpful tool to study the thermaldiffusion factor in a systematic manner. Nevertheless, this simple molecular description, through LJspheres, will only be able to give a rough estimation when dealing with very dissimilar molecules.
3.2. Systematic variations of LJ parameters
All the results presented in this section correspond to an equimolar mixture of methane, component2, with a “super” methane, component 1 with one of its physical parameters (mass, atomic diameteror potential strength) being different from those of the methane. In the study of the moment of inertiainfluence, component 2 is composed of two particles of methane linked by a bond of a given lengthand component 1 is the similar diatomic molecule, with the same bond length, with only its mass beingdifferent from that of component 2. Elsewhere, a positive sign ofαT means that component 2 (in mostcases the methane) prefers, more than the other species, to move toward the hot areas as indicated byEq. (3).
By changing one molecular parameter ratio (e.g.m1/m2) at a time, we are able to exactly observe theseparate contributions. Looking at the influence of each different ratio separately allows us to point outthe most influential parameter on thermal diffusion.
Comparisons between our results with previous ones obtained thanks to MD must be done with care,because of the way some authors calculate their reduced conditions. Some use the parameters of the firstcomponent[18,20], some others the CP approach[23] and some the values obtained using the vdW1approximation[21].
G. Galliero et al. / Fluid Phase Equilibria 208 (2003) 171–188 177
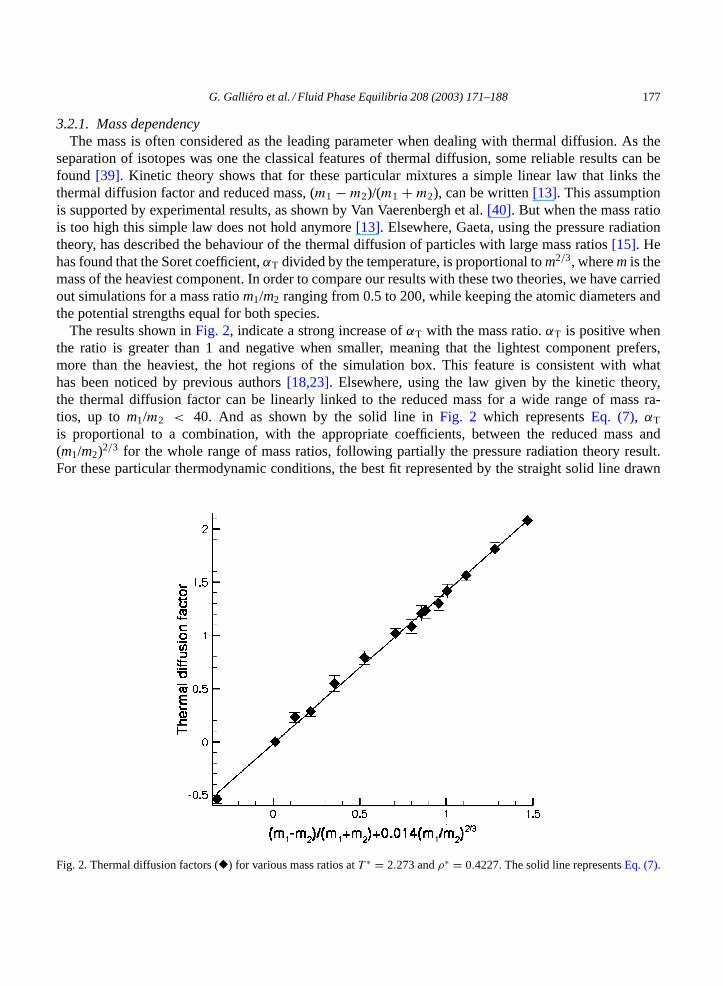
3.2.1. Mass dependencyThe mass is often considered as the leading parameter when dealing with thermal diffusion. As the
separation of isotopes was one the classical features of thermal diffusion, some reliable results can befound [39]. Kinetic theory shows that for these particular mixtures a simple linear law that links thethermal diffusion factor and reduced mass, (m1 − m2)/(m1 + m2), can be written[13]. This assumptionis supported by experimental results, as shown by Van Vaerenbergh et al.[40]. But when the mass ratiois too high this simple law does not hold anymore[13]. Elsewhere, Gaeta, using the pressure radiationtheory, has described the behaviour of the thermal diffusion of particles with large mass ratios[15]. Hehas found that the Soret coefficient,αT divided by the temperature, is proportional tom2/3, wherem is themass of the heaviest component. In order to compare our results with these two theories, we have carriedout simulations for a mass ratiom1/m2 ranging from 0.5 to 200, while keeping the atomic diameters andthe potential strengths equal for both species.
The results shown inFig. 2, indicate a strong increase ofαT with the mass ratio.αT is positive whenthe ratio is greater than 1 and negative when smaller, meaning that the lightest component prefers,more than the heaviest, the hot regions of the simulation box. This feature is consistent with whathas been noticed by previous authors[18,23]. Elsewhere, using the law given by the kinetic theory,the thermal diffusion factor can be linearly linked to the reduced mass for a wide range of mass ra-tios, up to m1/m2 < 40. And as shown by the solid line inFig. 2 which representsEq. (7), αT
is proportional to a combination, with the appropriate coefficients, between the reduced mass and(m1/m2)2/3 for the whole range of mass ratios, following partially the pressure radiation theory result.For these particular thermodynamic conditions, the best fit represented by the straight solid line drawn
Fig. 2. Thermal diffusion factors (�) for various mass ratios atT ∗ = 2.273 andρ∗ = 0.4227. The solid line representsEq. (7).
178 G. Galliero et al. / Fluid Phase Equilibria 208 (2003) 171–188
in Fig. 2 is:
αT = 1.427
((m1 − m2
m1 + m2
)+ 0.014
(m1
m2
)2/3
− 0.014
). (7)
A possible explanation of this general behaviour, a positive value ofαT for mass ratios greater than 1, canbe deduced from the fact that the system is in mechanical equilibrium, which implies a constant pressureinside the simulation box. So, applying a thermal gradient causes a density gradient in the oppositedirection, and the heaviest particles, which occupy the same volume as the lightest, participate moreefficiently to generate the area of strong density and so tend to migrate towards the cold areas more thanthe lighter ones.
3.2.2. Dependence to the moment of inertiaAs noticed by Rutherford[41], not only the mass of a particular molecule affects the thermal diffusion
factor but also how this mass is distributed along the molecule. A recent paper[42] shows that thecomplete mass contribution could be separated into two additive terms, the isotope one, representing themass difference as in previous section, and the contribution due to the mass distribution characterised bythe moment of inertia of the studied molecules. The simple LJ sphere approach is unable to catch theinfluence of the moment of inertia on the thermal diffusion. Therefore, we have performed simulationson diatomic molecules, which are modelled by two LJ spheres of methane linked together through ageometrically constraint bond,d. In this section, component 1 is a couple of two bonded methane spheresand component 2 is similar to the first one except that the mass of each of its atoms is different fromthose of component 1. Using such a description, both the effects of mass alone and of moment of inertiawill be taken into account. Two sets of simulations have been performed, the first one for a bond lengthequal to the atomic diameter of the methane and the second one for a bond length reduced by half.For each set of simulation, as only the mass differs from one simulation to another, (I1 − I2)/(I1 + I2)= (m1 − m2)/(m1 + m2). So the computedαT should be independent of the bond length comparing thevarious sets of simulations. Simulations have been carried out for a moment of inertia ratioI1/I2 varyingfrom 1 to 40.
Fig. 3shows that the computedαT for the two sets of simulations are very close to each other. Moreover,thermal diffusion is increased compared to the isotope contribution alone, indicating that a difference inthe moment of inertia between the two particles increases the separation. The influence of the moment ofinertia has a similar influence on thermal diffusion as that of the mass alone, as seen inFig. 3. Anotherinteresting feature is that this contribution, due to the rotation of the molecules, is linearly linked to thereduced moment of inertia, (I1 − I2)/(I1 + I2), for mass ratios below 20, when supposing its contributionin addition to the isotope one. The linear regressions on the computed values, drawn as solid and dashedstraight line inFig. 3, when averaged give:
αT = 1.427
((m1 − m2
m1 + m2
)+ 0.014
(m1
m2
)2/3
− 0.014
)+ 0.465
(I1 − I2
I1 + I2
). (8)
This feature agrees with what was previously found[41,42], except that in our case the moment of inertiacontribution is three times smaller than the one from the mass alone. Elsewhere, this dependence withthe mass distribution could explain the difference in thermal diffusion behaviour between normal andcycloalkanes.

G. Galliero et al. / Fluid Phase Equilibria 208 (2003) 171–188 179
Fig. 3. Thermal diffusion factors for various momentum of inertia ratios in simulations atT ∗ = 2.273 andρ∗ = 0.4227 ondiatomic molecules for:d = σCH4 (�); d = σCH4/2 (�). The results minus the isotope contributions are drawn for:d = σCH4
(�); d = σCH4/2 (�). The solid line representsEq. (8)and the dashed line represents the second term ofEq. (8).
The explanation of such positive contribution can be explained in the same manner as the one deducedfor the mass alone. The molecules with the bigger moment of inertia will rotate more slowly than theother ones and so will tend to migrate, compared to the other species, toward the area of strong density,which is located in the cold part of the simulation box.
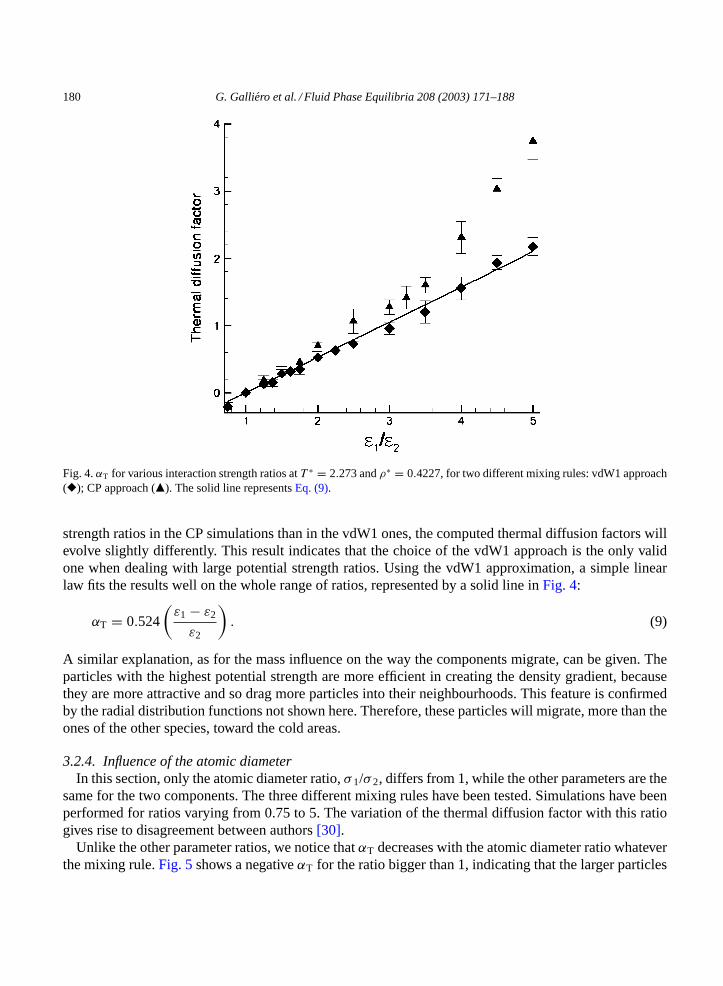
3.2.3. Influence of the potential strengthIn this section, while keeping masses and atomic diameters equal for the two species, the influence of
the interaction strength ratio,ε1/ε2, on the thermal diffusion factor is analysed. Simulations have beenperformed for a wide variety of ratios going from 0.75 to 5. The sensitivity to two mixing rules has beentested, the CP approach and the vdW1 approximation. The vdW1(3n) is strictly equivalent to the vdW1in this case.
As for the mass dependency,αT increases with the ratio whatever the mixing rules are.Fig. 4 showsa monotonically and linear rise of the thermal diffusion factor with the potential strength ratio for thevdW1 approach. An invert of the sign, below a ratio of 1, indicates that in all cases the component withthe largest potential strength prefers the cold areas, compared to the other species. This result agrees withprevious MD simulations[20,23]. The differences that arise from the two sets of simulations are onlydue to the weakness of the CP approach which induces a non-negligible drift of the reduced pressure.Keeping in mind thatP ∗ = 1.017 for a pure methane, the reduced pressure provided by the CP approachis 0.98 whenε1/ε2 = 2 and 0.928 whenε1/ε2 = 3, whereas in the vdW1 simulations,P ∗ = 1.014 and0.999 in the same circumstances. Therefore, as the reduced pressure decreases quicker with the potential
180 G. Galliero et al. / Fluid Phase Equilibria 208 (2003) 171–188
Fig. 4.αT for various interaction strength ratios atT ∗ = 2.273 andρ∗ = 0.4227, for two different mixing rules: vdW1 approach(�); CP approach (�). The solid line representsEq. (9).
strength ratios in the CP simulations than in the vdW1 ones, the computed thermal diffusion factors willevolve slightly differently. This result indicates that the choice of the vdW1 approach is the only validone when dealing with large potential strength ratios. Using the vdW1 approximation, a simple linearlaw fits the results well on the whole range of ratios, represented by a solid line inFig. 4:
αT = 0.524
(ε1 − ε2
ε2
). (9)
A similar explanation, as for the mass influence on the way the components migrate, can be given. Theparticles with the highest potential strength are more efficient in creating the density gradient, becausethey are more attractive and so drag more particles into their neighbourhoods. This feature is confirmedby the radial distribution functions not shown here. Therefore, these particles will migrate, more than theones of the other species, toward the cold areas.
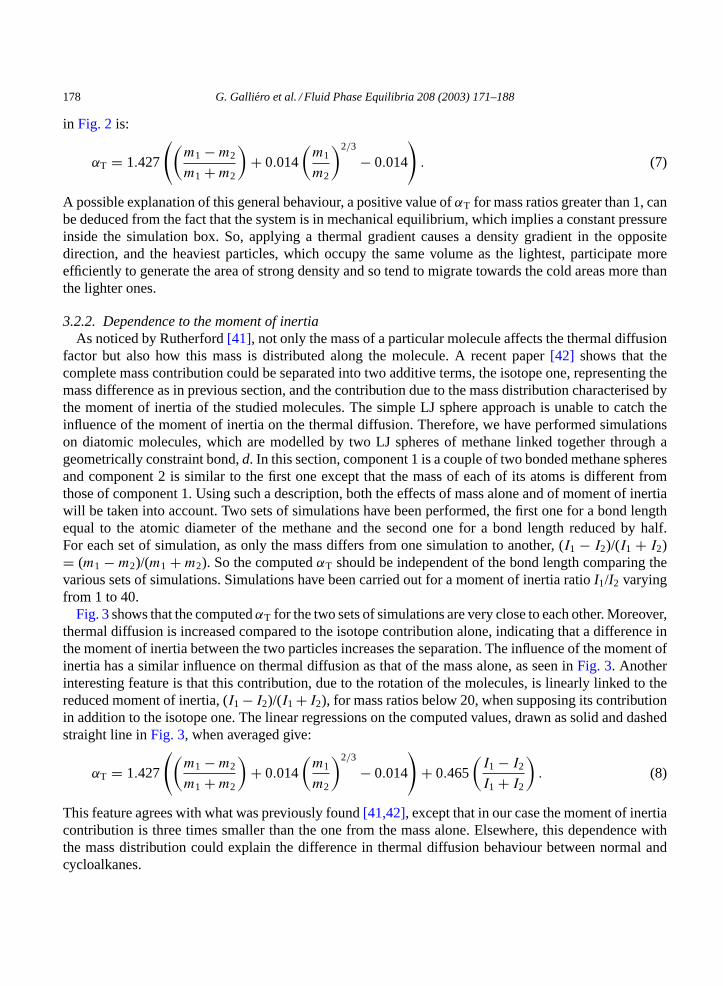
3.2.4. Influence of the atomic diameterIn this section, only the atomic diameter ratio,σ 1/σ 2, differs from 1, while the other parameters are the
same for the two components. The three different mixing rules have been tested. Simulations have beenperformed for ratios varying from 0.75 to 5. The variation of the thermal diffusion factor with this ratiogives rise to disagreement between authors[30].
Unlike the other parameter ratios, we notice thatαT decreases with the atomic diameter ratio whateverthe mixing rule.Fig. 5shows a negativeαT for the ratio bigger than 1, indicating that the larger particles
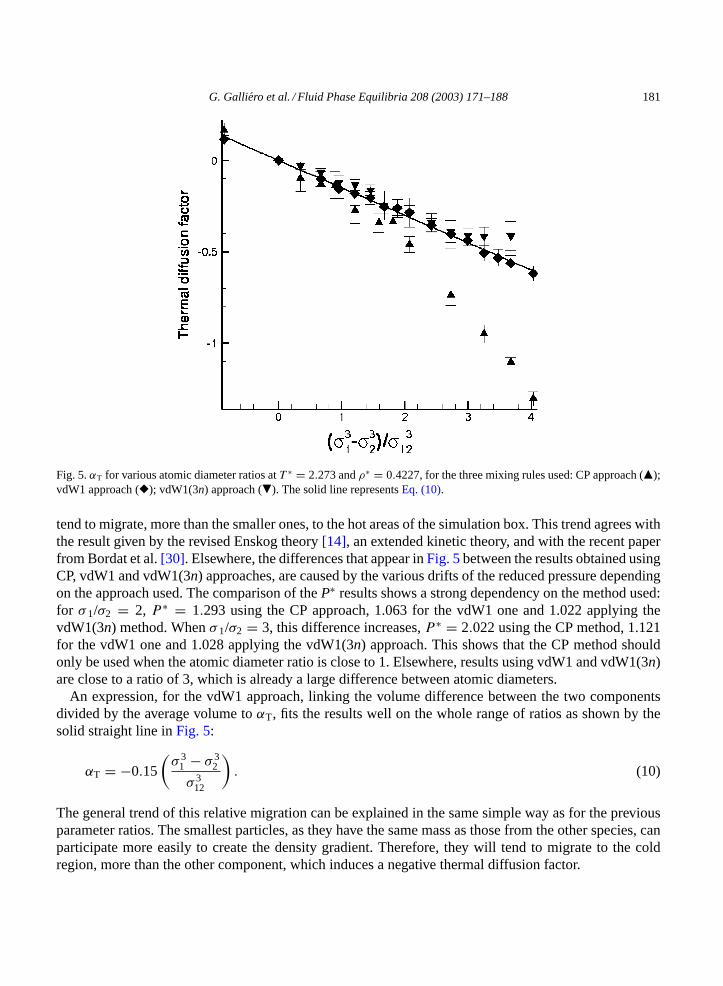
G. Galliero et al. / Fluid Phase Equilibria 208 (2003) 171–188 181
Fig. 5.αT for various atomic diameter ratios atT ∗ = 2.273 andρ∗ = 0.4227, for the three mixing rules used: CP approach (�);vdW1 approach (�); vdW1(3n) approach (�). The solid line representsEq. (10).
tend to migrate, more than the smaller ones, to the hot areas of the simulation box. This trend agrees withthe result given by the revised Enskog theory[14], an extended kinetic theory, and with the recent paperfrom Bordat et al.[30]. Elsewhere, the differences that appear inFig. 5between the results obtained usingCP, vdW1 and vdW1(3n) approaches, are caused by the various drifts of the reduced pressure dependingon the approach used. The comparison of theP∗ results shows a strong dependency on the method used:for σ 1/σ2 = 2, P ∗ = 1.293 using the CP approach, 1.063 for the vdW1 one and 1.022 applying thevdW1(3n) method. Whenσ 1/σ2 = 3, this difference increases,P ∗ = 2.022 using the CP method, 1.121for the vdW1 one and 1.028 applying the vdW1(3n) approach. This shows that the CP method shouldonly be used when the atomic diameter ratio is close to 1. Elsewhere, results using vdW1 and vdW1(3n)are close to a ratio of 3, which is already a large difference between atomic diameters.
An expression, for the vdW1 approach, linking the volume difference between the two componentsdivided by the average volume toαT, fits the results well on the whole range of ratios as shown by thesolid straight line inFig. 5:
αT = −0.15
(σ 3
1 − σ 32
σ 312
). (10)
The general trend of this relative migration can be explained in the same simple way as for the previousparameter ratios. The smallest particles, as they have the same mass as those from the other species, canparticipate more easily to create the density gradient. Therefore, they will tend to migrate to the coldregion, more than the other component, which induces a negative thermal diffusion factor.

182 G. Galliero et al. / Fluid Phase Equilibria 208 (2003) 171–188
3.2.5. Influence of the cross-interaction parametersThe accurate estimation of the thermal diffusion process is often considered as a good test for the
intermolecular potential between unlike molecules. As we have applied modified Lorentz–Berthelot rules,Eqs. (5) and (6), by modifying the two cross-parameters separately it is possible to evaluate the influenceof such modifications in the cross-interactions. So, we have performed simulations on an equimolarmethane/n-decane mixture using the vdW1 approach, for various typical values ofkij and lij . The LJparameters are drawn from[35].
Fig. 6 clearly shows a strong dependence of the thermal diffusion factor with the cross-parameters.The straight lines inFig. 6represent the best linear fit on the whole domain, which indicates that thermaldiffusion increases withkij and decrease withlij . These opposite trends are consistent with the separatecontributions due to the potential strength and the atomic diameter, askij andlij are linked to those twomolecular parameters. The discrepancy on the computedαT goes up to 50% for the largest, but typical,values compared to the results obtained using classical Lorentz–Berthelot rules, which corresponds tokij = 0 andlij = 0. Elsewhere, the contributions of these cross-interaction parameters to the thermaldiffusion are nearly linear on the range where simulations have been performed as seen inFig. 6.
This strong dependence should be taken into account when comparing experimental or flexible moleculeresults with Lennard–Jones ones, because a slight difference in the cross-parameters yields a large vari-ation on the computed thermal diffusion factor. Elsewhere, this strong dependence may be used, formixtures where reliable experimental values of thermal diffusion are known, to complete the neededknowledge of these cross-interaction parameters.
A possible explanation of the contributions induced by one of these parameters may be given. Anincrease of (1− kij ) means a stronger attraction between unlike particles and so tends to homogenise themixture leading to a decrease of thermal diffusion. No physical explanation concerning the influence oflij can be provided for the moment.
3.2.6. Coupling between contributionsAll the results of previous sections concern separate contributions of the molecular parameters to
the thermal diffusion factor. But thermal diffusion in real mixtures is a combination of these separatecontributions. In order to study the possible couplings between these various effects, we have performedsimulations in an equimolar molar mixture of methane, component 2, mixed with a pseudo-n-decane,component 1, using the vdW1 approximation. By pseudo-n-decane, we mean that while two molecularparameters of component 1 are kept equal to those ofn-decane, the last one varies. So, if couplingsexist, the shape of the curves obtained for such configurations should be the same as those inFigs. 2, 4and 5. In the case where no couplings occur, a simple translation will superpose the curves obtained inthese circumstances and those when only one parameter changes at a time. For this particular mixture,methane/n-decane, the differences compared to the values computed when only one parameter ratio isdifferent from 1, are, supposing the two other contributions as additive, 0.9 for the mass variation, 2.38for the atomic diameter dependence and 0.94 for the potential strength influence.
Fig. 7clearly indicates that couplings exist, especially for the atomic diameter case. Firstly, the squareand the diamond curves do not have exactly the same slopes, showing an increase in the couplings with theparameter ratios. Secondly, in all cases, except for small atomic diameter ratios, the differences betweenthe two curves of each figure is smaller than the predicted difference, coming from a sum of the two otherseparate contributions. This confirms the existence of couplings between the various contributions to thethermal diffusion factor[19], which reduce the thermal diffusion effect.

G.G
allie
roe
tal./F
luid
Ph
ase
Eq
uilib
ria2
08
(20
03
)1
71
–1
88
183
Fig. 6. Thermal diffusion factors for an equimolar methane/n-decane mixture atT ∗ = 2.273 andρ∗ = 0.4227 for various cross-interaction parameters comingfrom Eqs. (5) and (6). The solid lines represent linear regressions.

184 G. Galliero et al. / Fluid Phase Equilibria 208 (2003) 171–188
Fig. 7. Comparison ofαT dependence with the three separate parameter ratios for two different components 1 atT ∗ = 2.273andρ∗ = 0.4227. The first one having the two non-varying molecular LJ parameter ratios equal to 1 (�) and the second onethese two ratios different from 1 (�). The solid and the dashed lines represent linear regressions.
Elsewhere, the atomic diameter is the parameter which is the most subject to couplings, as shown bythe large difference between the solid curve and the dashed one on the bottom right inFig. 7. This generaltrend is confirmed by the results obtained in real mixtures, described in next section.
3.2.7. Alkanes equimolar mixturesAs the final aim of this work is to be able to estimate thermal diffusion factors for real mixtures,
simulations on equimolar alkane mixtures have been carried out. As in previous sections, component 2
G. Galliero et al. / Fluid Phase Equilibria 208 (2003) 171–188 185
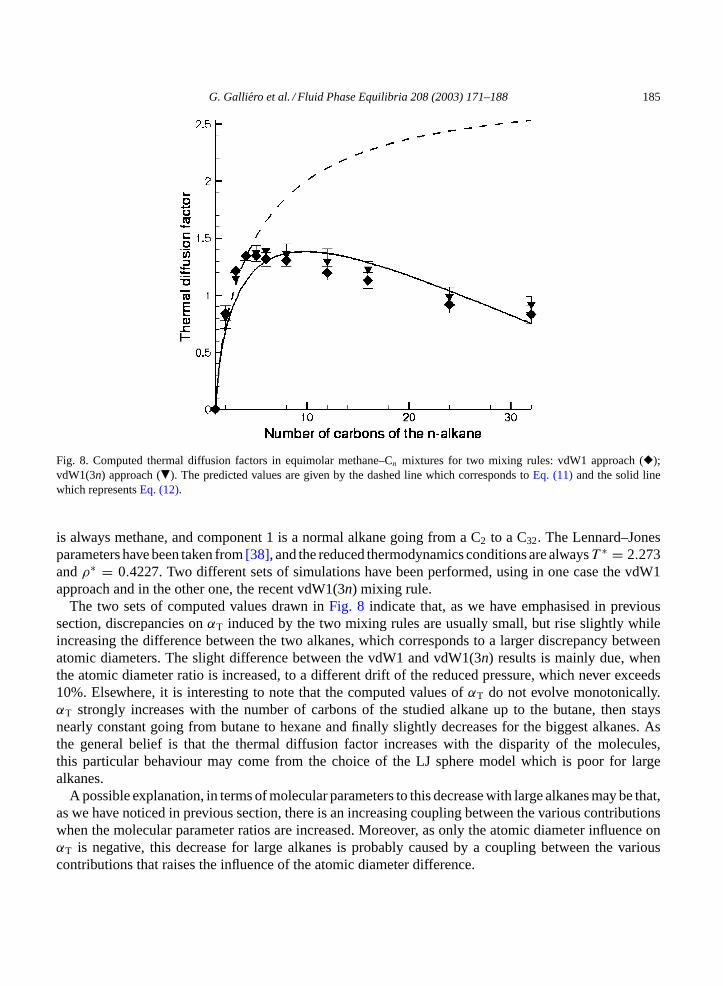
Fig. 8. Computed thermal diffusion factors in equimolar methane–Cn mixtures for two mixing rules: vdW1 approach (�);vdW1(3n) approach (�). The predicted values are given by the dashed line which corresponds toEq. (11)and the solid linewhich representsEq. (12).
is always methane, and component 1 is a normal alkane going from a C2 to a C32. The Lennard–Jonesparameters have been taken from[38], and the reduced thermodynamics conditions are alwaysT ∗ = 2.273andρ∗ = 0.4227. Two different sets of simulations have been performed, using in one case the vdW1approach and in the other one, the recent vdW1(3n) mixing rule.
The two sets of computed values drawn inFig. 8 indicate that, as we have emphasised in previoussection, discrepancies onαT induced by the two mixing rules are usually small, but rise slightly whileincreasing the difference between the two alkanes, which corresponds to a larger discrepancy betweenatomic diameters. The slight difference between the vdW1 and vdW1(3n) results is mainly due, whenthe atomic diameter ratio is increased, to a different drift of the reduced pressure, which never exceeds10%. Elsewhere, it is interesting to note that the computed values ofαT do not evolve monotonically.αT strongly increases with the number of carbons of the studied alkane up to the butane, then staysnearly constant going from butane to hexane and finally slightly decreases for the biggest alkanes. Asthe general belief is that the thermal diffusion factor increases with the disparity of the molecules,this particular behaviour may come from the choice of the LJ sphere model which is poor for largealkanes.
A possible explanation, in terms of molecular parameters to this decrease with large alkanes may be that,as we have noticed in previous section, there is an increasing coupling between the various contributionswhen the molecular parameter ratios are increased. Moreover, as only the atomic diameter influence onαT is negative, this decrease for large alkanes is probably caused by a coupling between the variouscontributions that raises the influence of the atomic diameter difference.

186 G. Galliero et al. / Fluid Phase Equilibria 208 (2003) 171–188
Elsewhere, we have tried to see whether it is possible to deduce these results, obtained on realmixtures, from those obtained on separate molecular parameters contributions, thanks to a simple com-bination of the previous correlations found (Eqs.(6), (7) and (9)). First, using the separate contribu-tions in the same way as in[23], a simple sum between all the separate contributions has beentested:
αT
(m1
m2,σ1
σ2,ε1
ε2
)= αT
(m1
m2
)+ αT
(σ1
σ2
)+ αT
(ε1
ε2
), (11)
where the three separate contributions in the RHS term ofEq. (11)are calculated, thanks toEqs. (7), (9)and (10). In a previous paper[19], we have shown that this simple assumption is able to predict quiteaccurately the results when the molecular parameter ratios are not too far from 1. A comparison, inFig. 8,between the computed values, the symbols, and the prediction ofEq. (11), the dashed curve, confirms thisresult. The dashed curve, inFig. 8, shows thatEq. (11)is able to give a good prediction for the smallestalkanes, up to then-pentane, but when there is a large discrepancy between the two components,Eq. (11)strongly overestimates the thermal diffusion factor.
Therefore, we have tried to find another simple formulation that could provide a reasonable predictioneven when the atomic diameter ratio is large, in order to be able to predict thermal diffusion for a widevariety of mixtures. A slightly modified version ofEq. (11), where only the coefficient devoted to theatomic diameter contribution is different from 1, has been chosen:
αT
(m1
m2,σ1
σ2,ε1
ε2
)= αT
(m1
m2
)+ αT
(ε1
ε2
)+ 1.8
(σ1
σ2
)αT
(σ1
σ2
). (12)
For all the simulations carried out,Eq. (12) is able to predictαT at ±15%. The solid line inFig. 8shows thatEq. (12)is able to correctly predict the thermal diffusion factor even when a large discrepancyexists between the two studied alkanes. But for the small alkanes,Eq. (12)is less accurate thanEq. (11).Nevertheless, compared to the simplicity ofEq. (12), the prediction is quite precise. This means that,for the tested mixtures, starting from the separate contributions, described byEqs. (7), (9) and (10), itis possible to predict correctly the thermal diffusion factor for real mixtures. However, work should bedone to enhance the analysis of the couplings between the separate contributions in order to improve theaccuracy of the predictions.
4. Conclusion
In this work, using molecular dynamics simulations, a systematic study of the thermal diffusionfactor behaviour with the molecular parameters in an equimolar LJ binary mixture has been carriedout.
Firstly, comparisons of the simple LJ spheres model with experimental and more comprehensivenumerical results on pentane/n-decane mixtures have indicated that, provided there is sufficient timeand particle numbers, a good estimation of the amplitude of the thermal diffusion factor could be ob-tained.
Elsewhere, systematic simulations on “synthetic” equimolar binary mixtures in supercritical conditionshave shown that the species with the biggest mass and moment of inertia, with the strongest potential andthe smallest volume, tends to migrate more than the other component, toward the cold areas. Moreover,
G. Galliero et al. / Fluid Phase Equilibria 208 (2003) 171–188 187
simple laws linkingαT with these molecular parameters could be gained when using appropriate mixingrules like the vdW1 one, in order to follow the law of the corresponding state.
Furthermore, we have found that, as expected, the thermal diffusion is strongly linked to the interactionsbetween unlike particles. The two cross-interaction parameters have a large and opposite influence on thecomputed thermal diffusion factor, indicating that thermal diffusion evaluation could be used as an aid toprecisely determine intermolecular potentials.
Finally, it is shown that for real mixtures, the addition of the contributions of the separate molecularparameters describing LJ spheres provides a good estimation of the thermal diffusion factor, especiallywhen the molecular parameter ratios between the two components are close to 1.
List of symbolsD12 mutual diffusion coefficient (m2 s−1)DT thermal diffusion coefficient (m2 s−1 K−1)h timestep (s)Ii moment of inertia of componenti (kg m2)J mass flux (kg m−1 s−1)kB Boltzmann’s constant (J K−1)kij cross-interaction parameter on energy between componenti andjlij cross-interaction parameter on length between componenti andjmi molar mass of componenti (kg mol−1)n power parameter in the mixing rules of Chen et al.[32]N number of moleculesP pressure (Pa)P∗ reduced pressurerc cut-off radius (m)rij distance between sitei andj (m)T temperature (K)T∗ reduced temperatureUij Lennard–Jones potential (J)V volume (m3)wi mass fraction of componentixi molar fraction of componenti
Greek symbolsαTi
thermal diffusion factor of componentiα∗
T reduced thermal diffusion factorεij Lennard–Jones potential parameter between sitei andj (J)εx equivalent Lennard–Jones potential parameter (J)λ thermal conductivity (W m−1 K−1)λ∗ reduced thermal conductivityρ mass density (kg m−3)σ ij Lennard–Jones potential parameter between sitei andj (m)σx equivalent Lennard–Jones potential parameter (m)

188 G. Galliero et al. / Fluid Phase Equilibria 208 (2003) 171–188
Acknowledgements
We wish to thank TotalFinaElf exploration production for a grant for one of us (G.G.). We thankthe Centre Informatique National de l’Enseignement Supérieur (CINES) in Montpellier (France) and theInstitut du Développement et des Ressources en Informatique Scientifique (IDRIS), Orsay, France, whichprovided a large part of the computer time for this study.
References
[1] S.R. De Groot, P. Mazur, Non-Equilibrium Thermodynamics, Dover, New York, 1984.[2] J.M. Kincaıd, B. Hafskjold, Mol. Phys. 82 (1994) 1099–1114.[3] B. Faissat, F. Montel, Entropie 198–199 (1996) 107–108.[4] B. Wilbois, G. Galliéro, J.-P. Caltagirone, F. Montel, Proceedings of SFT 2002, Elsevier, Amsterdam, 2002, pp. 485–490.[5] J.-C. Legros, P. Goemaere, J.K. Platten, Phys. Rev. A 32 (1985) 1903–1905.[6] W. Köhler, B. Müller, J. Chem. Phys. 103 (1995) 4367–4370.[7] S. Van Vaerenbergh, J.-C. Legros, J.C. Dupin, Adv. Space Res. 16 (1995) 69–81.[8] K.J. Zhang, M.E. Briggs, R.W. Gammon, J.V. Sengers, J. Chem. Phys. 104 (1996) 6881–6892.[9] O. Eccenaro, J.A. Madariaga, C.M. Santamaria, M.M. Bou-Ali, J. Valencia, Entropie 198–199 (1996) 71–76.
[10] L.J.T.M. Kempers, J. Chem. Phys. 115 (2001) 6330–6341.[11] R. Haase, Thermodynamics of Irreversible Process, Addison-Wesley, Reading, MA, 1969.[12] A. Firoozabadi, K. Ghorayeb, K. Shukla, AIChE J. 46 (2000) 892–900.[13] S. Chapman, T. Cowling, The Mathematical Theory of Non-Uniform Gases, Cambridge University Press, Cambridge, 1981.[14] J.M. Kincaıd, E.G.D. Cohen, M.L. de Haro, J. Chem. Phys. 86 (1987) 963–975.[15] F.S. Gaeta, Phys. Rev. 182 (1969) 289–296.[16] P.G. Wright, Z. Phys. Chem. Neue Folge 75 (1971) 58–62.[17] J. Colombani, J. Bert, J. Dupuy-Philon, J. Chem. Phys. 110 (1999) 8622–8627.[18] B. Hafskjold, T. Ikeshoji, S.K. Ratkje, Mol. Phys. 80 (1993) 1389–1412.[19] G. Galliéro, B. Duguay, J.-P. Caltagirone, F. Montel, IHTC12 Proceedings, vol. 1, Elsevier, Amsterdam, 2002, pp. 477–482.[20] A. Maghari, S. Yeganegi, J. Phys. Soc. Jpn. 69 (2000) 1389–1393.[21] R. Vogelsang, C. Hoheisel, Phys. Rev. A 38 (1988) 6296–6303.[22] D.M. Heyes, J. Chem. Phys. 96 (1992) 2217–2227.[23] D. Reith, J.F. Müller-Plathe, J. Chem. Phys 112 (2000) 2436–2443.[24] J.-M. Simon, D.K. Dysthe, A.H. Fuchs, B. Rousseau, Fluid Phase Equilib. 150–151 (1998) 151–159.[25] G. Galliéro, B. Duguay, J.-P. Caltagirone, F. Montel, Entropie 239–240 (2002) 93–97.[26] J.-M. Simon, Ph.D. thesis, Université Paris XI, Orsay, France, 1997.[27] G. Galliéro, J. Colombani, B. Duguay, J.-P. Caltagirone, F. Montel, Entropie 239–240 (2002) 98–102.[28] J. Colombani, G. Galliéro, B. Duguay, J.-P. Caltagirone, F. Montel, P.A. Bopp, Phys. Chem. Chem. Phys. 4 (2002) 313–321.[29] D.C. Rapaport, The Art of Molecular Dynamics Simulation, Cambridge University Press, Cambridge, 1995.[30] P. Bordat, D. Reith, J.F. Müller-Plathe, J. Chem. Phys. 115 (2001) 8978–8982.[31] T.W. Leland, J.S. Rowlinson, G.A. Sather, Trans. Faraday Soc. 64 (1968) 1447–1460.[32] J. Chen, J.-G. Mi, K.-Y. Chan, Fluid Phase Equilib. 178 (2001) 87–95.[33] J. Jackle, H. Kawai, Physica A 291 (2001) 184–196.[34] L. Bocquet, J.-L. Barrat, J. Phys. Condens. Matter 8 (1996) 9297–9300.[35] J.-M. Simon, B. Rousseau, D.K. Dysthe, B. Hafskjold, Entropie 35 (1999) 29–34.[36] A. Perronace, Ph.D. thesis, Université Paris XI, Orsay, France, 2001.[37] A. Perronace, C. Leppla, F. Leroy, B. Rousseau, S. Wiegand, J. Chem. Phys. 116 (2002) 3718–3729.[38] T. Sun, A.S. Teja, Ind. Eng. Chem. Res. 37 (1998) 3151–3158.[39] R.C. Jones, Phys. Rev. 58 (1940) 111–122.[40] S. Van Vaerenbergh, J.-P. Garandet, J.-P. Praizey, J.-C. Legros, Phys. Rev. E 58 (1998) 1866–1873.[41] W.M. Rutherford, J. Chem. Phys. 86 (1987) 5217–5218.[42] C. Debuschewitz, W. Köhler, Phys. Rev. Lett. 87 (2001) 055901-1–055901-4.
Related Documents