National Aeronautics and Space Administration Langley Research Center • Hampton, Virginia 23681-2199 NASA Technical Memorandum 4787 Thermal Conductivity Database of Various Structural Carbon-Carbon Composite Materials Craig W. Ohlhorst, Wallace L. Vaughn, Philip O. Ransone, and Hwa-Tsu Tsou Langley Research Center • Hampton, Virginia November 1997

Welcome message from author
This document is posted to help you gain knowledge. Please leave a comment to let me know what you think about it! Share it to your friends and learn new things together.
Transcript

National Aeronautics and Space AdministrationLangley Research Center • Hampton, Virginia 23681-2199
NASA Technical Memorandum 4787
Thermal Conductivity Database of VariousStructural Carbon-Carbon Composite MaterialsCraig W. Ohlhorst, Wallace L. Vaughn, Philip O. Ransone, and Hwa-Tsu TsouLangley Research Center • Hampton, Virginia
November 1997

Printed copies available from the following:
NASA Center for AeroSpace Information National Technical Information Service (NTIS)800 Elkridge Landing Road 5285 Port Royal RoadLinthicum Heights, MD 21090-2934 Springfield, VA 22161-2171(301) 621-0390 (703) 487-4650
The use of trademarks or names of manufacturers in this report is foraccurate reporting and does not constitute an official endorsement,either expressed or implied, of such products or manufacturers by theNational Aeronautics and Space Administration.
Available electronically at the following URL address: http://techreports.larc.nasa.gov/ltrs/ltrs.html

iii
Contents
Abbreviations . . . . . . . . . . . . . . . . . . . . . . . . . . . . . . . . . . . . . . . . . . . . . . . . . . . . . . . . . . . . . . . . . . . . . v
Abstract . . . . . . . . . . . . . . . . . . . . . . . . . . . . . . . . . . . . . . . . . . . . . . . . . . . . . . . . . . . . . . . . . . . . . . . . . . 1
Introduction . . . . . . . . . . . . . . . . . . . . . . . . . . . . . . . . . . . . . . . . . . . . . . . . . . . . . . . . . . . . . . . . . . . . . . . 1
Experimental Procedures . . . . . . . . . . . . . . . . . . . . . . . . . . . . . . . . . . . . . . . . . . . . . . . . . . . . . . . . . . . . . 1
Results . . . . . . . . . . . . . . . . . . . . . . . . . . . . . . . . . . . . . . . . . . . . . . . . . . . . . . . . . . . . . . . . . . . . . . . . . . . 3
Concluding Remarks . . . . . . . . . . . . . . . . . . . . . . . . . . . . . . . . . . . . . . . . . . . . . . . . . . . . . . . . . . . . . . . . 3
References . . . . . . . . . . . . . . . . . . . . . . . . . . . . . . . . . . . . . . . . . . . . . . . . . . . . . . . . . . . . . . . . . . . . . . . . 3
Tables . . . . . . . . . . . . . . . . . . . . . . . . . . . . . . . . . . . . . . . . . . . . . . . . . . . . . . . . . . . . . . . . . . . . . . . . . . . 4
Figures . . . . . . . . . . . . . . . . . . . . . . . . . . . . . . . . . . . . . . . . . . . . . . . . . . . . . . . . . . . . . . . . . . . . . . . . . . 33


v
Abbreviations
C-C carbon-carbon composites
CCAT Carbon-Carbon Advanced Technologies
CVD chemical vapor deposition
CVI chemical vapor infiltration
Condit conditioning
FAW fabric areal weight
fab fabrication
HSW harness satin weave
HT heat treatment
ip in-plane
LaRC Langley Research Center
LoPIC Low-pressure Pitch Impregnation and Carbonization
Max maximum
orth orthogonal
PPC preceramic polymer coating
t-t-t through-the-thickness
temp temperature
3-D three-dimensional


Abstract
Advanced thermal protection materials envisioned for use on future hypersonicvehicles will likely be subjected to temperatures in excess of 1811 K (2800°F) and,therefore, will require the rapid conduction of heat away from the stagnation regionsof wing leading edges, the nose cap area, and from engine inlet and exhaust areas.Carbon-carbon composite materials are candidates for use in advanced thermalprotection systems. For design purposes, high temperature thermophysical propertydata are required, but a search of the literature found little thermal conductivity datafor carbon-carbon materials above 1255 K (1800°F). Because a need was recognizedfor in-plane and through-the-thickness thermal conductivity data for carbon-carboncomposite materials over a wide temperature range, Langley Research Center(LaRC) embarked on an effort to compile a consistent set of thermal conductivityvalues from room temperature to 1922 K (3000°F) for carbon-carbon compositematerials on hand at LaRC for which the precursor materials and thermal processinghistory were known. This report documents the thermal conductivity data gener-ated for these materials. In-plane thermal conductivity values range from 10to 233 W/m-K, whereas through-the-thickness values range from 2 to 21 W/m-K.
Introduction
Advanced thermal protection systems envisioned foruse on future hypersonic vehicles will likely be subjectedto temperatures in excess of 1811 K and, therefore, willrequire the rapid conduction of heat away from the stag-nation regions of wing leading edges, the nose cap area,and from engine inlet and exhaust areas. Carbon-carbon(C-C) composite materials are lightweight, retain theirstrength at high temperatures, and have high and tailor-able thermal conductivity. These characteristics makethem attractive candidates as advanced thermal systemmaterials.
Carbon-carbon composites comprise a family ofmaterials having a carbon matrix reinforced with carbonfibers. A large variety of both fibers and matrix precursormaterials is used. The choice of precursor materials andthe thermal processing used to fabricate the compositesare major factors which determine the thermophysicalproperties of the materials. Availability of this informa-tion enables the user (designer or researcher) to betterutilize the thermophysical property data and allows formore meaningful comparisons between data sets. Asearch of the literature found little thermal conductivitydata for C-C materials above 1255 K. In some instances,thermal conductivity data were reported, but an adequatedescription of the precursor materials and the thermalprocessing history was not reported.
Because a need was recognized for in-plane andthrough-the-thickness thermal conductivity data for C-Ccomposite materials over a wide temperature range,Langley Research Center (LaRC) embarked on an effortto compile a consistent set of thermal conductivity valuesfrom room temperature to 1922 K for C-C compositematerials on hand at LaRC for which the precursor mate-rials and thermal processing history were known. This
report documents the thermal conductivity data gener-ated for these materials.
Experimental ProceduresTable 1 gives a description of the 28 materials for
which thermal diffusivity measurements were made andreported in this report. All the materials were derivedfrom previous studies aimed at improving mechanicalproperties and/or oxidation resistance. Material speci-mens 1 through 10 and 16 through 18 were fabricated toinvestigate the effects of different reinforcements anddifferent densification techniques on mechanical proper-ties. Material specimens 11 through 15 were fabricated toexplore the benefits of candidate substrate oxidationinhibitors and coating types. Material specimens 19through 26 were fabricated to investigate the effects ofchemical vapor infiltration (CVI) processing parameterson the thermal conductivity and mechanical properties ofcarbon-carbon composites. Material specimens 27and 28 were fabricated as candidate materials for a ther-mal shield on a proposed NASA Solar Probe Spacecraft.
The source of each material is in the second columnof table 1. The fiber type and tow size are in the third col-umn. Most of the materials were made with AmocoT-300 fiber. Two materials were made with Amoco T-50fiber, four were made with Celanese Celion fiber, andtwo were made with Mitsubishi Kasel DIALEAD K321fiber. All specimens except the four that were made withCelion fibers were constructed by using an 8 harnesssatin weave (8HSW) fabric. The number of tows per inchin both the warp and fill direction is given. Material spec-imens 16, 17, and 18 are stitched panels. A detaileddescription of their construction is given in reference 1.The weave construction for the materials made with theCelion fiber were 3-D orthogonal. A detailed descriptionof the construction of these four material panels (material

2
specimens 7 through 10) is given in reference 2. Thelayup for all materials except those made with the Celionfiber was 0/90°, and most of them were 7- or 8-plylaminates.
All the materials were initially prepared by pre-pregging the fabric/3-D preforms with a phenolic resinand molding into carbon-phenolic composites. The phe-nolic resin was then converted into the carbon matrix byinert-environment pyrolysis. A variety of densificationmethods was used to increase the densities of these com-posites to desired levels. Phenolic resin was the matrixfor about one-third the materials. CVI-deposited pyro-lytic carbon was the matrix for another third. Two Rohr,Inc., densification processes, designated by them as“Low-pressure Pitch Impregnation and Carbonization(LoPIC)” and “hybrid,” were used on the remaining thirdof the materials. In the LoPIC process, both phenolicresin and pitch are used as matrix material. The hybridprocess is a combination of using CVI and LoPICprocesses.
The fiber heat treatment temperature and maximumcomposite fabrication temperature are also given in thetable. For material specimens 1 through 18, the fabrichad heat treatment temperatures of 2273 K except thethree made by the Boeing Company and Rohr whichwere heat treated at 2423 K. The maximum compositefabrication temperature was either 1173 K or 1923 Kexcept for specimen 15; this material had been coated ata temperature of about 2033 K. In order to get a moredirect comparison of results between the uncoated mate-rials in the original set of 18, the decision was made thatthe finished composite materials (1–10 and 16–18)should all be conditioned to the same final temperature.The finished composites were heated to the fiber heattreatment temperature of 2273 K. None of the commer-cial materials (11 through 15) were conditioned, sincethe thermophysical property data would not be represen-tative of off-the-shelve commercial material. The fiberheat treatment temperature for material specimens 19through 26 was 2623 K and the CVI densification wasdone at 1323 K. The fibers in both material specimens 27and 28 were heat treated to 2273 K. Material 27 had amaximum composite fabrication temperature of 2373 K,whereas material 28 had a maximum composite fabrica-tion temperature of 2973 K.
The tenth column in table 1 indicates whether thematerial contained inhibitors and/or had been coated.The three Boeing/Rohr materials are the only ones tohave inhibitors. The nomenclature of 0.2 FAW desig-nates 20 percent by fabric areal weight. Two of theBoeing/Rohr materials (12 and 13) and material 15 arethe only three coated materials. The next to last columnlists the direction in which the thermophysical properties
were measured. Coated materials were only measured inthe through-the-thickness direction for reasons discussedin the next paragraph. The last column gives additionalinformation on the construction of the 3-D and stitchedmaterials.
Material specimens were provided to D. P. H.Hasselman at the Virginia Polytechnic Institute and StateUniversity for thermal diffusivity characterization. Thethermal diffusivity was measured by the flash diffusivitymethod, which basically consists of subjecting one sideof a sample to a single laser flash and then monitoringthe transient temperature response on the other side(refs. 3 and 4). A round specimen, 0.45 inch in diameter,was used for through-the-thickness direction measure-ments. For in-plane measurements, a square specimenwas used. This square specimen was fabricated by cut-ting rectangular pieces 0.118 inch wide by 0.340 inchhigh and then stacking sufficient pieces together in thethickness direction to make the stack approximately0.340 inch thick. In-plane diffusivity measurements werenot made on the three coated materials because the stack-ing of the rectangular pieces required for the in-planespecimen would have left columns of coating within thestacked thickness and thus would have invalidated themeasurement. Data were taken in increments of approxi-mately 373 K from room temperature to 1938 K formaterial specimens 1 through 26 and to 2448 K for mate-rial specimens 27 and 28. The data reported byHasselman to LaRC were temperature and thermaldiffusivity.
The thermal conductivity k of a material is related toits thermal diffusivity data by the following equation(ref. 4):
whereρ is the density;α, the thermal diffusivity; andcp,the heat capacity (specific heat). Bulk density measure-ments at room temperature were obtained from mass andvolume measurements. Although the density of carbon-carbon material does change slightly with temperature,this change was neglected because only minimal error isintroduced. Carbon-carbon composites made with T-300fibers have an in-plane coefficient of thermal expansion(CTE) of 0.56× 10⁻⁶/K and through-the-thickness CTEof 2.04× 10⁻⁶/K values from 811 K to 1366 K (ref. 5).With the use of these CTE values, the volume of thematerial would increase a maximum of about 1.5 percentfrom room temperature to 1922 K. This volume changewas considered to be sufficiently small so that densitycould be taken as a constant for the thermal conductivitycalculations reported in this paper.
Experimental values of the specific heat of graphiticmaterials taken from figure 2B-1 of reference 6 are
k ραcp=

3
plotted in figure 1. These data were curve fitted with thefollowing empirical equation:
whereT is temperature in kelvins.
The values of specific heat reported in this reportand subsequently used to calculate thermal conductivitywere calculated by this equation. This equation cannot beused to calculate the specific heat for coated materialsbecause it does not take into account the coating. Sincespecific heat was not experimentally measured, there areno heat capacity data for the three coated materials; thus,thermal conductivity values are not reported for thosematerials.
Results
Figures 2 and 3 summarize the thermal conductivityresults. Figure 2 shows the range of in-plane thermalconductivity data for materials evaluated in this report,and figure 3 shows the range of through-the-thicknessthermal conductivity data. The temperatures and corre-sponding thermophysical property data for the individualmaterials are shown in tables 2 through 29. Thermal dif-fusivity as a function of temperature is plotted for allmaterials (figs. 4 through 31). Values are given in bothsquare centimeters per second (cm2/s) and square feetper hour (ft2/hr). Temperatures are shown in both kelvin(K) and degrees Fahrenheit (°F). For uncoated materials,both in-plane and through-the-thickness values are plot-ted. For coated materials, only through-the-thickness val-ues are shown because that was the only direction inwhich measurements were made. For both in-plane andthrough-the-thickness directions, thermal diffusivity val-ues are maximum at room temperature and decrease withincreasing temperature. Values are fairly flat from 1200to 1900 K.
Thermal conductivity values for each of theuncoated materials are plotted in figures 32 through 56.Thermal conductivity in units of both watts per meter-kelvin (W/m-K) and British thermal units per hour-feet-degrees Fahrenheit (Btu/hr-ft-°F) are given as a functionof temperature in both kelvins and degrees Fahrenheit.For the in-plane direction, maximum thermal conductiv-ity values ranged from 20 to 68 W/m-K for all materialsexcept that of material 28, which had a maximum valueof 233 W/m-K. For the through-the-thickness direction,maximum thermal conductivity values ranged from 3to 12 W/m-K for all materials except that of material 28which had a maximum value of 21 W/m-K. In generalmaximum thermal conductvity occurred around 500 K.
As with the thermal diffusivity values, thermal conduc-tivity values were fairly flat from 1200 to 1900 K.
Concluding Remarks
Carbon-carbon composite materials are candidatesfor use in advanced thermal protection systems. Becausea need was recognized for in-plane and through-the-thickness thermal conductivity data for carbon-carboncomposite materials over a wide temperature range,Langley Research Center (LaRC) embarked on an effortto compile a consistent set of thermal conductivity valuesfrom room temperature to 1922 K (3000°F) for carbon-carbon composite materials on hand at LaRC for whichthe precursor materials and thermal processing historywere known. This report documents the thermal conduc-tivity data generated for these materials. In-plane thermalconductivity values range from 10 to 233 W/m-K,whereas through-the-thickness values range from 2to 21 W/m-K.
NASA Langley Research CenterHampton, VA 23681-2199July 16, 1997
References
1. Yamaki, Y. R.; Ransone, P. O.; and Maahs, Howard G.:Investigation of Stitching as a Method of InterlaminarReinforcement in Thin Carbon-Carbon Composites.The 16thConference on Metal Matrix, Carbon, and Ceramic MatrixComposites, John D. Buckley, ed., NASA CP-3175, Part 1,1992, pp. 367–386.
2. Ransone, Philip O.; Spivack, Bruce D.; and Maahs, HowardG.: Mechanical Properties of Thin 3-D Reinforced Carbon-Carbon Composites Densified With Different Matrices.The16th Conference on Metal Matrix, Carbon, and CeramicMatrix Composites, John D. Buckley, ed., NASA CP-3175,Part 1, 1992, pp. 347–366.
3. Tawil, H.; Bentsen, L. D.; Baskaran, S.; and Hasselman,D. P. H.: Thermal Diffusivity of Chemically Vapour DepositedSilicon Carbide Reinforced With Silicon Carbide or CarbonFibres. J. Mater. Sci., vol. 20, Sept. 1985, pp. 3201–3212.
4. Parker, W. J.; Jenkins, R. J.; Butler, C. P.; and Abbott, G. L.:Flash Method of Determining Thermal Diffusivity, HeatCapacity, and Thermal Conductivity.J. Appl. Phys., vol. 32,no. 9, Sept. 1961, pp. 1679–1684.
5. Ohlhorst, Craig W.; and Ransone, Philip O.:Effects ofThermal Cycling on Thermal Expansion and InterlaminarMechanical Properties of Advanced Carbon-CarbonComposites. NASA TP-2734, 1987.
6. Touloukian, Y. S.; and Buyco, E. H.:ThermophysicalProperties of Matter. Volume 5—Specific Heat, NonmetallicSolids. Y. S. Touloukian, ed., IFI/Plenum, 1970.
cp 38.0528 0.041618T 741.254/T+ +–=
0.707584 T 19.0915 log10T J/g-K+–

4
Table 1. Summary of Materials in Database
Materialspecimen
Materialsource Fiber/Tow
Constructiontows/in.
Layup,numberof plies
Densificationtype
Fiber HTtemp, K
Max fabtemp, K
Condittemp, K
Inhibitor/Coating MeasurementsComments
1 LaRCpanel 7A
T-300/3k 8HSW,24 × 23
0/90°, 7 Phenolic 2273 1173 2273 No/No ip/t-t-t
2 LaRCpanel 7B
T-300/3k 8HSW,24 × 23
0/90°, 7 LoPIC 2273 1923 2273 No/No ip/t-t-t
3 LaRCpanel 6 thinfabric
T-300/3k 8HSW,24 × 23
0/90°, 7 Hybrid 2273 1923 2273 No/No ip/t-t-t
4 LaRCpanel 7C
T-300/3k 8HSW,24 × 23
0/90°, 7 CVI 2273 1923 2273 No/No ip/t-t-t
5 LaRCpanel 1Pthin fabric
T-50/3k 8HSW,23 × 23
0/90°, 7 Phenolic 2273 1173 2273 No/No ip/t-t-t
6 LaRC 9Hthin fabric
T-50/3k 8HSW,23 × 23
0/90°, 7 Hybrid 2273 1923 2273 No/No ip/t-t-t
7 LaRC panel10-1
Celion/3k 333 3-D orth 5.5 layers Phenolic 2273 1173 2273 No/No ip/t-t-t 3ktows/site
8 LaRC panel10-3
Celion/3k 333 3-D orth 5.5 layers LoPIC 2273 1923 2273 No/No ip/t-t-t 3ktows/site
9 LaRC panel9-1
Celion/3k,2k 333 3-D orth 5.5 layers Phenolic 2273 1173 2273 No/No ip/t-t-t 2,1ktows/site
10 LaRC panel9-3
Celion/3k,2k 333 3-D orth 5.5 layers LoPIC 2273 1923 2273 No/No ip/t-t-t 2,1ktows/site
11 Boeing/Rohr T-300/1k 8HSW,35 × 35
0/90° Hybrid 2423 1923 None 0.2FAW/No
ip/t-t-t
12 Boeing/Rohr T-300/1k 8HSW,35 × 35
0/90° Hybrid 2423 1923 None 0.2FAW/CVD
t-t-t
13 Boeing/Rohr T-300/1k 8HSW,35 × 35
0/90° Hybrid 2423 1923 None 0.2FAW/PPC
t-t-t
14 CCAT T-300/3k 8HSW,24 × 23
0/90°, 8 Phenolic 2273 1173 None No/No ip/t-t-t

5
Table 1. Concluded
Materialspecimen
Materialsource Fiber/Tow
Constructiontows/in.
Layup,numberof plies
Densificationtype
Fiber HTtemp, K
Max fabtemp, K
Condittemp, K
Inhibitor/Coating MeasurementsComments
15 CCAT T-300/3k 8HSW,24 × 23
0/90°, 8 Phenolic 2273 2033 None No/Type III
t-t-t
16 LaRCstitchedpanel 2
T-300/3k 8HSW,24 × 23
0/90°, 7 Phenolic 2273 1173 2273 No/No ip/t-t-t 7/in;97k/in2
17 LaRCstitchedpanel 5
T-300/3k 8HSW,24 × 23
0/90°, 7 Phenolic 2273 1173 2273 No/No ip/t-t-t12/in;277k/in2
18 LaRCstitchedpanel 8
T-300/3k 8HSW,24 × 23
0/90°, 7 Phenolic 2273 1173 2273 No/No ip/t-t-t10/in;218k/in2
19 LaRC J1 T-300/3k 8HSW,24 × 23
0/90°, 7 CVI 2623 1323 None No/No ip/t-t-t
20 LaRC J2 T-300/3k 8HSW,24 × 23
0/90°, 7 CVI 2623 1323 None No/No ip/t-t-t
21 LaRC J3 T-300/3k 8HSW,24 × 23
0/90°, 7 CVI 2623 1323 None No/No ip/t-t-t
22 LaRC J4 T-300/3k 8HSW,24 × 23
0/90°, 7 CVI 2623 1323 None No/No ip/t-t-t
23 LaRC J5 T-300/3k 8HSW,24 × 23
0/90°, 7 CVI 2623 1323 None No/No ip/t-t-t
24 LaRC J6 T-300/3k 8HSW,24 × 23
0/90°, 7 CVI 2623 1323 None No/No ip/t-t-t
25 LaRC J7 T-300/3k 8HSW,24 × 23
0/90°, 7 CVI 2623 1323 None No/No ip/t-t-t
26 LaRC J8 T-300/3k 8HSW,24 × 23
0/90°, 7 CVI 2623 1323 None No/No ip/t-t-t
27 LaRC F1 K321/2k 8HSW,18 × 18
0/90°, 8 Phenolic 2273 2373 None No/No ip/t-t-t
28 LaRC P1 K321/2k 8HSW,18 × 18
0/90°, 8 1AR 2273 2973 None No/No ip/t-t-t
1Mitsubishi Gas Chemical mesophase pitch (AR).

6
Table 2. Thermophysical Property Data of LaRC Panel 7A, Which Is T-300 3k Phenolic Densified Material
Temperature Thermal diffusivity Thermal conductivity
Materialspecimen Direction °C K °F
Heat capacity,J/g-K
Density,g/cm3 cm2/s ft2/hr W/m-K Btu/hr-ft-°F
1 In-plane 23 296 73.4 0.69 1.547 0.231 0.8953 24.667 14.253124 397 255.2 0.983 1.547 0.178 0.6899 27.065 15.638207 480 404.6 1.176 1.547 0.162 0.6279 29.464 17.024304 577 579.2 1.351 1.547 0.151 0.5852 31.57 18.241416 689 780.8 1.503 1.547 0.143 0.5542 33.253 19.213509 782 948.2 1.598 1.547 0.13 0.5038 32.142 18.571608 881 1126.4 1.677 1.547 0.122 0.4728 31.648 18.286714 987 1317.2 1.742 1.547 0.114 0.4418 30.723 17.752816 1089 1500.8 1.791 1.547 0.111 0.4302 30.758 17.772912 1185 1673.6 1.829 1.547 0.109 0.4225 30.835 17.816
1022 1295 1871.6 1.864 1.547 0.112 0.4341 32.293 18.6591239 1512 2262.2 1.918 1.547 0.105 0.407 31.163 18.0061455 1728 2651 1.964 1.547 0.103 0.3992 31.288 18.0781657 1930 3014.6 2.004 1.547 0.0985 0.3818 30.542 17.647
1 t-t-t or normal 23 296 73.4 0.69 1.547 0.0449 0.174 4.795 2.77124 397 255.2 0.983 1.547 0.0368 0.1426 5.595 3.233206 479 402.8 1.174 1.547 0.0336 0.1302 6.1 3.525304 577 579.2 1.351 1.547 0.0285 0.1105 5.959 3.443402 675 755.6 1.487 1.547 0.0263 0.1019 6.049 3.495499 772 930.2 1.589 1.547 0.0268 0.1039 6.588 3.807596 869 1104.8 1.668 1.547 0.0259 0.1004 6.685 3.862706 979 1302.8 1.738 1.547 0.0238 0.0922 6.398 3.697804 1077 1479.2 1.786 1.547 0.0239 0.0926 6.603 3.815915 1188 1679 1.83 1.547 0.0246 0.0953 6.963 4.023
1004 1277 1839.2 1.859 1.547 0.0231 0.0895 6.642 3.8371241 1514 2265.8 1.919 1.547 0.0227 0.088 6.739 3.8941463 1736 2665.4 1.965 1.547 0.0227 0.088 6.901 3.9881664 1937 3027.2 2.006 1.547 0.0226 0.0876 7.013 4.052

7
Table 3. Thermophysical Property Data of LaRC Panel 7B, Which Is T-300 3k LOPIC Densified Material
Temperature Thermal diffusivity Thermal conductivity
Materialspecimen Direction °C K °F
Heat capacity,J/g-K
Density,g/cm3 cm2/s ft2/hr W/m-K Btu/hr-ft-°F
2 In-plane 23 296 73.4 0.69 1.634 0.227 0.8798 25.603 14.793124 397 255.2 0.983 1.634 0.19 0.7364 30.514 17.631207 480 404.6 1.176 1.634 0.17 0.6589 32.658 18.87304 577 579.2 1.351 1.634 0.151 0.5852 33.345 19.267400 673 752 1.484 1.634 0.141 0.5465 34.196 19.758515 788 959 1.604 1.634 0.13 0.5038 34.063 19.682615 888 1139 1.682 1.634 0.121 0.469 33.25 19.212707 980 1304.6 1.738 1.634 0.113 0.438 32.095 18.545808 1081 1486.4 1.788 1.634 0.111 0.4302 32.425 18.735917 1190 1682.6 1.83 1.634 0.111 0.4302 33.198 19.182
1019 1292 1866.2 1.863 1.634 0.112 0.4341 34.094 19.6991247 1520 2276.6 1.92 1.634 0.109 0.4225 34.201 19.7611463 1736 2665.4 1.965 1.634 0.107 0.4147 34.359 19.8531665 1938 3029 2.006 1.634 0.105 0.407 34.417 19.886
2 t-t-t or normal 23 296 73.4 0.69 1.634 0.0473 0.1833 5.335 3.083124 397 255.2 0.983 1.634 0.0357 0.1384 5.733 3.313207 480 404.6 1.176 1.634 0.0321 0.1244 6.167 3.563304 577 579.2 1.351 1.634 0.0306 0.1186 6.757 3.904402 675 755.6 1.487 1.634 0.0266 0.1031 6.462 3.734521 794 969.8 1.609 1.634 0.0248 0.0961 6.52 3.767616 889 1140.8 1.682 1.634 0.0229 0.0888 6.295 3.637709 982 1308.2 1.739 1.634 0.0215 0.0833 6.111 3.531818 1091 1504.4 1.792 1.634 0.0227 0.088 6.647 3.841910 1183 1670 1.828 1.634 0.0221 0.0857 6.601 3.814
1013 1286 1855.4 1.861 1.634 0.0226 0.0876 6.873 3.9711242 1515 2267.6 1.919 1.634 0.0226 0.0876 7.087 4.0951439 1712 2622.2 1.96 1.634 0.0221 0.0857 7.079 4.091673 1946 3043.4 2.008 1.634 0.0227 0.088 7.447 4.303

8
Table 4. Thermophysical Property Data of LaRC Panel 6, Which Is T-300 3k Hybrid Densified Material
Temperature Thermal diffusivity Thermal conductivity
Materialspecimen Direction °C K °F
Heat capacity,J/g-K
Density,g/cm3 cm2/s ft2/hr W/m-K Btu/hr-ft-°F
3 In-plane 23 296 73.4 0.69 1.575 0.209 0.81 22.722 13.129124 397 255.2 0.983 1.575 0.174 0.6744 26.936 15.563207 480 404.6 1.176 1.575 0.166 0.6434 30.738 17.76304 577 579.2 1.351 1.575 0.145 0.562 30.864 17.833455 728 851 1.546 1.575 0.121 0.469 29.461 17.023512 785 953.6 1.601 1.575 0.115 0.4457 28.996 16.754622 895 1151.6 1.686 1.575 0.108 0.4186 28.687 16.575720 993 1328 1.745 1.575 0.102 0.3953 28.038 16.2801 1074 1473.8 1.785 1.575 0.101 0.3915 28.39 16.404915 1188 1679 1.83 1.575 0.101 0.3915 29.105 16.817
1011 1284 1851.8 1.861 1.575 0.0996 0.386 29.187 16.8641234 1507 2253.2 1.917 1.575 0.0961 0.3725 29.021 16.7681456 1729 2652.8 1.964 1.575 0.0931 0.3608 28.796 16.6381664 1937 3027.2 2.006 1.575 0.0939 0.3639 29.664 17.14
3 t-t-t or normal 23 296 73.4 0.69 1.575 0.0509 0.1973 5.534 3.197124 397 255.2 0.983 1.575 0.0455 0.1763 7.043 4.07207 480 404.6 1.176 1.575 0.0381 0.1477 7.055 4.076304 577 579.2 1.351 1.575 0.0348 0.1349 7.407 4.28402 675 755.6 1.487 1.575 0.0304 0.1178 7.118 4.113508 781 946.4 1.597 1.575 0.0271 0.105 6.818 3.939609 882 1128.2 1.678 1.575 0.0252 0.0977 6.658 3.847718 991 1324.4 1.744 1.575 0.0237 0.0919 6.511 3.762820 1093 1508 1.793 1.575 0.0251 0.0973 7.088 4.095912 1185 1673.6 1.829 1.575 0.0243 0.0942 6.999 4.044
1007 1280 1844.6 1.859 1.575 0.0239 0.0926 6.999 4.0441243 1516 2269.4 1.919 1.575 0.0232 0.0899 7.013 4.0521447 1720 2636.6 1.962 1.575 0.0231 0.0895 7.138 4.1241664 1937 3027.2 2.006 1.575 0.0231 0.0895 7.298 4.217

9
Table 5. Thermophysical Property Data of LaRC Panel 7C, Which Is T-300 3k CVI Densified Material
Temperature Thermal diffusivity Thermal conductivity
Materialspecimen Direction °C K °F
Heat capacity,J/g-K
Density,g/cm3 cm2/s ft2/hr W/m-K Btu/hr-ft-°F
4 In-plane 23 296 73.4 0.69 1.534 0.218 0.8449 23.083 13.337124 397 255.2 0.983 1.534 0.186 0.7209 28.044 16.204207 480 404.6 1.176 1.534 0.169 0.655 30.479 17.611304 577 579.2 1.351 1.534 0.154 0.5969 31.926 18.447419 692 786.2 1.507 1.534 0.131 0.5077 30.276 17.493522 795 971.6 1.61 1.534 0.122 0.4728 30.126 17.407620 893 1148 1.685 1.534 0.119 0.4612 30.761 17.774726 999 1338.8 1.748 1.534 0.116 0.4496 31.113 17.977817 1090 1502.6 1.792 1.534 0.111 0.4302 30.507 17.627916 1189 1680.8 1.83 1.534 0.108 0.4186 30.318 17.518
1021 1294 1869.8 1.864 1.534 0.107 0.4147 30.588 17.6741241 1514 2265.8 1.919 1.534 0.0945 0.3663 27.817 16.0731457 1730 2654.6 1.964 1.534 0.0926 0.3589 27.898 16.121681 1954 3057.8 2.009 1.534 0.0931 0.3608 28.696 16.581
4 t-t-t or normal 23 296 73.4 0.69 1.534 0.051 0.1977 5.4 3.12207 480 404.6 1.176 1.534 0.042 0.1628 7.575 4.377304 577 579.2 1.351 1.534 0.0376 0.1457 7.795 4.504403 676 757.4 1.488 1.534 0.0344 0.1333 7.851 4.536534 807 993.2 1.62 1.534 0.0308 0.1194 7.654 4.423624 897 1155.2 1.688 1.534 0.0284 0.1101 7.353 4.249708 981 1306.4 1.739 1.534 0.0265 0.1027 7.068 4.084814 1087 1497.2 1.79 1.534 0.0254 0.0984 6.976 4.031922 1195 1691.6 1.832 1.534 0.025 0.0969 7.026 4.06
1021 1294 1869.8 1.864 1.534 0.0241 0.0934 6.889 3.9811254 1527 2289.2 1.922 1.534 0.0244 0.0946 7.193 4.1561467 1740 2672.6 1.966 1.534 0.0231 0.0895 6.967 4.0251618 1891 2944.4 1.996 1.534 0.0229 0.0888 7.013 4.052

10
Table 6. Thermophysical Property Data of LaRC Panel 1P, Which Is T-50 3k Phenolic Densified Material
Temperature Thermal diffusivity Thermal conductivity
Materialspecimen Direction °C K °F
Heat capacity,J/g-K
Density,g/cm3 cm2/s ft2/hr W/m-K Btu/hr-ft-°F
5 In-plane 23 296 73.4 0.69 1.586 0.305 1.1821 33.39 19.293124 397 255.2 0.983 1.586 0.245 0.9496 38.191 22.067207 480 404.6 1.176 1.586 0.232 0.8992 43.259 24.995304 577 579.2 1.351 1.586 0.2 0.7752 42.868 24.769452 725 845.6 1.543 1.586 0.169 0.655 41.352 23.893512 785 953.6 1.601 1.586 0.157 0.6085 39.863 23.033614 887 1137.2 1.681 1.586 0.145 0.562 38.659 22.337718 991 1324.4 1.744 1.586 0.141 0.5465 39.005 22.537818 1091 1504.4 1.792 1.586 0.135 0.5232 38.37 22.17914 1187 1677.2 1.829 1.586 0.128 0.4961 37.137 21.457
1014 1287 1857.2 1.861 1.586 0.124 0.4806 36.609 21.1531251 1524 2283.8 1.921 1.586 0.121 0.469 36.868 21.3021482 1755 2699.6 1.969 1.586 0.119 0.4612 37.162 21.4721665 1938 3029 2.006 1.586 0.121 0.469 38.496 22.243
5 t-t-t or normal 23 296 73.4 0.69 1.586 0.0412 0.1597 4.51 2.606124 397 255.2 0.983 1.586 0.035 0.1357 5.456 3.152207 480 404.6 1.176 1.586 0.0319 0.1236 5.948 3.437304 577 579.2 1.351 1.586 0.0288 0.1116 6.173 3.567402 675 755.6 1.487 1.586 0.0257 0.0996 6.06 3.501528 801 982.4 1.615 1.586 0.0228 0.0884 5.84 3.374614 887 1137.2 1.681 1.586 0.0217 0.0841 5.785 3.343715 988 1319 1.743 1.586 0.0214 0.0829 5.914 3.417821 1094 1509.8 1.793 1.586 0.0213 0.0826 6.058 3.5908 1181 1666.4 1.827 1.586 0.0209 0.081 6.057 3.5
1015 1288 1859 1.862 1.586 0.0207 0.0802 6.112 3.5321254 1527 2289.2 1.922 1.586 0.0203 0.0787 6.187 3.5751478 1751 2692.4 1.968 1.586 0.0207 0.0802 6.462 3.7341697 1970 3086.6 2.013 1.586 0.0215 0.0833 6.863 3.965

11
Table 7. Thermophysical Property Data of LaRC Panel 9H, Which Is T-50 3k Hybrid Densified Material
Temperature Thermal diffusivity Thermal conductivity
Materialspecimen Direction °C K °F
Heat capacity,J/g-K
Density,g/cm3 cm2/s ft2/hr W/m-K Btu/hr-ft-°F
6 In-plane 19 292 66.2 0.678 1.566 0.274 1.062 29.077 16.8127 400 260.6 0.991 1.566 0.225 0.872 34.904 20.167207 480 404.6 1.176 1.566 0.194 0.7519 35.717 20.637304 577 579.2 1.351 1.566 0.17 0.6589 35.979 20.788403 676 757.4 1.488 1.566 0.155 0.6007 36.115 20.867534 807 993.2 1.62 1.566 0.141 0.5465 35.771 20.668609 882 1128.2 1.678 1.566 0.131 0.5077 34.415 19.885724 997 1335.2 1.747 1.566 0.127 0.4922 34.753 20.08814 1087 1497.2 1.79 1.566 0.125 0.4845 35.046 20.25920 1193 1688 1.831 1.566 0.124 0.4806 35.563 20.548
1026 1299 1878.8 1.865 1.566 0.121 0.469 35.339 20.4191237 1510 2258.6 1.918 1.566 0.119 0.4612 35.744 20.6531453 1726 2647.4 1.963 1.566 0.113 0.438 34.741 20.0731664 1937 3027.2 2.006 1.566 0.113 0.438 35.494 20.508
6 t-t-t or normal 19 292 66.2 0.678 1.566 0.0466 0.1806 4.945 2.857124 397 255.2 0.983 1.566 0.0443 0.1717 6.819 3.94204 477 399.2 1.169 1.566 0.0401 0.1554 7.344 4.243305 578 581 1.353 1.566 0.0374 0.145 7.925 4.579403 676 757.4 1.488 1.566 0.0331 0.1283 7.712 4.456518 791 964.4 1.606 1.566 0.0265 0.1027 6.666 3.851634 907 1173.2 1.694 1.566 0.025 0.0969 6.634 3.833729 1002 1344.2 1.75 1.566 0.0244 0.0946 6.687 3.864823 1096 1513.4 1.794 1.566 0.0243 0.0942 6.828 3.945906 1179 1662.8 1.826 1.566 0.0244 0.0946 6.979 4.032
1008 1281 1846.4 1.86 1.566 0.0247 0.0957 7.193 4.1561252 1525 2285.6 1.921 1.566 0.0252 0.0977 7.582 4.3811459 1732 2658.2 1.964 1.566 0.0255 0.0988 7.844 4.5331673 1946 3043.4 2.008 1.566 0.0254 0.0984 7.986 4.614

12
Table 8. Thermophysical Property Data of LaRC Panel 10-1, Which Is Celion 3k Phenolic Densified Material
Temperature Thermal diffusivity Thermal conductivity
Materialspecimen Direction °C K °F
Heat capacity,J/g-K
Density,g/cm3 cm2/s ft2/hr W/m-K Btu/hr-ft-°F
7 In-plane 19 292 66.2 0.678 1.493 0.161 0.624 16.289 9.412127 400 260.6 0.991 1.493 0.13 0.5038 19.227 11.109205 478 401 1.172 1.493 0.12 0.4651 20.989 12.127304 577 579.2 1.351 1.493 0.105 0.407 21.186 12.241403 676 757.4 1.488 1.493 0.0972 0.3767 21.592 12.476532 805 989.6 1.618 1.493 0.088 0.3411 21.262 12.285617 890 1142.6 1.683 1.493 0.0808 0.3132 20.304 11.732720 993 1328 1.745 1.493 0.0765 0.2965 19.934 11.518822 1095 1511.6 1.794 1.493 0.0751 0.2911 20.113 11.621912 1185 1673.6 1.829 1.493 0.072 0.2791 19.657 11.358
1029 1302 1884.2 1.866 1.493 0.0719 0.2787 20.029 11.5731230 1503 2246 1.916 1.493 0.0735 0.2849 21.031 12.1511458 1731 2656.4 1.964 1.493 0.0797 0.3089 23.373 13.5051673 1946 3043.4 2.008 1.493 0.0806 0.3124 24.159 13.959
7 t-t-t or normal 21 294 69.8 0.684 1.493 0.0594 0.2302 6.066 3.505124 397 255.2 0.983 1.493 0.0542 0.2101 7.953 4.596204 477 399.2 1.169 1.493 0.0503 0.195 8.782 5.074306 579 582.8 1.355 1.493 0.0429 0.1663 8.676 5.013411 684 771.8 1.497 1.493 0.0373 0.1446 8.338 4.818504 777 939.2 1.594 1.493 0.0352 0.1364 8.375 4.839609 882 1128.2 1.678 1.493 0.0324 0.1256 8.115 4.689709 982 1308.2 1.739 1.493 0.0316 0.1225 8.206 4.741808 1081 1486.4 1.788 1.493 0.0313 0.1213 8.354 4.827916 1189 1680.8 1.83 1.493 0.0315 0.1221 8.606 4.973
1018 1291 1864.4 1.863 1.493 0.0316 0.1225 8.788 5.0781240 1513 2264 1.919 1.493 0.0315 0.1221 9.024 5.2141465 1738 2669 1.966 1.493 0.0319 0.1236 9.362 5.4091697 1970 3086.6 2.013 1.493 0.0327 0.1267 9.826 5.677

13
Table 9. Thermophysical Property Data of LaRC Panel 10-3, Which Is Celion 3k LoPIC Densified Material
Temperature Thermal diffusivity Thermal conductivity
Materialspecimen Direction °C K °F
Heat capacity,J/g-K
Density,g/cm3 cm2/s ft2/hr W/m-K Btu/hr-ft-°F
8 In-plane 19 292 66.2 0.678 1.609 0.162 0.6279 17.663 10.206127 400 260.6 0.991 1.609 0.139 0.5387 22.155 12.801207 480 404.6 1.176 1.609 0.129 0.5 24.402 14.1304 577 579.2 1.351 1.609 0.115 0.4457 25.007 14.449403 676 757.4 1.488 1.609 0.109 0.4225 26.094 15.077527 800 980.6 1.614 1.609 0.0963 0.3732 25.009 14.45612 885 1133.6 1.68 1.609 0.0897 0.3477 24.242 14.007719 992 1326.2 1.745 1.609 0.0859 0.3329 24.115 13.934819 1092 1506.2 1.793 1.609 0.0813 0.3151 23.448 13.548913 1186 1675.4 1.829 1.609 0.0799 0.3097 23.513 13.586
1020 1293 1868 1.863 1.609 0.0793 0.3073 23.774 13.7371232 1505 2249.6 1.917 1.609 0.0789 0.3058 24.335 14.0611467 1740 2672.6 1.966 1.609 0.0774 0.3 24.484 14.1471664 1937 3027.2 2.006 1.609 0.0776 0.3008 25.044 14.47
8 t-t-t or normal 21 294 69.8 0.684 1.609 0.0706 0.2736 7.769 4.489124 397 255.2 0.983 1.609 0.0609 0.236 9.631 5.565204 477 399.2 1.169 1.609 0.0551 0.2136 10.368 5.99304 577 579.2 1.351 1.609 0.0496 0.1922 10.786 6.232449 722 840.2 1.54 1.609 0.0411 0.1593 10.182 5.883524 797 975.2 1.611 1.609 0.039 0.1512 10.112 5.843614 887 1137.2 1.681 1.609 0.036 0.1395 9.737 5.626725 998 1337 1.748 1.609 0.0338 0.131 9.506 5.493806 1079 1482.8 1.787 1.609 0.0329 0.1275 9.459 5.465920 1193 1688 1.831 1.609 0.0327 0.1267 9.636 5.568
1008 1281 1846.4 1.86 1.609 0.0326 0.1263 9.755 5.6361252 1525 2285.6 1.921 1.609 0.0323 0.1252 9.985 5.771456 1729 2652.8 1.964 1.609 0.0326 0.1263 10.301 5.9521676 1949 3048.8 2.008 1.609 0.0342 0.1326 11.051 6.385

14
Table 10. Thermophysical Property Data of LaRC Panel 9-1, Which Is Celion 3k/2k Phenolic Densified Material
Temperature Thermal diffusivity Thermal conductivity
Materialspecimen Direction °C K °F
Heat capacity,J/g-K
Density,g/cm3 cm2/s ft2/hr W/m-K Btu/hr-ft-°F
9 In-plane 19 292 66.2 0.678 1.519 0.158 0.6124 16.264 9.397127 400 260.6 0.991 1.519 0.136 0.5271 20.464 11.824207 480 404.6 1.176 1.519 0.129 0.5 23.037 13.311304 577 579.2 1.351 1.519 0.118 0.4573 24.224 13.997403 676 757.4 1.488 1.519 0.112 0.4341 25.312 14.626506 779 942.8 1.596 1.519 0.0995 0.3856 24.114 13.933622 895 1151.6 1.686 1.519 0.0952 0.369 24.388 14.091727 1000 1340.6 1.749 1.519 0.0922 0.3573 24.495 14.153816 1089 1500.8 1.791 1.519 0.0888 0.3442 24.161 13.96916 1189 1680.8 1.83 1.519 0.0842 0.3263 23.406 13.524
1017 1290 1862.6 1.862 1.519 0.0831 0.3221 23.509 13.5831237 1510 2258.6 1.918 1.519 0.081 0.3139 23.599 13.6361459 1732 2658.2 1.964 1.519 0.0809 0.3135 24.14 13.9481674 1947 3045.2 2.008 1.519 0.0803 0.3112 24.491 14.151
9 t-t-t or normal 21 294 69.8 0.684 1.519 0.0583 0.226 6.057 3.5124 397 255.2 0.983 1.519 0.0493 0.1911 7.36 4.253204 477 399.2 1.169 1.519 0.0433 0.1678 7.692 4.444305 578 581 1.353 1.519 0.0359 0.1391 7.378 4.263417 690 782.6 1.504 1.519 0.0311 0.1205 7.106 4.106536 809 996.8 1.622 1.519 0.0293 0.1136 7.218 4.17610 883 1130 1.678 1.519 0.0286 0.1108 7.291 4.213721 994 1329.8 1.746 1.519 0.0285 0.1105 7.558 4.367823 1096 1513.4 1.794 1.519 0.0288 0.1116 7.849 4.535919 1192 1686.2 1.831 1.519 0.0288 0.1116 8.01 4.628
1004 1277 1839.2 1.859 1.519 0.0285 0.1105 8.046 4.6491229 1502 2244.2 1.916 1.519 0.0281 0.1089 8.179 4.7261466 1739 2670.8 1.966 1.519 0.0276 0.107 8.242 4.7621694 1967 3081.2 2.012 1.519 0.0276 0.107 8.435 4.874
15
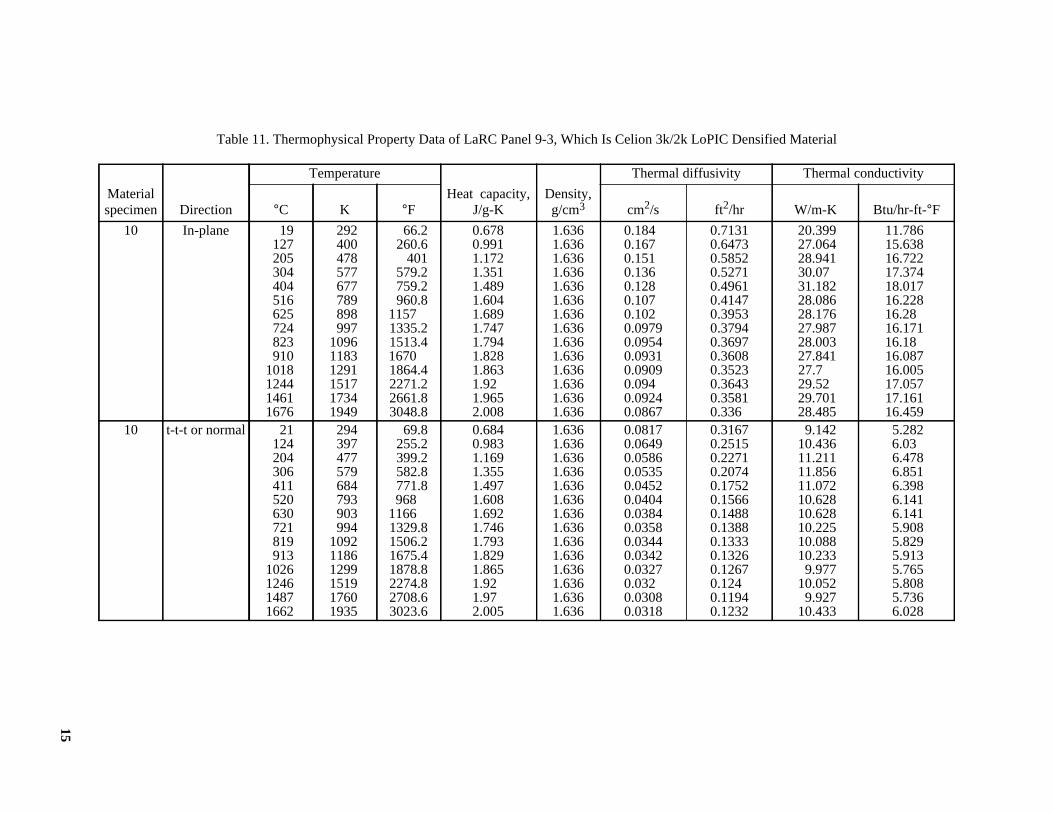
Table 11. Thermophysical Property Data of LaRC Panel 9-3, Which Is Celion 3k/2k LoPIC Densified Material
Temperature Thermal diffusivity Thermal conductivity
Materialspecimen Direction °C K °F
Heat capacity,J/g-K
Density,g/cm3 cm2/s ft2/hr W/m-K Btu/hr-ft-°F
10 In-plane 19 292 66.2 0.678 1.636 0.184 0.7131 20.399 11.786127 400 260.6 0.991 1.636 0.167 0.6473 27.064 15.638205 478 401 1.172 1.636 0.151 0.5852 28.941 16.722304 577 579.2 1.351 1.636 0.136 0.5271 30.07 17.374404 677 759.2 1.489 1.636 0.128 0.4961 31.182 18.017516 789 960.8 1.604 1.636 0.107 0.4147 28.086 16.228625 898 1157 1.689 1.636 0.102 0.3953 28.176 16.28724 997 1335.2 1.747 1.636 0.0979 0.3794 27.987 16.171823 1096 1513.4 1.794 1.636 0.0954 0.3697 28.003 16.18910 1183 1670 1.828 1.636 0.0931 0.3608 27.841 16.087
1018 1291 1864.4 1.863 1.636 0.0909 0.3523 27.7 16.0051244 1517 2271.2 1.92 1.636 0.094 0.3643 29.52 17.0571461 1734 2661.8 1.965 1.636 0.0924 0.3581 29.701 17.1611676 1949 3048.8 2.008 1.636 0.0867 0.336 28.485 16.459
10 t-t-t or normal 21 294 69.8 0.684 1.636 0.0817 0.3167 9.142 5.282124 397 255.2 0.983 1.636 0.0649 0.2515 10.436 6.03204 477 399.2 1.169 1.636 0.0586 0.2271 11.211 6.478306 579 582.8 1.355 1.636 0.0535 0.2074 11.856 6.851411 684 771.8 1.497 1.636 0.0452 0.1752 11.072 6.398520 793 968 1.608 1.636 0.0404 0.1566 10.628 6.141630 903 1166 1.692 1.636 0.0384 0.1488 10.628 6.141721 994 1329.8 1.746 1.636 0.0358 0.1388 10.225 5.908819 1092 1506.2 1.793 1.636 0.0344 0.1333 10.088 5.829913 1186 1675.4 1.829 1.636 0.0342 0.1326 10.233 5.913
1026 1299 1878.8 1.865 1.636 0.0327 0.1267 9.977 5.7651246 1519 2274.8 1.92 1.636 0.032 0.124 10.052 5.8081487 1760 2708.6 1.97 1.636 0.0308 0.1194 9.927 5.7361662 1935 3023.6 2.005 1.636 0.0318 0.1232 10.433 6.028

16
Table 12. Thermophysical Property Data of Boeing/Rohr T-300 1k Hybrid Densified Material
Temperature Thermal diffusivity Thermal conductivity
Materialspecimen Direction °C K °F
Heat capacity,J/g-K
Density,g/cm3 cm2/s ft2/hr W/m-K Btu/hr-ft-°F
11 In-plane 18 291 64.4 0.674 1.73 0.189 0.7325 22.054 12.743126 399 258.8 0.988 1.73 0.165 0.6395 28.203 16.296205 478 401 1.172 1.73 0.149 0.5775 30.198 17.449305 578 581 1.353 1.73 0.134 0.5194 31.366 18.123401 674 753.8 1.485 1.73 0.123 0.4767 31.609 18.264526 799 978.8 1.613 1.73 0.107 0.4147 29.862 17.254616 889 1140.8 1.682 1.73 0.102 0.3953 29.688 17.154713 986 1315.4 1.742 1.73 0.099 0.3837 29.827 17.234807 1080 1484.6 1.787 1.73 0.0977 0.3787 30.209 17.455905 1178 1661 1.826 1.73 0.0949 0.3678 29.981 17.323
1015 1288 1859 1.862 1.73 0.0915 0.3546 29.471 17.0281239 1512 2262.2 1.918 1.73 0.0859 0.3329 28.51 16.4731464 1737 2667.2 1.965 1.73 0.0856 0.3318 29.105 16.8171663 1936 3025.4 2.006 1.73 0.0832 0.3225 28.868 16.68
11 t-t-t 18 291 64.4 0.674 1.73 0.059 0.2287 6.884 3.978127 400 260.6 0.991 1.73 0.0471 0.1825 8.072 4.664205 478 401 1.172 1.73 0.0419 0.1624 8.492 4.907304 577 579.2 1.351 1.73 0.0383 0.1484 8.955 5.174405 678 761 1.49 1.73 0.0356 0.138 9.178 5.303521 794 969.8 1.609 1.73 0.0304 0.1178 8.461 4.889605 878 1121 1.675 1.73 0.0282 0.1093 8.171 4.721716 989 1320.8 1.743 1.73 0.0261 0.1012 7.871 4.548803 1076 1477.4 1.786 1.73 0.0261 0.1012 8.062 4.658909 1182 1668.2 1.828 1.73 0.0261 0.1012 8.252 4.768
1011 1284 1851.8 1.861 1.73 0.026 0.1008 8.369 4.8361221 1494 2229.8 1.914 1.73 0.0264 0.1023 8.744 5.0521456 1729 2652.8 1.964 1.73 0.0268 0.1039 9.105 5.2611664 1937 3027.2 2.006 1.73 0.0269 0.1043 9.334 5.393

17
Table 13. Thermophysical Property Data of CVD-Coated Boeing/Rohr T-300 1k Hybrid Densified Material
Temperature Thermal diffusivity
Materialspecimen Direction °C K °F
Heat capacity,J/g-K
Density,g/cm3 cm2/s ft2/hr
12 t-t-t 18 291 64.4 0.674 1.8 0.06 0.2325127 400 260.6 0.991 1.8 0.0514 0.1992205 478 401 1.172 1.8 0.0456 0.1767304 577 579.2 1.351 1.8 0.0419 0.1624405 678 761 1.49 1.8 0.0394 0.1527521 794 969.8 1.609 1.8 0.0365 0.1415623 896 1153.4 1.687 1.8 0.0354 0.1372720 993 1328 1.745 1.8 0.0324 0.1256817 1090 1502.6 1.792 1.8 0.0315 0.1221912 1185 1673.6 1.829 1.8 0.03 0.1163
1012 1285 1853.6 1.861 1.8 0.0299 0.11591231 1504 2247.8 1.917 1.8 0.0289 0.1121457 1730 2654.6 1.964 1.8 0.0289 0.1121652 1925 3005.6 2.003 1.8 0.0288 0.1116
Table 14. Thermophysical Property Data of PPC-Coated Boeing/Rohr T-300 1k Hybrid Densified Material
Temperature Thermal diffusivity
Materialspecimen Direction °C K °F
Heat capacity,J/g-K
Density,g/cm3 cm2/s ft2/hr
13 t-t-t 18 291 64.4 0.674 1.87 0.0412 0.1597127 400 260.6 0.991 1.87 0.0335 0.1298207 480 404.6 1.176 1.87 0.0325 0.126304 577 579.2 1.351 1.87 0.0286 0.1108405 678 761 1.49 1.87 0.0273 0.1058530 803 986 1.617 1.87 0.0253 0.0981605 878 1121 1.675 1.87 0.0243 0.0942702 975 1295.6 1.735 1.87 0.0233 0.0903808 1081 1486.4 1.788 1.87 0.0219 0.0849911 1184 1671.8 1.828 1.87 0.022 0.0853
1016 1289 1860.8 1.862 1.87 0.0203 0.07871242 1515 2267.6 1.919 1.87 0.0199 0.07711439 1712 2622.2 1.96 1.87 0.0208 0.08061654 1927 3009.2 2.004 1.87 0.0219 0.0849

18
Table 15. Thermophysical Property Data of CCAT T-300 3k Phenolic Densified Material
Temperature Thermal diffusivity Thermal conductivity
Materialspecimen Direction °C K °F
Heat capacity,J/g-K
Density,g/cm3 cm2/s ft2/hr W/m-K Btu/hr-ft-°F
14 In-plane 18 291 64.4 0.674 1.593 0.208 0.8062 22.349 12.913126 399 258.8 0.988 1.593 0.178 0.6899 28.016 16.188205 478 401 1.172 1.593 0.159 0.6162 29.673 17.145305 578 581 1.353 1.593 0.139 0.5387 29.96 17.311402 675 755.6 1.487 1.593 0.132 0.5116 31.261 18.062490 763 914 1.581 1.593 0.127 0.4922 31.979 18.477612 885 1133.6 1.68 1.593 0.121 0.469 32.376 18.707720 993 1328 1.745 1.593 0.118 0.4573 32.807 18.956811 1084 1491.8 1.789 1.593 0.113 0.438 32.205 18.608909 1182 1668.2 1.828 1.593 0.112 0.4341 32.606 18.84
1018 1291 1864.4 1.863 1.593 0.111 0.4302 32.936 19.0311231 1504 2247.8 1.917 1.593 0.11 0.4263 33.586 19.4061436 1709 2616.8 1.96 1.593 0.111 0.4302 34.654 20.0231656 1929 3012.8 2.004 1.593 0.111 0.4302 35.438 20.476
14 t-t-t 18 291 64.4 0.674 1.593 0.013 0.0504 1.397 0.807127 400 260.6 0.991 1.593 0.0128 0.0496 2.02 1.167205 478 401 1.172 1.593 0.0126 0.0488 2.351 1.359304 577 579.2 1.351 1.593 0.0121 0.0469 2.605 1.505405 678 761 1.49 1.593 0.0118 0.0457 2.801 1.619517 790 962.6 1.605 1.593 0.0114 0.0442 2.915 1.684619 892 1146.2 1.684 1.593 0.0112 0.0434 3.005 1.736716 989 1320.8 1.743 1.593 0.0113 0.0438 3.138 1.813809 1082 1488.2 1.788 1.593 0.0116 0.045 3.304 1.909913 1186 1675.4 1.829 1.593 0.0122 0.0473 3.555 2.054
1023 1296 1873.4 1.864 1.593 0.0133 0.0515 3.949 2.2821241 1514 2265.8 1.919 1.593 0.0168 0.0651 5.136 2.9671447 1720 2636.6 1.962 1.593 0.0182 0.0705 5.688 3.2871667 1940 3032.6 2.006 1.593 0.0199 0.0771 6.36 3.675

19
Table 16. Thermophysical Property Data ofType III Coated CCATT-300 3k Phenolic Densified Material
Temperature Thermal diffusivity
Materialspecimen Direction °C K °F
Heat capacity,J/g-K
Density,g/cm3 cm2/s ft2/hr
15 t-t-t 18 291 64.4 0.674 1.814 0.0289 0.112127 400 260.6 0.991 1.814 0.0283 0.1097205 478 401 1.172 1.814 0.0263 0.1019304 577 579.2 1.351 1.814 0.0238 0.0922405 678 761 1.49 1.814 0.0216 0.0837521 794 969.8 1.609 1.814 0.0198 0.0767602 875 1115.6 1.673 1.814 0.0222 0.086710 983 1310 1.74 1.814 0.0217 0.0841807 1080 1484.6 1.787 1.814 0.0214 0.0829907 1180 1664.6 1.827 1.814 0.0208 0.0806
1015 1288 1859 1.862 1.814 0.0204 0.07911231 1504 2247.8 1.917 1.814 0.0197 0.07641449 1722 2640.2 1.962 1.814 0.0204 0.07911664 1937 3027.2 2.006 1.814 0.0203 0.0787
15 t-t-t remeasured 20 293 68 0.681 1.814 0.0293 0.1136126 399 258.8 0.988 1.814 0.0252 0.0977206 479 402.8 1.174 1.814 0.0243 0.0942304 577 579.2 1.351 1.814 0.0219 0.0849403 676 757.4 1.488 1.814 0.0206 0.0798543 816 1009.4 1.628 1.814 0.02 0.0775601 874 1113.8 1.672 1.814 0.0198 0.0767721 994 1329.8 1.746 1.814 0.0195 0.0756815 1088 1499 1.791 1.814 0.0193 0.0748909 1182 1668.2 1.828 1.814 0.0191 0.074
1021 1294 1869.8 1.864 1.814 0.0186 0.07211231 1504 2247.8 1.917 1.814 0.0202 0.07831457 1730 2654.6 1.964 1.814 0.0204 0.07911664 1937 3027.2 2.006 1.814 0.0204 0.0791

20
Table 17. Thermophysical Property Data of LaRC Stitched Panel 2, Which Is T-300 3k Phenolic Densified Material
Temperature Thermal diffusivity Thermal conductivity
Materialspecimen Direction °C K °F
Heat capacity,J/g-K
Density,g/cm3 cm2/s ft2/hr W/m-K Btu/hr-ft-°F
16 In-plane 19 292 66.2 0.678 1.535 0.182 0.7054 18.931 10.939127 400 260.6 0.991 1.535 0.156 0.6046 23.721 13.706205 478 401 1.172 1.535 0.146 0.5659 26.255 15.17303 576 577.4 1.35 1.535 0.132 0.5116 27.351 15.804421 694 789.8 1.509 1.535 0.116 0.4496 26.867 15.524533 806 991.4 1.619 1.535 0.107 0.4147 26.594 15.366630 903 1166 1.692 1.535 0.0988 0.3829 25.658 14.825721 994 1329.8 1.746 1.535 0.0974 0.3775 26.102 15.081822 1095 1511.6 1.794 1.535 0.0947 0.367 26.075 15.066909 1182 1668.2 1.828 1.535 0.0922 0.3573 25.865 14.945
1013 1286 1855.4 1.861 1.535 0.0898 0.348 25.655 14.8241255 1528 2291 1.922 1.535 0.0861 0.3337 25.402 14.6771453 1726 2647.4 1.963 1.535 0.0841 0.326 25.344 14.6441669 1942 3036.2 2.007 1.535 0.0824 0.3194 25.383 14.666
16 t-t-t or normal 19 292 66.2 0.678 1.535 0.0472 0.1829 4.91 2.837127 400 260.6 0.991 1.535 0.0396 0.1535 6.021 3.479206 479 402.8 1.174 1.535 0.0379 0.1469 6.828 3.945303 576 577.4 1.35 1.535 0.0344 0.1333 7.128 4.119431 704 807.8 1.52 1.535 0.0314 0.1217 7.327 4.233519 792 966.2 1.607 1.535 0.0301 0.1167 7.425 4.29628 901 1162.4 1.691 1.535 0.0287 0.1112 7.447 4.303722 995 1331.6 1.746 1.535 0.0272 0.1054 7.291 4.213823 1096 1513.4 1.794 1.535 0.0267 0.1035 7.353 4.249920 1193 1688 1.831 1.535 0.0259 0.1004 7.281 4.207
1015 1288 1859 1.862 1.535 0.0252 0.0977 7.202 4.1611248 1521 2278.4 1.92 1.535 0.0261 0.1012 7.694 4.4461484 1757 2703.2 1.969 1.535 0.0265 0.1027 8.011 4.6291662 1935 3023.6 2.005 1.535 0.0277 0.1074 8.527 4.927

21
Table 18. Thermophysical Property Data of LaRC Stitched Panel 5, Which Is T-300 3k Phenolic Densified Material
Temperature Thermal diffusivity Thermal conductivity
Materialspecimen Direction °C K °F
Heat capacity,J/g-K
Density,g/cm3 cm2/s ft2/hr W/m-K Btu/hr-ft-°F
17 In-plane 19 292 66.2 0.678 1.444 0.179 0.6938 17.515 10.12127 400 260.6 0.991 1.444 0.147 0.5697 21.027 12.15205 478 401 1.172 1.444 0.143 0.5542 24.191 13.978303 576 577.4 1.35 1.444 0.127 0.4922 24.755 14.304429 702 804.2 1.518 1.444 0.11 0.4263 24.11 13.931525 798 977 1.612 1.444 0.0989 0.3833 23.026 13.304630 903 1166 1.692 1.444 0.0978 0.379 23.893 13.805719 992 1326.2 1.745 1.444 0.0899 0.3484 22.65 13.087814 1087 1497.2 1.79 1.444 0.0869 0.3368 22.466 12.981915 1188 1679 1.83 1.444 0.0866 0.3356 22.88 13.22
1015 1288 1859 1.862 1.444 0.0851 0.3298 22.878 13.2191256 1529 2292.8 1.922 1.444 0.0859 0.3329 23.844 13.7771457 1730 2654.6 1.964 1.444 0.0857 0.3322 24.305 14.0431664 1937 3027.2 2.006 1.444 0.0851 0.3298 24.648 14.242
17 t-t-t or normal 19 292 66.2 0.678 1.444 0.0748 0.2899 7.319 4.229127 400 260.6 0.991 1.444 0.0695 0.2694 9.941 5.744206 479 402.8 1.174 1.444 0.0657 0.2546 11.134 6.433303 576 577.4 1.35 1.444 0.0612 0.2372 11.929 6.893431 704 807.8 1.52 1.444 0.0525 0.2035 11.524 6.659538 811 1000.4 1.623 1.444 0.0472 0.1829 11.064 6.393635 908 1175 1.695 1.444 0.0445 0.1725 10.892 6.294723 996 1333.4 1.747 1.444 0.0428 0.1659 10.796 6.238822 1095 1511.6 1.794 1.444 0.0409 0.1585 10.594 6.121918 1191 1684.4 1.831 1.444 0.0403 0.1562 10.654 6.156
1013 1286 1855.4 1.861 1.444 0.0395 0.1531 10.616 6.1341251 1524 2283.8 1.921 1.444 0.0407 0.1577 11.291 6.5241466 1739 2670.8 1.966 1.444 0.0414 0.1605 11.752 6.791669 1942 3036.2 2.007 1.444 0.0408 0.1581 11.823 6.831

22
Table 19. Thermophysical Property Data of LaRC Stitched Panel 8, Which Is T-300 3k Phenolic Densified Material
Temperature Thermal diffusivity Thermal conductivity
Materialspecimen Direction °C K °F
Heat capacity,J/g-K
Density,g/cm3 cm2/s ft2/hr W/m-K Btu/hr-ft-°F
18 In-plane 19 292 66.2 0.678 1.439 0.174 0.6744 16.967 9.804127 400 260.6 0.991 1.439 0.146 0.5659 20.812 12.025205 478 401 1.172 1.439 0.129 0.5 21.747 12.565303 576 577.4 1.35 1.439 0.11 0.4263 21.367 12.346423 696 793.4 1.511 1.439 0.104 0.4031 22.615 13.067514 787 957.2 1.603 1.439 0.0983 0.381 22.671 13.099626 899 1158.8 1.689 1.439 0.0914 0.3542 22.217 12.837717 990 1322.6 1.744 1.439 0.0886 0.3434 22.231 12.845805 1078 1481 1.786 1.439 0.0864 0.3349 22.211 12.833912 1185 1673.6 1.829 1.439 0.0852 0.3302 22.419 12.954
1025 1298 1877 1.865 1.439 0.0838 0.3248 22.486 12.9921252 1525 2285.6 1.921 1.439 0.0813 0.3151 22.478 12.9881481 1754 2697.8 1.969 1.439 0.0805 0.312 22.807 13.1781659 1932 3018.2 2.005 1.439 0.081 0.3139 23.367 13.502
18 t-t-t or normal 19 292 66.2 0.678 1.439 0.0531 0.2058 5.178 2.992127 400 260.6 0.991 1.439 0.0483 0.1872 6.885 3.978205 478 401 1.172 1.439 0.0461 0.1787 7.772 4.49303 576 577.4 1.35 1.439 0.0415 0.1608 8.061 4.658443 716 829.4 1.533 1.439 0.0353 0.1368 7.788 4.5506 779 942.8 1.596 1.439 0.0331 0.1283 7.6 4.391640 913 1184 1.698 1.439 0.0324 0.1256 7.918 4.575728 1001 1342.4 1.75 1.439 0.032 0.124 8.056 4.655817 1090 1502.6 1.792 1.439 0.0325 0.126 8.379 4.841915 1188 1679 1.83 1.439 0.032 0.124 8.425 4.868
1018 1291 1864.4 1.863 1.439 0.0315 0.1221 8.443 4.8781253 1526 2287.4 1.922 1.439 0.0322 0.1248 8.904 5.1451453 1726 2647.4 1.963 1.439 0.0315 0.1221 8.899 5.1421674 1947 3045.2 2.008 1.439 0.0315 0.1221 9.101 5.259

23
Table 20. Thermophysical Property Data of LaRC J1, Which Is T-300 3k CVI Densified Material
Temperature Thermal diffusivity Thermal conductivity
Materialspecimen Direction °C K °F
Heat capacity,J/g-K
Density,g/cm3 cm2/s ft2/hr W/m-K Btu/hr-ft-°F
19 In-plane 19 292 66.2 0.678 1.35 0.14 0.5426 12.807 7.4208 481 406.4 1.178 1.35 0.121 0.469 19.238 11.116305 578 581 1.353 1.35 0.106 0.4108 19.362 11.187403 676 757.4 1.488 1.35 0.0944 0.3659 18.961 10.956435 708 815 1.525 1.35 0.0879 0.3407 18.091 10.453541 814 1005.8 1.626 1.35 0.0832 0.3225 18.262 10.552631 904 1167.8 1.692 1.35 0.0801 0.3104 18.302 10.575736 1009 1356.8 1.754 1.35 0.0784 0.3039 18.561 10.724814 1087 1497.2 1.79 1.35 0.076 0.2946 18.369 10.614937 1210 1718.6 1.837 1.35 0.0763 0.2957 18.924 10.935
1000 1273 1832 1.857 1.35 0.074 0.2868 18.555 10.7211271 1544 2319.8 1.926 1.35 0.0735 0.2849 19.106 11.0391576 1849 2868.8 1.988 1.35 0.0723 0.2802 19.403 11.2111726 1999 3138.8 2.019 1.35 0.0748 0.2899 20.391 11.782
19 t-t-t 20 293 68 0.681 1.35 0.0207 0.0802 1.902 1.099206 479 402.8 1.174 1.35 0.0172 0.0667 2.725 1.575304 577 579.2 1.351 1.35 0.0155 0.0601 2.828 1.634449 722 840.2 1.54 1.35 0.0149 0.0577 3.097 1.789527 800 980.6 1.614 1.35 0.0149 0.0577 3.247 1.876636 909 1176.8 1.696 1.35 0.0143 0.0554 3.274 1.892717 990 1322.6 1.744 1.35 0.0144 0.0558 3.391 1.959818 1091 1504.4 1.792 1.35 0.0137 0.0531 3.314 1.915910 1183 1670 1.828 1.35 0.0141 0.0546 3.479 2.01
1009 1282 1848.2 1.86 1.35 0.0139 0.0539 3.491 2.0171302 1575 2375.6 1.932 1.35 0.013 0.0504 3.391 1.959

24
Table 21. Thermophysical Property Data of LaRC J2, Which Is T-300 3k CVI Densified Material
Temperature Thermal diffusivity Thermal conductivity
Materialspecimen Direction °C K °F
Heat capacity,J/g-K
Density,g/cm3 cm2/s ft2/hr W/m-K Btu/hr-ft-°F
20 In-plane 19 292 66.2 0.678 1.57 0.39 1.5115 41.492 23.974208 481 406.4 1.178 1.57 0.27 1.0465 49.924 28.846304 577 579.2 1.351 1.57 0.233 0.9031 49.438 28.565403 676 757.4 1.488 1.57 0.205 0.7945 47.886 27.669530 803 986 1.617 1.57 0.181 0.7015 45.939 26.544619 892 1146.2 1.684 1.57 0.154 0.5969 40.727 23.532716 989 1320.8 1.743 1.57 0.147 0.5697 40.23 23.245820 1093 1508 1.793 1.57 0.141 0.5465 39.69 22.933913 1186 1675.4 1.829 1.57 0.14 0.5426 40.201 23.228
1014 1287 1857.2 1.861 1.57 0.139 0.5387 40.623 23.4721263 1536 2305.4 1.924 1.57 0.129 0.5 38.962 22.5121589 1862 2892.2 1.99 1.57 0.124 0.4806 38.751 22.391716 1989 3120.8 2.017 1.57 0.135 0.5232 42.742 24.696
20 t-t-t 20 293 68 0.681 1.57 0.0319 0.1236 3.41 1.97204 477 399.2 1.169 1.57 0.0267 0.1035 4.902 2.832304 577 579.2 1.351 1.57 0.024 0.093 5.092 2.942459 732 858.2 1.55 1.57 0.0222 0.086 5.403 3.122517 790 962.6 1.605 1.57 0.021 0.0814 5.293 3.058632 905 1169.6 1.693 1.57 0.0203 0.0787 5.396 3.118705 978 1301 1.737 1.57 0.0199 0.0771 5.427 3.136813 1086 1495.4 1.79 1.57 0.0188 0.0729 5.283 3.053906 1179 1662.8 1.826 1.57 0.0191 0.074 5.477 3.165
1006 1279 1842.8 1.859 1.57 0.0194 0.0752 5.662 3.2721277 1550 2330.6 1.927 1.57 0.018 0.0698 5.445 3.1461474 1747 2685.2 1.967 1.57 0.0182 0.0705 5.622 3.2481669 1942 3036.2 2.007 1.57 0.0187 0.0725 5.892 3.404

25
Table 22. Thermophysical Property Data of LaRC J3, Which Is T-300 3k CVI Densified Material
Temperature Thermal diffusivity Thermal conductivity
Materialspecimen Direction °C K °F
Heat capacity,J/g-K
Density,g/cm3 cm2/s ft2/hr W/m-K Btu/hr-ft-°F
21 In-plane 19 292 66.2 0.678 1.51 0.157 0.6085 16.065 9.282208 481 406.4 1.178 1.51 0.121 0.469 21.518 12.433304 577 579.2 1.351 1.51 0.113 0.438 23.06 13.324403 676 757.4 1.488 1.51 0.103 0.3992 23.141 13.371524 797 975.2 1.611 1.51 0.0902 0.3496 21.948 12.682630 903 1166 1.692 1.51 0.0853 0.3306 21.791 12.591732 1005 1349.6 1.752 1.51 0.0799 0.3097 21.133 12.21819 1092 1506.2 1.793 1.51 0.0765 0.2965 20.706 11.964927 1200 1700.6 1.834 1.51 0.0753 0.2918 20.851 12.048
1015 1288 1859 1.862 1.51 0.0743 0.288 20.888 12.0691272 1545 2321.6 1.926 1.51 0.0706 0.2736 20.53 11.8621519 1792 2766.2 1.976 1.51 0.0712 0.276 21.249 12.2781685 1958 3065 2.01 1.51 0.0721 0.2794 21.884 12.645
21 t-t-t 20 293 68 0.681 1.51 0.0308 0.1194 3.166 1.829204 477 399.2 1.169 1.51 0.0258 0.1 4.556 2.632304 577 579.2 1.351 1.51 0.0241 0.0934 4.918 2.842446 719 834.8 1.536 1.51 0.0222 0.086 5.15 2.976512 785 953.6 1.601 1.51 0.0207 0.0802 5.004 2.891627 900 1160.6 1.69 1.51 0.0189 0.0733 4.823 2.787717 990 1322.6 1.744 1.51 0.0185 0.0717 4.871 2.814813 1086 1495.4 1.79 1.51 0.0188 0.0729 5.081 2.936909 1182 1668.2 1.828 1.51 0.0187 0.0725 5.16 2.982
1007 1280 1844.6 1.859 1.51 0.0177 0.0686 4.97 2.8711251 1524 2283.8 1.921 1.51 0.0168 0.0651 4.874 2.8161476 1749 2688.8 1.968 1.51 0.0165 0.064 4.903 2.8331677 1950 3050.6 2.008 1.51 0.0176 0.0682 5.338 3.084

26
Table 23. Thermophysical Property Data of LaRC J4, Which Is T-300 3k CVI Densified Material
Temperature Thermal diffusivity Thermal conductivity
Materialspecimen Direction °C K °F
Heat capacity,J/g-K
Density,g/cm3 cm2/s ft2/hr W/m-K Btu/hr-ft-°F
22 In-plane 19 292 66.2 0.678 1.65 0.442 1.7131 49.42 28.555208 481 406.4 1.178 1.65 0.289 1.1201 56.16 32.45304 577 579.2 1.351 1.65 0.27 1.0465 60.208 34.788403 676 757.4 1.488 1.65 0.22 0.8527 54.009 31.206516 789 960.8 1.604 1.65 0.198 0.7674 52.418 30.287636 909 1176.8 1.696 1.65 0.172 0.6666 48.126 27.807716 989 1320.8 1.743 1.65 0.153 0.593 44.006 25.426818 1091 1504.4 1.792 1.65 0.146 0.5659 43.171 24.944917 1190 1682.6 1.83 1.65 0.143 0.5542 43.187 24.954
1007 1280 1844.6 1.859 1.65 0.136 0.5271 41.725 24.1091259 1532 2298.2 1.923 1.65 0.124 0.4806 39.343 22.7321545 1818 2813 1.982 1.65 0.122 0.4728 39.891 23.0491708 1981 3106.4 2.015 1.65 0.121 0.469 40.228 23.244
22 t-t-t 20 293 68 0.681 1.65 0.0347 0.1345 3.898 2.252203 476 397.4 1.167 1.65 0.0274 0.1062 5.278 3.049304 577 579.2 1.351 1.65 0.0265 0.1027 5.909 3.414449 722 840.2 1.54 1.65 0.0236 0.0915 5.995 3.464529 802 984.2 1.616 1.65 0.0215 0.0833 5.732 3.312625 898 1157 1.689 1.65 0.0193 0.0748 5.377 3.107714 987 1317.2 1.742 1.65 0.019 0.0736 5.461 3.156814 1087 1497.2 1.79 1.65 0.0188 0.0729 5.554 3.209921 1194 1689.8 1.832 1.65 0.0178 0.069 5.38 3.108
1012 1285 1853.6 1.861 1.65 0.0175 0.0678 5.373 3.1051256 1529 2292.8 1.922 1.65 0.0175 0.0678 5.55 3.2071461 1734 2661.8 1.965 1.65 0.018 0.0698 5.835 3.3721678 1951 3052.4 2.009 1.65 0.0177 0.0686 5.866 3.39

27
Table 24. Thermophysical Property Data of LaRC J5, Which Is T-300 3k CVI Densified Material
Temperature Thermal diffusivity Thermal conductivity
Materialspecimen Direction °C K °F
Heat capacity,J/g-K
Density,g/cm3 cm2/s ft2/hr W/m-K Btu/hr-ft-°F
23 In-plane 19 292 66.2 0.678 1.39 0.32 1.2402 30.142 17.416208 481 406.4 1.178 1.39 0.252 0.9767 41.254 23.836304 577 579.2 1.351 1.39 0.198 0.7674 37.195 21.491403 676 757.4 1.488 1.39 0.173 0.6705 35.778 20.673523 796 973.4 1.611 1.39 0.143 0.5542 32.014 18.498635 908 1175 1.695 1.39 0.136 0.5271 32.044 18.515723 996 1333.4 1.747 1.39 0.127 0.4922 30.838 17.818819 1092 1506.2 1.793 1.39 0.125 0.4845 31.145 17.995901 1174 1653.8 1.825 1.39 0.121 0.469 30.689 17.732
1006 1279 1842.8 1.859 1.39 0.116 0.4496 29.976 17.321262 1535 2303.6 1.924 1.39 0.111 0.4302 29.679 17.1481561 1834 2841.8 1.985 1.39 0.112 0.4341 30.9 17.8541693 1966 3079.4 2.012 1.39 0.113 0.438 31.599 18.258
23 t-t-t 20 293 68 0.681 1.39 0.0448 0.1736 4.239 2.45205 478 401 1.172 1.39 0.0339 0.1314 5.52 3.19304 577 579.2 1.351 1.39 0.0297 0.1151 5.579 3.224440 713 824 1.53 1.39 0.0291 0.1128 6.189 3.576550 823 1022 1.633 1.39 0.027 0.1046 6.13 3.542602 875 1115.6 1.673 1.39 0.0259 0.1004 6.022 3.479718 991 1324.4 1.744 1.39 0.024 0.093 5.819 3.362818 1091 1504.4 1.792 1.39 0.0222 0.086 5.53 3.195913 1186 1675.4 1.829 1.39 0.0212 0.0822 5.39 3.114
1005 1278 1841 1.859 1.39 0.0194 0.0752 5.012 2.8961247 1520 2276.6 1.92 1.39 0.0174 0.0674 4.644 2.6841457 1730 2654.6 1.964 1.39 0.0161 0.0624 4.395 2.541655 1928 3011 2.004 1.39 0.0151 0.0585 4.206 2.43

28
Table 25. Thermophysical Property Data of LaRC J6, Which Is T-300 3k CVI Densified Material
Temperature Thermal diffusivity Thermal conductivity
Materialspecimen Direction °C K °F
Heat capacity,J/g-K
Density,g/cm3 cm2/s ft2/hr W/m-K Btu/hr-ft-°F
24 In-plane 19 292 66.2 0.678 1.61 0.548 2.1239 59.787 34.545208 481 406.4 1.178 1.61 0.352 1.3643 66.745 38.565304 577 579.2 1.351 1.61 0.286 1.1085 62.23 35.956403 676 757.4 1.488 1.61 0.252 0.9767 60.365 34.879506 779 942.8 1.596 1.61 0.23 0.8914 59.081 34.137620 893 1148 1.685 1.61 0.209 0.81 56.703 32.763717 990 1322.6 1.744 1.61 0.198 0.7674 55.585 32.117812 1085 1493.6 1.789 1.61 0.185 0.717 53.3 30.797903 1176 1657.4 1.825 1.61 0.173 0.6705 50.843 29.377
1008 1281 1846.4 1.86 1.61 0.166 0.6434 49.703 28.7181274 1547 2325.2 1.926 1.61 0.13 0.5038 40.315 23.2941543 1816 2809.4 1.981 1.61 0.13 0.5038 41.467 23.961699 1972 3090.2 2.013 1.61 0.137 0.531 44.402 25.655
24 t-t-t 20 293 68 0.681 1.61 0.0657 0.2546 7.201 4.161205 478 401 1.172 1.61 0.0495 0.1919 9.336 5.395304 577 579.2 1.351 1.61 0.0451 0.1748 9.813 5.67427 700 800.6 1.516 1.61 0.0361 0.1399 8.809 5.09526 799 978.8 1.613 1.61 0.031 0.1201 8.051 4.652626 899 1158.8 1.689 1.61 0.0296 0.1147 8.05 4.651707 980 1304.6 1.738 1.61 0.0294 0.1139 8.228 4.754811 1084 1491.8 1.789 1.61 0.0284 0.1101 8.18 4.727911 1184 1671.8 1.828 1.61 0.0276 0.107 8.124 4.694
1002 1275 1835.6 1.858 1.61 0.0266 0.1031 7.957 4.5971254 1527 2289.2 1.922 1.61 0.0258 0.1 7.983 4.6121456 1729 2652.8 1.964 1.61 0.0245 0.095 7.746 4.4761673 1946 3043.4 2.008 1.61 0.0238 0.0922 7.693 4.445

29
Table 26. Thermophysical Property Data of LaRC J7, Which Is T-300 3k CVI Densified Material
Temperature Thermal diffusivity Thermal conductivity
Materialspecimen Direction °C K °F
Heat capacity,J/g-K
Density,g/cm3 cm2/s ft2/hr W/m-K Btu/hr-ft-°F
25 In-plane 19 292 66.2 0.678 1.54 0.398 1.5426 41.534 23.998208 481 406.4 1.178 1.54 0.268 1.0387 48.608 28.085304 577 579.2 1.351 1.54 0.223 0.8643 46.412 26.817403 676 757.4 1.488 1.54 0.193 0.748 44.222 25.551541 814 1005.8 1.626 1.54 0.154 0.5969 38.559 22.279621 894 1149.8 1.686 1.54 0.142 0.5504 36.865 21.301722 995 1331.6 1.746 1.54 0.138 0.5349 37.113 21.444807 1080 1484.6 1.787 1.54 0.125 0.4845 34.406 19.88907 1180 1664.6 1.827 1.54 0.12 0.4651 33.76 19.506
1012 1285 1853.6 1.861 1.54 0.111 0.4302 31.81 18.381251 1524 2283.8 1.921 1.54 0.112 0.4341 33.136 19.1461514 1787 2757.2 1.975 1.54 0.101 0.3915 30.726 17.7531703 1976 3097.4 2.014 1.54 0.108 0.4186 33.495 19.353
25 t-t-t 20 293 68 0.681 1.54 0.0718 0.2783 7.528 4.35206 479 402.8 1.174 1.54 0.0461 0.1787 8.332 4.814304 577 579.2 1.351 1.54 0.0424 0.1643 8.825 5.099448 721 838.4 1.539 1.54 0.0388 0.1504 9.193 5.312508 781 946.4 1.597 1.54 0.0345 0.1337 8.487 4.904628 901 1162.4 1.691 1.54 0.0306 0.1186 7.966 4.603714 987 1317.2 1.742 1.54 0.03 0.1163 8.048 4.65808 1081 1486.4 1.788 1.54 0.0287 0.1112 7.902 4.565901 1174 1653.8 1.825 1.54 0.0291 0.1128 8.177 4.725
1004 1277 1839.2 1.859 1.54 0.0281 0.1089 8.043 4.6471249 1522 2280.2 1.921 1.54 0.0256 0.0992 7.572 4.3751388 1661 2530.4 1.95 1.54 0.026 0.1008 7.808 4.5111684 1957 3063.2 2.01 1.54 0.0244 0.0946 7.552 4.364

30
Table 27. Thermophysical Property Data of LaRC J8, Which Is T-300 3k CVI Densified Material
Temperature Thermal diffusivity Thermal conductivity
Materialspecimen Direction °C K °F
Heat capacity,J/g-K
Density,g/cm3 cm2/s ft2/hr W/m-K Btu/hr-ft-°F
26 In-plane 19 292 66.2 0.678 1.66 0.547 2.12 61.531 35.553208 481 406.4 1.178 1.66 0.322 1.248 62.952 36.374304 577 579.2 1.351 1.66 0.304 1.1782 68.2 39.406403 676 757.4 1.488 1.66 0.269 1.0426 66.438 38.388528 801 982.4 1.615 1.66 0.232 0.8992 62.193 35.935634 907 1173.2 1.694 1.66 0.204 0.7907 57.381 33.155722 995 1331.6 1.746 1.66 0.193 0.748 55.949 32.328825 1098 1517 1.795 1.66 0.17 0.6589 50.656 29.269915 1188 1679 1.83 1.66 0.169 0.655 51.329 29.658
1012 1285 1853.6 1.861 1.66 0.158 0.6124 48.808 28.2011273 1546 2323.4 1.926 1.66 0.155 0.6007 49.555 28.6331485 1758 2705 1.97 1.66 0.141 0.5465 46.101 26.6371698 1971 3088.4 2.013 1.66 0.15 0.5814 50.12 28.959
26 t-t-t 20 293 68 0.681 1.66 0.074 0.2868 8.363 4.832206 479 402.8 1.174 1.66 0.0515 0.1996 10.033 5.797304 577 579.2 1.351 1.66 0.0442 0.1713 9.916 5.729432 705 809.6 1.521 1.66 0.0407 0.1577 10.278 5.939511 784 951.8 1.6 1.66 0.038 0.1473 10.093 5.832633 906 1171.4 1.694 1.66 0.0334 0.1295 9.391 5.426722 995 1331.6 1.746 1.66 0.0322 0.1248 9.335 5.394823 1096 1513.4 1.794 1.66 0.0289 0.112 8.608 4.973913 1186 1675.4 1.829 1.66 0.0286 0.1108 8.683 5.017
1020 1293 1868 1.863 1.66 0.027 0.1046 8.351 4.8251238 1511 2260.4 1.918 1.66 0.022 0.0853 7.006 4.0481468 1741 2674.4 1.966 1.66 0.0217 0.0841 7.083 4.0921683 1956 3061.4 2.01 1.66 0.0205 0.0795 6.839 3.952

31
Table 28. Thermophysical Property Data of LaRC F1, Which Is K321 2k Phenolic Densified Material
Temperature Thermal diffusivity Thermal conductivity
Materialspecimen Direction °C K °F
Heat capacity,J/g-K
Density,g/cm3 cm2/s ft2/hr W/m-K Btu/hr-ft-°F
27 In-plane 22 295 71.6 0.687 1.77 0.451 1.748 54.85 31.692126 399 258.8 0.988 1.77 0.336 1.302 58.76 33.952206 479 402.8 1.174 1.77 0.313 1.213 65.019 37.568307 580 584.6 1.356 1.77 0.269 1.043 64.572 37.309405 678 761 1.49 1.77 0.246 0.953 64.888 37.492524 797 975.2 1.611 1.77 0.214 0.829 61.039 35.268617 890 1142.6 1.683 1.77 0.198 0.767 58.986 34.082720 993 1328 1.745 1.77 0.181 0.702 55.914 32.307812 1085 1493.6 1.789 1.77 0.171 0.663 54.163 31.295911 1184 1671.8 1.828 1.77 0.162 0.628 52.423 30.29
1007 1280 1844.6 1.859 1.77 0.154 0.597 50.684 29.2851316 1589 2400.8 1.935 1.77 0.145 0.562 49.666 28.6971633 1906 2971.4 1.999 1.77 0.138 0.535 48.838 28.2191867 2140 3392.6 2.049 1.77 0.131 0.508 47.522 27.4582083 2356 3781.4 2.102 1.77 0.118 0.457 43.897 25.364
27 t-t-t 22 295 71.6 0.687 1.77 0.0427 0.165 5.193 3.001206 479 402.8 1.174 1.77 0.0328 0.127 6.813 3.937307 580 584.6 1.356 1.77 0.028 0.109 6.721 3.884405 678 761 1.49 1.77 0.0249 0.097 6.568 3.795537 810 998.6 1.623 1.77 0.023 0.089 6.605 3.817625 898 1157 1.689 1.77 0.0221 0.086 6.605 3.816722 995 1331.6 1.746 1.77 0.0192 0.074 5.935 3.429810 1083 1490 1.789 1.77 0.0181 0.07 5.73 3.311910 1183 1670 1.828 1.77 0.0177 0.069 5.727 3.309
1002 1275 1835.6 1.858 1.77 0.0182 0.071 5.985 3.4581339 1612 2442.2 1.94 1.77 0.0177 0.069 6.078 3.5121680 1953 3056 2.009 1.77 0.016 0.062 5.69 3.2881934 2207 3513.2 2.065 1.77 0.0158 0.061 5.775 3.3372173 2446 3943.4 2.126 1.77 0.014 0.054 5.268 3.044

32
Table 29. Thermophysical Property Data of LaRC P1, Which Is K321 2k AR Pitch Densified Material
Temperature Thermal diffusivity Thermal conductivity
Materialspecimen Direction °C K °F
Heat capacity,J/g-K
Density,g/cm3 cm2/s ft2/hr W/m-K Btu/hr-ft-°F
28 In-plane 22 295 71.6 0.687 1.884 1.804 6.9919 233.53 134.934126 399 258.8 0.988 1.884 1.097 4.2517 204.201 117.988206 479 402.8 1.174 1.884 0.836 3.2401 184.845 106.803307 580 584.6 1.356 1.884 0.653 2.5309 166.844 96.402405 678 761 1.49 1.884 0.532 2.0619 149.365 86.303540 813 1004 1.625 1.884 0.482 1.8681 147.568 85.265600 873 1112 1.671 1.884 0.415 1.6084 130.667 75.499715 988 1319 1.743 1.884 0.394 1.5271 129.353 74.74815 1088 1499 1.791 1.884 0.35 1.3565 118.085 68.229914 1187 1677.2 1.829 1.884 0.315 1.2209 108.562 62.727998 1271 1828.4 1.857 1.884 0.283 1.0968 98.995 57.199
1294 1567 2361.2 1.93 1.884 0.243 0.9418 88.38 51.0661645 1918 2993 2.002 1.884 0.22 0.8527 82.974 47.9421898 2171 3448.4 2.057 1.884 0.206 0.7984 79.817 46.1182109 2382 3828.2 2.109 1.884 0.165 0.6395 65.546 37.872
28 t-t-t 22 295 71.6 0.687 1.884 0.158 0.6124 20.453 11.818126 399 258.8 0.988 1.884 0.113 0.438 21.034 12.154206 479 402.8 1.174 1.884 0.0829 0.3213 18.33 10.591307 580 584.6 1.356 1.884 0.0699 0.2709 17.86 10.319405 678 761 1.49 1.884 0.0567 0.2198 15.919 9.198516 789 960.8 1.604 1.884 0.0421 0.1632 12.726 7.353617 890 1142.6 1.683 1.884 0.0384 0.1488 12.176 7.036707 980 1304.6 1.738 1.884 0.0343 0.1329 11.233 6.49819 1092 1506.2 1.793 1.884 0.031 0.1201 10.469 6.049914 1187 1677.2 1.829 1.884 0.0305 0.1182 10.512 6.074
1004 1277 1839.2 1.859 1.884 0.0276 0.107 9.664 5.5841296 1569 2364.8 1.931 1.884 0.0263 0.1019 9.567 5.5281639 1912 2982.2 2.001 1.884 0.0249 0.0965 9.385 5.4231971 2244 3579.8 2.074 1.884 0.0229 0.0888 8.947 5.172173 2446 3943.4 2.126 1.884 0.0233 0.0903 9.331 5.392

33
Figure 1. Specific heat for carbon-graphite from TPRC (Thermophysical Properties Research Center) data (ref. 6).
3
1
.3200 1000 3000
Temperature, K
Hea
t cap
acity
, J/g
-K

34
Figure 2. Range of in-plane thermal conductivity values for materials reported in paper.
250
150
50
0
200
100
The
rmal
con
duct
ivity
, W/m
-K
The
rmal
con
duct
ivity
, Btu
/hr-
ft-°F
250 500 750 1000 1250 1500 1750 2000 2250 2500
Temperature, K
140
120
100
80
60
40
20
0
–10 490 990 1490 1990Temperature, °F
2490 2990 3490 3990

35
Figure 3. Range of through-the-thickness thermal conductivity values for materials reported in paper.
45
40
35
30
25
20
15
5
10
0
The
rmal
con
duct
ivity
, W/m
-K
The
rmal
con
duct
ivity
, Btu
/hr-
ft-°F
250 500 750 1000 1250 1500 1750 2000 2250 2500
Temperature, K
25
20
15
10
5
0
–10 490 990 1490 1990Temperature, °F
2490 2990 3490 3990

36
Figure 4. Thermal diffusivity versus temperature for LaRC panel 7A, which is T-300 3k phenolic densified material.
0
.05
.10
.15
.20
.25
.30
0
.2
.4
.6
.8
1.0
250 500 750 1000 1250 1500 1750 2000
-10 490 990 1490 1990 2490 2990
The
rmal
diff
usiv
ity, c
m2 /
s
The
rmal
diff
usiv
ity, f
t2/h
rTemperature, K
Temperature, °F
In-plane
t-t-t
Specimen 1

37
Figure 5. Thermal diffusivity versus temperature for LaRC panel 7B, which is T-300 3k LoPIC densified material.
0
.05
.10
.15
.20
.25
.30
0
.2
.4
.6
.8
1.0
250 500 750 1000 1250 1500 1750 2000
-10 490 990 1490 1990 2490 2990
The
rmal
diff
usiv
ity, c
m2 /
s
The
rmal
diff
usiv
ity, f
t2/h
r
Temperature, K
Temperature, °F
In-plane
t-t-t
Specimen 2

38
Figure 6. Thermal diffusivity versus temperature for LaRC panel 6, which is T-300 3k hybrid densified material.
0
.05
.10
.15
.20
.25
.30
0
.2
.4
.6
.8
1.0
250 500 750 1000 1250 1500 1750 2000
-10 490 990 1490 1990 2490 2990
The
rmal
diff
usiv
ity, c
m2 /
s
The
rmal
diff
usiv
ity, f
t2/h
r
Temperature, K
Temperature, °F
In-plane
t-t-t
Specimen 3

39
Figure 7. Thermal diffusivity versus temperature for LaRC panel 7C, which is T-300 3k CVI densified material.
0
.05
.10
.15
.20
.25
.30
0
.2
.4
.6
.8
1.0
250 500 750 1000 1250 1500 1750 2000
-10 490 990 1490 1990 2490 2990
The
rmal
diff
usiv
ity, c
m2 /
s
The
rmal
diff
usiv
ity, f
t2/h
r
Temperature, K
Temperature, °F
In-plane
t-t-t
Specimen 4

40
Figure 8. Thermal diffusivity versus temperature for LaRC panel 1P, which is T-50 3k phenolic densified material.
0
.05
.10
.15
.20
.25
.30
0
.2
.4
.6
.8
1.0
250 500 750 1000 1250 1500 1750 2000
-10 490 990 1490 1990 2490 2990
The
rmal
diff
usiv
ity, c
m2 /
s
The
rmal
diff
usiv
ity, f
t2/h
r
Temperature, K
Temperature, °F
In-plane
t-t-t
Specimen 5

41
Figure 9. Thermal diffusivity versus temperature for LaRC panel 9H, which is T-50 3k hybrid densified material.
0
.05
.10
.15
.20
.25
.30
0
.2
.4
.6
.8
1.0
250 500 750 1000 1250 1500 1750 2000
-10 490 990 1490 1990 2490 2990
The
rmal
diff
usiv
ity, c
m2 /
s
The
rmal
diff
usiv
ity, f
t2/h
r
Temperature, K
Temperature, °F
In-plane
t-t-t
Specimen 6

42
Figure 10. Thermal diffusivity versus temperature for LaRC panel 10-1, which is Celion 3k phenolic densified material.
0
.05
.10
.15
.20
.25
.30
0
.2
.4
.6
.8
1.0
250 500 750 1000 1250 1500 1750 2000
-10 490 990 1490 1990 2490 2990
The
rmal
diff
usiv
ity, c
m2 /
s
The
rmal
diff
usiv
ity, f
t2/h
r
Temperature, K
Temperature, °F
In-plane
t-t-t
Specimen 7

43
Figure 11. Thermal diffusivity versus temperature for LaRC panel 10-3, which is Celion 3k LoPIC densified material.
0
.05
.10
.15
.20
.25
.30
0
.2
.4
.6
.8
1.0
250 500 750 1000 1250 1500 1750 2000
-10 490 990 1490 1990 2490 2990
The
rmal
diff
usiv
ity, c
m2 /
s
The
rmal
diff
usiv
ity, f
t2/h
r
Temperature, K
Temperature, °F
In-plane
t-t-t
Specimen 8

44
Figure 12. Thermal diffusivity versus temperature for LaRC panel 9-1, which is Celion 3k/2k phenolic densifiedmaterial.
0
.05
.10
.15
.20
.25
.30
0
.2
.4
.6
.8
1.0
250 500 750 1000 1250 1500 1750 2000
-10 490 990 1490 1990 2490 2990
The
rmal
diff
usiv
ity, c
m2 /
s
The
rmal
diff
usiv
ity, f
t2/h
r
Temperature, K
Temperature, °F
In-plane
t-t-t
Specimen 9

45
Figure 13. Thermal diffusivity versus temperature for LaRC panel 9-3, which is Celion 3k/2k LoPIC densified material.
0
.05
.10
.15
.20
.25
.30
0
.2
.4
.6
.8
1.0
250 500 750 1000 1250 1500 1750 2000
-10 490 990 1490 1990 2490 2990
The
rmal
diff
usiv
ity, c
m2 /
s
The
rmal
diff
usiv
ity, f
t2/h
r
Temperature, K
Temperature, °F
In-plane
t-t-t
Specimen 10

46
Figure 14. Thermal diffusivity versus temperature for Boeing/Rohr T-300 1k hybrid densified material.
0
.05
.10
.15
.20
.25
.30
0
.2
.4
.6
.8
1.0
250 500 750 1000 1250 1500 1750 2000
-10 490 990 1490 1990 2490 2990
The
rmal
diff
usiv
ity, c
m2 /
s
The
rmal
diff
usiv
ity, f
t2/h
r
Temperature, K
Temperature, °F
In-plane
t-t-t
Specimen 11

47
Figure 15. Thermal diffusivity versus temperature for CVD-coated Boeing/Rohr T-300 1k hybrid densified material.
0
.05
.10
.15
.20
.25
.30
0
.2
.4
.6
.8
1.0
250 500 750 1000 1250 1500 1750 2000
-10 490 990 1490 1990 2490 2990
The
rmal
diff
usiv
ity, c
m2 /
s
The
rmal
diff
usiv
ity, f
t2/h
r
Temperature, K
Temperature, °F
t-t-t
Specimen 12

48
Figure 16. Thermal diffusivity versus temperature for PPC-coated Boeing/Rohr T-300 1k hybrid densified material.
0
.05
.10
.15
.20
.25
.30
0
.2
.4
.6
.8
1.0
250 500 750 1000 1250 1500 1750 2000
-10 490 990 1490 1990 2490 2990
The
rmal
diff
usiv
ity, c
m2 /
s
The
rmal
diff
usiv
ity, f
t2/h
r
Temperature, K
Temperature, °F
t-t-t
Specimen 13

49
Figure 17. Thermal diffusivity versus temperature for CCAT T-300 3k phenolic densified material.
0
.05
.10
.15
.20
.25
.30
0
.2
.4
.6
.8
1.0
250 500 750 1000 1250 1500 1750 2000
-10 490 990 1490 1990 2490 2990
The
rmal
diff
usiv
ity, c
m2 /
s
The
rmal
diff
usiv
ity, f
t2/h
r
Temperature, K
Temperature, °F
In-plane
t-t-t
Specimen 14

50
Figure 18. Thermal diffusivity versus temperature for Type III coated CCAT T-300 3k phenolic densified material.
0
.05
.10
.15
.20
.25
.30
0
.2
.4
.6
.8
1.0
250 500 750 1000 1250 1500 1750 2000
-10 490 990 1490 1990 2490 2990
The
rmal
diff
usiv
ity, c
m2 /
s
The
rmal
diff
usiv
ity, f
t2/h
r
Temperature, K
Temperature, °F
t-t-t
Specimen 15

51
Figure 19. Thermal diffusivity versus temperature for LaRC stitched panel 2, which is T-300 3k phenolic densifiedmaterial.
0
.05
.10
.15
.20
.25
.30
0
.2
.4
.6
.8
1.0
250 500 750 1000 1250 1500 1750 2000
-10 490 990 1490 1990 2490 2990
The
rmal
diff
usiv
ity, c
m2 /
s
The
rmal
diff
usiv
ity, f
t2/h
r
Temperature, K
Temperature, °F
In-plane
t-t-t
Specimen 16

52
Figure 20. Thermal diffusivity versus temperature for LaRC stitched panel 5, which is T-300 3k phenolic densifiedmaterial.
0
.05
.10
.15
.20
.25
.30
0
.2
.4
.6
.8
1.0
250 500 750 1000 1250 1500 1750 2000
-10 490 990 1490 1990 2490 2990
The
rmal
diff
usiv
ity, c
m2 /
s
The
rmal
diff
usiv
ity, f
t2/h
r
Temperature, K
Temperature, °F
In-plane
t-t-t
Specimen 17

53
Figure 21. Thermal diffusivity versus temperature for LaRC stitched panel 8, which is T-300 3k phenolic densifiedmaterial.
0
.05
.10
.15
.20
.25
.30
0
.2
.4
.6
.8
1.0
250 500 750 1000 1250 1500 1750 2000
-10 490 990 1490 1990 2490 2990
The
rmal
diff
usiv
ity, c
m2 /
s
The
rmal
diff
usiv
ity, f
t2/h
r
Temperature, K
Temperature, °F
In-plane
t-t-t
Specimen 18

54
Figure 22. Thermal diffusivity versus temperature for LaRC J1, which is T-300 3k CVI densified material.
0
.10
.20
.30
.40
.50
.60
0
.4
.8
1.2
1.6
2.0
250 500 750 1000 1250 1500 1750 2000
-10 490 990 1490 1990 2490 2990
The
rmal
diff
usiv
ity, c
m2 /
s
The
rmal
diff
usiv
ity, f
t2/h
r
Temperature, K
Temperature, °F
In-plane
t-t-t
Specimen 19

55
Figure 23. Thermal diffusivity versus temperature for LaRC J2, which is T-300 3k CVI densified material.
0
.10
.20
.30
.40
.50
.60
0
.4
.8
1.2
1.6
2.0
250 500 750 1000 1250 1500 1750 2000
-10 490 990 1490 1990 2490 2990
The
rmal
diff
usiv
ity, c
m2 /
s
The
rmal
diff
usiv
ity, f
t2/h
r
Temperature, K
Temperature, °F
In-plane
t-t-t
Specimen 20

56
Figure 24. Thermal diffusivity versus temperature for LaRC J3, which is T-300 3k CVI densified material.
0
.10
.20
.30
.40
.50
.60
0
.4
.8
1.2
1.6
2.0
250 500 750 1000 1250 1500 1750 2000
-10 490 990 1490 1990 2490 2990
The
rmal
diff
usiv
ity, c
m2 /
s
The
rmal
diff
usiv
ity, f
t2/h
r
Temperature, K
Temperature, °F
In-plane
t-t-t
Specimen 21

57
Figure 25. Thermal diffusivity versus temperature for LaRC J4, which is T-300 3k CVI densified material.
0
.10
.20
.30
.40
.50
.60
0
.4
.8
1.2
1.6
2.0
250 500 750 1000 1250 1500 1750 2000
-10 490 990 1490 1990 2490 2990
The
rmal
diff
usiv
ity, c
m2 /
s
The
rmal
diff
usiv
ity, f
t2/h
r
Temperature, K
Temperature, °F
In-plane
t-t-t
Specimen 22

58
Figure 26. Thermal diffusivity versus temperature for LaRC J5, which is T-300 3k CVI densified material.
0
.10
.20
.30
.40
.50
.60
0
.4
.8
1.2
1.6
2.0
250 500 750 1000 1250 1500 1750 2000
-10 490 990 1490 1990 2490 2990
The
rmal
diff
usiv
ity, c
m2 /
s
The
rmal
diff
usiv
ity, f
t2/h
r
Temperature, K
Temperature, °F
In-plane
t-t-t
Specimen 23

59
Figure 27. Thermal diffusivity versus temperature for LaRC J6, which is T-300 3k CVI densified material.
0
.10
.20
.30
.40
.50
.60
0
.4
.8
1.2
1.6
2.0
250 500 750 1000 1250 1500 1750 2000
-10 490 990 1490 1990 2490 2990
The
rmal
diff
usiv
ity, c
m2 /
s
The
rmal
diff
usiv
ity, f
t2/h
r
Temperature, K
Temperature, °F
In-plane
t-t-t
Specimen 24

60
Figure 28. Thermal diffusivity versus temperature for LaRC J7, which is T-300 3k CVI densified material.
0
.10
.20
.30
.40
.50
.60
0
.4
.8
1.2
1.6
2.0
250 500 750 1000 1250 1500 1750 2000
-10 490 990 1490 1990 2490 2990
The
rmal
diff
usiv
ity, c
m2 /
s
The
rmal
diff
usiv
ity, f
t2/h
r
Temperature, K
Temperature, °F
In-plane
t-t-t
Specimen 25

61
Figure 29. Thermal diffusivity versus temperature for LaRC J8, which is T-300 3k CVI densified material.
0
.10
.20
.30
.40
.50
.60
0
.4
.8
1.2
1.6
2.0
250 500 750 1000 1250 1500 1750 2000
-10 490 990 1490 1990 2490 2990
The
rmal
diff
usiv
ity, c
m2 /
s
The
rmal
diff
usiv
ity, f
t2/h
r
Temperature, K
Temperature, °F
In-plane
t-t-t
Specimen 26

62
Figure 30. Thermal diffusivity versus temperature for LaRC F1, which is K321 2k phenolic densified material.
0
.10
.20
.30
.40
.50
.60
0
.4
.8
1.2
1.6
2.0
250 500 750 1000 1250 1500 1750 2000 2250 2500
-10 490 990 1490 1990 2490 2990 3490 3990
The
rmal
diff
usiv
ity, c
m2 /
s
The
rmal
diff
usiv
ity, f
t2/h
r
Temperature, K
Temperature, °F
In-plane
t-t-t
Specimen 27

63
Figure 31. Thermal diffusivity versus temperature for LaRC P1, which is K321 2k AR pitch densified material.
0
.50
1.00
1.50
2.00
0
1
2
3
4
5
6
7
250 500 750 1000 1250 1500 1750 2000 2250 2500
-10 490 990 1490 1990 2490 2990 3490 3990
The
rmal
diff
usiv
ity, c
m2 /
s
The
rmal
diff
usiv
ity, f
t2/h
r
Temperature, K
Temperature, °F
In-plane
t-t-t
Specimen 28

64
Figure 32. Thermal conductivity versus temperature for LaRC panel 7A, which is T-300 3k phenolic densified material.
0
5
15
10
25
20
35
30
40
45
0
5
10
20
15
25
250 500 750 1000 1250 1500 1750 2000
-10 490 990 1490 1990 2490 2990
The
rmal
con
duct
ivity
, W/m
-K
The
rmal
con
duct
ivity
, Btu
/hr-
ft-°F
Temperature, K
Temperature, °F
In-plane
t-t-t
Specimen 1

65
Figure 33. Thermal conductivity versus temperature for LaRC panel 7B, which is T-300 3k LoPIC densified material.
0
5
15
10
25
20
35
30
40
45
0
5
10
20
15
25
250 500 750 1000 1250 1500 1750 2000
-10 490 990 1490 1990 2490 2990
The
rmal
con
duct
ivity
, W/m
-K
The
rmal
con
duct
ivity
, Btu
/hr-
ft-°F
Temperature, K
Temperature, °F
In-plane
t-t-t
Specimen 2

66
Figure 34. Thermal conductivity versus temperature for LaRC panel 6, which is T-300 3k hybrid densified material.
0
5
15
10
25
20
35
30
40
45
0
5
10
20
15
25
250 500 750 1000 1250 1500 1750 2000
-10 490 990 1490 1990 2490 2990
The
rmal
con
duct
ivity
, W/m
-K
The
rmal
con
duct
ivity
, Btu
/hr-
ft-°F
Temperature, K
Temperature, °F
In-plane
t-t-t
Specimen 3

67
Figure 35. Thermal conductivity versus temperature for LaRC panel 7C, which is T-300 3k CVI densified material.
0
5
15
10
25
20
35
30
40
45
0
5
10
20
15
25
250 500 750 1000 1250 1500 1750 2000
-10 490 990 1490 1990 2490 2990
The
rmal
con
duct
ivity
, W/m
-K
The
rmal
con
duct
ivity
, Btu
/hr-
ft-°F
Temperature, K
Temperature, °F
In-plane
t-t-t
Specimen 4

68
Figure 36. Thermal conductivity versus temperature for LaRC panel 1P, which is T-50 3k phenolic densified material.
0
5
15
10
25
20
35
30
40
45
0
5
10
20
15
25
250 500 750 1000 1250 1500 1750 2000
-10 490 990 1490 1990 2490 2990
The
rmal
con
duct
ivity
, W/m
-K
The
rmal
con
duct
ivity
, Btu
/hr-
ft-°F
Temperature, K
Temperature, °F
In-plane
t-t-t
Specimen 5
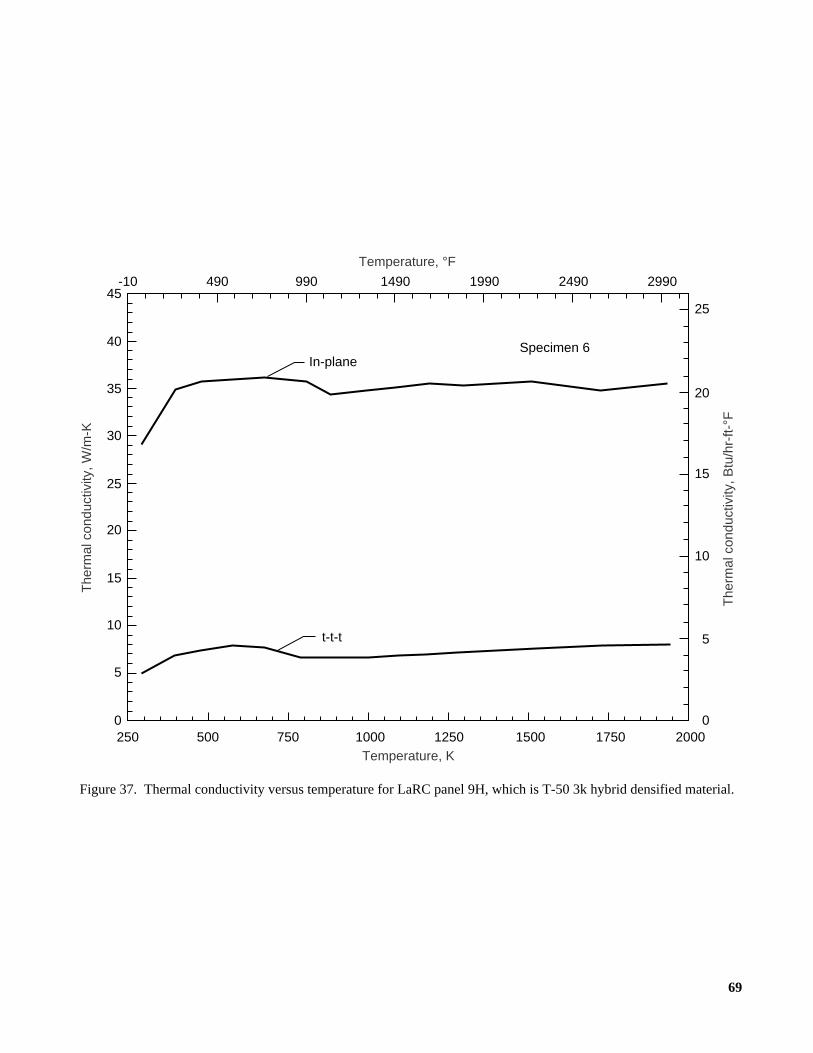
69
Figure 37. Thermal conductivity versus temperature for LaRC panel 9H, which is T-50 3k hybrid densified material.
0
5
15
10
25
20
35
30
40
45
0
5
10
20
15
25
250 500 750 1000 1250 1500 1750 2000
-10 490 990 1490 1990 2490 2990
The
rmal
con
duct
ivity
, W/m
-K
The
rmal
con
duct
ivity
, Btu
/hr-
ft-°F
Temperature, K
Temperature, °F
In-plane
t-t-t
Specimen 6

70
Figure 38. Thermal conductivity versus temperature for LaRC panel 10-1, which is Celion 3k phenolic densifiedmaterial.
0
5
15
10
25
20
35
30
40
45
0
5
10
20
15
25
250 500 750 1000 1250 1500 1750 2000
-10 490 990 1490 1990 2490 2990
The
rmal
con
duct
ivity
, W/m
-K
The
rmal
con
duct
ivity
, Btu
/hr-
ft-°F
Temperature, K
Temperature, °F
In-plane
t-t-t
Specimen 7

71
Figure 39. Thermal conductivity versus temperature for LaRC panel 10-3, which is Celion 3k LoPIC densified material.
0
5
15
10
25
20
35
30
40
45
0
5
10
20
15
25
250 500 750 1000 1250 1500 1750 2000
-10 490 990 1490 1990 2490 2990
The
rmal
con
duct
ivity
, W/m
-K
The
rmal
con
duct
ivity
, Btu
/hr-
ft-°F
Temperature, K
Temperature, °F
In-plane
t-t-t
Specimen 8

72
Figure 40. Thermal conductivity versus temperature for LaRC panel 9-1, which is Celion 3k/2k phenolic densifiedmaterial.
0
5
15
10
25
20
35
30
40
45
0
5
10
20
15
25
250 500 750 1000 1250 1500 1750 2000
-10 490 990 1490 1990 2490 2990
The
rmal
con
duct
ivity
, W/m
-K
The
rmal
con
duct
ivity
, Btu
/hr-
ft-°F
Temperature, K
Temperature, °F
In-plane
t-t-t
Specimen 9

73
Figure 41. Thermal conductivity versus temperature for LaRC panel 9-3, which is Celion 3k/2k LoPIC densifiedmaterial.
0
5
15
10
25
20
35
30
40
45
0
5
10
20
15
25
250 500 750 1000 1250 1500 1750 2000
-10 490 990 1490 1990 2490 2990
The
rmal
con
duct
ivity
, W/m
-K
The
rmal
con
duct
ivity
, Btu
/hr-
ft-°F
Temperature, K
Temperature, °F
In-plane
t-t-t
Specimen 10

74
Figure 42. Thermal conductivity versus temperature for Boeing/Rohr T-300 1k hybrid densified material.
0
5
15
10
25
20
35
30
40
45
0
5
10
20
15
25
250 500 750 1000 1250 1500 1750 2000
-10 490 990 1490 1990 2490 2990
The
rmal
con
duct
ivity
, W/m
-K
The
rmal
con
duct
ivity
, Btu
/hr-
ft-°F
Temperature, K
Temperature, °F
In-plane
t-t-t
Specimen 11

75
Figure 43. Thermal conductivity versus temperature for CCAT T-300 3k phenolic densified material.
0
5
15
10
25
20
35
30
40
45
0
5
10
20
15
25
250 500 750 1000 1250 1500 1750 2000
-10 490 990 1490 1990 2490 2990
The
rmal
con
duct
ivity
, W/m
-K
The
rmal
con
duct
ivity
, Btu
/hr-
ft-°F
Temperature, K
Temperature, °F
In-plane
t-t-t
Specimen 14

76
Figure 44. Thermal conductivity versus temperature for LaRC stitched panel 2, which is T-300 3k phenolic densifiedmaterial.
0
5
15
10
25
20
35
30
40
45
0
5
10
20
15
25
250 500 750 1000 1250 1500 1750 2000
-10 490 990 1490 1990 2490 2990
The
rmal
con
duct
ivity
, W/m
-K
The
rmal
con
duct
ivity
, Btu
/hr-
ft-°F
Temperature, K
Temperature, °F
In-plane
t-t-t
Specimen 16

77
Figure 45. Thermal conductivity versus temperature for LaRC stitched panel 5, which is T-300 3k phenolic densifiedmaterial.
0
5
15
10
25
20
35
30
40
45
0
5
10
20
15
25
250 500 750 1000 1250 1500 1750 2000
-10 490 990 1490 1990 2490 2990
The
rmal
con
duct
ivity
, W/m
-K
The
rmal
con
duct
ivity
, Btu
/hr-
ft-°F
Temperature, K
Temperature, °F
In-plane
t-t-t
Specimen 17

78
Figure 46. Thermal conductivity versus temperature for LaRC stitched panel 8, which is T-300 3k phenolic densifiedmaterial.
0
5
15
10
25
20
35
30
40
45
0
5
10
20
15
25
250 500 750 1000 1250 1500 1750 2000
-10 490 990 1490 1990 2490 2990
The
rmal
con
duct
ivity
, W/m
-K
The
rmal
con
duct
ivity
, Btu
/hr-
ft-°F
Temperature, K
Temperature, °F
In-plane
t-t-t
Specimen 18

79
Figure 47. Thermal conductivity versus temperature for LaRC J1, which is T-300 3k CVI densified material.
0
10
20
40
30
50
60
70
0
10
5
15
35
30
25
20
40
250 500 750 1000 1250 1500 1750 2000
-10 490 990 1490 1990 2490 2990
The
rmal
con
duct
ivity
, W/m
-K
The
rmal
con
duct
ivity
, Btu
/hr-
ft-°F
Temperature, K
Temperature, °F
In-plane
t-t-t
Specimen 19

80
Figure 48. Thermal conductivity versus temperature for LaRC J2, which is T-300 3k CVI densified material.
0
10
20
40
30
50
60
70
0
10
5
15
35
30
25
20
40
250 500 750 1000 1250 1500 1750 2000
-10 490 990 1490 1990 2490 2990
The
rmal
con
duct
ivity
, W/m
-K
The
rmal
con
duct
ivity
, Btu
/hr-
ft-°F
Temperature, K
Temperature, °F
In-plane
t-t-t
Specimen 20

81
Figure 49. Thermal conductivity versus temperature for LaRC J3, which is T-300 3k CVI densified material.
0
10
20
40
30
50
60
70
0
10
5
15
35
30
25
20
40
250 500 750 1000 1250 1500 1750 2000
-10 490 990 1490 1990 2490 2990
The
rmal
con
duct
ivity
, W/m
-K
The
rmal
con
duct
ivity
, Btu
/hr-
ft-°F
Temperature, K
Temperature, °F
In-plane
t-t-t
Specimen 21

82
Figure 50. Thermal conductivity versus temperature for LaRC J4, which is T-300 3k CVI densified material.
0
10
20
40
30
50
60
70
0
10
5
15
35
30
25
20
40
250 500 750 1000 1250 1500 1750 2000
-10 490 990 1490 1990 2490 2990
The
rmal
con
duct
ivity
, W/m
-K
The
rmal
con
duct
ivity
, Btu
/hr-
ft-°F
Temperature, K
Temperature, °F
In-plane
t-t-t
Specimen 22

83
Figure 51. Thermal conductivity versus temperature for LaRC J5, which is T-300 3k CVI densified material.
0
10
20
40
30
50
60
70
0
10
5
15
35
30
25
20
40
250 500 750 1000 1250 1500 1750 2000
-10 490 990 1490 1990 2490 2990
The
rmal
con
duct
ivity
, W/m
-K
The
rmal
con
duct
ivity
, Btu
/hr-
ft-°F
Temperature, K
Temperature, °F
In-plane
t-t-t
Specimen 23

84
Figure 52. Thermal conductivity versus temperature for LaRC J6, which is T-300 3k CVI densified material.
0
10
20
40
30
50
60
70
0
10
5
15
35
30
25
20
40
250 500 750 1000 1250 1500 1750 2000
-10 490 990 1490 1990 2490 2990
The
rmal
con
duct
ivity
, W/m
-K
The
rmal
con
duct
ivity
, Btu
/hr-
ft-°F
Temperature, K
Temperature, °F
In-plane
t-t-t
Specimen 24

85
Figure 53. Thermal conductivity versus temperature for LaRC J7, which is T-300 3k CVI densified material.
0
10
20
40
30
50
60
70
0
10
5
15
35
30
25
20
40
250 500 750 1000 1250 1500 1750 2000
-10 490 990 1490 1990 2490 2990
The
rmal
con
duct
ivity
, W/m
-K
The
rmal
con
duct
ivity
, Btu
/hr-
ft-°F
Temperature, K
Temperature, °F
In-plane
t-t-t
Specimen 25

86
Figure 54. Thermal conductivity versus temperature for LaRC J8, which is T-300 3k CVI densified material.
0
10
20
40
30
50
60
70
0
10
5
15
35
30
25
20
40
250 500 750 1000 1250 1500 1750 2000
-10 490 990 1490 1990 2490 2990
The
rmal
con
duct
ivity
, W/m
-K
The
rmal
con
duct
ivity
, Btu
/hr-
ft-°F
Temperature, K
Temperature, °F
In-plane
t-t-t
Specimen 26

87
Figure 55. Thermal conductivity versus temperature for LaRC F1, which is K321 2k phenolic densified material.
250 500 750 1000 1250 1500 1750 2000 2250 2500
-10 490 990 1490 1990 2490 2990 3490 3990
Temperature, K
Temperature, °F
In-plane
t-t-t
Specimen 27
0
10
20
40
30
50
60
70
0
10
5
15
35
30
25
20
40
The
rmal
con
duct
ivity
, W/m
-K
The
rmal
con
duct
ivity
, Btu
/hr-
ft-°F

88
Figure 56. Thermal conductivity versus temperature for LaRC P1, which is K321 2k AR pitch densified material.
250 500 750 1000 1250 1500 1750 2000 2250 2500
-10 490 990 1490 1990 2490 2990 3490 3990
Temperature, K
Temperature, °F
In-plane
t-t-t
Specimen 28
0
50
100
150
200
250
0
40
20
60
120
100
80
140
The
rmal
con
duct
ivity
, W/m
-K
The
rmal
con
duct
ivity
, Btu
/hr-
ft-°F


Form ApprovedOMB No. 0704-0188
Public reporting burden for this collection of information is estimated to average 1 hour per response, including the time for reviewing instructions, searching existing data sources,gathering and maintaining the data needed, and completing and reviewing the collection of information. Send comments regarding this burden estimate or any other aspect of thiscollection of information, including suggestions for reducing this burden, to Washington Headquarters Services, Directorate for Information Operations and Reports, 1215 JeffersonDavis Highway, Suite 1204, Arlington, VA 22202-4302, and to the Office of Management and Budget, Paperwork Reduction Project (0704-0188), Washington, DC 20503.
1. AGENCY USE ONLY (Leave blank) 2. REPORT DATE 3. REPORT TYPE AND DATES COVERED
4. TITLE AND SUBTITLE 5. FUNDING NUMBERS
6. AUTHOR(S)
7. PERFORMING ORGANIZATION NAME(S) AND ADDRESS(ES)
9. SPONSORING/MONITORING AGENCY NAME(S) AND ADDRESS(ES)
11. SUPPLEMENTARY NOTES
8. PERFORMING ORGANIZATIONREPORT NUMBER
10. SPONSORING/MONITORINGAGENCY REPORT NUMBER
12a. DISTRIBUTION/AVAILABILITY STATEMENT 12b. DISTRIBUTION CODE
13. ABSTRACT (Maximum 200 words)
14. SUBJECT TERMS
17. SECURITY CLASSIFICATIONOF REPORT
18. SECURITY CLASSIFICATIONOF THIS PAGE
19. SECURITY CLASSIFICATIONOF ABSTRACT
20. LIMITATIONOF ABSTRACT
15. NUMBER OF PAGES
16. PRICE CODE
NSN 7540-01-280-5500 Standard Form 298 (Rev. 2-89)Prescribed by ANSI Std. Z39-18298-102
REPORT DOCUMENTATION PAGE
November 1997 Technical Memorandum
Thermal Conductivity Database of Various Structural Carbon-CarbonComposite Materials WU 632-20-21-13
Craig W. Ohlhorst, Wallace L. Vaughn, Philip O. Ransone, andHwa-Tsu Tsou
L-17620
NASA TM-4787
Ohlhorst, Vaughn, and Ransone: Langley Research Center, Hampton, VA; Tsou: NRC/NASA Resident ResearchAssociate at Langley Research Center, Hampton, VA.
Advanced thermal protection materials envisioned for use on future hypersonic vehicles will likely be subjected totemperatures in excess of 1811 K (2800°F) and, therefore, will require the rapid conduction of heat away from thestagnation regions of wing leading edges, the nose cap area, and from engine inlet and exhaust areas. Carbon-carbon composite materials are candidates for use in advanced thermal protection systems. For design purposes,high temperature thermophysical property data are required, but a search of the literature found little thermal con-ductivity data for carbon-carbon materials above 1255 K (1800°F). Because a need was recognized for in-plane andthrough-the-thickness thermal conductivity data for carbon-carbon composite materials over a wide temperaturerange, Langley Research Center (LaRC) embarked on an effort to compile a consistent set of thermal conductivityvalues from room temperature to 1922 K (3000°F) for carbon-carbon composite materials on hand at LaRC forwhich the precursor materials and thermal processing history were known. This report documents the thermal con-ductivity data generated for these materials. In-plane thermal conductivity values range from 10 to 233 W/m-K,whereas through-the-thickness values range from 2 to 21 W/m-K.
Carbon-carbon composites; Thermal conductivity 94
A05
NASA Langley Research CenterHampton, VA 23681-2199
National Aeronautics and Space AdministrationWashington, DC 20546-0001
Unclassified–UnlimitedSubject Category 24Availability: NASA CASI (301) 621-0390
Unclassified Unclassified Unclassified
Related Documents