THERMAL COMFORT IN HIGHLY GLAZED BUILDINGS DETERMINED FOR WEATHER YEARS ON ACCOUNT OF SOLAR RADIATION Dominika Knera 1 and Dariusz Heim 1 1 Department of Heat and Mass Transfer, Lodz University of Technology ul. Wolczanska 213, 90-924 Lodz, Poland [email protected], [email protected] ABSTRACT The presented work is devoted to the analysis of thermal comfort indexes in highly glazed buildings under different weather conditions. All cases considered here differ in thermo-optical properties (such as thermal resistance, transmission), geometry, construction and orientation. Building performance simulation models (thermal and air flow) were defined using simulation software ESP-r. According to the workflow, proposed by authors, the optimal solution for glazing façade system was found for each of four main directions: N, E, S and W. In the proposed method three criteria were used: PMV and PPD indexes during heating and cooling seasons and average PPD index for the whole year. All obtained results were analysed statistically. The basic weather database was worked out according to the WYEC2 standard procedure, based on the data of European location characterized by moderate climatic conditions. The second part of this study consists of the analysis according to different weather scenarios. Standard WYEC2 data set was modified by using various indexes for solar radiation and ambient temperature (modified WYEC2 database). Optimization algorithm were proceeded again according to the same workflow. Based on the final results, the effect of different weather data sets was estimated. The general final conclusions are that: - optimal solution obtained on the basis of PPD and PMV indexes (for heating and cooling period), is different from the solution obtained on the basis of annually averaged value of PPD, - final optimal solution depends on the assumed meteorological database (WYEC2 with different indexes), even then the input data (measured meteorological parameters of thirty years) are the same. INTRODUCTION The problems of thermal comfort in highly glazed buildings are well investigated and described (Hwang & Shu 2011, Lyons et al. 2000). Louvres systems and other shading devices are recommended to architects to protect against overheating during summer and to provide the required amount of daylight (Heim & Kieszkowski 2006). During winter, the largely glazed external surfaces become a source of heat lost. On the other hand, architects like transparent building components because of the aesthetic and practical point of view (Arbab & Finley 2010). Office workers sitting behind uncover glass facade are usually strongly exposed to solar radiation and having an effect of radiation asymmetry. Therefore, a new concept of facade design is still desirable. One of the questionable idea is a concept of Double Skin Facade (DSF) (Poirazis 2006). However, in regards to the thermal comfort, in general, double skin façade (DSF) buildings have slight advantages in relation to single skin façade (SSF) buildings (Huckemann et al. 2010). On the other hand, the effect of individual, external climatic conditions, including specific location and climate change, should be considered in the optimization process (Crawley 2008). THERMAL COMFORT IN A ROOM BEHIND HIGHLY GLAZED FACADE Surface temperature and solar radiation Glass curtain wall exposed to solar radiation and built up zone with control temperature is a very complex thermal system. The intensity of thermo- physical processes directly in a glass and on boundary layers depends on weather conditions and indoor parameters determined by heating/cooling control system. Particularly, the following two weather parameters should be taken into account: solar radiation and air temperature. Solar radiation decides of the intensity of photo-thermal conversion in a construction of the facade and the adjacent zone. High intensity solar radiation is unfavourable, as it increases the temperature of internal surfaces, which then causes a rise of the mean radiant temperature. Air temperature determines the heat exchange with human body and affects the internal surface temperature. Therefore, both parameters and thermo- physical processes indirectly create thermal comfort in a building. Modelling and simulation Analysis of indoor parameters and human comfort indexes was carried out using a dynamic model of heat and mass transfer with ESP-r (Clarke 2011). Proceedings of BS2013: 13th Conference of International Building Performance Simulation Association, Chambéry, France, August 26-28 - 2602 -

Welcome message from author
This document is posted to help you gain knowledge. Please leave a comment to let me know what you think about it! Share it to your friends and learn new things together.
Transcript
THERMAL COMFORT IN HIGHLY GLAZED BUILDINGS DETERMINED FOR WEATHER YEARS ON ACCOUNT OF SOLAR RADIATION
Dominika Knera1 and Dariusz Heim1
1Department of Heat and Mass Transfer, Lodz University of Technology ul. Wolczanska 213, 90-924 Lodz, Poland
[email protected], [email protected]
ABSTRACT The presented work is devoted to the analysis of thermal comfort indexes in highly glazed buildings under different weather conditions. All cases considered here differ in thermo-optical properties (such as thermal resistance, transmission), geometry, construction and orientation. Building performance simulation models (thermal and air flow) were defined using simulation software ESP-r. According to the workflow, proposed by authors, the optimal solution for glazing façade system was found for each of four main directions: N, E, S and W. In the proposed method three criteria were used: PMV and PPD indexes during heating and cooling seasons and average PPD index for the whole year. All obtained results were analysed statistically. The basic weather database was worked out according to the WYEC2 standard procedure, based on the data of European location characterized by moderate climatic conditions. The second part of this study consists of the analysis according to different weather scenarios. Standard WYEC2 data set was modified by using various indexes for solar radiation and ambient temperature (modified WYEC2 database). Optimization algorithm were proceeded again according to the same workflow. Based on the final results, the effect of different weather data sets was estimated. The general final conclusions are that: - optimal solution obtained on the basis of PPD and PMV indexes (for heating and cooling period), is different from the solution obtained on the basis of annually averaged value of PPD, - final optimal solution depends on the assumed meteorological database (WYEC2 with different indexes), even then the input data (measured meteorological parameters of thirty years) are the same.
INTRODUCTION The problems of thermal comfort in highly glazed buildings are well investigated and described (Hwang & Shu 2011, Lyons et al. 2000). Louvres systems and other shading devices are recommended to architects to protect against overheating during summer and to provide the required amount of daylight (Heim &
Kieszkowski 2006). During winter, the largely glazed external surfaces become a source of heat lost. On the other hand, architects like transparent building components because of the aesthetic and practical point of view (Arbab & Finley 2010). Office workers sitting behind uncover glass facade are usually strongly exposed to solar radiation and having an effect of radiation asymmetry. Therefore, a new concept of facade design is still desirable. One of the questionable idea is a concept of Double Skin Facade (DSF) (Poirazis 2006). However, in regards to the thermal comfort, in general, double skin façade (DSF) buildings have slight advantages in relation to single skin façade (SSF) buildings (Huckemann et al. 2010). On the other hand, the effect of individual, external climatic conditions, including specific location and climate change, should be considered in the optimization process (Crawley 2008).
THERMAL COMFORT IN A ROOM BEHIND HIGHLY GLAZED FACADE Surface temperature and solar radiation
Glass curtain wall exposed to solar radiation and built up zone with control temperature is a very complex thermal system. The intensity of thermo-physical processes directly in a glass and on boundary layers depends on weather conditions and indoor parameters determined by heating/cooling control system. Particularly, the following two weather parameters should be taken into account: solar radiation and air temperature. Solar radiation decides of the intensity of photo-thermal conversion in a construction of the facade and the adjacent zone. High intensity solar radiation is unfavourable, as it increases the temperature of internal surfaces, which then causes a rise of the mean radiant temperature. Air temperature determines the heat exchange with human body and affects the internal surface temperature. Therefore, both parameters and thermo-physical processes indirectly create thermal comfort in a building.
Modelling and simulation Analysis of indoor parameters and human comfort indexes was carried out using a dynamic model of heat and mass transfer with ESP-r (Clarke 2011).
Proceedings of BS2013: 13th Conference of International Building Performance Simulation Association, Chambéry, France, August 26-28
- 2602 -
Administrateur

ESP-r is an integrated energy modelling tool for thermal, visual, and acoustic performance simulation of buildings and the energy systems (Citherlet & Hand 2002).
Thermal comfort evaluation Basic factors affecting the thermal comfort can be classified into environmental and personal (Cena & Clarke 1980). Environmental factors include: air temperature, mean radiant temperature, air velocity and relative humidity (Hensen & Lamberts 2011). Personal factors are the level of human activity (metabolic rate) and the thermal insulation of clothing (Djongyang et al. 2010). Nowadays, two methods of determining thermal comfort coexist: the rational approach and the adaptive approach. The rational approach is based on the Fanger’s theory of heat balance and thermoregulation (Fanger 1970), while the adaptive approach is based on research carried out among the people in the building (Nicol & Humphreys 2002). In this paper, thermal comfort assessment will be carried out for heat balance approach through the indicators devised by Fanger PMV and PPD (Olesen & Parsons 2002). The main goal of the first part of the paper was a numerical analysis of thermal comfort in an office building with highly glazed façade, taking into account different thermo-optical properties for standard weather databases WYEC2. The aim of the second part of the study was to estimate an effect of modified weather databases on thermal comfort indexes – PMV and PPD in an office building with highly glazed facade.
OPTIMIZATION PROCEDURE For the purpose of the presented study, individual algorithm was developed and described. Thermal comfort parameters assumed for optimization are described below.
Parameters of optimization The first indicator considered in the paper is PMV (Predicted Mean Vote). PMV describes the predicted average rating of thermal comfort. The second means of assessing the thermal comfort is Fanger's PPD index (Predicted Percentage of Dissatisfied). It determines the participation of dissatisfied with the conditions in the room, expressed in percentage. For the purpose of multi-criteria evaluation of thermal comfort, different thermal and optical properties of glazed facade were considered. Thermal comfort was analysed statistically, using a normal distribution of determined values. The following three criteria were established to find out the best solution:
criterion I – the highest probability of the occurrence of neutral thermal sensation, which means the maximum density of probability for PMV index equal “0”, max. PMV(0),
criterion II – the lowest variation in the perception of discomfort, which means the minimum standard deviation for a normal distribution of PPD index, min. σ (PPD),
criterion III – the minimum number of people dissatisfied, namely the lowest average value of PPD index, min. PPDav .
Workflow The analysis algorithm was carried out for two workflows. First of them was developed for individual seasons and the second for the whole year.
Figure 1 Workflow for individual seasons
The workflow presented in Figure 1 consists of three stages which are individually considered for heating and cooling seasons. At the first stage, various thermal transmittance values were analysed in the heating season. Based on the obtained results, the first ranking of solutions was carried out. The best solution was determined and marked as U1τ0. In the next step, different transmission during cooling season was analysed. Just as at the earlier stage of the workflow, ranking of solutions was carried out by choosing the best one (U1τ1). Subsequent stage was the comparison of the best solutions for the first and the second step of analysis. If they were identified as the same (U1τ0 = U1τ1), it would mean the end of analysis. Otherwise, the third stage of analysis should be performed for the heating season only. At that
Proceedings of BS2013: 13th Conference of International Building Performance Simulation Association, Chambéry, France, August 26-28
- 2603 -

stage, the first and second solution were compared in respect of thermal transmittance, assuming optical parameters selected in the second stage of analysis (e.g. U1τ1 & U2τ1). Final solution is determined on the basis of the last part of analysis. The procedure described above should be performed for both the criterion I and the criterion II.
Figure 2 Workflow for the whole year
In an analogous way, the analysis was performed for the criterion III. As opposed to previous workflow, the first and second step was carried out for the whole year. Moreover, the end of analysis occurs after the second stage. Workflow for the criterion III is presented in Figure 2.
PROBLEM DEFINITION Boundary conditions and thermal comfort Two types of highly glazed buildings equipped with single and double skin facades were analysed and compared, taking into account thermal comfort parameters. Due to this classification, five different values of thermal transmittance were considered in the first stage of the analysis. Three cases for double skin facade were denoted U1, U2, U3. For single facade it was UY and UX, respectively for double and triple glazing windows. Values of thermal transmittance assigned to individual cases are shown in Table 1.
Table 1 Values of thermal transmittance
PARTITION
THERMAL TRANSMITTANCE
DOUBLE SKIN FACADE
SINGLE SKIN FACADE
U1 U2 U3 UX UY
External 5.5 5.5 2.8 0.7 1.4
Internal 2.8 1.4 1.4
Different transmission values were considered in the second step of the analysis, from τ1 to τ7. Seven cases were analysed for double skin facade (from τ1 to τ7) and six for single skin facade (from τ1 to τ6). The exact values of transmission coefficients are given in Table 2.
Table 2 Analysed transmission
PARTITION TRANSMISSION
τ1 τ2 τ3 τ4 τ5 τ6 τ7
External 0.7 0.6 0.5 0.4 0.3 0.2 0.2
Internal 0.7 0.7 0.7 0.7 0.7 0.7 0.2
The parameters required to determine the thermal comfort indexes adopted in the criteria for an office building, category II are presented in Table 3.
Table 3 Parameters of thermal comfort
Parameters The heating season
The cooling season
Metabolic rate, [met] 1.2 1.2
Thermal insulation, [clo] 1.0 0.5
Air velocity, [m/s] 0.16 0.19
Climate analysis Data of meteorological reference year WYEC2 “Weather Year for Energy Calculations, Version 2” was used for all simulations. In the first part of the work, the standard procedure (two workflows) was carried out for standard WYEC2, hereinafter referred to as WYEC2_0. Next, the same algorithm was performed for the modified WYEC2_1, WYEC2_2, and WYEC2_3. Modified weather data have different weights assigned to the various weather parameters, like global solar radiation or air velocity. Due to thermal comfort, the most important of these parameters is solar global radiation. The comparison of solar global radiation for standard and modified WYEC2 is presented in Figure 4.
Figure 4 The normal distribution of global solar
radiation for various weather data
0
0.001
0.002
0.003
0.004
0.005
0.006
0 50 100 150 200 250 300 350 400
Den
sity
of p
roba
bilit
y [-]
Solar global radiation [W/m2]
WYEC2_0 WYEC2_1 WYEC2_2 WYEC2_3
Heating season
Cooling season
Proceedings of BS2013: 13th Conference of International Building Performance Simulation Association, Chambéry, France, August 26-28
- 2604 -

-300
-200
-100
0
100
200
300
121
542
964
385
71
071
1 28
51
499
1 71
31
927
2 14
12
355
2 56
92
783
2 99
73
211
3 42
53
639
3 85
34
067
4 28
14
495
4 70
94
923
5 13
75
351
5 56
55
779
5 99
36
207
6 42
16
635
6 84
97
063
7 27
77
491
7 70
57
919
8 13
38
347
8 56
1Diffe
renc
e glo
bal s
olar
radi
atio
n [W
/m2 ]
T [h]
Figure 3 The difference global solar radiation for WYEC2_0 and WYEC2_1
Results displayed in Figure 4 show that global solar radiation for all modified weather data, both for the heating as well as for cooling season, is almost the same and very similar to standard WYEC2_0. Besides, monthly ratio presented in Table 4 shows that difference between these values is insignificant, from 0.83 to 1.11.
Table 4 Ratio of the global solar radiation between modified
and standard WYEC2 for particular months
MONTH WYEC2_1/ WYEC2_0
WYEC2_2/ WYEC2_0
WYEC2_3/ WYEC2_0
I 0.83 0.87 0.83
II 1.11 1.07 1.11
III 1.09 1.09 1.09
IV 0.96 0.96 0.96
VI 1.03 0.99 1.00
VII 1.00 1.00 1.01
VIII 0.90 0.91 0.90
X 0.92 1.01 0.92
XI 0.97 0.97 0.97
XII 0.88 0.88 0.88
However, more detailed analyses, with the hourly time step (Figure 3), show the substantial differences between the selected WYEC2_0 & WYEC2_1, reaching up to 250 W/m2. Similar differences were also noticed for other types of weather data files.
CASE STUDY The paper presents an analysis of the indoor thermal comfort for a single zone of an office building with glazing facade system. It was assumed that the test room is a landscape office classified into category II in consideration of estimation of temperature range and ventilation rate.
Due to the results obtained for May and September, it was assumed that this two months are not taken into account in the analysis. The heating season starts from 1st of October and ends on 30th of April, while the cooling season is from 1st of June to 31th of August. Further, analysis of PMV and PPD indexes was limited only to the period of the office occupancy, from Monday to Friday, 8.00 ÷ 16.00.
Geometry Analysis was conducted for a vertical section of eight-storey building, located in the climatic zone of Central Europe. Glass façade starts on the second floor, and in the case of double skin façade, it finishes one meter above the building. Analysed landscape office, located on the fourth floor, has the following measurements, 8.0 × 6.0 × 2.7 m (width × depth × height), and adjacent facade zone 8.0 × 1.0 × 2.7 m respectively.
Operation For the purpose of the analysis, it was assumed that double skin facade is naturally ventilated. Two cases of the air inlet and outlet opening were considered – different for the heating (fully closed) and cooling season (80% of opening for both inlet and outlet). Air flow in ESP- r can be model, using the nodal network method. The connection to the external environment was defined by two external nodes located at the appropriate heights above the ground, corresponding to the height of the inlet and outlet. Authors assumed two ventilation air flow schemes due to the office occupancy. First scheme related to the presence of employees and the second applied to the absence of people. The total amount of air flow required during occupancy is qtot1 = 0.0576 m3/s. It was assumed that during the absence of the people total air flow decreased to the amount of qtot2 = 0.0048 m3/s.
Proceedings of BS2013: 13th Conference of International Building Performance Simulation Association, Chambéry, France, August 26-28
- 2605 -

a) b)
c) d)
Figure 5 The normal distribution of PMV index for criterion I due to thermal transmittance for a) north, b) east, c) south and d) west oriented facade
Additionally, it was assumed that heat gains occurs only during the occupancy time. Total heat gains from one person is 100 W and additionally 120 W per one computer set. Under the assumption that for one person there was one computer and that three people worked in the office, the total internal heat gains equalled 660 W. On the other hand, during the absence of people, all internal heat gains were set to zero.
RESULTS FOR STANDARD WYEC2_0 According to the optimization procedure, around 600 simulations were performed for all cases considered in the analysis. All the results obtained are presented in the form of statistical analysis.
Results for criterion I and criterion II Results for both, criterion I and criterion II were determined by the same workflow for individual seasons. The first stage of the analysis was to optimize the solution in terms of thermal insulation of the facade. U-value affects the amount of heat loss, which in the heating season is important to the thermal conditions in the analysed zone. Solutions for criterion I were developed in consideration of the maximum density of probability for PMV index equal “0”, max. PMV(0). Normal distributions for all cardinal directions in terms of criterion I were presented in Figure 5. Results for criterion II were determined due to the minimum standard deviation for a normal distribution of PPD index, min. σ (PPD).
Solutions arising due to criterion II for all orientations are shown in Table 5. The best solutions for each facade are indicated in bold.
Table 5 Values of standard deviation for a normal
distribution of PPD index for criterion II due to analysis of thermal transmittance
U1 U2 U3 UX UY
N 4.17 3.77 3.78 4.70 4.37
E 4.72 4.61 5.11 9.38 8.62
S 5.60 6.42 8.00 14.15 16.73
W 4.61 4.34 4.46 9.65 8.97
The best solutions selected due to criterion I and criterion II are presented in Table 6
Table 6 The best solutions due to thermal transmittance
N E S W
Criterion I UX U3 U1 U3
Criterion II U2 U2 U1 U2
Analysis of the best solutions taking into account thermal transmittance leads to the conclusion that thermal conditions for a building with double skin facade are more comfortable than for buildings with single skin facade.
0.0
0.5
1.0
1.5
2.0
-0.5 0 0.5 1
Dens
ity of
prob
abilit
y [-]
PMV [-]
U1 U2 U3 UX UY
0.0
0.2
0.4
0.6
0.8
1.0
1.2
-0.5 0 0.5 1 1.5 2
Den
sity
of p
roba
bilit
y [-]
PMV [-]
U1 U2 U3 UX UY
0.0
0.2
0.4
0.6
0.8
-0.5 0 0.5 1 1.5 2 2.5
Den
sity
of p
roba
bilit
y [-]
PMV [-]
U1 U2 U3 UX UY
0.0
0.2
0.4
0.6
0.8
1.0
1.2
1.4
-0.5 0 0.5 1 1.5 2
Den
sity
of p
roba
bilit
y [-]
PMV [-]
U1 U2 U3 UX UY
Proceedings of BS2013: 13th Conference of International Building Performance Simulation Association, Chambéry, France, August 26-28
- 2606 -

a) b)
c) d)
Figure 6 The normal distribution of PMV index for criterion I due to transmission for a) north, b) east, c) south and d) west oriented facade
In the second stage of optimization, seven or six (in the case of a single facade) different transmission values were analysed. This parameter has a significant effect on the solar heat gains and temperature (air and radiant) in the analysed room. Normal distributions for all cardinal directions in terms of criterion I are presented in Figure 6. Solutions obtained due to criterion II for all orientations are shown in Table 7. The best solutions for each façade are indicated in bold.
Table 7 Values of standard deviation for a normal
distribution of PPD index for criterion II due to analysis of transmission
τ1 τ2 τ3 τ4 τ5 τ6 τ7
N 2.49 2.26 2.08 2.51 5.14 10.39 14.24
E 5.36 4.66 3.97 3.30 2.65 3.54 7.73
S 5.61 4.90 4.25 4.00 5.57 10.30 14.10
W 4.10 3.59 3.07 2.62 2.59 5.18 9.81
The best solutions selected due to criterion I and criterion II are shown in Table 8.
Table 8 The best solutions due to transmission
N E S W
Criterion I UX τ6 U3 τ6 U1 τ5 U3 τ6
Criterion II U2 τ3 U2 τ5 U1 τ4 U2 τ5
The best solutions in consideration of transmission were noticed for the medium value of τ (τ3÷τ6). The third step of the analysis was to verify the correctness of previous results. For this purpose, comparison of the first and second solution, due to thermal transmittance, was conducted. Solar thermal transmittance values were assumed as the best from results of the second stage (U1τ1 and U2τ1). The final solutions selected for criterion I, criterion II, and both: solar and thermal transmittance are presented in Table 9.
Table 9 Final best solutions for criterion I and criterion II
N E S W
Criterion I UX τ6 U3 τ6 U2 τ5 U3 τ6
Criterion II min. σ (PPD)
U2 τ3 U2 τ5 U2 τ4 U2 τ5
3.47 3.51 4.03 3.41
After the third step of the analysis, only the best solutions for southern facade both for criterion I and criterion II had changed due to thermal transmittance from U1 to U2.
Results for criterion III Results for criterion III were determined by the workflow for the whole year, taking onto account the lowest average value of PPD index (min. PPDav). Optimization for criterion III was performed in an analogous way to the analysis of previous criteria. Firstly, the best solution due to thermal transmittance
0.0
0.5
1.0
1.5
2.0
2.5
3.0
3.5
-0.5 0 0.5 1
Dens
ity o
f pro
babi
lity
[-]
PMV [-]
τ1 τ2 τ3 τ4 τ5 τ6
0.0
0.5
1.0
1.5
2.0
-1 -0.5 0 0.5 1 1.5
Den
sity
of p
roba
bilit
y [-]
PMV [-]
τ1 τ2 τ3 τ4 τ5 τ6 τ7
0.0
0.5
1.0
1.5
-1.5 -1 -0.5 0 0.5 1
Den
sity
of p
roba
bilit
y [-]
PMV [-]
τ1 τ2 τ3 τ4 τ5 τ6 τ7
0.0
0.5
1.0
1.5
2.0
2.5
-1 -0.5 0 0.5 1
Den
sity
of p
roba
biity
[-]
PMV [-]
τ1 τ2 τ3 τ4 τ5 τ6 τ7
Proceedings of BS2013: 13th Conference of International Building Performance Simulation Association, Chambéry, France, August 26-28
- 2607 -

for the whole year was developed. The results for this part of analysis are shown in Table 10.
Table 10 Minimum average value of PPD index for criterion
III due to thermal transmittance
U1 U2 U3 UX UY
N 12.10 11.13 10.82 12.83 13.02
E 12.91 12.37 12.71 17.41 17.81
S 12.19 12.58 13.54 21.92 22.40
W 12.24 11.49 11.69 17.10 17.53
In the second step of optimization procedure, various transmission values for the whole year were analysed. Solutions determined for this part of analysis established the final solutions due to criterion III. The results for analysis of transmission are presented in Table 11.
Table 11 Minimum average value of PPD index for criterion
III due to transmission
τ1 τ2 τ3 τ4 τ5 τ6 τ7
N 10.82 10.77 10.83 10.97 11.28 12.03 12.97
E 12.37 11.91 11.57 11.39 11.38 11.70 12.44
S 12.19 11.63 11.32 11.33 11.81 13.06 14.38
W 11.49 11.25 11.15 11.18 11.36 11.90 12.83
The final solutions selected for criterion III are shown in Table 12.
Table 12 The best solutions for criterion III
N E S W
Criterion III U3 τ2 U2 τ5 U1 τ3 U2 τ3
All the best solutions in consideration of criterion III were determined for double skin facade and medium value of transmission.
RESULTS FOR DIFFERENT WEATHER DATA In this section the comparison between the best solutions, obtained for various weather data is presented and discussed. The best solutions, due to the criterion I and individual facade orientation, for modified weather data were the same (Table 13). Moreover, the normal distribution of them were very similar. The best solutions for standard WYEC2_0, with the exception of northern facade, were different than the best solutions for modified weather data.
Table 13 The best solutions for criterion I
WYEC2_0 WYEC2_1 WYEC2_2 WYEC2_3
N UX τ6 UX τ6 UX τ6 UX τ6
E U3 τ6 UY τ6 UY τ6 UY τ6
S U2 τ5 U2 τ6 U2 τ6 U2 τ6
W U3 τ6 UY τ6 UY τ6 UY τ6
Further, the normal distribution of WYEC2_0 differed from others for south oriented facade (Figure 7). Similar differences were noticed for others also north oriented facade.
0.0
0.5
1.0
1.5
2.0
2.5
-1 -0.5 0 0.5
Dens
ity of
prob
abilit
y [-]
PMV [-]
WYEC2_0 WYEC2_1 WYEC2_2 WYEC2_3
Figure 7 The normal distribution of PMV index for
criterion I south oriented facade
More distinctions were noticed because of criterion II (Table 14). First of all, the best solutions for standard and modified WYEC2 were different, except for the similarity between WYEC2_0 and WYEC2_2 for the southern and western facade. Furthermore, only the results for WYEC2_1 and WYEC2_3 were the same, but it was caused by identical weather data for the heating season. The remaining best solutions for modified WYEC2 were different, except for the eastern facade. The greatest differences up to 11% were noticed for the western facade.
Table 14 The best solutions for criterion II due to the value of
standard deviation of PPD index
WYEC2_0 WYEC2_1 WYEC2_2 WYEC2_3
N U2 τ3 U2 τ4 U3 τ3 U2 τ4
3.47 3.44 3.79 3.44
E U2 τ5 U3 τ6 U3 τ6 U3 τ6
3.51 3.36 3.60 3.36
S U2 τ4 U2 τ5 U2 τ4 U2 τ5
4.03 3.79 4.13 3.79
W U2 τ5 U3 τ5 U2 τ5 U3 τ5
3.41 3.66 3.85 3.66
The differences in the selection of the best solution were also for criterion III. However, distinctions in
Proceedings of BS2013: 13th Conference of International Building Performance Simulation Association, Chambéry, France, August 26-28
- 2608 -
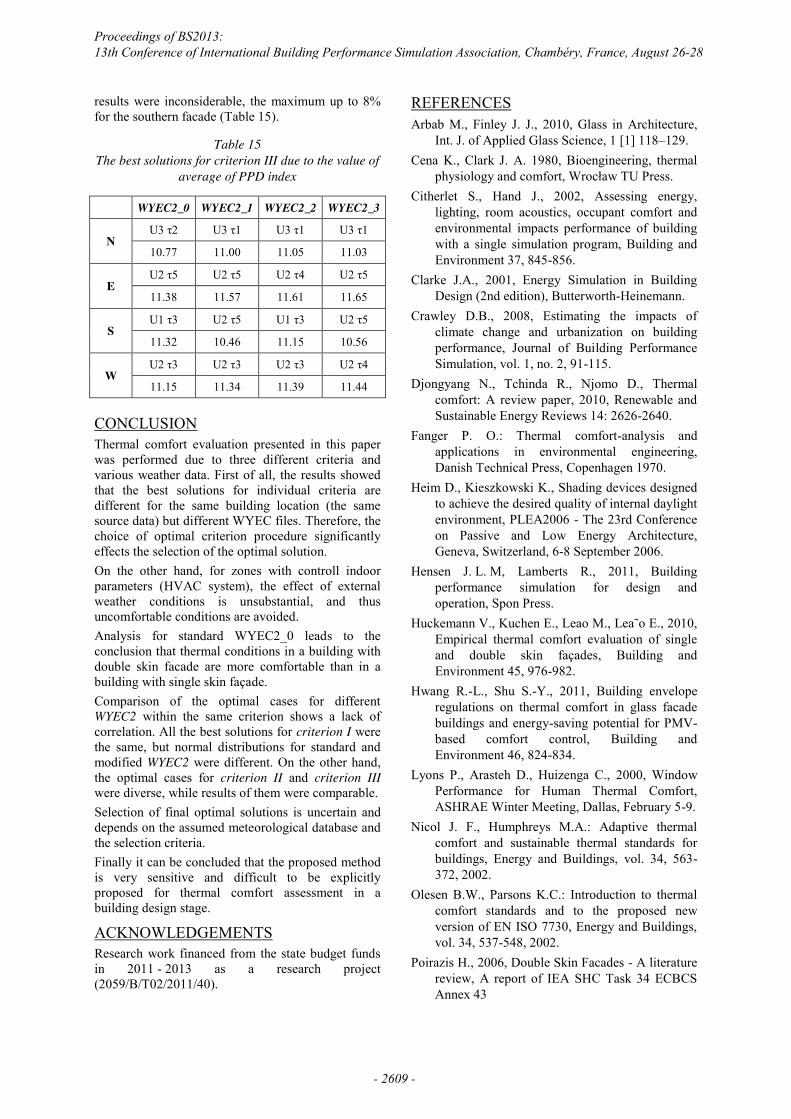
results were inconsiderable, the maximum up to 8% for the southern facade (Table 15).
Table 15 The best solutions for criterion III due to the value of
average of PPD index
WYEC2_0 WYEC2_1 WYEC2_2 WYEC2_3
N U3 τ2 U3 τ1 U3 τ1 U3 τ1
10.77 11.00 11.05 11.03
E U2 τ5 U2 τ5 U2 τ4 U2 τ5
11.38 11.57 11.61 11.65
S U1 τ3 U2 τ5 U1 τ3 U2 τ5
11.32 10.46 11.15 10.56
W U2 τ3 U2 τ3 U2 τ3 U2 τ4
11.15 11.34 11.39 11.44
CONCLUSION Thermal comfort evaluation presented in this paper was performed due to three different criteria and various weather data. First of all, the results showed that the best solutions for individual criteria are different for the same building location (the same source data) but different WYEC files. Therefore, the choice of optimal criterion procedure significantly effects the selection of the optimal solution. On the other hand, for zones with controll indoor parameters (HVAC system), the effect of external weather conditions is unsubstantial, and thus uncomfortable conditions are avoided. Analysis for standard WYEC2_0 leads to the conclusion that thermal conditions in a building with double skin facade are more comfortable than in a building with single skin façade. Comparison of the optimal cases for different WYEC2 within the same criterion shows a lack of correlation. All the best solutions for criterion I were the same, but normal distributions for standard and modified WYEC2 were different. On the other hand, the optimal cases for criterion II and criterion III were diverse, while results of them were comparable. Selection of final optimal solutions is uncertain and depends on the assumed meteorological database and the selection criteria. Finally it can be concluded that the proposed method is very sensitive and difficult to be explicitly proposed for thermal comfort assessment in a building design stage.
ACKNOWLEDGEMENTS Research work financed from the state budget funds in 2011 - 2013 as a research project (2059/B/T02/2011/40).
REFERENCES Arbab M., Finley J. J., 2010, Glass in Architecture,
Int. J. of Applied Glass Science, 1 [1] 118–129. Cena K., Clark J. A. 1980, Bioengineering, thermal
physiology and comfort, Wrocław TU Press. Citherlet S., Hand J., 2002, Assessing energy,
lighting, room acoustics, occupant comfort and environmental impacts performance of building with a single simulation program, Building and Environment 37, 845-856.
Clarke J.A., 2001, Energy Simulation in Building Design (2nd edition), Butterworth-Heinemann.
Crawley D.B., 2008, Estimating the impacts of climate change and urbanization on building performance, Journal of Building Performance Simulation, vol. 1, no. 2, 91-115.
Djongyang N., Tchinda R., Njomo D., Thermal comfort: A review paper, 2010, Renewable and Sustainable Energy Reviews 14: 2626-2640.
Fanger P. O.: Thermal comfort-analysis and applications in environmental engineering, Danish Technical Press, Copenhagen 1970.
Heim D., Kieszkowski K., Shading devices designed to achieve the desired quality of internal daylight environment, PLEA2006 - The 23rd Conference on Passive and Low Energy Architecture, Geneva, Switzerland, 6-8 September 2006.
Hensen J. L. M, Lamberts R., 2011, Building performance simulation for design and operation, Spon Press.
Huckemann V., Kuchen E., Leao M., Lea˜o E., 2010, Empirical thermal comfort evaluation of single and double skin façades, Building and Environment 45, 976-982.
Hwang R.-L., Shu S.-Y., 2011, Building envelope regulations on thermal comfort in glass facade buildings and energy-saving potential for PMV-based comfort control, Building and Environment 46, 824-834.
Lyons P., Arasteh D., Huizenga C., 2000, Window Performance for Human Thermal Comfort, ASHRAE Winter Meeting, Dallas, February 5-9.
Nicol J. F., Humphreys M.A.: Adaptive thermal comfort and sustainable thermal standards for buildings, Energy and Buildings, vol. 34, 563-372, 2002.
Olesen B.W., Parsons K.C.: Introduction to thermal comfort standards and to the proposed new version of EN ISO 7730, Energy and Buildings, vol. 34, 537-548, 2002.
Poirazis H., 2006, Double Skin Facades - A literature review, A report of IEA SHC Task 34 ECBCS Annex 43
Proceedings of BS2013: 13th Conference of International Building Performance Simulation Association, Chambéry, France, August 26-28
- 2609 -
Related Documents