Thermal comfort field study in undergraduate laboratories e An analysis of occupant perceptions Asit Kumar Mishra * , Maddali Ramgopal Department of Mechanical Engineering, Indian Institute of Technology Kharagpur, Kharagpur, West Bengal 721302, India article info Article history: Received 4 November 2013 Received in revised form 25 February 2014 Accepted 3 March 2014 Keywords: Thermal comfort Field study Adaptive thermal comfort Tropical climate Laboratory class Adaptive actions abstract A thermal comfort field study was conducted in an undergraduate laboratory classroom involving 121 subjects giving 338 responses. The building is located in a tropical climatic region of India. In addition to objective measurements of indoor climate, subjective responses on perceptions regarding thermal sensation, thermal preference, air velocity, and humidity were also collected. We present here an analysis of the subjective preferences and disposition of the occupants. While acceptability of higher air velocities seems ubiquitous amongst our subjects, a high level of tolerance for humid environments is also observed. Most of the responses (78%) are accepting of their thermal conditions. The occupants do have a predilection towards cooler thermal sensations and higher air velocities. Since the location is in a warm and humid region where fans are used in almost every building, this observation fits expectations. Students effectively adapt their clothing according to prevailing weather and even subject their clothing to some atypical adjustments. They also make use of the fact that laboratories have lesser constraints on posture and movement than lecture classes. Overall, the students are affable to indoors of naturally ventilated buildings and at the same time are empathetic to a naturally ventilated building’s environ- mentally friendly nature. Ó 2014 Elsevier Ltd. All rights reserved. 1. Introduction India’s higher education sector is seeing rapid growth both in terms of number of institutions and enrolments [1]. Ensuring thermal comfort in the large number of classrooms of these educational institutes is in national interest and a matter of ur- gency. For long, Indian classrooms relied on climate suitable design, natural ventilation, and ample use of fans to ensure student com- fort. With recent economic development of India though, the desire for AC has made a gross and unjustifiable jump from the category of ‘luxury’ items to that of ‘necessary’ items. Educational institutes have started proffering air-conditioning in a bid to stay attractive to prospective students. While AC may be seen as an easy way out for providing thermal comfort, in terms of energy demand, the idea is hardly sustainable. Also, classrooms are ideal locations for what Indraganti has called “thermal indulgence” [2] since users never face a utility bill. Electricity shortage figures at 9.9% of overall and 16.6% of peak demand haunt India’s growth story [3]. Every summer, India faces the double pronged problem of reduced electricity production due to reduced water levels in hydroelectric in- stallations and increased demand in agricultural sector for irriga- tion and building sector for AC. The confluence of all these factors may make grid collapses similar to that of 2012 summer [4] more commonplace. Comfort standards based on adaptive comfort models should come as a succour to Indian energy scenario. Recent studies [5e9] show that the Indian populace adapts with ease to the Indian climate. An occupant’s ability to adapt to his/her environment would depend on the availability of adaptive opportunities. A re- view of thermal comfort field studies found several works done in classrooms remarking that students have less access to and reduced number of adaptive opportunities compared to home or office oc- cupants [10]. At the same time, occupants’ subjective judgement regarding their thermal environment is also an important factor affecting their mental performance. This relation with productivity has been observed in contexts of perception of thermal comfort by school students [11], subjective thermal sensation of office workers [12], and overall satisfaction of office workers with their thermal environment [13]. Even ASHRAE defines thermal comfort not as a measurable physiological variable but as a “state of mind” [14]. So in environments where subjects are exerting themselves mentally, * Corresponding author. Tel. þ91 8768073875. E-mail addresses: [email protected], [email protected] (A.K. Mishra), [email protected] (M. Ramgopal). Contents lists available at ScienceDirect Building and Environment journal homepage: www.elsevier.com/locate/buildenv http://dx.doi.org/10.1016/j.buildenv.2014.03.005 0360-1323/Ó 2014 Elsevier Ltd. All rights reserved. Building and Environment 76 (2014) 62e72

Welcome message from author
This document is posted to help you gain knowledge. Please leave a comment to let me know what you think about it! Share it to your friends and learn new things together.
Transcript
lable at ScienceDirect
Building and Environment 76 (2014) 62e72
Contents lists avai
Building and Environment
journal homepage: www.elsevier .com/locate/bui ldenv
Thermal comfort field study in undergraduate laboratories e Ananalysis of occupant perceptions
Asit Kumar Mishra*, Maddali RamgopalDepartment of Mechanical Engineering, Indian Institute of Technology Kharagpur, Kharagpur, West Bengal 721302, India
a r t i c l e i n f o
Article history:Received 4 November 2013Received in revised form25 February 2014Accepted 3 March 2014
Keywords:Thermal comfortField studyAdaptive thermal comfortTropical climateLaboratory classAdaptive actions
* Corresponding author. Tel. þ91 8768073875.E-mail addresses: [email protected]
(A.K. Mishra), [email protected] (M. Ramgo
http://dx.doi.org/10.1016/j.buildenv.2014.03.0050360-1323/� 2014 Elsevier Ltd. All rights reserved.
a b s t r a c t
A thermal comfort field study was conducted in an undergraduate laboratory classroom involving 121subjects giving 338 responses. The building is located in a tropical climatic region of India. In addition toobjective measurements of indoor climate, subjective responses on perceptions regarding thermalsensation, thermal preference, air velocity, and humidity were also collected. We present here an analysisof the subjective preferences and disposition of the occupants. While acceptability of higher air velocitiesseems ubiquitous amongst our subjects, a high level of tolerance for humid environments is alsoobserved. Most of the responses (78%) are accepting of their thermal conditions. The occupants do have apredilection towards cooler thermal sensations and higher air velocities. Since the location is in a warmand humid region where fans are used in almost every building, this observation fits expectations.Students effectively adapt their clothing according to prevailing weather and even subject their clothingto some atypical adjustments. They also make use of the fact that laboratories have lesser constraints onposture and movement than lecture classes. Overall, the students are affable to indoors of naturallyventilated buildings and at the same time are empathetic to a naturally ventilated building’s environ-mentally friendly nature.
� 2014 Elsevier Ltd. All rights reserved.
1. Introduction
India’s higher education sector is seeing rapid growth both interms of number of institutions and enrolments [1]. Ensuringthermal comfort in the large number of classrooms of theseeducational institutes is in national interest and a matter of ur-gency. For long, Indian classrooms relied on climate suitable design,natural ventilation, and ample use of fans to ensure student com-fort. With recent economic development of India though, the desirefor AC has made a gross and unjustifiable jump from the category of‘luxury’ items to that of ‘necessary’ items. Educational instituteshave started proffering air-conditioning in a bid to stay attractive toprospective students. While AC may be seen as an easy way out forproviding thermal comfort, in terms of energy demand, the idea ishardly sustainable. Also, classrooms are ideal locations for whatIndraganti has called “thermal indulgence” [2] since users never facea utility bill. Electricity shortage figures at 9.9% of overall and 16.6%of peak demand haunt India’s growth story [3]. Every summer,
t.in, [email protected]).
India faces the double pronged problem of reduced electricityproduction due to reduced water levels in hydroelectric in-stallations and increased demand in agricultural sector for irriga-tion and building sector for AC. The confluence of all these factorsmay make grid collapses similar to that of 2012 summer [4] morecommonplace.
Comfort standards based on adaptive comfort models shouldcome as a succour to Indian energy scenario. Recent studies [5e9]show that the Indian populace adapts with ease to the Indianclimate. An occupant’s ability to adapt to his/her environmentwould depend on the availability of adaptive opportunities. A re-view of thermal comfort field studies found several works done inclassrooms remarking that students have less access to and reducednumber of adaptive opportunities compared to home or office oc-cupants [10]. At the same time, occupants’ subjective judgementregarding their thermal environment is also an important factoraffecting their mental performance. This relation with productivityhas been observed in contexts of perception of thermal comfort byschool students [11], subjective thermal sensation of office workers[12], and overall satisfaction of office workers with their thermalenvironment [13]. Even ASHRAE defines thermal comfort not as ameasurable physiological variable but as a “state of mind” [14]. Soin environments where subjects are exerting themselves mentally,
Nomenclature
AbbreviationsAC air-conditioningAVSS air velocity sensation scaleHSS humidity sensation scaleMRT mean radiant temperatureMTSV mean thermal sensation voteNV naturally ventilatedPMOAT prevailing mean outdoor air temperatureRH relative humidityRMT running mean temperatureTPS thermal preference scaleTSS thermal sensation scaleTSV thermal sensation vote (individual’s)
Symbolspa absolute pressure of water vapour in air (kPa)ta air temperature (�C)tc comfort temperature (using Griffiths’ formula) (�C)tg globe temperature (�C)tmrt mean radiant temperature (�C)top operative temperature (�C)trmt running mean temperature (�C)va air velocity (m/s)
Table 1Survey instruments.
Instrument Make Range Resolution Remarks
Slingpsychrometer
Local 0e120 �F 1 �F
Globethermometer
Constructed �10 e 110 �C 1 �C Globe ofplastic ball,70 mmdiameter
Anemometer Lutron AM-4201 0.1e30.0 m/s 0.1 m/s Vane-type
A.K. Mishra, M. Ramgopal / Building and Environment 76 (2014) 62e72 63
like a classroom, it is important to take into consideration how theyperceive their thermal environment and the opportunities they getfor adaptation.
In a recent work we reported some of our findings from athermal comfort field study done in an undergraduate laboratoryduring regular class hours [15]. Our findings showed that the stu-dents adeptly dealt with the thermal environment of the NVbuilding and found the indoors to be acceptable over a range of 20e31 �C. We also found that comfort temperatures found for ourstudent population, using Griffiths’ formula, had fair agreementwith established adaptive comfort standards. When increase incomfort temperature due to enhanced air velocity was taken intoaccount, the match improved. In the current work we analyse thesubjective votes and preferences of the students in the field survey.We look into how satisfied they are with different parameters oftheir thermal environment and how this perception reflects in theirpreferences and overall acceptance. We also look into what kind ofstrategies are put to work by students in adapting to their envi-ronment and what may be done to improve the efficacy of suchstrategies.
2. Study methodology
Detailed methodology of the study, choice of subjects andlocation, and objective measurements taken are discussed in anearlier work [15]. We briefly outline salient points of the studymethodology here. The study followed a laboratory course work forundergraduate students in Indian Institute of Technology (IIT)Kharagpur, India. Kharagpur is located in West Bengal, which is aneastern Indian state. Köppen classification gives Kharagpur aTropical savannah (Aw) type climate. Historical temperature data(obtained from the Department of Physics and Meteorology’s in-campus weather station) shows that January is the coolest monthwhile May is the warmest and April comes in a close second. Butsince summer breaks begin from the end of April, regular classes
are not held during the year’s warmest month. The survey wascarried out during the Spring semester of the Institute that startswith January and ends with April. Observations were taken during12 days from January through April, 2013.
Survey responses were taken from 121 students, aged between19 and 21 years. A total of 338 valid responses were gathered fromthem. These students had completed at least five semesters ofcourse work in IIT Kharagpur and thus, were assumed to be wellacclimatized to the local climate. Before being asked to answer thesurvey questionnaire, subjects were briefly introduced to thestructure and purpose of the survey. A clear impression was madethat they only need to give their frank and carefully thoughtopinions and they should not assume that the survey has anythingto do with future installation of air-conditioning in the labs andclassrooms. During the surveys, sometimes individual students didpose queries regarding understanding the import of certain ques-tions. Such queries were rare though.
2.1. Data collection
Survey activities were initiated 75e90 min into the class. Thiswas done to have the metabolic rate of the students stabilize afterthey walked or cycled from their hostels to the class. During theclass, groups of students, about 10 in number, worked withdifferent experimental set ups. Environmental parameters e drybulb and wet bulb temperature (DBT, WBT), globe temperature andair velocity e were measured simultaneously as students filled upthe survey questionnaire. Table 1 gives details regarding the in-struments used in the survey. The two thermometers used in thepsychrometer and the thermometer that was use to build the globethermometer were initially calibrated between the range of 10 and40 �C by using a reference thermometer from Zeal� (range �10 to50 �C, resolution 0.5 �C). For each group of students, five readingswere taken for DBT, WBT, and air velocity in the immediate vicinityof where they were working. As the globe thermometer required alonger time to get to a stable reading, only one globe temperaturewas recorded per group of students. While we calculated meanradiant temperature (MRT) using globe thermometer readings,operative temperature was obtained from a weighted average ofDBTandMRT. The convective heat transfer coefficient was used as aweighting factor for DBT while radiative heat transfer coefficientwas used to weight MRT. We assumed the radiative heat transfercoefficient to be constant at 4.7 W/m2 �C. Convective heat transfercoefficient was calculated from the relation given in ASHRAEHandbook of Fundamentals (Table 6, Chapter 9) [16] for use withstanding persons in moving air.
The measurements showed that there were no major variationsof thermal conditions between different sections of the lab. So,further analysis was done using averaged values of both environ-mental data and student votes. The R statistical computing packagewas used for all statistical analysis [17]. While performing regres-sion with the day-average values, a weight factor equal to thenumber of students surveyed on each corresponding day was used.
A.K. Mishra, M. Ramgopal / Building and Environment 76 (2014) 62e7264
Neutral temperature for any day during the survey was determinedusing Griffiths’ equation, but with a slope of 0.5 as proposed byHumphreys et al. [18].
Outdoor temperature data, was taken from the in-campusweather station in the Department of Physics and Meteorology.We calculated daily mean temperature by taking an average of theday’s recorded maximum and minimum temperatures. As one ofthe indices of outdoor temperature, a seven day RMT was calcu-lated with decay factor of 0.8 e as is used in EN15251 [19]. In viewof recent additions to Standard 55-2010, PMOATwas also calculatedas another index of outdoor air temperature by taking an average ofdaily mean temperatures from last seven days [14].
2.2. Subjective questionnaire
English is used as the medium of instruction at IIT. Hence, weconsidered that the students, who came from different states ofIndia, would enjoy similar levels of ease with a questionnaire beingframed in English. One of the prime concerns was to ensure that thesurvey did not hinder the normal schedule and running of the class.Accordingly, the questionnaire was designed tominimally interruptstudents’ engagement in their class. Keeping this in mind, separatesections on clothing and activity levels were not included in thepaper questionnaire. Values for clothing resistance and metabolicrates were estimated through observation. Table 2 gives the scaleoptions for the questions asked along with their numerical equiv-alents used during statistical analysis. The percentage of studentsvoting ‘Not acceptable’ in response to the acceptability of thermalenvironment question is taken to be the actual percentage dissat-isfied (APD).
To estimate clothing resistance values, we used an approachsimilar to the one used byMorgan and de Dear [20] in their study ofshoppers at a Sydney mall. We observed that students dressed insome or the other combination of half/full sleeve shirts, t-shirts,trousers, and jeans. Based on observation, every subject wasassigned a clo value according to the ensemble s/he had on. Duringwinter, extra clothing resistance values were added in for garmentslike jackets, sweaters, sweat-shirts etc. During the whole durationof the survey, the ensemble recorded with the lowest clo value wast-shirt with jeans while the highest clo value ensemble was acombination of full-sleeve shirt, jeans, and a sweat-shirt. Metabolicrate of the students, engaged in laboratory activities while standingor walking around, was estimated at 1.6 met in accordancewith thevalue given for “Standing, light activity (shopping, laboratory, lightindustry)” in ISO 7730-2005 [21].
3. Analysis of responses
3.1. Air velocity perception
The survey period was during what would be considered aswinter and summer seasons in Kharagpur. During this period, theclimate is generally not verywindy. Additionally, the position of the
Table 2Survey questionnaire options.
Numerical equivalent Thermal sensation Thermal comfort Air velocity
�3 Cold Much too cool e
�2 Cool Too cool e
�1 Slightly cool OK (cool) Still0 Neutral OK (Just right) Just right1 Slightly warm OK (warm) Breezy2 Warm Too warm e
3 Hot Much too warm e
building e sheltered by other buildings and a thick tree line e
resulted in there being very little contribution of outdoor winds onindoor air velocities. Air velocity recorded was primarily due to theuse of ceiling fans. During the cooler months of January andFebruary, none of the fans were in use while from the beginning ofMarch, all the fans were brought into use.
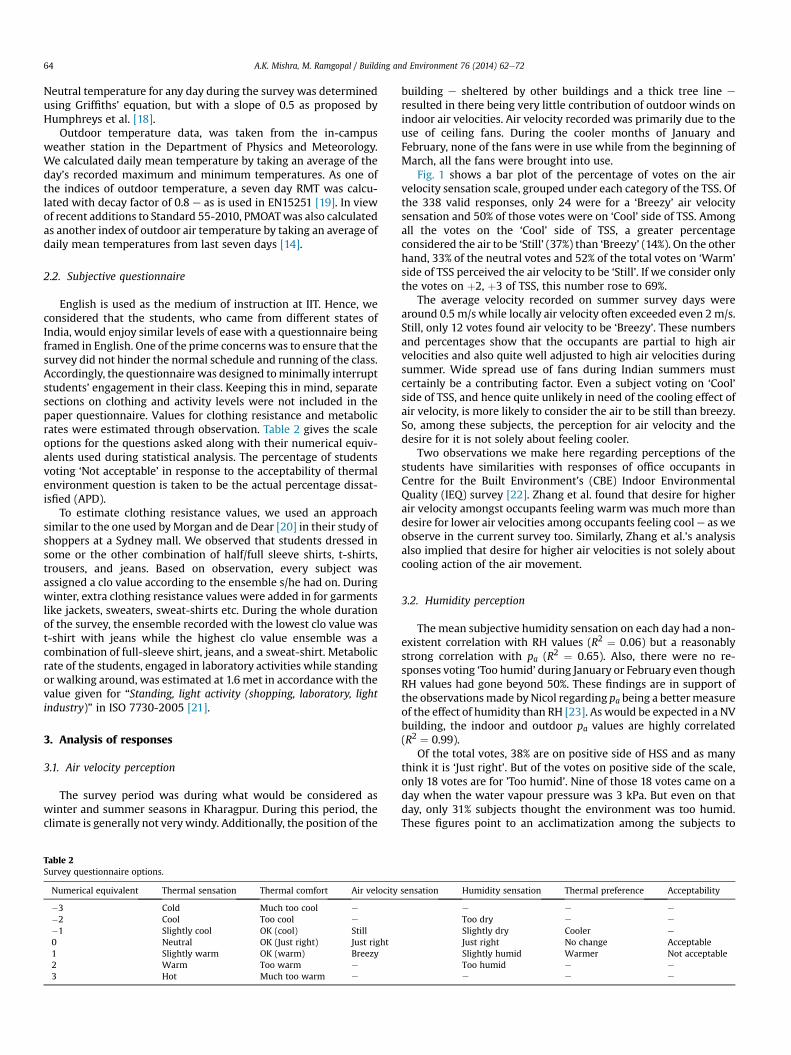
Fig. 1 shows a bar plot of the percentage of votes on the airvelocity sensation scale, grouped under each category of the TSS. Ofthe 338 valid responses, only 24 were for a ‘Breezy’ air velocitysensation and 50% of those votes were on ‘Cool’ side of TSS. Amongall the votes on the ‘Cool’ side of TSS, a greater percentageconsidered the air to be ‘Still’ (37%) than ‘Breezy’ (14%). On the otherhand, 33% of the neutral votes and 52% of the total votes on ‘Warm’
side of TSS perceived the air velocity to be ‘Still’. If we consider onlythe votes on þ2, þ3 of TSS, this number rose to 69%.
The average velocity recorded on summer survey days werearound 0.5 m/s while locally air velocity often exceeded even 2m/s.Still, only 12 votes found air velocity to be ‘Breezy’. These numbersand percentages show that the occupants are partial to high airvelocities and also quite well adjusted to high air velocities duringsummer. Wide spread use of fans during Indian summers mustcertainly be a contributing factor. Even a subject voting on ‘Cool’side of TSS, and hence quite unlikely in need of the cooling effect ofair velocity, is more likely to consider the air to be still than breezy.So, among these subjects, the perception for air velocity and thedesire for it is not solely about feeling cooler.
Two observations we make here regarding perceptions of thestudents have similarities with responses of office occupants inCentre for the Built Environment’s (CBE) Indoor EnvironmentalQuality (IEQ) survey [22]. Zhang et al. found that desire for higherair velocity amongst occupants feeling warm was much more thandesire for lower air velocities among occupants feeling coole as weobserve in the current survey too. Similarly, Zhang et al.’s analysisalso implied that desire for higher air velocities is not solely aboutcooling action of the air movement.
3.2. Humidity perception
The mean subjective humidity sensation on each day had a non-existent correlation with RH values (R2 ¼ 0.06) but a reasonablystrong correlation with pa (R2 ¼ 0.65). Also, there were no re-sponses voting ‘Too humid’ during January or February even thoughRH values had gone beyond 50%. These findings are in support ofthe observationsmade by Nicol regarding pa being a bettermeasureof the effect of humidity than RH [23]. As would be expected in a NVbuilding, the indoor and outdoor pa values are highly correlated(R2 ¼ 0.99).
Of the total votes, 38% are on positive side of HSS and as manythink it is ‘Just right’. But of the votes on positive side of the scale,only 18 votes are for ’Too humid’. Nine of those 18 votes came on aday when the water vapour pressure was 3 kPa. But even on thatday, only 31% subjects thought the environment was too humid.These figures point to an acclimatization among the subjects to
sensation Humidity sensation Thermal preference Acceptability
e e e
Too dry e e
Slightly dry Cooler e
Just right No change AcceptableSlightly humid Warmer Not acceptableToo humid e e
e e e
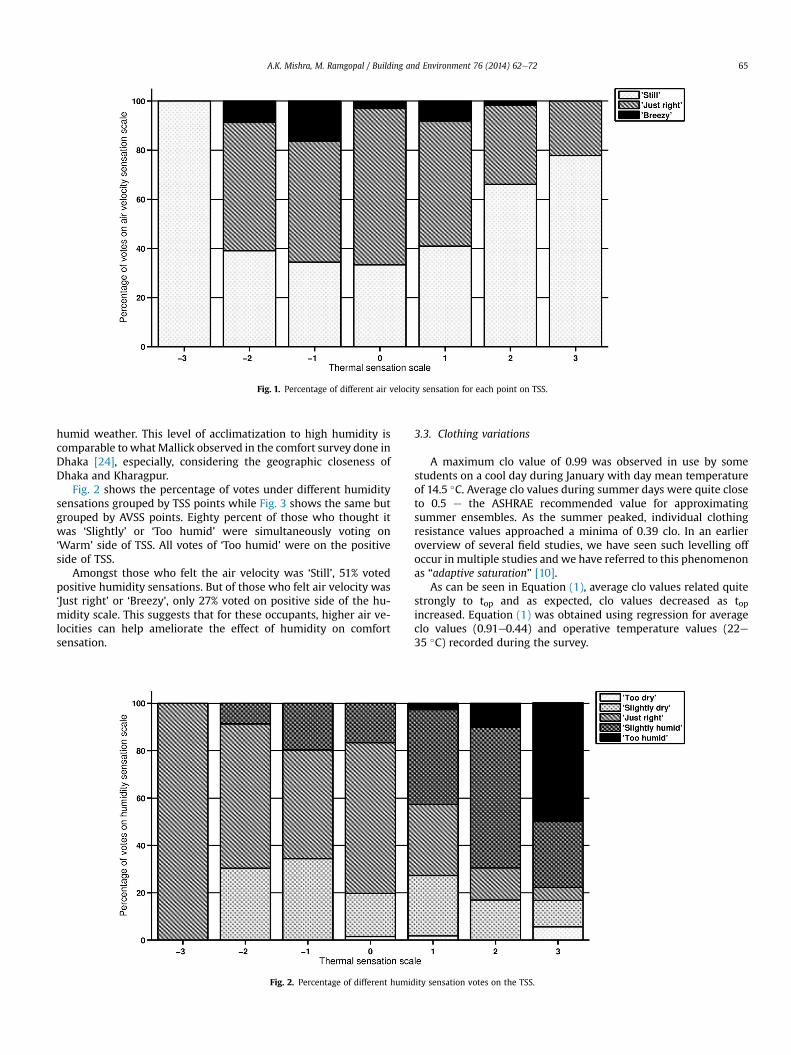
Fig. 1. Percentage of different air velocity sensation for each point on TSS.
A.K. Mishra, M. Ramgopal / Building and Environment 76 (2014) 62e72 65
humid weather. This level of acclimatization to high humidity iscomparable to whatMallick observed in the comfort survey done inDhaka [24], especially, considering the geographic closeness ofDhaka and Kharagpur.
Fig. 2 shows the percentage of votes under different humiditysensations grouped by TSS points while Fig. 3 shows the same butgrouped by AVSS points. Eighty percent of those who thought itwas ‘Slightly’ or ‘Too humid’ were simultaneously voting on‘Warm’ side of TSS. All votes of ‘Too humid’ were on the positiveside of TSS.
Amongst those who felt the air velocity was ‘Still’, 51% votedpositive humidity sensations. But of those who felt air velocity was‘Just right’ or ‘Breezy’, only 27% voted on positive side of the hu-midity scale. This suggests that for these occupants, higher air ve-locities can help ameliorate the effect of humidity on comfortsensation.
Fig. 2. Percentage of different humid
3.3. Clothing variations
A maximum clo value of 0.99 was observed in use by somestudents on a cool day during January with day mean temperatureof 14.5 �C. Average clo values during summer days were quite closeto 0.5 e the ASHRAE recommended value for approximatingsummer ensembles. As the summer peaked, individual clothingresistance values approached a minima of 0.39 clo. In an earlieroverview of several field studies, we have seen such levelling offoccur in multiple studies and we have referred to this phenomenonas “adaptive saturation” [10].
As can be seen in Equation (1), average clo values related quitestrongly to top and as expected, clo values decreased as topincreased. Equation (1) was obtained using regression for averageclo values (0.91e0.44) and operative temperature values (22e35 �C) recorded during the survey.
ity sensation votes on the TSS.
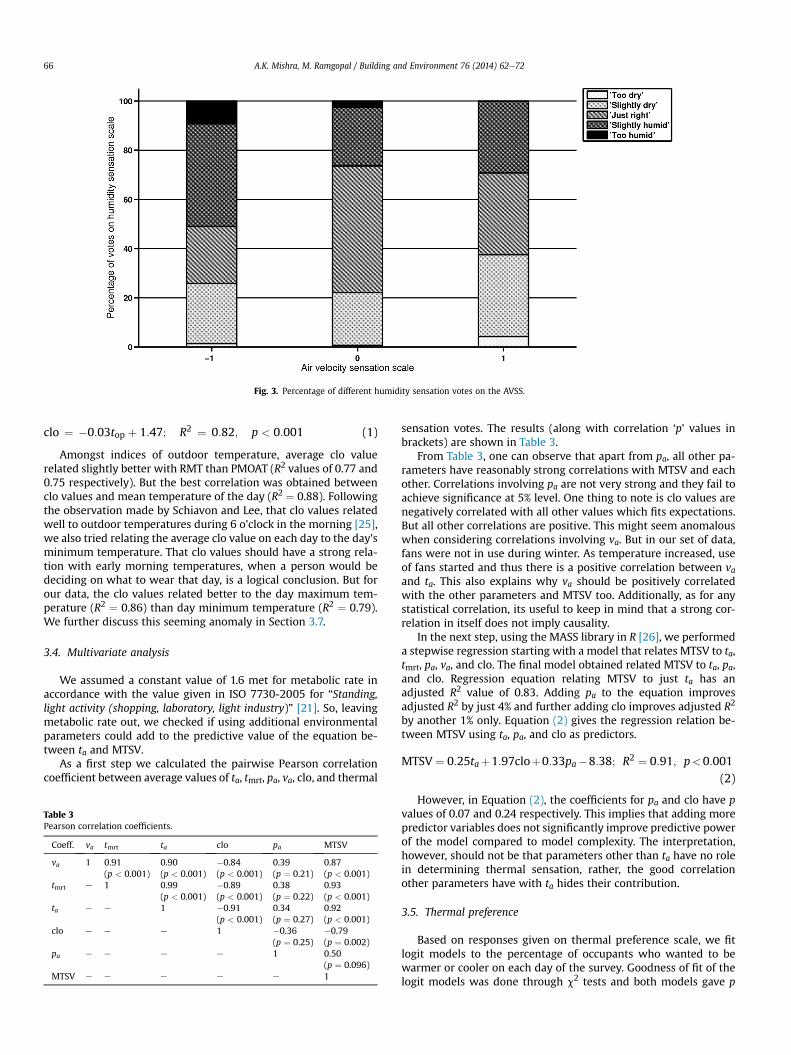
Fig. 3. Percentage of different humidity sensation votes on the AVSS.
A.K. Mishra, M. Ramgopal / Building and Environment 76 (2014) 62e7266
clo ¼ �0:03top þ 1:47; R2 ¼ 0:82; p < 0:001 (1)
Amongst indices of outdoor temperature, average clo valuerelated slightly better with RMT than PMOAT (R2 values of 0.77 and0.75 respectively). But the best correlation was obtained betweenclo values and mean temperature of the day (R2 ¼ 0.88). Followingthe observation made by Schiavon and Lee, that clo values relatedwell to outdoor temperatures during 6 o’clock in the morning [25],we also tried relating the average clo value on each day to the day’sminimum temperature. That clo values should have a strong rela-tion with early morning temperatures, when a person would bedeciding on what to wear that day, is a logical conclusion. But forour data, the clo values related better to the day maximum tem-perature (R2 ¼ 0.86) than day minimum temperature (R2 ¼ 0.79).We further discuss this seeming anomaly in Section 3.7.
3.4. Multivariate analysis
We assumed a constant value of 1.6 met for metabolic rate inaccordance with the value given in ISO 7730-2005 for “Standing,light activity (shopping, laboratory, light industry)” [21]. So, leavingmetabolic rate out, we checked if using additional environmentalparameters could add to the predictive value of the equation be-tween ta and MTSV.
As a first step we calculated the pairwise Pearson correlationcoefficient between average values of ta, tmrt, pa, va, clo, and thermal
Table 3Pearson correlation coefficients.
Coeff. va tmrt ta clo pa MTSV
va 1 0.91(p < 0.001)
0.90(p < 0.001)
�0.84(p < 0.001)
0.39(p ¼ 0.21)
0.87(p < 0.001)
tmrt e 1 0.99(p < 0.001)
�0.89(p < 0.001)
0.38(p ¼ 0.22)
0.93(p < 0.001)
ta e e 1 �0.91(p < 0.001)
0.34(p ¼ 0.27)
0.92(p < 0.001)
clo e e e 1 �0.36(p ¼ 0.25)
�0.79(p ¼ 0.002)
pa e e e e 1 0.50(p ¼ 0.096)
MTSV e e e e e 1
sensation votes. The results (along with correlation ‘p’ values inbrackets) are shown in Table 3.
From Table 3, one can observe that apart from pa, all other pa-rameters have reasonably strong correlations with MTSV and eachother. Correlations involving pa are not very strong and they fail toachieve significance at 5% level. One thing to note is clo values arenegatively correlated with all other values which fits expectations.But all other correlations are positive. This might seem anomalouswhen considering correlations involving va. But in our set of data,fans were not in use during winter. As temperature increased, useof fans started and thus there is a positive correlation between vaand ta. This also explains why va should be positively correlatedwith the other parameters and MTSV too. Additionally, as for anystatistical correlation, its useful to keep in mind that a strong cor-relation in itself does not imply causality.
In the next step, using the MASS library in R [26], we performeda stepwise regression starting with a model that relates MTSV to ta,tmrt, pa, va, and clo. The final model obtained related MTSV to ta, pa,and clo. Regression equation relating MTSV to just ta has anadjusted R2 value of 0.83. Adding pa to the equation improvesadjusted R2 by just 4% and further adding clo improves adjusted R2
by another 1% only. Equation (2) gives the regression relation be-tween MTSV using ta, pa, and clo as predictors.
MTSV ¼ 0:25taþ1:97cloþ0:33pa�8:38; R2 ¼ 0:91; p<0:001(2)
However, in Equation (2), the coefficients for pa and clo have pvalues of 0.07 and 0.24 respectively. This implies that adding morepredictor variables does not significantly improve predictive powerof the model compared to model complexity. The interpretation,however, should not be that parameters other than ta have no rolein determining thermal sensation, rather, the good correlationother parameters have with ta hides their contribution.
3.5. Thermal preference
Based on responses given on thermal preference scale, we fitlogit models to the percentage of occupants who wanted to bewarmer or cooler on each day of the survey. Goodness of fit of thelogit models was done through c2 tests and both models gave p
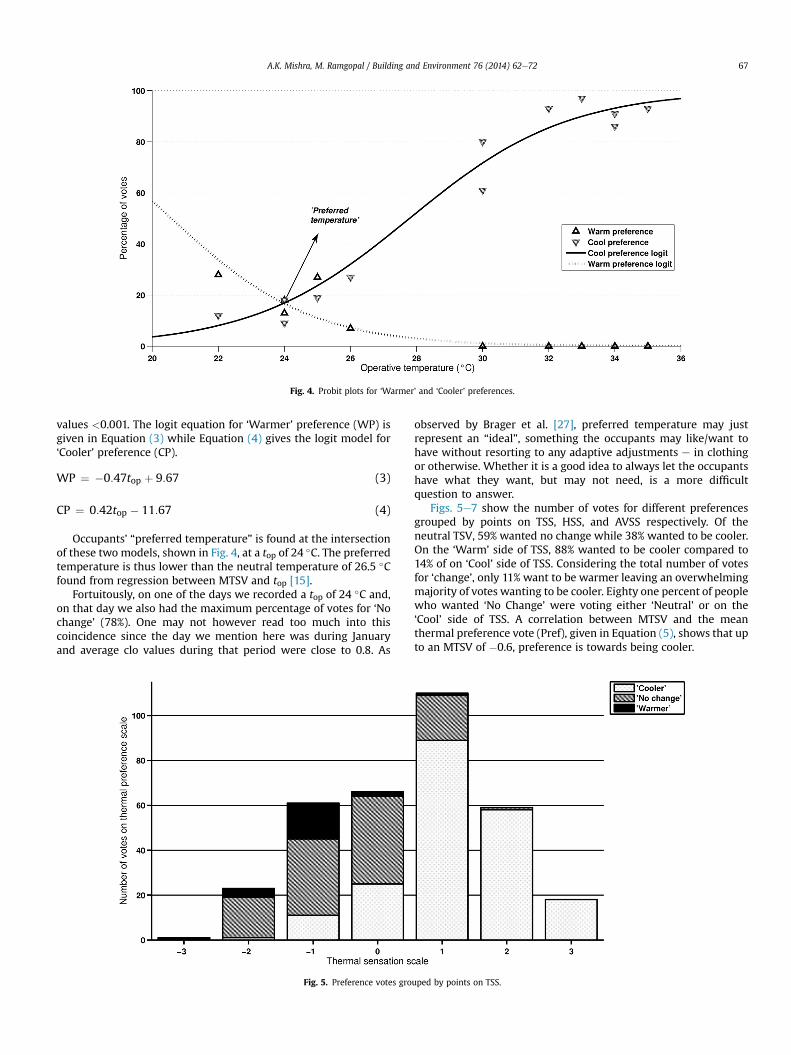
Fig. 4. Probit plots for ‘Warmer’ and ‘Cooler’ preferences.
A.K. Mishra, M. Ramgopal / Building and Environment 76 (2014) 62e72 67
values <0.001. The logit equation for ‘Warmer’ preference (WP) isgiven in Equation (3) while Equation (4) gives the logit model for‘Cooler’ preference (CP).
WP ¼ �0:47top þ 9:67 (3)
CP ¼ 0:42top � 11:67 (4)
Occupants’ “preferred temperature” is found at the intersectionof these two models, shown in Fig. 4, at a top of 24 �C. The preferredtemperature is thus lower than the neutral temperature of 26.5 �Cfound from regression between MTSV and top [15].
Fortuitously, on one of the days we recorded a top of 24 �C and,on that day we also had the maximum percentage of votes for ‘Nochange’ (78%). One may not however read too much into thiscoincidence since the day we mention here was during Januaryand average clo values during that period were close to 0.8. As
Fig. 5. Preference votes gro
observed by Brager et al. [27], preferred temperature may justrepresent an “ideal”, something the occupants may like/want tohave without resorting to any adaptive adjustments e in clothingor otherwise. Whether it is a good idea to always let the occupantshave what they want, but may not need, is a more difficultquestion to answer.
Figs. 5e7 show the number of votes for different preferencesgrouped by points on TSS, HSS, and AVSS respectively. Of theneutral TSV, 59% wanted no change while 38% wanted to be cooler.On the ‘Warm’ side of TSS, 88% wanted to be cooler compared to14% of on ‘Cool’ side of TSS. Considering the total number of votesfor ‘change’, only 11% want to be warmer leaving an overwhelmingmajority of votes wanting to be cooler. Eighty one percent of peoplewho wanted ‘No Change’ were voting either ‘Neutral’ or on the‘Cool’ side of TSS. A correlation between MTSV and the meanthermal preference vote (Pref), given in Equation (5), shows that upto an MTSV of �0.6, preference is towards being cooler.
uped by points on TSS.
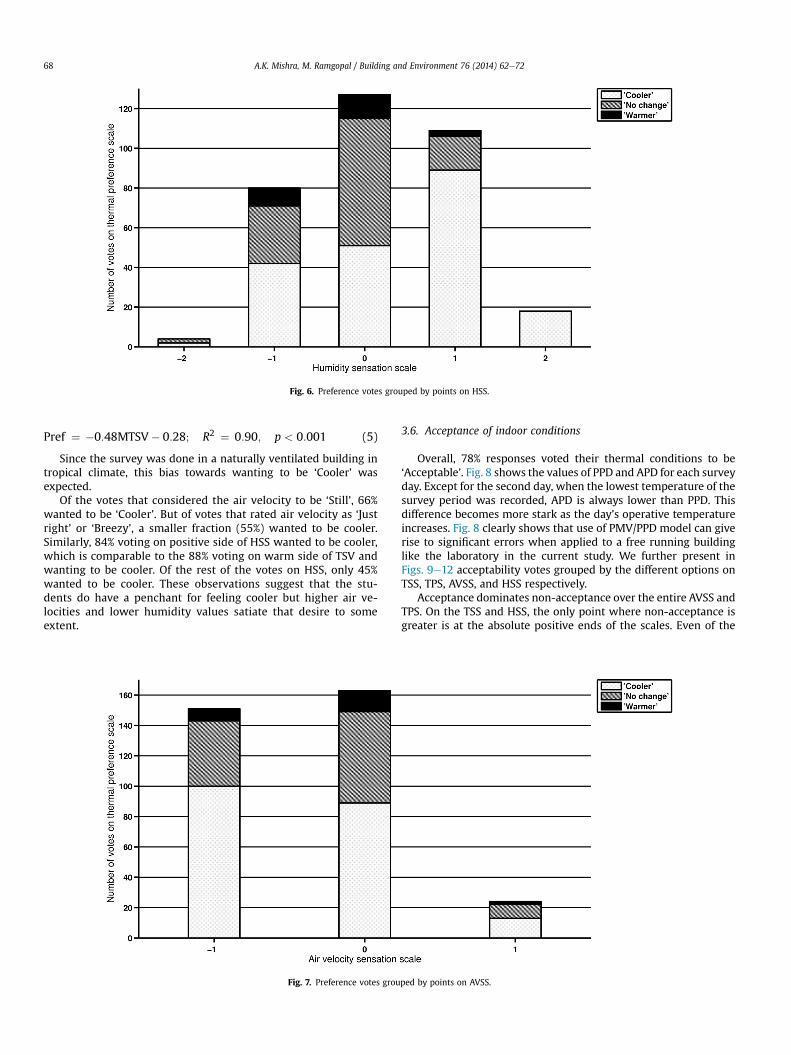
Fig. 6. Preference votes grouped by points on HSS.
A.K. Mishra, M. Ramgopal / Building and Environment 76 (2014) 62e7268
Pref ¼ �0:48MTSV� 0:28; R2 ¼ 0:90; p < 0:001 (5)
Since the survey was done in a naturally ventilated building intropical climate, this bias towards wanting to be ‘Cooler’ wasexpected.
Of the votes that considered the air velocity to be ‘Still’, 66%wanted to be ‘Cooler’. But of votes that rated air velocity as ‘Justright’ or ‘Breezy’, a smaller fraction (55%) wanted to be cooler.Similarly, 84% voting on positive side of HSS wanted to be cooler,which is comparable to the 88% voting on warm side of TSV andwanting to be cooler. Of the rest of the votes on HSS, only 45%wanted to be cooler. These observations suggest that the stu-dents do have a penchant for feeling cooler but higher air ve-locities and lower humidity values satiate that desire to someextent.
Fig. 7. Preference votes grou
3.6. Acceptance of indoor conditions
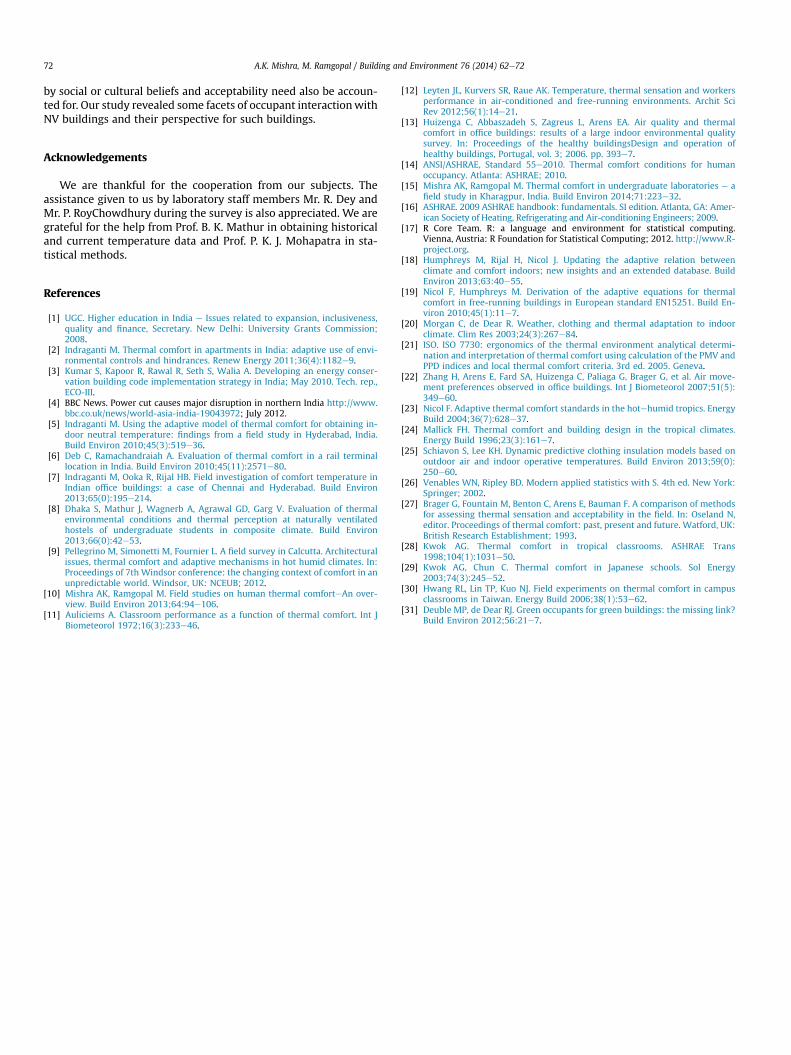
Overall, 78% responses voted their thermal conditions to be‘Acceptable’. Fig. 8 shows the values of PPD and APD for each surveyday. Except for the second day, when the lowest temperature of thesurvey period was recorded, APD is always lower than PPD. Thisdifference becomes more stark as the day’s operative temperatureincreases. Fig. 8 clearly shows that use of PMV/PPD model can giverise to significant errors when applied to a free running buildinglike the laboratory in the current study. We further present inFigs. 9e12 acceptability votes grouped by the different options onTSS, TPS, AVSS, and HSS respectively.
Acceptance dominates non-acceptance over the entire AVSS andTPS. On the TSS and HSS, the only point where non-acceptance isgreater is at the absolute positive ends of the scales. Even of the
ped by points on AVSS.
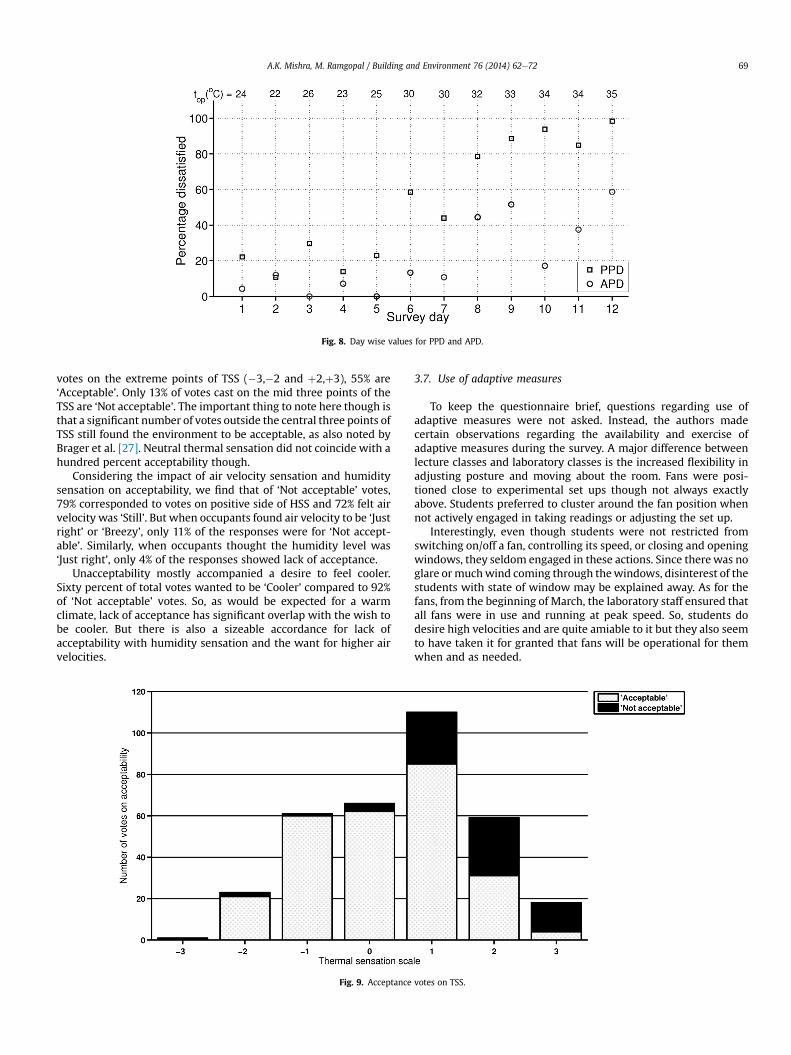
Fig. 8. Day wise values for PPD and APD.
A.K. Mishra, M. Ramgopal / Building and Environment 76 (2014) 62e72 69
votes on the extreme points of TSS (�3,�2 and þ2,þ3), 55% are‘Acceptable’. Only 13% of votes cast on the mid three points of theTSS are ‘Not acceptable’. The important thing to note here though isthat a significant number of votes outside the central three points ofTSS still found the environment to be acceptable, as also noted byBrager et al. [27]. Neutral thermal sensation did not coincide with ahundred percent acceptability though.
Considering the impact of air velocity sensation and humiditysensation on acceptability, we find that of ‘Not acceptable’ votes,79% corresponded to votes on positive side of HSS and 72% felt airvelocity was ‘Still’. But when occupants found air velocity to be ‘Justright’ or ‘Breezy’, only 11% of the responses were for ‘Not accept-able’. Similarly, when occupants thought the humidity level was‘Just right’, only 4% of the responses showed lack of acceptance.
Unacceptability mostly accompanied a desire to feel cooler.Sixty percent of total votes wanted to be ‘Cooler’ compared to 92%of ‘Not acceptable’ votes. So, as would be expected for a warmclimate, lack of acceptance has significant overlap with the wish tobe cooler. But there is also a sizeable accordance for lack ofacceptability with humidity sensation and the want for higher airvelocities.
Fig. 9. Acceptance
3.7. Use of adaptive measures
To keep the questionnaire brief, questions regarding use ofadaptive measures were not asked. Instead, the authors madecertain observations regarding the availability and exercise ofadaptive measures during the survey. A major difference betweenlecture classes and laboratory classes is the increased flexibility inadjusting posture and moving about the room. Fans were posi-tioned close to experimental set ups though not always exactlyabove. Students preferred to cluster around the fan position whennot actively engaged in taking readings or adjusting the set up.
Interestingly, even though students were not restricted fromswitching on/off a fan, controlling its speed, or closing and openingwindows, they seldom engaged in these actions. Since therewas noglare ormuchwind coming through thewindows, disinterest of thestudents with state of window may be explained away. As for thefans, from the beginning of March, the laboratory staff ensured thatall fans were in use and running at peak speed. So, students dodesire high velocities and are quite amiable to it but they also seemto have taken it for granted that fans will be operational for themwhen and as needed.
votes on TSS.
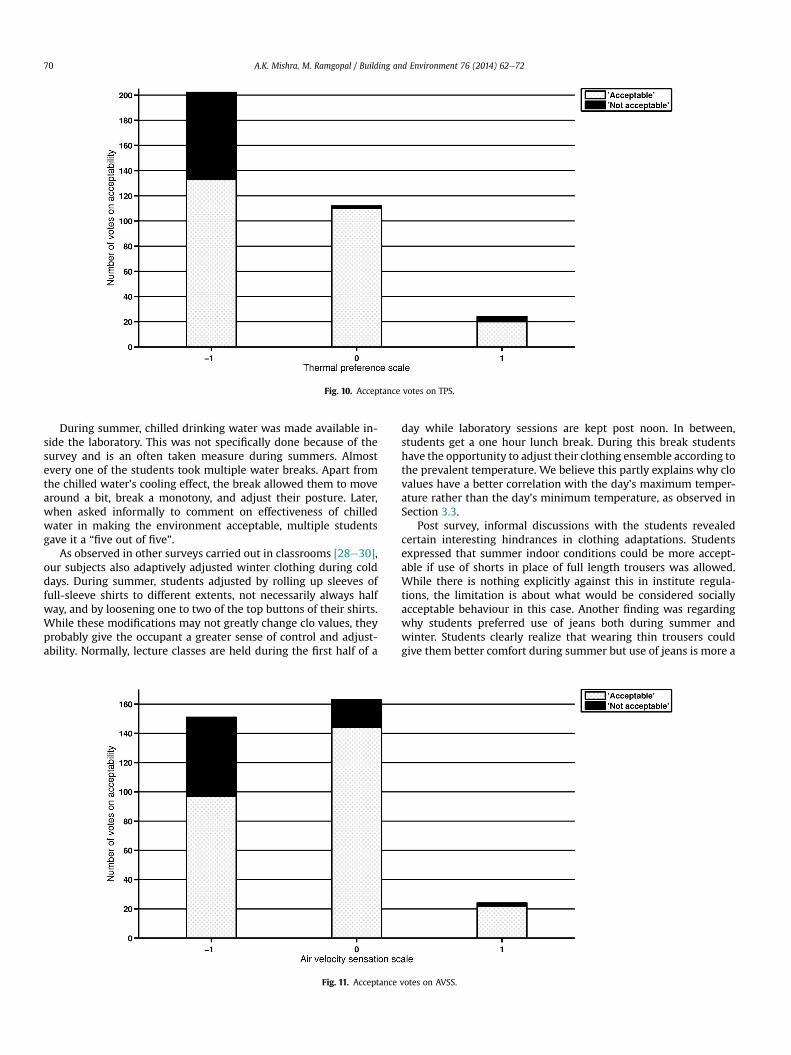
Fig. 10. Acceptance votes on TPS.
A.K. Mishra, M. Ramgopal / Building and Environment 76 (2014) 62e7270
During summer, chilled drinking water was made available in-side the laboratory. This was not specifically done because of thesurvey and is an often taken measure during summers. Almostevery one of the students took multiple water breaks. Apart fromthe chilled water’s cooling effect, the break allowed them to movearound a bit, break a monotony, and adjust their posture. Later,when asked informally to comment on effectiveness of chilledwater in making the environment acceptable, multiple studentsgave it a “five out of five”.
As observed in other surveys carried out in classrooms [28e30],our subjects also adaptively adjusted winter clothing during colddays. During summer, students adjusted by rolling up sleeves offull-sleeve shirts to different extents, not necessarily always halfway, and by loosening one to two of the top buttons of their shirts.While these modifications may not greatly change clo values, theyprobably give the occupant a greater sense of control and adjust-ability. Normally, lecture classes are held during the first half of a
Fig. 11. Acceptance
day while laboratory sessions are kept post noon. In between,students get a one hour lunch break. During this break studentshave the opportunity to adjust their clothing ensemble according tothe prevalent temperature. We believe this partly explains why clovalues have a better correlation with the day’s maximum temper-ature rather than the day’s minimum temperature, as observed inSection 3.3.
Post survey, informal discussions with the students revealedcertain interesting hindrances in clothing adaptations. Studentsexpressed that summer indoor conditions could be more accept-able if use of shorts in place of full length trousers was allowed.While there is nothing explicitly against this in institute regula-tions, the limitation is about what would be considered sociallyacceptable behaviour in this case. Another finding was regardingwhy students preferred use of jeans both during summer andwinter. Students clearly realize that wearing thin trousers couldgive them better comfort during summer but use of jeans is more a
votes on AVSS.
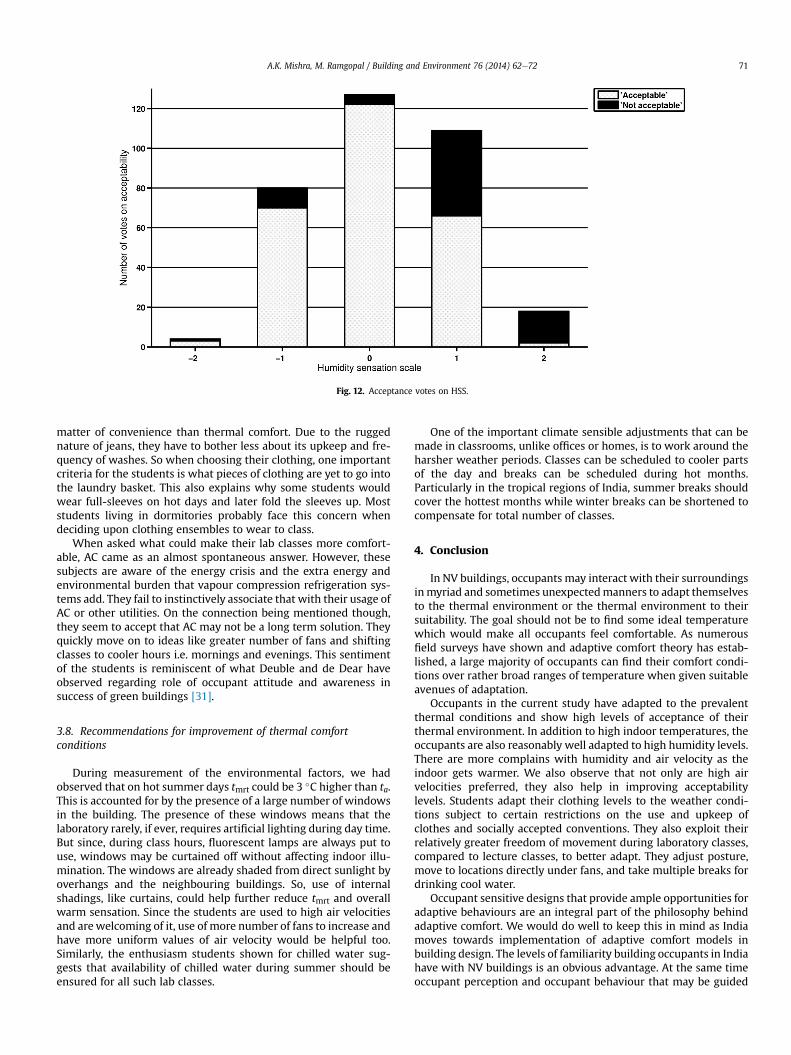
Fig. 12. Acceptance votes on HSS.
A.K. Mishra, M. Ramgopal / Building and Environment 76 (2014) 62e72 71
matter of convenience than thermal comfort. Due to the ruggednature of jeans, they have to bother less about its upkeep and fre-quency of washes. So when choosing their clothing, one importantcriteria for the students is what pieces of clothing are yet to go intothe laundry basket. This also explains why some students wouldwear full-sleeves on hot days and later fold the sleeves up. Moststudents living in dormitories probably face this concern whendeciding upon clothing ensembles to wear to class.
When asked what could make their lab classes more comfort-able, AC came as an almost spontaneous answer. However, thesesubjects are aware of the energy crisis and the extra energy andenvironmental burden that vapour compression refrigeration sys-tems add. They fail to instinctively associate that with their usage ofAC or other utilities. On the connection being mentioned though,they seem to accept that AC may not be a long term solution. Theyquickly move on to ideas like greater number of fans and shiftingclasses to cooler hours i.e. mornings and evenings. This sentimentof the students is reminiscent of what Deuble and de Dear haveobserved regarding role of occupant attitude and awareness insuccess of green buildings [31].
3.8. Recommendations for improvement of thermal comfortconditions
During measurement of the environmental factors, we hadobserved that on hot summer days tmrt could be 3 �C higher than ta.This is accounted for by the presence of a large number of windowsin the building. The presence of these windows means that thelaboratory rarely, if ever, requires artificial lighting during day time.But since, during class hours, fluorescent lamps are always put touse, windows may be curtained off without affecting indoor illu-mination. The windows are already shaded from direct sunlight byoverhangs and the neighbouring buildings. So, use of internalshadings, like curtains, could help further reduce tmrt and overallwarm sensation. Since the students are used to high air velocitiesand arewelcoming of it, use of more number of fans to increase andhave more uniform values of air velocity would be helpful too.Similarly, the enthusiasm students shown for chilled water sug-gests that availability of chilled water during summer should beensured for all such lab classes.
One of the important climate sensible adjustments that can bemade in classrooms, unlike offices or homes, is to work around theharsher weather periods. Classes can be scheduled to cooler partsof the day and breaks can be scheduled during hot months.Particularly in the tropical regions of India, summer breaks shouldcover the hottest months while winter breaks can be shortened tocompensate for total number of classes.
4. Conclusion
In NV buildings, occupants may interact with their surroundingsinmyriad and sometimes unexpectedmanners to adapt themselvesto the thermal environment or the thermal environment to theirsuitability. The goal should not be to find some ideal temperaturewhich would make all occupants feel comfortable. As numerousfield surveys have shown and adaptive comfort theory has estab-lished, a large majority of occupants can find their comfort condi-tions over rather broad ranges of temperature when given suitableavenues of adaptation.
Occupants in the current study have adapted to the prevalentthermal conditions and show high levels of acceptance of theirthermal environment. In addition to high indoor temperatures, theoccupants are also reasonably well adapted to high humidity levels.There are more complains with humidity and air velocity as theindoor gets warmer. We also observe that not only are high airvelocities preferred, they also help in improving acceptabilitylevels. Students adapt their clothing levels to the weather condi-tions subject to certain restrictions on the use and upkeep ofclothes and socially accepted conventions. They also exploit theirrelatively greater freedom of movement during laboratory classes,compared to lecture classes, to better adapt. They adjust posture,move to locations directly under fans, and take multiple breaks fordrinking cool water.
Occupant sensitive designs that provide ample opportunities foradaptive behaviours are an integral part of the philosophy behindadaptive comfort. We would do well to keep this in mind as Indiamoves towards implementation of adaptive comfort models inbuilding design. The levels of familiarity building occupants in Indiahave with NV buildings is an obvious advantage. At the same timeoccupant perception and occupant behaviour that may be guided
A.K. Mishra, M. Ramgopal / Building and Environment 76 (2014) 62e7272
by social or cultural beliefs and acceptability need also be accoun-ted for. Our study revealed some facets of occupant interactionwithNV buildings and their perspective for such buildings.
Acknowledgements
We are thankful for the cooperation from our subjects. Theassistance given to us by laboratory staff members Mr. R. Dey andMr. P. RoyChowdhury during the survey is also appreciated. We aregrateful for the help from Prof. B. K. Mathur in obtaining historicaland current temperature data and Prof. P. K. J. Mohapatra in sta-tistical methods.
References
[1] UGC. Higher education in India e Issues related to expansion, inclusiveness,quality and finance, Secretary. New Delhi: University Grants Commission;2008.
[2] Indraganti M. Thermal comfort in apartments in India: adaptive use of envi-ronmental controls and hindrances. Renew Energy 2011;36(4):1182e9.
[3] Kumar S, Kapoor R, Rawal R, Seth S, Walia A. Developing an energy conser-vation building code implementation strategy in India; May 2010. Tech. rep.,ECO-III.
[4] BBC News. Power cut causes major disruption in northern India http://www.bbc.co.uk/news/world-asia-india-19043972; July 2012.
[5] Indraganti M. Using the adaptive model of thermal comfort for obtaining in-door neutral temperature: findings from a field study in Hyderabad, India.Build Environ 2010;45(3):519e36.
[6] Deb C, Ramachandraiah A. Evaluation of thermal comfort in a rail terminallocation in India. Build Environ 2010;45(11):2571e80.
[7] Indraganti M, Ooka R, Rijal HB. Field investigation of comfort temperature inIndian office buildings: a case of Chennai and Hyderabad. Build Environ2013;65(0):195e214.
[8] Dhaka S, Mathur J, Wagnerb A, Agrawal GD, Garg V. Evaluation of thermalenvironmental conditions and thermal perception at naturally ventilatedhostels of undergraduate students in composite climate. Build Environ2013;66(0):42e53.
[9] Pellegrino M, Simonetti M, Fournier L. A field survey in Calcutta. Architecturalissues, thermal comfort and adaptive mechanisms in hot humid climates. In:Proceedings of 7th Windsor conference: the changing context of comfort in anunpredictable world. Windsor, UK: NCEUB; 2012.
[10] Mishra AK, Ramgopal M. Field studies on human thermal comforteAn over-view. Build Environ 2013;64:94e106.
[11] Auliciems A. Classroom performance as a function of thermal comfort. Int JBiometeorol 1972;16(3):233e46.
[12] Leyten JL, Kurvers SR, Raue AK. Temperature, thermal sensation and workersperformance in air-conditioned and free-running environments. Archit SciRev 2012;56(1):14e21.
[13] Huizenga C, Abbaszadeh S, Zagreus L, Arens EA. Air quality and thermalcomfort in office buildings: results of a large indoor environmental qualitysurvey. In: Proceedings of the healthy buildingsDesign and operation ofhealthy buildings, Portugal, vol. 3; 2006. pp. 393e7.
[14] ANSI/ASHRAE, Standard 55e2010. Thermal comfort conditions for humanoccupancy. Atlanta: ASHRAE; 2010.
[15] Mishra AK, Ramgopal M. Thermal comfort in undergraduate laboratories e afield study in Kharagpur, India. Build Environ 2014;71:223e32.
[16] ASHRAE. 2009 ASHRAE handbook: fundamentals. SI edition. Atlanta, GA: Amer-ican Society of Heating, Refrigerating and Air-conditioning Engineers; 2009.
[17] R Core Team. R: a language and environment for statistical computing.Vienna, Austria: R Foundation for Statistical Computing; 2012. http://www.R-project.org.
[18] Humphreys M, Rijal H, Nicol J. Updating the adaptive relation betweenclimate and comfort indoors; new insights and an extended database. BuildEnviron 2013;63:40e55.
[19] Nicol F, Humphreys M. Derivation of the adaptive equations for thermalcomfort in free-running buildings in European standard EN15251. Build En-viron 2010;45(1):11e7.
[20] Morgan C, de Dear R. Weather, clothing and thermal adaptation to indoorclimate. Clim Res 2003;24(3):267e84.
[21] ISO. ISO 7730: ergonomics of the thermal environment analytical determi-nation and interpretation of thermal comfort using calculation of the PMV andPPD indices and local thermal comfort criteria. 3rd ed. 2005. Geneva.
[22] Zhang H, Arens E, Fard SA, Huizenga C, Paliaga G, Brager G, et al. Air move-ment preferences observed in office buildings. Int J Biometeorol 2007;51(5):349e60.
[23] Nicol F. Adaptive thermal comfort standards in the hotehumid tropics. EnergyBuild 2004;36(7):628e37.
[24] Mallick FH. Thermal comfort and building design in the tropical climates.Energy Build 1996;23(3):161e7.
[25] Schiavon S, Lee KH. Dynamic predictive clothing insulation models based onoutdoor air and indoor operative temperatures. Build Environ 2013;59(0):250e60.
[26] Venables WN, Ripley BD. Modern applied statistics with S. 4th ed. New York:Springer; 2002.
[27] Brager G, Fountain M, Benton C, Arens E, Bauman F. A comparison of methodsfor assessing thermal sensation and acceptability in the field. In: Oseland N,editor. Proceedings of thermal comfort: past, present and future. Watford, UK:British Research Establishment; 1993.
[28] Kwok AG. Thermal comfort in tropical classrooms. ASHRAE Trans1998;104(1):1031e50.
[29] Kwok AG, Chun C. Thermal comfort in Japanese schools. Sol Energy2003;74(3):245e52.
[30] Hwang RL, Lin TP, Kuo NJ. Field experiments on thermal comfort in campusclassrooms in Taiwan. Energy Build 2006;38(1):53e62.
[31] Deuble MP, de Dear RJ. Green occupants for green buildings: the missing link?Build Environ 2012;56:21e7.
Related Documents


