Thermal characterization of magnesium containing ionomer glasses ELENI MARIA KARTELIA Supervisor: Dr. A. Stamboulis Thesis submitted for the degree of MRes Biomaterials University of Birmingham School of Engineering Department of Metallurgy and Materials September, 2010

Welcome message from author
This document is posted to help you gain knowledge. Please leave a comment to let me know what you think about it! Share it to your friends and learn new things together.
Transcript
Thermal characterization of magnesium
containing ionomer glasses
ELENI MARIA KARTELIA
Supervisor: Dr. A. Stamboulis
Thesis submitted for the degree of
MRes Biomaterials
University of Birmingham
School of Engineering
Department of Metallurgy and Materials
September, 2010

University of Birmingham Research Archive
e-theses repository This unpublished thesis/dissertation is copyright of the author and/or third parties. The intellectual property rights of the author or third parties in respect of this work are as defined by The Copyright Designs and Patents Act 1988 or as modified by any successor legislation. Any use made of information contained in this thesis/dissertation must be in accordance with that legislation and must be properly acknowledged. Further distribution or reproduction in any format is prohibited without the permission of the copyright holder.
2
ACKNOWLEDGMENTS
I would like to thank my supervisor Dr. A. Stamboulis for her help and
encouragement during my project. Without her support, I feel that I would not have
been able to complete this work.
I would also like to express my gratitude to Dr. D. Holland at University of Warwick
for her helping on DSC measurements. Many thanks are given to academic staff and
technicians of the School of Metallurgy and Materials.
I would like to thank sincerely the Phd students Praveen Ramakrishnan, Georgina
Kaklamani, Siqi Zhang and Mitra Kashani for their significant help through my
experimental work.
Last but not least, I would like to thank my family for their support and
understanding. Special thanks to Thanos Papaioannou.
3
TABLE CAPTIONS
CHAPTER 2: MATERIALS AND METHODS
Table 2.1.2: Composition of Mg substituted alumino-silicate glasses.
CHAPTER 3: RESULTS
Table 3.1: DSC analysis data for all Mg containing glasses (particle size >45μm)
measured at a heating rate of 10oC/min.
Table 3.2: Analysis of XRD patterns of different Mg containing glass-ceramics.
Table 3.3: Comparison of the crystal size and type of Ca fluorapatite
(Ca5(PO4)3F), wagnerite (Mg2(PO4)F) and mullite (Al6Si2O13) phase formed in glass-
ceramics with different Mg content.
Table 3.4: Optimum nucleation temperature and activation energies in Mg
containing glasses for FAP crystallisation determined by the Marotta and Kissinger
method (Matusita)

4
FIGURE CAPTIONS
CHAPTER 1: LITERATURE REVIEW
Figure 1.1: Setting reaction of a glass ionomer cement [25].
Figure 1.2: An example of the basic structure of tetrahedral units in silicate
glasses[44].
Figure 1.3: The figure indicates the fluorapatite crystal growth which is inhibited
by the size of the droplet. The droplet phase size is equivalent to the
fluorapatite crystal size. Reaching the transition temperature of the
second phase stimulates the fluorapatite crystal to exceed the droplet
phase boundaries [39].
Figure 1.4: SEM of a fracture surface showing elongated apatite crystals with a
high lenth to diameter aspect ratio [16].
CHAPTER 3: RESULTS
Figure 3.1: Density of Mg containing glasses.
Figure 3.2: Oxygen Density of Mg containing glasses.
Figure 3.3: FTIR spectra of all Mg substituted glasses.
Figure 3.4: DSC trace of calcium containing glass LG26 with particle size
>45μm measured at a heating rate of 10oC/min.
Figure 3.5: DSC traces of all Mg containing glasses ( (a) LG26(25%)Mg, (b)
LG26(50%)Mg, (c) LG26(75%)Mg, (d) LG26(100%)Mg) with
particle size ranging from 3mm to 45μm-100 μm measured at a
heating rate of 10oC/min.
Figure 3.6: Density of Mg containing glass ceramics.
Figure 3.7: X-ray powder diffraction patterns of heat treated Mg glass-ceramics.
F = Fluorapatite, M = Mullite, W = Wagnerite.

5
Figure 3.8: X-ray powder diffraction patterns of heat treated Mg glass-ceramics
up to Tp1 .F = fluorapatite, W = Wagnerite.
Figure 3.9: DSC traces of LG26(25%)Mg glass with 1 hour hold at different
nucleation Temperatures (656˚C, 676˚C, 696˚C, 716˚C) and a heating
rate of 10oC/min.
Figure 3.10: Optimum Nucleation curves of Tp´1 collected for the LG26(25%)Mg,
LG26(50%)Mg and LG26(75%)Mg containing glasses.
Figure 3.11: DSC traces of (a) LG26(25%)Mg, (b) LG26(50%)Mg and (c)
LG26(75%)Mg glass at five different heating rates after 1 hour of
optimum nucleation hold.

6
ABBREVIATIONS
A Apatite
APS Amorphous Phase Separation
AW Atomic Weight
BO Bridging Oxygens
Ca-FAP Calcium Fluorapatite
DSC Differential Scanning Calorimetry
Ea Activation Energy
Ca-FAP Fluorapatite
FTIR Fourier Transform Infrared Spectroscopy
GICs Glass Ionomer Cements
HA Hydroxyapatite
M Mullite
MAS-NMR Magic Angle Spinning Nuclear Magnetic Resonance
NBO Non-Bridging Oxygens
rA/rO Ratio of the ionic radii of the atom A and the atom O
SEM Scanning Electron Microscopy
Tg Glass Transition Temperature
Tn Optimum Nucleation Temperature
Tp1 First Crystallisation Peak Temperature
Tp'1 The crystallisation peak temperature occurring after nucleation
hold
Tp2 Second Crystallisation Peak Temperature
W Wagnerite
XRD X-ray Diffraction
7
CONTENTS
CHAPTER 1 .................................................................................................................................... 10
LITERATURE REVIEW ................................................................................................................ 10
1.1 Introduction ........................................................................................................................... 10 1.2 Composition and Structure of Ionomer glasses ............................................................................ 13 1.3 Structural Characterization of Ionomer glasses by Solid state MAS-NMR Spectroscopy .... 19 1.4 Crystallisation of Ionomer glasses ................................................................................................ 21 1.5 Cation Substitution in Ionomer glasses ........................................................................................ 24 1.6 Aims and Objectives ..................................................................................................................... 26
CHAPTER 2 .................................................................................................................................... 27
MATERIALS AND METHODS .................................................................................................... 27
2.1 Materials ....................................................................................................................................... 27 2.2 Methods ........................................................................................................................................ 28
2.2.1 Helium Pycnometer – Density Measurements ....................................................................... 28 2.2.2 Fourier Transform Infrared Spectroscopy.............................................................................. 29 2.2.3 X-ray Powder Diffraction ...................................................................................................... 30 CHAPTER 3 .................................................................................................................................... 34
RESULTS ....................................................................................................................................... 34
3.1 Effect of Cation Substitution on Glasses. ..................................................................................... 34 3.1.1 Density and Oxygen Density of Mg Substituted Glasses .......................................................... 34
3.1.2 FTIR analysis of Mg substituted glasses ............................................................................... 35 3.1.3 Glass Transition and Crystallization Temperatures of Mg Substituted Glasses .................... 36
3.2 Effect of Cation Substitution on Glass-Ceramics ......................................................................... 39 3.2.1 Density of Mg Substituted Glass-Ceramics ........................................................................... 39 3.2.2 XRD Study of Mg substituted Glass-Ceramics ..................................................................... 40 3.2.3 Optimum Nucleation Temperature and Activation Energy Study on Mg Substituted glasses
........................................................................................................................................................ 43 CHAPTER 4 .................................................................................................................................... 50
DISCUSSION ................................................................................................................................. 50
4.1 Effect of Cation Substitution on Glasses ...................................................................................... 50 4.1.1 Density and Oxygen Density ................................................................................................. 50 4.1.2 Fourier Transform Infrared Spectroscopy ............................................................................. 51 4.1.3 Glass Transition and Crystallization Temperatures of Mg Substituted Glasses .................... 52
4.2 Effect of Cation Substitution on Glass-Ceramics ......................................................................... 54 4.2.1 Density of Glass Ceramics..................................................................................................... 54 4.2.2 XRD Study of Mg substituted Glass-Ceramics ..................................................................... 55 4.2.3 Optimum Nucleation Temperature and Activation Energy Study on Mg Substituted glasses
........................................................................................................................................................ 56 CHAPTER 5 .................................................................................................................................... 59
CONCLUSIONS ............................................................................................................................. 59
CHAPTER 6 .................................................................................................................................... 62
FUTURE WORK ............................................................................................................................ 62
REFERENCES ................................................................................................................................ 63
8
ABSTRACT
Ionomer glasses are one of the components to produce glass ionomer cements or glass
polyalkenoate cements, a popular type of white dental fillings. A typical glass
composition for this application is 20-36% wt.% SiO2, 15-40% Al2O3, 0-35% CaO,
0-10% AlPO4, 0-40% CaF2, 0-5% Na3AlF6 and 0-6% AlF3. These glasses can be
made by mixing the appropriate oxides followed by fusion of ingredients in the
temperature range of 1200 ˚C to 1590 ˚C.
The glass composition used in this study is 4.5SiO2-3Al2O3-1.5P2O5-3CaO-2CaF2. A
series of new glasses were produced by Mg substitutions for Ca. Magnesium replaced
calcium, by 25 (LG26 25%Mg), 50 (LG26 50%Mg), 75 (LG26 75%Mg) and 100
molar % (LG26 100%Mg). The new glasses were characterised by Helium
Pycnometer, FTIR, DSC and XRD. The optimum nucleation temperatures and
activation energies were calculated by DSC, the crystal size was measured using the
Sherrer equation from the XRD patterns and finally the chemical structure was
analysed by FTIR. The glass density and the oxygen density were calculated in order
to understand how magnesium substitutions can affect the glass network.
In this study was showed that the density of glasses and glass ceramics decreased
whereas the oxygen density increased slightly with Mg substitution. Furthermore in
FTIR spectra there are four absorption regions of Mg containing aluminosilicate
glasses which were associated with stretching and bending vibrations. In FTIR was
also observed some shift towards higher wavenumbers with Mg substitution. On the
other hand, DSC analysis showed that the glass transition temperature (Tg), Tp1 and

9
Tp2 did not undergo significant changes with Mg substitution comparing all Mg
substituted glasses but a significant change was observed between the Tp1 and Tp2
values of LG26 and Mg substituted glasses. A decrease in optimum nucleation
temperature (Tn) with Mg substitution in all Mg substituted glasses except of
LG26(100%)Mg was also observed. The LG26(100%)Mg glass did not exhibit an
optimum nucleation temperature indicating that the glass undergoes spontaneous
crystallisation. Furthermore, XRD analysis showed that the substitution of Mg for Ca
resulted in the formation of Wagnerite (Mg2PO4F), Ca-FAP and Mullite (Al6Si2O13)
in the case of LG26(25%)Mg and LG26(50%)Mg containing glass ceramics and
Wagnerite (Mg2PO4F) and Mullite (Al6Si2O13) in the case of LG26(75%)Mg and
LG26(100%)Mg glass ceramics. The crystal size and the activation energy of Ca-
FAP/Wagnerite were calculated. The activation energy increased for all glass
compositions with the exception of LG26(75%)Mg.

10
CHAPTER 1
LITERATURE REVIEW
1.1 Introduction
Ionomer glasses are used to form glass ionomer cements and play an important part to
the structural features and the properties of glass ionomer cements which affect their
application range. Glass ionomer cements are adhesive to the tooth structure,
translucent and biocompatible [1]. Wilson and Kent developed the first glass-ionomer
cement in the Laboratory of the Government Chemist in UK formed by an acid-base
reaction between basic fluoro-alumino-silicate glass and a polyacrylic acid in the
presence of water. The glass ionomer cements that are available in the market today
show much improved mechanical properties compared to the ones used in the past [2-
8].
Dental cements are made out of an alumino silicate glass type containing Ca and
fluoride ions. These glasses can be made by oxide mixing followed by fusion of
ingredients in the temperature range of 1200˚C to 1590˚C which is composition
dependant. A typical composition is 20-36% SiO2 wt.%, 15-40% Al2O3, 0-35% CaO,
0-10% AlPO4, 0-40% CaF2, 0-5% Na3AlF6 and 0-6% AlF3. Ions are leaching out from
the glass while the cement is set as a result of the glass surface acid base reaction with
the polymeric acid, resulting in cation release and consequently cross-linking of the
polymer chains (Figure 1.1) [1, 9-11].

11
Figure 1.1: Setting reaction of a glass ionomer cement [25]
It is important to note, that the mechanical properties of cements are affected by the
silicon to aluminium ratio as well as the fluorine in the glass structure. The influence
of the silicon to aluminium ratio can be reduced by the high phosphorus content of
glasses since phosphorus locally charge balances the four-fold coordinated aluminium
ions in the glass network reducing the number of Al-O-Si bonds available for acid
hydrolysis and therefore delaying the setting reaction. It is generally accepted that low
phosphorus containing ionomer glasses are more reactive than high phosphorus
containing ionomer glasses. Aluminium as an intermediate oxide acts as network
former entering the silica network and conferring a negative charge in the network
making it susceptible to the acid hydrogen ions attack [12]. Lowenstein’s theory states
that if two tetrahedral units are linked by one oxygen bridge, the centre of only one of
them can be occupied by a tetrahedral aluminium. Occupation by silicon, or another
small ion of electrovalence of four or more, e.g. phosphorus must occur in the other
centre [45]. If aluminium is the second centre it must be at a higher coordination state
12
e.g. five or six coordination. Apart from the composition, other factors were taken
into account for the use of this glass:
Each silicon has at least one NBO (non bridging oxygen) as part of its
composition
The amount of fluorine in the glass should be less than that of aluminium in
order to minimize the formation of volatile SiF4 during melting [46]. The second
criterion can be explained on the basis that one Si4+
cation can be replaced easier with
NBOs or O2-
anions than with a non-bridging fluorine or F- anion and that an Al
3+ ion
should bond to F- anions preventing the formation of Si-F bonds in the glass network.
This explanation is supported by a trimethylsilylation analysis reported in a previous
study of 2SiO2-Al2O3-CaO-CaF2 glass that showed absence of Si-F bonds in the glass
structure [47].
On the other hand, fluorine plays an important role in the properties of ionomer
glasses and glass ionomer cements. The presence of fluorine decreases the glass
transition temperature, the melting temperature and the viscosity of ionomer glasses
as well as the refractive index of the glass and generally disrupts the glass network
facilitating the acid attack and is released directly by the ionomer glass, during cement
formation. Furthermore, the presence of fluoride (CaF2) enhances the compressive
strength (reaching values even above 200 MPa) and Young’s modulus but does not
seem to significantly influence the fracture toughness of glass ionomer cements, that
is strongly dependent on the polyacid molecular weight [5, 7, 12, 13, 15-18].
Glasses with appropriate compositions can be heat-treated and thus undergo
controlled crystallisation to form glass-ceramics, in which the main crystalline phase
13
is apatite, similar to the apatite phase in bones and teeth [15]. One of the most
important glass ceramics are apatite-mullite glass ceramics and are the result of the
crystallisation of the following general glass composition 4.5SiO2-3Al2O3-1.5P2O5-(5-
x)CaO-xCaF2.
1.2 Composition and Structure of Ionomer glasses
As was already described, the main components of ionomer glasses are 20-36% SiO2
wt.%, 15-40% Al2O3, 0-35% CaO, 0-10% AlPO4, 0-40% CaF2, 0-5% Na3AlF6 and
0-6% AlF3. The composition of glasses affects the rate of ion release. There are three
different types of glasses that have been used in the glass ionomer cements. These are
aluminosilicate, aluminoborate and zinc silicate glasses:
1) Alumino silicate glasses, that have been mainly studied by Wilson and co-workers
and are based on the systems SiO2 - Al2O3 – CaO or SiO2 - Al2O3 - CaF2 [11]. Low
amounts of alkali and alkali oxides (e.g. MgO and CaO) are present in the commercial
glasses of this type. The glasses exhibit high elastic modulus and a high chemical
corrosion resistance. The vast population of low-alkali aluminosilicates can be
transformed into glass ceramics readily and have been used in various applications
including cookware and dental implants [19]. These glass ceramics show good
chemical durability, tolerance in higher temperatures and superior strength properties.
Despite the fact that aluminosilicate glasses have been studied for a long time their
structure and chemical bonding is not completely understood [20, 21].

14
2) Alumino borate glasses studied by Combe et al are based mainly on the system
Al2O3 – B2O3 – ZnO – ZnF2 [22]. This type of glasses referred to as alumino borate
glasses are fairly important because of their ability to be hydrolysed in aqueous
environments. Yet after research, the alumino borate glasses were found to have
relatively poor chemical durability. The corresponded cements of alumino borate
glasses exhibit a limited compressive strength compared to alumino silicate glass-
formed ionomer cements. This makes the alumino borate glasses unsuitable for the
formation of cement [11].
3) Zinc silicate glasses based on the system CaO – ZnO - SiO2 or Al2O3 – ZnO - SiO2
have been investigated by Hill et al [43]. This type of ionomer glasses gives rise to
high strength glass ionomer cement. The glass reactivity and the ability to form
cement are determined by the network connectivity depending on the role of zinc in
the glass network whether this is a network modifier or an intermediate oxide. The
cement formed though, seemed to be unsuitable for dental use since it is hydrolysed
leading to degradation together with its general weakness. Furthermore, zinc is
important for the function of the immune system and has been recognised as an
antibacterial agent. Hence Zn-glass polyalkenoate cements can be used as hard tissue
replacement materials [11, 14].
Modification of the glass powder component using various methods occurs readily in
order to improve the glass ionomer strength. These methods include changing the
composition (e.g. the fluoride and sodium content and the aluminium : silicate ratio),
addition of bioactive components (e.g. certain glasses and hydroxyapatite) and
15
reinforcing by incorporating metal particles (e.g. silver-tin alloy, gold, platinum,
palladium, stainless steel or fibres such as carbon steel or glass) [23].
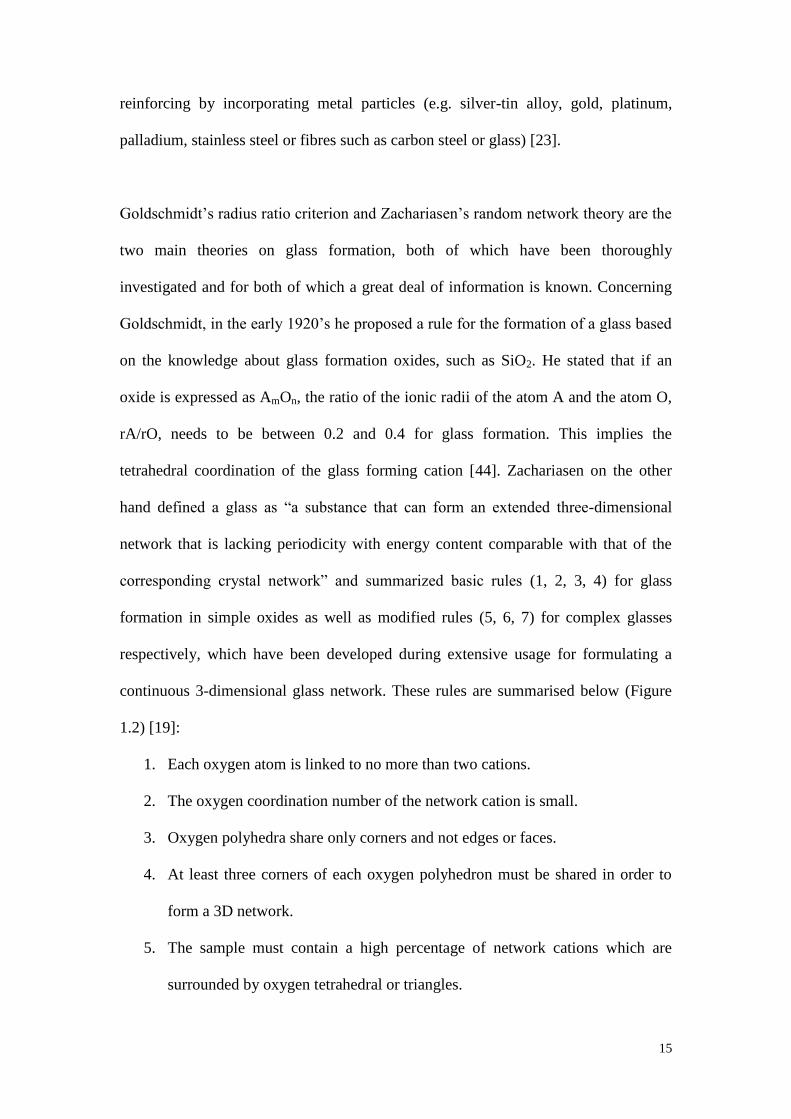
Goldschmidt’s radius ratio criterion and Zachariasen’s random network theory are the
two main theories on glass formation, both of which have been thoroughly
investigated and for both of which a great deal of information is known. Concerning
Goldschmidt, in the early 1920’s he proposed a rule for the formation of a glass based
on the knowledge about glass formation oxides, such as SiO2. He stated that if an
oxide is expressed as AmOn, the ratio of the ionic radii of the atom A and the atom O,
rA/rO, needs to be between 0.2 and 0.4 for glass formation. This implies the
tetrahedral coordination of the glass forming cation [44]. Zachariasen on the other
hand defined a glass as “a substance that can form an extended three-dimensional
network that is lacking periodicity with energy content comparable with that of the
corresponding crystal network” and summarized basic rules (1, 2, 3, 4) for glass
formation in simple oxides as well as modified rules (5, 6, 7) for complex glasses
respectively, which have been developed during extensive usage for formulating a
continuous 3-dimensional glass network. These rules are summarised below (Figure
1.2) [19]:
1. Each oxygen atom is linked to no more than two cations.
2. The oxygen coordination number of the network cation is small.
3. Oxygen polyhedra share only corners and not edges or faces.
4. At least three corners of each oxygen polyhedron must be shared in order to
form a 3D network.
5. The sample must contain a high percentage of network cations which are
surrounded by oxygen tetrahedral or triangles.

16
6. The tetrahedra or triangles share only corners with each other.
7. Some oxygens are linked only to two network cations and do not form further
bonds with any other cation.
Figure 1.2: An example of the basic structure of tetrahedral units in silicate glasses
[44].
The structural role of fluorine in ionomer glasses has been a main issue in research
due to their broad use in the formation of glass polyalkenoate cements. The role of
fluorine in the glass network and glass ionomer cements is summarised below [1, 7, 9,
11, 12, 28-32]:
1. Fluorine decreases the melting temperature and the viscosity of the ionomer glass
as well as the refractive index of the glass.
2. Fluorine disrupts the glass network facilitating the acid attack during cement
formation.
3. During cement formation, fluorine is released directly by the ionomer glass
without the need to add other fluorine compounds leading to a lower refractive
index. Hence, an improved translucency of the cement is adopted together with a
17
lower fusion temperature, improving the working characteristics of the cement
paste.
4. The presence of fluorine does not influence the fracture toughness of glass ionomer
cements.
5. Fluoride constantly being released is responsible for the inhibition of the formation
of secondary caries.
6. Fluoride enhances the compressive strength (which is reaching values above 200
MPa) and Young’s modulus of glass ionomer cements.
7. An increase in the fluorine content results in a significant reduction in the glass
transition temperature. The reduction was attributed to the replacement of BOs by
non bridging fluorines resulting in an overall reduction in the network
connectivity. This consequently allows network motion at a lower temperature
[33].
The use of calcium fluoro-alumino-silicate glasses for the formation of glass ionomer
cements (GICs) which is in turn used for medical and dental applications (as luting
cements, bases, anterior filling materials and increasingly as posterior filling materials
and bone cements) has attracted the interest of scientists in the last 10 years. The
above ionomer glass compositions have the ability of forming apatite and mullite
crystal phases which are then used for apatite-mullite glass-ceramics formation. These
ceramics have excellent osteo-integration and osteo-conduction properties when
implanted in the body as has been reported by Freeman et al. [24].
As was already mentioned, the generic glass composition SiO2-Al2O3-P2O5-CaO-CaF2
determines the properties of glass ionomer cements (GICs). Particularly, the Al/Si
18
ratio influences the glass properties and the properties of the resulting glass-ionomer
cements and glass-ceramics as derived after studies and scientific experiments. Yet,
the influence of Al/Si can be reduced by the high phosphorous content of the glasses
since phosphorus can locally charge balance four-fold coordinated aluminium ions in
the glass network which as a result has reduced number of Al-O-Si bonds available
for acid hydrolysis [25]. In simple phosphorus-free alumino-silicate-glasses,
hydrolysis of Si-O-Al bonds occurs and a silica gel layer is formed around the
remaining glass particles. During this process Al and Ca are released that can
ionically cross link the polyacrylic acid chains to form a polysalt matrix.
On the other hand, when glasses have high phosphorus content or if they have
undergone amorphous phase separation, a special type of hydrolysis occurs, known as
the P-O bonds hydrolysis [26]. During the hydrolysis of amorphous phase separated
glasses, the phosphate groups compete with carboxylate groups for aluminium and
calcium ions resulting in the inhibition of the cross-linking reaction in the cement
matrix. Moreover, glasses with high phosphorous content show a significant decrease
in the compressive strength and Young’s modulus of the cement.
In order to improve the glasses used in glass ionomer cement formation, extensive
research has been taking place studying the behaviour of glasses undergoing
amorphous phase separation. Cement improvement is highly important since it is
involved in restorative dentistry as explained above. Amorphous phase separation of
ionomer glasses and fluoro-phospho-silicate glasses, such as the borosilicate glass
system, was first studied by Barry et al.
19
He has acknowledged the division of the separation in two phases, one of which is
more susceptible to acid attack [12, 27].
1.3 Structural Characterization of Ionomer glasses
by Solid state MAS-NMR Spectroscopy
The structure of complex amorphous and crystalline solid materials is a field of great
importance in biomaterials science. These structures are mainly investigated using the
technique of solid state MAS-NMR (Magic Angle Spinning Nuclear Magnetic
Resonance) [6]. The above glass compositions have been extensively characterised in
the past by multinuclear solid state MAS-NMR spectroscopy. It has been suggested
that all Si is four fold coordinated and is present as Q3(3Al) and Q
4(4Al) species.
MAS-NMR characterisation of a range of model fluoro-alumino-silicate glasses
forming the basis of glass (ionomer) polyalkenoate cements and commercial glasses
was focused on four isotopes 29
Si, 27
Al, 31
P and 19
F:
29Si: Its spectrum indicates the two following species. Firstly, the Q
3(3Al) species
which represent a silicon with one non-bridging oxygen and three Si-O-Al linkages
and secondly, the Q4(4Al) species which represent a silicon with four Si-O-Al bonds.
27Al: It was found predominantly in four-fold coordination except in glasses with high
fluorine contents that have also a small proportion of five and six coordinated
aluminium.
31P: Its presence is observed as Al-O-PO3, which has a local negative charge of -2.
The negative charge is compensated by cations such as Ca2+
or six-fold coordinated
Al.

20
19F: F-Ca (n) and Al-F-Ca (n) species are found to be present in the calcium based
glass compositions. F-M (n) corresponds to fluorine surrounded by n next nearest
neighbour cations whereas Al-F-M (n) represents a fluorine bonded to aluminium
with the metal M in close proximity, charge balancing the tetrahedral AlO3F species.
An increase in the fluorine content of the glass and lower non-bridging oxygen
contents give rise to an increase in the proportion of Al-F-M (n) species [34].
A lot of information has been reported regarding the fluorine environment within the
aluminosilicate glass network by the MAS-NMR studies of Stamboulis and Hill [2,
21, 35, 36]. Stamboulis et al. did not justify the presence of Si-F-Ca (n) although its
presence cannot be completely ruled out. This is considered as true due to the
increasingly stronger peak with fluorine content at -125 ppm observed by high
fluorine containing glasses with the general composition of 4.5SiO2-3Al2O3-1.5P2O5-
(5-x)CaO-xCaF2 where x = 0-3. Identification of F-Ca(n) and Al-F–Ca(n) species in
all glasses at -90 ppm and -150 ppm respectively can also be made.
High concentration of five- and six-fold coordinated Al was observed in the MAS-
NMR studies conducted by Stebbins et al [37]. Stabilisation of the high-coordinated
Al species by the F- ions present in the Al coordination was observed. A series of
fluorine containing alumino-silicate glasses and commercial ionomer glasses was
additionally tested by applying 27
Al and
19F MAS-NMR spectroscopy by Stamboulis
et al. and Hill et al. [35, 36]. A lower resonance shift position of the peak of four-fold
coordinated Al (IV) for the phosphorus containing glass due to the Al-O-P bonds
being formed in contrast to a phosphorus free calcium alumino-silicate glass was
found.

21
1.4 Crystallisation of Ionomer glasses
The last 20 years have been a time of revolution for glass ceramic development [15].
The work of Hill et al led to the development of the SiO2-Al2O3-P2O5-CaO-CaF2
system that crystallises to an apatite phase that is the basis of glass-ceramic bone
substitutes and is mainly used in orthopaedic and dental applications. The presence of
fluorine in the above system has a significant effect on the nucleation and
crystallisation behaviour of the glasses. The system undergoes bulk crystallisation of
Fluorapatite (Ca-FAP) and Mullite that followed prior amorphous phase separation.
Evidence for the above are the optimum nucleation temperatures and the two loss
peaks occurring in dynamic mechanical thermal analysis experiments on nucleated
(phase separated) glasses. Often these glasses exhibit two transition temperatures that
are identified by the loss peaks in a dynamic mechanical thermal analysis study.
When the glasses are phase separated, the first phase is calcium, phosphate and
fluoride rich, crystallizing to fluorapatite (first crystallisation temperature) and the
second phase is aluminium and silicon rich, crystallizing to mullite (second
crystallisation temperature) [27].
APS (amorphous phase separation) is particularly important in glass–ceramics, as it
often occurs before crystal nucleation. It is the dominant nucleation mechanism in
commercial glass–ceramics and often occurs much faster than a nucleation
mechanism involving the precipitation of crystals of a nucleating phase. APS often
promotes crystal nucleation by two distinct mechanisms. It can provide an internal
surface for heterogeneous crystal nucleation, which will always have lower activation
energy than homogeneous nucleation, and it can also result in lowering the activation
energy for homogeneous crystal nucleation, as a result of one of the two new

22
amorphous phases being closer in chemical composition to the crystal phase that
forms. Nano-scale APS will often promote crystal nucleation, but may then serve to
hinder crystal growth and coarsening, as it will be difficult for a crystal to grow into
the second amorphous phase that is depleted in the species forming the crystal phase.
This is illustrated schematically in Figure 1.3. In this case there is a strong correlation
between the size of the extracted crystals and the size of the droplet phase, suggesting
that the Ca-FAP crystals do not grow beyond the boundaries of the droplet phase [39].
Figure 1.3: The figure indicates the Ca-FAP crystal growth which is inhibited by the
size of the droplet. The droplet phase size is equivalent to the fluorapatite crystal size.
Reaching the transition temperature of the second phase stimulates the fluorapatite
crystal to exceed the droplet phase boundaries [39].
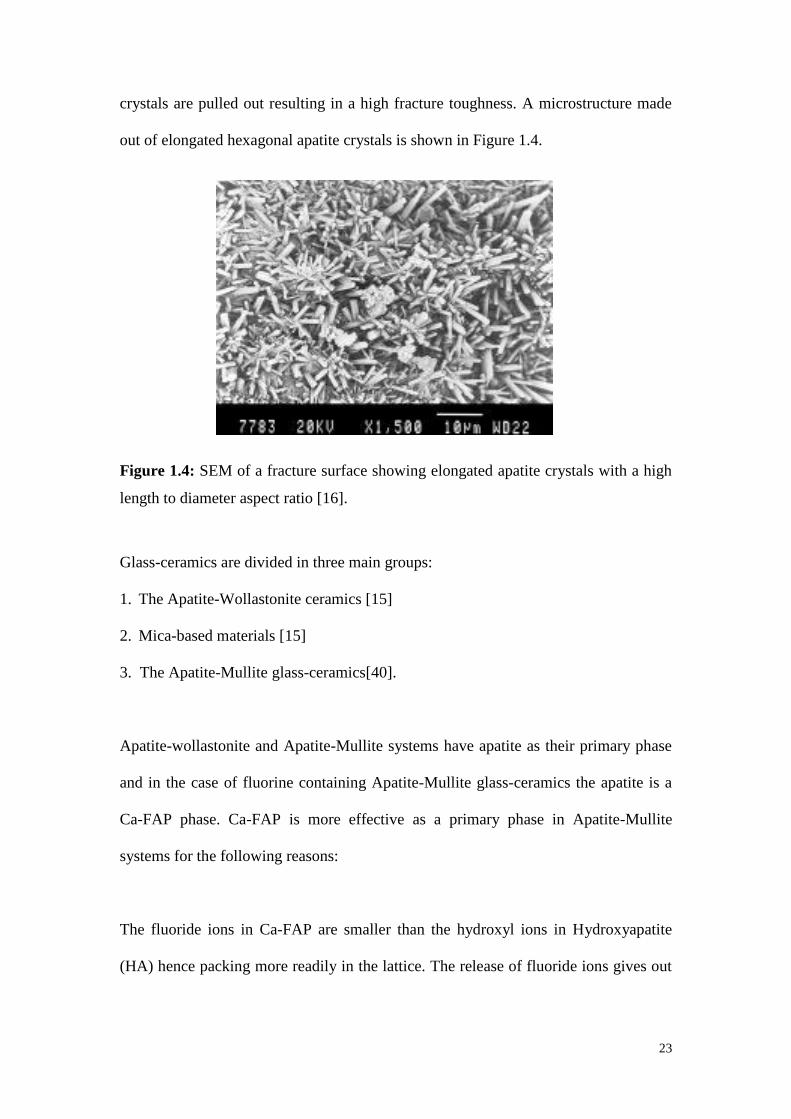
One of the compositions, studied by Dimitrova-Lukacs et al. [16], shows an increase
in the material’s fracture toughness and strength. The high fracture toughness results
from the microstructure, which consists of interlocking apatite and mullite crystals.
The apatite crystals can have an aspect ratio >50, and during fracture these needle-like
23
crystals are pulled out resulting in a high fracture toughness. A microstructure made
out of elongated hexagonal apatite crystals is shown in Figure 1.4.
Figure 1.4: SEM of a fracture surface showing elongated apatite crystals with a high
length to diameter aspect ratio [16].
Glass-ceramics are divided in three main groups:
1. The Apatite-Wollastonite ceramics [15]
2. Mica-based materials [15]
3. The Apatite-Mullite glass-ceramics[40].
Apatite-wollastonite and Apatite-Mullite systems have apatite as their primary phase
and in the case of fluorine containing Apatite-Mullite glass-ceramics the apatite is a
Ca-FAP phase. Ca-FAP is more effective as a primary phase in Apatite-Mullite
systems for the following reasons:
The fluoride ions in Ca-FAP are smaller than the hydroxyl ions in Hydroxyapatite
(HA) hence packing more readily in the lattice. The release of fluoride ions gives out

24
a cariostatic effect making the system more suitable for tooth saving preparation
methods.
Due to the importance of the above, scientists researched on the crystallisation of
Apatite-Mullite glass-ceramics. These ceramics have a general composition of
4.5SiO2-3Al2O3-1.5P2O5-(5-x)CaO-xCaF2 (where x = 0-3.0) with two fluorine atoms
substituting for one oxygen atom, which is the basis of the series of ceramics being
formed today. A Ca:P ratio of 1.67 representing that in apatite is observed in every
glass of this composition. Glasses with x = 0.5 on the other hand, have a Ca:P:F ratio
of 5:3:1 representing the stoichiometry in fluorapatite. The substitution of oxygen by
fluorine gives a crosslink density of 1.04 for the highest fluorine content possible,
0.44 less than the glass without fluorine as calculated by Ray et al. Fluorine has two
roles in glasses, one being that of a nucleating agent leading to the crystallisation of
fluorapatite. The other role is the allowance of a motion and rearrangement of the
glass network by facilitating the kinetics of crystallisation [16].
1.5 Cation Substitution in Ionomer glasses
Polyalkenoate cements (used for medical and dental applications) are formed by
calcium fluoro-alumino-silicate glasses or fluoro-alumino-silicate glasses containing
phosphate and strontium. A MAS-NMR study showed that the presence of F-Ca(n)
species in the glass is critical for the formation of Ca-FAP [21]. This becomes
particularly critical when cation substitution takes place. For example, Mg, Sr and Ba
substitution resulted in the presence of F-Mg(3), Al-F-Mg, F-Sr(3), Al-F-Sr and Al-
F-Ba species with obvious lack of F-Ba(3). As a result only Mg and Sr substituted
glasses crystallised to Wagnerite and Sr-Fluorapatite whereas Ba substituted glasses
25
did not crystallise to any apatite phase [21, 33, 36]. The latter information gave a
better insight in the understanding of the crystallisation mechanism and potential
applications of the above systems.
Radio-opacity that makes glasses opaque to X-Rays is introduced to the glass ionomer
cements usually by strontium, a substitute for calcium. For instance, the substitution
of strontium for calcium was investigated during nucleation and crystallisation of a
composition that has a Ca:P ratio of 1.67 corresponding to apatite stoichiometry and
crystallizes to Ca-FAP. This was first noticed and studied by Hill and Stamboulis.
Strontium can be a substitute to calcium since they have similar ionic radii, 1.16 nm
for strontium and 0.94 nm for calcium. Substitution of strontium in crystalline
structures may also occur. An example is the substitution of strontium in Apatite
structures [2, 12]. Solid solutions of strontium-calcium Hydroxyapatite
(Sr,Ca)10(PO4)6(OH)2, and pure Strontium Apatite are produced by aqueous solutions
and are hence described as minerals. An increase in the unit cell dimensions, with a
and c increasing to 0.942 from 0.688 nm for HA occurs when strontium is introduced
into the apatite lattice due to the slightly larger ionic radius of strontium. An X-ray
diffraction pattern for strontium apatite was produced due to this change with larger
d-spacing than its calcium counterpart. A material with increased X-ray radio opacity
is produced due to the increased atomic weight and number of strontium which in turn
leads to an increased density of both the glass and crystal structure. The ability to
observe a materials location and behaviour is basically what is important for medical
and dental applications.
26
Other substitutions studied include Mg and Ba cations. The size of the cations is
considered to strongly affect the structure and crystallisation of the ionomer glasses.
In Ba-substituted glasses for example, the silicon and phosphorus environment of the
glass was not highly influenced by the substitution. Yet, FTIR studies showed that
Ba-substitutions have the following effects [11, 42]: 1) A lower inter-tetrahedral angle
in Si-O-Si is being formed, 2) A less strained glass network is achieved, 3) Low
barium contents affect the crystallisation of the main phases which are Ca-FAP,
Mullite and some mixed Ba-Ca-FAP, 4) At high barium contents, there is no Ca-FAP
forming during crystallisation but mostly a barium aluminosilicate phase together
with crystalline BaPO4.
1.6 Aims and Objectives
The purpose of this research is to study the influence of magnesium substitution on
the structure of fluorine containing calcium-alumino-silicate glasses and the resulting
glass-ceramics. Consequently, the main purpose of this project is:
To study how Mg substitution can affect the glass transition temperature (Tg),
the crystallisation temperatures (Tp1, Tp2) as well as the optimum nucleation
temperature (Tn).
To understand the crystallisation mechanism and determine the crystal phases
as well as the crystal size of each crystal phase.
To calculate the Activation Energy (Ea) of Ca-FAP/Wagnerite, giving
information about the related nucleation and growth process that corresponds
to the formation of Ca-FAP.

27
CHAPTER 2
MATERIALS AND METHODS
2.1 Materials
The study was based on the use of Ca-alumino Silicate glasses with a composition of
4.5SiO2-3Al2O3-1.5P2O5-3CaO-2CaF2 and an excess of fluorine content Ca:P:F =
5:3:1. The production of the alumino-silicate glass of the defined composition
occurred using a melt quench route [70]. The required reagents are silica (SiO2),
alumina (Al2O3), phosphorus pentoxide (P2O5), calcium carbonate (CaCO3) and
calcium fluoride (CaF2). Concerning the Mg – substituted alumino silicate glasses, the
composition is 4.5SiO2-3Al2O3-1.5P2O5-3CaO-2CaF2, by LG26(25%)Mg, LG26
(50%)Mg, LG26(75%)Mg and LG26(100%)Mg. The required reagents are silica
(SiO2), alumina (Al2O3), phosphorus pentoxide (P2O5), calcium carbonate (CaCO3),
calcium fluoride (CaF2), magnesium oxide (MgO) and magnesium fluoride (MgF2)
(all the reagents were of analytical grade and supplied by Sigma-Aldrich)
The following steps were applied for the formation of alumino silicate glass and Mg-
substituted alumino silicate glasses:
A total amount of 500 g of glass was measured and mixed.
Transfer of the glass batch in a platinum crucible and heating at a temperature
of 1475oC for 2 hours.

28
The glass melt was then quenched in deionized water to avoid phase
separation and crystallization resulting in the formation of frit glass (fritting). The frit
glass was then grounded using a pestle and mortar and sieved.
Table 2.1.2: Composition of Mg substituted alumino-silicate glasses
Oxides-Molar Composition
Glass code SiO2 Al2O3 P2O5 CaO CaF2 MgO MgF2
LG26(25%)Mg 4.5 3 1.5 1.75 2 1.25 0
LG26(50%)Mg 4.5 3 1.5 0.5 2 2.5 0
LG26(75%)Mg 4.5 3 1.5 0 1.25 3 0.75
LG26(100%)Mg 4.5 3 1.5 0 0 3 2
2.2 Methods
2.2.1 Helium Pycnometer – Density Measurements
The density of glasses and glass ceramics was measured using the method of helium
pycnometer. Gas pycnometry is a common analytical technique that uses a gas
displacement method to measure volume accurately. Inert gas, such as helium is used
as the displacement medium. The sample is sealed in the instrument compartment of
known volume, the appropriate inert gas is admitted, and then expanded into another
precision internal volume. The pressure is measured before and after expansion and is

29
used to calculate the sample volume. Dividing this volume into the sample weight
gives the gas displacement density.
The AccuPyc II 1340 Series Pycnometer, that we used for density measurements of
glasses and glass ceramics, is automatic and provides density calculations on a wide
variety of powders, solids, and slurries having volumes from 0.01 to 350 cm3. In our
case the samples were <45μm of particle size and their mass was approximately 1gr.
The instrument completed sample analyses in thirty minutes providing us with 10
consecutive measurements as well as the deviation of each measurement. In order to
calculate the density of the glasses and glass ceramics we took the average of these
ten consecutive measurements.
In addition, the oxygen density was calculated in order to provide us with an
indication of the change of network connectivity with substitution.
Then the oxygen density of glasses was calculated by using the following equation
2.2:
(Eq 2.2)
2.2.2 Fourier Transform Infrared Spectroscopy
The FT-IR Spectroscopy is used in order to understand the nature of the bonds formed
in the amorphous glass with Mg substitution. Fourier transform infrared (FTIR)
powder absorption spectra were recorded in the 4000 - 400 cm-1
region by using a
glassofweightmolecular
oxygenofweightmolecularDensityDensityOxygen

30
Perkin-Elmer FTIR spectrometer (Spectrum 2000, Perkin Elmer, USA). A mixture of
the sample and KBr powders in an agate mortar and pestle which was then pressed
into the required shape resulted in the production of the KBr pellets. The weight ratio
of sample/KBr was 0.01. Approximately 12 scans were shown by the spectrum of
each sample represented an average of 12 scans and the background spectrum of a
blank KBr pellet was subtracted.
2.2.3 X-ray Powder Diffraction
X-ray Powder Diffraction is used in order to measure the crystal size of the formed
Ca-FAP as well as how the crystal size is affected by magnesium substitution. Also,
this technique will show the different crystal phases formed with magnesium
substitution. An increase in temperature of 10oC per minute up to 1100
oC using a
ramp heated all the frit glass samples. Once that temperature was achieved the
samples were left to heat for an hour and then cooled to room temperature using a
furnace. X-Ray diffraction was then performed on the samples using a continuous
scan between 2θ = 10° and 60°, with a step size of 2θ = 0.0200°. A Philips analytical
x’pert XRD was used with Cu Ka, at 40 kV and 40 mA.
Use of the Scherrer equation calculated the crystal size D [48, 49, 75]:
D=K /[wcos(θ)] (Eq 2.3)
K is a constant that takes values between 0.9 and 1.0 depending on the particle
morphology. is the Cu Kα radiation (0.15406nm), w is the full width at half-
maximum (FWHM in radian), and θ is the diffraction angle (in degrees). In this
31
experiment the average value of K = 0.95 was used giving an average volume of the
apparent size independent of the morphology.
2.2.4 Differential Scanning Calorimetry
In order to investigate the nucleation and crystallisation behaviour of glasses or in
other words in order to measure the optimum nucleation temperatures a NETZSCH
404C DSC with pairs of matched platinum-rhodium crucibles was used. 20 mg Al2O3
were weighed for the reference crucible as well as 20 mg samples were weighed and
placed in dry argon followed by heating with a rate of 10oC/min (unless otherwise
stated).
The method outlined by Marotta et al. was followed for the determination of the
optimum nucleation temperature in glasses that undergo bulk crystal nucleation [50]:
DSC (Differential Scanning Calorimetry) was used in order to determine the glass
transition and crystallisation temperature of glasses. The temperature range was from
25 to 1100oC and the heating rate was 10
oC/min. The sample weight was ca 20 mg for
all samples and the reference sample was alumina. According to the Marotta method
[43, 51], the glass sample should be held for 1 hour at 4 different temperatures Tg+20,
Tg+40, Tg+60 and Tg+80, and then it should be heated at 10oC/min to 1100
oC. All the
measurements were run at the temperature range of 400˚C-1100˚C with a heating rate
of 10˚C/min in a dry argon gas atmosphere. The optimum nucleation temperature was
then calculated as the temperature that corresponds to the minimum of the curve

32
defined by plotting the new first crystallisation temperatures against the holding
temperatures.
The number of stable nuclei Nn produced in a sample per time element tn as indicated
by Marotta et al. is:
b
nn tIN (Eq 2.4)
where I is the kinetic rate constant of nucleation and b is a parameter related to the
nucleation mechanism. The exothermal crystallisation peak temperatures will reflect
variations in nucleation rates when the samples have been subjected to lengthening
heating in the surrounding area of the assumed nucleation maxima. The above
observation led to Marotta realising that if tn is the same for each sample at each
temperature Tn, the subsequent equation can be applied [52-55]:
CTTR
EI
pp
c 11ln
'
(Eq 2.5)
where Ec is the activation energy for crystallisation, R is the gas constant, Tp is the
crystallisation peak temperature occurring after a nucleation hold, Tp is the latter
crystallisation peak temperature without a nucleation hold and C is the constant.
The experiments for the calculations of the activation energy for the crystallisation of
fluorapatite were conducted in the Physics Department at Warwick University using
the equipment of Mettler Toledo TGA/DSC 1 and Pt crucibles. These calculations
using both the Marotta method and the modified Kissinger method as proposed by
Matusita et al. [40] provide information about the related nucleation and growth
process. The Marotta method is based on the equation 2.6:
33
CRTEr
Ln PC /1 (Eq 2.6)
where r is the heating rate, EC is the activation energy of the process, TP is the
temperature corresponding to the maximum of the crystallisation peak, R is the
universal gas constant, and C is the constant.
On the other hand, the modified Kissinger method suggested by Matusita and Sakka
[54] is based on the equation 2.7:
CRTmErTLn PC
n
P //2 (Eq 2.7)
where TP is the crystallisation peak temperature, r is the heating rate, R is the
universal gas constant, n and m are the numerical constants which depend on the
crystallisation mechanism, and C is the constant. For surface nucleation n = m = 1
whereas for bulk nucleation from a constant number of nuclei n = m = 3 and for bulk
nucleation from an increasing number of nuclei n=4 and m=3.
The glass composition undergoes no change during crystallisation as assumed by both
methods. This is not true when the glass compositions differ to the crystalline phases
formed during crystallisation. The Kissinger [55] method makes it possible to assume
which are the appropriate values for n and m used for the above calculations including
the rare use of non-integer values (such values are used when neither pure bulk
nucleation nor surface nucleation occurs). Heating coarse glass particles in five
different heating rates which include 2, 5, 10, 15, and 20oC/min was used to calculate
the activation energies obtained.
34
CHAPTER 3
RESULTS
3.1 Effect of Cation Substitution on Glasses.
3.1.1 Density and Oxygen Density of Mg Substituted
Glasses
The measured density and oxygen density for Mg containing alumino-silicate glasses
are shown in Figure 3.1 and Figure 3.2. It is indicated, that the decrease of density is
proportional to the enhancement of magnesium substitution with the highest density
for LG26 (4.5SiO2-3Al2O3-1.5P2O53CaO-2CaF2) at 2.73 g/cm3 and the lowest density
for LG26(100%)Mg (4.5SiO2-3Al2O3-1.5P2O5-3MgO-0.75MgF2-1.25CaF2) at 2.65
g/cm3.
y = -0,0008x + 2,7393
R2 = 0,9089
2,62
2,64
2,66
2,68
2,7
2,72
2,74
2,76
0 20 40 60 80 100 120
Mg substitution content (at%)
Den
sity
(g/
cm3 )
Figure 3.1: Density of Mg containing glasses.

35
y = 0,0005x + 1,1178
R2 = 0,9505
0,8
1
1,2
1,4
0 20 40 60 80 100 120Mg substitution content (at%)
Oxy
gen
Den
sity
(g/
cm3 )
Figure 3.2: Oxygen Density of Mg containing glasses.
However, the oxygen density, based on the density values mentioned above, shows a
slightly increasing tendency, suggesting that there is a very small change of the
oxygen environment within the glass network with Mg substitution. The oxygen
density is increased from 1.11 g/cm3 for LG26 to 1.17 g/cm
3 for LG26(100%)Mg.
3.1.2 FTIR analysis of Mg substituted glasses
Figure 3.3 shows the FTIR adsorption spectra of all Mg containing glasses. The first
strong bands in the region of 800-1400 cm-1
appear in all samples and are assigned to
the Si-O(s) and P-O(s) stretching vibrations, however with increasing the Mg molar
content from LG26 to LG26(100%)Mg, these bands are shifted to slightly higher
wavenumbers, i.e., from 1089 cm-1
to 1109 cm-1
[56, 57]. In the case of
LG26(100%)Mg there is a difference, the bands are shifted to slightly lower
wanenumbers. It is very likely that this happens due to the more tight glass network
formed with 100%Mg substitution. In addition, there is an effect in the intensity of the
band situated at around 983 cm-1
that decreased with increasing the Mg molar content
36
in the glass. Furthermore, there is a medium strong band in the region of 620-800 cm-1
which is associated with AlO4 tetrahedra. The band between 530-620 cm-1
is
attributed to the P-O bending vibrations and Si-O-Al linkages, while the band centred
at around 460 cm-1
is related to the motion of bridging oxygens in the plane
perpendicular to the Si-O-Si(Al) bond, in other words is attributed to vibrations of the
Si-O-Si and Si-O-Al bonds [58- 60].
Figure 3.3: FTIR spectra of all Mg substituted glasses.
3.1.3 Glass Transition and Crystallization
Temperatures of Mg Substituted Glasses
Coarse particles (>45μm) of Mg containing glasses were characterised by using
differential scanning calorimetry (DSC) at a heating rate of 10oC/min from room
temperature to 1100oC. All graphs showing glass transition temperatures and

37
crystallisation peak temperatures are presented in Figure 3.4 and Figure 3.5. Table
3.1 presents the values of glass transition and crystallisation temperatures for all
glasses. It is clear that in these glasses, the corresponded glass transition temperature
(Tg) of LG26 has the highest value of 655oC whereas the Tg of each sample
(LG26(25%)Mg, LG26(50%)Mg, LG26(75%)Mg, LG26(100%)Mg) is decreased
initially with increasing the content of Mg, but then increased when the content of Mg
is higher than that of Ca.
Figure 3.4: DSC trace of calcium containing glass LG26 with particle size >45μm
measured at a heating rate of 10oC/min.
Concerning the first crystallisation peak temperature (Tp1) the progressive Mg
substitution forces Tp1 consistently to higher values from 760oC in the case of LG26
to 983oC in the case of LG26(100%)Mg as shown in Table 3.1. It is suggested, that

38
the changes of Tp1 in Mg substituted glasses may be related to the formation of
different crystalline phases at Tp1 in each sample.
Figure 3.5: DSC traces of all Mg containing glasses (a) (LG26(25%)Mg, (b)
LG26(50%)Mg, (c) LG26(75%)Mg and (d) LG26(100%)Mg) with particle size
ranging from 3mm to 45μm-100 μm measured at a heating rate of 10oC/min.
Table 3.1: DSC analysis data for all Mg containing glasses (particle size >45μm)
measured at a heating rate of 10oC/min.
Glass
Mg content
(at%)
Tg(oC)
Tp1(oC)
Tp2(oC)
LG26 0 655 760 991
LG26(25%)Mg 25 636 901 1070
LG26(50%)Mg 50 620 933 1073
LG26(75%)Mg 75 633 937 968

39
LG26(100%)Mg 100 652 983 1071
The second crystallisation peak temperature (Tp2) on the other hand increases
initially from 991oC in the case of LG26 to 1070
oC in the case of LG26(25%)Mg and
1073oC in the case of LG26(50%)Mg but then decreases to 968
oC in the case of
LG26(75%)Mg but increases again to 1071oC in the case of LG26(100%)Mg. A
characteristic endotherm at around 1200oC is observed in graphs 3.5c and d most
likely associated with crystal dissolution.
3.2 Effect of Cation Substitution on Glass-Ceramics
3.2.1 Density of Mg Substituted Glass-Ceramics
Figure 3.6 shows the measured density of Mg substituted glass ceramics. It is clear,
that the density for glass ceramics is decreased slightly with Mg substitution from
2.88 g/cm3 for LG26 (4.5SiO2-3Al2O3-1.5P2O53CaO-2CaF2) to 2.84 g/cm
3 for
LG26(100%)Mg (4.5SiO2-3Al2O3-1.5P2O5-3MgO-0.75MgF2-1.25CaF2).
Glass-Ceramics
y = -0,0004x + 2,892
R2 = 0,7562
2,8
2,82
2,84
2,86
2,88
2,9
0 20 40 60 80 100 120
Mg substitution content (at%)
Den
sity
(g/
cm3 )
Figure 3.6: Density of Mg containing glass ceramics.

40
It is observed, there is a linear relationship between the density and Mg molar content.
In addition, in this case the density depends on the amount and type of phases formed
in glass-ceramics.
3.2.2 XRD Study of Mg substituted Glass-Ceramics
Figure 3.7 indicates the X-Ray powder diffraction analysis of Mg substituted glasses
heat treated up to 1100oC with one hour hold in optimum nucleation temperature. It is
observed that the formation of Wagnerite (Mg2PO4F) (JCPDS 00-042-1330) is
favoured with increasing Mg substitution and fully replaces Ca-FAP when the Mg
content is higher than that of Ca.
Figure 3.7: X-ray powder diffraction patterns of heat treated Mg glass-ceramics. F =
Ca-FAP, M = Mullite, W = Wagnerite.

41
In particular, Mullite (Al6Si2O13) is present in all crystallised samples, Ca-FAP
(Ca5(PO4)3F) appears in LG26 in LG26(25%)Mg and in LG26(50%)Mg while
Wagnerite (Mg2PO4F) is present in all substituted glass-ceramics apart form LG26 as
shown in Table 3.2. There is also a small amount of AlPO4 present. The LG26
containing glass is mainly crystallised to Ca-FAP and Mullite as well as a small
amount of AlPO4.
Table 3.2: Analysis of XRD patterns of different Mg containing glass-ceramics.
GLASS CRYSTAL PHASES
LG26 Ca5(PO4)3F x Al6Si2O13 AlPO4
LG26(25%)Mg Ca5(PO4)3F Mg2PO4F Al6Si2O13 AlPO4
LG26(50%)Mg Ca5(PO4)3F Mg2PO4F Al6Si2O13 AlPO4
LG26(75%)Mg x Mg2PO4F Al6Si2O13 AlPO4
LG26(100%)Mg x Mg2PO4F Al6Si2O13 AlPO4
Furthermore all Mg substituted glasses were heat treated up to corresponding Tp1 and
studied by XRD analysis in order to identify the crystal phases formed at Tp1. The
Tp1 used for the heat treatments was measured from the DSC curves shown in Figure
3.11 (a, b, c and d) and used to calculate the activation energy (with holding at the
optimum nucleation temperature) when the heating rate was 10oC/min. Figure 3.8
shows that Ca-FAP (Ca5(PO4)3F) and Wagnerite (Mg2PO4F) are formed at Tp1 in
LG26(25%)Mg containing glasses, while only Wagnerite (Mg2PO4F) is formed in
LG26(75%)Mg glass-ceramic at Tp1.
42
Figure 3.8: X-ray powder diffraction patterns of heat treated Mg glass-ceramics up to
Tp1. F = Ca-FAP, W = Wagnerite.
Table 3.3: Comparison of the crystal size and type of Ca-FAP (Ca5(PO4)3F),
Wagnerite (Mg2(PO4)F) and Mullite (Al6Si2O13) phase formed in glass-ceramics with
different Mg content.
GLASS CRYSTAL SIZE (nm)
Ca-FAP
(Ca5(PO4)3F)
Hexagonal
Mullite
(Al6Si2O13)
orthorhombic
Wagnerite
(Mg2(PO4)F)
Monoclinic
LG26 28 26 x
LG26(25%)Mg 84 53 34
LG26(50%)Mg 26 72 42
LG26(75%)Mg x 59 35
LG26(100%)Mg x 31 30

43
In the case of LG26(100%)Mg the XRD pattern showed that the glass was not
crystallised to Wagnerite at the temperature indicated by DSC (Figure 3.11(d) below)
as the first crystallisation temperature. It is therefore concluded that the first
crystallisation temperature is higher than the above temperature and corresponds to
the second exothermic transition observed in Figure 3.11(d). The crystal size of all
phases, such as Ca-FAP (Ca5(PO4)3F), Wagnerite (Mg2PO4F) and Mullite (Al6Si2O13),
was calculated by the Scherrer equation and is shown in Table 3.3.
3.2.3 Optimum Nucleation Temperature and
Activation Energy Study on Mg Substituted glasses
As described before in Chapter 2, the Marotta method was used in order to calculate
the optimum nucleation temperatures for Mg substituted glasses. As it has been
mentioned, the minimum point in the curve of the first crystallisation temperatures
Tp'1 against the nucleation temperature Tn, corresponds to the optimum nucleation
temperature. For example, Figure 3.9 shows the DSC traces for LG26(25%)Mg after
1 hour hold at different nucleation temperatures e.g. 656oC, 676
oC, 696
oC and 716
oC.
The Tp'1 for the four different nucleation temperatures is 840oC, 832
oC, 855
oC and
864oC, respectively. According to Figure 3.10 the optimum nucleation temperature
(Tn) is 671oC, 658
oC, 654
oC for LG26(25%)Mg, LG26(50%)Mg and LG26(75%)Mg,
respectively.
44
Figure 3.9: DSC traces of LG26(25%)Mg glass with 1 hour hold at different
nucleation Temperatures (656˚C, 676˚C, 696˚C, 716˚C) and a heating rate of
10oC/min.
45
Figure 3.10: Optimum Nucleation curves of Tp´1 collected for the LG26(25%)Mg,
LG26(50%)Mg and LG26(75%)Mg containing glasses.
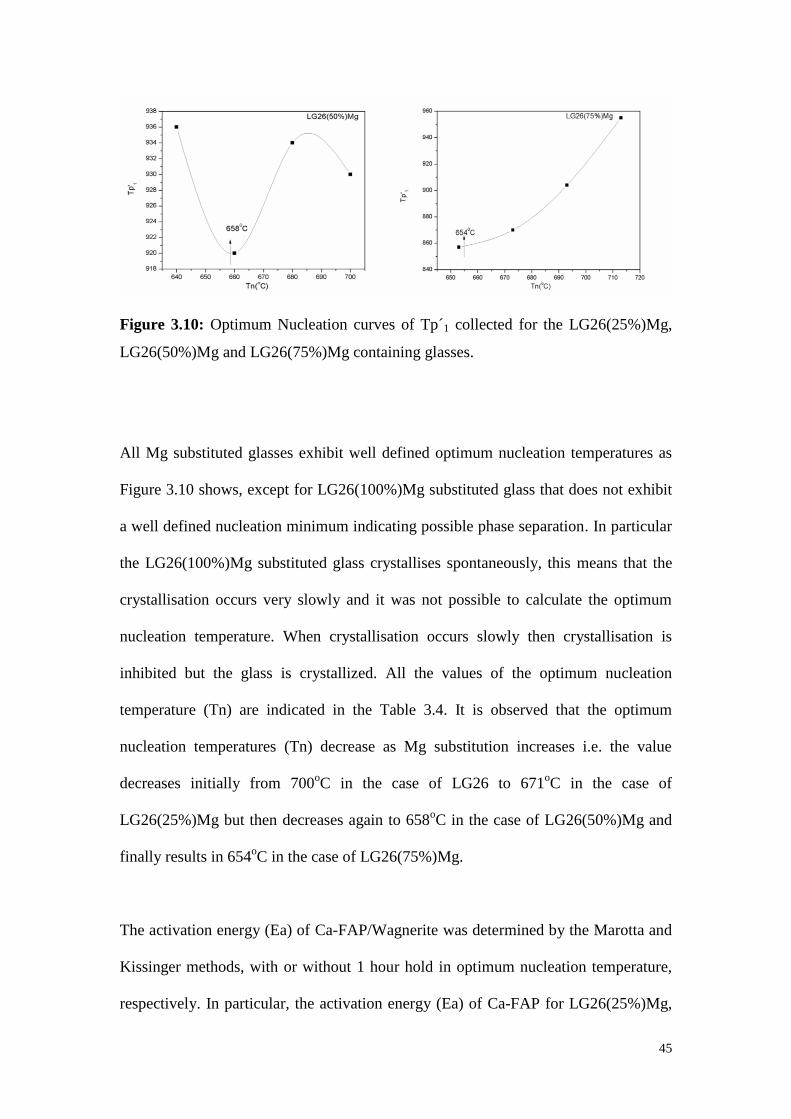
All Mg substituted glasses exhibit well defined optimum nucleation temperatures as
Figure 3.10 shows, except for LG26(100%)Mg substituted glass that does not exhibit
a well defined nucleation minimum indicating possible phase separation. In particular
the LG26(100%)Mg substituted glass crystallises spontaneously, this means that the
crystallisation occurs very slowly and it was not possible to calculate the optimum
nucleation temperature. When crystallisation occurs slowly then crystallisation is
inhibited but the glass is crystallized. All the values of the optimum nucleation
temperature (Tn) are indicated in the Table 3.4. It is observed that the optimum
nucleation temperatures (Tn) decrease as Mg substitution increases i.e. the value
decreases initially from 700oC in the case of LG26 to 671
oC in the case of
LG26(25%)Mg but then decreases again to 658oC in the case of LG26(50%)Mg and
finally results in 654oC in the case of LG26(75%)Mg.
The activation energy (Ea) of Ca-FAP/Wagnerite was determined by the Marotta and
Kissinger methods, with or without 1 hour hold in optimum nucleation temperature,
respectively. In particular, the activation energy (Ea) of Ca-FAP for LG26(25%)Mg,

46
LG26(50%)Mg and the Ea of Ca-FAP/Wagnerite for LG26(75%)Mg was determined
following 1 hour hold in 671oC, 658
oC, 654
oC , respectively, using five different
heating rates such as 2, 5, 10, 15 and 20oC/min as is indicated in Figure 3.11.
(a)

47
(b)
(c)

48
Figure 3.11: DSC traces of (a) LG26(25%)Mg, (b) LG26(50%)Mg, (c)
LG26(75%)Mg and (d) LG26(100%)Mg glasses at five different heating rates after 1
hour of optimum nucleation hold.
It is obvious that in the case of LG26(100%)Mg the activation energy (Ea) of Ca-
FAP/Wagnerite was not calculated since the glass does not exhibit well defined
optimum nucleation temperature. Furthermore, it was observed that the activation
energy slightly increased with the exception of LG26(75%)Mg. In order to understand
how magnesium substitution can affect the activation energy of Ca-FAP/Wagnerite
phase, both the Marotta and Kissinger methods were used for calculations for all Mg
substituted glasses (Table 3.4).
(d)
49
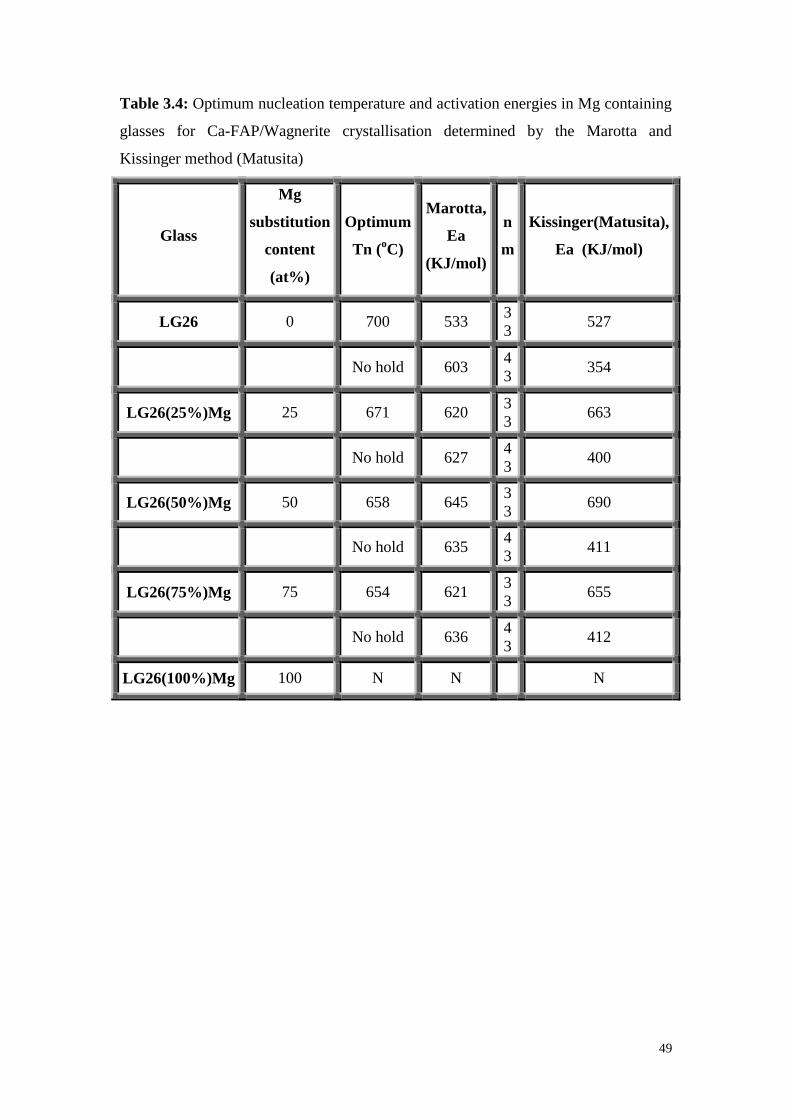
Table 3.4: Optimum nucleation temperature and activation energies in Mg containing
glasses for Ca-FAP/Wagnerite crystallisation determined by the Marotta and
Kissinger method (Matusita)
Glass
Mg
substitution
content
(at%)
Optimum
Tn (oC)
Marotta,
Ea
(KJ/mol)
n
m
Kissinger(Matusita),
Ea (KJ/mol)
LG26 0 700 533 3
3 527
No hold 603 4
3 354
LG26(25%)Mg 25 671 620 3
3 663
No hold 627 4
3 400
LG26(50%)Mg 50 658 645 3
3 690
No hold 635 4
3 411
LG26(75%)Mg 75 654 621 3
3 655
No hold 636 4
3 412
LG26(100%)Mg 100 N N N
50
CHAPTER 4
DISCUSSION
4.1 Effect of Cation Substitution on Glasses
4.1.1 Density and Oxygen Density
The measured density values are decreased linearly with increasing the molar content
of Mg from 2.73 g/cm3
of LG26 glass to 2.65 g/cm3
of LG26(100%)Mg containing
glass shown in Figure 3.1. The substitution of Mg for Ca resulted in a decrease of the
density of glasses as Mg has a smaller atomic weight (AW=24.3) and ionic radius
(0.065nm) compared to the atomic weight (AW=40) and ionic radius (0.114nm) of
Ca. Since the atomic weight of Mg and Ca are significantly different, the linear
decrease of density indicates that the atomic weight change has a more important
effect on the density values than the ionic radius.
The oxygen density values on the other hand, increased as the Mg substitution
increased, as shown in Figure 3.2. The minimum value is 1.113 g/cm3 in the case of
LG26 and the maximum value is 1.168 g/cm3
in the case of LG26(100%)Mg. In the
glass network, the oxygen density reflects the degree of packing of the atoms. There is
a slight linear increase in the oxygen density from LG26 to LG26(100%)Mg
containing glasses indicating a closer packed glass network. To summarise, it is clear
that Mg substitution leads to a decrease in glass density and an increase in oxygen
density.

51
4.1.2 Fourier Transform Infrared Spectroscopy
The Figure 3.3 showed the FTIR spectra of Mg substituted alumino silicate glasses.
The lack of sharp peaks in the FTIR spectra shown in Figure 3.3 indicates a disorder
in the silicate network reflecting the wide distribution of Qn units occurring in the
glasses. J.Serra et al. [70] reported that the peak at around 800 cm-1
is associated with
the bending Si-O(b) vibration whereas the asymmetric Si-O(s) stretching mode is
located in the range of 100-1300 cm-1
. It was also reported that the symmetric and
asymmetric stretching modes of Si-O-Si bonds in the Qn
units appear in the 800-1300
cm-1
region with the absorption bands of the Qn
units with n= 4, 3, 2, 1 and 0 centred
around 1200, 1100, 950, 900 and 850 cm-1
, respectively [65]. As reported from the
literature [57] in a simple silica glass all the silicon atoms are bonded to four oxygen
atoms and all oxygen atoms are bridging oxygen atoms (BO), each oxygen atom
bridges two silicon atoms. In addition, in FTIR spectra, the main absorption band is in
the range of 800-1400 cm-1
and indicates a distribution of Si-O-Si stretching (Q4), Si-
O-Si stretching (Q3) and Si-O-[NBO] per SiO4 tetrahedron (Q
3) [64].
In general, Mg acts as network modifier and can induce a visible shift of certain
bands, indicating a change in the formation of non-bridging oxygens in the glass
network. The replacement of Mg for Ca results in a shift towards larger wavenumbers
for the bands as well as in decreased relative intensity connected with Si-O-NBO
bonds. By increasing the Mg content, it is suggested that Mg substitution for Ca leads
to the formation of more bridging-oxygens within the glass network, as well as bigger
inter-tetrahedral angle values [60]. As observed from the Figure 3.3 the spectra of
LG26(100%)Mg substituted glass has a different tendency from all the other spectra.
The bands of this spectra are shifted to lower wavenumbers. It is most likely that this

52
happened due to the more tight glass network formed with 100%Mg substitution.
Generally, the formation of more Si–O–NBOs and the breakage of Si–O–Si bonds
play an important role in the biological response at the interface of the bioactive
materials when exposed to body fluids, therefore the study of the bonding
configuration is a key step for the development of new glasses and their biomedical
application [60-64].
4.1.3 Glass Transition and Crystallization
Temperatures of Mg Substituted Glasses
As indicated in Table 3.1 the glass transition temperature (Tg) decreases slightly with
Mg substitution in the beginning and then increases due to the “mixed cation effect”
as has been reported elsewhere [68]. Generally, it is observed that the glass transition
temperature (Tg) does not change significantly with Mg substitution. It has been
reported, that Mg substitution resulted in an increase in the number of bridging
oxygens and therefore the network connectivity was expected to increase [11, 21].
However, it is not clear whether an increase in the number of bridging oxygens is
connected with an increase in the glass transition temperature. One would expect that
an increase in the number of non-bridging oxygens would result in a stiffer glass
network and therefore in an increase in the glass transition temperature but the present
and previous experimental work [44] has not justified the above assumption.
Furthermore, it was observed that both Tp1 and Tp2 increased with Mg substitution.
In general, there are not significant changes in Tp1 and Tp2 among Mg substituted
glasses but there are significant changes between LG26 and Mg substituted glasses.
The values increase or decrease slightly by changing the substitution and often this

53
behaviour has been characterised as mixed cation effect. It has been reported [65]
that the mixed cation effect can represent the nonlinear variation of physical
properties (e.g. high minimum conductivity) that was observed in a family of glasses
when the relative proportion of two modifiers was varied while the total modifier
concentration was kept unchanged. This was most likely related to the cation
movement and structural properties. Rao et al. [66] reported, that the glass transition
temperature of xK2O–(40−x)Na2O–50B2O3–10As2O3 system exhibits a negative
deviation from linearity. For glasses containing 40 mole% of alkali content, the Tg
followed the order Na>K that is Tg,Na > Tg,K. In addition, a similar observation was
made in silicate glasses and mixed crystals [67]. Other published work [68] showed
that the glass transition temperature of glasses containing one network modifier
increased in the following order: Na2O<BaO<MgO. This is also consistent with an
increase in the cation-oxygen bond strength in the above order. In our case however a
similar behaviour was not observed. According to the literature, one would expect that
the glass transition temperature would increase with Mg substitution and considering
that the cation-oxygen bond is stronger than Ca-O, the Mg substituted glasses should
show an increase in the glass transition temperature. Previous work with similar Ba
substitutions did not show any increase in the glass transition temperature not even
compared to the present data [38]. In the contrary, the glass transition temperature is
very similar for both Ba and Mg substitutions. Here it is obvious that the mixed cation
effect is not that strong although there is some evidence of the mixed cation effect in
the first crystallisation temperature (Tp1). Different models [65] have been used to
interpret the mixed cation effect, assuming either a large structural modification
induced by mixing mobile species of different sizes or a specific interaction between
dissimilar mobile species. Pevzner et al. [68] studied the RO(R2O) · 2B2O3 glasses

54
(where R2O = Na2O, RO = BaO, MgO) upon replacement of Na2O by BaO or MgO,
and BaO by MgO and supported that the mixed cation effect was associated with the
difference in energy of cation-oxygen bonds and a different effect of cations on the
coordination state of boron.
4.2 Effect of Cation Substitution on Glass-Ceramics
4.2.1 Density of Glass Ceramics
The measured density values for glass ceramics are decreased with increasing the
molar content of Mg from 2.88 g/cm3
of LG26 containing glass ceramic to 2.84 g/cm3
of LG26(100%)Mg containing glass ceramic, shown in Figure 3.6. This happens
because the density depends on the kind of phases as well as the amount of each phase
that is present in the glass ceramic. For instance, it has been calculated from the XRD
data base (icdd ) in x’pert high score that the density of crystal phases such as Ca-FAP
(Ca5(PO4)3F) with reference code (00-015-0876), Wagnerite (Mg2PO4F) with
reference code (00-042-1330) and Mullite (Al6Si2O13) with reference code (00-015-
0776) are 3.15 g/cm3, 3.13 g/cm
3 and 3.00 g/cm
3, respectively. Consequently, it can
be explained why the LG26(100%)Mg substituted glass ceramic has the lowest
density value while the LG26(25%)Mg substituted glass ceramic has the highest
value. According to Table 3.2, it was observed that the LG26 glass ceramic consist of
3 crystal phases such as Ca-FAP, Mullite and AlPO4 whereas the LG26(100%)Mg
substituted glass ceramic consists of Wagnerite, Mullite and AlPO4. Gradually the
density decreases as the Mg substitution increases since Wagnerite replaces Ca-FAP
as well as the density of Wagnerite is lower than the density of Ca-FAP.
55
4.2.2 XRD Study of Mg substituted Glass-Ceramics
As Figure 3.7 showed, in the first series of measurements that Mg substituted glasses
heat treated up to 1100oC with one hour hold in optimum nucleation temperature, the
LG26 containing glass is mainly crystallised to Ca-FAP and Mullite (Al6Si2O13) as
well as a small amount of AlPO4. Consequently, the first crystallised phase is the Ca-
FAP and the second crystallised phase is the Mullite (Al6Si2O13). In particular, the
introduction of Mg for Ca results in the formation of Wagnerite (Mg2PO4F), Ca-FAP
and Mullite (Al6Si2O13) in the case of LG26(25%)Mg and LG26(50%)Mg containing
glass ceramics whereas the formation of Wagnerite (Mg2PO4F) and Mullite
(Al6Si2O13) is appeared in the case of LG26(75%)Mg and LG26(100%)Mg containing
glass ceramics. As was mentioned the formation of cubic AlPO4 phase is detected in
all Mg containing glass ceramics. AlPO4 has also been confirmed by Neutron
Diffraction [39] by previous work in the case of LG26. As far as the formation of
Magnesium Fluoride Phosphate (MgPO4F) is concerned this phase was appeared only
in the case of the LG26(75%)Mg containing glass ceramics.
By using Scherrer equation [69, 70], in the first series of measurements that involved
heat treatment of Mg substituted glasses up to 1100oC with one hour hold in optimum
nucleation temperature (Table 3.2), the crystal size of hexagonal Ca-FAP was
calculated to be in the range of 84 to 26 nm, and the crystal size of orthorhombic
Mullite was calculated in the range of 31 to 72 nm while the crystal size of
monoclinic Wagnerite was in the range of 30 to 42 nm.
Furthermore, all Mg substituted glasses were heat treated up to corresponding Tp1
and studied by XRD in order to identify the crystal phases formed at Tp1. As Figure

56
3.8 shows the Ca-FAP (Ca5(PO4)3F) is produced in LG26(25%)Mg containing glass
ceramic whereas the Wagnerite (Mg2PO4F) is formed in LG26(75%) Mg containing
glass ceramics. In the case of LG26(100%)Mg the XRD pattern showed that the glass
was not crystallised to Wagnerite at the temperature indicated by DSC (Figure
3.11(d)) as the first crystallisation temperature. It is therefore concluded that the first
crystallisation temperature is higher than the above temperature and corresponds to
the second exothermic transition observed in Figure 3.11(d). In order for the
LG26(100%)Mg to crystallise the heat treatment should have been conducted to
higher temperature (983oC from Figure 3.5(d)) and not at 820
oC taken from the DSC
curve used for the calculation of the activation energy.
4.2.3 Optimum Nucleation Temperature and
Activation Energy Study on Mg Substituted glasses
The basic method in order to calculate the optimum nucleation temperature is the
method outlined by Marotta et al. as mentioned before. The optimum nucleation
curves of Tp´1 collected for the LG26(25%)Mg, LG26(50%)Mg and LG26(75%)Mg
glasses are shown in Figure 3.10. The optimum nucleation temperatures (Tn)
decreased as Mg substitution increased. Consequently, a well defined optimum
nucleation temperature was calculated for all samples according to the first
crystallisation peak temperature except for the LG26(100%)Mg containing glass
which does not exhibit an optimum nucleation temperature. It is likely that this glass
was phase separated and crystallisation occurred spontaneously without going through
the nucleation process. In other words the crystallisation occurs very slowly and it
was not possible to calculate the optimum nucleation temperature. When
57
crystallisation occurs slowly then crystallisation is inhibited but the glass is
crystallized. In order to establish whether the above glass was phase separated an X-
ray diffractogram of the glass was taken which did not show any sign of
crystallisation. Knowing that phase separation can happen at a very small scale it is
possible that the XRD shows an amorphous glass pattern. A similar behaviour was
observed in previous work [38] with LG26(100%)Ba containing glass which did not
appear to have a well defined optimum nucleation temperature, indicating possibly
the efficiency of the corresponding phase (BaAl2Si2O8) to self-nucleate and grow.
Concerning the fact that in all cases the optimum nucleation temperature is only
slightly above the glass transition temperature, is indicative of the nucleation
mechanism involving amorphous phase separation [39]. It is very important to notice
that in the case of LG26(25%)Mg and LG26(50%)Mg the first crystallisation
temperature corresponds to the crystallisation of both Ca-FAP and Wagnerite whereas
in the case of LG26(75%)Mg and LG26(100%)Mg the first crystallisation
temperature corresponds to the crystallisation of Wagnerite only. Therefore in the two
first glass compositions the activation energy corresponds to both Ca-FAP and
Wagnerite crystal phases with Ca-FAP being the dominant crystalline phase.
As described above in Chapter 2, the calculations of the activation energies of Ca-
FAP/Wagnerite crystallisation were conducted using both the Marotta method and the
modified Kissinger method as proposed by Matusita et al. [40] that give information
about the related nucleation and growth process that corresponds to the formation of
Ca-FAP/Wagnerite. The values of n=3 and m=3 assume bulk nucleation from a
constant number of nuclei for samples with a nucleation hold, while the values n=4
and m=3 assume bulk nucleation from an increasing number of nuclei without a

58
nucleation hold. The activation energy for all Mg substituted glasses increased
compared to the activation energy for Ca-FAP crystallisation of the base LG26 glass
whereas the activation energy of Ca-FAP/Wagnerite did not change significantly with
Mg substitution if compared to all Mg substituted glasses (some slight increase or
decrease in value that do not follow a specific pattern). The increase of the activation
energy of Ca-FAP/Wagnerite with Mg substitution compared to the activation energy
of Ca-FAP/Wagnerite of LG26 is related with the gradual replacement of Ca-FAP by
Wagnerite as Mg substitution progressively increased. In a previous study it was
reported that the activation energy corresponding to the crystallisation Ca-FAP in Ba
and Sr glasses reduced with increasing substitution of Ba or Sr for Ca. Additionally,
the Ba substituted glasses exhibited lower activation energies than these of Sr
containing glasses. This may be attributed to the formation of a more disrupted glass
network in the case of Ba containing glasses as well as more non-bridging oxygens
with the larger cation substitution. It is therefore logical to conclude that in the case of
Mg which is a smaller cation compared to Ba, Sr and Ca the change in the activation
energy should be different. It is clear from Table 3.4 that between the Kissinger and
Marotta methods, the activation energies are in good agreement for all the glasses
with nucleation hold confirming the assumption of n=m=3 and consequently bulk
nucleation and crystallisation.

59
CHAPTER 5
CONCLUSIONS
The effect of Mg substitution on the structure of ionomer glasses and glass ceramics
was studied by using a combination of analytical methods such as FTIR, DSC and
XRD. The optimum nucleation temperature and the activation energy of Ca-
FAP/Wagnerite crystallisation was also measured using both the Kissinger and
Marotta methods. The Helium Pycnometer was used to measure the density of glasses
and glass ceramics.
The density of glasses decreased with increasing the molar content of Mg as expected
considering that Mg has a smaller atomic weight and ionic radius than the atomic
weight and ionic radius of Ca. Furthermore, the oxygen density increased slightly
with Mg substitution most likely due to better packing of atoms in the glass network
with Mg substitution for Ca. The density of glass ceramics on the other hand
decreased with increasing the molar content of Mg as expected because of the
formation of Wagnerite (Wagnerite exhibits lower density than Fluorapatite) that
progressively replaces Fluorapatite.
The FTIR spectra showed that there are four absorption regions of Mg containing
aluminosilicate glasses, associated with the following:
Si-O-Si (Q4) and Si-O-Si (Q
3) stretching vibrations as well as Si-O-[NBO],
Al-O vibrations with Al in four-fold coordination state,
P-O bending vibrations and Si-O-Al linkages and Si-O-Si bending vibrations.

60
The spectra did not show significant changes with Mg substitution other than some
shift towards higher wavenumbers with Mg substitution.
DSC analysis showed that the glass transition temperature Tg did not undergo
significant changes with Mg substitution but decreased slightly up to 50% Mg
substitution and then increased slightly with the progressive substitution of Mg for
Ca. This can be explained considering the mixed cation effect. Also, not significant
changes were observed for Tp1 and Tp2 comparing all Mg substituted glasses but a
significant change was observed between the Tp1 and Tp2 values of LG26 and Mg
substituted glasses. Among Mg substituted glasses, the Tp1 and Tp2 values increased
or decreased slightly with substitution and often this behaviour has been characterised
as the mixed cation effect. The optimum nucleation temperature (Tn) on the other
hand decreased as Mg substitution increased. Consequently, a well defined Tn was
calculated for all the samples according to the first crystallisation peak temperature
except for LG26 100%Mg containing glass which did not exhibit a Tn. It is likely that
this glass was phase separated and the crystallisation occured spontaneously without
going through the nucleation phase.
XRD analysis showed that the substitution of Mg for Ca resulted in the formation of
Wagnerite (Mg2PO4F), Ca-FAP and Mullite (Al6Si2O13) in the case of LG26(25%)Mg
and LG26(50%)Mg containing glass ceramics whereas the formation of Wagnerite
(Mg2PO4F) and Mullite (Al6Si2O13) was observed in the case of LG26(75%)Mg and
LG26(100%)Mg glass ceramics. Furthermore, the crystal size of hexagonal Ca-FAP
was calculated to be in the range of 84 to 26 nm, the crystal size of orthorhombic

61
Mullite was calculated in the range of 31 to 72 nm while the crystal size of
monoclinic Wagnerite was in the range of 30 to 42 nm. The Mg substituted glasses
which were heat treated up to the first crystallisation temperature Tp1 showed that
only Ca-FAP (Ca5(PO4)3F) was formed in LG26(25%)Mg glass ceramic whereas
Wagnerite (Mg2PO4F) was the only phase formed in LG26(75%)Mg glass ceramic.
The activation energy of Ca-FAP/Wagnerite increased for all glass compositions with
the exception of LG26(75%)Mg where Wagnerite was the only phase formed at Tp1
and therefore the activation energy was expected to decrease. The activation energies
values were in good agreement between the Kissinger and Marotta methods for all the
glasses with nucleation hold indicating bulk nucleation and crystallisation as the main
crystallisation mechanism.
62
CHAPTER 6
FUTURE WORK
The following future work can be suggested:
1. The first crystallization temperature corresponds to both Fluorapatite and
Wagnerite that crystallize both at the same temperature. It would be interesting to
identify what phase is forming first in order to be able to calculate the activation
energy of each one crystal phase separately. For this further DSC analysis is required.
2. It would be interesting to measure the degree of crystallisation for all Mg
substituted glass ceramics by XRD analysis. Glass-ceramics are polycrystalline
materials prepared by the controlled crystallisation of highly viscous glass-forming
melts. Their properties depend on the kind and the percentage of crystal phase formed
and on the composition of the residual glass. Therefore, the determination of the
degree of crystallisation is very important.
3. The study of different substitutions offered a very good insight of the role of
cations in the glass network. It is interesting that Ba, Sr and Ca are clearly network
modifiers whereas Mg and Zn have been also considered as intermediate oxides
(based on other published work). This study offered some useful information on the
effect of Mg on the glass structure but there is no evidence about the role of Mg in the
glass network. The possibility that under certain conditions Mg can act as a network
former is very attractive as this will lead to the formation of Al-free glasses that are
very desirable for biomedical applications.
4. Biocompatibility tests should be conducted on all Mg crystallised glasses in order
to assess their possibility as bone replacements for medical and dental applications.
63
REFERENCES
[1] K. Stanton and R. Hill, "The role of fluorine in the devitrification of
SiO2·Al2O3·P2O5·CaO·CaF2 glasses," Journal of Materials Science, vol. 35, pp.
1911–1916, 2000.
[2] R. Hill, A. Stamboulis, R. V. Law, A. Clifford, M. R. Towler, and C. Crowley,
"The influence of strontium substitution in fluorapatite glasses and glass ceramics,"
Journal of Non-Crystalline Solids, vol. 336, pp. 223–229, 2004.
[3] R. G. Hill, A. Stamboulis, and R. V. Law, "Characterisation of fluorine containing
glasses by F-19, Al-27, Si-29 and P-31 MAS-NMR spectroscopy," Journal of
Dentistry, vol. 34, pp. 525–532, 2006.
[4] A. Moshaverinia, N. Roohpour, Ihtesham U. Rehman, "Synthesis and
characterisation of a novel fast-set proline-derivative-containing glass ionomer
cement with enhanced mechanical properties," Acta Biomaterials, vol. 5, pp. 498-507,
2009.
[5] J. W. Nicholson, "Chemistry of glass-ionomer cements: a review," Biomaterials,
vol. 19, pp. 485–494, 1998.
[6] C. Fernandez, J. P. Amoureux, "2D multiquantum MAS-NMR spectroscopy of
27Al in aluminophosphate molecular sieves," Chemical Physics Letters, vol. 242, pp.
449-454, 1995.
[7] S. G. Griffin and R. G. Hill, "Influence of glass composition on the properties of
glass polyalkenoate cements. Part IV: influence of fluorine content," Biomaterials,
vol. 2, pp. 693–698, 2000.
[8] Carel L. Davidson, Ivar A. Mjor: Glass-Ionomer Cements, 1999.
[9] Graham J Mount: An atlas of Glass Ionomer Cements, 1990.

64
[10] C. M Crowley, J. Doyle, M. R. Towler, R. G Hill, S. Hampshire, "The influence
of capsule geometry and cement formulation on the apparent viscosity of dental
cement," Journal of dentistry, vol. 34, pp. 566-573, 2006.
[11] Artemis Stamboulis, Fei Wang, "Ionomer glasses: Design and Characterisation,"
in “Advanced Biomaterials”, ed. B. Basu, D.S. Katti, A.Kumar, John Wiley & Sons,
2009, pp.411-433.
[12] Alan D. Wilson/John W. McLean: Glass-Ionomer Cement, 1988.
[13] A. Guida, R. G. Hill, M. R. Towler, S. Eramo, "Fluoride release of model glass
ionomer cements", Journal of materials science: Materials in Medicine vol. 13, pp.
645-649, 2002.
[14] D.Boyd, H. Li and D. A. Tanner, "The antibacterial effect of zinc ion migration
from zinc-based glass polyalkenoate cements," Springer Science, vol.17, pp. 489-494,
2006.
[15] R. Hill and D. Wood, "Apatite-mullite glass ceramics," Journal of Materials
Science, vol. 6, pp. 311–318, 1995.
[16] A. Rafferty, A. Clifford, R. Hill, D. Wood, B. Samuneva, and M. Dimitrova-
Lukacs, "Influence of fluorine content in apatite-mullite glass ceramics," Journal of
the American Ceramic Society, vol. 83, pp. 2833–2838, 2000.
[17] S. Griffin, R. G Hill, "Glass composition influence on glass polyalkenoate
cement mechanical properties,” Journal of non-crystalline solids, vol.196, pp. 255-
259, 1996.
[18] C. M. Gorman and R. G. Hill, "Heat-pressed ionomer glass-ceramics. Part I: an
investigation of flow microstructure", Dental Materials, vol.19, pp. 320-326, 2003.
[19] Arun K. Varshneya: fundamentals of Inorganic Glasses, 2006

65
[20] A. Calver, R. G. Hill, and A. Stamboulis, "Influence of fluorine content on the
crystallization behavior of apatite-wollastonite glass ceramics," Journal of Materials
Science, vol. 39, pp. 2601-2603, 2004.
[21] R. D. Goodridge, D. J. Wood, C. Ohtsuki, and K. W. Dalgarno, "Biological
evaluation of an apatite-mullite glass-ceramic produced via selective laser sintering,"
Acta Biomaterialia, vol. 3, pp. 221-231, 2007.
[22] A. D. Neve, V. Piddock, and E. C. Combe, "The effect of glass heat treatment on
the properties of a novel polyalkenoate cement," Clinical Materials, vol. 12, pp. 113,
1993.
[23] D. Boyd, M. R. Towler, R. V. Law, and R. G. Hill, "An investigation into the
structure and reactivity of calcium-zinc-silicate ionomer glasses using MAS-NMR
spectroscopy," Journal of Materials Science: Materials in Medicine, vol. 17, 2006.
[24] C. O. Freeman, I. M. Brook, A. Johnson, P. V. Hatton, R. G. Hill, and K. T.
Stanton, "Crystallization modifies osteoconductivity in an apatite–mullite glass–
ceramic," Journal of Materials Science: Materials in Medicine, vol. 14, pp. 985-990,
2003.
[25] S. G. Griffin and R. G. Hill, "Influence of glass composition on the properties of
glass polyalkenoate cements. Part I: influence of aluminium to silicon ratio,"
Biomaterials, vol. 20, pp. 1579–1586, 1999.
[26] S. G. Griffin and R. G. Hill, "Influence of glass composition on the properties of
glass polyalkenoate cements. Part II: influence of phosphate content," Biomaterials,
vol. 21, pp. 399–403, 2000.
[27] A. Rafferty, R. Hill, and D. Wood, "Amorphous phase separation of ionomer
glasses,"Journal of Materials Science, vol. 35, pp. 3863–3869, 2000.
66
[28] A. D. Wilson, S. Crisp, H. J. Prosser, B. G. Lewis, and S. A. Merson,
"Aluminosilicate Glasses For Poly-Electrolyte Cements," Industrial & Engineering
Chemistry Product Research And Development, vol. 19, pp. 263-270, 1980.
[29] R. G. Hill and A. D. Wilson, "Some structural aspects of glasses used in ionomer
cements," Glass Technology, vol. 29, pp. 150-157, 1988.
[30] Q. Zeng and J. F. Stebbins, "Fluoride sites in aluminosilicate glasses: High-
resolution F-19 NMR results," American Mineralogist, vol. 85, pp. 863-867, 2000.
[31] E. De Barra and R. G. Hill, "Influence of glass composition on the properties of
glass polyalkenoate cements. Part III: influence of fluorite content," Biomaterials, vol.
21,pp. 563–569, 2000.
[32] A. Guida, R. G. Hill, M. R. Towler, S. Eramo, "Fluoride release of model glass
ionomer cements," Journal of materials science: Materials in Medicine vol. 13, pp.
645-649, 2002.
[33] A. Stamboulis, R. G. Hill, and R. V. Law, "Characterisation of the structure of
calcium alumino-silicate and calcium fluoro-alumino-silicate glasses by magic angle
spinning nuclear magnetic resonance (MAS-NMR)," Journal of Non-Crystalline
Solids, vol.333, pp. 101–107, 2004.
[34] R. G. Hill, A. Stamboulis, and R. V. Law, "Characterisation of fluorine
containing glasses by F-19, Al-27, Si-29 and P-31 MAS-NMR spectroscopy," Journal
of Dentistry, vol. 34, pp. 525–532, 2006.
[35] A. Stamboulis, R. G. Hill, and R. V. Law, "Characterisation of the structure of
calcium alumino-silicate and calcium fluoro-alumino-silicate glasses by magic angle
spinning nuclear magnetic resonance (MAS-NMR)," Journal of Non-Crystalline
Solids, vol. 333, pp. 101-107, 2004.
67
[36] A. Stamboulis, R. G. Hill, and R. V. Law, "Structural characterization of fluorine
containing glasses by F-19 Al-27 Si-29 and P-31 MAS-NMR spectroscopy," Journal
of Non-Crystalline Solids, vol. 351, pp. 3289-3295, 2005.
[37] J. F. Stebbins, S. Kroeker, S. K. Lee, and T. J. Kiczenski, "Quantification of five-
and six-coordinated aluminum ions in aluminosilicate and fluoride-containing glasses
by high-field, high-resolution Al-27 NMR," Journal of Non-Crystalline Solids, vol.
275, pp. 1-6, 2000.
[38] F. Wang, PhD Thesis, "Cation Substitution in ionomer glasses: Effect on glass structure
and crystallisation," University of Birmingham, 2009.
[39] R. Hill, A. Calver, A. Stamboulis, and N. Bubb, "Real time nucleation and
crystallisation studies of a fluorapatite glass-ceramics using small angle neutron
scattering and neutron diffraction," Journal of the American Ceramic Society, vol. 90,
pp. 763-768, 2007.
[40] A. Clifford, A. Rafferty, R. Hill, P. Mooney, D. Wood, B. Samuneva, and S.
Matsuya, "The influence of calcium to phosphate ratio on the nucleation and
crystallisation of apatite glass-ceramics," Journal of Materials Science: Materials in
Medicine, vol. 12, pp. 461-469, 2001.
[41] F. C. M. Driessens and R. M. H. Veerbeck, Biominerals: CRC, 1990.
[42] F. Wang, A. Stamboulis, D. Holland, S. Matsuya, and A. Takeuchi, "Solid state
MAS NMR and FTIR study of barium containing aluminosilicate glasses, " Key
Engineering Materials, vol. 361–363, pp. 825–828, 2008.
[43] M. Darling and R. Hill, "Novel polyalkenoate (glass-ionomer) dental cements
based on zinc silicate glasses," Biomaterials, vol. 15, pp. 299-306, 1994.
[44] S. Watts, Phd Thesis, "Composition structure property relationships in bioactive
glasses," Imperial College of London, 2010.
68
[45] W. Lowenstein, "The distribution of aluminium in the tetrahedral of silicates and
aluminates," American Mineralogist, vol. 39, pp. 92-96, 1954.
[46] A. Clifford, A. Rafferty, R. Hill, P. Mooney, D. Wood, B. Samuneva, and S.
Matsuya, "The influence of calcium to phosphate ratio on the nucleation and
crystallisation of apatite glass-ceramics," Journal of Materials Science: Materials in
Medicine, vol. 12, pp. 461-469, 2001.
[47] R. Hill, D. Wood, and M. Thomas, "Trimethylsilylation analysis of the silicate
structure of fluoro-alumino-silicate glasses and the structural role of fluorine,"
Journal of Materials Science, vol. 34, pp. 1767-1774, 1999.
[48] A. L. Patterson, "The Scherrer formula for x-ray particle size determination,"
Physical Review, vol. 56, pp. 978-982, 1939.
[49] A. Weibel, R. Bouchet, F. Boulc'h, and P. Knauth, "The big problem of small
particles: A comparison of methods for determination of particle size in
nanocrystalline anatase powders," Chemistry of Materials, vol. 17, pp. 2378-2385,
2005.
[50] J. E. Shelby, "Introduction to Glass Science and Technology (RSC paperbacks),"
The Royal Society of Chemistry, 1997.
[51] T. I. Barry, D. J. Clinton, and A. D. Wilson, "The structure of a glass-ionomer
cement and its relationship to the setting process," Journal of Dental Research, vol.
58, pp. 1072-1079, 1979.
[52] M. J. Davis and I. Mitra, "Crystallization measurements using DTA methods:
Applications to Zerodur," Journal of The American Ceramic Society, vol. 86, pp.
1540-1546, 2003.
[53] D.Wood and R.Hill, "Structure-Property Relationships in Ionomer Glasses,"
Clinical Materilas, vol.7, pp. 301-312, 1991.

69
[54] Kazuma Matusita and Sumio Sakka, "Kinetic study on crystallization of glass by
Differential Thermal Analysis- Criterion on application of Kissinger plot, " Journal of
Non-Crystalline Solids, vol. 38, pp. 741-746, 1980.
[55] P. Islam, R. Hill, A. Stamboulis, "Activation Energy for crystal growth in
stoichiometric CaAl2Si2O9 glasses, " Journal of Materials Science Letters, vol.22,
pp.1287-1289, 2003.
[56] L. Stoch and M. Sroda, "Infrared spectroscopy in the investigation of oxide
glasses structure," Journal of Molecular Structure, vol. 512, pp. 77-84, 1999.
[57] S. A. MacDonald, C. R. Schardt, D. J. Masiello, and J. H. Simmons, "Dispersion
analysis of FTIR reflection measurements in silicate glasses," Journal of Non-
Crystalline Solids, vol. 275, pp. 72-82, 2000.
[58] C. Huang and E. C. Behrman, "Structure And Properties Of Calcium
Aluminosilicate Glasses," Journal of Non-Crystalline Solids, vol. 128, pp. 310-321,
1991.
[59] L. G. Hwa, S. L. Hwang, and L. C. Liu, "Infrared and Raman spectra of calcium
alumino-silicate glasses," Journal of Non-Crystalline Solids, vol. 238, pp. 193-197,
1998.
[60] O. Peitl, E. D. Zanotto, and L. L. Hench, "Highly bioactive P2O5-Na2O-CaO-
SiO2 glass-ceramics," Journal of Non-Crystalline Solids, vol. 292, pp. 115-126, 2001.
[61] A. Chowdhuri, D.-U. Jin, J. Rosado, and C. Takoudis, "Strain and
substoichiometry at the Si(100)/SiO2 interface," Physical Review B, vol. 67, pp.
245305, 2003.
[62] A. E. Geissberger and F. L. Galeener, "Raman studies of vitreous SiO2 versus
fictive temperature," Physical Review B, vol. 28, pp. 3266-3271, 1983.

70
[63] P. N. Sen and M. F. Thorpe, "Phonons in Ax2 glasses - from molecular to band-
like modes," Physical Review B, vol. 15, pp. 4030-4038, 1977.
[64] J. Serra, P. Gonzalez, S. Liste, C. Serra, S. Chiussi, B. Leon, M. Perez-Amor, H.
O. Ylanen, and M. Hupa, "FTIR and XPS studies of bioactive silica based glasses,"
Journal of Non-Crystalline Solids, vol. 332, pp. 20-27, 2003.
[65] N. J. Clayden, S. Esposito, A. Aronne, and P. Pernice, "Solid state Al-27 NMR
and FTIR study of lanthanum aluminosilicate glasses," Journal of Non-Crystalline
Solids, vol. 258, pp. 11-19, 1999.
[66] N. Srinivasa Rao, S. Bale, M. Purnima, K. Siva Kumar, and S. Rahman, "Mixed
alkali effect in boroarsenate glasses," Journal of Physics and Chemistry of Solids, vol.
68, pp. 1354-1358, 2007.
[67] H. Jain, N. L. Peterson, and H. L. Downing, "Tracer diffusion and electrical-
conductivity in sodium cesium silicate-glasses," Journal of Non-Crystalline Solids,
vol. 55, pp. 283-300, 1983.
[68] B. Z. Pevzner and V. P. Klyuev, "Manifestation of the mixed-cation effect in
dilatometric properties of RO (R2O) center dot 2B(2)O(3) borate glasses upon
replacement of Na2O by BaO, Na2O by MgO, and BaO by MgO," Glass Physics And
Chemistry, vol. 30, pp. 506-514, 2004.
[69] A. Weibel, R. Bouchet, F. Boulc'h, and P. Knauth, "The big problem of small
particles: A comparison of methods for determination of particle size in
nanocrystalline anatase powders," Chemistry of Materials, vol. 17, pp. 2378-2385,
2005.
[70] H. Eshtiagh-Hosseini, M. R. Housaindokht, and M. Chahkandi, "Effects of
parameters of sol-gel process on the phase evolution of sol-gel-derived
hydroxyapatite," Materials Chemistry and Physics, vol. 106, pp. 310-316, 2007.
Related Documents