Thermal and mechanical properties of EPDM/PP + thermal shock-resistant ceramic composites Witold Brostow • Tea Datashvili • James Geodakyan • Jesse Lou Received: 12 July 2010 / Accepted: 16 November 2010 / Published online: 9 December 2010 Ó Springer Science+Business Media, LLC 2010 Abstract Dynamic vulcanizate blends of polypropylene (PP) and ethylene–propylene-diene rubber (EPDM) were filled with 5 wt% of micro-scale ceramic powder. To overcome the difficulty of particles dispersion and adhe- sion, the filler was modified through grafting using three kinds of organic molecules. A combination of Raman data with thermogravimetric analysis (TGA) results prove that grafting of organic macromolecules onto ceramic surfaces takes place. Dynamic mechanical analysis (DMA) has been performed from -100 to ?50 °C; addition of the ceramic increases the storage modulus E 0 , more so for modified filler. Compared to PP and thermoplastic vulca- nizate (TPV), a higher thermal expansion is seen after addition of the ceramic filler, a result of creation of more free volume. The tensile modulus of the composites is about 1.2 times that of pure TPV, an increase in the rigidity clearly caused by the ceramic. Fracture surfaces show weak bonding of filler particles to the matrix. In the sample containing modified filler the tensile deformation is going through the polymer matrix. The brittleness, B, decreases upon surface modification of the ceramic. The highest value of B is seen for the PP ? unmodified cera- mic while lower B values are obtained for TPV and its composites. Introduction The cost of manufacturing composite structures has proven to be the largest obstacle to their widespread use. The prevailing design and manufacturing approaches rely on assembling large numbers of mechanically fastened parts, a tradition inherited from metallurgy. Affordable composites can be achieved by proper materials selection, using low- cost manufacturing techniques and developing approaches for subsystem integration [1, 2]. Advancements in polymer composites using different fillers, adhesive bonding, and low-cost materials allow designers and manufacturers to exploit well the benefits of these materials [3–6]. Disadvantages of polymer-based composites include complex rheological behavior and difficult fabrication techniques [7–13]. Properties of composite materials are influenced by the properties of the components, shape of the filler, the morphology of the system, and the nature of the interfaces between the phases. A large variety of properties can be obtained with composites just by alteration of one of these items. Interfaces have large influence on the proper- ties of multiphase polymer composites [14–17]. The chal- lenge consists in obtaining significant improvements in the interfacial adhesion between the polymer matrix and the inorganic additives as well as achieving a homogeneous dispersion of the filler in polymer matrix [18–23]. In this work, we have fabricated dynamic vulcanizate blends of polypropylene (PP) with ethylene–propylene-diene W. Brostow (&) T. Datashvili J. Lou Laboratory of Advanced Polymers & Optimized Materials (LAPOM), Department of Materials Science and Engineering and Department of Physics, University of North Texas, 1150 Union Circle # 305310, Denton, TX 76203-5017, USA e-mail: [email protected]; [email protected] URL: http://www.unt.edu/LAPOM/ T. Datashvili e-mail: [email protected] J. Lou e-mail: [email protected] J. Geodakyan Scientific Research and Production Enterprise of Materials Science, 17 Charents Street, 0025 Yerevan, Armenia e-mail: [email protected] 123 J Mater Sci (2011) 46:2445–2455 DOI 10.1007/s10853-010-5091-2

Welcome message from author
This document is posted to help you gain knowledge. Please leave a comment to let me know what you think about it! Share it to your friends and learn new things together.
Transcript
Thermal and mechanical properties of EPDM/PP + thermalshock-resistant ceramic composites
Witold Brostow • Tea Datashvili • James Geodakyan •
Jesse Lou
Received: 12 July 2010 / Accepted: 16 November 2010 / Published online: 9 December 2010
� Springer Science+Business Media, LLC 2010
Abstract Dynamic vulcanizate blends of polypropylene
(PP) and ethylene–propylene-diene rubber (EPDM) were
filled with 5 wt% of micro-scale ceramic powder. To
overcome the difficulty of particles dispersion and adhe-
sion, the filler was modified through grafting using three
kinds of organic molecules. A combination of Raman data
with thermogravimetric analysis (TGA) results prove that
grafting of organic macromolecules onto ceramic surfaces
takes place. Dynamic mechanical analysis (DMA) has
been performed from -100 to ?50 �C; addition of the
ceramic increases the storage modulus E0, more so for
modified filler. Compared to PP and thermoplastic vulca-
nizate (TPV), a higher thermal expansion is seen after
addition of the ceramic filler, a result of creation of more
free volume. The tensile modulus of the composites is
about 1.2 times that of pure TPV, an increase in the
rigidity clearly caused by the ceramic. Fracture surfaces
show weak bonding of filler particles to the matrix. In the
sample containing modified filler the tensile deformation is
going through the polymer matrix. The brittleness, B,
decreases upon surface modification of the ceramic. The
highest value of B is seen for the PP ? unmodified cera-
mic while lower B values are obtained for TPV and its
composites.
Introduction
The cost of manufacturing composite structures has proven
to be the largest obstacle to their widespread use. The
prevailing design and manufacturing approaches rely on
assembling large numbers of mechanically fastened parts, a
tradition inherited from metallurgy. Affordable composites
can be achieved by proper materials selection, using low-
cost manufacturing techniques and developing approaches
for subsystem integration [1, 2]. Advancements in polymer
composites using different fillers, adhesive bonding, and
low-cost materials allow designers and manufacturers to
exploit well the benefits of these materials [3–6].
Disadvantages of polymer-based composites include
complex rheological behavior and difficult fabrication
techniques [7–13]. Properties of composite materials are
influenced by the properties of the components, shape of the
filler, the morphology of the system, and the nature of the
interfaces between the phases. A large variety of properties
can be obtained with composites just by alteration of one of
these items. Interfaces have large influence on the proper-
ties of multiphase polymer composites [14–17]. The chal-
lenge consists in obtaining significant improvements in the
interfacial adhesion between the polymer matrix and the
inorganic additives as well as achieving a homogeneous
dispersion of the filler in polymer matrix [18–23].
In this work, we have fabricated dynamic vulcanizate
blends of polypropylene (PP) with ethylene–propylene-diene
W. Brostow (&) � T. Datashvili � J. Lou
Laboratory of Advanced Polymers & Optimized Materials
(LAPOM), Department of Materials Science and Engineering
and Department of Physics, University of North Texas,
1150 Union Circle # 305310, Denton, TX 76203-5017, USA
e-mail: [email protected]; [email protected]
URL: http://www.unt.edu/LAPOM/
T. Datashvili
e-mail: [email protected]
J. Lou
e-mail: [email protected]
J. Geodakyan
Scientific Research and Production Enterprise of Materials
Science, 17 Charents Street, 0025 Yerevan, Armenia
e-mail: [email protected]
123
J Mater Sci (2011) 46:2445–2455
DOI 10.1007/s10853-010-5091-2
rubber (EPDM) [24] filled with 5 wt% of a micro-scale
ceramic powder. We have avoided this way a large
increase in density—which would introduce an extra factor
affecting the properties. EPDM ? PP (50 wt% ? 50 wt%)
compounds were dynamically vulcanized by melt mixing
at 190 �C using dicumyl peroxide. To overcome the diffi-
culty of particles dispersion and adhesion to the matrix, the
filler was modified through grafting of a polymerizable
organic silane and a titanate onto surfaces of ceramic
powders via hydroxyl groups. Additionally, stearic acid
was used as a third agent for coating the surface of the
ceramic filler. The powders were mixed through vulcani-
zation with EPDM ? PP.
For comparison, thermal and mechanical properties of
unfilled thermoplastic vulcanizate (TPV) and TPV filled
with neat powder were also evaluated under identical test
conditions.
Experimental part
Materials
The thermal shock-resistant ceramic powder contains
corundum (a-Al2O3), mullite (3Al2O3�2SiO2), the eutectic
of both (a summary formula &2Al2O3SiO2), modified
b-spodumene (with negative thermal expansivity) and
stabilized aluminum titanate. The composite was prepared
by interaction of the minerals in the air atmosphere at
1550 �C temperature for 5 h. Subsequently wet pressing in
the presence of water ? ethanol was applied in a circular
type mill followed by drying. The material has density
q = 3.60 g cm-3, open porosity 0.46%, and total porosity
20.0%; the average volumetric thermal expansivity in the
large range from 20 to 700 �C is a = 2.5 � 10-6 K-1. The
material survives multiple thermal cycling up to at least
1400 �C. Some compositions of such powders have been
patented [25, 26].
The coupling agents, namely 3MPS (3-methacrylox-
ypropyltrimethoxysilane, SCA 989) and a titanate coupling
agent (neopentyl(diallyl)oxy-tri(dioctyl)phosphato titanate)
(Lica12) were received as gifts from Struktol Company of
America and Kenrich Petrochemicals, Inc., respectively.
EPDM pellets were received as a gift from Dow Chemical
Company. PP pellets were supplied by Huntsman Co.
Table 1 provides some information on the coupling agents.
Peroxide, ethanol, and stearic acid were from Sigma
Chemicals Co. The reagents were analytically pure and
were used as received. Table 1 lists some properties of the
coupling agents.
Characterization techniques
Differential scanning calorimetry (DSC)
Differential scanning calorimetry (DSC) measurements
were performed on a Perkin Elmer DSC-7 instrument. The
DSC technique has been well described by Menard [27],
Gedde [28], and Lucas et al. [29]. The temperature range
from 10 to 200 �C was covered under a nitrogen atmo-
sphere at 10 �C/min heating and cooling rates.
The melting temperatures, Tm, crystallization tempera-
tures, Tc, and enthalpies of fusion Hf were evaluated on the
basis of thermograms. Volumetric degree of the crystal-
linity, Xc, was calculated as
Xc½%� ¼ 100Hf=HfPP ð1Þ
where HPPf = 209 J/g is the enthalpy of fusion [30] of
100% crystalline PP.
Dynamic mechanical analysis (DMA)
This technique is also well described by Menard [27],
Gedde [28], and Lucas et al. [29]. The tests were carried
out using a DMA7e apparatus from Perkin Elmer Co.
Specimens were analyzed in rectangular form using a three
point bending fixture in the temperature T scan mode. The
frequency applied was 1.0 Hz. We have recorded the
storage (solid-like) modulus E0 and tan d as a function of
temperature
tand ¼ E00=E0 ð2Þ
Table 1 The coupling agents
Trade name Chemical description Chemical structure Boiling point/�C
SCA 989 3-Methacryloxypropyltrimethoxysilane H2C=C(CH3)CO2(CH2)3Si(OCH3)3) 255
Lica12 Neopentyl(diallyl)oxy,tri(dioctyl)phosphato titanate 71
Stearic acid Octadecanoic acid C18H36O2 383
2446 J Mater Sci (2011) 46:2445–2455
123
where E00 is the loss (liquid-like) modulus.
Thermal mechanical analysis (TMA)
This technique has also been discussed in the literature
quoted [27–29]. Samples were analyzed in the temperature
T scan mode using a DMA7e apparatus from Perkin Elmer
Co with a compression analysis kit. The experiments were
performed over the temperature range from -50 to
?100 �C at the heating rate of 10 �C/min. TMA experi-
ments provide values of linear isobaric expansivity (often
called thermal expansion coefficient) defined as
aL ¼ L�1 oL=oTð ÞP ð3Þ
where L is the length (actually height, the distance between
top and bottom parallel surfaces) of the sample, T is the
temperature, and P is the pressure. The volumetric isobaric
expansivity, a, is defined analogously but with the volume
V instead of L.
Thermogravimetric analysis (TGA)
A Perkin Elmer TG-7 instrument was used to determine a
temperature profile of the powder. 5.0 mg of each dried
sample were placed on a balance and heated over the
temperature range from ?50 to 600 �C in nitrogen atmo-
sphere at the heating rate of 10 �C/min.
Raman spectroscopy
Raman spectra of the samples were obtained in the 3000 to
150 cm-1 range with a Nicolet Almega XR Dispersive
Raman spectrometer. The 780 nm line laser was used as an
excitation source. The collecting exposure time, preview
exposure time, and sample exposure were 10.0, 0.5, and
10.0 s, respectively.
Environmental scanning electron microscopy
Micrographs of all samples were taken using a FEI Quanta
environmental scanning electronic microscope (ESEM). A
small fraction of the samples were cut and/or fractured in
liquid nitrogen, mounted each on a copper stub, and coated
with a thin layer of gold to avoid electrostatic charging
during examination.
Tensile testing
The static tensile behavior of the samples was determined
at room temperature (25 �C) with a MTS tester (model
QTEST/5). The tests performed in a controlled environ-
ment and aimed to determine primarily the strain at break
eb and the tensile modulus E. The cross-head speed was
100 mm/min; five specimens of each sample were tested
and average values are reported.
Characterization of ceramic composite
Ceramic particle shapes and sizes were studied by ESEM.
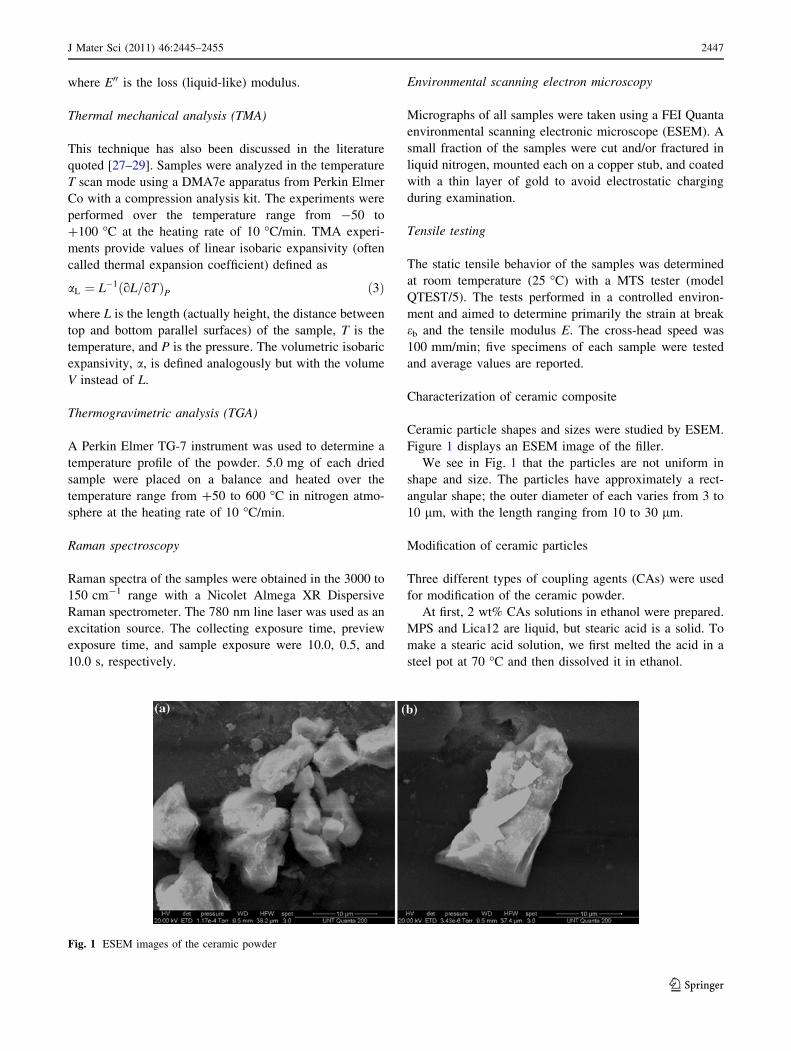
Figure 1 displays an ESEM image of the filler.
We see in Fig. 1 that the particles are not uniform in
shape and size. The particles have approximately a rect-
angular shape; the outer diameter of each varies from 3 to
10 lm, with the length ranging from 10 to 30 lm.
Modification of ceramic particles
Three different types of coupling agents (CAs) were used
for modification of the ceramic powder.
At first, 2 wt% CAs solutions in ethanol were prepared.
MPS and Lica12 are liquid, but stearic acid is a solid. To
make a stearic acid solution, we first melted the acid in a
steel pot at 70 �C and then dissolved it in ethanol.
Fig. 1 ESEM images of the ceramic powder
J Mater Sci (2011) 46:2445–2455 2447
123
The final reaction mixture contained powder with 2 wt%
CA alcohol solution in a 1:5 weight ratio. The solution was
added to powder slowly into a mixer with a constant stir-
ring rate at room temperature. The mixing was conducted
for 24 h at room temperature.
Afterwards, the powder was centrifuged and washed
with fresh alcohol to remove the excess CA absorbed on
the surfaces. Final products were dried at 40 �C under a
vacuum for 24 h.
Blending and sample preparation
The process of vulcanization was performed by melt
mixing in a C.W. Brabender D-52 Preparation Station.
EPDM was added first and softened at 160 �C with 60 rpm
speed for 2 min, followed by addition of PP. After 2 min of
mixing, 5 wt% of powder was added. Immediately after-
wards, 1 wt% of the curing agent was added, and tem-
perature and mixing speed were increased and kept for
2 min at 190 �C and 90 rpm. The amount of peroxide was
calculated on the basis of the EPDM ? PP weight.
Subsequently, the resulting samples were pelletized and
the blends were then molded in an AB-100 injection
molding machine (AB Machinery, Montreal, Quebec,
Canada) at 185 �C with an injection pressure of 830 kPa.
TGA and Raman spectroscopy of the ceramic powder
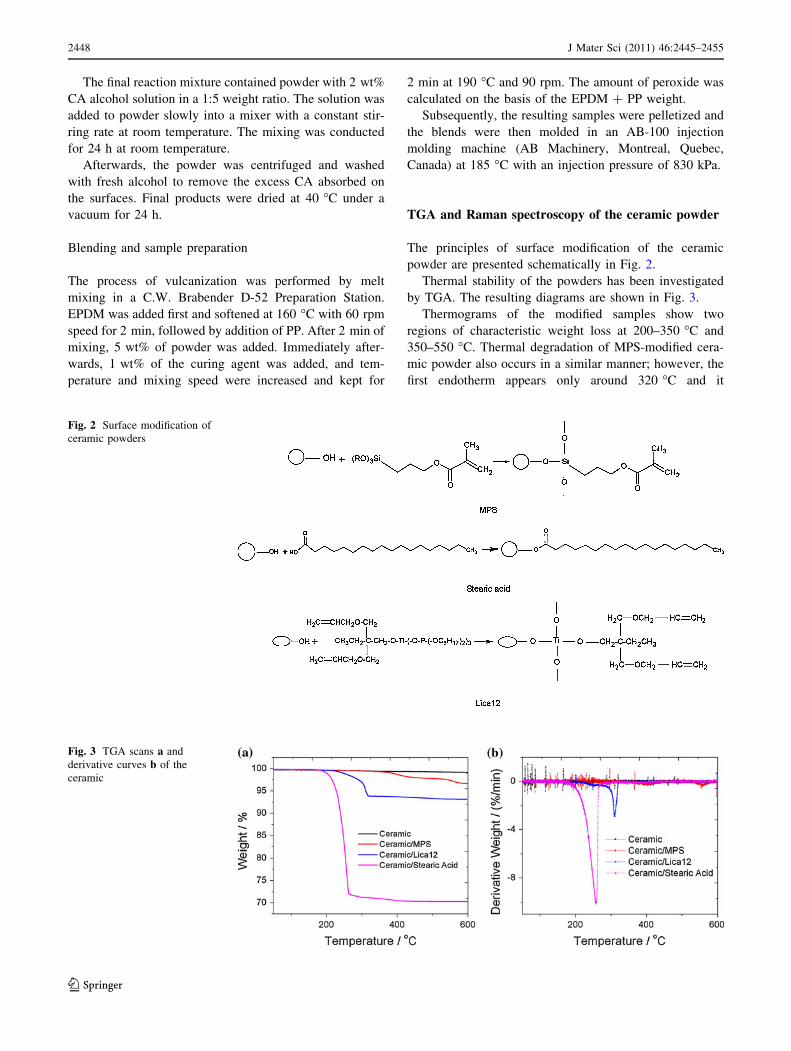
The principles of surface modification of the ceramic
powder are presented schematically in Fig. 2.
Thermal stability of the powders has been investigated
by TGA. The resulting diagrams are shown in Fig. 3.
Thermograms of the modified samples show two
regions of characteristic weight loss at 200–350 �C and
350–550 �C. Thermal degradation of MPS-modified cera-
mic powder also occurs in a similar manner; however, the
first endotherm appears only around 320 �C and it
Fig. 2 Surface modification of
ceramic powders
Fig. 3 TGA scans a and
derivative curves b of the
ceramic
2448 J Mater Sci (2011) 46:2445–2455
123
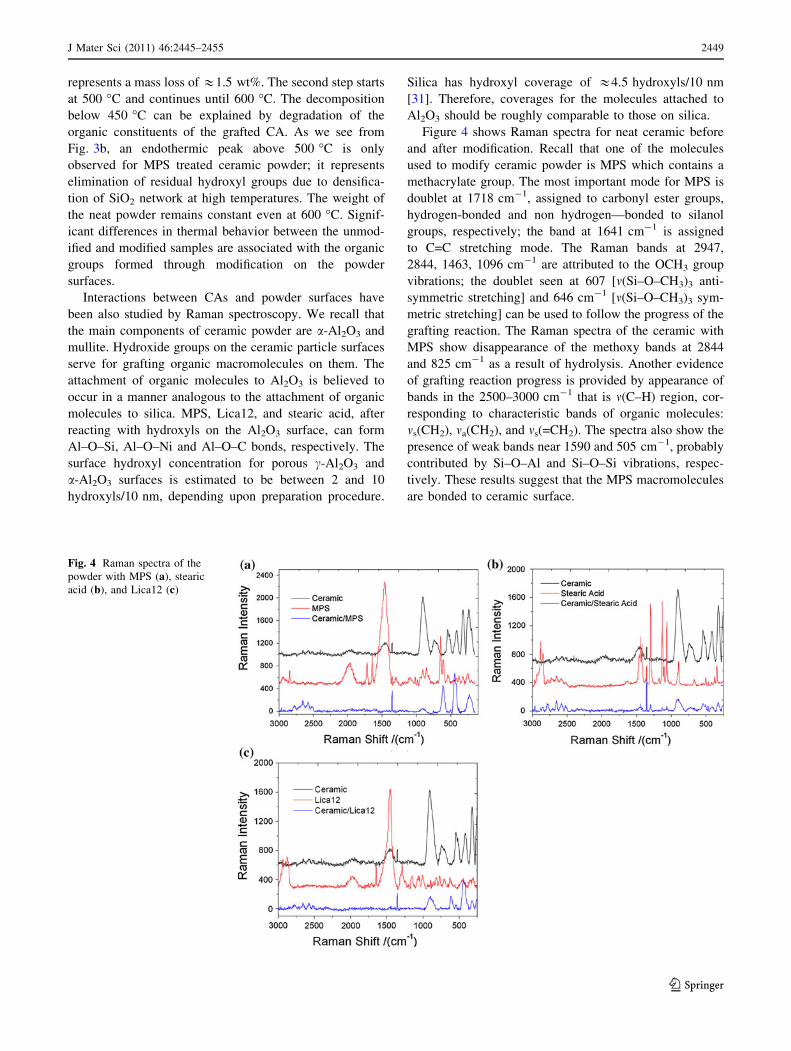
represents a mass loss of &1.5 wt%. The second step starts
at 500 �C and continues until 600 �C. The decomposition
below 450 �C can be explained by degradation of the
organic constituents of the grafted CA. As we see from
Fig. 3b, an endothermic peak above 500 �C is only
observed for MPS treated ceramic powder; it represents
elimination of residual hydroxyl groups due to densifica-
tion of SiO2 network at high temperatures. The weight of
the neat powder remains constant even at 600 �C. Signif-
icant differences in thermal behavior between the unmod-
ified and modified samples are associated with the organic
groups formed through modification on the powder
surfaces.
Interactions between CAs and powder surfaces have
been also studied by Raman spectroscopy. We recall that
the main components of ceramic powder are a-Al2O3 and
mullite. Hydroxide groups on the ceramic particle surfaces
serve for grafting organic macromolecules on them. The
attachment of organic molecules to Al2O3 is believed to
occur in a manner analogous to the attachment of organic
molecules to silica. MPS, Lica12, and stearic acid, after
reacting with hydroxyls on the Al2O3 surface, can form
Al–O–Si, Al–O–Ni and Al–O–C bonds, respectively. The
surface hydroxyl concentration for porous c-Al2O3 and
a-Al2O3 surfaces is estimated to be between 2 and 10
hydroxyls/10 nm, depending upon preparation procedure.
Silica has hydroxyl coverage of &4.5 hydroxyls/10 nm
[31]. Therefore, coverages for the molecules attached to
Al2O3 should be roughly comparable to those on silica.
Figure 4 shows Raman spectra for neat ceramic before
and after modification. Recall that one of the molecules
used to modify ceramic powder is MPS which contains a
methacrylate group. The most important mode for MPS is
doublet at 1718 cm-1, assigned to carbonyl ester groups,
hydrogen-bonded and non hydrogen—bonded to silanol
groups, respectively; the band at 1641 cm-1 is assigned
to C=C stretching mode. The Raman bands at 2947,
2844, 1463, 1096 cm-1 are attributed to the OCH3 group
vibrations; the doublet seen at 607 [m(Si–O–CH3)3 anti-
symmetric stretching] and 646 cm-1 [m(Si–O–CH3)3 sym-
metric stretching] can be used to follow the progress of the
grafting reaction. The Raman spectra of the ceramic with
MPS show disappearance of the methoxy bands at 2844
and 825 cm-1 as a result of hydrolysis. Another evidence
of grafting reaction progress is provided by appearance of
bands in the 2500–3000 cm-1 that is m(C–H) region, cor-
responding to characteristic bands of organic molecules:
ms(CH2), ma(CH2), and ms(=CH2). The spectra also show the
presence of weak bands near 1590 and 505 cm-1, probably
contributed by Si–O–Al and Si–O–Si vibrations, respec-
tively. These results suggest that the MPS macromolecules
are bonded to ceramic surface.
Fig. 4 Raman spectra of the
powder with MPS (a), stearic
acid (b), and Lica12 (c)
J Mater Sci (2011) 46:2445–2455 2449
123
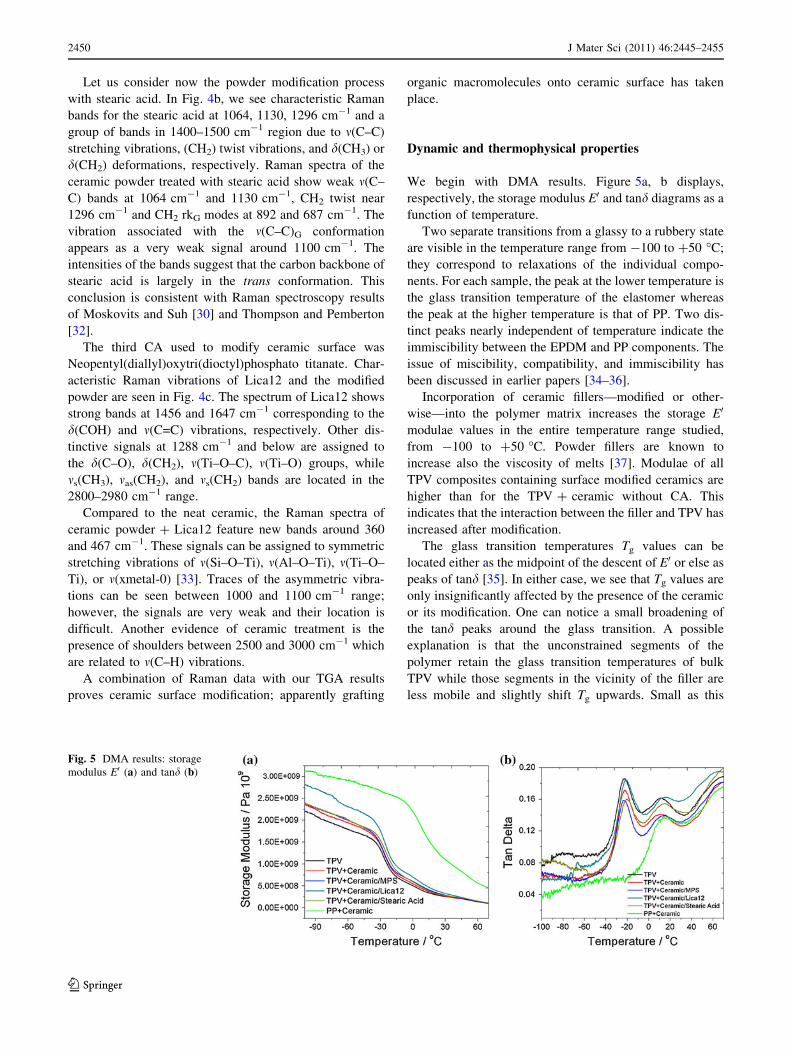
Let us consider now the powder modification process
with stearic acid. In Fig. 4b, we see characteristic Raman
bands for the stearic acid at 1064, 1130, 1296 cm-1 and a
group of bands in 1400–1500 cm-1 region due to m(C–C)
stretching vibrations, (CH2) twist vibrations, and d(CH3) or
d(CH2) deformations, respectively. Raman spectra of the
ceramic powder treated with stearic acid show weak m(C–
C) bands at 1064 cm-1 and 1130 cm-1, CH2 twist near
1296 cm-1 and CH2 rkG modes at 892 and 687 cm-1. The
vibration associated with the m(C–C)G conformation
appears as a very weak signal around 1100 cm-1. The
intensities of the bands suggest that the carbon backbone of
stearic acid is largely in the trans conformation. This
conclusion is consistent with Raman spectroscopy results
of Moskovits and Suh [30] and Thompson and Pemberton
[32].
The third CA used to modify ceramic surface was
Neopentyl(diallyl)oxytri(dioctyl)phosphato titanate. Char-
acteristic Raman vibrations of Lica12 and the modified
powder are seen in Fig. 4c. The spectrum of Lica12 shows
strong bands at 1456 and 1647 cm-1 corresponding to the
d(COH) and m(C=C) vibrations, respectively. Other dis-
tinctive signals at 1288 cm-1 and below are assigned to
the d(C–O), d(CH2), m(Ti–O–C), m(Ti–O) groups, while
ms(CH3), mas(CH2), and ms(CH2) bands are located in the
2800–2980 cm-1 range.
Compared to the neat ceramic, the Raman spectra of
ceramic powder ? Lica12 feature new bands around 360
and 467 cm-1. These signals can be assigned to symmetric
stretching vibrations of m(Si–O–Ti), m(Al–O–Ti), m(Ti–O–
Ti), or m(xmetal-0) [33]. Traces of the asymmetric vibra-
tions can be seen between 1000 and 1100 cm-1 range;
however, the signals are very weak and their location is
difficult. Another evidence of ceramic treatment is the
presence of shoulders between 2500 and 3000 cm-1 which
are related to m(C–H) vibrations.
A combination of Raman data with our TGA results
proves ceramic surface modification; apparently grafting
organic macromolecules onto ceramic surface has taken
place.
Dynamic and thermophysical properties
We begin with DMA results. Figure 5a, b displays,
respectively, the storage modulus E0 and tand diagrams as a
function of temperature.
Two separate transitions from a glassy to a rubbery state
are visible in the temperature range from -100 to ?50 �C;
they correspond to relaxations of the individual compo-
nents. For each sample, the peak at the lower temperature is
the glass transition temperature of the elastomer whereas
the peak at the higher temperature is that of PP. Two dis-
tinct peaks nearly independent of temperature indicate the
immiscibility between the EPDM and PP components. The
issue of miscibility, compatibility, and immiscibility has
been discussed in earlier papers [34–36].
Incorporation of ceramic fillers—modified or other-
wise—into the polymer matrix increases the storage E0
modulae values in the entire temperature range studied,
from -100 to ?50 �C. Powder fillers are known to
increase also the viscosity of melts [37]. Modulae of all
TPV composites containing surface modified ceramics are
higher than for the TPV ? ceramic without CA. This
indicates that the interaction between the filler and TPV has
increased after modification.
The glass transition temperatures Tg values can be
located either as the midpoint of the descent of E0 or else as
peaks of tand [35]. In either case, we see that Tg values are
only insignificantly affected by the presence of the ceramic
or its modification. One can notice a small broadening of
the tand peaks around the glass transition. A possible
explanation is that the unconstrained segments of the
polymer retain the glass transition temperatures of bulk
TPV while those segments in the vicinity of the filler are
less mobile and slightly shift Tg upwards. Small as this
Fig. 5 DMA results: storage
modulus E0 (a) and tand (b)
2450 J Mater Sci (2011) 46:2445–2455
123
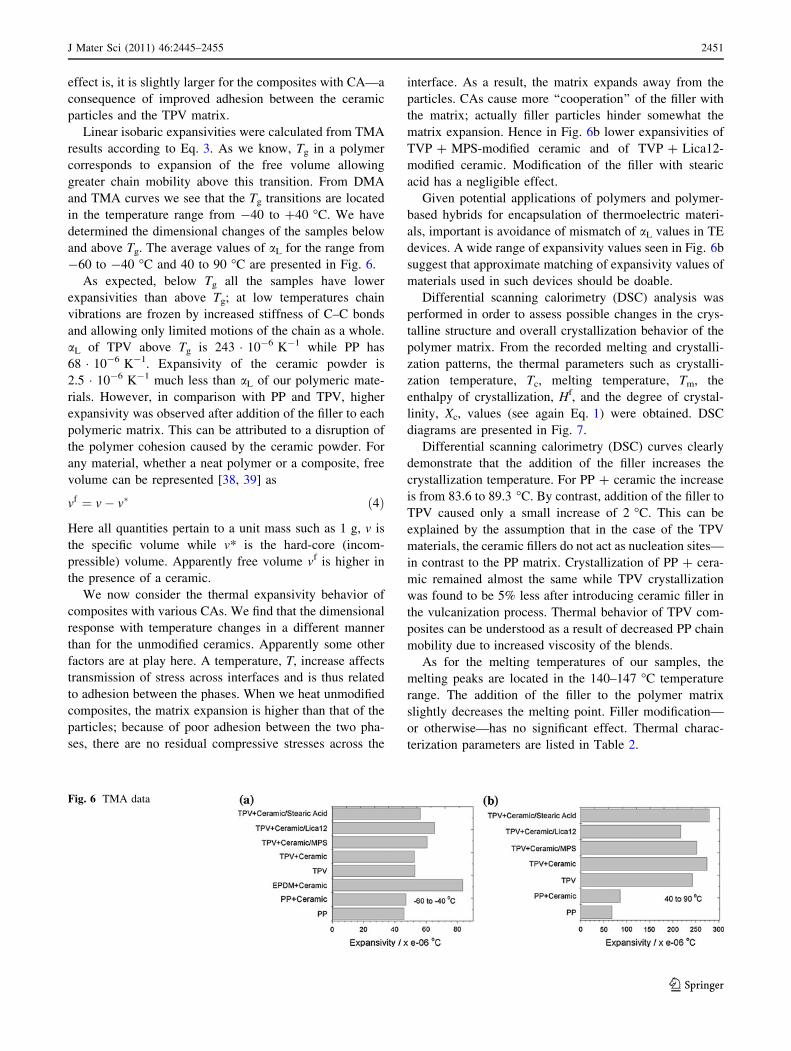
effect is, it is slightly larger for the composites with CA—a
consequence of improved adhesion between the ceramic
particles and the TPV matrix.
Linear isobaric expansivities were calculated from TMA
results according to Eq. 3. As we know, Tg in a polymer
corresponds to expansion of the free volume allowing
greater chain mobility above this transition. From DMA
and TMA curves we see that the Tg transitions are located
in the temperature range from -40 to ?40 �C. We have
determined the dimensional changes of the samples below
and above Tg. The average values of aL for the range from
-60 to -40 �C and 40 to 90 �C are presented in Fig. 6.
As expected, below Tg all the samples have lower
expansivities than above Tg; at low temperatures chain
vibrations are frozen by increased stiffness of C–C bonds
and allowing only limited motions of the chain as a whole.
aL of TPV above Tg is 243 � 10-6 K-1 while PP has
68 � 10-6 K-1. Expansivity of the ceramic powder is
2.5 � 10-6 K-1 much less than aL of our polymeric mate-
rials. However, in comparison with PP and TPV, higher
expansivity was observed after addition of the filler to each
polymeric matrix. This can be attributed to a disruption of
the polymer cohesion caused by the ceramic powder. For
any material, whether a neat polymer or a composite, free
volume can be represented [38, 39] as
vf ¼ v� v� ð4Þ
Here all quantities pertain to a unit mass such as 1 g, v is
the specific volume while v* is the hard-core (incom-
pressible) volume. Apparently free volume vf is higher in
the presence of a ceramic.
We now consider the thermal expansivity behavior of
composites with various CAs. We find that the dimensional
response with temperature changes in a different manner
than for the unmodified ceramics. Apparently some other
factors are at play here. A temperature, T, increase affects
transmission of stress across interfaces and is thus related
to adhesion between the phases. When we heat unmodified
composites, the matrix expansion is higher than that of the
particles; because of poor adhesion between the two pha-
ses, there are no residual compressive stresses across the
interface. As a result, the matrix expands away from the
particles. CAs cause more ‘‘cooperation’’ of the filler with
the matrix; actually filler particles hinder somewhat the
matrix expansion. Hence in Fig. 6b lower expansivities of
TVP ? MPS-modified ceramic and of TVP ? Lica12-
modified ceramic. Modification of the filler with stearic
acid has a negligible effect.
Given potential applications of polymers and polymer-
based hybrids for encapsulation of thermoelectric materi-
als, important is avoidance of mismatch of aL values in TE
devices. A wide range of expansivity values seen in Fig. 6b
suggest that approximate matching of expansivity values of
materials used in such devices should be doable.
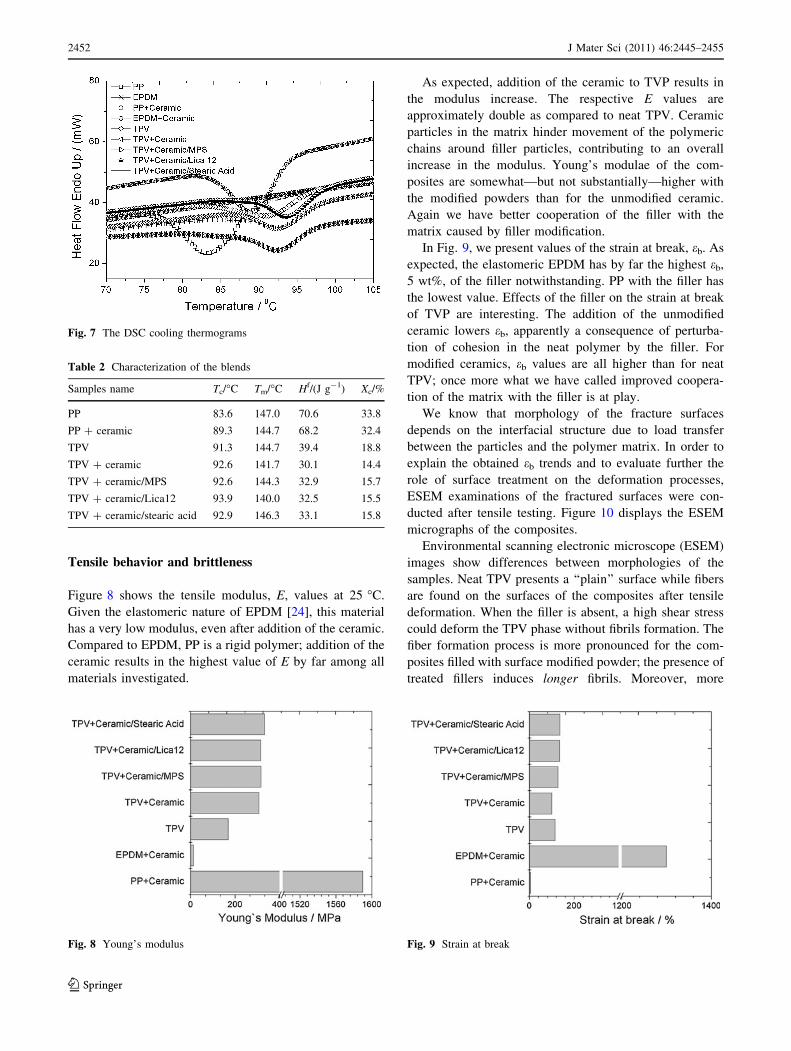
Differential scanning calorimetry (DSC) analysis was
performed in order to assess possible changes in the crys-
talline structure and overall crystallization behavior of the
polymer matrix. From the recorded melting and crystalli-
zation patterns, the thermal parameters such as crystalli-
zation temperature, Tc, melting temperature, Tm, the
enthalpy of crystallization, Hf, and the degree of crystal-
linity, Xc, values (see again Eq. 1) were obtained. DSC
diagrams are presented in Fig. 7.
Differential scanning calorimetry (DSC) curves clearly
demonstrate that the addition of the filler increases the
crystallization temperature. For PP ? ceramic the increase
is from 83.6 to 89.3 �C. By contrast, addition of the filler to
TPV caused only a small increase of 2 �C. This can be
explained by the assumption that in the case of the TPV
materials, the ceramic fillers do not act as nucleation sites—
in contrast to the PP matrix. Crystallization of PP ? cera-
mic remained almost the same while TPV crystallization
was found to be 5% less after introducing ceramic filler in
the vulcanization process. Thermal behavior of TPV com-
posites can be understood as a result of decreased PP chain
mobility due to increased viscosity of the blends.
As for the melting temperatures of our samples, the
melting peaks are located in the 140–147 �C temperature
range. The addition of the filler to the polymer matrix
slightly decreases the melting point. Filler modification—
or otherwise—has no significant effect. Thermal charac-
terization parameters are listed in Table 2.
Fig. 6 TMA data
J Mater Sci (2011) 46:2445–2455 2451
123
Tensile behavior and brittleness
Figure 8 shows the tensile modulus, E, values at 25 �C.
Given the elastomeric nature of EPDM [24], this material
has a very low modulus, even after addition of the ceramic.
Compared to EPDM, PP is a rigid polymer; addition of the
ceramic results in the highest value of E by far among all
materials investigated.
As expected, addition of the ceramic to TVP results in
the modulus increase. The respective E values are
approximately double as compared to neat TPV. Ceramic
particles in the matrix hinder movement of the polymeric
chains around filler particles, contributing to an overall
increase in the modulus. Young’s modulae of the com-
posites are somewhat—but not substantially—higher with
the modified powders than for the unmodified ceramic.
Again we have better cooperation of the filler with the
matrix caused by filler modification.
In Fig. 9, we present values of the strain at break, eb. As
expected, the elastomeric EPDM has by far the highest eb,
5 wt%, of the filler notwithstanding. PP with the filler has
the lowest value. Effects of the filler on the strain at break
of TVP are interesting. The addition of the unmodified
ceramic lowers eb, apparently a consequence of perturba-
tion of cohesion in the neat polymer by the filler. For
modified ceramics, eb values are all higher than for neat
TPV; once more what we have called improved coopera-
tion of the matrix with the filler is at play.
We know that morphology of the fracture surfaces
depends on the interfacial structure due to load transfer
between the particles and the polymer matrix. In order to
explain the obtained eb trends and to evaluate further the
role of surface treatment on the deformation processes,
ESEM examinations of the fractured surfaces were con-
ducted after tensile testing. Figure 10 displays the ESEM
micrographs of the composites.
Environmental scanning electronic microscope (ESEM)
images show differences between morphologies of the
samples. Neat TPV presents a ‘‘plain’’ surface while fibers
are found on the surfaces of the composites after tensile
deformation. When the filler is absent, a high shear stress
could deform the TPV phase without fibrils formation. The
fiber formation process is more pronounced for the com-
posites filled with surface modified powder; the presence of
treated fillers induces longer fibrils. Moreover, more
Fig. 7 The DSC cooling thermograms
Table 2 Characterization of the blends
Samples name Tc/�C Tm/�C Hf/(J g-1) Xc/%
PP 83.6 147.0 70.6 33.8
PP ? ceramic 89.3 144.7 68.2 32.4
TPV 91.3 144.7 39.4 18.8
TPV ? ceramic 92.6 141.7 30.1 14.4
TPV ? ceramic/MPS 92.6 144.3 32.9 15.7
TPV ? ceramic/Lica12 93.9 140.0 32.5 15.5
TPV ? ceramic/stearic acid 92.9 146.3 33.1 15.8
Fig. 8 Young’s modulus Fig. 9 Strain at break
2452 J Mater Sci (2011) 46:2445–2455
123
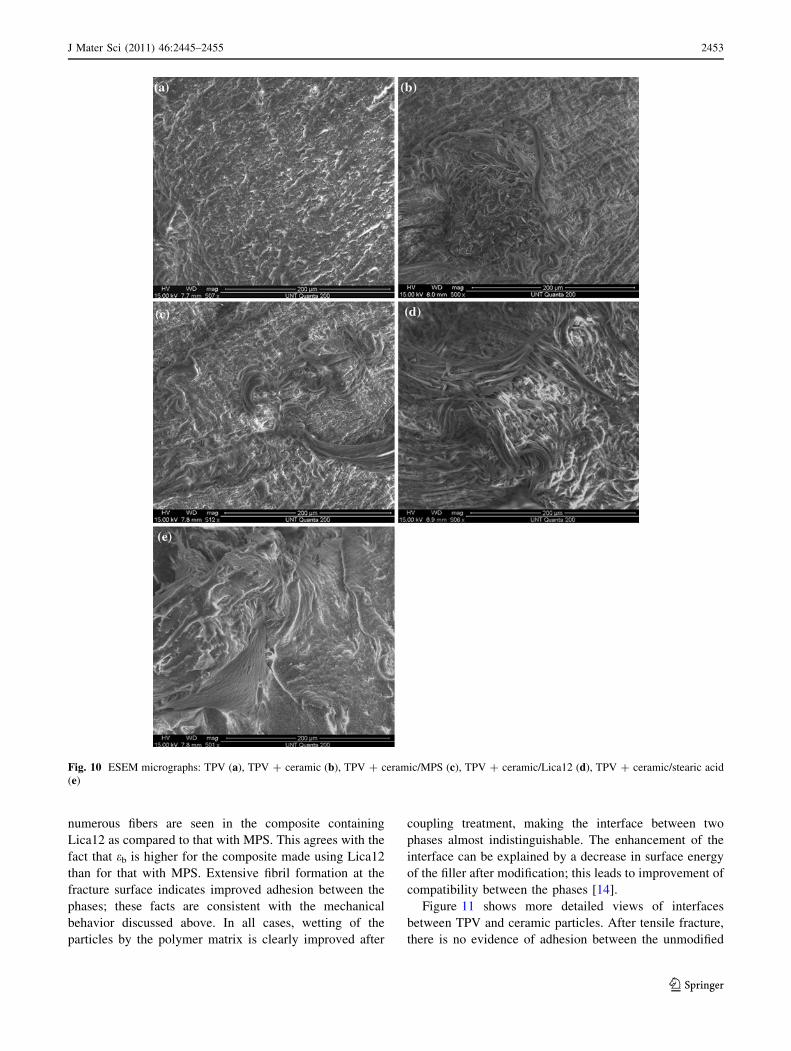
numerous fibers are seen in the composite containing
Lica12 as compared to that with MPS. This agrees with the
fact that eb is higher for the composite made using Lica12
than for that with MPS. Extensive fibril formation at the
fracture surface indicates improved adhesion between the
phases; these facts are consistent with the mechanical
behavior discussed above. In all cases, wetting of the
particles by the polymer matrix is clearly improved after
coupling treatment, making the interface between two
phases almost indistinguishable. The enhancement of the
interface can be explained by a decrease in surface energy
of the filler after modification; this leads to improvement of
compatibility between the phases [14].
Figure 11 shows more detailed views of interfaces
between TPV and ceramic particles. After tensile fracture,
there is no evidence of adhesion between the unmodified
Fig. 10 ESEM micrographs: TPV (a), TPV ? ceramic (b), TPV ? ceramic/MPS (c), TPV ? ceramic/Lica12 (d), TPV ? ceramic/stearic acid
(e)
J Mater Sci (2011) 46:2445–2455 2453
123
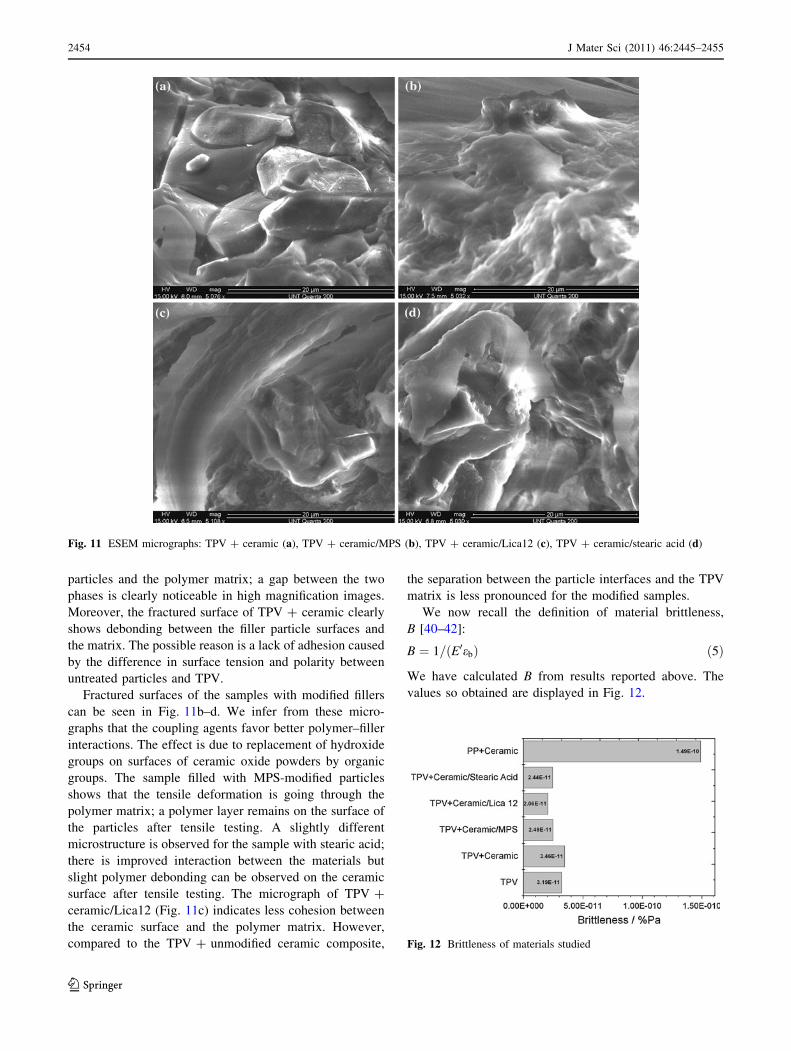
particles and the polymer matrix; a gap between the two
phases is clearly noticeable in high magnification images.
Moreover, the fractured surface of TPV ? ceramic clearly
shows debonding between the filler particle surfaces and
the matrix. The possible reason is a lack of adhesion caused
by the difference in surface tension and polarity between
untreated particles and TPV.
Fractured surfaces of the samples with modified fillers
can be seen in Fig. 11b–d. We infer from these micro-
graphs that the coupling agents favor better polymer–filler
interactions. The effect is due to replacement of hydroxide
groups on surfaces of ceramic oxide powders by organic
groups. The sample filled with MPS-modified particles
shows that the tensile deformation is going through the
polymer matrix; a polymer layer remains on the surface of
the particles after tensile testing. A slightly different
microstructure is observed for the sample with stearic acid;
there is improved interaction between the materials but
slight polymer debonding can be observed on the ceramic
surface after tensile testing. The micrograph of TPV ?
ceramic/Lica12 (Fig. 11c) indicates less cohesion between
the ceramic surface and the polymer matrix. However,
compared to the TPV ? unmodified ceramic composite,
the separation between the particle interfaces and the TPV
matrix is less pronounced for the modified samples.
We now recall the definition of material brittleness,
B [40–42]:
B ¼ 1= E0ebð Þ ð5Þ
We have calculated B from results reported above. The
values so obtained are displayed in Fig. 12.
Fig. 11 ESEM micrographs: TPV ? ceramic (a), TPV ? ceramic/MPS (b), TPV ? ceramic/Lica12 (c), TPV ? ceramic/stearic acid (d)
Fig. 12 Brittleness of materials studied
2454 J Mater Sci (2011) 46:2445–2455
123
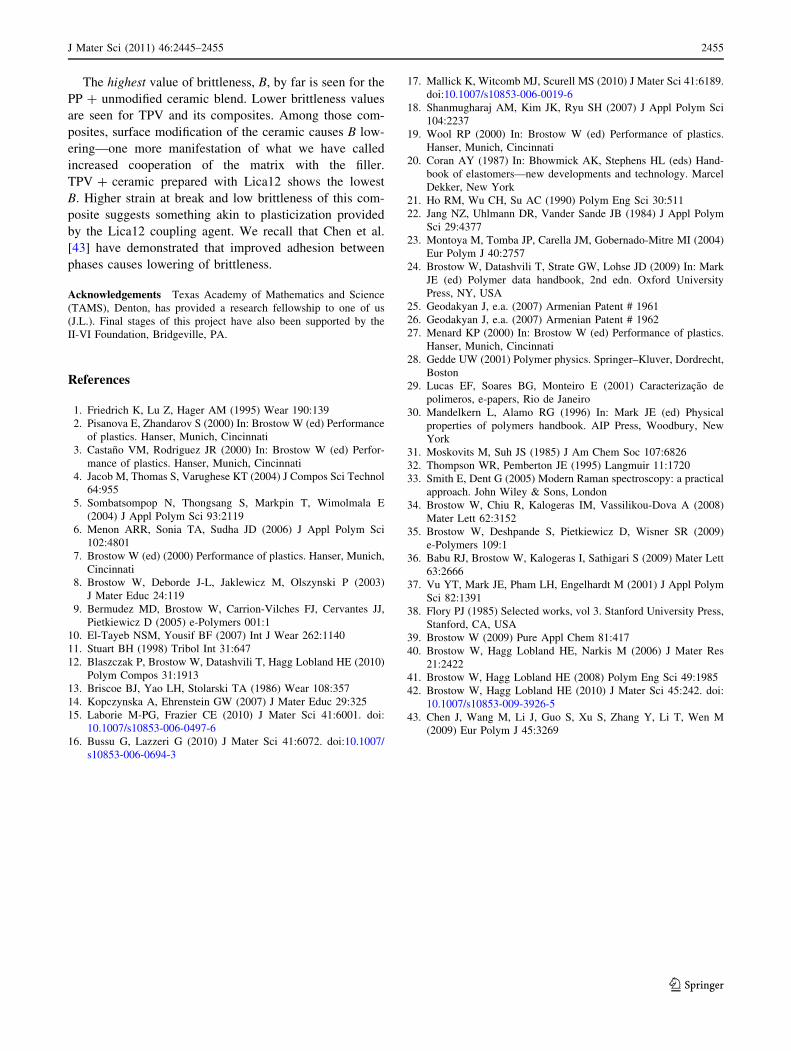
The highest value of brittleness, B, by far is seen for the
PP ? unmodified ceramic blend. Lower brittleness values
are seen for TPV and its composites. Among those com-
posites, surface modification of the ceramic causes B low-
ering—one more manifestation of what we have called
increased cooperation of the matrix with the filler.
TPV ? ceramic prepared with Lica12 shows the lowest
B. Higher strain at break and low brittleness of this com-
posite suggests something akin to plasticization provided
by the Lica12 coupling agent. We recall that Chen et al.
[43] have demonstrated that improved adhesion between
phases causes lowering of brittleness.
Acknowledgements Texas Academy of Mathematics and Science
(TAMS), Denton, has provided a research fellowship to one of us
(J.L.). Final stages of this project have also been supported by the
II-VI Foundation, Bridgeville, PA.
References
1. Friedrich K, Lu Z, Hager AM (1995) Wear 190:139
2. Pisanova E, Zhandarov S (2000) In: Brostow W (ed) Performance
of plastics. Hanser, Munich, Cincinnati
3. Castano VM, Rodriguez JR (2000) In: Brostow W (ed) Perfor-
mance of plastics. Hanser, Munich, Cincinnati
4. Jacob M, Thomas S, Varughese KT (2004) J Compos Sci Technol
64:955
5. Sombatsompop N, Thongsang S, Markpin T, Wimolmala E
(2004) J Appl Polym Sci 93:2119
6. Menon ARR, Sonia TA, Sudha JD (2006) J Appl Polym Sci
102:4801
7. Brostow W (ed) (2000) Performance of plastics. Hanser, Munich,
Cincinnati
8. Brostow W, Deborde J-L, Jaklewicz M, Olszynski P (2003)
J Mater Educ 24:119
9. Bermudez MD, Brostow W, Carrion-Vilches FJ, Cervantes JJ,
Pietkiewicz D (2005) e-Polymers 001:1
10. El-Tayeb NSM, Yousif BF (2007) Int J Wear 262:1140
11. Stuart BH (1998) Tribol Int 31:647
12. Blaszczak P, Brostow W, Datashvili T, Hagg Lobland HE (2010)
Polym Compos 31:1913
13. Briscoe BJ, Yao LH, Stolarski TA (1986) Wear 108:357
14. Kopczynska A, Ehrenstein GW (2007) J Mater Educ 29:325
15. Laborie M-PG, Frazier CE (2010) J Mater Sci 41:6001. doi:
10.1007/s10853-006-0497-6
16. Bussu G, Lazzeri G (2010) J Mater Sci 41:6072. doi:10.1007/
s10853-006-0694-3
17. Mallick K, Witcomb MJ, Scurell MS (2010) J Mater Sci 41:6189.
doi:10.1007/s10853-006-0019-6
18. Shanmugharaj AM, Kim JK, Ryu SH (2007) J Appl Polym Sci
104:2237
19. Wool RP (2000) In: Brostow W (ed) Performance of plastics.
Hanser, Munich, Cincinnati
20. Coran AY (1987) In: Bhowmick AK, Stephens HL (eds) Hand-
book of elastomers—new developments and technology. Marcel
Dekker, New York
21. Ho RM, Wu CH, Su AC (1990) Polym Eng Sci 30:511
22. Jang NZ, Uhlmann DR, Vander Sande JB (1984) J Appl Polym
Sci 29:4377
23. Montoya M, Tomba JP, Carella JM, Gobernado-Mitre MI (2004)
Eur Polym J 40:2757
24. Brostow W, Datashvili T, Strate GW, Lohse JD (2009) In: Mark
JE (ed) Polymer data handbook, 2nd edn. Oxford University
Press, NY, USA
25. Geodakyan J, e.a. (2007) Armenian Patent # 1961
26. Geodakyan J, e.a. (2007) Armenian Patent # 1962
27. Menard KP (2000) In: Brostow W (ed) Performance of plastics.
Hanser, Munich, Cincinnati
28. Gedde UW (2001) Polymer physics. Springer–Kluver, Dordrecht,
Boston
29. Lucas EF, Soares BG, Monteiro E (2001) Caracterizacao de
polimeros, e-papers, Rio de Janeiro
30. Mandelkern L, Alamo RG (1996) In: Mark JE (ed) Physical
properties of polymers handbook. AIP Press, Woodbury, New
York
31. Moskovits M, Suh JS (1985) J Am Chem Soc 107:6826
32. Thompson WR, Pemberton JE (1995) Langmuir 11:1720
33. Smith E, Dent G (2005) Modern Raman spectroscopy: a practical
approach. John Wiley & Sons, London
34. Brostow W, Chiu R, Kalogeras IM, Vassilikou-Dova A (2008)
Mater Lett 62:3152
35. Brostow W, Deshpande S, Pietkiewicz D, Wisner SR (2009)
e-Polymers 109:1
36. Babu RJ, Brostow W, Kalogeras I, Sathigari S (2009) Mater Lett
63:2666
37. Vu YT, Mark JE, Pham LH, Engelhardt M (2001) J Appl Polym
Sci 82:1391
38. Flory PJ (1985) Selected works, vol 3. Stanford University Press,
Stanford, CA, USA
39. Brostow W (2009) Pure Appl Chem 81:417
40. Brostow W, Hagg Lobland HE, Narkis M (2006) J Mater Res
21:2422
41. Brostow W, Hagg Lobland HE (2008) Polym Eng Sci 49:1985
42. Brostow W, Hagg Lobland HE (2010) J Mater Sci 45:242. doi:
10.1007/s10853-009-3926-5
43. Chen J, Wang M, Li J, Guo S, Xu S, Zhang Y, Li T, Wen M
(2009) Eur Polym J 45:3269
J Mater Sci (2011) 46:2445–2455 2455
123
Related Documents