See discussions, stats, and author profiles for this publication at: https://www.researchgate.net/publication/224217973 Thermal Analysis of Facial Muscles Contractions Article in IEEE Transactions on Affective Computing · July 2011 DOI: 10.1109/T-AFFC.2011.3 · Source: IEEE Xplore CITATIONS 19 READS 106 9 authors, including: Some of the authors of this publication are also working on these related projects: HEM- UniGe / vCool View project Didier Grandjean University of Geneva 158 PUBLICATIONS 4,535 CITATIONS SEE PROFILE Karim N'Diaye L'Institut du Cerveau et de la Moelle Épini… 37 PUBLICATIONS 1,079 CITATIONS SEE PROFILE Patrik Vuilleumier University of Geneva 335 PUBLICATIONS 17,989 CITATIONS SEE PROFILE Klaus Scherer University of Geneva 363 PUBLICATIONS 24,401 CITATIONS SEE PROFILE All content following this page was uploaded by Patrik Vuilleumier on 29 December 2013. The user has requested enhancement of the downloaded file. All in-text references underlined in blue are linked to publications on ResearchGate, letting you access and read them immediately.

Welcome message from author
This document is posted to help you gain knowledge. Please leave a comment to let me know what you think about it! Share it to your friends and learn new things together.
Transcript

Seediscussions,stats,andauthorprofilesforthispublicationat:https://www.researchgate.net/publication/224217973
ThermalAnalysisofFacialMusclesContractions
ArticleinIEEETransactionsonAffectiveComputing·July2011
DOI:10.1109/T-AFFC.2011.3·Source:IEEEXplore
CITATIONS
19
READS
106
9authors,including:
Someoftheauthorsofthispublicationarealsoworkingontheserelatedprojects:
HEM-UniGe/vCoolViewproject
DidierGrandjean
UniversityofGeneva
158PUBLICATIONS4,535CITATIONS
SEEPROFILE
KarimN'Diaye
L'InstitutduCerveauetdelaMoelleÉpini…
37PUBLICATIONS1,079CITATIONS
SEEPROFILE
PatrikVuilleumier
UniversityofGeneva
335PUBLICATIONS17,989CITATIONS
SEEPROFILE
KlausScherer
UniversityofGeneva
363PUBLICATIONS24,401CITATIONS
SEEPROFILE
AllcontentfollowingthispagewasuploadedbyPatrikVuilleumieron29December2013.
Theuserhasrequestedenhancementofthedownloadedfile.Allin-textreferencesunderlinedinbluearelinkedtopublicationsonResearchGate,lettingyouaccessandreadthemimmediately.
Thermal Analysisof Facial Muscles Contractions
Sophie Jarlier, Didier Grandjean, Sylvain Delplanque, Karim N’Diaye, Isabelle Cayeux,
Maria Ines Velazco, David Sander, Patrik Vuilleumier, and Klaus R. Scherer
Abstract—Facial expressions can be systematically coded using the Facial Action Coding System (FACS) that describes the specific
action unit (AU) or combination of AUs elicited during different kinds of expressions. This study investigated the thermal patterns
concomitant to specific action units performance. As thermal imaging can track dynamic patterns in facial temperature at any distance
(> 0:4 m), with high temporal (< 20 m) and thermal (< 20 mK@300 K) resolutions, this noninvasive technique was tested as a method
to assess fluctuations of facial heat patterns induced by facial muscles contractions. Four FACS-trained coders produced nine different
AUs or combination of AUs at various speeds and intensities. Using a spatial pattern approach based on PCA decomposition of the
thermal signal, we showed that thermal fluctuations are specific to the activated AUs and are sensitive to the kinetics and intensities of
AU production. These results open new avenues for studying patterns of facial muscle activity related to emotion or other cognitively
induced activities, in a noninvasive manner, avoiding potential lighting issues.
Index Terms—Facial expression, FACS, muscle contraction, thermography.
Ç
1 INTRODUCTION
FACIAL expressions are complex muscular patterns thatcarry complex social signals. A facial expression results
from one or more motions or positions of the muscles ofthe face. In order to study and analyze facial musclescontractions, researchers use techniques such as FacialAction Coding System (FACS) coding, video-taped imagesrecording, and electromyography (EMG).
Ekman et al. [1] have developed the most popular
standard system to classify the physical aspects of facial
expressions: the FACS. This system is based on the anatomy
of the facial muscles and is composed of action units (AUs)
that describe all visible facial movements at different
intensities. Since 1976, when the FACS system was first
developed, 7,000 different combinations of AUs have been
identified in a large number of facial expressions (44 AUsfor changes in facial expression and 12 AUs for changes ingaze direction and head orientation [2]). Nowadays, astandardized procedure exists (FACS Final Test) to trainresearchers who are interested in becoming FACS codersnot only to decode the precise AUs expressed by others, butalso to produce these AUs on demand. Although veryinformative, this process of coding each action unit in afacial expression is very time-consuming.
Several attempts have been made to automatize thecoding though. For instance, Lien et al. [3] used video-tapedimages under visible spectrum lighting to automaticallydetect, track, and classify the AUs implied in the expres-sions. Unfortunately, the influence of lighting on imagequality (contrast fluctuations or low light) limits this visible-spectrum imagery technique.
To circumvent this problem, researchers can directlyrecord the electrical activity of muscles that subtend the AUsby means of facial EMG, which measures muscle contraction(even the visually imperceptible). This technique is particu-larly sensitive to measure the kinetics and intensity of thatmuscular contraction [4]. However, EMG recording is notwithout drawbacks: 1) It can be difficult to record the preciseactivity of a specific muscle involved in a given AU becauseof the diffusion of electrical activity from one muscle toanother (i.e., cross-talk phenomenon); 2) electrodes must befixed on many areas of the face, a constraint that couldhamper natural muscular contraction; and 3) theoretically,there should be as many electrodes as there are differentmuscles related to the AUs. This last point constitutes asevere limitation for the use of EMG as a noninvasivemethod. However, to date no technique has been developedthat would allow the simultaneous recording of all facialmuscle activity, being sensitive to the intensity and thetemporal dynamics of the contractions, and without hinder-ing natural AU production or facing light problems.
2 IEEE TRANSACTIONS ON AFFECTIVE COMPUTING, VOL. 2, NO. 1, JANUARY-MARCH 2011
. S. Jarlier, S. Delplanque, and K.R. Scherer are with the Swiss Center forAffective Sciences (CISA), University of Geneva, 7 rue des Battoirs, 1205Geneva, Switzerland.E-mail: {sophie.jarlier, sylvain.delplanque, klaus.scherer}@unige.ch.
. D. Grandjean and D. Sander are with the Department of Psychology,University of Geneva, 40 bd du Pont d’Arve, 1205 Geneva, Switzerland.E-mail: {didier.grandjean, david.sander}@unige.ch.
. K. N’Diaye is with the Equipe Cogimage (ex-LENA CNRS UPR 640),CRICM—UPMC/INSERM UMR-S975/CNRS UMR7225, 47 bd del’Hopital, F-75651 Paris Cedex 13. E-mail: [email protected].
. I. Cayeux and M.I. Velazco are with the Firmenich SA—PO Box 239,Route des Jeunes 1, CH-1211 Geneva 8, Switzerland.E-mail: [email protected].
. P. Vuilleumier is with the Laboratory of Behavioral Neurology andImaging of Cognition (LabNIC), Department of Neuroscience/Physiology,University Medical Center (CMU), Bat. A, 7th floor, room 7008, 1 rueMichel-Servet, CH-1211 Geneva, Switzerland.E-mail: [email protected].
Manuscript received 16 Mar. 2010; revised 8 Sept. 2010; accepted 20 Dec.2010; published online 7 Feb. 2011.Recommended for acceptance by J. Cohn.For information on obtaining reprints of this article, please send e-mail to:[email protected], and reference IEEECS Log NumberTAFFC-2010-03-0019.Digital Object Identifier no. 10.1109/T-AFFC.2011.3.
1949-3045/11/$26.00 � 2011 IEEE Published by the IEEE Computer Society
Thermal imaging, which has recently been used indomains such as public services (e.g., security, firefighters,and military) and medical diagnosis, may be a promisingalternative for the investigation of AU production. A facialAU represents the contraction of a specific muscle or acombination of muscles, and research has demonstratedthat such muscle contraction induces an increase in skintemperature (e.g., [5]). For this reason, thermal imaginganalyses might be well suited to detect AU production.Moreover, in contrast to EMG recordings, this technique isnoninvasive (no electrodes on the face) and can record thewhole face activity at once. Furthermore, as demonstratedby studies on human breath tracking [6] and on vesselblood flow [7], thermal imaging techniques provide veryhigh temporal resolution, given appropriate image sam-pling rates. This latter characteristic is of particularrelevance where the dynamic of muscle contraction isconcerned. In sum, thermography could be used as anoninvasive method, and without the visible-spectrumillumination limitations, to detect the location, the intensity,and the speed of thermal changes related to musclecontractions. However, to date, no study has attempted tosystematically validate this technique to reveal facial heatmodulations related to AUs performance.
This study constitutes a first attempt to investigate thesuitability and the sensitivity of the thermal imagingtechnique to detect specific facial muscles’ heat patterns.The objective of this work was to examine whether specificAUs are associated with a specific activated heat pattern. Totest the specificity of the heat pattern produced, four trainedFACS coders were recorded while they voluntarily pro-duced different AUs. Moreover, to test whether thermalimaging is sensitive to both the intensity and the speed ofmuscle contraction, FACS coders were asked to activate thedifferent AUs at different intensities and speeds. Analyses ofthermal images followed the standard process [8] used infacial expression recognition: 1) location of the face in theimages and faces normalization, 2) facial features extraction,and 3) expression classification based on facial featuresmotion and/or appearance. Here, we used an analytical
procedure to extract the facial features from thermal images,i.e., the representative heat maps for each requested actionunit. In particular, a spatial pattern detection procedure(using a principal component analysis) was undertaken,allowing the detection of coherent heat changes in the facewithout any a priori assumption about the particular facialarea that would be activated.
2 METHOD
2.1 Participants (Coders)
Four trained and certified FACS coders (three women, allright handed, 28-51 years old) participated in our experi-ment as AUs coders.
2.2 Procedure
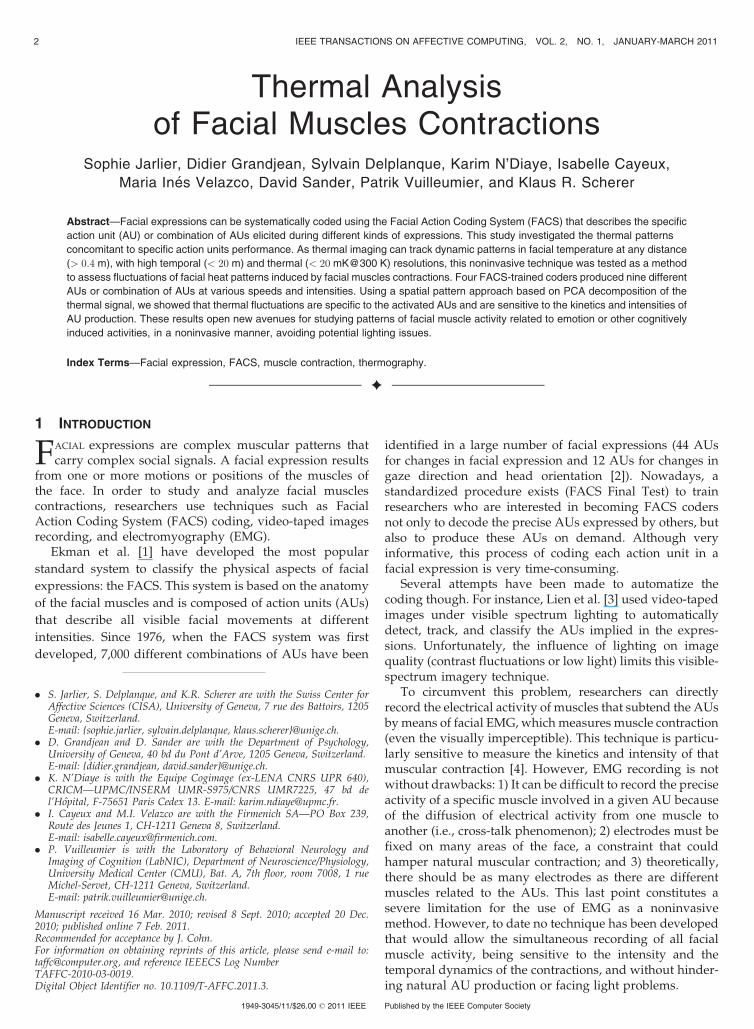
The coders were seated on a comfortable chair in a dimly litroom at a temperature between 20 and 23� C. Their headswere immobilized with a noninvasive head fixation systemmade for this purpose (head frame, Fig. 1). Participants wereasked not to use any makeup or facial products the day of theexperiment. In addition, they were asked not to eat or drinkhot substances and not to smoke during the hour precedingthe experiment. Their facial skin was washed with 70 percentalcohol to remove any interfering substances. The experimentwas then described and the participants rested for 15 min toacclimatize with the surrounding temperature.
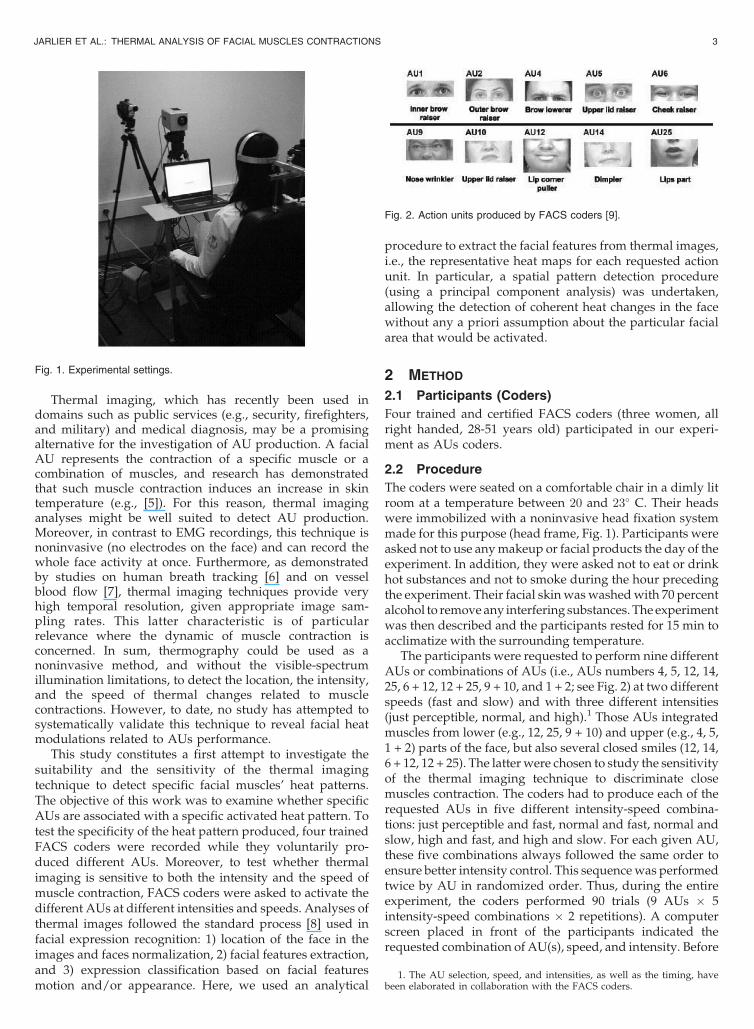
The participants were requested to perform nine differentAUs or combinations of AUs (i.e., AUs numbers 4, 5, 12, 14,25, 6 + 12, 12 + 25, 9 + 10, and 1 + 2; see Fig. 2) at two differentspeeds (fast and slow) and with three different intensities(just perceptible, normal, and high).1 Those AUs integratedmuscles from lower (e.g., 12, 25, 9 + 10) and upper (e.g., 4, 5,1 + 2) parts of the face, but also several closed smiles (12, 14,6 + 12, 12 + 25). The latter were chosen to study the sensitivityof the thermal imaging technique to discriminate closemuscles contraction. The coders had to produce each of therequested AUs in five different intensity-speed combina-tions: just perceptible and fast, normal and fast, normal andslow, high and fast, and high and slow. For each given AU,these five combinations always followed the same order toensure better intensity control. This sequence was performedtwice by AU in randomized order. Thus, during the entireexperiment, the coders performed 90 trials (9 AUs � 5intensity-speed combinations � 2 repetitions). A computerscreen placed in front of the participants indicated therequested combination of AU(s), speed, and intensity. Before
JARLIER ET AL.: THERMAL ANALYSIS OF FACIAL MUSCLES CONTRACTIONS 3
Fig. 1. Experimental settings.
1. The AU selection, speed, and intensities, as well as the timing, havebeen elaborated in collaboration with the FACS coders.
Fig. 2. Action units produced by FACS coders [9].
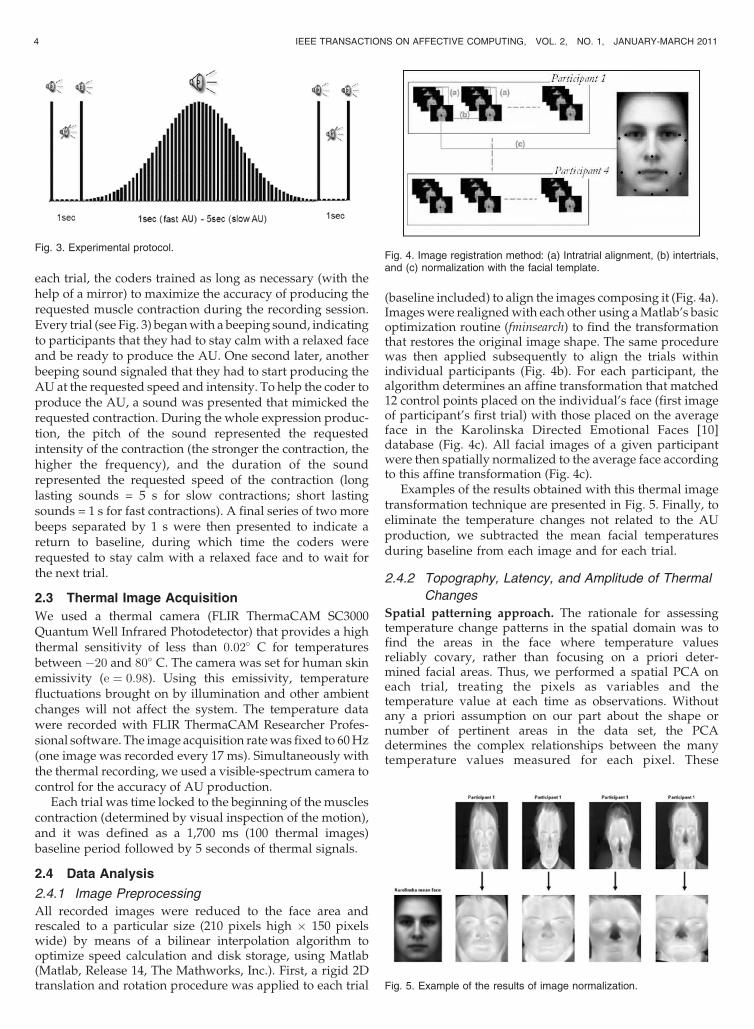
each trial, the coders trained as long as necessary (with thehelp of a mirror) to maximize the accuracy of producing therequested muscle contraction during the recording session.Every trial (see Fig. 3) began with a beeping sound, indicatingto participants that they had to stay calm with a relaxed faceand be ready to produce the AU. One second later, anotherbeeping sound signaled that they had to start producing theAU at the requested speed and intensity. To help the coder toproduce the AU, a sound was presented that mimicked therequested contraction. During the whole expression produc-tion, the pitch of the sound represented the requestedintensity of the contraction (the stronger the contraction, thehigher the frequency), and the duration of the soundrepresented the requested speed of the contraction (longlasting sounds = 5 s for slow contractions; short lastingsounds = 1 s for fast contractions). A final series of two morebeeps separated by 1 s were then presented to indicate areturn to baseline, during which time the coders wererequested to stay calm with a relaxed face and to wait forthe next trial.
2.3 Thermal Image Acquisition
We used a thermal camera (FLIR ThermaCAM SC3000Quantum Well Infrared Photodetector) that provides a highthermal sensitivity of less than 0:02� C for temperaturesbetween �20 and 80� C. The camera was set for human skinemissivity (e ¼ 0:98). Using this emissivity, temperaturefluctuations brought on by illumination and other ambientchanges will not affect the system. The temperature datawere recorded with FLIR ThermaCAM Researcher Profes-sional software. The image acquisition rate was fixed to 60 Hz(one image was recorded every 17 ms). Simultaneously withthe thermal recording, we used a visible-spectrum camera tocontrol for the accuracy of AU production.
Each trial was time locked to the beginning of the musclescontraction (determined by visual inspection of the motion),and it was defined as a 1,700 ms (100 thermal images)baseline period followed by 5 seconds of thermal signals.
2.4 Data Analysis
2.4.1 Image Preprocessing
All recorded images were reduced to the face area andrescaled to a particular size (210 pixels high � 150 pixelswide) by means of a bilinear interpolation algorithm tooptimize speed calculation and disk storage, using Matlab(Matlab, Release 14, The Mathworks, Inc.). First, a rigid 2Dtranslation and rotation procedure was applied to each trial
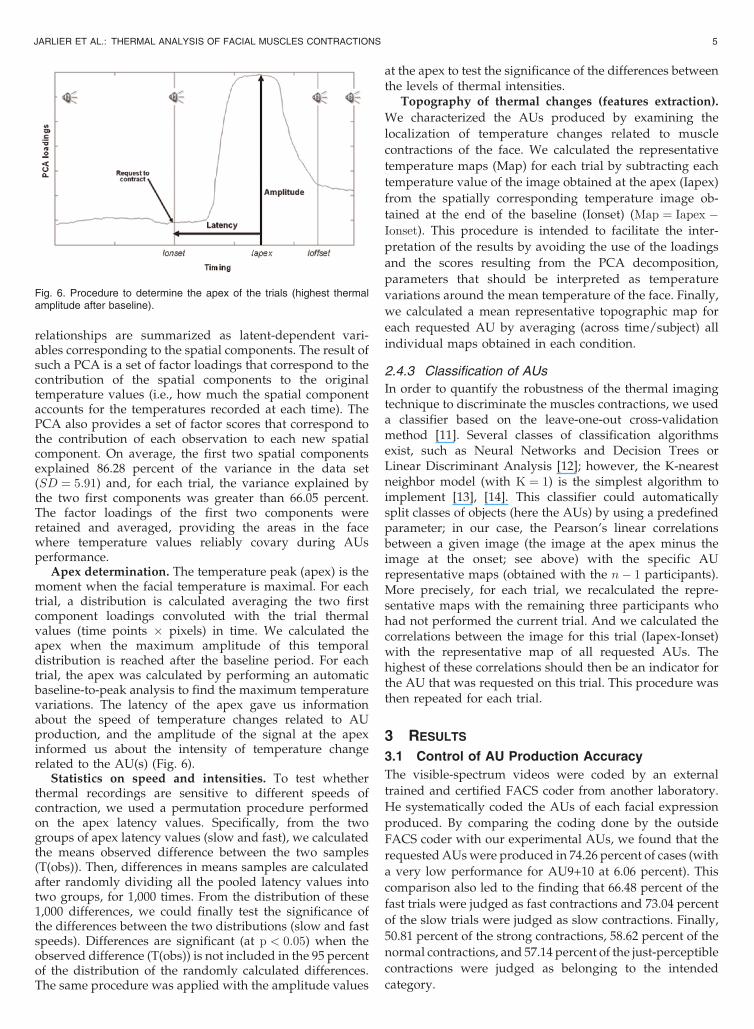
(baseline included) to align the images composing it (Fig. 4a).Images were realigned with each other using a Matlab’s basicoptimization routine (fminsearch) to find the transformationthat restores the original image shape. The same procedurewas then applied subsequently to align the trials withinindividual participants (Fig. 4b). For each participant, thealgorithm determines an affine transformation that matched12 control points placed on the individual’s face (first imageof participant’s first trial) with those placed on the averageface in the Karolinska Directed Emotional Faces [10]database (Fig. 4c). All facial images of a given participantwere then spatially normalized to the average face accordingto this affine transformation (Fig. 4c).
Examples of the results obtained with this thermal imagetransformation technique are presented in Fig. 5. Finally, toeliminate the temperature changes not related to the AUproduction, we subtracted the mean facial temperaturesduring baseline from each image and for each trial.
2.4.2 Topography, Latency, and Amplitude of Thermal
Changes
Spatial patterning approach. The rationale for assessingtemperature change patterns in the spatial domain was tofind the areas in the face where temperature valuesreliably covary, rather than focusing on a priori deter-mined facial areas. Thus, we performed a spatial PCA oneach trial, treating the pixels as variables and thetemperature value at each time as observations. Withoutany a priori assumption on our part about the shape ornumber of pertinent areas in the data set, the PCAdetermines the complex relationships between the manytemperature values measured for each pixel. These
4 IEEE TRANSACTIONS ON AFFECTIVE COMPUTING, VOL. 2, NO. 1, JANUARY-MARCH 2011
Fig. 3. Experimental protocol.Fig. 4. Image registration method: (a) Intratrial alignment, (b) intertrials,and (c) normalization with the facial template.
Fig. 5. Example of the results of image normalization.
relationships are summarized as latent-dependent vari-ables corresponding to the spatial components. The result ofsuch a PCA is a set of factor loadings that correspond to thecontribution of the spatial components to the originaltemperature values (i.e., how much the spatial componentaccounts for the temperatures recorded at each time). ThePCA also provides a set of factor scores that correspond tothe contribution of each observation to each new spatialcomponent. On average, the first two spatial componentsexplained 86.28 percent of the variance in the data set(SD ¼ 5:91) and, for each trial, the variance explained bythe two first components was greater than 66.05 percent.The factor loadings of the first two components wereretained and averaged, providing the areas in the facewhere temperature values reliably covary during AUsperformance.
Apex determination. The temperature peak (apex) is themoment when the facial temperature is maximal. For eachtrial, a distribution is calculated averaging the two firstcomponent loadings convoluted with the trial thermalvalues (time points � pixels) in time. We calculated theapex when the maximum amplitude of this temporaldistribution is reached after the baseline period. For eachtrial, the apex was calculated by performing an automaticbaseline-to-peak analysis to find the maximum temperaturevariations. The latency of the apex gave us informationabout the speed of temperature changes related to AUproduction, and the amplitude of the signal at the apexinformed us about the intensity of temperature changerelated to the AU(s) (Fig. 6).
Statistics on speed and intensities. To test whetherthermal recordings are sensitive to different speeds ofcontraction, we used a permutation procedure performedon the apex latency values. Specifically, from the twogroups of apex latency values (slow and fast), we calculatedthe means observed difference between the two samples(T(obs)). Then, differences in means samples are calculatedafter randomly dividing all the pooled latency values intotwo groups, for 1,000 times. From the distribution of these1,000 differences, we could finally test the significance ofthe differences between the two distributions (slow and fastspeeds). Differences are significant (at p < 0:05) when theobserved difference (T(obs)) is not included in the 95 percentof the distribution of the randomly calculated differences.The same procedure was applied with the amplitude values
at the apex to test the significance of the differences betweenthe levels of thermal intensities.
Topography of thermal changes (features extraction).
We characterized the AUs produced by examining the
localization of temperature changes related to muscle
contractions of the face. We calculated the representative
temperature maps (Map) for each trial by subtracting each
temperature value of the image obtained at the apex (Iapex)
from the spatially corresponding temperature image ob-
tained at the end of the baseline (Ionset) (Map ¼ Iapex �Ionset). This procedure is intended to facilitate the inter-
pretation of the results by avoiding the use of the loadings
and the scores resulting from the PCA decomposition,
parameters that should be interpreted as temperature
variations around the mean temperature of the face. Finally,
we calculated a mean representative topographic map for
each requested AU by averaging (across time/subject) all
individual maps obtained in each condition.
2.4.3 Classification of AUs
In order to quantify the robustness of the thermal imagingtechnique to discriminate the muscles contractions, we useda classifier based on the leave-one-out cross-validationmethod [11]. Several classes of classification algorithmsexist, such as Neural Networks and Decision Trees orLinear Discriminant Analysis [12]; however, the K-nearestneighbor model (with K ¼ 1) is the simplest algorithm toimplement [13], [14]. This classifier could automaticallysplit classes of objects (here the AUs) by using a predefinedparameter; in our case, the Pearson’s linear correlationsbetween a given image (the image at the apex minus theimage at the onset; see above) with the specific AUrepresentative maps (obtained with the n� 1 participants).More precisely, for each trial, we recalculated the repre-sentative maps with the remaining three participants whohad not performed the current trial. And we calculated thecorrelations between the image for this trial (Iapex-Ionset)with the representative map of all requested AUs. Thehighest of these correlations should then be an indicator forthe AU that was requested on this trial. This procedure wasthen repeated for each trial.
3 RESULTS
3.1 Control of AU Production Accuracy
The visible-spectrum videos were coded by an external
trained and certified FACS coder from another laboratory.
He systematically coded the AUs of each facial expression
produced. By comparing the coding done by the outside
FACS coder with our experimental AUs, we found that the
requested AUs were produced in 74.26 percent of cases (with
a very low performance for AU9+10 at 6.06 percent). This
comparison also led to the finding that 66.48 percent of the
fast trials were judged as fast contractions and 73.04 percent
of the slow trials were judged as slow contractions. Finally,
50.81 percent of the strong contractions, 58.62 percent of the
normal contractions, and 57.14 percent of the just-perceptible
contractions were judged as belonging to the intended
category.
JARLIER ET AL.: THERMAL ANALYSIS OF FACIAL MUSCLES CONTRACTIONS 5
Fig. 6. Procedure to determine the apex of the trials (highest thermalamplitude after baseline).
3.2 Sensitivity to Speed
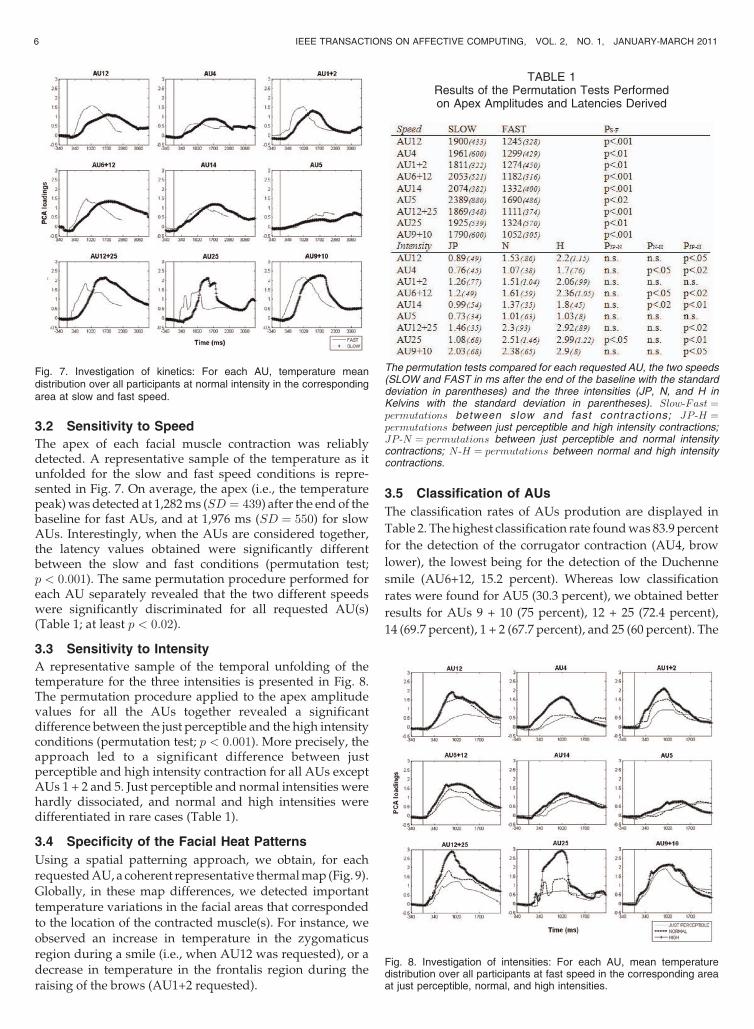
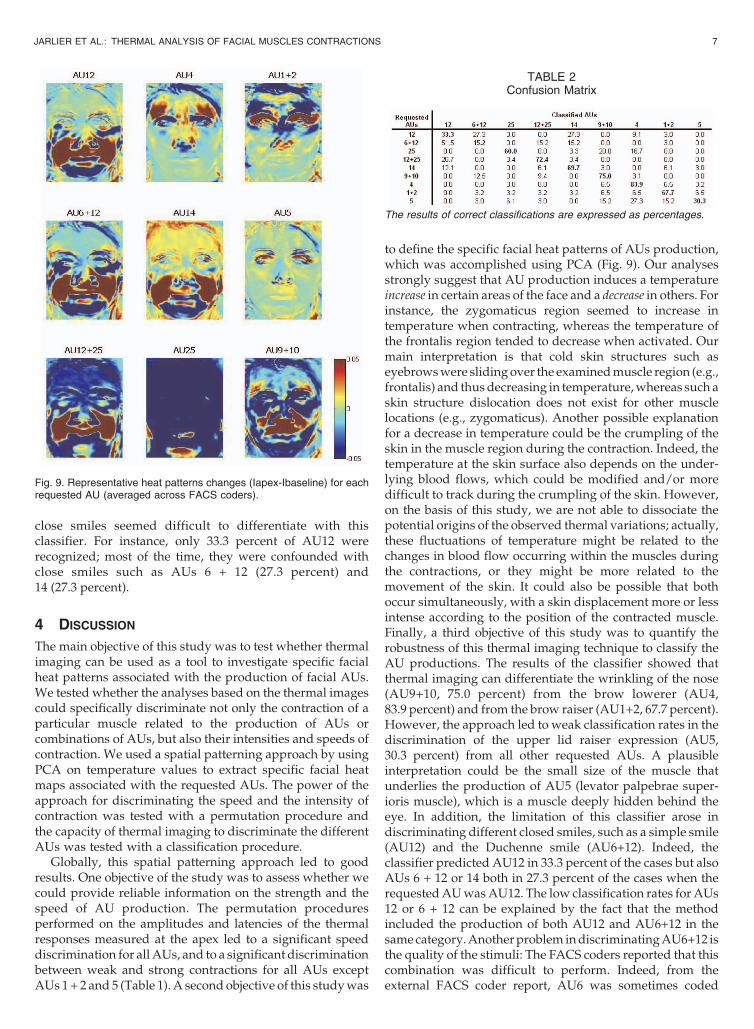
The apex of each facial muscle contraction was reliablydetected. A representative sample of the temperature as itunfolded for the slow and fast speed conditions is repre-sented in Fig. 7. On average, the apex (i.e., the temperaturepeak) was detected at 1,282 ms (SD ¼ 439) after the end of thebaseline for fast AUs, and at 1,976 ms (SD ¼ 550) for slowAUs. Interestingly, when the AUs are considered together,the latency values obtained were significantly differentbetween the slow and fast conditions (permutation test;p < 0:001). The same permutation procedure performed foreach AU separately revealed that the two different speedswere significantly discriminated for all requested AU(s)(Table 1; at least p < 0:02).
3.3 Sensitivity to Intensity
A representative sample of the temporal unfolding of thetemperature for the three intensities is presented in Fig. 8.The permutation procedure applied to the apex amplitudevalues for all the AUs together revealed a significantdifference between the just perceptible and the high intensityconditions (permutation test; p < 0:001). More precisely, theapproach led to a significant difference between justperceptible and high intensity contraction for all AUs exceptAUs 1 + 2 and 5. Just perceptible and normal intensities werehardly dissociated, and normal and high intensities weredifferentiated in rare cases (Table 1).
3.4 Specificity of the Facial Heat Patterns
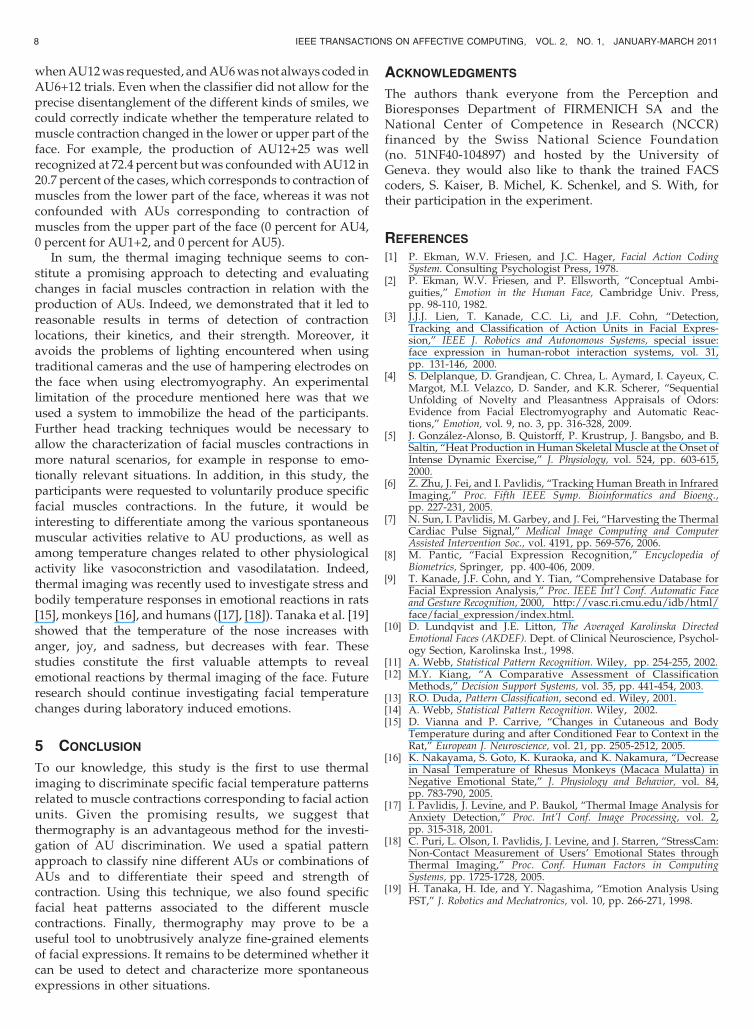
Using a spatial patterning approach, we obtain, for eachrequested AU, a coherent representative thermal map (Fig. 9).Globally, in these map differences, we detected importanttemperature variations in the facial areas that correspondedto the location of the contracted muscle(s). For instance, weobserved an increase in temperature in the zygomaticusregion during a smile (i.e., when AU12 was requested), or adecrease in temperature in the frontalis region during theraising of the brows (AU1+2 requested).
3.5 Classification of AUs
The classification rates of AUs prodution are displayed in
Table 2. The highest classification rate found was 83.9 percent
for the detection of the corrugator contraction (AU4, brow
lower), the lowest being for the detection of the Duchenne
smile (AU6+12, 15.2 percent). Whereas low classification
rates were found for AU5 (30.3 percent), we obtained better
results for AUs 9 + 10 (75 percent), 12 + 25 (72.4 percent),
14 (69.7 percent), 1 + 2 (67.7 percent), and 25 (60 percent). The
6 IEEE TRANSACTIONS ON AFFECTIVE COMPUTING, VOL. 2, NO. 1, JANUARY-MARCH 2011
TABLE 1Results of the Permutation Tests Performedon Apex Amplitudes and Latencies Derived
The permutation tests compared for each requested AU, the two speeds(SLOW and FAST in ms after the end of the baseline with the standarddeviation in parentheses) and the three intensities (JP, N, and H inKelvins with the standard deviation in parentheses). Slow-Fast ¼permutations between slow and fast contractions; JP -H ¼permutations between just perceptible and high intensity contractions;JP -N ¼ permutations between just perceptible and normal intensitycontractions; N-H ¼ permutations between normal and high intensitycontractions.
Fig. 7. Investigation of kinetics: For each AU, temperature meandistribution over all participants at normal intensity in the correspondingarea at slow and fast speed.
Fig. 8. Investigation of intensities: For each AU, mean temperaturedistribution over all participants at fast speed in the corresponding areaat just perceptible, normal, and high intensities.
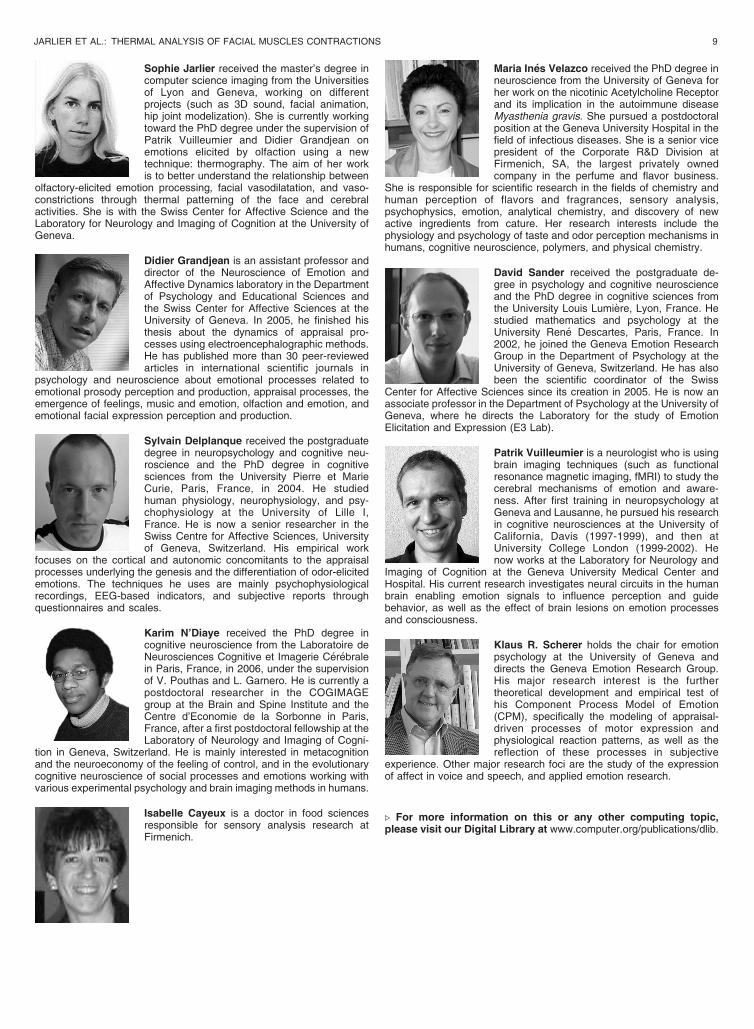
close smiles seemed difficult to differentiate with thisclassifier. For instance, only 33.3 percent of AU12 wererecognized; most of the time, they were confounded withclose smiles such as AUs 6 + 12 (27.3 percent) and14 (27.3 percent).
4 DISCUSSION
The main objective of this study was to test whether thermalimaging can be used as a tool to investigate specific facialheat patterns associated with the production of facial AUs.We tested whether the analyses based on the thermal imagescould specifically discriminate not only the contraction of aparticular muscle related to the production of AUs orcombinations of AUs, but also their intensities and speeds ofcontraction. We used a spatial patterning approach by usingPCA on temperature values to extract specific facial heatmaps associated with the requested AUs. The power of theapproach for discriminating the speed and the intensity ofcontraction was tested with a permutation procedure andthe capacity of thermal imaging to discriminate the differentAUs was tested with a classification procedure.
Globally, this spatial patterning approach led to goodresults. One objective of the study was to assess whether wecould provide reliable information on the strength and thespeed of AU production. The permutation proceduresperformed on the amplitudes and latencies of the thermalresponses measured at the apex led to a significant speeddiscrimination for all AUs, and to a significant discriminationbetween weak and strong contractions for all AUs exceptAUs 1 + 2 and 5 (Table 1). A second objective of this study was
to define the specific facial heat patterns of AUs production,which was accomplished using PCA (Fig. 9). Our analysesstrongly suggest that AU production induces a temperatureincrease in certain areas of the face and a decrease in others. Forinstance, the zygomaticus region seemed to increase intemperature when contracting, whereas the temperature ofthe frontalis region tended to decrease when activated. Ourmain interpretation is that cold skin structures such aseyebrows were sliding over the examined muscle region (e.g.,frontalis) and thus decreasing in temperature, whereas such askin structure dislocation does not exist for other musclelocations (e.g., zygomaticus). Another possible explanationfor a decrease in temperature could be the crumpling of theskin in the muscle region during the contraction. Indeed, thetemperature at the skin surface also depends on the under-lying blood flows, which could be modified and/or moredifficult to track during the crumpling of the skin. However,on the basis of this study, we are not able to dissociate thepotential origins of the observed thermal variations; actually,these fluctuations of temperature might be related to thechanges in blood flow occurring within the muscles duringthe contractions, or they might be more related to themovement of the skin. It could also be possible that bothoccur simultaneously, with a skin displacement more or lessintense according to the position of the contracted muscle.Finally, a third objective of this study was to quantify therobustness of this thermal imaging technique to classify theAU productions. The results of the classifier showed thatthermal imaging can differentiate the wrinkling of the nose(AU9+10, 75.0 percent) from the brow lowerer (AU4,83.9 percent) and from the brow raiser (AU1+2, 67.7 percent).However, the approach led to weak classification rates in thediscrimination of the upper lid raiser expression (AU5,30.3 percent) from all other requested AUs. A plausibleinterpretation could be the small size of the muscle thatunderlies the production of AU5 (levator palpebrae super-ioris muscle), which is a muscle deeply hidden behind theeye. In addition, the limitation of this classifier arose indiscriminating different closed smiles, such as a simple smile(AU12) and the Duchenne smile (AU6+12). Indeed, theclassifier predicted AU12 in 33.3 percent of the cases but alsoAUs 6 + 12 or 14 both in 27.3 percent of the cases when therequested AU was AU12. The low classification rates for AUs12 or 6 + 12 can be explained by the fact that the methodincluded the production of both AU12 and AU6+12 in thesame category. Another problem in discriminating AU6+12 isthe quality of the stimuli: The FACS coders reported that thiscombination was difficult to perform. Indeed, from theexternal FACS coder report, AU6 was sometimes coded
JARLIER ET AL.: THERMAL ANALYSIS OF FACIAL MUSCLES CONTRACTIONS 7
TABLE 2Confusion Matrix
The results of correct classifications are expressed as percentages.
Fig. 9. Representative heat patterns changes (Iapex-Ibaseline) for eachrequested AU (averaged across FACS coders).
when AU12 was requested, and AU6 was not always coded inAU6+12 trials. Even when the classifier did not allow for theprecise disentanglement of the different kinds of smiles, wecould correctly indicate whether the temperature related tomuscle contraction changed in the lower or upper part of theface. For example, the production of AU12+25 was wellrecognized at 72.4 percent but was confounded with AU12 in20.7 percent of the cases, which corresponds to contraction ofmuscles from the lower part of the face, whereas it was notconfounded with AUs corresponding to contraction ofmuscles from the upper part of the face (0 percent for AU4,0 percent for AU1+2, and 0 percent for AU5).
In sum, the thermal imaging technique seems to con-stitute a promising approach to detecting and evaluatingchanges in facial muscles contraction in relation with theproduction of AUs. Indeed, we demonstrated that it led toreasonable results in terms of detection of contractionlocations, their kinetics, and their strength. Moreover, itavoids the problems of lighting encountered when usingtraditional cameras and the use of hampering electrodes onthe face when using electromyography. An experimentallimitation of the procedure mentioned here was that weused a system to immobilize the head of the participants.Further head tracking techniques would be necessary toallow the characterization of facial muscles contractions inmore natural scenarios, for example in response to emo-tionally relevant situations. In addition, in this study, theparticipants were requested to voluntarily produce specificfacial muscles contractions. In the future, it would beinteresting to differentiate among the various spontaneousmuscular activities relative to AU productions, as well asamong temperature changes related to other physiologicalactivity like vasoconstriction and vasodilatation. Indeed,thermal imaging was recently used to investigate stress andbodily temperature responses in emotional reactions in rats[15], monkeys [16], and humans ([17], [18]). Tanaka et al. [19]showed that the temperature of the nose increases withanger, joy, and sadness, but decreases with fear. Thesestudies constitute the first valuable attempts to revealemotional reactions by thermal imaging of the face. Futureresearch should continue investigating facial temperaturechanges during laboratory induced emotions.
5 CONCLUSION
To our knowledge, this study is the first to use thermalimaging to discriminate specific facial temperature patternsrelated to muscle contractions corresponding to facial actionunits. Given the promising results, we suggest thatthermography is an advantageous method for the investi-gation of AU discrimination. We used a spatial patternapproach to classify nine different AUs or combinations ofAUs and to differentiate their speed and strength ofcontraction. Using this technique, we also found specificfacial heat patterns associated to the different musclecontractions. Finally, thermography may prove to be auseful tool to unobtrusively analyze fine-grained elementsof facial expressions. It remains to be determined whether itcan be used to detect and characterize more spontaneousexpressions in other situations.
ACKNOWLEDGMENTS
The authors thank everyone from the Perception andBioresponses Department of FIRMENICH SA and theNational Center of Competence in Research (NCCR)financed by the Swiss National Science Foundation(no. 51NF40-104897) and hosted by the University ofGeneva. they would also like to thank the trained FACScoders, S. Kaiser, B. Michel, K. Schenkel, and S. With, fortheir participation in the experiment.
REFERENCES
[1] P. Ekman, W.V. Friesen, and J.C. Hager, Facial Action CodingSystem. Consulting Psychologist Press, 1978.
[2] P. Ekman, W.V. Friesen, and P. Ellsworth, “Conceptual Ambi-guities,” Emotion in the Human Face, Cambridge Univ. Press,pp. 98-110, 1982.
[3] J.J.J. Lien, T. Kanade, C.C. Li, and J.F. Cohn, “Detection,Tracking and Classification of Action Units in Facial Expres-sion,” IEEE J. Robotics and Autonomous Systems, special issue:face expression in human-robot interaction systems, vol. 31,pp. 131-146, 2000.
[4] S. Delplanque, D. Grandjean, C. Chrea, L. Aymard, I. Cayeux, C.Margot, M.I. Velazco, D. Sander, and K.R. Scherer, “SequentialUnfolding of Novelty and Pleasantness Appraisals of Odors:Evidence from Facial Electromyography and Automatic Reac-tions,” Emotion, vol. 9, no. 3, pp. 316-328, 2009.
[5] J. Gonzalez-Alonso, B. Quistorff, P. Krustrup, J. Bangsbo, and B.Saltin, “Heat Production in Human Skeletal Muscle at the Onset ofIntense Dynamic Exercise,” J. Physiology, vol. 524, pp. 603-615,2000.
[6] Z. Zhu, J. Fei, and I. Pavlidis, “Tracking Human Breath in InfraredImaging,” Proc. Fifth IEEE Symp. Bioinformatics and Bioeng.,pp. 227-231, 2005.
[7] N. Sun, I. Pavlidis, M. Garbey, and J. Fei, “Harvesting the ThermalCardiac Pulse Signal,” Medical Image Computing and ComputerAssisted Intervention Soc., vol. 4191, pp. 569-576, 2006.
[8] M. Pantic, “Facial Expression Recognition,” Encyclopedia ofBiometrics, Springer, pp. 400-406, 2009.
[9] T. Kanade, J.F. Cohn, and Y. Tian, “Comprehensive Database forFacial Expression Analysis,” Proc. IEEE Int’l Conf. Automatic Faceand Gesture Recognition, 2000, http://vasc.ri.cmu.edu/idb/html/face/facial_expression/index.html.
[10] D. Lundqvist and J.E. Litton, The Averaged Karolinska DirectedEmotional Faces (AKDEF). Dept. of Clinical Neuroscience, Psychol-ogy Section, Karolinska Inst., 1998.
[11] A. Webb, Statistical Pattern Recognition. Wiley, pp. 254-255, 2002.[12] M.Y. Kiang, “A Comparative Assessment of Classification
Methods,” Decision Support Systems, vol. 35, pp. 441-454, 2003.[13] R.O. Duda, Pattern Classification, second ed. Wiley, 2001.[14] A. Webb, Statistical Pattern Recognition. Wiley, 2002.[15] D. Vianna and P. Carrive, “Changes in Cutaneous and Body
Temperature during and after Conditioned Fear to Context in theRat,” European J. Neuroscience, vol. 21, pp. 2505-2512, 2005.
[16] K. Nakayama, S. Goto, K. Kuraoka, and K. Nakamura, “Decreasein Nasal Temperature of Rhesus Monkeys (Macaca Mulatta) inNegative Emotional State,” J. Physiology and Behavior, vol. 84,pp. 783-790, 2005.
[17] I. Pavlidis, J. Levine, and P. Baukol, “Thermal Image Analysis forAnxiety Detection,” Proc. Int’l Conf. Image Processing, vol. 2,pp. 315-318, 2001.
[18] C. Puri, L. Olson, I. Pavlidis, J. Levine, and J. Starren, “StressCam:Non-Contact Measurement of Users’ Emotional States throughThermal Imaging,” Proc. Conf. Human Factors in ComputingSystems, pp. 1725-1728, 2005.
[19] H. Tanaka, H. Ide, and Y. Nagashima, “Emotion Analysis UsingFST,” J. Robotics and Mechatronics, vol. 10, pp. 266-271, 1998.
8 IEEE TRANSACTIONS ON AFFECTIVE COMPUTING, VOL. 2, NO. 1, JANUARY-MARCH 2011
Sophie Jarlier received the master’s degree incomputer science imaging from the Universitiesof Lyon and Geneva, working on differentprojects (such as 3D sound, facial animation,hip joint modelization). She is currently workingtoward the PhD degree under the supervision ofPatrik Vuilleumier and Didier Grandjean onemotions elicited by olfaction using a newtechnique: thermography. The aim of her workis to better understand the relationship between
olfactory-elicited emotion processing, facial vasodilatation, and vaso-constrictions through thermal patterning of the face and cerebralactivities. She is with the Swiss Center for Affective Science and theLaboratory for Neurology and Imaging of Cognition at the University ofGeneva.
Didier Grandjean is an assistant professor anddirector of the Neuroscience of Emotion andAffective Dynamics laboratory in the Departmentof Psychology and Educational Sciences andthe Swiss Center for Affective Sciences at theUniversity of Geneva. In 2005, he finished histhesis about the dynamics of appraisal pro-cesses using electroencephalographic methods.He has published more than 30 peer-reviewedarticles in international scientific journals in
psychology and neuroscience about emotional processes related toemotional prosody perception and production, appraisal processes, theemergence of feelings, music and emotion, olfaction and emotion, andemotional facial expression perception and production.
Sylvain Delplanque received the postgraduatedegree in neuropsychology and cognitive neu-roscience and the PhD degree in cognitivesciences from the University Pierre et MarieCurie, Paris, France, in 2004. He studiedhuman physiology, neurophysiology, and psy-chophysiology at the University of Lille I,France. He is now a senior researcher in theSwiss Centre for Affective Sciences, Universityof Geneva, Switzerland. His empirical work
focuses on the cortical and autonomic concomitants to the appraisalprocesses underlying the genesis and the differentiation of odor-elicitedemotions. The techniques he uses are mainly psychophysiologicalrecordings, EEG-based indicators, and subjective reports throughquestionnaires and scales.
Karim N’Diaye received the PhD degree incognitive neuroscience from the Laboratoire deNeurosciences Cognitive et Imagerie Cerebralein Paris, France, in 2006, under the supervisionof V. Pouthas and L. Garnero. He is currently apostdoctoral researcher in the COGIMAGEgroup at the Brain and Spine Institute and theCentre d’Economie de la Sorbonne in Paris,France, after a first postdoctoral fellowship at theLaboratory of Neurology and Imaging of Cogni-
tion in Geneva, Switzerland. He is mainly interested in metacognitionand the neuroeconomy of the feeling of control, and in the evolutionarycognitive neuroscience of social processes and emotions working withvarious experimental psychology and brain imaging methods in humans.
Isabelle Cayeux is a doctor in food sciencesresponsible for sensory analysis research atFirmenich.
Maria Ines Velazco received the PhD degree inneuroscience from the University of Geneva forher work on the nicotinic Acetylcholine Receptorand its implication in the autoimmune diseaseMyasthenia gravis. She pursued a postdoctoralposition at the Geneva University Hospital in thefield of infectious diseases. She is a senior vicepresident of the Corporate R&D Division atFirmenich, SA, the largest privately ownedcompany in the perfume and flavor business.
She is responsible for scientific research in the fields of chemistry andhuman perception of flavors and fragrances, sensory analysis,psychophysics, emotion, analytical chemistry, and discovery of newactive ingredients from cature. Her research interests include thephysiology and psychology of taste and odor perception mechanisms inhumans, cognitive neuroscience, polymers, and physical chemistry.
David Sander received the postgraduate de-gree in psychology and cognitive neuroscienceand the PhD degree in cognitive sciences fromthe University Louis Lumiere, Lyon, France. Hestudied mathematics and psychology at theUniversity Rene Descartes, Paris, France. In2002, he joined the Geneva Emotion ResearchGroup in the Department of Psychology at theUniversity of Geneva, Switzerland. He has alsobeen the scientific coordinator of the Swiss
Center for Affective Sciences since its creation in 2005. He is now anassociate professor in the Department of Psychology at the University ofGeneva, where he directs the Laboratory for the study of EmotionElicitation and Expression (E3 Lab).
Patrik Vuilleumier is a neurologist who is usingbrain imaging techniques (such as functionalresonance magnetic imaging, fMRI) to study thecerebral mechanisms of emotion and aware-ness. After first training in neuropsychology atGeneva and Lausanne, he pursued his researchin cognitive neurosciences at the University ofCalifornia, Davis (1997-1999), and then atUniversity College London (1999-2002). Henow works at the Laboratory for Neurology and
Imaging of Cognition at the Geneva University Medical Center andHospital. His current research investigates neural circuits in the humanbrain enabling emotion signals to influence perception and guidebehavior, as well as the effect of brain lesions on emotion processesand consciousness.
Klaus R. Scherer holds the chair for emotionpsychology at the University of Geneva anddirects the Geneva Emotion Research Group.His major research interest is the furthertheoretical development and empirical test ofhis Component Process Model of Emotion(CPM), specifically the modeling of appraisal-driven processes of motor expression andphysiological reaction patterns, as well as thereflection of these processes in subjective
experience. Other major research foci are the study of the expressionof affect in voice and speech, and applied emotion research.
. For more information on this or any other computing topic,please visit our Digital Library at www.computer.org/publications/dlib.
JARLIER ET AL.: THERMAL ANALYSIS OF FACIAL MUSCLES CONTRACTIONS 9
Related Documents