Journal of Thermal Analysis, Vol. 51 (19981 307-319 THERMAL ANALYSIS OF CRUDE OILS AND COMPARISON WITH SIMDIST AND TBP DISTILLATION DATA M. A. Ali, M. A. B. Siddiqui and S. M. J. Zaidi Petroleum and Gas Technology Division, The Research Institute, King Fahd University of Petroleum & Minerals, Dhahran 31261, Saudi Arabia (Received February 28, 1996; in revised form January I0, 1997) Abstract Four commercial Saudi Arabian crude oils were characterized by thermogravimetry (TG) and differential thermal analysis (DTA). These crude oils, Arab Berri (AB), Arab Light (AL), Arab Medium (AM) and Arab Heavy (AH), were also subjected to the traditionally employed true boiling point (TBP) distillation and simulated distillation (SIMDIST). The TG/DTA data show that the hydrocarbons present in these crude oils fall into four groups: the volatiles, the low molecular weight, the medium molecular weight and the high molecular weight com- pounds. These four types of hydrocarbons were observed to display certain trends, such that the volatile and low molecular weight hydrocarbons increased, while the medium and high molecular weight hydrocarbons decreased with the lightness of the crude. The volatile con- tents ofAB, AL, AM and AH crude oils up to 280~ were 50.1, 42.2, 42.3 and 38.5 mass per- cent, respectively. This confirms that AB is the lightest of these crude oils with maximum vola- tile content. The mass percentage loss from the TG results is in good agreement with the per- centage distilled from TBP (ASTM D 2892) and SIMDIST. During evaporation, the TG mass loss follows a similar trend to those of the TBP and SIMDIST results and thus behaves like dis- tillation. During the oxidative degradation, the TG curve shows a higher mass loss as com- pared to the distillation data. The higher deviation of the TG mass loss and percentage distilled at the higher-temperature end of the curve may be attributed to the higher content of asphalte- nes and carbonaceous material present in AH as compared to the AB crude oil. At around 200~ the TG mass loss curve intersects the TBP and SIMDIST curves and shows a derivation from distillation behaviour. This intersection temperature of the TG and distillation curves is observed to decrease with the heaviness of the crude and can be an indication of the onset of thermal degradation of hydrocarbons present in the crude oil. On the whole, the TG data closely resemble the distillation results. Keywords: DTA, DTG, Saudi Arabian crude oils, SIMDIST, TBP distillation, TG Introduction Crude oils and other complex materials are characterized by a number of physical and chemical analytical parameters. These include viscosity, pour 0368~t466/98/ $ 5. O0 9 1998 Akadgmiai Kiad6, Budapest Akadgmiai Kiad6, Budapest Kluwer Academic Publishers, Dordrecht

Welcome message from author
This document is posted to help you gain knowledge. Please leave a comment to let me know what you think about it! Share it to your friends and learn new things together.
Transcript
Journal of Thermal Analysis, Vol. 51 (19981 307-319
THERMAL ANALYSIS OF CRUDE OILS AND COMPARISON WITH SIMDIST AND TBP DISTILLATION DATA
M. A. Ali, M. A. B. Siddiqui and S. M. J. Zaidi Petroleum and Gas Technology Division, The Research Institute, King Fahd University of Petroleum & Minerals, Dhahran 31261, Saudi Arabia
(Received February 28, 1996; in revised form January I0, 1997)
Abstract
Four commercial Saudi Arabian crude oils were characterized by thermogravimetry (TG) and differential thermal analysis (DTA). These crude oils, Arab Berri (AB), Arab Light (AL), Arab Medium (AM) and Arab Heavy (AH), were also subjected to the traditionally employed true boiling point (TBP) distillation and simulated distillation (SIMDIST). The TG/DTA data show that the hydrocarbons present in these crude oils fall into four groups: the volatiles, the low molecular weight, the medium molecular weight and the high molecular weight com- pounds. These four types of hydrocarbons were observed to display certain trends, such that the volatile and low molecular weight hydrocarbons increased, while the medium and high molecular weight hydrocarbons decreased with the lightness of the crude. The volatile con- tents ofAB, AL, AM and AH crude oils up to 280~ were 50.1, 42.2, 42.3 and 38.5 mass per- cent, respectively. This confirms that AB is the lightest of these crude oils with maximum vola- tile content. The mass percentage loss from the TG results is in good agreement with the per- centage distilled from TBP (ASTM D 2892) and SIMDIST. During evaporation, the TG mass loss follows a similar trend to those of the TBP and SIMDIST results and thus behaves like dis- tillation. During the oxidative degradation, the TG curve shows a higher mass loss as com- pared to the distillation data. The higher deviation of the TG mass loss and percentage distilled at the higher-temperature end of the curve may be attributed to the higher content of asphalte- nes and carbonaceous material present in AH as compared to the AB crude oil. At around 200~ the TG mass loss curve intersects the TBP and SIMDIST curves and shows a derivation from distillation behaviour. This intersection temperature of the TG and distillation curves is observed to decrease with the heaviness of the crude and can be an indication of the onset of thermal degradation of hydrocarbons present in the crude oil. On the whole, the TG data closely resemble the distillation results.
Keywords: DTA, DTG, Saudi Arabian crude oils, SIMDIST, TBP distillation, TG
Introduction
C r u d e o i l s a n d o t h e r c o m p l e x m a t e r i a l s a r e c h a r a c t e r i z e d b y a n u m b e r o f
p h y s i c a l and c h e m i c a l a n a l y t i c a l p a r a m e t e r s . T h e s e i n c l u d e v i s c o s i t y , p o u r
0368~t466/98/ $ 5. O0
�9 1998 Akadgmiai Kiad6, Budapest Akadgmiai Kiad6, Budapest
Kluwer Academic Publishers, Dordrecht
308 ALl et al.: CRUDE OILS
point, carbon residue and solvent insolubles. To achieve a more in-depth analy- sis, these materials are fractionated into a number of cuts and characterized by a combination of physico-chemical analytical techniques. Thermogravimetry (TG) is one of the techniques that allows a study of the thermo-oxidation and mass loss of crude oils over an extended temperature range. All crude oils un- dergo mass loss on heating, but it is possible to differentiate between two crude oils on the basis of the characteristic shapes of their TG curves.
A number of analytical methods have been applied to crude oils and petro- leum products in order to determine their properties. These include simulated distillation (SIMDIST) by gas chromatography [1, 2], pyrolysis gas chromatog- raphy [3], capillary gas chromatography [4, 5], mass spectrometry [6], gas chro- matography - mass spectrometry [5, 7, 8], infrared spectroscopy [9] and atomic absorption spectrometry [10].
TG has been used extensively to study the characteristic of crude oils and other petroleum products. B ae published a design for a high-pressure thermobal- ance [ 11] and demonstrated the application of TG for determination of the fire flooding conditions characteristic of crude oils [ 12]. Masek investigated heavy tar fractions by TG [13] and studied the effect of the purge gas composition on the TG results of fuel oils [14]. Lubricating oils have also been studied by TG by Hsu and Cummings [ 15], who developed a method of determining the oxidative- autoignition characteristics of heat transfer oil [ 16]. Dyszel [ 17] developed a TG method to distinguish Alaskan crude oil from other crude oils of the world. A number of investigators have used TG to characterize asphalt and bituminous material [ 18], heavy crudes and residue [ 19], petroleum distillates [20, 21] and asphaltenes [22] and to monitor the reaction between a crude oil derivative and sulfur [23]. Fischer demonstrated the applicability of TG for the microdistilla- tion of petroleum and the quantification of asphaltic contents [24]. Barbooti et al. [25] used TG to characterize heavy crude oils.
This paper describes the utilization of TG/DTA methods to characterize S audi Arabian crude oils, to further investigate the properties of the volatile com- ponents of these crudes and to correlate the characteristics with the thermo-oxi- dation behaviour of such crudes. The results of TG/DTA analysis were also cor- related with true boiling point (TBP) distillation and SIMDIST data.
Experimental
Sample definition
The four Saudi Arabian crude oils for this study were supplied by Saudi Aramco. They were Arabian Berri (AB), Arabian Light (AL), Arabian Medium (AM) and Arabian Heavy (AH). These crude oils were stabilized at lower tem- perature before distillation. AH is produced from an offshore oilfield, Safania, located about 125 miles north-west of the exporting terminal Ras Tanura; this is
J. Thermal Anal., 51, 1998
ALI et al.: CRUDE OILS 309
Fig. 1 Map showing the location of oil fields producing the Saudi crude oils under study
the world's largest offshore oil field. AM is produced from a blend of oils from the Abu Safah, Khursaniyah, Marjan and Zuluf oil fields. AL is a blend of prod- ucts from the Abqaiq Ain Dar, Shedgum Uthmaniyah, Abu Hadriyah and Hawi- yah oil fields. AB is produced from the Berri oil fields. A map showing the loca- tion of these oil fields is given in Fig. I.
Thermal analysis
The equipment used for thermal analysis was a simultaneous thermal ana- lyser STA-429 manufactured by Netzch, Germany, which performs TG and DTA simultaneously. About 100 mg of crude oil was taken, with alumina as a refer- ence material. The temperature was raised at a uniform rate of 10~ min -~ from room temperature up to 1200~ in air atmosphere. In the thermal curves, the per- centage mass loss, the differential temperature and temperature are plotted si- multaneously.
DTA is a technique for measuring the amount of heat evolved or absorbed and the temperature at which these changes take place within the material. The tem- perature difference between a test sample and the reference material is measured as a function of temperature, while the substance and the reference material are
.I. Thermal AnaL, 51, 1998
310 ALl et al.: CRUDE OILS
subjected to controlled temperature heating. A number of phenomena such as de- composition and oxidation may take place in a material when it is heated at a con- stant rate. TG is a technique in which the change in mass of a substance is meas- ured as a function of temperature while it is subjected to controlled heating. The characteristic decomposition phenomenon is the appearance of an endothermic peak in a DTA curve with a corresponding mass loss. Oxidative degradation is characterized by an exothermic peak with corresponding mass loss.
Gas chromatographic simulated distillation (SIMDIST)
The system used for SIMDIST consisted of an HP 5880A gas chromatograph equipped with an FID and automatic sampler HP 7673A. The column employed was the UCW-982. The system was calibrated by analysing a mixture of normal paraffins from nC5 to nC40 covering the temperature range from 36 to 525~ The program used the boiling points of the paraffins and their corresponding reten- tion times to produce a calibration curve. This curve is used to determine the boiling range distribution of the sample. A known amount of an internal standard consisting of C~4, C15, C16 and C17 normal paraffins was added to the crude oil sample to calculate the percentage recovery and boiling range distribution up to 525~ The program calculated the data and produced a SIMDIST report as per- centage distilled vs. temperature. The detailed SIMDIST operating conditions and procedure are given elsewhere [1].
True boiling point (TBP) distillation
The TBP distillation data were obtained by using a computerized Gecil Distel 2892 apparatus having a column equivalent to 16 theoretical plates and operated at a reflux ratio of 5:1. This instrument is equipped with an electronic pressure sensor, a photoelectric level follower to measure the volume of distillate and distillation rate, a fraction collector with 12 distillate receivers, a vacuum pump and a refrigeration unit. Following the debutanization of crude oil at 25~ the distillation was carried out under atmospheric pressure up to 200~ Above 200~ sufficient vacuum was applied to the system to keep the atmospheric equivalent temperature (AET) below 200~ so that the cracking of hydrocar- bons can be prevented, The TBP distillation was carried out up to 390~ The vacuum distillation was performed by using a computerized Gecil Minidist 1160 apparatus in accordance with ASTM method D 1160. The vacuum distillation was carried out on the residue of TBP distillation and was continued up to 600~ AET. The system was operated at 2 mm Hg pressure. The detailed TBP experi- mental conditions and procedure are given elsewhere [ 1 ].
J. Thermal Anal., 51, 1998

ALI et al.: CRUDE OILS 311
Results and discussion
Some of the properties of the Saudi Arabian crude oils used in this study are given in Table 1. These are API gravity, sulfur, nickel and vanadium contents. A very clear trend can be observed in these crude oils: the sulfur, nickel and vana- dium contents increase with decrease in the API gravity. The reason for the de- crease in the API gravity or the increased density of a crude oil is the increased asphaltene content. Asphaltenes are high molecular weight (high density) con- densed aromatic and naphthenic systems containing sulfur linkages and aro- matic sulfur groups such as thiophene and its benzene homologues. The heavy crudes also contain higher amounts of organometallic compounds called por- phyrins, having nickel and vanadium central atoms attached to the nitrogen at- oms of pyrrole-type rings [26]. Therefore, the higher the amount of asphaltenes and porphyrins, the higher will be the sulfur, vanadium and nickel contents and thus, the lower will be the API gravity of that crude oil.
Table 1 Some characteristics of Saudi crude oils under study
Sulfur/ Nickel/ Vanadium/ Crude oil API Gravity wt% ppm ppm
Arab Berri 38.60 1.20 0.6 2.2
Arab Light 33.45 1.98 3.2 15.5
Arab Medium 30.36 2.45 8.4 27.9
Arab Heavy 28.00 2.67 16.7 57.9
u~
2O
-80 - -100 -120
I ._.~, . ................. Dm
' ~ L --DTA TG
I l l i . , t l l l t , l l . . . . I l l l l l l t l t l l l l l l + l , l i l l l l l l l l l l t l l l i l + i I
200 400 600 BOO 1000
T~ ~
Fig. 2 TG, DTA and DTG curves of Arab Berri crude oil
600
~00
200 "~
200 ~
-~00 1200
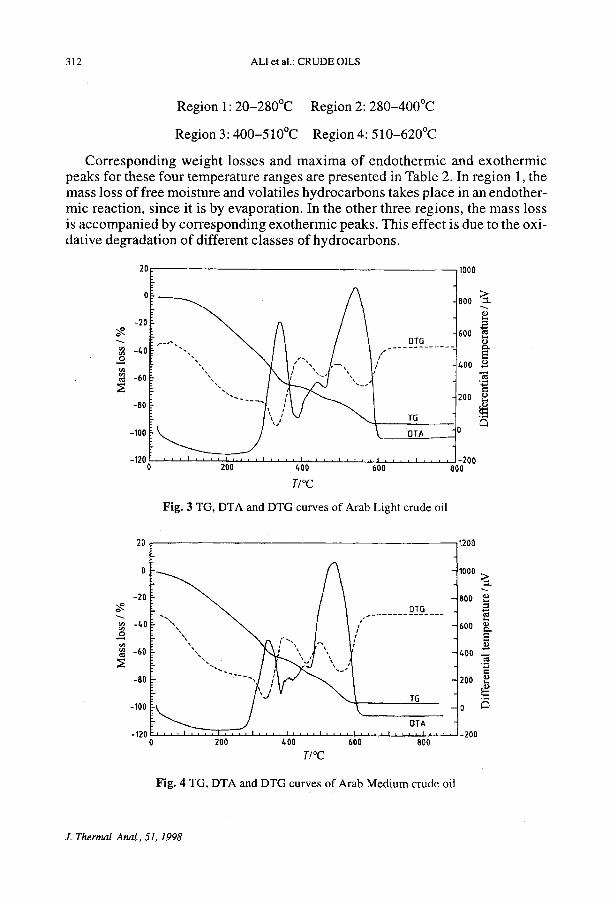
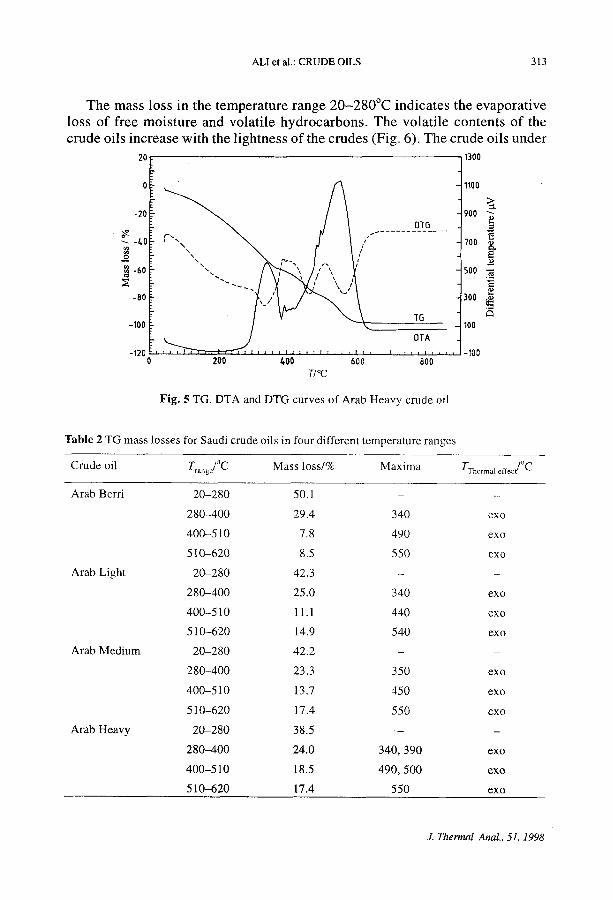
TG, DTG and DTA curves of the AB, AL, AM and AH crude oils are shown in Figs 2 to 5. These curves demonstrate the following four regions of thermal effects:
Z Thermal Anal., 51, 1998
312 ALl et al.: CRUDE OILS
Region 1 : 20-280~ Region 2: 280-400~
Region 3: 400-510~ Region 4: 510-620~
Corresponding weight losses and maxima of endothermic and exothermic peaks for these four temperature ranges are presented in Table 2. In region 1, the mass loss of free moisture and volatiles hydrocarbons takes place in an endother- mic reaction, since it is by evaporation. In the other three regions, the mass loss is accompanied by corresponding exothermic peaks. This effect is due to the oxi- dative degradation of different classes of hydrocarbons.
20 ,1000
0
-20
-4o
-60
-80
- 1 0 0
-120
DTG $
9T~
i l i , , , I , , , ,
200 t.O0
80o
600 o
4oo o
2OO
0
-200 600 800
T/~
Fig. 3 TG, DTA and DTG curves of Arab Light crude oil
2O
0
-20
N -~o 0
-60
-00
-100
-120
1200
~ / IOOO
8o0
. . . . . . . . 9_r_G . . . . �9 ~ 600
/ , ;
200
" . 0
" OTA
200 400 600 800
T/~
Fig. 4 TG, DTA and DTG curves of Arab Medium crude oil
J. Thermal Anal., 51, 1998
ALI et al.: CRUDE OILS 313
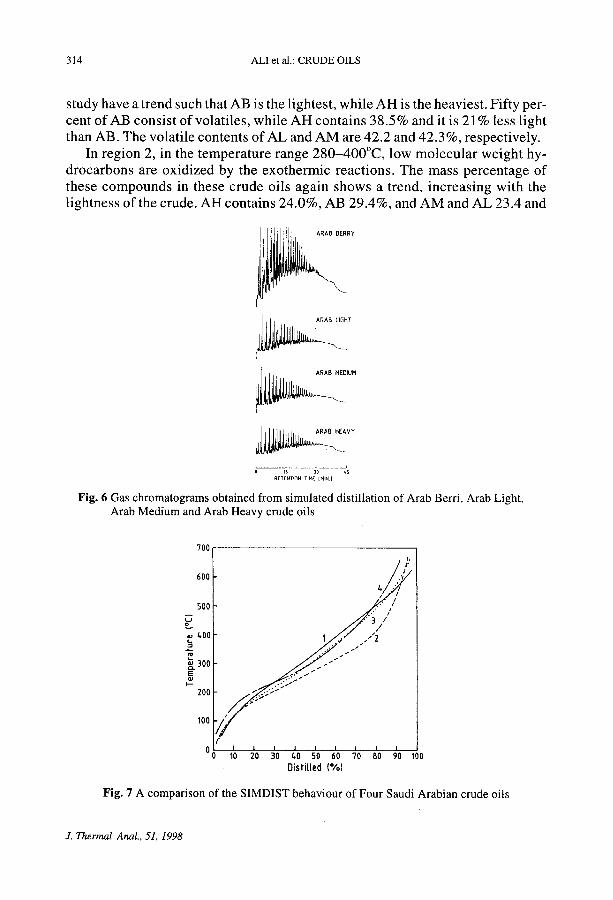
The mass loss in the temperature range 20-280~ indicates the evaporative loss of free moisture and volatile hydrocarbons. The volatile contents of the crude oils increase with the lightness of the crudes (Fig. 6). The crude oils under
20 1300
o
-2o
"~ -40 o
-ao
-100
-120 0
~ ........ PY_~ .... ~ \ \ \ \ / I/
x x ~x i " - . l ?,
TG
ZOO /+00 600 800 T/~
11oo
>= 900
700
500 .~
300 ,~ ~5
100
-IO0
Fig . 5 TG, D T A and D T G cu rves o f Arab H e a v y c rude oil
T a b l e 2 T G m a s s losses for Saudi c rude oils in four d i f fe rent t empe ra tu r e r anges
loC ~ C r u d e oil Trange/~ M a s s loss /% M a x i m a Trh . . . . 1 eflecd
Arab Berr i 2 0 - 2 8 0 50.1 - -
2 8 0 - 4 0 0 29.4 340 exo
4 0 0 - 5 1 0 7.8 490 exo
5 1 0 - 6 2 0 8.5 550 exo
Arab L igh t 2 0 - 2 8 0 42.3 - -
2 8 0 - 4 0 0 25.0 340 exo
4 0 0 - 5 1 0 11.1 440 exo
5 1 0 - 6 2 0 14.9 540 exo
A r a b M e d i u m 2 0 - 2 8 0 42 .2 - -
2 8 0 - 4 0 0 23.3 350 exo
4 0 0 - 5 1 0 13.7 450 exo
5 1 0 - 6 2 0 17.4 550 exo
A r a b Heavy 2 0 - 2 8 0 38.5 - -
280--400 24.0 340, 390 exo
4 0 0 - 5 1 0 18.5 490, 500 exo
5 1 0 - 6 2 0 17.4 550 exo
J. Thermal Anal., 51, 1998
314 ALl et al.: CRUDE OILS
study have a trend such that AB is the lightest, while AH is the heaviest. Fifty per- cent of AB consist of volatiles, while AH contains 38.5% and it is 21% less light than AB. The volatile contents of AL and AM are 42.2 and 42.3 %, respectively.
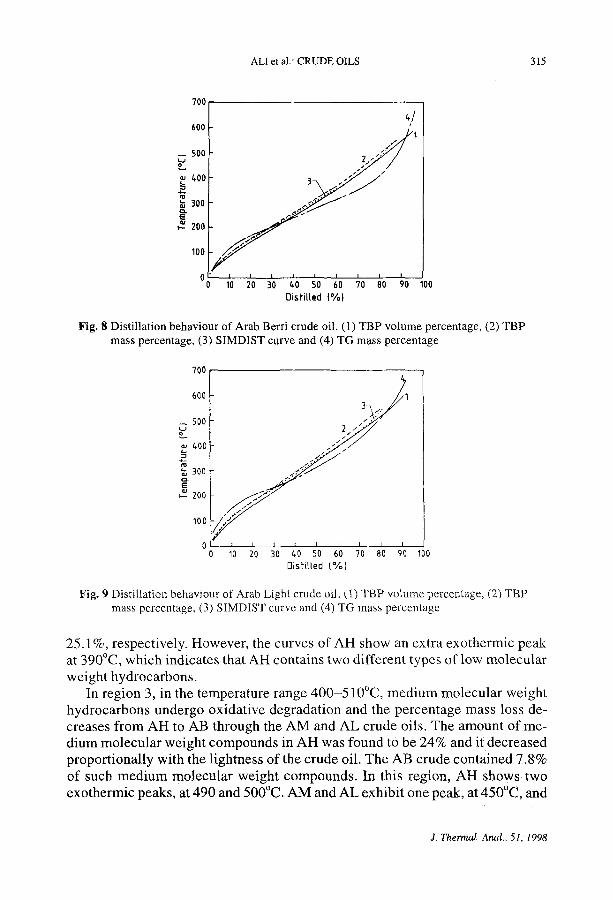
In region 2, in the temperature range 280-400~ low molecular weight hy- drocarbons are oxidized by the exothermic reactions. The mass percentage of these compounds in these crude oils again shows a trend, increasing with the lightness of the crude. AH contains 24.0%, AB 29.4%, and AM and AL 23.4 and
~ RY
HT
ARAB MEDIUM
i
ARAB HEAVY
o 15 30 ~5 REIENIION TIME IMINI
Fig. 6 Gas chromatograms obtained from simulated distillation of Arab Berri, Arab Light, Arab Medium and Arab Heavy crude oils
700
600
S00
~00
~300
200
100
r
., '" / / ..." /
f
s'o 6'o. 1o do Oistitled (%1
Fig. 7 A comparison of the SIMDIST behaviour of Four Saudi Arabian crude oils
J. Thermal Anal., 51, 1998
ALI et al.: CRUDE OILS 315
700
600
500
,v 400
300 Q .
200
100
0 0
4/ t
1 / 1
s j 10 0 40 SO 60 70 80 90 100
Oisfitled 1%1
Fig. 8 Distillation behaviour of Arab Berri crude oil. (1) TBP volume percentage, (2) TBP mass percentage, (3) SIMDIST curve and (4) TG mass percentage
700
500
t, O0
300
200
100
0 0
I I I t I 1 71 810 9JO 10 20 30 ~0 50 60 0
Distilled (%1 100
Fig. 9 Distillation behaviour of Arab Light crude oil. ( t) TBP volume percentage, (2) TBP mass percentage, (3) SIMDIST curve and (4) TG mass percentage
25.1%, respectively. However, the curves of AH show an extra exothermic peak at 390~ which indicates that AH contains two different types of low molecular weight hydrocarbons.
In region 3, in the temperature range 400-510~ medium molecular weight hydrocarbons undergo oxidative degradation and the percentage mass loss de- creases from AH to AB through the AM and AL crude oils. The amount of me- dium molecular weight compounds in AH was found to be 24% and it decreased proportionally with the lightness of the crude oil. The AB crude contained 7.8% of such medium molecular weight compounds. In this region, AH shows two exothermic peaks, at 490 and 500~ AM and AL exhibit one peak, at 450~ and
J. Thermal Anal., 51, 1998
316 ALl et al.: CRUDE OILS
700
600
- - 500
~.oo ..-i
300 m= ~-- 200
100
I I I I I / I I I 10 20 30 t~0 50 60 70 80 90 100
OistiUed (%1
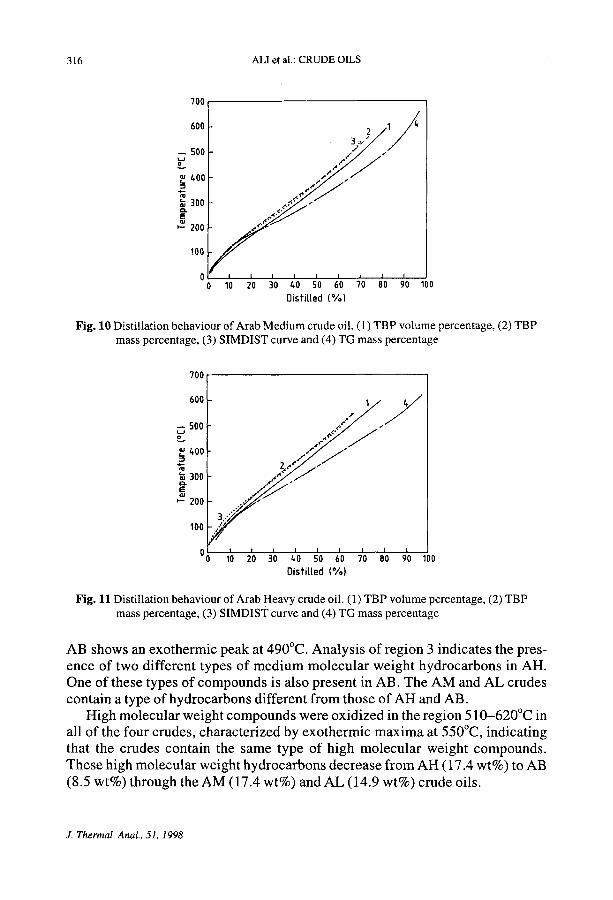
Fig. 10 Distillation behaviour of Arab Medium crude oil. (1) TBP volume percentage, (2) TBP mass percentage, (3) SIMDIST curve and (4) TG mass percentage
700
600
- - 500:
,,, L, oo I
3oo i
200
100
00
.+,+y j "
S I I I
lo 2'0 3'0 ~'o ~o 6'o 70 80 ;o +oo Distil.ted (%)
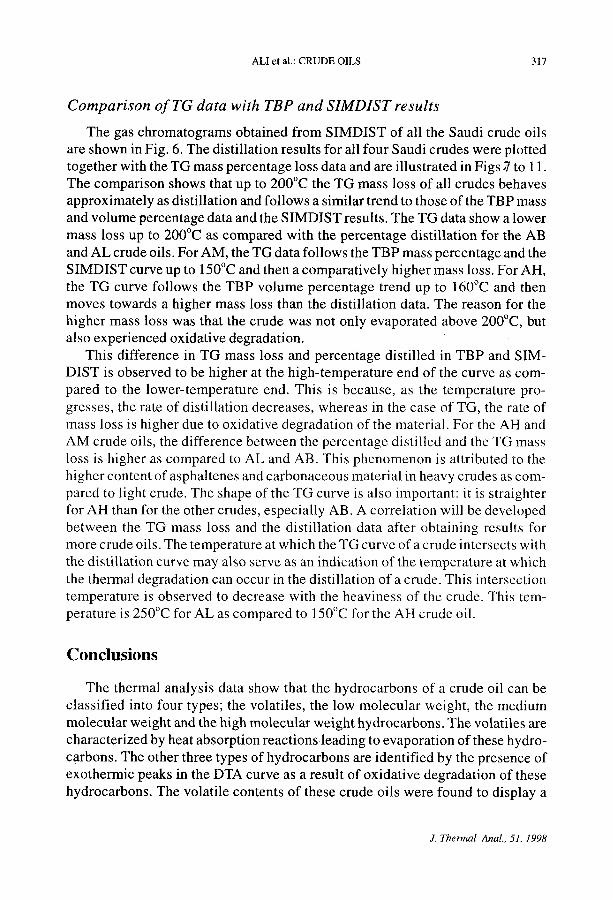
Fig. 11 Distillation behaviour of Arab Heavy crude oil. (1) TBP volume percentage, (2) TBP mass percentage, (3) SIMDIST curve and (4) TG mass percentage
AB shows an exothermic peak at 490~ Analysis of region 3 indicates the pres- ence of two different types of medium molecular weight hydrocarbons in AH. One of these types of compounds is also present in AB. The AM and AL crudes contain a type of hydrocarbons different from those of AH and AB.
High molecular weight compounds were oxidized in the region 510-620~ in all of the four crudes, characterized by exothermic maxima at 550~ indicating that the crudes contain the same type of high molecular weight compounds. These high molecular weight hydrocarbons decrease from AH (17.4 wt%) to AB (8.5 wt%) through the AM (17.4 wt%) and AL (14.9 wt%) crude oils.
Z Thermal Anal., 51, 1998
ALl et al.: CRUDE OILS 317
Comparison of TG data with TBP and SIMDIST results
The gas chromatograms obtained from SIMDIST of all the Saudi crude oils are shown in Fig. 6. The distillation results for all four Saudi crudes were plotted together with the TG mass percentage loss data and are illustrated in Figs ,7 to 11. The comparison shows that up to 200~ the TG mass loss of all crudes behaves approximately as distillation and follows a similar trend to those of the TBP mass and volume percentage data and the SIMDIST results. The TG data show a lower mass loss up to 200~ as compared with the percentage distillation for the AB and AL crude oils. For AM, the TG data follows the TBP mass percentage and the SIMDIST curve up to 150~ and then a comparatively higher mass loss. For AH, the TG curve follows the TBP volume percentage trend up to 160~ and then moves towards a higher mass loss than the distillation data. The reason for the higher mass loss was that the crude was not only evaporated above 200~ but also experienced oxidative degradation.
This difference in TG mass loss and percentage distilled in TBP and SIM- DIST is observed to be higher at the high-temperature end of the curve as com- pared to the lower-temperature end. This is because, as the temperature pro- gresses, the rate of distillation decreases, whereas in the case of TG, the rate of mass loss is higher due to oxidative degradation of the material. For the AH and AM crude oils, the difference between the percentage distilled and the TG mass loss is higher as compared to AL and AB. This phenomenon is attributed to the higher content of asphaltenes and carbonaceous material in heavy crudes as com- pared to light crude. The shape of the TG curve is also important: it is straighter for AH than for the other crudes, especially AB. A correlation will be developed between the TG mass loss and the distillation data after obtaining results for more crude oils. The temperature at which the TG curve of a crude intersects with the distillation curve may also serve as an indication of the temperature at which the thermal degradation can occur in the distillation of a crude. This intersection temperature is observed to decrease with the heaviness of the crude. This tem- perature is 250~ for AL as compared to 150~ for the AH crude oil.
Conclusions
The thermal analysis data show that the hydrocarbons of a crude oil can be classified into four types; the volatiles, the low molecular weight, the medium molecular weight and the high molecular weight hydrocarbons. The volatiles are characterized by heat absorption reactions leading to evaporation of these hydro- carbons. The other three types of hydrocarbons are identified by the presence of exothermic peaks in the DTA curve as a result of oxidative degradation of these hydrocarbons. The volatile contents of these crude oils were found to display a
J. Thermal Anal., 51, 1998
318 ALl et al.: CRUDE OILS
trend: the lighter crude contains more volatiles as compared to the heavier crude. AH contains 38.5% volatiles, while AB has 50%. The volatile contents of AL and AM are each 42.0%. The mass percentage of low molecular weight hydrocar- bons in these crude oils again shows a trend: it increases with the lightness of the crude. The medium and high molecular weight hydrocarbons were found to de- crease with the lightness of the crudes and exhibit a trend from AH to AB through AM and AL.
The comparison of the TG mass percentage loss data with the TBP distillation and SIMDIST results shows that up to 250~ the TG mass loss of the crudes be- haves approximately as distillation and follows a similar trend to those of the TBP and SIMDIST results. This is because, at around 200~ the volatiles and free moistures are evaporated and no thermal degradation of the crude occurs. At temperatures above 250~ the TG curve shows a higher mass loss as compared to the distillation data. The reason for the higher mass loss is that the crude not only evaporates above 200~ but also experiences oxidative degradation. The higher difference in TG mass loss and percentage distilled in TBP and SIMDIST at the high-temperature end of the curve as compared to the lower-temperature end indicates that, as the temperature elevation progresses, the rate of distillation decreases, whereas the rate of TG mass loss increases due to oxidative degrada- tion of the material. The higher deviation of the TG mass loss and the percentage distilled at the higher-temperature end may be attributed to the higher content of asphaltenes and carbonaceous material in heavy crudes as compared to light ones. The temperature of intersection of the TG and distillation curves is ob- served to decrease with the heaviness of the crude, and can indicate the thermal degradation temperature limit of a crude oil.
The authors wish to acknowledge the support of the Research Institute of the King Fahd Uni- versity of Petroleum and Minerals, Dhahran, Saudi Arabia.
References
1 N. Kosal, M. A. Ali and A. Bhairi, Special Issue of Journal of King Abdul Aziz Univ. Eng. Sci., Jeddah, Saudi Arabia, (1993) 267.
2 L. G. Chorn, J. Chromatogr. Sci., 22 (1984) 17. 3 R J. Laplat, J. Gas Chromatogr., 5 (1967) 128. 4 R. D. Cole, Nature (London), 233 (1971) 545. 5 J. Shen, R. J. Engen and N. K. Saadeh, The Arabian J. Sci. Eng., 10 (1985) 63. 6 D. P. Lin, L. A. Litorja and N. M. Abbas, The Arab. J. Sci. Eng., 13 (1988) 145. 7 V. F. Gaylor, C. N. Jones, G. H. Landrel and E. C. Hughes, Anal. Chem., 36 (1964) 1606. 8 J. Shen, Anal. Chem., 56 (1984) 214. 9 C. W. Brown and P. F. Lynch, Anal. Chem., 48 (1976) 191.
10 M. S. Viglor and V. F. Gaylor, Appl. Spectr., 28 (1974) 342.
J. Thermal Anal., 51, 1998

ALl et al.: CRUDE OILS 319
11 J. H. Bae, Rev. Sci. Instrum., 43 (1972) 983. 12 J. H. Bae, Soc. Pet. Eng. J., 17 (1977) 211. 13 V. Masek, Przem. Chem., 47 (1968) 473. 14 V. Masek, Erdoel Kohle Erdgas Petrochem., 21 (1968) 546. 15 S. M. Hsu and A. L. Cummings, SAE Technical Paper 831682 (1983) p. 10. 16 A. B. Carel and D. K. Cabbiness, Thermochim. Acta, 44 (1981) 363. 17 S. M. Dyszel, Thermochim. Acta, 38 (1980) 299. 18 K. Rajeshwar, Fuel, 65 (1986) 987. 19 G. W. Bartlett, Ph. D. Thesis, University of West Indies, 1982. 20 D. A. H. Al-Sammerrai, A. K. Mohammed and N. Abbas, Fuel, 66 (1987) 512. 21 I. E. Castellanos, Fuel Sci. Tech. Int'l. 11 (1993) 1759. 22 J. A. Ayala and M. E. Rincon, Fuel Chemistry Preprints, 26 (1981) 120. 23 L. Hadley-Coates, A. K. Achwal and K. A. Khan, Fuel, 65 (1986) 1684. 24 H. J. Voelker and J. Fishcer, Conference on Chemical Processes of Petroleum and Natural
Gas. Plenary Lecture, Budapest, 1965, p. 650. 25 M. M. Barbooti, S. H. A1-Madfai and D. A. Al-Sammerrai, J. Thermal Anal., 31 (1986)
253. 26 E Sundararaman, Anal. Chem., 57 (1985) 2204.
J. Thermal Anal., 51, 1998
Related Documents