Thermal analysis kinetics of Tartary buckwheat flour Haiyan Huang * , Jilin Li, Hong Liu Xichang University, Xichang 61500, China Corresponding Author Email: [email protected] https://doi.org/10.18280/ijht.360433 ABSTRACT Received: 19 February 2018 Accepted: 25 May 2018 This experiment uses a DTA-TG analyzer to perform thermal analysis on Tartary buckwheat flour under static-air condition. The best experimental conditions for the thermal analysis of Tartary buckwheat flour are: sample mass 3.000g, heating rate 10°C/min. This paper studies the thermostabilization of Tartary buckwheat flour and concludes the four stages of thermal decomposition of Tartary buckwheat flour via extrapolated onset temperature of the thermogravimetric curve, as well as the proper processing temperature for Tartary buckwheat flour should be lower than 266.74 °C. By comparing Stava-Sestak method and FWO method, we can get that the apparent activation energy of the thermal decomposition of Tartary buckwheat flour is 235.38 KJ/mol, and the frequency factor is LnA = 44.07. Through comparison between 30 mechanistic function models and kinetic mode function models, it infers the most probable mechanism function for simulating the thermal decomposition of Tartary buckwheat flour. The reaction kinetics model of the decomposition of Tartary buckwheat flour is preliminarily calculated, which has provided a theoretical basis for the temperature control of Tartary buckwheat flour during the processing. Keywords: tartary buckwheat flour, differential thermal analysis (DTA), thermal analysis kinetics 1. INTRODUCTION Tartary buckwheat is a kind of coarse grain which has been proved by many literatures to have health care function [1]. It is widely cultivated in the western part of China and has great development values as people are paying more attention to the health nowadays. However, in current China, the development of Tartary buckwheat is still in its infancy compared to other developed countries, and there are few studies on the modern process parameters, resulting in the current Tartary buckwheat products have many problems in the R&D and actual production process, such as the change of the properties of active substances due to improper control of processing temperature during processing weakens the health-care functions of the Tartary buckwheat products [2]. At present, the application of Tartary buckwheat in food has involved aspects of processing methods, processing characteristics, influence mechanism and processing technology, and the influence of enzyme chemistry on the quality of processed products. However, the research and application of DTA technology in Tartary buckwheat processing is rare [3]. DTA [4] is a thermobalance technology that uses programs to control the heating rate and sensitivity, by recording the mass and energy change of a substance during heating, it determines the temperature at which the substance begins to lose weight and obtains this substance’s thermal stability. Through non-isothermal kinetics, it can calculate the substance’s activation energy and frequency factor so as to determine the mechanism function of its thermal decomposition reaction and predict its thermal decomposition reaction model, which provides a reliable theoretical reference for the Tartary buckwheat flour in the processing and storage process. The apparent activation energy, frequency factor and mechanism function obtained are also important theoretical parameters in the in-depth study or processing of Tartary buckwheat flour. 2. MATERIALS AND METHODS 2.1 Test materials and equipment Tartary buckwheat flour was purchased from Hangfei Tartary buckwheat Co., Ltd., moisture content is less than 10%. SHMADZU DTG-60 DTA-TG analyzer: Shimadzu Corporation, Japan. The heating range is 20°C~600°C; the atmosphere is static air; the reference material is an empty ceramic crucible. 2.2 Test methods 2.2.1 Method for determining the best thermal analysis image By comparing different sample masses, the corresponding thermal analysis images are first obtained, then the sharpness and apparent degree of the peak shape are also compared to obtain the best thermal analysis image, and this mass is taken as the best sample mass, again by comparing different heating rates we can obtain different thermal analysis images, and the same standard is used to obtain the best thermal analysis conditions and thermal analysis images. 2.2.2 Determination of reaction critical temperature The onset temperature of the Tartary buckwheat flour is determined by the best thermal analysis image obtained and the extrapolated onset temperature of the thermogravimetric curve. International Journal of Heat and Technology Vol. 36, No. 4, December, 2018, pp. 1414-1422 Journal homepage: http://iieta.org/Journals/IJHT 1414

Welcome message from author
This document is posted to help you gain knowledge. Please leave a comment to let me know what you think about it! Share it to your friends and learn new things together.
Transcript
Thermal analysis kinetics of Tartary buckwheat flour
Haiyan Huang*, Jilin Li, Hong Liu
Xichang University, Xichang 61500, China
Corresponding Author Email: [email protected]
https://doi.org/10.18280/ijht.360433 ABSTRACT
Received: 19 February 2018
Accepted: 25 May 2018
This experiment uses a DTA-TG analyzer to perform thermal analysis on Tartary buckwheat
flour under static-air condition. The best experimental conditions for the thermal analysis of
Tartary buckwheat flour are: sample mass 3.000g, heating rate 10°C/min. This paper studies
the thermostabilization of Tartary buckwheat flour and concludes the four stages of thermal
decomposition of Tartary buckwheat flour via extrapolated onset temperature of the
thermogravimetric curve, as well as the proper processing temperature for Tartary buckwheat
flour should be lower than 266.74 °C. By comparing Stava-Sestak method and FWO method,
we can get that the apparent activation energy of the thermal decomposition of Tartary
buckwheat flour is 235.38 KJ/mol, and the frequency factor is LnA = 44.07. Through
comparison between 30 mechanistic function models and kinetic mode function models, it
infers the most probable mechanism function for simulating the thermal decomposition of
Tartary buckwheat flour. The reaction kinetics model of the decomposition of Tartary
buckwheat flour is preliminarily calculated, which has provided a theoretical basis for the
temperature control of Tartary buckwheat flour during the processing.
Keywords:
tartary buckwheat flour, differential
thermal analysis (DTA), thermal analysis
kinetics
1. INTRODUCTION
Tartary buckwheat is a kind of coarse grain which has been
proved by many literatures to have health care function [1]. It
is widely cultivated in the western part of China and has great
development values as people are paying more attention to the
health nowadays. However, in current China, the development
of Tartary buckwheat is still in its infancy compared to other
developed countries, and there are few studies on the modern
process parameters, resulting in the current Tartary buckwheat
products have many problems in the R&D and actual
production process, such as the change of the properties of
active substances due to improper control of processing
temperature during processing weakens the health-care
functions of the Tartary buckwheat products [2]. At present,
the application of Tartary buckwheat in food has involved
aspects of processing methods, processing characteristics,
influence mechanism and processing technology, and the
influence of enzyme chemistry on the quality of processed
products. However, the research and application of DTA
technology in Tartary buckwheat processing is rare [3].
DTA [4] is a thermobalance technology that uses programs
to control the heating rate and sensitivity, by recording the
mass and energy change of a substance during heating, it
determines the temperature at which the substance begins to
lose weight and obtains this substance’s thermal stability.
Through non-isothermal kinetics, it can calculate the
substance’s activation energy and frequency factor so as to
determine the mechanism function of its thermal
decomposition reaction and predict its thermal decomposition
reaction model, which provides a reliable theoretical reference
for the Tartary buckwheat flour in the processing and storage
process. The apparent activation energy, frequency factor and
mechanism function obtained are also important theoretical
parameters in the in-depth study or processing of Tartary
buckwheat flour.
2. MATERIALS AND METHODS
2.1 Test materials and equipment
Tartary buckwheat flour was purchased from Hangfei
Tartary buckwheat Co., Ltd., moisture content is less than 10%.
SHMADZU DTG-60 DTA-TG analyzer: Shimadzu
Corporation, Japan. The heating range is 20°C~600°C; the
atmosphere is static air; the reference material is an empty
ceramic crucible.
2.2 Test methods
2.2.1 Method for determining the best thermal analysis image
By comparing different sample masses, the corresponding
thermal analysis images are first obtained, then the sharpness
and apparent degree of the peak shape are also compared to
obtain the best thermal analysis image, and this mass is taken
as the best sample mass, again by comparing different heating
rates we can obtain different thermal analysis images, and the
same standard is used to obtain the best thermal analysis
conditions and thermal analysis images.
2.2.2 Determination of reaction critical temperature
The onset temperature of the Tartary buckwheat flour is
determined by the best thermal analysis image obtained and
the extrapolated onset temperature of the thermogravimetric
curve.
International Journal of Heat and Technology Vol. 36, No. 4, December, 2018, pp. 1414-1422
Journal homepage: http://iieta.org/Journals/IJHT
1414
2.2.3 Solving thermal analysis kinetic factors
(1) Determination of activation energy E and frequency
factor A
The FWO method is used to substitute the temperature of
the equal conversion rate under different heating rate
conditions in to the FWO equation to solve the activation
energy and the frequency factor [5].
(2) Determination of the mechanism function G(α)
Each mechanism function is substituted into the Satava-
Sestak equation to solve the activation energies Es and As, and
compare them with the activation energy E obtained by the
FWO method. Select a kinetic mode function that satisfies the
following condition: [6]
0
0
0.3sE E
E
− (1)
Then, determine the optimal mechanism function by
calculating the correlation coefficient.
3. RESULTS AND ANALYSIS
3.1 Determination of the best DTA-TGA image
3.1.1 Influence of Tartary buckwheat flour sample mass on
TGA curve
In this paper, a set of five samples were prepared with a
gradient of 1.000g between 1.000g and 5.000g, and the heating
rate was controlled at 10 °C/min. By selecting the mass with
sharp and obvious peak, the best sample mass suitable for the
measuring of TGA curve was selected. The mass change has
no significant effect on the TGA curve, but has a great
influence on the DTA curve, and all curves showed three peaks,
among which the peaks of the 3.000g sample are more obvious
and easier to analyze. By comparison, 3.000 g was finally
selected as the best sample mass for the thermal analysis test
of Tartary buckwheat flour.
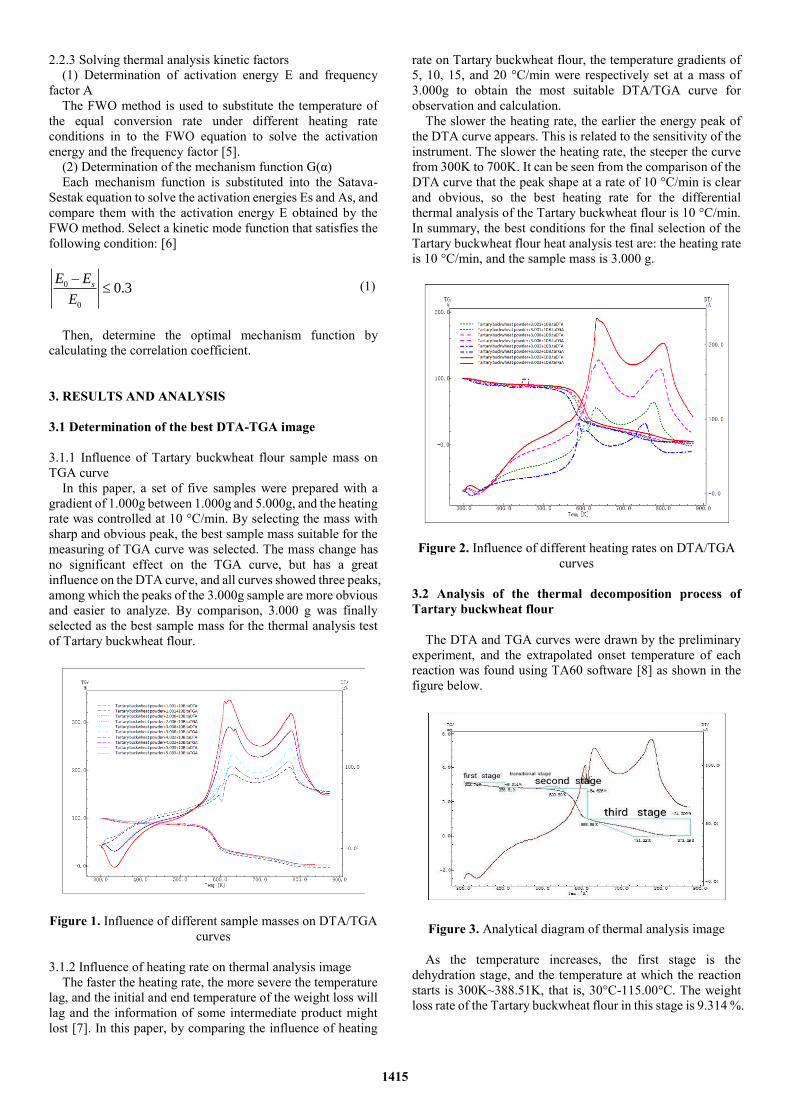
Figure 1. Influence of different sample masses on DTA/TGA
curves
3.1.2 Influence of heating rate on thermal analysis image
The faster the heating rate, the more severe the temperature
lag, and the initial and end temperature of the weight loss will
lag and the information of some intermediate product might
lost [7]. In this paper, by comparing the influence of heating
rate on Tartary buckwheat flour, the temperature gradients of
5, 10, 15, and 20 °C/min were respectively set at a mass of
3.000g to obtain the most suitable DTA/TGA curve for
observation and calculation.
The slower the heating rate, the earlier the energy peak of
the DTA curve appears. This is related to the sensitivity of the
instrument. The slower the heating rate, the steeper the curve
from 300K to 700K. It can be seen from the comparison of the
DTA curve that the peak shape at a rate of 10 °C/min is clear
and obvious, so the best heating rate for the differential
thermal analysis of the Tartary buckwheat flour is 10 °C/min.
In summary, the best conditions for the final selection of the
Tartary buckwheat flour heat analysis test are: the heating rate
is 10 °C/min, and the sample mass is 3.000 g.
Figure 2. Influence of different heating rates on DTA/TGA
curves
3.2 Analysis of the thermal decomposition process of
Tartary buckwheat flour
The DTA and TGA curves were drawn by the preliminary
experiment, and the extrapolated onset temperature of each
reaction was found using TA60 software [8] as shown in the
figure below.
Figure 3. Analytical diagram of thermal analysis image
As the temperature increases, the first stage is the
dehydration stage, and the temperature at which the reaction
starts is 300K~388.51K, that is, 30°C-115.00°C. The weight
loss rate of the Tartary buckwheat flour in this stage is 9.314 %.
1415
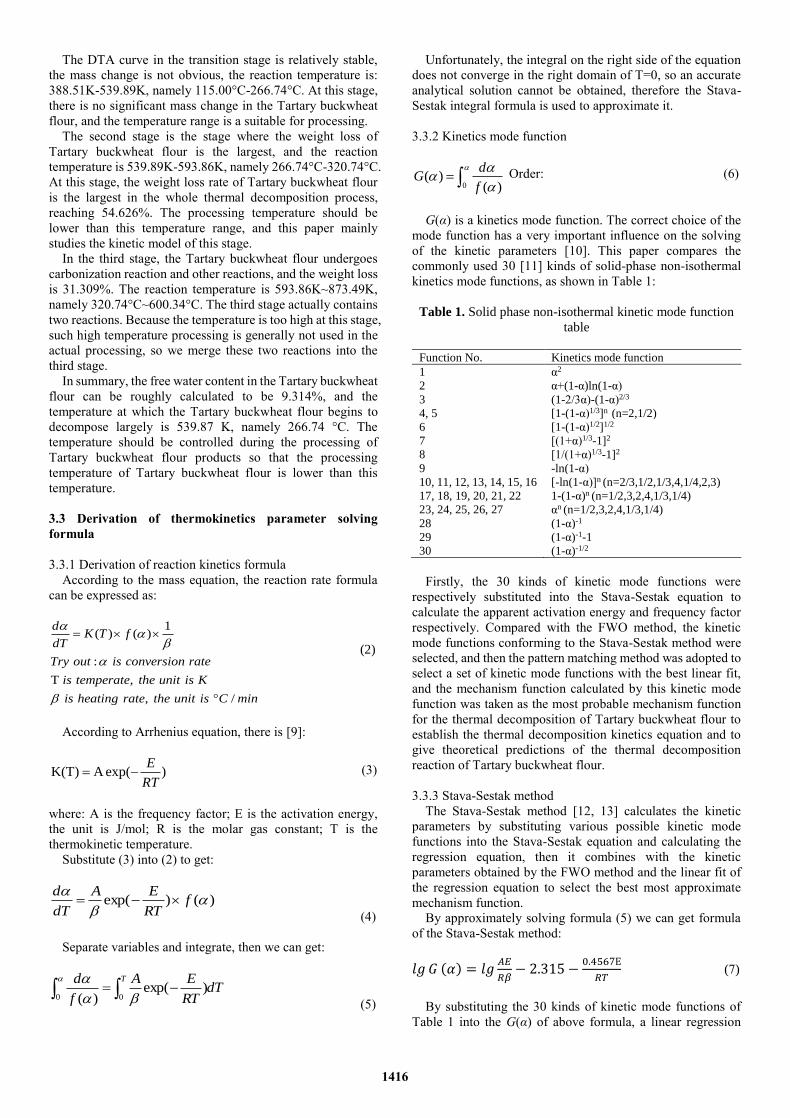
The DTA curve in the transition stage is relatively stable,
the mass change is not obvious, the reaction temperature is:
388.51K-539.89K, namely 115.00°C-266.74°C. At this stage,
there is no significant mass change in the Tartary buckwheat
flour, and the temperature range is a suitable for processing.
The second stage is the stage where the weight loss of
Tartary buckwheat flour is the largest, and the reaction
temperature is 539.89K-593.86K, namely 266.74°C-320.74°C.
At this stage, the weight loss rate of Tartary buckwheat flour
is the largest in the whole thermal decomposition process,
reaching 54.626%. The processing temperature should be
lower than this temperature range, and this paper mainly
studies the kinetic model of this stage.
In the third stage, the Tartary buckwheat flour undergoes
carbonization reaction and other reactions, and the weight loss
is 31.309%. The reaction temperature is 593.86K~873.49K,
namely 320.74°C~600.34°C. The third stage actually contains
two reactions. Because the temperature is too high at this stage,
such high temperature processing is generally not used in the
actual processing, so we merge these two reactions into the
third stage.
In summary, the free water content in the Tartary buckwheat
flour can be roughly calculated to be 9.314%, and the
temperature at which the Tartary buckwheat flour begins to
decompose largely is 539.87 K, namely 266.74 °C. The
temperature should be controlled during the processing of
Tartary buckwheat flour products so that the processing
temperature of Tartary buckwheat flour is lower than this
temperature.
3.3 Derivation of thermokinetics parameter solving
formula
3.3.1 Derivation of reaction kinetics formula
According to the mass equation, the reaction rate formula
can be expressed as:
1( ) ( )
:
,
, /
T
is conversion rate
is temperate the unit is K
is heating rate the
dK T f
dT
Try out
unit is C min
=
(2)
According to Arrhenius equation, there is [9]:
K(T) A exp( )E
RT= − (3)
where: A is the frequency factor; E is the activation energy,
the unit is J/mol; R is the molar gas constant; T is the
thermokinetic temperature.
Substitute (3) into (2) to get:
)()exp(
f
RT
EA
dT
d−=
(4)
Separate variables and integrate, then we can get:
dTRT
EA
f
d T
−=00
)exp()(
(5)
Unfortunately, the integral on the right side of the equation
does not converge in the right domain of T=0, so an accurate
analytical solution cannot be obtained, therefore the Stava-
Sestak integral formula is used to approximate it.
3.3.2 Kinetics mode function
0( )
( )
dG
f
= Order: (6)
G(α) is a kinetics mode function. The correct choice of the
mode function has a very important influence on the solving
of the kinetic parameters [10]. This paper compares the
commonly used 30 [11] kinds of solid-phase non-isothermal
kinetics mode functions, as shown in Table 1:
Table 1. Solid phase non-isothermal kinetic mode function
table
Function No. Kinetics mode function
1 α2
2 α+(1-α)ln(1-α)
3 (1-2/3α)-(1-α)2/3
4, 5 [1-(1-α)1/3]n (n=2,1/2)
6 [1-(1-α)1/2]1/2
7 [(1+α)1/3-1]2
8 [1/(1+α)1/3-1]2
9 -ln(1-α)
10, 11, 12, 13, 14, 15, 16 [-ln(1-α)]n (n=2/3,1/2,1/3,4,1/4,2,3)
17, 18, 19, 20, 21, 22 1-(1-α)n (n=1/2,3,2,4,1/3,1/4)
23, 24, 25, 26, 27 αn (n=1/2,3,2,4,1/3,1/4)
28 (1-α)-1
29 (1-α)-1-1
30 (1-α)-1/2
Firstly, the 30 kinds of kinetic mode functions were
respectively substituted into the Stava-Sestak equation to
calculate the apparent activation energy and frequency factor
respectively. Compared with the FWO method, the kinetic
mode functions conforming to the Stava-Sestak method were
selected, and then the pattern matching method was adopted to
select a set of kinetic mode functions with the best linear fit,
and the mechanism function calculated by this kinetic mode
function was taken as the most probable mechanism function
for the thermal decomposition of Tartary buckwheat flour to
establish the thermal decomposition kinetics equation and to
give theoretical predictions of the thermal decomposition
reaction of Tartary buckwheat flour.
3.3.3 Stava-Sestak method
The Stava-Sestak method [12, 13] calculates the kinetic
parameters by substituting various possible kinetic mode
functions into the Stava-Sestak equation and calculating the
regression equation, then it combines with the kinetic
parameters obtained by the FWO method and the linear fit of
the regression equation to select the best most approximate
mechanism function.
By approximately solving formula (5) we can get formula
of the Stava-Sestak method:
𝑙𝑔 𝐺 (𝛼) = 𝑙𝑔𝐴𝐸
𝑅𝛽− 2.315 −
0.4567E
𝑅𝑇 (7)
By substituting the 30 kinds of kinetic mode functions of
Table 1 into the G(α) of above formula, a linear regression
1416
equation of lgG(α) and 1/T is obtained by using the least
squares method:
baxy −=
Then according to the linear regression equation there are:
E a R 0.4567
lg 2.315 lg lg lgA b R E
=
= + + + − (8)
3.3.4 FWO method
By approximately solving formula (6) we can get the FWO
equation [14]:
RT
E
RG
AE456.0315.2)
)(lg()lg( −−=
(9)
where: β is the heating rate; A is the frequency factor; R is the
ideal gas constant, takes 8.314 here; E is the activation energy,
the unit is KJ/mol; T is the reaction temperature, the unit is K
(Kelvin).
By analyzing formula (9) we can find that, lgβ has a linear
relationship with 1/T. In the actual calculation, α takes the
temperatures of 0.10, 0.20, and 0.30, respectively. The linear
regression equation of the two are obtained by the least square
method. The activation energy E is obtained from the slope,
and the frequency factor A is obtained from the intercept.
An outstanding advantage of the FWO method over other
methods is that it is not necessary to determine the kinetic
mode function. For complex high molecular substances such
as Tartary buckwheat flour, it is often impossible to determine
its specific reaction, so it causes great difficulty for the
determination of the kinetic mode function [15]. The apparent
activation energy of Tartary buckwheat flour can be calculated
more accurately using the FWO method. This outstanding
advantage of FWO method is also often used to test the
correctness of the hypothetical kinetic mode function. The
appropriate kinetic mode function was screened by comparing
with the results calculated by the Stava-Sestak method.
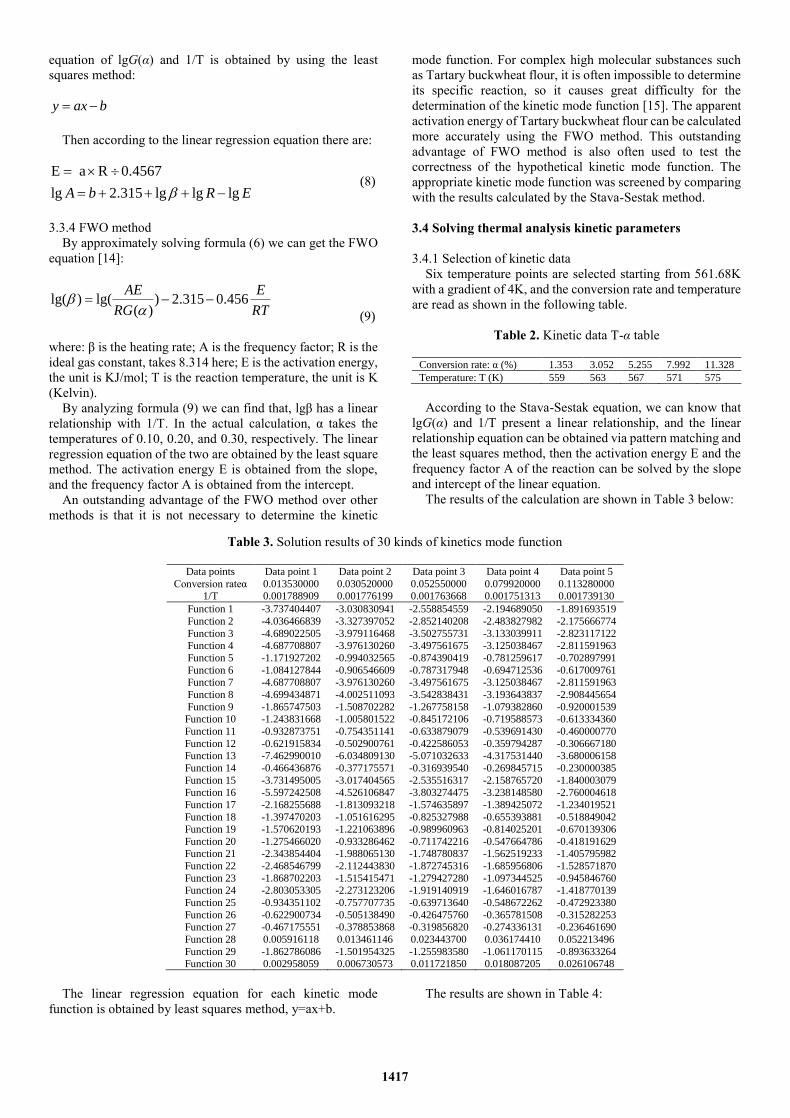
3.4 Solving thermal analysis kinetic parameters
3.4.1 Selection of kinetic data
Six temperature points are selected starting from 561.68K
with a gradient of 4K, and the conversion rate and temperature
are read as shown in the following table.
Table 2. Kinetic data T-α table
Conversion rate: α (%) 1.353 3.052 5.255 7.992 11.328
Temperature: T (K) 559 563 567 571 575
According to the Stava-Sestak equation, we can know that
lgG(α) and 1/T present a linear relationship, and the linear
relationship equation can be obtained via pattern matching and
the least squares method, then the activation energy E and the
frequency factor A of the reaction can be solved by the slope
and intercept of the linear equation.
The results of the calculation are shown in Table 3 below:
Table 3. Solution results of 30 kinds of kinetics mode function
Data points Data point 1 Data point 2 Data point 3 Data point 4 Data point 5
Conversion rateα 0.013530000 0.030520000 0.052550000 0.079920000 0.113280000 1/T 0.001788909 0.001776199 0.001763668 0.001751313 0.001739130
Function 1 -3.737404407 -3.030830941 -2.558854559 -2.194689050 -1.891693519
Function 2 -4.036466839 -3.327397052 -2.852140208 -2.483827982 -2.175666774
Function 3 -4.689022505 -3.979116468 -3.502755731 -3.133039911 -2.823117122 Function 4 -4.687708807 -3.976130260 -3.497561675 -3.125038467 -2.811591963
Function 5 -1.171927202 -0.994032565 -0.874390419 -0.781259617 -0.702897991
Function 6 -1.084127844 -0.906546609 -0.787317948 -0.694712536 -0.617009761 Function 7 -4.687708807 -3.976130260 -3.497561675 -3.125038467 -2.811591963
Function 8 -4.699434871 -4.002511093 -3.542838431 -3.193643837 -2.908445654
Function 9 -1.865747503 -1.508702282 -1.267758158 -1.079382860 -0.920001539 Function 10 -1.243831668 -1.005801522 -0.845172106 -0.719588573 -0.613334360
Function 11 -0.932873751 -0.754351141 -0.633879079 -0.539691430 -0.460000770
Function 12 -0.621915834 -0.502900761 -0.422586053 -0.359794287 -0.306667180 Function 13 -7.462990010 -6.034809130 -5.071032633 -4.317531440 -3.680006158
Function 14 -0.466436876 -0.377175571 -0.316939540 -0.269845715 -0.230000385
Function 15 -3.731495005 -3.017404565 -2.535516317 -2.158765720 -1.840003079
Function 16 -5.597242508 -4.526106847 -3.803274475 -3.238148580 -2.760004618
Function 17 -2.168255688 -1.813093218 -1.574635897 -1.389425072 -1.234019521
Function 18 -1.397470203 -1.051616295 -0.825327988 -0.655393881 -0.518849042 Function 19 -1.570620193 -1.221063896 -0.989960963 -0.814025201 -0.670139306
Function 20 -1.275466020 -0.933286462 -0.711742216 -0.547664786 -0.418191629 Function 21 -2.343854404 -1.988065130 -1.748780837 -1.562519233 -1.405795982
Function 22 -2.468546799 -2.112443830 -1.872745316 -1.685956806 -1.528571870
Function 23 -1.868702203 -1.515415471 -1.279427280 -1.097344525 -0.945846760 Function 24 -2.803053305 -2.273123206 -1.919140919 -1.646016787 -1.418770139
Function 25 -0.934351102 -0.757707735 -0.639713640 -0.548672262 -0.472923380
Function 26 -0.622900734 -0.505138490 -0.426475760 -0.365781508 -0.315282253 Function 27 -0.467175551 -0.378853868 -0.319856820 -0.274336131 -0.236461690
Function 28 0.005916118 0.013461146 0.023443700 0.036174410 0.052213496
Function 29 -1.862786086 -1.501954325 -1.255983580 -1.061170115 -0.893633264 Function 30 0.002958059 0.006730573 0.011721850 0.018087205 0.026106748
The linear regression equation for each kinetic mode
function is obtained by least squares method, y=ax+b.
The results are shown in Table 4:
1417
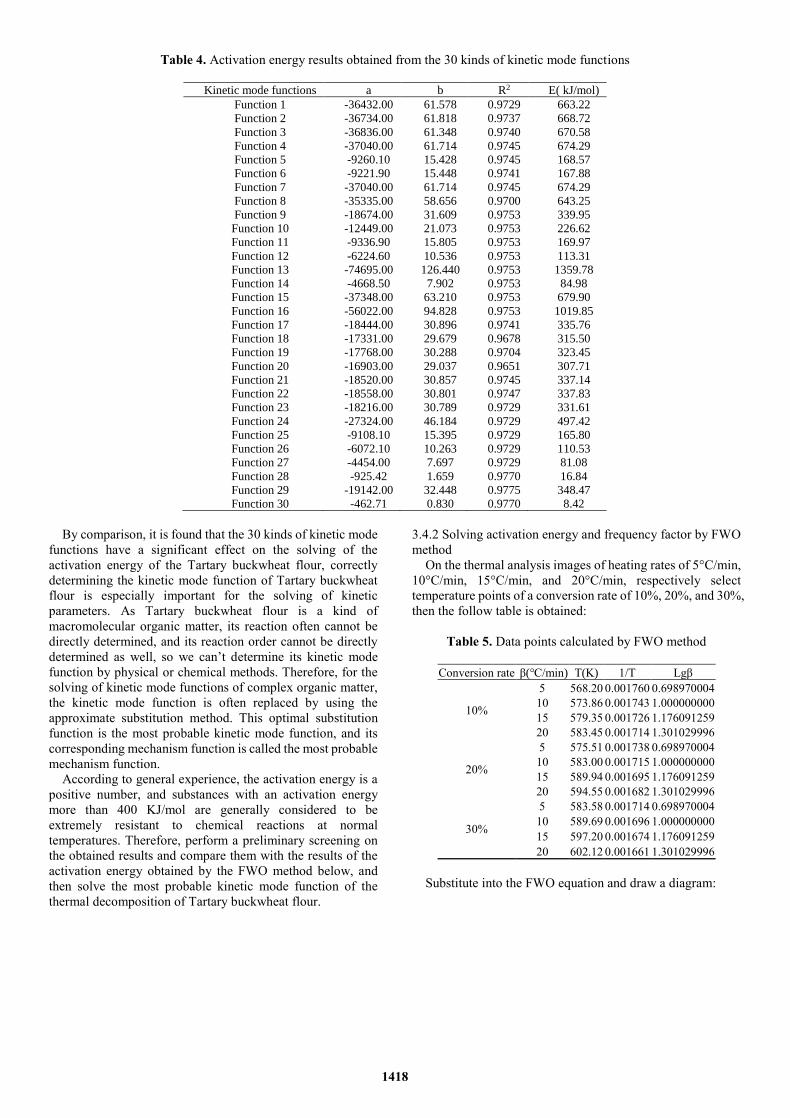
Table 4. Activation energy results obtained from the 30 kinds of kinetic mode functions
Kinetic mode functions a b R2 E( kJ/mol)
Function 1 -36432.00 61.578 0.9729 663.22
Function 2 -36734.00 61.818 0.9737 668.72
Function 3 -36836.00 61.348 0.9740 670.58
Function 4 -37040.00 61.714 0.9745 674.29
Function 5 -9260.10 15.428 0.9745 168.57
Function 6 -9221.90 15.448 0.9741 167.88
Function 7 -37040.00 61.714 0.9745 674.29
Function 8 -35335.00 58.656 0.9700 643.25
Function 9 -18674.00 31.609 0.9753 339.95
Function 10 -12449.00 21.073 0.9753 226.62
Function 11 -9336.90 15.805 0.9753 169.97
Function 12 -6224.60 10.536 0.9753 113.31
Function 13 -74695.00 126.440 0.9753 1359.78
Function 14 -4668.50 7.902 0.9753 84.98
Function 15 -37348.00 63.210 0.9753 679.90
Function 16 -56022.00 94.828 0.9753 1019.85
Function 17 -18444.00 30.896 0.9741 335.76
Function 18 -17331.00 29.679 0.9678 315.50
Function 19 -17768.00 30.288 0.9704 323.45
Function 20 -16903.00 29.037 0.9651 307.71
Function 21 -18520.00 30.857 0.9745 337.14
Function 22 -18558.00 30.801 0.9747 337.83
Function 23 -18216.00 30.789 0.9729 331.61
Function 24 -27324.00 46.184 0.9729 497.42
Function 25 -9108.10 15.395 0.9729 165.80
Function 26 -6072.10 10.263 0.9729 110.53
Function 27 -4454.00 7.697 0.9729 81.08
Function 28 -925.42 1.659 0.9770 16.84
Function 29 -19142.00 32.448 0.9775 348.47
Function 30 -462.71 0.830 0.9770 8.42
By comparison, it is found that the 30 kinds of kinetic mode
functions have a significant effect on the solving of the
activation energy of the Tartary buckwheat flour, correctly
determining the kinetic mode function of Tartary buckwheat
flour is especially important for the solving of kinetic
parameters. As Tartary buckwheat flour is a kind of
macromolecular organic matter, its reaction often cannot be
directly determined, and its reaction order cannot be directly
determined as well, so we can’t determine its kinetic mode
function by physical or chemical methods. Therefore, for the
solving of kinetic mode functions of complex organic matter,
the kinetic mode function is often replaced by using the
approximate substitution method. This optimal substitution
function is the most probable kinetic mode function, and its
corresponding mechanism function is called the most probable
mechanism function.
According to general experience, the activation energy is a
positive number, and substances with an activation energy
more than 400 KJ/mol are generally considered to be
extremely resistant to chemical reactions at normal
temperatures. Therefore, perform a preliminary screening on
the obtained results and compare them with the results of the
activation energy obtained by the FWO method below, and
then solve the most probable kinetic mode function of the
thermal decomposition of Tartary buckwheat flour.
3.4.2 Solving activation energy and frequency factor by FWO
method
On the thermal analysis images of heating rates of 5°C/min,
10°C/min, 15°C/min, and 20°C/min, respectively select
temperature points of a conversion rate of 10%, 20%, and 30%,
then the follow table is obtained:
Table 5. Data points calculated by FWO method
Conversion rate β(℃/min) T(K) 1/T Lgβ
10%
5 568.20 0.001760 0.698970004
10 573.86 0.001743 1.000000000
15 579.35 0.001726 1.176091259
20 583.45 0.001714 1.301029996
20%
5 575.51 0.001738 0.698970004
10 583.00 0.001715 1.000000000
15 589.94 0.001695 1.176091259
20 594.55 0.001682 1.301029996
30%
5 583.58 0.001714 0.698970004
10 589.69 0.001696 1.000000000
15 597.20 0.001674 1.176091259
20 602.12 0.001661 1.301029996
Substitute into the FWO equation and draw a diagram:
1418
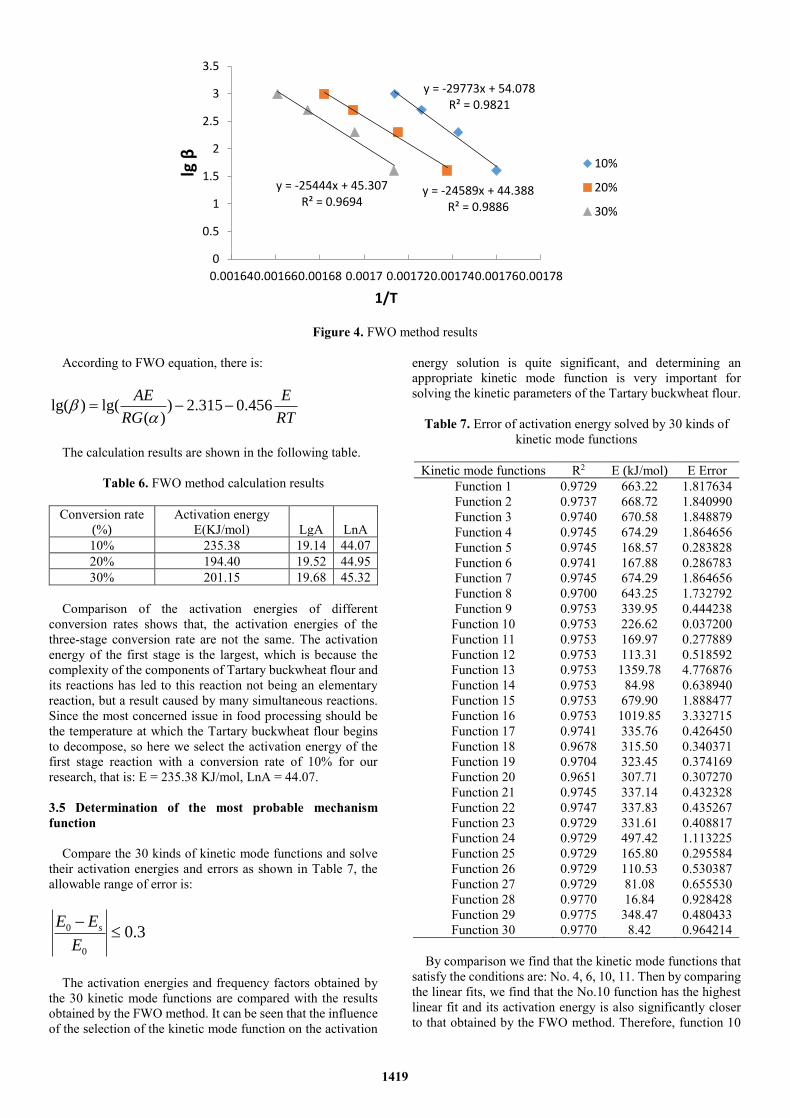
Figure 4. FWO method results
According to FWO equation, there is:
RT
E
RG
AE456.0315.2)
)(lg()lg( −−=
The calculation results are shown in the following table.
Table 6. FWO method calculation results
Conversion rate
(%)
Activation energy
E(KJ/mol) LgA LnA
10% 235.38 19.14 44.07
20% 194.40 19.52 44.95
30% 201.15 19.68 45.32
Comparison of the activation energies of different
conversion rates shows that, the activation energies of the
three-stage conversion rate are not the same. The activation
energy of the first stage is the largest, which is because the
complexity of the components of Tartary buckwheat flour and
its reactions has led to this reaction not being an elementary
reaction, but a result caused by many simultaneous reactions.
Since the most concerned issue in food processing should be
the temperature at which the Tartary buckwheat flour begins
to decompose, so here we select the activation energy of the
first stage reaction with a conversion rate of 10% for our
research, that is: E = 235.38 KJ/mol, LnA = 44.07.
3.5 Determination of the most probable mechanism
function
Compare the 30 kinds of kinetic mode functions and solve
their activation energies and errors as shown in Table 7, the
allowable range of error is:
0.30
0 −
E
EE s
The activation energies and frequency factors obtained by
the 30 kinetic mode functions are compared with the results
obtained by the FWO method. It can be seen that the influence
of the selection of the kinetic mode function on the activation
energy solution is quite significant, and determining an
appropriate kinetic mode function is very important for
solving the kinetic parameters of the Tartary buckwheat flour.
Table 7. Error of activation energy solved by 30 kinds of
kinetic mode functions
Kinetic mode functions R2 E (kJ/mol) E Error
Function 1 0.9729 663.22 1.817634
Function 2 0.9737 668.72 1.840990
Function 3 0.9740 670.58 1.848879
Function 4 0.9745 674.29 1.864656
Function 5 0.9745 168.57 0.283828
Function 6 0.9741 167.88 0.286783
Function 7 0.9745 674.29 1.864656
Function 8 0.9700 643.25 1.732792
Function 9 0.9753 339.95 0.444238
Function 10 0.9753 226.62 0.037200
Function 11 0.9753 169.97 0.277889
Function 12 0.9753 113.31 0.518592
Function 13 0.9753 1359.78 4.776876
Function 14 0.9753 84.98 0.638940
Function 15 0.9753 679.90 1.888477
Function 16 0.9753 1019.85 3.332715
Function 17 0.9741 335.76 0.426450
Function 18 0.9678 315.50 0.340371
Function 19 0.9704 323.45 0.374169
Function 20 0.9651 307.71 0.307270
Function 21 0.9745 337.14 0.432328
Function 22 0.9747 337.83 0.435267
Function 23 0.9729 331.61 0.408817
Function 24 0.9729 497.42 1.113225
Function 25 0.9729 165.80 0.295584
Function 26 0.9729 110.53 0.530387
Function 27 0.9729 81.08 0.655530
Function 28 0.9770 16.84 0.928428
Function 29 0.9775 348.47 0.480433
Function 30 0.9770 8.42 0.964214
By comparison we find that the kinetic mode functions that
satisfy the conditions are: No. 4, 6, 10, 11. Then by comparing
the linear fits, we find that the No.10 function has the highest
linear fit and its activation energy is also significantly closer
to that obtained by the FWO method. Therefore, function 10
y = -29773x + 54.078R² = 0.9821
y = -24589x + 44.388R² = 0.9886
y = -25444x + 45.307R² = 0.9694
0
0.5
1
1.5
2
2.5
3
3.5
0.001640.001660.00168 0.0017 0.001720.001740.001760.00178
lg β
1/T
10%
20%
30%
1419
is selected as the kinetic mode function for the Tartary
buckwheat flour, that is:
3/2)]1ln([G −−=)(
The most probable mechanism function of the thermal
decomposition of Tartary buckwheat flour calculated by above
formula is:
1/33( ) [ ln(1 )] (1- )
2f = − −
3.6 Establishment of the kinetic equation of Tartary
buckwheat flour
The activation energy calculated by the FWO method is:
E=235.38 KJ/mol
The frequency factor is: lnA=44.07.
Using Stava-Sestak method, the activation energies
calculated by 30 kinds of kinetic mode functions are compared
and then perform logical analysis of its linear fitness to screen
out the most probable mechanism function [16].
In summary, the kinetic equation is obtained as follows:
1/3235384.32 3exp{44.07 } (1 ) [ ln(1 )]
2
d
dt RT
= − − • − −
Separate the variable and integrate both sides of the
equation simultaneously to get:
2
3235384.32
[ ln(1 )] exp{44.07 } tRT
− − = −
A thermal analysis kinetic model for the Tartary buckwheat
flour is obtained, then predict the kinetic model of the Tartary
buckwheat flour.
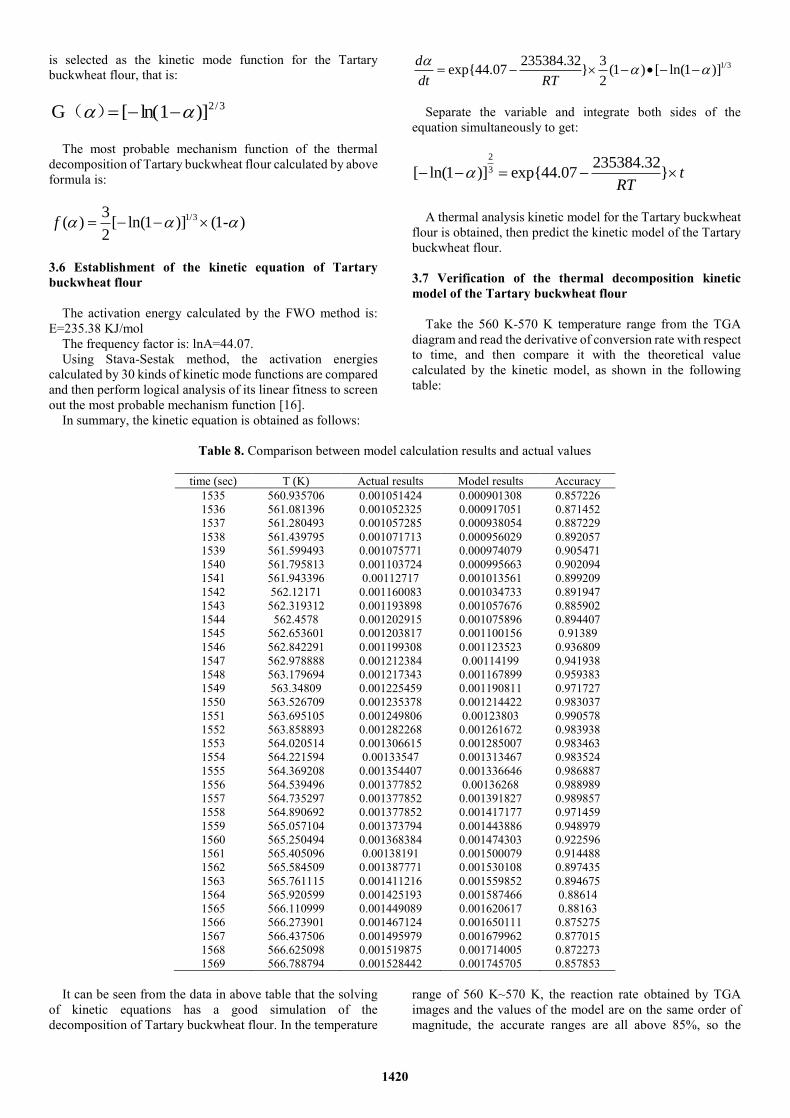
3.7 Verification of the thermal decomposition kinetic
model of the Tartary buckwheat flour
Take the 560 K-570 K temperature range from the TGA
diagram and read the derivative of conversion rate with respect
to time, and then compare it with the theoretical value
calculated by the kinetic model, as shown in the following
table:
Table 8. Comparison between model calculation results and actual values
time (sec) T (K) Actual results Model results Accuracy
1535 560.935706 0.001051424 0.000901308 0.857226
1536 561.081396 0.001052325 0.000917051 0.871452
1537 561.280493 0.001057285 0.000938054 0.887229
1538 561.439795 0.001071713 0.000956029 0.892057
1539 561.599493 0.001075771 0.000974079 0.905471
1540 561.795813 0.001103724 0.000995663 0.902094
1541 561.943396 0.00112717 0.001013561 0.899209
1542 562.12171 0.001160083 0.001034733 0.891947
1543 562.319312 0.001193898 0.001057676 0.885902
1544 562.4578 0.001202915 0.001075896 0.894407
1545 562.653601 0.001203817 0.001100156 0.91389
1546 562.842291 0.001199308 0.001123523 0.936809
1547 562.978888 0.001212384 0.00114199 0.941938
1548 563.179694 0.001217343 0.001167899 0.959383
1549 563.34809 0.001225459 0.001190811 0.971727
1550 563.526709 0.001235378 0.001214422 0.983037
1551 563.695105 0.001249806 0.00123803 0.990578
1552 563.858893 0.001282268 0.001261672 0.983938
1553 564.020514 0.001306615 0.001285007 0.983463
1554 564.221594 0.00133547 0.001313467 0.983524
1555 564.369208 0.001354407 0.001336646 0.986887
1556 564.539496 0.001377852 0.00136268 0.988989
1557 564.735297 0.001377852 0.001391827 0.989857
1558 564.890692 0.001377852 0.001417177 0.971459
1559 565.057104 0.001373794 0.001443886 0.948979
1560 565.250494 0.001368384 0.001474303 0.922596
1561 565.405096 0.00138191 0.001500079 0.914488
1562 565.584509 0.001387771 0.001530108 0.897435
1563 565.761115 0.001411216 0.001559852 0.894675
1564 565.920599 0.001425193 0.001587466 0.88614
1565 566.110999 0.001449089 0.001620617 0.88163
1566 566.273901 0.001467124 0.001650111 0.875275
1567 566.437506 0.001495979 0.001679962 0.877015
1568 566.625098 0.001519875 0.001714005 0.872273
1569 566.788794 0.001528442 0.001745705 0.857853
It can be seen from the data in above table that the solving
of kinetic equations has a good simulation of the
decomposition of Tartary buckwheat flour. In the temperature
range of 560 K~570 K, the reaction rate obtained by TGA
images and the values of the model are on the same order of
magnitude, the accurate ranges are all above 85%, so the
1420
established kinetic mode function is relative reliable. Also, we
can see from the table that the accuracy decreases with the
increase of temperature, this may be determined by the
complex components of the Tartary buckwheat flour itself.
This conclusion has also been verified when using FWO
method, under a higher temperature, the activation energy,
frequency factor and most probable mechanism function have
changed [17-21]. However, in food processing, what we
concern most is the first stage reaction, so we will not further
solve and discuss the reactions in later stages here.
4. DISCUSSION
4.1 Determination of proper processing temperature
By thermal analysis, we can get the temperature at which
the Tartary buckwheat flour begins to decompose is 539.89 K
or 266.74 °C. In order to reduce the reaction of Tartary
buckwheat flour during the actual production and processing,
the processing temperature should be lower than this
temperature.
4.2 Determination of the best experimental conditions for
the kinetic test of Tartary buckwheat flour
By comparing the thermal analysis images obtained by
different masses and different heating rate conditions, the best
conditions for obtaining the thermal analysis test of the Tartary
buckwheat flour by selecting sharp and obvious peak images
are: the sample mass is 3.000g, and the heating rate is:
10 °C/min.
4.3 Determination of the thermal decomposition stages of
Tartary buckwheat flour
Through the thermal decomposition image of Tartary
buckwheat flour, we can get that the decomposition of Tartary
buckwheat flour can be divided into four stages: the initial
dehydration stage, the transition stage, the first reaction stage,
and the second reaction stage. Among them, the Tartary
buckwheat flour in the transition stage is the most stable, and
it is the optimal temperature range for processing, which is
115.00 °C~266.74 °C. In the first stage, the weight loss of the
Tartary buckwheat flour is the most serious, and the onset
temperature of the reaction is 266.74 °C, and this temperature
should be avoided in order to prevent mass loss during
processing. The second stage is the final reaction stage of the
Tartary buckwheat flour, in which the Tartary buckwheat flour
begins to undergo carbonization and other reactions.
4.4 Establishment of kinetic model for the thermal
decomposition of Tartary buckwheat flour
This paper uses the FWO method to calculate the activation
energy of the thermal decomposition reaction of Tartary
buckwheat flour to be: 235.38 KJ/mol, frequency factor: LnA
= 44.07. By comparing the activation energies solved by the
30 kinds of kinetic mode functions and the activation energy
solved by the FWO method, and by comparing the linear fits
of the 30 kinetic mode functions, we can find that the No.10
kinetic mode function is the most probable kinetic mode
function for the thermal decomposition of Tartary buckwheat
flour, that is:
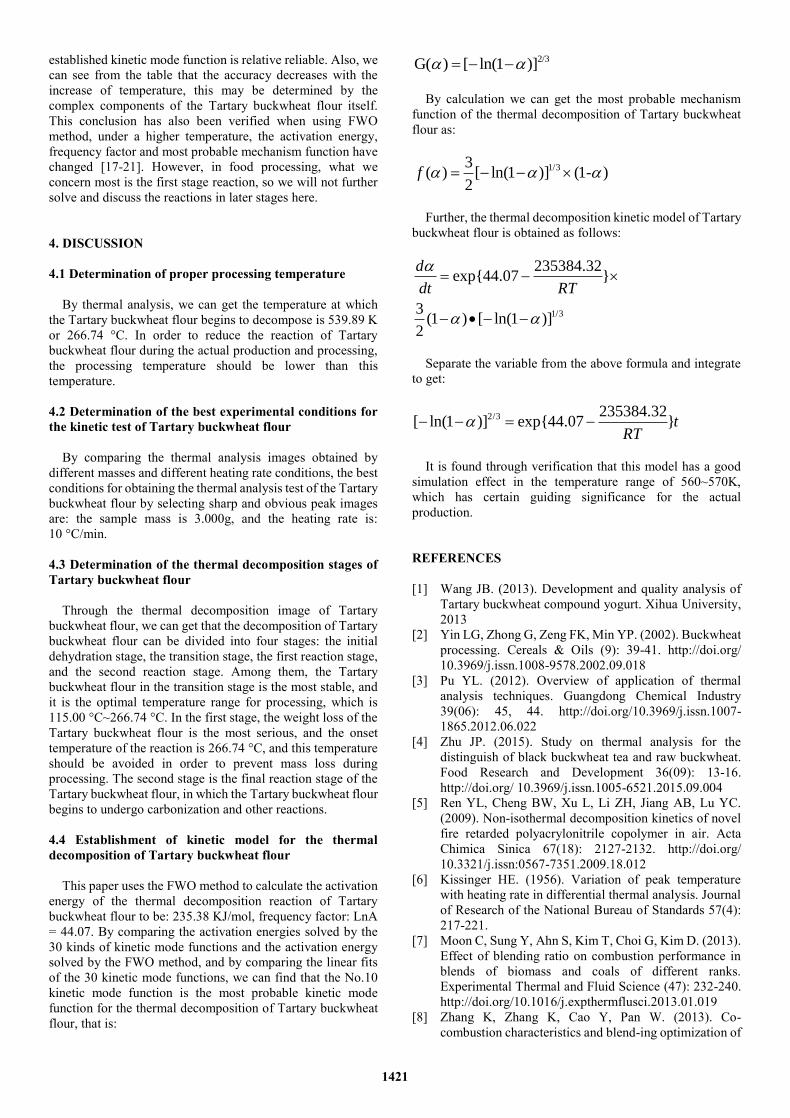
2/3G( ) [ ln(1 )] = − −
By calculation we can get the most probable mechanism
function of the thermal decomposition of Tartary buckwheat
flour as:
1/33( ) [ ln(1 )] (1- )
2f = − −
Further, the thermal decomposition kinetic model of Tartary
buckwheat flour is obtained as follows:
1/3
235384.32exp{44.07 }
3(1 ) [ ln(1 )]
2
d
dt RT
= −
− • − −
Separate the variable from the above formula and integrate
to get:
2/3 235384.32[ ln(1 )] exp{44.07 }t
RT− − = −
It is found through verification that this model has a good
simulation effect in the temperature range of 560~570K,
which has certain guiding significance for the actual
production.
REFERENCES
[1] Wang JB. (2013). Development and quality analysis of
Tartary buckwheat compound yogurt. Xihua University,
2013
[2] Yin LG, Zhong G, Zeng FK, Min YP. (2002). Buckwheat
processing. Cereals & Oils (9): 39-41. http://doi.org/
10.3969/j.issn.1008-9578.2002.09.018
[3] Pu YL. (2012). Overview of application of thermal
analysis techniques. Guangdong Chemical Industry
39(06): 45, 44. http://doi.org/10.3969/j.issn.1007-
1865.2012.06.022
[4] Zhu JP. (2015). Study on thermal analysis for the
distinguish of black buckwheat tea and raw buckwheat.
Food Research and Development 36(09): 13-16.
http://doi.org/ 10.3969/j.issn.1005-6521.2015.09.004
[5] Ren YL, Cheng BW, Xu L, Li ZH, Jiang AB, Lu YC.
(2009). Non-isothermal decomposition kinetics of novel
fire retarded polyacrylonitrile copolymer in air. Acta
Chimica Sinica 67(18): 2127-2132. http://doi.org/
10.3321/j.issn:0567-7351.2009.18.012
[6] Kissinger HE. (1956). Variation of peak temperature
with heating rate in differential thermal analysis. Journal
of Research of the National Bureau of Standards 57(4):
217-221.
[7] Moon C, Sung Y, Ahn S, Kim T, Choi G, Kim D. (2013).
Effect of blending ratio on combustion performance in
blends of biomass and coals of different ranks.
Experimental Thermal and Fluid Science (47): 232-240.
http://doi.org/10.1016/j.expthermflusci.2013.01.019
[8] Zhang K, Zhang K, Cao Y, Pan W. (2013). Co-
combustion characteristics and blend-ing optimization of
1421
tobacco stem and high-sulfur bituminous coal based o-n
thermogravimetric and mass spectrometry analyses.
Bioresources Technology 131: 325-332.
http://doi.org/10.1016/j.biortech.2012.12.163
[9] Jiang C. (2015). Optimization of coal spontaneous
combustion mechanism function by artificial fish swarm
algorithm. Liaoning University of Engineering and
Technology.
[10] Zou SP, Wu YL, Yang MD, Li C, Tong JM. (2009)
Pyrolysis characteristics and kinetics of the marine
microalgae Dunaliella tertiolecta using
thermogravimetric analyzer. Bioresource Technology
101(1) 359-365.
http://doi.org/10.1016/j.biortech.2009.08.020
[11] Wang WW. (2012). biomass characteristics research
based on TGA test and BP neural network. North China
Electric Power University.
[12] Lai YH, Lu MX, Ma CY, Shi MH. (2001). Research on
pyrolysis characteristics of agricultural residues under
liner heating temperature. Journal of Combustion
Science and Technology 7(3): 245-248.
http://doi.org/10.3321/j.issn:1006-8740.2001.03.009
[13] Liu RH, Yuan HR, Xu L. (2007). Kinetic study of maize
straw pyrolysis. Acta Energiae Solaris Sinica 28(5): 527-
531. http://doi.org/10.3321/j.issn:0254-
0096.2007.05.014
[14] Liu ZH, Xu GH, Zhang HL. (2006). Thermal analysis
instrument. Beijing: Chemical Industry Press, 2006
[15] Hu RZ, Shi QZ. (2001). Thermal analysis dynamics.
Beijing: Science Press.
[16] Wang MF, Jiang EC, Zhou L. (2009). Kinetic analysis of
cornstalk pyrolysis. Transactions of The Chinese Society
of Agricultural Engineering 25(2): 204-207.
[17] Alonso M, Borrego A G, Alvarez D, Menéndez R. (2001).
Reactivity study of chars obtained at different
temperatures in relation to their petrographic
characteristics. Fuel Processing Technology 69(3): 257-
272. http://doi.org/10.1016/S0378-3820(00)00146-6
[18] Zhao M, Wu W, Lu M, Wei XY. (2002). Pyrolysis
kinetics of rice straw. Transactions of The Chinese
Society of Agricultural Engineering 18(1): 107-110.
http://doi.org/ 10.1007/s11769-002-0038-4
[19] Stenseng M, Jensen A, Dam-Johansen K. (2001).
Investigation of biomass pyrolysis by thermogravimetric
analysis and differential scanning calorimetry. Journal of
Analytical and Applied Pyrolysis 58(1): 765-780.
http://doi.org/ 10.1016/S0165-2370(00)00200-X
[20] Jiang L, Wang YZ, Yu T, Wu T. (2013). Mechanism of
synergistic corrosion of sulfur and chlorine components
in biomass mixed coal combustion. Power Station
System Engineering (03): 1-4
[21] Liu HX, Cao YB, Li YX. (2009). Application of thermal
analysis in the analysis of edible spices and flavors. Food
Science 30(17): 349-354. http://doi.org/10.1007/978-3-
540-85168-4_52
APPENDIX
Symbol description
E activation energy, KJ•mol-1
G(α) kinetics mode function
TGA curve: thermogravimetric analysis curve
DTA curve: differential thermal analysis curve
K thermokinetic temperature, unit in K (Kelvin)
α solid sample mass conversion rate
T temperature, K
β differential thermal analysis heating rate: °C/min
f(α) reaction mechanism function
R ideal gas constant, 8.314 KJ•mol-1
Exp natural logarithm
E0 activation energy calculated by the FWO method,
KJ•mol-1
Es activation energy calculated by the Stava-Sestak
method, KJ•mol-1
t time, unit: second
1422
Related Documents