
Welcome message from author
This document is posted to help you gain knowledge. Please leave a comment to let me know what you think about it! Share it to your friends and learn new things together.
Transcript
Fakultät für
Naturwissenschaften
Institut für Elektrochemie
Theory-based Investigation of theSolid Electrolyte Interphase inLithium-ion Systems
Dissertation zur Erlangung des Doktorgrades Dr. rer. nat. der Fakultät für
Naturwissenschaften der Universität at Ulm
Vorgelegt von
Fabian Joschka Single
aus Stuttgart, 2020
Dekan:
Prof. Dr. Thorsten Bernhardt
Erstgutachter:
Prof. Dr. Arnulf Latz
Zweitgutachter:
Prof. Dr. Timo Jacob
Drittgutachter:
Prof. Dr. Bernhard Roling
Betreuer:
PD Dr. Birger Horstmann
Tag der Promotion:
6.7.2021
Preface
This document is the compilation of all the results I have achieved during mydoctorate between 2014 and 2019. It was supervised by Prof. Arnulf Latz, head ofthe department Computational Electrochemistry at the Institute of EngineeringThermodynamics of the German Aerospace Center (DLR). The department isalso aliated with Helmholtz Institute Ulm (HIU) where it is predominantlysituated and the thesis was written.This is a cumulative dissertation. As such, it contains a concise summary of
all relevant concepts and results that have been investigated in the course of mywork at the HIU. The full scope of the research can be found in the publicationsbelow. They are referred to as Paper I - Paper V throughout this document.For each publication, summary and discussion can be found in a dedicated sectionof chapter 3. Additionally, all manuscripts are attached in the last chapter of thisdissertation.
I Fabian Single, Birger Horstmann, and Arnulf Latz. Dynamics and mor-phology of solid electrolyte interphase (SEI). Physical Chemistry ChemicalPhysics, 18(27):17810-17814, 2016. doi 10.1039/C6CP02816K
II Fabian Single, Birger Horstmann, and Arnulf Latz. Revealing SEI Mor-phology: In-Depth Analysis of a Modeling Approach. Journal of The Elec-trochemical Society, 164(11):E3132-E3145, 2017. doi 10.1149/2.0121711jes
III Fabian Single, Arnulf Latz, and Birger Horstmann. Identifying the Mech-anism of Continued Growth of the Solid-Electrolyte Interphase. Chem-SusChem, 11(12):1950-1955, 2018. doi 10.1002/cssc.201800077
IV Birger Horstmann, Fabian Single, and Arnulf Latz. Review on multi-scalemodels of solid-electrolyte interphase formation. Current Opinion in Elec-trochemistry, 13:61-69, feb 2019. doi 10.1016/j.coelec.2018.10.013
V Fabian Single, Birger Horstmann, and Arnulf Latz. Theory of ImpedanceSpectroscopy for Lithium Batteries. The Journal of Physical Chemistry C,123(45):27327-27343, 2019. doi 10.1021/acs.jpcc.9b07389
Interim results of this work were also shown at several conferences and work-shops. These contributions include posters, presentations, and proceeding arti-cles.
1. Fabian Single, Birger Horstmann, and Arnulf Latz. Modelling and Simula-tion of the Solid Electrolyte Interphase with varying Porosity. ModVal 12,Freiburg, March/2015. Presentation
i
2. Fabian Single, Erkmen Karaca, Birger Horstmann, and Arnulf Latz. Simu-lation and modelling of the solid electrolyte interphase with varying poros-ity. 227th ECS Meeting, Chicago, May/2015. Conference proceeding, seereference [1]
3. Fabian Single, Birger Horstmann, and Arnulf Latz. Modelling Solid Elec-trolyte Interphase growth, a Novel Description of Porous Layer Evolution.Bunsentagung 2016, Rostock, May/2016. Presentation
4. Fabian Single, Schmitt, Tobias, Birger Horstmann, and Arnulf Latz. Mod-eling SEI Formation and Morphology. 67th Annual Meeting of the Interna-tional Society of Electrochemistry, Den Haag, August/2016. Presentationand poster
5. Fabian Single, Tobias Schmitt, Arnulf Latz, and Birger Horstmann. Model-ing Solid Elektrolyte Interphase Formation and Morphology. 2nd ScienticSCI Meeting, Berlin, November/2016. Poster
6. Fabian Single, Birger Horstmann, and Arnulf Latz. Theory-based Investi-gation of SEI Formation. ModVal 14, Karlsruhe, March/2017. Presentation
7. Fabian Single, Birger Horstmann, and Arnulf Latz. Revealing SEI Mor-phology: A Novel Modelling Approach. 231st ECS Meeting, New Orleans,May/2017. Presentation
8. Fabian Single, Birger Horstmann, and Arnulf Latz. Revealing the mech-anisms behind long-term SEI formation. Science Award Electrochemistry,Karlsruhe, November/2017. Poster
ii

Acknowledgements
Redacted in electronic version.
iii

Abstract and Summary
The primary research focus of this thesis is the Solid Electrolyte Interphase (SEI).This is a thin lm covering the surface of negative electrodes in many electro-chemical cells such as modern lithium-ion batteries. The SEI has an essentialprotective function in the battery as it stabilises the electrode interface with theliquid electrolyte. At low potentials, pristine electrodes reduce the electrolyte andSEI is formed from solid products of these reduction reactions. Once established,SEI passivates the electrode and electrolyte reduction is mostly suppressed. How-ever, the slow rate at which these reactions continue to proceed cause sustainedSEI growth during battery life. This process leads to irreversible loss of cyclablelithium and reduces the capacity of modern lithium-ion batteries. The main partof this work is about models that describe this long-term growth. These modelsshare the same overall objective, which is to identify the underlying mechanismresponsible for this eect. The nal part of the thesis is about an electrochemicalimpedance model. It predicts the impedance signal of a symmetric cell with twometal Li-electrodes that are coated with SEI layers. As a physics-based model,it is designed to improve the reliability and consistency of impedance spectrainterpretation in comparison to commonly used equivalent circuits.Previous theoretic studies about long-term SEI growth are almost entirely
based on the assumption of transport-limited growth. This concept considersa homogeneous surface lm and models SEI thickness evolution by assumingthat the rate of the formation reaction is limited by the availability of a singleprecursor. Said precursor can reach the reaction interface because an unknownmechanism allows it to cross the SEI. Below, this mechanism is referred to as thelong-term growth mechanism (LTGM). Prominent examples studied in previousliterature include electron migration, electron tunnelling, and solvent diusion.However, each of these LTGMs results in a qualitatively similar prediction for thelong-term evolution of SEI thickness. Therefore, previous studies have not beenable to identify the LTGM conclusively. Only Tang et al. addressed this issueby studying multiple mechanisms and the corresponding potential dependence ofSEI formation [2]. SEI growth models developed and studied in this thesis followa similar approach. Some extend the rate-limiting idea and aim to predict addi-tional SEI features that can be validated with experiments while others consideradditional dependencies to identify the LTGM.The rst such model is published in Paper I. It assumes electron conduction
as the LTGM and utilises a novel continuum description of the growing SEI.This enables the model to predict SEI morphology in addition to the growthbehaviour. In the basic version, the model predicts that the SEI has a non-zeroporosity which is constant throughout the lm. The model shows how thesepores are established by the competition between two counter-moving transportmechanisms. Paper I also reports how a dual-layer SEI can be formed when two
v
distinct SEI formation reactions are considered. Specically, the model predictsthat the SEI features a dense inner layer and a porous outer layer if co-solventreduction is considered.Paper II is based on the same model and includes the theory and results of the
rst publication. In comparison, these parts are more detailed and comprehensive.Additionally, two new model modications are presented. Firstly, the model isextended with solid convection to describe mechanical deformation of the SEI.This truly allows lm growth to occur at the electrode/SEI interface or within theSEI itself. In this way, the model can be used to describe SEI growth with solventdiusion acting as the LTGM as well. However, it predicts an unstable SEI growthrate if this mechanism facilitates SEI growth. The rate of solvent diusing throughthe SEI is orders of magnitudes more sensitive to porosity uctuations of the SEIthan any other mechanisms. Local porosity uctuations occur during chargeand discharge of a battery and would lead to an inhomogeneous distribution ofSEI thickness. This is not observed in experiments and suggests that solventdiusion cannot be the LTGM. Secondly, Paper II is the rst publication thatuses the diusion of neutral lithium-interstitials through the SEI as the LTGMin an SEI growth model. As suggested in previous theoretical studies, neutrallithium-interstitials exist at interstitial sites in Li2CO3 [3]. Their concentration inthe solid SEI matrix depends on the potential and is multiple orders of magnitudesmaller than the concentration of lithium-ions. Using lithium-interstitial diusionas the LTGM (instead of electron migration) does not result in a dierent growthbehaviour of the surface layer. The mechanism also produces qualitatively similarSEI morphologies. Therefore, other SEI properties or dependencies need to beconsidered for conclusive identication of the LTGM.This approach is used in the subsequent publication, Paper III. It was inspired
and enabled by a publication of Keil et al. who published a comprehensive studyon capacity fade in commercial lithium-ion batteries with a long-term storageexperiment [4] . They showed that capacity fade depends strongly on the state ofcharge (SOC) at which the battery is stored. In Paper III, the storage experi-ment is modelled with the assumption that long-term SEI growth is the primarydegradation mechanism. The potential dependence of capacity fade produced byfour dierent LTGMs is compared to experimental data. Solvent diusion showsno such dependence at all. Both electron tunnelling and electron conductiondo produce a potential dependence; however, it is not consistent with the ex-periment. Only assuming lithium-interstitial diusion as the LTGM results in aquantitative agreement with experiment. In conclusion, the comparison suggestsonce again that solvent diusion cannot be the mechanism that causes long-termSEI growth. In turn, the diusion of neutral lithium-interstitials emerges as anew prominent LTGM candidate.These results motivated Paper IV, a review paper on previous and current
theoretic studies on SEI. It comprehensively summarises results from multiplecomputational methods that have been used to study dierent aspects of theSEI. This includes results from Paper I−Paper III which are discussed in thecontext of other publications on this subject.In the nal part of this thesis, the focus shifts from models that describe SEI
growth to models that can be used for SEI characterisation. To this aim, an
vi
impedance model for a symmetric lithium cell with planar electrodes has beendeveloped. Both lithium electrodes are covered by surface lms that are con-sidered by the model. The model is published in Paper V and features twoimprovements over other similar models. Firstly, it is based on a comprehen-sive theory of lithium-ion transport in the SEI and the electrolyte phase. Thetheory uses a well-dened set of transport parameters and considers convectionwith the centre-of-mass reference frame. Secondly, the model is fully analyticaland reveals the complete parameter dependence of the complex impedance sig-nal. Measurements by Wohde et al. [5] are used for model validation. Withthis experiment, parameter identication is not completely unambiguous becauseindividual impedance features overlap. This is a common problem for electro-chemical impedance measurements of complex systems. Nonetheless, the modelsuggests that lithium-ion transport through the SEI has a transference numberof nearly one. Therefore, lithium-ion transport in the SEI has solid electrolytecharacter and is most likely facilitated by the solid phase of the SEI. The fullpotential of the model could be utilised with a well-tailored experiment, e.g., bydesigning the system such that the overlap of dierent resonances is minimised.Apart from these results, the impedance model also reveals the complex pa-
rameter dependence of the nite-length Warburg impedance, which is producedat very low frequencies in the symmetric cell. This complexity emerges at highsalt concentration and necessitates the consideration of convection in the elec-trolyte. Convective motion must be described with a well-dened reference frameand all transport parameters must be adapted accordingly. In this context, themodel is suited for consistent determination of electrolyte transport parametersin a complete theoretical framework.
vii

Contents
1 Introduction and Motivation 1
1.1 Experimental Techniques used for SEI Characterization . . . . . . 51.2 Experimental Understanding of SEI . . . . . . . . . . . . . . . . . 81.3 Theoretical Understanding of SEI . . . . . . . . . . . . . . . . . . 19
1.3.1 Atomistic Studies . . . . . . . . . . . . . . . . . . . . . . . 201.3.2 Continuum SEI growth Models . . . . . . . . . . . . . . . 23
2 Theory 29
2.1 Transport Theory . . . . . . . . . . . . . . . . . . . . . . . . . . . 292.1.1 Transport in Porous Media . . . . . . . . . . . . . . . . . . 302.1.2 Dilute Solution Theory . . . . . . . . . . . . . . . . . . . . 332.1.3 Constraints in Liquid Mixtures . . . . . . . . . . . . . . . 352.1.4 Binary Electrolyte . . . . . . . . . . . . . . . . . . . . . . 36
2.2 Electrochemical Kinetics . . . . . . . . . . . . . . . . . . . . . . . 362.3 Finite Volume Method Discretisation . . . . . . . . . . . . . . . . 372.4 Parabolic and Logarithmic Growth . . . . . . . . . . . . . . . . . 40
2.4.1 Electron Tunnelling based SEI Growth Model . . . . . . . 422.4.2 Diusion or Migration based SEI Growth Models . . . . . 43
3 Cumulative Part 47
3.1 Dynamics and Morphology of SEI . . . . . . . . . . . . . . . . . . 493.1.1 Abstract . . . . . . . . . . . . . . . . . . . . . . . . . . . . 493.1.2 Theory . . . . . . . . . . . . . . . . . . . . . . . . . . . . . 513.1.3 Results and Discussion . . . . . . . . . . . . . . . . . . . . 543.1.4 Explanation of own Contribution . . . . . . . . . . . . . . 55
3.2 Revealing SEI Morphology . . . . . . . . . . . . . . . . . . . . . . 573.2.1 Abstract . . . . . . . . . . . . . . . . . . . . . . . . . . . . 583.2.2 Theory . . . . . . . . . . . . . . . . . . . . . . . . . . . . . 583.2.3 Results and Discussion . . . . . . . . . . . . . . . . . . . . 613.2.4 Explanation of own Contribution . . . . . . . . . . . . . . 64
3.3 Identifying the Mechanism of Continued Growth of the SEI . . . . 673.3.1 Abstract . . . . . . . . . . . . . . . . . . . . . . . . . . . . 673.3.2 Theory . . . . . . . . . . . . . . . . . . . . . . . . . . . . . 683.3.3 Results and Discussion . . . . . . . . . . . . . . . . . . . . 693.3.4 Explanation of own contribution . . . . . . . . . . . . . . . 72
3.4 Review on multi-scale Models of SEI Formation . . . . . . . . . . 733.4.1 Explanation of own contribution . . . . . . . . . . . . . . . 73
3.5 Theory of Impedance Spectroscopy for Lithium Batteries . . . . . 753.5.1 Abstract . . . . . . . . . . . . . . . . . . . . . . . . . . . . 753.5.2 Theory . . . . . . . . . . . . . . . . . . . . . . . . . . . . . 76
ix
Contents
3.5.3 Results and Discussion . . . . . . . . . . . . . . . . . . . . 783.5.4 Explanation of own Contribution . . . . . . . . . . . . . . 84
4 Conclusion and Outlook 85
Bibliography 91
Attached Publications 111
Paper I: Dynamics and Morphology of SEI . . . . . . . . . . . . . . .Manuscript . . . . . . . . . . . . . . . . . . . . . . . . . . . . . . 113Electronic Supporting Information . . . . . . . . . . . . . . . . . . 119
Paper II: Revealing SEI Morphology . . . . . . . . . . . . . . . . . . .Manuscript . . . . . . . . . . . . . . . . . . . . . . . . . . . . . . 121
Paper III: Identifying the Mechanism of Continued Growth of the SEIManuscript . . . . . . . . . . . . . . . . . . . . . . . . . . . . . . 135Electronic Supporting Information . . . . . . . . . . . . . . . . . . 141
Paper IV: Review on multi-scale Models of Solid-Electrolyte InterphaseFormation . . . . . . . . . . . . . . . . . . . . . . . . . . . . . . .Manuscript . . . . . . . . . . . . . . . . . . . . . . . . . . . . . . 147
Paper V: Theory of Impedance Spectroscopy for Lithium Batteries . .Manuscript . . . . . . . . . . . . . . . . . . . . . . . . . . . . . . 157Electronic Supporting Information . . . . . . . . . . . . . . . . . . 175
x
1 Introduction and Motivation
In late 2019, the Nobel prize of chemistry was awarded to John Goodenough,Stanley Whittingham, and Akira Yoshino for their simultaneous invention andlive-long work on the lithium-ion battery technology [610]. This boosted pub-lic attention and recognition of battery research in general. Although batteriesare an integral part of nearly every secondary (rechargeable) device, the tech-nology has only recently been perceived as a driver of innovation and change.Instead, other technologies, for example, computer technology or machine/deeplearning were and are more widely regarded as the key to smarter devices andfuture applications. However, most of these devices would not exist without areliable and performant battery technology in the rst place. Maybe modernbattery technology is already taken for granted, similar to conventional station-ary electricity which has long become part of the mundane. Alternatively, thisperception could be explained by the rate at which these technologies improve.Consider, for example, computing power which has always been increasing ex-ponentially. In contrast, lithium-ion batteries have only been improving slowlyin comparison. Their core technology has undergone no fundamental changes inrecent time. Instead, several small, almost cosmetic alterations have been intro-duced. However, these changes have, in combination with steady improvements inmanufacturing, caused a continuous improvement of battery performance. Mostnotably, this improvement has been accompanied by a signicant drop in the costper stored energy. Recently, lithium-ion batteries have become good and cheapenough to spark the emergence of numerous new applications. Battery packs arenow widely used to store solar energy in detached houses. Even larger systemscan be employed to stabilise moderately sized power grids. Finally, it has becomeapparent that electric vehicles (EVs) will ultimately be a credible alternative toconventional combustion engine cars.All these applications result in an unprecedented demand for lithium-ion cells,
sparking a debate about the ecological footprint of lithium-ion batteries technol-ogy. The debate itself is not unfounded. First of all, a large amount of energy isconsumed by the production of lithium-ion batteries alone. Secondly, several com-mon battery materials, second to none cobalt, have a substantial ecological impactand remain controversial. However, unlike a vehicle with a combustion engine, abattery-powered one can be charged with power from clean and zero-emission en-ergy sources. In this way, the environmental sustainability of a battery-poweredvehicle improves over time. Unfortunately, this improvement is limited becausetoday's lithium-ion batteries still suer from degradation. Although the batteriesthemselves do not just stop working, they eventually degrade until they no longermeet the requirements demanded by their application. For instance, the batteryof an electric vehicle is considered obsolete after it looses more than 20% of itsoriginal capacity. Consequently, batteries have a limited lifetime which eventu-
1
1 Introduction and Motivation
Graphite
ElectrolyteSEI
EC
Li+
A−
e−
SEI formationReaction
RLTM
Charge &.Discharge
RLTM
precipitation
reductionreaction
growth
a) b)
c)
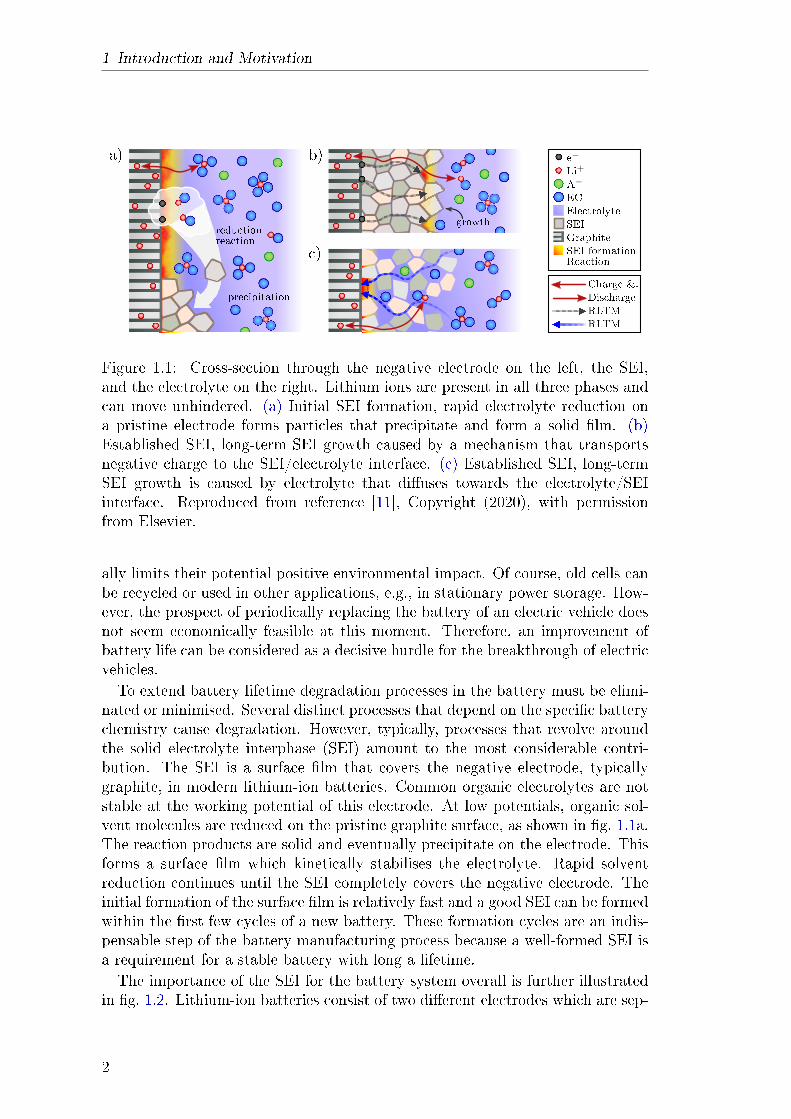
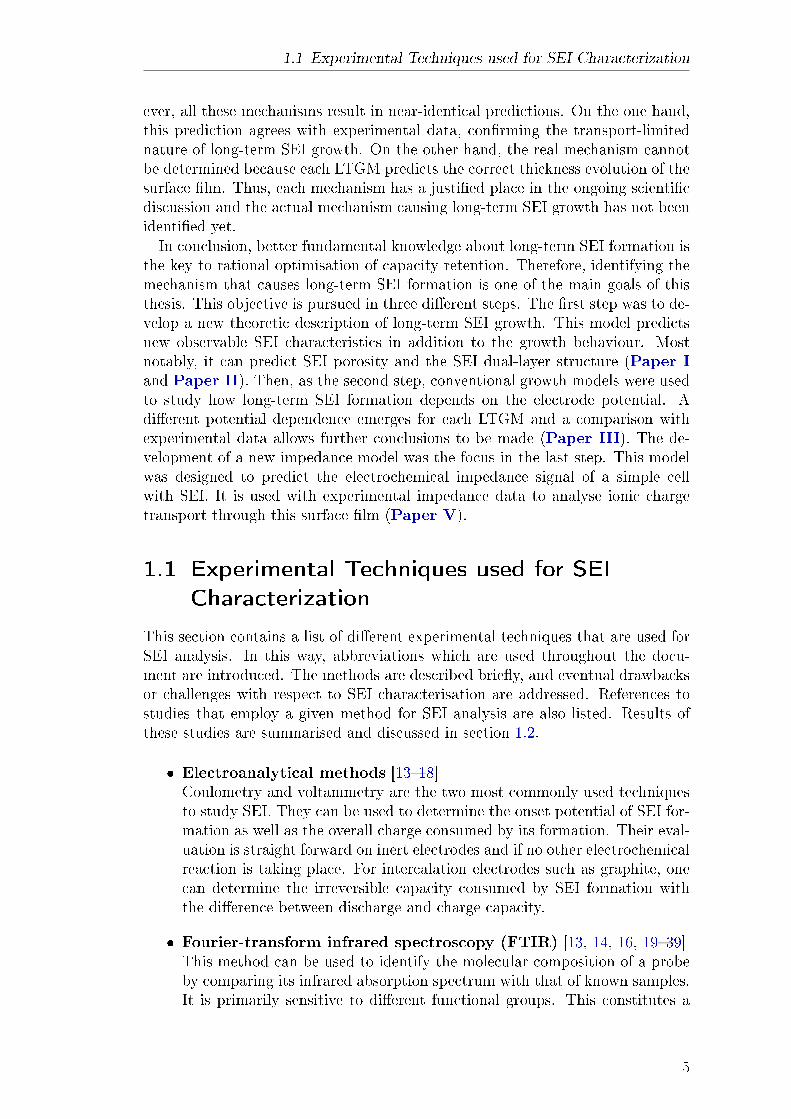
Figure 1.1: Cross-section through the negative electrode on the left, the SEI,and the electrolyte on the right. Lithium ions are present in all three phases andcan move unhindered. (a) Initial SEI formation, rapid electrolyte reduction ona pristine electrode forms particles that precipitate and form a solid lm. (b)Established SEI, long-term SEI growth caused by a mechanism that transportsnegative charge to the SEI/electrolyte interface. (c) Established SEI, long-termSEI growth is caused by electrolyte that diuses towards the electrolyte/SEIinterface. Reproduced from reference [11], Copyright (2020), with permissionfrom Elsevier.
ally limits their potential positive environmental impact. Of course, old cells canbe recycled or used in other applications, e.g., in stationary power storage. How-ever, the prospect of periodically replacing the battery of an electric vehicle doesnot seem economically feasible at this moment. Therefore, an improvement ofbattery life can be considered as a decisive hurdle for the breakthrough of electricvehicles.To extend battery lifetime degradation processes in the battery must be elimi-
nated or minimised. Several distinct processes that depend on the specic batterychemistry cause degradation. However, typically, processes that revolve aroundthe solid electrolyte interphase (SEI) amount to the most considerable contri-bution. The SEI is a surface lm that covers the negative electrode, typicallygraphite, in modern lithium-ion batteries. Common organic electrolytes are notstable at the working potential of this electrode. At low potentials, organic sol-vent molecules are reduced on the pristine graphite surface, as shown in g. 1.1a.The reaction products are solid and eventually precipitate on the electrode. Thisforms a surface lm which kinetically stabilises the electrolyte. Rapid solventreduction continues until the SEI completely covers the negative electrode. Theinitial formation of the surface lm is relatively fast and a good SEI can be formedwithin the rst few cycles of a new battery. These formation cycles are an indis-pensable step of the battery manufacturing process because a well-formed SEI isa requirement for a stable battery with long a lifetime.The importance of the SEI for the battery system overall is further illustrated
in g. 1.2. Lithium-ion batteries consist of two dierent electrodes which are sep-
2
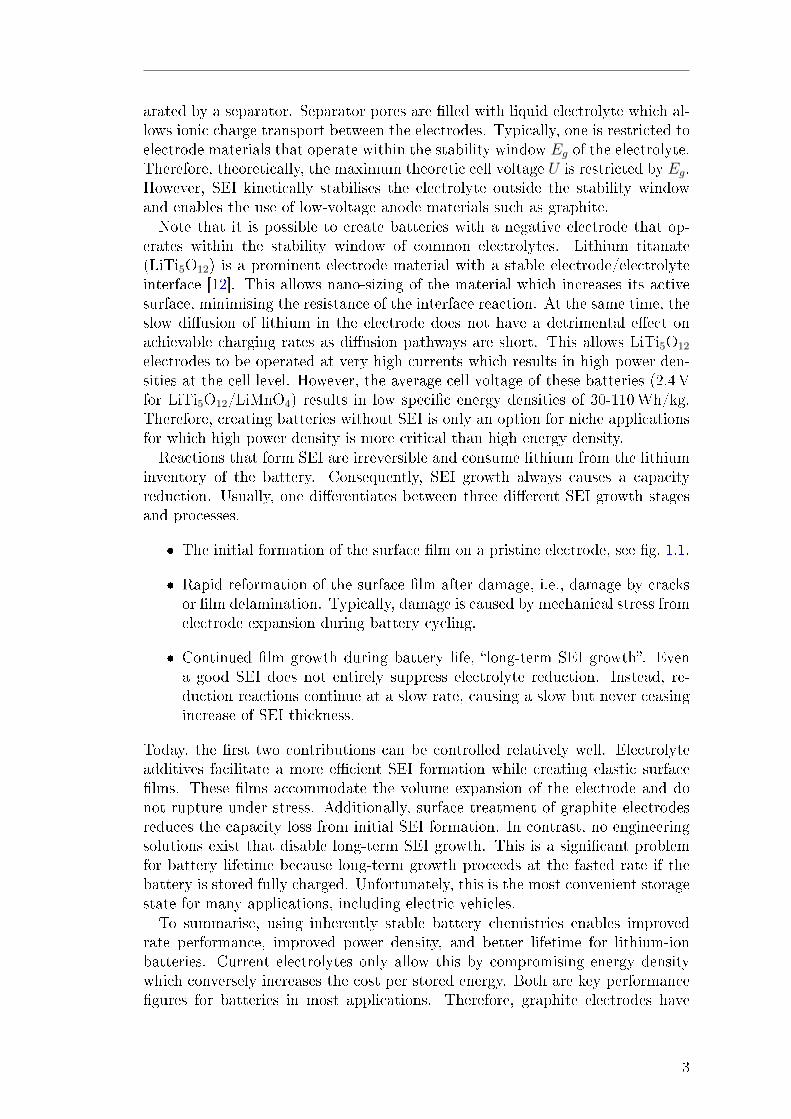
arated by a separator. Separator pores are lled with liquid electrolyte which al-lows ionic charge transport between the electrodes. Typically, one is restricted toelectrode materials that operate within the stability window Eg of the electrolyte.Therefore, theoretically, the maximum theoretic cell voltage U is restricted by Eg.However, SEI kinetically stabilises the electrolyte outside the stability windowand enables the use of low-voltage anode materials such as graphite.Note that it is possible to create batteries with a negative electrode that op-
erates within the stability window of common electrolytes. Lithium titanate(LiTi5O12) is a prominent electrode material with a stable electrode/electrolyteinterface [12]. This allows nano-sizing of the material which increases its activesurface, minimising the resistance of the interface reaction. At the same time, theslow diusion of lithium in the electrode does not have a detrimental eect onachievable charging rates as diusion pathways are short. This allows LiTi5O12
electrodes to be operated at very high currents which results in high power den-sities at the cell level. However, the average cell voltage of these batteries (2.4Vfor LiTi5O12/LiMnO4) results in low specic energy densities of 30-110Wh/kg.Therefore, creating batteries without SEI is only an option for niche applicationsfor which high power density is more critical than high energy density.Reactions that form SEI are irreversible and consume lithium from the lithium
inventory of the battery. Consequently, SEI growth always causes a capacityreduction. Usually, one dierentiates between three dierent SEI growth stagesand processes.
The initial formation of the surface lm on a pristine electrode, see g. 1.1.
Rapid reformation of the surface lm after damage, i.e., damage by cracksor lm delamination. Typically, damage is caused by mechanical stress fromelectrode expansion during battery cycling.
Continued lm growth during battery life, long-term SEI growth. Evena good SEI does not entirely suppress electrolyte reduction. Instead, re-duction reactions continue at a slow rate, causing a slow but never ceasingincrease of SEI thickness.
Today, the rst two contributions can be controlled relatively well. Electrolyteadditives facilitate a more ecient SEI formation while creating elastic surfacelms. These lms accommodate the volume expansion of the electrode and donot rupture under stress. Additionally, surface treatment of graphite electrodesreduces the capacity loss from initial SEI formation. In contrast, no engineeringsolutions exist that disable long-term SEI growth. This is a signicant problemfor battery lifetime because long-term growth proceeds at the fasted rate if thebattery is stored fully charged. Unfortunately, this is the most convenient storagestate for many applications, including electric vehicles.To summarise, using inherently stable battery chemistries enables improved
rate performance, improved power density, and better lifetime for lithium-ionbatteries. Current electrolytes only allow this by compromising energy densitywhich conversely increases the cost per stored energy. Both are key performancegures for batteries in most applications. Therefore, graphite electrodes have
3
1 Introduction and Motivation
NegativePositive ElectrolyteElectrode Electrode
by SEI
Anode
Cathode
?
Stabilitywindow Eg
stabilized
Energy Potential
LUMO
HOMO
µA − µC = FU
µA
µC
Stable electrolyte
Stable materials
0V
1V
2V
3V
4V
5V
Materials that re-quire surface lmsfor stable use
LithiumGraphite
LiMn2O4LiCoO2LiNixCoyMnzO2
LiFePO4
0.00V0.10V
4.10V4.40V
3.45V
4.70V
Anode
Cathode
Approx. Potential
Li4Ti5O12 1.40V
LiTiS2 2.00V
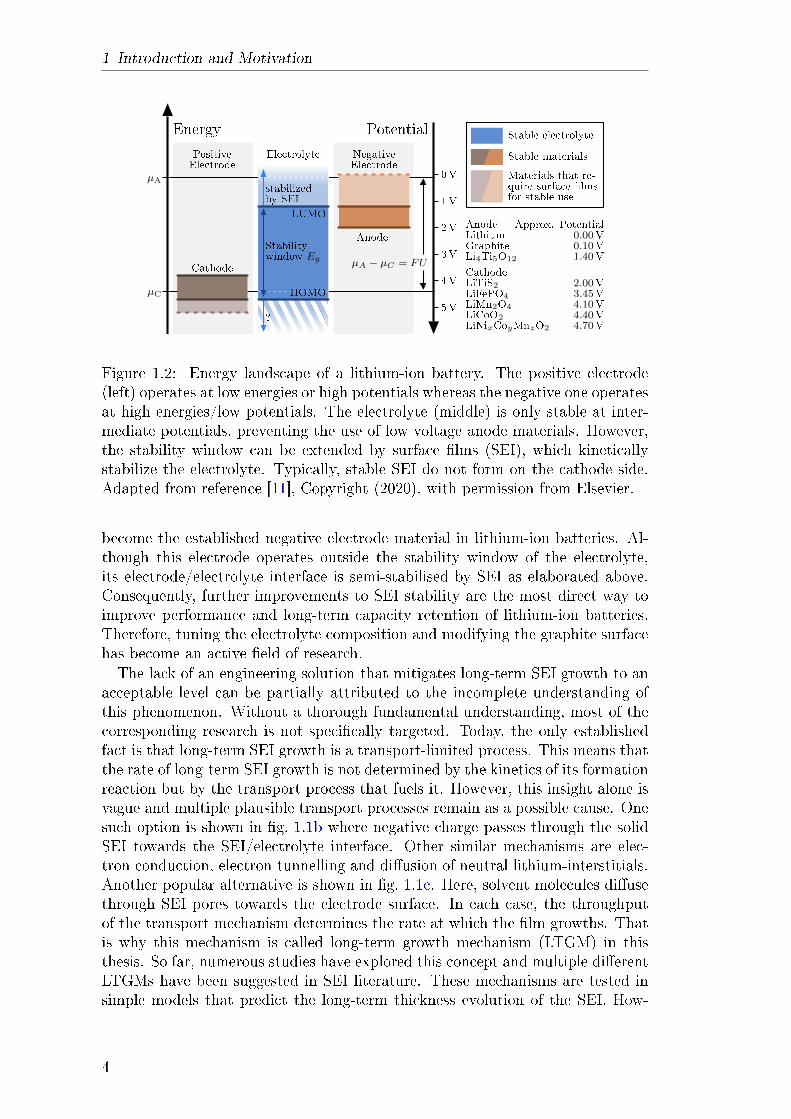
Figure 1.2: Energy landscape of a lithium-ion battery. The positive electrode(left) operates at low energies or high potentials whereas the negative one operatesat high energies/low potentials. The electrolyte (middle) is only stable at inter-mediate potentials, preventing the use of low voltage anode materials. However,the stability window can be extended by surface lms (SEI), which kineticallystabilize the electrolyte. Typically, stable SEI do not form on the cathode side.Adapted from reference [11], Copyright (2020), with permission from Elsevier.
become the established negative electrode material in lithium-ion batteries. Al-though this electrode operates outside the stability window of the electrolyte,its electrode/electrolyte interface is semi-stabilised by SEI as elaborated above.Consequently, further improvements to SEI stability are the most direct way toimprove performance and long-term capacity retention of lithium-ion batteries.Therefore, tuning the electrolyte composition and modifying the graphite surfacehas become an active eld of research.The lack of an engineering solution that mitigates long-term SEI growth to an
acceptable level can be partially attributed to the incomplete understanding ofthis phenomenon. Without a thorough fundamental understanding, most of thecorresponding research is not specically targeted. Today, the only establishedfact is that long-term SEI growth is a transport-limited process. This means thatthe rate of long-term SEI growth is not determined by the kinetics of its formationreaction but by the transport process that fuels it. However, this insight alone isvague and multiple plausible transport processes remain as a possible cause. Onesuch option is shown in g. 1.1b where negative charge passes through the solidSEI towards the SEI/electrolyte interface. Other similar mechanisms are elec-tron conduction, electron tunnelling and diusion of neutral lithium-interstitials.Another popular alternative is shown in g. 1.1c. Here, solvent molecules diusethrough SEI pores towards the electrode surface. In each case, the throughputof the transport mechanism determines the rate at which the lm growths. Thatis why this mechanism is called long-term growth mechanism (LTGM) in thisthesis. So far, numerous studies have explored this concept and multiple dierentLTGMs have been suggested in SEI literature. These mechanisms are tested insimple models that predict the long-term thickness evolution of the SEI. How-
4
1.1 Experimental Techniques used for SEI Characterization
ever, all these mechanisms result in near-identical predictions. On the one hand,this prediction agrees with experimental data, conrming the transport-limitednature of long-term SEI growth. On the other hand, the real mechanism cannotbe determined because each LTGM predicts the correct thickness evolution of thesurface lm. Thus, each mechanism has a justied place in the ongoing scienticdiscussion and the actual mechanism causing long-term SEI growth has not beenidentied yet.In conclusion, better fundamental knowledge about long-term SEI formation is
the key to rational optimisation of capacity retention. Therefore, identifying themechanism that causes long-term SEI formation is one of the main goals of thisthesis. This objective is pursued in three dierent steps. The rst step was to de-velop a new theoretic description of long-term SEI growth. This model predictsnew observable SEI characteristics in addition to the growth behaviour. Mostnotably, it can predict SEI porosity and the SEI dual-layer structure (Paper Iand Paper II). Then, as the second step, conventional growth models were usedto study how long-term SEI formation depends on the electrode potential. Adierent potential dependence emerges for each LTGM and a comparison withexperimental data allows further conclusions to be made (Paper III). The de-velopment of a new impedance model was the focus in the last step. This modelwas designed to predict the electrochemical impedance signal of a simple cellwith SEI. It is used with experimental impedance data to analyse ionic chargetransport through this surface lm (Paper V).
1.1 Experimental Techniques used for SEI
Characterization
This section contains a list of dierent experimental techniques that are used forSEI analysis. In this way, abbreviations which are used throughout the docu-ment are introduced. The methods are described briey, and eventual drawbacksor challenges with respect to SEI characterisation are addressed. References tostudies that employ a given method for SEI analysis are also listed. Results ofthese studies are summarised and discussed in section 1.2.
Electroanalytical methods [1318]Coulometry and voltammetry are the two most commonly used techniquesto study SEI. They can be used to determine the onset potential of SEI for-mation as well as the overall charge consumed by its formation. Their eval-uation is straight forward on inert electrodes and if no other electrochemicalreaction is taking place. For intercalation electrodes such as graphite, onecan determine the irreversible capacity consumed by SEI formation withthe dierence between discharge and charge capacity.
Fourier-transform infrared spectroscopy (FTIR) [13, 14, 16, 1939]This method can be used to identify the molecular composition of a probeby comparing its infrared absorption spectrum with that of known samples.It is primarily sensitive to dierent functional groups. This constitutes a
5
1 Introduction and Motivation
challenge for SEI analysis as several SEI compounds and the electrolyteshare the carbonate group. One advantage of this method is that it canbe used to study surface lms in-situ with the internal reectance mode aspioneered by Goren and Aurbach [14, 40, 41].
X-ray photoelectron spectroscopy (XPS) [14, 15, 1820, 32, 3437, 4248]Measures the number of electrons emitted by the probe at dierent energiesof incoming X-rays. Electrons are emitted when the energy of incomingradiation is larger than their binding energy. The method is surface sensitivebecause electrons can only escape from a few nanometres inside the probes.This spectrum can be used to obtain the quantitative elemental compositionof the probe's surface. XPS measurements take place in vacuum and SEIsamples must be prepared, i.e., rinsed with a volatile solvent such as DMC.XPS depth proles of EC and DMC derived SEI were measured by Weberet al. in reference [18].
X-ray absorption spectroscopy (XAS) [14]Measures the amount of radiation that is absorbed by the probe as a func-tion of X-ray energy/frequency. X-rays are adsorbed when they excite innerelectrons. There are two method variants, depending on the X-ray energiesused. X-ray absorption near edge structure spectroscopy (XANES) revealsinformation about unoccupied molecular orbits from which the chemicalcomposition of the probe can be inferred. Here, only energies near an edgeare considered. Extended X-ray absorption ne structure (EXAFS) can beused to study the amount and distance of neighbouring atoms.
X-ray diraction (XRD) [14, 27, 34, 49, 50]Diraction patterns emerge when waves or wave-like particles interact withstructures of similar size to their wavelength. Therefore, XRD can be usedto study structures of crystalline phases. Narzi et al. pioneered the in-situapplication of this method to study surface lms on lithium electrodes [49].The diraction pattern produced by dierent compounds in the sample canbe reconstructed and identied with a so-called Rietveld renement.
Raman Spectroscopy [28, 51]Raman scattering is an inelastic interaction between molecules and light.They re-emit photons with a small energy shift after excitation. This emis-sion spectrum contains information about crystallinity and composition ofthe probe. An image of this information can be created by scanning theprobe with a focused laser beam (Raman microscopy or Raman mapping).
Nuclear magnetic resonance (NMR) [30, 32, 33, 3639, 5254]NMR has been used to study SEI composition and the solution structure ofthe electrolyte. Radio waves can induce nuclear magnetic resonance whenthe probe is placed in a strong magnetic eld. The resonance produces radiowaves at a frequency that is highly characteristic for specic compoundsand chemical environments. It only exists in samples that contain atoms
6
1.1 Experimental Techniques used for SEI Characterization
with non-zero nucleus spin. This includes 1H, 6Li, 13C, and 19F. In-situmeasurements are possible.
Mass spectroscopy [17, 20, 29, 30, 44, 46, 47, 55]Mass spectroscopy measures the weight of ionic species. There are dierentmethods to extract ions from the probe; the most popular one is the useof an ion beam. Secondary ions are ejected from the probe by targetingit with high energy primary ions. The combination is called secondary ionmass spectroscopy (SIMS). This technique is used to measure depth prolesas the secondary ion beam slowly removes material. However, correctlycalibrating the absolute depth is dicult because the removal rate mightchange as the composition of the SEI changes. Electrospray ionisation massspectroscopy (ESI-MS) can be used to analyse ions from solutions [29, 30].Quantitative reconstruction of SEI composition is not possible with thismass spectroscopy. Many SEI compounds are similar such that severalionic fragments cant be assigned to a single compound.
Electrochemical impedance spectroscopy (EIS) [14, 16, 17, 27, 47,5660]Measures the response (resistance) of an electrochemical cell to externalsignals at a given frequency. Individual contributions of the overall cellresistance resonate at dierent frequencies. For instance, the ionic resistanceof the SEI typically resonates in the∼kHz range. Ideally, it can be separatedfrom the interface resistance that is often found in the ∼Hz range. As anin-situ technique, EIS is suited to study the increase of ionic SEI resistanceduring its formation [60].
Transmission electron microscopy (TEM) [15, 27, 36, 37, 50, 59, 61]High resolution imaging technique which uses an high energy electron beamthat penetrates probe. The resolution is determined by the electron energywhich ranges from 80 keV to 400 keV and can be below 1Å. Beam damageconstitutes a signicant problem when imaging SEI with this technique,especially at high energies and during long exposures. Requires high vacuumand images from SEI are created ex-situ.
Scanning electron microscopy (SEM) [13, 2123, 43, 44, 47, 55, 62, 63]Surface imaging technique which uses a low energy electron beam to scan theprobe (8 keV to 30 keV). The image is constructed from reected (backscat-tered) and secondary electrons emitted by the probe. Resolutions between1 and 2 nanometres are possible. Requires vacuum and all images of SEIcreated with this method are taken ex-situ.
Atomic force microscopy (AFM) [51, 6466]AFM uses a needle with a thin tip to scan the height prole of the probe.The needle is in direct contact with the probe and the height prole infor-mation is collected by adjusting the position of the tip (constant force) orby measuring the force exerted on the cantilever. Alternatively, ScanningTunnelling Microscopy (STM) can be used if instead if the probe is electron-ically conductive. For STM, no direct contact between the tip and the probe
7
1 Introduction and Motivation
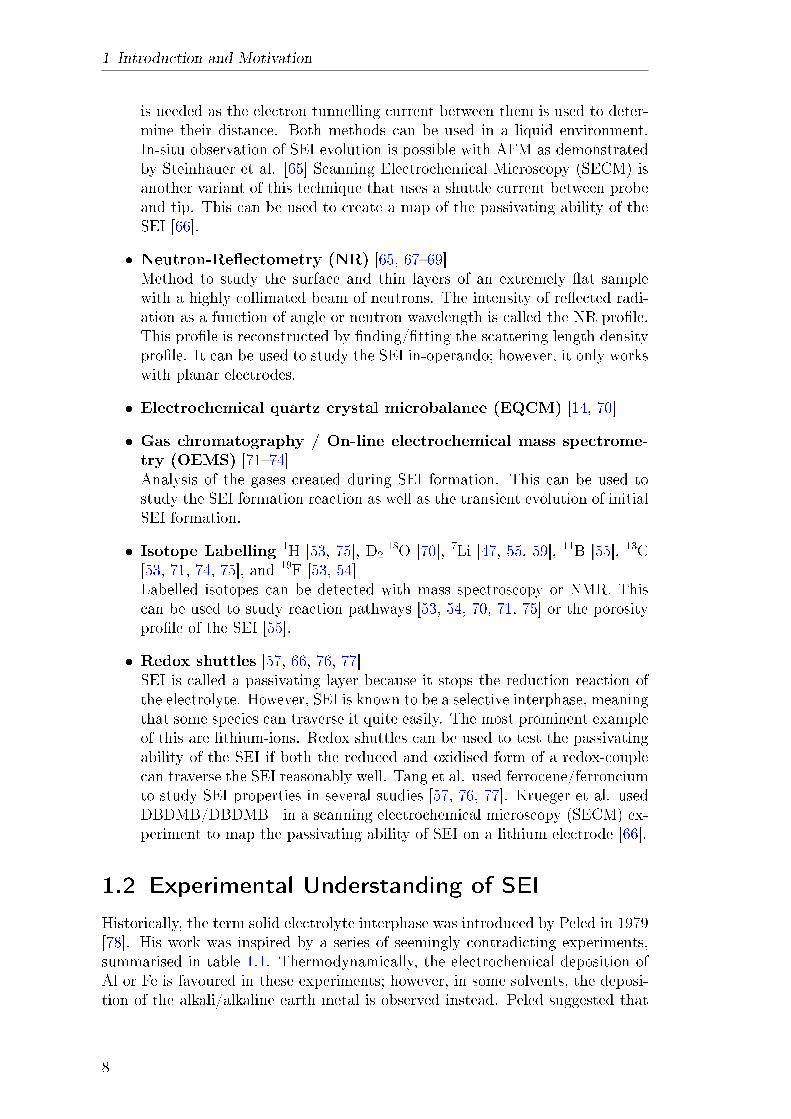
is needed as the electron tunnelling current between them is used to deter-mine their distance. Both methods can be used in a liquid environment.In-situ observation of SEI evolution is possible with AFM as demonstratedby Steinhauer et al. [65] Scanning Electrochemical Microscopy (SECM) isanother variant of this technique that uses a shuttle current between probeand tip. This can be used to create a map of the passivating ability of theSEI [66].
Neutron-Reectometry (NR) [65, 6769]Method to study the surface and thin layers of an extremely at samplewith a highly collimated beam of neutrons. The intensity of reected radi-ation as a function of angle or neutron wavelength is called the NR prole.This prole is reconstructed by nding/tting the scattering length densityprole. It can be used to study the SEI in-operando; however, it only workswith planar electrodes.
Electrochemical quartz crystal microbalance (EQCM) [14, 70]
Gas chromatography / On-line electrochemical mass spectrome-try (OEMS) [7174]Analysis of the gases created during SEI formation. This can be used tostudy the SEI formation reaction as well as the transient evolution of initialSEI formation.
Isotope Labelling 1H [53, 75], D218O [70], 7Li [47, 55, 59], 11B [55], 13C
[53, 71, 74, 75], and 19F [53, 54]Labelled isotopes can be detected with mass spectroscopy or NMR. Thiscan be used to study reaction pathways [53, 54, 70, 71, 75] or the porosityprole of the SEI [55].
Redox shuttles [57, 66, 76, 77]SEI is called a passivating layer because it stops the reduction reaction ofthe electrolyte. However, SEI is known to be a selective interphase, meaningthat some species can traverse it quite easily. The most prominent exampleof this are lithium-ions. Redox shuttles can be used to test the passivatingability of the SEI if both the reduced and oxidised form of a redox-couplecan traverse the SEI reasonably well. Tang et al. used ferrocene/ferronciumto study SEI properties in several studies [57, 76, 77]. Krueger et al. usedDBDMB/DBDMB+ in a scanning electrochemical microscopy (SECM) ex-periment to map the passivating ability of SEI on a lithium electrode [66].
1.2 Experimental Understanding of SEI
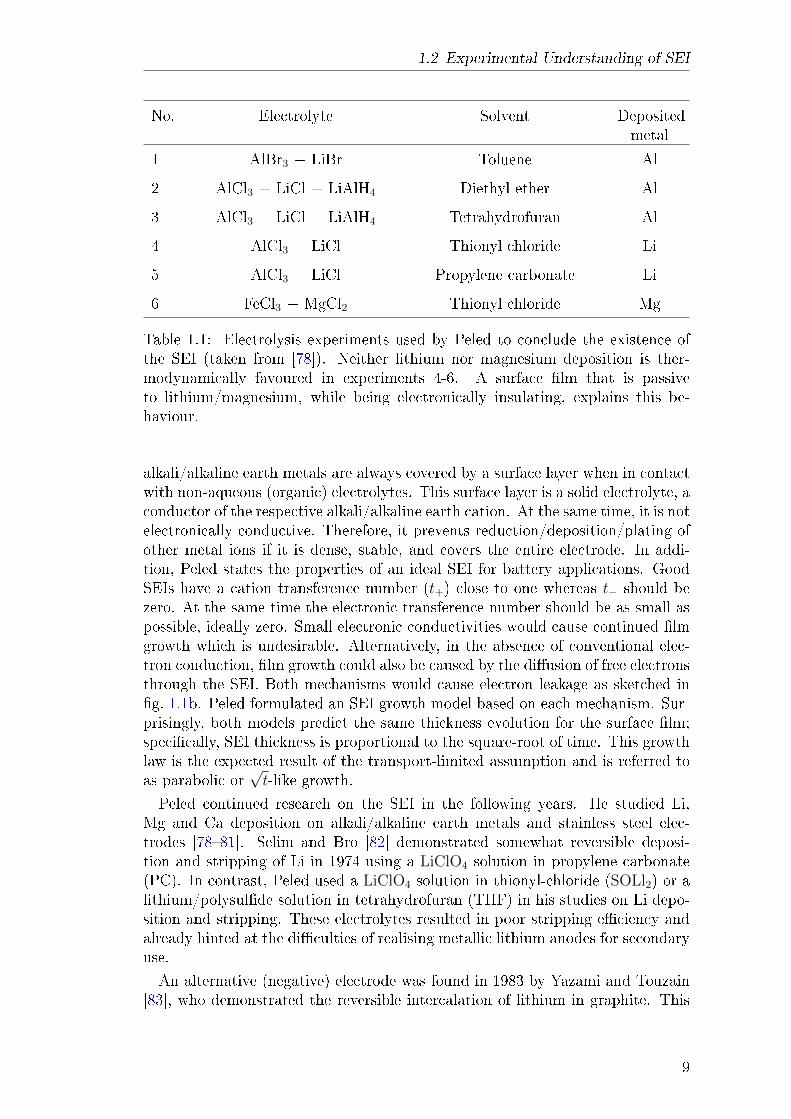
Historically, the term solid electrolyte interphase was introduced by Peled in 1979[78]. His work was inspired by a series of seemingly contradicting experiments,summarised in table 1.1. Thermodynamically, the electrochemical deposition ofAl or Fe is favoured in these experiments; however, in some solvents, the deposi-tion of the alkali/alkaline earth metal is observed instead. Peled suggested that
8
1.2 Experimental Understanding of SEI
No. Electrolyte Solvent Depositedmetal
1 AlBr3 + LiBr Toluene Al
2 AlCl3 + LiCl + LiAlH4 Diethyl ether Al
3 AlCl3 + LiCl + LiAlH4 Tetrahydrofuran Al
4 AlCl3 + LiCl Thionyl chloride Li
5 AlCl3 + LiCl Propylene carbonate Li
6 FeCl3 + MgCl2 Thionyl chloride Mg
Table 1.1: Electrolysis experiments used by Peled to conclude the existence ofthe SEI (taken from [78]). Neither lithium nor magnesium deposition is ther-modynamically favoured in experiments 4-6. A surface lm that is passiveto lithium/magnesium, while being electronically insulating, explains this be-haviour.
alkali/alkaline earth metals are always covered by a surface layer when in contactwith non-aqueous (organic) electrolytes. This surface layer is a solid electrolyte, aconductor of the respective alkali/alkaline earth cation. At the same time, it is notelectronically conductive. Therefore, it prevents reduction/deposition/plating ofother metal ions if it is dense, stable, and covers the entire electrode. In addi-tion, Peled states the properties of an ideal SEI for battery applications. GoodSEIs have a cation transference number (t+) close to one whereas t− should bezero. At the same time the electronic transference number should be as small aspossible, ideally zero. Small electronic conductivities would cause continued lmgrowth which is undesirable. Alternatively, in the absence of conventional elec-tron conduction, lm growth could also be caused by the diusion of free electronsthrough the SEI. Both mechanisms would cause electron leakage as sketched ing. 1.1b. Peled formulated an SEI growth model based on each mechanism. Sur-prisingly, both models predict the same thickness evolution for the surface lm;specically, SEI thickness is proportional to the square-root of time. This growthlaw is the expected result of the transport-limited assumption and is referred toas parabolic or
√t-like growth.
Peled continued research on the SEI in the following years. He studied Li,Mg and Ca deposition on alkali/alkaline earth metals and stainless steel elec-trodes [7881]. Selim and Bro [82] demonstrated somewhat reversible deposi-tion and stripping of Li in 1974 using a LiClO4 solution in propylene carbonate(PC). In contrast, Peled used a LiClO4 solution in thionyl-chloride (SOLl2) or alithium/polysulde solution in tetrahydrofuran (THF) in his studies on Li depo-sition and stripping. These electrolytes resulted in poor stripping eciency andalready hinted at the diculties of realising metallic lithium anodes for secondaryuse.An alternative (negative) electrode was found in 1983 by Yazami and Touzain
[83], who demonstrated the reversible intercalation of lithium in graphite. This
9
1 Introduction and Motivation
was not possible with liquid electrolytes at the time, specically PC. Instead,a polymeric solid electrolyte was used to stabilise the electrode. This discoveryclearly illustrated the potential of graphite as an electrode material for secondarylithium-ion batteries. It initiated a series of studies that attempted to achievereversible lithium intercalation into graphite by electrochemical means. As men-tioned above, PC, fails to do so. This seemed counter-intuitive because PC formsa relatively stable SEI on metallic lithium which allows reversible cycling to somedegree [82]. Takada et al. [84] found that the perchlorate ion (ClO−4 ) partiallyco-intercalates into graphite along with the lithium cation. It is now known thatco-intercalation ultimately causes exfoliation, the shedding of lithium layers whichslowly dissolves the graphite and prevents the formation of a stable SEI.The use of graphite as an anode material for lithium-ion batteries was patented
by Akira Yoshino in 1985 who worked for Asahi Kasei at the time. The improvedcycling stability of this anode was demonstrated by Dahn et al. [85] in 1990.His group used a lithium hexauoroarsenate (LiAsF6) solution in an ethylenecarbonate (EC)/PC mixture. This electrolyte produces a stable interface andresulted in capacity retention of 90% after 100 cycles. They explained this withthe high reduction potential of EC. It is higher than the reduction potentialof PC and lies above the potentials at which lithium intercalation in graphiteoccurs. Consequently, during the rst negative polarisation of the anode, EC isreduced before the intercalation begins. This forms the SEI before the onset oflithiation. Therefore, co-intercalation does not take place when the lithiation ofthe electrode begins. It also implies that the SEI formed in the formation cycleconsists mostly of EC reduction products.The overall quality of EC as an SEI forming additive was further demonstrated
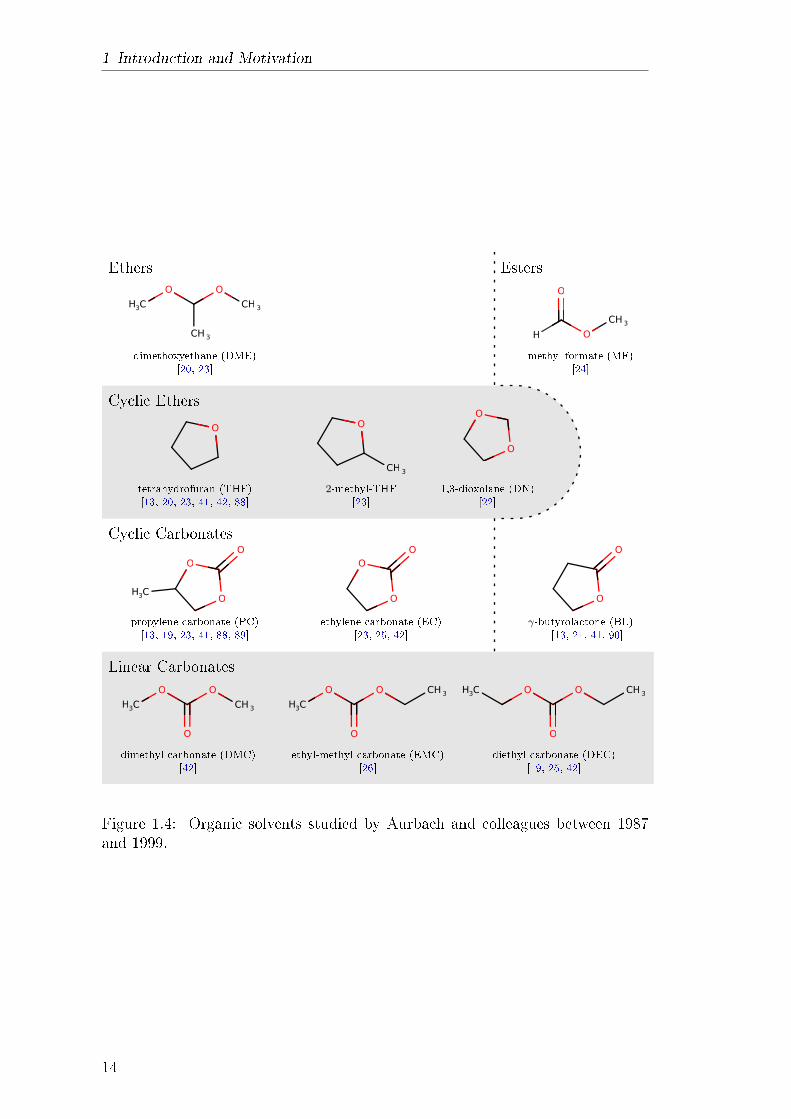
by Aurbach in 1991 [23]. Adding EC to electrolytes based on PC or 2-methyl-THFimproved the cycling eciency of metal lithium electrodes [23]. Aurbach hadstudied surface lms on this electrode extensively and realised that the use ofactive additives to modify the SEI could yield considerable improvements [13].To this aim, he studied lm formation from a myriad of dierent organic solvents,see g. 1.4. These solvents were used in dierent mixtures and combined withseveral lithium salts. The most common salts in his early studies were lithiumperchlorate (LiClO4) and lithium hexauoroarsenate (LiAsF6). However, after1995, mostly lithium hexauorophosphate (LiPF6) and lithium tetrauoroborate(LiBF4) were used. Additionally, Aurbach considered the eect of common elec-trolyte contaminants such as water, oxygen, CO2 and nitrogen [13, 21].Aside from a few exceptions [86], lithium-metal electrodes are still not used
in secondary applications today. Lithium deposition is highly dendritic and thecoulombic eciency of lithium-metal electrodes is not good enough for this eldof use [87]. However, Aurbach's work proved to be essential for the current under-standing of SEI on other electrodes, including graphite. Aurbach did not only usestandard electrochemical techniques to measure the inuence of the surface lmson cycling eciency. He also studied their composition by using surface character-isation techniques such as Fourier-transform infrared spectroscopy (FTIR), X-rayphotoelectron spectroscopy (XPS), secondary ion mass spectroscopy (SIMS), andother methods. These techniques were systematically employed to identify SEIcompounds formed by dierent solvents, additives, salts, and possible contami-
10
1.2 Experimental Understanding of SEI
nation species. Most notably, Aurbach used in-situ FTIR in studies after 1991 byusing the internal reectance mode [40]. In-situ experiments on SEI are desirablebecause surface lms are not stable under air. Generally, SEI reacts with oxygenor CO2 and is easily damaged during cell disassembly or transfer. Even if airexposure is avoided, the pretreatment of the test specimen often includes rinsingand drying. This can alter the surface lms as well and complicates the use ofmost experimental procedures used to analyse SEI, for instance, XPS and SIMS.
11
1 Introduction and Motivation
tetrahydrofuran (THF) 2-methyl-THF
propylene carbonate (PC) ethylene carbonate (EC) γ-butyrolactone (BL)
dimethyl carbonate (DMC) ethyl-methyl carbonate (EMC) diethyl carbonate (DEC)
Cyclic Ethers
Cyclic Carbonates
Linear Carbonates
Ethers
dimethoxyethane (DME)
Esters
methyl formate (MF)
1,3-dioxolane (DN)[13, 20, 23, 41, 42, 88]
[13, 19, 23, 41, 88, 89] [23, 25, 42] [13, 21, 41, 90]
[22][23]
[24][20, 23]
[42] [26] [19, 25, 42]
O O
O
H3C LiO H
H
H3CCH3
−−→
−−→
−−→
x2
−−→
PC e−−→
−−→EC e−−→
x2−−→
a)
b)
trace H2O
trace H2O
lithium carbonate (Li2CO3)
lithium ethylene dicarbonate (LiEDC)
lithium ethyl carbonate (LiEC)
lithium methyl-ethylene dicarbonate (LiMEDC)
lithium propyl carbonate (LiPC)
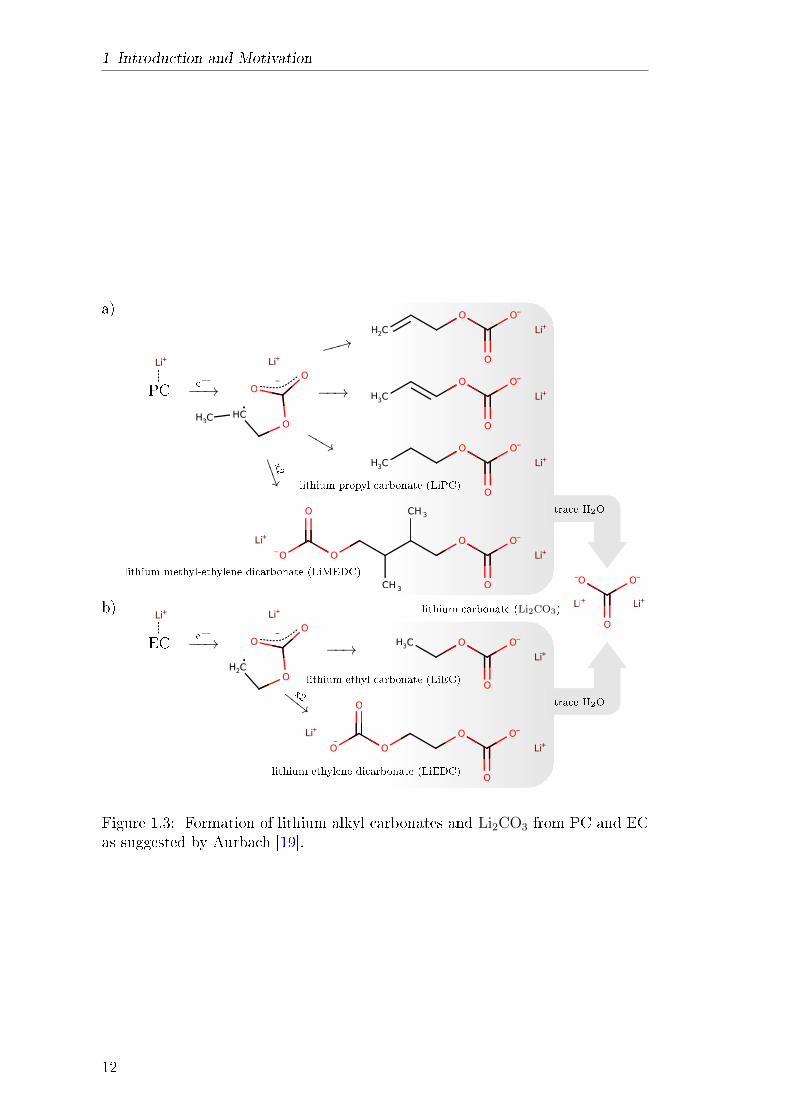
Figure 1.3: Formation of lithium alkyl carbonates and Li2CO3 from PC and ECas suggested by Aurbach [19].
12
1.2 Experimental Understanding of SEI
The reduction of PC on the lithium metal electrode has already been stud-ied in the early 1970s. It was found that the main reaction product is Li2CO3
which ultimately forms the surface lm [91]. Therefore, Li2CO3 had been sug-gested as the main SEI compound in all organic carbonate solvents until Aurbachproposed a dierent SEI composition in 1987 [19]. His measurements indicatedthe presence of lithium alkyl carbonates in SEI from PC-based electrolytes. Heproposed that if Li2CO3 is an SEI compound at all, it would only be found afew monolayers directly on top of the electrode. Furthermore, the continuousformation of Li2CO3 is regarded as unlikely because the two-electron reduction ofPC is only relevant on a pristine electrode. Instead, he suggested single-electronreduction of PC which forms a relatively stable radical, shown in g. 1.3a. Dif-ferent radical terminations can then result in the formation of various lithiumalkyl carbonates. A similar mechanism was later proposed for EC, as shown ing. 1.3b. This mechanism has been proposed and conrmed by other researchersas well [16, 33, 38, 70]. It was also explored and conrmed in several theoreticalstudies with DFT and MD simulations [9295]. Linear carbonates, as shown ing. 1.4, are reduced in a similar fashion. Electron transfer to the lithium-ioncoordinated to the carbonate group leads to C-O bond cleavage. This leads tothe formation of lithium propyl carbonate (LiPC) and lithium ethyl carbonate(LiEC) from DMC and DEC respectively [38]. Both species are also found asreduction products of EMC [26]. Aurbach attributed the presence of Li2CO3 inearlier studies [49, 96] to further reduction of lithium alkyl carbonates, facilitatedby electrolyte contamination like trace water. This has recently been conrmedin NMR experiments where Li2CO3 was not found [53]. The studied used binder-free electrodes that have almost no water contamination. Another study by Kitzet al. used D2
18O to further conrm the connection between trace-water contentand Li2CO3 [70]. With sucient contamination, an Li2CO3-rich SEI is formed inEC-based electrolytes at potentials between 1.7V and 2.4V vs Li/Li+. If thereis sucient contamination, a suciently passivating SEI can be formed in thisway. Then, the formation of lithium carbonates typically form at potentials atapproximately 0.8V is no longer observed in the initial formation cycle.
13
1 Introduction and Motivation
tetrahydrofuran (THF) 2-methyl-THF
propylene carbonate (PC) ethylene carbonate (EC) γ-butyrolactone (BL)
dimethyl carbonate (DMC) ethyl-methyl carbonate (EMC) diethyl carbonate (DEC)
Cyclic Ethers
Cyclic Carbonates
Linear Carbonates
Ethers
dimethoxyethane (DME)
Esters
methyl formate (MF)
1,3-dioxolane (DN)[13, 20, 23, 41, 42, 88]
[13, 19, 23, 41, 88, 89] [23, 25, 42] [13, 21, 41, 90]
[22][23]
[24][20, 23]
[42] [26] [19, 25, 42]
Figure 1.4: Organic solvents studied by Aurbach and colleagues between 1987and 1999.
14
1.2 Experimental Understanding of SEI
tetrahydrofuran (THF) 2-methyl-THF
propylene carbonate (PC) ethylene carbonate (EC) γ-butyrolactone (BL)
dimethyl carbonate (DMC) ethyl-methyl carbonate (EMC) diethyl carbonate (DEC)
Cyclic Ethers
Cyclic Carbonates
Linear Carbonates
Ethers
dimethoxyethane (DME)
Esters
methyl formate (MF)
1,3-dioxolane (DN)[13, 20, 23, 41, 42, 88]
[13, 19, 23, 41, 88, 89] [23, 25, 42] [13, 21, 41, 90]
[22][23]
[24][20, 23]
[42] [26] [19, 25, 42]
O O
O
H3C LiO H
H
H3CCH3
EC e−−→
−−→EC Li+ + e−−−−−→
x2−−→
a)
b)
CO2
trace H2O
lithium carbonate (Li2CO3)
lithium ethylene dicarbonate (LiEDC)
lithium ethyl carbonate (LiEC)
LiEDC
lithium propyl carbonate (LiPC)
Li+ + e−−−−−→
e−−→ −−→
LiEDC
CO2
+CO
THF
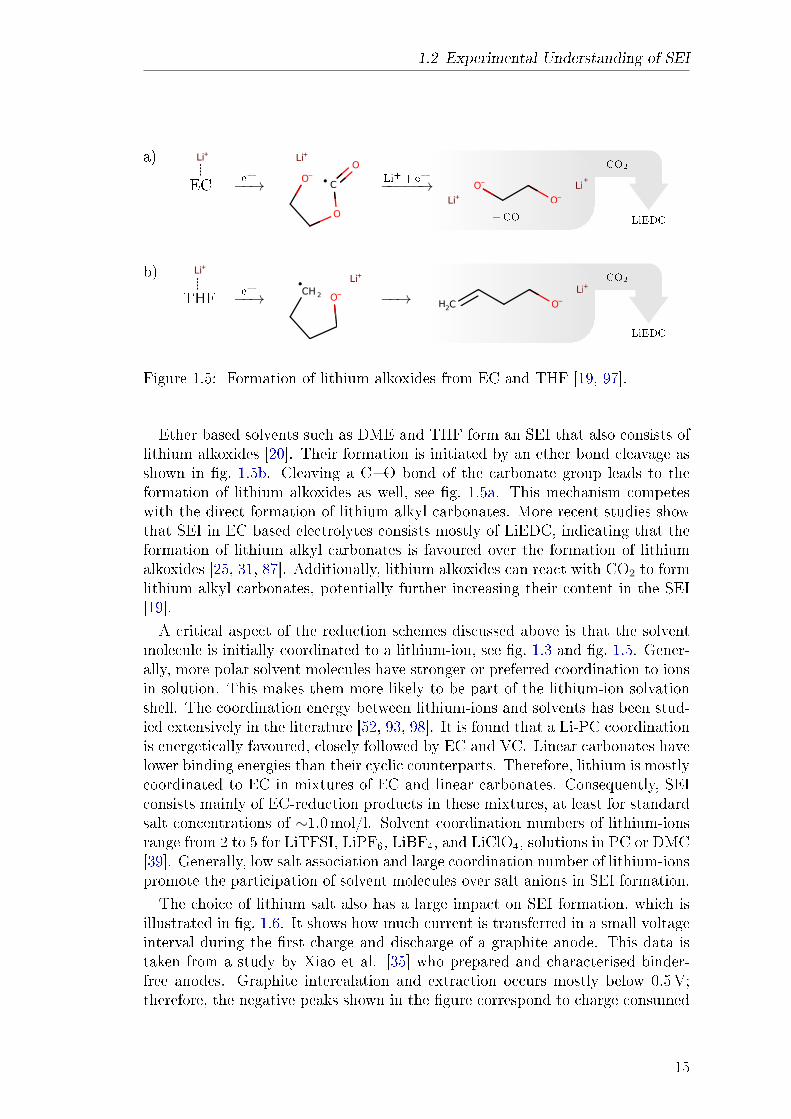
Figure 1.5: Formation of lithium alkoxides from EC and THF [19, 97].
Ether based solvents such as DME and THF form an SEI that also consists oflithium alkoxides [20]. Their formation is initiated by an ether bond cleavage asshown in g. 1.5b. Cleaving a CO bond of the carbonate group leads to theformation of lithium alkoxides as well, see g. 1.5a. This mechanism competeswith the direct formation of lithium alkyl carbonates. More recent studies showthat SEI in EC based electrolytes consists mostly of LiEDC, indicating that theformation of lithium alkyl carbonates is favoured over the formation of lithiumalkoxides [25, 31, 87]. Additionally, lithium alkoxides can react with CO2 to formlithium alkyl carbonates, potentially further increasing their content in the SEI[19].A critical aspect of the reduction schemes discussed above is that the solvent
molecule is initially coordinated to a lithium-ion, see g. 1.3 and g. 1.5. Gener-ally, more polar solvent molecules have stronger or preferred coordination to ionsin solution. This makes them more likely to be part of the lithium-ion solvationshell. The coordination energy between lithium-ions and solvents has been stud-ied extensively in the literature [52, 93, 98]. It is found that a Li-PC coordinationis energetically favoured, closely followed by EC and VC. Linear carbonates havelower binding energies than their cyclic counterparts. Therefore, lithium is mostlycoordinated to EC in mixtures of EC and linear carbonates. Consequently, SEIconsists mainly of EC-reduction products in these mixtures, at least for standardsalt concentrations of ∼1.0mol/l. Solvent coordination numbers of lithium-ionsrange from 2 to 5 for LiTFSI, LiPF6, LiBF4, and LiClO4, solutions in PC or DMC[39]. Generally, low salt association and large coordination number of lithium-ionspromote the participation of solvent molecules over salt anions in SEI formation.The choice of lithium salt also has a large impact on SEI formation, which is
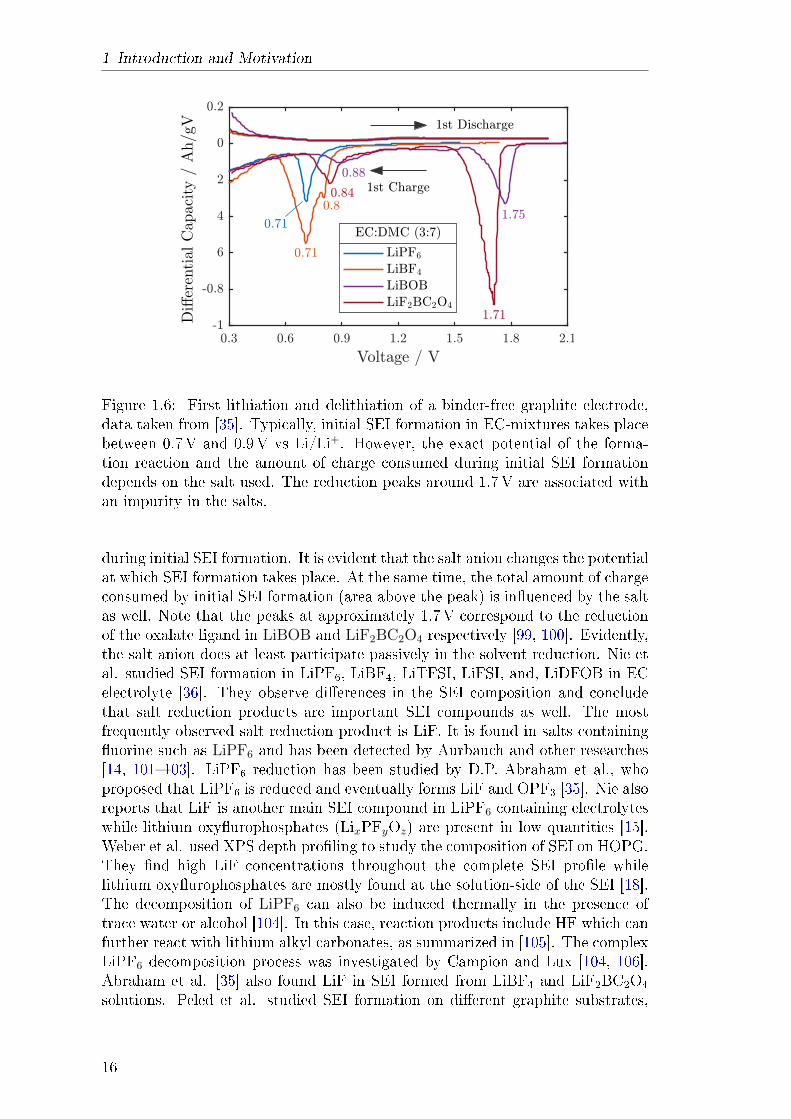
illustrated in g. 1.6. It shows how much current is transferred in a small voltageinterval during the rst charge and discharge of a graphite anode. This data istaken from a study by Xiao et al. [35] who prepared and characterised binder-free anodes. Graphite intercalation and extraction occurs mostly below 0.5V;therefore, the negative peaks shown in the gure correspond to charge consumed
15
1 Introduction and Motivation
Figure 1.6: First lithiation and delithiation of a binder-free graphite electrode,data taken from [35]. Typically, initial SEI formation in EC-mixtures takes placebetween 0.7V and 0.9V vs Li/Li+. However, the exact potential of the forma-tion reaction and the amount of charge consumed during initial SEI formationdepends on the salt used. The reduction peaks around 1.7V are associated withan impurity in the salts.
during initial SEI formation. It is evident that the salt anion changes the potentialat which SEI formation takes place. At the same time, the total amount of chargeconsumed by initial SEI formation (area above the peak) is inuenced by the saltas well. Note that the peaks at approximately 1.7V correspond to the reductionof the oxalate ligand in LiBOB and LiF2BC2O4 respectively [99, 100]. Evidently,the salt anion does at least participate passively in the solvent reduction. Nie etal. studied SEI formation in LiPF6, LiBF4, LiTFSI, LiFSI, and, LiDFOB in ECelectrolyte [36]. They observe dierences in the SEI composition and concludethat salt reduction products are important SEI compounds as well. The mostfrequently observed salt reduction product is LiF. It is found in salts containinguorine such as LiPF6 and has been detected by Aurbauch and other researches[14, 101103]. LiPF6 reduction has been studied by D.P. Abraham et al., whoproposed that LiPF6 is reduced and eventually forms LiF and OPF3 [35]. Nie alsoreports that LiF is another main SEI compound in LiPF6 containing electrolyteswhile lithium oxyurophosphates (LixPFyOz) are present in low quantities [15].Weber et al. used XPS depth proling to study the composition of SEI on HOPG.They nd high LiF concentrations throughout the complete SEI prole whilelithium oxyurophosphates are mostly found at the solution-side of the SEI [18].The decomposition of LiPF6 can also be induced thermally in the presence oftrace water or alcohol [104]. In this case, reaction products include HF which canfurther react with lithium alkyl carbonates, as summarized in [105]. The complexLiPF6 decomposition process was investigated by Campion and Lux [104, 106].Abraham et al. [35] also found LiF in SEI formed from LiBF4 and LiF2BC2O4
solutions. Peled et al. studied SEI formation on dierent graphite substrates,
16
1.2 Experimental Understanding of SEI
including Highly Ordered Pyrolytic Graphite (HOPG) with LiPF6, LiAsF6, and,LiTFSI solutions [46]. His XPS and TOF-SIMS measurements suggest that SEIon the graphite edge plane consists mainly of salt reduction products, mostlyLiF. In contrast, SEI on the basal plane is thinner and consists of polymeric andorganic solvent reduction compounds. Finally Seo et al. report that the anionassociation tendency for dierent lithium salts increases in the order CF3CO2
>CF3SO3
> BF4 > ClO4
≥ TFSI > PF6 [107]. As mentioned above, higher
salt association increases the amount of anion reduction products in the SEI.This eect is extremely pronounced in the limit of super concentrated electrolytes[108, 109]. These electrolytes have lower ionic conductivities than conventionallyused dilute electrolytes with salt concentrations of ∼1M. Despite this, theyimprove the rate performance of graphite electrodes which is attributed to amuch smaller SEI resistance. In these electrolytes, SEI is almost entirely anionderived [110]. Petibon et al. studied highly concentrated LiFSI ethylacetate cellswith EIS and reports reduced interface resistance of the graphite anode [58]. Adierent but similar trend is the move towards ionic liquids. These electrolytesalso create surface lms with dierent chemistry, as shown by Kim et al. [48] fora Li-TFSI based ionic liquid.Super concentrated electrolytes and ionic liquids open up an additional avenue
of SEI research. However, this is a relatively new eld and the vast majorityof studies on SEI focuses on organic solvents with relatively dilute salt concen-trations. Here, studies of simplied systems, i.e., binder-free electrodes haveimproved our understanding of SEI composition [34]. This progress is also dueto the use of novel experimental techniques such as solid state NMR and TEM[53, 111]. These studies examine SEI from LiPF6/organic carbonate mixtures ongraphite and silicon anodes. They conrm that SEI in EC containing solventsis primarily composed of lithium ethylene dicarbonate ((CH2OCO2Li)2, LiEDC).Poly-ethylene oxide is also found as a major product of EC reduction. Reduc-tion of linear carbonates such as dimethyl carbonate (DMC) is also found to formlithium alkyl carbonates, such as lithium methyl carbonate (CH3OCO2Li, LiMC).These compounds play a minor role when EC is in the solvent mixture. This islinked to the solvation shell of lithium-ions which are preferably coordinated toEC [52, 111]. Furthermore, EC has a higher reduction potential [112]. Li2CO3 isnot present or only found in small quantities in recent studies [35, 53, 111]. Itspresence in several older studies is now believed to originate from water and CO2
contamination.It has also been found that SEI properties depend on the underlying sub-
strate/electrode. This complicates SEI research because results obtained withgood model systems such as HOPG or copper cannot be transferred to electrodesof interest such as graphite. Bar-Tow and Peled illustrate this in separate stud-ies for the basal and edge plane of graphite [43, 44]. They nd that the graphitebasal plane is covered by an SEI layer that consists mostly of organic compounds.This layer is three to ve times thinner than the SEI on the graphite edge plane.The latter is also made up of salt reduction products. This is evidenced withdepth-proling techniques such as time of ight secondary ion mass spectrome-try (TOF-SIMS). Kostecki et al. found that SEI thickness is directly correlatedwith an increasing concentration of graphite edge plane and lattice defects of the
17
1 Introduction and Motivation
underlying electrode [51]. Weber et al. correlate the defect concentration on aHOPG electrode to the rate of initial passivation [18]. Specically, formationtakes more than three cycles if the electrode is defect-free, i.e., smooth and welldened. In contrast, passivation is completed after the rst cycle on a defectiveelectrode.Solvent decomposition on dierent lithium conversion alloys also proceeds dif-
ferently from solvent decomposition on graphite [113]. Electrode materials thatexhibit large volume change such as silicon can fail to form a stable SEI entirely.SEI needs to be exible to accommodate volume changes of the underlying sub-strate without damage by cracking or rupture. It is believed that polymeric SEIcompounds can provide or improve these properties. SEI is mostly comprisedof polymeric compounds when FEC is used as a solvent or additive [15]. Earlyindications on the existence of polymeric SEI compounds have been found within-situ XRD [49]. More recently, NMR experiments have shown that SEI fromEC based electrolytes contains large amounts of poly-ethylene oxides [53]. Theycoexist with the lithium carbonates shown in g. 1.3, i.e., LiEDC, LiEC andLi2CO3. Other NMR studies nd that FEC and VC, both popular SEI formingadditives, mainly produce polymeric SEI species as well [54, 75].The notion that the SEI consists of a porous outer layer (solution side, i.e.
neighbouring the electrolyte) and a dense inner (electrode side, i.e. close tothe electrode) layer is often encountered in literature. Peled et al. draw thisconclusion in a study about SEI formed on the graphite basal plane. He ndsthat solution-side composition of the surface lm contains a large amount oforganic remnants that are not present in layers below [44]. Harris and Lu usedTOF-SIMS to nd evidence of a dual-layer SEI morphology with depth prolesof labelled isotopes [114]. This is conrmed in a theoretical study by Shi et al.[3] which reproduces said prole explained with a dual-layer SEI model. Harrisand Lu also nd dierent chemical composition of these layers in other studies[47, 55]. Solid-state NMR studies also suggest that SEI is at least partially porous[53], supporting the porous outer layer theory. Tang et al. successfully used adual-layer model to explain ferrocene redox-shuttle experiments [57, 76]. Thismolecule can be reduced electrochemically on an electrode that is covered byan SEI. However, the passivating ability of the SEI impedes this process. Tangnds that a dual-layer model describes her transient measurements well if SEI onHOPG or on the graphite basal plane is studied. For SEI formed on the graphiteedge plane, a more complicated behaviour is observed that could involve frequentSEI dissolution and reformation [77].More recent studies reveal a strong dependence of the SEI formation rate [115]
on the direction of applied lithium-ion currents. SEI is found to grow faster whena large current is applied that charges (lithiates) the underlying electrode.In summary, there is a general understanding of SEI composition and mor-
phology for a few specic systems. Surface lms on graphite electrodes in organicsolvents have been studied and optimised for battery performance in several stud-ies. This vast amount of information creates the elusive conclusion that SEI is wellunderstood. However, there are still some key aspects concerning SEI that lacksucient understanding. Firstly, the mechanism of lithium-ion transport throughthe SEI is still under debate. This is an essential aspect of battery operation and
18
1.3 Theoretical Understanding of SEI
understanding the nature of lithium-ion transport in the SEI could help to reducethe ionic resistance of the surface lm. In this way, one could increase the powerand rate performance of lithium-ion batteries. Secondly, there is an ongoing dis-cussion about the mechanism that causes long-term SEI growth. As mentionedabove, the surface lm does not stop electrolyte reduction reactions completely.Instead, these reactions continue throughout battery life and slowly reduce a bat-teries capacity [4, 116]. This could be caused by several dierent mechanisms,for example, electron leakage through the surface lm. Alternatively, a porousSEI would enable through-lm solvent diusion, which could cause electrolytereduction as well. As summarised in section 1.3, multiple such mechanisms arediscussed in SEI literature. Finding or identifying the correct mechanism canshow an avenue to tailor SEI and reduce capacity fade. This could also enablethe development of operating strategies that mitigate long-term capacity fade inlithium-ion batteries.The lack of understanding of these key questions can be attributed to several
reasons. There are many variables which inuence SEI properties and complicatea systematic investigation. The choice of solvent, salt, and salt concentration, butalso the choice of electrode material and its surface treatment similarly inuenceSEI formation and properties [117]. Initial SEI formation is strongly aected bytemperature, potential, as well as the duration of formation cycles. It is knownthat temperature and potential also aect the long-term growth [2, 4, 118]. SEIchemistry is known to be sensitive to air exposure which can occur during sampletransfer. Additionally, SEI probes are often rinsed with DMC or EMC. Thiscan damage or alter the surface lm before its characterisation. Damage canalso be caused by electron beams that are used for imaging. SEI chemistry isdiverse; however, several dierent SEI compounds have similar functional groupsand atomic bonds. An example of this is the carbonate group which is found inall lithium carbonates and all common solvents, as shown in gs. 1.3 and 1.4. Itis therefore dicult to accurately or quantitatively determine SEI compositionwith techniques such as FTIR and XPS. All this makes analysing and comparingdierent studies and their results dicult. This does, in turn, complicate theidentication of universal SEI properties and mechanisms.
1.3 Theoretical Understanding of SEI
The amount of experimental studies on SEI comes as no surprise considering itspivotal importance for further development of the lithium-ion battery technology.These experimental eorts are accompanied by numerous theoretical studies andconsiderations which try to predict SEI properties and complement or explainexperimental results. However, the diversity of relevant length and time scalesthat govern SEI formation constitutes a fundamental theoretical challenge. It isessential to distinguish between initial SEI formation, which takes places in sec-onds to hours, and continued long-term SEI growth. Relevant timescales for thelatter range from days to years. SEI chemistry is determined by electrochemicalreactions between select atoms and molecules. These are aected by molecularenvironments while transport through the SEI determines the availability of reac-
19
1 Introduction and Motivation
tants. A single method cannot capture this complexity alone. Therefore, a largevariety of methods is used to describe isolated aspects of SEI surface lms. Below,results from dierent theoretic studies are summarised briey. They are groupedinto two categories. Section 1.3.1 reviews results from atomistic methods whichare based on quantum chemistry. Note that a more comprehensive summary ofthese results can be found in literature [110, 119121]. Atomistic methods de-scribe individual atoms and molecules. These simulations are restricted to shorttime scales and small system sizes. In contrast, multi-scale models can describeSEI as a whole over longer scales. Results from such models are summarised insection 1.3.2 and Paper IV.
1.3.1 Atomistic Studies
Atomistic studies use quantum chemistry methods such as density functional the-ory (DFT) and molecular dynamics (MD) or DFT/MD hybrid/derivative meth-ods. These include monte marlo molecular dynamics (MCMD), reactive force-eld (ReaxFF), density-functional tight-binding (DFTB), molecular dynamics[122], and ab-initio molecular dynamics (AIMD) [123]. Each method is computa-tionally expensive and limited in system size and time span. For example, AIMDsimulations can describe ∼10-100 particles for femto- and up to picoseconds.In contrast, MCMD methods can describe ∼105 particles for few nanoseconds[110]. Many studies consider a simplied molecular environment because of thelimited system size of these methods. Idealised conditions include calculationsat zero Kelvin or omitting ions, co-solvents and impurities. Nonetheless, thesesimulations provide otherwise inaccessible insights into a broad range of SEI phe-nomena. This includes optimal and preferred arrangements of molecules as wellas the enthalpy and activation energy of various SEI formation reactions. Asmentioned above, MD methods can simulate the transient evolution of a largenumber of particles for several nanoseconds. The initial SEI formation phase ismuch longer such that a full simulation of this process is not possible. However,these simulations can capture short extracts of this process which is sucient tostudy critical mechanisms. Some MD methods are capable of describing diversechemical environments due to the large number of particles they can support.This can be used to study transport mechanisms in amorphous structures andsolutions. Such simulations are often performed at elevated temperature if slowtransport processes are studied.
Transport in the SEIIn regular structures, diusion coecients can also be determined with DFTby calculating energy barriers of optimal diusion pathways. Shi et al. usethis method to nd the diusion coecient of lithium-ions, vacancies andother defects in a Li2CO3 host lattice [3]. They also calculated the formationenergy of these defects from which their concentration can be inferred. Thepublication also reports a nite concentration of neutral lithium-interstitialsand its potential dependence. This result is picked up in Paper II andPaper III of this thesis. These publications investigate the diusion of Li-radicals as the long-term growth mechanism of SEI formation. Generally,
20
1.3 Theoretical Understanding of SEI
defect concentrations are found to depend strongly on the potential. Thisis considered in a follow-up study where the potential dependence of theionic conductivity is elucidated further [124]. At potentials below 1V vsLi/Li+, lithium-ion conduction is facilitated by lithium-ion interstitials witha repetitive knock-o mechanism. The same mechanism has also been foundby Borodin et al. in MD simulations [125]. In contrast, at potentials above4V, lithium-ion vacancies become the dominant charge carrier in Li2CO3.Both charge carriers facilitate lithium-ion transport at potentials betweenthese values at which the conductivity is small (10−15 S/cm).
This value is too small and would almost prevent lithiation and delithiationof the underlying electrode in this potential range. However, it would bepossible if the inorganic layer of the SEI is only a few nanometres thick,a conclusion that aligns with the common assumption SEI is composed ofa thin (inner, electrode-side) inorganic and a thick (outer, solution-side)organic layer. The latter is partially porous and has notably higher ionicconductivity. However, investigations by Zhang et al. reveal that such asmall conductivity could also be possible if the inorganic SEI layer is thicker[59]. He studied the interface between LiF and Li2CO3, two common SEIcompounds, and reports a high vacancy concentration in this region. Thiscould also enable fast lithium-ion transport such that high ion mobilityin the bulk of individual SEI grains is not needed. Bedrov et al. usedan MD-Monte Carlo (MC) algorithm to study Li-diusion in ordered andamorphous layers of LiEDC and Li2BDC [126]. At room temperature, bothmaterials and structures behave as a single ion conductor, meaning onlycations are mobile. It is also found that ordered structures result in higherion mobility. It is rationalised that slow SEI growth favours the formationof ordered phases. Therefore, the prediction is consistent with the experi-mental observation that slow formation cycles result in better battery per-formance. Lithium-ion diusivity in LiF, Li2O, and Li2CO3 has also beenstudied by Benitez et al. with classical MD [127]. These simulations ndlithium-ion diusion coecients between 4 · 10−17 and 4 · 10−16 m2/s.
Lin et al. calculated electron tunnelling barriers and probabilities for thinlayers of Li2CO3, LiF and Li3PO4 [128]. The tunnelling rates are relevantup to SEI thickness between 16 and 30 A which is consistent with TEMimages [61]. This implies that electron tunnelling plays an essential role inthe initial phase of SEI formation. The concept of a thin inorganic layerthat limits SEI growth is also suggested by Li et al. [129] and is furtherdiscussed in section 1.3.2.
Electrolyte decompositionMultiple authors study reaction paths of solvent molecules, salt anions andSEI compounds. Quantum chemistry investigations can highlight whichmechanism is kinetically or thermodynamically favoured. Yu et al. studiedthe interaction of excess electrons with (EC)n clusters using static anddynamic DFT calculations [130]. He nds that this electron is localised ona single molecule which leads to reduced energy barrier for breaking theC-O bond that opens the EC ring. Note that this is the initial step of
21
1 Introduction and Motivation
most EC decomposition reactions, see g. 1.3b. Theoretical studies on thetwo-electron reduction of EC have been summarised by Leung et al. seereference [131]. This reduction path was found to be energetically favoured[132]. It is therefore inferred that it plays an important role during initialSEI formation. However, after the formation of a thin SEI layer, the electrontunnelling rate becomes smaller and a single electron (or two-step) reductionprocesses become dominant. Ring-opening reaction products are found tobe CO and OC2H4O2 (de-protonated ethylene glycol). While the formeris found in experiments, the latter further reacts to form LiEDC with traceCO2. In the absence of CO2, its decomposition products are proposed toinclude CO, CO3
2 , C2H4, and even oligomers. If the second electron is notsupplied quickly compared to the ring-opening reaction, the formation ofC2H4 and CO3
are predicted instead. The latter can react further to formLi2CO3.
Similar studies have been performed for the decomposition of FEC [133].Here, the main reduction product is found to be LiF while gaseous by-products include CO2 and CHOCH2. Another study by the same authoris dedicated to the thermodynamic stability of standard SEI componentson a metallic Li electrode [134]. Such reactions include the reduction ofLi2CO3 and LiEDC to form Li2O. They are expected to take place at theelectrode-side of the SEI where a thin layer of Li2O is predicted.
Electrolytes in battery applications consist of multiple solvent species, saltand additives. Studies on reduction pathways often omit this complex chem-ical environment. This can lead to surprising discrepancies between theo-retic predictions and experimental observations. According to reductionpotentials, LiPF6 should be the preferred or even the only species reducedin common electrolytes mixtures of EC, DEC, and VC. Ab-initio MD sim-ulations by Leung et al. predict that PF6
reduction plays a major role atlow electrode potentials [135]. However, AIMD simulations by Martinez etal. show that competition for active Li sites on the surface can prevent this.This competition leads to the reduction of mostly solvent molecules [123].Additionally, in common electrolytes, solvent molecules outnumber salt an-ions at ratios of 13 to 1 which increases their likelihood to participate in SEIformation reactions. Borodin et al. explain the preferred reduction of ECin mixed carbonate electrolytes [136]. EC has a higher reduction potentialthan DMC [112], but its preferred reduction is also caused by other factors.Adsorption of EC on existing SEI compounds is energetically favoured overDMC adsorption. Furthermore, dierent studies show that the solvationshell of lithium-ions consists mostly of EC molecules at common salt con-centrations [52, 98]. This is due to the high dipole moment of EC and alsotrue for other linear carbonates. In another study Chapman et al. alsoreports solvent coordination numbers of lithium ions range from 2 to 5 forLiTFSI, LiPF6, LiBF4, and LiClO4, solutions in PC or DMC [39]. Gener-ally, low salt association and large solvent coordination numbers promotethe participation of solvent molecules over salt anions in SEI formation.
Theoretic studies by Sodeyama show that sacricial TFSA− reduction pre-
22
1.3 Theoretical Understanding of SEI
vents the decomposition of acetonitrile solvent molecules at very high saltconcentrations [137]. This is desirable in a battery because it does notreduce the reversible lithium inventory of the system.
SEI formationThe mechanism shown in g. 1.1a was proposed by Ushirogata et al. [138].He performed DFT calculations of solubility and adhesion energies of SEIcompounds and suggests that direct precipitation of newly formed SEI isunlikely. Instead, reduction products rst diuse away from the electrodeand aggregate to form larger clusters. These clusters then precipitate onthe electrode to form the passivating surface lm. Ushirogata argues thatthis mechanism is needed to explain surface lms that are up to severaltens of nanometres thick. These SEIs are found on graphite after the rstlithiation [37]. Details of the initial SEI formation mechanism are stillsubject to debate. Electron tunnelling only enables the SEI to become 2-3nanometres thick [128]. First principle calculations by Soto et al. proposethat radical species are responsible for SEI growth beyond this limit [139].In this case, the transient evolution of SEI thickness can be described withmulti-scale models, see section 1.3.2.
High throughput screeningMultiple dierent methods are used simultaneously in so-called high through-put screening studies [112, 140142]. These study several key properties ofsolvent and salt candidates for battery applications. This also includes thestability window of the species in question. Currently, oxidative stability isof more importance due to the recent trend towards high voltage cathodes.However, stability against reduction is often considered as well.
In conclusion, predictions by atomistic theories converge for standard carbonate-based solvents and the most common additives, i.e., FEC and VC. The reductionmechanism of these molecules is well understood. However, quantitative predic-tions of SEI composition are not possible because the formation is also inuencedby the solution structure of the electrolyte as well as a competition for adsorp-tion sites between dierent solvent species. Additionally, the eciency of lmformation and SEI composition could be determined by the adhesion energies ofdierent SEI compounds. The nature of lithium-ion transport through the SEIremains debated. Diusion of lithium-ions is possible in all relevant SEI com-pounds; however, ion transport along grain boundaries could play an importantrole as well. This also applies for lithium-ion movement in SEI pores. Electrontunnelling through the SEI is likely to play an important role in its initial for-mation. In contrast, long-term lm growth could be caused by the diusion ofneutral lithium-interstitials.
1.3.2 Continuum SEI growth Models
In contrast to atomistic models, continuum SEI growth models describe SEI for-mation in a simplied way and try to elucidate universal properties. There-fore, they typically omit a detailed description of the SEI formation reaction and
23
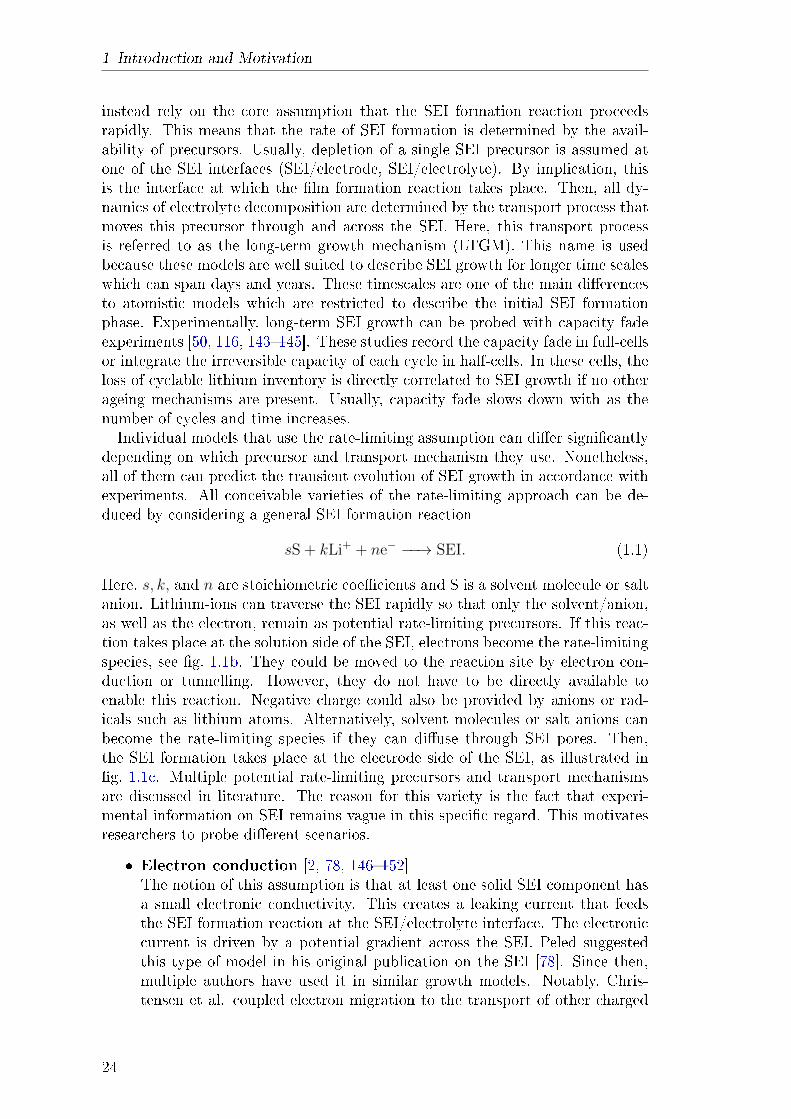
1 Introduction and Motivation
instead rely on the core assumption that the SEI formation reaction proceedsrapidly. This means that the rate of SEI formation is determined by the avail-ability of precursors. Usually, depletion of a single SEI precursor is assumed atone of the SEI interfaces (SEI/electrode, SEI/electrolyte). By implication, thisis the interface at which the lm formation reaction takes place. Then, all dy-namics of electrolyte decomposition are determined by the transport process thatmoves this precursor through and across the SEI. Here, this transport processis referred to as the long-term growth mechanism (LTGM). This name is usedbecause these models are well suited to describe SEI growth for longer time scaleswhich can span days and years. These timescales are one of the main dierencesto atomistic models which are restricted to describe the initial SEI formationphase. Experimentally, long-term SEI growth can be probed with capacity fadeexperiments [50, 116, 143145]. These studies record the capacity fade in full-cellsor integrate the irreversible capacity of each cycle in half-cells. In these cells, theloss of cyclable lithium inventory is directly correlated to SEI growth if no otherageing mechanisms are present. Usually, capacity fade slows down with as thenumber of cycles and time increases.Individual models that use the rate-limiting assumption can dier signicantly
depending on which precursor and transport mechanism they use. Nonetheless,all of them can predict the transient evolution of SEI growth in accordance withexperiments. All conceivable varieties of the rate-limiting approach can be de-duced by considering a general SEI formation reaction
sS + kLi+ + ne− −−→ SEI. (1.1)
Here, s, k, and n are stoichiometric coecients and S is a solvent molecule or saltanion. Lithium-ions can traverse the SEI rapidly so that only the solvent/anion,as well as the electron, remain as potential rate-limiting precursors. If this reac-tion takes place at the solution side of the SEI, electrons become the rate-limitingspecies, see g. 1.1b. They could be moved to the reaction site by electron con-duction or tunnelling. However, they do not have to be directly available toenable this reaction. Negative charge could also be provided by anions or rad-icals such as lithium atoms. Alternatively, solvent molecules or salt anions canbecome the rate-limiting species if they can diuse through SEI pores. Then,the SEI formation takes place at the electrode side of the SEI, as illustrated ing. 1.1c. Multiple potential rate-limiting precursors and transport mechanismsare discussed in literature. The reason for this variety is the fact that experi-mental information on SEI remains vague in this specic regard. This motivatesresearchers to probe dierent scenarios.
Electron conduction [2, 78, 146152]The notion of this assumption is that at least one solid SEI component hasa small electronic conductivity. This creates a leaking current that feedsthe SEI formation reaction at the SEI/electrolyte interface. The electroniccurrent is driven by a potential gradient across the SEI. Peled suggestedthis type of model in his original publication on the SEI [78]. Since then,multiple authors have used it in similar growth models. Notably, Chris-tensen et al. coupled electron migration to the transport of other charged
24
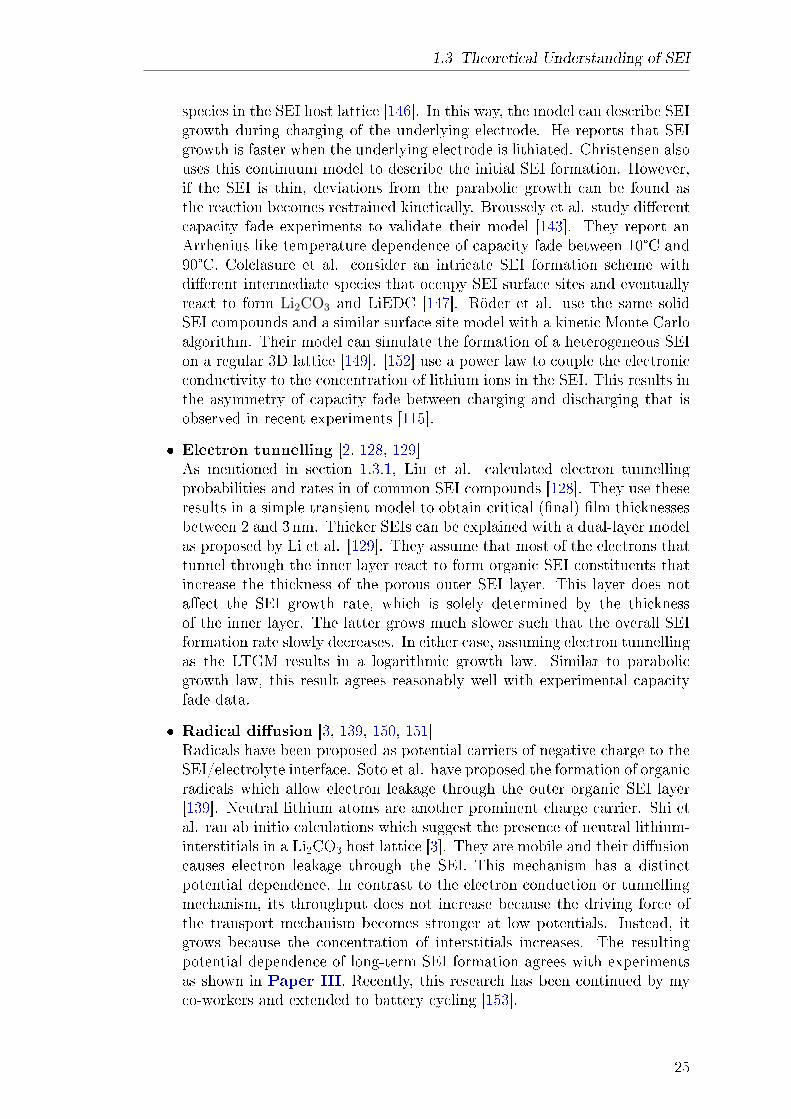
1.3 Theoretical Understanding of SEI
species in the SEI host lattice [146]. In this way, the model can describe SEIgrowth during charging of the underlying electrode. He reports that SEIgrowth is faster when the underlying electrode is lithiated. Christensen alsouses this continuum model to describe the initial SEI formation. However,if the SEI is thin, deviations from the parabolic growth can be found asthe reaction becomes restrained kinetically. Broussely et al. study dierentcapacity fade experiments to validate their model [143]. They report anArrhenius like temperature dependence of capacity fade between 10°C and90°C. Colclasure et al. consider an intricate SEI formation scheme withdierent intermediate species that occupy SEI surface sites and eventuallyreact to form Li2CO3 and LiEDC [147]. Röder et al. use the same solidSEI compounds and a similar surface site model with a kinetic Monte Carloalgorithm. Their model can simulate the formation of a heterogeneous SEIon a regular 3D lattice [149]. [152] use a power law to couple the electronicconductivity to the concentration of lithium ions in the SEI. This results inthe asymmetry of capacity fade between charging and discharging that isobserved in recent experiments [115].
Electron tunnelling [2, 128, 129]As mentioned in section 1.3.1, Lin et al. calculated electron tunnellingprobabilities and rates in of common SEI compounds [128]. They use theseresults in a simple transient model to obtain critical (nal) lm thicknessesbetween 2 and 3 nm. Thicker SEIs can be explained with a dual-layer modelas proposed by Li et al. [129]. They assume that most of the electrons thattunnel through the inner layer react to form organic SEI constituents thatincrease the thickness of the porous outer SEI layer. This layer does notaect the SEI growth rate, which is solely determined by the thicknessof the inner layer. The latter grows much slower such that the overall SEIformation rate slowly decreases. In either case, assuming electron tunnellingas the LTGM results in a logarithmic growth law. Similar to parabolicgrowth law, this result agrees reasonably well with experimental capacityfade data.
Radical diusion [3, 139, 150, 151]Radicals have been proposed as potential carriers of negative charge to theSEI/electrolyte interface. Soto et al. have proposed the formation of organicradicals which allow electron leakage through the outer organic SEI layer[139]. Neutral lithium atoms are another prominent charge carrier. Shi etal. ran ab initio calculations which suggest the presence of neutral lithium-interstitials in a Li2CO3 host lattice [3]. They are mobile and their diusioncauses electron leakage through the SEI. This mechanism has a distinctpotential dependence. In contrast to the electron conduction or tunnellingmechanism, its throughput does not increase because the driving force ofthe transport mechanism becomes stronger at low potentials. Instead, itgrows because the concentration of interstitials increases. The resultingpotential dependence of long-term SEI formation agrees with experimentsas shown in Paper III. Recently, this research has been continued by myco-workers and extended to battery cycling [153].
25
1 Introduction and Motivation
Solvent/Anion diusion [2, 144, 154, 155]Alternatively, one can assume that electrolyte species such as solvent mole-cules or salt anions can diuse through the SEI. Then, this diusion processbecomes the rate-limiting mechanism. Its throughput must be small to slowdown SEI growth to a reasonable rate. This does imply that SEI porositymust be small because typical diusion coecients in the electrolyte aretoo large. Note that, dierent from all mechanisms discussed above, SEIformation takes place at the electrode/SEI interface if this mechanism is as-sumed. Pinson and Banzant couple their growth model to a battery modeland study the eect of SEI growth on cell capacity and voltage [118]. Theyalso consider an Arrhenius temperature dependence of the diusion coef-cient, resulting in good agreement with experimental capacity fade data.Tahmasbi et al. consider the inhomogeneity of SEI thickness by modellingthe evolution of its thickness distribution [154]. The heterogeneity of SEIis also considered by Hao et al. [155]. His 3D model describes SEI growthand considers multiple SEI compounds.
SEI failure and reformation [2, 156]SEI will rupture if in-plane stresses exerted by the underlying electrode arelarger than its tear resistance. This increases SEI porosity or creates cracks,either of which will expose the electrode to the electrolyte. Then, solventmolecules are reduced rapidly, and newly formed SEI compounds quicklyseal these gaps and stop SEI formation. Many continuum models considerthis mechanism together with one of the other LTGMs listed above. Mostcapacity fade experiments are designed such that the battery/cell is cycledrepeatedly. Then, capacity fade from SEI reformation consumes an almostconstant amount of lithium in each cycle. Continuum models simplify thisby dening a constant rate at which this mechanism consumes lithium. Inthis way, the nal prediction for capacity fade becomes a superposition oflinear and parabolic growth or logarithmic growth.
SEI failure and reformation play a secondary role on graphite electrodeswhich experience a relatively small volume change during lithiation and de-lithiation of∼ 10%. The expansion of conversion alloy anodes such as siliconcan be as large as ∼ 320%. Repeated SEI failure and reformation is themain cause of capacity fade in these electrodes. Tanaka et al. demonstratethis by simulating structural failure of the SEI on silicon [156]. Dendriticplating of lithium also causes signicant SEI failure, ultimately preventingthe use of metal lithium electrodes in secondary applications.
Most of these models assume homogeneous SEI thickness and morphology. Thisresults in a simple ODE that can be solved analytically if innitely fast reactionkinetics and stationary conditions are assumed. Its solution is a parabolic growthlaw. Only the tunnelling models predict a logarithmic time dependence of SEIthickness. An analytic solution is not possible if the kinetics of the SEI forma-tion reaction are considered, e.g. with a Butler-Volmer type rate expression. Inthis case, one nds a notable deviation from the analytic solution if SEI thick-ness is small. This is expected because SEI formation is limited by the reaction
26
1.3 Theoretical Understanding of SEI
kinetics in this situation. However, at long timescales, every model will even-tually transition to the long-term growth behaviour predicted by the analyticsolution. Christensen summarises these dierent growth regimes in detail [146].Von Kolzenberg et al. also discuss dierent SEI growth phases in a more recentpublication [153]. This model considers lithium-interstitial diusion and electronmigration at the same time which results in an additional very-long time growthregime.Some researches have created more complex models to study SEI heterogeneity.
Many studies couple the SEI growth model and common battery models to studythe distribution of SEI thickness throughout the cell [157]. Other researchessimulate SEI formation in three dimensions with a semi-atomistic Monte-Carloapproach [149, 155, 158]. These models suggest that the SEI thickness is notevenly distributed; however, the relative thickness variations they predict aresmall. Tahmasbi et al. use a population balance model to capture this eect[154]. He nds that variations of SEI thickness become smaller with time.The common issue of continuum SEI growth models is that they almost unani-
mously predict the parabolic growth law. Only the models that consider electron-tunnelling predict logarithmic growth. However, timescales considered by exper-imental capacity fade studies are not long enough to condently identify eithercandidate. Therefore, rate-limiting models cannot be validated with capacity fadeexperiments alone. This was recognised by Tang et al. who considered multiplemodels and investigated how SEI growth depends on other factors [2]. Theseexperiments show that SEI formation on glassy carbon electrodes consumes morecharge at lower potentials. Therefore, the authors conclude that the LTGM mustinvolve a charged species. They also report that SEI formation consumes morecharge in a spinning rotating disk electrode. This implies that transport from thebulk electrolyte has a slowing eect on SEI formation. However, it can also beexplained with the near-shore aggregation mechanism suggested by Ushirogataet al. [138]. Alternatively, damage to the outer and fragile SEI layer by frictionwould also lead to less ecient SEI formation.Tang and colleagues also used Ferrocene redox shuttles in several studies to
probe the passivating ability of SEI [57, 76, 77]. Surprisingly, relatively largeredox-shuttle currents can be drawn even after the SEI has been formed. Thesecurrents are up to ve orders of magnitude larger than the leaking current thatdrives long-term SEI growth [76]. They are aected and impeded by the SEI, anddierent limiting currents can be reached depending on the stage of SEI formation.Tang explains these measurements with a continuum model that assumes a dual-layer SEI. The thin and dense inner layer passivates the electrode. At the sametime, a thicker porous outer layer impedes the shuttle current with the formationof a diuse barrier. This model describes the experiments on HOPG electrodeswell. However, a more complicated behaviour is observed for SEI formed on thegraphite edge plane, which could involve frequent dissolution and reforming [77].In summary, continuum models can accurately predict the SEIs long-term evo-
lution. These models are based on one out of a handful of dierent long-termgrowth mechanisms of which the actual mechanism could not yet be determined.An essential result of this dissertation is anticipated at this point. Only thediusion of neutral lithium-interstitials reproduces the experimentally observed
27
1 Introduction and Motivation
potential dependence of long-term SEI growth. Dierent extensions of this mech-anism can further pronounce the asymmetry of long-term SEI growth that isobserved between lithiation and delithiation of the underlying electrode. Finally,models that assume a dual-layer SEI structure correctly predict and describedierent phenomena revolving around this surface layer.
28
2 Theory
This chapter on theory addresses the main principles used by the models devel-oped in this thesis. These include the SEI growth models developed in Paper I,and Paper II, as well as the impedance model from Paper V. They are all basedon a one-dimensional description of mass and charge balance. Therefore, the rstsection of this chapter is about transport theory. It explains the mass balanceequation, which is the central building block of the models mentioned above.Transport in porous media and dilute solution theory are also summarised. Con-centrated solution theory is not addressed here; however, a comprehensive deriva-tion can be found in the electronic supplementary information of Paper V. SEIformation and lithium intercalation are electrochemical reactions. They can bemodelled with the Butler-Volmer equation which is discussed in section 2.2. Notethat the content of these sections is part of the standard literature for electro-chemical systems [159].All models developed in this thesis have been analysed with numerical simu-
lations. This also applies to the impedance model, which is solved analyticallyin Paper V. In this case, the numeric solution was used to validate the analyticcalculation. Section 2.3 explains the nite-volume discretisation method that wasused to perform these simulations.Finally, section 2.4, compares the two growth laws that are associated with
SEI growth. In lithium-ion batteries, the capacity loss becomes slower with time.Both parabolic and logarithmic growth of the SEI layer can describe this trend.This section explains why neither of the growth laws can be conclusively identiedwith available experimental data. It also discusses the physical origin of thesegrowth laws in the context of SEI growth.
2.1 Transport Theory
As mentioned above, all models developed in this thesis rely on a one-dimensionaldescription of mass and charge balance. Accordingly, the central component ofthese models is the mass balance equation. A general mass balance equation de-scribes the temporal evolution of a quantity variable φ. This can be an absolutenumber of particles, energy, or entropy or the corresponding density (concentra-tion, energy density, or entropy density). Due to the reduction to one dimension,φ(x, t) depends on the position along the primary axes x, and time t. The corre-sponding mass balance equation reads
∂φ
∂t= −div ξφ + sφ. (2.1)
29
2 Theory
Here, ξφ is the current density of the quantity φ in the direction of the primaryaxes. The source term sφ adds or removes the corresponding quantity. This termcan be used to model chemical reactions or dissipation. Both, ξφ and sφ dependon the physics that describe the quantity φ in the corresponding phase.
In this thesis, eq. (2.1) is mainly used to describe the evolution of molarconcentrations. This includes the concentration of solvent molecules, spe-cic ions, or the salt concentration in the liquid electrolyte phase. Theconcentration of neutral lithium-interstitials in the solid SEI phase is con-sidered in specic models. SEI growth models developed in Paper I andPaper II use dilute and ideal solution theory to describe the transport ofthese species. This means that each species moves independently and doesnot interact with other species in the solution. The source term accountsfor their consumption by the SEI formation reaction. Concentrated solu-tion theory is only used in the impedance model developed in Paper V. Ineither case, diusion, migration, and convection are the relevant transportmechanisms.
The SEI growth models in Paper I and Paper II use a mass balanceequation to describe the evolution of the solid SEI itself. To this aim, thesolid volume fraction of each SEI compound i is considered as a quantityvariable. In this case, the rate of the corresponding SEI formation reactiondetermines the source term si. In Paper I, solid SEI species do not move sothat their current density is zero. However, in Paper II, solid convectionis introduced to model displacement of the SEI within the model domain.
Principally, anion and cation concentration are independent variables in abinary salt solution. The charge density % = F (z+c+ + z−c−) is a superpo-sition of these concentrations with units of C/m3. This variable is non-zeroin Paper V. Here, the Poisson equation is used to solve for the electronicpotential, see eq. (2.8). All other models in this thesis assume electroneu-trality, i.e., % = 0. Then, the general mass balance equation for % is nolonger a partial dierential equation. It becomes an implicit equation thatis used to determine the distribution of the electronic or electrochemicalpotential.
In summary, mass balance equations can be used to describe the temporal evo-lution of dierent physical quantities within a model domain. The charge-balanceequation can be used to solve for the electronic or electrochemical potential ifelectroneutrality is assumed. These are the key building blocks for the modelsdeveloped in this thesis. They typically consist of multiple balance equations thatdescribe the evolution of the primary variables. These variables and are used tocalculate the ux densities and the rate of electrochemical reactions within themodel domain.
2.1.1 Transport in Porous Media
Mass balance equations can also be used to describe the evolution of quantityvariables in a porous geometry. Naturally, the geometric intricacies of a porous
30
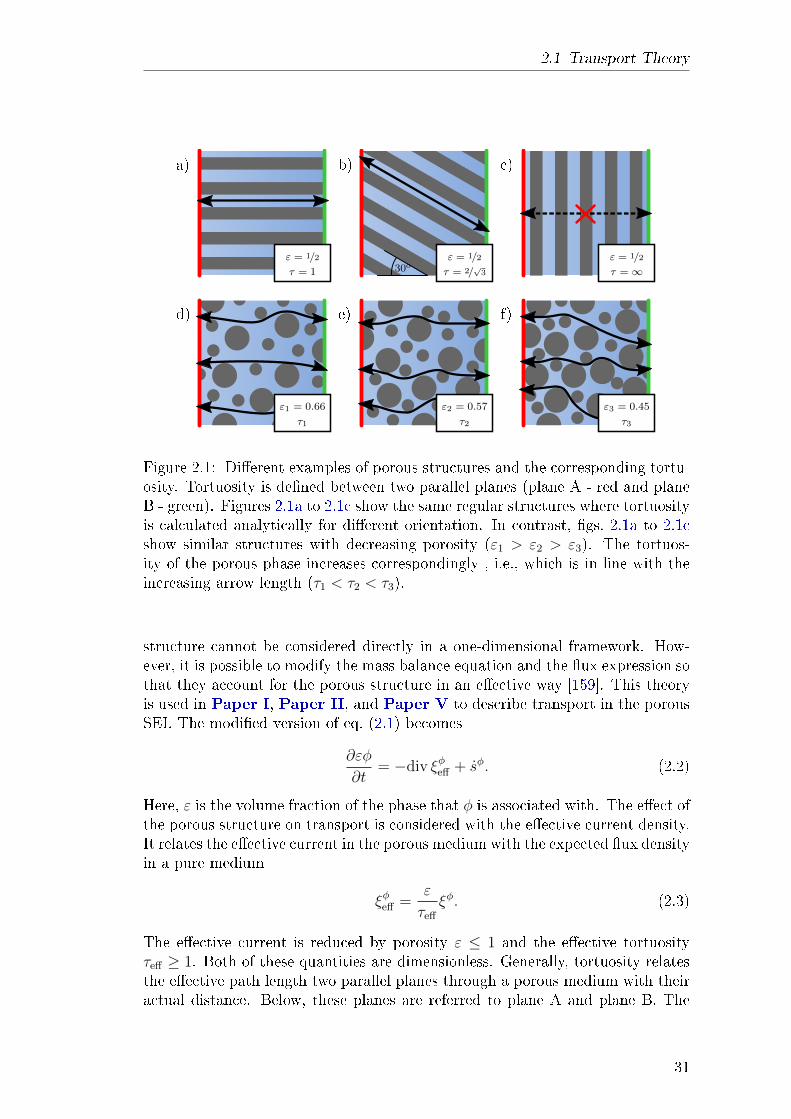
2.1 Transport Theory
a) b) c)
d) e) f)
ε = 1/2
τ = 1
ε = 1/2
τ =∞ε = 1/2
τ = 2/√3
ε1 = 0.66
τ1
ε2 = 0.57
τ2 τ3
ε3 = 0.45
30o
Figure 2.1: Dierent examples of porous structures and the corresponding tortu-osity. Tortuosity is dened between two parallel planes (plane A - red and planeB - green). Figures 2.1a to 2.1c show the same regular structures where tortuosityis calculated analytically for dierent orientation. In contrast, gs. 2.1a to 2.1cshow similar structures with decreasing porosity (ε1 > ε2 > ε3). The tortuos-ity of the porous phase increases correspondingly , i.e., which is in line with theincreasing arrow length (τ1 < τ2 < τ3).
structure cannot be considered directly in a one-dimensional framework. How-ever, it is possible to modify the mass balance equation and the ux expression sothat they account for the porous structure in an eective way [159]. This theoryis used in Paper I, Paper II, and Paper V to describe transport in the porousSEI. The modied version of eq. (2.1) becomes
∂εφ
∂t= −div ξφeff + sφ. (2.2)
Here, ε is the volume fraction of the phase that φ is associated with. The eect ofthe porous structure on transport is considered with the eective current density.It relates the eective current in the porous medium with the expected ux densityin a pure medium
ξφeff =ε
τeff
ξφ. (2.3)
The eective current is reduced by porosity ε ≤ 1 and the eective tortuosityτeff ≥ 1. Both of these quantities are dimensionless. Generally, tortuosity relatesthe eective path length two parallel planes through a porous medium with theiractual distance. Below, these planes are referred to plane A and plane B. The
31
2 Theory
concept of tortuosity is illustrated in g. 2.1, where one of these planes is redwhereas the other one is green. Tortuosity is anisotropic for most structures,see gs. 2.1a to 2.1c. In this thesis, it always refers to the direction along theprimary dimension. This is the through-lm direction in case of the SEI. Thereare multiple denitions of tortuosity that are dierent from each other.
The geodesic tortuosity is a good measure of the shortest path lengththrough a porous structure. It is calculated by determining the distribu-tion of the shortest distance Lmin between a random sample point on planeA and plane B. The geodesic tortuosity is the mean of this distribution,normalised by L, the distance between both planes
τgeo =〈Lmin〉L
. (2.4)
This denition does not take the size of individual pores into account. It isnot a good measure for mass transport through a porous structure for thisreason.
The pore size is considered by the eective tortuosity. This tortuosity vari-ant considers all paths that connect plane A and B through a porous struc-ture. It uses eq. (2.3) as its denition and can be calculated for a givengeometry. To this aim, a simple expression is used for the current densityξφ ∝ ∇φ. Formulating the corresponding mass balance equation results ina Poisson equation for φ (∆φ = 0) This equation which needs to be solvedin the pore phase. Without loss of generality, the boundary conditions canbe chosen as
φ = 0 on plane A,
φ = 1 on plane B, and
~n · ∇φ = 0, zero normal derivative on all other boundaries.
The eective tortuosity can then be calculated with eq. (2.3)
τeff = ε · L ·∫
A∩P~n · ∇φ dA∫AdA
. (2.5)
These integrals calculate the eective current between plane A and B. Here,ξφeff is calculated with an integral over the porous phase on plane A (P refersto the porous volume of the 3d structure). The corresponding integral overξφ has been simplied.
The models developed in this thesis only consider the eective tortuosity. Theyuse it for the description of transport in the porous SEI. Unfortunately, tomo-graphic SEI data is not available so that a direct calculation of τeff is not possible.Therefore, τeff is an unknown parameter in these models. However, the modelscan be used to determine and estimate reasonable ranges for this parameter. Thisallows some conclusions to be drawn about the otherwise inaccessible morphologyof the SEI.
32
2.1 Transport Theory
2.1.2 Dilute Solution Theory
This short section on dilute solution theory is meant to introduce the essentialconcepts of ionic charge transport in a uid medium. Note that no model de-veloped in this thesis actually use dilute solution theory in this context. Chargetransport in the electrolyte is not relevant for the description of long-term SEIgrowth during stationary storage. Lithium-ions are fairly mobile in the electrolyteand in the SEI itself. Therefore, both SEI growth models developed in Paper Iand Paper II assume that the concentration prole of charged species is in equi-librium. These models only use dilute solution theory to describe the mixture ofsolvent and co-solvent. Concentrated solution theory is used in the impedancemodel developed in Paper V. This theory is derived in the corresponding elec-tronic supplementary information, see section 4.5.2. More information on concen-trated solution theory can also be found in standard literature [159] and recentpublications [160].
This summary of dilute solution theory considers a liquid mixture that consistsof N dierent species α = 1, ..., N with charge number zα. The electrochemicalpotential of species α is dened as
µα = µ0,α +RT · ln a+ zαFΦ.
This denition combines the conventional chemical potential µα with electrostaticenergy contributions. Note that µα =
(∂G∂nα
)T,p,nβ 6=α
is a function of the Gibbs
Free Energy G. Here, Φ is the electric eld, R is the universal gas constant, Tis the temperature, and F is the Faraday constant. The reference concentrationsc0,α determine the reference potentials µ0,α which are constant. Generally, theactivity a is equal to γα · cα/c0,α, where γα is the activity coecient which mayitself depend on the concentrations and satises γα(c0,1, ..., c0,N) = 1.
Dilute solution theory simplies the interaction between dierent species. It isan approximation that can be used if all concentrations, except for one, are verysmall. Here, without loss of generality, this solvent role is assigned to species α =1. Then, all other concentrations satisfy cα 6=1 c1. Because of this concentrationmismatch, the chemical environment of every species α 6= 1 only consists ofsolvent molecules. Therefore, the corresponding inner energy does not dependon the concentration. Additionally, interactions between dierent non-solventspecies are rare and can be neglected. In this case, the Gibbs Free Energy onlyconsists of conguration entropic contributions so that γα 6=1 = 1.
This is also true in an ideal solution where the individual concentrations donot need to be small. Instead, the interactions between dierent species need tobe identical. This implies that the enthalpy of mixing is zero. Common batteryelectrolytes use of cyclic (EC, VC) and linear carbonates (DMC,EMC,DEC) assolvents. These species are chemically similar so that corresponding mixturescould feature near ideal solution behaviour.
A gradient of µα causes a force that acts on all particles of species α. Thiscauses them to move. The resulting molar ux density is obtained by considering
33
2 Theory
the mobility uα and the corresponding concentration cα
Nα = −uαcα∇µα= −uαRT∇cα − uαcαzαF∇Φ
= −Dα∇cα −σαzαF∇Φ. (2.6)
Here, Dα = uαRT is the diusion coecient and σα = uαcαz2αF
2 is the conductiv-ity of species α. Individual particles move by diusion and migration. In an idealsolution, diusion is only driven by congurational entropy maximisation. It isstraight forward to extend this ux expression to account for other interactions,i.e., magnetism or convective motion.
Summing over all charged species gives the total electric current density
J =N∑
α=1
zαFNα
= −N∑
α=1
zαFD∇cα −N∑
α=1
σα∇Φ.
Here, the electrolyte conductivity can be identied in the absence of concentrationgradients
σ =N∑
α=1
σα = F 2
N∑
α=1
uαcαz2α.
Liquid electrolytes satisfy Ohm's law in the absence of concentration gradients.This can be used to dene the transference number (or ion transport number) ofspecies α
tα =σασ
=uαcαz
2α∑N
β=1 uβcβz2β
.
The ion transport number denotes the relative contribution of species α to thetotal ionic current in the absence of concentration gradients. These numbersare dimensionless and satisfy
∑Nα=1 tα = 1, which makes them popular trans-
port parameters. However, in real systems, these parameters are not as easy touse as they appear to be. Incomplete dissociation of salts or the formation ofion-pairs can signicantly complicate their dependence on fundamental transportproperties (Dα or uα). Additionally, convective eects cannot be neglected inconcentrated solutions. This drastically aects the interpretation of transferencenumbers which depend on the reference frame that is chosen. The relation be-tween apparat transference numbers in the resting frame and the centre of massframe is derived in Paper V and in the corresponding electronic supplementaryinformation, see section 4.5.2
Using the ux expression eq. (2.6) in a mass balance equation eq. (2.1) results
34
2.1 Transport Theory
in the Nernst-Planck equation [161]
∂cα∂t
= ∇ ·(Dα∇cα +
σαzαF∇Φ
). (2.7)
All N equations of these type form a closed set of equations together with thePoisson equation for electrostatics
E∆Φ = −N∑
α=1
zαFcα = −%, (2.8)
where E = E0ER is the permittivity of the mixture.
2.1.3 Constraints in Liquid Mixtures
The SEI growth models developed in Paper I and Paper II, as well as theimpedance model in Paper V consider a liquid electrolyte. This electrolyte isa salt solution, meaning that there is a single anion and cation species. Onlylithium ions are considered as the cation species in this thesis whereas PF6
andTFSI are considered as anions. The solvent itself can be a mixture of severalspecies. Common battery electrolytes are mixtures of EC and a linear carbonate,i.e. DMC, EMC, and DEC. The impedance model also considers a tetragylme(G4) solvent.
Technically, the concentration cα of each electrolyte species α = 1, ..., N is anindependent variable when modelling the electrolyte. However, constraints canbe used to eliminate some of these variables. This reduces the model complexity.The two commonly used constrains are
N∑
α=1
ναcα = 1, να =
(∂V
∂nα
)
T,p,nβ 6=α
, (2.9a)
N∑
α=1
zαcα = 0. (2.9b)
Here, να is the partial molar volume of species α and zα is the correspondingcharge number. Note that any partial molar quantity satises a relation similarto eq. (2.9a) [162]. Equation (2.9b) is the mathematical formulation of elec-troneutrality. Electrostatic interactions are strong and eectively prevent theseparation of charges in a solution [159, 163]. This approximation holds truefor length scales that are larger than the Debye length λD and timescales largerthan λ2
D/Dsalt. Here, Dsalt is the salt diusion coecient of the liquid electrolyte,see section 2.1.4. The Debye length species the distance over which chargesare separated and thus electric elds are generated. A dedicated section on thisquantity is included in the electronic supplementary information of Paper V,see section 4.5.2.
35
2 Theory
2.1.4 Binary Electrolyte
The binary electrolyte refers to a solution of a dissociated salt. In this case,the stoichiometry of the salt determines the total amount of cations and anions.Specically, the valences nα and the charge numbers zα of both salt componentssatisfy z+n+ + z−n− = 0. Assuming electroneutrality relates their concentrationsaccording to eq. (2.9b). This motivates the introduction of the salt concentration
csalt =c+
n+
=c−n−
.
This variable simultaneously describes the distribution of anions and cations.Now, the temporal evolution of each ionic concentration can be described with
a mass balance equation. Dierent liner combinations of these equations resultin
∂csalt
∂t= ∇ ·Dsalt∇csalt, (2.10a)
0 = ∇ · J , (2.10b)
if electroneutrality is assumed. Equation (2.10) describes the transient evolutionthe salt concentration and the corresponding potential distribution. Note thatthese equations can also be derived with concentrated solution theory. However,the following expressions are only valid for dilute solution theory
J =N∑
i=1
zαF · Nα = −σ∇Φ− (D+ −D−) z+n+F∇c,
Dsalt =D+D− (z+ − z−)
z+D+ − z−D−,
σ =F 2csalt
RT
(z2
+n+D+ − z2−n−D−
).
They are dierent if concentrated solution theory is used. This is shown in theelectronic supplementary information of Paper V, see section 4.5.2
2.2 Electrochemical Kinetics
Electrochemical kinetics is the branch of electrochemistry that investigates therate at which electrochemical reactions proceed. This rate depends on the currentsystem conguration at the reaction site. That includes the concentration of anyspecies that participates in the reaction, as well as the electrochemical potentialof the electrolyte and the electric potential of the electrode.The most prominent rate expression for electrochemical reactions is the Butler-
Volmer equation. It is derived in standard literature for electrochemistry [159]and multiple publications [164, 165]. A partial derivation is also included in Pa-per II. Other rate expressions include the Marcus-Hush-Chidsey and the Marcusrate expression [166]. These expressions describe reactions with outer-sphere elec-tron transfer. However, they align with the Butler-Volmer rate expression unless
36
2.3 Finite Volume Method Discretisation
the overpotential η becomes large. This is illustrated in reference [166], wheredeviations between the dierent models only appear when |η| > 3RT/F ≈ 75mV(n = 1, αa = αc = 1/2). That is the reason the Butler-Volmer equation was usedin this thesis. The overpotential of the SEI formation reaction is expected to besmall because of the transport limited nature of long-term SEI growth. This isconrmed in the SEI growth models of Paper I and Paper II. These simulationsalways transition to transport limited growth and feature with small overpoten-tials, even if the overpotentials are articially increased by reducing the exchangecurrent density. Overpotentials are also small for lithium plating/stripping re-action in impedance model of Paper V. During an impedance experiment, thetotal cell voltage should be much smaller than the 75mV mentioned above.A general electrochemical reaction is considered to describe the Butler-Volmer
equation∑
α
Eα + n · e− ←−→∑
α
Pα.
The educts Eα are reduced on the electrode to form the reaction products Pαor vice versa. At the same time, the electrode supplies or consumes n electrons,depending on the reaction direction. The corresponding Butler-Volmer rate ex-pression is given by
jBV = i0 ·(eαanFηRT − e−αcnFηRT
)
This expression is the sum of two exponentials, one describing the anodic andone describing the cathodic reaction direction. The reaction rate is determinedby the overpotential η and the exchange current density i0. η is the drivingforce of the reaction. It is proportional to the total change of the electrochemicalpotential that the participating experience species when undergoing the reaction.Other parameters are the dimensionless transfer coecients αa and αc. Theyare dicult to determine and often assumed to equal 1/2. The exchange currentdensity i0, scales the rate of the interface reaction. Typically, i0 depends onthe concentration of precursors and reaction products as well their stoichiometry.However, more complicated expressions can emerge for processes such as lithiumintercalation in graphite [165].The Butler-Volmer equation can be linearised at small overpotentials which
means that jBV ≈ i0nF (αa+αc)RT
· η. On the contrary, one of the exponential termscan be omitted for large values of |η|. In this case, the Butler-Volmer expressionaligns with the Tafel equation.
2.3 Finite Volume Method Discretisation
Discretisation is a central aspect when it comes to the numerical solution of partialdierential equations. Specically, the simulation domain must be discretisedin space and time. Temporal discretisation is usually performed by the solver.Therefore, only the spatial discretisation scheme is summarised in this section.Similar to before, a one-dimensional system is considered. This simulation
37
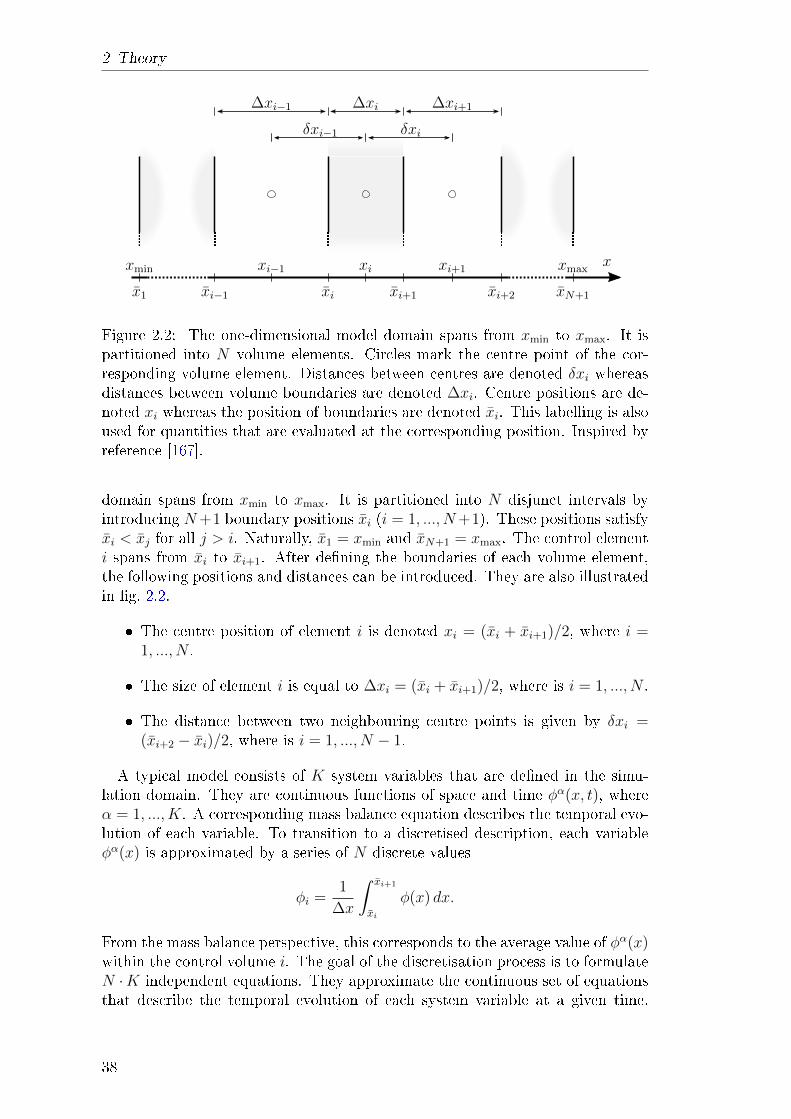
2 Theory
δxi−1 δxi
∆xi−1 ∆xi ∆xi+1
x
x1 xi xi+1 xi+2 xN+1xi−1
xi−1 xi xi+1xmin xmax
Figure 2.2: The one-dimensional model domain spans from xmin to xmax. It ispartitioned into N volume elements. Circles mark the centre point of the cor-responding volume element. Distances between centres are denoted δxi whereasdistances between volume boundaries are denoted ∆xi. Centre positions are de-noted xi whereas the position of boundaries are denoted xi. This labelling is alsoused for quantities that are evaluated at the corresponding position. Inspired byreference [167].
domain spans from xmin to xmax. It is partitioned into N disjunct intervals byintroducing N+1 boundary positions xi (i = 1, ..., N+1). These positions satisfyxi < xj for all j > i. Naturally, x1 = xmin and xN+1 = xmax. The control elementi spans from xi to xi+1. After dening the boundaries of each volume element,the following positions and distances can be introduced. They are also illustratedin g. 2.2.
The centre position of element i is denoted xi = (xi + xi+1)/2, where i =1, ..., N .
The size of element i is equal to ∆xi = (xi + xi+1)/2, where is i = 1, ..., N .
The distance between two neighbouring centre points is given by δxi =(xi+2 − xi)/2, where is i = 1, ..., N − 1.
A typical model consists of K system variables that are dened in the simu-lation domain. They are continuous functions of space and time φα(x, t), whereα = 1, ..., K. A corresponding mass balance equation describes the temporal evo-lution of each variable. To transition to a discretised description, each variableφα(x) is approximated by a series of N discrete values
φi =1
∆x
∫ xi+1
xi
φ(x) dx.
From the mass balance perspective, this corresponds to the average value of φα(x)within the control volume i. The goal of the discretisation process is to formulateN ·K independent equations. They approximate the continuous set of equationsthat describe the temporal evolution of each system variable at a given time.
38
2.3 Finite Volume Method Discretisation
An individual equation is obtained by integrating one of the K mass balanceequations, see eq. (2.1), over one of the N volume elements. This results in
∂φαi∂t
=ξαi − ξαi+1
∆xi+
1
∆xi
∫ xi+1
xi
sα dx
︸ ︷︷ ︸≈sαi
, (2.11)
after division by ∆xi. Similar to positions, expressions with a bar are evaluatedat the corresponding boundary. Typically, sαk is a function of several systemvariables. The integral over this term is approximated by evaluating it with theaverage values within the control volume
1
∆xi
∫ xi+1
xi
sα(φ1(x), ..., φα(x)) dx ≈ sα(φ1i , ..., φ
Ki ) = sαi
Next, the ux densities need to be approximated on the boundaries of each vol-ume element. Diusion and migration are the most frequently used transportmechanisms in this thesis. Their ux expression has the same mathematicalstructure
ξ(x) = Γ(φ1(x), ..., φα(x)) · gradφ(x).
Below, this expression is used for ξα to illustrate the discretisation procedure.Additionally, α is xed and this index is omitted below for clarity. To evaluateeq. (2.11), uxes need to be evaluated at the boundaries of the volume element.This creates ambiguity because the uxes depend on variables that are denedin each neighbouring control volume. Therefore, a new rule must be created toevaluate ξi, the ux density on the boundary. This rule must guarantee consistentevaluation of this expression. Otherwise, the discretised system of equations willnot conserve the corresponding variable. It is reasonable to assume that Γ isconstant within each control element. This suggests that
Γi∂φ
∂x
∣∣∣∣xi+1−
= Γi+1∂φ
∂x
∣∣∣∣xi+1
= Γi+1∂φ
∂x
∣∣∣∣xi+1+
,
where, ± denote left and right hand side dierentiation. Approximating withnite dierences results in the following relations
2Γiφi+1 − φi
∆xi= Γi+1
φi+1 − φiδxi
, (2.12a)
2Γi+1φi+1 − φi+1
∆xi+1
= Γi+1φi+1 − φiδxi
. (2.12b)
The left and right hand side dierentiation approximate φ(xi) with φi. Thisproduces the factor 2 and is exact for a rst-order approximation of φ(x) withinthe control volume. Equation (2.12) is used to eliminate φi+1 and solve for Γi+1.
39
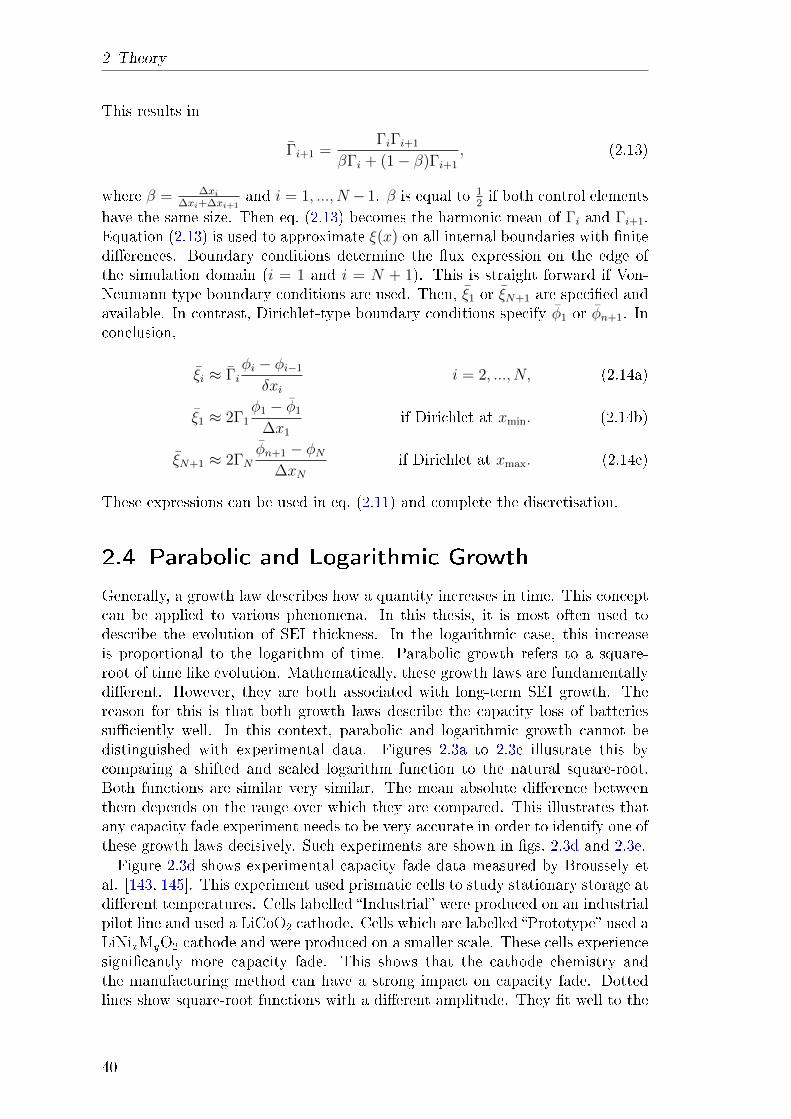
2 Theory
This results in
Γi+1 =ΓiΓi+1
βΓi + (1− β)Γi+1
, (2.13)
where β = ∆xi∆xi+∆xi+1
and i = 1, ..., N − 1. β is equal to 12if both control elements
have the same size. Then eq. (2.13) becomes the harmonic mean of Γi and Γi+1.Equation (2.13) is used to approximate ξ(x) on all internal boundaries with nitedierences. Boundary conditions determine the ux expression on the edge ofthe simulation domain (i = 1 and i = N + 1). This is straight forward if Von-Neumann type boundary conditions are used. Then, ξ1 or ξN+1 are specied andavailable. In contrast, Dirichlet-type boundary conditions specify φ1 or φn+1. Inconclusion,
ξi ≈ Γiφi − φi−1
δxii = 2, ..., N, (2.14a)
ξ1 ≈ 2Γ1φ1 − φ1
∆x1
if Dirichlet at xmin. (2.14b)
ξN+1 ≈ 2ΓNφn+1 − φN
∆xNif Dirichlet at xmax. (2.14c)
These expressions can be used in eq. (2.11) and complete the discretisation.
2.4 Parabolic and Logarithmic Growth
Generally, a growth law describes how a quantity increases in time. This conceptcan be applied to various phenomena. In this thesis, it is most often used todescribe the evolution of SEI thickness. In the logarithmic case, this increaseis proportional to the logarithm of time. Parabolic growth refers to a square-root of time like evolution. Mathematically, these growth laws are fundamentallydierent. However, they are both associated with long-term SEI growth. Thereason for this is that both growth laws describe the capacity loss of batteriessuciently well. In this context, parabolic and logarithmic growth cannot bedistinguished with experimental data. Figures 2.3a to 2.3c illustrate this bycomparing a shifted and scaled logarithm function to the natural square-root.Both functions are similar very similar. The mean absolute dierence betweenthem depends on the range over which they are compared. This illustrates thatany capacity fade experiment needs to be very accurate in order to identify one ofthese growth laws decisively. Such experiments are shown in gs. 2.3d and 2.3e.Figure 2.3d shows experimental capacity fade data measured by Broussely et
al. [143, 145]. This experiment used prismatic cells to study stationary storage atdierent temperatures. Cells labelled Industrial were produced on an industrialpilot line and used a LiCoO2 cathode. Cells which are labelled Prototype used aLiNixMyO2 cathode and were produced on a smaller scale. These cells experiencesignicantly more capacity fade. This shows that the cathode chemistry andthe manufacturing method can have a strong impact on capacity fade. Dottedlines show square-root functions with a dierent amplitude. They t well to the
40
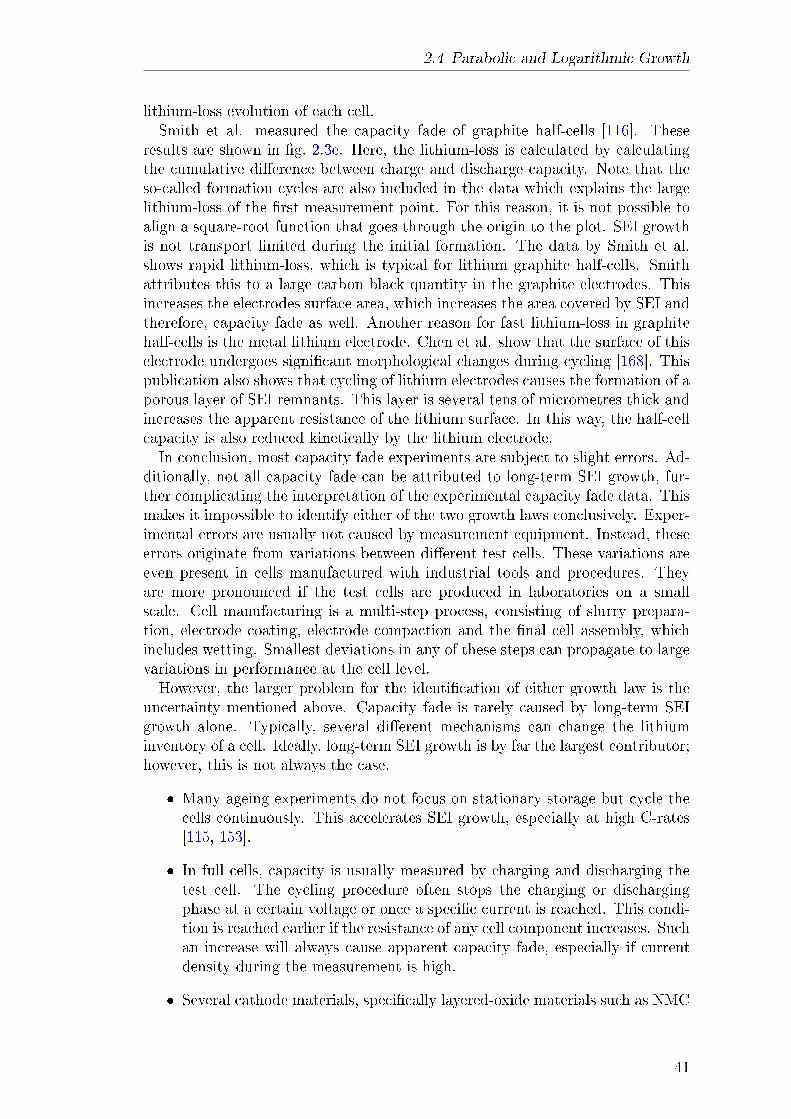
2.4 Parabolic and Logarithmic Growth
lithium-loss evolution of each cell.Smith et al. measured the capacity fade of graphite half-cells [116]. These
results are shown in g. 2.3e. Here, the lithium-loss is calculated by calculatingthe cumulative dierence between charge and discharge capacity. Note that theso-called formation cycles are also included in the data which explains the largelithium-loss of the rst measurement point. For this reason, it is not possible toalign a square-root function that goes through the origin to the plot. SEI growthis not transport limited during the initial formation. The data by Smith et al.shows rapid lithium-loss, which is typical for lithium graphite half-cells. Smithattributes this to a large carbon black quantity in the graphite electrodes. Thisincreases the electrodes surface area, which increases the area covered by SEI andtherefore, capacity fade as well. Another reason for fast lithium-loss in graphitehalf-cells is the metal lithium electrode. Chen et al. show that the surface of thiselectrode undergoes signicant morphological changes during cycling [168]. Thispublication also shows that cycling of lithium electrodes causes the formation of aporous layer of SEI remnants. This layer is several tens of micrometres thick andincreases the apparent resistance of the lithium surface. In this way, the half-cellcapacity is also reduced kinetically by the lithium electrode.In conclusion, most capacity fade experiments are subject to slight errors. Ad-
ditionally, not all capacity fade can be attributed to long-term SEI growth, fur-ther complicating the interpretation of the experimental capacity fade data. Thismakes it impossible to identify either of the two growth laws conclusively. Exper-imental errors are usually not caused by measurement equipment. Instead, theseerrors originate from variations between dierent test cells. These variations areeven present in cells manufactured with industrial tools and procedures. Theyare more pronounced if the test cells are produced in laboratories on a smallscale. Cell manufacturing is a multi-step process, consisting of slurry prepara-tion, electrode coating, electrode compaction and the nal cell assembly, whichincludes wetting. Smallest deviations in any of these steps can propagate to largevariations in performance at the cell level.However, the larger problem for the identication of either growth law is the
uncertainty mentioned above. Capacity fade is rarely caused by long-term SEIgrowth alone. Typically, several dierent mechanisms can change the lithiuminventory of a cell. Ideally, long-term SEI growth is by far the largest contributor;however, this is not always the case.
Many ageing experiments do not focus on stationary storage but cycle thecells continuously. This accelerates SEI growth, especially at high C-rates[115, 153].
In full cells, capacity is usually measured by charging and discharging thetest cell. The cycling procedure often stops the charging or dischargingphase at a certain voltage or once a specic current is reached. This condi-tion is reached earlier if the resistance of any cell component increases. Suchan increase will always cause apparent capacity fade, especially if currentdensity during the measurement is high.
Several cathode materials, specically layered-oxide materials such as NMC
41
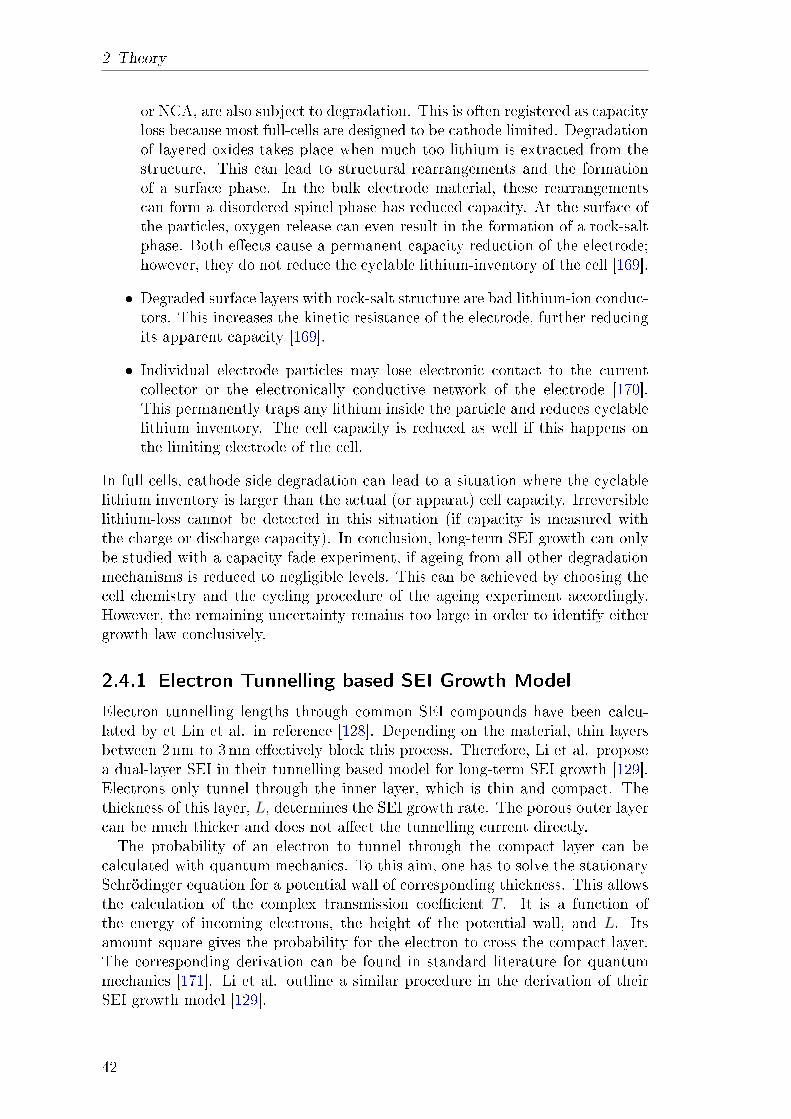
2 Theory
or NCA, are also subject to degradation. This is often registered as capacityloss because most full-cells are designed to be cathode limited. Degradationof layered oxides takes place when much too lithium is extracted from thestructure. This can lead to structural rearrangements and the formationof a surface phase. In the bulk electrode material, these rearrangementscan form a disordered spinel phase has reduced capacity. At the surface ofthe particles, oxygen release can even result in the formation of a rock-saltphase. Both eects cause a permanent capacity reduction of the electrode;however, they do not reduce the cyclable lithium-inventory of the cell [169].
Degraded surface layers with rock-salt structure are bad lithium-ion conduc-tors. This increases the kinetic resistance of the electrode, further reducingits apparent capacity [169].
Individual electrode particles may lose electronic contact to the currentcollector or the electronically conductive network of the electrode [170].This permanently traps any lithium inside the particle and reduces cyclablelithium inventory. The cell capacity is reduced as well if this happens onthe limiting electrode of the cell.
In full cells, cathode side degradation can lead to a situation where the cyclablelithium inventory is larger than the actual (or apparat) cell capacity. Irreversiblelithium-loss cannot be detected in this situation (if capacity is measured withthe charge or discharge capacity). In conclusion, long-term SEI growth can onlybe studied with a capacity fade experiment, if ageing from all other degradationmechanisms is reduced to negligible levels. This can be achieved by choosing thecell chemistry and the cycling procedure of the ageing experiment accordingly.However, the remaining uncertainty remains too large in order to identify eithergrowth law conclusively.
2.4.1 Electron Tunnelling based SEI Growth Model
Electron tunnelling lengths through common SEI compounds have been calcu-lated by et Lin et al. in reference [128]. Depending on the material, thin layersbetween 2 nm to 3 nm eectively block this process. Therefore, Li et al. proposea dual-layer SEI in their tunnelling based model for long-term SEI growth [129].Electrons only tunnel through the inner layer, which is thin and compact. Thethickness of this layer, L, determines the SEI growth rate. The porous outer layercan be much thicker and does not aect the tunnelling current directly.The probability of an electron to tunnel through the compact layer can be
calculated with quantum mechanics. To this aim, one has to solve the stationarySchrödinger equation for a potential wall of corresponding thickness. This allowsthe calculation of the complex transmission coecient T . It is a function ofthe energy of incoming electrons, the height of the potential wall, and L. Itsamount square gives the probability for the electron to cross the compact layer.The corresponding derivation can be found in standard literature for quantummechanics [171]. Li et al. outline a similar procedure in the derivation of theirSEI growth model [129].
42
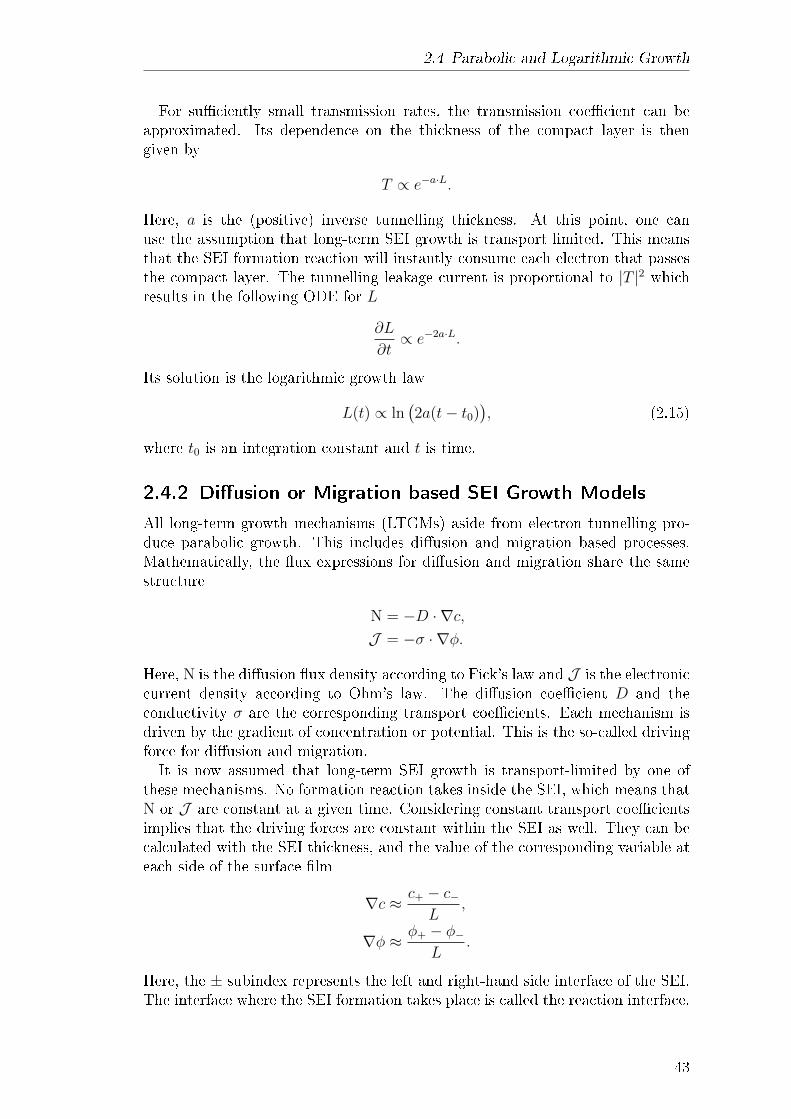
2.4 Parabolic and Logarithmic Growth
For suciently small transmission rates, the transmission coecient can beapproximated. Its dependence on the thickness of the compact layer is thengiven by
T ∝ e−a·L.
Here, a is the (positive) inverse tunnelling thickness. At this point, one canuse the assumption that long-term SEI growth is transport limited. This meansthat the SEI formation reaction will instantly consume each electron that passesthe compact layer. The tunnelling leakage current is proportional to |T |2 whichresults in the following ODE for L
∂L
∂t∝ e−2a·L.
Its solution is the logarithmic growth law
L(t) ∝ ln(2a(t− t0)
), (2.15)
where t0 is an integration constant and t is time.
2.4.2 Diusion or Migration based SEI Growth Models
All long-term growth mechanisms (LTGMs) aside from electron tunnelling pro-duce parabolic growth. This includes diusion and migration based processes.Mathematically, the ux expressions for diusion and migration share the samestructure
N = −D · ∇c,J = −σ · ∇φ.
Here, N is the diusion ux density according to Fick's law and J is the electroniccurrent density according to Ohm's law. The diusion coecient D and theconductivity σ are the corresponding transport coecients. Each mechanism isdriven by the gradient of concentration or potential. This is the so-called drivingforce for diusion and migration.It is now assumed that long-term SEI growth is transport-limited by one of
these mechanisms. No formation reaction takes inside the SEI, which means thatN or J are constant at a given time. Considering constant transport coecientsimplies that the driving forces are constant within the SEI as well. They can becalculated with the SEI thickness, and the value of the corresponding variable ateach side of the surface lm
∇c ≈ c+ − c−L
,
∇φ ≈ φ+ − φ−L
.
Here, the ± subindex represents the left and right-hand side interface of the SEI.The interface where the SEI formation takes place is called the reaction interface.
43
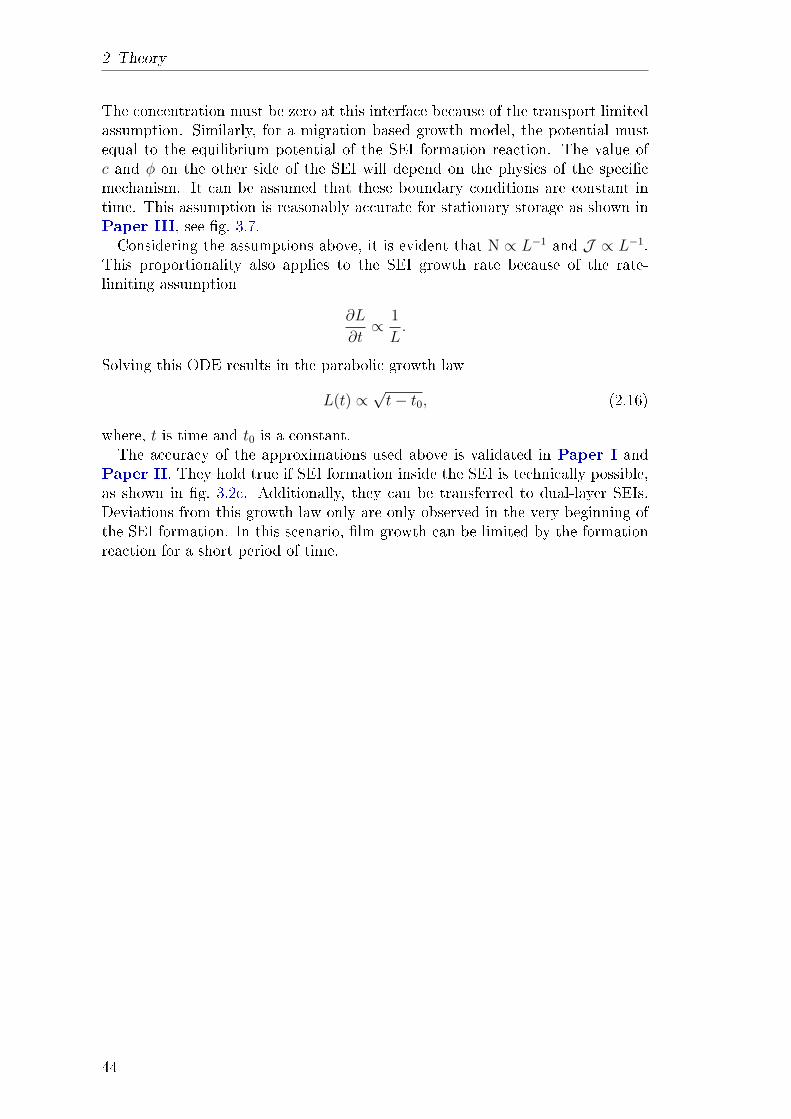
2 Theory
The concentration must be zero at this interface because of the transport limitedassumption. Similarly, for a migration based growth model, the potential mustequal to the equilibrium potential of the SEI formation reaction. The value ofc and φ on the other side of the SEI will depend on the physics of the specicmechanism. It can be assumed that these boundary conditions are constant intime. This assumption is reasonably accurate for stationary storage as shown inPaper III, see g. 3.7.Considering the assumptions above, it is evident that N ∝ L−1 and J ∝ L−1.
This proportionality also applies to the SEI growth rate because of the rate-limiting assumption
∂L
∂t∝ 1
L.
Solving this ODE results in the parabolic growth law
L(t) ∝√t− t0, (2.16)
where, t is time and t0 is a constant.The accuracy of the approximations used above is validated in Paper I and
Paper II. They hold true if SEI formation inside the SEI is technically possible,as shown in g. 3.2c. Additionally, they can be transferred to dual-layer SEIs.Deviations from this growth law only are only observed in the very beginning ofthe SEI formation. In this scenario, lm growth can be limited by the formationreaction for a short period of time.
44
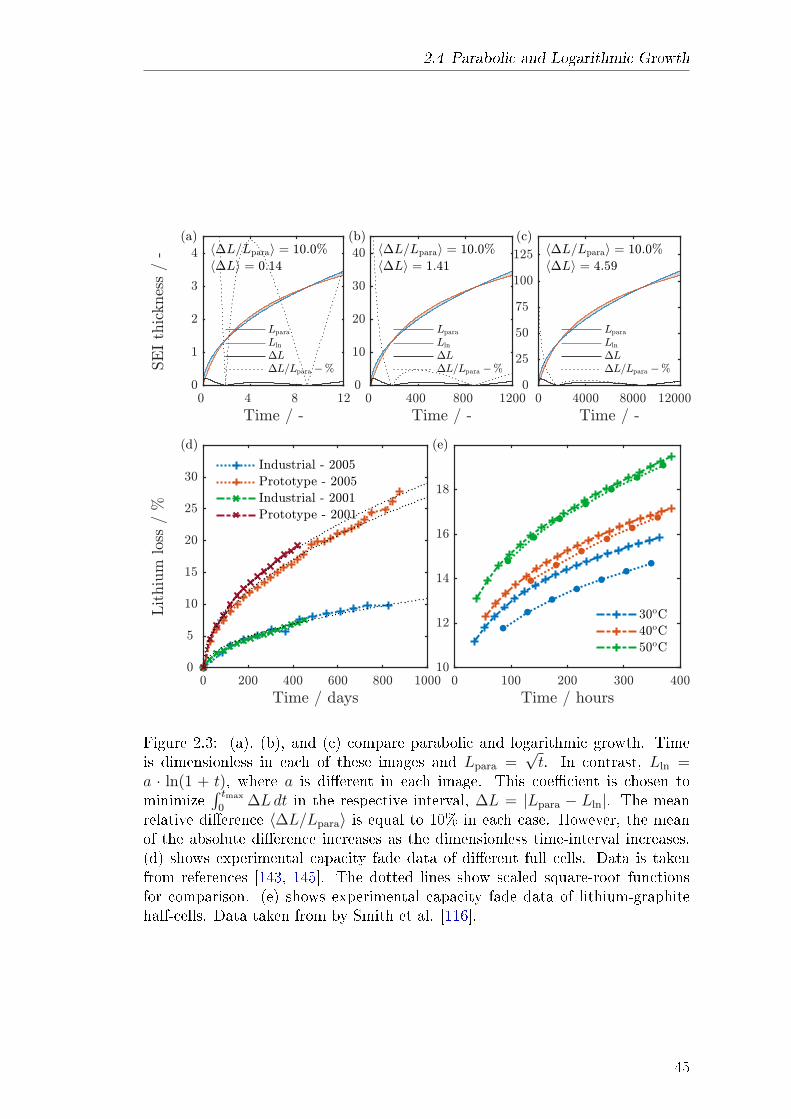
2.4 Parabolic and Logarithmic Growth
Figure 2.3: (a), (b), and (c) compare parabolic and logarithmic growth. Timeis dimensionless in each of these images and Lpara =
√t. In contrast, Lln =
a · ln(1 + t), where a is dierent in each image. This coecient is chosen tominimize
∫ tmax
0∆Ldt in the respective interval, ∆L = |Lpara − Lln|. The mean
relative dierence 〈∆L/Lpara〉 is equal to 10% in each case. However, the meanof the absolute dierence increases as the dimensionless time-interval increases.(d) shows experimental capacity fade data of dierent full cells. Data is takenfrom references [143, 145]. The dotted lines show scaled square-root functionsfor comparison. (e) shows experimental capacity fade data of lithium-graphitehalf-cells. Data taken from by Smith et al. [116].
45

3 Cumulative Part
The following sections summarise and discuss the peer-reviewed articles which Ihave authored during my dissertation. Typically, each brief report is split intothree subsections. The model, its core assumptions, and the theories that it isbased on are summarised in the Theory section. Next, Results and Discussionsection briey describes and interprets the results of the corresponding publica-tion. Finally, my own contribution to each publication in question is outlined inthe Explanation of own Contribution.The order of the ve publications below is primarily chronological, i.e. in order
of their publication date. At the same time, there is also a superior directive.Generally, the focus shifts from a microscopic description to a macroscopic de-scription from one publication to the next. In the case of SEI, macroscopic prop-erties are experimentally accessible and their prediction eases or enables modelvalidation. Paper I and Paper II present and analyse a newly developed modelwhich describes long-term SEI growth. The distinguishing feature that sets itapart from previous similar models is the prediction of SEI morphology. Specif-ically, the models predict the prole of SEI porosity in through-lm direction.This microscopic description of SEI morphology is omitted in Paper III. Here,more simplied models are used to describe the potential dependence of SEIgrowth. Comparing this dependence to experimental data enables drawing rmconclusions concerning the long-term growth mechanism (LTGM). As mentionedabove, Paper IV is a review paper. It includes the results of the three previouspublications and places them in the overall context of theory-based literature onSEI growth. The nal publication of the thesis, Paper V, introduces a physics-based impedance model of a simple electrochemical cell. Initially, this model wasdesigned to identify and measure SEI properties with electrochemical impedancespectroscopy (EIS). It is based on a consistent physical description of lithium-iontransport in all phases of the cell. This also results in novel insights that enablea more consistent determination of electrolyte transport parameters with EIS.These results are especially relevant for highly concentrated electrolytes.
47

3.1 Dynamics and Morphology of SEI
3.1 Dynamics and Morphology of Solid
Electrolyte Interphase (SEI)
Authors Fabian Single, Birger Horstmann, and Arnulf Latz
Journal Physical Chemistry Chemical Physics
Volume (Issue) 18 (27)
Pages 17810-17814
Published on 13th June 2016
DOI 10.1039/c6cp02816k
Copyright The abstract and gures in this section are republished withpermission of the Royal Society of Chemistry from refer-ence [148], permission conveyed through Copyrigth Clear-ance Center, Inc.
3.1.1 Abstract
We develop a novel theory for the continuous electrochemical formation ofporous lms to study the solid electrolyte interphase (SEI) on lithium ionbattery anodes. Existing SEI studies model a homogeneous morphology anda single relevant transport mechanism. Our approach, in contrast, is basedon two transport mechanisms and enables us to track SEI porosity in a spa-tially resolved way. SEI thickness evolution agrees with existing studies andis validated with experiments. This consistent approach is unprecedentedin SEI modeling. We predict a non-zero SEI porosity and the dependenceof morphology on transport properties. Additionally, we capture dual-layerchemistry and morphology. Analytic expressions which describe the param-eter dependence of all key properties are derived and discussed.
49
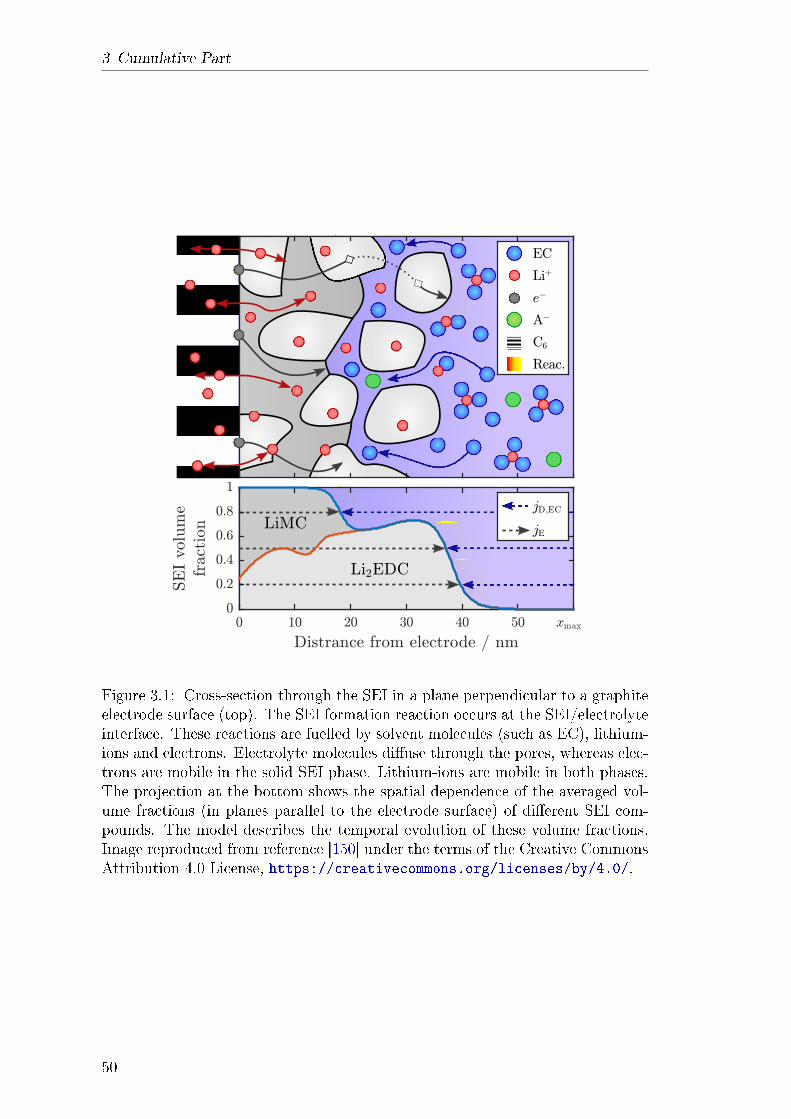
3 Cumulative Part
Figure 3.1: Cross-section through the SEI in a plane perpendicular to a graphiteelectrode surface (top). The SEI formation reaction occurs at the SEI/electrolyteinterface. These reactions are fuelled by solvent molecules (such as EC), lithium-ions and electrons. Electrolyte molecules diuse through the pores, whereas elec-trons are mobile in the solid SEI phase. Lithium-ions are mobile in both phases.The projection at the bottom shows the spatial dependence of the averaged vol-ume fractions (in planes parallel to the electrode surface) of dierent SEI com-pounds. The model describes the temporal evolution of these volume fractions.Image reproduced from reference [150] under the terms of the Creative CommonsAttribution 4.0 License, https://creativecommons.org/licenses/by/4.0/.
50
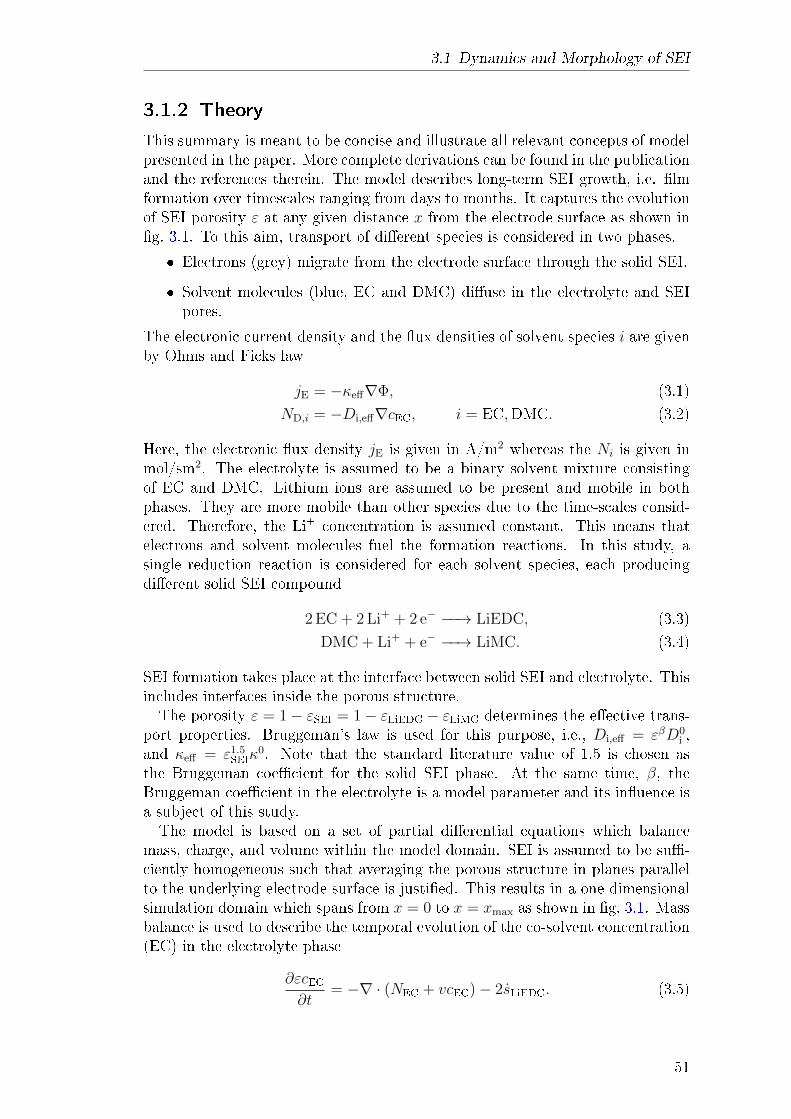
3.1 Dynamics and Morphology of SEI
3.1.2 Theory
This summary is meant to be concise and illustrate all relevant concepts of modelpresented in the paper. More complete derivations can be found in the publicationand the references therein. The model describes long-term SEI growth, i.e. lmformation over timescales ranging from days to months. It captures the evolutionof SEI porosity ε at any given distance x from the electrode surface as shown ing. 3.1. To this aim, transport of dierent species is considered in two phases.
Electrons (grey) migrate from the electrode surface through the solid SEI.
Solvent molecules (blue, EC and DMC) diuse in the electrolyte and SEIpores.
The electronic current density and the ux densities of solvent species i are givenby Ohms and Ficks law
jE = −κeff∇Φ, (3.1)ND,i = −Di,eff∇cEC, i = EC,DMC. (3.2)
Here, the electronic ux density jE is given in A/m2 whereas the Ni is given inmol/sm2. The electrolyte is assumed to be a binary solvent mixture consistingof EC and DMC. Lithium ions are assumed to be present and mobile in bothphases. They are more mobile than other species due to the time-scales consid-ered. Therefore, the Li+ concentration is assumed constant. This means thatelectrons and solvent molecules fuel the formation reactions. In this study, asingle reduction reaction is considered for each solvent species, each producingdierent solid SEI compound
2 EC + 2 Li+ + 2 e− −−→ LiEDC, (3.3)DMC + Li+ + e− −−→ LiMC. (3.4)
SEI formation takes place at the interface between solid SEI and electrolyte. Thisincludes interfaces inside the porous structure.The porosity ε = 1− εSEI = 1− εLiEDC − εLiMC determines the eective trans-
port properties. Bruggeman's law is used for this purpose, i.e., Di,eff = εβD0i ,
and κeff = ε1.5SEIκ
0. Note that the standard literature value of 1.5 is chosen asthe Bruggeman coecient for the solid SEI phase. At the same time, β, theBruggeman coecient in the electrolyte is a model parameter and its inuence isa subject of this study.The model is based on a set of partial dierential equations which balance
mass, charge, and volume within the model domain. SEI is assumed to be su-ciently homogeneous such that averaging the porous structure in planes parallelto the underlying electrode surface is justied. This results in a one-dimensionalsimulation domain which spans from x = 0 to x = xmax as shown in g. 3.1. Massbalance is used to describe the temporal evolution of the co-solvent concentration(EC) in the electrolyte phase
∂εcEC∂t
= −∇ · (NEC + vcEC)− 2sLiEDC. (3.5)
51
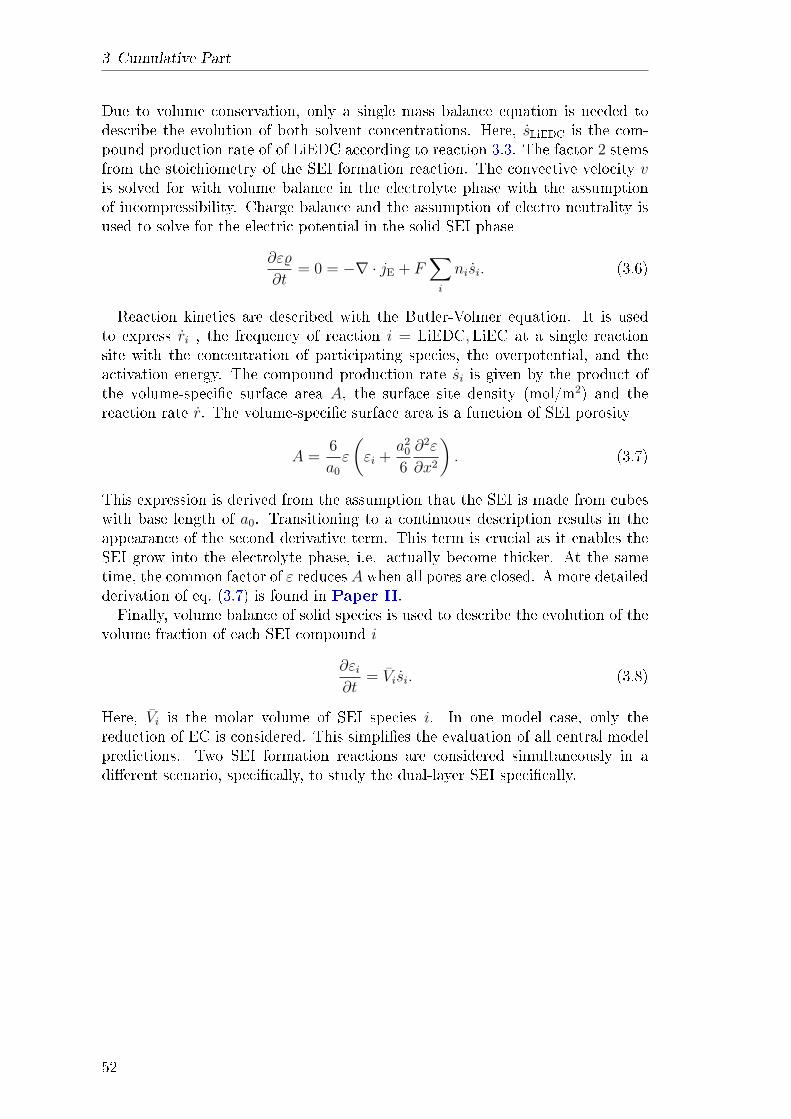
3 Cumulative Part
Due to volume conservation, only a single mass balance equation is needed todescribe the evolution of both solvent concentrations. Here, sLiEDC is the com-pound production rate of of LiEDC according to reaction 3.3. The factor 2 stemsfrom the stoichiometry of the SEI formation reaction. The convective velocity vis solved for with volume balance in the electrolyte phase with the assumptionof incompressibility. Charge balance and the assumption of electro neutrality isused to solve for the electric potential in the solid SEI phase
∂ε%
∂t= 0 = −∇ · jE + F
∑
i
nisi. (3.6)
Reaction kinetics are described with the Butler-Volmer equation. It is usedto express ri , the frequency of reaction i = LiEDC,LiEC at a single reactionsite with the concentration of participating species, the overpotential, and theactivation energy. The compound production rate si is given by the product ofthe volume-specic surface area A, the surface site density (mol/m2) and thereaction rate r. The volume-specic surface area is a function of SEI porosity
A =6
a0
ε
(εi +
a20
6
∂2ε
∂x2
). (3.7)
This expression is derived from the assumption that the SEI is made from cubeswith base length of a0. Transitioning to a continuous description results in theappearance of the second derivative term. This term is crucial as it enables theSEI grow into the electrolyte phase, i.e. actually become thicker. At the sametime, the common factor of ε reduces A when all pores are closed. A more detailedderivation of eq. (3.7) is found in Paper II.Finally, volume balance of solid species is used to describe the evolution of the
volume fraction of each SEI compound i
∂εi∂t
= Visi. (3.8)
Here, Vi is the molar volume of SEI species i. In one model case, only thereduction of EC is considered. This simplies the evaluation of all central modelpredictions. Two SEI formation reactions are considered simultaneously in adierent scenario, specically, to study the dual-layer SEI specically.
52
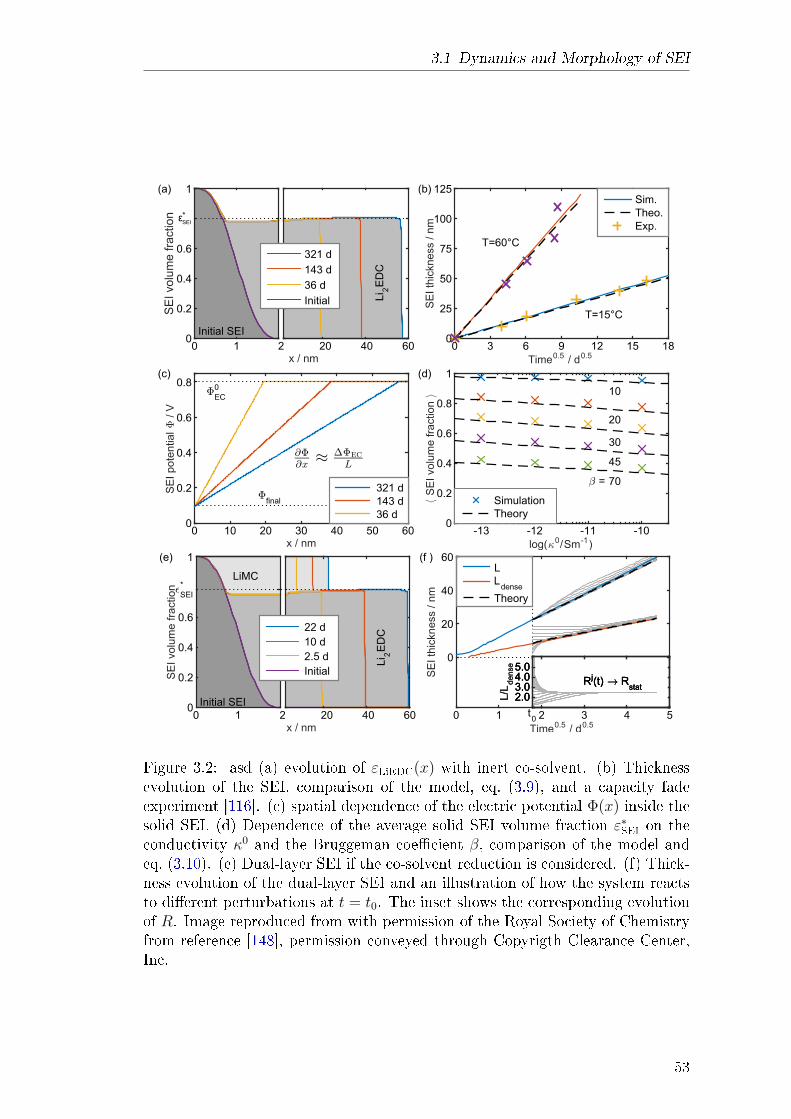
3.1 Dynamics and Morphology of SEI
e f
Figure 3.2: asd (a) evolution of εLiEDC(x) with inert co-solvent. (b) Thicknessevolution of the SEI, comparison of the model, eq. (3.9), and a capacity fadeexperiment [116]. (c) spatial dependence of the electric potential Φ(x) inside thesolid SEI. (d) Dependence of the average solid SEI volume fraction ε∗SEI on theconductivity κ0 and the Bruggeman coecient β, comparison of the model andeq. (3.10). (e) Dual-layer SEI if the co-solvent reduction is considered. (f) Thick-ness evolution of the dual-layer SEI and an illustration of how the system reactsto dierent perturbations at t = t0. The inset shows the corresponding evolutionof R. Image reproduced from with permission of the Royal Society of Chemistryfrom reference [148], permission conveyed through Copyrigth Clearance Center,Inc.
53
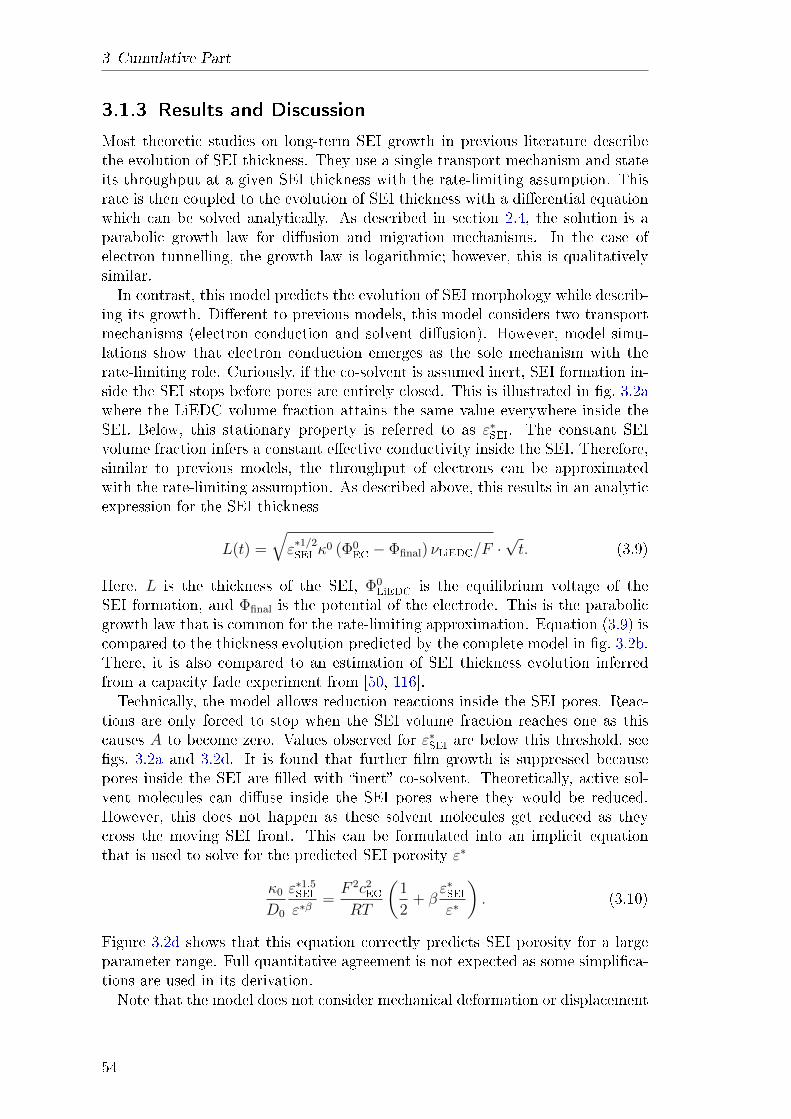
3 Cumulative Part
3.1.3 Results and Discussion
Most theoretic studies on long-term SEI growth in previous literature describethe evolution of SEI thickness. They use a single transport mechanism and stateits throughput at a given SEI thickness with the rate-limiting assumption. Thisrate is then coupled to the evolution of SEI thickness with a dierential equationwhich can be solved analytically. As described in section 2.4, the solution is aparabolic growth law for diusion and migration mechanisms. In the case ofelectron tunnelling, the growth law is logarithmic; however, this is qualitativelysimilar.In contrast, this model predicts the evolution of SEI morphology while describ-
ing its growth. Dierent to previous models, this model considers two transportmechanisms (electron conduction and solvent diusion). However, model simu-lations show that electron conduction emerges as the sole mechanism with therate-limiting role. Curiously, if the co-solvent is assumed inert, SEI formation in-side the SEI stops before pores are entirely closed. This is illustrated in g. 3.2awhere the LiEDC volume fraction attains the same value everywhere inside theSEI. Below, this stationary property is referred to as ε∗SEI. The constant SEIvolume fraction infers a constant eective conductivity inside the SEI. Therefore,similar to previous models, the throughput of electrons can be approximatedwith the rate-limiting assumption. As described above, this results in an analyticexpression for the SEI thickness
L(t) =
√ε∗1/2SEI κ
0 (Φ0EC − Φfinal) νLiEDC/F ·
√t. (3.9)
Here, L is the thickness of the SEI, Φ0LiEDC is the equilibrium voltage of the
SEI formation, and Φfinal is the potential of the electrode. This is the parabolicgrowth law that is common for the rate-limiting approximation. Equation (3.9) iscompared to the thickness evolution predicted by the complete model in g. 3.2b.There, it is also compared to an estimation of SEI thickness evolution inferredfrom a capacity fade experiment from [50, 116].Technically, the model allows reduction reactions inside the SEI pores. Reac-
tions are only forced to stop when the SEI volume fraction reaches one as thiscauses A to become zero. Values observed for ε∗SEI are below this threshold, seegs. 3.2a and 3.2d. It is found that further lm growth is suppressed becausepores inside the SEI are lled with inert co-solvent. Theoretically, active sol-vent molecules can diuse inside the SEI pores where they would be reduced.However, this does not happen as these solvent molecules get reduced as theycross the moving SEI front. This can be formulated into an implicit equationthat is used to solve for the predicted SEI porosity ε∗
κ0
D0
ε∗1.5SEI
ε∗β=F 2c2
EC
RT
(1
2+ β
ε∗SEIε∗
). (3.10)
Figure 3.2d shows that this equation correctly predicts SEI porosity for a largeparameter range. Full quantitative agreement is not expected as some simplica-tions are used in its derivation.Note that the model does not consider mechanical deformation or displacement
54
3.1 Dynamics and Morphology of SEI
of the SEI (such an extension is added to the model in Paper II). Because ofthis, actual lm growth can only happen at the SEI front. Reduction reactionsinside the SEI can occur, but this will always increase SEI density. Therefore,electron-conduction is expected to emerge as the rate-limiting mechanism.Co-solvent reduction is considered in the discussion below. The reduction po-
tential of DMC is assumed lower than the reduction potential of EC. Therefore,DMC reduction occurs inside the SEI, forming LiEC. The reaction is stopped oncethe SEI pores are closed as the specic surface area becomes zero. This resultsin a dual-layer SEI with a dense inner layer (spanning from x = 0 to x = Ldense)and an outer layer with the constant porosity ε∗SEI as shown in g. 3.2e. DMCreduction only takes place close to the electrode is due to the spatial distributionof the electric potential (see g. 3.2c).Numeric simulations of the model show that SEI thickness evolution still follows
a square-root of time dependence. Again, the thickness evolution of the modelcan be approximated with the rate-limiting assumption. The analytic resultalso predicts the square-root of time growth law if a second reduction reaction isconsidered. However, the parameter dependence of the corresponding expressionsis more complex and eq. (3.9) is no longer valid. Model simulations show thatthe ratio Rstat = L/Ldense always attains a constant value, illustrated in g. 3.2f.This does not depend on the specic initialization of the system and is also true ifthe system is perturbed. Physically, such perturbations represent damage of theouter layer by SEI rupture or mechanical deformation from electrode expansion.In conclusion, the relative thickness of the inner layer to the total SEI thicknessappears to be a uniform property. Therefore, this prediction is highly suitableobservable for experimental model validation. It could be conrmed with neutronreectometry experiments. Similar studies have already been performed for theinitial SEI formation [65, 172].
3.1.4 Explanation of own Contribution
The basic concept of the SEI growth model has been developed by Birger Horstmann,Erkmen Karaca [1, 173]. Their model describes the lithium-ion concentration inthe electrolyte and omitted the solvent. I have added this solvent species to theSEI growth model presented in this publication and changed the reaction kinet-ics accordingly. Additionally, I added a second SEI phase to study the dual-layerSEI. Development of eq. (3.10) was also done in close collaboration between BirgerHorstmann and myself. Although the text of this publication was entirely writtenby myself, B. Horstmann contributed in a signicant way through discussions andcorrections.The following contributions have been made by myself alone
text of the section: Abstract, introduction, model description, discussion ofresults, and conclusion
numeric model development and implementation (includes all code)
model simulations and evaluation of the result
analytic analysis of thickness evolution for single and dual-layer SEI
55

3 Cumulative Part
all gures
56
3.2 Revealing SEI Morphology
3.2 Revealing SEI Morphology: In-Depth
Analysis of a Modeling Approach
Authors Fabian Single, Birger Horstmann, and Arnulf Latz
Journal Journal of The Electrochemical Society
Volume (Issue) 164 (11)
Pages E3132-E3145
Published on 5th May 2017
DOI 10.1149/2.0121711jes
Copyright The abstract and gures in this section are reproduced fromreference [150] under the terms of the Creative CommonsAttribution 4.0 License, https://creativecommons.org/
licenses/by/4.0/.
Paper II explores the same long-term SEI growth model that is presentedin Paper I. However, the rst publication is written in communication formatand relatively concise. In contrast, Paper II contains a more comprehensivederivation of theory and discussion of results. Numerics, regularization, and ini-tialization of the model are also addressed. The basic framework of the modelremains the same as in Paper I; however, two new changes or model exten-sions are introduced in this publication. Firstly, electron conduction is replacedwith a dierent transport mechanism. Secondly, solid convection is introduced todescribe mechanical deformation of the SEI. This allows a more thorough investi-gation of dierent LTGMs as well as the dual-layer structure of the surface lm.These results motivate a more detailed analysis of the assumptions made in themodel and resulting implications for its validity. Finally, SEI thickness evolution,as predicted by the model, is compared to a dierent capacity fade experimentby Broussely et al. [143].
57
3 Cumulative Part
3.2.1 Abstract
In this article, we present a novel theory for the long term evolution ofthe solid electrolyte interphase (SEI) in lithium-ion batteries and proposenovel validation measurements. Both SEI thickness and morphology arepredicted by our model as we take into account two transport mechanisms,i.e., solvent diusion in the SEI pores and charge transport in the solid SEIphase. We show that a porous SEI is created due to the interplay of thesetransport mechanisms. Dierent dual-layer SEIs emerge from dierent elec-trolyte decomposition reactions. We reveal the behaviour of such dual layerstructures and discuss its dependence on system parameters. Model analy-sis enables us to interpret SEI thickness uctuations and link them to therate-limiting transport mechanism. Our results are general and indepen-dent of specic modelling choices, e.g., for charge transport and reductionreactions.
3.2.2 Theory
The rst signicant addition to the model is the implementation of mechanicalSEI deformation. These eects are described in phenomenological fashion suchthat the model retains its simplistic form. To this aim, solid convection is consid-ered in the mass balance equation for each SEI volume fraction. Next, the solidconvective velocity v is introduced as a variable. The equation used to solve forv is derived from two extreme cases. In the rst case, the solid products of SEIformation reactions precipitate locally and increase the density of the porous lm.This is similar to before. In the second case, v is dened such that the SEI densityremains constant at the location where SEI formation reactions occur. Instead,the surface lm expands and pushes the outer part of the SEI further away fromthe electrode. Mathematically, these cases result in the following equations
εSEI∇ · v = 0, (3.11a)
εSEI∇ · v =∑
i
V iSEIρiri. (3.11b)
The equation used to determine v is obtained by superimposing these cases witha smooth, monotone transition function α(εSEI)
εSEI∇ · v = α(εSEI)∑
i
V iSEIρiri. (3.12)
As shown in g. 3.3a, a simple transition function is used. Multiple test simula-tions showed that the precise shape of this function only plays a secondary role.The only parameter with a pronounced impact on the model result is εcrit, thevolume fraction at which α becomes one. This parameter marks the highest SEIvolume fraction that can be attained. It could be explained by a certain shapeor morphology of SEI precipitates. These could determine in a densest possiblepacking, similar to the greatest fraction of space occupied by spheres.
58
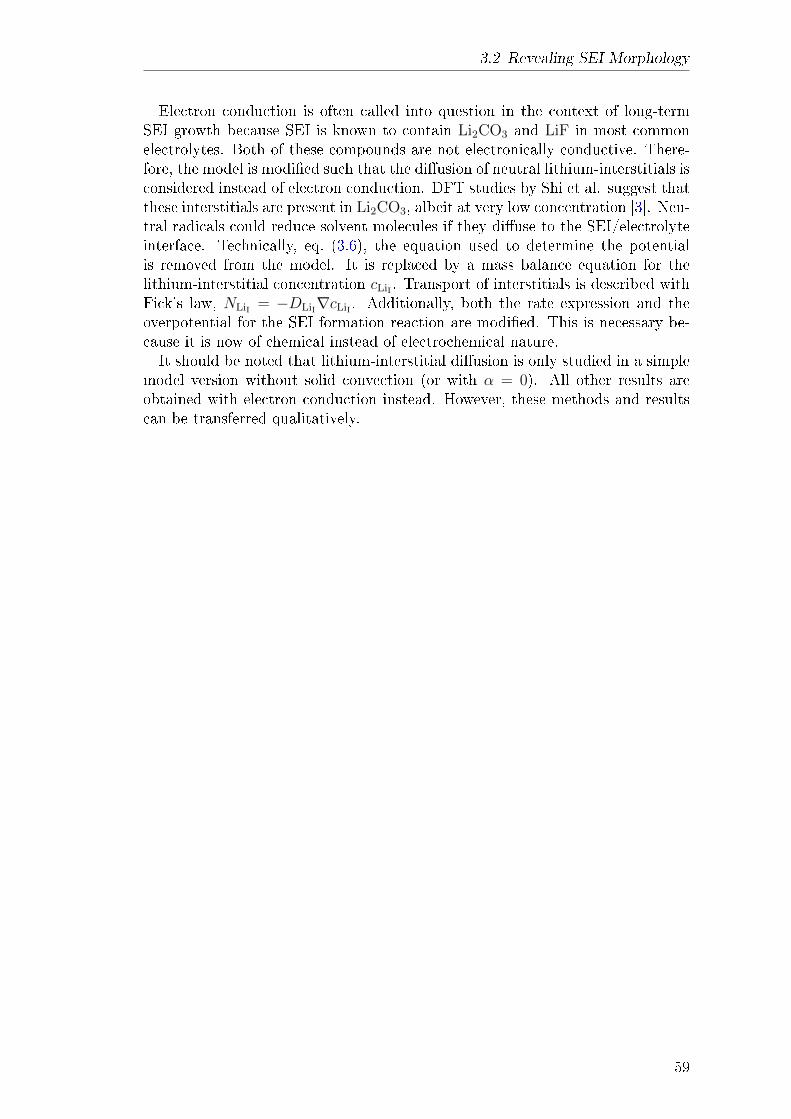
3.2 Revealing SEI Morphology
Electron conduction is often called into question in the context of long-termSEI growth because SEI is known to contain Li2CO3 and LiF in most commonelectrolytes. Both of these compounds are not electronically conductive. There-fore, the model is modied such that the diusion of neutral lithium-interstitials isconsidered instead of electron conduction. DFT studies by Shi et al. suggest thatthese interstitials are present in Li2CO3, albeit at very low concentration [3]. Neu-tral radicals could reduce solvent molecules if they diuse to the SEI/electrolyteinterface. Technically, eq. (3.6), the equation used to determine the potentialis removed from the model. It is replaced by a mass balance equation for thelithium-interstitial concentration cLiI . Transport of interstitials is described withFick's law, NLiI = −DLiI∇cLiI . Additionally, both the rate expression and theoverpotential for the SEI formation reaction are modied. This is necessary be-cause it is now of chemical instead of electrochemical nature.It should be noted that lithium-interstitial diusion is only studied in a simple
model version without solid convection (or with α = 0). All other results areobtained with electron conduction instead. However, these methods and resultscan be transferred qualitatively.
59
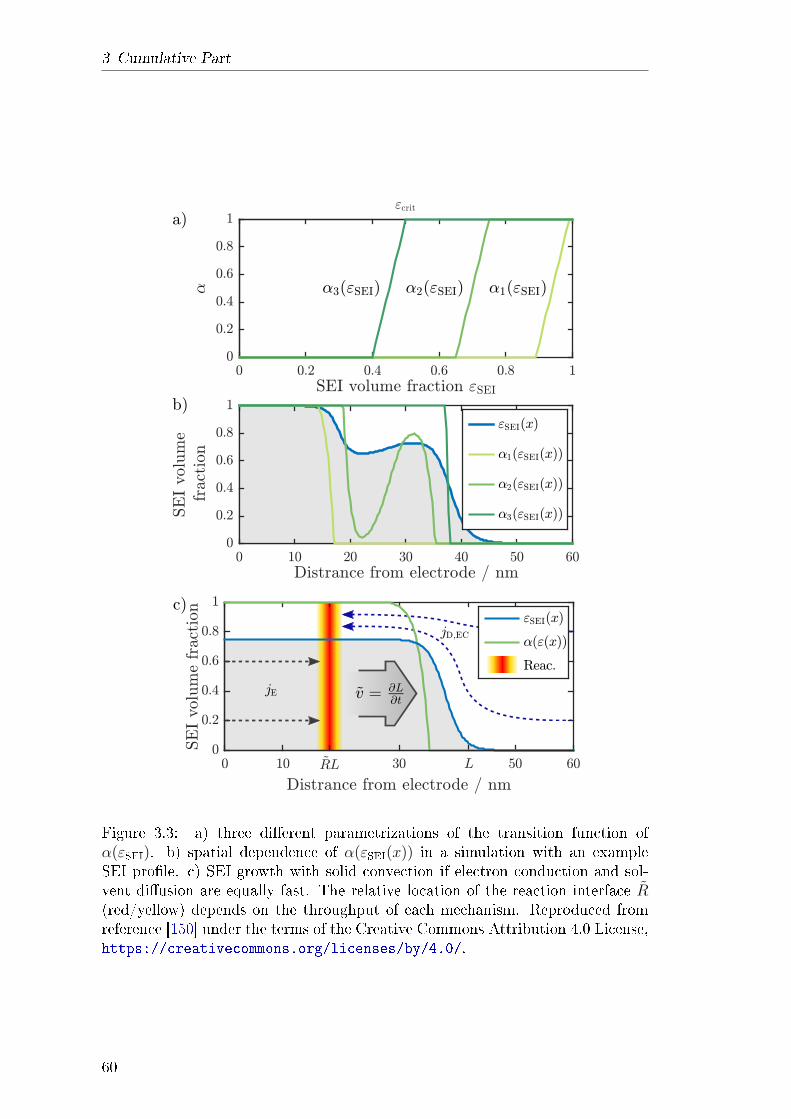
3 Cumulative Part
Figure 3.3: a) three dierent parametrizations of the transition function ofα(εSEI). b) spatial dependence of α(εSEI(x)) in a simulation with an exampleSEI prole. c) SEI growth with solid convection if electron conduction and sol-vent diusion are equally fast. The relative location of the reaction interface R(red/yellow) depends on the throughput of each mechanism. Reproduced fromreference [150] under the terms of the Creative Commons Attribution 4.0 License,https://creativecommons.org/licenses/by/4.0/.
60
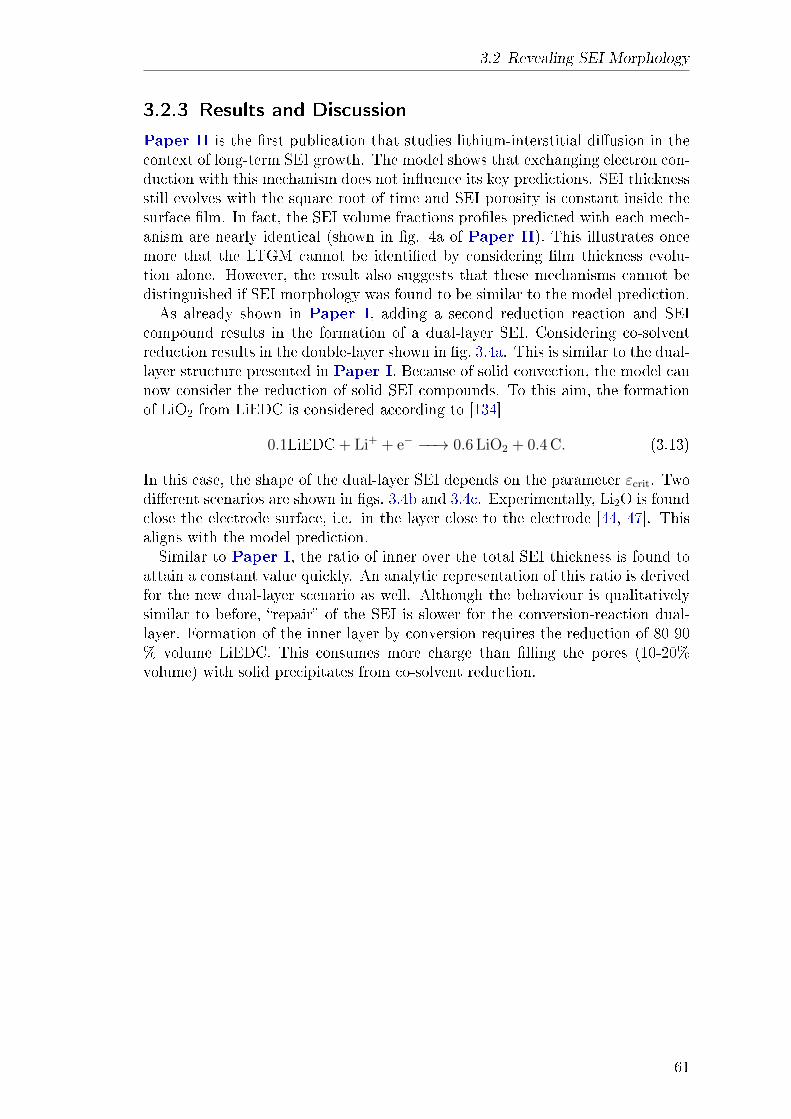
3.2 Revealing SEI Morphology
3.2.3 Results and Discussion
Paper II is the rst publication that studies lithium-interstitial diusion in thecontext of long-term SEI growth. The model shows that exchanging electron con-duction with this mechanism does not inuence its key predictions. SEI thicknessstill evolves with the square root of time and SEI porosity is constant inside thesurface lm. In fact, the SEI volume fractions proles predicted with each mech-anism are nearly identical (shown in g. 4a of Paper II). This illustrates oncemore that the LTGM cannot be identied by considering lm thickness evolu-tion alone. However, the result also suggests that these mechanisms cannot bedistinguished if SEI morphology was found to be similar to the model prediction.As already shown in Paper I, adding a second reduction reaction and SEI
compound results in the formation of a dual-layer SEI. Considering co-solventreduction results in the double-layer shown in g. 3.4a. This is similar to the dual-layer structure presented in Paper I. Because of solid convection, the model cannow consider the reduction of solid SEI compounds. To this aim, the formationof LiO2 from LiEDC is considered according to [134]
0.1LiEDC + Li+ + e− −−→ 0.6 LiO2 + 0.4 C. (3.13)
In this case, the shape of the dual-layer SEI depends on the parameter εcrit. Twodierent scenarios are shown in gs. 3.4b and 3.4c. Experimentally, Li2O is foundclose the electrode surface, i.e. in the layer close to the electrode [44, 47]. Thisaligns with the model prediction.Similar to Paper I, the ratio of inner over the total SEI thickness is found to
attain a constant value quickly. An analytic representation of this ratio is derivedfor the new dual-layer scenario as well. Although the behaviour is qualitativelysimilar to before, repair of the SEI is slower for the conversion-reaction dual-layer. Formation of the inner layer by conversion requires the reduction of 80-90% volume LiEDC. This consumes more charge than lling the pores (10-20%volume) with solid precipitates from co-solvent reduction.
61
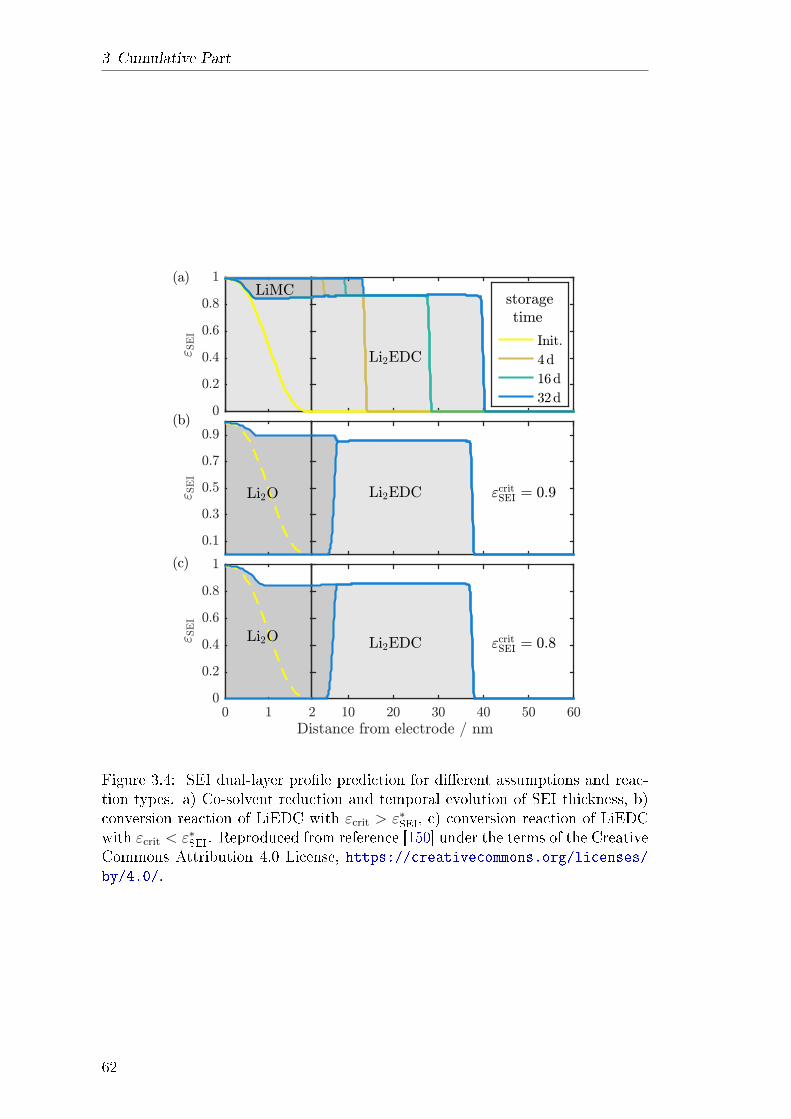
3 Cumulative Part
Figure 3.4: SEI dual-layer prole prediction for dierent assumptions and reac-tion types. a) Co-solvent reduction and temporal evolution of SEI thickness, b)conversion reaction of LiEDC with εcrit > ε∗SEI, c) conversion reaction of LiEDCwith εcrit < ε∗SEI. Reproduced from reference [150] under the terms of the CreativeCommons Attribution 4.0 License, https://creativecommons.org/licenses/by/4.0/.
62
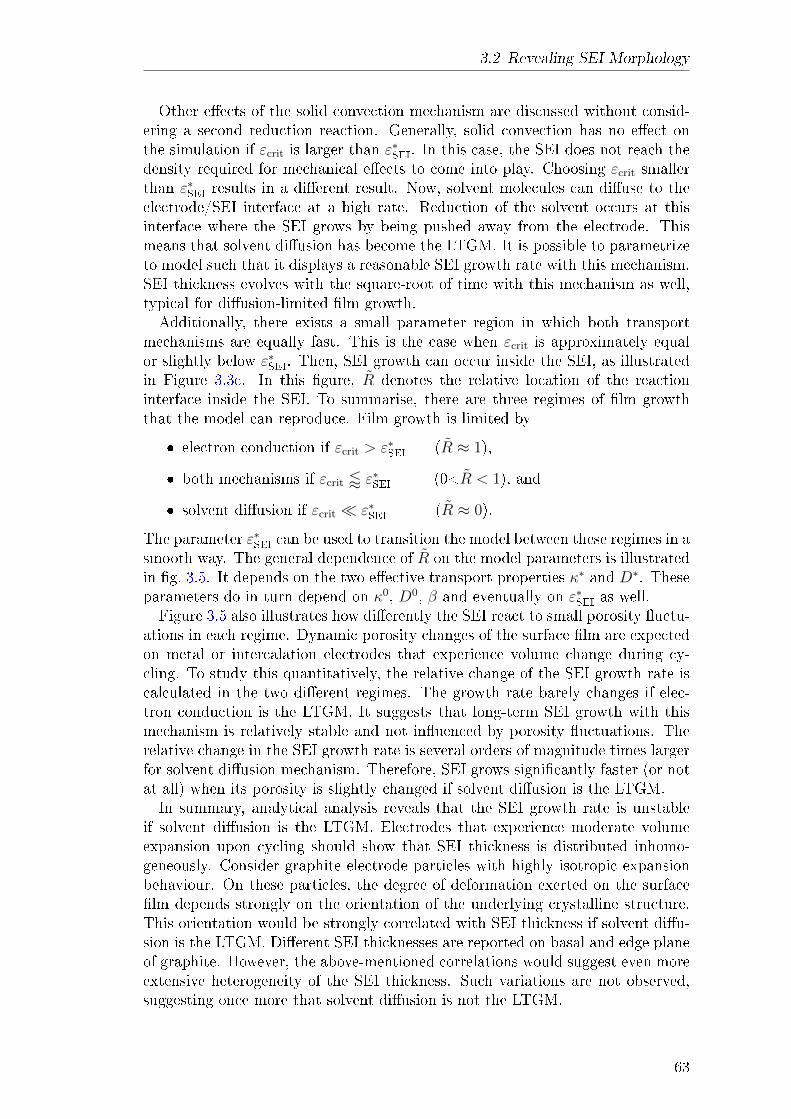
3.2 Revealing SEI Morphology
Other eects of the solid convection mechanism are discussed without consid-ering a second reduction reaction. Generally, solid convection has no eect onthe simulation if εcrit is larger than ε∗SEI. In this case, the SEI does not reach thedensity required for mechanical eects to come into play. Choosing εcrit smallerthan ε∗SEI results in a dierent result. Now, solvent molecules can diuse to theelectrode/SEI interface at a high rate. Reduction of the solvent occurs at thisinterface where the SEI grows by being pushed away from the electrode. Thismeans that solvent diusion has become the LTGM. It is possible to parametrizeto model such that it displays a reasonable SEI growth rate with this mechanism.SEI thickness evolves with the square-root of time with this mechanism as well,typical for diusion-limited lm growth.Additionally, there exists a small parameter region in which both transport
mechanisms are equally fast. This is the case when εcrit is approximately equalor slightly below ε∗SEI. Then, SEI growth can occur inside the SEI, as illustratedin Figure 3.3c. In this gure, R denotes the relative location of the reactioninterface inside the SEI. To summarise, there are three regimes of lm growththat the model can reproduce. Film growth is limited by
electron conduction if εcrit > ε∗SEI (R ≈ 1),
both mechanisms if εcrit / ε∗SEI (0<R < 1), and
solvent diusion if εcrit ε∗SEI (R ≈ 0).
The parameter ε∗SEI can be used to transition the model between these regimes in asmooth way. The general dependence of R on the model parameters is illustratedin g. 3.5. It depends on the two eective transport properties κ∗ and D∗. Theseparameters do in turn depend on κ0, D0, β and eventually on ε∗SEI as well.Figure 3.5 also illustrates how dierently the SEI react to small porosity uctu-
ations in each regime. Dynamic porosity changes of the surface lm are expectedon metal or intercalation electrodes that experience volume change during cy-cling. To study this quantitatively, the relative change of the SEI growth rate iscalculated in the two dierent regimes. The growth rate barely changes if elec-tron conduction is the LTGM. It suggests that long-term SEI growth with thismechanism is relatively stable and not inuenced by porosity uctuations. Therelative change in the SEI growth rate is several orders of magnitude times largerfor solvent diusion mechanism. Therefore, SEI grows signicantly faster (or notat all) when its porosity is slightly changed if solvent diusion is the LTGM.In summary, analytical analysis reveals that the SEI growth rate is unstable
if solvent diusion is the LTGM. Electrodes that experience moderate volumeexpansion upon cycling should show that SEI thickness is distributed inhomo-geneously. Consider graphite electrode particles with highly isotropic expansionbehaviour. On these particles, the degree of deformation exerted on the surfacelm depends strongly on the orientation of the underlying crystalline structure.This orientation would be strongly correlated with SEI thickness if solvent diu-sion is the LTGM. Dierent SEI thicknesses are reported on basal and edge planeof graphite. However, the above-mentioned correlations would suggest even moreextensive heterogeneity of the SEI thickness. Such variations are not observed,suggesting once more that solvent diusion is not the LTGM.
63
3 Cumulative Part
3.2.4 Explanation of own Contribution
The original concept of the model presented in this publication was developedby Birger Horstmann and Erkman Karaca, see references [1, 173]. As alreadyelaborated in section 3.1.4, I have added substantial further developments theirmodel version. In this publication, I have developed and added the physics of"solid convection" as well as the lithium-interstitial diusion mechanism. Equa-tion 34 in Paper II was derived in close collaboration between Birger Horstmannand myself. Abstract, Conclusion, and parts of the Discussion section were alsowritten in collaboration between me and Birger Horstmann. However, as listedbelow, the majority of the manuscript was entirely written by myself. Here,Birger Horstmann contributed with discussions and corrections.The following contributions have been made by myself alone
text of the section: Introduction, Model, Model Implementation, SimulationResults, and Conclusion
solid convection theory development
numeric model development and implementation (includes all code)
simulations and evaluation of results
analytic analysis of thickness evolution for single and dual-layer SEI, as wellas the calculations for the sensitivity analysis in chapter Charge vs. solventtransport
all gures
64
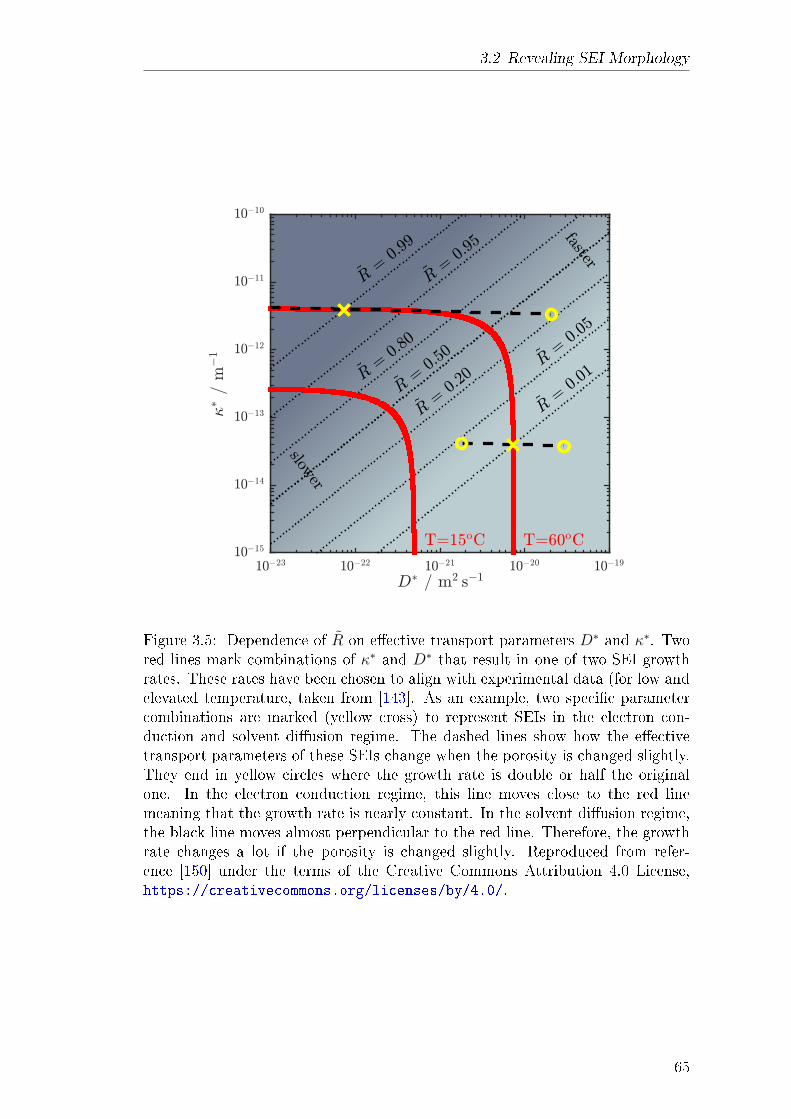
3.2 Revealing SEI Morphology
Figure 3.5: Dependence of R on eective transport parameters D∗ and κ∗. Twored lines mark combinations of κ∗ and D∗ that result in one of two SEI growthrates. These rates have been chosen to align with experimental data (for low andelevated temperature, taken from [143]. As an example, two specic parametercombinations are marked (yellow cross) to represent SEIs in the electron con-duction and solvent diusion regime. The dashed lines show how the eectivetransport parameters of these SEIs change when the porosity is changed slightly.They end in yellow circles where the growth rate is double or half the originalone. In the electron conduction regime, this line moves close to the red linemeaning that the growth rate is nearly constant. In the solvent diusion regime,the black line moves almost perpendicular to the red line. Therefore, the growthrate changes a lot if the porosity is changed slightly. Reproduced from refer-ence [150] under the terms of the Creative Commons Attribution 4.0 License,https://creativecommons.org/licenses/by/4.0/.
65

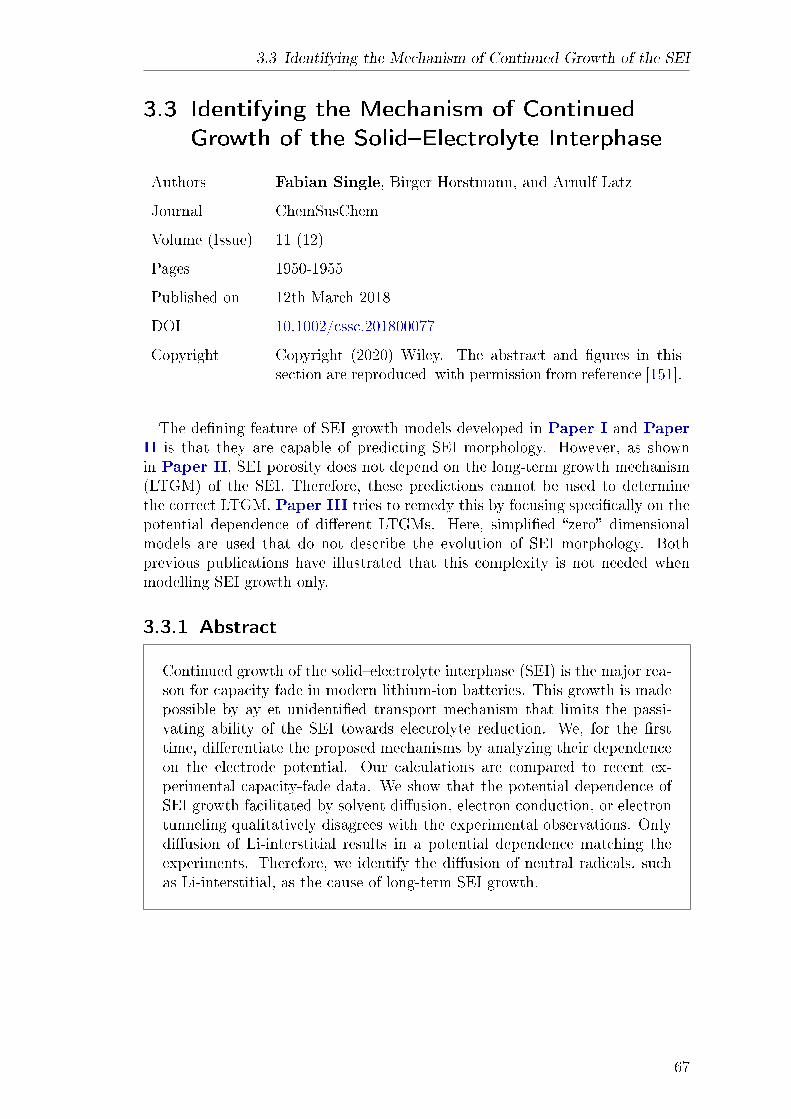
3.3 Identifying the Mechanism of Continued Growth of the SEI
3.3 Identifying the Mechanism of Continued
Growth of the SolidElectrolyte Interphase
Authors Fabian Single, Birger Horstmann, and Arnulf Latz
Journal ChemSusChem
Volume (Issue) 11 (12)
Pages 1950-1955
Published on 12th March 2018
DOI 10.1002/cssc.201800077
Copyright Copyright (2020) Wiley. The abstract and gures in thissection are reproduced with permission from reference [151].
The dening feature of SEI growth models developed in Paper I and PaperII is that they are capable of predicting SEI morphology. However, as shownin Paper II, SEI porosity does not depend on the long-term growth mechanism(LTGM) of the SEI. Therefore, these predictions cannot be used to determinethe correct LTGM. Paper III tries to remedy this by focusing specically on thepotential dependence of dierent LTGMs. Here, simplied zero dimensionalmodels are used that do not describe the evolution of SEI morphology. Bothprevious publications have illustrated that this complexity is not needed whenmodelling SEI growth only.
3.3.1 Abstract
Continued growth of the solidelectrolyte interphase (SEI) is the major rea-son for capacity fade in modern lithium-ion batteries. This growth is madepossible by ay et unidentied transport mechanism that limits the passi-vating ability of the SEI towards electrolyte reduction. We, for the rsttime, dierentiate the proposed mechanisms by analyzing their dependenceon the electrode potential. Our calculations are compared to recent ex-perimental capacity-fade data. We show that the potential dependence ofSEI growth facilitated by solvent diusion, electron conduction, or electrontunneling qualitatively disagrees with the experimental observations. Onlydiusion of Li-interstitial results in a potential dependence matching theexperiments. Therefore, we identify the diusion of neutral radicals, suchas Li-interstitial, as the cause of long-term SEI growth.
67
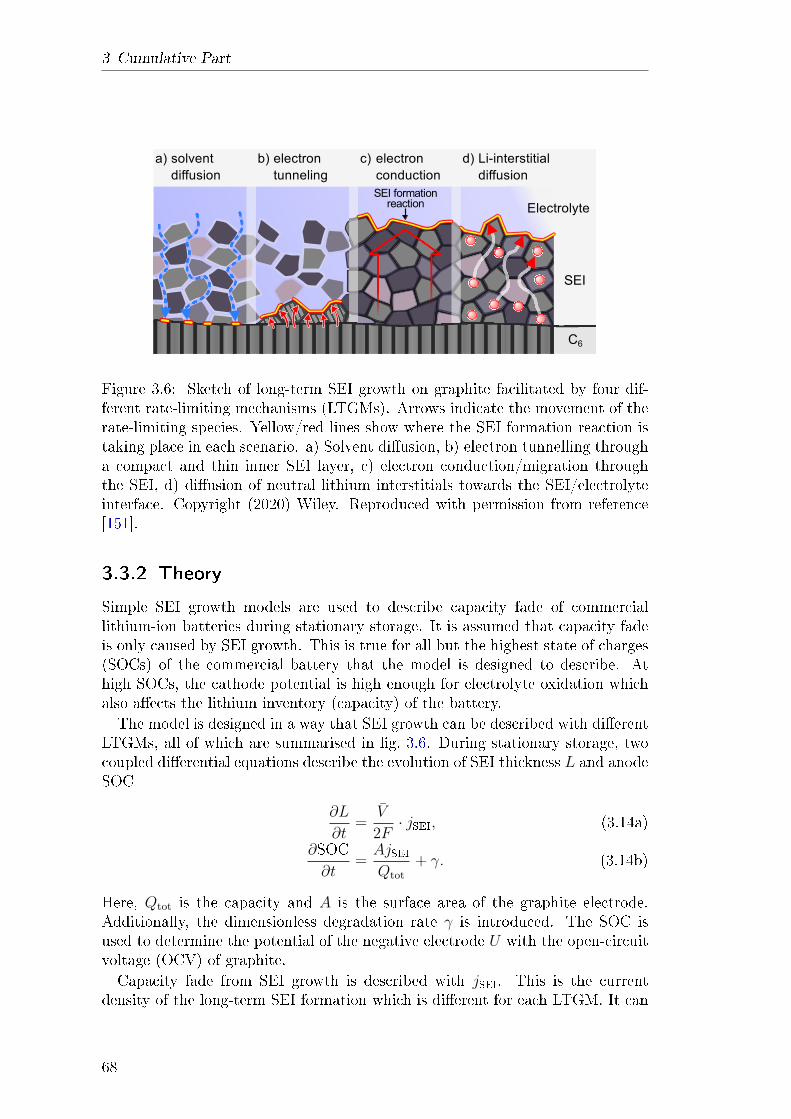
3 Cumulative Part
Figure 3.6: Sketch of long-term SEI growth on graphite facilitated by four dif-ferent rate-limiting mechanisms (LTGMs). Arrows indicate the movement of therate-limiting species. Yellow/red lines show where the SEI formation reaction istaking place in each scenario. a) Solvent diusion, b) electron tunnelling througha compact and thin inner SEI layer, c) electron conduction/migration throughthe SEI, d) diusion of neutral lithium interstitials towards the SEI/electrolyteinterface. Copyright (2020) Wiley. Reproduced with permission from reference[151].
3.3.2 Theory
Simple SEI growth models are used to describe capacity fade of commerciallithium-ion batteries during stationary storage. It is assumed that capacity fadeis only caused by SEI growth. This is true for all but the highest state of charges(SOCs) of the commercial battery that the model is designed to describe. Athigh SOCs, the cathode potential is high enough for electrolyte oxidation whichalso aects the lithium inventory (capacity) of the battery.The model is designed in a way that SEI growth can be described with dierent
LTGMs, all of which are summarised in g. 3.6. During stationary storage, twocoupled dierential equations describe the evolution of SEI thickness L and anodeSOC
∂L
∂t=
V
2F· jSEI, (3.14a)
∂SOC∂t
=AjSEIQtot
+ γ. (3.14b)
Here, Qtot is the capacity and A is the surface area of the graphite electrode.Additionally, the dimensionless degradation rate γ is introduced. The SOC isused to determine the potential of the negative electrode U with the open-circuitvoltage (OCV) of graphite.Capacity fade from SEI growth is described with jSEI. This is the current
density of the long-term SEI formation which is dierent for each LTGM. It can
68
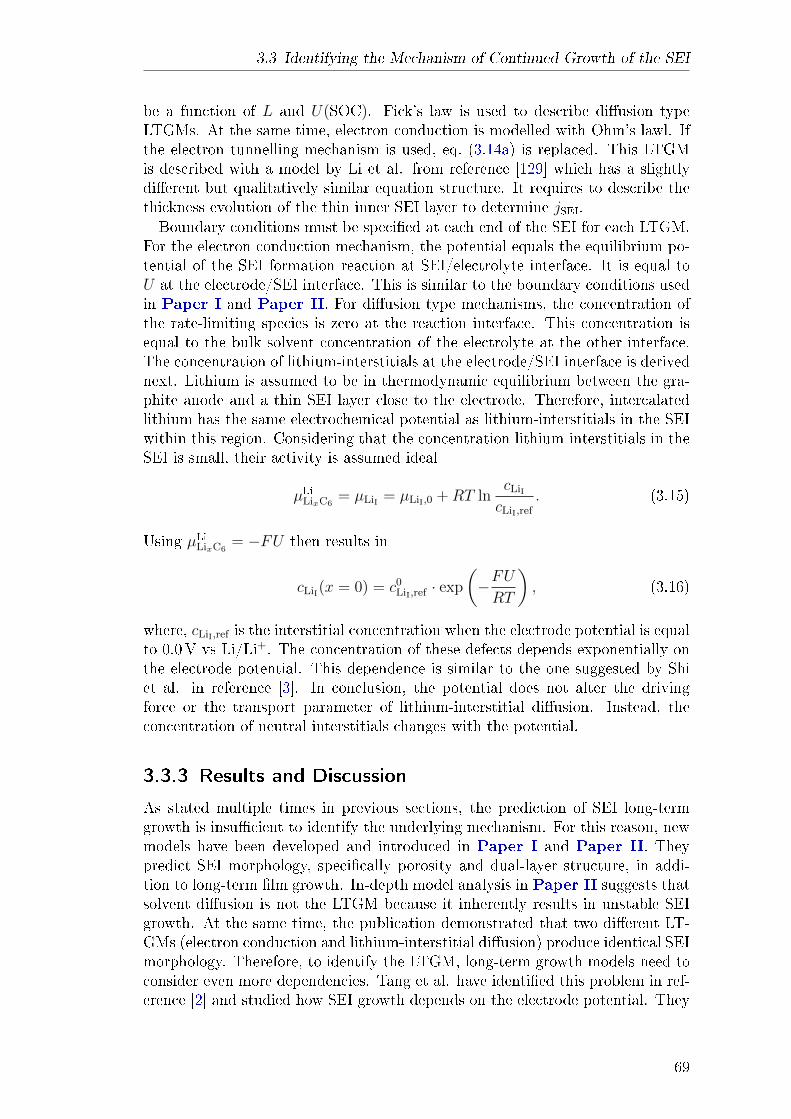
3.3 Identifying the Mechanism of Continued Growth of the SEI
be a function of L and U(SOC). Fick's law is used to describe diusion typeLTGMs. At the same time, electron conduction is modelled with Ohm's lawl. Ifthe electron tunnelling mechanism is used, eq. (3.14a) is replaced. This LTGMis described with a model by Li et al. from reference [129] which has a slightlydierent but qualitatively similar equation structure. It requires to describe thethickness evolution of the thin inner SEI layer to determine jSEI.Boundary conditions must be specied at each end of the SEI for each LTGM.
For the electron conduction mechanism, the potential equals the equilibrium po-tential of the SEI formation reaction at SEI/electrolyte interface. It is equal toU at the electrode/SEI interface. This is similar to the boundary conditions usedin Paper I and Paper II. For diusion type mechanisms, the concentration ofthe rate-limiting species is zero at the reaction interface. This concentration isequal to the bulk solvent concentration of the electrolyte at the other interface.The concentration of lithium-interstitials at the electrode/SEI interface is derivednext. Lithium is assumed to be in thermodynamic equilibrium between the gra-phite anode and a thin SEI layer close to the electrode. Therefore, intercalatedlithium has the same electrochemical potential as lithium-interstitials in the SEIwithin this region. Considering that the concentration lithium-interstitials in theSEI is small, their activity is assumed ideal
µLiLixC6= µLiI = µLiI,0 +RT ln
cLiI
cLiI,ref
. (3.15)
Using µLiLixC6= −FU then results in
cLiI(x = 0) = c0LiI,ref · exp
(−FURT
), (3.16)
where, cLiI,ref is the interstitial concentration when the electrode potential is equalto 0.0V vs Li/Li+. The concentration of these defects depends exponentially onthe electrode potential. This dependence is similar to the one suggested by Shiet al. in reference [3]. In conclusion, the potential does not alter the drivingforce or the transport parameter of lithium-interstitial diusion. Instead, theconcentration of neutral interstitials changes with the potential.
3.3.3 Results and Discussion
As stated multiple times in previous sections, the prediction of SEI long-termgrowth is insucient to identify the underlying mechanism. For this reason, newmodels have been developed and introduced in Paper I and Paper II. Theypredict SEI morphology, specically porosity and dual-layer structure, in addi-tion to long-term lm growth. In-depth model analysis in Paper II suggests thatsolvent diusion is not the LTGM because it inherently results in unstable SEIgrowth. At the same time, the publication demonstrated that two dierent LT-GMs (electron conduction and lithium-interstitial diusion) produce identical SEImorphology. Therefore, to identify the LTGM, long-term growth models need toconsider even more dependencies. Tang et al. have identied this problem in ref-erence [2] and studied how SEI growth depends on the electrode potential. They
69
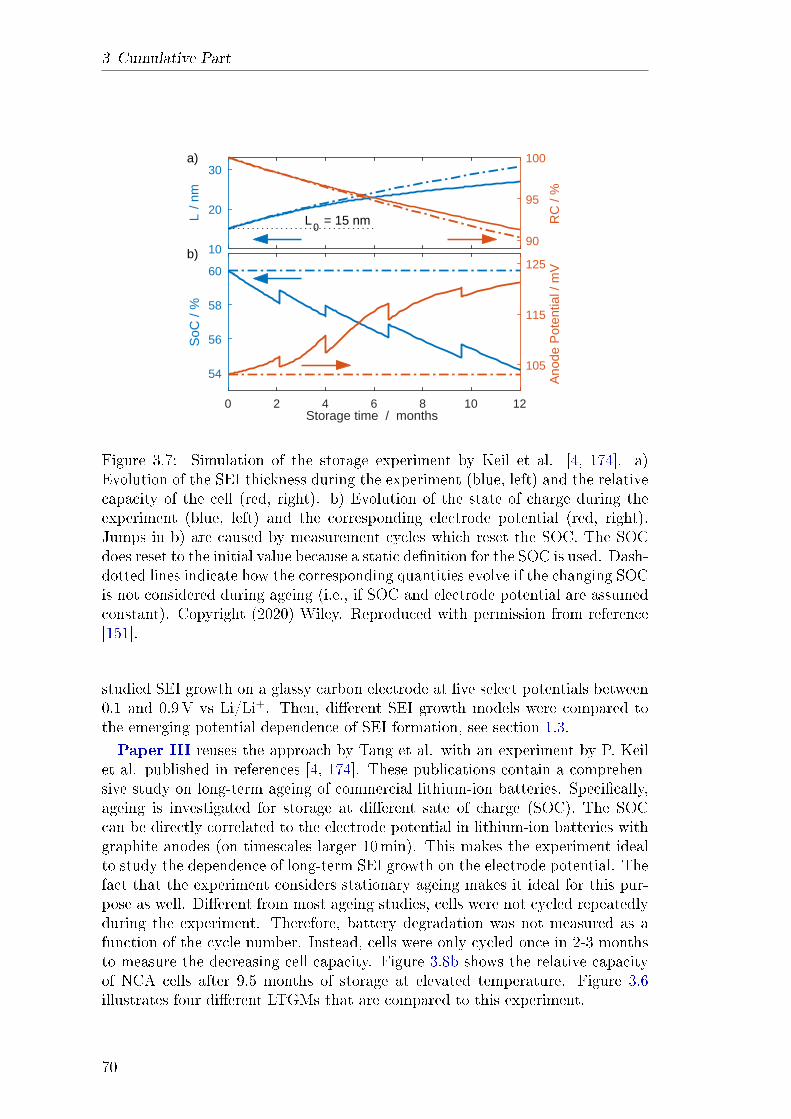
3 Cumulative Part
0 2 4 6 8 10 12
54
56
58
60
105
115
125b)
Storage time / months
SoC
/ %
Ano
de P
oten
tial /
mV
10
20
30
90
95
100
L0
= 15 nm
a)
L /
nm
RC
/ %
Figure 3.7: Simulation of the storage experiment by Keil et al. [4, 174]. a)Evolution of the SEI thickness during the experiment (blue, left) and the relativecapacity of the cell (red, right). b) Evolution of the state of charge during theexperiment (blue, left) and the corresponding electrode potential (red, right).Jumps in b) are caused by measurement cycles which reset the SOC. The SOCdoes reset to the initial value because a static denition for the SOC is used. Dash-dotted lines indicate how the corresponding quantities evolve if the changing SOCis not considered during ageing (i.e., if SOC and electrode potential are assumedconstant). Copyright (2020) Wiley. Reproduced with permission from reference[151].
studied SEI growth on a glassy carbon electrode at ve select potentials between0.1 and 0.9V vs Li/Li+. Then, dierent SEI growth models were compared tothe emerging potential dependence of SEI formation, see section 1.3.Paper III reuses the approach by Tang et al. with an experiment by P. Keil
et al. published in references [4, 174]. These publications contain a comprehen-sive study on long-term ageing of commercial lithium-ion batteries. Specically,ageing is investigated for storage at dierent sate of charge (SOC). The SOCcan be directly correlated to the electrode potential in lithium-ion batteries withgraphite anodes (on timescales larger 10min). This makes the experiment idealto study the dependence of long-term SEI growth on the electrode potential. Thefact that the experiment considers stationary ageing makes it ideal for this pur-pose as well. Dierent from most ageing studies, cells were not cycled repeatedlyduring the experiment. Therefore, battery degradation was not measured as afunction of the cycle number. Instead, cells were only cycled once in 2-3 monthsto measure the decreasing cell capacity. Figure 3.8b shows the relative capacityof NCA cells after 9.5 months of storage at elevated temperature. Figure 3.6illustrates four dierent LTGMs that are compared to this experiment.
70
3.3 Identifying the Mechanism of Continued Growth of the SEI
a)
100
200
300
U /
mV
De-lithiationAverageLithiation
b)
0 20 40 60 80 100Initial SoC of storage experiment / %
86
88
90
92
94
96
98
100
RC
afte
r 9.
5 m
onth
s / %
e conductione tunnelingLi diffusionSovent diffusion
--
I
Figure 3.8: a) Charge (dotted) and discharge (dash-dotted) potential of the Li-graphite cells measured by Keil et al. at C/20 [4, 174]. The mean between thesecurves (blue line) is used to determine the electrode potential for a given SOC.The curve is stretched and shifted to align with cell capacity, which is smaller thanthe capacity of the negative electrode. b) (Crosses) Capacity fade of commercialNCA cells after 9.5 months of storage at elevated temperature, also measured byKeil et al. [4, 174]. 16 Cells were stored at dierent SOC. Lines show the relativecapacity as predicted by the simulation with for dierent LTGMs, see g. 3.6.Copyright (2020) Wiley. Reproduced with permission from reference [151].
The solvent diusion mechanism does not depend on the electrode potential.Therefore, the same level of cell degradation is predicted for all potentials/SOCs.Such a dependence emerges for any of the three other mechanisms. However,only lithium-interstitial diusion shows good qualitative agreement with the ex-periment. Note that there is no model parameter that can adjust the potentialdependence of this mechanism. In contrast, the potential dependence of electronmigration and tunnelling can be adjusted by changing the equilibrium potentialof the SEI formation reaction. This parameter can be used to obtain better qual-itative agreement; however, the corresponding equilibrium potential is not rea-sonable. Therefore, lithium-interstitial diusion emerges as a prominent LTGMcandidate.
71
3 Cumulative Part
3.3.4 Explanation of own contribution
This manuscript was almost entirely written by myself. Birger Horstmann wrotesome parts of the abstract, the introduction and the conclusion section. However,he further contributed with corrections and insightful discussions in all othersections.The following contributions have been made by myself alone
the text of sections "Capacity fade model", "Results and Discussion"
development of the base-model for the simulation of the capacity fade ex-periment (all three dierent model types)
numerical implementation of the model as well as all simulations and theirevaluation
derivation of the analytic solution of the dierent models in the "Simpliedsolutions" section
all gures
72
3.4 Review on multi-scale Models of SEI Formation
3.4 Review on multi-scale Models of
Solid-Electrolyte Interphase Formation
Authors Birger Horstmann, Fabian Single, and Arnulf Latz
Journal Current Opinion in Electrochemistry
Volume 13
Pages 61-69
Published on 2nd November 2018
DOI 10.1016/j.coelec.2018.10.013
Copyright The abstract below is reproduced from reference [11], Copy-right (2020), with permission from Elsevier.
Paper IV is a review paper. It contains a brief summary of results from theo-retic studies on SEI that use atomistic methods which is similar to section 1.3.1.However, the main focus of this publication are results from continuum-type SEIgrowth models. Paper IV also contains results of Paper I−Paper III. Theyare discussed in the context of previous and more recent literature. Note thatthese publications are also summarised in section 1.3.2.
Abstract
Electrolyte reduction products form the solid-electrolyte interphase (SEI)on negative electrodes of lithium-ion batteries. Even though this processpractically stabilizes the electrodeelectrolyte interface, it results in con-tinued capacity-fade limiting lifetime and safety of lithium-ion batteries.Recent atomistic and continuum theories give new insights into the growthof structures and the transport of ions in the SEI. The diusion of neutralradicals has emerged as a prominent candidate for the long-term growthmechanism, because it predicts the observed potential dependence of SEIgrowth.
3.4.1 Explanation of own contribution
This manuscript was mostly written by Birger Horstmann who is the lead au-thor of the publication. Parts of section 1 (Introduction) have been written incollaboration between myself and Birger Horstmann. Furthermore, I have alsocontributed to the literature research needed for this review as well as severaltechnical discussions. The publications also uses some gures that I have createdfor dierent publications. The following contributions have been made by myselfalone for this publication specically.
Literature research for section 1 (Introduction)
73

3 Cumulative Part
Literature research for section 3 (Continuum models and long-term SEIgrowth)
Figure 1 and gure 2
74
3.5 Theory of Impedance Spectroscopy for Lithium Batteries
3.5 Theory of Impedance Spectroscopy for
Lithium Batteries
Authors Fabian Single, Birger Horstmann, and Arnulf Latz
Journal The Journal of Physical Chemistry C
Volume (Issue) 123 (45)
Pages 27327-27343
Published on 14th October 2019
DOI 10.1021/acs.jpcc.9b07389
Copyright The abstract and gures in this section are reproduced withpermission from reference [175], Copyright (2020) AmericanChemical Society.
Experimental characterization of the SEI constitutes a signicant challenge asdiscussed in section 1.2. One of its dicult aspects is the fact that SEI is notstable in normal atmosphere and easily damaged during sample transfer. SEIsamples need to be rinsed with DMC for preparation and cleaning before beeingcharacterised with most ex-situ methods. This step can also damage or alter thesurface lm. In-situ techniques such as impedance spectroscopy are not aectedby this issue, making them especially desirable for SEI characterization.
3.5.1 Abstract
In this article, we derive and discuss a physics-based model for impedancespectroscopy of lithium batteries. Our model for electrochemical cells withplanar electrodes takes into account the solid-electrolyte interphase (SEI)as a porous surface lm. We present two improvements over standardimpedance models. First, our model is based on a consistent descriptionof lithium transport through electrolyte and the SEI. We use well-denedtransport parameters, e.g., transference numbers, and consider convectionof the center-of-mass. Second, we solve our model equations analyticallyand state the full transport parameter dependence of the impedance signals.Our consistent model results in an analytic expression for the cell impedanceincluding bulk and surface processes. The impedance signals due to con-centration polarizations highlight the importance of electrolyte convectionin concentrated electrolytes. We simplify our expression for the compleximpedance and compare it to common equivalent circuit models. Such sim-plied models are good approximations in concise parameter ranges. Fi-nally, we compare our model with experiments of lithium metal electrodesand nd large transference numbers for lithium ions. This analysis revealsthat lithium-ion transport through the SEI has solid-electrolyte character.
75
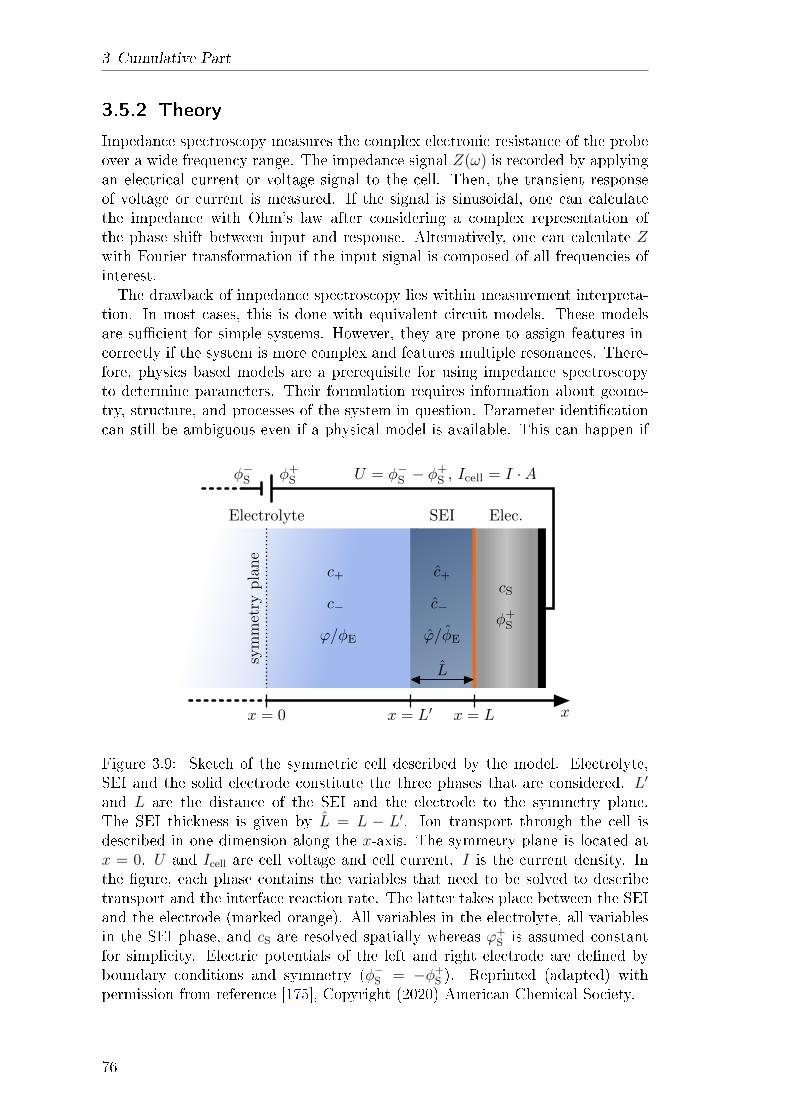
3 Cumulative Part
3.5.2 Theory
Impedance spectroscopy measures the complex electronic resistance of the probeover a wide frequency range. The impedance signal Z(ω) is recorded by applyingan electrical current or voltage signal to the cell. Then, the transient responseof voltage or current is measured. If the signal is sinusoidal, one can calculatethe impedance with Ohm's law after considering a complex representation ofthe phase shift between input and response. Alternatively, one can calculate Zwith Fourier transformation if the input signal is composed of all frequencies ofinterest.The drawback of impedance spectroscopy lies within measurement interpreta-
tion. In most cases, this is done with equivalent circuit models. These modelsare sucient for simple systems. However, they are prone to assign features in-correctly if the system is more complex and features multiple resonances. There-fore, physics based models are a prerequisite for using impedance spectroscopyto determine parameters. Their formulation requires information about geome-try, structure, and processes of the system in question. Parameter identicationcan still be ambiguous even if a physical model is available. This can happen if
x = Lx = 0
c+ c+
c−
ϕ/φE
c−
ϕ/φE
x = L′
symmetry
plane
Electrolyte SEI Elec.
φ+Sφ−S
φ+S
cS
x
U = φ−S − φ+S , Icell = I ·A
L
Figure 3.9: Sketch of the symmetric cell described by the model. Electrolyte,SEI and the solid electrode constitute the three phases that are considered. L′
and L are the distance of the SEI and the electrode to the symmetry plane.The SEI thickness is given by L = L − L′. Ion transport through the cell isdescribed in one dimension along the x-axis. The symmetry plane is located atx = 0. U and Icell are cell voltage and cell current. I is the current density. Inthe gure, each phase contains the variables that need to be solved to describetransport and the interface reaction rate. The latter takes place between the SEIand the electrode (marked orange). All variables in the electrolyte, all variablesin the SEI phase, and cS are resolved spatially whereas ϕ+
S is assumed constantfor simplicity. Electric potentials of the left and right electrode are dened byboundary conditions and symmetry (φ−S = −φ+
S ). Reprinted (adapted) withpermission from reference [175], Copyright (2020) American Chemical Society.
76
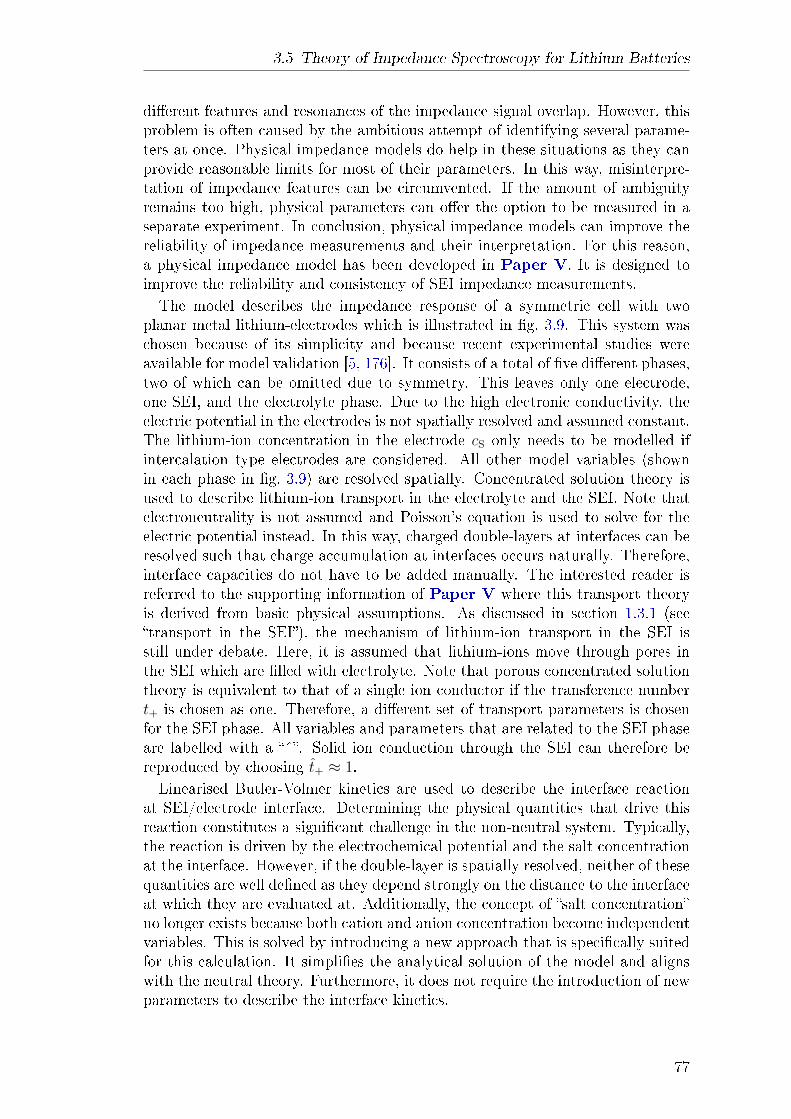
3.5 Theory of Impedance Spectroscopy for Lithium Batteries
dierent features and resonances of the impedance signal overlap. However, thisproblem is often caused by the ambitious attempt of identifying several parame-ters at once. Physical impedance models do help in these situations as they canprovide reasonable limits for most of their parameters. In this way, misinterpre-tation of impedance features can be circumvented. If the amount of ambiguityremains too high, physical parameters can oer the option to be measured in aseparate experiment. In conclusion, physical impedance models can improve thereliability of impedance measurements and their interpretation. For this reason,a physical impedance model has been developed in Paper V. It is designed toimprove the reliability and consistency of SEI impedance measurements.The model describes the impedance response of a symmetric cell with two
planar metal lithium-electrodes which is illustrated in g. 3.9. This system waschosen because of its simplicity and because recent experimental studies wereavailable for model validation [5, 176]. It consists of a total of ve dierent phases,two of which can be omitted due to symmetry. This leaves only one electrode,one SEI, and the electrolyte phase. Due to the high electronic conductivity, theelectric potential in the electrodes is not spatially resolved and assumed constant.The lithium-ion concentration in the electrode cS only needs to be modelled ifintercalation type electrodes are considered. All other model variables (shownin each phase in g. 3.9) are resolved spatially. Concentrated solution theory isused to describe lithium-ion transport in the electrolyte and the SEI. Note thatelectroneutrality is not assumed and Poisson's equation is used to solve for theelectric potential instead. In this way, charged double-layers at interfaces can beresolved such that charge accumulation at interfaces occurs naturally. Therefore,interface capacities do not have to be added manually. The interested reader isreferred to the supporting information of Paper V where this transport theoryis derived from basic physical assumptions. As discussed in section 1.3.1 (seetransport in the SEI), the mechanism of lithium-ion transport in the SEI isstill under debate. Here, it is assumed that lithium-ions move through pores inthe SEI which are lled with electrolyte. Note that porous concentrated solutiontheory is equivalent to that of a single ion conductor if the transference numbert+ is chosen as one. Therefore, a dierent set of transport parameters is chosenfor the SEI phase. All variables and parameters that are related to the SEI phaseare labelled with a . Solid ion conduction through the SEI can therefore bereproduced by choosing t+ ≈ 1.Linearised Butler-Volmer kinetics are used to describe the interface reaction
at SEI/electrode interface. Determining the physical quantities that drive thisreaction constitutes a signicant challenge in the non-neutral system. Typically,the reaction is driven by the electrochemical potential and the salt concentrationat the interface. However, if the double-layer is spatially resolved, neither of thesequantities are well dened as they depend strongly on the distance to the interfaceat which they are evaluated at. Additionally, the concept of salt concentrationno longer exists because both cation and anion concentration become independentvariables. This is solved by introducing a new approach that is specically suitedfor this calculation. It simplies the analytical solution of the model and alignswith the neutral theory. Furthermore, it does not require the introduction of newparameters to describe the interface kinetics.
77
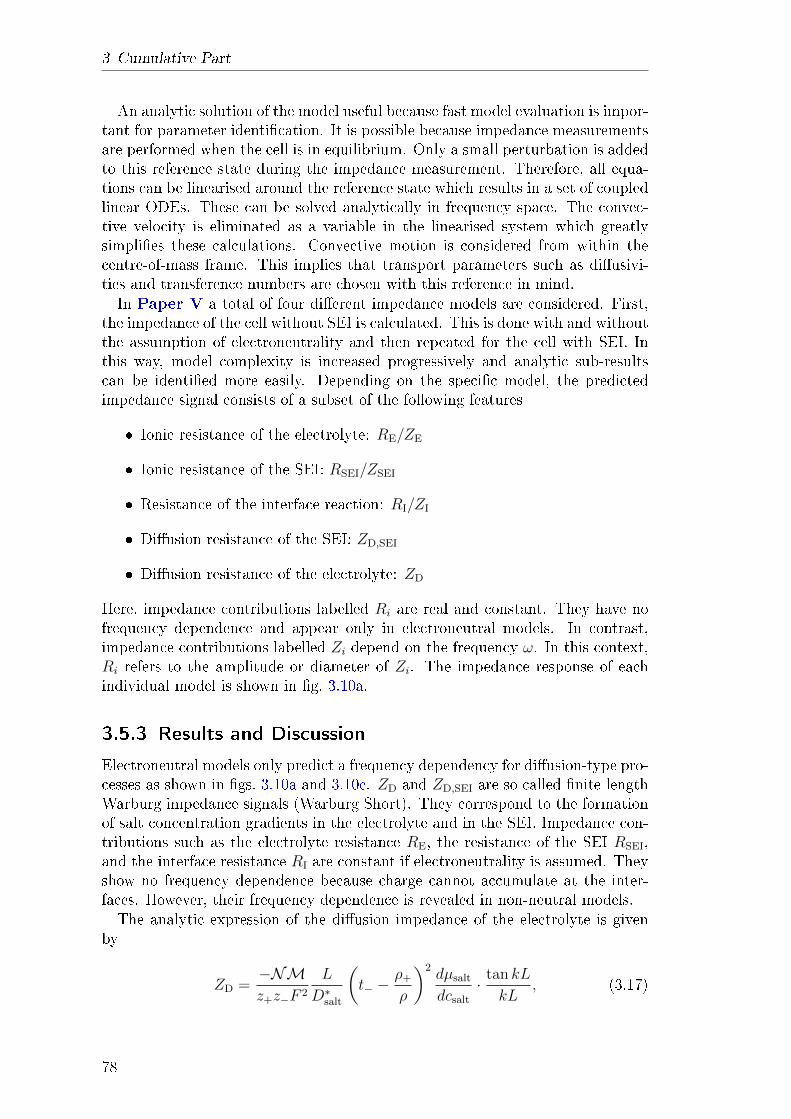
3 Cumulative Part
An analytic solution of the model useful because fast model evaluation is impor-tant for parameter identication. It is possible because impedance measurementsare performed when the cell is in equilibrium. Only a small perturbation is addedto this reference state during the impedance measurement. Therefore, all equa-tions can be linearised around the reference state which results in a set of coupledlinear ODEs. These can be solved analytically in frequency space. The convec-tive velocity is eliminated as a variable in the linearised system which greatlysimplies these calculations. Convective motion is considered from within thecentre-of-mass frame. This implies that transport parameters such as diusivi-ties and transference numbers are chosen with this reference in mind.In Paper V a total of four dierent impedance models are considered. First,
the impedance of the cell without SEI is calculated. This is done with and withoutthe assumption of electroneutrality and then repeated for the cell with SEI. Inthis way, model complexity is increased progressively and analytic sub-resultscan be identied more easily. Depending on the specic model, the predictedimpedance signal consists of a subset of the following features
Ionic resistance of the electrolyte: RE/ZE
Ionic resistance of the SEI: RSEI/ZSEI
Resistance of the interface reaction: RI/ZI
Diusion resistance of the SEI: ZD,SEI
Diusion resistance of the electrolyte: ZD
Here, impedance contributions labelled Ri are real and constant. They have nofrequency dependence and appear only in electroneutral models. In contrast,impedance contributions labelled Zi depend on the frequency ω. In this context,Ri refers to the amplitude or diameter of Zi. The impedance response of eachindividual model is shown in g. 3.10a.
3.5.3 Results and Discussion
Electroneutral models only predict a frequency dependency for diusion-type pro-cesses as shown in gs. 3.10a and 3.10c. ZD and ZD,SEI are so called nite-lengthWarburg impedance signals (Warburg Short). They correspond to the formationof salt concentration gradients in the electrolyte and in the SEI. Impedance con-tributions such as the electrolyte resistance RE, the resistance of the SEI RSEI,and the interface resistance RI are constant if electroneutrality is assumed. Theyshow no frequency dependence because charge cannot accumulate at the inter-faces. However, their frequency dependence is revealed in non-neutral models.The analytic expression of the diusion impedance of the electrolyte is given
by
ZD =−NMz+z−F 2
L
D∗salt
(t− −
ρ+
ρ
)2dµsalt
dcsalt
· tan kL
kL, (3.17)
78
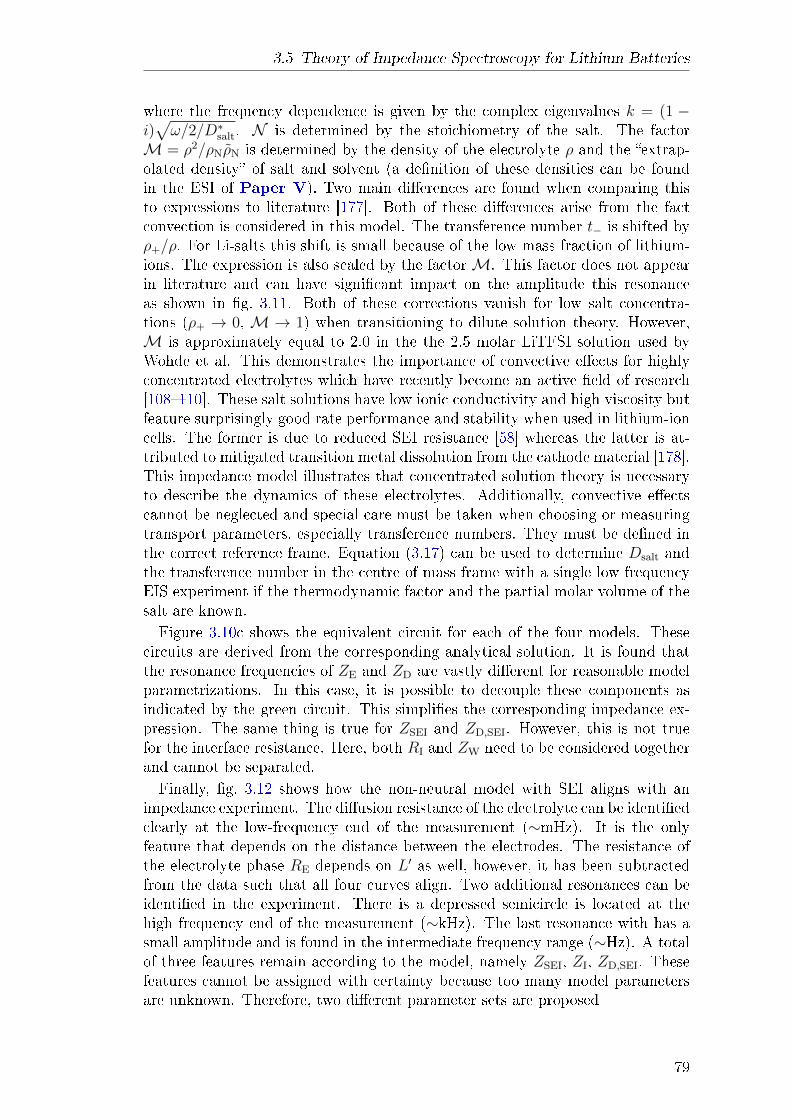
3.5 Theory of Impedance Spectroscopy for Lithium Batteries
where the frequency dependence is given by the complex eigenvalues k = (1 −i)√ω/2/D∗salt. N is determined by the stoichiometry of the salt. The factor
M = ρ2/ρNρN is determined by the density of the electrolyte ρ and the extrap-olated density of salt and solvent (a denition of these densities can be foundin the ESI of Paper V). Two main dierences are found when comparing thisto expressions to literature [177]. Both of these dierences arise from the factconvection is considered in this model. The transference number t− is shifted byρ+/ρ. For Li-salts this shift is small because of the low mass fraction of lithium-ions. The expression is also scaled by the factorM. This factor does not appearin literature and can have signicant impact on the amplitude this resonanceas shown in g. 3.11. Both of these corrections vanish for low salt concentra-tions (ρ+ → 0, M → 1) when transitioning to dilute solution theory. However,M is approximately equal to 2.0 in the the 2.5 molar LiTFSI solution used byWohde et al. This demonstrates the importance of convective eects for highlyconcentrated electrolytes which have recently become an active eld of research[108110]. These salt solutions have low ionic conductivity and high viscosity butfeature surprisingly good rate performance and stability when used in lithium-ioncells. The former is due to reduced SEI resistance [58] whereas the latter is at-tributed to mitigated transition metal dissolution from the cathode material [178].This impedance model illustrates that concentrated solution theory is necessaryto describe the dynamics of these electrolytes. Additionally, convective eectscannot be neglected and special care must be taken when choosing or measuringtransport parameters, especially transference numbers. They must be dened inthe correct reference frame. Equation (3.17) can be used to determine Dsalt andthe transference number in the centre of mass frame with a single low frequencyEIS experiment if the thermodynamic factor and the partial molar volume of thesalt are known.Figure 3.10c shows the equivalent circuit for each of the four models. These
circuits are derived from the corresponding analytical solution. It is found thatthe resonance frequencies of ZE and ZD are vastly dierent for reasonable modelparametrizations. In this case, it is possible to decouple these components asindicated by the green circuit. This simplies the corresponding impedance ex-pression. The same thing is true for ZSEI and ZD,SEI. However, this is not truefor the interface resistance. Here, both RI and ZW need to be considered togetherand cannot be separated.Finally, g. 3.12 shows how the non-neutral model with SEI aligns with an
impedance experiment. The diusion resistance of the electrolyte can be identiedclearly at the low-frequency end of the measurement (∼mHz). It is the onlyfeature that depends on the distance between the electrodes. The resistance ofthe electrolyte phase RE depends on L′ as well, however, it has been subtractedfrom the data such that all four curves align. Two additional resonances can beidentied in the experiment. There is a depressed semicircle is located at thehigh frequency end of the measurement (∼kHz). The last resonance with has asmall amplitude and is found in the intermediate frequency range (∼Hz). A totalof three features remain according to the model, namely ZSEI, ZI, ZD,SEI. Thesefeatures cannot be assigned with certainty because too many model parametersare unknown. Therefore, two dierent parameter sets are proposed
79
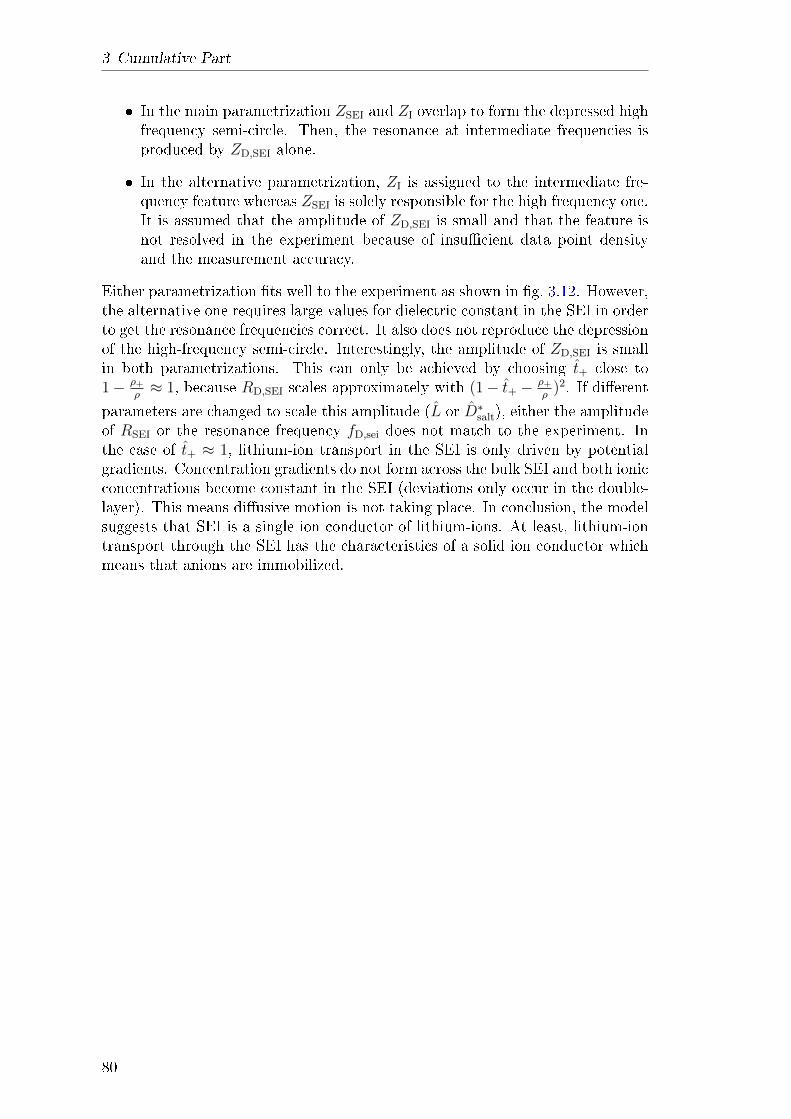
3 Cumulative Part
In the main parametrization ZSEI and ZI overlap to form the depressed highfrequency semi-circle. Then, the resonance at intermediate frequencies isproduced by ZD,SEI alone.
In the alternative parametrization, ZI is assigned to the intermediate fre-quency feature whereas ZSEI is solely responsible for the high frequency one.It is assumed that the amplitude of ZD,SEI is small and that the feature isnot resolved in the experiment because of insucient data point densityand the measurement accuracy.
Either parametrization ts well to the experiment as shown in g. 3.12. However,the alternative one requires large values for dielectric constant in the SEI in orderto get the resonance frequencies correct. It also does not reproduce the depressionof the high-frequency semi-circle. Interestingly, the amplitude of ZD,SEI is smallin both parametrizations. This can only be achieved by choosing t+ close to1− ρ+
ρ≈ 1, because RD,SEI scales approximately with (1− t+ − ρ+
ρ)2. If dierent
parameters are changed to scale this amplitude (L or D∗salt), either the amplitudeof RSEI or the resonance frequency fD,sei does not match to the experiment. Inthe case of t+ ≈ 1, lithium-ion transport in the SEI is only driven by potentialgradients. Concentration gradients do not form across the bulk SEI and both ionicconcentrations become constant in the SEI (deviations only occur in the double-layer). This means diusive motion is not taking place. In conclusion, the modelsuggests that SEI is a single ion conductor of lithium-ions. At least, lithium-iontransport through the SEI has the characteristics of a solid ion conductor whichmeans that anions are immobilized.
80
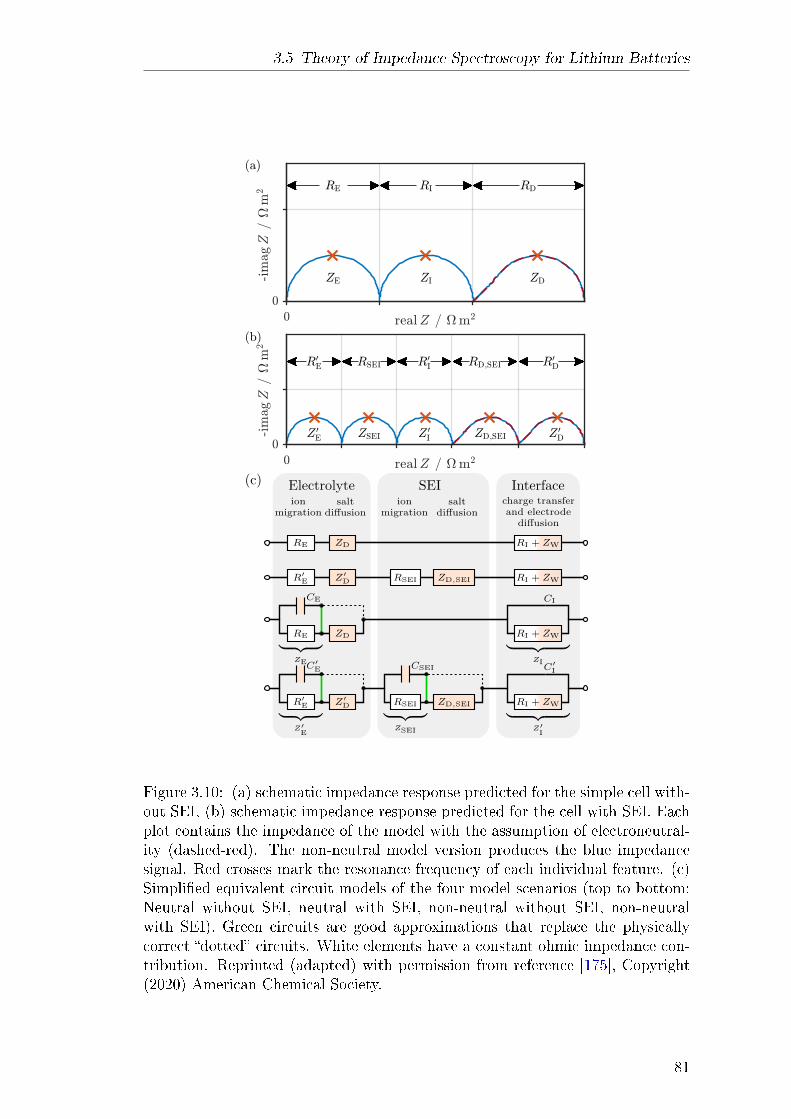
3.5 Theory of Impedance Spectroscopy for Lithium Batteries
Figure 3.10: (a) schematic impedance response predicted for the simple cell with-out SEI, (b) schematic impedance response predicted for the cell with SEI. Eachplot contains the impedance of the model with the assumption of electroneutral-ity (dashed-red). The non-neutral model version produces the blue impedancesignal. Red crosses mark the resonance frequency of each individual feature. (c)Simplied equivalent circuit models of the four model scenarios (top to bottom:Neutral without SEI, neutral with SEI, non-neutral without SEI, non-neutralwith SEI). Green circuits are good approximations that replace the physicallycorrect dotted circuits. White elements have a constant ohmic impedance con-tribution. Reprinted (adapted) with permission from reference [175], Copyright(2020) American Chemical Society.
81
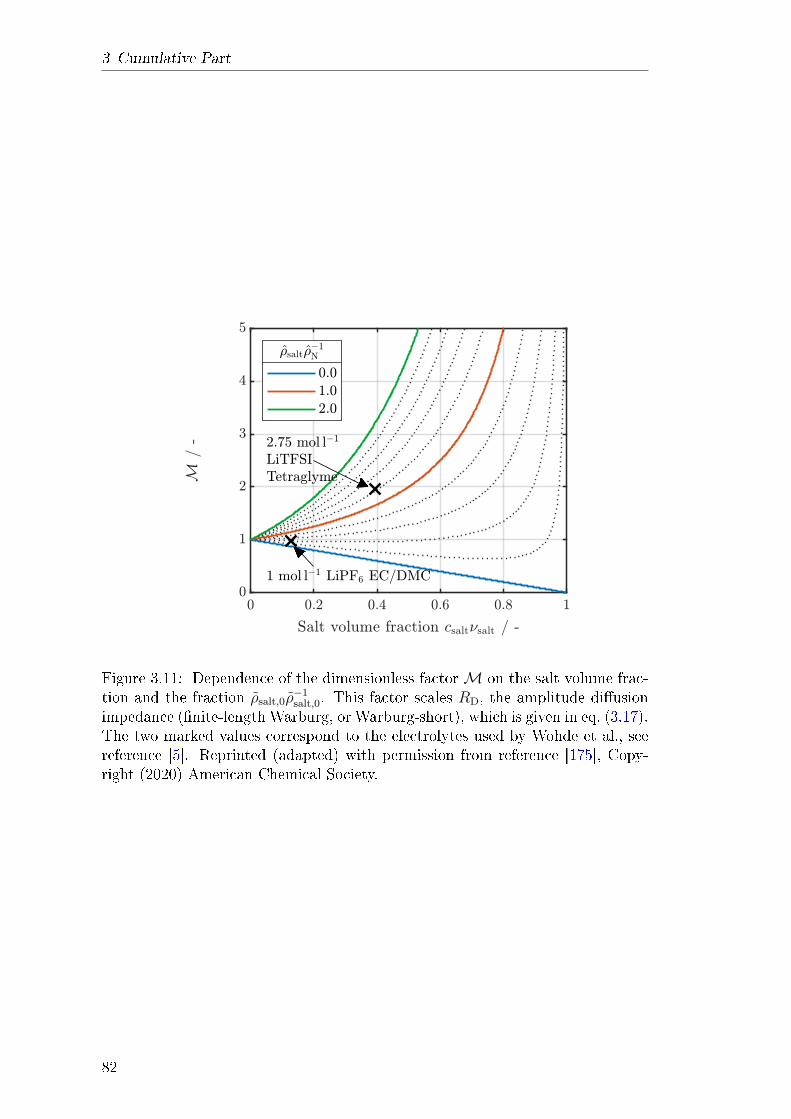
3 Cumulative Part
Figure 3.11: Dependence of the dimensionless factorM on the salt volume frac-tion and the fraction ρsalt,0ρ
−1salt,0. This factor scales RD, the amplitude diusion
impedance (nite-length Warburg, or Warburg-short), which is given in eq. (3.17).The two marked values correspond to the electrolytes used by Wohde et al., seereference [5]. Reprinted (adapted) with permission from reference [175], Copy-right (2020) American Chemical Society.
82
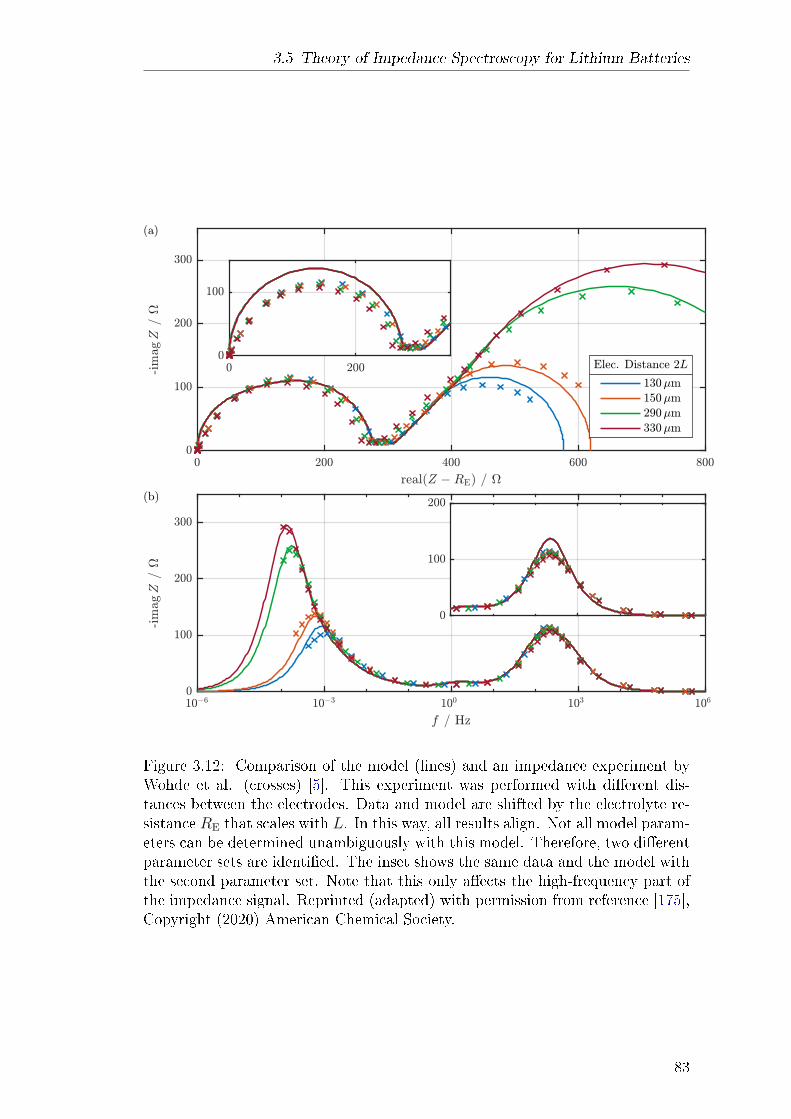
3.5 Theory of Impedance Spectroscopy for Lithium Batteries
Figure 3.12: Comparison of the model (lines) and an impedance experiment byWohde et al. (crosses) [5]. This experiment was performed with dierent dis-tances between the electrodes. Data and model are shifted by the electrolyte re-sistance RE that scales with L. In this way, all results align. Not all model param-eters can be determined unambiguously with this model. Therefore, two dierentparameter sets are identied. The inset shows the same data and the model withthe second parameter set. Note that this only aects the high-frequency part ofthe impedance signal. Reprinted (adapted) with permission from reference [175],Copyright (2020) American Chemical Society.
83
3 Cumulative Part
3.5.4 Explanation of own Contribution
Birger Horstmann provided the idea of an analytic impedance model which issolved in frequency space. He also provided valuable feedback in discussions forfurther development of the model which was primarily done by myself. This in-cludes calculations such as the linearisation of the transport theory, calculationof eigenvectors, derivation of the reaction rate expression, and the nal calcula-tion of the solution. The text was written by myself with the exception of theabstract and the conclusion. These sections were written by in collaboration be-tween Birger Horstmann and myself. He also contributed by proofreading themanuscript and with feedback on the content and structure of the publication.The transport theory of concentrated mixtures was originally derived by Max
Schammer and Birger Horstmann [160]. It has been adapted for the binary saltand is presented in the supporting information of this publication.Furthermore, the following contributions have been made by myself alone
text of the following sections: introduction, theory, theory of impedancespectroscopy, discussion, and validation with experiments
analytical calculations (by hand and with Mathematica)
numerical calculations (Matlab)
parameter identication and model calibration with experiment
all gures and plots
84
4 Conclusion and Outlook
This thesis's primary goal was the identication of universal solid electrolyteinterphase (SEI) properties. First and foremost, this refers to identifying thelong-term growth mechanism (LTGM) that causes continued SEI formation andcapacity fade in lithium-ion batteries. However, other aspects such as the mor-phology of this surface lm have been of interest as well. To this aim, a new modelhas been developed to describe long-term SEI growth. In contrast to similar pre-viously existing SEI growth models, this model can also predict the evolution ofSEI morphology. It is also designed to test the eect that dierent LTGMs haveon SEI morphology and SEI growth.As shown in Paper I and Paper II, the model predicts the expected parabolic
growth law for the evolution of SEI thickness. This result aligns with previousliterature and experiments. Additionally, the model predicts a non-zero porosityfor the outer SEI layer for dierent LTGMs, i.e., electron conduction and lithium-interstitial diusion but not for solvent diusion. It arises from a competitionbetween two transport mechanisms that move SEI precursors to the SEI frontwhere the formation reaction takes place. Another condition for this predictionis that one electrolyte species has a lower reduction potential than the otherone. At the SEI front, porosity decreases until the stable species becomes almostimmobilised inside SEI pores. Then, the porosity inside the SEI stays constantbecause the rate of active solvent moving past the SEI front into the porouslayer becomes slower than SEI growth itself. As shown in Paper II, this processdoes not take place if solvent diusion is assumed to be the LTGM. For thismechanism, porosity becomes a model parameter.The model also predicts the dual-layer structure of the SEI and the porosity
of the outer layer. These predictions depend on the chemical reactions at playand the eective transport parameters in each phase. The original intent was toconclude the LTGM with these predictions. However, this has not been possiblebecause of two reasons. Firstly, direct quantitative observation of SEI porosityhas not been possible yet in experiments. Most experimental evidence for thedual-layer structure is indirect. The corresponding methods cannot measure theporosity or the thickness of individual SEI layers. Imaging methods that couldachieve this require high beam energies at the resolution required for this obser-vation. However, the organic outer SEI layer is susceptible to beam damage andalso believed to be aected by the ex-situ nature of TEM experiments. Secondly,as shown in Paper II, all morphology predictions do not depend strongly on theLTGM. Lithium-interstitial diusion produces a porous outer layer just as wellas electron conduction. Therefore, determining the exact morphology of the SEIcannot be used to dierentiate between these LTGMs.However, as shown in Paper II, the possibility to simulate SEI growth with dif-
ferent LTGMs could still be used to draw meaningful conclusions. To this aim, the
85
4 Conclusion and Outlook
model framework was used to study how SEI responds to small porosity changes.In real batteries, such porosity uctuations occur when the underlying electrodeexpands or shrinks during cycling. As shown by the comparison of dierent LT-GMs, only the solvent diusion mechanism responds strongly to these changes. Ifthis LTGM causes SEI growth, small deviations in lm porosity can change in theSEI growth rate by several orders of magnitude. In this case, porosity uctuationswould temporarily but repeatedly lead to fast and uncontrolled formation of thesurface lm. In comparison, the SEI growth rate is barely aected by porosityuctuations if either electron conduction or lithium-interstitial diusion causesits long-term growth. The expansion that crystalline graphite particles experi-ence during lithiation is distributed inhomogeneously over the particle's surfacebecause the expansion of graphite during lithiation is anisotropic. If SEI growthwere to be this porosity sensitive, SEI thickness would be distributed heteroge-neously on these particles. Experimentally, this is not observed to the predicteddegree, which can be considered as evidence against the solvent diusion mecha-nism.More evidence for this hypothesis is given in Paper III. The experiments by
Keil et al. clearly illustrate that long-term SEI growth depends on the elec-trode potential [4, 174]. This cannot be reproduced if diusion of a neutralsolvent species through SEI pores is used as the LTGM. Long-term SEI growthis accelerated at low electrode potentials as shown by the experiment. Then,the electrode would then attract cations by electrostatic interactions. Aside fromlithium-ions, other cations can be present in the electrolyte, i.e., due to transitionmetal dissolution of high-voltage cathodes such as NCA and NMC. However, thesame potential dependence is also observed in cells with lithium-iron-phosphatecathodes where such cations are not present. Tang et al. also observed a similarpotential dependence in a 2012 publication [2]. She concluded that a chargedspecies must be the rate-limiting one. This is not necessarily true, as shown inPaper III. Low potentials can also increase the concentration of the rate-limitingspecies. In this way, SEI growth is accelerated even if the rate-limiting speciesitself is neutral, as in the case of neutral lithium-interstitials.Amongst the four LTGMs studied in Paper III, the potential dependence
predicted by the lithium-interstitial diusion mechanism agrees best with theexperimental data. Electron conduction and tunnelling produce a potential de-pendence as well; however, the agreement is not as good. Additionally, thisdependence is highly dependent on secondary parameters such as the equilib-rium potential of the formation reaction in the case of electron conduction. Theelectron tunnelling model by Li et al. [179] depends strongly on the activationenergy of the tunnelling process. Furthermore, it is sensitive to the SEI's exactdual-layer structure, which is a model parameter. In contrast, it is not possibleto adjust the potential dependence produced by the lithium-interstitial diusionmechanism with any model parameter. This is an almost necessary feature of auniversal SEI property that is produced by dierent SEIs.Recent experiments by Attia et al. [115] show that SEI growth depends on
the direction of the lithium intercalation current. Specically, SEI growth isaccelerated during lithiation of the underlying electrode. Lithium-interstitial dif-fusion reproduces this asymmetry naturally because lithiation of the anodes takes
86
placer at low potentials. This increases the interstitial concentration according toeq. (3.16) and accelerates SEI growth. Similarly, delithiation requires high elec-trode potentials which, in turn, reduce the rate of long-term SEI formation. VonKolzenberg et al. show this in a recent publication [153]. In another publication,Das et al. couple the lithium-interstitial concentration to the concentration oflithium-ions inside the SEI [152]. This further pronounces the charge/dischargeasymmetry of SEI formation observed by Attia et al.In conclusion, Paper III presents strong evidence that lithium-interstitial dif-
fusion is the LTGM. Other researchers of the SEI modelling eld have alreadystarted to use this result, and their top priority is no longer the identicationof the LTGM. Instead, understanding the interaction between lm growth andthrough-lm current has become the next challenge of SEI modelling. The mod-els developed in Paper I and Paper II can easily be extended to consider thisas well. In this way, one could use them to study how ionic currents in the SEIaect its morphology.The model framework developed in this thesis can describe the formation and
growth of porous surface lms in general and can be utilised in other scenariosand applications. For example, it would be well suited to describe the cycling ofa metal lithium electrode. Plating and stripping of lithium are highly irreversibleas shown by Chen et al. in reference [168]. Lithium deposition is dendritic andcauses the formation of a porous lithium surface layer. Unlike SEI, this layercan be several tens of micrometres thick. It is removed when lithium is strippedelectrochemically. However, any SEI that has formed in the porous lithium layeris left behind which leads to the formation of a porous and inert layer of SEI rem-nants. This layer forms in front of the electrode and is labelled dead-lithiumlayer by Chen et al. It can reach thicknesses of over ∼ 100 µm after multiplecycles and at this point, it constitutes signicantly to the overall cell resistance.These eects are not considered in standard electrochemical models of lithiumhalf-cells or lithium-sulphur batteries [180, 181]. Instead, a Butler-Volmer typerate expression is used to model the kinetics of the lithium metal electrode. Thisdescription does not capture the substantial increase of the specic surface areadue to the formation of the porous lithium layer. Also, it does not consider thegrowing dead lithium layer either. An accurate lithium electrode model wouldimprove the accuracy of these simulations signicantly. In this application, themodel would be similar to previous models of zinc [182] and magnesium [183]anodes in metal-air batteries. However, the description of solid convection intro-duced in Paper II would be necessary to describe the cyclic displacement of thedead lithium layer. In conclusion, the SEI growth model developed in this thesishas excellent potential to be adapted for dierent applications in electrochemistryand lm growth in general.
A completely dierent approach is taken in Paper V to investigate SEI fur-ther. This publication presents a new impedance model for a symmetric cell withplanar electrodes which are covered by a surface lm. The model is entirely an-alytical and physics-based. Its analytical nature allows quick calculation whichis essential for parameter calibration with experimental data. It also producesmathematical expressions for each impedance feature which reveal their com-
87
4 Conclusion and Outlook
plete parameter dependence. The model itself is derived from a physics-baseddescription of transport in all phases of the electrochemical cell. Use of the Pois-son equation creates the double-layer capacity of dierent interfaces naturally.Nonetheless, the model shows excellent agreement with simpler equivalent circuitmodels. It was also used to identify parameter combinations and ranges at whichthis agreement breaks down.For validation, the impedance model was compared to an experiment by Wohde
et al. [5]. The agreement between model and experiment is excellent; however,unambiguous identication of all model parameters is not possible. There aretoo many unknown parameters in the rst place, and frequency overlap of someresonances complicates parameter identication as well. Nonetheless, some keyparameters can be identied with sucient accuracy so that some conclusionscan be made. The rst one is about the SEI aspect of the model. All impedancemodels with SEI show that the porous surface lm adds two features to the simplecell's impedance response. This includes the expected semi-circle that representsthe conventional SEI resistance. However, the assumption of a porous SEI alsodirectly creates a second diusion type impedance (nite-length Warburg). Thisfeature cannot be identied clearly in the impedance experiment. Therefore, thefeature either does not exist or its amplitude is small. The analytical solution ofthe model implies that the transference number in the SEI is approximately onein both cases. By implication, SEI is a single ion conductor and ionic transportthrough the SEI is likely to happen in its solid phase. It is not possible to ruleout ion transport through SEI pores; however, anions would have to be immo-bilised in these pores. Consequently, these results suggest that ion transport inthe SEI has solid-ion conductor character. The model/experiment comparisonalso reveals results that concern electrolyte transport in general. Wohde et al.used a highly concentrated Li-TFSI tetraglyme solution electrolyte [5]. This so-lution creates a large diusion impedance feature (nite-length Warburg), i.e., aresistance increase at very low frequencies due to the formation of salt concen-tration gradients across the cell. The analytic expression for this feature revealsthat its correct amplitude can only be produced if the model considers convectiveeects. This clearly demonstrates the importance of convection in these typesof solutions. Similarly critical is a consistent description of electrolyte trans-port which means that transport parameters such as the diusion coecient andtransference numbers must be determined in the correct reference frame. An ac-curate description of charge transport in the electrolyte is of pivotal importancefor accurate simulations of electrochemical cells. This is especially true for highcurrent density, where large concentration gradients aect the conductivity of theelectrolyte signicantly. Porous electrodes further magnify this eect and reachthe limiting current of the electrolyte even earlier. So far, the standard theory forelectrolyte transport in lithium-ion batteries often omits convection in the elec-trolyte [184, 185]. This is, among other things, because convective eects are notas pronounced for commonly used salt concentrations of 1-1.2M, as illustratedfor the prevalent LP30 electrolyte in g. 3.11. However, this gure also showsthat convection leads to large deviations for super-concentrated electrolytes andionic liquids.Further development of the impedance model is possible and a logical step
88
would be the addition of a second SEI layer. The resulting model could be usedto study the eect of a dual-layer SEI on impedance measurements. However,the current model already has too many parameters, of which some could notbe identied unambiguously. Therefore, such an addition would only be reason-able if a well-tailored impedance experiment was available. To further improvethe experiment by Wohde et al., this experiment would have to use a planar in-tercalation electrode. As mentioned above, lithium electrodes quickly develop acomplex surface morphology which can severely change the interface resistance ofthe electrode between dierent measurements [168]. Using an intercalation typeelectrode would allow for repeated impedance measurements at dierent ages ofthe surface lm. Changes in amplitude and resonance frequency of individualfeatures could then be used for their unambiguous identication. Note that amore stable electrode is a prerequisite to perform comparable measurements atdierent times. Steinhauer et al. have performed similar experiments for theinitial SEI formation on carbon electrodes [60]. Long-term studies of this kindwould be indispensable for a better understanding of long-term SEI growth. Tofurther improve the experimental results, one could some adjust parameters suchas the salt concentration, electrode distance, or electrode particle size (for in-tercalation electrodes). In this way, one could avoid frequency overlaps betweendierent resonances to some degree. In conclusion, currently, the model wouldbenet more from an improved experiment than from further development of itsSEI aspect.However, this is not true for the electrolyte transport aspect of the model. The
underlying theory for electrolyte transport could be reformulated with a dierentreference frame for convection. Alternative reference frames are the centre ofvolume or the solvent velocity. This would result in relations that can transformelectrolyte transport parameters between dierent reference frames and relatethem to conventionally measured ones. Further development of this kind couldestablish low-frequency electrochemical impedance spectroscopy as a tool for theconsistent determination of electrolyte transport parameters, i.e., salt diusioncoecients, transference numbers, and thermodynamic factors.
The eld of battery research is in constant movement and simultaneouslybranching o into multiple directions. For instance, the lithium-ion battery tech-nology moves towards high voltage cathode materials and solid electrolytes thatmay eventually stabilise metal lithium anodes. Lithium alloy anodes such assilicon or tin are also prominent candidates for additional improvement of en-ergy density [186]. At the same time, potential alternatives to lithium-basedsystems are being studied. These include other alkali/alkaline earth metals suchas sodium and [187189] and magnesium [190]. All these technologies share thecommon problem of insucient interface stability, which is currently prevent-ing their breakthrough. The most promising strategy forward in most of thesecases is rational electrolyte design. These eorts are not necessarily aimed atcreating electrolytes with larger stability windows. Instead, they are focused onelectrolytes that form better surface lms. For instance, metal-sodium electrodeshave highly inecient passivation because of dendritic deposition [188]. This canbe improved by using alloying tin electrodes which typically also suer from in-
89
4 Conclusion and Outlook
stability because they experience large volume change during cycling. However,improved stability is realised in 1M NaPF6-glyme based electrolytes, which forma polymeric and compact SEI [189]. A dierent example of electrolyte optimi-sation are electrolyte additives. These can also stabilise the cathode interfaceswhere surface lms can similarly from the oxidation of electrolyte species. LiPF6
derivatives such as dimethyl uorophosphate and diethyl uorophosphate havebeen shown to form eective cathode/electrolyte interphases [191]. They im-prove cycling stability and Coulombic eciency of high-voltage NMC cells. Atthis point, highly concentrated electrolytes and should be mentioned as the nalexample for rational electrolyte design [109]. These electrolytes could also enablehigh voltage cathode materials in lithium-ion based systems. They are known tomitigate transition metal dissolution and stabilise the aluminium current collec-tor at high voltages [108]. Currently, sucient stability of this current collectoris only achieved with LiPF6 and EC based electrolytes. However, highly concen-trated electrolytes are found to mitigate aluminium corrosion at high potentials[192]. These electrolytes form SEIs that are almost entirely anion derived [110].This is similarly true for ionic liquids [48, 193] and eectively opens up a newand high dimensional control parameter for SEI formation which has yet to befully explored.In conclusion, SEI research remains a central component of lithium-ion and post
lithium-ion battery development. Many future SEI studies will focus on surfacelms formed with new salts and higher salt concentrations. These feature a dif-ferent composition compared to SEIs formed from LiPF6-carbonate electrolytes,which are well understood. This research will result in several new SEI chemistriesthat have promising performance. Whether the models developed in this thesescan be used to describe these surface lms depends on two factors. Most im-portantly, the SEI in question must also feature parabolic long-term growth.Additionally, it must be suciently homogeneous so that the one-dimensionaldescription is accurate. Then, most predictions from Paper II will also applybecause they only depend on the specic SEI chemistry quantitatively. Qualita-tive results such as the predictions for SEI porosity and the notion that a solventdiusion is unlikely to be the LTGM will apply as well. However, whether thediusion of neutral lithium-interstitials is the LTGM instead will depend on thespecic SEI chemistry. Another theoretic comparison of dierent LTGMs similarto Paper III in conjunction with a new experiment that measures capacity fadeduring storage at dierent potentials, similar to reference [4], could answer thisquestion. Theoretic studies that use atomistic methods can also provide addi-tional clues on the LTGM in these SEIs. Quantum chemistry will also play asubstantial role in predicting the chemical composition of these surface lms andin revealing the corresponding reaction mechanisms. Either way, it is foreseeablethat great leaps in SEI research will continue to be made, especially by combiningexperimentation with theory-based research.
90
Bibliography
[1] Fabian Single, Erkm Karaca, Birger Horstmann, and Arnulf Latz. Sim-ulation and Modelling of the Solid Electrolyte Interphase with VaryingPorosity. ECS Transactions, 69(1):129131, oct 2015. ISSN 1938-6737.doi 10.1149/06901.0129ecst.
[2] Maureen Tang, Sida Lu, and John Newman. Experimental and Theoreti-cal Investigation of Solid-Electrolyte-Interphase Formation Mechanisms onGlassy Carbon. Journal of The Electrochemical Society, 159(11):A1775A1785, aug 2012. doi 10.1149/2.025211jes.
[3] Siqi Shi, Peng Lu, Zhongyi Liu, Yue Qi, Louis G Hector, Hong Li, andStephen J Harris. Direct Calculation of Li-ion Transport in the Solid Elec-trolyte Interphase. Journal of the American Chemical Society, 134(37):1547615487, 2012. doi 10.1021/ja305366r.
[4] Peter Keil, Simon F. Schuster, Jörn Wilhelm, Julian Travi, Andreas Hauser,Ralph C. Karl, and Andreas Jossen. Calendar Aging of Lithium-Ion Bat-teries. Journal of The Electrochemical Society, 163(9):A1872A1880, 2016.doi 10.1149/2.0411609jes.
[5] F. Wohde, M. Balabajew, and B. Roling. Li Transference Numbers in LiquidElectrolytes Obtained by Very-Low-Frequency Impedance Spectroscopy atVariable Electrode Distances. Journal of The Electrochemical Society, 163(5):A714A721, 2016. doi 10.1149/2.0811605jes.
[6] M. M. Thackeray, W. I. F. David, P. G. Bruce, and J. B. Goodenough.Lithium insertion into manganese spinels. Materials Research Bulletin, 18(4):461472, apr 1983. doi 10.1016/0025-5408(83)90138-1.
[7] A. K. Padhi, K. S. Nanjundaswamy, and J. B. Goodenough. Phospho-olivines as Positive-Electrode Materials for Rechargeable Lithium Batteries.Journal of The Electrochemical Society, 144(4):11881194, apr 1997. ISSN0013-4651. doi 10.1149/1.1837571.
[8] M. Stanley Whittingham. Electrointercalation in transition-metal disul-phides. Journal of the Chemical Society, Chemical Communications, 9:328329, 1974. ISSN 0022-4936. doi 10.1039/c39740000328.
[9] M. S. WHITTINGHAM. Electrical Energy Storage and IntercalationChemistry. Science, 192(4244):11261127, jun 1976. doi 10.1126/sci-ence.192.4244.1126.
91
Bibliography
[10] Akira Yoshino. The birth of the lithium-ion battery. Angewandte Chemie- International Edition, 51(24):57985800, 2012. ISSN 14337851. doi10.1002/anie.201105006.
[11] Birger Horstmann, Fabian Single, and Arnulf Latz. Review on multi-scalemodels of solid-electrolyte interphase formation. Current Opinion in Elec-trochemistry, 13:6169, feb 2019. doi 10.1016/j.coelec.2018.10.013.
[12] Bote Zhao, Ran Ran, Meilin Liu, and Zongping Shao. A comprehensive re-view of Li 4 Ti 5 O 12 -based electrodes for lithium-ion batteries: The latestadvancements and future perspectives. Materials Science and Engineering:R: Reports, 98:171, dec 2015. doi 10.1016/j.mser.2015.10.001.
[13] Doron Aurbach, Yosef Gofer, and Jacob Langzam. The Correlation Be-tween Surface Chemistry, Surface Morphology, and Cycling Eciency ofLithium Electrodes in a Few Polar Aprotic Systems. Journal of The Elec-trochemical Society, 136(11):31983205, nov 1989. ISSN 0013-4651. doi10.1149/1.2096425.
[14] D. Aurbach, A. Zaban, Y. Ein-Eli, I. Weissman, O. Chusid, B. Markovsky,M. Levi, E. Levi, A. Schechter, and E. Granot. Recent studies on the cor-relation between surface chemistry, morphology, three-dimensional struc-tures and performance of Li and Li-C intercalation anodes in several im-portant electrolyte systems. Journal of Power Sources, 68(1):9198, 1997.doi 10.1016/S0378-7753(97)02575-5.
[15] Mengyun Nie, Daniel P. Abraham, Daniel M. Seo, Yanjing Chen, ArijitBose, and Brett L. Lucht. Role of Solution Structure in Solid ElectrolyteInterphase Formation on Graphite with LiPF 6 in Propylene Carbonate.The Journal of Physical Chemistry C, 117(48):2538125389, dec 2013. doi10.1021/jp409765w.
[16] Atetegeb Meazah Haregewoin, Ermias Girma Leggesse, Jyh-Chiang Jiang,Fu-Ming Wang, Bing-Joe Hwang, and Shawn D. Lin. Comparative Studyon the Solid Electrolyte Interface Formation by the Reduction of AlkylCarbonates in Lithium ion Battery. Electrochimica Acta, 136(0):274285,aug 2014. doi 10.1016/j.electacta.2014.05.103.
[17] Ravi Kumar, Peng Lu, Xingcheng Xiao, Zhuangqun Huang, and Brian W.Sheldon. Strain-Induced Lithium Losses in the Solid Electrolyte Interphaseon Silicon Electrodes. ACS Applied Materials and Interfaces, 9(34):2840628417, 2017. doi 10.1021/acsami.7b06647.
[18] Isabella Weber, Johannes Schnaidt, Bin Wang, Thomas Diemant, andR. Jürgen Behm. Model Studies on the Solid Electrolyte Interphase For-mation on Graphite Electrodes in Ethylene Carbonate and Dimethyl Car-bonate: Highly Oriented Pyrolytic Graphite. ChemElectroChem, 6(19):49854997, 2019. ISSN 21960216. doi 10.1002/celc.201900909.
92
Bibliography
[19] D. Aurbach. Identication of Surface Films Formed on Lithium in PropyleneCarbonate Solutions. Journal of The Electrochemical Society, 134(7):1611,1987. doi 10.1149/1.2100722.
[20] D. Aurbach, M. L. Daroux, P. W. Faguy, and E. Yeager. Identication ofSurface Films Formed on Lithium in Dimethoxyethane and TetrahydrofuranSolutions. Journal of The Electrochemical Society, 135(8):1863, 1988. ISSN00134651. doi 10.1149/1.2100722.
[21] Doron Aurbach. Identication of Surface Films Formed on Lithium Sur-faces in γ-Butyrolactone Solutions: I . Uncontaminated Solutions. Jour-nal of The Electrochemical Society, 136(6):16061610, jun 1989. doi10.1149/1.2096977.
[22] Doron Aurbach, Orit Youngman, Yosef Gofer, and Arie Meitav. The elec-trochemical behaviour of 1,3-dioxolaneLiClO4 solutionsI. Uncontam-inated solutions. Electrochimica Acta, 35(3):625638, mar 1990. ISSN00134686. doi 10.1016/0013-4686(90)87055-7.
[23] Doron Aurbach and Yosef Gofer. The behavior of lithium electrodes inmixtures of alkyl carbonates and ethers. Journal of The ElectrochemicalSociety, 138(12):3529, 1991. doi 10.1149/1.2085454.
[24] Yair Ein-Ely and Doron Aurbach. Identication of Surface Films Formed onActive Metals and Nonactive Metal Electrodes at Low Potentials in MethylFormate Solutions. Langmuir, 8(7):18451850, 1992. ISSN 15205827. doi10.1021/la00043a026.
[25] Doron Aurbach, Yair Ein-Eli, Boris Markovsky, Arie Zaban, S. Luski,Y. Carmeli, and H. Yamin. The Study of Electrolyte Solutions Based onEthylene and Diethyl Carbonates for Rechargeable Li Batteries: II . Gra-phite Electrodes. Journal of The Electrochemical Society, 142(9):28822890,sep 1995. doi 10.1149/1.2048659.
[26] Yair Ein-Eli, Stacey R. Thomas, Victor Koch, Doron Aurbach, BorisMarkovsky, and Alexander Schechter. Ethylmethylcarbonate, a PromisingSolvent for Li-Ion Rechargeable Batteries. Journal of The ElectrochemicalSociety, 143(12):L273L277, dec 1996. doi 10.1149/1.1837293.
[27] Doron Aurbach, Mikhail D. Levi, Elena Levi, and Alexander Schechter.Failure and Stabilization Mechanisms of Graphite Electrodes. The Journalof Physical Chemistry B, 101(96):21952206, 1997. ISSN 1520-6106. doi10.1021/jp962815t.
[28] K. A. Striebel, J. Shim, E. J. Cairns, R. Kostecki, Y.-J. Lee, J. Reimer, T. J.Richardson, P. N. Ross, X. Song, and G. V. Zhuang. Diagnostic Analysisof Electrodes from High-Power Lithium-Ion Cells Cycled under DierentConditions. Journal of The Electrochemical Society, 151(6):A857, 2004. doi10.1149/1.1710514.
93
Bibliography
[29] S. Laruelle, S. Pilard, P. Guenot, S. Grugeon, and J.-M. Tarascon. Iden-tication of Li-Based Electrolyte Degradation Products Through DEI andESI High-Resolution Mass Spectrometry. Journal of The ElectrochemicalSociety, 151(8):A1202, 2004. ISSN 00134651. doi 10.1149/1.1760992.
[30] L. Gireaud, S. Grugeon, S. Laruelle, S. Pilard, and J.-M. Tarascon. Iden-tication of Li Battery Electrolyte Degradation Products Through DirectSynthesis and Characterization of Alkyl Carbonate Salts. Journal of TheElectrochemical Society, 152(5):A850, 2005. doi 10.1149/1.1872673.
[31] Guorong V. Zhuang, Kang Xu, Hui Yang, T. Richard Jow, and Philip N.Ross. Lithium Ethylene Dicarbonate Identied as the Primary Product ofChemical and Electrochemical Reduction of EC in 1.2 M LiPF 6 /EC:EMCElectrolyte. The Journal of Physical Chemistry B, 109(37):1756717573,sep 2005. ISSN 1520-6106. doi 10.1021/jp052474w.
[32] Kang Xu, Guorong V. Zhuang, Jan L. Allen, Unchul Lee, Sheng S. Zhang,Philip N. Ross, and T. Richard Jow. Syntheses and Characterization ofLithium Alkyl Mono- and Dicarbonates as Components of Surface Films inLi-Ion Batteries. The Journal of Physical Chemistry B, 110(15):77087719,apr 2006. doi 10.1021/jp0601522.
[33] Gregory Gachot, Sylvie Grugeon, Michel Armand, Serge Pilard, PierreGuenot, Jean-Marie Tarascon, and Stephane Laruelle. Deciphering themulti-step degradation mechanisms of carbonate-based electrolyte in Libatteries. Journal of Power Sources, 178(1):409421, mar 2008. ISSN03787753. doi 10.1016/j.jpowsour.2007.11.110.
[34] S.H. Kang, D. P. Abraham, A. Xiao, and B. L. Lucht. Investi-gating the solid electrolyte interphase using binder-free graphite elec-trodes. Journal of Power Sources, 175(1):526532, jan 2008. doi10.1016/j.jpowsour.2007.08.112.
[35] Ang Xiao, Li Yang, Brett L. Lucht, Sun-Ho Kang, and Daniel P. Abra-ham. Examining the Solid Electrolyte Interphase on Binder-Free GraphiteElectrodes. Journal of The Electrochemical Society, 156(4):A318, 2009. doi10.1149/1.3078020.
[36] Mengyun Nie and Brett L. Lucht. Role of Lithium Salt on Solid Elec-trolyte Interface (SEI) Formation and Structure in Lithium Ion Batteries.Journal of The Electrochemical Society, 161(6):A1001A1006, 2014. doi10.1149/2.054406jes.
[37] Mengyun Nie, Dinesh Chalasani, Daniel P. Abraham, Yanjing Chen, Ari-jit Bose, and Brett L. Lucht. Lithium Ion Battery Graphite Solid Elec-trolyte Interphase Revealed by Microscopy and Spectroscopy. Journalof Physical Chemistry C, 117(3):12571267, 2013. ISSN 19327447. doi10.1021/jp3118055.
94
Bibliography
[38] Daniel M. Seo, Dinesh Chalasani, Bharathy S. Parimalam, Rahul Kadam,Mengyun Nie, and Brett L. Lucht. Reduction Reactions of Carbonate Sol-vents for Lithium Ion Batteries. ECS Electrochemistry Letters, 3(9):A91A93, 2014. ISSN 2162-8734. doi 10.1149/2.0021409eel.
[39] Navid Chapman, Oleg Borodin, Taeho Yoon, Cao Cuong Nguyen, andBrett L. Lucht. Spectroscopic and Density Functional Theory Character-ization of Common Lithium Salt Solvates in Carbonate Electrolytes forLithium Batteries. Journal of Physical Chemistry C, 121(4):21352148,2017. ISSN 19327455. doi 10.1021/acs.jpcc.6b12234.
[40] Elisha Goren, Orit Chusid (Youngman), and Doron Aurbach. The Appli-cation of In Situ FTIR Spectroscopy to the Study of Surface Films Formedon Lithium and Noble Metals at Low Potentials in Li Battery Electrolytes.Journal of The Electrochemical Society, 138(5):L6L9, may 1991. ISSN0013-4651. doi 10.1149/1.2085828.
[41] Doron Aurbach and Orit Chusid (Youngman). The Study of Surface FilmsFormed on Lithium and Noble Metal Electrodes in Polar Aprotic SystemsBy the Use of In Situ Fourier Transform Infrared Spectroscopy. Journal ofThe Electrochemical Society, 140(1):L1L4, jan 1993. ISSN 0013-4651. doi10.1149/1.2056119.
[42] Alex Schechter, Doron Aurbach, and Hagay Cohen. X-ray PhotoelectronSpectroscopy Study of Surface Films Formed on Li Electrodes Freshly Pre-pared in Alkyl Carbonate Solutions. Langmuir, 15(9):33343342, apr 1999.ISSN 0743-7463. doi 10.1021/la981048h.
[43] D. Bar-Tow. A Study of Highly Oriented Pyrolytic Graphite as a Modelfor the Graphite Anode in Li-Ion Batteries. Journal of The ElectrochemicalSociety, 146(3):824, 1999. ISSN 00134651. doi 10.1149/1.1391688.
[44] E. Peled, D. Bar Tow, A. Merson, A. Gladkich, L. Burstein, and D. Golod-nitsky. Composition, depth proles and lateral distribution of materi-als in the SEI built on HOPG-TOF SIMS and XPS studies. Journal ofPower Sources, 97-98:5257, jul 2001. ISSN 03787753. doi 10.1016/S0378-7753(01)00505-5.
[45] A. M. Andersson, D. P. Abraham, R. Haasch, S. MacLaren, J. Liu,and K. Amine. Surface Characterization of Electrodes from High PowerLithium-Ion Batteries. Journal of The Electrochemical Society, 149(10):A1358, 2002. ISSN 00134651. doi 10.1149/1.1505636.
[46] E. Peled, D. Golodnitsky, A. Ulus, and V. Yut. Eect of carbon substrateon SEI composition and morphology. Electrochimica Acta, 50(2-3 SPEC.ISS.):391395, 2004. doi 10.1016/j.electacta.2004.01.130.
[47] Peng Lu, Chen Li, Eric W. Schneider, and Stephen J. Harris. Chemistry,impedance, and morphology evolution in solid electrolyte interphase lmsduring formation in lithium ion batteries. Journal of Physical ChemistryC, 118(2):896903, 2014. ISSN 19327447. doi 10.1021/jp4111019.
95
Bibliography
[48] Jihyun Kim, Isabella Weber, Florian Buchner, Johannes Schnaidt, andR. Jürgen Behm. Surface chemistry and electrochemistry of an ionic liquidand lithium on Li4Ti5O12(111) - A model study of the anode|electrolyteinterface. Journal of Chemical Physics, 151(13), 2019. ISSN 00219606. doi10.1063/1.5119765.
[49] Gholamabbas Nazri and Rolf H. Muller. In Situ X-Ray Diraction of Sur-face Layers on Lithium in Nonaqueous Electrolyte. Journal of The Electro-chemical Society, 132(6):13851387, jun 1985. doi 10.1149/1.2114128.
[50] Ping Liu, John Wang, Jocelyn Hicks-Garner, Elena Sherman, Souren Souki-azian, Mark Verbrugge, Harshad Tataria, James Musser, and Peter Fi-namore. Aging Mechanisms of LiFePO4 Batteries Deduced by Electro-chemical and Structural Analyses. Journal of The Electrochemical Society,157:A499, 2010. doi 10.1149/1.3294790.
[51] Robert Kostecki and Frank McLarnon. Microprobe study of the eect ofLi intercalation on the structure of graphite. Journal of Power Sources,119-121:550554, 2003. doi 10.1016/S0378-7753(03)00287-8.
[52] Kang Xu, Yiufai Lam, Sheng S. Zhang, T. Richard Jow, and Timothy B.Curtis. Solvation Sheath of Li+ in Nonaqueous Electrolytes and Its Implica-tion of Graphite/Electrolyte Interface Chemistry. The Journal of PhysicalChemistry C, 111(20):74117421, may 2007. doi 10.1021/jp068691u.
[53] Alison L. Michan, Michal Leskes, and Clare P. Grey. Voltage DependentSolid Electrolyte Interphase Formation in Silicon Electrodes: Monitoringthe Formation of Organic Decomposition Products. Chemistry of Materials,28(1):385398, jan 2016. doi 10.1021/acs.chemmater.5b04408.
[54] Yanting Jin, Nis Julian H. Kneusels, Pieter C.M.M. Magusin, Gunwoo Kim,Elizabeth Castillo-Martínez, Lauren E. Marbella, Rachel N. Kerber, Dun-can J. Howe, Subhradip Paul, Tao Liu, and Clare P. Grey. Identifyingthe Structural Basis for the Increased Stability of the Solid Electrolyte In-terphase Formed on Silicon with the Additive Fluoroethylene Carbonate.Journal of the American Chemical Society, 139(42):1499215004, 2017. doi10.1021/jacs.7b06834.
[55] Stephen J. Harris and Peng Lu. Eects of InhomogeneitiesNanoscale toMesoscaleon the Durability of Li-Ion Batteries. The Journal of PhysicalChemistry C, 117(13):64816492, apr 2013. doi 10.1021/jp311431z.
[56] Doron Aurbach and Arie Zaban. Impedance spectroscopy of lithium elec-trodes. Journal of Electroanalytical Chemistry, 348(1-2):155179, apr 1993.ISSN 15726657. doi 10.1016/0022-0728(93)80129-6.
[57] Maureen Tang and John Newman. Transient Characterization of Solid-Electrolyte-Interphase Using Ferrocene. Journal of The ElectrochemicalSociety, 159(3):A281, jan 2012. ISSN 0013-4651. doi 10.1149/2.073203jes.
96
Bibliography
[58] R. Petibon, C. P. Aiken, L. Ma, D. Xiong, and J. R. Dahn. Theuse of ethyl acetate as a sole solvent in highly concentrated electrolytefor Li-ion batteries. Electrochimica Acta, 154:287293, feb 2015. doi10.1016/j.electacta.2014.12.093.
[59] Qinglin Zhang, Jie Pan, Peng Lu, Zhongyi Liu, Mark W. Verbrugge,Brian W. Sheldon, Yang Tse Cheng, Yue Qi, and Xingcheng Xiao. Syn-ergetic Eects of Inorganic Components in Solid Electrolyte Interphase onHigh Cycle Eciency of Lithium Ion Batteries. Nano Letters, 16(3):20112016, 2016. doi 10.1021/acs.nanolett.5b05283.
[60] Miriam Steinhauer, Sebastian Risse, Norbert Wagner, and K. AndreasFriedrich. Investigation of the Solid Electrolyte Interphase Formation atGraphite Anodes in Lithium-Ion Batteries with Electrochemical ImpedanceSpectroscopy. Electrochimica Acta, 228:652658, 2017. ISSN 00134686. doi10.1016/j.electacta.2017.01.128.
[61] J. Shim, R. Kostecki, T. Richardson, X. Song, and K. A. Striebel. Electro-chemical analysis for cycle performance and capacity fading of a lithium-ionbattery cycled at elevated temperature. Journal of Power Sources, 112(1):222230, 2002. ISSN 03787753. doi 10.1016/S0378-7753(02)00363-4.
[62] Nam Soon Choi, Kyoung Han Yew, Kyu Youl Lee, Minseok Sung, Ho Kim,and Sung Soo Kim. Eect of uoroethylene carbonate additive on interfacialproperties of silicon thin-lm electrode. Journal of Power Sources, 161(2):12541259, 2006. doi 10.1016/j.jpowsour.2006.05.049.
[63] Robert L. Sacci, Jennifer M. Black, Nina Balke, Nancy J. Dudney, Kar-ren L. More, and Raymond R. Unocic. Nanoscale imaging of fundamentalLi battery chemistry: Solid-electrolyte interphase formation and preferen-tial growth of lithium metal nanoclusters. Nano Letters, 15(3):20112018,2015. doi 10.1021/nl5048626.
[64] Doron Aurbach and Yair Cohen. The Application of Atomic Force Mi-croscopy for the Study of Li Deposition Processes. Journal of The Electro-chemical Society, 143(11):35253532, nov 1996. doi 10.1149/1.1837248.
[65] Miriam Steinhauer, Michael Stich, Mario Kurniawan, Beatrix-Kamelia Sei-dlhofer, Marcus Trapp, Andreas Bund, Norbert Wagner, and K. AndreasFriedrich. In Situ Studies of Solid Electrolyte Interphase (SEI) Forma-tion on Crystalline Carbon Surfaces by Neutron Reectometry and AtomicForce Microscopy. ACS Applied Materials & Interfaces, 9:3579435801,2017. ISSN 1944-8244. doi 10.1021/acsami.7b09181.
[66] Bastian Krueger, Luis Balboa, Jan Frederik Dohmann, Martin Winter, Pe-ter Bieker, and Gunther Wittstock. Solid Electrolyte Interphase Evolu-tion on Lithium Metal Electrodes Followed by Scanning ElectrochemicalMicroscopy Under Realistic Battery Cycling Current Densities. ChemElec-troChem, pages 18, 2020. doi 10.1002/celc.202000441.
97
Bibliography
[67] Jeanette E. Owejan, Jon P. Owejan, Steven C. DeCaluwe, and Joseph A.Dura. Solid Electrolyte Interphase in Li-Ion Batteries: Evolving StructuresMeasured In situ by Neutron Reectometry. Chemistry of Materials, 24(11):21332140, jun 2012. doi 10.1021/cm3006887.
[68] T. M. Fears, M. Doucet, J. F. Browning, J. K. S. Baldwin, J. G. Winiarz,H. Kaiser, H. Taub, R. L. Sacci, and G. M. Veith. Evaluating the solidelectrolyte interphase formed on silicon electrodes: a comparison of exsitu X-ray photoelectron spectroscopy and in situ neutron reectometry.Physical Chemistry Chemical Physics, 18(20):13927ö13940, 2016. doi10.1039/C6CP00978F.
[69] Hiroyuki Kawaura, Masashi Harada, Yasuhito Kondo, Hiroki Kondo, Yoshi-take Suganuma, Naoko Takahashi, Jun Sugiyama, Yoshiki Seno, and Nori-fumi L. Yamada. Operando Measurement of Solid Electrolyte InterphaseFormation at Working Electrode of Li-Ion Battery by Time-Slicing NeutronReectometry. ACS Applied Materials and Interfaces, 8(15):95409544,2016. ISSN 19448252. doi 10.1021/acsami.6b01170.
[70] Paul G. Kitz, Petr Novák, and Erik J. Berg. Inuence of Water Con-tamination on the SEI Formation in Li-Ion Cells: An Operando EQCM-DStudy. ACS Applied Materials & Interfaces, 2020. ISSN 1944-8244. doi10.1021/acsami.0c01642.
[71] Masamichi Onuki, Shinichi Kinoshita, Yuuichi Sakata, Miwa Yanagi-date, Yumiko Otake, Makoto Ue, and Masaki Deguchi. Identicationof the Source of Evolved Gas in Li-Ion Batteries Using 13C-labeled Sol-vents. Journal of The Electrochemical Society, 155(11):A794, 2008. doi10.1149/1.2969947.
[72] Rebecca Bernhard, Michael Metzger, and Hubert A. Gasteiger. Gas Evolu-tion at Graphite Anodes Depending on Electrolyte Water Content and SEIQuality Studied by On-Line Electrochemical Mass Spectrometry. Journal ofThe Electrochemical Society, 162(10):A1984A1989, 2015. ISSN 0013-4651.doi 10.1149/2.0191510jes.
[73] K. Uta Schwenke, Sophie Solchenbach, Julien Demeaux, Brett L. Lucht,and Hubert A. Gasteiger. The Impact of CO 2 Evolved from VC andFEC during Formation of Graphite Anodes in Lithium-Ion Batteries .Journal of The Electrochemical Society, 166(10):A2035A2047, 2019. doi10.1149/2.0821910jes.
[74] Anna T.S. Freiberg, Johannes Sicklinger, Sophie Solchenbach, and Hu-bert A. Gasteiger. Li2CO3 decomposition in Li-ion batteries inducedby the electrochemical oxidation of the electrolyte and of electrolyte im-purities. Electrochimica Acta, 346:136271, 2020. ISSN 00134686. doi10.1016/j.electacta.2020.136271.
[75] Alison L. Michan, Bharathy S. Parimalam, Michal Leskes, Rachel N. Ker-ber, Taeho Yoon, Clare P. Grey, and Brett L. Lucht. Fluoroethylene
98
Bibliography
carbonate and vinylene carbonate reduction: Understanding lithium-ionbattery electrolyte additives and solid electrolyte interphase formation.Chemistry of Materials, 28(22):81498159, 2016. ISSN 15205002. doi10.1021/acs.chemmater.6b02282.
[76] Maureen Tang and John Newman. Electrochemical Characterization of SEI-Type Passivating Films Using Redox Shuttles. Journal of The Electrochem-ical Society, 158(5):A530, 2011. ISSN 00134651. doi 10.1149/1.3567765.
[77] M. Tang and J. Newman. Why is the Solid-Electrolyte-Interphase Selec-tive? Through-Film Ferrocenium Reduction on Highly Oriented PyrolyticGraphite. Journal of the Electrochemical Society, 159(12):A1922A1927,oct 2012. doi 10.1149/2.028212jes.
[78] E. Peled. The Electrochemical Behavior of Alkali and Alkaline Earth Metalsin Nonaqueous Battery SystemsThe Solid Electrolyte Interphase Model.Journal of The Electrochemical Society, 126(12):2047, 1979. ISSN 00134651.doi 10.1149/1.2128859.
[79] A. Meitav and E. Peled. Solid electrolyte interphase (SEI) electrode. Jour-nal of Electroanalytical Chemistry and Interfacial Electrochemistry, 134(1):4963, mar 1982. ISSN 00220728. doi 10.1016/S0022-0728(82)85026-2.
[80] A. Meitav and E. Peled. Solid Electrolyte Interphase (SEI) Electrode II. TheFormation and Properties of the SEI on Magnesium in SOCI2-Mg(AICI)4)2Solutions. Journal of The Electrochemical Society, 128(4):825, 1981. doi10.1149/1.2127512.
[81] A. Meitav and E. Peled. Solid electrolyte interphase (SEI) electrode-V. theformation and properties of the solid electrolyte interphase on calcium inthionyl chloride solutions. Electrochimica Acta, 33(8):11111121, 1988. doi10.1016/0013-4686(88)80202-0.
[82] R. Selim and P. Bro. Some Observations on Rechargeable Lithium Elec-trodes in a Propylene Carbonate Electrolyte. Journal of The Electrochem-ical Society, 121(11):1457, 1974. doi 10.1149/1.2401708.
[83] R Yazami and Ph Touzain. A reversible graphite-lithium negative electrodefor electrochemical generators. Journal of Power Sources, 9(3):365371, jan1983. ISSN 03787753. doi 10.1016/0378-7753(83)87040-2.
[84] Y. Takada, R. Fujii, and K. Matsuo. On the Graphite IntercalationCompound Prepared Electrochemically in LiClO4-Propylene CarbonateElectrolyte. TANSO, 1983(114):120123, 1983. ISSN 1884-5495. doi10.7209/tanso.1983.120.
[85] Rosamaría Fong, Ulrich von Sacken, and J. R. Dahn. Studies of LithiumIntercalation into Carbons Using Nonaqueous Electrochemical Cells. Jour-nal of The Electrochemical Society, 137(7):20092013, jul 1990. doi10.1149/1.2086855.
99
Bibliography
[86] Ji-Guang Zhang, Wu Xu, and Wesley A Henderson. Lithium Metal Anodesand Rechargeable Lithium Metal Batteries, volume 249 of Springer Seriesin Materials Science. Springer International Publishing, Cham, 2017. ISBN978-3-319-44053-8. doi 10.1007/978-3-319-44054-5.
[87] Doron Aurbach, Yair Ein-Eli, Boris Markovsky, Arie Zaban, S. Luski,Y. Carmeli, and H. Yamin. The Study of Electrolyte Solutions Based onEthylene and Diethyl Carbonates for Rechargeable Li Batteries: II . Gra-phite Electrodes. Journal of The Electrochemical Society, 142(9):28822890,sep 1995. doi 10.1149/1.2048659.
[88] Doron Aurbach and Orit Chusid (Youngman). In situ FTIR Spectroelectro-chemical Studies of Surface Films Formed on Li and Nonactive Electrodesat Low Potentials in Li Salt Solutions Containing CO 2. Journal of TheElectrochemical Society, 140(11):L155L157, nov 1993. ISSN 0013-4651. doi10.1149/1.2221034.
[89] Doron Aurbach, Yosef Gofer, Moshe Ben-Zion, and Pinchas Aped. Thebehaviour of lithium electrodes in propylene and ethylene carbonate: Temajor factors that inuence Li cycling eciency. Journal of Electroanalyt-ical Chemistry, 339(1-2):451471, 1992. ISSN 00220728. doi 10.1016/0022-0728(92)80467-I.
[90] Doron Aurbach. Identication of Surface Films Formed on Lithium Sur-faces in γ-Butyrolactone Solutions: I . Uncontaminated Solutions. Jour-nal of The Electrochemical Society, 136(6):16061610, jun 1989. doi10.1149/1.2096977.
[91] F.P. Dousek, J. Jansta, and J. íha. Electrochemical systems for galvaniccells in organic aprotic solvents. Journal of Electroanalytical Chemistry andInterfacial Electrochemistry, 46(2):281287, sep 1973. ISSN 00220728. doi10.1016/S0022-0728(73)80136-6.
[92] Yixuan Wang, Shinichiro Nakamura, Makoto Ue, and Perla B. Balbuena.Theoretical Studies To Understand Surface Chemistry on Carbon Anodesfor Lithium-Ion Batteries: Reduction Mechanisms of Ethylene Carbonate.Journal of the American Chemical Society, 123(47):1170811718, nov 2001.doi 10.1021/ja0164529.
[93] YixuanWang and Perla B. Balbuena. Theoretical insights into the reductivedecompositions of propylene carbonate and vinylene carbonate: Densityfunctional theory studies. Journal of Physical Chemistry B, 106(17):44864495, 2002. doi 10.1021/jp014371t.
[94] Yixuan Wang and Perla B. Balbuena. Theoretical studies on cosolvation ofLi ion and solvent reductive decomposition in binary mixtures of aliphaticcarbonates. International Journal of Quantum Chemistry, 102:724733,2005. ISSN 00207608. doi 10.1002/qua.20466.
100
Bibliography
[95] Ken Tasaki. Solvent decompositions and physical properties of decomposi-tion compounds in Li-ion battery electrolytes studied by DFT calculationsand molecular dynamics simulations. Journal of Physical Chemistry B, 109(Vc):29202933, 2005. ISSN 15206106. doi 10.1021/jp047240b.
[96] I. Epelboin, M. Froment, M. Garreau, J. Thevenin, and D. Warin. Behav-ior of Secondary Lithium and Aluminum-Lithium Electrodes in PropyleneCarbonate. Journal of The Electrochemical Society, 127(10):21002104, oct1980. doi 10.1149/1.2129354.
[97] Kang Xu. Whether EC and PC Dier in Interphasial Chemistry onGraphitic Anode and How. Journal of The Electrochemical Society, 156(9):751755, 2009. doi 10.1149/1.3166182.
[98] Oleg Borodin, Marco Olguin, Panchapakesan Ganesh, Paul R. C. Kent,Joshua L. Allen, and Wesley a. Henderson. Competitive lithium solvation oflinear and cyclic carbonates from quantum chemistry. Phys. Chem. Chem.Phys., 18(1):164175, 2016. doi 10.1039/C5CP05121E.
[99] Kang Xu, Sheng S. Zhang, Unchul Lee, Jan L. Allen, and T. Richard Jow.LiBOB: Is it an alternative salt for lithium ion chemistry? Journal of PowerSources, 146(1-2):7985, 2005. doi 10.1016/j.jpowsour.2005.03.153.
[100] Zonghai Chen, W. Q. Lu, J. Liu, and K. Amine. LiPF6/LiBOB blend saltelectrolyte for high-power lithium-ion batteries. Electrochimica Acta, 51(16):33223326, 2006. doi 10.1016/j.electacta.2005.09.027.
[101] Ken Tasaki, Katsuya Kanda, Shinichiro Nakamura, and Makoto Ue.Decomposition of LiPF6 and Stability of PF6 in Li-Ion Battery Elec-trolytes. Journal of The Electrochemical Society, 150(12):A1628, 2003. ISSN00134651. doi 10.1149/1.1622406.
[102] Tetsuya Kawamura, Takaaki Sonoda, Shigeto Okada, and Jun-ichi Ya-maki. Improvement of the Stability of LiPF6 Electrolytes toward Waterby the Addition of LiCl. Electrochemistry, 71(12):11391141, dec 2003. doi10.5796/electrochemistry.71.1139.
[103] Andriy V. Plakhotnyk, Ludger Ernst, and Reinhard Schmutzler. Hydrolysisin the system LiPF 6 - Propylene carbonate - Dimethyl carbonate - H 2O.Journal of Fluorine Chemistry, 126(1):2731, 2005. ISSN 00221139. doi10.1016/j.juchem.2004.09.027.
[104] Christopher L. Campion, Wentao Li, and Brett L. Lucht. Thermal Decom-position of LiPF6-Based Electrolytes for Lithium-Ion Batteries. Journal ofThe Electrochemical Society, 152(12):A2327, 2005. doi 10.1149/1.2083267.
[105] Seong Jin An, Jianlin Li, Claus Daniel, Debasish Mohanty, Shrikant Nag-pure, and David L. Wood. The state of understanding of the lithium-ion-battery graphite solid electrolyte interphase (SEI) and its relationshipto formation cycling. Carbon, 105:5276, aug 2016. ISSN 00086223. doi10.1016/j.carbon.2016.04.008.
101
Bibliography
[106] S. F. Lux, I. T. Lucas, E. Pollak, S. Passerini, M. Winter, and R. Kostecki.The mechanism of HF formation in LiPF6 based organic carbonate elec-trolytes. Electrochemistry Communications, 14(1):4750, 2012. ISSN13882481. doi 10.1016/j.elecom.2011.10.026.
[107] Daniel M. Seo, Oleg Borodin, Sang-Don Han, Quang Ly, Paul D. Boyle, andWesley A. Henderson. Electrolyte Solvation and Ionic Association. Journalof The Electrochemical Society, 159(5):A553, 2012. ISSN 00134651. doi10.1149/2.jes112264.
[108] Jianhui Wang, Yuki Yamada, Keitaro Sodeyama, Ching Hua Chiang, Yoshi-taka Tateyama, and Atsuo Yamada. Superconcentrated electrolytes fora high-voltage lithium-ion battery. Nature Communications, 7(May):19,2016. doi 10.1038/ncomms12032.
[109] Yuki Yamada. Developing new functionalities of superconcentrated elec-trolytes for lithium-ion batteries. Electrochemistry, 85(9):559565, 2017.doi 10.5796/electrochemistry.85.559.
[110] Yuki Yamada, Jianhui Wang, Seongjae Ko, Eriko Watanabe, and AtsuoYamada. Advances and issues in developing salt-concentrated batteryelectrolytes. Nature Energy, 4(4):269280, 2019. ISSN 20587546. doi10.1038/s41560-019-0336-z.
[111] Mengyun Nie, Daniel P. Abraham, Yanjing Chen, Arijit Bose, and Brett L.Lucht. Silicon Solid Electrolyte Interphase (SEI) of Lithium Ion BatteryCharacterized by Microscopy and Spectroscopy. The Journal of Physi-cal Chemistry C, 117(26):1340313412, jul 2013. ISSN 1932-7447. doi10.1021/jp404155y.
[112] Oleg Borodin, Marco Olguin, Carrie E. Spear, Kenneth W. Leiter, andJaroslaw Knap. Towards high throughput screening of electrochemical sta-bility of battery electrolytes. Nanotechnology, 26(35):354003, sep 2015. doi10.1088/0957-4484/26/35/354003.
[113] M. R. Wagner, P. R. Raimann, A. Trifonova, K. C. Moeller, J. O. Besen-hard, and M. Winter. Electrolyte Decomposition Reactions on Tin- andGraphite-Based Anodes are Dierent. Electrochemical and Solid-State Let-ters, 7(7):A201, 2004. ISSN 10990062. doi 10.1149/1.1739312.
[114] Peng Lu and Stephen J. Harris. Lithium Transport Within the Solid Elec-trolyte Interphase. Electrochemistry Communications, 13(10):10351037,2011. doi 10.1016/j.elecom.2011.06.026.
[115] Peter M. Attia, Supratim Das, Stephen J. Harris, Martin Z. Bazant, andWilliam C. Chueh. Electrochemical Kinetics of SEI Growth on CarbonBlack: Part I. Experiments. Journal of The Electrochemical Society, 166(4):E97E106, feb 2019. ISSN 0013-4651. doi 10.1149/2.0231904jes.
102
Bibliography
[116] A. J. Smith, J. C. Burns, Xuemei Zhao, Deijun Xiong, and J. R. Dahn. AHigh Precision Coulometry Study of the SEI Growth in Li/Graphite Cells.Journal of The Electrochemical Society, 158(5):A447, 2011. ISSN 00134651.doi 10.1149/1.3557892.
[117] P. Ganesh, P. R C Kent, and De-en Jiang. SolidElectrolyte InterphaseFormation and Electrolyte Reduction at Li-Ion Battery Graphite Anodes:Insights from First-Principles Molecular Dynamics. The Journal of PhysicalChemistry C, 116(46):2447624481, nov 2012. doi 10.1021/jp3086304.
[118] Matthew B. Pinson and Martin Z. Bazant. Theory of SEI Formation inRechargeable Batteries: Capacity Fade, Accelerated Aging and LifetimePrediction. Journal of The Electrochemical Society, 160(2):A243A250, dec2013. doi 10.1149/2.044302jes.
[119] F. A. Soto, J. M. Martinez de la Hoz, J. M. Seminario, and P. B. Bal-buena. Modeling solid-electrolyte interfacial phenomena in silicon anodes.Current Opinion in Chemical Engineering, 13:179185, aug 2016. doi10.1016/j.coche.2016.08.017.
[120] Yunsong Li, Kevin Leung, and Yue Qi. Computational Exploration of theLi-Electrode|Electrolyte Interface in the Presence of a Nanometer ThickSolid-Electrolyte Interphase Layer. Accounts of Chemical Research, 49(10):23632370, 2016. doi 10.1021/acs.accounts.6b00363.
[121] Oleg Borodin, Xiaoming Ren, Jenel Vatamanu, Arthur Von Wald Cresce,Jaroslaw Knap, and Kang Xu. Modeling Insight into Battery ElectrolyteElectrochemical Stability and Interfacial Structure. Accounts of ChemicalResearch, 50(12):28862894, 2017. doi 10.1021/acs.accounts.7b00486.
[122] Masaki Okoshi, Chien Pin Chou, and Hiromi Nakai. Theoretical Analy-sis of Carrier Ion Diusion in Superconcentrated Electrolyte Solutions forSodium-Ion Batteries. Journal of Physical Chemistry B, 122(9):26002609,2018. ISSN 15205207. doi 10.1021/acs.jpcb.7b10589.
[123] Julibeth M. Martinez De La Hoz, Fernando A. Soto, and Perla B. Balbuena.Eect of the electrolyte composition on SEI reactions at Si anodes of Li Ionbatteries. Journal of Physical Chemistry C, 119(13):70607068, 2015. doi10.1021/acs.jpcc.5b01228.
[124] Siqi Shi, Yue Qi, Hong Li, and Louis G. Hector. Defect thermodynamics anddiusion mechanisms in Li2CO 3 and implications for the solid electrolyteinterphase in Li-ion batteries. Journal of Physical Chemistry C, 117(17):85798593, 2013. doi 10.1021/jp310591u.
[125] Oleg Borodin, Guorong V. Zhuang, Philip N Ross, and Kang Xu. MolecularDynamics Simulations and Experimental Study of Lithium Ion Transportin Dilithium Ethylene Dicarbonate. The Journal of Physical Chemistry C,117(15):74337444, apr 2013. doi 10.1021/jp4000494.
103
Bibliography
[126] Dmitry Bedrov, Oleg Borodin, and Justin B. Hooper. Li Transport andMechanical Properties of Model Solid Electrolyte Interphases (SEI): Insightfrom Atomistic Molecular Dynamics Simulations. The Journal of PhysicalChemistry C, 121(30):1609816109, 2017. doi 10.1021/acs.jpcc.7b04247.
[127] Laura Benitez and Jorge M. Seminario. Ion Diusivity through the SolidElectrolyte Interphase in Lithium-Ion Batteries. Journal of The Elec-trochemical Society, 164(11):E3159E3170, 2017. ISSN 0013-4651. doi10.1149/2.0181711jes.
[128] Yu-Xiao Lin, Zhe Liu, Kevin Leung, Long-Qing Chen, Peng Lu, and YueQi. Connecting the irreversible capacity loss in Li-ion batteries with theelectronic insulating properties of solid electrolyte interphase (SEI) compo-nents. Journal of Power Sources, 309:221230, mar 2016. ISSN 03787753.doi 10.1016/j.jpowsour.2016.01.078.
[129] D. Li, D. Danilov, Z. Zhang, H. Chen, Y. Yang, and P. H. L. Notten.Modeling the SEI-Formation on Graphite Electrodes in LiFePO4 Batter-ies. Journal of the Electrochemical Society, 162(6):A858A869, 2015. doi10.1149/2.0161506jes.
[130] Jiamei Yu, Perla B. Balbuena, Joanne Budzien, and Kevin Leung. HybridDFT Functional-Based Static and Molecular Dynamics Studies of ExcessElectron in Liquid Ethylene Carbonate. Journal of The ElectrochemicalSociety, 158(4):A400, 2011. doi 10.1149/1.3545977.
[131] Kevin Leung. Two-electron reduction of ethylene carbonate: A quantumchemistry re-examination of mechanisms. Chemical Physics Letters, 568-569:18, 2013. ISSN 00092614. doi 10.1016/j.cplett.2012.08.022.
[132] Kevin Leung, Yue Qi, Kevin R. Zavadil, Yoon Seok Jung, Anne C. Dillon,Andrew S. Cavanagh, Se-Hee Lee, and Steven M. George. Using AtomicLayer Deposition to Hinder Solvent Decomposition in Lithium Ion Batter-ies: First-Principles Modeling and Experimental Studies. Journal of theAmerican Chemical Society, 133(37):1474114754, sep 2011. ISSN 0002-7863. doi 10.1021/ja205119g.
[133] Kevin Leung, Susan B. Rempe, Michael E. Foster, Yuguang Ma, Juli-beth M. Martinez del la Hoz, Na Sai, and Perla B. Balbuena. Model-ing Electrochemical Decomposition of Fluoroethylene Carbonate on SiliconAnode Surfaces in Lithium Ion Batteries. Journal of The ElectrochemicalSociety, 161(3):A213A221, 2014. doi 10.1149/2.092401jes.
[134] Kevin Leung, Fernando A. Soto, Kie Hankins, Perla B. Balbuena, andKatharine L. Harrison. Stability of Solid Electrolyte Interphase Compo-nents on LithiumMetal and Reactive Anode Material Surfaces. The Journalof Physical Chemistry C, 120(12):63026313, mar 2016. ISSN 1932-7447.doi 10.1021/acs.jpcc.5b11719.
104
Bibliography
[135] Kevin Leung. Predicting the voltage dependence of interfacial electrochem-ical processes at lithium-intercalated graphite edge planes. Physical Chem-istry Chemical Physics, 17(3):16371643, 2015. doi 10.1039/c4cp04494k.
[136] Oleg Borodin and Dmitry Bedrov. Interfacial Structure and Dynamicsof the Lithium Alkyl Dicarbonate SEI Components in Contact with theLithium Battery Electrolyte. The Journal of Physical Chemistry C, 118:1836218371, 2014. doi 10.1021/jp504598n.
[137] Keitaro Sodeyama, Yuki Yamada, Koharu Aikawa, Atsuo Yamada, andYoshitaka Tateyama. Sacricial anion reduction mechanism for elec-trochemical stability improvement in highly concentrated Li-salt elec-trolyte. Journal of Physical Chemistry C, 118(26):1409114097, 2014. ISSN19327455. doi 10.1021/jp501178n.
[138] Keisuke Ushirogata, Keitaro Sodeyama, Zdenek Futera, YoshitakaTateyama, and Yukihiro Okuno. Near-Shore Aggregation Mechanism ofElectrolyte Decomposition Products to Explain Solid Electrolyte InterphaseFormation. Journal of The Electrochemical Society, 162(14):A2670A2678,2015. doi 10.1149/2.0301514jes.
[139] Fernando A. Soto, Yuguang Ma, Julibeth M. Martinez de la Hoz, Jorge M.Seminario, and Perla B. Balbuena. Formation and Growth Mecha-nisms of Solid-Electrolyte Interphase Layers in Rechargeable Batteries.Chemistry of Materials, 27(23):79908000, 2015. ISSN 15205002. doi10.1021/acs.chemmater.5b03358.
[140] Martin Korth. Large-scale virtual high-throughput screening for the identi-cation of new battery electrolyte solvents: Evaluation of electronic struc-ture theory methods. Physical Chemistry Chemical Physics, 16(17):79197926, 2014. doi 10.1039/c4cp00547c.
[141] Tamara Husch, Nusret Duygu Yilmazer, Andrea Balducci, and Martin Ko-rth. Large-scale virtual high-throughput screening for the identication ofnew battery electrolyte solvents: Computing infrastructure and collectiveproperties. Physical Chemistry Chemical Physics, 17(5):33943401, 2015.doi 10.1039/c4cp04338c.
[142] Lei Cheng, Rajeev S. Assary, Xiaohui Qu, Anubhav Jain, Shyue Ping Ong,Nav Nidhi Rajput, Kristin Persson, and Larry A. Curtiss. AcceleratingElectrolyte Discovery for Energy Storage with High-Throughput Screening.Journal of Physical Chemistry Letters, 6(2):283291, 2015. ISSN 19487185.doi 10.1021/jz502319n.
[143] M. Broussely, S. Herreyre, P. Biensan, P. Kasztejna, K. Nechev, and R.J.Staniewicz. Aging mechanism in Li ion cells and calendar life predictions.Journal of Power Sources, 97-98:1321, jul 2001. ISSN 03787753. doi10.1016/S0378-7753(01)00722-4.
105
Bibliography
[144] Harry J. Ploehn, Premanand Ramadass, and Ralph E. White. Sol-vent Diusion Model for Aging of Lithium-Ion Battery Cells. Journalof The Electrochemical Society, 151(3):A456, 2004. ISSN 00134651. doi10.1149/1.1644601.
[145] M. Broussely, Ph Biensan, F. Bonhomme, Ph Blanchard, S. Herreyre,K. Nechev, and R.J. Staniewicz. Main aging mechanisms in Li ion batteries.Journal of Power Sources, 146(1-2):9096, aug 2005. ISSN 03787753. doi10.1016/j.jpowsour.2005.03.172.
[146] John Christensen and John Newman. A Mathematical Model for theLithium-Ion Negative Electrode Solid Electrolyte Interphase. Journal ofThe Electrochemical Society, 151(11):A1977, 2004. ISSN 00134651. doi10.1149/1.1804812.
[147] Andrew M. Colclasure, Kandler A. Smith, and Robert J. Kee. Model-ing detailed chemistry and transport for solid-electrolyte-interface (SEI)lms in Liion batteries. Electrochimica Acta, 58:3343, dec 2011. doi10.1016/j.electacta.2011.08.067.
[148] Fabian Single, Birger Horstmann, and Arnulf Latz. Dynamics andmorphology of solid electrolyte interphase (SEI). Physical ChemistryChemical Physics, 18(27):1781017814, 2016. ISSN 1463-9076. doi10.1039/C6CP02816K.
[149] Fridolin Röder, Richard D. Braatz, and Ulrike Krewer. Multi-Scale Simu-lation of Heterogeneous Surface Film Growth Mechanisms in Lithium-IonBatteries. Journal of The Electrochemical Society, 164(11):E3335E3344,2017. ISSN 0013-4651. doi 10.1149/2.0241711jes.
[150] Fabian Single, Birger Horstmann, and Arnulf Latz. Revealing SEI Mor-phology: In-Depth Analysis of a Modeling Approach. Journal of TheElectrochemical Society, 164(11):E3132E3145, 2017. ISSN 0013-4651. doi10.1149/2.0121711jes.
[151] Fabian Single, Arnulf Latz, and Birger Horstmann. Identifying theMechanism of Continued Growth of the SolidElectrolyte Interphase.ChemSusChem, 11(12):19501955, jun 2018. ISSN 1864-5631. doi10.1002/cssc.201800077.
[152] Supratim Das, Peter M. Attia, William C. Chueh, and Martin Z. Bazant.Electrochemical Kinetics of SEI Growth on Carbon Black: Part II. Model-ing. Journal of The Electrochemical Society, 166(4):E107E118, feb 2019.ISSN 0013-4651. doi 10.1149/2.0241904jes.
[153] Lars von Kolzenberg, Arnulf Latz, and Birger Horstmann. Solid-ElectrolyteInterphase During Battery Cycling: Theory of Growth Regimes. pages 111, apr 2020. doi 10.1002/cssc.202000867.
106
Bibliography
[154] A. A. Tahmasbi, T. Kadyk, and M. H. Eikerling. Statistical Physics-BasedModel of Solid Electrolyte Interphase Growth in Lithium Ion Batteries.Journal of The Electrochemical Society, 164(6):A1307A1313, 2017. ISSN0013-4651. doi 10.1149/2.1581706jes.
[155] Feng Hao, Zhixiao Liu, Perla B. Balbuena, and Partha P. Mukherjee.Mesoscale Elucidation of Solid Electrolyte Interphase Layer Formation inLi-Ion Battery Anode. The Journal of Physical Chemistry C, 121(47):2623326240, nov 2017. doi 10.1021/acs.jpcc.7b09465.
[156] Masatomo Tanaka, Justin B. Hooper, and Dmitry Bedrov. Role of Plasticityin Mechanical Failure of Solid Electrolyte Interphases on NanostructuredSilicon Electrode: Insight from Continuum Level Modeling. ACS AppliedEnergy Materials, 1(5):18581863, 2018. doi 10.1021/acsaem.8b00344.
[157] Tobias Schmitt. Degradation Models and Simulation Tools for Lithium andZinc Batteries. PhD thesis, Ulm University, 2019.
[158] Fridolin Röder, Richard D. Braatz, and Ulrike Krewer. Multi-scale modelingof solid electrolyte interface formation in lithium-ion batteries. In ComputerAided Chemical Engineering, volume 38, pages 157162. Elsevier, 2016. doi10.1016/B978-0-444-63428-3.50031-X.
[159] John Newman and Karen E. Thomas-Alyea. Electrochemical Systems. JohnWiley & Sons, 2012. ISBN 978-0-471-47756-3.
[160] Max Schammer, Birger Horstmann, and Arnulf Latz. Theory of Transportin Highly Concentrated Electrolytes. pages 116, oct 2020. URL http:
//arxiv.org/abs/2010.14915.
[161] Max Planck. Ueber die Erregung von Electricität und Wärme in Elec-trolyten. Annalen der Physik und Chemie, 275(2):161186, 1890. ISSN00033804. doi 10.1002/andp.18902750202.
[162] Charles Kittel. Elementary statistical physics. Courier Corporation, 2004.
[163] Edmund J. F. Dickinson, Juan G. Limon-Petersen, and Richard G. Comp-ton. The electroneutrality approximation in electrochemistry. Jour-nal of Solid State Electrochemistry, 15(7-8):13351345, jul 2011. doi10.1007/s10008-011-1323-x.
[164] Martin Z. Bazant. Theory of Chemical Kinetics and Charge Transfer basedon Nonequilibrium Thermodynamics. Accounts of Chemical Research, 46(5):11441160, may 2013. doi 10.1021/ar300145c.
[165] Arnulf Latz and Jochen Zausch. Thermodynamic derivation of a Butler-Volmer model for intercalation in Li-ion batteries. Electrochimica Acta, 110:358362, 2013. doi 10.1016/j.electacta.2013.06.043.
[166] Yi Zeng, Raymond B. Smith, Peng Bai, and Martin Z. Bazant. Simple for-mula for Marcus-Hush-Chidsey kinetics. Journal of Electroanalytical Chem-istry, 735:7783, 2014. ISSN 15726657. doi 10.1016/j.jelechem.2014.09.038.
107
Bibliography
[167] Gerald W Recktenwald. The Control-Volume Finite-Dierence Approxi-mation to the Diusion Equation, 2014. URL http://web.cecs.pdx.edu/
~gerry/class/ME448/lecture/pdf/CVFDdiffusion2D.pdf.
[168] Kuan Hung Chen, Kevin N. Wood, Eric Kazyak, William S. Lepage, An-drew L. Davis, Adrian J. Sanchez, and Neil P. Dasgupta. Dead lithium:Mass transport eects on voltage, capacity, and failure of lithium metalanodes. Journal of Materials Chemistry A, 5(23):1167111681, 2017. doi10.1039/c7ta00371d.
[169] J. Kasnatscheew, M. Evertz, B. Streipert, R. Wagner, R. Klöpsch, B. Vort-mann, H. Hahn, S. Nowak, M. Amereller, A.-C. Gentschev, P. Lamp, andM. Winter. The truth about the 1st cycle Coulombic eciency of LiNi1/3 Co 1/3 Mn 1/3 O 2 (NCM) cathodes. Physical Chemistry ChemicalPhysics, 18(5):39563965, 2016. doi 10.1039/C5CP07718D.
[170] Florian Holtstiege, Andrea Wilken, Martin Winter, and Tobias Placke.Running out of lithium? A route to dierentiate between capacity losses andactive lithium losses in lithium-ion batteries. Physical Chemistry ChemicalPhysics, 19(38):2590525918, 2017. doi 10.1039/c7cp05405j.
[171] Claude Cohen-Tannoudji, Bernard Diu, and Franck Laloë. Quanten-mechanik. Walter de Gruyter GmbH & Co KG, 2019.
[172] Gabriel M. Veith, Mathieu Doucet, J. Kevin Baldwin, Robert L. Sacci,Tyler M. Fears, Yongqiang Wang, and James F. Browning. Direct Deter-mination of Solid-Electrolyte Interphase Thickness and Composition as aFunction of State of Charge on a Silicon Anode. The Journal of Phys-ical Chemistry C, 119(35):2033920349, sep 2015. ISSN 1932-7447. doi10.1021/acs.jpcc.5b06817.
[173] Erkmen Karaca. Modeling Growth of the Solid Electrolyte Interphase (MScthesis). Universität Ulm, 2014.
[174] Peter Keil and Andreas Jossen. Calendar Aging of NCA Lithium-Ion Bat-teries Investigated by Dierential Voltage Analysis and Coulomb Track-ing. Journal of The Electrochemical Society, 164(1):60666074, 2017. doi10.1149/2.0091701jes.
[175] Fabian Single, Birger Horstmann, and Arnulf Latz. Theory of ImpedanceSpectroscopy for Lithium Batteries. The Journal of Physical Chemistry C,123(45):2732727343, 2019. doi 10.1021/acs.jpcc.9b07389.
[176] Fabian Wohde. Charakterisierung des Ionentransportes in neuen Li-Elektrolyten und Untersuchung der Auswirkungen auf die elektrochemis-chen Eigenschaften kumulative Dissertation. Dissertation, 2016.
[177] Marc Doyle. Analysis of Transference Number Measurements Based onthe Potentiostatic Polarization of Solid Polymer Electrolytes. Journal ofThe Electrochemical Society, 142(10):3465, 1995. ISSN 00134651. doi10.1149/1.2050005.
108
Bibliography
[178] Musa Ali Cambaz, Bhaghavathi P. Vinayan, Syed Atif Pervez, Rune E.Johnsen, Holger Geÿwein, Alexander A. Guda, Yury V. Rusalev,Michael Kiarie Kinyanjui, Ute Kaiser, and Maximilian Fichtner. Suppress-ing Dissolution of Vanadium from Cation-Disordered Li(2-x)VO2F via aConcentrated Electrolyte Approach. Chemistry of Materials, 31:79417950,2019. ISSN 15205002. doi 10.1021/acs.chemmater.9b02074.
[179] Juchuan Li, Nancy J. Dudney, Jagjit Nanda, and Chengdu Liang. Articialsolid electrolyte interphase to address the electrochemical degradation of sil-icon electrodes. ACS Applied Materials and Interfaces, 6(13):1008310088,2014. doi 10.1021/am5009419.
[180] Timo Danner, Guanchen Zhu, Andreas F. Hofmann, and ArnulfLatz. Modeling of nano-structured cathodes for improved lithium-sulfur batteries. Electrochimica Acta, 184:124133, 2015. doi10.1016/j.electacta.2015.09.143.
[181] Raphael Richter, Joachim Häcker, Zhirong Zhao-karger, Timo Danner,Maximilian Fichtner, Kaspar Andreas Friedrich, and Arnulf Latz. Insightsinto self-discharge of lithium and magnesium sulfur batteries. ACS AppliedEnergy Materials, 2020. doi 10.1021/acsaem.0c01114.
[182] Johannes Stamm, Alberto Varzi, Arnulf Latz, and Birger Horstmann. Mod-eling nucleation and growth of zinc oxide during discharge of primaryzinc-air batteries. Journal of Power Sources, 360:136149, 2017. doi10.1016/j.jpowsour.2017.05.073.
[183] Simon Clark, Arnulf Latz, and Birger Horstmann. A review of model-based design tools for metal-air batteries. Batteries, 4(1):126, 2018. ISSN23130105. doi 10.3390/batteries4010005.
[184] Arnulf Latz and Jochen Zausch. Thermodynamic Consistent TransportTheory of Li-ion Batteries. Journal of Power Sources, 196(6):32963302,2011. ISSN 03787753. doi 10.1016/j.jpowsour.2010.11.088.
[185] Arnulf Latz and Jochen Zausch. Multiscale modeling of lithium ion batter-ies: Thermal aspects. Beilstein Journal of Nanotechnology, 6(1):9871007,2015. doi 10.3762/bjnano.6.102.
[186] Chu Liang, Mingxia Gao, Hongge Pan, Yongfeng Liu, and Mi Yan. Lithiumalloys and metal oxides as high-capacity anode materials for lithium-ionbatteries. Journal of Alloys and Compounds, 575:246256, 2013. ISSN09258388. doi 10.1016/j.jallcom.2013.04.001.
[187] Gebrekidan Gebresilassie Eshetu, Thomas Diemant, Maral Hekmatfar,Sylvie Grugeon, R. Jürgen Behm, Stephane Laruelle, Michel Armand, andStefano Passerini. Impact of the electrolyte salt anion on the solid elec-trolyte interphase formation in sodium ion batteries. Nano Energy, 55:327340, 2019. ISSN 22112855. doi 10.1016/j.nanoen.2018.10.040.
109
Bibliography
[188] Magdalena Mandl, Julian Becherer, Dominik Kramer, Reiner Mönig,Thomas Diemant, R. Jürgen Behm, Markus Hahn, Olaf Böse, andMichael A. Danzer. Sodium metal anodes: Deposition and dissolution be-haviour and SEI formation. Electrochimica Acta, 354:136698, sep 2020. doi10.1016/j.electacta.2020.136698.
[189] Bingsheng Qin, Alexander Schiele, Zenonas Jusys, Alessandro Mariani,Thomas Diemant, Xu Liu, Torsten Brezesinski, R. Jürgen Behm, AlbertoVarzi, and Stefano Passerini. Highly Reversible Sodiation of Tin in GlymeElectrolytes: The Critical Role of the Solid Electrolyte Interphase and ItsFormation Mechanism. ACS Applied Materials and Interfaces, 12(3):36973708, 2020. ISSN 19448252. doi 10.1021/acsami.9b20616.
[190] Joachim Häcker, Christian Danner, Brigitta Sievert, Indro Biswas,Zhirong Zhao-Karger, Norbert Wagner, and K. Andreas Friedrich.Investigation of MagnesiumSulfur Batteries using ElectrochemicalImpedance Spectroscopy. Electrochimica Acta, 338, 2020. doi10.1016/j.electacta.2020.135787.
[191] Ralf Wagner, Martin Korth, Benjamin Streipert, Johannes Kasnatscheew,Dennis R. Gallus, Sebastian Brox, Marius Amereller, Isidora Cekic-Laskovic, and Martin Winter. Impact of Selected LiPF6 Hydrolysis Prod-ucts on the High Voltage Stability of Lithium-Ion Battery Cells. ACS Ap-plied Materials and Interfaces, 8(45):3087130878, 2016. doi 10.1021/ac-sami.6b09164.
[192] Sowmiya Theivaprakasam, Gaetan Girard, Patrick Howlett, Maria Forsyth,Sagar Mitra, and Douglas MacFarlane. Passivation behaviour of aluminiumcurrent collector in ionic liquid alkyl carbonate (hybrid) electrolytes. npjMaterials Degradation, 2(1), 2018. doi 10.1038/s41529-018-0033-6.
[193] Florian Buchner, Katrin Forster-Tonigold, Jihyun Kim, Joachim Bans-mann, Axel Groÿ, and R. Jürgen Behm. Interaction between Li, UltrathinAdsorbed Ionic Liquid Films, and CoO(111) Thin Films: A Model Study ofthe Solid|Electrolyte Interphase Formation. Chemistry of Materials, 31(15):55375549, 2019. ISSN 15205002. doi 10.1021/acs.chemmater.9b01253.
110
Attached Publications
Paper I Dynamics and Morphology of Solid Electrolyte Interphase (SEI)
Page 113 ManuscriptPage 119 Electronic Supporting Information
Both republished with permission of the Royal Society of Chemistry fromreference [148], permission conveyed through Copyrigth Clearance Cen-ter, Inc.
Paper II Revealing SEI Morphology: In-Depth Analysis of a Modeling Approach
Page 121 Manuscript
Reprinted from reference [150] under the terms of the Creative CommonsAttribution 4.0 License, https://creativecommons.org/licenses/by/4.0/.
Paper III Identifying the Mechanism of Continued Growth of the SolidElectrolyteInterphase
Page 135 ManuscriptPage 141 Electronic Supporting Information
Copyright (2020) Wiley. Both used with permission from reference [151].
Paper IV Review on multi-scale Models of Solid-Electrolyte Interphase Formation
Page 147 Manuscript
Reprinted from reference [11], Copyright (2020), with permission fromElsevier.
Paper V Theory of Impedance Spectroscopy for Lithium Batteries
Page 157 ManuscriptPage 175 Electronic Supporting Information
Both reprinted with permission from reference [175], Copyright (2020)American Chemical Society.
111

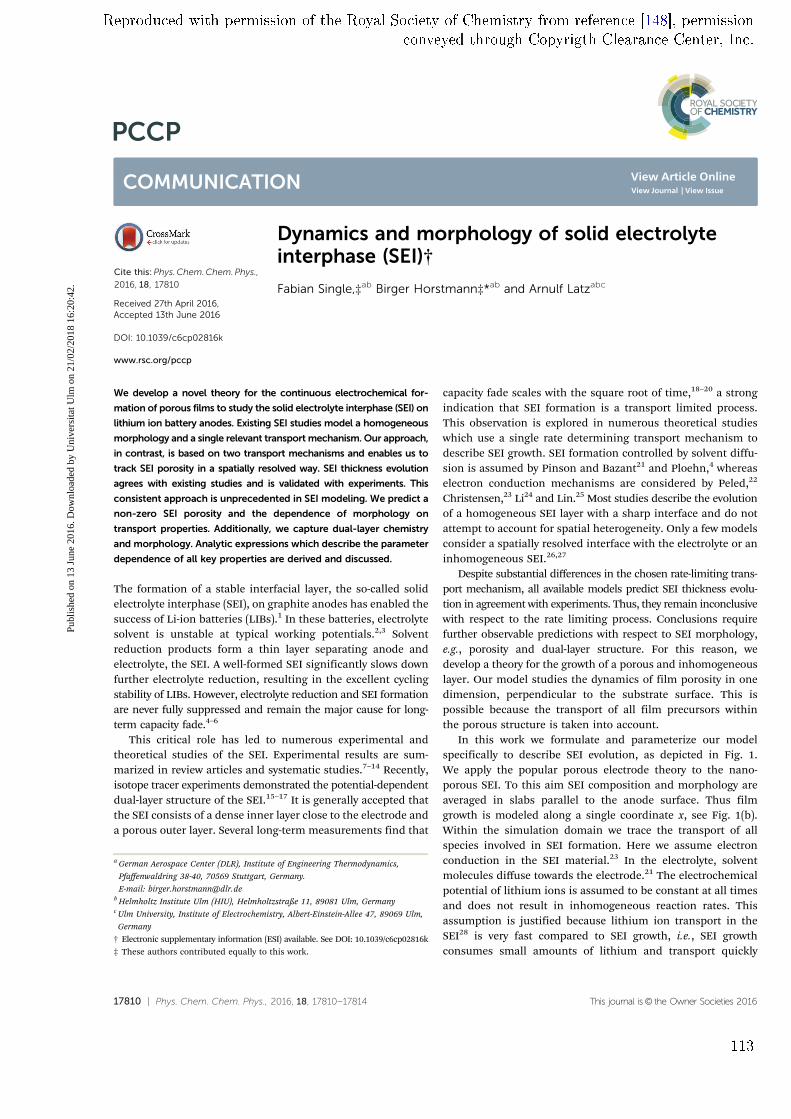
17810 | Phys. Chem. Chem. Phys., 2016, 18, 17810--17814 This journal is© the Owner Societies 2016
Cite this:Phys.Chem.Chem.Phys.,
2016, 18, 17810
Dynamics and morphology of solid electrolyteinterphase (SEI)†
Fabian Single,‡ab Birger Horstmann‡*ab and Arnulf Latzabc
We develop a novel theory for the continuous electrochemical for-
mation of porous films to study the solid electrolyte interphase (SEI) on
lithium ion battery anodes. Existing SEI studies model a homogeneous
morphology and a single relevant transport mechanism. Our approach,
in contrast, is based on two transport mechanisms and enables us to
track SEI porosity in a spatially resolved way. SEI thickness evolution
agrees with existing studies and is validated with experiments. This
consistent approach is unprecedented in SEI modeling. We predict a
non-zero SEI porosity and the dependence of morphology on
transport properties. Additionally, we capture dual-layer chemistry
and morphology. Analytic expressions which describe the parameter
dependence of all key properties are derived and discussed.
The formation of a stable interfacial layer, the so-called solidelectrolyte interphase (SEI), on graphite anodes has enabled thesuccess of Li-ion batteries (LIBs).1 In these batteries, electrolytesolvent is unstable at typical working potentials.2,3 Solventreduction products form a thin layer separating anode andelectrolyte, the SEI. A well-formed SEI significantly slows downfurther electrolyte reduction, resulting in the excellent cyclingstability of LIBs. However, electrolyte reduction and SEI formationare never fully suppressed and remain the major cause for long-term capacity fade.4–6
This critical role has led to numerous experimental andtheoretical studies of the SEI. Experimental results are sum-marized in review articles and systematic studies.7–14 Recently,isotope tracer experiments demonstrated the potential-dependentdual-layer structure of the SEI.15–17 It is generally accepted thatthe SEI consists of a dense inner layer close to the electrode anda porous outer layer. Several long-term measurements find that
capacity fade scales with the square root of time,18–20 a strongindication that SEI formation is a transport limited process.This observation is explored in numerous theoretical studieswhich use a single rate determining transport mechanism todescribe SEI growth. SEI formation controlled by solvent diffu-sion is assumed by Pinson and Bazant21 and Ploehn,4 whereaselectron conduction mechanisms are considered by Peled,22
Christensen,23 Li24 and Lin.25 Most studies describe the evolutionof a homogeneous SEI layer with a sharp interface and do notattempt to account for spatial heterogeneity. Only a few modelsconsider a spatially resolved interface with the electrolyte or aninhomogeneous SEI.26,27
Despite substantial differences in the chosen rate-limiting trans-port mechanism, all available models predict SEI thickness evolu-tion in agreement with experiments. Thus, they remain inconclusivewith respect to the rate limiting process. Conclusions requirefurther observable predictions with respect to SEI morphology,e.g., porosity and dual-layer structure. For this reason, wedevelop a theory for the growth of a porous and inhomogeneouslayer. Our model studies the dynamics of film porosity in onedimension, perpendicular to the substrate surface. This ispossible because the transport of all film precursors withinthe porous structure is taken into account.
In this work we formulate and parameterize our modelspecifically to describe SEI evolution, as depicted in Fig. 1.We apply the popular porous electrode theory to the nano-porous SEI. To this aim SEI composition and morphology areaveraged in slabs parallel to the anode surface. Thus filmgrowth is modeled along a single coordinate x, see Fig. 1(b).Within the simulation domain we trace the transport of allspecies involved in SEI formation. Here we assume electronconduction in the SEI material.23 In the electrolyte, solventmolecules diffuse towards the electrode.21 The electrochemicalpotential of lithium ions is assumed to be constant at all timesand does not result in inhomogeneous reaction rates. Thisassumption is justified because lithium ion transport in theSEI28 is very fast compared to SEI growth, i.e., SEI growthconsumes small amounts of lithium and transport quickly
a German Aerospace Center (DLR), Institute of Engineering Thermodynamics,
Pfaffenwaldring 38-40, 70569 Stuttgart, Germany.
E-mail: [email protected] Helmholtz Institute Ulm (HIU), Helmholtzstraße 11, 89081 Ulm, Germanyc Ulm University, Institute of Electrochemistry, Albert-Einstein-Allee 47, 89069 Ulm,
Germany
† Electronic supplementary information (ESI) available. See DOI: 10.1039/c6cp02816k‡ These authors contributed equally to this work.
Received 27th April 2016,Accepted 13th June 2016
DOI: 10.1039/c6cp02816k
www.rsc.org/pccp
PCCP
COMMUNICATION
Publ
ishe
d on
13
June
201
6. D
ownl
oade
d by
Uni
vers
itat U
lm o
n 21
/02/
2018
16:
20:4
2.
View Article OnlineView Journal | View Issue
Reproduced with permission of the Royal Society of Chemistry from reference [148], permissionconveyed through Copyrigth Clearance Center, Inc.
113
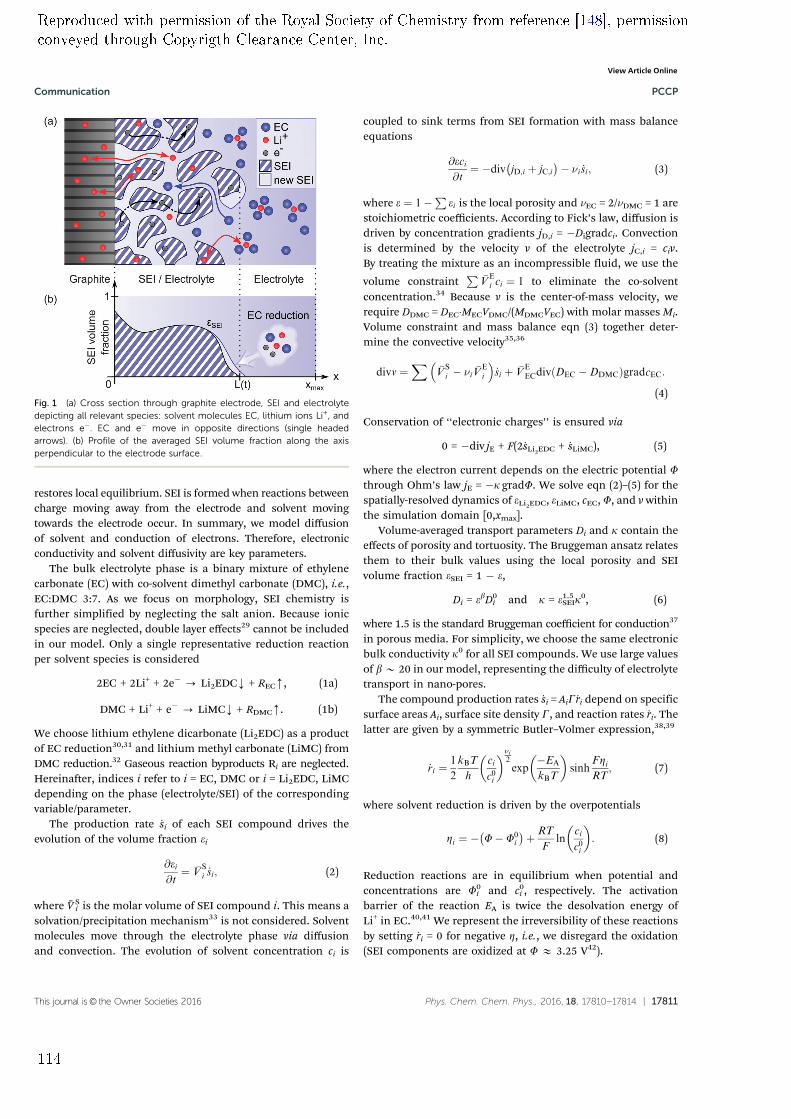
This journal is© the Owner Societies 2016 Phys. Chem. Chem. Phys., 2016, 18, 17810--17814 | 17811
restores local equilibrium. SEI is formed when reactions betweencharge moving away from the electrode and solvent movingtowards the electrode occur. In summary, we model diffusionof solvent and conduction of electrons. Therefore, electronicconductivity and solvent diffusivity are key parameters.
The bulk electrolyte phase is a binary mixture of ethylenecarbonate (EC) with co-solvent dimethyl carbonate (DMC), i.e.,EC:DMC 3:7. As we focus on morphology, SEI chemistry isfurther simplified by neglecting the salt anion. Because ionicspecies are neglected, double layer effects29 cannot be includedin our model. Only a single representative reduction reactionper solvent species is considered
2EC + 2Li+ + 2e - Li2EDCk + RECm, (1a)
DMC + Li+ + e - LiMCk + RDMCm. (1b)
We choose lithium ethylene dicarbonate (Li2EDC) as a productof EC reduction30,31 and lithium methyl carbonate (LiMC) fromDMC reduction.32 Gaseous reaction byproducts Ri are neglected.Hereinafter, indices i refer to i = EC, DMC or i = Li2EDC, LiMCdepending on the phase (electrolyte/SEI) of the correspondingvariable/parameter.
The production rate :si of each SEI compound drives the
evolution of the volume fraction ei
@ei@t¼ V
Si _si; (2)
where %V Si is the molar volume of SEI compound i. This means a
solvation/precipitation mechanism33 is not considered. Solventmolecules move through the electrolyte phase via diffusionand convection. The evolution of solvent concentration ci is
coupled to sink terms from SEI formation with mass balanceequations
@eci@t¼ div jD;i þ jC;i
ni _si; (3)
where e ¼ 1P
ei is the local porosity and nEC = 2/nDMC = 1 arestoichiometric coefficients. According to Fick’s law, diffusion isdriven by concentration gradients jD,i = Digradci. Convectionis determined by the velocity v of the electrolyte jC,i = civ.By treating the mixture as an incompressible fluid, we use the
volume constraintP
VEi ci ¼ 1 to eliminate the co-solvent
concentration.34 Because v is the center-of-mass velocity, werequire DDMC = DECMECVDMC/(MDMCVEC) with molar masses Mi.Volume constraint and mass balance eqn (3) together deter-mine the convective velocity35,36
divv ¼X
VSi ni V
Ei
_si þ V
EECdiv DEC DDMCð ÞgradcEC:
(4)
Conservation of ‘‘electronic charges’’ is ensured via
0 = div jE + F(2:sLi2EDC + :sLiMC), (5)
where the electron current depends on the electric potential Fthrough Ohm’s law jE = k gradF. We solve eqn (2)–(5) for thespatially-resolved dynamics of eLi2EDC, eLiMC, cEC, F, and v withinthe simulation domain [0,xmax].
Volume-averaged transport parameters Di and k contain theeffects of porosity and tortuosity. The Bruggeman ansatz relatesthem to their bulk values using the local porosity and SEIvolume fraction eSEI = 1 e,
Di = ebD0i and k = e1.5
SEIk0, (6)
where 1.5 is the standard Bruggeman coefficient for conduction37
in porous media. For simplicity, we choose the same electronicbulk conductivity k0 for all SEI compounds. We use large valuesof bB 20 in our model, representing the difficulty of electrolytetransport in nano-pores.
The compound production rates :si = AiG:ri depend on specific
surface areas Ai, surface site density G, and reaction rates :ri. Thelatter are given by a symmetric Butler–Volmer expression,38,39
_ri ¼1
2
kBT
h
ci
c0i
ni2exp
EA
kBT
sinh
FZiRT
; (7)
where solvent reduction is driven by the overpotentials
Zi ¼ F F0i
þ RT
Fln
ci
c0i
: (8)
Reduction reactions are in equilibrium when potential andconcentrations are F0
i and c0i , respectively. The activation
barrier of the reaction EA is twice the desolvation energy ofLi+ in EC.40,41 We represent the irreversibility of these reactionsby setting :
ri = 0 for negative Z, i.e., we disregard the oxidation(SEI components are oxidized at F E 3.25 V42).
Fig. 1 (a) Cross section through graphite electrode, SEI and electrolytedepicting all relevant species: solvent molecules EC, lithium ions Li+, andelectrons e. EC and e move in opposite directions (single headedarrows). (b) Profile of the averaged SEI volume fraction along the axisperpendicular to the electrode surface.
Communication PCCP
Publ
ishe
d on
13
June
201
6. D
ownl
oade
d by
Uni
vers
itat U
lm o
n 21
/02/
2018
16:
20:4
2.
View Article Online
Reproduced with permission of the Royal Society of Chemistry from reference [148], permissionconveyed through Copyrigth Clearance Center, Inc.
114
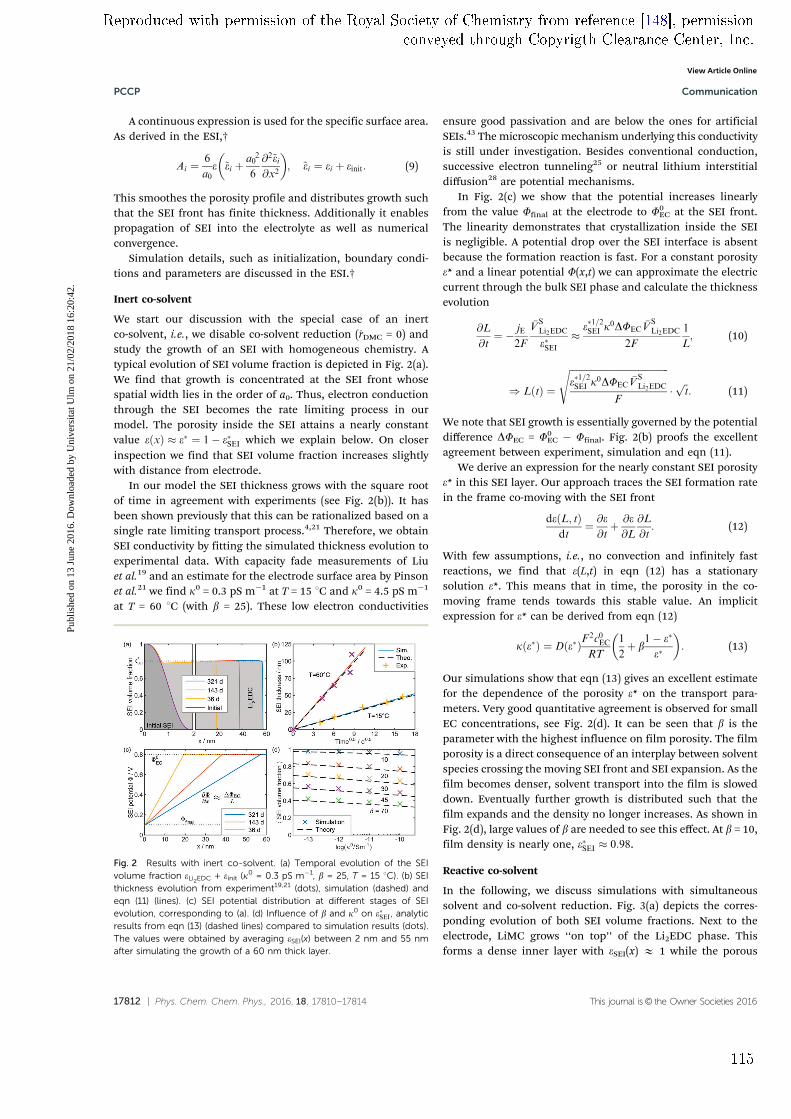
17812 | Phys. Chem. Chem. Phys., 2016, 18, 17810--17814 This journal is© the Owner Societies 2016
A continuous expression is used for the specific surface area.As derived in the ESI,†
Ai ¼6
a0e ~ei þ
a02
6
@2~ei@x2
; ~ei ¼ ei þ einit: (9)
This smoothes the porosity profile and distributes growth suchthat the SEI front has finite thickness. Additionally it enablespropagation of SEI into the electrolyte as well as numericalconvergence.
Simulation details, such as initialization, boundary condi-tions and parameters are discussed in the ESI.†
Inert co-solvent
We start our discussion with the special case of an inertco-solvent, i.e., we disable co-solvent reduction (:rDMC = 0) andstudy the growth of an SEI with homogeneous chemistry. Atypical evolution of SEI volume fraction is depicted in Fig. 2(a).We find that growth is concentrated at the SEI front whosespatial width lies in the order of a0. Thus, electron conductionthrough the SEI becomes the rate limiting process in ourmodel. The porosity inside the SEI attains a nearly constantvalue e xð Þ e ¼ 1 eSEI which we explain below. On closerinspection we find that SEI volume fraction increases slightlywith distance from electrode.
In our model the SEI thickness grows with the square rootof time in agreement with experiments (see Fig. 2(b)). It hasbeen shown previously that this can be rationalized based on asingle rate limiting transport process.4,21 Therefore, we obtainSEI conductivity by fitting the simulated thickness evolution toexperimental data. With capacity fade measurements of Liuet al.19 and an estimate for the electrode surface area by Pinsonet al.21 we find k0 = 0.3 pS m1 at T = 15 1C and k0 = 4.5 pS m1
at T = 60 1C (with b = 25). These low electron conductivities
ensure good passivation and are below the ones for artificialSEIs.43 The microscopic mechanism underlying this conductivityis still under investigation. Besides conventional conduction,successive electron tunneling25 or neutral lithium interstitialdiffusion28 are potential mechanisms.
In Fig. 2(c) we show that the potential increases linearlyfrom the value Ffinal at the electrode to F0
EC at the SEI front.The linearity demonstrates that crystallization inside the SEIis negligible. A potential drop over the SEI interface is absentbecause the formation reaction is fast. For a constant porositye* and a linear potential F(x,t) we can approximate the electriccurrent through the bulk SEI phase and calculate the thicknessevolution
@L
@t¼ jE
2F
VSLi2EDC
eSEI
e1=2SEI k0DFEC
VSLi2EDC
2F
1
L; (10)
) LðtÞ ¼
ffiffiffiffiffiffiffiffiffiffiffiffiffiffiffiffiffiffiffiffiffiffiffiffiffiffiffiffiffiffiffiffiffiffiffiffiffiffiffiffiffiffie1=2SEI k
0DFECVSLi2EDC
F
sffiffitp: (11)
We note that SEI growth is essentially governed by the potentialdifference DFEC = F0
EC Ffinal. Fig. 2(b) proofs the excellentagreement between experiment, simulation and eqn (11).
We derive an expression for the nearly constant SEI porositye* in this SEI layer. Our approach traces the SEI formation ratein the frame co-moving with the SEI front
deðL; tÞdt
¼ @e@tþ @e@L
@L
@t: (12)
With few assumptions, i.e., no convection and infinitely fastreactions, we find that e(L,t) in eqn (12) has a stationarysolution e*. This means that in time, the porosity in the co-moving frame tends towards this stable value. An implicitexpression for e* can be derived from eqn (12)
k eð Þ ¼ D eð ÞF2c0ECRT
1
2þ b
1 e
e
: (13)
Our simulations show that eqn (13) gives an excellent estimatefor the dependence of the porosity e* on the transport para-meters. Very good quantitative agreement is observed for smallEC concentrations, see Fig. 2(d). It can be seen that b is theparameter with the highest influence on film porosity. The filmporosity is a direct consequence of an interplay between solventspecies crossing the moving SEI front and SEI expansion. As thefilm becomes denser, solvent transport into the film is sloweddown. Eventually further growth is distributed such that thefilm expands and the density no longer increases. As shown inFig. 2(d), large values of b are needed to see this effect. At b = 10,film density is nearly one, eSEI 0:98.
Reactive co-solvent
In the following, we discuss simulations with simultaneoussolvent and co-solvent reduction. Fig. 3(a) depicts the corres-ponding evolution of both SEI volume fractions. Next to theelectrode, LiMC grows ‘‘on top’’ of the Li2EDC phase. Thisforms a dense inner layer with eSEI(x) E 1 while the porous
Fig. 2 Results with inert co-solvent. (a) Temporal evolution of the SEIvolume fraction eLi2EDC + einit (k0 = 0.3 pS m1, b = 25, T = 15 1C). (b) SEIthickness evolution from experiment19,21 (dots), simulation (dashed) andeqn (11) (lines). (c) SEI potential distribution at different stages of SEIevolution, corresponding to (a). (d) Influence of b and k0 on eSEI, analyticresults from eqn (13) (dashed lines) compared to simulation results (dots).The values were obtained by averaging eSEI(x) between 2 nm and 55 nmafter simulating the growth of a 60 nm thick layer.
PCCP Communication
Publ
ishe
d on
13
June
201
6. D
ownl
oade
d by
Uni
vers
itat U
lm o
n 21
/02/
2018
16:
20:4
2.
View Article Online
Reproduced with permission of the Royal Society of Chemistry from reference [148], permissionconveyed through Copyrigth Clearance Center, Inc.
115
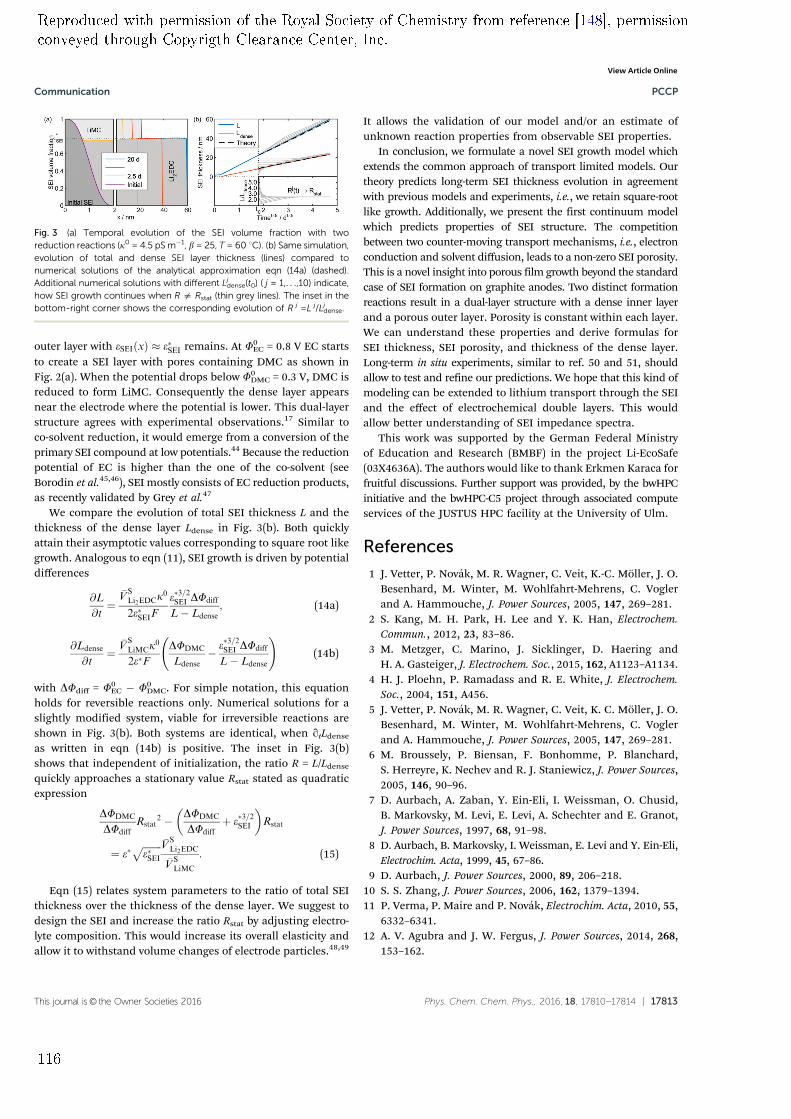
This journal is© the Owner Societies 2016 Phys. Chem. Chem. Phys., 2016, 18, 17810--17814 | 17813
outer layer with eSEI xð Þ eSEI remains. At F0EC = 0.8 V EC starts
to create a SEI layer with pores containing DMC as shown inFig. 2(a). When the potential drops below F0
DMC = 0.3 V, DMC isreduced to form LiMC. Consequently the dense layer appearsnear the electrode where the potential is lower. This dual-layerstructure agrees with experimental observations.17 Similar toco-solvent reduction, it would emerge from a conversion of theprimary SEI compound at low potentials.44 Because the reductionpotential of EC is higher than the one of the co-solvent (seeBorodin et al.45,46), SEI mostly consists of EC reduction products,as recently validated by Grey et al.47
We compare the evolution of total SEI thickness L and thethickness of the dense layer Ldense in Fig. 3(b). Both quicklyattain their asymptotic values corresponding to square root likegrowth. Analogous to eqn (11), SEI growth is driven by potentialdifferences
@L
@t¼
VSLi2EDCk
0
2eSEIFe3=2SEI DFdiff
L Ldense; (14a)
@Ldense
@t¼
VSLiMCk
0
2eFDFDMC
Ldense e3=2SEI DFdiff
L Ldense
!(14b)
with DFdiff = F0EC F0
DMC. For simple notation, this equationholds for reversible reactions only. Numerical solutions for aslightly modified system, viable for irreversible reactions areshown in Fig. 3(b). Both systems are identical, when qtLdense
as written in eqn (14b) is positive. The inset in Fig. 3(b)shows that independent of initialization, the ratio R = L/Ldense
quickly approaches a stationary value Rstat stated as quadraticexpression
DFDMC
DFdiffRstat
2 DFDMC
DFdiffþ e3=2SEI
Rstat
¼ effiffiffiffiffiffiffiffieSEI
p VSLi2EDC
VSLiMC
: (15)
Eqn (15) relates system parameters to the ratio of total SEIthickness over the thickness of the dense layer. We suggest todesign the SEI and increase the ratio Rstat by adjusting electro-lyte composition. This would increase its overall elasticity andallow it to withstand volume changes of electrode particles.48,49
It allows the validation of our model and/or an estimate ofunknown reaction properties from observable SEI properties.
In conclusion, we formulate a novel SEI growth model whichextends the common approach of transport limited models. Ourtheory predicts long-term SEI thickness evolution in agreementwith previous models and experiments, i.e., we retain square-rootlike growth. Additionally, we present the first continuum modelwhich predicts properties of SEI structure. The competitionbetween two counter-moving transport mechanisms, i.e., electronconduction and solvent diffusion, leads to a non-zero SEI porosity.This is a novel insight into porous film growth beyond the standardcase of SEI formation on graphite anodes. Two distinct formationreactions result in a dual-layer structure with a dense inner layerand a porous outer layer. Porosity is constant within each layer.We can understand these properties and derive formulas forSEI thickness, SEI porosity, and thickness of the dense layer.Long-term in situ experiments, similar to ref. 50 and 51, shouldallow to test and refine our predictions. We hope that this kind ofmodeling can be extended to lithium transport through the SEIand the effect of electrochemical double layers. This wouldallow better understanding of SEI impedance spectra.
This work was supported by the German Federal Ministryof Education and Research (BMBF) in the project Li-EcoSafe(03X4636A). The authors would like to thank Erkmen Karaca forfruitful discussions. Further support was provided, by the bwHPCinitiative and the bwHPC-C5 project through associated computeservices of the JUSTUS HPC facility at the University of Ulm.
References
1 J. Vetter, P. Novak, M. R. Wagner, C. Veit, K.-C. Moller, J. O.Besenhard, M. Winter, M. Wohlfahrt-Mehrens, C. Voglerand A. Hammouche, J. Power Sources, 2005, 147, 269–281.
2 S. Kang, M. H. Park, H. Lee and Y. K. Han, Electrochem.Commun., 2012, 23, 83–86.
3 M. Metzger, C. Marino, J. Sicklinger, D. Haering andH. A. Gasteiger, J. Electrochem. Soc., 2015, 162, A1123–A1134.
4 H. J. Ploehn, P. Ramadass and R. E. White, J. Electrochem.Soc., 2004, 151, A456.
5 J. Vetter, P. Novak, M. R. Wagner, C. Veit, K. C. Moller, J. O.Besenhard, M. Winter, M. Wohlfahrt-Mehrens, C. Voglerand A. Hammouche, J. Power Sources, 2005, 147, 269–281.
6 M. Broussely, P. Biensan, F. Bonhomme, P. Blanchard,S. Herreyre, K. Nechev and R. J. Staniewicz, J. Power Sources,2005, 146, 90–96.
7 D. Aurbach, A. Zaban, Y. Ein-Eli, I. Weissman, O. Chusid,B. Markovsky, M. Levi, E. Levi, A. Schechter and E. Granot,J. Power Sources, 1997, 68, 91–98.
8 D. Aurbach, B. Markovsky, I. Weissman, E. Levi and Y. Ein-Eli,Electrochim. Acta, 1999, 45, 67–86.
9 D. Aurbach, J. Power Sources, 2000, 89, 206–218.10 S. S. Zhang, J. Power Sources, 2006, 162, 1379–1394.11 P. Verma, P. Maire and P. Novak, Electrochim. Acta, 2010, 55,
6332–6341.12 A. V. Agubra and J. W. Fergus, J. Power Sources, 2014, 268,
153–162.
Fig. 3 (a) Temporal evolution of the SEI volume fraction with tworeduction reactions (k0 = 4.5 pS m1, b = 25, T = 60 1C). (b) Same simulation,evolution of total and dense SEI layer thickness (lines) compared tonumerical solutions of the analytical approximation eqn (14a) (dashed).Additional numerical solutions with different Lj
dense(t0) ( j = 1,. . .,10) indicate,how SEI growth continues when R a Rstat (thin grey lines). The inset in thebottom-right corner shows the corresponding evolution of R j =L j/Lj
dense.
Communication PCCP
Publ
ishe
d on
13
June
201
6. D
ownl
oade
d by
Uni
vers
itat U
lm o
n 21
/02/
2018
16:
20:4
2.
View Article Online
Reproduced with permission of the Royal Society of Chemistry from reference [148], permissionconveyed through Copyrigth Clearance Center, Inc.
116
17814 | Phys. Chem. Chem. Phys., 2016, 18, 17810--17814 This journal is© the Owner Societies 2016
13 A. M. Haregewoin, E. G. Leggesse, J.-C. Jiang, F.-M. Wang, B.-J.Hwang and S. D. Lin, Electrochim. Acta, 2014, 136, 274–285.
14 F. A. Soto, Y. Ma, J. M. Martinez De La Hoz, J. M. Seminarioand P. B. Balbuena, Chem. Mater., 2015, 27, 7990–8000.
15 P. Lu and S. J. Harris, Electrochem. Commun., 2011, 13,1035–1037.
16 S. J. Harris and P. Lu, J. Phys. Chem. C, 2013, 117, 6481–6492.17 P. Lu, C. Li, E. W. Schneider and S. J. Harris, J. Phys. Chem.
C, 2014, 118, 896–903.18 M. Broussely, S. Herreyre, P. Biensan, P. Kasztejna, K. Nechev
and R. J. Staniewicz, J. Power Sources, 2001, 97–98, 13–21.19 P. Liu, J. Wang, J. Hicks-Garner, E. Sherman, S. Soukiazian,
M. Verbrugge, H. Tataria, J. Musser and P. Finamore,J. Electrochem. Soc., 2010, 157, A499.
20 A. J. Smith, J. C. Burns, X. Zhao, D. Xiong and J. R. Dahn,J. Electrochem. Soc., 2011, 158, A447–A452.
21 M. B. Pinson and M. Z. Bazant, J. Electrochem. Soc., 2012,160, A243–A250.
22 E. Peled, J. Electrochem. Soc., 1979, 126, 2047–2051.23 J. Christensen and J. Newman, J. Electrochem. Soc., 2004,
151, A1977.24 D. Li, D. Danilov, Z. Zhang, H. Chen, Y. Yang and P. H. L.
Notten, J. Electrochem. Soc., 2015, 162, A858–A869.25 Y. X. Lin, Z. Liu, K. Leung, L. Q. Chen, P. Lu and Y. Qi,
J. Power Sources, 2016, 309, 221–230.26 J. Deng, G. J. Wagner and R. P. Muller, J. Electrochem. Soc.,
2013, 160, A487–A496.27 P. Guan, L. Liu and X. Lin, J. Electrochem. Soc., 2015, 162,
A1798–A1808.28 S. Shi, P. Lu, Z. Liu, Y. Qi, L. G. Hector, H. Li and S. J. Harris,
J. Am. Chem. Soc., 2012, 134, 15476–15487.29 Q. Zhang, J. Pan, P. Lu, Z. Liu, M. W. Verbrugge,
B. W. Sheldon, Y. T. Cheng, Y. Qi and X. Xiao, Nano Lett.,2016, 16, 2011–2016.
30 G. V. Zhuang, K. Xu, H. Yang, T. R. Jow and P. N. Ross,J. Phys. Chem. B, 2005, 109, 17567–17573.
31 K. Leung, Chem. Phys. Lett., 2013, 568–569, 1–8.
32 D. M. Seo, D. Chalasani, B. S. Parimalam, R. Kadam, M. Nieand B. L. Lucht, ECS Electrochem. Lett., 2014, 3, A91–A93.
33 O. Borodin and D. Bedrov, J. Phys. Chem. C, 2014, 118,18362–18371.
34 B. Horstmann, T. Danner and W. G. Bessler, Energy Environ.Sci., 2013, 6, 1299–1314.
35 D. Bothe and W. Dreyer, Acta Mech., 2015, 226, 1757–1805.36 S. de Groot and P. Mazur, Non-equilibrium Thermodynamics,
Dover Publications, 1962.37 M. Doyle, J. Electrochem. Soc., 1993, 140, 1526.38 A. Latz and J. Zausch, J. Power Sources, 2011, 196, 3296–3302.39 M. Z. Bazant, Acc. Chem. Res., 2013, 46, 1144–1160.40 Y. Yamada, Y. Iriyama, T. Abe and Z. Ogumi, Langmuir,
2009, 25, 12766–12770.41 K. Xu, A. Von Cresce and U. Lee, Langmuir, 2010, 26,
11538–11543.42 M. Tang and J. Newman, J. Electrochem. Soc., 2012, 159, A281.43 J. Li, N. J. Dudney, J. Nanda and C. Liang, ACS Appl. Mater.
Interfaces, 2014, 6, 10083–10088.44 K. Leung, F. A. Soto, K. Hankins, P. B. Balbuena and
K. L. Harrison, J. Phys. Chem. C, 2016, 120, 6302–6313.45 O. Borodin, M. Olguin, C. E. Spear, K. W. Leiter and J. Knap,
Nanotechnology, 2015, 26, 354003.46 O. Borodin, M. Olguin, P. Ganesh, P. R. C. Kent, J. L. Allen and
W. A. Henderson, Phys. Chem. Chem. Phys., 2016, 18, 164–175.47 A. L. Michan, M. Leskes and C. P. Grey, Chem. Mater., 2015,
385–398.48 J. Zhang, X. Yang, R. Wang, W. Dong, W. Lu, X. Wu, X. Wang,
H. Li and L. Chen, J. Phys. Chem. C, 2014, 118, 20756–20762.49 V. Kuznetsov, A. H. Zinn, G. Zampardi, S. Borhani-Haghighi,
F. La Mantia, A. Ludwig, W. Schuhmann and E. Ventosa,ACS Appl. Mater. Interfaces, 2015, 7, 23554–23563.
50 G. M. Veith, M. Doucet, J. K. Baldwin, R. L. Sacci, T. M. Fears,Y. Wang and J. F. Browning, J. Phys. Chem. C, 2015, 119,20339–20349.
51 R. L. Sacci, J. M. Black, N. Balke, N. J. Dudney, K. L. Moreand R. R. Unocic, Nano Lett., 2015, 15, 2011–2018.
PCCP Communication
Publ
ishe
d on
13
June
201
6. D
ownl
oade
d by
Uni
vers
itat U
lm o
n 21
/02/
2018
16:
20:4
2.
View Article Online
Reproduced with permission of the Royal Society of Chemistry from reference [148], permissionconveyed through Copyrigth Clearance Center, Inc.
117

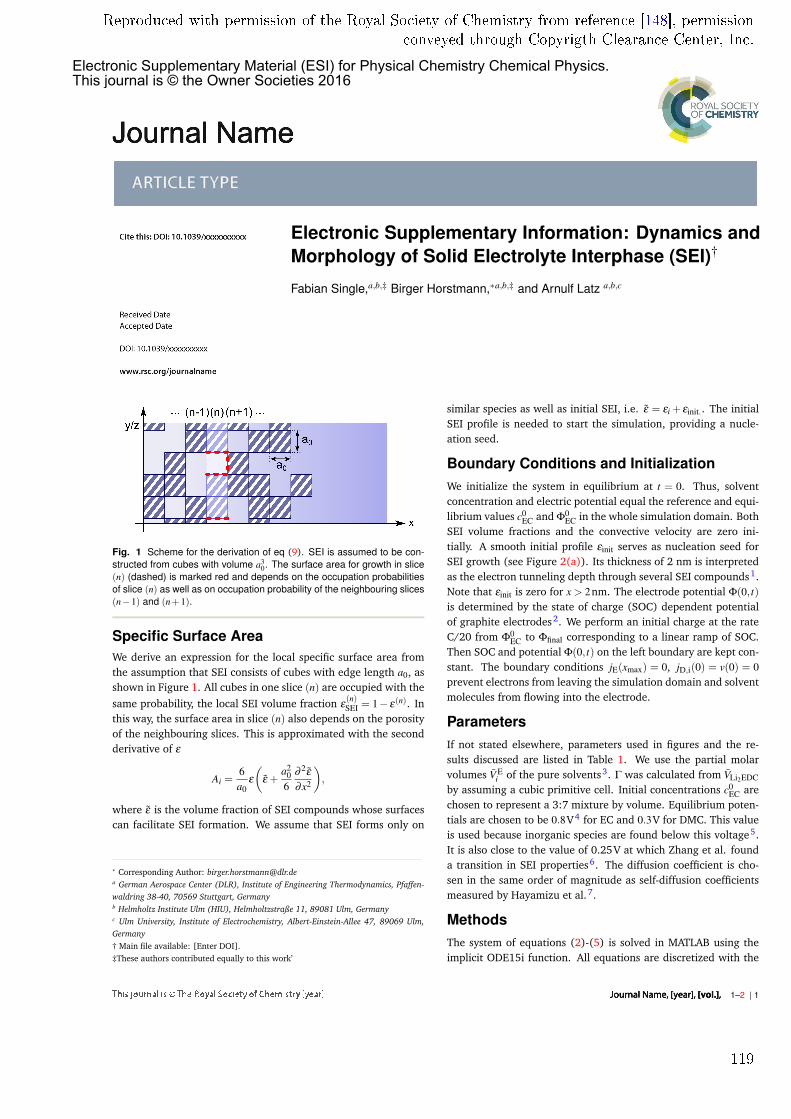
Journal Name
Electronic Supplementary Information: Dynamics andMorphology of Solid Electrolyte Interphase (SEI)†
Fabian Single,a,b,‡ Birger Horstmann,∗a,b,‡ and Arnulf Latz a,b,c
Fig. 1 Scheme for the derivation of eq (9). SEI is assumed to be con-structed from cubes with volume a3
0. The surface area for growth in slice(n) (dashed) is marked red and depends on the occupation probabilitiesof slice (n) as well as on occupation probability of the neighbouring slices(n−1) and (n+1).
Specific Surface AreaWe derive an expression for the local specific surface area fromthe assumption that SEI consists of cubes with edge length a0, asshown in Figure 1. All cubes in one slice (n) are occupied with thesame probability, the local SEI volume fraction ε(n)SEI = 1− ε(n). Inthis way, the surface area in slice (n) also depends on the porosityof the neighbouring slices. This is approximated with the secondderivative of ε
Ai =6a0
ε(
ε +a2
06
∂ 2ε∂x2
),
where ε is the volume fraction of SEI compounds whose surfacescan facilitate SEI formation. We assume that SEI forms only on
∗ Corresponding Author: [email protected] German Aerospace Center (DLR), Institute of Engineering Thermodynamics, Pfaffen-waldring 38-40, 70569 Stuttgart, Germanyb Helmholtz Institute Ulm (HIU), Helmholtzstraße 11, 89081 Ulm, Germanyc Ulm University, Institute of Electrochemistry, Albert-Einstein-Allee 47, 89069 Ulm,Germany† Main file available: [Enter DOI].‡These authors contributed equally to this work’
similar species as well as initial SEI, i.e. ε = εi + εinit.. The initialSEI profile is needed to start the simulation, providing a nucle-ation seed.
Boundary Conditions and InitializationWe initialize the system in equilibrium at t = 0. Thus, solventconcentration and electric potential equal the reference and equi-librium values c0
EC and Φ0EC in the whole simulation domain. Both
SEI volume fractions and the convective velocity are zero ini-tially. A smooth initial profile εinit serves as nucleation seed forSEI growth (see Figure 2(a)). Its thickness of 2 nm is interpretedas the electron tunneling depth through several SEI compounds1.Note that εinit is zero for x > 2nm. The electrode potential Φ(0, t)is determined by the state of charge (SOC) dependent potentialof graphite electrodes2. We perform an initial charge at the rateC/20 from Φ0
EC to Φfinal corresponding to a linear ramp of SOC.Then SOC and potential Φ(0, t) on the left boundary are kept con-stant. The boundary conditions jE(xmax) = 0, jD,i(0) = v(0) = 0prevent electrons from leaving the simulation domain and solventmolecules from flowing into the electrode.
ParametersIf not stated elsewhere, parameters used in figures and the re-sults discussed are listed in Table 1. We use the partial molarvolumes V E
i of the pure solvents3. Γ was calculated from VLi2EDC
by assuming a cubic primitive cell. Initial concentrations c0EC are
chosen to represent a 3:7 mixture by volume. Equilibrium poten-tials are chosen to be 0.8V4 for EC and 0.3V for DMC. This valueis used because inorganic species are found below this voltage5.It is also close to the value of 0.25V at which Zhang et al. founda transition in SEI properties6. The diffusion coefficient is cho-sen in the same order of magnitude as self-diffusion coefficientsmeasured by Hayamizu et al.7.
MethodsThe system of equations (2)-(5) is solved in MATLAB using theimplicit ODE15i function. All equations are discretized with the
Journal Name, [year], [vol.], 1–2 | 1
Electronic Supplementary Material (ESI) for Physical Chemistry Chemical Physics.This journal is © the Owner Societies 2016
Reproduced with permission of the Royal Society of Chemistry from reference [148], permissionconveyed through Copyrigth Clearance Center, Inc.
119
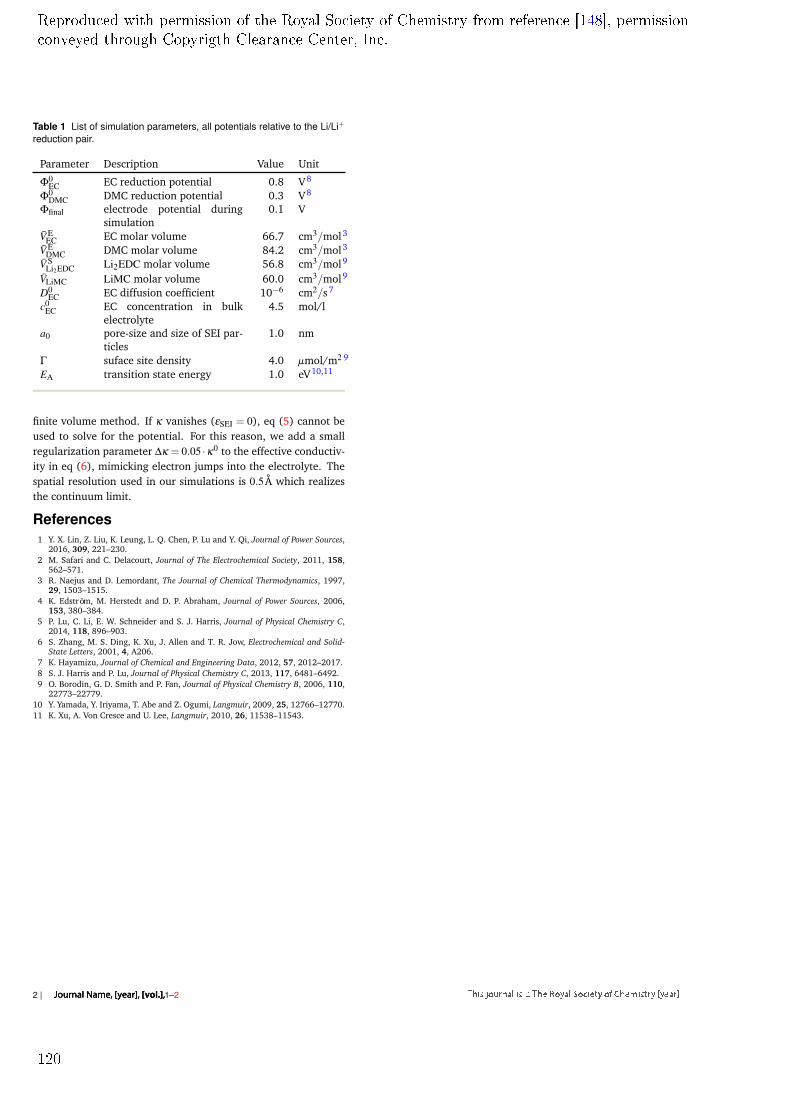
Table 1 List of simulation parameters, all potentials relative to the Li/Li+
reduction pair.
Parameter Description Value Unit
Φ0EC EC reduction potential 0.8 V8
Φ0DMC DMC reduction potential 0.3 V8
Φfinal electrode potential duringsimulation
0.1 V
V EEC EC molar volume 66.7 cm3/mol3
V EDMC DMC molar volume 84.2 cm3/mol3
V SLi2EDC Li2EDC molar volume 56.8 cm3/mol9
VLiMC LiMC molar volume 60.0 cm3/mol9
D0EC EC diffusion coefficient 10−6 cm2/s7
c0EC EC concentration in bulk
electrolyte4.5 mol/l
a0 pore-size and size of SEI par-ticles
1.0 nm
Γ suface site density 4.0 µmol/m2 9
EA transition state energy 1.0 eV10,11
finite volume method. If κ vanishes (εSEI = 0), eq (5) cannot beused to solve for the potential. For this reason, we add a smallregularization parameter ∆κ = 0.05 ·κ0 to the effective conductiv-ity in eq (6), mimicking electron jumps into the electrolyte. Thespatial resolution used in our simulations is 0.5Å which realizesthe continuum limit.
References1 Y. X. Lin, Z. Liu, K. Leung, L. Q. Chen, P. Lu and Y. Qi, Journal of Power Sources,
2016, 309, 221–230.2 M. Safari and C. Delacourt, Journal of The Electrochemical Society, 2011, 158,
562–571.3 R. Naejus and D. Lemordant, The Journal of Chemical Thermodynamics, 1997,
29, 1503–1515.4 K. Edström, M. Herstedt and D. P. Abraham, Journal of Power Sources, 2006,
153, 380–384.5 P. Lu, C. Li, E. W. Schneider and S. J. Harris, Journal of Physical Chemistry C,
2014, 118, 896–903.6 S. Zhang, M. S. Ding, K. Xu, J. Allen and T. R. Jow, Electrochemical and Solid-
State Letters, 2001, 4, A206.7 K. Hayamizu, Journal of Chemical and Engineering Data, 2012, 57, 2012–2017.8 S. J. Harris and P. Lu, Journal of Physical Chemistry C, 2013, 117, 6481–6492.9 O. Borodin, G. D. Smith and P. Fan, Journal of Physical Chemistry B, 2006, 110,
22773–22779.10 Y. Yamada, Y. Iriyama, T. Abe and Z. Ogumi, Langmuir, 2009, 25, 12766–12770.11 K. Xu, A. Von Cresce and U. Lee, Langmuir, 2010, 26, 11538–11543.
2 | 1–2Journal Name, [year], [vol.],
Reproduced with permission of the Royal Society of Chemistry from reference [148], permissionconveyed through Copyrigth Clearance Center, Inc.
120
E3132 Journal of The Electrochemical Society, 164 (11) E3132-E3145 (2017)
JES FOCUS ISSUE ON MATHEMATICAL MODELING OF ELECTROCHEMICAL SYSTEMS AT MULTIPLE SCALES IN HONOR OF JOHN NEWMAN
Revealing SEI Morphology: In-Depth Analysis of a ModelingApproachFabian Single,a,b,z Birger Horstmann,a,b,z and Arnulf Latza,b,c
aGerman Aerospace Center (DLR), Institute of Engineering Thermodynamics, 70569 Stuttgart, GermanybHelmholtz Institute Ulm (HIU), 89081 Ulm, GermanycUlm University, Institute of Electrochemistry, 89069 Ulm, Germany
In this article, we present a novel theory for the long term evolution of the solid electrolyte interphase (SEI) in lithium-ion batteriesand propose novel validation measurements. Both SEI thickness and morphology are predicted by our model as we take into accounttwo transport mechanisms, i.e., solvent diffusion in the SEI pores and charge transport in the solid SEI phase. We show that aporous SEI is created due to the interplay of these transport mechanisms. Different dual layer SEIs emerge from different electrolytedecomposition reactions. We reveal the behavior of such dual layer structures and discuss its dependence on system parameters.Model analysis enables us to interpret SEI thickness fluctuations and link them to the rate-limiting transport mechanism. Our resultsare general and independent of specific modeling choices, e.g., for charge transport and reduction reactions.© The Author(s) 2017. Published by ECS. This is an open access article distributed under the terms of the Creative CommonsAttribution 4.0 License (CC BY, http://creativecommons.org/licenses/by/4.0/), which permits unrestricted reuse of the work in anymedium, provided the original work is properly cited. [DOI: 10.1149/2.0121711jes] All rights reserved.
Manuscript submitted February 6, 2017; revised manuscript received April 17, 2017. Published May 5, 2017. This paper is part ofthe JES Focus Issue on Mathematical Modeling of Electrochemical Systems at Multiple Scales in Honor of John Newman.
In the near future, automotive and mobile applications demandpower storage with large energy and power density. Currently, lithium-ion batteries (LIBs) are the technology of choice for devices with thesedemands. They operate at high cell potentials and offer high specificcapacities while providing long lifetimes. The latter is a consequenceof the stable chemistry of modern LIB systems. A significant part ofthis stability can be attributed to the passivation ability of the solidelectrolyte interphase (SEI). This thin layer forms between the nega-tive electrode and the electrolyte. Hence contact between these phasesis prevented and the continuous reduction of electrolyte molecules issuppressed. These reduction processes occur because the operatingpotential of the negative electrode lies well below the stability windowof the electrolyte.1 They are suppressed because reduction productsquickly form the SEI during the first charge of a pristine electrode.The self passivating ability is one of the most important distinctionsbetween a well and a badly performing lithium-ion battery chemistry.It is of such importance because the reduction reactions consumelithium-ions, directly reducing battery capacity. However, a real SEIis not perfectly passivating and electrolyte reduction is never com-pletely suppressed. Consequently, the lifetime of a battery is directlyrelated to the long-term passivating ability of the SEI.
Numerous studies on SEI have been conducted since Peled re-ported on this correlation in 1979.2 Most of these studies are experi-mental, investigating cycling stability as well as SEI impedance andcomposition. Theoretical studies are scarce in comparison, despite es-tablished methods such as DFT and DFT/MD derivatives. This can bepartially explained with the chemical diversity of SEI, which has beeninvestigated by Aurbach et al. for decades. Results are summarizedin Refs. 3, 4 and include the study of SEI formation on graphite elec-trodes in organic solvent mixtures. The most significant finding of thistime is that ethylene carbonate (EC) forms a stable SEI on graphite asopposed to propylene carbonate (PC). Another focus of early studiesis the SEI composition, which has been probed by FTIR and XPS andother techniques. Lithium carbonate (Li2CO3) and lithium alkyl car-bonates have been reported as products from the reduction of organiccarbonates.
Studies of simplified systems, i.e., binder-free electrodes have im-proved our understanding of SEI composition only recently.5 Thisadvance is also due to the use of novel experimental techniques suchas solid state NMR and TEM.6,7 The focus of these studies are the stan-dard LiPF6/organic carbonate mixtures on graphite and silicon anodes.
zE-mail: [email protected]; [email protected]
They find that SEI in EC containing solvents is primarily composedof lithium ethylene dicarbonate ((CH2OCO2Li)2, Li2EDC). Polyethy-lene oxide is also found as a major product of EC reduction. Linearcarbonates like dimethyl carbonate (DMC) are reduced to lithium alkylcarbonates, such as lithium methyl carbonate (CH3OCO2Li, LiMC).These compounds play a secondary role when EC is in the solventmixture. This is linked to the solvation shell of lithium-ions which arepreferably coordinated to EC.6,8 Furthermore, EC has a higher reduc-tion potential.9 Li2CO3 is not present or only found in small quantitiesin recent studies.6,7,10 Its presence in several older studies is believedto correlate to water and CO2 contamination.
The electrolyte salt has a large impact on SEI composition andperformance. It can shift the onset potential of SEI formation andinfluence the total irreversible capacity during the first cycle.10,11 InLiPF6 solutions, LiF is another major SEI compound while lithiumoxyflurophosphates (Lix PFyOz) are present in low quantities.12 Thecomplex LiPF6 decomposition process is investigated by Campionand Lux.13,14
Additionally, SEI composition depends on the electrode material.Solvent decomposition reactions proceed differently on graphite andlithium storage alloys.15 Electrode materials exhibiting large volumechange, i.e., silicon, fail to form a stable SEI. SEI needs to be flexibleto accommodate volume changes of the underlying substrate withoutdamage by cracking or rupture. It is believed that these properties canbe, to some degree, provided by polymeric SEI compounds as foundwhen FEC is used as solvent or additive.12 Harris and Lu16,17 show,that SEI consists of a porous outer layer and a dense inner (closethe the electrode) layer by using isotope tracer and depth profilingtechniques such as TOF-SIMS. Evidence for a dual-layer structureis found in the chemical composition of the film. Solid state NMRstudies also suggest that SEI is at least partially porous.7
To summarize, there is a general understanding of SEI compo-sition and morphology for few specific systems. Especially SEIs ongraphite electrodes in organic solvents are studied and optimized forbattery performance in several studies. This vast amount of infor-mation creates the elusive conclusion that SEI is well understood.However, several key questions about basic SEI mechanisms haveyet to be answered. Most striking is the fact that the mechanism forlithium-ion transport through the SEI is still debated. Shi et al. pro-pose a ”knock-of” diffusion mechanism for lithium-ion interstitials inLi2CO3.18 Diffusion of lithium-ions through Li2EDC is modeled byBorodin et al.19 At the same time Zhang et al. suggest that lithium-ionsdiffuse and migrate along boundaries between different SEI species.20
Another open question is the process of initial SEI formation where
Reproduced from reference [150] under the terms of the Creative CommonsAttribution 4.0 License, https://creativecommons.org/licenses/by/4.0/.
121
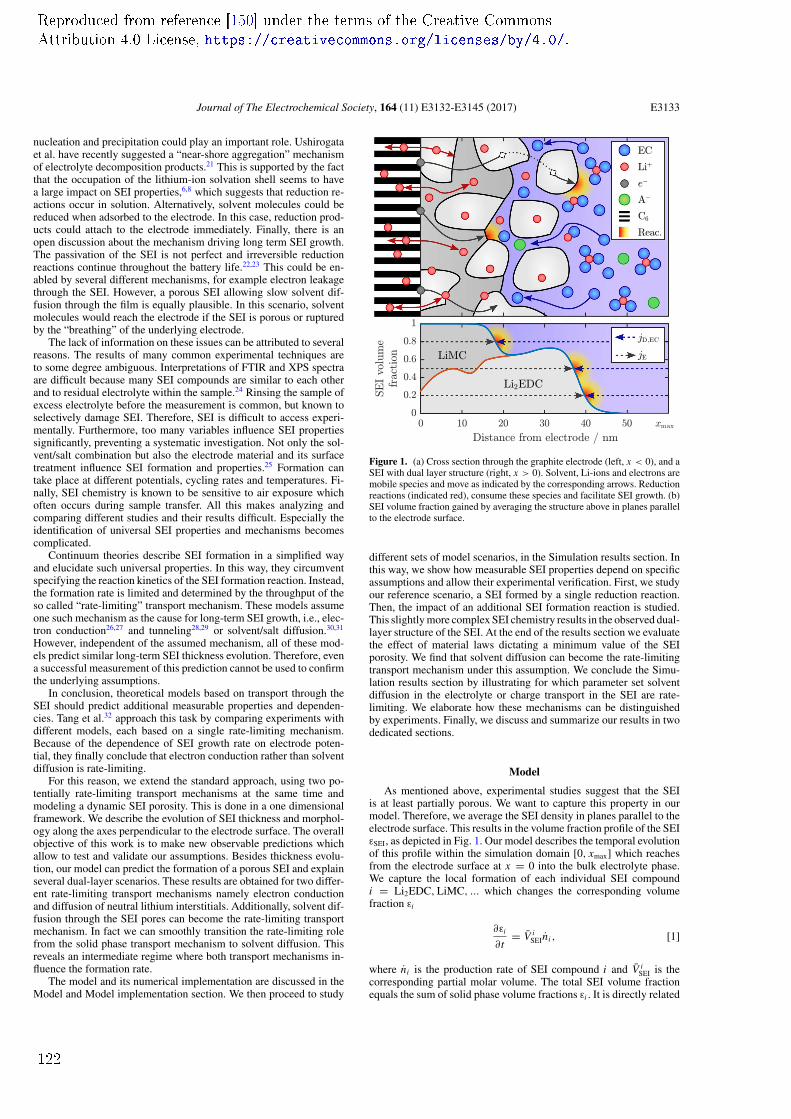
Journal of The Electrochemical Society, 164 (11) E3132-E3145 (2017) E3133
nucleation and precipitation could play an important role. Ushirogataet al. have recently suggested a “near-shore aggregation” mechanismof electrolyte decomposition products.21 This is supported by the factthat the occupation of the lithium-ion solvation shell seems to havea large impact on SEI properties,6,8 which suggests that reduction re-actions occur in solution. Alternatively, solvent molecules could bereduced when adsorbed to the electrode. In this case, reduction prod-ucts could attach to the electrode immediately. Finally, there is anopen discussion about the mechanism driving long term SEI growth.The passivation of the SEI is not perfect and irreversible reductionreactions continue throughout the battery life.22,23 This could be en-abled by several different mechanisms, for example electron leakagethrough the SEI. However, a porous SEI allowing slow solvent dif-fusion through the film is equally plausible. In this scenario, solventmolecules would reach the electrode if the SEI is porous or rupturedby the “breathing” of the underlying electrode.
The lack of information on these issues can be attributed to severalreasons. The results of many common experimental techniques areto some degree ambiguous. Interpretations of FTIR and XPS spectraare difficult because many SEI compounds are similar to each otherand to residual electrolyte within the sample.24 Rinsing the sample ofexcess electrolyte before the measurement is common, but known toselectively damage SEI. Therefore, SEI is difficult to access experi-mentally. Furthermore, too many variables influence SEI propertiessignificantly, preventing a systematic investigation. Not only the sol-vent/salt combination but also the electrode material and its surfacetreatment influence SEI formation and properties.25 Formation cantake place at different potentials, cycling rates and temperatures. Fi-nally, SEI chemistry is known to be sensitive to air exposure whichoften occurs during sample transfer. All this makes analyzing andcomparing different studies and their results difficult. Especially theidentification of universal SEI properties and mechanisms becomescomplicated.
Continuum theories describe SEI formation in a simplified wayand elucidate such universal properties. In this way, they circumventspecifying the reaction kinetics of the SEI formation reaction. Instead,the formation rate is limited and determined by the throughput of theso called “rate-limiting” transport mechanism. These models assumeone such mechanism as the cause for long-term SEI growth, i.e., elec-tron conduction26,27 and tunneling28,29 or solvent/salt diffusion.30,31
However, independent of the assumed mechanism, all of these mod-els predict similar long-term SEI thickness evolution. Therefore, evena successful measurement of this prediction cannot be used to confirmthe underlying assumptions.
In conclusion, theoretical models based on transport through theSEI should predict additional measurable properties and dependen-cies. Tang et al.32 approach this task by comparing experiments withdifferent models, each based on a single rate-limiting mechanism.Because of the dependence of SEI growth rate on electrode poten-tial, they finally conclude that electron conduction rather than solventdiffusion is rate-limiting.
For this reason, we extend the standard approach, using two po-tentially rate-limiting transport mechanisms at the same time andmodeling a dynamic SEI porosity. This is done in a one dimensionalframework. We describe the evolution of SEI thickness and morphol-ogy along the axes perpendicular to the electrode surface. The overallobjective of this work is to make new observable predictions whichallow to test and validate our assumptions. Besides thickness evolu-tion, our model can predict the formation of a porous SEI and explainseveral dual-layer scenarios. These results are obtained for two differ-ent rate-limiting transport mechanisms namely electron conductionand diffusion of neutral lithium interstitials. Additionally, solvent dif-fusion through the SEI pores can become the rate-limiting transportmechanism. In fact we can smoothly transition the rate-limiting rolefrom the solid phase transport mechanism to solvent diffusion. Thisreveals an intermediate regime where both transport mechanisms in-fluence the formation rate.
The model and its numerical implementation are discussed in theModel and Model implementation section. We then proceed to study
Figure 1. (a) Cross section through the graphite electrode (left, x < 0), and aSEI with dual layer structure (right, x > 0). Solvent, Li-ions and electrons aremobile species and move as indicated by the corresponding arrows. Reductionreactions (indicated red), consume these species and facilitate SEI growth. (b)SEI volume fraction gained by averaging the structure above in planes parallelto the electrode surface.
different sets of model scenarios, in the Simulation results section. Inthis way, we show how measurable SEI properties depend on specificassumptions and allow their experimental verification. First, we studyour reference scenario, a SEI formed by a single reduction reaction.Then, the impact of an additional SEI formation reaction is studied.This slightly more complex SEI chemistry results in the observed dual-layer structure of the SEI. At the end of the results section we evaluatethe effect of material laws dictating a minimum value of the SEIporosity. We find that solvent diffusion can become the rate-limitingtransport mechanism under this assumption. We conclude the Simu-lation results section by illustrating for which parameter set solventdiffusion in the electrolyte or charge transport in the SEI are rate-limiting. We elaborate how these mechanisms can be distinguishedby experiments. Finally, we discuss and summarize our results in twodedicated sections.
Model
As mentioned above, experimental studies suggest that the SEIis at least partially porous. We want to capture this property in ourmodel. Therefore, we average the SEI density in planes parallel to theelectrode surface. This results in the volume fraction profile of the SEIεSEI, as depicted in Fig. 1. Our model describes the temporal evolutionof this profile within the simulation domain [0, xmax] which reachesfrom the electrode surface at x = 0 into the bulk electrolyte phase.We capture the local formation of each individual SEI compoundi = Li2EDC, LiMC, ... which changes the corresponding volumefraction εi
∂εi
∂t= V i
SEIni , [1]
where ni is the production rate of SEI compound i and V iSEI is the
corresponding partial molar volume. The total SEI volume fractionequals the sum of solid phase volume fractions εi . It is directly related
Reproduced from reference [150] under the terms of the Creative CommonsAttribution 4.0 License, https://creativecommons.org/licenses/by/4.0/.
122
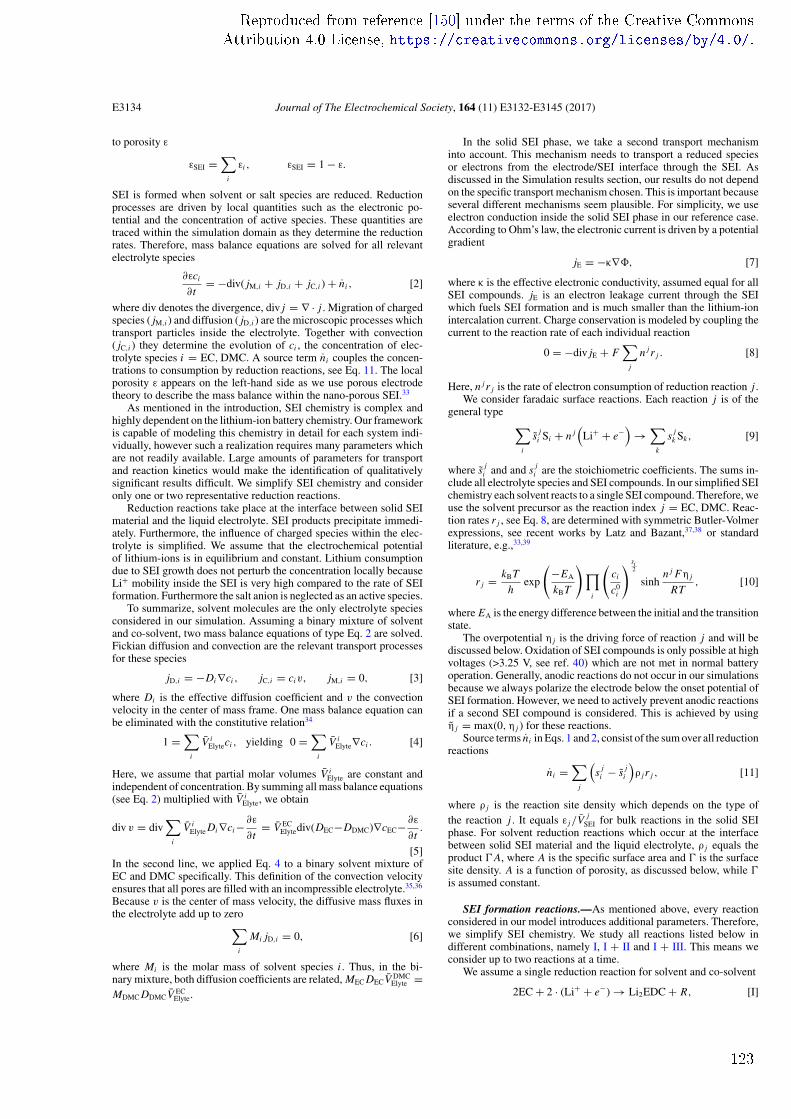
E3134 Journal of The Electrochemical Society, 164 (11) E3132-E3145 (2017)
to porosity ε
εSEI =∑
i
εi , εSEI = 1 − ε.
SEI is formed when solvent or salt species are reduced. Reductionprocesses are driven by local quantities such as the electronic po-tential and the concentration of active species. These quantities aretraced within the simulation domain as they determine the reductionrates. Therefore, mass balance equations are solved for all relevantelectrolyte species
∂εci
∂t= −div( jM,i + jD,i + jC,i ) + ni , [2]
where div denotes the divergence, div j = ∇ · j . Migration of chargedspecies ( jM,i ) and diffusion ( jD,i ) are the microscopic processes whichtransport particles inside the electrolyte. Together with convection( jC,i ) they determine the evolution of ci , the concentration of elec-trolyte species i = EC, DMC. A source term ni couples the concen-trations to consumption by reduction reactions, see Eq. 11. The localporosity ε appears on the left-hand side as we use porous electrodetheory to describe the mass balance within the nano-porous SEI.33
As mentioned in the introduction, SEI chemistry is complex andhighly dependent on the lithium-ion battery chemistry. Our frameworkis capable of modeling this chemistry in detail for each system indi-vidually, however such a realization requires many parameters whichare not readily available. Large amounts of parameters for transportand reaction kinetics would make the identification of qualitativelysignificant results difficult. We simplify SEI chemistry and consideronly one or two representative reduction reactions.
Reduction reactions take place at the interface between solid SEImaterial and the liquid electrolyte. SEI products precipitate immedi-ately. Furthermore, the influence of charged species within the elec-trolyte is simplified. We assume that the electrochemical potentialof lithium-ions is in equilibrium and constant. Lithium consumptiondue to SEI growth does not perturb the concentration locally becauseLi+ mobility inside the SEI is very high compared to the rate of SEIformation. Furthermore the salt anion is neglected as an active species.
To summarize, solvent molecules are the only electrolyte speciesconsidered in our simulation. Assuming a binary mixture of solventand co-solvent, two mass balance equations of type Eq. 2 are solved.Fickian diffusion and convection are the relevant transport processesfor these species
jD,i = −Di∇ci , jC,i = civ, jM,i = 0, [3]
where Di is the effective diffusion coefficient and v the convectionvelocity in the center of mass frame. One mass balance equation canbe eliminated with the constitutive relation34
1 =∑
i
V iElyteci , yielding 0 =
∑i
V iElyte∇ci . [4]
Here, we assume that partial molar volumes V iElyte are constant and
independent of concentration. By summing all mass balance equations(see Eq. 2) multiplied with V i
Elyte, we obtain
div v = div∑
i
V iElyte Di∇ci − ∂ε
∂t= V EC
Elytediv(DEC−DDMC)∇cEC− ∂ε
∂t.
[5]In the second line, we applied Eq. 4 to a binary solvent mixture ofEC and DMC specifically. This definition of the convection velocityensures that all pores are filled with an incompressible electrolyte.35,36
Because v is the center of mass velocity, the diffusive mass fluxes inthe electrolyte add up to zero∑
i
Mi jD,i = 0, [6]
where Mi is the molar mass of solvent species i . Thus, in the bi-nary mixture, both diffusion coefficients are related, MEC DECV DMC
Elyte =MDMC DDMCV EC
Elyte.
In the solid SEI phase, we take a second transport mechanisminto account. This mechanism needs to transport a reduced speciesor electrons from the electrode/SEI interface through the SEI. Asdiscussed in the Simulation results section, our results do not dependon the specific transport mechanism chosen. This is important becauseseveral different mechanisms seem plausible. For simplicity, we useelectron conduction inside the solid SEI phase in our reference case.According to Ohm’s law, the electronic current is driven by a potentialgradient
jE = −κ∇, [7]
where κ is the effective electronic conductivity, assumed equal for allSEI compounds. jE is an electron leakage current through the SEIwhich fuels SEI formation and is much smaller than the lithium-ionintercalation current. Charge conservation is modeled by coupling thecurrent to the reaction rate of each individual reaction
0 = −div jE + F∑
j
n j r j . [8]
Here, n jr j is the rate of electron consumption of reduction reaction j .We consider faradaic surface reactions. Each reaction j is of the
general type ∑i
s ji Si + n j
(Li+ + e−
)→
∑k
s jk Sk, [9]
where s ji and and s j
i are the stoichiometric coefficients. The sums in-clude all electrolyte species and SEI compounds. In our simplified SEIchemistry each solvent reacts to a single SEI compound. Therefore, weuse the solvent precursor as the reaction index j = EC, DMC. Reac-tion rates r j , see Eq. 8, are determined with symmetric Butler-Volmerexpressions, see recent works by Latz and Bazant,37,38 or standardliterature, e.g.,33,39
r j = kBT
hexp
(−EA
kBT
) ∏i
(ci
c0i
) si2
sinhn j Fη j
RT, [10]
where EA is the energy difference between the initial and the transitionstate.
The overpotential η j is the driving force of reaction j and will bediscussed below. Oxidation of SEI compounds is only possible at highvoltages (>3.25 V, see ref. 40) which are not met in normal batteryoperation. Generally, anodic reactions do not occur in our simulationsbecause we always polarize the electrode below the onset potential ofSEI formation. However, we need to actively prevent anodic reactionsif a second SEI compound is considered. This is achieved by usingη j = max(0,η j ) for these reactions.
Source terms ni in Eqs. 1 and 2, consist of the sum over all reductionreactions
ni =∑
j
(s j
i − s ji
)ρ j r j , [11]
where ρ j is the reaction site density which depends on the type ofthe reaction j . It equals ε j/V j
SEI for bulk reactions in the solid SEIphase. For solvent reduction reactions which occur at the interfacebetween solid SEI material and the liquid electrolyte, ρ j equals theproduct A, where A is the specific surface area and is the surfacesite density. A is a function of porosity, as discussed below, while is assumed constant.
SEI formation reactions.—As mentioned above, every reactionconsidered in our model introduces additional parameters. Therefore,we simplify SEI chemistry. We study all reactions listed below indifferent combinations, namely I, I + II and I + III. This means weconsider up to two reactions at a time.
We assume a single reduction reaction for solvent and co-solvent
2EC + 2 · (Li+ + e−) → Li2EDC + R, [I]
Reproduced from reference [150] under the terms of the Creative CommonsAttribution 4.0 License, https://creativecommons.org/licenses/by/4.0/.
123
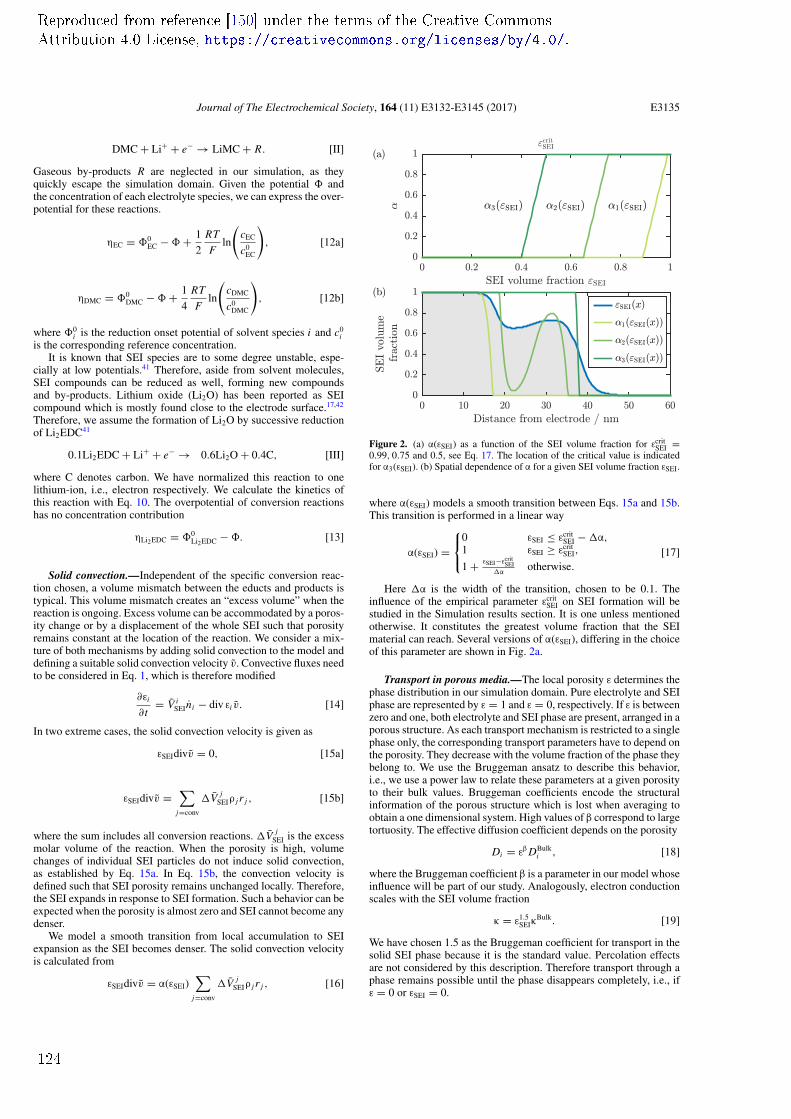
Journal of The Electrochemical Society, 164 (11) E3132-E3145 (2017) E3135
DMC + Li+ + e− → LiMC + R. [II]
Gaseous by-products R are neglected in our simulation, as theyquickly escape the simulation domain. Given the potential andthe concentration of each electrolyte species, we can express the over-potential for these reactions.
ηEC = 0EC − + 1
2
RT
Fln
(cEC
c0EC
), [12a]
ηDMC = 0DMC − + 1
4
RT
Fln
(cDMC
c0DMC
), [12b]
where 0i is the reduction onset potential of solvent species i and c0
iis the corresponding reference concentration.
It is known that SEI species are to some degree unstable, espe-cially at low potentials.41 Therefore, aside from solvent molecules,SEI compounds can be reduced as well, forming new compoundsand by-products. Lithium oxide (Li2O) has been reported as SEIcompound which is mostly found close to the electrode surface.17,42
Therefore, we assume the formation of Li2O by successive reductionof Li2EDC41
0.1Li2EDC + Li+ + e− → 0.6Li2O + 0.4C, [III]
where C denotes carbon. We have normalized this reaction to onelithium-ion, i.e., electron respectively. We calculate the kinetics ofthis reaction with Eq. 10. The overpotential of conversion reactionshas no concentration contribution
ηLi2EDC = 0Li2EDC − . [13]
Solid convection.—Independent of the specific conversion reac-tion chosen, a volume mismatch between the educts and products istypical. This volume mismatch creates an “excess volume” when thereaction is ongoing. Excess volume can be accommodated by a poros-ity change or by a displacement of the whole SEI such that porosityremains constant at the location of the reaction. We consider a mix-ture of both mechanisms by adding solid convection to the model anddefining a suitable solid convection velocity v. Convective fluxes needto be considered in Eq. 1, which is therefore modified
∂εi
∂t= V i
SEIni − div εi v. [14]
In two extreme cases, the solid convection velocity is given as
εSEIdivv = 0, [15a]
εSEIdivv =∑
j=conv
V jSEIρ j r j , [15b]
where the sum includes all conversion reactions. V jSEI is the excess
molar volume of the reaction. When the porosity is high, volumechanges of individual SEI particles do not induce solid convection,as established by Eq. 15a. In Eq. 15b, the convection velocity isdefined such that SEI porosity remains unchanged locally. Therefore,the SEI expands in response to SEI formation. Such a behavior can beexpected when the porosity is almost zero and SEI cannot become anydenser.
We model a smooth transition from local accumulation to SEIexpansion as the SEI becomes denser. The solid convection velocityis calculated from
εSEIdivv = α(εSEI)∑
j=conv
V jSEIρ j r j , [16]
Figure 2. (a) α(εSEI) as a function of the SEI volume fraction for εcritSEI =
0.99, 0.75 and 0.5, see Eq. 17. The location of the critical value is indicatedfor α3(εSEI). (b) Spatial dependence of α for a given SEI volume fraction εSEI.
where α(εSEI) models a smooth transition between Eqs. 15a and 15b.This transition is performed in a linear way
α(εSEI) =⎧⎨⎩
0 εSEI ≤ εcritSEI − α,
1 εSEI ≥ εcritSEI,
1 + εSEI−εcritSEI
αotherwise.
[17]
Here α is the width of the transition, chosen to be 0.1. Theinfluence of the empirical parameter εcrit
SEI on SEI formation will bestudied in the Simulation results section. It is one unless mentionedotherwise. It constitutes the greatest volume fraction that the SEImaterial can reach. Several versions of α(εSEI), differing in the choiceof this parameter are shown in Fig. 2a.
Transport in porous media.—The local porosity ε determines thephase distribution in our simulation domain. Pure electrolyte and SEIphase are represented by ε = 1 and ε = 0, respectively. If ε is betweenzero and one, both electrolyte and SEI phase are present, arranged in aporous structure. As each transport mechanism is restricted to a singlephase only, the corresponding transport parameters have to depend onthe porosity. They decrease with the volume fraction of the phase theybelong to. We use the Bruggeman ansatz to describe this behavior,i.e., we use a power law to relate these parameters at a given porosityto their bulk values. Bruggeman coefficients encode the structuralinformation of the porous structure which is lost when averaging toobtain a one dimensional system. High values of β correspond to largetortuosity. The effective diffusion coefficient depends on the porosity
Di = εβ DBulki , [18]
where the Bruggeman coefficient β is a parameter in our model whoseinfluence will be part of our study. Analogously, electron conductionscales with the SEI volume fraction
κ = ε1.5SEIκ
Bulk. [19]
We have chosen 1.5 as the Bruggeman coefficient for transport in thesolid SEI phase because it is the standard value. Percolation effectsare not considered by this description. Therefore transport through aphase remains possible until the phase disappears completely, i.e., ifε = 0 or εSEI = 0.
Reproduced from reference [150] under the terms of the Creative CommonsAttribution 4.0 License, https://creativecommons.org/licenses/by/4.0/.
124
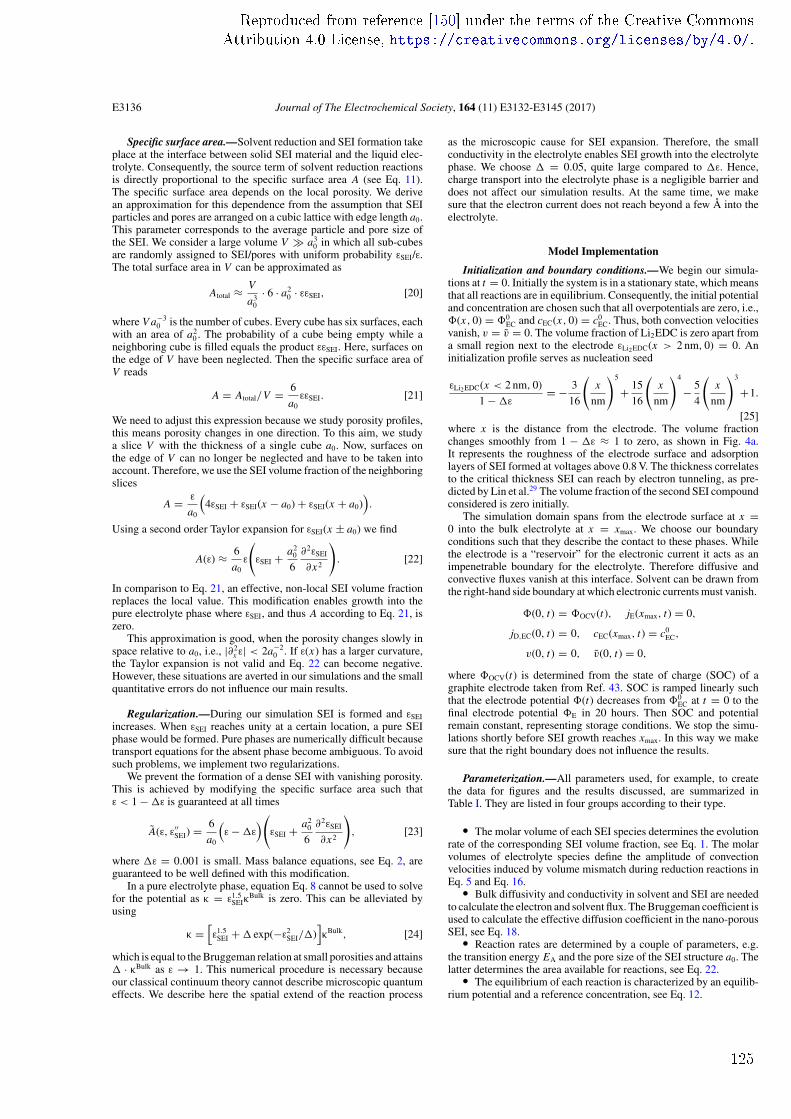
E3136 Journal of The Electrochemical Society, 164 (11) E3132-E3145 (2017)
Specific surface area.—Solvent reduction and SEI formation takeplace at the interface between solid SEI material and the liquid elec-trolyte. Consequently, the source term of solvent reduction reactionsis directly proportional to the specific surface area A (see Eq. 11).The specific surface area depends on the local porosity. We derivean approximation for this dependence from the assumption that SEIparticles and pores are arranged on a cubic lattice with edge length a0.This parameter corresponds to the average particle and pore size ofthe SEI. We consider a large volume V a3
0 in which all sub-cubesare randomly assigned to SEI/pores with uniform probability εSEI/ε.The total surface area in V can be approximated as
Atotal ≈ V
a30
· 6 · a20 · εεSEI, [20]
where V a−30 is the number of cubes. Every cube has six surfaces, each
with an area of a20 . The probability of a cube being empty while a
neighboring cube is filled equals the product εεSEI. Here, surfaces onthe edge of V have been neglected. Then the specific surface area ofV reads
A = Atotal/V = 6
a0εεSEI. [21]
We need to adjust this expression because we study porosity profiles,this means porosity changes in one direction. To this aim, we studya slice V with the thickness of a single cube a0. Now, surfaces onthe edge of V can no longer be neglected and have to be taken intoaccount. Therefore, we use the SEI volume fraction of the neighboringslices
A = ε
a0
(4εSEI + εSEI(x − a0) + εSEI(x + a0)
).
Using a second order Taylor expansion for εSEI(x ± a0) we find
A(ε) ≈ 6
a0ε
(εSEI + a2
0
6
∂2εSEI
∂x2
). [22]
In comparison to Eq. 21, an effective, non-local SEI volume fractionreplaces the local value. This modification enables growth into thepure electrolyte phase where εSEI, and thus A according to Eq. 21, iszero.
This approximation is good, when the porosity changes slowly inspace relative to a0, i.e., |∂2
x ε| < 2a−20 . If ε(x) has a larger curvature,
the Taylor expansion is not valid and Eq. 22 can become negative.However, these situations are averted in our simulations and the smallquantitative errors do not influence our main results.
Regularization.—During our simulation SEI is formed and εSEI
increases. When εSEI reaches unity at a certain location, a pure SEIphase would be formed. Pure phases are numerically difficult becausetransport equations for the absent phase become ambiguous. To avoidsuch problems, we implement two regularizations.
We prevent the formation of a dense SEI with vanishing porosity.This is achieved by modifying the specific surface area such thatε < 1 − ε is guaranteed at all times
A(ε, ε′′SEI) = 6
a0
(ε − ε
)(εSEI + a2
0
6
∂2εSEI
∂x2
), [23]
where ε = 0.001 is small. Mass balance equations, see Eq. 2, areguaranteed to be well defined with this modification.
In a pure electrolyte phase, equation Eq. 8 cannot be used to solvefor the potential as κ = ε1.5
SEIκBulk is zero. This can be alleviated by
using
κ =[ε1.5
SEI + exp(−ε2SEI/)
]κBulk, [24]
which is equal to the Bruggeman relation at small porosities and attains · κBulk as ε → 1. This numerical procedure is necessary becauseour classical continuum theory cannot describe microscopic quantumeffects. We describe here the spatial extend of the reaction process
as the microscopic cause for SEI expansion. Therefore, the smallconductivity in the electrolyte enables SEI growth into the electrolytephase. We choose = 0.05, quite large compared to ε. Hence,charge transport into the electrolyte phase is a negligible barrier anddoes not affect our simulation results. At the same time, we makesure that the electron current does not reach beyond a few Å into theelectrolyte.
Model Implementation
Initialization and boundary conditions.—We begin our simula-tions at t = 0. Initially the system is in a stationary state, which meansthat all reactions are in equilibrium. Consequently, the initial potentialand concentration are chosen such that all overpotentials are zero, i.e.,(x, 0) = 0
EC and cEC(x, 0) = c0EC. Thus, both convection velocities
vanish, v = v = 0. The volume fraction of Li2EDC is zero apart froma small region next to the electrode εLi2EDC(x > 2 nm, 0) = 0. Aninitialization profile serves as nucleation seed
εLi2EDC(x < 2 nm, 0)
1 − ε= − 3
16
(x
nm
)5
+ 15
16
(x
nm
)4
− 5
4
(x
nm
)3
+1.
[25]where x is the distance from the electrode. The volume fractionchanges smoothly from 1 − ε ≈ 1 to zero, as shown in Fig. 4a.It represents the roughness of the electrode surface and adsorptionlayers of SEI formed at voltages above 0.8 V. The thickness correlatesto the critical thickness SEI can reach by electron tunneling, as pre-dicted by Lin et al.29 The volume fraction of the second SEI compoundconsidered is zero initially.
The simulation domain spans from the electrode surface at x =0 into the bulk electrolyte at x = xmax. We choose our boundaryconditions such that they describe the contact to these phases. Whilethe electrode is a “reservoir” for the electronic current it acts as animpenetrable boundary for the electrolyte. Therefore diffusive andconvective fluxes vanish at this interface. Solvent can be drawn fromthe right-hand side boundary at which electronic currents must vanish.
(0, t) = OCV(t), jE(xmax, t) = 0,
jD,EC(0, t) = 0, cEC(xmax, t) = c0EC,
v(0, t) = 0, v(0, t) = 0,
where OCV(t) is determined from the state of charge (SOC) of agraphite electrode taken from Ref. 43. SOC is ramped linearly suchthat the electrode potential (t) decreases from 0
EC at t = 0 to thefinal electrode potential E in 20 hours. Then SOC and potentialremain constant, representing storage conditions. We stop the simu-lations shortly before SEI growth reaches xmax. In this way we makesure that the right boundary does not influence the results.
Parameterization.—All parameters used, for example, to createthe data for figures and the results discussed, are summarized inTable I. They are listed in four groups according to their type. The molar volume of each SEI species determines the evolutionrate of the corresponding SEI volume fraction, see Eq. 1. The molarvolumes of electrolyte species define the amplitude of convectionvelocities induced by volume mismatch during reduction reactions inEq. 5 and Eq. 16. Bulk diffusivity and conductivity in solvent and SEI are neededto calculate the electron and solvent flux. The Bruggeman coefficient isused to calculate the effective diffusion coefficient in the nano-porousSEI, see Eq. 18. Reaction rates are determined by a couple of parameters, e.g.the transition energy EA and the pore size of the SEI structure a0. Thelatter determines the area available for reactions, see Eq. 22. The equilibrium of each reaction is characterized by an equilib-rium potential and a reference concentration, see Eq. 12.
Reproduced from reference [150] under the terms of the Creative CommonsAttribution 4.0 License, https://creativecommons.org/licenses/by/4.0/.
125
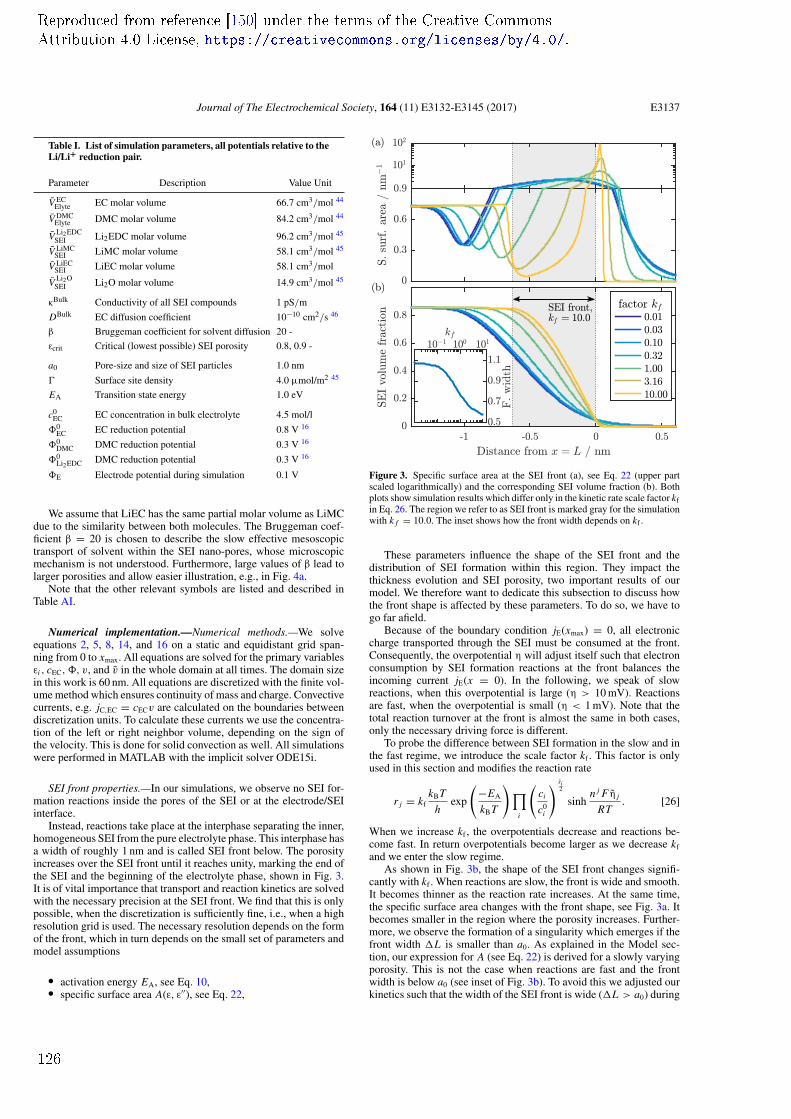
Journal of The Electrochemical Society, 164 (11) E3132-E3145 (2017) E3137
Table I. List of simulation parameters, all potentials relative to theLi/Li+ reduction pair.
Parameter Description Value Unit
V ECElyte EC molar volume 66.7 cm3/mol 44
V DMCElyte DMC molar volume 84.2 cm3/mol 44
V Li2EDCSEI Li2EDC molar volume 96.2 cm3/mol 45
V LiMCSEI LiMC molar volume 58.1 cm3/mol 45
V LiECSEI LiEC molar volume 58.1 cm3/mol
V Li2OSEI Li2O molar volume 14.9 cm3/mol 45
κBulk Conductivity of all SEI compounds 1 pS/m
DBulk EC diffusion coefficient 10−10 cm2/s 46
β Bruggeman coefficient for solvent diffusion 20 -
εcrit Critical (lowest possible) SEI porosity 0.8, 0.9 -
a0 Pore-size and size of SEI particles 1.0 nm
Surface site density 4.0 μmol/m2 45
EA Transition state energy 1.0 eV
c0EC EC concentration in bulk electrolyte 4.5 mol/l
0EC EC reduction potential 0.8 V 16
0DMC DMC reduction potential 0.3 V 16
0Li2EDC DMC reduction potential 0.3 V 16
E Electrode potential during simulation 0.1 V
We assume that LiEC has the same partial molar volume as LiMCdue to the similarity between both molecules. The Bruggeman coef-ficient β = 20 is chosen to describe the slow effective mesoscopictransport of solvent within the SEI nano-pores, whose microscopicmechanism is not understood. Furthermore, large values of β lead tolarger porosities and allow easier illustration, e.g., in Fig. 4a.
Note that the other relevant symbols are listed and described inTable AI.
Numerical implementation.—Numerical methods.—We solveequations 2, 5, 8, 14, and 16 on a static and equidistant grid span-ning from 0 to xmax. All equations are solved for the primary variablesεi , cEC, , v, and v in the whole domain at all times. The domain sizein this work is 60 nm. All equations are discretized with the finite vol-ume method which ensures continuity of mass and charge. Convectivecurrents, e.g. jC,EC = cECv are calculated on the boundaries betweendiscretization units. To calculate these currents we use the concentra-tion of the left or right neighbor volume, depending on the sign ofthe velocity. This is done for solid convection as well. All simulationswere performed in MATLAB with the implicit solver ODE15i.
SEI front properties.—In our simulations, we observe no SEI for-mation reactions inside the pores of the SEI or at the electrode/SEIinterface.
Instead, reactions take place at the interphase separating the inner,homogeneous SEI from the pure electrolyte phase. This interphase hasa width of roughly 1 nm and is called SEI front below. The porosityincreases over the SEI front until it reaches unity, marking the end ofthe SEI and the beginning of the electrolyte phase, shown in Fig. 3.It is of vital importance that transport and reaction kinetics are solvedwith the necessary precision at the SEI front. We find that this is onlypossible, when the discretization is sufficiently fine, i.e., when a highresolution grid is used. The necessary resolution depends on the formof the front, which in turn depends on the small set of parameters andmodel assumptions activation energy EA, see Eq. 10, specific surface area A(ε, ε′′), see Eq. 22,
Figure 3. Specific surface area at the SEI front (a), see Eq. 22 (upper partscaled logarithmically) and the corresponding SEI volume fraction (b). Bothplots show simulation results which differ only in the kinetic rate scale factor kfin Eq. 26. The region we refer to as SEI front is marked gray for the simulationwith k f = 10.0. The inset shows how the front width depends on kf .
These parameters influence the shape of the SEI front and thedistribution of SEI formation within this region. They impact thethickness evolution and SEI porosity, two important results of ourmodel. We therefore want to dedicate this subsection to discuss howthe front shape is affected by these parameters. To do so, we have togo far afield.
Because of the boundary condition jE(xmax) = 0, all electroniccharge transported through the SEI must be consumed at the front.Consequently, the overpotential η will adjust itself such that electronconsumption by SEI formation reactions at the front balances theincoming current jE(x = 0). In the following, we speak of slowreactions, when this overpotential is large (η > 10 mV). Reactionsare fast, when the overpotential is small (η < 1 mV). Note that thetotal reaction turnover at the front is almost the same in both cases,only the necessary driving force is different.
To probe the difference between SEI formation in the slow and inthe fast regime, we introduce the scale factor kf . This factor is onlyused in this section and modifies the reaction rate
r j = kfkBT
hexp
(−EA
kBT
)∏i
(ci
c0i
) si2
sinhn j F η j
RT. [26]
When we increase kf , the overpotentials decrease and reactions be-come fast. In return overpotentials become larger as we decrease kf
and we enter the slow regime.As shown in Fig. 3b, the shape of the SEI front changes signifi-
cantly with kf . When reactions are slow, the front is wide and smooth.It becomes thinner as the reaction rate increases. At the same time,the specific surface area changes with the front shape, see Fig. 3a. Itbecomes smaller in the region where the porosity increases. Further-more, we observe the formation of a singularity which emerges if thefront width L is smaller than a0. As explained in the Model sec-tion, our expression for A (see Eq. 22) is derived for a slowly varyingporosity. This is not the case when reactions are fast and the frontwidth is below a0 (see inset of Fig. 3b). To avoid this we adjusted ourkinetics such that the width of the SEI front is wide (L > a0) during
Reproduced from reference [150] under the terms of the Creative CommonsAttribution 4.0 License, https://creativecommons.org/licenses/by/4.0/.
126
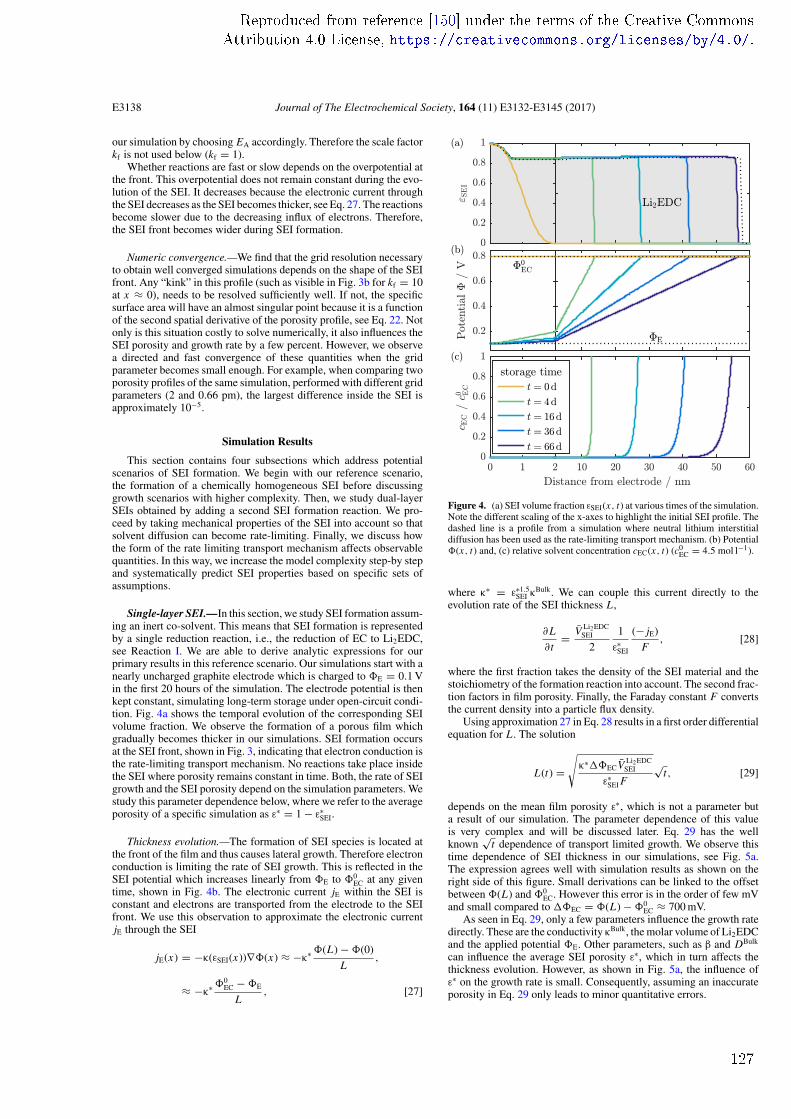
E3138 Journal of The Electrochemical Society, 164 (11) E3132-E3145 (2017)
our simulation by choosing EA accordingly. Therefore the scale factorkf is not used below (kf = 1).
Whether reactions are fast or slow depends on the overpotential atthe front. This overpotential does not remain constant during the evo-lution of the SEI. It decreases because the electronic current throughthe SEI decreases as the SEI becomes thicker, see Eq. 27. The reactionsbecome slower due to the decreasing influx of electrons. Therefore,the SEI front becomes wider during SEI formation.
Numeric convergence.—We find that the grid resolution necessaryto obtain well converged simulations depends on the shape of the SEIfront. Any “kink” in this profile (such as visible in Fig. 3b for kf = 10at x ≈ 0), needs to be resolved sufficiently well. If not, the specificsurface area will have an almost singular point because it is a functionof the second spatial derivative of the porosity profile, see Eq. 22. Notonly is this situation costly to solve numerically, it also influences theSEI porosity and growth rate by a few percent. However, we observea directed and fast convergence of these quantities when the gridparameter becomes small enough. For example, when comparing twoporosity profiles of the same simulation, performed with different gridparameters (2 and 0.66 pm), the largest difference inside the SEI isapproximately 10−5.
Simulation Results
This section contains four subsections which address potentialscenarios of SEI formation. We begin with our reference scenario,the formation of a chemically homogeneous SEI before discussinggrowth scenarios with higher complexity. Then, we study dual-layerSEIs obtained by adding a second SEI formation reaction. We pro-ceed by taking mechanical properties of the SEI into account so thatsolvent diffusion can become rate-limiting. Finally, we discuss howthe form of the rate limiting transport mechanism affects observablequantities. In this way, we increase the model complexity step-by stepand systematically predict SEI properties based on specific sets ofassumptions.
Single-layer SEI.—In this section, we study SEI formation assum-ing an inert co-solvent. This means that SEI formation is representedby a single reduction reaction, i.e., the reduction of EC to Li2EDC,see Reaction I. We are able to derive analytic expressions for ourprimary results in this reference scenario. Our simulations start with anearly uncharged graphite electrode which is charged to E = 0.1 Vin the first 20 hours of the simulation. The electrode potential is thenkept constant, simulating long-term storage under open-circuit condi-tion. Fig. 4a shows the temporal evolution of the corresponding SEIvolume fraction. We observe the formation of a porous film whichgradually becomes thicker in our simulations. SEI formation occursat the SEI front, shown in Fig. 3, indicating that electron conduction isthe rate-limiting transport mechanism. No reactions take place insidethe SEI where porosity remains constant in time. Both, the rate of SEIgrowth and the SEI porosity depend on the simulation parameters. Westudy this parameter dependence below, where we refer to the averageporosity of a specific simulation as ε∗ = 1 − ε∗
SEI.
Thickness evolution.—The formation of SEI species is located atthe front of the film and thus causes lateral growth. Therefore electronconduction is limiting the rate of SEI growth. This is reflected in theSEI potential which increases linearly from E to 0
EC at any giventime, shown in Fig. 4b. The electronic current jE within the SEI isconstant and electrons are transported from the electrode to the SEIfront. We use this observation to approximate the electronic currentjE through the SEI
jE(x) = −κ(εSEI(x))∇(x) ≈ −κ∗ (L) − (0)
L,
≈ −κ∗ 0EC − E
L, [27]
Figure 4. (a) SEI volume fraction εSEI(x, t) at various times of the simulation.Note the different scaling of the x-axes to highlight the initial SEI profile. Thedashed line is a profile from a simulation where neutral lithium interstitialdiffusion has been used as the rate-limiting transport mechanism. (b) Potential(x, t) and, (c) relative solvent concentration cEC(x, t) (c0
EC = 4.5 mol l−1).
where κ∗ = ε∗1.5SEI κBulk. We can couple this current directly to the
evolution rate of the SEI thickness L ,
∂L
∂t= V Li2EDC
SEI
2
1
ε∗SEI
(− jE)
F, [28]
where the first fraction takes the density of the SEI material and thestoichiometry of the formation reaction into account. The second frac-tion factors in film porosity. Finally, the Faraday constant F convertsthe current density into a particle flux density.
Using approximation 27 in Eq. 28 results in a first order differentialequation for L . The solution
L(t) =√
κ∗ECV Li2EDCSEI
ε∗SEI F
√t, [29]
depends on the mean film porosity ε∗, which is not a parameter buta result of our simulation. The parameter dependence of this valueis very complex and will be discussed later. Eq. 29 has the wellknown
√t dependence of transport limited growth. We observe this
time dependence of SEI thickness in our simulations, see Fig. 5a.The expression agrees well with simulation results as shown on theright side of this figure. Small derivations can be linked to the offsetbetween (L) and 0
EC. However this error is in the order of few mVand small compared to EC = (L) − 0
EC ≈ 700 mV.As seen in Eq. 29, only a few parameters influence the growth rate
directly. These are the conductivity κBulk, the molar volume of Li2EDCand the applied potential E. Other parameters, such as β and DBulk
can influence the average SEI porosity ε∗, which in turn affects thethickness evolution. However, as shown in Fig. 5a, the influence ofε∗ on the growth rate is small. Consequently, assuming an inaccurateporosity in Eq. 29 only leads to minor quantitative errors.
Reproduced from reference [150] under the terms of the Creative CommonsAttribution 4.0 License, https://creativecommons.org/licenses/by/4.0/.
127
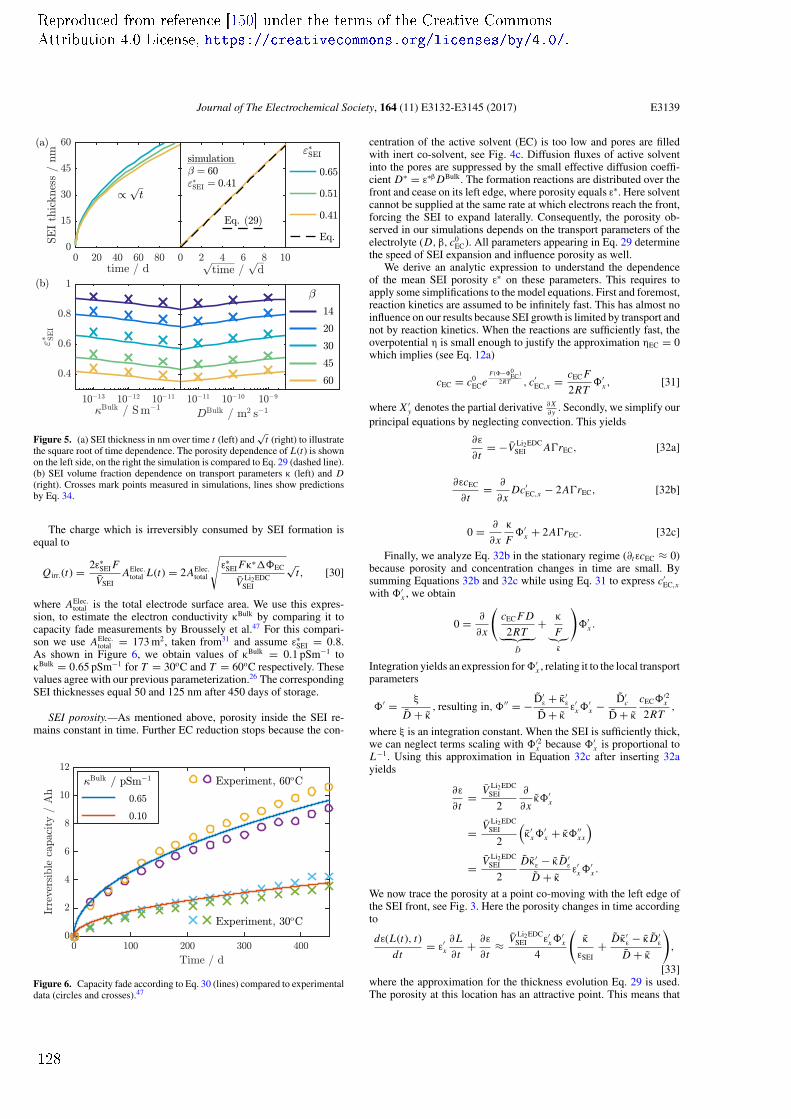
Journal of The Electrochemical Society, 164 (11) E3132-E3145 (2017) E3139
Figure 5. (a) SEI thickness in nm over time t (left) and√
t (right) to illustratethe square root of time dependence. The porosity dependence of L(t) is shownon the left side, on the right the simulation is compared to Eq. 29 (dashed line).(b) SEI volume fraction dependence on transport parameters κ (left) and D(right). Crosses mark points measured in simulations, lines show predictionsby Eq. 34.
The charge which is irreversibly consumed by SEI formation isequal to
Qirr.(t) = 2ε∗SEI F
VSEIAElec.
total L(t) = 2AElec.total
√ε∗
SEI Fκ∗EC
V Li2EDCSEI
√t, [30]
where AElec.total is the total electrode surface area. We use this expres-
sion, to estimate the electron conductivity κBulk by comparing it tocapacity fade measurements by Broussely et al.47 For this compari-son we use AElec.
total = 173 m2, taken from31 and assume ε∗SEI = 0.8.
As shown in Figure 6, we obtain values of κBulk = 0.1 pSm−1 toκBulk = 0.65 pSm−1 for T = 30oC and T = 60oC respectively. Thesevalues agree with our previous parameterization.26 The correspondingSEI thicknesses equal 50 and 125 nm after 450 days of storage.
SEI porosity.—As mentioned above, porosity inside the SEI re-mains constant in time. Further EC reduction stops because the con-
Figure 6. Capacity fade according to Eq. 30 (lines) compared to experimentaldata (circles and crosses).47
centration of the active solvent (EC) is too low and pores are filledwith inert co-solvent, see Fig. 4c. Diffusion fluxes of active solventinto the pores are suppressed by the small effective diffusion coeffi-cient D∗ = ε∗β DBulk. The formation reactions are distributed over thefront and cease on its left edge, where porosity equals ε∗. Here solventcannot be supplied at the same rate at which electrons reach the front,forcing the SEI to expand laterally. Consequently, the porosity ob-served in our simulations depends on the transport parameters of theelectrolyte (D, β, c0
EC). All parameters appearing in Eq. 29 determinethe speed of SEI expansion and influence porosity as well.
We derive an analytic expression to understand the dependenceof the mean SEI porosity ε∗ on these parameters. This requires toapply some simplifications to the model equations. First and foremost,reaction kinetics are assumed to be infinitely fast. This has almost noinfluence on our results because SEI growth is limited by transport andnot by reaction kinetics. When the reactions are sufficiently fast, theoverpotential η is small enough to justify the approximation ηEC = 0which implies (see Eq. 12a)
cEC = c0ECe
F(−0EC)
2RT , c′EC,x = cEC F
2RT′
x , [31]
where X ′y denotes the partial derivative ∂ X
∂y . Secondly, we simplify ourprincipal equations by neglecting convection. This yields
∂ε
∂t= −V Li2EDC
SEI ArEC, [32a]
∂εcEC
∂t= ∂
∂xDc′
EC,x − 2ArEC, [32b]
0 = ∂
∂x
κ
F′
x + 2ArEC. [32c]
Finally, we analyze Eq. 32b in the stationary regime (∂tεcEC ≈ 0)because porosity and concentration changes in time are small. Bysumming Equations 32b and 32c while using Eq. 31 to express c′
EC,xwith ′
x , we obtain
0 = ∂
∂x
(cEC F D
2RT︸ ︷︷ ︸D
+ κ
F︸︷︷︸κ
)′
x .
Integration yields an expression for ′x , relating it to the local transport
parameters
′ = ξ
D + κ, resulting in, ′′ = − D′
ε + κ′ε
D + κε′
x′x − D′
c
D + κ
cEC′2x
2RT,
where ξ is an integration constant. When the SEI is sufficiently thick,we can neglect terms scaling with ′2
x because ′x is proportional to
L−1. Using this approximation in Equation 32c after inserting 32ayields
∂ε
∂t= V Li2EDC
SEI
2
∂
∂xκ′
x
= V Li2EDCSEI
2
(κ′
x′x + κ′′
xx
)
= V Li2EDCSEI
2
Dκ′ε − κD′
ε
D + κε′
x′x .
We now trace the porosity at a point co-moving with the left edge ofthe SEI front, see Fig. 3. Here the porosity changes in time accordingto
dε(L(t), t)
dt= ε′
x
∂L
∂t+ ∂ε
∂t≈ V Li2EDC
SEI ε′x
′x
4
(κ
εSEI+ Dκ′
ε − κD′ε
D + κ
),
[33]where the approximation for the thickness evolution Eq. 29 is used.The porosity at this location has an attractive point. This means that
Reproduced from reference [150] under the terms of the Creative CommonsAttribution 4.0 License, https://creativecommons.org/licenses/by/4.0/.
128
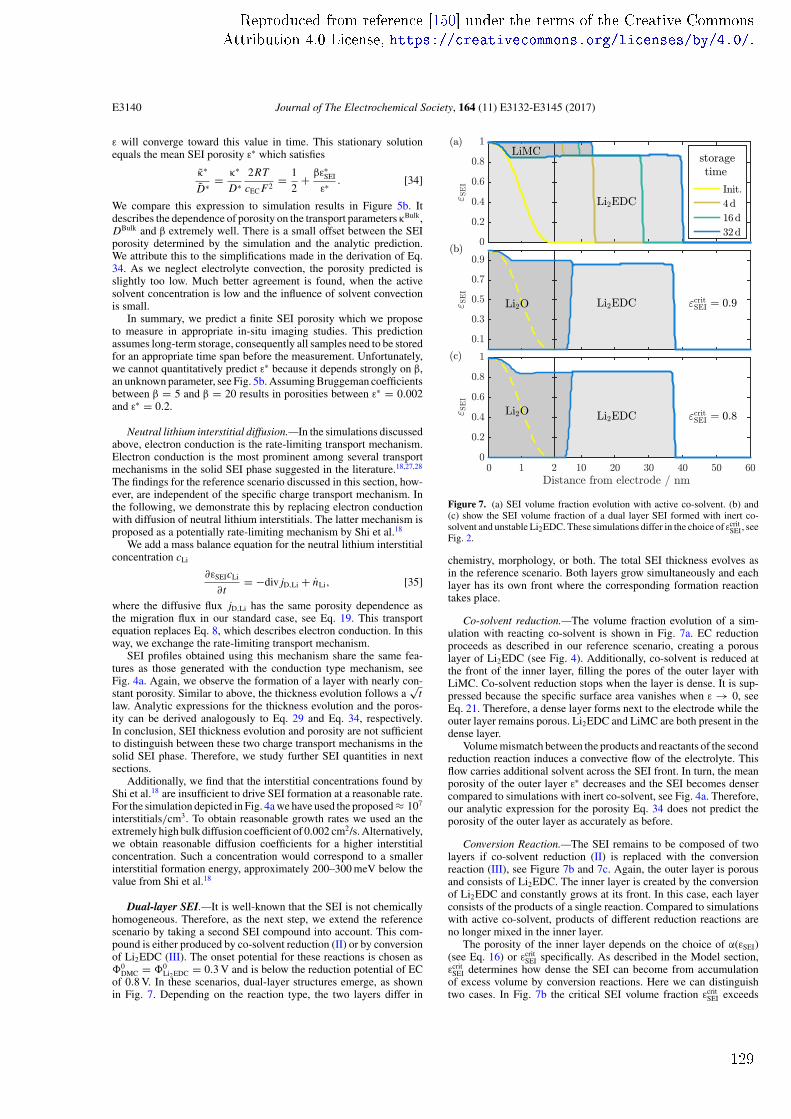
E3140 Journal of The Electrochemical Society, 164 (11) E3132-E3145 (2017)
ε will converge toward this value in time. This stationary solutionequals the mean SEI porosity ε∗ which satisfies
κ∗
D∗ = κ∗
D∗2RT
cEC F2= 1
2+ βε∗
SEI
ε∗ . [34]
We compare this expression to simulation results in Figure 5b. Itdescribes the dependence of porosity on the transport parameters κBulk,DBulk and β extremely well. There is a small offset between the SEIporosity determined by the simulation and the analytic prediction.We attribute this to the simplifications made in the derivation of Eq.34. As we neglect electrolyte convection, the porosity predicted isslightly too low. Much better agreement is found, when the activesolvent concentration is low and the influence of solvent convectionis small.
In summary, we predict a finite SEI porosity which we proposeto measure in appropriate in-situ imaging studies. This predictionassumes long-term storage, consequently all samples need to be storedfor an appropriate time span before the measurement. Unfortunately,we cannot quantitatively predict ε∗ because it depends strongly on β,an unknown parameter, see Fig. 5b. Assuming Bruggeman coefficientsbetween β = 5 and β = 20 results in porosities between ε∗ = 0.002and ε∗ = 0.2.
Neutral lithium interstitial diffusion.—In the simulations discussedabove, electron conduction is the rate-limiting transport mechanism.Electron conduction is the most prominent among several transportmechanisms in the solid SEI phase suggested in the literature.18,27,28
The findings for the reference scenario discussed in this section, how-ever, are independent of the specific charge transport mechanism. Inthe following, we demonstrate this by replacing electron conductionwith diffusion of neutral lithium interstitials. The latter mechanism isproposed as a potentially rate-limiting mechanism by Shi et al.18
We add a mass balance equation for the neutral lithium interstitialconcentration cLi
∂εSEIcLi
∂t= −div jD,Li + nLi, [35]
where the diffusive flux jD,Li has the same porosity dependence asthe migration flux in our standard case, see Eq. 19. This transportequation replaces Eq. 8, which describes electron conduction. In thisway, we exchange the rate-limiting transport mechanism.
SEI profiles obtained using this mechanism share the same fea-tures as those generated with the conduction type mechanism, seeFig. 4a. Again, we observe the formation of a layer with nearly con-stant porosity. Similar to above, the thickness evolution follows a
√t
law. Analytic expressions for the thickness evolution and the poros-ity can be derived analogously to Eq. 29 and Eq. 34, respectively.In conclusion, SEI thickness evolution and porosity are not sufficientto distinguish between these two charge transport mechanisms in thesolid SEI phase. Therefore, we study further SEI quantities in nextsections.
Additionally, we find that the interstitial concentrations found byShi et al.18 are insufficient to drive SEI formation at a reasonable rate.For the simulation depicted in Fig. 4a we have used the proposed ≈ 107
interstitials/cm3. To obtain reasonable growth rates we used an theextremely high bulk diffusion coefficient of 0.002 cm2/s. Alternatively,we obtain reasonable diffusion coefficients for a higher interstitialconcentration. Such a concentration would correspond to a smallerinterstitial formation energy, approximately 200–300 meV below thevalue from Shi et al.18
Dual-layer SEI.—It is well-known that the SEI is not chemicallyhomogeneous. Therefore, as the next step, we extend the referencescenario by taking a second SEI compound into account. This com-pound is either produced by co-solvent reduction (II) or by conversionof Li2EDC (III). The onset potential for these reactions is chosen as0
DMC = 0Li2EDC = 0.3 V and is below the reduction potential of EC
of 0.8 V. In these scenarios, dual-layer structures emerge, as shownin Fig. 7. Depending on the reaction type, the two layers differ in
Figure 7. (a) SEI volume fraction evolution with active co-solvent. (b) and(c) show the SEI volume fraction of a dual layer SEI formed with inert co-solvent and unstable Li2EDC. These simulations differ in the choice of εcrit
SEI, seeFig. 2.
chemistry, morphology, or both. The total SEI thickness evolves asin the reference scenario. Both layers grow simultaneously and eachlayer has its own front where the corresponding formation reactiontakes place.
Co-solvent reduction.—The volume fraction evolution of a sim-ulation with reacting co-solvent is shown in Fig. 7a. EC reductionproceeds as described in our reference scenario, creating a porouslayer of Li2EDC (see Fig. 4). Additionally, co-solvent is reduced atthe front of the inner layer, filling the pores of the outer layer withLiMC. Co-solvent reduction stops when the layer is dense. It is sup-pressed because the specific surface area vanishes when ε → 0, seeEq. 21. Therefore, a dense layer forms next to the electrode while theouter layer remains porous. Li2EDC and LiMC are both present in thedense layer.
Volume mismatch between the products and reactants of the secondreduction reaction induces a convective flow of the electrolyte. Thisflow carries additional solvent across the SEI front. In turn, the meanporosity of the outer layer ε∗ decreases and the SEI becomes densercompared to simulations with inert co-solvent, see Fig. 4a. Therefore,our analytic expression for the porosity Eq. 34 does not predict theporosity of the outer layer as accurately as before.
Conversion Reaction.—The SEI remains to be composed of twolayers if co-solvent reduction (II) is replaced with the conversionreaction (III), see Figure 7b and 7c. Again, the outer layer is porousand consists of Li2EDC. The inner layer is created by the conversionof Li2EDC and constantly grows at its front. In this case, each layerconsists of the products of a single reaction. Compared to simulationswith active co-solvent, products of different reduction reactions areno longer mixed in the inner layer.
The porosity of the inner layer depends on the choice of α(εSEI)(see Eq. 16) or εcrit
SEI specifically. As described in the Model section,εcrit
SEI determines how dense the SEI can become from accumulationof excess volume by conversion reactions. Here we can distinguishtwo cases. In Fig. 7b the critical SEI volume fraction εcrit
SEI exceeds
Reproduced from reference [150] under the terms of the Creative CommonsAttribution 4.0 License, https://creativecommons.org/licenses/by/4.0/.
129
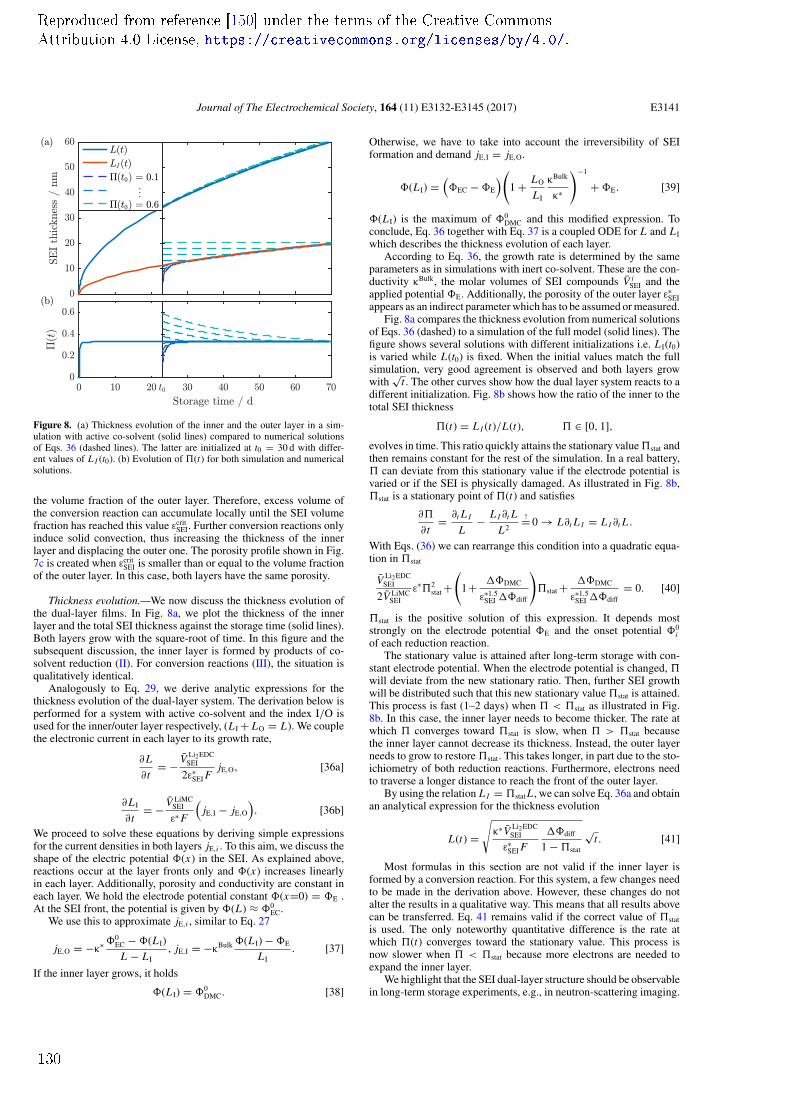
Journal of The Electrochemical Society, 164 (11) E3132-E3145 (2017) E3141
Figure 8. (a) Thickness evolution of the inner and the outer layer in a sim-ulation with active co-solvent (solid lines) compared to numerical solutionsof Eqs. 36 (dashed lines). The latter are initialized at t0 = 30 d with differ-ent values of L I (t0). (b) Evolution of (t) for both simulation and numericalsolutions.
the volume fraction of the outer layer. Therefore, excess volume ofthe conversion reaction can accumulate locally until the SEI volumefraction has reached this value εcrit
SEI. Further conversion reactions onlyinduce solid convection, thus increasing the thickness of the innerlayer and displacing the outer one. The porosity profile shown in Fig.7c is created when εcrit
SEI is smaller than or equal to the volume fractionof the outer layer. In this case, both layers have the same porosity.
Thickness evolution.—We now discuss the thickness evolution ofthe dual-layer films. In Fig. 8a, we plot the thickness of the innerlayer and the total SEI thickness against the storage time (solid lines).Both layers grow with the square-root of time. In this figure and thesubsequent discussion, the inner layer is formed by products of co-solvent reduction (II). For conversion reactions (III), the situation isqualitatively identical.
Analogously to Eq. 29, we derive analytic expressions for thethickness evolution of the dual-layer system. The derivation below isperformed for a system with active co-solvent and the index I/O isused for the inner/outer layer respectively, (L I + LO = L). We couplethe electronic current in each layer to its growth rate,
∂L
∂t= − V Li2EDC
SEI
2ε∗SEI F
jE,O, [36a]
∂L I
∂t= − V LiMC
SEI
ε∗ F
(jE,I − jE,O
). [36b]
We proceed to solve these equations by deriving simple expressionsfor the current densities in both layers jE,i . To this aim, we discuss theshape of the electric potential (x) in the SEI. As explained above,reactions occur at the layer fronts only and (x) increases linearlyin each layer. Additionally, porosity and conductivity are constant ineach layer. We hold the electrode potential constant (x=0) = E .At the SEI front, the potential is given by (L) ≈ 0
EC.We use this to approximate jE,i , similar to Eq. 27
jE,O = −κ∗ 0EC − (L I)
L − L I, jE,I = −κBulk (L I) − E
L I. [37]
If the inner layer grows, it holds
(L I) = 0DMC. [38]
Otherwise, we have to take into account the irreversibility of SEIformation and demand jE,I = jE,O.
(L I) =(EC − E
)(1 + LO
L I
κBulk
κ∗
)−1
+ E. [39]
(L I) is the maximum of 0DMC and this modified expression. To
conclude, Eq. 36 together with Eq. 37 is a coupled ODE for L and L I
which describes the thickness evolution of each layer.According to Eq. 36, the growth rate is determined by the same
parameters as in simulations with inert co-solvent. These are the con-ductivity κBulk, the molar volumes of SEI compounds V i
SEI and theapplied potential E. Additionally, the porosity of the outer layer ε∗
SEIappears as an indirect parameter which has to be assumed or measured.
Fig. 8a compares the thickness evolution from numerical solutionsof Eqs. 36 (dashed) to a simulation of the full model (solid lines). Thefigure shows several solutions with different initializations i.e. L I(t0)is varied while L(t0) is fixed. When the initial values match the fullsimulation, very good agreement is observed and both layers growwith
√t . The other curves show how the dual layer system reacts to a
different initialization. Fig. 8b shows how the ratio of the inner to thetotal SEI thickness
(t) = L I (t)/L(t), ∈ [0, 1],
evolves in time. This ratio quickly attains the stationary value stat andthen remains constant for the rest of the simulation. In a real battery, can deviate from this stationary value if the electrode potential isvaried or if the SEI is physically damaged. As illustrated in Fig. 8b,stat is a stationary point of (t) and satisfies
∂
∂t= ∂t L I
L− L I ∂t L
L2
!= 0 → L∂t L I = L I ∂t L .
With Eqs. (36) we can rearrange this condition into a quadratic equa-tion in stat
V Li2EDCSEI
2V LiMCSEI
ε∗2stat +
(1+ DMC
ε∗1.5SEI diff
)stat + DMC
ε∗1.5SEI diff
= 0. [40]
stat is the positive solution of this expression. It depends moststrongly on the electrode potential E and the onset potential 0
iof each reduction reaction.
The stationary value is attained after long-term storage with con-stant electrode potential. When the electrode potential is changed, will deviate from the new stationary ratio. Then, further SEI growthwill be distributed such that this new stationary value stat is attained.This process is fast (1–2 days) when < stat as illustrated in Fig.8b. In this case, the inner layer needs to become thicker. The rate atwhich converges toward stat is slow, when > stat becausethe inner layer cannot decrease its thickness. Instead, the outer layerneeds to grow to restore stat. This takes longer, in part due to the sto-ichiometry of both reduction reactions. Furthermore, electrons needto traverse a longer distance to reach the front of the outer layer.
By using the relation L I = stat L , we can solve Eq. 36a and obtainan analytical expression for the thickness evolution
L(t) =√
κ∗V Li2EDCSEI
ε∗SEI F
diff
1 − stat
√t . [41]
Most formulas in this section are not valid if the inner layer isformed by a conversion reaction. For this system, a few changes needto be made in the derivation above. However, these changes do notalter the results in a qualitative way. This means that all results abovecan be transferred. Eq. 41 remains valid if the correct value of stat
is used. The only noteworthy quantitative difference is the rate atwhich (t) converges toward the stationary value. This process isnow slower when < stat because more electrons are needed toexpand the inner layer.
We highlight that the SEI dual-layer structure should be observablein long-term storage experiments, e.g., in neutron-scattering imaging.
Reproduced from reference [150] under the terms of the Creative CommonsAttribution 4.0 License, https://creativecommons.org/licenses/by/4.0/.
130
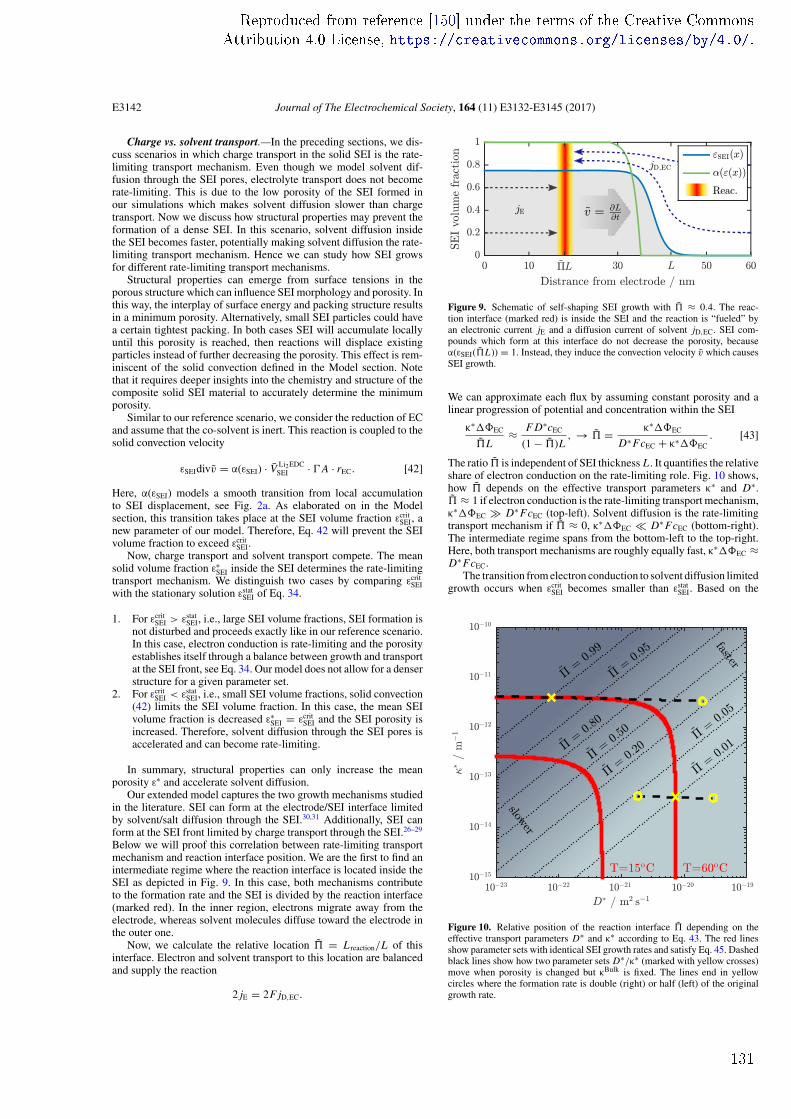
E3142 Journal of The Electrochemical Society, 164 (11) E3132-E3145 (2017)
Charge vs. solvent transport.—In the preceding sections, we dis-cuss scenarios in which charge transport in the solid SEI is the rate-limiting transport mechanism. Even though we model solvent dif-fusion through the SEI pores, electrolyte transport does not becomerate-limiting. This is due to the low porosity of the SEI formed inour simulations which makes solvent diffusion slower than chargetransport. Now we discuss how structural properties may prevent theformation of a dense SEI. In this scenario, solvent diffusion insidethe SEI becomes faster, potentially making solvent diffusion the rate-limiting transport mechanism. Hence we can study how SEI growsfor different rate-limiting transport mechanisms.
Structural properties can emerge from surface tensions in theporous structure which can influence SEI morphology and porosity. Inthis way, the interplay of surface energy and packing structure resultsin a minimum porosity. Alternatively, small SEI particles could havea certain tightest packing. In both cases SEI will accumulate locallyuntil this porosity is reached, then reactions will displace existingparticles instead of further decreasing the porosity. This effect is rem-iniscent of the solid convection defined in the Model section. Notethat it requires deeper insights into the chemistry and structure of thecomposite solid SEI material to accurately determine the minimumporosity.
Similar to our reference scenario, we consider the reduction of ECand assume that the co-solvent is inert. This reaction is coupled to thesolid convection velocity
εSEIdivv = α(εSEI) · V Li2EDCSEI · A · rEC. [42]
Here, α(εSEI) models a smooth transition from local accumulationto SEI displacement, see Fig. 2a. As elaborated on in the Modelsection, this transition takes place at the SEI volume fraction εcrit
SEI, anew parameter of our model. Therefore, Eq. 42 will prevent the SEIvolume fraction to exceed εcrit
SEI.Now, charge transport and solvent transport compete. The mean
solid volume fraction ε∗SEI inside the SEI determines the rate-limiting
transport mechanism. We distinguish two cases by comparing εcritSEI
with the stationary solution εstatSEI of Eq. 34.
1. For εcritSEI > εstat
SEI, i.e., large SEI volume fractions, SEI formation isnot disturbed and proceeds exactly like in our reference scenario.In this case, electron conduction is rate-limiting and the porosityestablishes itself through a balance between growth and transportat the SEI front, see Eq. 34. Our model does not allow for a denserstructure for a given parameter set.
2. For εcritSEI < εstat
SEI, i.e., small SEI volume fractions, solid convection(42) limits the SEI volume fraction. In this case, the mean SEIvolume fraction is decreased ε∗
SEI = εcritSEI and the SEI porosity is
increased. Therefore, solvent diffusion through the SEI pores isaccelerated and can become rate-limiting.
In summary, structural properties can only increase the meanporosity ε∗ and accelerate solvent diffusion.
Our extended model captures the two growth mechanisms studiedin the literature. SEI can form at the electrode/SEI interface limitedby solvent/salt diffusion through the SEI.30,31 Additionally, SEI canform at the SEI front limited by charge transport through the SEI.26–29
Below we will proof this correlation between rate-limiting transportmechanism and reaction interface position. We are the first to find anintermediate regime where the reaction interface is located inside theSEI as depicted in Fig. 9. In this case, both mechanisms contributeto the formation rate and the SEI is divided by the reaction interface(marked red). In the inner region, electrons migrate away from theelectrode, whereas solvent molecules diffuse toward the electrode inthe outer one.
Now, we calculate the relative location = L reaction/L of thisinterface. Electron and solvent transport to this location are balancedand supply the reaction
2 jE = 2F jD,EC.
Figure 9. Schematic of self-shaping SEI growth with ≈ 0.4. The reac-tion interface (marked red) is inside the SEI and the reaction is “fueled” byan electronic current jE and a diffusion current of solvent jD,EC. SEI com-pounds which form at this interface do not decrease the porosity, becauseα(εSEI(L)) = 1. Instead, they induce the convection velocity v which causesSEI growth.
We can approximate each flux by assuming constant porosity and alinear progression of potential and concentration within the SEI
κ∗EC
L≈ F D∗cEC
(1 − )L, → = κ∗EC
D∗ FcEC + κ∗EC. [43]
The ratio is independent of SEI thickness L . It quantifies the relativeshare of electron conduction on the rate-limiting role. Fig. 10 shows,how depends on the effective transport parameters κ∗ and D∗. ≈ 1 if electron conduction is the rate-limiting transport mechanism,κ∗EC D∗ FcEC (top-left). Solvent diffusion is the rate-limitingtransport mechanism if ≈ 0, κ∗EC D∗ FcEC (bottom-right).The intermediate regime spans from the bottom-left to the top-right.Here, both transport mechanisms are roughly equally fast, κ∗EC ≈D∗ FcEC.
The transition from electron conduction to solvent diffusion limitedgrowth occurs when εcrit
SEI becomes smaller than εstatSEI. Based on the
Figure 10. Relative position of the reaction interface depending on theeffective transport parameters D∗ and κ∗ according to Eq. 43. The red linesshow parameter sets with identical SEI growth rates and satisfy Eq. 45. Dashedblack lines show how two parameter sets D∗/κ∗ (marked with yellow crosses)move when porosity is changed but κBulk is fixed. The lines end in yellowcircles where the formation rate is double (right) or half (left) of the originalgrowth rate.
Reproduced from reference [150] under the terms of the Creative CommonsAttribution 4.0 License, https://creativecommons.org/licenses/by/4.0/.
131
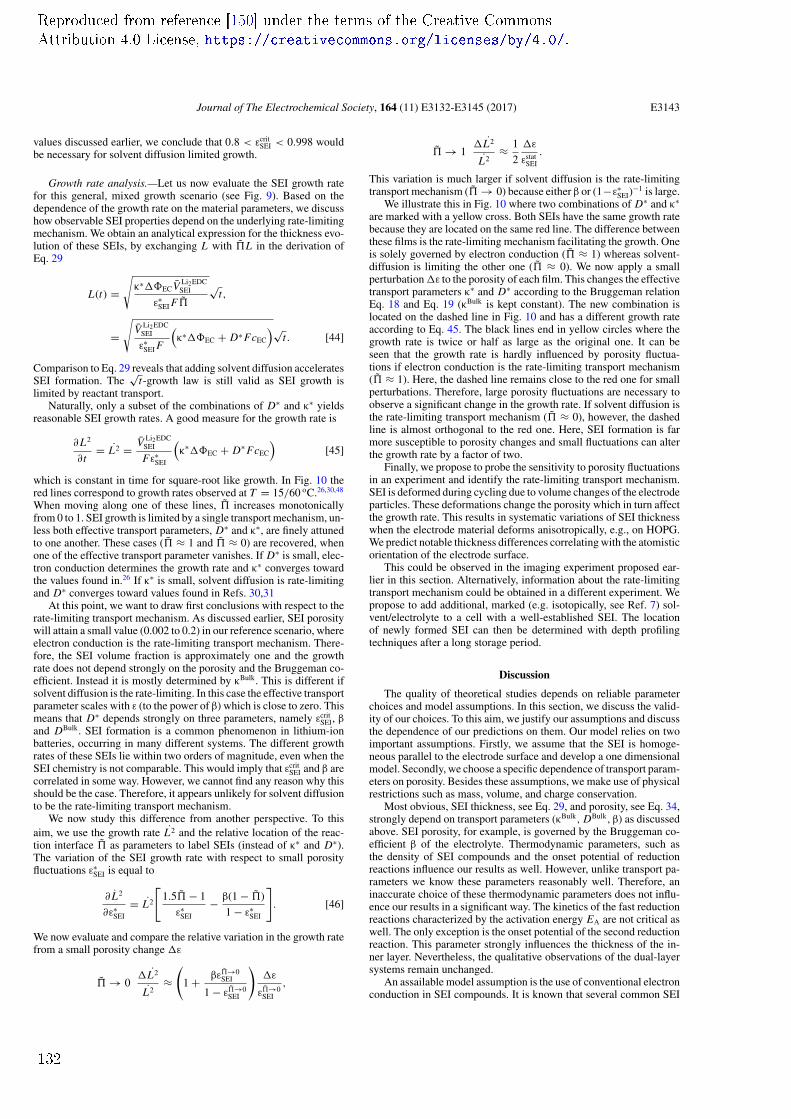
Journal of The Electrochemical Society, 164 (11) E3132-E3145 (2017) E3143
values discussed earlier, we conclude that 0.8 < εcritSEI < 0.998 would
be necessary for solvent diffusion limited growth.
Growth rate analysis.—Let us now evaluate the SEI growth ratefor this general, mixed growth scenario (see Fig. 9). Based on thedependence of the growth rate on the material parameters, we discusshow observable SEI properties depend on the underlying rate-limitingmechanism. We obtain an analytical expression for the thickness evo-lution of these SEIs, by exchanging L with L in the derivation ofEq. 29
L(t) =√
κ∗ECV Li2EDCSEI
ε∗SEI F
√t,
=√
V Li2EDCSEI
ε∗SEI F
(κ∗EC + D∗ FcEC
)√t . [44]
Comparison to Eq. 29 reveals that adding solvent diffusion acceleratesSEI formation. The
√t-growth law is still valid as SEI growth is
limited by reactant transport.Naturally, only a subset of the combinations of D∗ and κ∗ yields
reasonable SEI growth rates. A good measure for the growth rate is
∂L2
∂t= L2 = V Li2EDC
SEI
Fε∗SEI
(κ∗EC + D∗ FcEC
)[45]
which is constant in time for square-root like growth. In Fig. 10 thered lines correspond to growth rates observed at T = 15/60 oC.26,30,48
When moving along one of these lines, increases monotonicallyfrom 0 to 1. SEI growth is limited by a single transport mechanism, un-less both effective transport parameters, D∗ and κ∗, are finely attunedto one another. These cases ( ≈ 1 and ≈ 0) are recovered, whenone of the effective transport parameter vanishes. If D∗ is small, elec-tron conduction determines the growth rate and κ∗ converges towardthe values found in.26 If κ∗ is small, solvent diffusion is rate-limitingand D∗ converges toward values found in Refs. 30,31
At this point, we want to draw first conclusions with respect to therate-limiting transport mechanism. As discussed earlier, SEI porositywill attain a small value (0.002 to 0.2) in our reference scenario, whereelectron conduction is the rate-limiting transport mechanism. There-fore, the SEI volume fraction is approximately one and the growthrate does not depend strongly on the porosity and the Bruggeman co-efficient. Instead it is mostly determined by κBulk. This is different ifsolvent diffusion is the rate-limiting. In this case the effective transportparameter scales with ε (to the power of β) which is close to zero. Thismeans that D∗ depends strongly on three parameters, namely εcrit
SEI, βand DBulk. SEI formation is a common phenomenon in lithium-ionbatteries, occurring in many different systems. The different growthrates of these SEIs lie within two orders of magnitude, even when theSEI chemistry is not comparable. This would imply that εcrit
SEI and β arecorrelated in some way. However, we cannot find any reason why thisshould be the case. Therefore, it appears unlikely for solvent diffusionto be the rate-limiting transport mechanism.
We now study this difference from another perspective. To thisaim, we use the growth rate L2 and the relative location of the reac-tion interface as parameters to label SEIs (instead of κ∗ and D∗).The variation of the SEI growth rate with respect to small porosityfluctuations ε∗
SEI is equal to
∂ L2
∂ε∗SEI
= L2
[1.5 − 1
ε∗SEI
− β(1 − )
1 − ε∗SEI
]. [46]
We now evaluate and compare the relative variation in the growth ratefrom a small porosity change ε
→ 0L2
L2≈
(1 + βε→0
SEI
1 − ε→0SEI
)ε
ε→0SEI
,
→ 1L2
L2≈ 1
2
ε
εstatSEI
.
This variation is much larger if solvent diffusion is the rate-limitingtransport mechanism ( → 0) because either β or (1−ε∗
SEI)−1 is large.
We illustrate this in Fig. 10 where two combinations of D∗ and κ∗
are marked with a yellow cross. Both SEIs have the same growth ratebecause they are located on the same red line. The difference betweenthese films is the rate-limiting mechanism facilitating the growth. Oneis solely governed by electron conduction ( ≈ 1) whereas solvent-diffusion is limiting the other one ( ≈ 0). We now apply a smallperturbation ε to the porosity of each film. This changes the effectivetransport parameters κ∗ and D∗ according to the Bruggeman relationEq. 18 and Eq. 19 (κBulk is kept constant). The new combination islocated on the dashed line in Fig. 10 and has a different growth rateaccording to Eq. 45. The black lines end in yellow circles where thegrowth rate is twice or half as large as the original one. It can beseen that the growth rate is hardly influenced by porosity fluctua-tions if electron conduction is the rate-limiting transport mechanism( ≈ 1). Here, the dashed line remains close to the red one for smallperturbations. Therefore, large porosity fluctuations are necessary toobserve a significant change in the growth rate. If solvent diffusion isthe rate-limiting transport mechanism ( ≈ 0), however, the dashedline is almost orthogonal to the red one. Here, SEI formation is farmore susceptible to porosity changes and small fluctuations can alterthe growth rate by a factor of two.
Finally, we propose to probe the sensitivity to porosity fluctuationsin an experiment and identify the rate-limiting transport mechanism.SEI is deformed during cycling due to volume changes of the electrodeparticles. These deformations change the porosity which in turn affectthe growth rate. This results in systematic variations of SEI thicknesswhen the electrode material deforms anisotropically, e.g., on HOPG.We predict notable thickness differences correlating with the atomisticorientation of the electrode surface.
This could be observed in the imaging experiment proposed ear-lier in this section. Alternatively, information about the rate-limitingtransport mechanism could be obtained in a different experiment. Wepropose to add additional, marked (e.g. isotopically, see Ref. 7) sol-vent/electrolyte to a cell with a well-established SEI. The locationof newly formed SEI can then be determined with depth profilingtechniques after a long storage period.
Discussion
The quality of theoretical studies depends on reliable parameterchoices and model assumptions. In this section, we discuss the valid-ity of our choices. To this aim, we justify our assumptions and discussthe dependence of our predictions on them. Our model relies on twoimportant assumptions. Firstly, we assume that the SEI is homoge-neous parallel to the electrode surface and develop a one dimensionalmodel. Secondly, we choose a specific dependence of transport param-eters on porosity. Besides these assumptions, we make use of physicalrestrictions such as mass, volume, and charge conservation.
Most obvious, SEI thickness, see Eq. 29, and porosity, see Eq. 34,strongly depend on transport parameters (κBulk, DBulk, β) as discussedabove. SEI porosity, for example, is governed by the Bruggeman co-efficient β of the electrolyte. Thermodynamic parameters, such asthe density of SEI compounds and the onset potential of reductionreactions influence our results as well. However, unlike transport pa-rameters we know these parameters reasonably well. Therefore, aninaccurate choice of these thermodynamic parameters does not influ-ence our results in a significant way. The kinetics of the fast reductionreactions characterized by the activation energy EA are not critical aswell. The only exception is the onset potential of the second reductionreaction. This parameter strongly influences the thickness of the in-ner layer. Nevertheless, the qualitative observations of the dual-layersystems remain unchanged.
An assailable model assumption is the use of conventional electronconduction in SEI compounds. It is known that several common SEI
Reproduced from reference [150] under the terms of the Creative CommonsAttribution 4.0 License, https://creativecommons.org/licenses/by/4.0/.
132
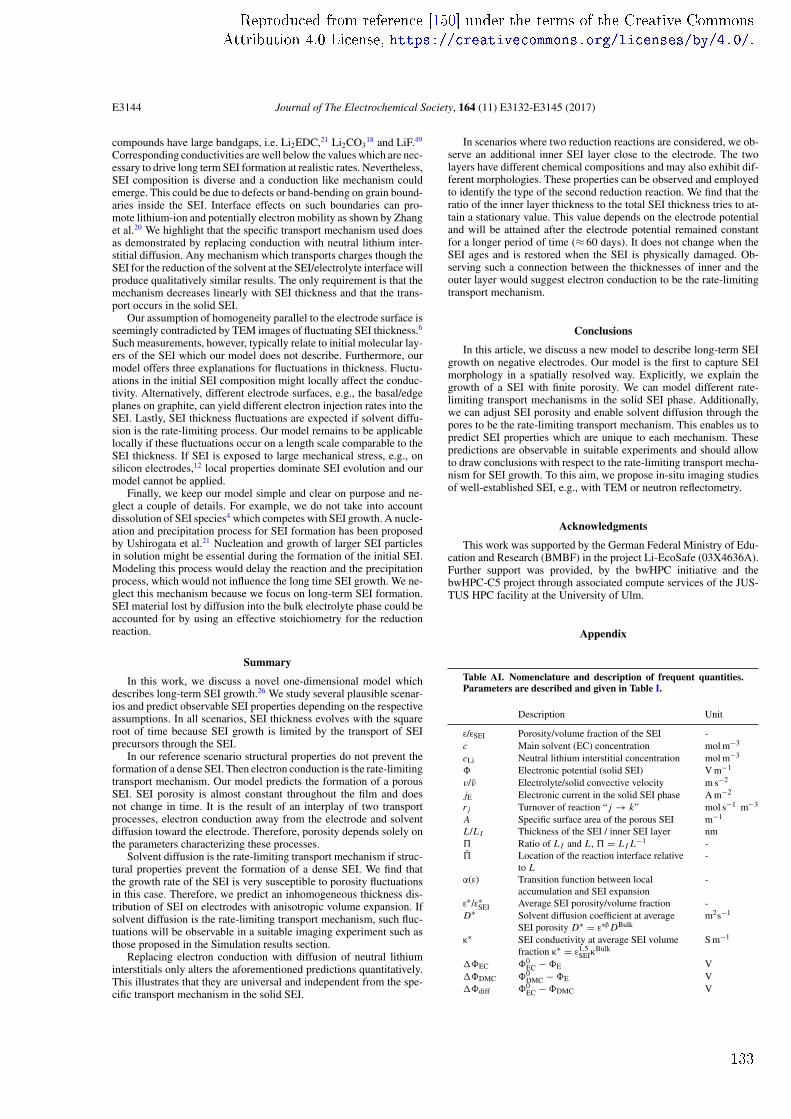
E3144 Journal of The Electrochemical Society, 164 (11) E3132-E3145 (2017)
compounds have large bandgaps, i.e. Li2EDC,21 Li2CO318 and LiF.49
Corresponding conductivities are well below the values which are nec-essary to drive long term SEI formation at realistic rates. Nevertheless,SEI composition is diverse and a conduction like mechanism couldemerge. This could be due to defects or band-bending on grain bound-aries inside the SEI. Interface effects on such boundaries can pro-mote lithium-ion and potentially electron mobility as shown by Zhanget al.20 We highlight that the specific transport mechanism used doesas demonstrated by replacing conduction with neutral lithium inter-stitial diffusion. Any mechanism which transports charges though theSEI for the reduction of the solvent at the SEI/electrolyte interface willproduce qualitatively similar results. The only requirement is that themechanism decreases linearly with SEI thickness and that the trans-port occurs in the solid SEI.
Our assumption of homogeneity parallel to the electrode surface isseemingly contradicted by TEM images of fluctuating SEI thickness.6
Such measurements, however, typically relate to initial molecular lay-ers of the SEI which our model does not describe. Furthermore, ourmodel offers three explanations for fluctuations in thickness. Fluctu-ations in the initial SEI composition might locally affect the conduc-tivity. Alternatively, different electrode surfaces, e.g., the basal/edgeplanes on graphite, can yield different electron injection rates into theSEI. Lastly, SEI thickness fluctuations are expected if solvent diffu-sion is the rate-limiting process. Our model remains to be applicablelocally if these fluctuations occur on a length scale comparable to theSEI thickness. If SEI is exposed to large mechanical stress, e.g., onsilicon electrodes,12 local properties dominate SEI evolution and ourmodel cannot be applied.
Finally, we keep our model simple and clear on purpose and ne-glect a couple of details. For example, we do not take into accountdissolution of SEI species4 which competes with SEI growth. A nucle-ation and precipitation process for SEI formation has been proposedby Ushirogata et al.21 Nucleation and growth of larger SEI particlesin solution might be essential during the formation of the initial SEI.Modeling this process would delay the reaction and the precipitationprocess, which would not influence the long time SEI growth. We ne-glect this mechanism because we focus on long-term SEI formation.SEI material lost by diffusion into the bulk electrolyte phase could beaccounted for by using an effective stoichiometry for the reductionreaction.
Summary
In this work, we discuss a novel one-dimensional model whichdescribes long-term SEI growth.26 We study several plausible scenar-ios and predict observable SEI properties depending on the respectiveassumptions. In all scenarios, SEI thickness evolves with the squareroot of time because SEI growth is limited by the transport of SEIprecursors through the SEI.
In our reference scenario structural properties do not prevent theformation of a dense SEI. Then electron conduction is the rate-limitingtransport mechanism. Our model predicts the formation of a porousSEI. SEI porosity is almost constant throughout the film and doesnot change in time. It is the result of an interplay of two transportprocesses, electron conduction away from the electrode and solventdiffusion toward the electrode. Therefore, porosity depends solely onthe parameters characterizing these processes.
Solvent diffusion is the rate-limiting transport mechanism if struc-tural properties prevent the formation of a dense SEI. We find thatthe growth rate of the SEI is very susceptible to porosity fluctuationsin this case. Therefore, we predict an inhomogeneous thickness dis-tribution of SEI on electrodes with anisotropic volume expansion. Ifsolvent diffusion is the rate-limiting transport mechanism, such fluc-tuations will be observable in a suitable imaging experiment such asthose proposed in the Simulation results section.
Replacing electron conduction with diffusion of neutral lithiuminterstitials only alters the aforementioned predictions quantitatively.This illustrates that they are universal and independent from the spe-cific transport mechanism in the solid SEI.
In scenarios where two reduction reactions are considered, we ob-serve an additional inner SEI layer close to the electrode. The twolayers have different chemical compositions and may also exhibit dif-ferent morphologies. These properties can be observed and employedto identify the type of the second reduction reaction. We find that theratio of the inner layer thickness to the total SEI thickness tries to at-tain a stationary value. This value depends on the electrode potentialand will be attained after the electrode potential remained constantfor a longer period of time (≈ 60 days). It does not change when theSEI ages and is restored when the SEI is physically damaged. Ob-serving such a connection between the thicknesses of inner and theouter layer would suggest electron conduction to be the rate-limitingtransport mechanism.
Conclusions
In this article, we discuss a new model to describe long-term SEIgrowth on negative electrodes. Our model is the first to capture SEImorphology in a spatially resolved way. Explicitly, we explain thegrowth of a SEI with finite porosity. We can model different rate-limiting transport mechanisms in the solid SEI phase. Additionally,we can adjust SEI porosity and enable solvent diffusion through thepores to be the rate-limiting transport mechanism. This enables us topredict SEI properties which are unique to each mechanism. Thesepredictions are observable in suitable experiments and should allowto draw conclusions with respect to the rate-limiting transport mecha-nism for SEI growth. To this aim, we propose in-situ imaging studiesof well-established SEI, e.g., with TEM or neutron reflectometry.
Acknowledgments
This work was supported by the German Federal Ministry of Edu-cation and Research (BMBF) in the project Li-EcoSafe (03X4636A).Further support was provided, by the bwHPC initiative and thebwHPC-C5 project through associated compute services of the JUS-TUS HPC facility at the University of Ulm.
Appendix
Table AI. Nomenclature and description of frequent quantities.Parameters are described and given in Table I.
Description Unit
ε/εSEI Porosity/volume fraction of the SEI -c Main solvent (EC) concentration mol m−3
cLi Neutral lithium interstitial concentration mol m−3
Electronic potential (solid SEI) V m−1
v/v Electrolyte/solid convective velocity m s−2
jE Electronic current in the solid SEI phase A m−2
r j Turnover of reaction “ j → k” mol s−1 m−3
A Specific surface area of the porous SEI m−1
L/L I Thickness of the SEI / inner SEI layer nm Ratio of L I and L , = L I L−1 - Location of the reaction interface relative
to L-
α(ε) Transition function between localaccumulation and SEI expansion
-
ε∗/ε∗SEI Average SEI porosity/volume fraction -
D∗ Solvent diffusion coefficient at averageSEI porosity D∗ = ε∗β DBulk
m2s−1
κ∗ SEI conductivity at average SEI volumefraction κ∗ = ε1.5
SEIκBulk
S m−1
EC 0EC − E V
DMC 0DMC − E V
diff 0EC − DMC V
Reproduced from reference [150] under the terms of the Creative CommonsAttribution 4.0 License, https://creativecommons.org/licenses/by/4.0/.
133
Journal of The Electrochemical Society, 164 (11) E3132-E3145 (2017) E3145
References
1. S. Kang, M. H. Park, H. Lee, and Y. K. Han, Electrochemistry Communications, 23,83 (2012).
2. E. Peled, Journal of The Electrochemical Society, 126, 2047 (1979).3. D. Aurbach, A. Zaban, Y. Ein-Eli, I. Weissman, O. Chusid, B. Markovsky, M. Levi,
E. Levi, A. Schechter, and E. Granot, Journal of Power Sources, 68, 91 (1997).4. D. Aurbach, Journal of Power Sources, 89, 206 (2000).5. S. H. Kang, D. P. Abraham, A. Xiao, and B. L. Lucht, Journal of Power Sources,
175, 526 (2008).6. M. Nie, D. P. Abraham, D. M. Seo, Y. Chen, A. Bose, and B. L. Lucht, The Journal
of Physical Chemistry C, 117, 25381 (2013).7. A. L. Michan, M. Leskes, and C. P. Grey, Chemistry of Materials, 28, 385
(2015).8. K. Xu, Y. Lam, S. S. Zhang, T. R. Jow, and T. B. Curtis, Journal of Physical Chemistry
C, 111, 7411 (2007).9. O. Borodin, M. Olguin, C. E. Spear, K. W. Leiter, and J. Knap, Nanotechnology, 26,
354003 (2015).10. A. Xiao, L. Yang, B. L. Lucht, S.-H. Kang, and D. P. Abraham, Journal of The
Electrochemical Society, 156, A318 (2009).11. M. Nie and B. L. Lucht, Journal of The Electrochemical Society, 161, 1001
(2014).12. M. Nie, D. P. Abraham, Y. Chen, A. Bose, and B. L. Lucht, The Journal of Physical
Chemistry C, 117, 13403 (2013).13. C. L. Campion, W. Li, and B. L. Lucht, Journal of The Electrochemical Society, 152,
A2327 (2005).14. S. F. Lux, I. T. Lucas, E. Pollak, S. Passerini, M. Winter, and R. Kostecki, Electro-
chemistry Communications, 14, 47 (2012).15. M. Wagner, P. Raimann, A. Trifonova, K.-C. Moeller, J. Besenhard, and M. Winter,
Electrochemical and Solid-State Letters, 7, A201 (2004).16. S. J. Harris and P. Lu, Journal of Physical Chemistry C, 117, 6481 (2013).17. P. Lu, C. Li, E. W. Schneider, and S. J. Harris, Journal of Physical Chemistry C, 118,
896 (2014).18. S. Shi, P. Lu, Z. Liu, Y. Qi, L. G. Hector, H. Li, and S. J. Harris, Journal of the
American Chemical Society, 134, 15476 (2012).19. O. Borodin, G. R. V. Zhuang, P. N. Ross, and K. Xu, Journal of Physical Chemistry
C, 117, 7433 (2013).20. Q. Zhang, J. Pan, P. Lu, Z. Liu, M. W. Verbrugge, B. W. Sheldon, Y. T. Cheng, Y. Qi,
and X. Xiao, Nano Letters, 16, 2011 (2016).21. K. Ushirogata, K. Sodeyama, Z. Futera, Y. Tateyama, and Y. Okuno, Journal of The
Electrochemical Society, 162, A2670 (2015).22. A. J. Smith, J. C. Burns, X. Zhao, D. Xiong, and J. R. Dahn, Journal of The Electro-
chemical Society, 158, A447 (2011).23. P. Keil, S. F. Schuster, J. Wilhelm, J. Travi, A. Hauser, R. C. Karl, and A. Jossen,
Journal of The Electrochemical Society, 163, A1872 (2016).
24. P. Verma, P. Maire, and P. Novak, Electrochimica Acta, 55, 6332 (2010).25. P. Ganesh, P. R. C. Kent, and D. E. Jiang, Journal of Physical Chemistry C, 116,
24476 (2012).26. F. Single, B. Horstmann, and A. Latz, Phys. Chem. Chem. Phys., 18, 17810
(2016).27. J. Christensen and J. Newman, Journal of The Electrochemical Society, 151, A1977
(2004).28. D. Li, D. Danilov, Z. Zhang, H. Chen, Y. Yang, and P. H. L. Notten, Journal of the
Electrochemical Society, 162, A858 (2015).29. Y. X. Lin, Z. Liu, K. Leung, L. Q. Chen, P. Lu, and Y. Qi, Journal of Power Sources,
309, 221 (2016).30. M. B. Pinson and M. Z. Bazant, Journal of the Electrochemical Society, 160, A243
(2012).31. H. J. Ploehn, P. Ramadass, and R. E. White, Journal of The Electrochemical Society,
151, A456 (2004).32. M. Tang, S. Lu, and J. Newman, Journal of The Electrochemical Society, 159, A1775
(2012).33. J. Newman and K. Thomas-Alyea, Electrochemical Systems, Electrochemical Society
series (John Wiley & Sons, 2004).34. B. Horstmann, T. Danner, and W. G. Bessler, Energy & Environmental Science, 6,
1299 (2013).35. D. Bothe and W. Dreyer, Acta Mechanica, 226, 1757 (2015).36. S. de Groot and P. Mazur, Non-equilibrium Thermodynamics, Dover Books on
Physics (Dover Publications, 1962).37. A. Latz and J. Zausch, Electrochimica Acta, 110, 358 (2013).38. M. Z. Bazant, Accounts of Chemical Research, 46, 1144 (2013).39. J. Bockris, A. Reddy, and M. Gamboa-Aldeco, Modern Electrochemistry 2A: Fun-
damentals of Electrodics, Modern electrochemistry (Springer US, 2001).40. M. Tang and J. Newman, Journal of The Electrochemical Society, 159, A281 (2012).41. K. Leung, F. A. Soto, K. Hankins, P. B. Balbuena, and K. L. Harrison, The Journal
of Physical Chemistry C, 120, 6302 (2016).42. E. Peled, D. Bar Tow, A. Merson, A. Gladkich, L. Burstein, and D. Golodnitsky,
Journal of Power Sources, 97-98, 52 (2001).43. M. Safari and C. Delacourt, Journal of The Electrochemical Society, 158, 562 (2011).44. R. Naejus, D. Lemordant, R. Coudert, and P. Willmann, The Journal of Chemical
Thermodynamics, 29, 1503 (1997).45. O. Borodin, G. D. Smith, and P. Fan, Journal of Physical Chemistry B, 110, 22773
(2006).46. K. Hayamizu, Journal of Chemical and Engineering Data, 57, 2012 (2012).47. M. Broussely, S. Herreyre, P. Biensan, P. Kasztejna, K. Nechev, and R. J. Staniewicz,
Journal of Power Sources, 97-98, 13 (2001) .48. P. Liu, J. Wang, J. Hicks-Garner, E. Sherman, S. Soukiazian, M. Verbrugge, H. Tataria,
J. Musser, and P. Finamore, Journal of The Electrochemical Society, 157, A499(2010).
49. R. C. Chaney, E. E. Lafon, and C. C. Lin, Phys. Rev. B, 4, 2734 (1971).
Reproduced from reference [150] under the terms of the Creative CommonsAttribution 4.0 License, https://creativecommons.org/licenses/by/4.0/.
134
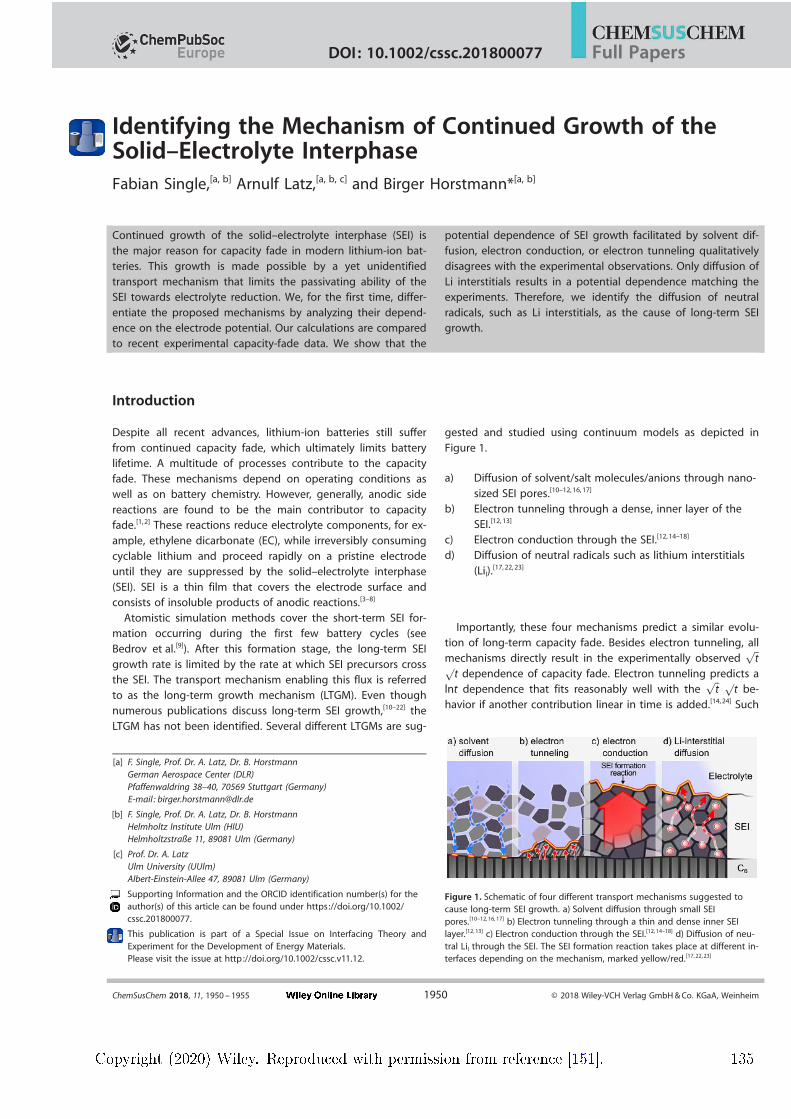
Identifying the Mechanism of Continued Growth of theSolid–Electrolyte InterphaseFabian Single,[a, b] Arnulf Latz,[a, b, c] and Birger Horstmann*[a, b]
Introduction
Despite all recent advances, lithium-ion batteries still suffer
from continued capacity fade, which ultimately limits batterylifetime. A multitude of processes contribute to the capacity
fade. These mechanisms depend on operating conditions aswell as on battery chemistry. However, generally, anodic side
reactions are found to be the main contributor to capacityfade.[1, 2] These reactions reduce electrolyte components, for ex-
ample, ethylene dicarbonate (EC), while irreversibly consuming
cyclable lithium and proceed rapidly on a pristine electrodeuntil they are suppressed by the solid–electrolyte interphase
(SEI). SEI is a thin film that covers the electrode surface andconsists of insoluble products of anodic reactions.[3–8]
Atomistic simulation methods cover the short-term SEI for-mation occurring during the first few battery cycles (seeBedrov et al.[9]). After this formation stage, the long-term SEI
growth rate is limited by the rate at which SEI precursors crossthe SEI. The transport mechanism enabling this flux is referredto as the long-term growth mechanism (LTGM). Even thoughnumerous publications discuss long-term SEI growth,[10–22] the
LTGM has not been identified. Several different LTGMs are sug-
gested and studied using continuum models as depicted in
Figure 1.
a) Diffusion of solvent/salt molecules/anions through nano-
sized SEI pores.[10–12,16,17]
b) Electron tunneling through a dense, inner layer of the
SEI.[12,13]
c) Electron conduction through the SEI.[12,14–18]
d) Diffusion of neutral radicals such as lithium interstitials
(LiI).[17,22,23]
Importantly, these four mechanisms predict a similar evolu-tion of long-term capacity fade. Besides electron tunneling, allmechanisms directly result in the experimentally observed
ffiffit
ppt dependence of capacity fade. Electron tunneling predicts a
lnt dependence that fits reasonably well with theffiffit
p pt be-
havior if another contribution linear in time is added.[14,24] Such
Continued growth of the solid–electrolyte interphase (SEI) isthe major reason for capacity fade in modern lithium-ion bat-
teries. This growth is made possible by a yet unidentified
transport mechanism that limits the passivating ability of theSEI towards electrolyte reduction. We, for the first time, differ-
entiate the proposed mechanisms by analyzing their depend-ence on the electrode potential. Our calculations are compared
to recent experimental capacity-fade data. We show that the
potential dependence of SEI growth facilitated by solvent dif-fusion, electron conduction, or electron tunneling qualitatively
disagrees with the experimental observations. Only diffusion of
Li interstitials results in a potential dependence matching theexperiments. Therefore, we identify the diffusion of neutral
radicals, such as Li interstitials, as the cause of long-term SEIgrowth.
Figure 1. Schematic of four different transport mechanisms suggested tocause long-term SEI growth. a) Solvent diffusion through small SEIpores.[10–12, 16,17] b) Electron tunneling through a thin and dense inner SEIlayer.[12,13] c) Electron conduction through the SEI.[12,14–18] d) Diffusion of neu-tral LiI through the SEI. The SEI formation reaction takes place at different in-terfaces depending on the mechanism, marked yellow/red.[17, 22,23]
[a] F. Single, Prof. Dr. A. Latz, Dr. B. HorstmannGerman Aerospace Center (DLR)Pfaffenwaldring 38–40, 70569 Stuttgart (Germany)E-mail : [email protected]
[b] F. Single, Prof. Dr. A. Latz, Dr. B. HorstmannHelmholtz Institute Ulm (HIU)Helmholtzstraße 11, 89081 Ulm (Germany)
[c] Prof. Dr. A. LatzUlm University (UUlm)Albert-Einstein-Allee 47, 89081 Ulm (Germany)
Supporting Information and the ORCID identification number(s) for theauthor(s) of this article can be found under https://doi.org/10.1002/cssc.201800077.
This publication is part of a Special Issue on Interfacing Theory andExperiment for the Development of Energy Materials.Please visit the issue at http://doi.org/10.1002/cssc.v11.12.
ChemSusChem 2018, 11, 1950 – 1955 T 2018 Wiley-VCH Verlag GmbH&Co. KGaA, Weinheim1950
Full PapersDOI: 10.1002/cssc.201800077
Copyright (2020) Wiley. Reproduced with permission from reference [151]. 135
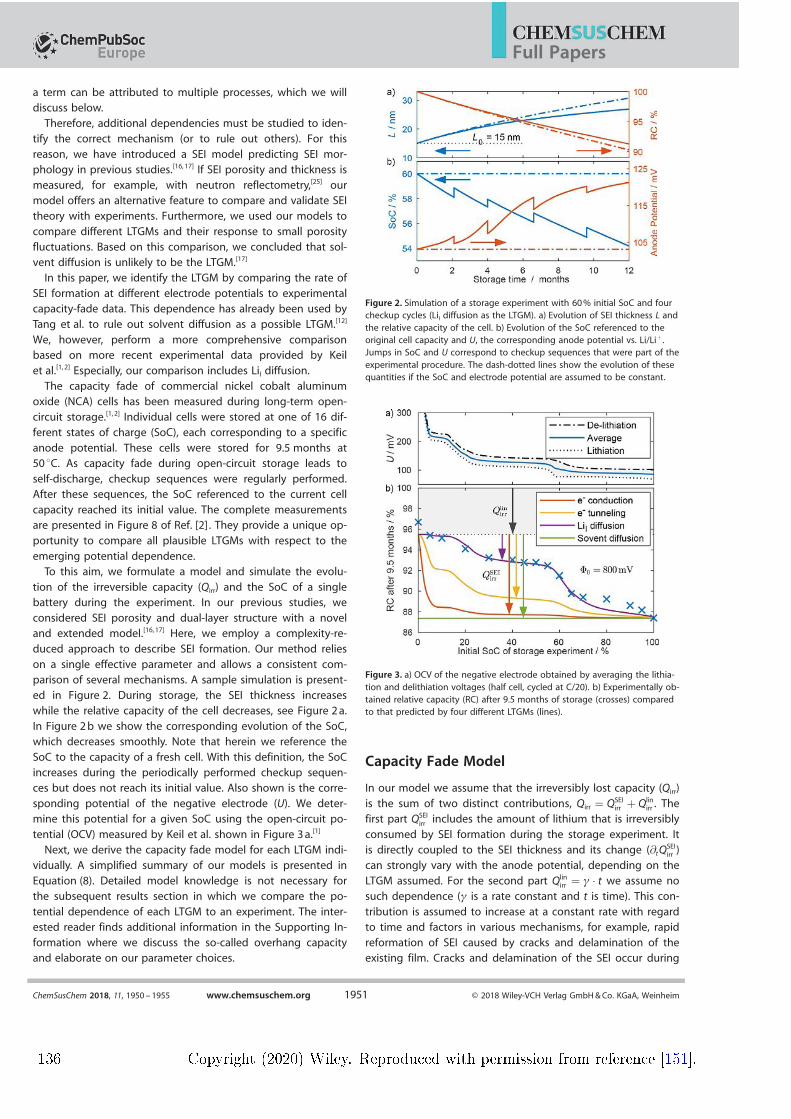
a term can be attributed to multiple processes, which we willdiscuss below.
Therefore, additional dependencies must be studied to iden-tify the correct mechanism (or to rule out others). For this
reason, we have introduced a SEI model predicting SEI mor-phology in previous studies.[16,17] If SEI porosity and thickness is
measured, for example, with neutron reflectometry,[25] ourmodel offers an alternative feature to compare and validate SEItheory with experiments. Furthermore, we used our models to
compare different LTGMs and their response to small porosityfluctuations. Based on this comparison, we concluded that sol-
vent diffusion is unlikely to be the LTGM.[17]
In this paper, we identify the LTGM by comparing the rate of
SEI formation at different electrode potentials to experimentalcapacity-fade data. This dependence has already been used by
Tang et al. to rule out solvent diffusion as a possible LTGM.[12]
We, however, perform a more comprehensive comparisonbased on more recent experimental data provided by Keil
et al.[1, 2] Especially, our comparison includes LiI diffusion.The capacity fade of commercial nickel cobalt aluminum
oxide (NCA) cells has been measured during long-term open-circuit storage.[1, 2] Individual cells were stored at one of 16 dif-
ferent states of charge (SoC), each corresponding to a specific
anode potential. These cells were stored for 9.5 months at50 8C. As capacity fade during open-circuit storage leads to
self-discharge, checkup sequences were regularly performed.After these sequences, the SoC referenced to the current cell
capacity reached its initial value. The complete measurementsare presented in Figure 8 of Ref. [2] . They provide a unique op-
portunity to compare all plausible LTGMs with respect to the
emerging potential dependence.To this aim, we formulate a model and simulate the evolu-
tion of the irreversible capacity (Qirr) and the SoC of a singlebattery during the experiment. In our previous studies, we
considered SEI porosity and dual-layer structure with a noveland extended model.[16,17] Here, we employ a complexity-re-
duced approach to describe SEI formation. Our method relies
on a single effective parameter and allows a consistent com-parison of several mechanisms. A sample simulation is present-ed in Figure 2. During storage, the SEI thickness increaseswhile the relative capacity of the cell decreases, see Figure 2a.
In Figure 2b we show the corresponding evolution of the SoC,which decreases smoothly. Note that herein we reference the
SoC to the capacity of a fresh cell. With this definition, the SoCincreases during the periodically performed checkup sequen-ces but does not reach its initial value. Also shown is the corre-
sponding potential of the negative electrode (U). We deter-mine this potential for a given SoC using the open-circuit po-
tential (OCV) measured by Keil et al. shown in Figure 3a.[1]
Next, we derive the capacity fade model for each LTGM indi-
vidually. A simplified summary of our models is presented in
Equation (8). Detailed model knowledge is not necessary forthe subsequent results section in which we compare the po-
tential dependence of each LTGM to an experiment. The inter-ested reader finds additional information in the Supporting In-
formation where we discuss the so-called overhang capacityand elaborate on our parameter choices.
Capacity Fade Model
In our model we assume that the irreversibly lost capacity (Qirr)
is the sum of two distinct contributions, Qirr ¼ QSEIirr þ Qlin
irr . Thefirst part QSEI
irr includes the amount of lithium that is irreversibly
consumed by SEI formation during the storage experiment. Itis directly coupled to the SEI thickness and its change (@tQ
SEIirr )
can strongly vary with the anode potential, depending on the
LTGM assumed. For the second part Qlinirr ¼ g ? t we assume no
such dependence (g is a rate constant and t is time). This con-
tribution is assumed to increase at a constant rate with regardto time and factors in various mechanisms, for example, rapid
reformation of SEI caused by cracks and delamination of theexisting film. Cracks and delamination of the SEI occur during
Figure 2. Simulation of a storage experiment with 60% initial SoC and fourcheckup cycles (LiI diffusion as the LTGM). a) Evolution of SEI thickness L andthe relative capacity of the cell. b) Evolution of the SoC referenced to theoriginal cell capacity and U, the corresponding anode potential vs. Li/Li+ .Jumps in SoC and U correspond to checkup sequences that were part of theexperimental procedure. The dash-dotted lines show the evolution of thesequantities if the SoC and electrode potential are assumed to be constant.
Figure 3. a) OCV of the negative electrode obtained by averaging the lithia-tion and delithiation voltages (half cell, cycled at C/20). b) Experimentally ob-tained relative capacity (RC) after 9.5 months of storage (crosses) comparedto that predicted by four different LTGMs (lines).
ChemSusChem 2018, 11, 1950 – 1955 www.chemsuschem.org T 2018 Wiley-VCH Verlag GmbH&Co. KGaA, Weinheim1951
Full Papers
136 Copyright (2020) Wiley. Reproduced with permission from reference [151].
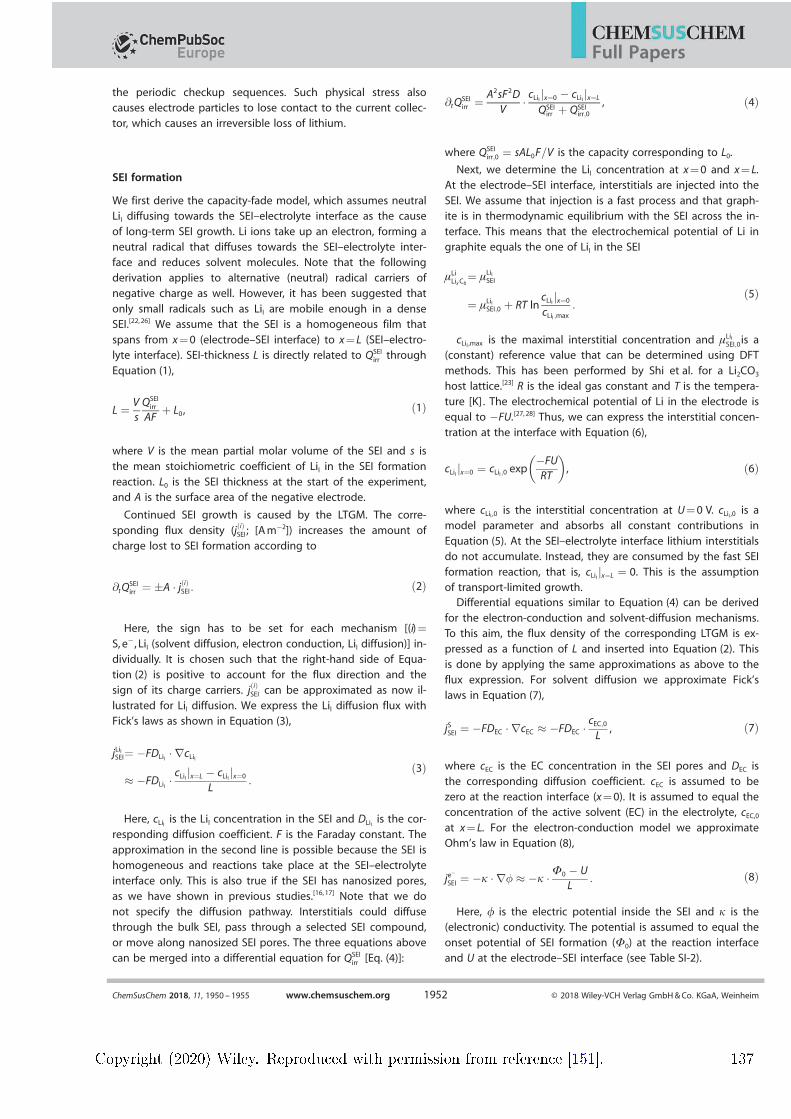
the periodic checkup sequences. Such physical stress alsocauses electrode particles to lose contact to the current collec-
tor, which causes an irreversible loss of lithium.
SEI formation
We first derive the capacity-fade model, which assumes neutralLiI diffusing towards the SEI–electrolyte interface as the causeof long-term SEI growth. Li ions take up an electron, forming aneutral radical that diffuses towards the SEI–electrolyte inter-face and reduces solvent molecules. Note that the followingderivation applies to alternative (neutral) radical carriers ofnegative charge as well. However, it has been suggested that
only small radicals such as LiI are mobile enough in a denseSEI.[22,26] We assume that the SEI is a homogeneous film that
spans from x=0 (electrode–SEI interface) to x=L (SEI–electro-lyte interface). SEI-thickness L is directly related to QSEI
irr through
Equation (1),
L ¼ VsQSEI
irr
AFþ L0, ð1Þ
where V is the mean partial molar volume of the SEI and s isthe mean stoichiometric coefficient of LiI in the SEI formationreaction. L0 is the SEI thickness at the start of the experiment,and A is the surface area of the negative electrode.
Continued SEI growth is caused by the LTGM. The corre-
sponding flux density (j ið ÞSEI; [Am@2]) increases the amount of
charge lost to SEI formation according to
@tQSEIirr ¼ :A ? j ið ÞSEI: ð2Þ
Here, the sign has to be set for each mechanism [(i)=
S, e@ , LiI (solvent diffusion, electron conduction, LiI diffusion)] in-dividually. It is chosen such that the right-hand side of Equa-
tion (2) is positive to account for the flux direction and thesign of its charge carriers. j ið ÞSEI can be approximated as now il-
lustrated for LiI diffusion. We express the LiI diffusion flux withFick’s laws as shown in Equation (3),
jLiISEI¼ @FDLiI ?rcLiI
& @FDLiI ?cLiI x¼Lj @ cLiI x¼0j
L:
ð3Þ
Here, cLiI is the LiI concentration in the SEI and DLiI is the cor-
responding diffusion coefficient. F is the Faraday constant. Theapproximation in the second line is possible because the SEI is
homogeneous and reactions take place at the SEI–electrolyte
interface only. This is also true if the SEI has nanosized pores,as we have shown in previous studies.[16,17] Note that we do
not specify the diffusion pathway. Interstitials could diffusethrough the bulk SEI, pass through a selected SEI compound,
or move along nanosized SEI pores. The three equations abovecan be merged into a differential equation for QSEI
irr [Eq. (4)]:
@tQSEIirr ¼ A2sF2D
V? cLiI x¼0j @ cLiI x¼Lj
QSEIirr þ QSEI
irr;0
, ð4Þ
where QSEIirr;0 ¼ sAL0F=V is the capacity corresponding to L0.
Next, we determine the LiI concentration at x=0 and x=L.At the electrode–SEI interface, interstitials are injected into the
SEI. We assume that injection is a fast process and that graph-ite is in thermodynamic equilibrium with the SEI across the in-
terface. This means that the electrochemical potential of Li ingraphite equals the one of LiI in the SEI
mLiLixC6
¼ mLiISEI
¼ mLiISEI;0 þ RT ln
cLiI x¼0jcLiI ;max
:ð5Þ
cLiI ,max is the maximal interstitial concentration and mLiISEI;0is a
(constant) reference value that can be determined using DFT
methods. This has been performed by Shi et al. for a Li2CO3
host lattice.[23] R is the ideal gas constant and T is the tempera-
ture [K] . The electrochemical potential of Li in the electrode isequal to @FU.[27,28] Thus, we can express the interstitial concen-
tration at the interface with Equation (6),
cLiI x¼0j ¼ cLiI ;0 exp@FURT
. -, ð6Þ
where cLiI ,0 is the interstitial concentration at U=0 V. cLiI ,0 is a
model parameter and absorbs all constant contributions in
Equation (5). At the SEI–electrolyte interface lithium interstitialsdo not accumulate. Instead, they are consumed by the fast SEI
formation reaction, that is, cLiI x¼Lj ¼ 0. This is the assumptionof transport-limited growth.
Differential equations similar to Equation (4) can be derived
for the electron-conduction and solvent-diffusion mechanisms.To this aim, the flux density of the corresponding LTGM is ex-pressed as a function of L and inserted into Equation (2). This
is done by applying the same approximations as above to theflux expression. For solvent diffusion we approximate Fick’slaws in Equation (7),
jSSEI ¼ @FDEC ?rcEC & @FDEC ?cEC;0L
, ð7Þ
where cEC is the EC concentration in the SEI pores and DEC is
the corresponding diffusion coefficient. cEC is assumed to bezero at the reaction interface (x=0). It is assumed to equal the
concentration of the active solvent (EC) in the electrolyte, cEC,0at x=L. For the electron-conduction model we approximateOhm’s law in Equation (8),
je@
SEI ¼ @k ?r@ & @k ?F0 @ UL
: ð8Þ
Here, f is the electric potential inside the SEI and k is the(electronic) conductivity. The potential is assumed to equal the
onset potential of SEI formation (F0) at the reaction interfaceand U at the electrode–SEI interface (see Table SI-2).
ChemSusChem 2018, 11, 1950 – 1955 www.chemsuschem.org T 2018 Wiley-VCH Verlag GmbH&Co. KGaA, Weinheim1952
Full Papers
Copyright (2020) Wiley. Reproduced with permission from reference [151]. 137
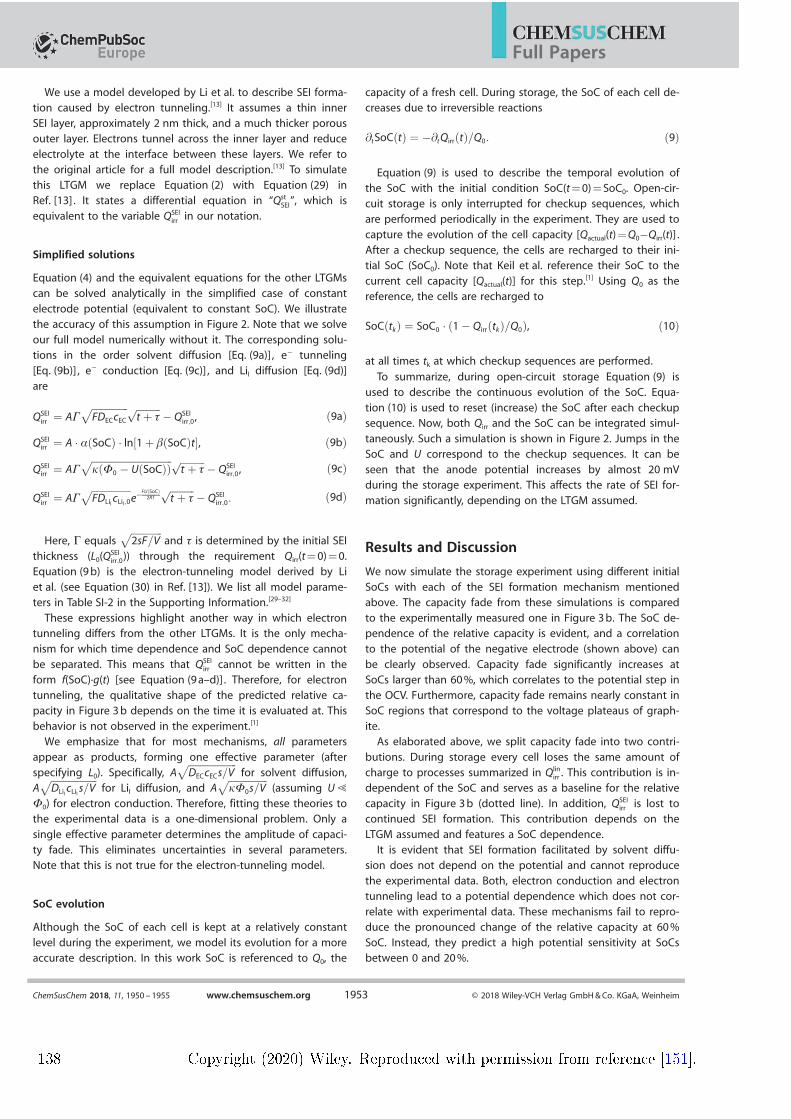
We use a model developed by Li et al. to describe SEI forma-tion caused by electron tunneling.[13] It assumes a thin inner
SEI layer, approximately 2 nm thick, and a much thicker porousouter layer. Electrons tunnel across the inner layer and reduce
electrolyte at the interface between these layers. We refer tothe original article for a full model description.[13] To simulate
this LTGM we replace Equation (2) with Equation (29) inRef. [13] . It states a differential equation in “Qst
SEI”, which isequivalent to the variable QSEI
irr in our notation.
Simplified solutions
Equation (4) and the equivalent equations for the other LTGMscan be solved analytically in the simplified case of constant
electrode potential (equivalent to constant SoC). We illustratethe accuracy of this assumption in Figure 2. Note that we solveour full model numerically without it. The corresponding solu-tions in the order solvent diffusion [Eq. (9a)] , e@ tunneling
[Eq. (9b)] , e@ conduction [Eq. (9c)] , and LiI diffusion [Eq. (9d)]are
QSEIirr ¼ AG
ffiffiffiffiffiffiffiffiffiffiffiffiffiffiffiFDECcEC
p ffiffiffiffiffiffiffiffiffiffit þ t
p @ QSEIirr;0, ð9aÞ
QSEIirr ¼ A ? a SoCð Þ ? ln 1þ b SoCð Þt½ A, ð9bÞ
QSEIirr ¼ AG
ffiffiffiffiffiffiffiffiffiffiffiffiffiffiffiffiffiffiffiffiffiffiffiffiffiffiffiffiffiffiffiffiffik F0 @ U SoCð Þð Þ
p ffiffiffiffiffiffiffiffiffiffit þ t
p @ QSEIirr;0, ð9cÞ
QSEIirr ¼ AG
ffiffiffiffiffiffiffiffiffiffiffiffiffiffiffiffiFDLiIcLiI ;0
pe@
FU SoCð Þ2RT
ffiffiffiffiffiffiffiffiffiffit þ t
p @ QSEIirr;0: ð9dÞ
Here, G equalsffiffiffiffiffiffiffiffiffiffiffiffiffi2sF=V
pand t is determined by the initial SEI
thickness (L0(QSEIirr;0)) through the requirement Qirr(t=0)=0.
Equation (9b) is the electron-tunneling model derived by Li
et al. (see Equation (30) in Ref. [13]). We list all model parame-ters in Table SI-2 in the Supporting Information.[29–32]
These expressions highlight another way in which electrontunneling differs from the other LTGMs. It is the only mecha-nism for which time dependence and SoC dependence cannot
be separated. This means that QSEIirr cannot be written in the
form f(SoC)·g(t) [see Equation (9a–d)] . Therefore, for electrontunneling, the qualitative shape of the predicted relative ca-pacity in Figure 3b depends on the time it is evaluated at. This
behavior is not observed in the experiment.[1]
We emphasize that for most mechanisms, all parameters
appear as products, forming one effective parameter (afterspecifying L0). Specifically, A
ffiffiffiffiffiffiffiffiffiffiffiffiffiffiffiffiffiffiffiffiDECcECs=V
pfor solvent diffusion,
AffiffiffiffiffiffiffiffiffiffiffiffiffiffiffiffiffiffiffiDLiIcLiIs=V
pfor LiI diffusion, and A
ffiffiffiffiffiffiffiffiffiffiffiffiffiffiffiffikF0s=V
p(assuming U!
F0) for electron conduction. Therefore, fitting these theories tothe experimental data is a one-dimensional problem. Only a
single effective parameter determines the amplitude of capaci-ty fade. This eliminates uncertainties in several parameters.
Note that this is not true for the electron-tunneling model.
SoC evolution
Although the SoC of each cell is kept at a relatively constant
level during the experiment, we model its evolution for a moreaccurate description. In this work SoC is referenced to Q0, the
capacity of a fresh cell. During storage, the SoC of each cell de-creases due to irreversible reactions
@tSoC tð Þ ¼ @@tQirrðtÞ=Q0: ð9Þ
Equation (9) is used to describe the temporal evolution ofthe SoC with the initial condition SoC(t=0)=SoC0. Open-cir-cuit storage is only interrupted for checkup sequences, whichare performed periodically in the experiment. They are used tocapture the evolution of the cell capacity [Qactual(t)=Q0@Qirr(t)] .After a checkup sequence, the cells are recharged to their ini-tial SoC (SoC0). Note that Keil et al. reference their SoC to thecurrent cell capacity [Qactual(t)] for this step.[1] Using Q0 as thereference, the cells are recharged to
SoC tkð Þ ¼ SoC0 ? 1@ QirrðtkÞ=Q0ð Þ, ð10Þ
at all times tk at which checkup sequences are performed.
To summarize, during open-circuit storage Equation (9) is
used to describe the continuous evolution of the SoC. Equa-
tion (10) is used to reset (increase) the SoC after each checkupsequence. Now, both Qirr and the SoC can be integrated simul-
taneously. Such a simulation is shown in Figure 2. Jumps in theSoC and U correspond to the checkup sequences. It can be
seen that the anode potential increases by almost 20 mVduring the storage experiment. This affects the rate of SEI for-
mation significantly, depending on the LTGM assumed.
Results and Discussion
We now simulate the storage experiment using different initial
SoCs with each of the SEI formation mechanism mentionedabove. The capacity fade from these simulations is compared
to the experimentally measured one in Figure 3b. The SoC de-pendence of the relative capacity is evident, and a correlation
to the potential of the negative electrode (shown above) can
be clearly observed. Capacity fade significantly increases atSoCs larger than 60%, which correlates to the potential step inthe OCV. Furthermore, capacity fade remains nearly constant inSoC regions that correspond to the voltage plateaus of graph-
ite.As elaborated above, we split capacity fade into two contri-
butions. During storage every cell loses the same amount ofcharge to processes summarized in Qlin
irr . This contribution is in-dependent of the SoC and serves as a baseline for the relative
capacity in Figure 3b (dotted line). In addition, QSEIirr is lost to
continued SEI formation. This contribution depends on the
LTGM assumed and features a SoC dependence.It is evident that SEI formation facilitated by solvent diffu-
sion does not depend on the potential and cannot reproduce
the experimental data. Both, electron conduction and electrontunneling lead to a potential dependence which does not cor-
relate with experimental data. These mechanisms fail to repro-duce the pronounced change of the relative capacity at 60%
SoC. Instead, they predict a high potential sensitivity at SoCsbetween 0 and 20%.
ChemSusChem 2018, 11, 1950 – 1955 www.chemsuschem.org T 2018 Wiley-VCH Verlag GmbH&Co. KGaA, Weinheim1953
Full Papers
138 Copyright (2020) Wiley. Reproduced with permission from reference [151].
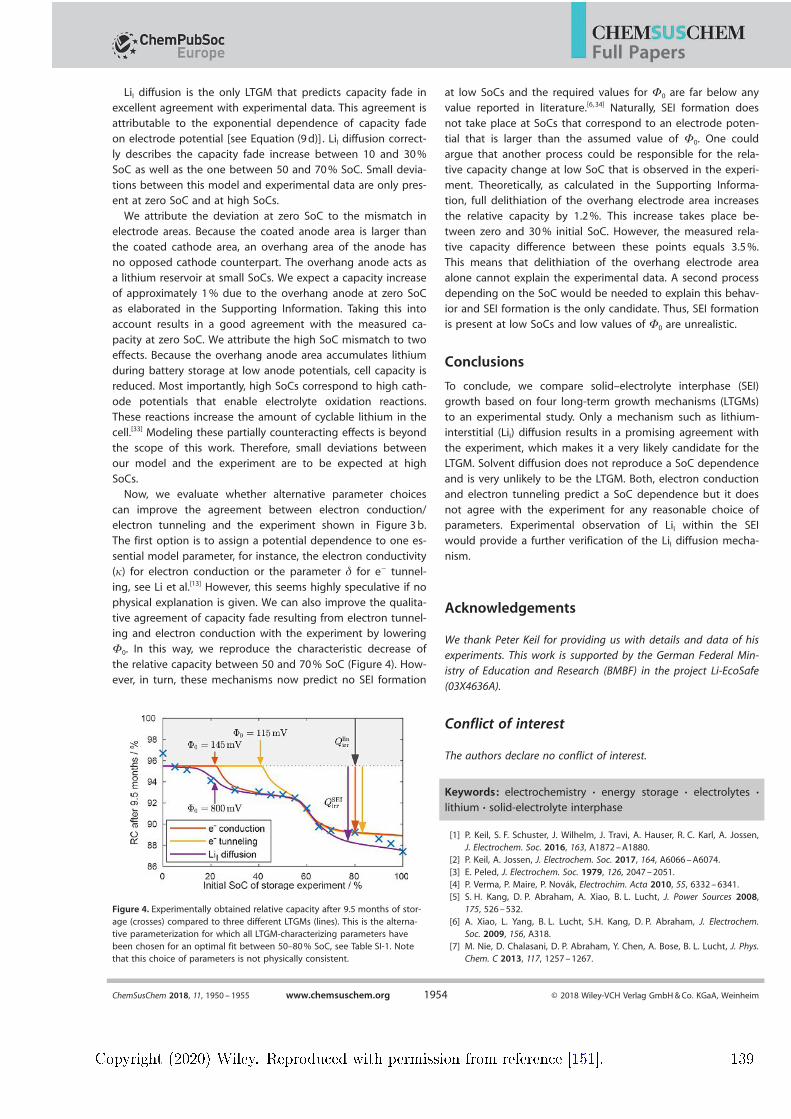
LiI diffusion is the only LTGM that predicts capacity fade inexcellent agreement with experimental data. This agreement is
attributable to the exponential dependence of capacity fadeon electrode potential [see Equation (9d)] . LiI diffusion correct-
ly describes the capacity fade increase between 10 and 30%SoC as well as the one between 50 and 70% SoC. Small devia-
tions between this model and experimental data are only pres-ent at zero SoC and at high SoCs.
We attribute the deviation at zero SoC to the mismatch in
electrode areas. Because the coated anode area is larger thanthe coated cathode area, an overhang area of the anode has
no opposed cathode counterpart. The overhang anode acts asa lithium reservoir at small SoCs. We expect a capacity increase
of approximately 1% due to the overhang anode at zero SoCas elaborated in the Supporting Information. Taking this intoaccount results in a good agreement with the measured ca-
pacity at zero SoC. We attribute the high SoC mismatch to twoeffects. Because the overhang anode area accumulates lithiumduring battery storage at low anode potentials, cell capacity isreduced. Most importantly, high SoCs correspond to high cath-
ode potentials that enable electrolyte oxidation reactions.These reactions increase the amount of cyclable lithium in the
cell.[33] Modeling these partially counteracting effects is beyond
the scope of this work. Therefore, small deviations betweenour model and the experiment are to be expected at high
SoCs.Now, we evaluate whether alternative parameter choices
can improve the agreement between electron conduction/electron tunneling and the experiment shown in Figure 3b.
The first option is to assign a potential dependence to one es-
sential model parameter, for instance, the electron conductivity(k) for electron conduction or the parameter d for e@ tunnel-
ing, see Li et al.[13] However, this seems highly speculative if nophysical explanation is given. We can also improve the qualita-
tive agreement of capacity fade resulting from electron tunnel-ing and electron conduction with the experiment by lowering
F0. In this way, we reproduce the characteristic decrease of
the relative capacity between 50 and 70% SoC (Figure 4). How-ever, in turn, these mechanisms now predict no SEI formation
at low SoCs and the required values for F0 are far below anyvalue reported in literature.[6, 34] Naturally, SEI formation does
not take place at SoCs that correspond to an electrode poten-tial that is larger than the assumed value of F0. One could
argue that another process could be responsible for the rela-tive capacity change at low SoC that is observed in the experi-
ment. Theoretically, as calculated in the Supporting Informa-tion, full delithiation of the overhang electrode area increases
the relative capacity by 1.2%. This increase takes place be-
tween zero and 30% initial SoC. However, the measured rela-tive capacity difference between these points equals 3.5%.
This means that delithiation of the overhang electrode areaalone cannot explain the experimental data. A second process
depending on the SoC would be needed to explain this behav-ior and SEI formation is the only candidate. Thus, SEI formationis present at low SoCs and low values of F0 are unrealistic.
Conclusions
To conclude, we compare solid–electrolyte interphase (SEI)
growth based on four long-term growth mechanisms (LTGMs)to an experimental study. Only a mechanism such as lithium-
interstitial (LiI) diffusion results in a promising agreement with
the experiment, which makes it a very likely candidate for theLTGM. Solvent diffusion does not reproduce a SoC dependence
and is very unlikely to be the LTGM. Both, electron conductionand electron tunneling predict a SoC dependence but it does
not agree with the experiment for any reasonable choice ofparameters. Experimental observation of LiI within the SEI
would provide a further verification of the LiI diffusion mecha-
nism.
Acknowledgements
We thank Peter Keil for providing us with details and data of his
experiments. This work is supported by the German Federal Min-istry of Education and Research (BMBF) in the project Li-EcoSafe
(03X4636A).
Conflict of interest
The authors declare no conflict of interest.
Keywords: electrochemistry · energy storage · electrolytes ·lithium · solid-electrolyte interphase
[1] P. Keil, S. F. Schuster, J. Wilhelm, J. Travi, A. Hauser, R. C. Karl, A. Jossen,J. Electrochem. Soc. 2016, 163, A1872–A1880.
[2] P. Keil, A. Jossen, J. Electrochem. Soc. 2017, 164, A6066–A6074.[3] E. Peled, J. Electrochem. Soc. 1979, 126, 2047–2051.[4] P. Verma, P. Maire, P. Nov#k, Electrochim. Acta 2010, 55, 6332–6341.[5] S. H. Kang, D. P. Abraham, A. Xiao, B. L. Lucht, J. Power Sources 2008,
175, 526–532.[6] A. Xiao, L. Yang, B. L. Lucht, S.H. Kang, D. P. Abraham, J. Electrochem.
Soc. 2009, 156, A318.[7] M. Nie, D. Chalasani, D. P. Abraham, Y. Chen, A. Bose, B. L. Lucht, J. Phys.
Chem. C 2013, 117, 1257–1267.
Figure 4. Experimentally obtained relative capacity after 9.5 months of stor-age (crosses) compared to three different LTGMs (lines). This is the alterna-tive parameterization for which all LTGM-characterizing parameters havebeen chosen for an optimal fit between 50–80% SoC, see Table SI-1. Notethat this choice of parameters is not physically consistent.
ChemSusChem 2018, 11, 1950 – 1955 www.chemsuschem.org T 2018 Wiley-VCH Verlag GmbH&Co. KGaA, Weinheim1954
Full Papers
Copyright (2020) Wiley. Reproduced with permission from reference [151]. 139
[8] M. Nie, D. P. Abraham, Y. Chen, A. Bose, B. L. Lucht, J. Phys. Chem. C2013, 117, 13403–13412.
[9] D. Bedrov, O. Borodin, J. B. Hooper, J. Phys. Chem. C 2017, 121, 16098–16109.
[10] H. J. Ploehn, P. Ramadass, R. E. White, J. Electrochem. Soc. 2004, 151,A456.
[11] M. B. Pinson, M. Z. Bazant, J. Electrochem. Soc. 2012, 160, A243–A250.[12] M. Tang, S. Lu, J. Newman, J. Electrochem. Soc. 2012, 159, A1775–
A1785.[13] D. Li, D. Danilov, Z. Zhang, H. Chen, Y. Yang, P. H. L. Notten, J. Electro-
chem. Soc. 2015, 162, A858–A869.[14] M. Broussely, S. Herreyre, P. Biensan, P. Kasztejna, K. Nechev, R. J. Stanie-
wicz, J. Power Sources 2001, 97–98, 13–21.[15] J. Christensen, J. Newman, J. Electrochem. Soc. 2004, 151, A1977.[16] F. Single, B. Horstmann, A. Latz, Phys. Chem. Chem. Phys. 2016, 18,
17810–17814.[17] F. Single, B. Horstmann, A. Latz, J. Electrochem. Soc. 2017, 164, E3132–
E3145.[18] F. Rçder, R. D. Braatz, U. Krewer, J. Electrochem. Soc. 2017, 164, E3335–
E3344.[19] A. M. Colclasure, K. A. Smith, R. J. Kee, Electrochim. Acta 2011, 58, 33–
43.[20] F. Rçder, R. D. Braatz, U. Krewer in Computer Aided Chemical Engineering,
Elsevier, Amsterdam, 2016, pp. 157–162.[21] F. Hao, Z. Liu, P. B. Balbuena, P. P. Mukherjee, J. Phys. Chem. C 2017, 121,
26233–26240.[22] F. A. Soto, Y. Ma, J. M. Martinez de la Hoz, J. M. Seminario, P. B. Balbuena,
Chem. Mater. 2015, 27, 7990–8000.
[23] S. Shi, P. Lu, Z. Liu, Y. Qi, L. G. Hector, H. Li, S. J. Harris, J. Am. Chem. Soc.2012, 134, 15476–15487.
[24] A. J. Smith, J. C. Burns, X. Zhao, D. Xiong, J. R. Dahn, J. Electrochem. Soc.2011, 158, A447.
[25] M. Steinhauer, M. Stich, M. Kurniawan, B.-K. Seidlhofer, M. Trapp, A.Bund, N. Wagner, K. A. Friedrich, ACS Appl. Mater. Interfaces 2017, 9,35794–35801.
[26] E. Peled, S. Menkin, J. Electrochem. Soc. 2017, 164, A1703–A1719.[27] A. Latz, J. Zausch, J. Power Sources 2011, 196, 3296–3302.[28] A. Latz, J. Zausch, Electrochim. Acta 2013, 110, 358–362.[29] O. Borodin, G. D. Smith, P. Fan, J. Phys. Chem. B 2006, 110, 22773–
22779.[30] G. V. Zhuang, K. Xu, H. Yang, T. R. Jow, P. N. Ross, J. Phys. Chem. B 2005,
109, 17567–17573.[31] K. Edstrçm, M. Herstedt, D. P. Abraham, J. Power Sources 2006, 153,
380–384.[32] T. L. Kulova, A. M. Skundin, E. A. Nizhnikovskii, A. V. Fesenko, Russ. J. Elec-
trochem. 2006, 42, 259–262.[33] R. D. Deshpande, P. Ridgway, Y. Fu, W. Zhang, J. Cai, V. Battaglia, J. Elec-
trochem. Soc. 2015, 162, A330–A338.[34] O. Borodin, M. Olguin, C. E. Spear, K. W. Leiter, J. Knap, Nanotechnology
2015, 26, 354003.
Manuscript received: January 11, 2018Revised manuscript received: March 8, 2018
Accepted manuscript online: March 12, 2018Version of record online: April 17, 2018
ChemSusChem 2018, 11, 1950 – 1955 www.chemsuschem.org T 2018 Wiley-VCH Verlag GmbH&Co. KGaA, Weinheim1955
Full Papers
140 Copyright (2020) Wiley. Reproduced with permission from reference [151].
Supporting Information
Identifying the Mechanism of Continued Growth of theSolid–Electrolyte InterphaseFabian Single,[a, b] Arnulf Latz,[a, b, c] and Birger Horstmann*[a, b]
cssc_201800077_sm_miscellaneous_information.pdf
Copyright (2020) Wiley. Reproduced with permission from reference [151]. 141
1. OVERHANG ANODE AREA
The NCR18650PD cells studied in this experiment are designed such that the coated
anode area is larger that the coated cathode area (798 cm2 vs 767 cm2).1 This results in
so-called “overhang areas” of the anode. Lithium stored in this part does not participate in
regular charge and discharge cycles. However, it can slowly enter/leave the anode during
storage and become available for cycling. The driving force for this process is the potential
difference between the actual negative electrode and the overhang area. All cells were
delivered and stored at approximately 30% SoC before the experiment. We assume this
to be the initial SoC of the overhang area. According to the values provided by Keil et al.
the overhang area equals 31 cm2 (note that this is an approximation because the coated area
mismatch is reduced slightly when the cell is rolled up). This means that the overhang can
store up to 4% of the total cell capacity.
The impact of the overhang area on the lithium balance of the cell depends on the SoC
the cell is stored at.
• Cells stored at zero SoC feature a large driving force for overhang delithiation (500mV).
Consequently, we expect full delithiation of the overhang area from its initial SoC of
30%. This corresponds to an increase of the cell capacity by 1.2%.
• The anode potential of cells stored between 20-60% SoC is nearly constant because of
the first voltage plateau. This means that the driving force for overhang lithiation is
small (1-3mV). Therefore, we expect little to no impact from this effect for cells stored
in this SoC range.
• Cells stored at SoCs larger than 60% feature a driving force of approximately 20mV
which is still relatively small. This causes a capacity decrease because the overlap
consumes lithium. Note that this process is slow because of the small driving force.
Quantifying the corresponding capacity decrease is beyond the scope of this work.
2
142 Copyright (2020) Wiley. Reproduced with permission from reference [151].
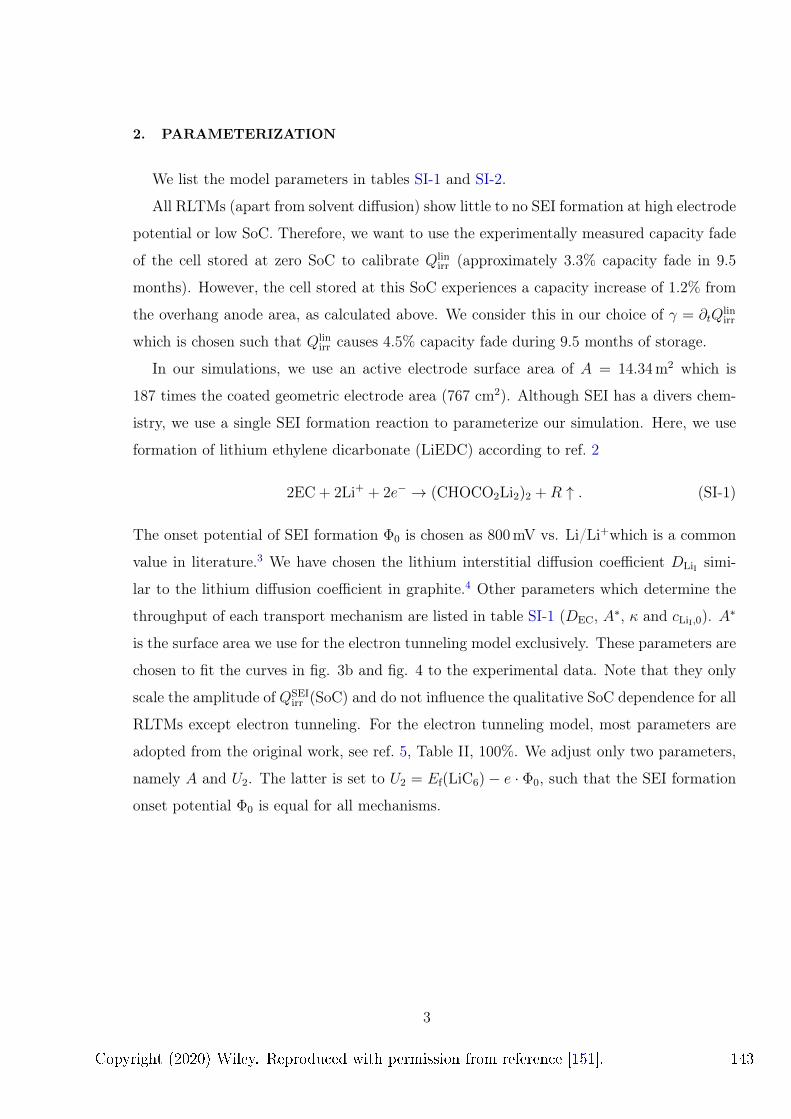
2. PARAMETERIZATION
We list the model parameters in tables SI-1 and SI-2.
All RLTMs (apart from solvent diffusion) show little to no SEI formation at high electrode
potential or low SoC. Therefore, we want to use the experimentally measured capacity fade
of the cell stored at zero SoC to calibrate Qlinirr (approximately 3.3% capacity fade in 9.5
months). However, the cell stored at this SoC experiences a capacity increase of 1.2% from
the overhang anode area, as calculated above. We consider this in our choice of γ = ∂tQlinirr
which is chosen such that Qlinirr causes 4.5% capacity fade during 9.5 months of storage.
In our simulations, we use an active electrode surface area of A = 14.34m2 which is
187 times the coated geometric electrode area (767 cm2). Although SEI has a divers chem-
istry, we use a single SEI formation reaction to parameterize our simulation. Here, we use
formation of lithium ethylene dicarbonate (LiEDC) according to ref. 2
2EC + 2Li+ + 2e− → (CHOCO2Li2)2 +R ↑ . (SI-1)
The onset potential of SEI formation Φ0 is chosen as 800mV vs. Li/Li+which is a common
value in literature.3 We have chosen the lithium interstitial diffusion coefficient DLiI simi-
lar to the lithium diffusion coefficient in graphite.4 Other parameters which determine the
throughput of each transport mechanism are listed in table SI-1 (DEC, A∗, κ and cLiI,0). A∗
is the surface area we use for the electron tunneling model exclusively. These parameters are
chosen to fit the curves in fig. 3b and fig. 4 to the experimental data. Note that they only
scale the amplitude of QSEIirr (SoC) and do not influence the qualitative SoC dependence for all
RLTMs except electron tunneling. For the electron tunneling model, most parameters are
adopted from the original work, see ref. 5, Table II, 100%. We adjust only two parameters,
namely A and U2. The latter is set to U2 = Ef(LiC6)− e · Φ0, such that the SEI formation
onset potential Φ0 is equal for all mechanisms.
3
Copyright (2020) Wiley. Reproduced with permission from reference [151]. 143
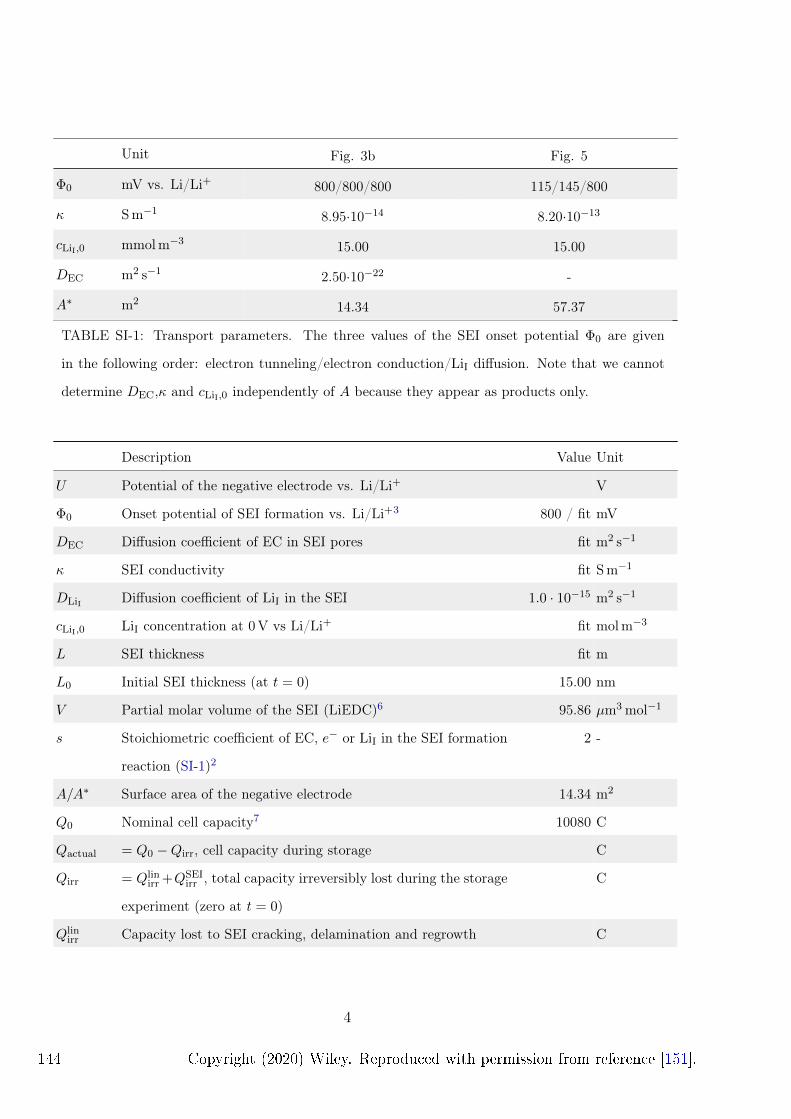
Unit Fig. 3b Fig. 5
Φ0 mV vs. Li/Li+ 800/800/800 115/145/800
κ Sm−1 8.95·10−14 8.20·10−13
cLiI,0 mmolm−3 15.00 15.00
DEC m2 s−1 2.50·10−22 -
A∗ m2 14.34 57.37
TABLE SI-1: Transport parameters. The three values of the SEI onset potential Φ0 are given
in the following order: electron tunneling/electron conduction/LiI diffusion. Note that we cannot
determine DEC,κ and cLiI,0 independently of A because they appear as products only.
Description Value Unit
U Potential of the negative electrode vs. Li/Li+ V
Φ0 Onset potential of SEI formation vs. Li/Li+3 800 / fit mV
DEC Diffusion coefficient of EC in SEI pores fit m2 s−1
κ SEI conductivity fit Sm−1
DLiI Diffusion coefficient of LiI in the SEI 1.0 · 10−15 m2 s−1
cLiI,0 LiI concentration at 0V vs Li/Li+ fit molm−3
L SEI thickness fit m
L0 Initial SEI thickness (at t = 0) 15.00 nm
V Partial molar volume of the SEI (LiEDC)6 95.86 µm3mol−1
s Stoichiometric coefficient of EC, e− or LiI in the SEI formation
reaction (SI-1)2
2 -
A/A∗ Surface area of the negative electrode 14.34 m2
Q0 Nominal cell capacity7 10080 C
Qactual = Q0 −Qirr, cell capacity during storage C
Qirr = Qlinirr +QSEI
irr , total capacity irreversibly lost during the storage
experiment (zero at t = 0)
C
Qlinirr Capacity lost to SEI cracking, delamination and regrowth C
4
144 Copyright (2020) Wiley. Reproduced with permission from reference [151].
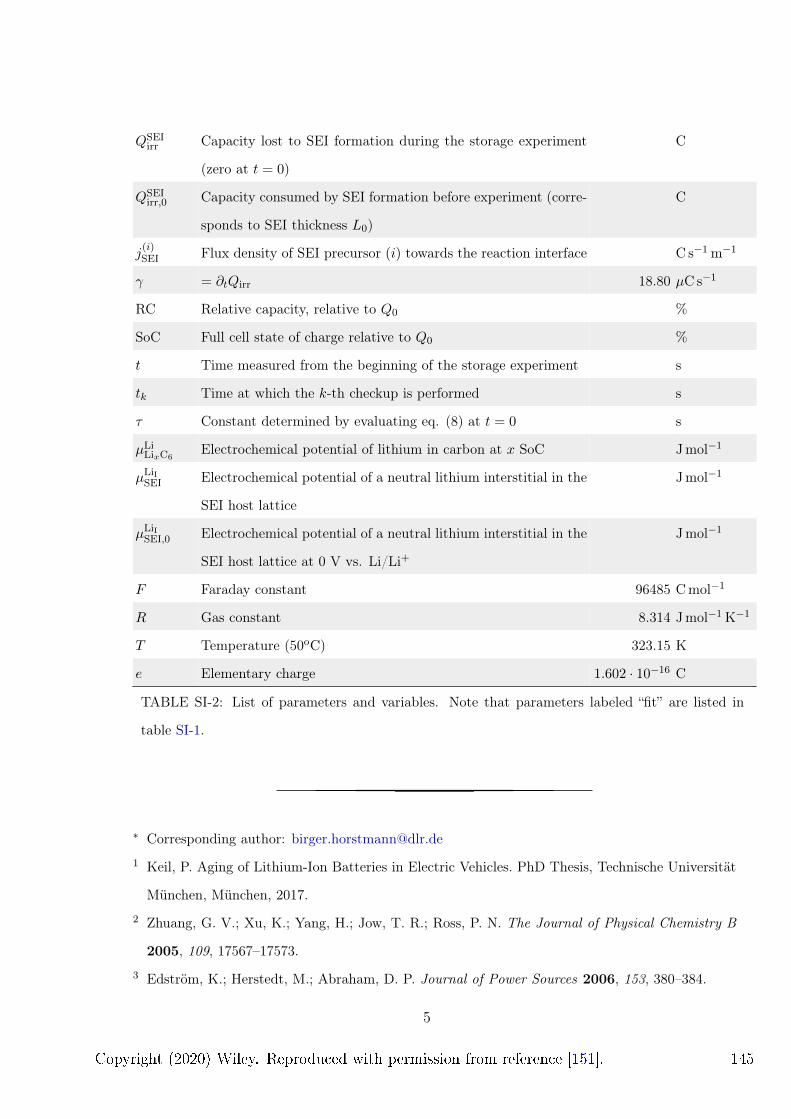
QSEIirr Capacity lost to SEI formation during the storage experiment
(zero at t = 0)
C
QSEIirr,0 Capacity consumed by SEI formation before experiment (corre-
sponds to SEI thickness L0)
C
j(i)SEI Flux density of SEI precursor (i) towards the reaction interface C s−1m−1
γ = ∂tQirr 18.80 µC s−1
RC Relative capacity, relative to Q0 %
SoC Full cell state of charge relative to Q0 %
t Time measured from the beginning of the storage experiment s
tk Time at which the k-th checkup is performed s
τ Constant determined by evaluating eq. (8) at t = 0 s
µLiLixC6Electrochemical potential of lithium in carbon at x SoC Jmol−1
µLiISEI Electrochemical potential of a neutral lithium interstitial in the
SEI host lattice
Jmol−1
µLiISEI,0 Electrochemical potential of a neutral lithium interstitial in the
SEI host lattice at 0 V vs. Li/Li+
Jmol−1
F Faraday constant 96485 Cmol−1
R Gas constant 8.314 Jmol−1K−1
T Temperature (50oC) 323.15 K
e Elementary charge 1.602 · 10−16 C
TABLE SI-2: List of parameters and variables. Note that parameters labeled “fit” are listed in
table SI-1.
∗ Corresponding author: [email protected]
1 Keil, P. Aging of Lithium-Ion Batteries in Electric Vehicles. PhD Thesis, Technische Universität
München, München, 2017.
2 Zhuang, G. V.; Xu, K.; Yang, H.; Jow, T. R.; Ross, P. N. The Journal of Physical Chemistry B
2005, 109, 17567–17573.
3 Edström, K.; Herstedt, M.; Abraham, D. P. Journal of Power Sources 2006, 153, 380–384.
5
Copyright (2020) Wiley. Reproduced with permission from reference [151]. 145
4 Kulova, T.; Skundin, A.; Nizhnikovskii, E.; Fesenko, A. Russian Journal of Electrochemistry
2006, 42, 259–262.
5 Li, D.; Danilov, D.; Zhang, Z.; Chen, H.; Yang, Y.; Notten, P. H. L. Journal of the Electrochemical
Society 2015, 162, A858–A869.
6 Borodin, O.; Smith, G. D.; Fan, P. The Journal of Physical Chemistry B 2006, 110, 22773–22779.
7 Keil, P.; Schuster, S. F.; Wilhelm, J.; Travi, J.; Hauser, A.; Karl, R. C.; Jossen, A. Journal of
The Electrochemical Society 2016, 163, A1872–A1880.
6
146 Copyright (2020) Wiley. Reproduced with permission from reference [151].
Review Article
Review on multi-scale models of solid-electrolyteinterphase formationBirger Horstmann1,2, Fabian Single1,2 and Arnulf Latz1,2,3
AbstractElectrolyte reduction products form the solid-electrolyte inter-phase (SEI) on negative electrodes of lithium-ion batteries.Even though this process practically stabilizes theelectrode–electrolyte interface, it results in continued capacity-fade limiting lifetime and safety of lithium-ion batteries. Recentatomistic and continuum theories give new insights into thegrowth of structures and the transport of ions in the SEI. Thediffusion of neutral radicals has emerged as a prominentcandidate for the long-term growth mechanism, because itpredicts the observed potential dependence of SEI growth.
Addresses1 Helmholtz Institute Ulm (HIU), Helmholtzstraße 11, 89081, Ulm,Germany2 German Aerospace Center (DLR), Institute of Engineering Thermo-dynamics, Pfaffenwaldring 38-40, 70569, Stuttgart, Germany3 Ulm University, Institute of Electrochemistry, Albert-Einstein-Allee 47,89069, Ulm, Germany
Corresponding author: Horstmann, Birger ([email protected])
Current Opinion in Electrochemistry 2019, 13:61–69
This review comes from a themed issue on Fundamental & Theoret-ical Electrochemistry
Edited by Martin Bazant
For a complete overview see the Issue and the Editorial
Available online 2 November 2018
https://doi.org/10.1016/j.coelec.2018.10.013
2451-9103/© 2018 Elsevier B.V. All rights reserved.
KeywordsLithium-ion battery, Solid-electrolyte interphase, SEI growth, Capacityfade, Multi-scale modeling, Validation.
IntroductionStandard lithium-ion batteries rely on graphite asnegative electrode material even though graphite de-composes the standard electrolytes at their workingpotentials (see Figure 1). The decomposition productsform the so-called solid-electrolyte interphase (SEI)which is protecting the electrolyte and suppressesfurther electrolyte reduction [4,5]. Nevertheless,lithium transport through the SEI remains possible andis typically not limiting battery performance. The SEI isin the focus of many processes limiting lifetime, per-
formance, and safety of lithium-ion batteries. It affects
the inhomogeneous growth and dissolution of lithiummetal [6,7]. Thermal runaway as the main cause forbattery failure is promoted by SEI decomposition [8e11]. The main capacity fade during battery storagestems from the consumption of lithium due to thecontinued growth of SEI [12,13]. During batterycycling, graphite undergoes a notable volume changedamaging the SEI and accelerating loss of cycle-able
lithium. This volume change is even more pronouncedfor next-generation high-capacity materials like lithiummetal or silicon [14]. Generally, the quest for largerbattery cell voltages requires improvements in interfa-cial stability. Thus, SEI modeling contributes to thebroad theoretical effort towards rational design of stableelectrolytes [15e17].
Since 1979 a multitude of experimental SEI research hasbeen performed [4,18], recent examples include batterystorage at various state-of-charge (SoC) [12,13], differ-
ential capacity analysis during cycling [19], neutronreflectometry [20], atomic force microscopy [21], nuclearmagnetic resonance [22], redox shuttles [23,24], fourier-transform infrared spectroscopy [25], and photo-electronspectroscopy [26]. As a consequence, there is a generalunderstanding of SEI composition andmorphology for fewspecific systems. The chemical composition of the SEI,however, is diverse and disturbed by trace-amounts ofcontaminants. Therefore, elucidating SEI behavior re-quires a careful experimental effort and several keyquestions about basic SEI mechanisms have yet to be
answered (see Figure 2). Most striking is the fact that themechanism for Liþ transport through the SEI is stilldebated. A dual-layer structure of SEI is typicallydescribed with an inner compact layer and a porous poly-meric outer layer [27], but both the thickness and theformation mechanism of these layers are still debated.
Under these circumstances, theoretical studies provideimportant complementary insights into universal prin-ciples of SEI chemistry, structure, and dynamics. Thediversity of entangled length and time scales governing
SEI properties constitutes a fundamental theoreticalchallenge. One should, for example, distinguish be-tween the process of initial SEI formation in hours anddays and the continued SEI growth in months and years.On the one hand, SEI chemistry is governed by reactionsbetween individual atoms and molecules. On the otherhand, molecular environments influence reaction
Available online at www.sciencedirect.com
ScienceDirectCurrent Opinion in
Electrochemistry
www.sciencedirect.com Current Opinion in Electrochemistry 2019, 13:61–69
Reproduced from reference [11], Copyright (2020), with permission from Elsevier.
147
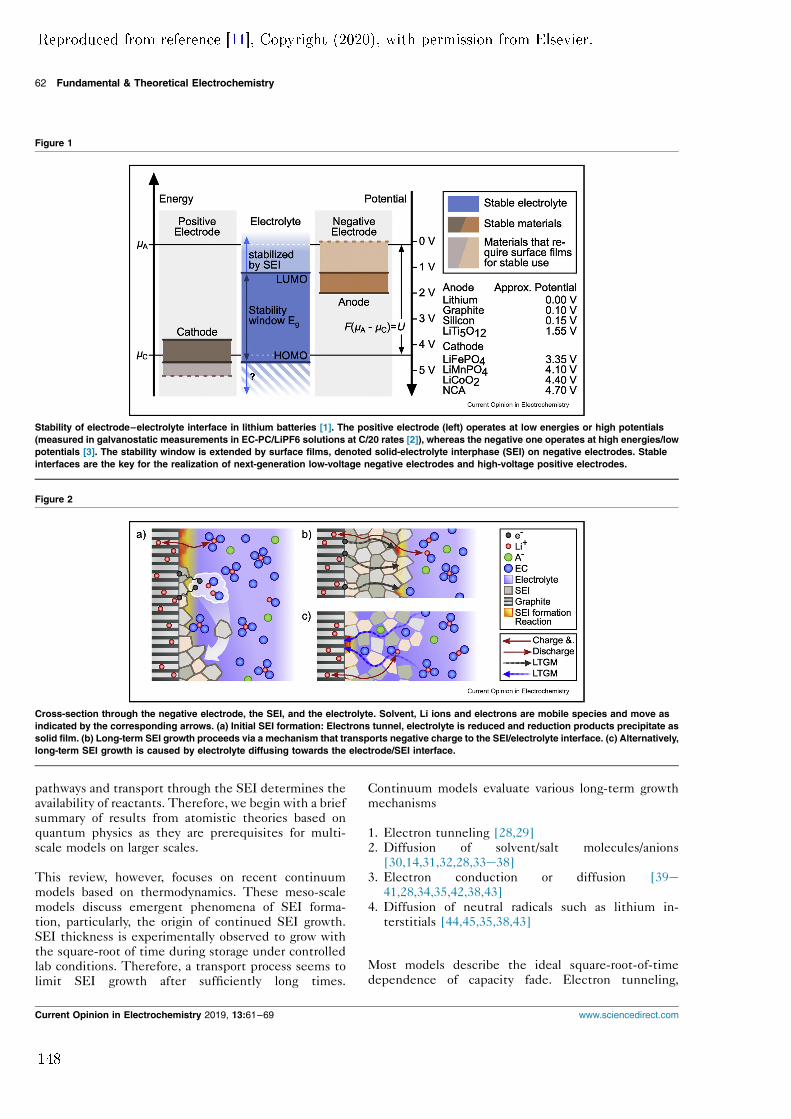
pathways and transport through the SEI determines theavailability of reactants. Therefore, we begin with a briefsummary of results from atomistic theories based onquantum physics as they are prerequisites for multi-scale models on larger scales.
This review, however, focuses on recent continuummodels based on thermodynamics. These meso-scale
models discuss emergent phenomena of SEI forma-tion, particularly, the origin of continued SEI growth.SEI thickness is experimentally observed to grow withthe square-root of time during storage under controlledlab conditions. Therefore, a transport process seems tolimit SEI growth after sufficiently long times.
Continuum models evaluate various long-term growthmechanisms
1. Electron tunneling [28,29]2. Diffusion of solvent/salt molecules/anions
[30,14,31,32,28,33e38]3. Electron conduction or diffusion [39e
41,28,34,35,42,38,43]
4. Diffusion of neutral radicals such as lithium in-terstitials [44,45,35,38,43]
Most models describe the ideal square-root-of-timedependence of capacity fade. Electron tunneling,
Figure 1
Stability of electrode–electrolyte interface in lithium batteries [1]. The positive electrode (left) operates at low energies or high potentials(measured in galvanostatic measurements in EC-PC/LiPF6 solutions at C/20 rates [2]), whereas the negative one operates at high energies/lowpotentials [3]. The stability window is extended by surface films, denoted solid-electrolyte interphase (SEI) on negative electrodes. Stableinterfaces are the key for the realization of next-generation low-voltage negative electrodes and high-voltage positive electrodes.
Figure 2
Cross-section through the negative electrode, the SEI, and the electrolyte. Solvent, Li ions and electrons are mobile species and move asindicated by the corresponding arrows. (a) Initial SEI formation: Electrons tunnel, electrolyte is reduced and reduction products precipitate assolid film. (b) Long-term SEI growth proceeds via a mechanism that transports negative charge to the SEI/electrolyte interface. (c) Alternatively,long-term SEI growth is caused by electrolyte diffusing towards the electrode/SEI interface.
62 Fundamental & Theoretical Electrochemistry
Current Opinion in Electrochemistry 2019, 13:61–69 www.sciencedirect.com
Reproduced from reference [11], Copyright (2020), with permission from Elsevier.
148
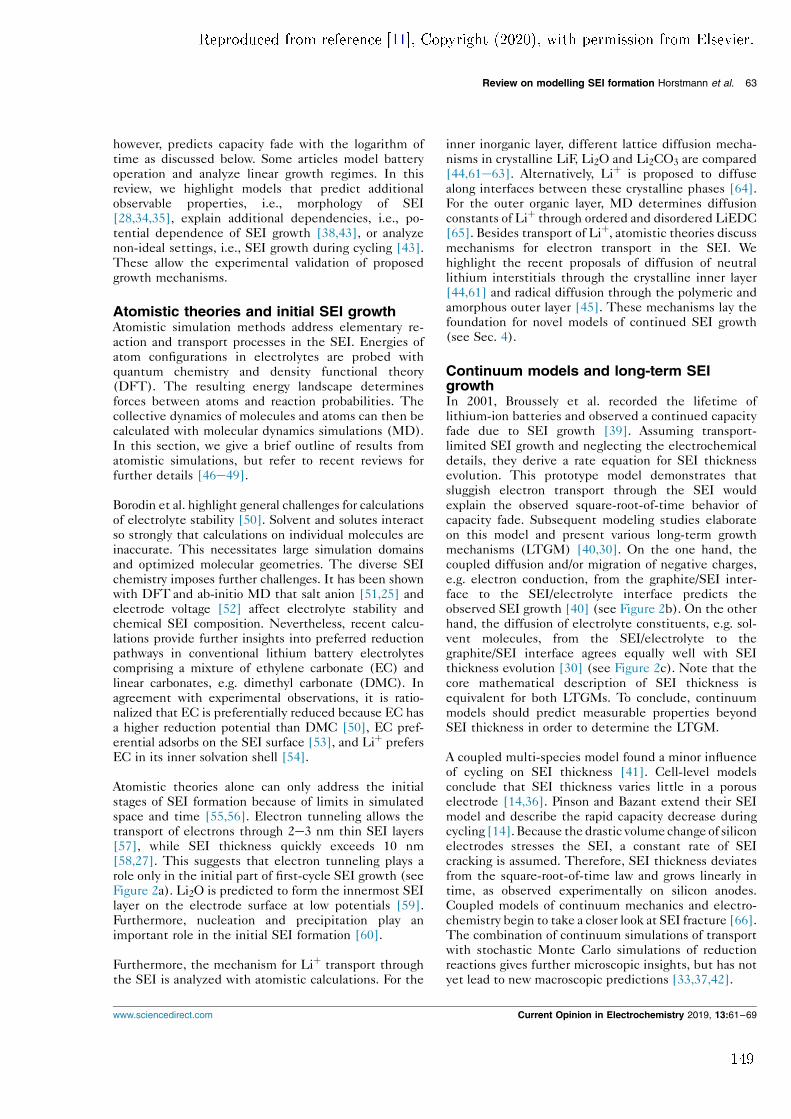
however, predicts capacity fade with the logarithm oftime as discussed below. Some articles model batteryoperation and analyze linear growth regimes. In thisreview, we highlight models that predict additionalobservable properties, i.e., morphology of SEI[28,34,35], explain additional dependencies, i.e., po-tential dependence of SEI growth [38,43], or analyzenon-ideal settings, i.e., SEI growth during cycling [43].
These allow the experimental validation of proposedgrowth mechanisms.
Atomistic theories and initial SEI growthAtomistic simulation methods address elementary re-
action and transport processes in the SEI. Energies ofatom configurations in electrolytes are probed withquantum chemistry and density functional theory(DFT). The resulting energy landscape determinesforces between atoms and reaction probabilities. Thecollective dynamics of molecules and atoms can then becalculated with molecular dynamics simulations (MD).In this section, we give a brief outline of results fromatomistic simulations, but refer to recent reviews forfurther details [46e49].
Borodin et al. highlight general challenges for calculationsof electrolyte stability [50]. Solvent and solutes interactso strongly that calculations on individual molecules areinaccurate. This necessitates large simulation domainsand optimized molecular geometries. The diverse SEIchemistry imposes further challenges. It has been shownwith DFT and ab-initio MD that salt anion [51,25] andelectrode voltage [52] affect electrolyte stability andchemical SEI composition. Nevertheless, recent calcu-lations provide further insights into preferred reductionpathways in conventional lithium battery electrolytescomprising a mixture of ethylene carbonate (EC) and
linear carbonates, e.g. dimethyl carbonate (DMC). Inagreement with experimental observations, it is ratio-nalized that EC is preferentially reduced because EC hasa higher reduction potential than DMC [50], EC pref-erential adsorbs on the SEI surface [53], and Liþ prefersEC in its inner solvation shell [54].
Atomistic theories alone can only address the initialstages of SEI formation because of limits in simulatedspace and time [55,56]. Electron tunneling allows thetransport of electrons through 2e3 nm thin SEI layers
[57], while SEI thickness quickly exceeds 10 nm[58,27]. This suggests that electron tunneling plays arole only in the initial part of first-cycle SEI growth (seeFigure 2a). Li2O is predicted to form the innermost SEIlayer on the electrode surface at low potentials [59].Furthermore, nucleation and precipitation play animportant role in the initial SEI formation [60].
Furthermore, the mechanism for Liþ transport throughthe SEI is analyzed with atomistic calculations. For the
inner inorganic layer, different lattice diffusion mecha-nisms in crystalline LiF, Li2O and Li2CO3 are compared[44,61e63]. Alternatively, Liþ is proposed to diffusealong interfaces between these crystalline phases [64].For the outer organic layer, MD determines diffusionconstants of Liþ through ordered and disordered LiEDC[65]. Besides transport of Liþ, atomistic theories discussmechanisms for electron transport in the SEI. We
highlight the recent proposals of diffusion of neutrallithium interstitials through the crystalline inner layer[44,61] and radical diffusion through the polymeric andamorphous outer layer [45]. These mechanisms lay thefoundation for novel models of continued SEI growth(see Sec. 4).
Continuum models and long-term SEIgrowthIn 2001, Broussely et al. recorded the lifetime oflithium-ion batteries and observed a continued capacityfade due to SEI growth [39]. Assuming transport-limited SEI growth and neglecting the electrochemicaldetails, they derive a rate equation for SEI thicknessevolution. This prototype model demonstrates thatsluggish electron transport through the SEI would
explain the observed square-root-of-time behavior ofcapacity fade. Subsequent modeling studies elaborateon this model and present various long-term growthmechanisms (LTGM) [40,30]. On the one hand, thecoupled diffusion and/or migration of negative charges,e.g. electron conduction, from the graphite/SEI inter-face to the SEI/electrolyte interface predicts theobserved SEI growth [40] (see Figure 2b). On the otherhand, the diffusion of electrolyte constituents, e.g. sol-vent molecules, from the SEI/electrolyte to thegraphite/SEI interface agrees equally well with SEIthickness evolution [30] (see Figure 2c). Note that the
core mathematical description of SEI thickness isequivalent for both LTGMs. To conclude, continuummodels should predict measurable properties beyondSEI thickness in order to determine the LTGM.
A coupled multi-species model found a minor influenceof cycling on SEI thickness [41]. Cell-level modelsconclude that SEI thickness varies little in a porouselectrode [14,36]. Pinson and Bazant extend their SEImodel and describe the rapid capacity decrease duringcycling [14]. Because thedrastic volume change of silicon
electrodes stresses the SEI, a constant rate of SEIcracking is assumed. Therefore, SEI thickness deviatesfrom the square-root-of-time law and grows linearly intime, as observed experimentally on silicon anodes.Coupled models of continuum mechanics and electro-chemistry begin to take a closer look at SEI fracture [66].The combination of continuum simulations of transportwith stochastic Monte Carlo simulations of reductionreactions gives further microscopic insights, but has notyet lead to new macroscopic predictions [33,37,42].
Review on modelling SEI formation Horstmann et al. 63
www.sciencedirect.com Current Opinion in Electrochemistry 2019, 13:61–69
Reproduced from reference [11], Copyright (2020), with permission from Elsevier.
149
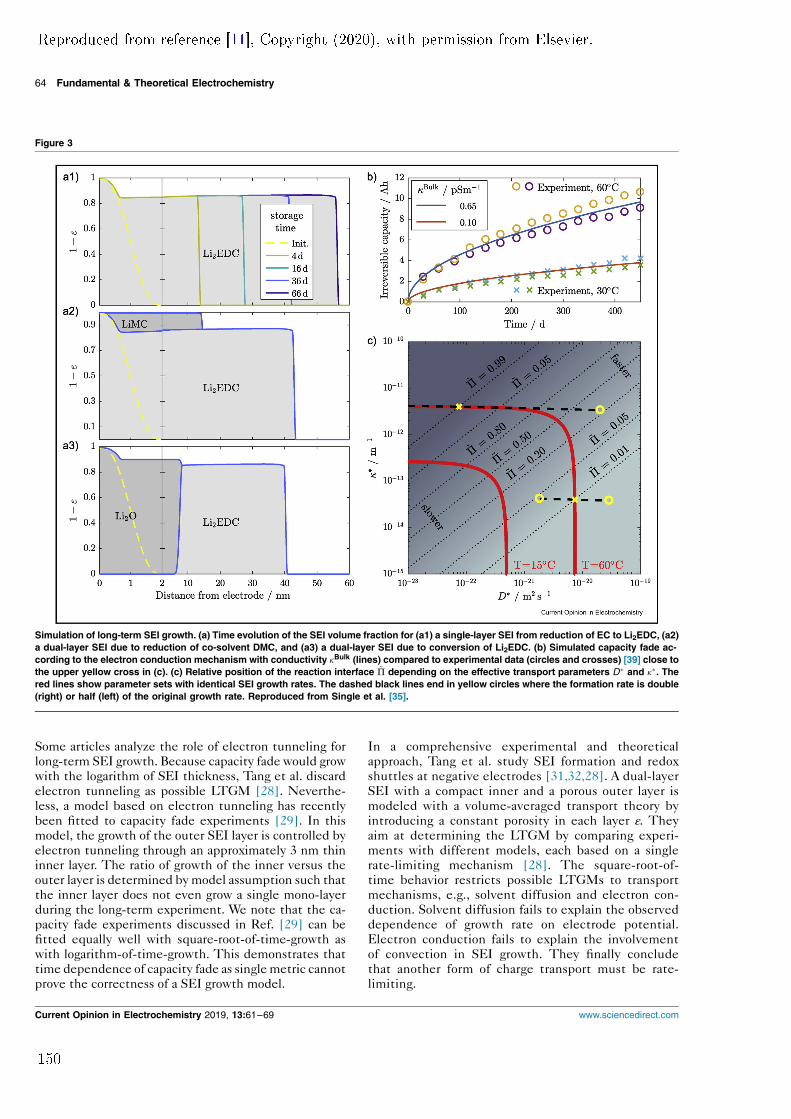
Some articles analyze the role of electron tunneling forlong-term SEI growth. Because capacity fade would growwith the logarithm of SEI thickness, Tang et al. discard
electron tunneling as possible LTGM [28]. Neverthe-less, a model based on electron tunneling has recentlybeen fitted to capacity fade experiments [29]. In thismodel, the growth of the outer SEI layer is controlled byelectron tunneling through an approximately 3 nm thininner layer. The ratio of growth of the inner versus theouter layer is determined bymodel assumption such thatthe inner layer does not even grow a single mono-layerduring the long-term experiment. We note that the ca-pacity fade experiments discussed in Ref. [29] can befitted equally well with square-root-of-time-growth as
with logarithm-of-time-growth. This demonstrates thattime dependence of capacity fade as singlemetric cannotprove the correctness of a SEI growth model.
In a comprehensive experimental and theoreticalapproach, Tang et al. study SEI formation and redoxshuttles at negative electrodes [31,32,28]. A dual-layer
SEI with a compact inner and a porous outer layer ismodeled with a volume-averaged transport theory byintroducing a constant porosity in each layer ε. Theyaim at determining the LTGM by comparing experi-ments with different models, each based on a singlerate-limiting mechanism [28]. The square-root-of-time behavior restricts possible LTGMs to transportmechanisms, e.g., solvent diffusion and electron con-duction. Solvent diffusion fails to explain the observeddependence of growth rate on electrode potential.Electron conduction fails to explain the involvement
of convection in SEI growth. They finally concludethat another form of charge transport must be rate-limiting.
Figure 3
Simulation of long-term SEI growth. (a) Time evolution of the SEI volume fraction for (a1) a single-layer SEI from reduction of EC to Li2EDC, (a2)a dual-layer SEI due to reduction of co-solvent DMC, and (a3) a dual-layer SEI due to conversion of Li2EDC. (b) Simulated capacity fade ac-cording to the electron conduction mechanism with conductivity kBulk (lines) compared to experimental data (circles and crosses) [39] close tothe upper yellow cross in (c). (c) Relative position of the reaction interface ~P depending on the effective transport parameters D and k. Thered lines show parameter sets with identical SEI growth rates. The dashed black lines end in yellow circles where the formation rate is double(right) or half (left) of the original growth rate. Reproduced from Single et al. [35].
64 Fundamental & Theoretical Electrochemistry
Current Opinion in Electrochemistry 2019, 13:61–69 www.sciencedirect.com
Reproduced from reference [11], Copyright (2020), with permission from Elsevier.
150
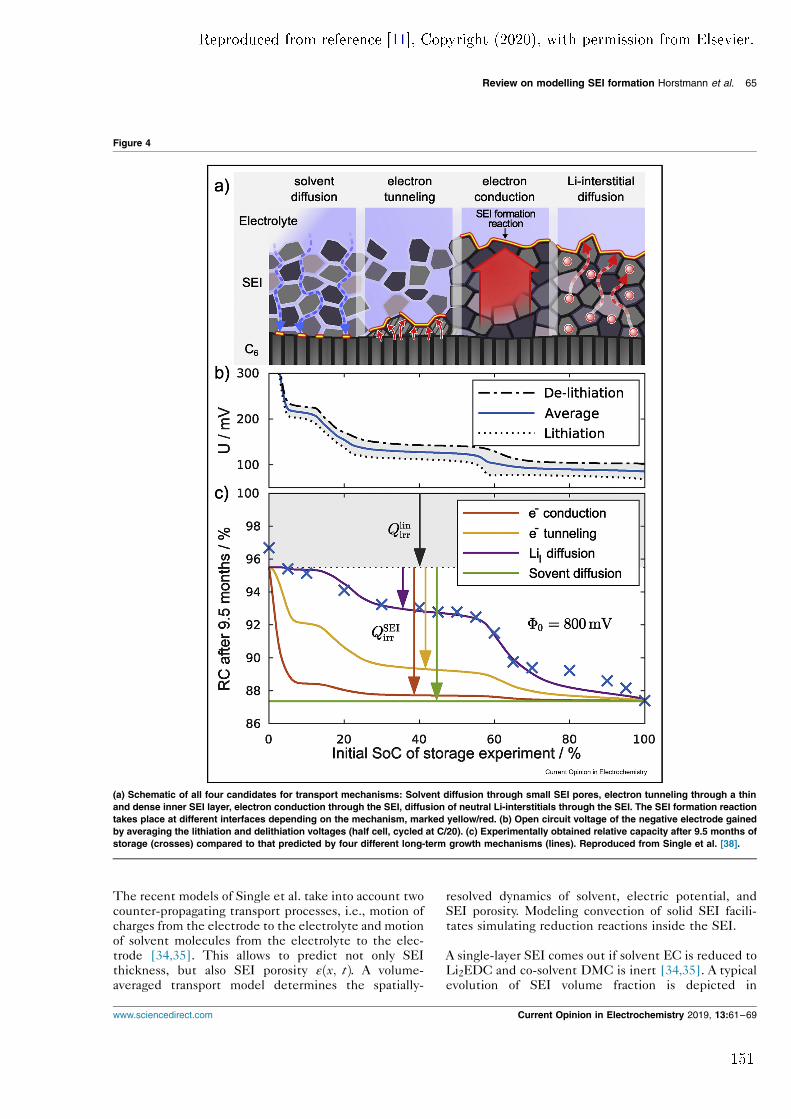
The recent models of Single et al. take into account twocounter-propagating transport processes, i.e., motion ofcharges from the electrode to the electrolyte and motionof solvent molecules from the electrolyte to the elec-trode [34,35]. This allows to predict not only SEIthickness, but also SEI porosity εðx; tÞ. A volume-averaged transport model determines the spatially-
resolved dynamics of solvent, electric potential, andSEI porosity. Modeling convection of solid SEI facili-tates simulating reduction reactions inside the SEI.
A single-layer SEI comes out if solvent EC is reduced toLi2EDC and co-solvent DMC is inert [34,35]. A typicalevolution of SEI volume fraction is depicted in
Figure 4
(a) Schematic of all four candidates for transport mechanisms: Solvent diffusion through small SEI pores, electron tunneling through a thinand dense inner SEI layer, electron conduction through the SEI, diffusion of neutral Li-interstitials through the SEI. The SEI formation reactiontakes place at different interfaces depending on the mechanism, marked yellow/red. (b) Open circuit voltage of the negative electrode gainedby averaging the lithiation and delithiation voltages (half cell, cycled at C/20). (c) Experimentally obtained relative capacity after 9.5 months ofstorage (crosses) compared to that predicted by four different long-term growth mechanisms (lines). Reproduced from Single et al. [38].
Review on modelling SEI formation Horstmann et al. 65
www.sciencedirect.com Current Opinion in Electrochemistry 2019, 13:61–69
Reproduced from reference [11], Copyright (2020), with permission from Elsevier.
151
Figure 3a1. It is found that SEI growth is limited byelectron transport and that SEI predominantly grows atthe SEI/electrolyte interface [34] ( ~Pz1 in Figure 3c).Therefore, SEI thickness grows like the square-root-of-time in agreement with capacity fade experiments (seeFigure 3b). The predicted SEI porosity is almost con-stant and approaches a stability point ε determined byelectrolyte transport properties. The transition from
electron conduction to solvent diffusion as LTGM isstudied by imposing large SEI porosities and taking intoaccount solid convection [35]. If solvent diffusion israte-limiting, the reaction zone moves to the electrode/SEI interface ( ~Pz0 in Figure 3c) and significant fluc-tuations in SEI thickness are predicted.
Additional SEI formation reactions lead to a dual-layerSEI [35]. If reduction of co-solvent DMC or primarySEI compound Li2EDC is considered, low potentialsfavor the second reduction near the electrode and a
compact, non-porous, inner layer is formed (seeFigure 3a2, a3). The ratio between the thickness ofinner and outer layer is determined by electrode po-tential and material parameters. Simulations illustratethat this stationary thickness ratio is quickly re-attainedafter the SEI is disturbed. Most importantly, SEIthickness and capacity fade grow with the square-root oftime for dual-layer morphologies, as well.
Multi-scale models of electron leakage vianeutral radicalsBased on atomistic theories, Shi et al. and Soto et al.propose diffusion of neutral radicals as an alternativemechanism for charge transport from the electrodethrough the SEI into the electrolyte [44,45]. In the caseof inorganic SEI, lithium ions take up an electron at theelectrode/SEI interface, diffuse as neutral lithium in-
terstitials through the SEI, and release an electron at theSEI/electrolyte interface [44]. In the porous organic SEI,radicals formed by electrolyte reduction can act as elec-tron carrier [45]. Single et al. take up this result anddevelop a continuummodel based on diffusion of neutralradicals [35]. SEI profiles simulatedwith thismechanismshare the same features as those described above forelectron conduction. Recent continuum models high-light the unique exponential dependence of SEI growthrate on electrode potential for this mechanism [38,43].
The first such model by Single et al. points out that theconcentration of radicals at the electrode is determinedby its electric potential [38]. They compare the pre-dictions of different LTGMs with capacity fade experi-ments for various graphite potentials and state-of-charges (SoC) [13]. Simple theories based on the fourLTGMs enlisted above are created: electrolyte diffu-sion, electron tunneling, electron conduction, andlithium interstitial diffusion. As summarized in Figure 4,solvent diffusion does not reproduce any SoC
dependence. The SoC dependence of electron con-duction and electron tunneling does not agree with theexperiment for any reasonable choice of parameters.Only a mechanism such as neutral lithium interstitialdiffusion results in a promising agreement with theexperiment and remains a candidate for the LTGM.
Recently, Das et al. extend this model and couple SEI
growth with lithium-ion transport through the SEI [43].Based on atomistic theories [44], they assume diffusionof lithium ions on interstitial sites and electron con-duction on this sparse network of lithium-ion in-terstitials. Note that an electron bound to a lithium-ioninterstitial constitutes the aforementioned neutrallithium interstitial. As a consequence, the concentrationof lithium ions determines electron conductivity. Thismodel can explain recent differential capacity mea-surements that SEI grows only during lithiation, but notduring delithiation [19].
ConclusionsIn this short review, we summarize recent theoreticalstudies of SEI structure and formation. A multi-scaleapproach is necessary to elucidate the broad range of
SEI properties from chemical composition to mechani-cal structure. Predictions of atomistic theories convergetowards a clear SEI chemistry for standard carbonate-based electrolytes, but the relevance of transportmechanisms remains debated.
Continuum models build on recent findings anddemonstrate macroscopically observable consequencesof microscopic material behavior. Understanding SEIformation is a key goal. We distinguish between forma-tion of initial SEI and long-term SEI growth. Recentsimulations explain the SEI dual-layer structure. Diffu-
sion of neutral radicals leads to the observed potentialdependence of long-term growth mechanisms. Couplingthis mechanism with lithium-ion diffusion predicts anobserved asymmetry in SEI growth during cycling.
Conflict of interest statementNothing declared.
AcknowledgementThis work is supported by the German Federal Ministry of Education andResearch (BMBF) in the project Li-EcoSafe (03X4636A). Further supportwas provided by the bwHPC initiative and the bwHPCC5 project throughassociated compute services of the JUSTUS HPC facility are the “Ministryof Science, Research and Art Baden-Wurttemberg, Germany” and the“German Research Foundation (DFG), Germany” at the University ofUlm. This work contributes to the research performed at CELEST(Center for Electrochemical Energy Storage Ulm-Karlsruhe).
ReferencesPapers of particular interest, published within the period of review,have been highlighted as:
* of special interest* * of outstanding interest
66 Fundamental & Theoretical Electrochemistry
Current Opinion in Electrochemistry 2019, 13:61–69 www.sciencedirect.com
Reproduced from reference [11], Copyright (2020), with permission from Elsevier.
152
1. Goodenough JB, Kim Y: Challenges for rechargeable Li bat-teries. Chem Mater 2010, 22:587, https://doi.org/10.1021/cm901452z.
2. Martha SK, Haik O, Zinigrad E, Exnar I, Drezen T, Miners JH,Aurbach D: On the thermal stability of olivine cathode mate-rials for lithium-ion batteries. J Electrochem Soc 2011, 158:A1115, https://doi.org/10.1149/1.3622849.
3. Ohzuku T, Brodd RJ: An overview of positive-electrode mate-rials for advanced lithium-ion batteries. J Power Sources 2007,174:449–456, https://doi.org/10.1016/j.jpowsour.2007.06.154.arXiv:arXiv:1011.1669v3.
4. Peled E: The electrochemical behavior of alkali and alkalineearth metals in nonaqueous battery systems–the solid elec-trolyte interphase model. J Electrochem Soc 1979, 126:2047–2051, https://doi.org/10.1149/1.2128859.
5. Aurbach D: Review of selected electrode-solution interactionswhich determine the performance of Li and Li ion batteries.J Power Sources 2000, 89:206–218, https://doi.org/10.1016/S0378-7753(00)00431-6.
6. Horstmann B, Single F, Hein S, Schmitt T, Latz A: Modelinggraphite surfaces: lithium plating & solid electrolyte inter-phase. In E2Flight symposium; 2016:7–8. http://elib.dlr.de/109271/1/Flugsymposium.pdf; 2016.
7. Kushima A, So KP, Su C, Bai P, Kuriyama N, Maebashi T,Fujiwara Y, Bazant MZ, Li J: Liquid cell transmission electronmicroscopy observation of lithium metal growth and disso-lution: root growth, dead lithium and lithium flotsams. NanoEnergy 2017, 32:271–279, https://doi.org/10.1016/j.nanoen.2016.12.001.
8. Maleki H, Deng G, Anani A, Howard J: Thermal stability studiesof Li-ion cells and components. J Electrochem Soc 1999, 146:3224, https://doi.org/10.1149/1.1392458.
9. Finegan DP, Scheel M, Robinson JB, Tjaden B, Hunt I, Mason TJ,Millichamp J, Di Michiel M, Offer GJ, Hinds G, Brett DJ,Shearing PR: In-operando high-speed tomography of lithium-ion batteries during thermal runaway. Nat Commun 2015, 6:1–10, https://doi.org/10.1038/ncomms7924.
10. Abada S, Marlair G, Lecocq A, Petit M, Sauvant-Moynot V,Huet F: Safety focused modeling of lithium-ion batteries: areview. J Power Sources 2016, 306:178–192, https://doi.org/10.1016/j.jpowsour.2015.11.100.
11. Tanaka N, Bessler WG: Numerical investigation of kineticmechanism for runaway thermo-electrochemistry in lithium-ion cells. Solid State Ionics 2014, 262:70–73, https://doi.org/10.1016/j.ssi.2013.10.0092013.
12. Keil P, Schuster SF, Wilhelm J, Travi J, Hauser A, Karl RC,Jossen A: Calendar aging of lithium-ion batteries.J Electrochem Soc 2016, 163:A1872–A1880, https://doi.org/10.1149/2.0411609jes.
13. Keil P, Jossen A: Calendar aging of NCA lithium-ion batteriesinvestigated by differential voltage analysis and coulombtracking. J Electrochem Soc 2017, 164:A6066–A6074, https://doi.org/10.1149/2.0091701jes.
14. Pinson MB, Bazant MZ: Theory of SEI formation in recharge-able batteries: capacity fade, accelerated aging and lifetimeprediction. J Electrochem Soc 2012, 160:A243–A250, https://doi.org/10.1149/2.044302jes.
15. Vatamanu J, Borodin O: Ramifications of water-in-salt interfa-cial structure at charged electrodes for electrolyte electro-chemical stability. J Phys Chem Lett 2017, 8:4362–4367,https://doi.org/10.1021/acs.jpclett.7b01879.
16. Hoffmann V, Pulletikurthi G, Carstens T, Lahiri A, Borodin A,Schammer M, Horstmann B, Latz A, Endres F: Influence of asilver salt on the nanostructure of an Au(111) ionic liquidinterface: an atomic force microscopy study and theoreticalconcepts. Phys Chem Chem Phys 2018, 20:4760–4771, https://doi.org/10.1039/C7CP08243F.
17. McEldrew M, Goodwin ZAH, Kornyshev AA, Bazant MZ: Theoryof the double layer in water-in-salt electrolytes. J Phys ChemLett 2018, 9:5840–5846, https://doi.org/10.1021/acs.jp-clett.8b02543. arXiv:1808.06118.
18. Gauthier M, Carney TJ, Grimaud A, Giordano L, Pour N,Chang HH, Fenning DP, Lux SF, Paschos O, Bauer C, Maglia F,Lupart S, Lamp P, Shao-Horn Y: Electrode-electrolyte interfacein Li-ion batteries: current understanding and new insights.J Phys Chem Lett 2015, 6:4653–4672, https://doi.org/10.1021/acs.jpclett.5b01727.
19. P. M. Attia, S. Das, K. Lim, M. Z. Bazant, W. C. Chueh, Electro-chemical kinetics of SEI growth in Li-ion batteries Part I: experi-mental quantification of voltage, current rate, and current directiondependence on carbon anodes, private communication.
20. Steinhauer M, Stich M, Kurniawan M, Seidlhofer B-K, Trapp M,Bund A, Wagner N, Friedrich KA: In situ studies of solid elec-trolyte interphase (SEI) formation on crystalline carbon sur-faces by neutron reflectometry and atomic force microscopy.ACS Appl Mater Interfaces 2017, 9:35794–35801, https://doi.org/10.1021/acsami.7b09181.
21. Kumar R, Lu P, Xiao X, Huang Z, Sheldon BW: Strain-inducedlithium losses in the solid electrolyte interphase on siliconelectrodes. ACS Appl Mater Interfaces 2017, 9:28406–28417,https://doi.org/10.1021/acsami.7b06647.
22. Michan AL, Leskes M, Grey CP: Voltage dependent solidelectrolyte interphase formation in silicon electrodes: moni-toring the formation of organic decomposition products.Chem Mater 2016, 28:385–398, https://doi.org/10.1021/acs.chemmater.5b04408.
23. Tang M, Miyazaki K, Abe T, Newman J: Effect of graphiteorientation and lithium salt on electronic passivation ofhighly oriented pyrolytic graphite. J Electrochem Soc 2012,159:A634–A641, https://doi.org/10.1149/2.073205jes.
24. Kranz T, Kranz S, Miß V, Schepp J, Roling B: Interrelation be-tween redox molecule transport and Li + ion transport acrossa model solid electrolyte interphase grown on a glassycarbon electrode. J Electrochem Soc 2017, 164:A3777–A3784,https://doi.org/10.1149/2.1171714jes.
25. Chapman N, Borodin O, Yoon T, Nguyen CC, Lucht BL: Spec-troscopic and density functional theory characterization ofcommon lithium salt solvates in carbonate electrolytes forlithium batteries. J Phys Chem C 2017, 121:2135–2148, https://doi.org/10.1021/acs.jpcc.6b12234.
26. Maibach J, Lindgren F, Eriksson H, Edström K, Hahlin M: Electricpotential gradient at the buried interface between lithium-ionbattery electrodes and the SEI observed using photoelectronspectroscopy. J Phys Chem Lett 2016, 7:1775–1780, https://doi.org/10.1021/acs.jpclett.6b00391.
27. Lu P, Li C, Schneider E, Harris S: Chemistry, impedance, andmorphology evolution in solid electrolyte interphase filmsduring formation in lithium ion batteries. J Phys Chem C 2014,118:896–903, https://doi.org/10.1021/jp4111019.
28* *. Tang M, Lu S, Newman J: Experimental and theoretical
investigation of solid-electrolyte-interphase formationmechanisms on glassy carbon. J Electrochem Soc 2012, 159:A1775–A1785, https://doi.org/10.1149/2.025211jes.
In a comprehensive theoretical and experimental approach, Tang et al.compare various transport mechanisms as possible long-term growthmechanism.
29. Li D, Danilov D, Zhang Z, Chen H, Yang Y, Notten PHL:Modelingthe SEI-formation on graphite electrodes in LiFePO4 batte-ries. J Electrochem Soc 2015, 162:A858–A869, https://doi.org/10.1149/2.0161506jes.
30. Ploehn HJ, Ramadass P, White RE: Solvent diffusion model foraging of lithium-ion battery cells. J Electrochem Soc 2004, 151:A456, https://doi.org/10.1149/1.1644601.
31. Tang M, Newman J: Electrochemical characterization of SEI-type passivating films using redox shuttles. J ElectrochemSoc 2011, 158:A530–A536, https://doi.org/10.1149/1.3567765.
32. Tang M, Newman J: Transient characterization of solid-electrolyte-interphase using ferrocene. J Electrochem Soc2012, 159:A281–A289, https://doi.org/10.1149/2.073203jes.
33. Röder F, Braatz RD, Krewer U: Multi-scale modeling of solidelectrolyte interface formation in lithium-ion batteries, 26theuropean symposium on computer aided. Process Eng 2016,
Review on modelling SEI formation Horstmann et al. 67
www.sciencedirect.com Current Opinion in Electrochemistry 2019, 13:61–69
Reproduced from reference [11], Copyright (2020), with permission from Elsevier.
153

38:157–162, https://doi.org/10.1016/B978-0-444-63428-3.50031-X.
34. Single F, Horstmann B, Latz A: Dynamics and morphology ofsolid electrolyte interphase (SEI). Phys Chem Chem Phys2016, 18:17810–17814, https://doi.org/10.1039/C6CP02816K.
35*. Single F, Horstmann B, Latz A: Revealing SEI morphology: in-
depth analysis of a modeling approach. J Electrochem Soc2017, 164:E3132–E3145, https://doi.org/10.1149/2.0121711jes.
This paper models not only SEI thickness, but also SEI porosity andSEI dual-layer structure. The transition from electron conduction tosolvent diffusion as long-term growth mechanism is studied.
36. Tahmasbi AA, Kadyk T, Eikerling MH: Statistical physics-basedmodel of solid electrolyte interphase growth in lithium ionbatteries. J Electrochem Soc 2017, 164:A1307–A1313, https://doi.org/10.1149/2.1581706jes.
37. Hao F, Liu Z, Balbuena PB, Mukherjee PP: Mesoscale eluci-dation of solid electrolyte interphase layer formation in Li-ionbattery anode. J Phys Chem C 2017, 121:26233–26240, https://doi.org/10.1021/acs.jpcc.7b09465.
38* *. Single F, Latz A, Horstmann B: Identifying the mechanism of
continued growth of the solid-electrolyte interphase. Chem-SusChem 2018, 11:1950–1955, https://doi.org/10.1002/cssc.201800077.
In this article, Single et al. compare the SoC dependence of variouslong-term growth mechanisms with storage experiments and presentthe first indirect experimental evidence for neutral interstitial diffusion.
39. Broussely M, Herreyre S, Biensan P, Kasztejna P, Nechev K,Staniewicz R: Aging mechanism in Li ion cells and calendarlife predictions. J Power Sources 2001, 97–98:13–21, https://doi.org/10.1016/S0378-7753(01)00722-4.
40. Christensen J, Newman J: A mathematical model for thelithium-ion negative electrode solid electrolyte interphase.J Electrochem Soc 2004, 151:A1977, https://doi.org/10.1149/1.1804812.
41. Colclasure AM, Smith KA, Kee RJ: Modeling detailed chemistryand transport for solid-electrolyte-interface (SEI) films in Li-ion batteries. Electrochim Acta 2011, 58:33–43, https://doi.org/10.1016/j.electacta.2011.08.067.
42. Röder F, Braatz RD, Krewer U: Multi-scale simulation of het-erogeneous surface film growth mechanisms in lithium-ionbatteries. J Electrochem Soc 2017, 164:E3335–E3344, https://doi.org/10.1149/2.0241711jes.
43*. S. Das, P. M. Attia, W. C. Chueh, M. Z. Bazant, Electrochemical
kinetics of SEI growth in Li-ion batteries Part II: modeling, privatecommunication.
By coupling neutral lithium interstitials with lithium-ion interstitials, theauthors explain recent experiments showing asymmetric SEI growthduring (de-)intercalation.
44* *. Shi S, Lu P, Liu Z, Qi Y, Hector LG, Li H, Harris SJ: Direct
calculation of Li-ion transport in the solid electrolyte inter-phase. J Am Chem Soc 2012, 134:15476–15487, https://doi.org/10.1021/ja305366r.
This article presents atomistic calculations of transport mechanisms ininorganic SEI material. For the first time, it proposes diffusion of neutrallithium interstitials as SEI growth mechanism.
45*. Soto FA, Ma Y, Martinez De La Hoz JM, Seminario JM,
Balbuena PB: formation and growth mechanisms of solid-electrolyte interphase layers in rechargeable batteries. ChemMater 2015, 27:7990–8000, https://doi.org/10.1021/acs.chemmater.5b03358.
This article proposes the formation of organic radicals which allowelectron leakage through the outer organic SEI layer.
46. Soto FA, Martinez de la Hoz JM, Seminario JM, Balbuena PB:Modeling solid-electrolyte interfacial phenomena in siliconanodes. Curr Opin Chem Eng 2016, 13:179–185, https://doi.org/10.1016/j.coche.2016.08.017.
47. Li Y, Leung K, Qi Y: Computational exploration of the Li-Electrode—electrolyte interface in the presence of a nano-meter thick solid-electrolyte interphase layer. Accounts ChemRes 2016, 49:2363–2370, https://doi.org/10.1021/acs.accounts.6b00363.
48. Borodin O, Ren X, Vatamanu J, Von Wald Cresce A, Knap J,Xu K: Modeling insight into battery electrolyte electro-chemical stability and interfacial structure. Accounts ChemRes 2017, 50:2886–2894, https://doi.org/10.1021/acs.accounts.7b00486.
49. Wang A, Kadam S, Li H, Shi S, Qi Y: Review on modeling of theanode solid electrolyte interphase (SEI) for lithium-ion bat-teries. npj Comput Mater 2018, 4:15, https://doi.org/10.1038/s41524-018-0064-0.
50*. Borodin O, Olguin M, Spear CE, Leiter KW, Knap J: Towards
high throughput screening of electrochemical stability ofbattery electrolytes. Nanotechnology 2015, 26:354003, https://doi.org/10.1088/0957-4484/26/35/354003.
Borodin et al. highlight general challenges for atomistic calculations ofelectrolyte stability.
51. Martinez De La Hoz JM, Soto FA, Balbuena PB: Effect of theelectrolyte composition on SEI reactions at Si anodes of LiIon batteries. J Phys Chem C 2015, 119:7060–7068, https://doi.org/10.1021/acs.jpcc.5b01228.
52. Leung K: Predicting the voltage dependence of interfacialelectrochemical processes at lithium-intercalated graphiteedge planes. Phys Chem Chem Phys 2015, 17:1637–1643,https://doi.org/10.1039/c4cp04494k.
53. Borodin O, Bedrov D: Interfacial structure and dynamics of thelithium alkyl dicarbonate SEI components in contact with thelithium battery electrolyte. J Phys Chem C 2014, 118:18362–18371, https://doi.org/10.1021/jp504598n.
54. Borodin O, Olguin M, Ganesh P, Kent P, Allen J: Competitivelithium solvation of linear and cyclic carbonates from quan-tum chemistry. Phys Chem Chem Phys 2016, 18:164–175,https://doi.org/10.1039/x0xx00000x.
55. Bertolini S, Balbuena PB: Buildup of the solid electrolyteinterphase on lithium-metal anodes: reactive molecular dy-namics study. J Phys Chem C 2018, 122:10783–10791, https://doi.org/10.1021/acs.jpcc.8b03046.
56. Takenaka N, Suzuki Y, Sakai H, Nagaoka M: On electrolyte-dependent formation of solid electrolyte interphase film inlithium-ion batteries: strong sensitivity to small structuraldifference of electrolyte molecules. J Phys Chem C 2014, 118:10874–10882, https://doi.org/10.1021/jp5018696.
57. Lin YX, Liu Z, Leung K, Chen LQ, Lu P, Qi Y: Connecting theirreversible capacity loss in Li-ion batteries with the elec-tronic insulating properties of solid electrolyte interphase(SEI) components. J Power Sources 2016, 309:221–230,https://doi.org/10.1016/j.jpowsour.2016.01.078.
58. Nie M, Abraham DP, Chen Y, Bose A, Lucht BL: Silicon solidelectrolyte interphase (SEI) of lithium ion battery character-ized by microscopy and spectroscopy. J Phys Chem C 2013,117:13403–13412, https://doi.org/10.1021/jp404155y.
59. Leung K, Soto F, Hankins K, Balbuena PB, Harrison KL: Stabilityof solid electrolyte interphase components on lithium metaland reactive anode material surfaces. J Phys Chem C 2016,120:6302–6313, https://doi.org/10.1021/acs.jpcc.5b11719.
60. Ushirogata K, Sodeyama K, Futera Z, Tateyama Y, Okuno Y:Near-shore aggregation mechanism of electrolyte decompo-sition products to explain solid electrolyte interphase for-mation. J Electrochem Soc 2015, 162:A2670–A2678, https://doi.org/10.1149/2.0301514jes.
61. Shi S, Qi Y, Li H, Hector LG: Defect thermodynamics anddiffusion mechanisms in Li2 CO3 and implications for thesolid electrolyte interphase in Li-ion batteries. J Phys Chem C2013, 117:8579–8593, https://doi.org/10.1021/jp310591u. http://pubs.acs.org/doi/10.1021/jp310591u.
62. Soto FA, Yan P, Engelhard MH, Marzouk A, Wang C, Xu G,Chen Z, Amine K, Liu J, Sprenkle VL, El-Mellouhi F, Balbuena PB,Li X: Tuning the solid electrolyte interphase for selective Li-and Na-ion storage in hard carbon. Adv Mater 2017, 29:1606860, https://doi.org/10.1002/adma.201606860.
63. Benitez L, Seminario JM: Ion diffusivity through the solidelectrolyte interphase in lithium-ion batteries. J Electrochem
68 Fundamental & Theoretical Electrochemistry
Current Opinion in Electrochemistry 2019, 13:61–69 www.sciencedirect.com
Reproduced from reference [11], Copyright (2020), with permission from Elsevier.
154
Soc 2017, 164:E3159–E3170, https://doi.org/10.1149/2.0181711jes.
64. Zhang Q, Pan J, Lu P, Liu Z, Verbrugge MW, Sheldon BW,Cheng YT, Qi Y, Xiao X: Synergetic effects of inorganic com-ponents in solid electrolyte interphase on high cycle effi-ciency of lithium ion batteries. Nano Lett 2016, 16:2011–2016,https://doi.org/10.1021/acs.nanolett.5b05283.
65. Bedrov D, Borodin O, Hooper JB: Li+ transport and mechanicalproperties of model solid electrolyte interphases (SEI):
insight from atomistic molecular dynamics simulations.J Phys Chem C 2017, 121:16098–16109, https://doi.org/10.1021/acs.jpcc.7b04247.
66. Tanaka M, Hooper JB, Bedrov D: Role of plasticity in me-chanical failure of solid electrolyte interphases on nano-structured silicon electrode: insight from continuum levelmodeling. ACS Appl Energy Mater 2018, 1:1858–1863, https://doi.org/10.1021/acsaem.8b00344.
Review on modelling SEI formation Horstmann et al. 69
www.sciencedirect.com Current Opinion in Electrochemistry 2019, 13:61–69
Reproduced from reference [11], Copyright (2020), with permission from Elsevier.
155

Theory of Impedance Spectroscopy for Lithium BatteriesFabian Single,†,‡ Birger Horstmann,*,†,‡,§ and Arnulf Latz*,†,‡,§
†German Aerospace Center (DLR), Institute of Engineering Thermodynamics, Pfaffenwaldring 38-40, 70569 Stuttgart, Germany‡Helmholtz Institute Ulm (HIU), Helmholtzstraße 11, 89081 Ulm, Germany§University of Ulm, Albert-Einstein-Allee 47, 89081 Ulm, Germany
*S Supporting Information
ABSTRACT: In this article, we derive and discuss a physics-based model for impedance spectroscopy of lithium batteries.Our model for electrochemical cells with planar electrodes takesinto account the solid−electrolyte interphase (SEI) as a poroussurface film. We present two improvements over standardimpedance models. First, our model is based on a consistentdescription of lithium transport through electrolyte and the SEI.We use well-defined transport parameters, e.g., transferencenumbers, and consider convection of the center-of-mass. Second,we solve our model equations analytically and state the fulltransport parameter dependence of the impedance signals. Ourconsistent model results in an analytic expression for the cellimpedance including bulk and surface processes. The impedancesignals due to concentration polarizations highlight the importance of electrolyte convection in concentrated electrolytes. Wesimplify our expression for the complex impedance and compare it to common equivalent circuit models. Such simplifiedmodels are good approximations in concise parameter ranges. Finally, we compare our model with experiments of lithium metalelectrodes and find large transference numbers for lithium ions. This analysis reveals that lithium-ion transport through the SEIhas solid-electrolyte character.
1. INTRODUCTION
Impedance spectroscopy is an essential tool for the character-ization of electrochemical devices. This method gives insightinto phenomena that are otherwise difficult to access. Itsnondestructive nature makes it especially suitable formonitoring delicate surface films such as the solid−electrolyteinterphase (SEI)1−4 in lithium-ion batteries.Interpretation of impedance measurements requires a
modeling approach. Today, equivalent circuit models remainthe most prominent model type for this purpose.5 However,such models often mask the way some parameters influencethe impedance. Physics-based models include these depend-encies at the cost of an increased modeling effort. Numerouscomprehensive models exist and describe a diverse amount ofelectrochemical processes and systems. These include cell-levelmodels of standard lithium-ion batteries,6,7 Li−sulfur bat-teries,8,9 metal−air batteries,10−12 and fuel cells.13 Othermodels focus on selected electrochemical processes of interest,such as membranes,14 interface reactions,15,16 electrochemicaldouble layers,17,18 and growth of surface layers.19,20 Suchmodels accurately capture reactions and transport in thecomplex geometry and morphology of the correspondingsystem. They are also used for impedance calculations bytaking into account interface capacities.21 Then, one cancalculate the cell impedance with a single voltage stepsimulation.22
Several models discuss the impedance of lithium-ionbatteries. Most of these models go to great lengths to describethe porous electrode and the frequency-dependent response ofsingle electrode particles. This is described within theframework of 1 + 1D Newman models.23−25 Advanced modelsconsider a particle size distribution26 and anisotropicparticles.27 More recent publications also discuss thedistribution of relaxation times28 and consider higherharmonics.29
Most of the impedance models cited above are eithersemianalytic or fully numeric. However, only exact analyticmodels allow the use of impedance spectroscopy to determineparameters and physical quantities, e.g., diffusion coefficient,Tafel slope, and double-layer capacitance. This is the addedvalue of exact analytic results as demonstrated by Kulikovsky etal. with multiple impedance models for fuel cells.30−32
In our impedance model we consider a simple cell geometrywith two planar electrodes. This results in exact analyticalexpressions which elucidate the full parameter dependence ofthe complex resistance. We give particular attention to theelectrolyte which is described with a thermodynamicallyconsistent theory. Our theory describes a concentrated and
Received: August 2, 2019Revised: October 13, 2019Published: October 14, 2019
Article
pubs.acs.org/JPCCCite This: J. Phys. Chem. C 2019, 123, 27327−27343
© 2019 American Chemical Society 27327 DOI: 10.1021/acs.jpcc.9b07389J. Phys. Chem. C 2019, 123, 27327−27343
Dow
nloa
ded
via
Bir
ger
Hor
stm
ann
on N
ovem
ber
17, 2
019
at 2
1:16
:42
(UT
C).
See
http
s://p
ubs.
acs.
org/
shar
ingg
uide
lines
for
opt
ions
on
how
to le
gitim
atel
y sh
are
publ
ishe
d ar
ticle
s.Reproduced with permission from reference [175], Copyright (2020) American Chemical Society.
157
nonideal binary electrolyte with convection. We use thePoisson equation which naturally describes charged surfacelayers. These layers cause the standard capacitive response inimpedance spectroscopy. The Poisson equation is rarely usedin literature14,33 as most studies simplify the equation systemand assume local electroneutrality. They then model interfacecapacitances phenomenologically.21 Our impedance modelalso takes into account the SEI as a surface film covering theelectrode. We assume electrolyte transport in the SEI poresand gain insights into the nature of lithium-ion transportthrough the SEI by comparing our model with a recentexperiment.34
We briefly summarize our theory-based model and outlineour calculation procedure for impedance in section 2. Thesecalculations are presented in section 3 and discussed in section4. In section 5, we validate our impedance model with acomparison to experimental data. Finally, in section 6 we giveour conclusion.
2. THEORYWe calculate the half-cell impedance of the symmetric celldepicted in Figure 1. It consists of two identical planar
electrodes which are separated by the SEI and a binaryelectrolyte. This setup represents a common electrochemicalcell, e.g., two lithium metal electrodes with LP30 electrolyte.We describe liquid phases such as the electrolyte and the porespace of the SEI with and without the assumption of localelectroneutrality. Additionally, we consider a simplified modelwithout SEI in each of these scenarios. Thus, we discuss a totalof four impedance models. In this way, we guide the readerthrough calculations and discussions as the model complexityincreases.We perform a virtual experiment to calculate the impedance
response of our model cells. To this aim, we apply anoscillating potential or current. Specifically, we choose aboundary condition for which the temporal progression of the“applied” quantity is proportional to eiωt. Here, i is theimaginary unit and ω = 2πf is a fixed frequency. We thencalculate the corresponding response for this frequency, i.e.,current or potential. All governing equations are linearized forthis calculation such that a real-valued solution can be obtainedeasily from the complex one. We find the general solution foreach primary variable listed in Figure 1. General solutions are alinear superposition of multiple partial solutions because of thelinear nature of the problem. The correct linear combination
follows from physical boundary conditions. Considering theseconstraints naturally results in a linear system of equations. Itssolution gives the half-cell impedance with the conventionaldefinition
ZU
I j j( )
212
s s
I S
ωϕ ϕ
= = ·−+
− +
(1)
where the sign in the definition of the voltage difference Uconsiders the difference between technical and physicalcurrent. jI is the current density corresponding to the rate ofthe interface reaction. jS describes charge that moves betweenthe electrodes to screen charged surface species; see section3.2.1. Equation 1 gives the impedance in Ω m2 because jI, jS,and I are current densities. Division of Z(ω) by A, the crosssection area of the cell, results in the actual cell resistance.
2.1. Transport Theory. We describe transport in theelectrolyte phase with a theory derived by Schammer et al.35
based on previous work (refs 36−39). The theory is discussedin sections SI-1 and SI-3. It describes the fluxes of a binaryelectrolyte consisting of cations, anions, and neutral solventmolecules (labeled with subscripts + , − , and N). Twoindependent flux expressions are sufficient to describe themotion of this mixture relative to the center-of-mass velocity v,e.g.,
N D ctz F E∑ κ
ϕ= − ∇ − ∇αβ
αβ αα
α=± (2)
where α = ±. This representation is well-suited to describe ageneral electrolyte. If we assume local electroneutrality,however, we choose the anion flux N− and the ionic current
as independent fluxes:
N D ctz Fsalt= − ∇ +− −−
− (3a)
tz F c
cd
dsalt
salt
κ μκ φ=
∇ − ∇ −
+−
(3b)
where F is the Faraday constant andn n
n n= ++ −
+ −. Note that Nα
and are flux and current densities. Fluxes in eqs 2 and 3 aredriven by gradients of concentration cα, electric potential ϕE,
and effective electrochemical potentialz FEφ ϕ = + μ+
+. Effective
quantities are marked with a tilde and appear frequently in thiswork. They originate from the description relative to thecenter-of-mass velocity. The effective chemical potential ofcation μ+ and salt μsalt are directly related to the conventionalquantities; see eqs SI-4 and SI-47. Transport in the electrolyteis parametrized by the salt diffusion coefficient Dsalt,conductivity κ, and the transference number t+ (t+ + t− = 1).The diffusion matrix D with entries Dαβ in eq 2 is determinedby these three parameters; see section SI-3B. Transportparameters are related to the more fundamental Onsagercoefficients by the chemical potentials μα. We use the standarddefinition of the chemical potentials:
RTf c
cln , salt
,0μ α= = ±α
α α
α
i
kjjjjj
y
zzzzz
(4)
where cα,0 are the reference concentrations. The activitycoefficients fα describe the nonideal behavior of species α and
Figure 1. Sketch of the symmetric cell used for the impedancecalculation listing relevant variables of each phase. The SEI thicknessL determines L′ = L − L. The orange boundary between the SEI andthe electrode marks the location of the interface reaction.
The Journal of Physical Chemistry C Article
DOI: 10.1021/acs.jpcc.9b07389J. Phys. Chem. C 2019, 123, 27327−27343
27328
Reproduced with permission from reference [175], Copyright (2020) American Chemical Society.
158
are related to the thermodynamic coefficient 1c
ln
ln= +α
μ∂∂
α
α;
see section SI-3A.The center-of-mass velocity v is used to express the
complete flux expressions
N N c v* = +α α α (5)
Below, the superscript * labels quantities and parameters thatare associated with the complete flux expressions. These fluxexpressions are used in mass balance equations
c Nt∂ = −∇· *α α (6)
which determine the temporal evolution of a concentrationwith the corresponding flux density. As outlined in section SI-1B, we consider incompressibility as an additional constraint toexpress v.38,40
2.2. Linearization of Model Equations. Impedancemeasurements are performed around an equilibrium state,the reference state. They capture the linear response of thissystem to an applied potential/current which is oscillating at agiven frequency. Because the reference shall not be perturbed,the applied voltage/current must be small. In our analyticalapproach, these oscillations are chosen to have an infinitesimalamplitude. As a result, any deviation from the reference state inour virtual measurement becomes infinitesimal. Therefore, allgoverning equations can be linearized around the referencestate. Considering eqs 2 and 3, the most simple such referencestate has a constant concentration and potential distribution
c x c n c( ) ,0 salt,0= =± ± ± (7a)
x( ) , etc.E E,0ϕ ϕ= (7b)
Henceforth, we mark all quantities referring to the referencestate with the subscript 0. We refer the interested reader tosection SI-2, where the linearization procedure is described indetail. Linearization of the flux expressions relative to thecenter-of-mass velocity results in
N D ctz F E∑ δ
κδϕ= − ∇ − ∇α
βαβ β
α
α=± (8a)
N D ctz Fsalt δ= − ∇ +− −−
− (8b)
tz F c
cd
dsalt
salt
κ μδ κ δφ=
∇ − ∇ −
+−
(8c)
Linearizing the full flux expressions given by eq 5 results in
N D ctz F
c vE off∑ δκ
δϕ* = − * ∇ −*
∇ +αβ
αβ βα
αα
=± (9a)
N D ctz F
c vsalt offδ* = − * ∇ +*
+− −−
−− (9b)
tz F c
cd
dsalt
salt
κ μδ κ δφ* =
∇ − ∇ =−
+−
(9c)
where voff is a constant offset velocity. Note that eq 9c isidentical to eq 8c because the charge density in our referencestate is zero. The linearized flux expressions have threesignificant properties. First, all original variables are replaced
with the corresponding deviation variables. They consider thedeviation from the reference state
c c c c ,0δ→ = −α α α α (10a)
, etc.E E E E,0ϕ δϕ ϕ ϕ→ = − (10b)
Second, all quantities beside these deviation variables areconstant after linearization. This not only applies to transportparameters but also to the concentrations cα and partial
derivatives such asc
d
dsalt
salt
μ . These quantities are consistently
evaluated at the reference state. We therefore omit thecorresponding notation in each linearized expression. Third, anew set of apparent transport parameters (Dsalt* , Dαβ* , and tα*)consistently replaces the original ones in the linearized full fluxexpressions. These quantities combine diffusion/migration andconvection in a single diffusion/migration term. This is a resultof linearizing the expression for the center-of-mass velocity.Equation SI-64 relates the apparent transport parameters to theparameters used in flux expression relative to the center-of-mass velocity.
2.3. Interface Reaction. We use a linearized Butler−Volmer rate expression to describe the interface reaction rate:
jIlinη
=(11)
Here, is the interface resistance parameter of our model. It isinversely proportional to the exchange current density. Notethat eq 11 does not depend on the charge transfer coefficientand the electrolyte/electrode concentration. These depend-encies are part of the nonlinearized rate expression.41−43 Theyvanish because the expression is linearized at the referencestate where η = 0. The linearized overpotential is equal to thefollowing:42
Uc
clin Sbulk
SSη δϕ δφ δ= − − ∂
∂ (12)
This expression takes into account the electrode potential δϕS,the electrochemical potential in the electrolyte δφbulk, and theconcentration of intercalated particles in the electrode δcS. Thelabel “bulk” indicates that the evaluation of δφ is nontrivial inthe case of spatially resolved double layers. For simplicity, we
restrict ourselves to metallic electrodes, i.e., 0UcS
=∂∂
, in the
main text. The impact of an intercalation electrode is discussedin section SI-6. In our definition, η is negative for intercalationor plating processes.
2.4. SEI Model. Experimental and theoretical studies reportthat SEI is at least partially porous.3,19,44−46 Our recentfindings suggest that solvent molecules are effectivelyimmobilized within these pores.47,48 However, this resultdoes not apply to smaller and more mobile lithium ions. Theyare also charged and subject to large electric forces. We followthis idea in this work and model the SEI with nanosized pores.These pores are filled with electrolyte and enable chargetransport through the surface film. Parameters, quantities, andvariables in the SEI pores are marked with a hat. We useporous electrode theory to describe transport in this porespace.6,49−51 This means that we employ the same fluxexpressions that are used for the electrolyte phase; see eq 8.However, the original bulk transport parameters are replacedwith effective ones
The Journal of Physical Chemistry C Article
DOI: 10.1021/acs.jpcc.9b07389J. Phys. Chem. C 2019, 123, 27327−27343
27329
Reproduced with permission from reference [175], Copyright (2020) American Chemical Society.
159
D Dsalt saltετ
=(13a)
κ ετ
κ =(13b)
Parameters ε and τ (porosity and tortuosity) capture themorphology of the SEI. They are constant in space and time.Additionally, we introduce t+, a dedicated cation transferencenumber for the SEI phase. This is motivated by findings ofPopovic et al.52 They show that the lithium transferencenumber of a liquid electrolyte can be increased and becomeclose to 1 if the anion species is immobilized in a mesoporousstructure.2.5. Boundary Conditions. The binary electrolyte is in
contact with the electrodes which take up lithium ions only.Therefore, the anion flux density N−* vanishes at the electrodeinterface. At the same time, N+* is equal to the interface
reaction ratej
z FI
+. For the electrodes at x = L, we obtain the
following boundary conditions for the fluxes relative to thecenter-of-mass velocity
N Lj
z F zz
( )
1 if
if
I
ρρ
α
ρρ
α= − ·
− = +
− = −α
+
+
+
−
+
l
m
ooooooo
n
ooooooo (14)
Here, ρ+ and ρ are the cation mass density and the massdensity of the electrolyte. Sections SI-1B and SI-3D contain adetailed derivation of the expression above.
3. THEORY OF IMPEDANCE SPECTROSCOPYThe most common simplification in the modeling ofelectrochemical systems is the assumption of local electro-neutrality. We use this assumption for impedance calculationsin section 3.1 (neutral models). These calculations are thenrepeated without the electroneutrality assumption in section3.2 (non-neutral models). We discuss all impedance results insection 4.3.1. Electroneutral Impedance. Local electroneutrality
means that the charge density ϱ is 0 and that the ionic currentis constant in space. This assumption also implies that
charge does not accumulate at interfaces; therefore, thedouble-layer screening charge QS and the correspondingcurrent jS vanish. In this case, we apply an oscillating cellcurrent I(t) = I0 eiωt. This is convenient because electro-neutrality implies I= such that eqs 8c and 9b can be usedto solve for δc− and δφ.We first calculate the impedance without considering SEI.
Thus, the electrolyte phase spans from −L to L and is in directcontact with the electrode. We add SEI in section 3.1.3.In the first step, we insert the linearized flux expression for
N−* into the mass balance equation of the anion concentrationeq 6. This results in a linear partial differential equation in δc−:
c D ct saltδ δΔ∂ = *− − (15)
as 0∇· = . We solve it with an exponential Ansatz in x and t,i.e., δ ∝ eikx eiωt. Only antisymmetric solutions in x contributeto the impedance calculation; see eq 1. The solution of eq 15then becomes
c C kxe sin( )i tδ = ω− (16)
where C is a coefficient and the wavenumber k is given by thedispersion relation:
k iD
(1 )2 salt
ω= − * (17)
The inverse of k describes the spatial width of saltconcentration oscillations at a given frequency ω. Wedetermine C with the flux boundary condition for the anionspecies; see eq 14,
CI
z F Dt
k kLe
e 1 1cos( )
i ti t
0
N salt
ρρ
ρρ
= * −ω
ω
−−
+ikjjjj
yzzzz
(18)
The extrapolated density ρN is given byMv
ρ =αα
α(Mα is the
molar weight and vα is the partial molar volume of species α).We find that C is proportional to the amplitude of the appliedcurrent I0.Next, we calculate the deviation of the electrochemical
potential δφ at x = L. This quantity is needed to express therate of the interface reaction with eq 12. We obtain it byintegrating eq 9c. However, first, we express the effectiveelectrochemical potential φ in this equation with φ, theconventional one. Equations SI-4b and SI-61 relate thesequantities:
MM z FN
Nφ φμ
= − +
+ (19)
We eliminate the chemical potential of the solvent μN with theGibbs−Duhem relation; see eq SI-46. The differential versionof eq 19 then becomes
x x z F ccx
d
dsalt
salt
δφ δφ ρρ
μ δ∂ ∂
= ∂∂
+ ∂
∂+
+ −
(20)
where electrolyte density ρ and cation density ρ+ are constantand evaluated at the reference state. We use eq 20 in eq 9c andrearrange for ∇φ. Integration from 0 to x results in
Ixz F
tc
c xd
d( )salt
saltδφ
κρρ
μδ= − + −
·
+−
+−
ikjjjj
yzzzz
(21)
The antisymmetry of concentration and electrochemicalpotential implies that both δc− and δφ vanish at x = 0.
3.1.1. Interface Reaction.We describe the interface reactionrate jI with the linearized Butler−Volmer expression given byeq 11. In the electroneutral model, we evaluate theelectrochemical potential at the interface δφbulk = δφ(L).The current between the electrodes I and the interface reactionrate jI are related by
I jI lin1η= − = − −
(22)
where the sign considers the orientation of the interface.Inserting the linearized overpotential ηlin from eq 12 gives thepotential of the electrode:
L I L( ) ( )S Sδϕ δϕ δφ= + = − ++(23)
3.1.2. Impedance. Considering the symmetry of thesolution implies U = ϕE
− − ϕE+ = −2δϕE
+. Equation 1 thenimplies Z = δϕS
+/I if jS = 0 is considered. Therefore, we obtainthe complex impedance by inserting eq 21 in eq 23,considering eqs 16 and 18, and dividing by I. We find that Zis the sum of three distinct contributions:
The Journal of Physical Chemistry C Article
DOI: 10.1021/acs.jpcc.9b07389J. Phys. Chem. C 2019, 123, 27327−27343
27330
Reproduced with permission from reference [175], Copyright (2020) American Chemical Society.
160
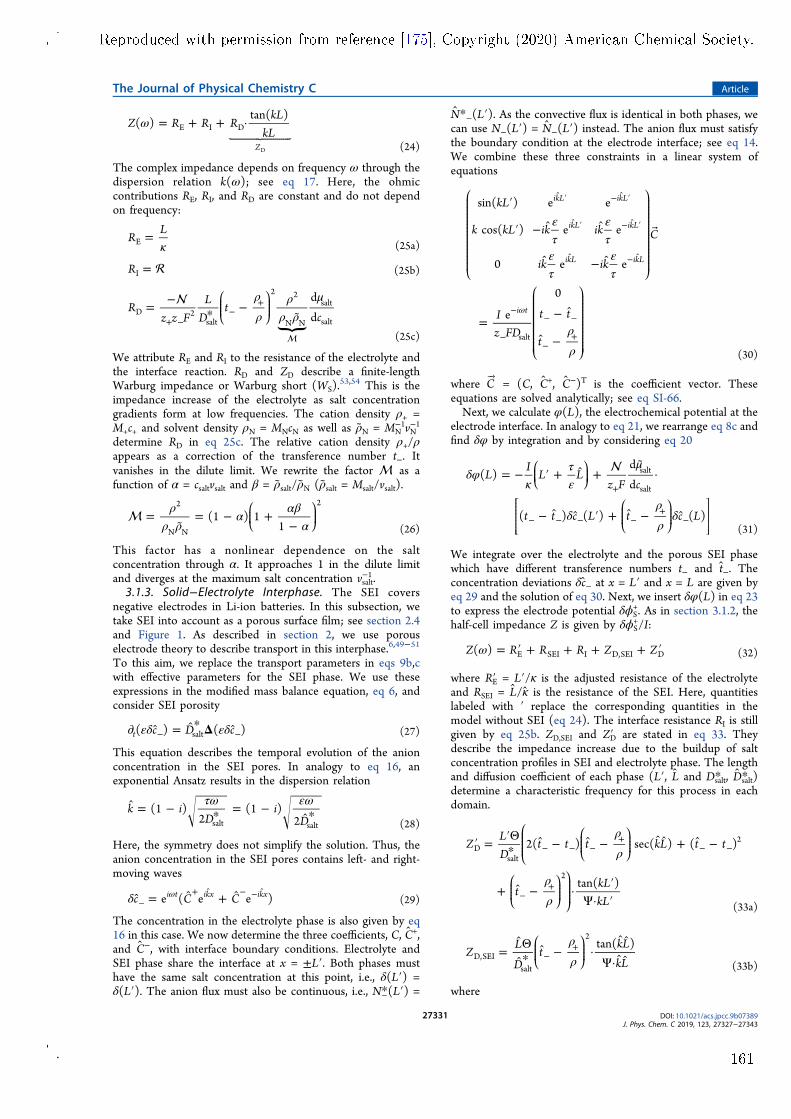
Z R R RkL
kL( )
tan( )
Z
E I D
D
ω = + + ·´ ≠ÖÖÖÖÖÖÖÖÖÖÖÖÖÖ ÆÖÖÖÖÖÖÖÖÖÖÖÖÖÖ
(24)
The complex impedance depends on frequency ω through thedispersion relation k(ω); see eq 17. Here, the ohmiccontributions RE, RI, and RD are constant and do not dependon frequency:
RL
E κ=
(25a)
RI = (25b)
Rz z F
LD
tc
d
dD 2salt
2 2
N N
salt
salt
ρρ
ρρ ρ
μ= −
* −+ −
−+
ßikjjjj
yzzzz
(25c)
We attribute RE and RI to the resistance of the electrolyte andthe interface reaction. RD and ZD describe a finite-lengthWarburg impedance or Warburg short (WS).
53,54 This is theimpedance increase of the electrolyte as salt concentrationgradients form at low frequencies. The cation density ρ+ =M+c+ and solvent density ρN = MNcN as well as ρN = MN
−1vN−1
determine RD in eq 25c. The relative cation density ρ+/ρappears as a correction of the transference number t−. Itvanishes in the dilute limit. We rewrite the factor as afunction of α = csaltvsalt and β = ρsalt/ρN (ρsalt = Msalt/vsalt).
(1 ) 11
2
N N
2ρρ ρ
α αβα
=
= − +−
ikjjj
yzzz
(26)
This factor has a nonlinear dependence on the saltconcentration through α. It approaches 1 in the dilute limitand diverges at the maximum salt concentration vsalt
−1.3.1.3. Solid−Electrolyte Interphase. The SEI covers
negative electrodes in Li-ion batteries. In this subsection, wetake SEI into account as a porous surface film; see section 2.4and Figure 1. As described in section 2, we use porouselectrode theory to describe transport in this interphase.6,49−51
To this aim, we replace the transport parameters in eqs 9b,cwith effective parameters for the SEI phase. We use theseexpressions in the modified mass balance equation, eq 6, andconsider SEI porosity
c D c( ) ( )t saltεδ εδΔ∂ = * − − (27)
This equation describes the temporal evolution of the anionconcentration in the SEI pores. In analogy to eq 16, anexponential Ansatz results in the dispersion relation
k iD
iD
(1 )2
(1 )2salt salt
τω εω = − * = −* (28)
Here, the symmetry does not simplify the solution. Thus, theanion concentration in the SEI pores contains left- and right-moving waves
c C Ce ( e e )i t ikx ikxδ = + ω−
+ − − (29)
The concentration in the electrolyte phase is also given by eq16 in this case. We now determine the three coefficients, C, C+,and C−, with interface boundary conditions. Electrolyte andSEI phase share the interface at x = ±L′. Both phases musthave the same salt concentration at this point, i.e., δ(L′) =δ(L′). The anion flux must also be continuous, i.e., N−*(L′) =
N*−(L′). As the convective flux is identical in both phases, wecan use N−(L′) = N−(L′) instead. The anion flux must satisfythe boundary condition at the electrode interface; see eq 14.We combine these three constraints in a linear system ofequations
kL
k kL ik ik
ik ik
C
Iz FD
t t
t
sin( ) e e
cos( ) e e
0 e e
e
0
ikL ikL
ikL ikL
ikL ikL
i t
salt
ετ
ετ
ετ
ετ
ρρ
′
′ −
−
=−
−
ω
′ − ′
′ − ′
−
−
−
− −
−+
i
k
jjjjjjjjjjjjjjjjjjjj
y
zzzzzzzzzzzzzzzzzzzzi
k
jjjjjjjjjjjjjjjj
y
zzzzzzzzzzzzzzzz (30)
where C÷◊÷
= (C, C+, C−)T is the coefficient vector. Theseequations are solved analytically; see eq SI-66.Next, we calculate φ(L), the electrochemical potential at the
electrode interface. In analogy to eq 21, we rearrange eq 8c andfind δφ by integration and by considering eq 20
LI
L Lz F c
t t c L t c L
( )d
d
( ) ( ) ( )
salt
saltδφ
κτε
μ
δρρ
δ
= − ′ + +
·
− ′ + −
+
− − − −+
−
ikjjj
yzzz
Ä
Ç
ÅÅÅÅÅÅÅÅÅÅikjjjj
yzzzz
É
Ö
ÑÑÑÑÑÑÑÑÑÑ (31)
We integrate over the electrolyte and the porous SEI phasewhich have different transference numbers t− and t−. Theconcentration deviations δc− at x = L′ and x = L are given byeq 29 and the solution of eq 30. Next, we insert δφ(L) in eq 23to express the electrode potential δϕS
+. As in section 3.1.2, thehalf-cell impedance Z is given by δϕS
+/I:
Z R R R Z Z( ) E SEI I D,SEI Dω = ′ + + + + ′ (32)
where RE′ = L′/κ is the adjusted resistance of the electrolyteand RSEI = L/κ is the resistance of the SEI. Here, quantitieslabeled with ′ replace the corresponding quantities in themodel without SEI (eq 24). The interface resistance RI is stillgiven by eq 25b. ZD,SEI and ZD′ are stated in eq 33. Theydescribe the impedance increase due to the buildup of saltconcentration profiles in SEI and electrolyte phase. The lengthand diffusion coefficient of each phase (L′, L and Dsalt* , Dsalt* )determine a characteristic frequency for this process in eachdomain.
ZLD
t t t kL t t
tkLkL
2( ) sec( ) ( )
tan( )
Dsalt
2
2
ρρ
ρρ
′ = ′Θ*
− − + −
+ − · ′Ψ· ′
− − −+
− −
−+
i
k
jjjjjjikjjjj
yzzzz
ikjjjj
yzzzz
y
zzzzzz(33a)
ZL
Dt
kLkL
tan( )D,SEI
salt
2ρρ
=Θ*
− ·
Ψ· −+i
kjjjj
yzzzz
(33b)
where
The Journal of Physical Chemistry C Article
DOI: 10.1021/acs.jpcc.9b07389J. Phys. Chem. C 2019, 123, 27327−27343
27331
Reproduced with permission from reference [175], Copyright (2020) American Chemical Society.
161
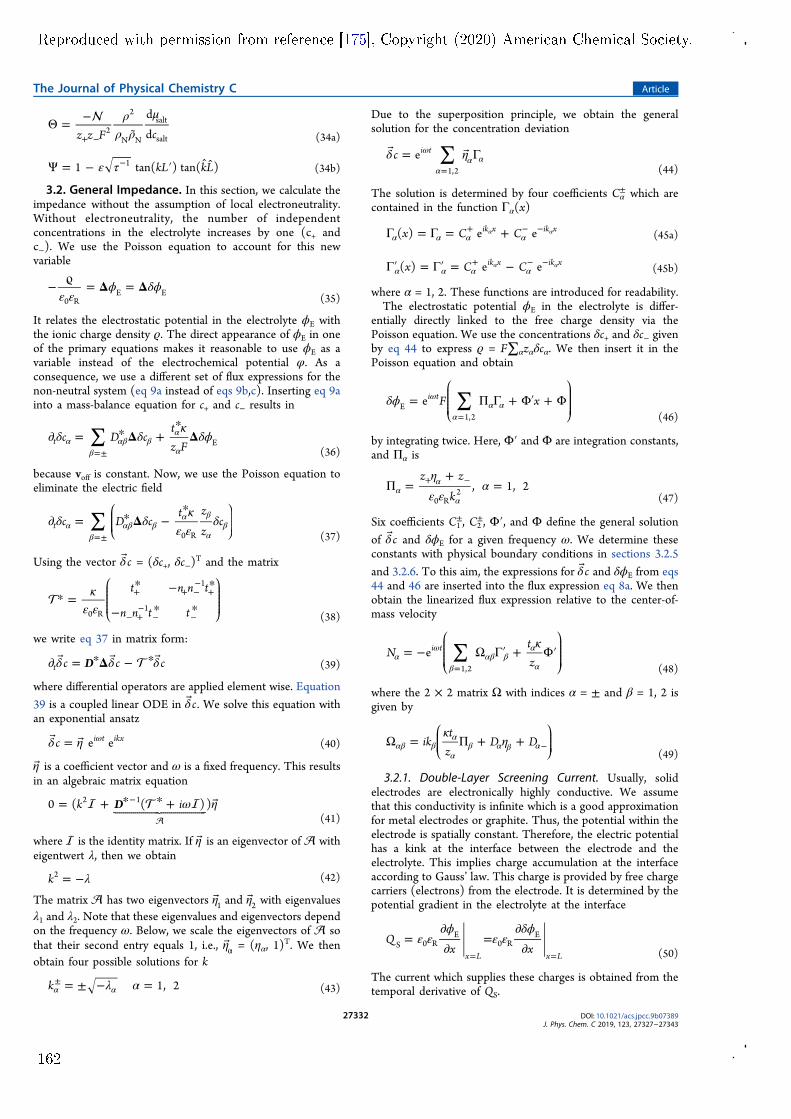
z z F c
d
d2
2
N N
salt
salt
ρρ ρ
μΘ = −
+ − (34a)
kL kL1 tan( ) tan( )1ε τΨ = − ′ − (34b)
3.2. General Impedance. In this section, we calculate theimpedance without the assumption of local electroneutrality.Without electroneutrality, the number of independentconcentrations in the electrolyte increases by one (c+ andc−). We use the Poisson equation to account for this newvariable
0 RE Eε ε
ϕ δϕΔ Δ− ϱ = =(35)
It relates the electrostatic potential in the electrolyte ϕE withthe ionic charge density ϱ. The direct appearance of ϕE in oneof the primary equations makes it reasonable to use ϕE as avariable instead of the electrochemical potential φ. As aconsequence, we use a different set of flux expressions for thenon-neutral system (eq 9a instead of eqs 9b,c). Inserting eq 9ainto a mass-balance equation for c+ and c− results in
c D ctz Ft E∑δ δ
κδϕΔ Δ∂ = * +
*α
βαβ β
α
α=± (36)
because voff is constant. Now, we use the Poisson equation toeliminate the electric field
c D ct z
zct
0 R∑δ δ
κε ε
δΔ∂ = * −*
αβ
αβ βα β
αβ
=±
ikjjjjj
yzzzzz
(37)
Using the vector cδ = (δc+, δc−)T and the matrix
t n n t
n n t t0 R
1
1
κε ε
* =* − *
− * *+ + −
−+
− +−
− −
i
k
jjjjjjjy
zzzzzzz(38)
we write eq 37 in matrix form:
Dc c ctδ δ δΔ∂ = * − * (39)
where differential operators are applied element wise. Equation39 is a coupled linear ODE in cδ . We solve this equation withan exponential ansatz
c e ei t ikxδ η = ω (40)
η is a coefficient vector and ω is a fixed frequency. This resultsin an algebraic matrix equation
Dk i0 ( ( ) )2 1 ω η= + * * + −´ ≠ÖÖÖÖÖÖÖÖÖÖÖÖÖÖÖÖÖÖÖÖÖÖ ÆÖÖÖÖÖÖÖÖÖÖÖÖÖÖÖÖÖÖÖÖÖÖ
(41)
where is the identity matrix. If η is an eigenvector of witheigentwert λ, then we obtain
k2 λ= − (42)
The matrix has two eigenvectors 1η and 2η with eigenvaluesλ1 and λ2. Note that these eigenvalues and eigenvectors dependon the frequency ω. Below, we scale the eigenvectors of sothat their second entry equals 1, i.e., ηα = (ηα, 1)
T. We thenobtain four possible solutions for k
k 1, 2λ α= ± − =α α±
(43)
Due to the superposition principle, we obtain the generalsolution for the concentration deviation
c ei t
1,2
∑δ η = Γω
αα α
= (44)
The solution is determined by four coefficients Cα± which are
contained in the function Γα(x)
x C C( ) e eik x ik xΓ = Γ = +α α α α+ − −α α (45a)
x C C( ) e eik x ik xΓ′ = Γ′ = −α α α α+ − −α α (45b)
where α = 1, 2. These functions are introduced for readability.The electrostatic potential ϕE in the electrolyte is differ-
entially directly linked to the free charge density via thePoisson equation. We use the concentrations δc+ and δc− givenby eq 44 to express ϱ = F∑αzαδcα. We then insert it in thePoisson equation and obtain
F xei tE
1,2
∑δϕ = Π Γ + Φ′ + Φω
αα α
=
i
k
jjjjjjjy
zzzzzzz (46)
by integrating twice. Here, Φ′ and Φ are integration constants,and Πα is
z z
k, 1, 2
0 R2
ηε ε
αΠ =+
=αα
α
+ −
(47)
Six coefficients C1±, C2
±, Φ′, and Φ define the general solutionof cδ and δϕE for a given frequency ω. We determine theseconstants with physical boundary conditions in sections 3.2.5and 3.2.6. To this aim, the expressions for cδ and δϕE from eqs44 and 46 are inserted into the flux expression eq 8a. We thenobtain the linearized flux expression relative to the center-of-mass velocity
Ntz
ei t
1,2
∑ κ= − Ω Γ′ + Φ′α
ω
βαβ β
α
α=
i
k
jjjjjjjy
zzzzzzz (48)
where the 2 × 2 matrix Ω with indices α = ± and β = 1, 2 isgiven by
ikt
zD D
κηΩ = Π + +αβ β
α
αβ α β α−
ikjjjjj
yzzzzz (49)
3.2.1. Double-Layer Screening Current. Usually, solidelectrodes are electronically highly conductive. We assumethat this conductivity is infinite which is a good approximationfor metal electrodes or graphite. Thus, the potential within theelectrode is spatially constant. Therefore, the electric potentialhas a kink at the interface between the electrode and theelectrolyte. This implies charge accumulation at the interfaceaccording to Gauss’ law. This charge is provided by free chargecarriers (electrons) from the electrode. It is determined by thepotential gradient in the electrolyte at the interface
Qx x
x L x LS 0 R
E0 R
Eε εϕ
ε εδϕ
=∂∂
=∂∂= = (50)
The current which supplies these charges is obtained from thetemporal derivative of QS.
The Journal of Physical Chemistry C Article
DOI: 10.1021/acs.jpcc.9b07389J. Phys. Chem. C 2019, 123, 27327−27343
27332
Reproduced with permission from reference [175], Copyright (2020) American Chemical Society.
162
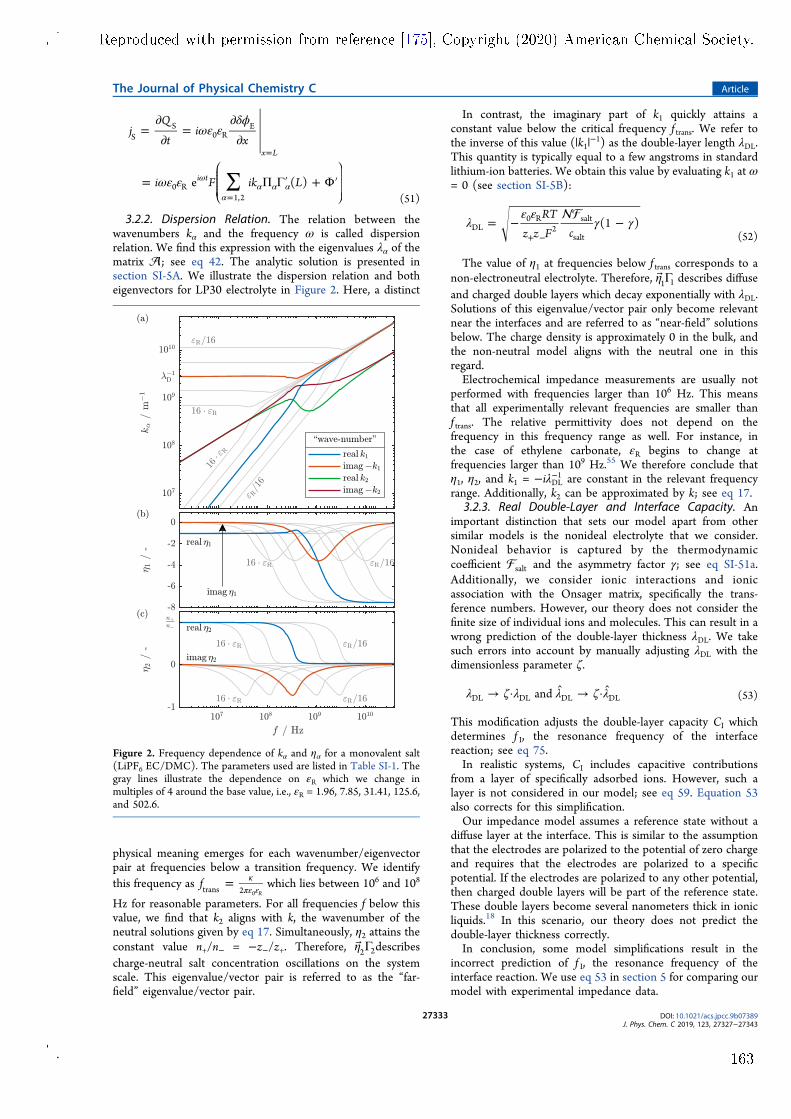
jQ
ti
x
i F ik Le ( )
x L
i t
SS
0 RE
0 R1,2
∑
ωε εδϕ
ωε ε
=∂∂
=∂∂
= Π Γ′ + Φ′ω
αα α α
=
=
i
k
jjjjjjjy
zzzzzzz (51)
3.2.2. Dispersion Relation. The relation between thewavenumbers kα and the frequency ω is called dispersionrelation. We find this expression with the eigenvalues λα of thematrix ; see eq 42. The analytic solution is presented insection SI-5A. We illustrate the dispersion relation and botheigenvectors for LP30 electrolyte in Figure 2. Here, a distinct
physical meaning emerges for each wavenumber/eigenvectorpair at frequencies below a transition frequency. We identifythis frequency as ftrans 2 R0
= κπε ε
which lies between 106 and 108
Hz for reasonable parameters. For all frequencies f below thisvalue, we find that k2 aligns with k, the wavenumber of theneutral solutions given by eq 17. Simultaneously, η2 attains theconstant value n+/n− = −z−/z+. Therefore, 2 2η Γ describescharge-neutral salt concentration oscillations on the systemscale. This eigenvalue/vector pair is referred to as the “far-field” eigenvalue/vector pair.
In contrast, the imaginary part of k1 quickly attains aconstant value below the critical frequency f trans. We refer tothe inverse of this value (|k1|
−1) as the double-layer length λDL.This quantity is typically equal to a few angstroms in standardlithium-ion batteries. We obtain this value by evaluating k1 at ω= 0 (see section SI-5B):
RTz z F c
(1 )DL0 R
2salt
saltλ
ε εγ γ= − −
+ − (52)
The value of η1 at frequencies below f trans corresponds to anon-electroneutral electrolyte. Therefore, 1 1η Γ describes diffuseand charged double layers which decay exponentially with λDL.Solutions of this eigenvalue/vector pair only become relevantnear the interfaces and are referred to as “near-field” solutionsbelow. The charge density is approximately 0 in the bulk, andthe non-neutral model aligns with the neutral one in thisregard.Electrochemical impedance measurements are usually not
performed with frequencies larger than 106 Hz. This meansthat all experimentally relevant frequencies are smaller thanf trans. The relative permittivity does not depend on thefrequency in this frequency range as well. For instance, inthe case of ethylene carbonate, εR begins to change atfrequencies larger than 109 Hz.55 We therefore conclude thatη1, η2, and k1 = −iλDL−1 are constant in the relevant frequencyrange. Additionally, k2 can be approximated by k; see eq 17.
3.2.3. Real Double-Layer and Interface Capacity. Animportant distinction that sets our model apart from othersimilar models is the nonideal electrolyte that we consider.Nonideal behavior is captured by the thermodynamiccoefficient salt and the asymmetry factor γ; see eq SI-51a.Additionally, we consider ionic interactions and ionicassociation with the Onsager matrix, specifically the trans-ference numbers. However, our theory does not consider thefinite size of individual ions and molecules. This can result in awrong prediction of the double-layer thickness λDL. We takesuch errors into account by manually adjusting λDL with thedimensionless parameter ζ.
andDL DL DL DLλ ζ λ λ ζ λ→ · → · (53)
This modification adjusts the double-layer capacity CI whichdetermines f I, the resonance frequency of the interfacereaction; see eq 75.In realistic systems, CI includes capacitive contributions
from a layer of specifically adsorbed ions. However, such alayer is not considered in our model; see eq 59. Equation 53also corrects for this simplification.Our impedance model assumes a reference state without a
diffuse layer at the interface. This is similar to the assumptionthat the electrodes are polarized to the potential of zero chargeand requires that the electrodes are polarized to a specificpotential. If the electrodes are polarized to any other potential,then charged double layers will be part of the reference state.These double layers become several nanometers thick in ionicliquids.18 In this scenario, our theory does not predict thedouble-layer thickness correctly.In conclusion, some model simplifications result in the
incorrect prediction of f I, the resonance frequency of theinterface reaction. We use eq 53 in section 5 for comparing ourmodel with experimental impedance data.
Figure 2. Frequency dependence of kα and ηα for a monovalent salt(LiPF6 EC/DMC). The parameters used are listed in Table SI-1. Thegray lines illustrate the dependence on εR which we change inmultiples of 4 around the base value, i.e., εR = 1.96, 7.85, 31.41, 125.6,and 502.6.
The Journal of Physical Chemistry C Article
DOI: 10.1021/acs.jpcc.9b07389J. Phys. Chem. C 2019, 123, 27327−27343
27333
Reproduced with permission from reference [175], Copyright (2020) American Chemical Society.
163
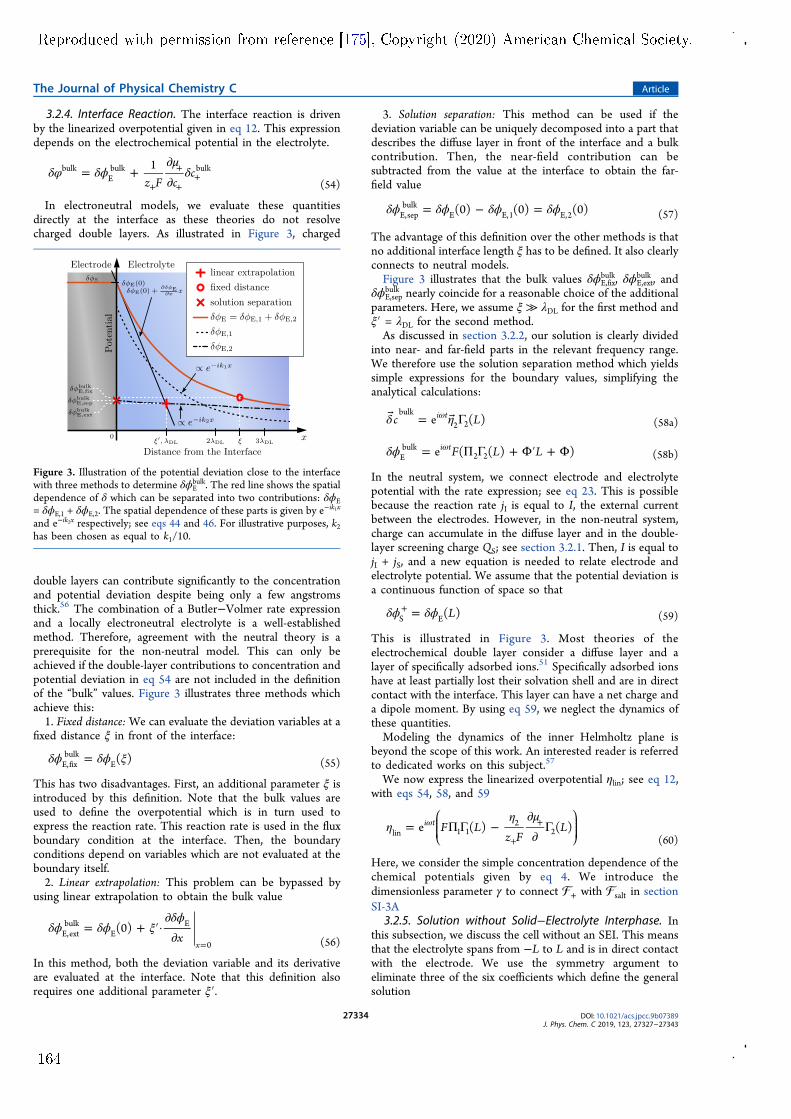
3.2.4. Interface Reaction. The interface reaction is drivenby the linearized overpotential given in eq 12. This expressiondepends on the electrochemical potential in the electrolyte.
z F cc
1bulkEbulk bulkδφ δϕ
μδ= +
∂∂+
+
++
(54)
In electroneutral models, we evaluate these quantitiesdirectly at the interface as these theories do not resolvecharged double layers. As illustrated in Figure 3, charged
double layers can contribute significantly to the concentrationand potential deviation despite being only a few angstromsthick.56 The combination of a Butler−Volmer rate expressionand a locally electroneutral electrolyte is a well-establishedmethod. Therefore, agreement with the neutral theory is aprerequisite for the non-neutral model. This can only beachieved if the double-layer contributions to concentration andpotential deviation in eq 54 are not included in the definitionof the “bulk” values. Figure 3 illustrates three methods whichachieve this:1. Fixed distance:We can evaluate the deviation variables at a
fixed distance ξ in front of the interface:
( )E,fixbulk
Eδϕ δϕ ξ= (55)
This has two disadvantages. First, an additional parameter ξ isintroduced by this definition. Note that the bulk values areused to define the overpotential which is in turn used toexpress the reaction rate. This reaction rate is used in the fluxboundary condition at the interface. Then, the boundaryconditions depend on variables which are not evaluated at theboundary itself.2. Linear extrapolation: This problem can be bypassed by
using linear extrapolation to obtain the bulk value
x(0)
xE,extbulk
EE
0
δϕ δϕ ξδϕ
= + ′·∂∂ = (56)
In this method, both the deviation variable and its derivativeare evaluated at the interface. Note that this definition alsorequires one additional parameter ξ′.
3. Solution separation: This method can be used if thedeviation variable can be uniquely decomposed into a part thatdescribes the diffuse layer in front of the interface and a bulkcontribution. Then, the near-field contribution can besubtracted from the value at the interface to obtain the far-field value
(0) (0) (0)E,sepbulk
E E,1 E,2δϕ δϕ δϕ δϕ= − = (57)
The advantage of this definition over the other methods is thatno additional interface length ξ has to be defined. It also clearlyconnects to neutral models.Figure 3 illustrates that the bulk values δϕE,fix
bulk, δϕE,extbulk , and
δϕE,sepbulk nearly coincide for a reasonable choice of the additional
parameters. Here, we assume ξ ≫ λDL for the first method andξ′ = λDL for the second method.As discussed in section 3.2.2, our solution is clearly divided
into near- and far-field parts in the relevant frequency range.We therefore use the solution separation method which yieldssimple expressions for the boundary values, simplifying theanalytical calculations:
c Le ( )i tbulk2 2δ η = Γω
(58a)
F L Le ( ( ) )i tEbulk
2 2δϕ = Π Γ + Φ′ + Φω(58b)
In the neutral system, we connect electrode and electrolytepotential with the rate expression; see eq 23. This is possiblebecause the reaction rate jI is equal to I, the external currentbetween the electrodes. However, in the non-neutral system,charge can accumulate in the diffuse layer and in the double-layer screening charge QS; see section 3.2.1. Then, I is equal tojI + jS, and a new equation is needed to relate electrode andelectrolyte potential. We assume that the potential deviation isa continuous function of space so that
L( )S Eδϕ δϕ=+(59)
This is illustrated in Figure 3. Most theories of theelectrochemical double layer consider a diffuse layer and alayer of specifically adsorbed ions.51 Specifically adsorbed ionshave at least partially lost their solvation shell and are in directcontact with the interface. This layer can have a net charge anda dipole moment. By using eq 59, we neglect the dynamics ofthese quantities.Modeling the dynamics of the inner Helmholtz plane is
beyond the scope of this work. An interested reader is referredto dedicated works on this subject.57
We now express the linearized overpotential ηlin; see eq 12,with eqs 54, 58, and 59
F Lz F
Le ( ) ( )i tlin 1 1
22η
η μ= Π Γ −
∂∂
Γω
+
+ikjjjjj
yzzzzz (60)
Here, we consider the simple concentration dependence of thechemical potentials given by eq 4. We introduce thedimensionless parameter γ to connect + with salt in sectionSI-3A
3.2.5. Solution without Solid−Electrolyte Interphase. Inthis subsection, we discuss the cell without an SEI. This meansthat the electrolyte spans from −L to L and is in direct contactwith the electrode. We use the symmetry argument toeliminate three of the six coefficients which define the generalsolution
Figure 3. Illustration of the potential deviation close to the interfacewith three methods to determine δϕE
bulk. The red line shows the spatialdependence of δ which can be separated into two contributions: δϕE= δϕE,1 + δϕE,2. The spatial dependence of these parts is given by e
−ik1x
and e−ik2x respectively; see eqs 44 and 46. For illustrative purposes, k2has been chosen as equal to k1/10.
The Journal of Physical Chemistry C Article
DOI: 10.1021/acs.jpcc.9b07389J. Phys. Chem. C 2019, 123, 27327−27343
27334
Reproduced with permission from reference [175], Copyright (2020) American Chemical Society.
164
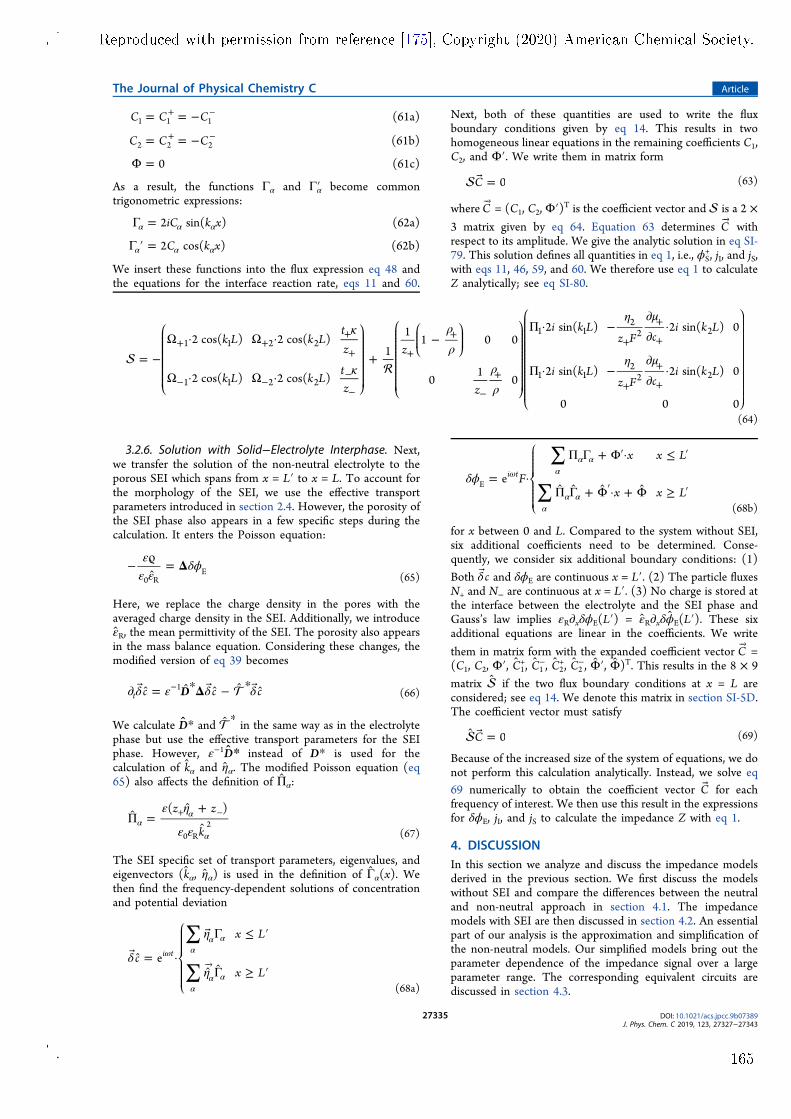
C C C
C C C
(61a)
(61b)
0 (61c)
1 1 1
2 2 2
= = −
= = −
Φ =
+ −
+ −
As a result, the functions Γα and Γα′ become commontrigonometric expressions:
iC k x
C k x
2 sin( ) (62a)
2 cos( ) (62b)
Γ =
Γ ′ =α α α
α α α
We insert these functions into the flux expression eq 48 andthe equations for the interface reaction rate, eqs 11 and 60.
Next, both of these quantities are used to write the fluxboundary conditions given by eq 14. This results in twohomogeneous linear equations in the remaining coefficients C1,C2, and Φ′. We write them in matrix form
C 0 = (63)
whereC÷◊÷= (C1, C2, Φ′)T is the coefficient vector and is a 2 ×
3 matrix given by eq 64. Equation 63 determines C÷◊÷
withrespect to its amplitude. We give the analytic solution in eq SI-79. This solution defines all quantities in eq 1, i.e., ϕS
+, jI, and jS,with eqs 11, 46, 59, and 60. We therefore use eq 1 to calculateZ analytically; see eq SI-80.
k L k Ltz
k L k Ltz
z
z
i k Lz F c
i k L
i k Lz F c
i k L
2 cos( ) 2 cos( )
2 cos( ) 2 cos( )
11
1 0 0
01
0
2 sin( ) 2 sin( ) 0
2 sin( ) 2 sin( ) 0
0 0 0
1 1 2 2
1 1 2 2
1 12
2 2
1 12
2 2
κ
κ
ρρ
ρρ
η μ
η μ= −Ω · Ω ·
Ω · Ω ·+
−Π · −
∂∂
·
Π · −∂∂
·
+ ++
+
− −−
−
+
+
−
+
+
+
+
+
+
+
i
k
jjjjjjjjjjjjjjj
y
zzzzzzzzzzzzzzz
i
k
jjjjjjjjjjjjjjjjj
ikjjjj
yzzzz
y
zzzzzzzzzzzzzzzzz
i
k
jjjjjjjjjjjjjjjjjjjjjjj
y
zzzzzzzzzzzzzzzzzzzzzzz(64)
3.2.6. Solution with Solid−Electrolyte Interphase. Next,we transfer the solution of the non-neutral electrolyte to theporous SEI which spans from x = L′ to x = L. To account forthe morphology of the SEI, we use the effective transportparameters introduced in section 2.4. However, the porosity ofthe SEI phase also appears in a few specific steps during thecalculation. It enters the Poisson equation:
0 RE
εε ε
δϕΔ− ϱ
=(65)
Here, we replace the charge density in the pores with theaveraged charge density in the SEI. Additionally, we introduceεR, the mean permittivity of the SEI. The porosity also appearsin the mass balance equation. Considering these changes, themodified version of eq 39 becomes
Dc c ct1δ ε δ δΔ∂ = * − * −
(66)
We calculate D* and * in the same way as in the electrolytephase but use the effective transport parameters for the SEIphase. However, ε−1D* instead of D* is used for thecalculation of kα and ηα. The modified Poisson equation (eq65) also affects the definition of Πα:
z z
k
( )
0 R2
ε η
ε εΠ =
+α
α
α
+ −
(67)
The SEI specific set of transport parameters, eigenvalues, andeigenvectors (kα, ηα) is used in the definition of Γα(x). Wethen find the frequency-dependent solutions of concentrationand potential deviation
c
x L
x Lei t
∑
∑δ
η
η = ·
Γ ≤ ′
Γ ≥ ′ω α
α α
αα α
l
m
ooooooo
n
ooooooo÷◊÷
(68a)
F
x x L
x x Lei t
E
∑
∑δϕ = ·
Π Γ + Φ′· ≤ ′
Π Γ + Φ′· + Φ ≥ ′ω α
α α
αα α
l
mooooooo
nooooooo (68b)
for x between 0 and L. Compared to the system without SEI,six additional coefficients need to be determined. Conse-quently, we consider six additional boundary conditions: (1)Both cδ and δϕE are continuous x = L′. (2) The particle fluxesN+ and N− are continuous at x = L′. (3) No charge is stored atthe interface between the electrolyte and the SEI phase andGauss’s law implies εR∂xδϕE(L′) = εR∂xδϕE(L′). These sixadditional equations are linear in the coefficients. We write
them in matrix form with the expanded coefficient vector C÷◊÷=
(C1, C2, Φ′, C1+, C1
−, C2+, C2
−, Φ′, Φ)T. This results in the 8 × 9matrix if the two flux boundary conditions at x = L areconsidered; see eq 14. We denote this matrix in section SI-5D.The coefficient vector must satisfy
C 0 = (69)
Because of the increased size of the system of equations, we donot perform this calculation analytically. Instead, we solve eq69 numerically to obtain the coefficient vector C for eachfrequency of interest. We then use this result in the expressionsfor δϕE, jI, and jS to calculate the impedance Z with eq 1.
4. DISCUSSIONIn this section we analyze and discuss the impedance modelsderived in the previous section. We first discuss the modelswithout SEI and compare the differences between the neutraland non-neutral approach in section 4.1. The impedancemodels with SEI are then discussed in section 4.2. An essentialpart of our analysis is the approximation and simplification ofthe non-neutral models. Our simplified models bring out theparameter dependence of the impedance signal over a largeparameter range. The corresponding equivalent circuits arediscussed in section 4.3.
The Journal of Physical Chemistry C Article
DOI: 10.1021/acs.jpcc.9b07389J. Phys. Chem. C 2019, 123, 27327−27343
27335
Reproduced with permission from reference [175], Copyright (2020) American Chemical Society.
165
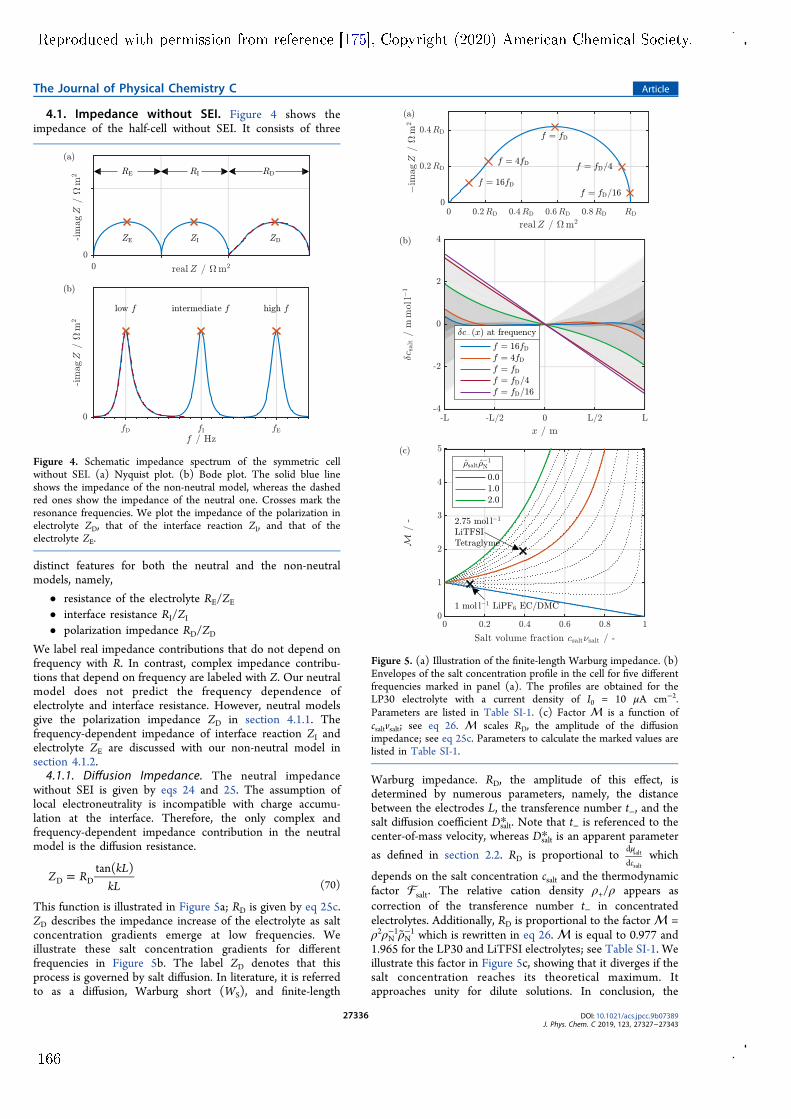
4.1. Impedance without SEI. Figure 4 shows theimpedance of the half-cell without SEI. It consists of three
distinct features for both the neutral and the non-neutralmodels, namely,
• resistance of the electrolyte RE/ZE
• interface resistance RI/ZI
• polarization impedance RD/ZD
We label real impedance contributions that do not depend onfrequency with R. In contrast, complex impedance contribu-tions that depend on frequency are labeled with Z. Our neutralmodel does not predict the frequency dependence ofelectrolyte and interface resistance. However, neutral modelsgive the polarization impedance ZD in section 4.1.1. Thefrequency-dependent impedance of interface reaction ZI andelectrolyte ZE are discussed with our non-neutral model insection 4.1.2.4.1.1. Diffusion Impedance. The neutral impedance
without SEI is given by eqs 24 and 25. The assumption oflocal electroneutrality is incompatible with charge accumu-lation at the interface. Therefore, the only complex andfrequency-dependent impedance contribution in the neutralmodel is the diffusion resistance.
Z RkL
kLtan( )
D D=(70)
This function is illustrated in Figure 5a; RD is given by eq 25c.ZD describes the impedance increase of the electrolyte as saltconcentration gradients emerge at low frequencies. Weillustrate these salt concentration gradients for differentfrequencies in Figure 5b. The label ZD denotes that thisprocess is governed by salt diffusion. In literature, it is referredto as a diffusion, Warburg short (WS), and finite-length
Warburg impedance. RD, the amplitude of this effect, isdetermined by numerous parameters, namely, the distancebetween the electrodes L, the transference number t−, and thesalt diffusion coefficient Dsalt* . Note that t− is referenced to thecenter-of-mass velocity, whereas Dsalt* is an apparent parameter
as defined in section 2.2. RD is proportional toc
d
dsalt
salt
μwhich
depends on the salt concentration csalt and the thermodynamicfactor salt. The relative cation density ρ+/ρ appears ascorrection of the transference number t− in concentratedelectrolytes. Additionally, RD is proportional to the factor =ρ2ρN
−1ρN−1 which is rewritten in eq 26. is equal to 0.977 and
1.965 for the LP30 and LiTFSI electrolytes; see Table SI-1. Weillustrate this factor in Figure 5c, showing that it diverges if thesalt concentration reaches its theoretical maximum. Itapproaches unity for dilute solutions. In conclusion, the
Figure 4. Schematic impedance spectrum of the symmetric cellwithout SEI. (a) Nyquist plot. (b) Bode plot. The solid blue lineshows the impedance of the non-neutral model, whereas the dashedred ones show the impedance of the neutral one. Crosses mark theresonance frequencies. We plot the impedance of the polarization inelectrolyte ZD, that of the interface reaction ZI, and that of theelectrolyte ZE.
Figure 5. (a) Illustration of the finite-length Warburg impedance. (b)Envelopes of the salt concentration profile in the cell for five differentfrequencies marked in panel (a). The profiles are obtained for theLP30 electrolyte with a current density of I0 = 10 μA cm−2.Parameters are listed in Table SI-1. (c) Factor is a function ofcsaltvsalt; see eq 26. scales RD, the amplitude of the diffusionimpedance; see eq 25c. Parameters to calculate the marked values arelisted in Table SI-1.
The Journal of Physical Chemistry C Article
DOI: 10.1021/acs.jpcc.9b07389J. Phys. Chem. C 2019, 123, 27327−27343
27336
Reproduced with permission from reference [175], Copyright (2020) American Chemical Society.
166
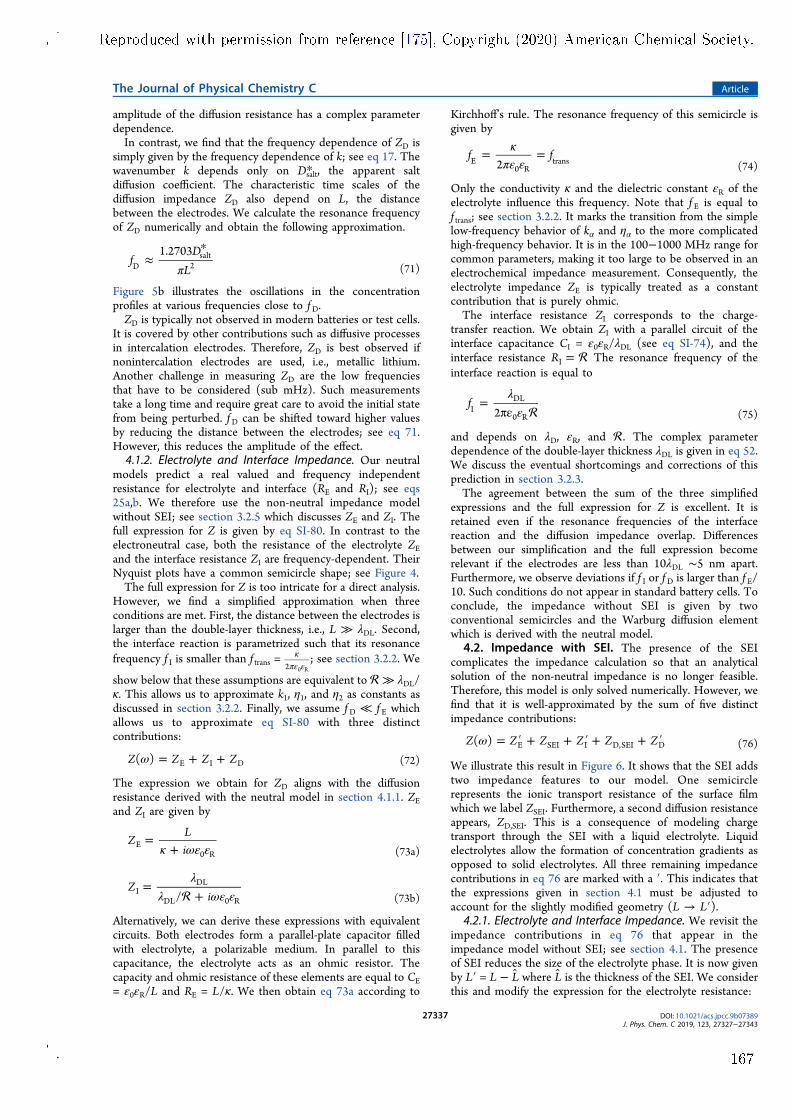
amplitude of the diffusion resistance has a complex parameterdependence.In contrast, we find that the frequency dependence of ZD is
simply given by the frequency dependence of k; see eq 17. Thewavenumber k depends only on Dsalt* , the apparent saltdiffusion coefficient. The characteristic time scales of thediffusion impedance ZD also depend on L, the distancebetween the electrodes. We calculate the resonance frequencyof ZD numerically and obtain the following approximation.
fD
L1.2703
Dsalt
2π≈
*(71)
Figure 5b illustrates the oscillations in the concentrationprofiles at various frequencies close to f D.ZD is typically not observed in modern batteries or test cells.
It is covered by other contributions such as diffusive processesin intercalation electrodes. Therefore, ZD is best observed ifnonintercalation electrodes are used, i.e., metallic lithium.Another challenge in measuring ZD are the low frequenciesthat have to be considered (sub mHz). Such measurementstake a long time and require great care to avoid the initial statefrom being perturbed. f D can be shifted toward higher valuesby reducing the distance between the electrodes; see eq 71.However, this reduces the amplitude of the effect.4.1.2. Electrolyte and Interface Impedance. Our neutral
models predict a real valued and frequency independentresistance for electrolyte and interface (RE and RI); see eqs25a,b. We therefore use the non-neutral impedance modelwithout SEI; see section 3.2.5 which discusses ZE and ZI. Thefull expression for Z is given by eq SI-80. In contrast to theelectroneutral case, both the resistance of the electrolyte ZEand the interface resistance ZI are frequency-dependent. TheirNyquist plots have a common semicircle shape; see Figure 4.The full expression for Z is too intricate for a direct analysis.
However, we find a simplified approximation when threeconditions are met. First, the distance between the electrodes islarger than the double-layer thickness, i.e., L ≫ λDL. Second,the interface reaction is parametrized such that its resonancefrequency f I is smaller than f trans = 2 0 R
κπε ε
; see section 3.2.2. We
show below that these assumptions are equivalent to ≫ λDL/κ. This allows us to approximate k1, η1, and η2 as constants asdiscussed in section 3.2.2. Finally, we assume f D ≪ f E whichallows us to approximate eq SI-80 with three distinctcontributions:
Z Z Z Z( ) E I Dω = + + (72)
The expression we obtain for ZD aligns with the diffusionresistance derived with the neutral model in section 4.1.1. ZEand ZI are given by
ZLiE
0 Rκ ωε ε=
+ (73a)
Zi/I
DL
DL 0 R
λλ ωε ε
=+ (73b)
Alternatively, we can derive these expressions with equivalentcircuits. Both electrodes form a parallel-plate capacitor filledwith electrolyte, a polarizable medium. In parallel to thiscapacitance, the electrolyte acts as an ohmic resistor. Thecapacity and ohmic resistance of these elements are equal to CE= ε0εR/L and RE = L/κ. We then obtain eq 73a according to
Kirchhoff’s rule. The resonance frequency of this semicircle isgiven by
f f2E
0 Rtrans
κπε ε
= =(74)
Only the conductivity κ and the dielectric constant εR of theelectrolyte influence this frequency. Note that f E is equal tof trans; see section 3.2.2. It marks the transition from the simplelow-frequency behavior of kα and ηα to the more complicatedhigh-frequency behavior. It is in the 100−1000 MHz range forcommon parameters, making it too large to be observed in anelectrochemical impedance measurement. Consequently, theelectrolyte impedance ZE is typically treated as a constantcontribution that is purely ohmic.The interface resistance ZI corresponds to the charge-
transfer reaction. We obtain ZI with a parallel circuit of theinterface capacitance CI = ε0εR/λDL (see eq SI-74), and theinterface resistance RI = The resonance frequency of theinterface reaction is equal to
f2I
DL
0 R
λε
=πε (75)
and depends on λD, εR, and . The complex parameterdependence of the double-layer thickness λDL is given in eq 52.We discuss the eventual shortcomings and corrections of thisprediction in section 3.2.3.The agreement between the sum of the three simplified
expressions and the full expression for Z is excellent. It isretained even if the resonance frequencies of the interfacereaction and the diffusion impedance overlap. Differencesbetween our simplification and the full expression becomerelevant if the electrodes are less than 10λDL ∼5 nm apart.Furthermore, we observe deviations if f I or f D is larger than f E/10. Such conditions do not appear in standard battery cells. Toconclude, the impedance without SEI is given by twoconventional semicircles and the Warburg diffusion elementwhich is derived with the neutral model.
4.2. Impedance with SEI. The presence of the SEIcomplicates the impedance calculation so that an analyticalsolution of the non-neutral impedance is no longer feasible.Therefore, this model is only solved numerically. However, wefind that it is well-approximated by the sum of five distinctimpedance contributions:
Z Z Z Z Z Z( ) E SEI I D,SEI Dω = ′ + + ′ + + ′ (76)
We illustrate this result in Figure 6. It shows that the SEI addstwo impedance features to our model. One semicirclerepresents the ionic transport resistance of the surface filmwhich we label ZSEI. Furthermore, a second diffusion resistanceappears, ZD,SEI. This is a consequence of modeling chargetransport through the SEI with a liquid electrolyte. Liquidelectrolytes allow the formation of concentration gradients asopposed to solid electrolytes. All three remaining impedancecontributions in eq 76 are marked with a ′. This indicates thatthe expressions given in section 4.1 must be adjusted toaccount for the slightly modified geometry (L → L′).
4.2.1. Electrolyte and Interface Impedance. We revisit theimpedance contributions in eq 76 that appear in theimpedance model without SEI; see section 4.1. The presenceof SEI reduces the size of the electrolyte phase. It is now givenby L′ = L − L where L is the thickness of the SEI. We considerthis and modify the expression for the electrolyte resistance:
The Journal of Physical Chemistry C Article
DOI: 10.1021/acs.jpcc.9b07389J. Phys. Chem. C 2019, 123, 27327−27343
27337
Reproduced with permission from reference [175], Copyright (2020) American Chemical Society.
167
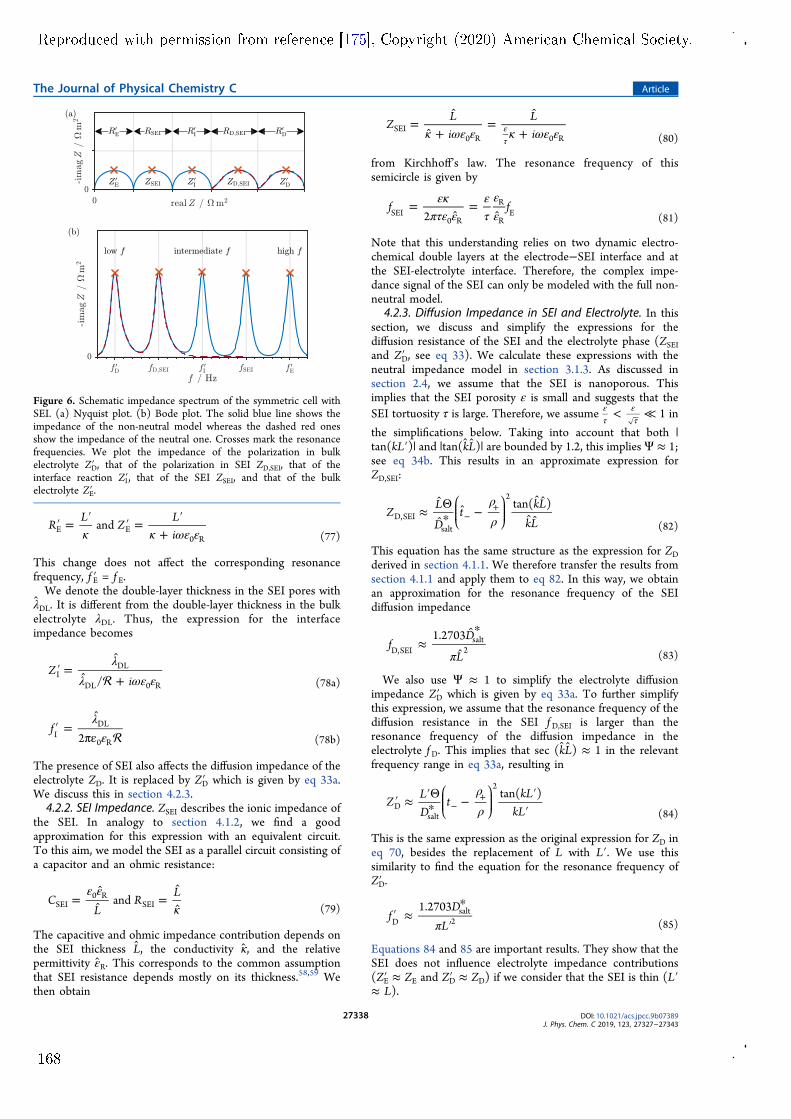
RL
ZLi
andE E0 Rκ κ ωε ε
′ = ′ ′ = ′+ (77)
This change does not affect the corresponding resonancefrequency, f E′ = f E.We denote the double-layer thickness in the SEI pores with
λDL. It is different from the double-layer thickness in the bulkelectrolyte λDL. Thus, the expression for the interfaceimpedance becomes
Zi/I
DL
DL 0 R
λλ ωε ε
′ =
+ (78a)
f2I
DL
0 R
λε
′ =
πε (78b)
The presence of SEI also affects the diffusion impedance of theelectrolyte ZD. It is replaced by ZD′ which is given by eq 33a.We discuss this in section 4.2.3.4.2.2. SEI Impedance. ZSEI describes the ionic impedance of
the SEI. In analogy to section 4.1.2, we find a goodapproximation for this expression with an equivalent circuit.To this aim, we model the SEI as a parallel circuit consisting ofa capacitor and an ohmic resistance:
CL
RL
andSEI0 R
SEIε ε
κ=
=
(79)
The capacitive and ohmic impedance contribution depends onthe SEI thickness L, the conductivity κ, and the relativepermittivity εR. This corresponds to the common assumptionthat SEI resistance depends mostly on its thickness.58,59 Wethen obtain
ZLi
LiSEI
0 R 0 Rκ ωε ε κ ωε ε=
+
=
+ετ (80)
from Kirchhoff’s law. The resonance frequency of thissemicircle is given by
f f2SEI
0 R
R
RE
εκπτε ε
ετ
εε
=
= (81)
Note that this understanding relies on two dynamic electro-chemical double layers at the electrode−SEI interface and atthe SEI-electrolyte interface. Therefore, the complex impe-dance signal of the SEI can only be modeled with the full non-neutral model.
4.2.3. Diffusion Impedance in SEI and Electrolyte. In thissection, we discuss and simplify the expressions for thediffusion resistance of the SEI and the electrolyte phase (ZSEIand ZD′ , see eq 33). We calculate these expressions with theneutral impedance model in section 3.1.3. As discussed insection 2.4, we assume that the SEI is nanoporous. Thisimplies that the SEI porosity ε is small and suggests that theSEI tortuosity τ is large. Therefore, we assume <ε
τετ≪ 1 in
the simplifications below. Taking into account that both |tan(kL′)| and |tan(kL)| are bounded by 1.2, this implies Ψ ≈ 1;see eq 34b. This results in an approximate expression forZD,SEI:
ZL
Dt
kLkL
tan( )D,SEI
salt
2ρρ
≈Θ*
−
−+i
kjjjj
yzzzz
(82)
This equation has the same structure as the expression for ZDderived in section 4.1.1. We therefore transfer the results fromsection 4.1.1 and apply them to eq 82. In this way, we obtainan approximation for the resonance frequency of the SEIdiffusion impedance
fD
L
1.2703D,SEI
salt2π
≈*
(83)
We also use Ψ ≈ 1 to simplify the electrolyte diffusionimpedance ZD′ which is given by eq 33a. To further simplifythis expression, we assume that the resonance frequency of thediffusion resistance in the SEI f D,SEI is larger than theresonance frequency of the diffusion impedance in theelectrolyte f D. This implies that sec (kL) ≈ 1 in the relevantfrequency range in eq 33a, resulting in
ZLD
tkL
kLtan( )
Dsalt
2ρρ
′ ≈ ′Θ* − ′
′−+i
kjjjj
yzzzz
(84)
This is the same expression as the original expression for ZD ineq 70, besides the replacement of L with L′. We use thissimilarity to find the equation for the resonance frequency ofZD′ .
fD
L1.2703
Dsalt
2π′ ≈
*
′ (85)
Equations 84 and 85 are important results. They show that theSEI does not influence electrolyte impedance contributions(ZE′ ≈ ZE and ZD′ ≈ ZD) if we consider that the SEI is thin (L′≈ L).
Figure 6. Schematic impedance spectrum of the symmetric cell withSEI. (a) Nyquist plot. (b) Bode plot. The solid blue line shows theimpedance of the non-neutral model whereas the dashed red onesshow the impedance of the neutral one. Crosses mark the resonancefrequencies. We plot the impedance of the polarization in bulkelectrolyte ZD′ , that of the polarization in SEI ZD,SEI, that of theinterface reaction ZI′, that of the SEI ZSEI, and that of the bulkelectrolyte ZE′ .
The Journal of Physical Chemistry C Article
DOI: 10.1021/acs.jpcc.9b07389J. Phys. Chem. C 2019, 123, 27327−27343
27338
Reproduced with permission from reference [175], Copyright (2020) American Chemical Society.
168
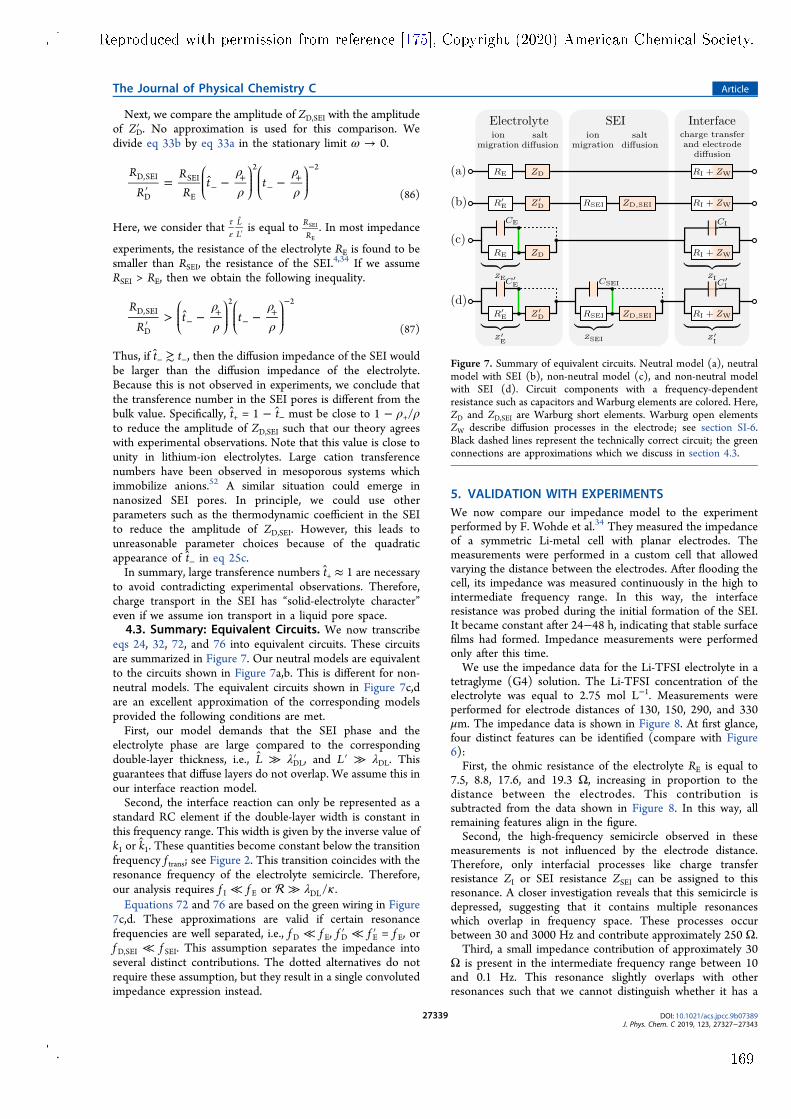
Next, we compare the amplitude of ZD,SEI with the amplitudeof ZD′ . No approximation is used for this comparison. Wedivide eq 33b by eq 33a in the stationary limit ω → 0.
R
RRR
t tD,SEI
D
SEI
E
2 2ρρ
ρρ′
= − −−+
−+
−ikjjjj
yzzzz
ikjjjj
yzzzz
(86)
Here, we consider that LL
τε
′ is equal to
RR
SEI
E. In most impedance
experiments, the resistance of the electrolyte RE is found to besmaller than RSEI, the resistance of the SEI.4,34 If we assumeRSEI > RE, then we obtain the following inequality.
R
Rt tD,SEI
D
2 2ρρ
ρρ′
> − −−+
−+
−ikjjjj
yzzzz
ikjjjj
yzzzz
(87)
Thus, if t− ≳ t−, then the diffusion impedance of the SEI wouldbe larger than the diffusion impedance of the electrolyte.Because this is not observed in experiments, we conclude thatthe transference number in the SEI pores is different from thebulk value. Specifically, t+ = 1 − t− must be close to 1 − ρ+/ρto reduce the amplitude of ZD,SEI such that our theory agreeswith experimental observations. Note that this value is close tounity in lithium-ion electrolytes. Large cation transferencenumbers have been observed in mesoporous systems whichimmobilize anions.52 A similar situation could emerge innanosized SEI pores. In principle, we could use otherparameters such as the thermodynamic coefficient in the SEIto reduce the amplitude of ZD,SEI. However, this leads tounreasonable parameter choices because of the quadraticappearance of t− in eq 25c.In summary, large transference numbers t+ ≈ 1 are necessary
to avoid contradicting experimental observations. Therefore,charge transport in the SEI has “solid-electrolyte character”even if we assume ion transport in a liquid pore space.4.3. Summary: Equivalent Circuits. We now transcribe
eqs 24, 32, 72, and 76 into equivalent circuits. These circuitsare summarized in Figure 7. Our neutral models are equivalentto the circuits shown in Figure 7a,b. This is different for non-neutral models. The equivalent circuits shown in Figure 7c,dare an excellent approximation of the corresponding modelsprovided the following conditions are met.First, our model demands that the SEI phase and the
electrolyte phase are large compared to the correspondingdouble-layer thickness, i.e., L ≫ λDL′ , and L′ ≫ λDL. Thisguarantees that diffuse layers do not overlap. We assume this inour interface reaction model.Second, the interface reaction can only be represented as a
standard RC element if the double-layer width is constant inthis frequency range. This width is given by the inverse value ofk1 or k1. These quantities become constant below the transitionfrequency f trans; see Figure 2. This transition coincides with theresonance frequency of the electrolyte semicircle. Therefore,our analysis requires f I ≪ f E or /DLλ κ≫ .Equations 72 and 76 are based on the green wiring in Figure
7c,d. These approximations are valid if certain resonancefrequencies are well separated, i.e., f D ≪ f E, f D′ ≪ f E′ = f E, orf D,SEI ≪ f SEI. This assumption separates the impedance intoseveral distinct contributions. The dotted alternatives do notrequire these assumption, but they result in a single convolutedimpedance expression instead.
5. VALIDATION WITH EXPERIMENTSWe now compare our impedance model to the experimentperformed by F. Wohde et al.34 They measured the impedanceof a symmetric Li-metal cell with planar electrodes. Themeasurements were performed in a custom cell that allowedvarying the distance between the electrodes. After flooding thecell, its impedance was measured continuously in the high tointermediate frequency range. In this way, the interfaceresistance was probed during the initial formation of the SEI.It became constant after 24−48 h, indicating that stable surfacefilms had formed. Impedance measurements were performedonly after this time.We use the impedance data for the Li-TFSI electrolyte in a
tetraglyme (G4) solution. The Li-TFSI concentration of theelectrolyte was equal to 2.75 mol L−1. Measurements wereperformed for electrode distances of 130, 150, 290, and 330μm. The impedance data is shown in Figure 8. At first glance,four distinct features can be identified (compare with Figure6):First, the ohmic resistance of the electrolyte RE is equal to
7.5, 8.8, 17.6, and 19.3 Ω, increasing in proportion to thedistance between the electrodes. This contribution issubtracted from the data shown in Figure 8. In this way, allremaining features align in the figure.Second, the high-frequency semicircle observed in these
measurements is not influenced by the electrode distance.Therefore, only interfacial processes like charge transferresistance ZI or SEI resistance ZSEI can be assigned to thisresonance. A closer investigation reveals that this semicircle isdepressed, suggesting that it contains multiple resonanceswhich overlap in frequency space. These processes occurbetween 30 and 3000 Hz and contribute approximately 250 Ω.Third, a small impedance contribution of approximately 30
Ω is present in the intermediate frequency range between 10and 0.1 Hz. This resonance slightly overlaps with otherresonances such that we cannot distinguish whether it has a
Figure 7. Summary of equivalent circuits. Neutral model (a), neutralmodel with SEI (b), non-neutral model (c), and non-neutral modelwith SEI (d). Circuit components with a frequency-dependentresistance such as capacitors and Warburg elements are colored. Here,ZD and ZD,SEI are Warburg short elements. Warburg open elementsZW describe diffusion processes in the electrode; see section SI-6.Black dashed lines represent the technically correct circuit; the greenconnections are approximations which we discuss in section 4.3.
The Journal of Physical Chemistry C Article
DOI: 10.1021/acs.jpcc.9b07389J. Phys. Chem. C 2019, 123, 27327−27343
27339
Reproduced with permission from reference [175], Copyright (2020) American Chemical Society.
169
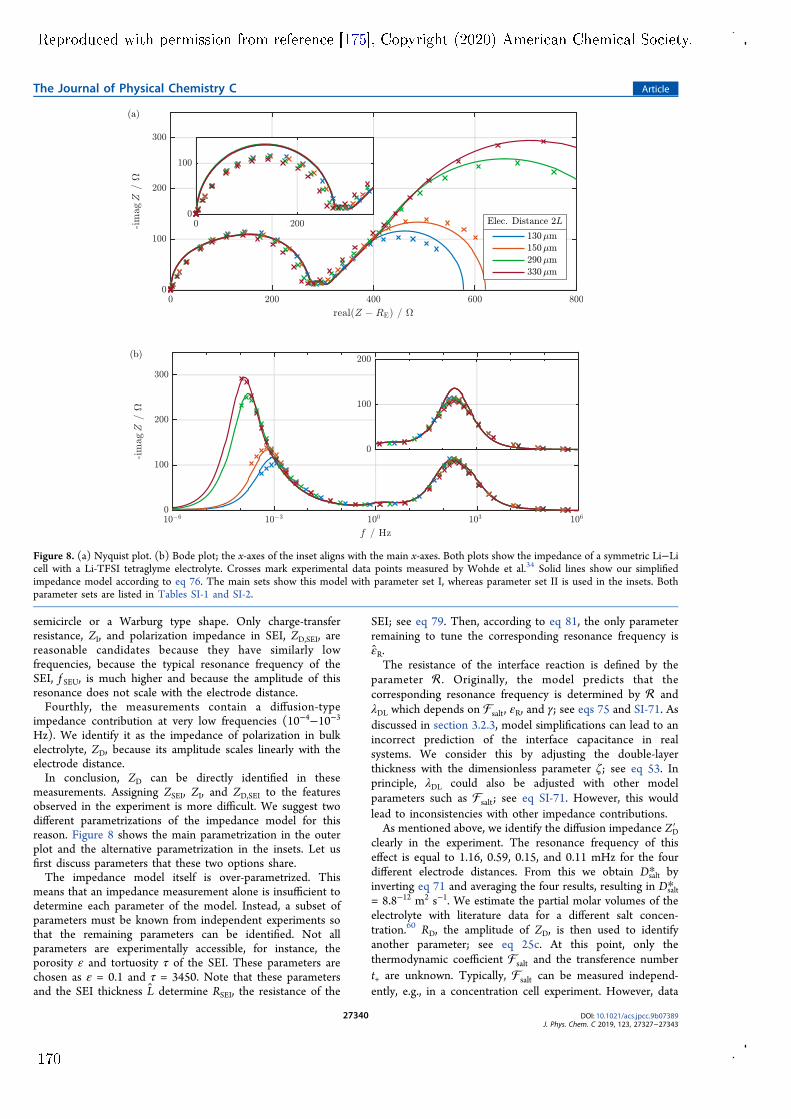
semicircle or a Warburg type shape. Only charge-transferresistance, ZI, and polarization impedance in SEI, ZD,SEI, arereasonable candidates because they have similarly lowfrequencies, because the typical resonance frequency of theSEI, f SEU, is much higher and because the amplitude of thisresonance does not scale with the electrode distance.Fourthly, the measurements contain a diffusion-type
impedance contribution at very low frequencies (10−4−10−3Hz). We identify it as the impedance of polarization in bulkelectrolyte, ZD, because its amplitude scales linearly with theelectrode distance.In conclusion, ZD can be directly identified in these
measurements. Assigning ZSEI, ZI, and ZD,SEI to the featuresobserved in the experiment is more difficult. We suggest twodifferent parametrizations of the impedance model for thisreason. Figure 8 shows the main parametrization in the outerplot and the alternative parametrization in the insets. Let usfirst discuss parameters that these two options share.The impedance model itself is over-parametrized. This
means that an impedance measurement alone is insufficient todetermine each parameter of the model. Instead, a subset ofparameters must be known from independent experiments sothat the remaining parameters can be identified. Not allparameters are experimentally accessible, for instance, theporosity ε and tortuosity τ of the SEI. These parameters arechosen as ε = 0.1 and τ = 3450. Note that these parametersand the SEI thickness L determine RSEI, the resistance of the
SEI; see eq 79. Then, according to eq 81, the only parameterremaining to tune the corresponding resonance frequency isεR.The resistance of the interface reaction is defined by the
parameter . Originally, the model predicts that thecorresponding resonance frequency is determined by andλDL which depends on salt, εR, and γ; see eqs 75 and SI-71. Asdiscussed in section 3.2.3, model simplifications can lead to anincorrect prediction of the interface capacitance in realsystems. We consider this by adjusting the double-layerthickness with the dimensionless parameter ζ; see eq 53. Inprinciple, λDL could also be adjusted with other modelparameters such as salt; see eq SI-71. However, this wouldlead to inconsistencies with other impedance contributions.As mentioned above, we identify the diffusion impedance ZD′
clearly in the experiment. The resonance frequency of thiseffect is equal to 1.16, 0.59, 0.15, and 0.11 mHz for the fourdifferent electrode distances. From this we obtain Dsalt* byinverting eq 71 and averaging the four results, resulting in Dsalt*= 8.8−12 m2 s−1. We estimate the partial molar volumes of theelectrolyte with literature data for a different salt concen-tration.60 RD, the amplitude of ZD, is then used to identifyanother parameter; see eq 25c. At this point, only thethermodynamic coefficient salt and the transference numbert+ are unknown. Typically, salt can be measured independ-ently, e.g., in a concentration cell experiment. However, data
Figure 8. (a) Nyquist plot. (b) Bode plot; the x-axes of the inset aligns with the main x-axes. Both plots show the impedance of a symmetric Li−Licell with a Li-TFSI tetraglyme electrolyte. Crosses mark experimental data points measured by Wohde et al.34 Solid lines show our simplifiedimpedance model according to eq 76. The main sets show this model with parameter set I, whereas parameter set II is used in the insets. Bothparameter sets are listed in Tables SI-1 and SI-2.
The Journal of Physical Chemistry C Article
DOI: 10.1021/acs.jpcc.9b07389J. Phys. Chem. C 2019, 123, 27327−27343
27340
Reproduced with permission from reference [175], Copyright (2020) American Chemical Society.
170
for salt is not available in literature for the highly concentratedsolution at hand. We use a different approach for this reason.The transference number is taken from34,61 which is calculatedas follows:
tR
R R0.0245E
E D=
+=+
(88)
As discussed by Doyle and Newman,62 this equation correctlygives the transference number for a dilute/ideal electrolyte.Note that neither of these assumptions are applicable to thissystem. After choosing t+, we calculate the thermodynamicfactor with the impedance data resulting in 6.2salt = . Thelarge thermodynamic factor illustrates the nonideal behavior ofthe system. This implies that eq 88 gives a flawed estimate forthe transference number. However, this uncertainty could beremoved by measuring the thermodynamic factor independ-ently63 and using the impedance measurement to determinethe transference number.We now elaborate on the differences between both
parameter sets. They are summarized in Tables SI-1 and SI-2.64 In our main parametrization, both ZSEI and ZI overlap andform the high-frequency semicircle. RSEI and RI, the resistancesof the SEI and the interface reaction, are determined bychoosing L and . With the choice listed in Table SI-1, thesecontributions amount to RSEI = 102 Ω and RI = 168 Ω. Theresonance frequencies are then adjusted with the choices ζ = 5and εR = 131. Then, the impedance of polarization in SEI,ZD,SEI, must be assigned to the intermediate resonance. At thispoint, the lithium-ion transference number in the SEI, t+, is theonly parameter left to scale this impedance contribution. Themodel fits well to the data if we choose t+ = 0.9.In the alternative parametrization, we attribute the high-
frequency resonance to ZSEI alone. To this aim, we increaseRSEI by increasing the SEI thickness to 67 nm. Then, the SEIresistance accounts for RSEI = 273 Ω. At the same time, weadjust the relative permittivity of the SEI to move thissemicircle to the correct resonance frequency, εR = 347. ZI isattributed to the intermediate frequency resonance resulting ina lower value for so that RI = 23Ω. However, shifting thecorresponding resonance frequency to the intermediate regimerequires a significant correction of the interface capacity, i.e., ζ= 0.02. Finally, the impedance of polarization in SEI, ZD,SEI, isparametrized so that its amplitude is small. In this case, ZD,SEIcan be neglected if t+ = 0.97.Both models show good qualitative agreement with the
experiment; see Figure 8. Naturally, the first parametrizationhas a better quantitative agreement with the data as it correctlypredicts the depressed semicircle. However, this depressioncould also be caused by an inhomogeneous distribution of SEIproperties. The main parametrization also requires morereasonable corrections. For instance, the interface capacityneeds to be corrected by a factor of 5 in the mainparametrization, whereas a factor of 50 is needed in thealternative one. Both parametrizations require large values forthe relative permittivity of the SEI. However, the value neededin the alternative option is even larger, so it is difficult to justify(135 vs 347). A better understanding of which parametrizationis correct can be obtained by observing the high frequencyimpedance during the initial SEI formation. This would easilyallow the identification of SEI impedance contributions whichincrease during this time.
Both parametrization share a large lithium transferencenumber to describe the transport in the SEI pores. Here, thevalues 0.9 and 0.97 are used, indicating that transport in theSEI pores is qualitatively different from transport in the bulkelectrolyte. As argued above, this behavior can be explained byimmobilization of anions in the porous SEI structure.52
Although these two values are similar, they cause a significantchange in the cell impedance. In the first parametrization,RD,SEI is equal to 15 Ω creating a visible resonance between theinterface semicircle and the low frequency finite-lengthWarburg. In contrast, in the second parametrization, RD,SEI isequal to 1.5 Ω, so ZD,SEI is overshadowed and not visible. Notethat a smaller value of t+ would result in a much largeramplitude of ZD,SEI and can be ruled out. Therefore, the modelpredicts lithium-ion transference numbers close to one in theSEI phase.In conclusion, the assumption that charge transfer in the SEI
is facilitated by liquid electrolyte in small SEI pores predictsthe emergence of an additional feature in the cell impedance.For the experiment at hand, this feature dominates theimpedance response if the lithium-ion transference number inthe SEI is not adjusted (t+ = 0.0245 → RD,SEI = 1868 Ω). Ourmodel only agrees with the experiment if large lithium-iontransference numbers are chosen in the SEI phase. Thisindicates that lithium ions move in the solid phase of the SEIor that lithium-ion transport in the SEI pores has a solid-electrolyte character.
6. CONCLUSIONSIn this article, we present an analytical impedance model for asymmetric cell with planar electrodes. We model the solid−electrolyte interphase (SEI) as a porous surface layer. Ourmodel relies on a thermodynamically consistent theory forelectrolyte transport. We take special care that transportparameters as the diffusion coefficient and the transferencenumbers are well-defined. This implies the consistentdefinition of a reference velocity, the center-of-mass velocityin our case. Our analytic expressions for impedance spectros-copy show that this is especially relevant for concentratedelectrolytes.To reveal the parameter dependence of the impedance
spectrum, we perform a step-by-step procedure. We begin bycalculating the impedance spectrum for locally electroneutralsystems without SEI. Finally, we relax the condition of localelectroneutrality and include transport through a porous SEI.Most importantly, we describe diffusion impedances orWarburg short elements and reveal their dependence on thetransference number. Thus, we suggest using impedancespectroscopy for the determination of the transference numberor the thermodynamic factor in the bulk electrolyte and theSEI.Our analytical impedance expressions are approximately
described with common equivalent circuit models. We identifyand discuss the frequency range and parameter space in whichequivalent circuit methods are valid.We predict the thickness of charged electrochemical double-
layers based on the Poisson equation. Thus, in our model, thestandard Debye length defines the double-layer capacitanceand the resonance frequency of the interface reactionsemicircle. However, this frequency does not agree withexperimental data for a Li-TFSI tetraglyme solution with Li-metal electrodes. This indicates that charged double-layers ofthe reference state cannot be neglected when calculating the
The Journal of Physical Chemistry C Article
DOI: 10.1021/acs.jpcc.9b07389J. Phys. Chem. C 2019, 123, 27327−27343
27341
Reproduced with permission from reference [175], Copyright (2020) American Chemical Society.
171
impedance response. Furthermore, ion adsorption on theelectrode surface contributes significantly to the interfacecapacitance of this system.Our model explores the assumption that charge transport
through the SEI is enabled by small pores which are filled withelectrolyte. This results in a second finite-length Warburgelement in the impedance response of the cell. Only a SEI-specific Li+ transference number close to 1 reduces theamplitude of this impedance contribution to levels that alignwith experiments. Therefore, charge transport in the SEI showsthe characteristics of a solid electrolyte even if transport in aliquid environment is assumed. We therefore propose todescribe lithium-ion transport in the SEI with a specific theoryfor solid electrolytes.Combining our results with the impact of intercalation
electrodes (see section SI-6) and of porous electrodes withinmicrostructure resolved simulations (see ref 36) will yield theimpedance signal for standard lithium-ion batteries.
ASSOCIATED CONTENT*S Supporting InformationThe Supporting Information is available free of charge on theACS Publications website at DOI: 10.1021/acs.jpcc.9b07389.
Transport theory of a general concentrated electrolyte;linearization of model equations; transport theory andlinearization applied to a binary electrolyte; calculationdetails for impedance spectrum assuming local electro-neutrality; calculation details for impedance spectrum ofthe non-neutral model; Warburg diffusion impedance inintercalation electrodes; list of parameters. (PDF)
AUTHOR INFORMATIONCorresponding Authors*E-mail: [email protected] (B.H.).*E-mail: [email protected] (A.L.).ORCIDBirger Horstmann: 0000-0002-1500-0578NotesThe authors declare no competing financial interest.
ACKNOWLEDGMENTSThis work is supported by the German Federal Ministry ofEducation and Research (BMBF) with the project Li-EcoSafe(03 × 4636A). We thank Prof. Bernhard Roling and FabianSalzer for stimulating discussions.
REFERENCES(1) Fauteux, D. Formation of a passivating film at the lithium-PEO-LiCF3SO3 interface. Solid State Ionics 1985, 17, 133−138.(2) Gao, L.; Macdonald, D. D. Characterization of IrreversibleProcesses at the Li/Poly[bis(2,3-di-(2-methoxyethoxy)propoxy)-phosphazana] Interface on Charge Cycling. J. Electrochem. Soc.1997, 144, 1174−1179.(3) Lu, P.; Li, C.; Schneider, E. W.; Harris, S. J. Chemistry,impedance, and morphology evolution in solid electrolyte interphasefilms during formation in lithium ion batteries. J. Phys. Chem. C 2014,118, 896−903.(4) Steinhauer, M.; Risse, S.; Wagner, N.; Friedrich, K. A.Investigation of the Solid Electrolyte Interphase Formation atGraphite Anodes in Lithium-Ion Batteries with ElectrochemicalImpedance Spectroscopy. Electrochim. Acta 2017, 228, 652−658.(5) Levi, M. D.; Aurbach, D. Simultaneous Measurements andModeling of the Electrochemical Impedance and the Cyclic
Voltammetric Characteristics of Graphite Electrodes Doped withLithium. J. Phys. Chem. B 1997, 101, 4630−4640.(6) Doyle, M. Modeling of Galvanostatic Charge and Discharge ofthe Lithium/Polymer/Insertion Cell. J. Electrochem. Soc. 1993, 140,1526.(7) Danner, T.; Singh, M.; Hein, S.; Kaiser, J.; Hahn, H.; Latz, A.Thick electrodes for Li-ion batteries: A model based analysis. J. PowerSources 2016, 334, 191−201.(8) Fronczek, D. N.; Bessler, W. G. Insight into lithium-sulfurbatteries: Elementary kinetic modeling and impedance simulation. J.Power Sources 2013, 244, 183−188.(9) Danner, T.; Zhu, G.; Hofmann, A. F.; Latz, A. Modeling of nano-structured cathodes for improved lithium-sulfur batteries. Electrochim.Acta 2015, 184, 124−133.(10) Schmitt, T.; Arlt, T.; Manke, I.; Latz, A.; Horstmann, B. Zincelectrode shape-change in secondary air batteries: A 2D modelingapproach. J. Power Sources 2019, 432, 119−132.(11) Clark, S.; Mainar, A. R.; Iruin, E.; Colmenares, L. C.; Blazquez,J. A.; Tolchard, J. R.; Latz, A.; Horstmann, B. Towards rechargeablezinc-air batteries with aqueous chloride electrolytes. J. Mater. Chem. A2019, 7, 11387−11399.(12) Clark, S.; Latz, A.; Horstmann, B. A Review of Model-BasedDesign Tools for Metal-Air Batteries. Batteries 2018, 4, 5.(13) Jahnke, T.; Zago, M.; Casalegno, A.; Bessler, W. G.; Latz, A. Atransient multi-scale model for direct methanol fuel cells. Electrochim.Acta 2017, 232, 215−225.(14) Moya, A. A. Electrochemical Impedance of Ion-ExchangeMembranes with Interfacial Charge Transfer Resistances. J. Phys.Chem. C 2016, 120, 6543−6552.(15) Huang, Q. A.; Park, S. M. Unified model for transient faradaicimpedance spectroscopy: Theory and prediction. J. Phys. Chem. C2012, 116, 16939−16950.(16) Luck, J.; Latz, A. The electrochemical double layer and itsimpedance behavior in lithium-ion batteries. Phys. Chem. Chem. Phys.2019, 21, 14753−14765.(17) Braun, S.; Yada, C.; Latz, A. Thermodynamically ConsistentModel for Space-Charge-Layer Formation in a Solid Electrolyte. J.Phys. Chem. C 2015, 119, 22281−22288.(18) Hoffmann, V.; Pulletikurthi, G.; Carstens, T.; Lahiri, A.;Borodin, A.; Schammer, M.; Horstmann, B.; Latz, A.; Endres, F.Influence of a silver salt on the nanostructure of a Au(111)/ionicliquid interface: An atomic force microscopy study and theoreticalconcepts. Phys. Chem. Chem. Phys. 2018, 20, 4760−4771.(19) Single, F.; Horstmann, B.; Latz, A. Dynamics and morphologyof solid electrolyte interphase (SEI). Phys. Chem. Chem. Phys. 2016,18, 17810−17814.(20) Horstmann, B.; Gallant, B.; Mitchell, R.; Bessler, W. G.; Shao-Horn, Y.; Bazant, M. Z. Rate-Dependent Morphology of Li2O2
Growth in Li-O2 Batteries. J. Phys. Chem. Lett. 2013, 4, 4217−4222.(21) Legrand, N.; Rael, S.; Knosp, B.; Hinaje, M.; Desprez, P.;Lapicque, F. Including double-layer capacitance in lithium-ion batterymathematical models. J. Power Sources 2014, 251, 370−378.(22) Bessler, W. G. Rapid Impedance Modeling via Potential Stepand Current Relaxation Simulations. J. Electrochem. Soc. 2007, 154,B1186.(23) Levi, M. D.; Aurbach, D. Impedance of a single intercalationparticle and of non-homogeneous, multilayered porous compositeelectrodes for Li-ion batteries. J. Phys. Chem. B 2004, 108, 11693−11703.(24) Huang, R. W. J. M.; Chung, F.; Kelder, E. M. ImpedanceSimulation of a Li-Ion Battery with Porous Electrodes and SphericalLi+ Intercalation Particles. J. Electrochem. Soc. 2006, 153, A1459.(25) Mistry, A. N.; Mukherjee, P. P. Probing spatial coupling ofresistive modes in porous intercalation electrodes through impedancespectroscopy. Phys. Chem. Chem. Phys. 2019, 21, 3805−3813.(26) Meyers, J. P.; Doyle, M.; Darling, R. M.; Newman, J. TheImpedance Response of a Porous Electrode Composed ofIntercalation Particles. J. Electrochem. Soc. 2000, 147, 2930.
The Journal of Physical Chemistry C Article
DOI: 10.1021/acs.jpcc.9b07389J. Phys. Chem. C 2019, 123, 27327−27343
27342
Reproduced with permission from reference [175], Copyright (2020) American Chemical Society.
172
(27) Song, J.; Bazant, M. Z. Effects of Nanoparticle Geometry andSize Distribution on Diffusion Impedance of Battery Electrodes. J.Electrochem. Soc. 2013, 160, A15−A24.(28) Schmidt, J. P.; Chrobak, T.; Ender, M.; Illig, J.; Klotz, D.; Ivers-Tiffee, E. Studies on LiFePO4as cathode material using impedancespectroscopy. J. Power Sources 2011, 196, 5342−5348.(29) Murbach, M. D.; Schwartz, D. T. Extending Newman’s Pseudo-Two-Dimensional Lithium-Ion Battery Impedance Simulation Ap-proach to Include the Nonlinear Harmonic Response. J. Electrochem.Soc. 2017, 164, E3311−E3320.(30) Kulikovsky, A. A physical model for catalyst layer impedance. J.Electroanal. Chem. 2012, 669, 28−34.(31) Kulikovsky, A.; Eikerling, M. Analytical solutions for impedanceof the cathode catalyst layer in PEM fuel cell: Layer parameters fromimpedance spectrum without fitting. J. Electroanal. Chem. 2013, 691,13−17.(32) Kulikovsky, A.; Shamardina, O. A Model for PEM Fuel CellImpedance: Oxygen Flow in the Channel Triggers Spatial andFrequency Oscillations. J. Electrochem. Soc. 2015, 162, F1068−F1077.(33) Zhou, H.; Preston, M. A.; Tilton, R. D.; White, L. R.Calculation of the dynamic impedance of the double layer on a planarelectrode by the theory of electrokinetics. J. Colloid Interface Sci. 2005,292, 277−289.(34) Wohde, F.; Balabajew, M.; Roling, B. Li Transference Numbersin Liquid Electrolytes Obtained by Very-Low-Frequency ImpedanceSpectroscopy at Variable Electrode Distances. J. Electrochem. Soc.2016, 163, A714−A721.(35) Schammer, M.; Horstmann, B.; Latz, A. Theory of transport inhighly concentrated electrolytes. Submitted, 2019.(36) Latz, A.; Zausch, J. Multiscale modeling of lithium ion batteries:Thermal aspects. Beilstein J. Nanotechnol. 2015, 6, 987−1007.(37) Latz, A.; Zausch, J. Thermodynamic Consistent TransportTheory of Li-ion Batteries. J. Power Sources 2011, 196, 3296−3302.(38) Stamm, J.; Varzi, A.; Latz, A.; Horstmann, B. Modelingnucleation and growth of zinc oxide during discharge of primary zinc-air batteries. J. Power Sources 2017, 360, 136−149.(39) Clark, S.; Latz, A.; Horstmann, B. Rational Development ofNeutral Aqueous Electrolytes for Zinc-Air Batteries. ChemSusChem2017, 10, 4735−4747.(40) Horstmann, B.; Danner, T.; Bessler, W. G. Precipitation inaqueous lithium-oxygen batteries: A model-based analysis. EnergyEnviron. Sci. 2013, 6, 1299−1314.(41) Rubi, J. M.; Kjelstrup, S. Mesoscopic NonequilibriumThermodynamics Gives the Same Thermodynamic Basis to Butler-Volmer and Nernst Equations. J. Phys. Chem. B 2003, 107, 13471−13477.(42) Latz, A.; Zausch, J. Thermodynamic derivation of a Butler-Volmer model for intercalation in Li-ion batteries. Electrochim. Acta2013, 110, 358−362.(43) Bazant, M. Z. Theory of Chemical Kinetics and ChargeTransfer based on Nonequilibrium Thermodynamics. Acc. Chem. Res.2013, 46, 1144−1160.(44) Harris, S. J.; Lu, P. Effects of inhomogeneities - nanoscale tomesoscale - on the durability of Li-ion batteries. J. Phys. Chem. C2013, 117, 6481−6492.(45) Michan, A. L.; Leskes, M.; Grey, C. P. Voltage Dependent SolidElectrolyte Interphase Formation in Silicon Electrodes: Monitoringthe Formation of Organic Decomposition Products. Chem. Mater.2016, 28, 385−398.(46) Single, F.; Horstmann, B.; Latz, A. Revealing SEI Morphology:In-Depth Analysis of a Modeling Approach. J. Electrochem. Soc. 2017,164, E3132−E3145.(47) Single, F.; Latz, A.; Horstmann, B. Identifying the Mechanismof Continued Growth of the Solid-Electrolyte Interphase. Chem-SusChem 2018, 11, 1950−1955.(48) Horstmann, B.; Single, F.; Latz, A. Review on multi-scalemodels of solid-electrolyte interphase formation. Curr. Opin. Electro-chem. 2019, 13, 61−69.
(49) Newman, J. S.; Tobias, C. W. Theoretical Analysis of CurrentDistribution in Porous Electrodes. J. Electrochem. Soc. 1962, 109,1183.(50) Newman, J.; Tiedemann, W. Porous-electrode theory withbattery applications. AIChE J. 1975, 21, 25−41.(51) Newman, J.; Thomas-Alyea, K. E. Electrochemical Systems; JohnWiley & Sons, 2004.(52) Popovic, J.; Hasegawa, G.; Moudrakovski, I.; Maier, J.Infiltrated porous oxide monoliths as high lithium transferencenumber electrolytes. J. Mater. Chem. A 2016, 4, 7135−7140.(53) Warburg, E. Uber die Polarisationskapazitat des Platins. Ann.Phys. 1901, 311, 125−135.(54) Neumann, E. Ueber die Polarisationscapacitat umkehrbarerElektroden. Ann. Phys. 1899, 303, 500−534.(55) Payne, R.; Theodorou, I. E. Dielectric properties and relaxationin ethylene carbonate and propylene carbonate. J. Phys. Chem. 1972,76, 2892−2900.(56) Biesheuvel, P. M.; Fu, Y.; Bazant, M. Z. Diffuse charge andFaradaic reactions in porous electrodes. Phys. Rev. E 2011, 83,No. 061507.(57) Luck, J.; Latz, A. Theory of reactions at electrified interfaces.Phys. Chem. Chem. Phys. 2016, 18, 17799−17804.(58) Peled, E. The Electrochemical Behavior of Alkali and AlkalineEarth Metals in Nonaqueous Battery Systems − The Solid ElectrolyteInterphase Model. J. Electrochem. Soc. 1979, 126, 2047−2051.(59) Broussely, M.; Herreyre, S.; Biensan, P.; Kasztejna, P.; Nechev,K.; Staniewicz, R. J. Aging Mechanism in Li Ion Cells and CalendarLife Predictions. J. Power Sources 2001, 97−98, 13−21.(60) Brouillette, D.; Perron, G.; Desnoyers, J. E. Apparent MolarVolume, Heat Capacity, and Conductance of Lithium Bis-(trifluoromethylsulfone)imide in Glymes and Other Aprotic Solvents.J. Solution Chem. 1998, 27, 151−182.(61) Dong, D.; Salzer, F.; Roling, B.; Bedrov, D. How efficient is Li+
ion transport in solvate ionic liquids under anion-blocking conditionsin a battery? Phys. Chem. Chem. Phys. 2018, 20, 29174−29183.(62) Doyle, M. Analysis of Transference Number MeasurementsBased on the Potentiostatic Polarization of Solid Polymer Electrolytes.J. Electrochem. Soc. 1995, 142, 3465.(63) Ehrl, A.; Graf, M.; Wall, W. A.; Gasteiger, H. A.; Landesfeind, J.Direct Electrochemical Determination of Thermodynamic Factors inAprotic Binary Electrolytes. J. Electrochem. Soc. 2016, 163, A1254−A1264.(64) Naejus, R.; Lemordant, D.; Coudert, R.; Willmann, P. Excessthermodynamic properties of binary mixtures containing linear orcyclic carbonates as solvents at the temperatures 298.15 and 315.15 K.J. Chem. Thermodyn. 1997, 29, 1503−1515.
NOTE ADDED AFTER ASAP PUBLICATIONThis paper was published ASAP on October 29, 2019, withincorrect expressions in equations 3, 31, 33, 34, and 64. Thecorrected version was reposted on October 30, 2019.
The Journal of Physical Chemistry C Article
DOI: 10.1021/acs.jpcc.9b07389J. Phys. Chem. C 2019, 123, 27327−27343
27343
Reproduced with permission from reference [175], Copyright (2020) American Chemical Society.
173

Electronic Supporting Information: Theory of Impedance
Spectroscopy for Lithium Batteries
Fabian Single
German Aerospace Center (DLR), Institute of Engineering Thermodynamics,
Pfaffenwaldring 38-40, 70569 Stuttgart, Germany and
Helmholtz Institute Ulm (HIU), Helmholtzstraße 11, 89081 Ulm, Germany
Birger Horstmann∗ and Arnulf Latz†
German Aerospace Center (DLR), Institute of Engineering Thermodynamics,
Pfaffenwaldring 38-40, 70569 Stuttgart, Germany
Helmholtz Institute Ulm (HIU), Helmholtzstraße 11, 89081 Ulm, Germany and
Ulm University, Albert-Einstein-Allee 47, 89081 Ulm, Germany
(Dated: October 23, 2019)
∗ Corresponding author: [email protected]† Corresponding author: [email protected]
S1
Reproduced with permission from reference [175], Copyright (2020) American Chemical Society.
175
CONTENTS
SI-1. Transport Theory S2
A. Reference Velocity S3
B. Incompressibility and Convection S4
C. Thermodynamically consistent Flux Expressions S5
SI-2. Linearisation S9
SI-3. Binary Electrolyte S14
A. Chemical Potentials S16
B. Salt Diffusion Coefficient S18
C. Flux Expressions S19
D. Linearisation S20
SI-4. Impedance: Electroneutral System With SEI S21
SI-5. Appendix: General Impedance S21
A. Dispersion Relation S21
B. Double-Layer Thickness and Interface Capacity S23
C. Non-Neutral System without SEI S26
D. Non-Neutral System with SEI S27
SI-6. Intercalation Electrodes S29
SI-7. List of Parameters S32
References S33
SI-1. TRANSPORT THEORY
The transport theory presented in this section is based on a publication by Schammer et
al.1 As mentioned in the main document, similar theories have been discussed in Refs.2–4 The
theory describes a liquid mixture of N different species which are labelled with the subscript
α = 1, . . . , N . The special case of the binary electrolyte is discussed in section SI-3.
S2
Reproduced with permission from reference [175], Copyright (2020) American Chemical Society.
176
A. Reference Velocity
The transport theory is derived relative to the center-of-mass velocity of the liquid. In
contrast, the lab or resting frame is a global reference system which describes the mixture
from an external perspective. Below, any quantity or parameter that is directly associated
with the lab frame is marked with superscript ∗. Quantities and parameters without this
label refer to the formulation relative to the center-of-mass velocity. Molar flux densities in
both formulations are related
N∗α = cαv∗α, (SI-1a)
Nα = cα (v∗α − v) . (SI-1b)
Here, v∗α is the mean velocity of species α in the lab frame. v is the center-of-mass velocity
which is given by
v =1
ρ
N∑
α=1
ραv∗α, (SI-2)
where ρ and ρα are the density of the mixture and the partial density of species α. Any
choice of reference system reduces the amount of independent fluxes by one. All individual
fluxes relative to the center-of-mass velocity satisfy
0 =N∑
α=1
MαNα, (SI-3)
where Mα is the molar mass of species α. In the derivation below, species 1 is chosen to
be “eliminated” with this constraint. This suggests the definition of the following effective
quantities which appear frequently below
zα = zα −Mα
M1
z1, (SI-4a)
µα = µα −Mα
M1
µ1, (SI-4b)
να = να −Mα
M1
ν1, (SI-4c)
S3
Reproduced with permission from reference [175], Copyright (2020) American Chemical Society.
177
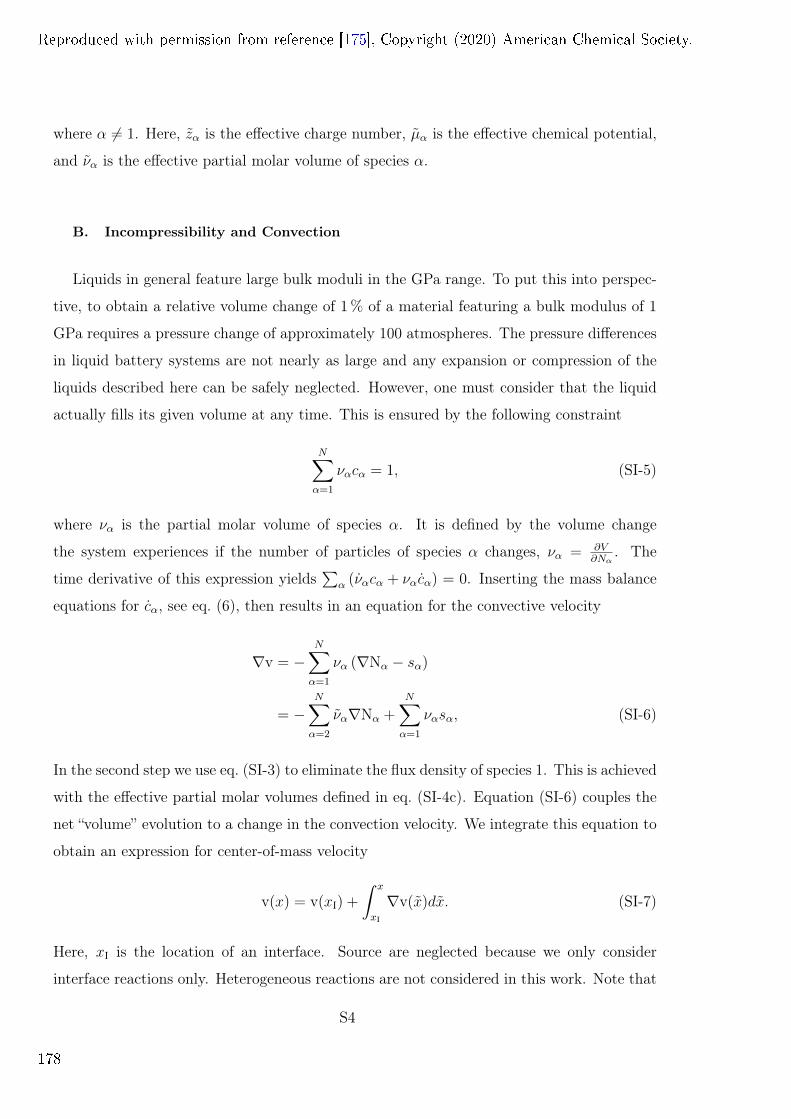
where α 6= 1. Here, zα is the effective charge number, µα is the effective chemical potential,
and να is the effective partial molar volume of species α.
B. Incompressibility and Convection
Liquids in general feature large bulk moduli in the GPa range. To put this into perspec-
tive, to obtain a relative volume change of 1% of a material featuring a bulk modulus of 1
GPa requires a pressure change of approximately 100 atmospheres. The pressure differences
in liquid battery systems are not nearly as large and any expansion or compression of the
liquids described here can be safely neglected. However, one must consider that the liquid
actually fills its given volume at any time. This is ensured by the following constraint
N∑
α=1
ναcα = 1, (SI-5)
where να is the partial molar volume of species α. It is defined by the volume change
the system experiences if the number of particles of species α changes, να = ∂V∂Nα
. The
time derivative of this expression yields∑
α (ναcα + ναcα) = 0. Inserting the mass balance
equations for cα, see eq. (6), then results in an equation for the convective velocity
∇v = −N∑
α=1
να (∇Nα − sα)
= −N∑
α=2
να∇Nα +N∑
α=1
ναsα, (SI-6)
In the second step we use eq. (SI-3) to eliminate the flux density of species 1. This is achieved
with the effective partial molar volumes defined in eq. (SI-4c). Equation (SI-6) couples the
net “volume” evolution to a change in the convection velocity. We integrate this equation to
obtain an expression for center-of-mass velocity
v(x) = v(xI) +
∫ x
xI
∇v(x)dx. (SI-7)
Here, xI is the location of an interface. Source are neglected because we only consider
interface reactions only. Heterogeneous reactions are not considered in this work. Note that
S4
Reproduced with permission from reference [175], Copyright (2020) American Chemical Society.
178
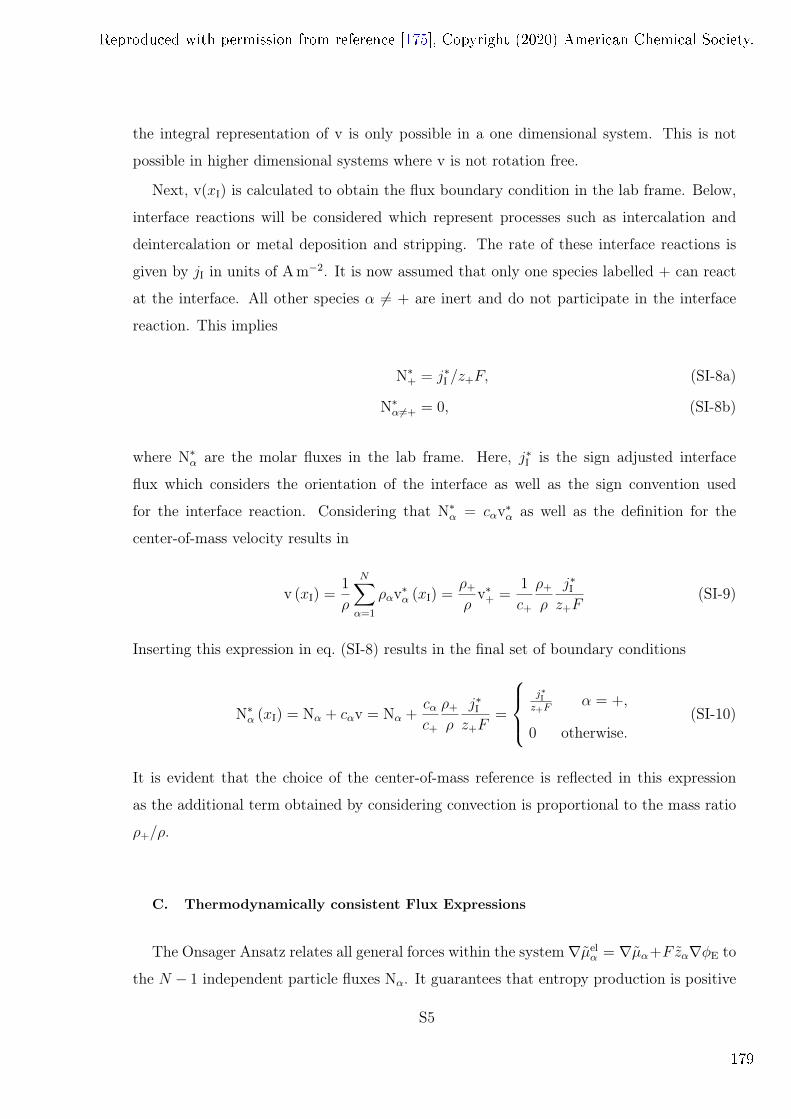
the integral representation of v is only possible in a one dimensional system. This is not
possible in higher dimensional systems where v is not rotation free.
Next, v(xI) is calculated to obtain the flux boundary condition in the lab frame. Below,
interface reactions will be considered which represent processes such as intercalation and
deintercalation or metal deposition and stripping. The rate of these interface reactions is
given by jI in units of Am−2. It is now assumed that only one species labelled + can react
at the interface. All other species α 6= + are inert and do not participate in the interface
reaction. This implies
N∗+ = j∗I /z+F, (SI-8a)
N∗α 6=+ = 0, (SI-8b)
where N∗α are the molar fluxes in the lab frame. Here, j∗I is the sign adjusted interface
flux which considers the orientation of the interface as well as the sign convention used
for the interface reaction. Considering that N∗α = cαv∗α as well as the definition for the
center-of-mass velocity results in
v (xI) =1
ρ
N∑
α=1
ραv∗α (xI) =ρ+
ρv∗+ =
1
c+
ρ+
ρ
j∗Iz+F
(SI-9)
Inserting this expression in eq. (SI-8) results in the final set of boundary conditions
N∗α (xI) = Nα + cαv = Nα +cαc+
ρ+
ρ
j∗Iz+F
=
j∗Iz+F
α = +,
0 otherwise.(SI-10)
It is evident that the choice of the center-of-mass reference is reflected in this expression
as the additional term obtained by considering convection is proportional to the mass ratio
ρ+/ρ.
C. Thermodynamically consistent Flux Expressions
The Onsager Ansatz relates all general forces within the system∇µelα = ∇µα+F zα∇φE to
the N − 1 independent particle fluxes Nα. It guarantees that entropy production is positive
S5
Reproduced with permission from reference [175], Copyright (2020) American Chemical Society.
179
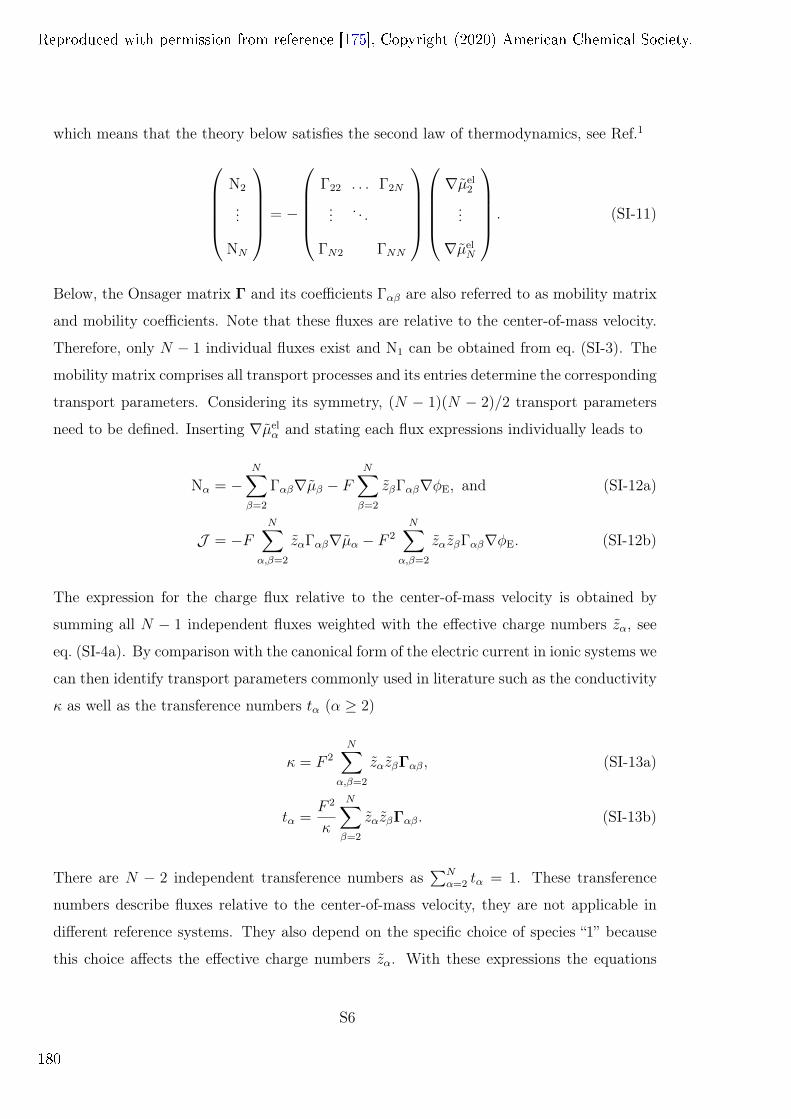
which means that the theory below satisfies the second law of thermodynamics, see Ref.1
N2
...
NN
= −
Γ22 . . . Γ2N
... . . .
ΓN2 ΓNN
∇µel2
...
∇µelN
. (SI-11)
Below, the Onsager matrix Γ and its coefficients Γαβ are also referred to as mobility matrix
and mobility coefficients. Note that these fluxes are relative to the center-of-mass velocity.
Therefore, only N − 1 individual fluxes exist and N1 can be obtained from eq. (SI-3). The
mobility matrix comprises all transport processes and its entries determine the corresponding
transport parameters. Considering its symmetry, (N − 1)(N − 2)/2 transport parameters
need to be defined. Inserting ∇µelα and stating each flux expressions individually leads to
Nα = −N∑
β=2
Γαβ∇µβ − FN∑
β=2
zβΓαβ∇φE, and (SI-12a)
J = −FN∑
α,β=2
zαΓαβ∇µα − F 2
N∑
α,β=2
zαzβΓαβ∇φE. (SI-12b)
The expression for the charge flux relative to the center-of-mass velocity is obtained by
summing all N − 1 independent fluxes weighted with the effective charge numbers zα, see
eq. (SI-4a). By comparison with the canonical form of the electric current in ionic systems we
can then identify transport parameters commonly used in literature such as the conductivity
κ as well as the transference numbers tα (α ≥ 2)
κ = F 2
N∑
α,β=2
zαzβΓαβ, (SI-13a)
tα =F 2
κ
N∑
β=2
zαzβΓαβ. (SI-13b)
There are N − 2 independent transference numbers as∑N
α=2 tα = 1. These transference
numbers describe fluxes relative to the center-of-mass velocity, they are not applicable in
different reference systems. They also depend on the specific choice of species “1” because
this choice affects the effective charge numbers zα. With these expressions the equations
S6
Reproduced with permission from reference [175], Copyright (2020) American Chemical Society.
180
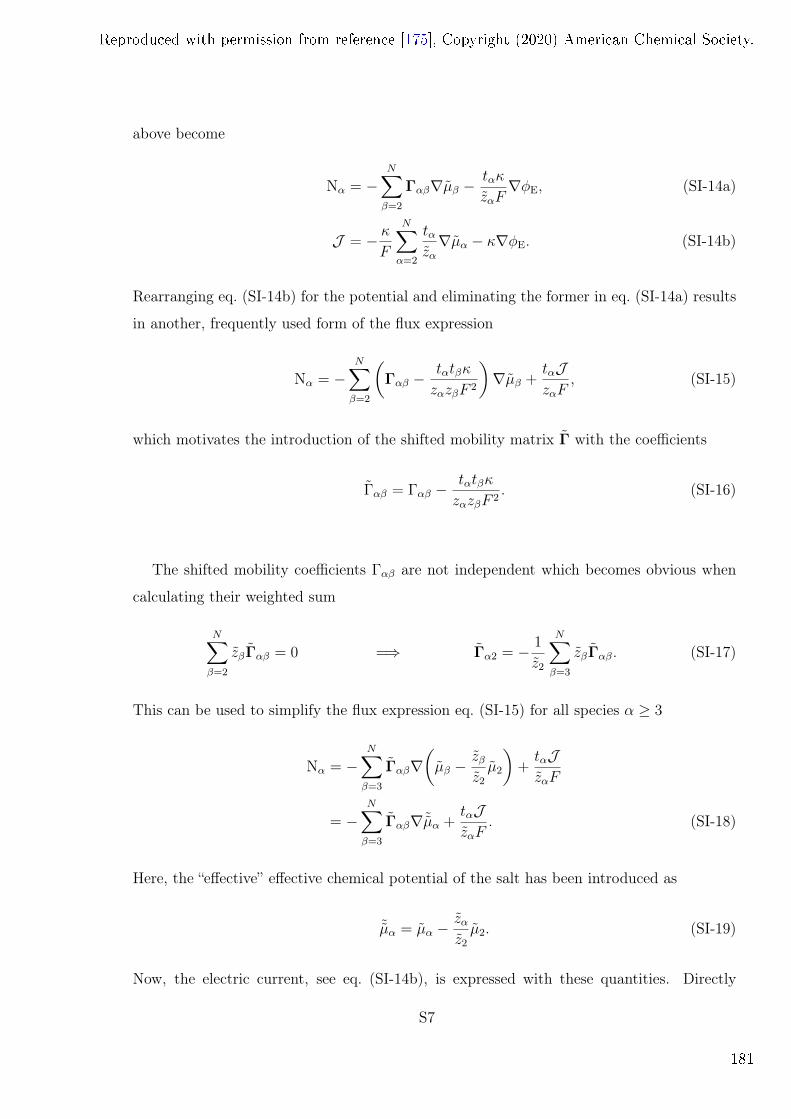
above become
Nα = −N∑
β=2
Γαβ∇µβ −tακ
zαF∇φE, (SI-14a)
J = − κF
N∑
α=2
tαzα∇µα − κ∇φE. (SI-14b)
Rearranging eq. (SI-14b) for the potential and eliminating the former in eq. (SI-14a) results
in another, frequently used form of the flux expression
Nα = −N∑
β=2
(Γαβ −
tαtβκ
zαzβF 2
)∇µβ +
tαJzαF
, (SI-15)
which motivates the introduction of the shifted mobility matrix Γ with the coefficients
Γαβ = Γαβ −tαtβκ
zαzβF 2. (SI-16)
The shifted mobility coefficients Γαβ are not independent which becomes obvious when
calculating their weighted sum
N∑
β=2
zβΓαβ = 0 =⇒ Γα2 = − 1
z2
N∑
β=3
zβΓαβ. (SI-17)
This can be used to simplify the flux expression eq. (SI-15) for all species α ≥ 3
Nα = −N∑
β=3
Γαβ∇(µβ −
zβz2
µ2
)+tαJzαF
= −N∑
β=3
Γαβ∇ ˜µα +tαJzαF
. (SI-18)
Here, the “effective” effective chemical potential of the salt has been introduced as
˜µα = µα −zαz2
µ2. (SI-19)
Now, the electric current, see eq. (SI-14b), is expressed with these quantities. Directly
S7
Reproduced with permission from reference [175], Copyright (2020) American Chemical Society.
181
exchanging µα with ˜µα and running the sum from 3 instead of 2 results in
N∑
α=3
tαzα∇ ˜µα =
N∑
α=3
tαzα∇µα −
N∑
α=3
tαz2
∇µ2
=N∑
α=3
tαzα∇µα −
1− t2z2
∇µ2
=N∑
α=2
tαzα∇µα −
∇µ2
z2
. (SI-20)
This substitution results in an extra term which is now absorbed in the electrochemical
potential defined as
ϕ = φE +µ2
z2F. (SI-21)
Then, the final expression for the electric current reads
J = − κF
N∑
α=3
tαzα∇ ˜µα − κ∇ϕ. (SI-22)
To conclude, to describe the temporal evolution of a mixture of N species, N − 1 mass
balance equations need to be solved, see eq. (6). These mass balance equations can be
written for an arbitrary subset of concentrations cα and the charge density %. There are
only N − 1 independent fluxes relative to the center-of-mass velocity. They are driven by
N − 2 effective effective chemical potentials ˜µα and the electrochemical potential ϕ. To
transform these fluxes into the resting frame, one additional equation (constraint) needs to
be considered to find the convective velocity. We assume incompressibility and determine
the convection velocity by eq. (SI-6). In non-neutral systems the Poisson equation can be
used to relate the potential to the concentration distribution. This is not necessary in neutral
systems where the assumption of electroneutrality implies % = 0, reducing the number of
independent concentrations by one. Then, the potential can be calculated with eq. (SI-22)
or eq. (SI-14b).
Most flux expressions derived above will be used in mass-balance equations where con-
centrations are used as primary variables. It is therefore desirable to express all fluxes with
concentration gradients instead of chemical potential gradients. Expanding the following
S8
Reproduced with permission from reference [175], Copyright (2020) American Chemical Society.
182
expression
N∑
β=2
Γαβ∇µβ =N∑
β=2
N∑
γ=2
Γαβ∂µβ∂cγ∇cγ
yields
Dαβ =N∑
γ=2
Γαγ∂µγ∂cβ
, D = ΓJµ, (SI-23a)
Dαβ =N∑
γ=2
Γαγ∂µγ∂cβ
. D = ΓJµ, (SI-23b)
Here, the diffusion matrix is expressed element wise in sum notation on the left and in matrix
notation on the right. Jµ is the Jacobi matrix of µα with respect to cα (α = 2, . . . , N). With
this, the particle flux expressions become
Nα = −N∑
β=2
Dαβ∇cα −tακ
zαF∇φE, (SI-24a)
Nα = −N∑
β=2
Dαβ∇cα +tαJzαF
, (SI-24b)
for all α ≥ 2. Both D and D are N − 1×N − 1 matrices. In addition, the effective shifted
diffusion matrix is introduced which is a N − 2×N − 2 matrix because ˜µα is only defined
for α ≥ 3
˜Dαβ =N∑
γ=3
Γαγ∂ ˜µγ∂cβ
. ˜D = ΓJ ˜µ. (SI-25)
SI-2. LINEARISATION
Any perturbation applied to the system is small and the deviation from the equilibrium
state is denoted as
δcα(x, t) = cα(t, x)− cα,0, (SI-26a)
δφE(t, x) = φE(t, x)− φE,0. (SI-26b)
S9
Reproduced with permission from reference [175], Copyright (2020) American Chemical Society.
183
Here, the reference concentration and potential in the electrolyte are constant in space and
time. Next, we linearise the flux expression relative to the center-of-mass velocity. To this
aim the perturbation variables are inserted into the flux expression given by eq. (SI-24a).
Then all parameters with a concentration dependence (Dαβ, tα, and κ) are approximated
with a first order series expansion in cα
Nα = −N∑
β=2
Dαβ∇cβ +tακ
zαF∇φE
= −N∑
β=2
Dαβ∇δcβ +tακ
zαF∇δφE
= −N∑
β=2
Dαβ,lin∇δcβ +tα,linκlin
zαF∇δφE +O
(δ2). (SI-27)
Here, δ2 comprises all quadratic combinations of perturbation variables (δc1, δc1δc2, δc22,
etc.) and the first order approximation of the quantity ξ is given by
ξlin = ξ (c1,0, . . . , cN,0)︸ ︷︷ ︸ξ0
+N∑
β=1
∂ξ
∂cβ
∣∣∣∣cα=cα,0
· δcβ +O(δ2). (SI-28)
In the first order approximation of eq. (SI-27) all terms of higher order in the deviation
variables can be omitted. Only first order terms in perturbation variables remain
Nα,lin = −N∑
β=2
Dαβ,0∇δcβ +tα,0κ0
zαF∇δφE. (SI-29)
It can be seen that concentration dependence of the transport parameters disappears in the
linearised flux expression. Furthermore, all former variables are now replaced with their
corresponding perturbation variable. The linearised flux expression consists of first order
terms in deviation variables only. Naturally, there is no zero order term because the reference
state is in equilibrium. Next, the expression for the convection velocity (derived from the
S10
Reproduced with permission from reference [175], Copyright (2020) American Chemical Society.
184
assumption of incompressibility see eq. (SI-6)) is linearised as well
∇v = −N∑
α=2
να∇Nα
= −N∑
α=2
να,lin∇Nα,lin +O(δ2)
=⇒ (∇v)lin = −N∑
α=2
να,0∇Nα,lin. (SI-30)
Note that the production term s is omitted because only interface reactions are considered.
The concentration dependence of να is omitted because Nα,lin has no zero-order terms as
ascertained above (flux free reference state). Integration then yields the first order approxi-
mation of the convection velocity
vlin = −N∑
α=2
να,0 (Nα,lin − Nα,lin (xI)) + v (xI) ,
= −N∑
α=2
να,0Nα,lin + voff (SI-31)
where xI is the location of an interface and v (xI) is the center-of-mass velocity caused by
reactions (particle sources) at the interface. The offset velocity voff =∑N
α=2 να,0Nα,lin (xI) +
v (xI) comprises all terms in the flux expression that can be attributed to the interface
reaction. These contributions are constant in space such that ∇ · voff = 0. Using the
linearised expression for v and Nα the linearised fluxes in the resting frame become
N∗α,lin = Nα,lin + cα,0vlin
=N∑
β=2
(δαβ − cα,0νβ,0)Nβ,lin + cα,0voff , (SI-32)
where δαβ is the Kronecker delta. This linear relation between the fluxes relative to the
center-of-mass velocity and the fluxes in the resting frame can be written in matrix form.
S11
Reproduced with permission from reference [175], Copyright (2020) American Chemical Society.
185
To this aim, we condense concentrations and fluxes into vectors
N∗2,lin...
N∗N,lin
=
I −
c2,0ν2,0 . . . c2,0νN,0
... . . . ...
cN,0ν2,0 . . . cN,0νN,0
︸ ︷︷ ︸C
N2,lin
...
NN,lin
+ ~c0voff . (SI-33)
Here, I is the identity matrix. Vector quantities ~ξ contain the elements ξ2, . . . , ξN . Below,
C is referred to as the convection-correction matrix. It can be written as
C = I − ~c0~ν T0 , (SI-34)
where the ~c0 and ~ν0 are vectors with the entries cα,0 and να,0, α = 2, . . . , N . We use
Sylvester’s determinant theorem to calculate the determinant of this matrix (first step)
detC = 1− ~ν T0 ~c0 = 1−N∑
α=2
cα,0να,0
= 1−N∑
α=2
cα,0
(να,0 −
Mα
M1
ν1,0
)
=1
M1
[M1c1,0ν1,0 +
N∑
α=2
Mαcα,0ν1,0
]
=ν1,0
M1
ρ0 =ρ0
ρ1,0
. (SI-35)
We use the definition of να in the second line and ρ =∑N
α=1Mαcα in the third line. It can
be seen that the determinant can be reduced to the ratio of two densities. This means that
the determinant is nonzero and that C can be inverted. Here ρ0 is the mass density of the
mixture in the reference state. In contrast, ρ1,0 is the extrapolated density of species 1. This
quantity must be calculated from the partial molar volume of this species in the reference
state ρ1,0 = M1
ν1,0.
Using the the matrix form of the fluxes relative to the center-of-mass velocity and trans-
S12
Reproduced with permission from reference [175], Copyright (2020) American Chemical Society.
186
forming them into the resting frame with eq. (SI-33) results in
~N∗ = CD∇~δc+ C ~T κF∇δφE + ~c0voff ,
= D∗∇~δc+ ~T ∗κ
F∇δφE + ~c0voff , (SI-36)
where ~Tα = tαzα
and ~T ∗α = t∗αzα
(α = 2, . . . , N). It can be seen that the flux expression in the
resting frame has the exact same form as the one for fluxes relative to the center-of-mass
velocity. These expressions only differ in the “offset flux” voff and the fact that a modified set
of transport parameters are used. Note that only the entries of the diffusion matrix and the
transference numbers need to be transformed whereas the conductivity remains the same in
both frames
D∗ = CD, (SI-37a)
~T ∗ = C ~T . (SI-37b)
If all species α ≥ 2 have non zero zα, eq. (SI-37b) can be rewritten to relate the transference
numbers in both frames directly
~t∗ =
z2 0
. . .
0 zN
C
z−12 0
. . .
0 z−1N
~t (SI-38)
These equations relate the transport parameters which describe fluxes relative to the center-
of-mass velocity with the ones used in the resting frame flux expression. They can be
inverted because C has a non-zero determinant. Note that this set of resting frame transport
parameters is a result of the first order approximation around a reference state which is in
thermodynamic equilibrium. Therefore, these parameters can only be used in this very
context. They can not be used to write down the fluxes in the resting frame if this condition
is not met.
S13
Reproduced with permission from reference [175], Copyright (2020) American Chemical Society.
187
SI-3. BINARY ELECTROLYTE
The binary electrolyte consists of a charge neutral solvent species (labelled N) as well as
cations M and anions A (labelled + and −). Considering section SI-1, the former numeric
labels are now assigned as 1 → N , 2 → +, and 3 → −. Cations and anions are added to
the solution by adding a salt which is fully dissociated in the solvent
Mn+An− −→ n+Mz+ + n−Az− . (SI-39)
The stoichiometric coefficients and the charge numbers satisfy
n+z+ + n−z− = 0. (SI-40)
With the framework derived in section SI-1 the solvent species is eliminated by describing
the fluxes relative to the center-of-mass velocity. Also, because the solvent species is neutral,
the effective charge numbers equal the original ones zα = zα, see eq. (SI-4a).
In the flux expressions derived in section SI-1, all transport parameters appear together
with entries of the mobility matrix Γ. However, the entries of the mobility matrix are
directly related to the common, more accessible parameters with eqs. (SI-13a) and (SI-13b).
In the case of a binary electrolyte, these equations read
κ = F 2(z2
+Γ++ + 2z+z−Γ+− + z2−Γ−−
), (SI-41a)
t+κ = F 2(z2
+Γ++ + z+z−Γ+−). (SI-41b)
One goal of this section is to invert these relations to express the Onsager matrix Γ as
a function of common transport parameters. To this aim, a third equation is needed to
link the final common transport parameter to the mobility coefficients. The parameter in
question is the salt diffusion coefficient Dsalt. This parameter describes a collective diffusive
motion of cations and anions on “large” scales. On these scales both ionic species cannot
diffuse independently as this would cause charge separation. Therefore, salt diffusion is a
charge-neutral process and electroneutrality is assumed to derive this final equation. This
implies that the charge density % = F (z+c+ + z−c−) is zero which directly relates both ionic
S14
Reproduced with permission from reference [175], Copyright (2020) American Chemical Society.
188
concentrations and their gradients, motivating the introduction of the salt concentration
csalt =c+
n+
=c−n−
. (SI-42)
To find the missing equation, we need to express the gradient of the “effective-effective”-
chemical potential ˜µ−. With eq. (SI-40) as well as the definition of ˜µ−, eq. (SI-19) it follows
that
˜µ− = µ− −z−z+
µ+ = µ− +n+
n−µ+, (SI-43)
which is true because zα = zα. This motivates the introduction of µsalt, the effective chemical
potential of the salt
µsalt =n− ˜µ−n+ + n−
=n+µ+ + n−µ−n+ + n−
=n+µ+ + n−µ−n+ + n−︸ ︷︷ ︸
µsalt
−n+M+ + n−M−(n+ + n−)MN
µN. (SI-44)
Note that µsalt contains weighted contributions from the solvent chemical potential. These
originate from the description relative to the center-of-mass velocity. It must not be confused
with µsalt which only takes potential contributions of the ionic species into account. We use
the Gibbs-Duhem relation to express the chemical potential of the solvent
∑
α=N,±cαdµα =
S
VdT + dP. (SI-45)
Here, S is entropy and V is the volume of the system. dT and dP are temperature and
pressure change which are zero because we assume constant temperature and pressure. This
results in
cNdµN = − (c+dµ+ + c−dµ−) = −csalt (n+dµ+ + n−dµ−)
= −csalt (n+ + n−) dµsalt. (SI-46)
S15
Reproduced with permission from reference [175], Copyright (2020) American Chemical Society.
189
Considering this in the differential version of eq. (SI-44) gives
dµsalt
dcsalt
=cNMN + c+M+ + c−M−
cNMN
dµsalt
dcsalt
=ρ
ρN
dµsalt
dcsalt
. (SI-47)
The factor ρρN
is larger than one and becomes one if the weight percentage of the salt is
small, which corresponds to the dilute limit.
A. Chemical Potentials
Generally, each chemical potential is a function of temperature, pressure, and the three
concentrations µα = µα(T, P, cN, c+, c−). Both, temperature and pressure are assumed to be
constant in this work. This leaves three concentrations, two of which are independent due
to the volume constraint eq. (SI-5). Electroneutrality is another constraint in experiments
because non-neutral solutions cannot be created. Therefore, one can only measure how the
chemical potentials depend on the salt concentration. Electroneutrality is a good approx-
imation within the bulk solution. However, the theory developed here also describes the
electrolyte near interfaces where charged double-layers violate charge neutrality. For this
reason, the following concentration dependence of the chemical potentials is assumed
µ± = RT ln
(f±c±c±,0
). (SI-48)
Here, fα is the activity coefficient of the species α which depends on cα only. The experi-
mentally available activity coefficient of the salt mixture is linked to the activity coefficient
of each ionic species
fn++n−salt = f
n+
+ fn−− . (SI-49)
This is consistent with the definition of µsalt in eq. (SI-44). The thermodynamic factor of
the salt is defined as Fsalt = 1 + d ln fsaltd ln csalt
and is linked to the thermodynamic factor of the
individual ions. We use the definition of µsalt and fsalt in eqs. (SI-44) and (SI-49) which
S16
Reproduced with permission from reference [175], Copyright (2020) American Chemical Society.
190
results in
Fsalt =n+F+ + n−F−
n+ + n−. (SI-50)
Next, the dimensionless parameter 0 < γ < 1 is introduced. It describes an asymmetry in
the contribution of the individual ions to the thermodynamic factor of the salt
F+ = γ · n+ + n−n+
Fsalt, (SI-51a)
F− = (1− γ) · n+ + n−n−
Fsalt. (SI-51b)
Considering the definition of csalt and µα, see eqs. (SI-42) and (SI-48), as well of the simple
concentration dependence of fα then results in
∂µ+
∂c+
= γ · n+ + n−n2
+
dµsalt
dcsalt
, (SI-52a)
∂µ−∂c−
= (1− γ) · n+ + n−n2−
dµsalt
dcsalt
. (SI-52b)
Next, we calculate the Jacobi matrix of the effective potentials µα. This quantity is
needed to find the diffusion matrix D which is used in eqs. (SI-24a) and (SI-24b). Again,
the Gibbs-Duhem relation at constant temperature and pressure is used to express partial
derivatives of µN, see eq. (SI-46). We then obtain the Jacobi matrix of µα with respect to
cα
Jµ =
(1 + ρ+
ρN
)∂µ+∂c+
M+c−ρN
∂µ−∂c−
M−c+ρN
∂µ+∂c+
(1 + ρ−
ρN
)∂µ−∂c−
. (SI-53)
We can rewrite this matrix if it is evaluated at an electroneutral configuration. Then, the
salt concentration csalt is well defined such that
Jµ =n+ + n−n+n−
dµsalt
dcsalt
γ(
1 + ρ+ρN
)n−n+
(1− γ) ρ+ρN
γ ρ−ρN
(1− γ)(
1 + ρ−ρN
)n+
n−
. (SI-54)
S17
Reproduced with permission from reference [175], Copyright (2020) American Chemical Society.
191
In this case, the determinant of this matrix becomes
detJµ = γ (1− γ) ·(n+ + n−n+n−
)2
·(dµsalt
dcsalt
)2ρ
ρN
= γ (1− γ) ·(n+ + n−n+n−
)2
· dµsalt
dcsalt
dµsalt
dcsalt
. (SI-55)
B. Salt Diffusion Coefficient
Equation (SI-18) is used to express the anion flux with the assumption of a neutral
concentration distribution
N− = −Γ−−∇ ˜µ− +t−Jz−F
= −Γ−−n+ + n−n−
∇µsalt +t−Jz−F
= −Γ−−n+ + n−n2−
dµsalt
dcsalt
∇c− +t−Jz−F
. (SI-56)
Comparison to the canonical flux expression reveals that the diffusion coefficient Dsalt is
equal to Γ−−n++n−n2−
dµsaltdcsalt
. Note that this parameter is only well defined for fluxes relative to
the center-of-mass velocity. With the definition of the shifted mobility coefficient Γ−− as
well as eq. (SI-41) the shifted mobility coefficient can be rewritten
Γ−− = Γ−− −t−z−
t−z−
κ
F 2=F 2
κ
( κ
F 2Γ−− − (z−Γ−− + z+Γ+−)2
)
=F 2
κ
((z2
+Γ++ + 2z+z−Γ+− + z2−Γ−−
)Γ−− − (z−Γ−− + z+Γ+−)2)
=z2
+F2
κ
(Γ++Γ−− − Γ2
+−)
=z2
+F2
κdet Γ. (SI-57)
Then, the equation which links the salt diffusion coefficient and the mobility coefficients Γαβ
becomes
Dsalt =z2
+F2
κ
n+ + n−n2−
dµsalt
dcsalt
det Γ
= −z+z−F 2
κ
n+ + n−n+n−
ρ
ρN
dµsalt
dcsalt
det Γ. (SI-58)
S18
Reproduced with permission from reference [175], Copyright (2020) American Chemical Society.
192
Here, the second transformation is done to show that the final expression for Dsalt is sym-
metric in n± and z±. With eqs. (SI-41) and (SI-58) there are three equations to couple
Dsalt, κ and t+ to the three mobility coefficients. Inverting these equations results in
Γαβ = Dsalt
∣∣∣∣z+z−zαzβ
∣∣∣∣n+n−n+ + n−
ρN
ρ
(dµsalt
dcsalt
)−1
+tαtβκ
zαzβF 2, (SI-59a)
Γαβ = Dsalt
∣∣∣∣z+z−zαzβ
∣∣∣∣n+n−n+ + n−
ρN
ρ
(dµsalt
dcsalt
)−1
. (SI-59b)
After calculating the the mobility matrix we can express the diffusion matrix D = ΓJµ with
the Jacobi matrix given by eq. (SI-55) .
C. Flux Expressions
Transcribing the flux expressions derived in section SI-1 to the binary electrolyte is
straight forward. The binary electrolyte has N = 3 species which are assigned as 1 → N,
2→ +, and 3→ −. Then, eqs. (SI-18), (SI-22) and (SI-24a) become
Nα = −∑
β=±Dαβ∇cβ −
tακ
zαF∇φE, α = ± (SI-60a)
N− = −Γ−−∇ ˜µ− +t−Jz−F
, (SI-60b)
J = − κF
t−z−∇ ˜µ− − κ∇ϕ, (SI-60c)
where the effective electrochemical potential is defined as
ϕ = φE +µ+
z+F. (SI-61)
Next, eqs. (SI-60b) and (SI-60c) are rewritten with the assumption of electroneutrality, i.e.
z+c+ +z−c− = 0. The chemical potentials defined in section SI-3A are used to express ∇ ˜µ−.
S19
Reproduced with permission from reference [175], Copyright (2020) American Chemical Society.
193
This results in
N− = −Dsalt∇c− +t−Jz−F
, (SI-62a)
J =κ
F
t−z+
n+ + n−n+n−︸ ︷︷ ︸N
dµsalt
dcsalt
∇c− − κ∇ϕ. (SI-62b)
D. Linearisation
Applying the linearisation to the binary electrolyte is straight forward. The convection
correction matrix reads
C =
1− c+,0ν+ −c+,0ν−
−c−,0ν+ 1− c−,0ν−
, (SI-63)
so that the convection corrected transport coefficients become
D∗salt =ρ0
ρN,0
Dsalt, (SI-64a)
D∗ = CD (SI-64b)
t∗+ = (1− c+,0ν+,0) t+ + c−,0ν−,0t−, (SI-64c)
t∗− = c+,0ν+,0t+ + (1− c−,0ν−,0) t−. (SI-64d)
To obtain the salt diffusion coefficient in the resting frame, we replace Γ with Γ∗ = CΓ
in eq. (SI-58). Considering that detCΓ = detC · det Γ then gives the result above we use
eq. (SI-35). Note that the density of the complete solution ρ is an easily measured quantity
which is not true for ρN. As described in section SI-2, this quantity does not equal the
density of the pure solvent and must be calculated with νN, partial molar volume of the
solvent. Note that the convection corrected transference numbers satisfy t∗+ + t∗− = 1.
The flux boundary condition is derived in section SI-1B, see eq. (SI-10). Its linearised
S20
Reproduced with permission from reference [175], Copyright (2020) American Chemical Society.
194
form for the binary electrolyte reads
N∗α,lin (xI) = Nα,lin +cα,0c+,0
ρ+,0
ρ0
j∗Iz+F
=
j∗Iz+F
α = +,
0 α = −.(SI-65)
The only difference is that concentrations and densities are replaced with the constant values
which define the reference state (cα,0, and ρ+,0).
SI-4. IMPEDANCE: ELECTRONEUTRAL SYSTEM WITH SEI
We use eq. (30) to determine the three coefficients C, C+, and C−. This calculation is
performed with analytical tools resulting in
C =ε
τkeikL
′((
e2ikL′ + e2ikL) (t− − t−
)− 2keik(L′+L)
(t− −
ρ+
ρ
)), (SI-66a)
C+ =eikL′(e2ikL′ − 1
) ετk(t− − t−
)
− eikL(k − ε
τk + e2ikL
(k +
ε
τk))(
t− −ρ+
ρ
), (SI-66b)
C− =eikL′+L
(eikL
(e2ikL′ − 1
) ετk(t− − t−
)
− 2ei(k+k)L′(t− −
ρ+
ρ
)(k cos kL′ − i ε
τk sin kL′
)). (SI-66c)
SI-5. APPENDIX: GENERAL IMPEDANCE
A. Dispersion Relation
The relation between the “wave-numbers” kα and the frequency ω = 2πf is called dis-
persion relation. We now determine this relation by calculating the eigenvectors ~ηα and
eigenvalues λα of the matrix Aω = D∗−1 (T + iωI). For the binary system, these matrices
S21
Reproduced with permission from reference [175], Copyright (2020) American Chemical Society.
195
read
D∗−1 =1
detD∗
D∗++ D∗+−
D∗−+ D∗−−
, and (SI-67a)
T ∗ + iωI =1
E0ER
κt∗+ + iωE0ER −κt∗+n+/n−
−κt∗−n−/n+ κt∗− + iωE0ER
, (SI-67b)
where, detD∗ = D∗++D∗−− − D∗+−D
∗−+. Determining ~ηα and λα is a lengthy calculation
which is performed with computational tools (Mathematica). We scale the eigenvectors of
A so that their second entry equals 1, i.e., ~ηα = (ηα, 1)T. Both, the eigenvalues and the
eigenvectors are large expressions. However, they satisfy the following relations
Ak = λ1 · λ2 =iω (iωE0ER + κ)
E0ER detD∗, (SI-68a)
Bk = λ1 + λ2
=
(D∗++ +D∗−−
)iωE0ERn+n−+
κ(D∗++t
∗−n+n− +D∗+−t
∗−n
2− +D∗−+t
∗+n
2+ +D∗−−t
∗+n+n−
)
E0ERn+n− detD∗
=
(D∗++ +D∗−−
)iωE0ER + κD∗salt
E0ER detD∗, (SI-68b)
and
Aη = η1 · η2 = −(iωE0ER + κt−)D∗+−n+n− + κt+D∗−−n
2+
(iωE0ER + κt+)D∗−+n+n− + κt−D∗++n2−, (SI-69a)
Bη = η1 + η2
=
(D∗++ −D∗−−
)iωE0ERn+n−+
κ(D∗++t
∗−n+n− −D∗+−t∗−n2
− +D∗−+t∗+n
2+ −D∗−−t∗+n+n−
)
(iωE0ER + κt∗+)D∗−+n+n− − κD∗++t∗−n
2−
. (SI-69b)
Using these quantities k1,2 and η1,2 can be expressed as such
k1,2 =
√
−Bk
2±√B2k
4− Ak, (SI-70a)
η1,2 =Bη
2±√B2η
4− Aη. (SI-70b)
S22
Reproduced with permission from reference [175], Copyright (2020) American Chemical Society.
196
These expressions are used to calculate kα and ηα. Note that they cannot be used to match
the eigenvalues to their corresponding eigenvectors correctly because the sign of the square
root cannot be assigned without ambiguity. This also applies to eq. (SI-70a) where the outer
square-root only determines kα with respect to the sign. Below, this sign is chosen such that
imag kα is negative.
B. Double-Layer Thickness and Interface Capacity
An essential result of the non-neutral model is the so called dispersion relation given
by eq. (SI-70a). This expression describes two characteristic length scales of first order
perturbations at a given frequency. We discuss these length scales in the low frequency or
stationary limit in section 3.2.2. In this limit, one length scale diverges whereas the other
one attains a constant value. It is given by
λDL = limω→0
ik1−1 = i
√−Bk(ω = 0)−1 =
√Bk(ω = 0)−1 =
√E0ER
κ
detD∗
D∗salt
=
√−E0ERRT
z+z−F 2· NFsalt
csalt
· γ (1− γ). (SI-71)
In the last step, we use D∗ = CΓJµ and D∗salt = detCDsalt. Furthermore, we use eq. (SI-58)
to relate det Γ with Dsalt as well as eq. (SI-55) to express the determinant of the Jacobi
matrix. λDL characterizes the spatial extend of charged interface layers. Its dependence on
γ and the anion valence z− is illustrated in fig. SI-1 . It is a physical property that affects
measurable quantities such as the double-layer capacity CDL. We find the charge stored
within the diffuse layer by integrating the charge density. For the interface at x = L we
approximate this quantity with
QDL = λDF (η1,Hz+ + z−)C+H , (SI-72)
by considering λDL L. At the same time, the potential drop across the diffuse layer is
well approximated by
ΦDL = FΠ1C+H = F
z+η1 + z−E0ER
λ2DLC
+H , (SI-73)
S23
Reproduced with permission from reference [175], Copyright (2020) American Chemical Society.
197
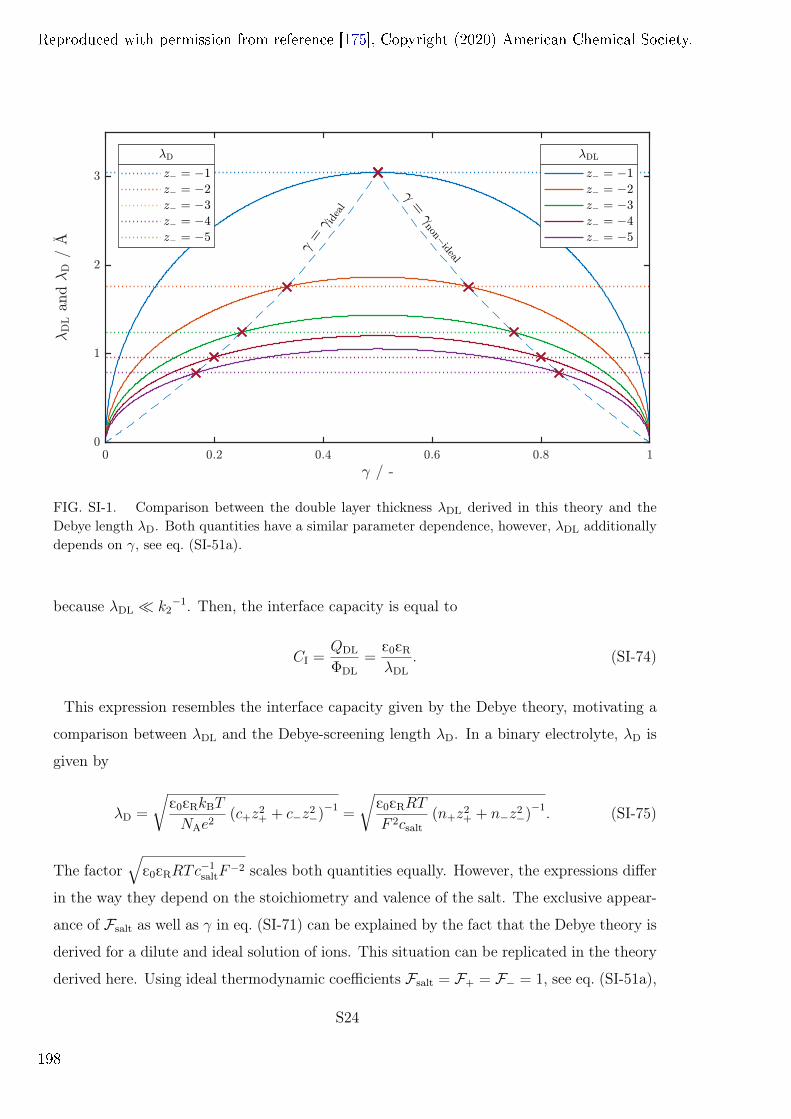
FIG. SI-1. Comparison between the double layer thickness λDL derived in this theory and theDebye length λD. Both quantities have a similar parameter dependence, however, λDL additionallydepends on γ, see eq. (SI-51a).
because λDL k2−1. Then, the interface capacity is equal to
CI =QDL
ΦDL
=E0ER
λDL
. (SI-74)
This expression resembles the interface capacity given by the Debye theory, motivating a
comparison between λDL and the Debye-screening length λD. In a binary electrolyte, λD is
given by
λD =
√E0ERkBT
NAe2(c+z2
+ + c−z2−)−1
=
√E0ERRT
F 2csalt
(n+z2+ + n−z2
−)−1. (SI-75)
The factor√
E0ERRTc−1saltF
−2 scales both quantities equally. However, the expressions differ
in the way they depend on the stoichiometry and valence of the salt. The exclusive appear-
ance of Fsalt as well as γ in eq. (SI-71) can be explained by the fact that the Debye theory is
derived for a dilute and ideal solution of ions. This situation can be replicated in the theory
derived here. Using ideal thermodynamic coefficients Fsalt = F+ = F− = 1, see eq. (SI-51a),
S24
Reproduced with permission from reference [175], Copyright (2020) American Chemical Society.
198
results in an expression for γ
γideal =n+
n+ + n−. (SI-76)
Both, λDL and λD align if this value is chosen for γ and Fsalt is equal to 1. This is also true
if γ = γnon−ideal = n−n++n−
although this no longer corresponds an ideal situation. This is
illustrated in fig. SI-1.
To conclude, in terms of charged interface layers this theory aligns with the Debye-Hückel
theory if ideal behaviour of all ionic species is assumed. This is surprising because the Debye-
length is obtained by solving the (linearised) Poisson-Boltzmann equation. Therefore, the
Boltzmann distribution is an essential part of the conventional derivation. In contrast, the
derivation of λDL is solely based on a set of thermodynamic consistent flux expressions,
chemical potentials and the Poisson equation. The Boltzmann distribution is not used
directly. However, an equivalent expression can be identified within the derivation. Note
that λDL is derived for in the stationary limit of a flux free reference state. This implies
∇µelα = ∇ (µα + zαFφE) = 0, (SI-77)
if we consider the original flux expressions given by eq. (SI-11) Neglecting the solvent such
that µα = µα = ln(fαcαc
−1α,0
)then results in a link between the concentrations cα and the
potential φE
ln (fαcα) ∝ − zαFφE
RT, or fαcα ∝ e−
zαFφERT . (SI-78)
The right hand side is equivalent to the Boltzmann distribution. In the Debye-Hückel
theory, the exponential in this expression is linearised and the potential is expressed with
the Poisson equation. This results in a second order differential equation where λD emerges
as a characteristic length. In this theory, linearisation is applied to the logarithm in the
equivalent expression on the left hand side. Both theories use the Poisson equation to
eliminate the electric field and are therefore equivalent for ideal systems.
S25
Reproduced with permission from reference [175], Copyright (2020) American Chemical Society.
199
C. Non-Neutral System without SEI
The matrix equation eq. (64) defines the coefficient vector ~C = (C1, C2,Φ′)T with respect
to its amplitude. The solution below is calculated with computational tools (Mathematica)
C1 =− i∂µ+
∂c+
η2 sin k2L
(t− −
ρ+
ρ
)+ cos k2LF
2Rz+ (t+z−Ω−2 − t−z+Ω+2) , (SI-79a)
C2 =F 2z+
(−iΠ1 sin k1L
(t− −
ρ+
ρ
)+ cos k1LR (t−z+Ω+1 − t+z−Ω−1)
), (SI-79b)
Φ′ =− 2i cos k2LF2Π1 sin k1Lz+
(z−Ω−2
(ρ+
ρ− 1
)+ z+Ω+2
ρ+
ρ
)
+ 2i cos k2LF2 det ΩRz−z2
+
+ 2i∂µ+
∂c+
η1 sin k2L
(z−Ω−1
(1− ρ+
ρ
)− z+Ω+1
ρ+
ρ
). (SI-79c)
Note that the amplitude of the coefficient vector is not determined. However, this amplitude
cancels out when calculating the impedance Z. We obtain the follwing expression when we
calculate the impdance with eq. (1)
Z =AB , (SI-80)
where A and B are equal to
A =L
(cos k2LF
2Π1 sin k1Lz+(Ω−2(−ρ+ ρ+)z− + Ω+2ρ+z+)
+ cos k1L(i cos k2LF2(Ω−1Ω+2 − Ω−2Ω+1)ρRz−z2
+
+∂µ+
∂c+
η2 sin k2L(Ω−1(−ρ+ ρ+)z− + Ω+1ρ+z+))
)
+ κ
(i∂µ+
∂c+
η2Π1 sin k2L sin k1L(ρt− − ρ+)
+ F 2z+
(cos k2LΠ1ρR sin k1L(−Ω−2t+z− + Ω+2t−z+)
+ Π2 sin k2L(iΠ1 sin k1L(ρt− − ρ+) + cos k1LρR(Ω−1t+z− − Ω+1t−z+))),
(SI-81)
S26
Reproduced with permission from reference [175], Copyright (2020) American Chemical Society.
200
B =E0ERiω
(cos k2LF
2Π1 sin k1Lz+(Ω−2(−ρ+ ρ+)z− + Ω+2ρ+z+)
+ cos k1L(i cos k2LF2(Ω−1Ω+2 − Ω−2Ω+1)ρRz−z2
+
+∂µ+
∂c+
η2 sin k2L(Ω−1(−ρ+ ρ+)z− + Ω+1ρ+z+))
)
+ κ
[cos k2LF
2Π1 sin k1Lz+
(iE0ERiωk2Π2(ρt− − ρ+)− Ω−2ρt+z− + Ω+2ρt−z+
)
+ cos k1L
(∂µ+
∂c+
η2 sin k2L(iE0ERiωk1Π1(ρt− − ρ+)− Ω−1ρt+z− + Ω+1ρt−z+)
+ cos k2LE0ERF2iωρRz+(k1Π1(−Ω−2t+z− + Ω+2t−z+) + k2Π2(Ω−1t+z− − Ω+1t−z+))
)].
(SI-82)
D. Non-Neutral System with SEI
Below, we state the matrix S for the non-neutral system with SEI. This is a 8x9 matrix
where the first six lines correspond to the six continuity constraints at x = L′ listed in the
main document. These equations are ordered from top to bottom c+, c−, Φ, ∂xΦ, N+, and,
N−. They are followed by the constraint for the flux boundary conditions for N+ and N− at
x = L.
S27
Reproduced with permission from reference [175], Copyright (2020) American Chemical Society.
201
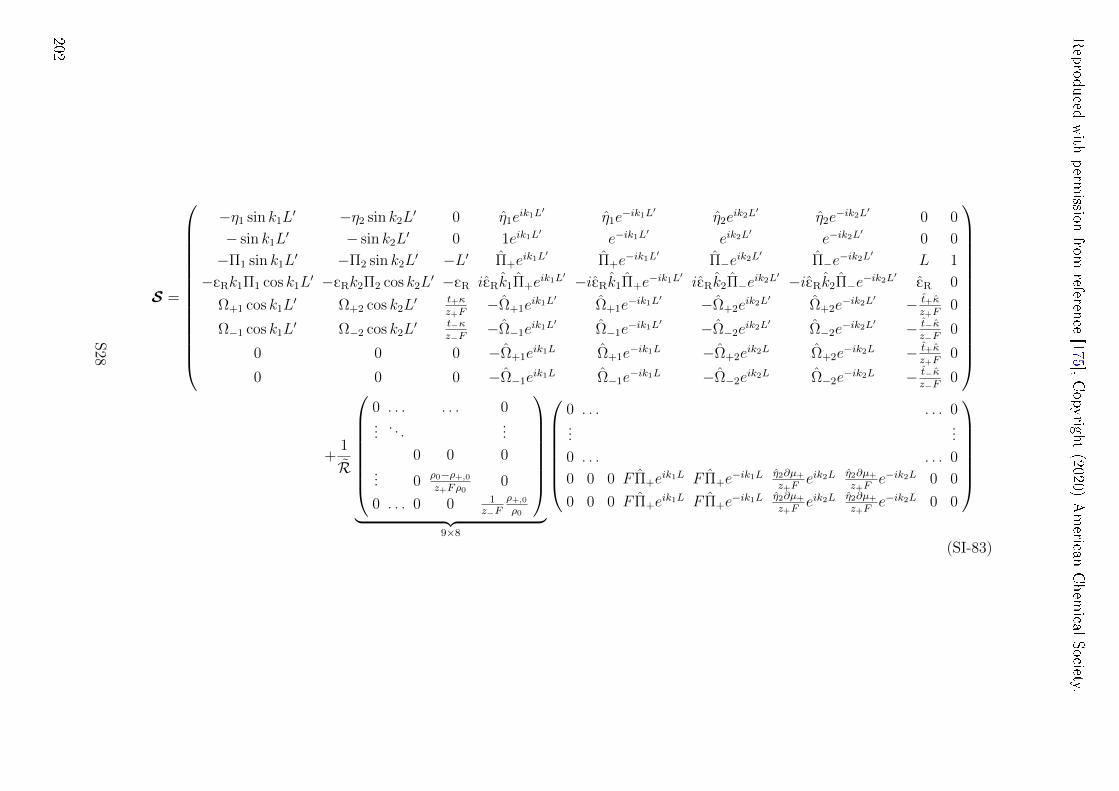
S =
−η1 sin k1L′ −η2 sin k2L
′ 0 η1eik1L′ η1e
−ik1L′ η2eik2L′ η2e
−ik2L′ 0 0
− sin k1L′ − sin k2L
′ 0 1eik1L′
e−ik1L′
eik2L′
e−ik2L′
0 0
−Π1 sin k1L′ −Π2 sin k2L
′ −L′ Π+eik1L′ Π+e
−ik1L′ Π−eik2L′
Π−e−ik2L′
L 1
−ERk1Π1 cos k1L′ −ERk2Π2 cos k2L
′ −ER iERk1Π+eik1L′ −iERk1Π+e
−ik1L′ iERk2Π−eik2L′ −iERk2Π−e−ik2L
′ER 0
Ω+1 cos k1L′ Ω+2 cos k2L
′ t+κz+F
−Ω+1eik1L′ Ω+1e
−ik1L′ −Ω+2eik2L′ Ω+2e
−ik2L′ − t+κz+F
0
Ω−1 cos k1L′ Ω−2 cos k2L
′ t−κz−F
−Ω−1eik1L′ Ω−1e
−ik1L′ −Ω−2eik2L′ Ω−2e
−ik2L′ − t−κz−F
0
0 0 0 −Ω+1eik1L Ω+1e
−ik1L −Ω+2eik2L Ω+2e
−ik2L − t+κz+F
0
0 0 0 −Ω−1eik1L Ω−1e
−ik1L −Ω−2eik2L Ω−2e
−ik2L − t−κz−F
0
+1
R
0 . . . . . . 0... . . . ...
0 0 0... 0 ρ0−ρ+,0
z+Fρ00
0 . . . 0 0 1z−F
ρ+,0ρ0
︸ ︷︷ ︸9×8
0 . . . . . . 0...
...0 . . . . . . 0
0 0 0 F Π+eik1L F Π+e
−ik1L η2∂µ+z+F
eik2L η2∂µ+z+F
e−ik2L 0 0
0 0 0 F Π+eik1L F Π+e
−ik1L η2∂µ+z+F
eik2L η2∂µ+z+F
e−ik2L 0 0
(SI-83)
S28
Reproduced
with
permission
fromreference
[175],Copyright
(2020)American
Chem
icalSociety.
202
SI-6. INTERCALATION ELECTRODES
In this section we briefly discuss the impedance response of an intercalation electrode.
The electrode material has an equilibrium potential U(cS) which depends on the degree of
lithiation, i.e., the solid concentration cS. We consider this in the linearised overpotential
eq. (11). Here only the first order term is used to approximate the change of the electrode
potential as the solid concentration at the electrode surface changes. We introduce
∂U =∂U
∂cS
∣∣∣∣cS=cS,0
=1
cS,max
∂U
∂SoC
∣∣∣∣SoC=SoC0
, (SI-84)
to express the linearised reaction rate as follows
jIR = δφS − δϕbulk
︸ ︷︷ ︸ηH
−∂UδcS. (SI-85)
Here, ηH contains all contributions to the overpotential that are considered in the main
document.
We consider a planar electrode with thickness LS. A similar calculation is performed by
Meyers et al.5 for spherical electrode particles. We shift the coordinate system such that the
interface reaction takes place at x = LS and the electrode begins at x = 0. It is assumed
that the electronic conductivity of these particles is large such that all potential gradients in
the particles are zero. The absence of electric potential gradients also implies that diffusion
is the only relevant transport process for the solid species. We therefore use the linearised
flux expression to describe transport of the intercalated species
NS,lin = −DS,0∇δcS. (SI-86)
Here, DS,0 is the solid diffusion coefficient at the reference concentration cS,0. Using this
expression in a mass-balance equation results in an ODE for cS
∂tδcS = DS∆cS = DS∂δcS
∂x. (SI-87)
S29
Reproduced with permission from reference [175], Copyright (2020) American Chemical Society.
203
Again, we solve this equation is solved with an exponential ansatz
δcS = eiωteiqx. (SI-88)
Inserting the ansatz in eq. (SI-87) results in the dispersion relation
q = ± (1− i)√
ω
2DS
. (SI-89)
The solution of δcS is given by a linear combination of eq. (SI-88) with both solutions ±q.This linear combination must satisfy flux boundary conditions at x = 0 and x = LS. At
x = 0, the flux in the electrode must be zero because of the adjacent current collector. This
eliminates one coefficient and implies
δcS = eiωt · CS cos (qx) , (SI-90)
where CS is the remaining coefficient of the linear combination. This is the time dependent
solution of the lithium concentration in the electrode for the frequency ω. Using this solution
to express the flux at x = LS results in
NS(LS) = eiωt · CSDS,0q sin (qLS) . (SI-91)
This expression must equal the rate of the interface reaction given by eq. (SI-85) such that
CS =ηH
eiωt(∂U cos
(qLS
)+ z+FRDS,0 sin (qLS)
)−1. (SI-92)
This is then used with eq. (SI-91) to find the reaction rate jI
jI = z+FNS(LS) =ηH
R+ ∂Uz+FqDS,0
tan (qLS)−1 =ηH
R. (SI-93)
All contributions from the oscillating concentration at the electrode surface can be included
S30
Reproduced with permission from reference [175], Copyright (2020) American Chemical Society.
204
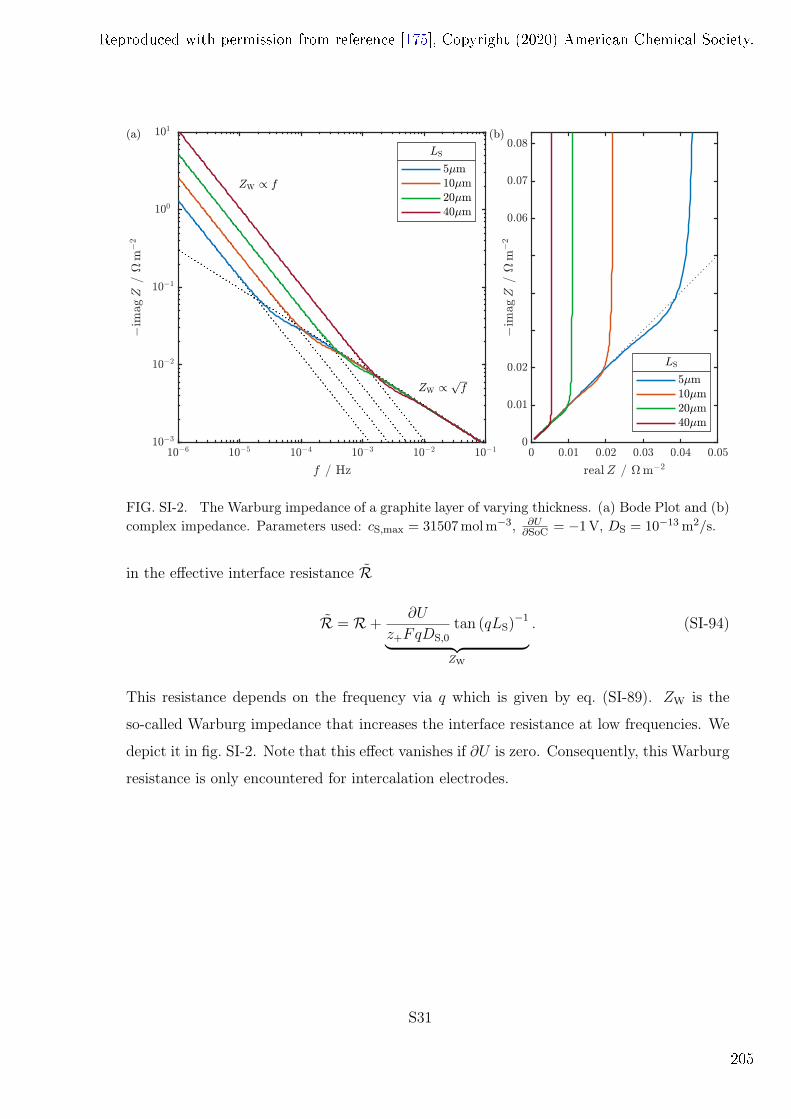
FIG. SI-2. The Warburg impedance of a graphite layer of varying thickness. (a) Bode Plot and (b)complex impedance. Parameters used: cS,max = 31507molm−3, ∂U
∂SoC = −1V, DS = 10−13 m2/s.
in the effective interface resistance R
R = R+∂U
z+FqDS,0
tan (qLS)−1
︸ ︷︷ ︸ZW
. (SI-94)
This resistance depends on the frequency via q which is given by eq. (SI-89). ZW is the
so-called Warburg impedance that increases the interface resistance at low frequencies. We
depict it in fig. SI-2. Note that this effect vanishes if ∂U is zero. Consequently, this Warburg
resistance is only encountered for intercalation electrodes.
S31
Reproduced with permission from reference [175], Copyright (2020) American Chemical Society.
205
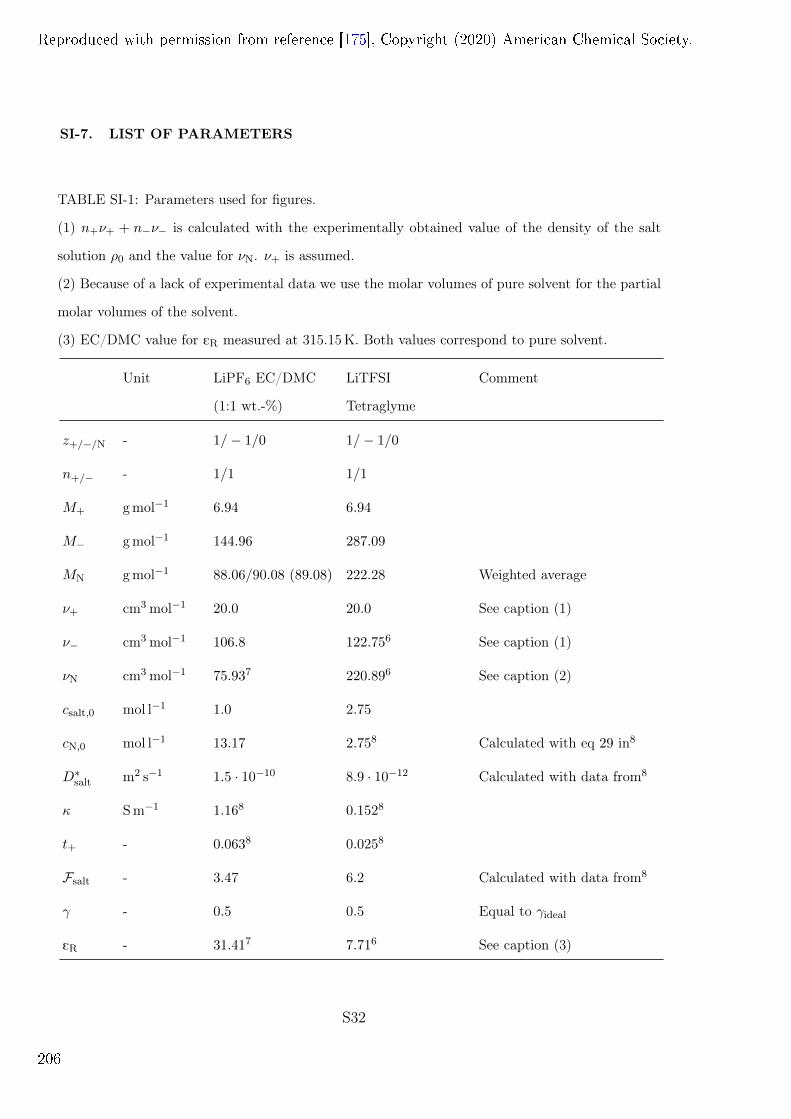
SI-7. LIST OF PARAMETERS
TABLE SI-1: Parameters used for figures.
(1) n+ν+ + n−ν− is calculated with the experimentally obtained value of the density of the salt
solution ρ0 and the value for νN. ν+ is assumed.
(2) Because of a lack of experimental data we use the molar volumes of pure solvent for the partial
molar volumes of the solvent.
(3) EC/DMC value for ER measured at 315.15K. Both values correspond to pure solvent.
Unit LiPF6 EC/DMC
(1:1 wt.-%)
LiTFSI
Tetraglyme
Comment
z+/−/N - 1/− 1/0 1/− 1/0
n+/− - 1/1 1/1
M+ gmol−1 6.94 6.94
M− gmol−1 144.96 287.09
MN gmol−1 88.06/90.08 (89.08) 222.28 Weighted average
ν+ cm3 mol−1 20.0 20.0 See caption (1)
ν− cm3 mol−1 106.8 122.756 See caption (1)
νN cm3 mol−1 75.937 220.896 See caption (2)
csalt,0 mol l−1 1.0 2.75
cN,0 mol l−1 13.17 2.758 Calculated with eq 29 in8
D∗salt m2 s−1 1.5 · 10−10 8.9 · 10−12 Calculated with data from8
κ Sm−1 1.168 0.1528
t+ - 0.0638 0.0258
Fsalt - 3.47 6.2 Calculated with data from8
γ - 0.5 0.5 Equal to γideal
ER - 31.417 7.716 See caption (3)
S32
Reproduced with permission from reference [175], Copyright (2020) American Chemical Society.
206
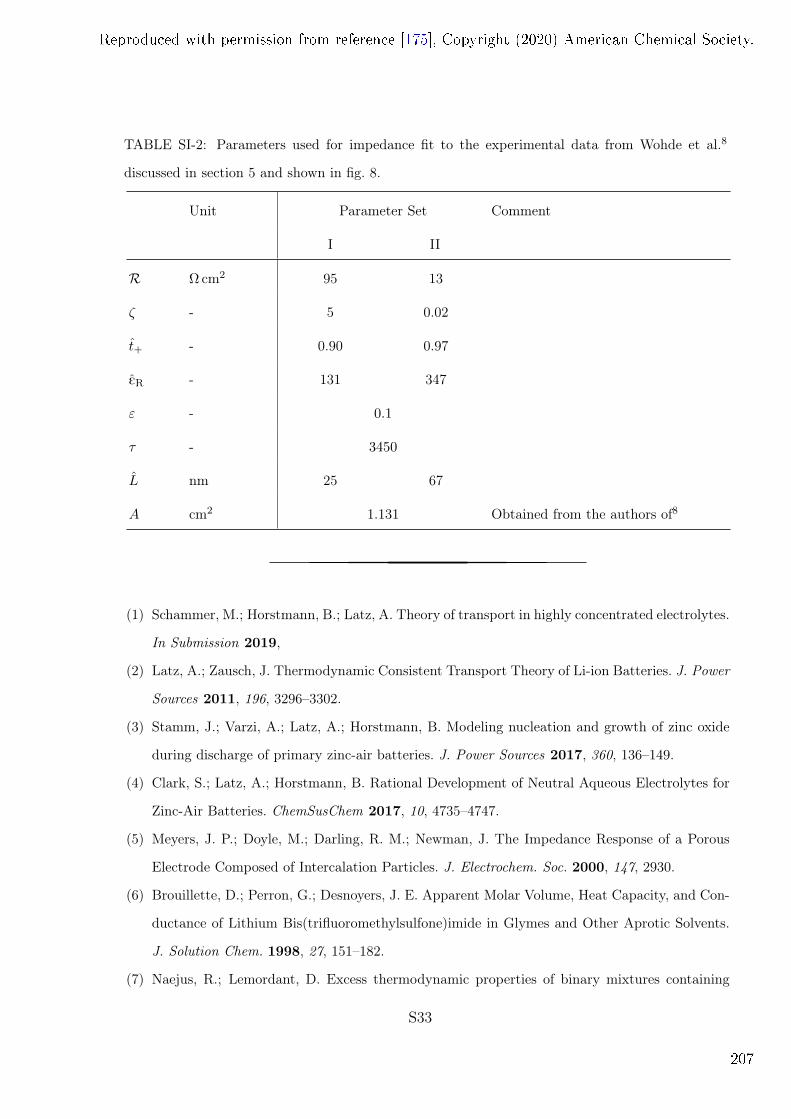
TABLE SI-2: Parameters used for impedance fit to the experimental data from Wohde et al.8
discussed in section 5 and shown in fig. 8.
Unit Parameter Set Comment
I II
R Ω cm2 95 13
ζ - 5 0.02
t+ - 0.90 0.97
ER - 131 347
ε - 0.1
τ - 3450
L nm 25 67
A cm2 1.131 Obtained from the authors of8
(1) Schammer, M.; Horstmann, B.; Latz, A. Theory of transport in highly concentrated electrolytes.
In Submission 2019,
(2) Latz, A.; Zausch, J. Thermodynamic Consistent Transport Theory of Li-ion Batteries. J. Power
Sources 2011, 196, 3296–3302.
(3) Stamm, J.; Varzi, A.; Latz, A.; Horstmann, B. Modeling nucleation and growth of zinc oxide
during discharge of primary zinc-air batteries. J. Power Sources 2017, 360, 136–149.
(4) Clark, S.; Latz, A.; Horstmann, B. Rational Development of Neutral Aqueous Electrolytes for
Zinc-Air Batteries. ChemSusChem 2017, 10, 4735–4747.
(5) Meyers, J. P.; Doyle, M.; Darling, R. M.; Newman, J. The Impedance Response of a Porous
Electrode Composed of Intercalation Particles. J. Electrochem. Soc. 2000, 147, 2930.
(6) Brouillette, D.; Perron, G.; Desnoyers, J. E. Apparent Molar Volume, Heat Capacity, and Con-
ductance of Lithium Bis(trifluoromethylsulfone)imide in Glymes and Other Aprotic Solvents.
J. Solution Chem. 1998, 27, 151–182.
(7) Naejus, R.; Lemordant, D. Excess thermodynamic properties of binary mixtures containing
S33
Reproduced with permission from reference [175], Copyright (2020) American Chemical Society.
207
linear or cyclic carbonates as solvents at the temperatures 298.15 K and 315.15 K. J. Chem.
Thermodyn. 1997, 29, 1503–1515.
(8) Wohde, F.; Balabajew, M.; Roling, B. Li Transference Numbers in Liquid Electrolytes Ob-
tained by Very-Low-Frequency Impedance Spectroscopy at Variable Electrode Distances. J.
Electrochem. Soc. 2016, 163, A714–A721.
S34
Reproduced with permission from reference [175], Copyright (2020) American Chemical Society.
208
Related Documents


