arXiv:cond-mat/0607654v1 [cond-mat.supr-con] 25 Jul 2006 Theoretical study of metal borides stability Aleksey N. Kolmogorov and Stefano Curtarolo Department of Mechanical Engineering and Materials Science, Duke University, Durham, NC 27708 (Dated: February 6, 2008) We have recently identified metal-sandwich (MS) crystal structures and shown with ab initio calculations that the MS lithium monoboride phases are favored over the known stoichiometric ones under hydrostatic pressure [Phys. Rev. B 73, 180501(R) (2006)]. According to previous studies synthesized lithium monoboride tends to be boron-deficient, however the mechanism leading to this phenomenon is not fully understood. We propose a simple model that explains the experimentally observed off-stoichiometry and show that compared to such boron-deficient phases the MS-LiB compounds still have lower formation enthalpy under high pressures. We also investigate stability of MS phases for a large class of metal borides. Our ab initio results suggest that MS noble metal borides are less unstable than the corresponding AlB2-type phases but not stable enough to form under equilibrium conditions. 1. INTRODUCTION The interest in the AlB 2 family of metal diborides re-emerged after the discovery of superconductivity in MgB 2 with a surprisingly high transition temperature of 39 K[1]. Boron p-states have been shown to be key for both stability and superconductivity in these compounds[2, 3, 4]. MgB 2 is a unique metal diboride because it has a significant density of boron pσ-states at the Fermi level which give rise to the high T c super- conductivity, and yet enough of them are filled for the compound to be structurally stable[2, 3, 4]. The effec- tively hole-doped noble- and alkali-metal diborides would have higher pσ density of states (DOS) at E F , but they have been demonstrated to be unstable under normal conditions[4]. The effort to achieve higher T c has thus primarily focused on doping magnesium diboride with various metals; however, doping this material has proven to be difficult[5] and no improvement on T c has yet been reported. According to a recent theoretical study of non- local screening effects in metals, MgB 2 may already be optimally doped[6]. Lithium borocarbide with a doubled AlB 2 unit cell has been suggested as a possible high-T c superconductor under hole-doping[7], but disorder in the heavily doped Li x BC appears to forbid superconductivity above 2K[8]. In this work we investigate whether there could be sta- ble high-T c superconducting metal borides in configu- rations beyond the standard AlB 2 prototype. We have recently proposed metal-sandwich (MS) structures MS1 and MS2, which also have sp 2 layers of boron but sepa- rated by two metal layers[9]. Despite their rather simple unit cells these structures have apparently never been considered before. As we demonstrate below, identifi- cation of the MS structures is not straightforward be- cause they represent a local minimum not usually ex- plored with current compound prediction strategies[9]. We reveal trends in the cohesion of MS phases by calcu- lating formation energies for a large class of metal borides and show that some monovalent-metal borides benefit from having additional layers of metal. The MS noble- metal borides still have positive formation energy, but they are less unstable than the AlB 2 -type phases. This result helps resolve the question of what phases would form first in the noble-metal boride systems under non- equilibrium conditions[10, 11, 12, 13]. Our main finding concerns the Li-B system, in which the MS lithium monoboride is stable enough to compete against the known stoichiometric phases. According to our previous ab initio calculations the MS lithium mono- boride is comparable in energy to these phases under nor- mal conditions, but it becomes the ground state at 50% concentration under moderate hydrostatic pressures[9]. Here we extend the analysis to non-stoichiometric Li-B phases which could potentially intervene in the synthe- sis of the MS phases. In particular, synthesized lithium monoboride with linear chains of boron is known to be boron-deficient for reasons not fully understood so far. We simulate the incommensurate LiB y phases (notation explained in Ref. [14]) by constructing a series of small periodic Li 2n B m structures and show that the minimum formation energy is achieved for y ≈ 0.9, in very good agreement with the experimentally observed values. Us- ing this simple model of the off-stoichiometry phases with linear chains of boron we demonstrate that relative to them MS-LiB still has lower formation enthalpy under high pressures. Simulations of other alkali-metal borides, MB y (M = Na, K, Rb, Cs), suggest that that these nearly stoichiometric phases might form under moderate pres- sures. The paper is divided in the sections describing: 2) sim- ulation details; 3) construction of the MS prototypes; 4) stability of MS phases for a large class of metal borides; 5) detailed investigation of the Li-B system; 6) simulations of other monovalent and higher-valent metal borides; 7) summary of the electronic and structural properties of the MS phases.

Welcome message from author
This document is posted to help you gain knowledge. Please leave a comment to let me know what you think about it! Share it to your friends and learn new things together.
Transcript
arX
iv:c
ond-
mat
/060
7654
v1 [
cond
-mat
.sup
r-co
n] 2
5 Ju
l 200
6
Theoretical study of metal borides stability
Aleksey N. Kolmogorov and Stefano CurtaroloDepartment of Mechanical Engineering and Materials Science, Duke University, Durham, NC 27708
(Dated: February 6, 2008)
We have recently identified metal-sandwich (MS) crystal structures and shown with ab initio
calculations that the MS lithium monoboride phases are favored over the known stoichiometric onesunder hydrostatic pressure [Phys. Rev. B 73, 180501(R) (2006)]. According to previous studiessynthesized lithium monoboride tends to be boron-deficient, however the mechanism leading to thisphenomenon is not fully understood. We propose a simple model that explains the experimentallyobserved off-stoichiometry and show that compared to such boron-deficient phases the MS-LiBcompounds still have lower formation enthalpy under high pressures. We also investigate stabilityof MS phases for a large class of metal borides. Our ab initio results suggest that MS noble metalborides are less unstable than the corresponding AlB2-type phases but not stable enough to formunder equilibrium conditions.
1. INTRODUCTION
The interest in the AlB2 family of metal diboridesre-emerged after the discovery of superconductivity inMgB2 with a surprisingly high transition temperatureof 39 K[1]. Boron p-states have been shown to bekey for both stability and superconductivity in thesecompounds[2, 3, 4]. MgB2 is a unique metal diboridebecause it has a significant density of boron pσ-statesat the Fermi level which give rise to the high Tc super-conductivity, and yet enough of them are filled for thecompound to be structurally stable[2, 3, 4]. The effec-tively hole-doped noble- and alkali-metal diborides wouldhave higher pσ density of states (DOS) at EF , but theyhave been demonstrated to be unstable under normalconditions[4]. The effort to achieve higher Tc has thusprimarily focused on doping magnesium diboride withvarious metals; however, doping this material has provento be difficult[5] and no improvement on Tc has yet beenreported. According to a recent theoretical study of non-local screening effects in metals, MgB2 may already beoptimally doped[6]. Lithium borocarbide with a doubledAlB2 unit cell has been suggested as a possible high-Tc
superconductor under hole-doping[7], but disorder in theheavily doped LixBC appears to forbid superconductivityabove 2K[8].
In this work we investigate whether there could be sta-ble high-Tc superconducting metal borides in configu-rations beyond the standard AlB2 prototype. We haverecently proposed metal-sandwich (MS) structures MS1and MS2, which also have sp2 layers of boron but sepa-rated by two metal layers[9]. Despite their rather simpleunit cells these structures have apparently never beenconsidered before. As we demonstrate below, identifi-cation of the MS structures is not straightforward be-cause they represent a local minimum not usually ex-plored with current compound prediction strategies[9].We reveal trends in the cohesion of MS phases by calcu-lating formation energies for a large class of metal boridesand show that some monovalent-metal borides benefit
from having additional layers of metal. The MS noble-metal borides still have positive formation energy, butthey are less unstable than the AlB2-type phases. Thisresult helps resolve the question of what phases wouldform first in the noble-metal boride systems under non-equilibrium conditions[10, 11, 12, 13].
Our main finding concerns the Li-B system, in whichthe MS lithium monoboride is stable enough to competeagainst the known stoichiometric phases. According toour previous ab initio calculations the MS lithium mono-boride is comparable in energy to these phases under nor-mal conditions, but it becomes the ground state at 50%concentration under moderate hydrostatic pressures[9].Here we extend the analysis to non-stoichiometric Li-Bphases which could potentially intervene in the synthe-sis of the MS phases. In particular, synthesized lithiummonoboride with linear chains of boron is known to beboron-deficient for reasons not fully understood so far.We simulate the incommensurate LiBy phases (notationexplained in Ref. [14]) by constructing a series of smallperiodic Li2nBm structures and show that the minimumformation energy is achieved for y ≈ 0.9, in very goodagreement with the experimentally observed values. Us-ing this simple model of the off-stoichiometry phases withlinear chains of boron we demonstrate that relative tothem MS-LiB still has lower formation enthalpy underhigh pressures. Simulations of other alkali-metal borides,MBy (M = Na, K, Rb, Cs), suggest that that these nearlystoichiometric phases might form under moderate pres-sures.
The paper is divided in the sections describing: 2) sim-ulation details; 3) construction of the MS prototypes; 4)stability of MS phases for a large class of metal borides; 5)detailed investigation of the Li-B system; 6) simulationsof other monovalent and higher-valent metal borides; 7)summary of the electronic and structural properties ofthe MS phases.
2
2. COMPUTATION DETAILS
Present ab initio calculations are performed with Vi-enna Ab-Initio Simulation Package VASP [15, 16] withProjector Augmented Waves (PAW) [17] and exchange-correlation functionals as parametrized by Perdew,Burke, and Ernzerhof (PBE)[18] for the Generalized Gra-dient Approximation (GGA). Because of a significantcharge transfer between metal and boron in most struc-tures considered we use PAW pseudopotentials in whichsemi-core states are treated as valence. This is espe-cially important for the Li-B system as discussed in Refs.[9, 19]. Simulations are carried out at zero tempera-ture and without zero-point motion; spin polarization isused only for magnetic alloys. We use an energy cut-off of 398 eV and at least 8000/(number of atoms in unitcell) k-points distributed on a Monkhorst-Pack mesh [20].We also employ an augmented plane-wave+local orbitals(APW+lo) code WIEN2K to plot characters of electronicbands[21]. All structures are fully relaxed. Our care-ful tests show that the relative energies are numericallyconverged to within 1∼2 meV/atom.
Construction of binary phase diagrams AxB1−x isbased on the calculated formation enthalpy Hf , whichis determined with respect to the most stable structuresof pure elements. For boron there are two competingphases α-B and β-B[22]; we use α-B (Ref. [4]), theoreti-cally shown to be the more stable phase at low temper-atures and high pressures [22]. A structure at a givencomposition x is considered stable (at zero temperatureand without zero-point motion) if it has the lowest for-mation enthalpy for any structure at this compositionand if on the binary phase diagram Hf (x) it lies belowa tie-line connecting the two stable structures closest incomposition to x on each side.
3. IDENTIFICATION OF MS PROTOTYPES
Data-mining of quantum calculations (DMQC), intro-duced in our previous work[23], is a theoretical method topredict the structure of materials through efficient re-useof ab initio results. The DMQC iteratively determinescorrelations in the calculated energies on a chosen libraryof binary alloys and structure types. The last work hasdemonstrated that for a set of 114 crystal structures and55 binary metallic alloys the method gives an almost per-fect prediction of the ground states (within the library)in a fraction of all possible computations[23, 24]. Thespeed-up (commonly by a factor from 3 to 4) is achievedby the method’s rational strategy for suggesting the nextphase to be evaluated. An essential feature of these calcu-lations is the full relaxation of the considered structures,which ensures an accurate determination of the correla-tions in the chosen library[25].
We have recently begun expanding the 114×55 library
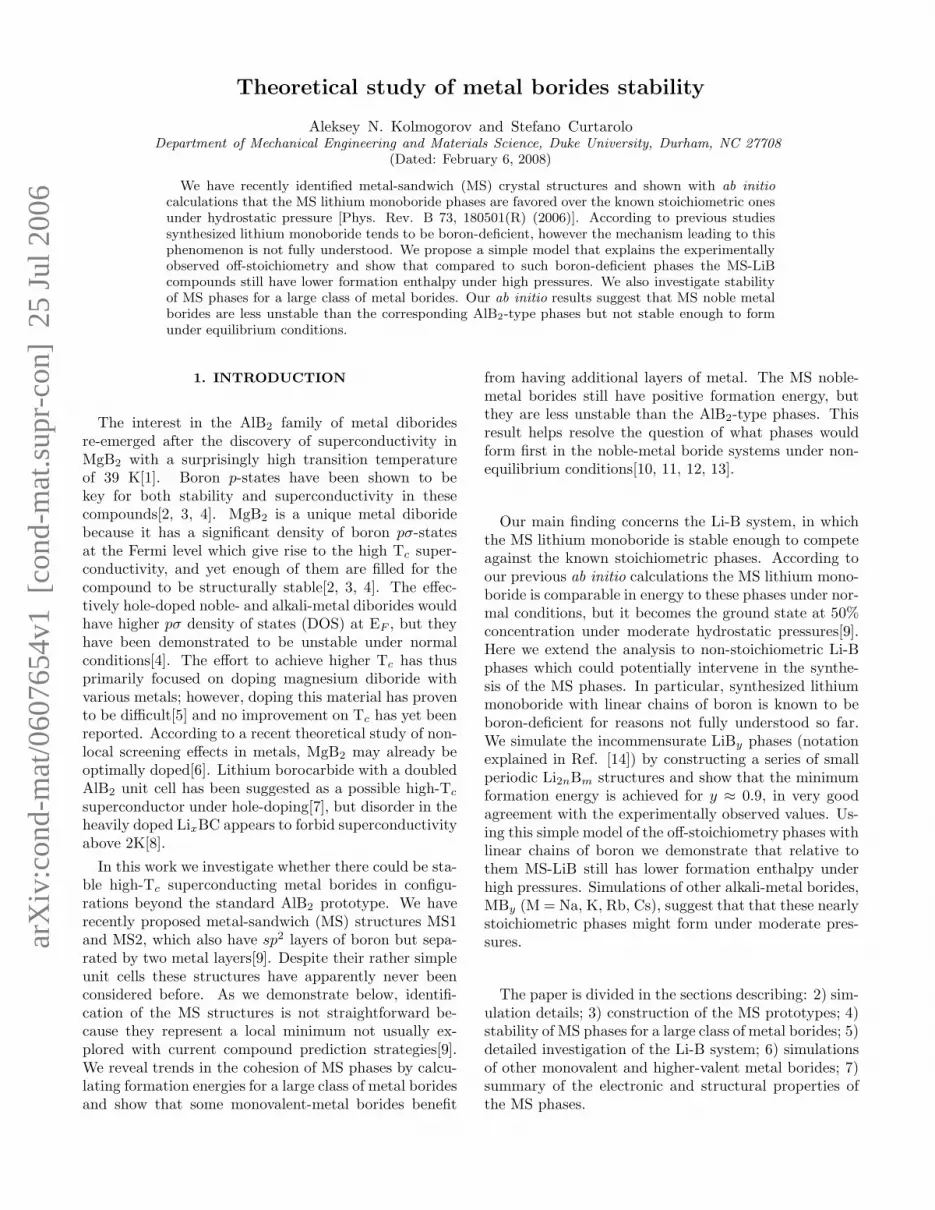
FIG. 1: (color online). Energy barrier as a function ofboron fractional coordinate dB for a transition path from V2(dB ≈ 0.25 [26]) to MS1 (dB ≈ 0, see text) for different metalborides. For each value of dB the energy is minimized by ad-justment of the remaining free parameters a, c, and the metalfractional coordinate dM .
of ab initio energies of binary alloys[23] to include metalborides. Boron tends to form covalent bonds in inter-metallic compounds; to have this correlation in futurepredictions with the DMQC we needed first to add a fewcompound-forming metal-boride systems into the library.Introduction of a new system involves calculations of en-ergies for all the prototype entries in the library. Sur-prisingly, in the very first system considered, Mg-B, oneof the fcc structures with 4-atom unit cell at 50% con-centration, A2B2 fcc-(111) (or V2 [26]), relaxed almostall the way down to the AlB2-MgB2↔hcp-Mg tie-line.Significant relaxations are not uncommon in our simu-lations; they usually correspond to the transformationfrom a starting configuration to a known stable proto-type and are automatically detected by the change in thesymmetry. The magnesium monoboride phase, however,retained its original space group R3m (#166).
Having examined the relaxation process we found thatthere is a continuous symmetry-conserving path from V2to a new structure MS1[9, 27]. V2 has 4 atoms per unitcell with 4 free parameters a, c, dB, and dM (the lasttwo are fractional distances between boron and metallayers), so that atoms are constrained only to the verti-cal lines (see Fig. 1). The perfect fcc lattice correspondsto c/a=4
√
2/3 and dB = dM=0.25, but this special casedoes not grant additional symmetry operations and localrelaxation have been seen in some metallic systems[26].
3
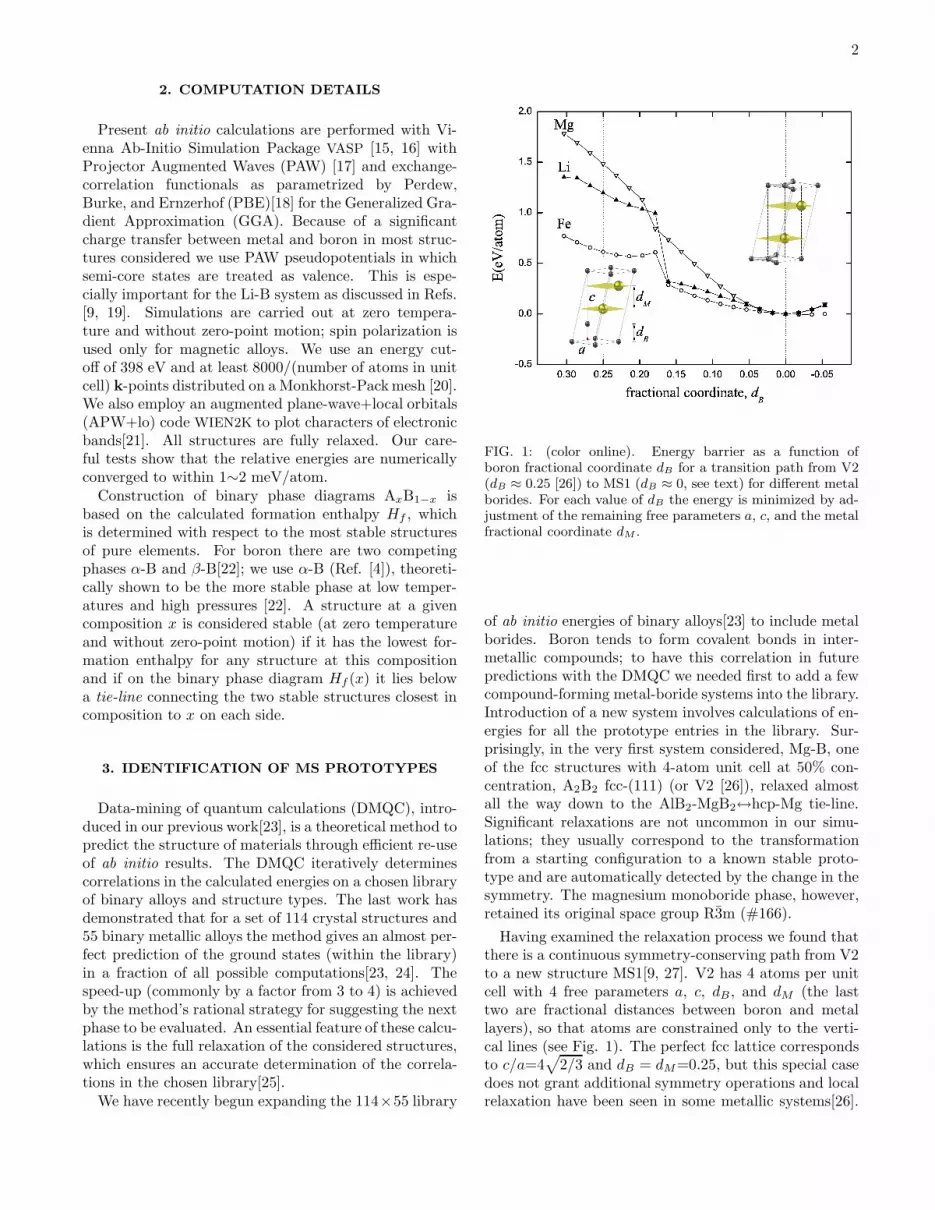
In metal borides a more dramatic transformation leadsto a much more stable configuration: boron atoms re-arrange themselves to form covalent bonds in a hexago-nal layer (dB → 0) rather then share electrons in close-packed triangular layers, while metal atoms remain in aclose-packed bilayer. We have checked other alkali, al-kaline and transition metal borides not present in theDMQC library and confirmed that they all benefit fromthis transformation; however, some electron-rich systemsmight not escape from the local fcc-type minimum, asshown in Fig. 1 for FeB. This could be a reason whythe MS1 prototype has apparently been overlooked sofar. We would like to point out that identification of newprototypes is not an intended function of the DMQC.This interesting accidental result should be credited tothe exhaustive consideration of all candidates (regardlessof how unlikely they seem to be a stable phase - an fccsupercell is hardly a suitable configuration for a magne-sium boride phase) and the careful structural relaxationin the calculation of their ground state energies.
We proceed by constructing a library of related MSprototypes. Structures, where the metal atoms closestto boron sit directly above the center of boron hexagons,are uniquely specified by the positions of the metal lay-ers (such as α, β, γ, in Fig. 2). The MS1 structure canthus also be labeled as |αβ|: the Greek letters show thepositions of the two metal layers and vertical bars cor-respond to boron layers. A hexagonal supercell for thisphase[27] is obtained when the last metal layer matchesthe first: |αβ|βγ|γα|. The fourth metal layer can alter-natively be shifted back to site α (see Fig. 2(d)), result-ing in another structure at the same stoichiometry MS2(|αβ|βα|)[9, 28]. Examples of more metal-rich structuresare |αβα| (MS3)[29] and |αβγ|. Various stoichiometriescan also be achieved by combination of smaller cells,i.e. |αβ|β| (MS4) and |α|αβ|βα|. In this notation theAlB2-prototype is labeled simply as |α|, which we willuse henceforth to avoid confusion with the aluminum di-boride compound. Positioning metal atoms above boronhexagon centers is not the only possibility. Stackingfaults have been experimentally observed in MgB2[30],though such defects have been shown to be energeticallycostly for this compound[31]. We have constructed a pe-riodic structure (δ-MB2) with 3 atoms per unit cell wherethe metal atoms in |α| are shifted along (a+b) to beabove the middle of a boron-boron bond[32].
4. STABILITY OF THE MS PHASES
Formation of a particular compound in systems witha few competing phases is determined by a number offactors, i.e. the ground state energy, synthesis conditions,thermodynamic and kinetic effects. Comparison of high-throughput ab initio results[24, 33, 34] with experimentaldatabases has shown that the calculated total energies
FIG. 2: (color online). Known AlB2 and proposed MS struc-tures for metal borides. The hexagonal layers of boron (grey)are separated by triangular layers of metal (yellow, only fouratoms per layer are shown). Except for the δ structure shownin b)[32], all structures have metal layers positioned abovethe middle of the nearest boron hexagons. The alternativenotations given in brackets are explained in the text. Theconcentration of metal in these structures is 33% (AlB2), 33%(δ), 50% (MS1), 50% (MS2), 60% (MS3), and 43% (MS4).
alone allow to identify the correct phases observed in theexperiment in about 96.7% of investigated cases (Eq. 3in Ref. [33]). In this section we use the total energycriterium to narrow down the set of systems in which theMS phases might occur.
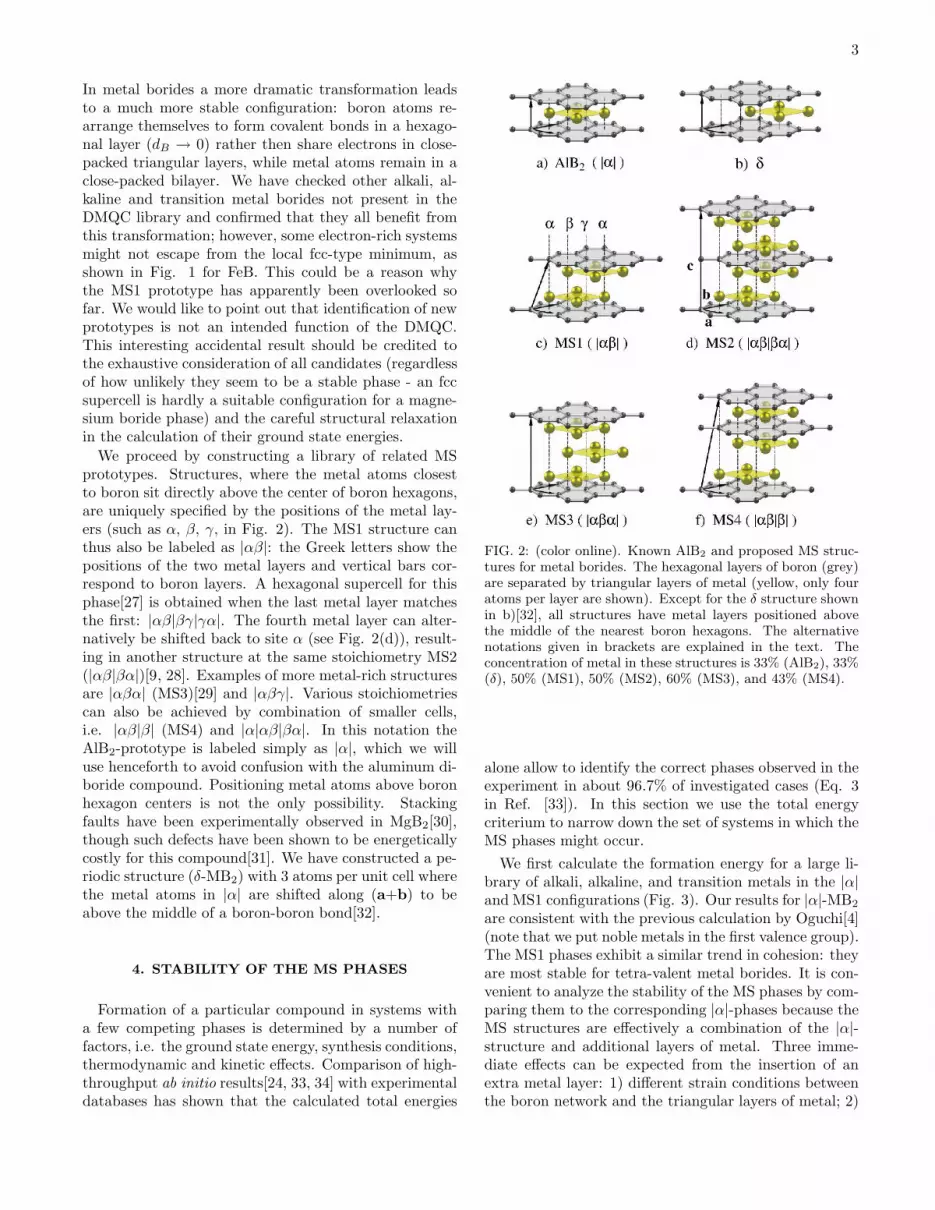
We first calculate the formation energy for a large li-brary of alkali, alkaline, and transition metals in the |α|and MS1 configurations (Fig. 3). Our results for |α|-MB2
are consistent with the previous calculation by Oguchi[4](note that we put noble metals in the first valence group).The MS1 phases exhibit a similar trend in cohesion: theyare most stable for tetra-valent metal borides. It is con-venient to analyze the stability of the MS phases by com-paring them to the corresponding |α|-phases because theMS structures are effectively a combination of the |α|-structure and additional layers of metal. Three imme-diate effects can be expected from the insertion of anextra metal layer: 1) different strain conditions betweenthe boron network and the triangular layers of metal; 2)
4
-1.0
-0.5
0.0
0.5
1 2 3 4 5 6 7 8 9 10
-1.0
-0.5
0.0
0.5
MS1
| |
Pt
PdNi
Co
Ir
Rh
Fe
Os
Ru
Mn
Re
Tc
CrMo
W
VNbTa
TiHfZr
Be
Ca
ZnNaCu
Au
AgK
Sc
Y
Al
Cd
LiMg
Fo
rmat
ion
ener
gy (e
V/a
tom
)
Ni
PdPt
Ir
RhCoFe
Ru
Os
Re
MnTc
CrMoW
TaNbV
TiHfZrSc
Y
AlCaMg
BeZnCd
Li
Ag
CuNa
KAu
valence
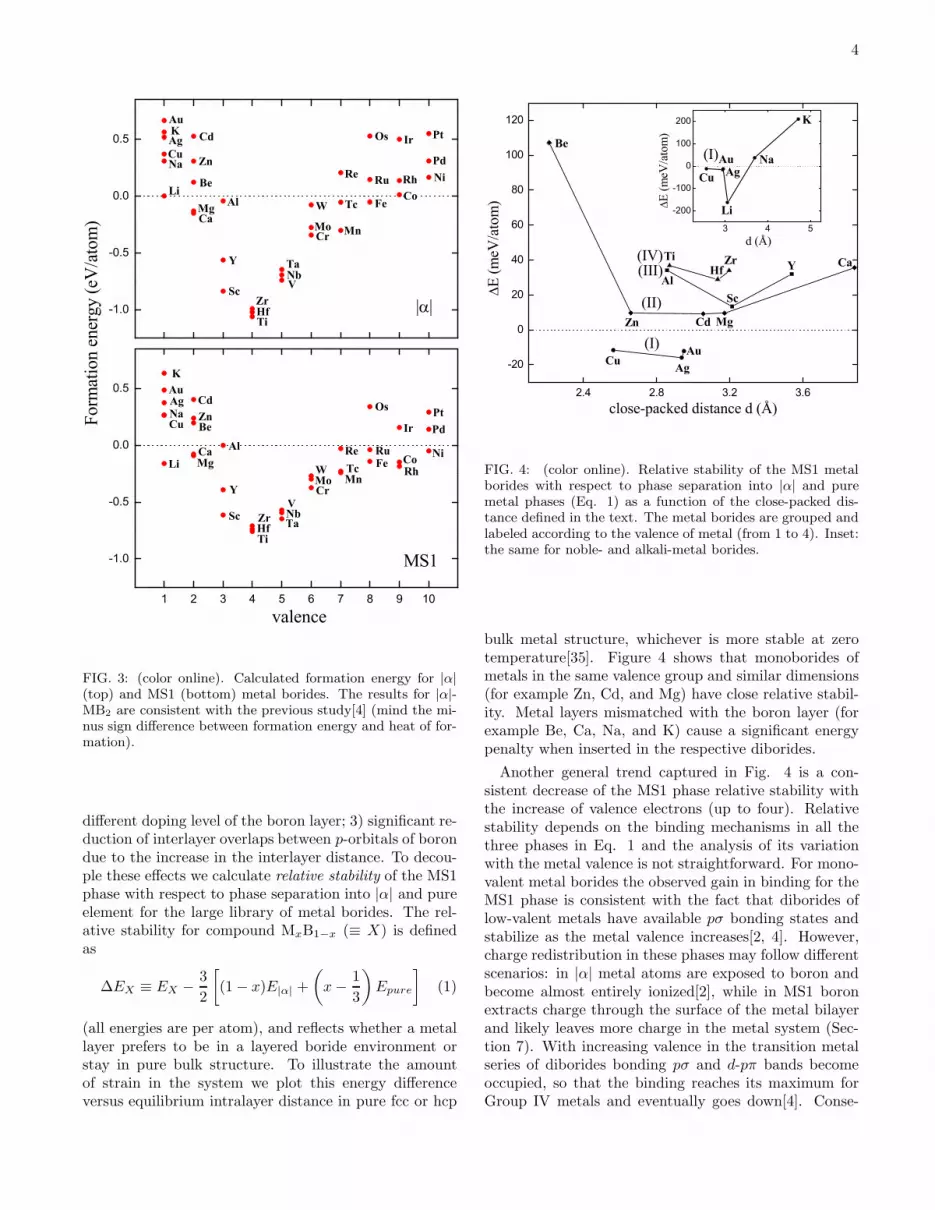
FIG. 3: (color online). Calculated formation energy for |α|(top) and MS1 (bottom) metal borides. The results for |α|-MB2 are consistent with the previous study[4] (mind the mi-nus sign difference between formation energy and heat of for-mation).
different doping level of the boron layer; 3) significant re-duction of interlayer overlaps between p-orbitals of borondue to the increase in the interlayer distance. To decou-ple these effects we calculate relative stability of the MS1phase with respect to phase separation into |α| and pureelement for the large library of metal borides. The rel-ative stability for compound MxB1−x (≡ X) is definedas
∆EX ≡ EX −3
2
[
(1 − x)E|α| +
(
x −1
3
)
Epure
]
(1)
(all energies are per atom), and reflects whether a metallayer prefers to be in a layered boride environment orstay in pure bulk structure. To illustrate the amountof strain in the system we plot this energy differenceversus equilibrium intralayer distance in pure fcc or hcp
2.4 2.8 3.2 3.6
-20
0
20
40
60
80
100
120
3 4 5
-200
-100
0
100
200
(I)
(IV)(III)
(II)
(I)
AgAu
Cu
E (m
eV/a
tom
)
TiHf
Zr
Sc
YAl
Ca
Mg
Be
Zn Cd
Li
AgCu
Na
K
Au
close-packed distance d (Å)
E (m
eV/a
tom
)
d (Å)
FIG. 4: (color online). Relative stability of the MS1 metalborides with respect to phase separation into |α| and puremetal phases (Eq. 1) as a function of the close-packed dis-tance defined in the text. The metal borides are grouped andlabeled according to the valence of metal (from 1 to 4). Inset:the same for noble- and alkali-metal borides.
bulk metal structure, whichever is more stable at zerotemperature[35]. Figure 4 shows that monoborides ofmetals in the same valence group and similar dimensions(for example Zn, Cd, and Mg) have close relative stabil-ity. Metal layers mismatched with the boron layer (forexample Be, Ca, Na, and K) cause a significant energypenalty when inserted in the respective diborides.
Another general trend captured in Fig. 4 is a con-sistent decrease of the MS1 phase relative stability withthe increase of valence electrons (up to four). Relativestability depends on the binding mechanisms in all thethree phases in Eq. 1 and the analysis of its variationwith the metal valence is not straightforward. For mono-valent metal borides the observed gain in binding for theMS1 phase is consistent with the fact that diborides oflow-valent metals have available pσ bonding states andstabilize as the metal valence increases[2, 4]. However,charge redistribution in these phases may follow differentscenarios: in |α| metal atoms are exposed to boron andbecome almost entirely ionized[2], while in MS1 boronextracts charge through the surface of the metal bilayerand likely leaves more charge in the metal system (Sec-tion 7). With increasing valence in the transition metalseries of diborides bonding pσ and d-pπ bands becomeoccupied, so that the binding reaches its maximum forGroup IV metals and eventually goes down[4]. Conse-
5
quently, we observe a noticeable increase in the relativestability of the MS1 structure for higher-valent metals (infact, all metal diborides with at least five valence elec-trons benefit from insertion of an extra metal layer withthe largest gain of -340 meV/atom obtained for RhB).However, these electron-rich systems allow other phaseswith significantly lower energies (prototypes NiAs, NaCl,FeB-b, etc.[13]). Hence, we focus on low-electron systemsthat have been shown to stabilize through incorporationof extra metal layers and could compete with existingphases.
5. LI-B SYSTEM
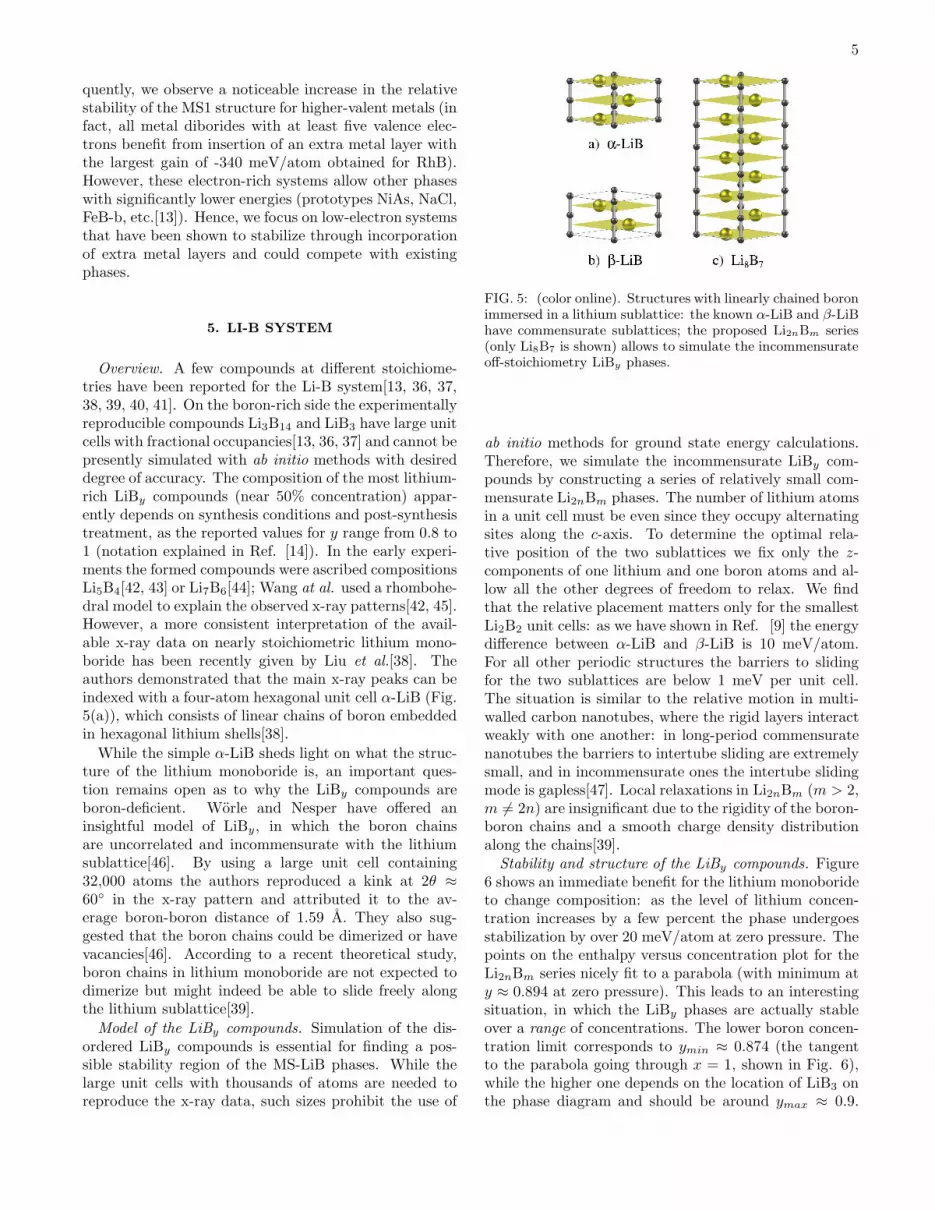
Overview. A few compounds at different stoichiome-tries have been reported for the Li-B system[13, 36, 37,38, 39, 40, 41]. On the boron-rich side the experimentallyreproducible compounds Li3B14 and LiB3 have large unitcells with fractional occupancies[13, 36, 37] and cannot bepresently simulated with ab initio methods with desireddegree of accuracy. The composition of the most lithium-rich LiBy compounds (near 50% concentration) appar-ently depends on synthesis conditions and post-synthesistreatment, as the reported values for y range from 0.8 to1 (notation explained in Ref. [14]). In the early experi-ments the formed compounds were ascribed compositionsLi5B4[42, 43] or Li7B6[44]; Wang at al. used a rhombohe-dral model to explain the observed x-ray patterns[42, 45].However, a more consistent interpretation of the avail-able x-ray data on nearly stoichiometric lithium mono-boride has been recently given by Liu et al.[38]. Theauthors demonstrated that the main x-ray peaks can beindexed with a four-atom hexagonal unit cell α-LiB (Fig.5(a)), which consists of linear chains of boron embeddedin hexagonal lithium shells[38].
While the simple α-LiB sheds light on what the struc-ture of the lithium monoboride is, an important ques-tion remains open as to why the LiBy compounds areboron-deficient. Worle and Nesper have offered aninsightful model of LiBy, in which the boron chainsare uncorrelated and incommensurate with the lithiumsublattice[46]. By using a large unit cell containing32,000 atoms the authors reproduced a kink at 2θ ≈60◦ in the x-ray pattern and attributed it to the av-erage boron-boron distance of 1.59 A. They also sug-gested that the boron chains could be dimerized or havevacancies[46]. According to a recent theoretical study,boron chains in lithium monoboride are not expected todimerize but might indeed be able to slide freely alongthe lithium sublattice[39].
Model of the LiBy compounds. Simulation of the dis-ordered LiBy compounds is essential for finding a pos-sible stability region of the MS-LiB phases. While thelarge unit cells with thousands of atoms are needed toreproduce the x-ray data, such sizes prohibit the use of
FIG. 5: (color online). Structures with linearly chained boronimmersed in a lithium sublattice: the known α-LiB and β-LiBhave commensurate sublattices; the proposed Li2nBm series(only Li8B7 is shown) allows to simulate the incommensurateoff-stoichiometry LiBy phases.
ab initio methods for ground state energy calculations.Therefore, we simulate the incommensurate LiBy com-pounds by constructing a series of relatively small com-mensurate Li2nBm phases. The number of lithium atomsin a unit cell must be even since they occupy alternatingsites along the c-axis. To determine the optimal rela-tive position of the two sublattices we fix only the z-components of one lithium and one boron atoms and al-low all the other degrees of freedom to relax. We findthat the relative placement matters only for the smallestLi2B2 unit cells: as we have shown in Ref. [9] the energydifference between α-LiB and β-LiB is 10 meV/atom.For all other periodic structures the barriers to slidingfor the two sublattices are below 1 meV per unit cell.The situation is similar to the relative motion in multi-walled carbon nanotubes, where the rigid layers interactweakly with one another: in long-period commensuratenanotubes the barriers to intertube sliding are extremelysmall, and in incommensurate ones the intertube slidingmode is gapless[47]. Local relaxations in Li2nBm (m > 2,m 6= 2n) are insignificant due to the rigidity of the boron-boron chains and a smooth charge density distributionalong the chains[39].
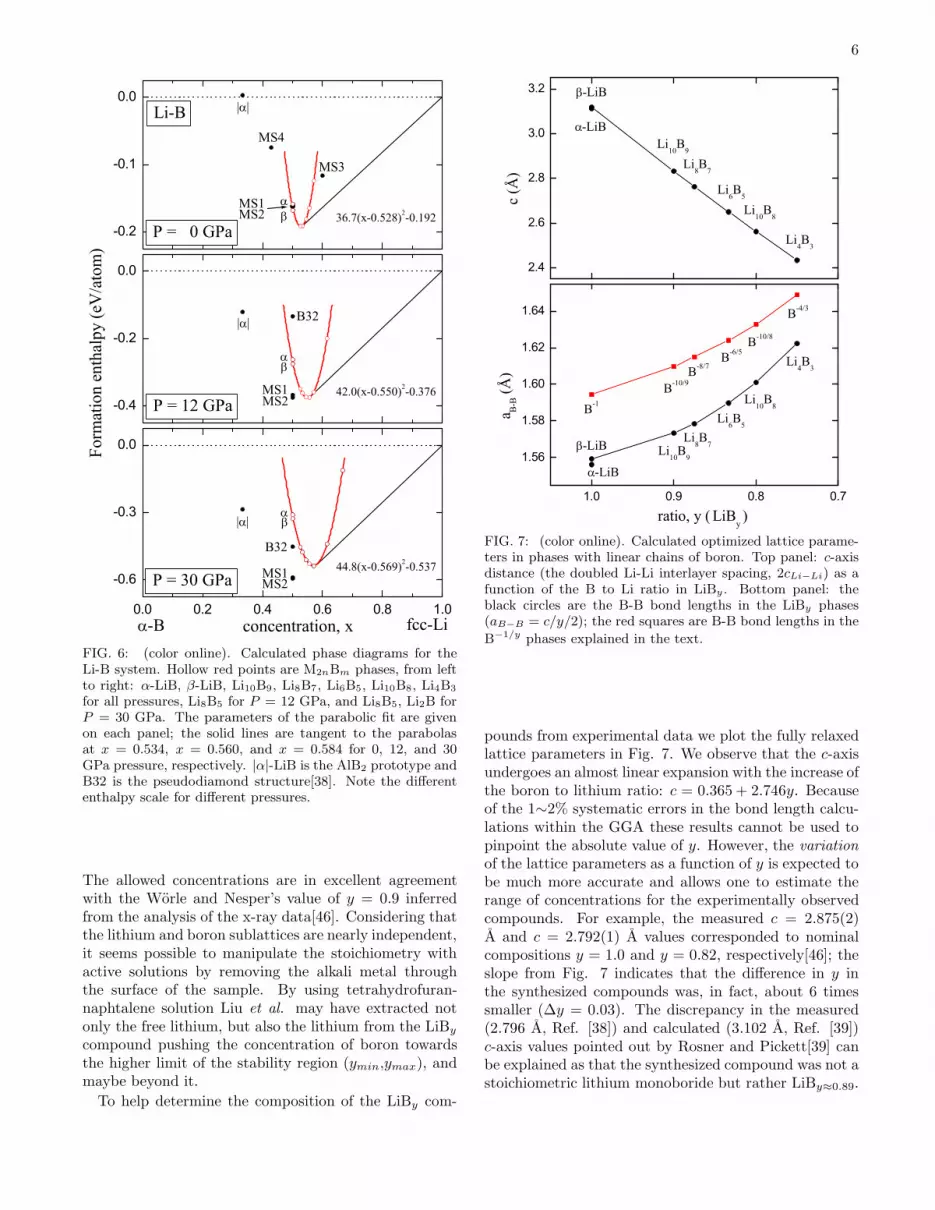
Stability and structure of the LiBy compounds. Figure6 shows an immediate benefit for the lithium monoborideto change composition: as the level of lithium concen-tration increases by a few percent the phase undergoesstabilization by over 20 meV/atom at zero pressure. Thepoints on the enthalpy versus concentration plot for theLi2nBm series nicely fit to a parabola (with minimum aty ≈ 0.894 at zero pressure). This leads to an interestingsituation, in which the LiBy phases are actually stableover a range of concentrations. The lower boron concen-tration limit corresponds to ymin ≈ 0.874 (the tangentto the parabola going through x = 1, shown in Fig. 6),while the higher one depends on the location of LiB3 onthe phase diagram and should be around ymax ≈ 0.9.
6
-0.2
-0.1
0.0
0.0 0.2 0.4 0.6 0.8 1.0
-0.6
-0.3
0.0
-0.4
-0.2
0.0
Li-B
36.7(x-0.528)2-0.192
MS4
MS3
MS1
| |
P = 0 GPa MS2
P = 30 GPa 44.8(x-0.569)2-0.537
| |
B32
MS2MS1
fcc-Li
concentration, x
B32
P = 12 GPa 42.0(x-0.550)2-0.376
MS1
| |
MS2
-B
Form
atio
n en
thal
py (e
V/a
tom
)
FIG. 6: (color online). Calculated phase diagrams for theLi-B system. Hollow red points are M2nBm phases, from leftto right: α-LiB, β-LiB, Li10B9, Li8B7, Li6B5, Li10B8, Li4B3
for all pressures, Li8B5 for P = 12 GPa, and Li8B5, Li2B forP = 30 GPa. The parameters of the parabolic fit are givenon each panel; the solid lines are tangent to the parabolasat x = 0.534, x = 0.560, and x = 0.584 for 0, 12, and 30GPa pressure, respectively. |α|-LiB is the AlB2 prototype andB32 is the pseudodiamond structure[38]. Note the differententhalpy scale for different pressures.
The allowed concentrations are in excellent agreementwith the Worle and Nesper’s value of y = 0.9 inferredfrom the analysis of the x-ray data[46]. Considering thatthe lithium and boron sublattices are nearly independent,it seems possible to manipulate the stoichiometry withactive solutions by removing the alkali metal throughthe surface of the sample. By using tetrahydrofuran-naphtalene solution Liu et al. may have extracted notonly the free lithium, but also the lithium from the LiBy
compound pushing the concentration of boron towardsthe higher limit of the stability region (ymin,ymax), andmaybe beyond it.
To help determine the composition of the LiBy com-
1.0 0.9 0.8 0.7
1.56
1.58
1.60
1.62
1.64
2.4
2.6
2.8
3.0
3.2
B-4/3
B-10/8
B-6/5
B-8/7
B-10/9
B-1
Li4B
3
Li10
B8
Li6B
5
Li8B
7Li10
B9
-LiB
-LiB
ratio, y ( LiB
y )
-LiB
Li4B
3
Li10
B8
Li6B
5
Li8B
7
Li10
B9
-LiB
a B-B (Å
)
c (Å
)
FIG. 7: (color online). Calculated optimized lattice parame-ters in phases with linear chains of boron. Top panel: c-axisdistance (the doubled Li-Li interlayer spacing, 2cLi−Li) as afunction of the B to Li ratio in LiBy . Bottom panel: theblack circles are the B-B bond lengths in the LiBy phases(aB−B = c/y/2); the red squares are B-B bond lengths in the
B−1/y phases explained in the text.
pounds from experimental data we plot the fully relaxedlattice parameters in Fig. 7. We observe that the c-axisundergoes an almost linear expansion with the increase ofthe boron to lithium ratio: c = 0.365 + 2.746y. Becauseof the 1∼2% systematic errors in the bond length calcu-lations within the GGA these results cannot be used topinpoint the absolute value of y. However, the variation
of the lattice parameters as a function of y is expected tobe much more accurate and allows one to estimate therange of concentrations for the experimentally observedcompounds. For example, the measured c = 2.875(2)A and c = 2.792(1) A values corresponded to nominalcompositions y = 1.0 and y = 0.82, respectively[46]; theslope from Fig. 7 indicates that the difference in y inthe synthesized compounds was, in fact, about 6 timessmaller (∆y = 0.03). The discrepancy in the measured(2.796 A, Ref. [38]) and calculated (3.102 A, Ref. [39])c-axis values pointed out by Rosner and Pickett[39] canbe explained as that the synthesized compound was not astoichiometric lithium monoboride but rather LiBy≈0.89.
7
0.0
0.2
0.4
0.6
0.0
0.2
0.4
0.6
-12 -10 -8 -6 -4 -2 0 2 40.0
0.2
0.4
0.6
-LiB B- 1
Li8B
7
B- 8/7
tota
l DO
S (s
tate
s/(e
V sp
in b
oron
ato
m))
Li4B
3
B- 4/3
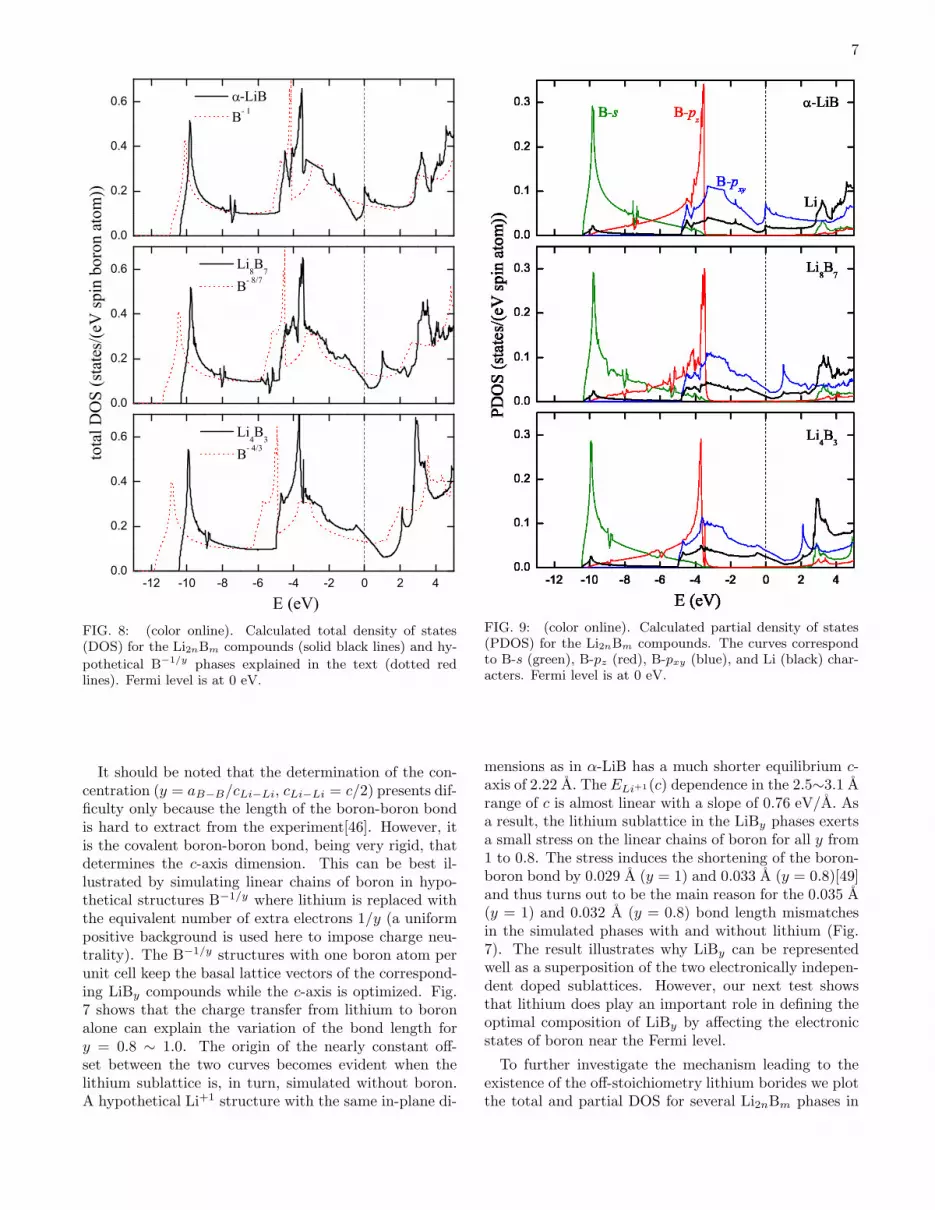
E (eV)FIG. 8: (color online). Calculated total density of states(DOS) for the Li2nBm compounds (solid black lines) and hy-
pothetical B−1/y phases explained in the text (dotted redlines). Fermi level is at 0 eV.
It should be noted that the determination of the con-centration (y = aB−B/cLi−Li, cLi−Li = c/2) presents dif-ficulty only because the length of the boron-boron bondis hard to extract from the experiment[46]. However, itis the covalent boron-boron bond, being very rigid, thatdetermines the c-axis dimension. This can be best il-lustrated by simulating linear chains of boron in hypo-thetical structures B−1/y where lithium is replaced withthe equivalent number of extra electrons 1/y (a uniformpositive background is used here to impose charge neu-trality). The B−1/y structures with one boron atom perunit cell keep the basal lattice vectors of the correspond-ing LiBy compounds while the c-axis is optimized. Fig.7 shows that the charge transfer from lithium to boronalone can explain the variation of the bond length fory = 0.8 ∼ 1.0. The origin of the nearly constant off-set between the two curves becomes evident when thelithium sublattice is, in turn, simulated without boron.A hypothetical Li+1 structure with the same in-plane di-
FIG. 9: (color online). Calculated partial density of states(PDOS) for the Li2nBm compounds. The curves correspondto B-s (green), B-pz (red), B-pxy (blue), and Li (black) char-acters. Fermi level is at 0 eV.
mensions as in α-LiB has a much shorter equilibrium c-axis of 2.22 A. The ELi+1(c) dependence in the 2.5∼3.1 Arange of c is almost linear with a slope of 0.76 eV/A. Asa result, the lithium sublattice in the LiBy phases exertsa small stress on the linear chains of boron for all y from1 to 0.8. The stress induces the shortening of the boron-boron bond by 0.029 A (y = 1) and 0.033 A (y = 0.8)[49]and thus turns out to be the main reason for the 0.035 A(y = 1) and 0.032 A (y = 0.8) bond length mismatchesin the simulated phases with and without lithium (Fig.7). The result illustrates why LiBy can be representedwell as a superposition of the two electronically indepen-dent doped sublattices. However, our next test showsthat lithium does play an important role in defining theoptimal composition of LiBy by affecting the electronicstates of boron near the Fermi level.
To further investigate the mechanism leading to theexistence of the off-stoichiometry lithium borides we plotthe total and partial DOS for several Li2nBm phases in
8
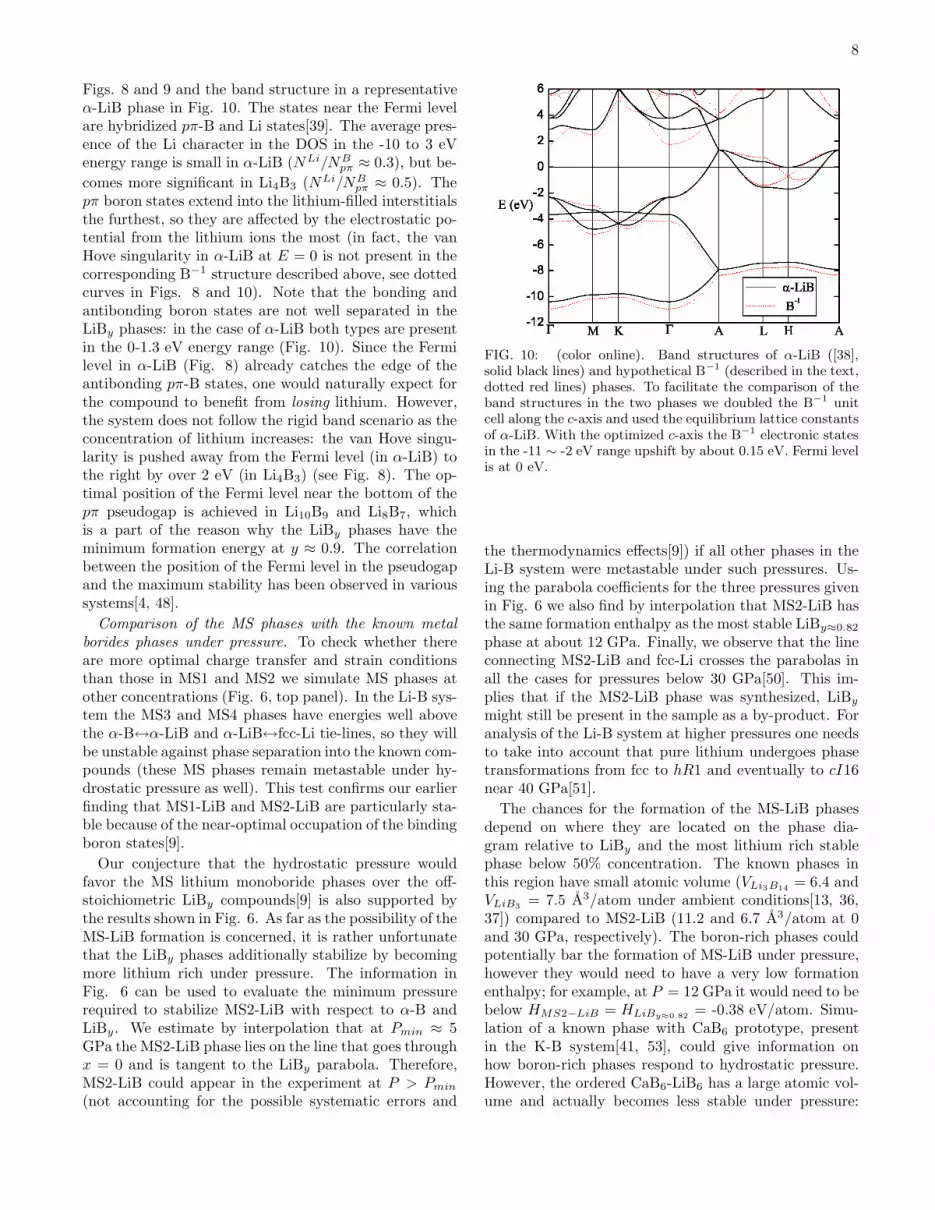
Figs. 8 and 9 and the band structure in a representativeα-LiB phase in Fig. 10. The states near the Fermi levelare hybridized pπ-B and Li states[39]. The average pres-ence of the Li character in the DOS in the -10 to 3 eVenergy range is small in α-LiB (NLi/NB
pπ ≈ 0.3), but be-
comes more significant in Li4B3 (NLi/NBpπ ≈ 0.5). The
pπ boron states extend into the lithium-filled interstitialsthe furthest, so they are affected by the electrostatic po-tential from the lithium ions the most (in fact, the vanHove singularity in α-LiB at E = 0 is not present in thecorresponding B−1 structure described above, see dottedcurves in Figs. 8 and 10). Note that the bonding andantibonding boron states are not well separated in theLiBy phases: in the case of α-LiB both types are presentin the 0-1.3 eV energy range (Fig. 10). Since the Fermilevel in α-LiB (Fig. 8) already catches the edge of theantibonding pπ-B states, one would naturally expect forthe compound to benefit from losing lithium. However,the system does not follow the rigid band scenario as theconcentration of lithium increases: the van Hove singu-larity is pushed away from the Fermi level (in α-LiB) tothe right by over 2 eV (in Li4B3) (see Fig. 8). The op-timal position of the Fermi level near the bottom of thepπ pseudogap is achieved in Li10B9 and Li8B7, whichis a part of the reason why the LiBy phases have theminimum formation energy at y ≈ 0.9. The correlationbetween the position of the Fermi level in the pseudogapand the maximum stability has been observed in varioussystems[4, 48].
Comparison of the MS phases with the known metal
borides phases under pressure. To check whether thereare more optimal charge transfer and strain conditionsthan those in MS1 and MS2 we simulate MS phases atother concentrations (Fig. 6, top panel). In the Li-B sys-tem the MS3 and MS4 phases have energies well abovethe α-B↔α-LiB and α-LiB↔fcc-Li tie-lines, so they willbe unstable against phase separation into the known com-pounds (these MS phases remain metastable under hy-drostatic pressure as well). This test confirms our earlierfinding that MS1-LiB and MS2-LiB are particularly sta-ble because of the near-optimal occupation of the bindingboron states[9].
Our conjecture that the hydrostatic pressure wouldfavor the MS lithium monoboride phases over the off-stoichiometric LiBy compounds[9] is also supported bythe results shown in Fig. 6. As far as the possibility of theMS-LiB formation is concerned, it is rather unfortunatethat the LiBy phases additionally stabilize by becomingmore lithium rich under pressure. The information inFig. 6 can be used to evaluate the minimum pressurerequired to stabilize MS2-LiB with respect to α-B andLiBy. We estimate by interpolation that at Pmin ≈ 5GPa the MS2-LiB phase lies on the line that goes throughx = 0 and is tangent to the LiBy parabola. Therefore,MS2-LiB could appear in the experiment at P > Pmin
(not accounting for the possible systematic errors and
FIG. 10: (color online). Band structures of α-LiB ([38],solid black lines) and hypothetical B−1 (described in the text,dotted red lines) phases. To facilitate the comparison of theband structures in the two phases we doubled the B−1 unitcell along the c-axis and used the equilibrium lattice constantsof α-LiB. With the optimized c-axis the B−1 electronic statesin the -11 ∼ -2 eV range upshift by about 0.15 eV. Fermi levelis at 0 eV.
the thermodynamics effects[9]) if all other phases in theLi-B system were metastable under such pressures. Us-ing the parabola coefficients for the three pressures givenin Fig. 6 we also find by interpolation that MS2-LiB hasthe same formation enthalpy as the most stable LiBy≈0.82
phase at about 12 GPa. Finally, we observe that the lineconnecting MS2-LiB and fcc-Li crosses the parabolas inall the cases for pressures below 30 GPa[50]. This im-plies that if the MS2-LiB phase was synthesized, LiBy
might still be present in the sample as a by-product. Foranalysis of the Li-B system at higher pressures one needsto take into account that pure lithium undergoes phasetransformations from fcc to hR1 and eventually to cI16near 40 GPa[51].
The chances for the formation of the MS-LiB phasesdepend on where they are located on the phase dia-gram relative to LiBy and the most lithium rich stablephase below 50% concentration. The known phases inthis region have small atomic volume (VLi3B14
= 6.4 andVLiB3
= 7.5 A3/atom under ambient conditions[13, 36,37]) compared to MS2-LiB (11.2 and 6.7 A3/atom at 0and 30 GPa, respectively). The boron-rich phases couldpotentially bar the formation of MS-LiB under pressure,however they would need to have a very low formationenthalpy; for example, at P = 12 GPa it would need to bebelow HMS2−LiB = HLiBy≈0.82 = -0.38 eV/atom. Simu-lation of a known phase with CaB6 prototype, presentin the K-B system[41, 53], could give information onhow boron-rich phases respond to hydrostatic pressure.However, the ordered CaB6-LiB6 has a large atomic vol-ume and actually becomes less stable under pressure:

9
-0.2
-0.1
0.0
0.1
0.2
0.3
0.0 0.2 0.4 0.6 0.8 1.0-0.2
-0.1
0.0
0.1
0.2
0.3
0.0
0.2
0.4
0.6
0.8
0.0 0.2 0.4 0.6 0.8 1.0-0.4
-0.2
0.0
0.2
0.4
Na-B P= 0 GPa MS2
NaB6
Na3B
20
Form
atio
n en
thal
py (e
V/a
tom
)
P=12 GPa
MS2
fcc-Na-B
NaB6
Na3B
20
concentration, x
Rb-B P= 0 GPaMS2
RbB6
Rb3B
20
Form
atio
n en
thal
py (e
V/a
tom
)
P=12 GPa
MS2
fcc-Rb-B
RbB6Rb
3B
20
concentration, x
FIG. 11: (color online). Calculated phase diagrams for Na-Band Rb-B systems at different pressures. Hollow red pointsare M2nBm phases, from left to right: M2B4, M2B3, M4B5,M6B7, α-MB, β-MB, and M8B7. The boron rich phases areNa3B20 and CaB6 prototypes with Pearson symbols oS46 andcP7, respectively. The vertical dotted lines mark the 50%composition.
Hf = 0.016 eV/atom, V = 10.1 A3/atom at zero pres-sure and Hf = 0.303 eV/atom, V = 8.6 A3/atom at30 GPa pressure. Rosner and Pickett pointed out thata compact pseudodiamond phase B32 (NaTl prototype)might appear under pressure[39]. Using enthalpy versuspressure curves for the α-LiB and B32 phases we find thecrossover pressure to be 22 GPa. MS2-LiB stays belowB32-LiB until about 65 GPa. Overall, our simulationssuggest that there might be a window of pressures atwhich the MS-LiB phases can be synthesized.
-0.10.00.10.20.30.40.50.6
0.0 0.2 0.4 0.6 0.8 1.0-0.4
-0.3
-0.2
-0.1
0.0
0.1
0.0
0.2
0.4
0.6
0.8
0.0 0.2 0.4 0.6 0.8 1.0-0.4
-0.2
0.0
0.2
0.4
K-B
P= 0 GPa
MS2
KB6K
3B
20
Form
atio
n en
thal
py (e
V/a
tom
)
P=12 GPa MS2
fcc-K-B
KB6
K3B
20
concentration, x
Cs-B P= 0 GPa MS2
CsB6
Cs3B
20
Form
atio
n en
thal
py (e
V/a
tom
)
P=12 GPaMS2
fcc-Cs-B
CsB6
Cs3B
20
concentration, x
FIG. 12: (color online). The same as in Fig. 11 for K-B andCs-B systems.
6. OTHER MONOVALENT AND SOME
HIGHER-VALENT METAL BORIDES
Alkali and transition metal borides. According to theexperimental databases and the latest review of alkali-metal borides[13, 41] there are no stable sodium or potas-sium borides above 15% concentration of metal and nostable rubidium or cesium borides in the whole concen-tration range. Na3B20 (Pearson symbol oS46) and KB6
(Pearson symbol cP7) compounds, made out of boronpolyhedra intercalated with alkali atoms, are consideredthe most metal-rich known borides in the Na-B and K-B systems, respectively[13, 41, 52, 53]. Our simula-tions confirm that these compounds have negative for-mation enthalpies of -58 meV/atom for Na3B20 and -29
10
meV/atom for KB6 with respect to α-B and fcc-M[35].The formation Gibbs free energies for these compoundsmight be less negative if they were evaluated with re-spect to β-B at finite temperature[22]. This could be thereason why there is no conclusive evidence of potassiumhexaboride synthesis[41]. Complete theoretical investiga-tion of the boron-rich compounds such as Na3B29 (Ref.[54]) is beyond the scope of this study but it is interestingto see where the nearly stoichiometric MBy phases placewith respect to the known phases in these systems.
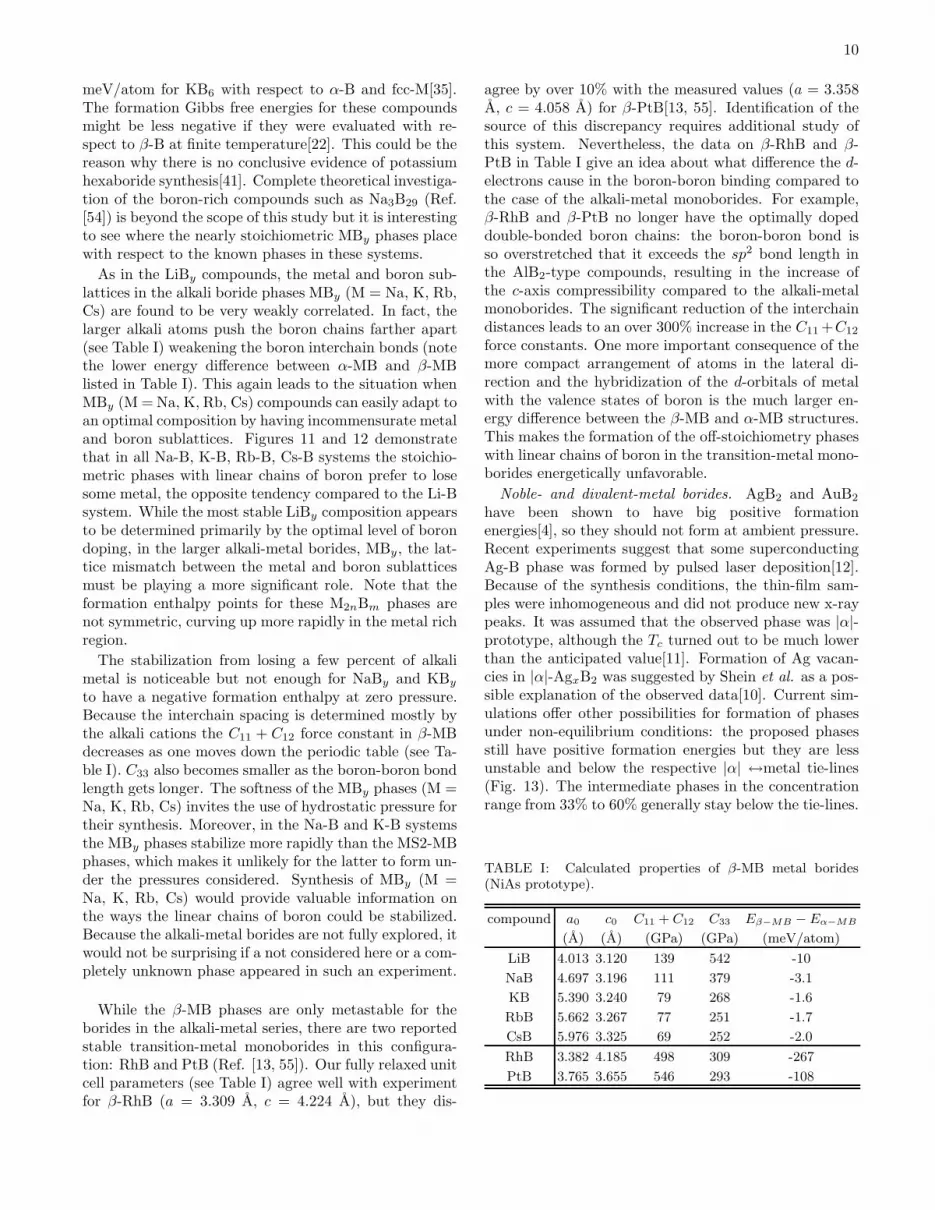
As in the LiBy compounds, the metal and boron sub-lattices in the alkali boride phases MBy (M = Na, K, Rb,Cs) are found to be very weakly correlated. In fact, thelarger alkali atoms push the boron chains farther apart(see Table I) weakening the boron interchain bonds (notethe lower energy difference between α-MB and β-MBlisted in Table I). This again leads to the situation whenMBy (M = Na, K, Rb, Cs) compounds can easily adapt toan optimal composition by having incommensurate metaland boron sublattices. Figures 11 and 12 demonstratethat in all Na-B, K-B, Rb-B, Cs-B systems the stoichio-metric phases with linear chains of boron prefer to losesome metal, the opposite tendency compared to the Li-Bsystem. While the most stable LiBy composition appearsto be determined primarily by the optimal level of borondoping, in the larger alkali-metal borides, MBy, the lat-tice mismatch between the metal and boron sublatticesmust be playing a more significant role. Note that theformation enthalpy points for these M2nBm phases arenot symmetric, curving up more rapidly in the metal richregion.
The stabilization from losing a few percent of alkalimetal is noticeable but not enough for NaBy and KBy
to have a negative formation enthalpy at zero pressure.Because the interchain spacing is determined mostly bythe alkali cations the C11 + C12 force constant in β-MBdecreases as one moves down the periodic table (see Ta-ble I). C33 also becomes smaller as the boron-boron bondlength gets longer. The softness of the MBy phases (M =Na, K, Rb, Cs) invites the use of hydrostatic pressure fortheir synthesis. Moreover, in the Na-B and K-B systemsthe MBy phases stabilize more rapidly than the MS2-MBphases, which makes it unlikely for the latter to form un-der the pressures considered. Synthesis of MBy (M =Na, K, Rb, Cs) would provide valuable information onthe ways the linear chains of boron could be stabilized.Because the alkali-metal borides are not fully explored, itwould not be surprising if a not considered here or a com-pletely unknown phase appeared in such an experiment.
While the β-MB phases are only metastable for theborides in the alkali-metal series, there are two reportedstable transition-metal monoborides in this configura-tion: RhB and PtB (Ref. [13, 55]). Our fully relaxed unitcell parameters (see Table I) agree well with experimentfor β-RhB (a = 3.309 A, c = 4.224 A), but they dis-
agree by over 10% with the measured values (a = 3.358A, c = 4.058 A) for β-PtB[13, 55]. Identification of thesource of this discrepancy requires additional study ofthis system. Nevertheless, the data on β-RhB and β-PtB in Table I give an idea about what difference the d-electrons cause in the boron-boron binding compared tothe case of the alkali-metal monoborides. For example,β-RhB and β-PtB no longer have the optimally dopeddouble-bonded boron chains: the boron-boron bond isso overstretched that it exceeds the sp2 bond length inthe AlB2-type compounds, resulting in the increase ofthe c-axis compressibility compared to the alkali-metalmonoborides. The significant reduction of the interchaindistances leads to an over 300% increase in the C11 +C12
force constants. One more important consequence of themore compact arrangement of atoms in the lateral di-rection and the hybridization of the d-orbitals of metalwith the valence states of boron is the much larger en-ergy difference between the β-MB and α-MB structures.This makes the formation of the off-stoichiometry phaseswith linear chains of boron in the transition-metal mono-borides energetically unfavorable.
Noble- and divalent-metal borides. AgB2 and AuB2
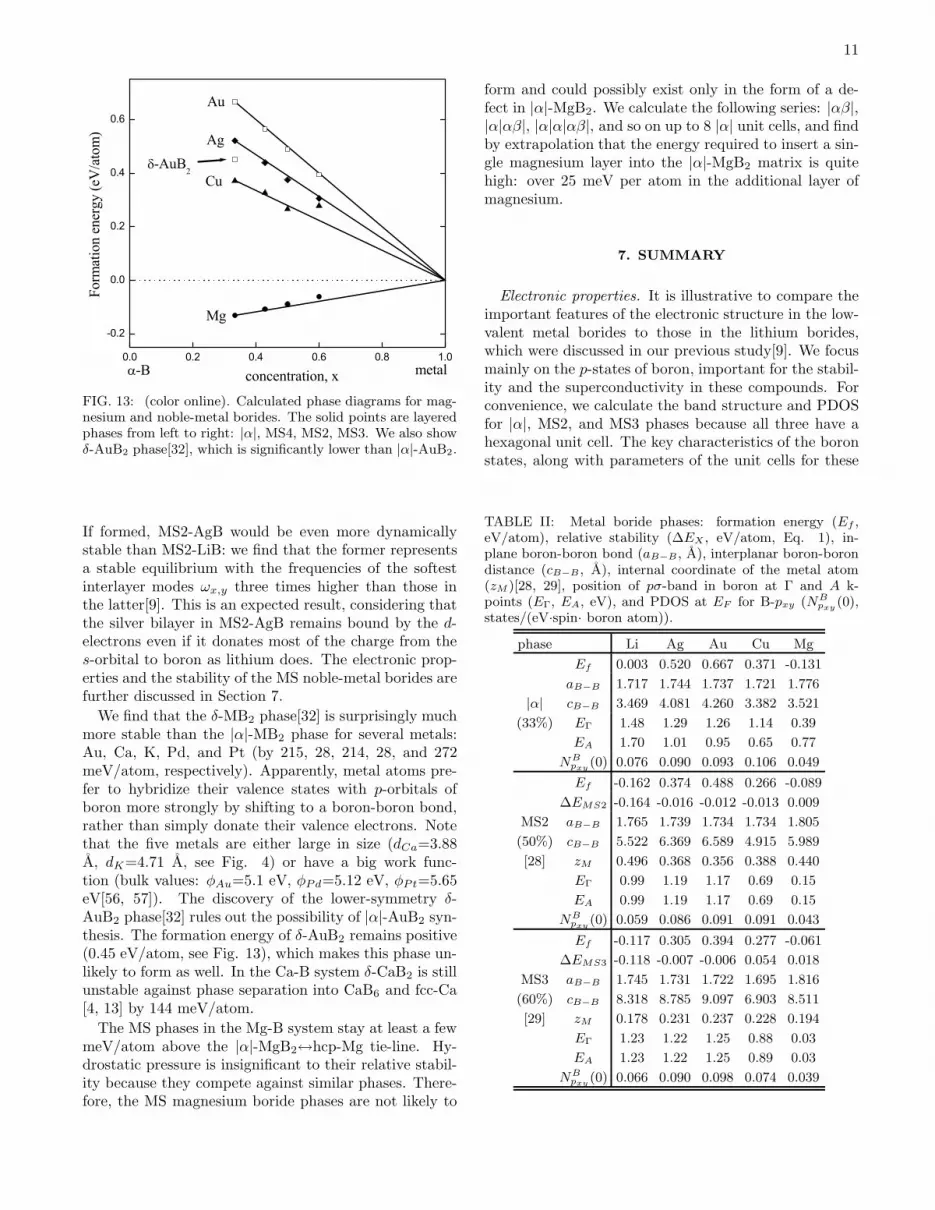
have been shown to have big positive formationenergies[4], so they should not form at ambient pressure.Recent experiments suggest that some superconductingAg-B phase was formed by pulsed laser deposition[12].Because of the synthesis conditions, the thin-film sam-ples were inhomogeneous and did not produce new x-raypeaks. It was assumed that the observed phase was |α|-prototype, although the Tc turned out to be much lowerthan the anticipated value[11]. Formation of Ag vacan-cies in |α|-AgxB2 was suggested by Shein et al. as a pos-sible explanation of the observed data[10]. Current sim-ulations offer other possibilities for formation of phasesunder non-equilibrium conditions: the proposed phasesstill have positive formation energies but they are lessunstable and below the respective |α| ↔metal tie-lines(Fig. 13). The intermediate phases in the concentrationrange from 33% to 60% generally stay below the tie-lines.
TABLE I: Calculated properties of β-MB metal borides(NiAs prototype).
compound a0 c0 C11 + C12 C33 Eβ−MB − Eα−MB
(A) (A) (GPa) (GPa) (meV/atom)
LiB 4.013 3.120 139 542 -10
NaB 4.697 3.196 111 379 -3.1
KB 5.390 3.240 79 268 -1.6
RbB 5.662 3.267 77 251 -1.7
CsB 5.976 3.325 69 252 -2.0
RhB 3.382 4.185 498 309 -267
PtB 3.765 3.655 546 293 -108
11
0.0 0.2 0.4 0.6 0.8 1.0
-0.2
0.0
0.2
0.4
0.6
-AuB2
metal-B
Cu
Ag
AuFo
rmat
ion
ener
gy (e
V/a
tom
)
Mg
concentration, x
FIG. 13: (color online). Calculated phase diagrams for mag-nesium and noble-metal borides. The solid points are layeredphases from left to right: |α|, MS4, MS2, MS3. We also showδ-AuB2 phase[32], which is significantly lower than |α|-AuB2.
If formed, MS2-AgB would be even more dynamicallystable than MS2-LiB: we find that the former representsa stable equilibrium with the frequencies of the softestinterlayer modes ωx,y three times higher than those inthe latter[9]. This is an expected result, considering thatthe silver bilayer in MS2-AgB remains bound by the d-electrons even if it donates most of the charge from thes-orbital to boron as lithium does. The electronic prop-erties and the stability of the MS noble-metal borides arefurther discussed in Section 7.
We find that the δ-MB2 phase[32] is surprisingly muchmore stable than the |α|-MB2 phase for several metals:Au, Ca, K, Pd, and Pt (by 215, 28, 214, 28, and 272meV/atom, respectively). Apparently, metal atoms pre-fer to hybridize their valence states with p-orbitals ofboron more strongly by shifting to a boron-boron bond,rather than simply donate their valence electrons. Notethat the five metals are either large in size (dCa=3.88A, dK=4.71 A, see Fig. 4) or have a big work func-tion (bulk values: φAu=5.1 eV, φPd=5.12 eV, φPt=5.65eV[56, 57]). The discovery of the lower-symmetry δ-AuB2 phase[32] rules out the possibility of |α|-AuB2 syn-thesis. The formation energy of δ-AuB2 remains positive(0.45 eV/atom, see Fig. 13), which makes this phase un-likely to form as well. In the Ca-B system δ-CaB2 is stillunstable against phase separation into CaB6 and fcc-Ca[4, 13] by 144 meV/atom.
The MS phases in the Mg-B system stay at least a fewmeV/atom above the |α|-MgB2↔hcp-Mg tie-line. Hy-drostatic pressure is insignificant to their relative stabil-ity because they compete against similar phases. There-fore, the MS magnesium boride phases are not likely to
form and could possibly exist only in the form of a de-fect in |α|-MgB2. We calculate the following series: |αβ|,|α|αβ|, |α|α|αβ|, and so on up to 8 |α| unit cells, and findby extrapolation that the energy required to insert a sin-gle magnesium layer into the |α|-MgB2 matrix is quitehigh: over 25 meV per atom in the additional layer ofmagnesium.
7. SUMMARY
Electronic properties. It is illustrative to compare theimportant features of the electronic structure in the low-valent metal borides to those in the lithium borides,which were discussed in our previous study[9]. We focusmainly on the p-states of boron, important for the stabil-ity and the superconductivity in these compounds. Forconvenience, we calculate the band structure and PDOSfor |α|, MS2, and MS3 phases because all three have ahexagonal unit cell. The key characteristics of the boronstates, along with parameters of the unit cells for these
TABLE II: Metal boride phases: formation energy (Ef ,eV/atom), relative stability (∆EX , eV/atom, Eq. 1), in-plane boron-boron bond (aB−B , A), interplanar boron-borondistance (cB−B , A), internal coordinate of the metal atom(zM )[28, 29], position of pσ-band in boron at Γ and A k-points (EΓ, EA, eV), and PDOS at EF for B-pxy (NB
pxy(0),
states/(eV·spin· boron atom)).
phase Li Ag Au Cu Mg
Ef 0.003 0.520 0.667 0.371 -0.131
aB−B 1.717 1.744 1.737 1.721 1.776
|α| cB−B 3.469 4.081 4.260 3.382 3.521
(33%) EΓ 1.48 1.29 1.26 1.14 0.39
EA 1.70 1.01 0.95 0.65 0.77
NBpxy
(0) 0.076 0.090 0.093 0.106 0.049
Ef -0.162 0.374 0.488 0.266 -0.089
∆EMS2 -0.164 -0.016 -0.012 -0.013 0.009
MS2 aB−B 1.765 1.739 1.734 1.734 1.805
(50%) cB−B 5.522 6.369 6.589 4.915 5.989
[28] zM 0.496 0.368 0.356 0.388 0.440
EΓ 0.99 1.19 1.17 0.69 0.15
EA 0.99 1.19 1.17 0.69 0.15
NBpxy
(0) 0.059 0.086 0.091 0.091 0.043
Ef -0.117 0.305 0.394 0.277 -0.061
∆EMS3 -0.118 -0.007 -0.006 0.054 0.018
MS3 aB−B 1.745 1.731 1.722 1.695 1.816
(60%) cB−B 8.318 8.785 9.097 6.903 8.511
[29] zM 0.178 0.231 0.237 0.228 0.194
EΓ 1.23 1.22 1.25 0.88 0.03
EA 1.23 1.22 1.25 0.89 0.03
NBpxy
(0) 0.066 0.090 0.098 0.074 0.039
12
phases are given in Table II.
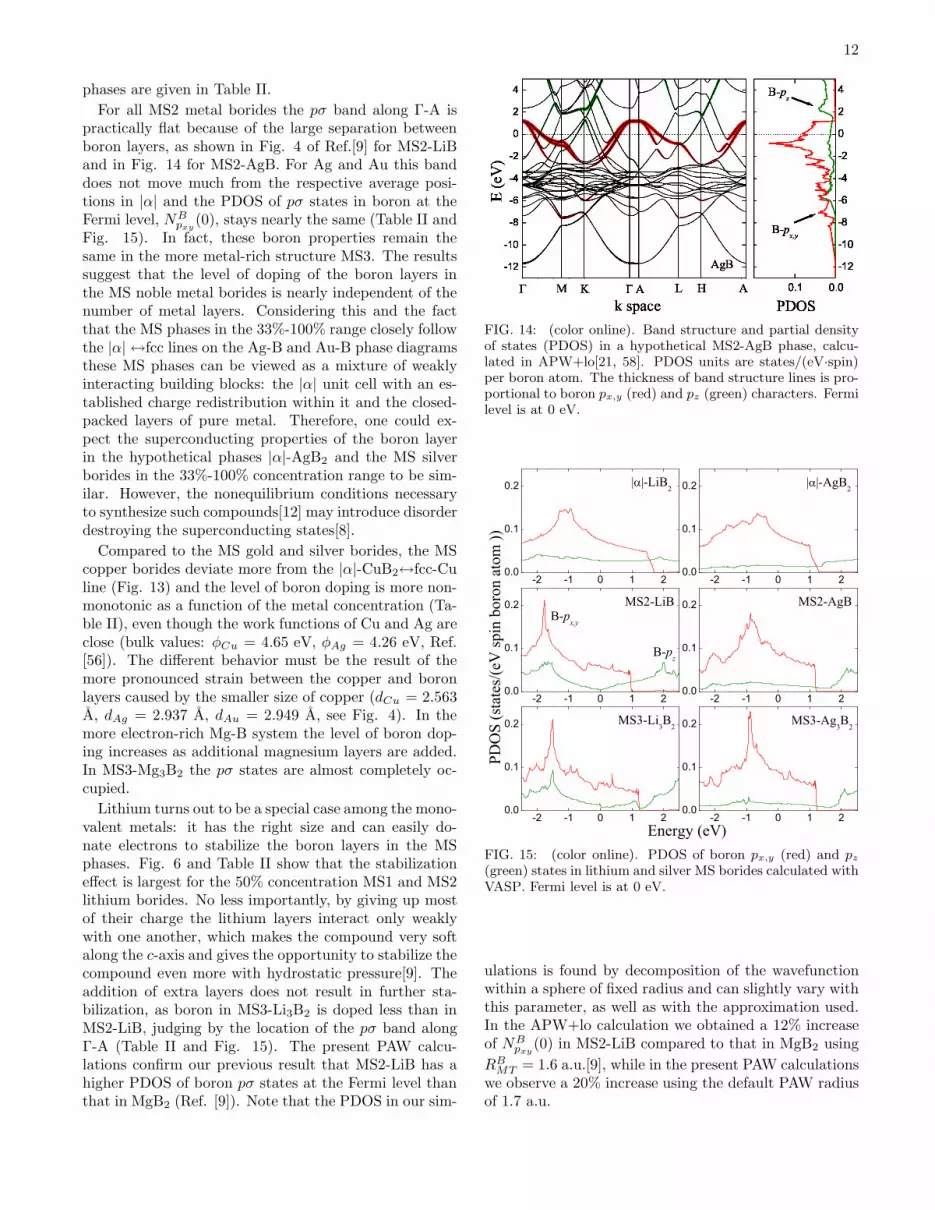
For all MS2 metal borides the pσ band along Γ-A ispractically flat because of the large separation betweenboron layers, as shown in Fig. 4 of Ref.[9] for MS2-LiBand in Fig. 14 for MS2-AgB. For Ag and Au this banddoes not move much from the respective average posi-tions in |α| and the PDOS of pσ states in boron at theFermi level, NB
pxy(0), stays nearly the same (Table II and
Fig. 15). In fact, these boron properties remain thesame in the more metal-rich structure MS3. The resultssuggest that the level of doping of the boron layers inthe MS noble metal borides is nearly independent of thenumber of metal layers. Considering this and the factthat the MS phases in the 33%-100% range closely followthe |α| ↔fcc lines on the Ag-B and Au-B phase diagramsthese MS phases can be viewed as a mixture of weaklyinteracting building blocks: the |α| unit cell with an es-tablished charge redistribution within it and the closed-packed layers of pure metal. Therefore, one could ex-pect the superconducting properties of the boron layerin the hypothetical phases |α|-AgB2 and the MS silverborides in the 33%-100% concentration range to be sim-ilar. However, the nonequilibrium conditions necessaryto synthesize such compounds[12] may introduce disorderdestroying the superconducting states[8].
Compared to the MS gold and silver borides, the MScopper borides deviate more from the |α|-CuB2↔fcc-Culine (Fig. 13) and the level of boron doping is more non-monotonic as a function of the metal concentration (Ta-ble II), even though the work functions of Cu and Ag areclose (bulk values: φCu = 4.65 eV, φAg = 4.26 eV, Ref.[56]). The different behavior must be the result of themore pronounced strain between the copper and boronlayers caused by the smaller size of copper (dCu = 2.563A, dAg = 2.937 A, dAu = 2.949 A, see Fig. 4). In themore electron-rich Mg-B system the level of boron dop-ing increases as additional magnesium layers are added.In MS3-Mg3B2 the pσ states are almost completely oc-cupied.
Lithium turns out to be a special case among the mono-valent metals: it has the right size and can easily do-nate electrons to stabilize the boron layers in the MSphases. Fig. 6 and Table II show that the stabilizationeffect is largest for the 50% concentration MS1 and MS2lithium borides. No less importantly, by giving up mostof their charge the lithium layers interact only weaklywith one another, which makes the compound very softalong the c-axis and gives the opportunity to stabilize thecompound even more with hydrostatic pressure[9]. Theaddition of extra layers does not result in further sta-bilization, as boron in MS3-Li3B2 is doped less than inMS2-LiB, judging by the location of the pσ band alongΓ-A (Table II and Fig. 15). The present PAW calcu-lations confirm our previous result that MS2-LiB has ahigher PDOS of boron pσ states at the Fermi level thanthat in MgB2 (Ref. [9]). Note that the PDOS in our sim-
FIG. 14: (color online). Band structure and partial densityof states (PDOS) in a hypothetical MS2-AgB phase, calcu-lated in APW+lo[21, 58]. PDOS units are states/(eV·spin)per boron atom. The thickness of band structure lines is pro-portional to boron px,y (red) and pz (green) characters. Fermilevel is at 0 eV.
-2 -1 0 1 20.0
0.1
0.2
-2 -1 0 1 20.0
0.1
0.2
-2 -1 0 1 20.0
0.1
0.2
-2 -1 0 1 20.0
0.1
0.2
-2 -1 0 1 20.0
0.1
0.2
-2 -1 0 1 20.0
0.1
0.2
| |-LiB2
| |-AgB2
B-px,y
B-pz
MS2-LiB
MS2-AgB
MS3-Li3B
2
PDO
S (s
tate
s/(e
V sp
in b
oron
ato
m ))
Energy (eV)
MS3-Ag3B
2
FIG. 15: (color online). PDOS of boron px,y (red) and pz
(green) states in lithium and silver MS borides calculated withVASP. Fermi level is at 0 eV.
ulations is found by decomposition of the wavefunctionwithin a sphere of fixed radius and can slightly vary withthis parameter, as well as with the approximation used.In the APW+lo calculation we obtained a 12% increaseof NB
pxy(0) in MS2-LiB compared to that in MgB2 using
RBMT = 1.6 a.u.[9], while in the present PAW calculations
we observe a 20% increase using the default PAW radiusof 1.7 a.u.
13
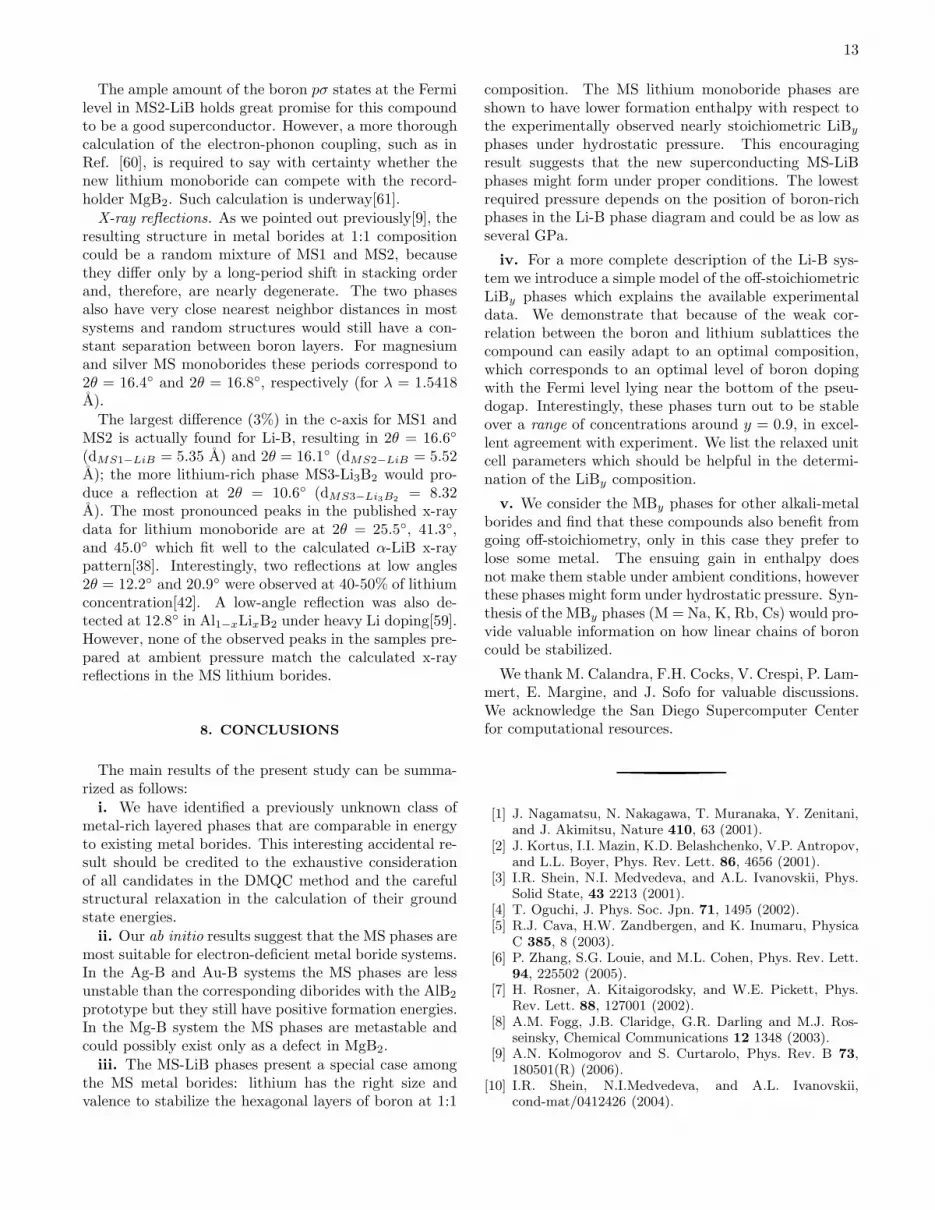
The ample amount of the boron pσ states at the Fermilevel in MS2-LiB holds great promise for this compoundto be a good superconductor. However, a more thoroughcalculation of the electron-phonon coupling, such as inRef. [60], is required to say with certainty whether thenew lithium monoboride can compete with the record-holder MgB2. Such calculation is underway[61].
X-ray reflections. As we pointed out previously[9], theresulting structure in metal borides at 1:1 compositioncould be a random mixture of MS1 and MS2, becausethey differ only by a long-period shift in stacking orderand, therefore, are nearly degenerate. The two phasesalso have very close nearest neighbor distances in mostsystems and random structures would still have a con-stant separation between boron layers. For magnesiumand silver MS monoborides these periods correspond to2θ = 16.4◦ and 2θ = 16.8◦, respectively (for λ = 1.5418A).
The largest difference (3%) in the c-axis for MS1 andMS2 is actually found for Li-B, resulting in 2θ = 16.6◦
(dMS1−LiB = 5.35 A) and 2θ = 16.1◦ (dMS2−LiB = 5.52A); the more lithium-rich phase MS3-Li3B2 would pro-duce a reflection at 2θ = 10.6◦ (dMS3−Li3B2
= 8.32A). The most pronounced peaks in the published x-raydata for lithium monoboride are at 2θ = 25.5◦, 41.3◦,and 45.0◦ which fit well to the calculated α-LiB x-raypattern[38]. Interestingly, two reflections at low angles2θ = 12.2◦ and 20.9◦ were observed at 40-50% of lithiumconcentration[42]. A low-angle reflection was also de-tected at 12.8◦ in Al1−xLixB2 under heavy Li doping[59].However, none of the observed peaks in the samples pre-pared at ambient pressure match the calculated x-rayreflections in the MS lithium borides.
8. CONCLUSIONS
The main results of the present study can be summa-rized as follows:
i. We have identified a previously unknown class ofmetal-rich layered phases that are comparable in energyto existing metal borides. This interesting accidental re-sult should be credited to the exhaustive considerationof all candidates in the DMQC method and the carefulstructural relaxation in the calculation of their groundstate energies.
ii. Our ab initio results suggest that the MS phases aremost suitable for electron-deficient metal boride systems.In the Ag-B and Au-B systems the MS phases are lessunstable than the corresponding diborides with the AlB2
prototype but they still have positive formation energies.In the Mg-B system the MS phases are metastable andcould possibly exist only as a defect in MgB2.
iii. The MS-LiB phases present a special case amongthe MS metal borides: lithium has the right size andvalence to stabilize the hexagonal layers of boron at 1:1
composition. The MS lithium monoboride phases areshown to have lower formation enthalpy with respect tothe experimentally observed nearly stoichiometric LiBy
phases under hydrostatic pressure. This encouragingresult suggests that the new superconducting MS-LiBphases might form under proper conditions. The lowestrequired pressure depends on the position of boron-richphases in the Li-B phase diagram and could be as low asseveral GPa.
iv. For a more complete description of the Li-B sys-tem we introduce a simple model of the off-stoichiometricLiBy phases which explains the available experimentaldata. We demonstrate that because of the weak cor-relation between the boron and lithium sublattices thecompound can easily adapt to an optimal composition,which corresponds to an optimal level of boron dopingwith the Fermi level lying near the bottom of the pseu-dogap. Interestingly, these phases turn out to be stableover a range of concentrations around y = 0.9, in excel-lent agreement with experiment. We list the relaxed unitcell parameters which should be helpful in the determi-nation of the LiBy composition.
v. We consider the MBy phases for other alkali-metalborides and find that these compounds also benefit fromgoing off-stoichiometry, only in this case they prefer tolose some metal. The ensuing gain in enthalpy doesnot make them stable under ambient conditions, howeverthese phases might form under hydrostatic pressure. Syn-thesis of the MBy phases (M = Na, K, Rb, Cs) would pro-vide valuable information on how linear chains of boroncould be stabilized.
We thank M. Calandra, F.H. Cocks, V. Crespi, P. Lam-mert, E. Margine, and J. Sofo for valuable discussions.We acknowledge the San Diego Supercomputer Centerfor computational resources.
[1] J. Nagamatsu, N. Nakagawa, T. Muranaka, Y. Zenitani,and J. Akimitsu, Nature 410, 63 (2001).
[2] J. Kortus, I.I. Mazin, K.D. Belashchenko, V.P. Antropov,and L.L. Boyer, Phys. Rev. Lett. 86, 4656 (2001).
[3] I.R. Shein, N.I. Medvedeva, and A.L. Ivanovskii, Phys.Solid State, 43 2213 (2001).
[4] T. Oguchi, J. Phys. Soc. Jpn. 71, 1495 (2002).[5] R.J. Cava, H.W. Zandbergen, and K. Inumaru, Physica
C 385, 8 (2003).[6] P. Zhang, S.G. Louie, and M.L. Cohen, Phys. Rev. Lett.
94, 225502 (2005).[7] H. Rosner, A. Kitaigorodsky, and W.E. Pickett, Phys.
Rev. Lett. 88, 127001 (2002).[8] A.M. Fogg, J.B. Claridge, G.R. Darling and M.J. Ros-
seinsky, Chemical Communications 12 1348 (2003).[9] A.N. Kolmogorov and S. Curtarolo, Phys. Rev. B 73,
180501(R) (2006).[10] I.R. Shein, N.I.Medvedeva, and A.L. Ivanovskii,
cond-mat/0412426 (2004).
14
[11] S.K. Kwon, S.J. Youn, K.S. Kim, and B.I. Min,cond-mat/0106483 (2001).
[12] R. Tomita, H. Koga, T. Uchiyama, and L. Iguchi, J. Phys.Soc. Jpn. 73, 2639 (2004).
[13] P. Villars, K. Cenzual, J. L. C. Daams, F. Hulliger, T.B. Massalski, H. Okamoto, K. Osaki, A. Prince, and S.Iwata, Crystal Impact, Pauling File. Inorganic Materi-
als Database and Design System, Binaries Edition, ASMInternational, Metal Park, OH (2003)
[14] To facilitate comparison with experiment we use the LiBy
notation for boron-deficient lithium monoboride phases.Concentration of boron is denoted as y instead of x toavoid confusion with the alternative notation LixB1−x
(y = (1 − x)/x).[15] G. Kresse and J. Hafner, Phys. Rev. B 47, 558 (1993).[16] G. Kresse and J. Furthmuller, Phys. Rev. B 54, 11169
(1996).[17] P.E. Blochl, Phys. Rev. B 50, 17953 (1994).[18] J.P. Perdew, K. Burke, and M. Ernzerhof, Phys. Rev.
Lett. 77 3865 (1996).[19] G. Kresse and D. Joubert, Phys. Rev. B 59, 1758 (1999).[20] J.D. Pack and H.J. Monkhorst, Phys. Rev. B 13, 5188
(1976); 16, 1748 (1977).[21] An augmented plane wave+local orbitals program for cal-
culating crystal properties P. Blaha, K. Schwarz, G.K.H.Madsen, D. Kvasnicka, and J. Luitz, WIEN2K, KarlheinzSchwarz, Technical Universitdt Wien, Austria, 2001.
[22] A. Masago, K. Shirai, and H. Katayama-Yoshida, Phys.Rev. B 73, 104102 (2006).
[23] S. Curtarolo, D. Morgan, K. Persson, J. Rodgers, and G.Ceder, Phys. Rev. Lett. 91, 135503 (2003).
[24] D. Morgan, G. Ceder, and S. Curtarolo, Meas. Sci. Tech-nol. 16, 296 (2005).
[25] Description of the methods and calculation details canbe found in [23].
[26] R. Magri, S.-H. Wei, and A. Zunger, Phys. Rev. B 42,11388 (1990). V. Ozolins, C. Wolverton, and A. Zunger,Phys. Rev. B 57, 6427 (1998).
[27] MS1: 4 atoms in the primitive unit cell, space groupR3m (#166). a = b, α = β = 90◦, γ = 120◦, Wyckoffpositions: M (0,0,1/6 − zM/6), B (0,0,1/3+δ).
[28] MS2: 8 atoms, space group P63/mmc (#194). a = b,α = β = 90◦, γ = 120◦, Wyckoff positions: M(4f) (1/3,2/3,1/4 − zM/4), B1 (2b) (0,0,1/4), B2 (2d)(1/3,2/3,3/4).
[29] MS3: 5 atoms, space group P6m2 (#187). a = b,α = β = 90◦, γ = 120◦, Wyckoff positions: M1 (2g)(0,0,zM ), M1 (1d) (1/3,2/3,1/2), B1 (1c) (1/3,2/3,0), B2(1e) (2/3,1/3,0).
[30] Y. Zhu, L. Wu, V. Volkov, Q. Li, G. Gu, A.R. Mooden-baugh, M. Malac, M. Suenaga, and J. Tranquada, Phys-ica C 356, 239 (2001).
[31] Y. Yan and M.M. Al-Jassim, Phys. Rev. B 66, 052502(2002).
[32] δ: 3 atoms in the primitive unit cell, space group Cmmm(#50). α = β = γ = 90◦, Wyckoff positions: M (2c)(1/2,0,1/2), B (x,0,0). δ-AuB2: a = 5.762 A, b = 2.721A, c = 4.328 A, x = 0.3498.
[33] S. Curtarolo, D. Morgan, and G. Ceder, Calphad 29,163-211 (2005).
[34] S. Curtarolo, A. N. Kolmogorov, and F. H. Cocks, Cal-phad 29, 155-161 (2005).
[35] Li, Na, K, Rb, and Cs have nearly degenerate bcc and
fcc energies at zero pressure.
[36] G. Mair, R. Nesper, and H.G. von Schnering, J. SolidState Chem. 75, 30 (1988).
[37] G. Mair, H.G. von Schnering, W. Worle, and R. Nesper,Z. Anorg. Allg. Chem. 625, 1207 (1999).
[38] Z. Liu, X. Qu, B. Huang, and Z. Li, J. Alloys Compd.311, 256 (2000).
[39] H. Rosner and W.E. Pickett, Phys. Rev. B 67, 054104(2003).
[40] H.B. Borgstedt and C. Guminski, J. Phase Equilibria 24,572 (2003).
[41] B. Albert, Eur. J. Inorg. Chem. 2000, 1679 (2000).[42] F.E. Wang, M.A. Mitchell, R.A. Sutula, J.R. Holden, and
L.H. Bennett, J. Less-Common Met. 61, 237 (1978).[43] F.E. Wang, Metall. Trans. A 10, 343 (1979).[44] S. Dallek, D.W. Ernst, and B.F. Larrick, J. Electrochem.
Soc. 126, 866 (1979).[45] According to our ab initio results this structure has large
positive formation energy (0.5 eV/atom).[46] M. Worle and R. Nesper, Angew. Chem. Int. Ed. 39,
2349 (2000).[47] A. N. Kolmogorov and V. H. Crespi, Phys. Rev. Lett. 85,
4727 (2000); T. Vukovic, M. Damnjanovic, I. Milosevic,Phisica E 16, 259-268 (2003).
[48] J.H. Xu, T. Oguchi, and A.J. Freeman, Phys. Rev. B 35,6940 (1987); P. Ravindran, L. Fast, P.A. Korzhavyi, B.Johansson, J. Wills, and O. Eriksson, J. Appl. Phys. 84,4891 (1998).
[49] The difference of the equilibrium boron-boron
bond lengths in the LiBy and B1/y phasescaused by the constant stress from the lithiumsublattice (FLi+ = 0.76 eV/A) is found asaLiBy − aB−1/y =−FLi+/(∂2EB−1/y (a)/∂a2), where
∂2EB−1/y (a)/∂a2 is 26.5 eV/A2 at y=1 and 22.8 eV/A2
at y=0.8.[50] In fact, if we define H∗ as the intersection of the tangent
and the x = 0.5 line in Fig. 6 (H∗ ≡ −0.5 × tangent),then H∗ is lower than HMS2−LiB by approximately 40meV/atom for all the pressures considered.
[51] M. Hanfland, K. Syassen, N. E. Christensen, and D. L.Novikov, Nature 408, 174 (2000).
[52] B. Albert, Angew. Chem. 110, 1135 (1998); B. Albertand K. Hofmann, Z. Anorg. Allg. Chem. 625, 709 (1999).
[53] R. Naslain and J. Etourneau, Compt. Rend. 263, 484(1966).
[54] B. Albert, K. Hofmann, C. Fild, H. Eckert, M. Schleifer,and R. Gruehn, Chem.-Eur. J. 6, 2531 (2000).
[55] B. Aronsson, E. Stenberg, and J. Aselius, Acta Chem.Scand. 14, 733 (1960).
[56] H.B. Michaelson, J. Appl. Phys. 48, 4729 (1977).[57] Work functions of a [111] monolayer of different metals
are likely to follow the same order as those of bulk struc-ture.
[58] RAgMT = 2.0 a.u., RB
MT = 1.6 a.u., and RMT ·Kmax = 8.0.[59] T. Sun, Y.G. Zhao, R. Fan, X.P. Zhang, B.G. Liu, Y.H.
Xiong, and P.J. Li, J. Superconductivity 17, 473 (2004).[60] A. Shukla, M. Calandra, M. d’Astuto, M. Lazzeri, F.
Mauri, C. Bellin, M. Krisch, J. Karpinski, S. M. Kazakov,J. Jun, D. Daghero, and K. Parlinski, Phys. Rev. Lett.90, 095506 (2003).
[61] M. Calandra, A.N. Kolmogorov, and S. Curtarolo, in
preparation.
Related Documents