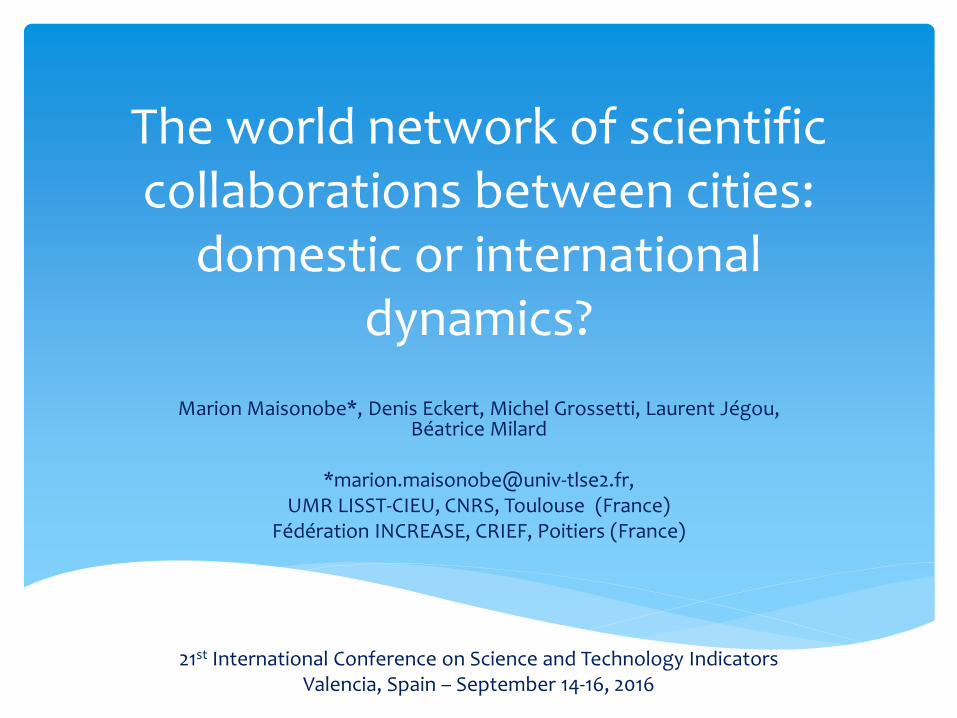
The world network of scientific collaborations between cities: domestic or international dynamics? Marion Maisonobe*, Denis Eckert, Michel Grossetti, Laurent Jégou, Béatrice Milard *[email protected], UMR LISST-CIEU, CNRS, Toulouse (France) Fédération INCREASE, CRIEF, Poitiers (France) 21 st International Conference on Science and Technology Indicators Valencia, Spain – September 14-16, 2016

Welcome message from author
This document is posted to help you gain knowledge. Please leave a comment to let me know what you think about it! Share it to your friends and learn new things together.
Transcript
The world network of scientific collaborations between cities:
domestic or international dynamics?
Marion Maisonobe*, Denis Eckert, Michel Grossetti, Laurent Jégou, Béatrice Milard
UMR LISST-CIEU, CNRS, Toulouse (France) Fédération INCREASE, CRIEF, Poitiers (France)
21st International Conference on Science and Technology Indicators Valencia, Spain – September 14-16, 2016

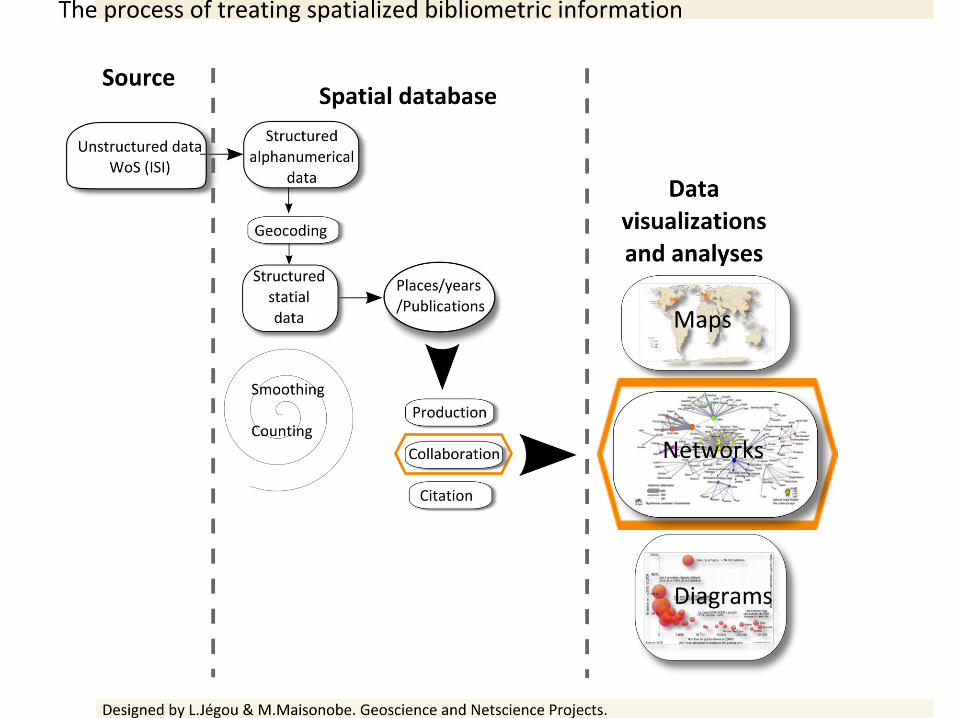
Dataset : the SCI Expanded
More than a million publications per year between 1999 and 2010
Two step method
1. Geocode addresses of authors for each publication
2. Assign data at the urban area level
Analyze the spatial distribution of scientific activity and exchanges between cities through co-authorship data
Dataset and method

Web visualization tool shared among all project participants to control the results of automatic geocoding processes and delineate urban areas’ perimeters (developed in 2010 with OpenLayers)

Counting method : the case of an article co-signed by 16 authors in Paris and Toulouse
An only link :
Paris-Toulouse
Value = 1
Publication weight :
Paris = 0,5
Toulouse = 0,5
Whole Normalised Counting (Gauffriau et al, 2008)

The geography of contemporary scientific activities
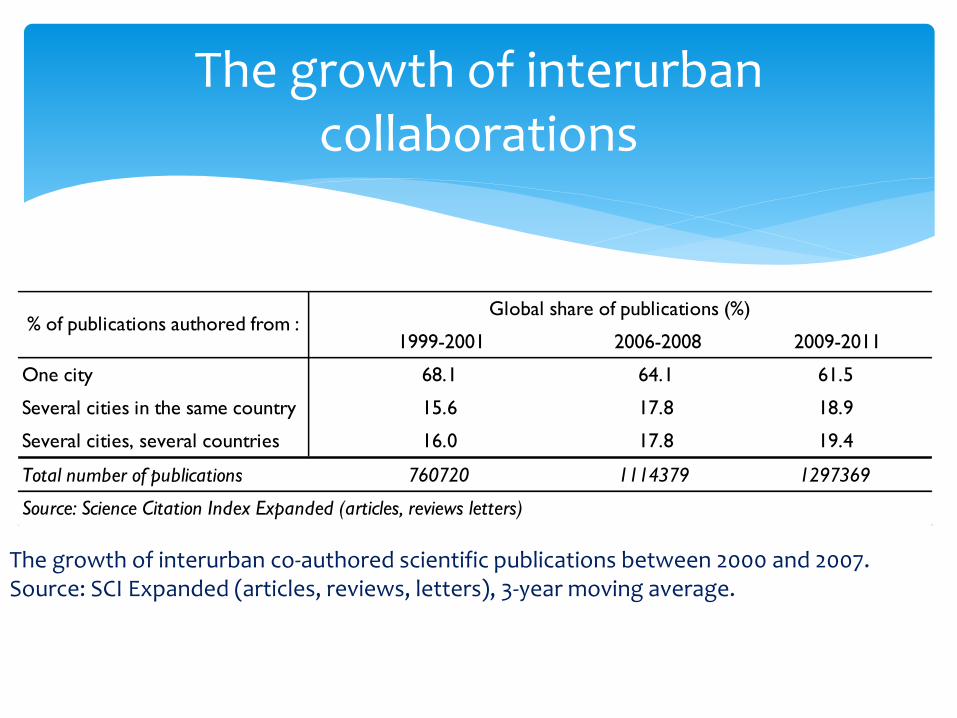
The growth of interurban collaborations
The growth of interurban co-authored scientific publications between 2000 and 2007. Source: SCI Expanded (articles, reviews, letters), 3-year moving average.
1999-2001 2006-2008 2009-2011
One city 68.1 64.1 61.5
Several cities in the same country 15.6 17.8 18.9
Several cities, several countries 16.0 17.8 19.4
Total number of publications 760720 1114379 1297369
Source: Science Citation Index Expanded (articles, reviews letters)
% of publications authored from :Global share of publications (%)

Among the 35 most co-authoring countries (2007*)
% of the country in the whole interurban co-authorship (2007*)
Domestic co-authorship evolution (2000-2007) n-fold**
International co-authorship evolution (2000-2007) n-fold**
Czech-Republic 0.5 1.45 ↗↗ 0.85 ↘↘
Poland 1.0 1.38 ↗↗ 0.85 ↘↘
Portugal 0.6 1.36 ↗↗ 0.85 ↘↘
Greece 0.6 1.35 ↗↗ 0.83 ↘↘
Hungary 0.4 1.33 ↗↗ 0.90 ↘↘
Turkey 1.0 1.30 ↗↗ 0.63 ↘↘
Iran 0.5 1.28 ↗↗ 0.73 ↘↘
Brazil 2.0 1.25 ↗↗ 0.69 ↘↘
Russia 1.4 1.23 ↗↗ 0.90 ↘↘
Mexico 0.6 1.20 ↗↗ 0.89 ↘↘
Israel 0.7 1.18 ↗↗ 0.92 ↘↘
Belgium 1.1 1.14 ↗↗ 0.94 ↘↘
Taiwan 1.5 1.13 ↗↗ 0.74 ↘↘
India 1.7 1.12 ↗↗ 0.84 ↘↘
China 7.3 1.10 ↗↗ 0.82 ↘↘
Countries with growing domestic co-authorship

Among the 35 most co-authoring countries (2007*)
% of the country in the whole interurban co-authorship (2007*)
Domestic co-authorship evolution (2000-2007) n-fold**
International co-authorship evolution (2000-2007) n-fold**
Spain 2.6 1.08 ↗ 0.94 ↘
Argentina 0.4 1.07 ↗ 0.96 ↘
Denmark 0.8 1.07 ↗ 0.97 ↘
Austria 0.7 1.06 ↗ 0.99 ↘
Netherlands 2.1 1.04 ↗ 0.97 ↘
Australia 2.0 1.02 ↗ 0.99 ↘
South-Korea 2.1 1.02 ↗ 0.97 ↘
Finland 0.8 1.02 ↗ 0.98 ↘
Switzerland 1.4 1.01 - 1.00 - Norway 0.6 1.01 - 0.99 - Germany 6.8 1.01 - 0.99 - Italy 4.0 1.01 - 0.99 - Canada 3.3 1.00 - 1.00 - France 5.0 1.00 - 1.00 -
Countries with slightly stable interurban collaboration pattern

Among the 35 most co-authoring countries (2007*)
% of the country in the whole interurban co-authorship (2007*)
Domestic co-authorship evolution (2000-2007) n-fold**
International co-authorship evolution (2000-2007) n-fold**
United-States 26.7 0.99 ↘ 1.03 ↗
Japan 6.5 0.98 ↘ 1.06 ↗
Sweden 1.4 0.97 ↘ 1.02 ↗
United-Kingdom 6.1 0.90 ↘ 1.10 ↗↗
South-Africa 0.4 0.89 ↘↘ 1.07 ↗↗
New-Zealand 0.4 0.86 ↘↘ 1.08 ↗↗
Total of the 35 countries
95.0 1.03 ↗ 0.97 ↘
World total 100 1.02 ↗ 0.97 ↘
A few internationalising countries
*Normalized counting (WNC), 3-years moving average. Source: SCIExp (articles, reviews, letters) ** % co-authorship 2007 / % co-authorship 2000 Key: The % of domestic interurban co-authorship of Czech-Republic have been multiplied by 1.45 between 2000 and 2007

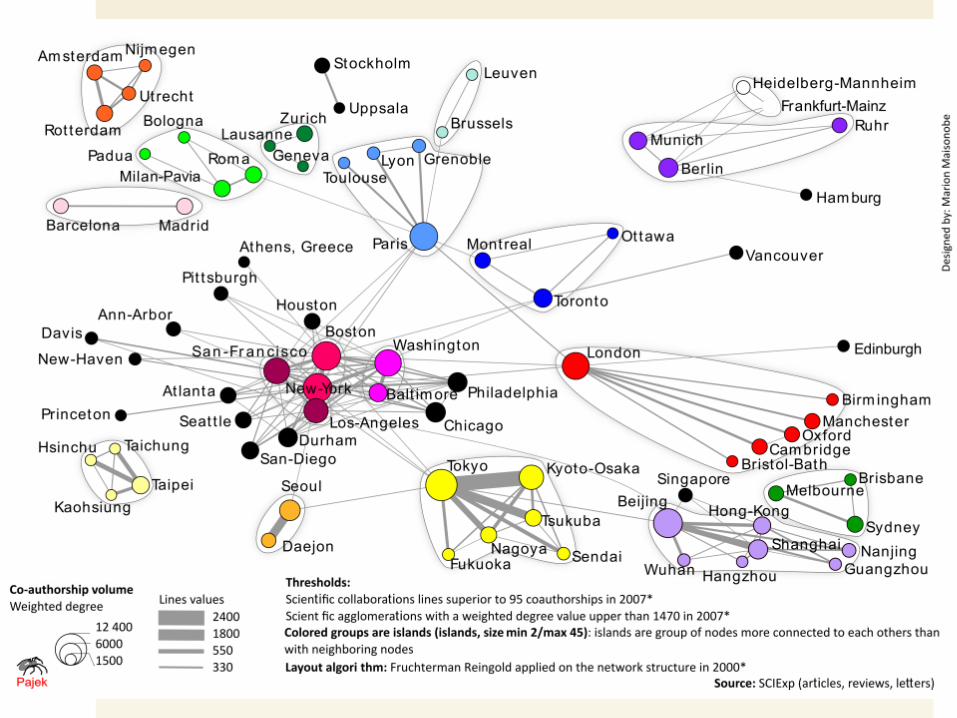
The top publishing cities in 2007*
Dynamic of the domestic co-authorship (2000-2007) n-fold *
Dynamic of the international co-authorship (2000-2007) n-fold*
Moscow 1.27 ↗↗ 0.92 ↘
Taipei 1.21 ↗↗ 0.76 ↘
Hong Kong 1.20 ↗↗ 0.81 ↘
Beijing 1.14 ↗↗ 0.81 ↘
Melbourne 1.11 ↗↗ 0.94 ↘
Madrid 1.11 ↗↗ 0.94 ↘
Munich 1.07 ↗ 0.95 ↘
Barcelona 1.07 ↗ 0.97 ↘
Shanghai 1.05 ↗ 0.93 ↘
Montreal 1.04 ↗ 0.98 ↘
Roma 1.03 ↗ 0.97 ↘
Toronto 1.02 ↗ 0.99 ↘
Cities with growing domestic co-authorship

The top publishing cities in 2007*
Dynamic of the domestic co-authorship (2000-2007) n-fold *
Dynamic of the international co-authorship (2000-2007) n-fold*
Seoul 1.01 - 0.99 -
Paris 1.01 - 1.00 -
San Francisco Bay 1.00 - 1.01 -
Berlin 0.99 - 1.00 -
Washington-Bethesda 0.99 - 1.01 -
Durham Research Triangle 0.99 - 1.02 -
Philadelphia 0.99 - 1.02 -
Kyoto-Osaka 0.99 - 1.02 -
Chicago 0.99 - 1.02 -
Milan-Pavia 0.99 - 1.01 -
New York 0.98 ↘ 1.03 ↗
Tokyo 0.98 ↘ 1.04 ↗
Sydney 0.98 ↘ 1.01 ↗
Los Angeles 0.98 ↘ 1.04 ↗
Baltimore 0.98 ↘ 1.06 ↗
Boston 0.95 ↘ 1.08 ↗
London 0.86 ↘↘ 1.09 ↗↗
Key: The % of domestic interurban co-authorship of Moscow have been multiplied by 1.27 between 2000 and 2007
A few inter-nationalising
world cities…


A more diversified (less concentrated) spatial distribution of the world scientific enterprise
An increasing integration of emerging national systems of research
The growing embeddedness of “world cities” into their national space
Conclusion

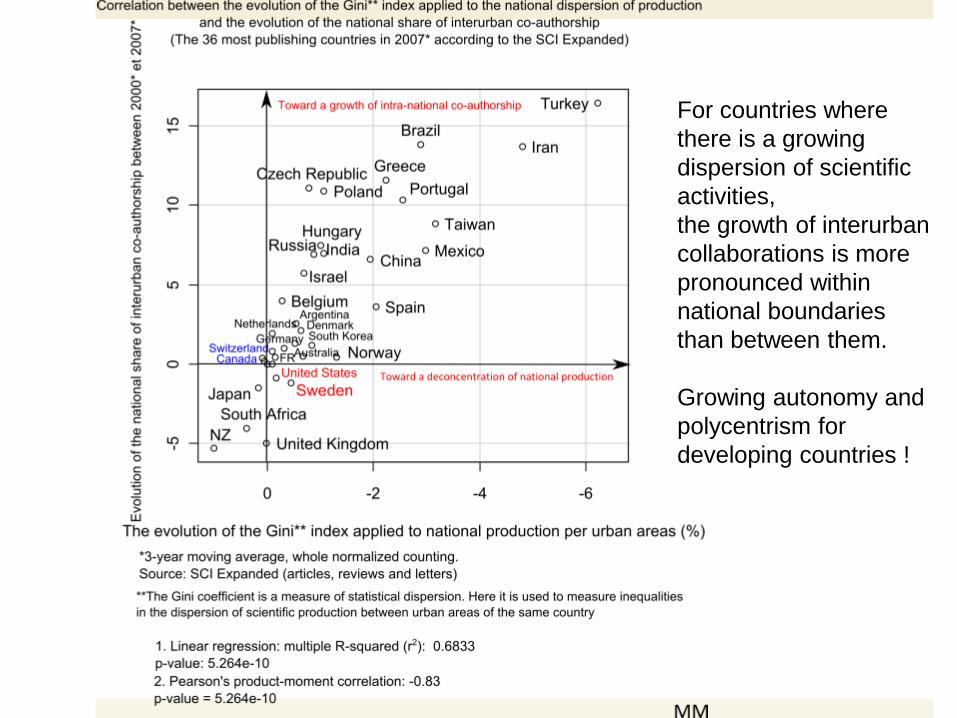
For countries where
there is a growing
dispersion of scientific
activities,
the growth of interurban
collaborations is more
pronounced within
national boundaries
than between them.
Growing autonomy and
polycentrism for
developing countries !
Related Documents