The State of Policies and Programme Implementation of the Global Strategy for Infant and Young Child Feeding in 51 Countries ARE OUR BABIES FALLING THROUGH THE GAPS? 2012 The World Breastfeeding Trends Initiative (WBT ) i

Welcome message from author
This document is posted to help you gain knowledge. Please leave a comment to let me know what you think about it! Share it to your friends and learn new things together.
Transcript
The State of Policies and Programme Implementation of theGlobal Strategy for Infant and Young Child Feeding in 51 Countries
ARE OUR BABIESFALLING THROUGH
THE GAPS?
2012
The World Breastfeeding Trends Initiative (WBT )i
Supported byPublished by
The State of Policies and Programme Implementation of theGlobal Strategy for Infant and Young Child Feeding in 51 Countries
ARE OUR BABIESFALLING THROUGH
THE GAPS?
2012
The World Breastfeeding Trends Initiative (WBT )i
iiAre our babies falling through the gaps?
Are our babies falling through the gaps?
Copyright © BPNI / IBFAN-Asia, 2012
Arun Gupta, Radha Holla, J.P. Dadhich and Beena Bhatt
Amit Dahiya
BPNI / IBFAN Asia
BP-33, Pitampura, Delhi 110 034, India.Tel: +91-11-, 27343608, 42683059
Tel/Fax: +91-11-27343606. Email: [email protected]
Website: www.ibfanasia.org
REPORT WRITING AND PRODUCTIONWriting & Edited by:
Design & Layout:
PUBLISHED BY
ISBN No.: 978-81-88950-36-2
�
�
�
�
Reviewed by:
Photo Credits :
MartaTrejos and Joyce Chanetsa
IBFAN Africa, UNICEF Egypt,WABA, Ines Fernandez and Nupur Bidla
All rights are reserved by the Breastfeeding Promotion Network of India (BPNI) / International
Baby Food Action (IBFAN) Asia. The use of the report on 'The State of Breastfeeding in 33
Countries' for education or information purpose, reproduction and translation, is encouraged.
Any part of this publication may be freely reproduced, as long as the meaning of the text is not
altered and appropriate acknowledgment and credit is given to this publication.
The designations employed and the presentation of the material in this work do not imply the
expression on any opinion whatsoever on the part of IBFAN Asia and BPNI concerning the legal
status of any country,territory,city or area of its authorities,or concerning the delimitation of its
frontiers and boundaries.
Acknowledgements
Several people have been involved in the World Breastfeeding Trends Initiative (WBT ) in 51 countries
carrying out the assessment, identifying gaps, making recommendations, preparing national reports
and report cards, and preparing the global report.
I would firstly like to thank governments and national IBFAN leaders who took part; their commitment to
improving IYCF is the pillar on which enhancing breastfeeding rates rests.
The Swedish International Development Agency (Sida) and Norwegian Agency for Development
Cooperation (NORAD), have been associated with WBT process since its inception. IBFAN and gBICS are
grateful for their support of the Strategic Plan of IBFAN Asia 2008-2012; WBT has been central to this.
IBFAN regional coordinators took on the challenge of mobilizing countries to conduct the WBT
assessments. The entire exercise was supported by the World Alliance for Breastfeeding Action (WABA)
and its core partners. I would like to thank to the global leadership team members of both IBFAN and
WABA for being with us and supporting us at every step.
At the IBFAN Asia Regional Coordination Office, all the staff have contributed in some way or another to
the WBT process. I am so grateful to them for their untiring work. Beena in particular for liaisoning with
regional and country coordinators, verifying data, managing the website and uploading country data. JP
and Radha for their assistance in development of the global report - the conceptualization, analysis,
writing, etc. Amit for the design of report and overseeing production of the report and several other vital
actions to ensure that the report is brought out in time. A very special and heartfelt thanks to PK Sudhir,
Veena, Arniika, Fariha, Manish, Neelima, Nupur, Shoba for their assistance at any time. Managing funds,
Guptaji has always been so helping.
I would also like to thank office assistants who have been doing all the background work and never in
picture, Vinay, Suresh, Vijay and Ashok, they played truly very useful role.
The WBT is an ongoing process of assessment, action, re-assessment, followed by further action to
enhance optimal infant and young child feeding practices. I would finally like to thank all persons who
have committed themselves to achieving this end, because for it is through their vision, their mission and
their actions that the aim of the WBT initiative is achieved.
Dr. Arun Gupta, MD FIAP
Regional Coordinator, IBFAN Asia
i
i
i
i
i
i
i
iiiAre our babies falling through the gaps?
Acronyms
BPNI Breastfeeding Promotion Network of India
DALYs Disability Adjusted LifeYears
gBICS global Breastfeeding Initiative for Child Survival
Global Strategy Global Strategy for Infant andYoung Child Feeding
GLOPAR Global Participatory Action Research
IBFAN International Baby Food Action Network
ICDC International Code Documentation Centre
ILO International Labour Organisation
IYCF Infant andYoung Child Feeding
MDGs Millennium Development Goals
Norad Norwegian Agency for Development Cooperation
RCO Regional Coordinating Office
Sida Swedish International Development Agency
UNICEF United Nations Children's Fund
WABA World Alliance for Breastfeeding Action
WBT World BreastfeedingTrends Initiative
WHO World Health Organization
i
ivAre our babies falling through the gaps?
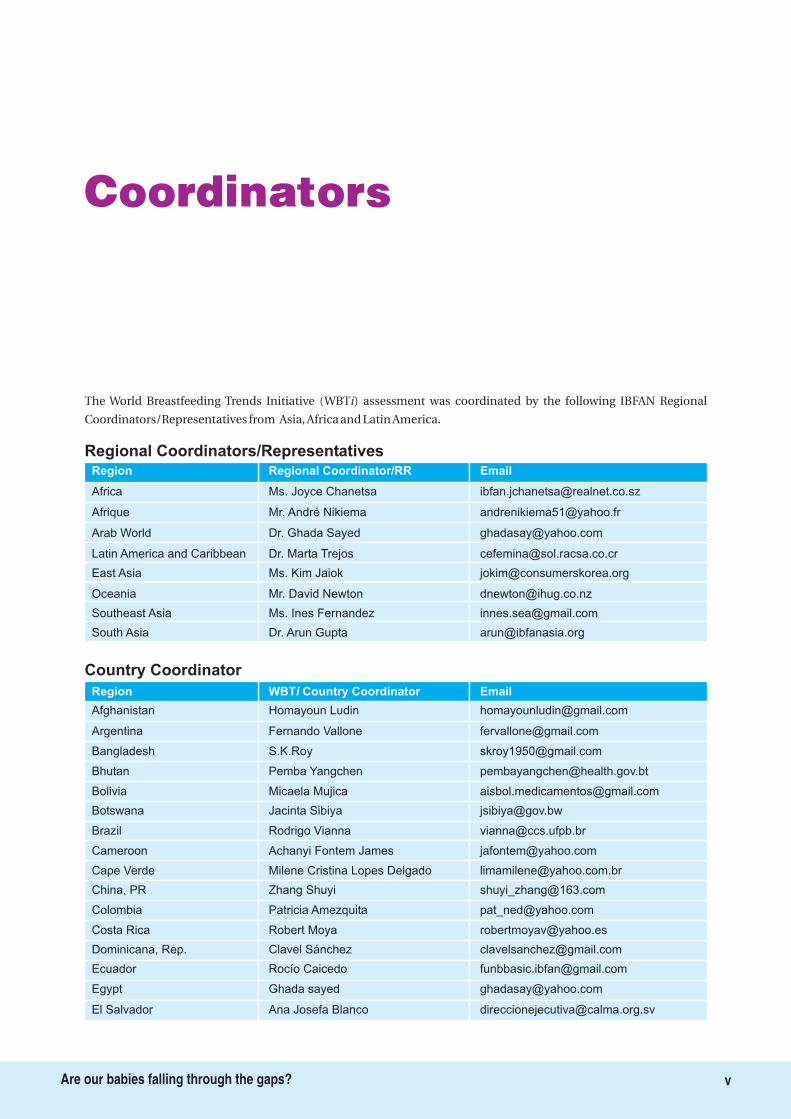
The World Breastfeeding Trends Initiative (WBT ) assessment was coordinated by the following IBFAN Regional
Coordinators/Representatives from Asia, Africa and Latin America.
i
Coordinators
Regional Coordinators/RepresentativesRegion Regional Coordinator/RR Email
Africa Ms. Joyce Chanetsa [email protected]
Afrique Mr. André Nikiema [email protected]
Arab World Dr. Ghada Sayed [email protected]
Latin America and
East Asia Ms. Kim Jaiok [email protected]
Oceania Mr. David Newton [email protected]
Southeast Asia Ms. Ines Fernandez [email protected]
South Asia Dr. Arun Gupta [email protected]
Caribbean Dr. Marta Trejos [email protected]
Country Coordinator
Region WBT Country Coordinator Emaili
Afghanistan Homayoun Ludin [email protected]
Argentina Fernando Vallone [email protected]
Bangladesh S.K.Roy [email protected]
Bhutan Pemba Yangchen [email protected]
Bolivia Micaela Mujica [email protected]
Botswana Jacinta Sibiya [email protected]
Brazil Rodrigo Vianna [email protected]
Cameroon Achanyi Fontem James [email protected]
Cape Verde Milene Cristina Lopes Delgado [email protected]
China, PR Zhang Shuyi [email protected]
Colombia Patricia Amezquita [email protected]
Costa Rica Robert Moya [email protected]
Dominicana, Rep. Clavel Sánchez [email protected]
Ecuador Rocío Caicedo [email protected]
Egypt Ghada sayed [email protected]
El Salvador Ana Josefa Blanco [email protected]
vAre our babies falling through the gaps?
Country Coordinator
Region WBT Country Coordinator Emaili
Fiji Ateca Kama [email protected]
Gambia Bakary J.S. Jallow bakaryjallow24yahoo.co.uk
Ghana Wilhelmina Okwabi [email protected]
Guatemala Vilma Chaves [email protected]
Hong Kong Patricia [email protected]
India J.P. Dadhich [email protected]
Indonesia Nia Umar [email protected]
Japan Kidokoro [email protected]
Jordan Hanan Najmi [email protected]
Kenya Terry Wefwafwa [email protected]
Kiribati Ntaene Tanua [email protected]
Korea, Rep. Kim Jaiok [email protected]
Kuwait Mona Al Sumaie [email protected]
Lebanon Ali El Zein [email protected]
Lesotho Thithidi Diaho [email protected]
Malawi Janet Guta [email protected]
Maldives Nasheed Hanan Ahmed [email protected]
Mexico Marcos Arana [email protected]
Mongolia Gochoo Soyolgerel [email protected]
Mozambique Mércia Cristina Paulo Tembe [email protected]
Nepal Prakash Sundar Shrestha [email protected]
Nicaragua Ninoska Cruz [email protected]
Pakistan Zareef khan [email protected]
Philippines Ines AV. Fernandez [email protected]
Peru Ana Vazquez [email protected]
Sao Tome and Principe Armanda Gani [email protected]
Saudi Arabia Anne Batterjee [email protected]
Sri Lanka Renuka Jayatissa [email protected]
Swaziland Percy Chipepere [email protected]
Taiwan (ROC) Leh-Chi Chwang [email protected]
Thailand Yupayong Hangchaovanich [email protected]
Uganda Gerald Onyango [email protected]
Uruguay Florencia Cerruti [email protected]
Venezuela Eunice Lample [email protected]
Vietnam Bui Hong Van [email protected]
Zambia Raider Habulembe Mugode [email protected]
Zimbabwe Ancikaria Chigumira [email protected]
viAre our babies falling through the gaps?
Foreword
Measurement is critical to assess the degree of implementation of policies and programs to protect,
promote and support breastfeeding, as well as to assess trends through time. Limited knowledge
about the scale and distribution of inadequate breastfeeding policies and programs has hampered action
to correct the problems identified and advocate for the resources needed. To date a methodology that
systematically analyzes the implementation of policies and practices to foster improved breastfeeding has
not existed. The World Breastfeeding Trends Initiative (WBT ) addresses this gap by providing a
systematic method to evaluate the implementation of the World Health Organization (WHO)/UNICEF
Global of Infant and Young Child Feeding.
Adopted by the World Health Assembly and the UNICEF Executive Board in 2002, the Global Strategy for
Infant and Young Child Feeding recognized that
To address these problems, the set forth nine operational targets related to both
breastfeeding and complementary feeding. To assess progress in the implementation of the
, the World Health Organization developed a tool for assessing national practices, policies and
programs in support of infant and young child feeding. Inspired by this tool, the International Baby Food
Action Network (IBFAN) of Asia developed the WBT to track, assess and monitor infant and young child
feeding practices, policies and programs worldwide in support of breastfeeding and complementary
feeding. To provide a measure of the key factors associated with breastfeeding and complementary
feeding practices, the WBT focuses on a set of 15 indicators; five related to feeding practices and 10
related to policies and programs.
WBT provides simple, valid, and reliable indicators essential to track progress of the implementation of
policies and programs in favor of breastfeeding. It also provides an easy to interpret color coded
i
“Malnutrition has been responsible directly or indirectly,
for 60% of the 10.9 million deaths annually among children under five. Well over two-thirds of these deaths,
which are often associated with inappropriate feeding practices, occur during the first year of life. No more
than 35% of infants worldwide are exclusively breastfed for the first four months of life; complementary
feeding frequently begins too early or too late, and foods are often nutritionally inadequate or unsafe.
Malnourished children who survive are more often sick and suffer life-long consequences of impaired
development. Because poor feeding practices are a major threat to social and economic development, they
are among the most serious obstacles to attain and maintain health that face this age group.”
Global Strategy
Global
Strategy
i
i
i
viiAre our babies falling through the gaps?
presentation style to clearly communicate results to policy makers and other interested parties.
Importantly, WBT results predict improved breastfeeding practices. An analysis of 23 countries that have
reported WBTi results and that have measures of exclusive breastfeeding during the last 15 to 20 years
shows a significant association between WBTi score and increases in exclusive breastfeeding.
WBT measures the degree to which conditions are present that provide mothers with supportive
conditions at birth to initiate breastfeeding within the first hour of birth, and an optimal environment
thereafter, to practice exclusive breastfeeding for the first six months and to continue breastfeeding for
two years or more. Results generated through its application can be used for advocacy to strengthen
efforts of the United Nations, Ministries of Health, non-government organization and all stakeholders
who work to improve the breastfeeding environment globally. They can also be used to identify
weaknesses and strengths in breastfeeding policies and programs so that weaknesses can be corrected
and strengths celebrated. An old adage states that “we do what we measure”. By providing a systematic
quantifiably tool for measuring implementation of policies and programs in favor of breastfeeding, WBT
is an essential element for global efforts to protect, promote and support breastfeeding protection.
Senior Advisor, Food and Nutrition
Pan American Health Organization/World Health Organization
i
i
i
Dr. Chessa Lutter
viiiAre our babies falling through the gaps?
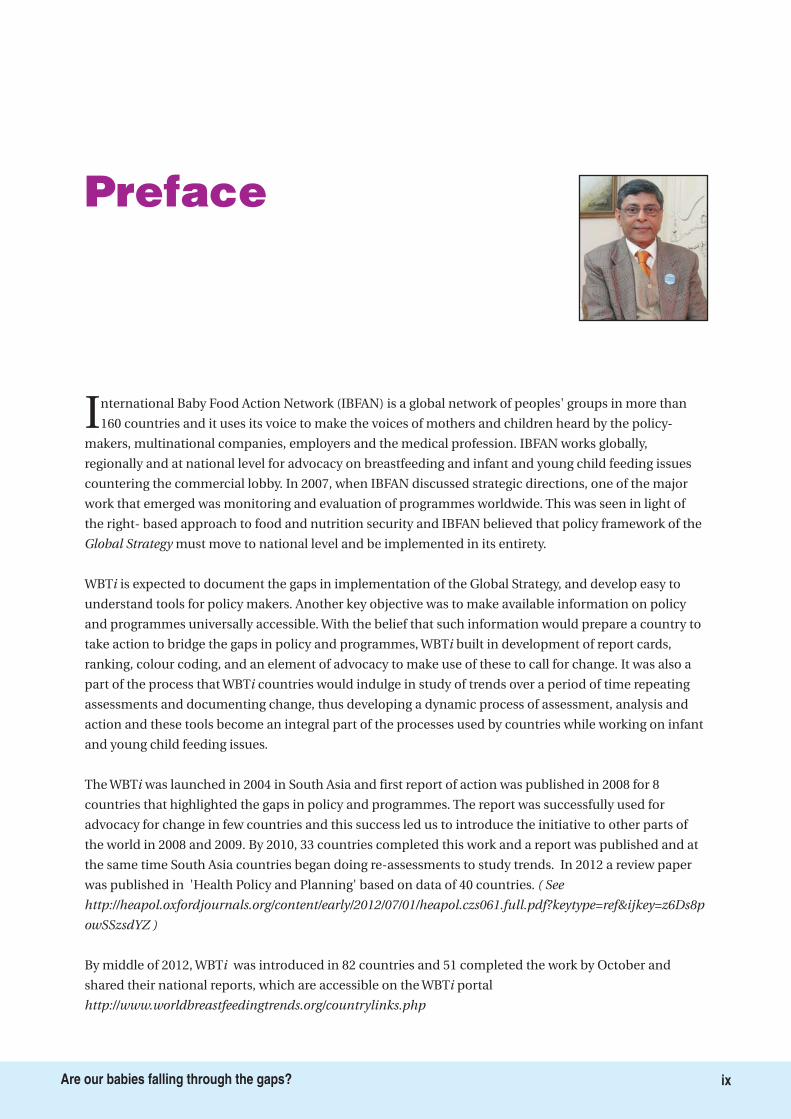
Preface
International Baby Food Action Network (IBFAN) is a global network of peoples' groups in more than
160 countries and it uses its voice to make the voices of mothers and children heard by the policy-
makers, multinational companies, employers and the medical profession. IBFAN works globally,
regionally and at national level for advocacy on breastfeeding and infant and young child feeding issues
countering the commercial lobby. In 2007, when IBFAN discussed strategic directions, one of the major
work that emerged was monitoring and evaluation of programmes worldwide. This was seen in light of
the right- based approach to food and nutrition security and IBFAN believed that policy framework of the
must move to national level and be implemented in its entirety.
WBT is expected to document the gaps in implementation of the Global Strategy, and develop easy to
understand tools for policy makers. Another key objective was to make available information on policy
and programmes universally accessible. With the belief that such information would prepare a country to
take action to bridge the gaps in policy and programmes, WBT built in development of report cards,
ranking, colour coding, and an element of advocacy to make use of these to call for change. It was also a
part of the process that WBT countries would indulge in study of trends over a period of time repeating
assessments and documenting change, thus developing a dynamic process of assessment, analysis and
action and these tools become an integral part of the processes used by countries while working on infant
and young child feeding issues.
The WBT was launched in 2004 in South Asia and first report of action was published in 2008 for 8
countries that highlighted the gaps in policy and programmes. The report was successfully used for
advocacy for change in few countries and this success led us to introduce the initiative to other parts of
the world in 2008 and 2009. By 2010, 33 countries completed this work and a report was published and at
the same time South Asia countries began doing re-assessments to study trends. In 2012 a review paper
was published in 'Health Policy and Planning' based on data of 40 countries.
By middle of 2012, WBT was introduced in 82 countries and 51 completed the work by October and
shared their national reports, which are accessible on the WBT portal
Global Strategy
i
i
i
i
( See
http://heapol.oxfordjournals.org/content/early/2012/07/01/heapol.czs061.full.pdf?keytype=ref&ijkey=z6Ds8p
owSSzsdYZ )
i
i
http://www.worldbreastfeedingtrends.org/countrylinks.php
ixAre our babies falling through the gaps?
The tool has shown the potential for moving the policy from paper to practice as we hear from country
after country taking action to set in place some kind of mechanisms or direct action on IYCF
programmes. I hope more countries will join in over next five years and those who have already joined
would produce trend reports by then. The journey from policy to practice is an important one. While
IBFAN's regional offices in Africa, Latin America, Arab world, Oceania, Southeast Asia, and East Asia have
made use of the tool with quite impressive results, this is an idea whose time has come !
Dr Arun Gupta.
Regional Coordinator, IBFAN Asia
xAre our babies falling through the gaps?
Contents
xiAre our babies falling through the gaps?
Acknowledgements iii
Acronyms iv
Coordinators v
Foreword vii
Preface ix
Executive Summary 1
Background 8
Keeping Score 12
Glaring Gaps 15
1. National Policy, Programme and Coordination2. Baby Friendly Hospital Initiative (Ten Steps to Successful Breastfeeding)3. Implementation of the International Code4. Maternity Protection5. Health and Nutrition Care Systems6. Mother Support and Community Outreach -
Community-based Support for the Pregnant and Breastfeeding Mother7. Information Support8. Infant Feeding and HIV9. Infant Feeding during Emergencies10. Monitoring and Evaluation
The Average, is Average 551. Timely initiation of breastfeeding within one hour of birth2. Exclusive Breastfeeding3. Median duration of breastfeeding4. Bottle-feeding5. Complementary Feeding
A Long Way to Go 67
What Next? 74
WBT Works 76
AboutWBT and the Process 87
How did we do it? 91
Partners in 51 Countries 93
Methods to Derive Colour Coding/Rating 98
Bibliography 101
About IBFAN and gBICS 103
i
i
xiiAre our babies falling through the gaps?
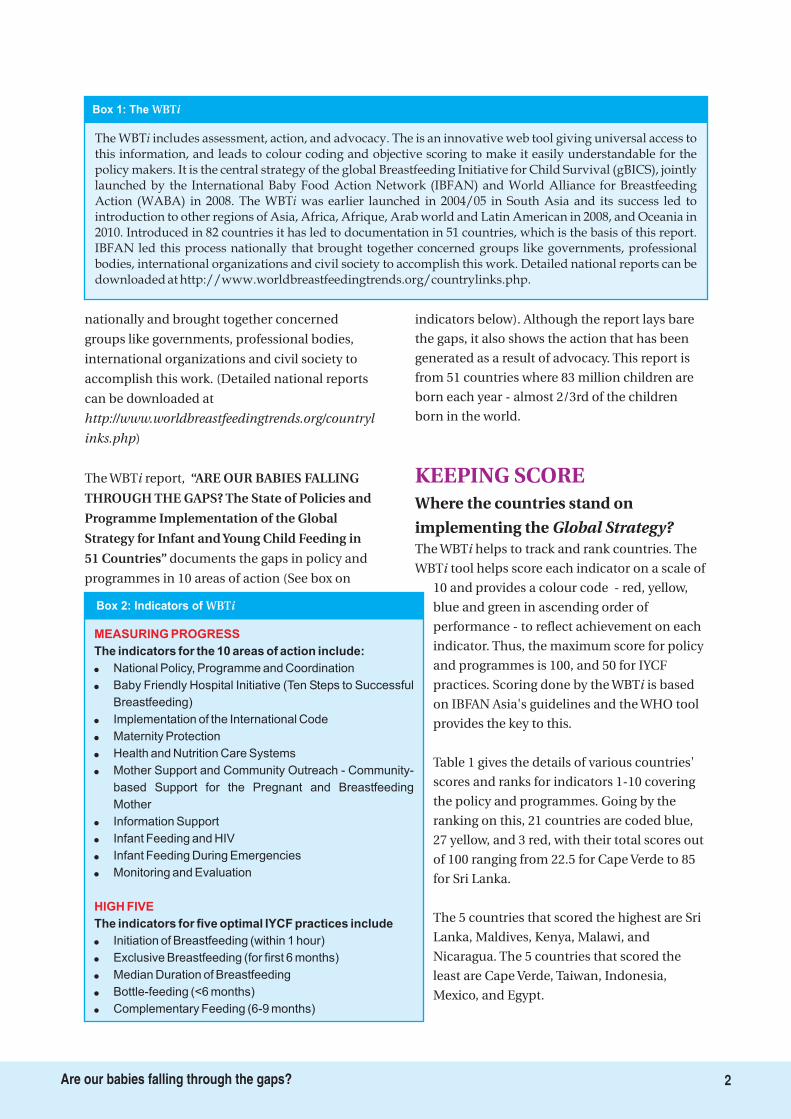
Executive Summary
Every year close to 136 million babies are born
all over the world. Of them as many as 92
million are not able to experience the WHO's
recommended optimal feeding practices:
Beginning breastfeeding within one hour, Being
exclusively breastfed for the first six months, and
Timely and appropriate complementary feeding
with continued breastfeeding after 6 months, up
to 2 years. This is in spite of the well-known
benefits of optimal feeding for a child's health,
development and survival, as well as its
advantages in long-term health in adulthood and
prevention of non-communicable diseases
(NCDs).
In order to increase the rates of
optimal feeding practices, the WHO
and UNICEF developed the Global
Strategy for Infant and Young Child
Feeding, which provides a framework
for action to scale up breastfeeding and
infant and young child feeding interventions.
They also developed a tool to monitor these
inputs.
Based on these tools, the Breastfeeding
Promotion Network of India/ International Baby
Food Action Network (IBFAN), Asia, developed
the World Breastfeeding Trends Initiative (WBT ),
which measures inputs and generates national
action. WBTi analyses the situation, documents
gaps, builds consensus and recommendations,
and stimulates governments to take some action
to bridge the gaps. The W.H.O. has recognised the
value of this action tool and the W.H.O. has
recently launched The Global database on the
Implementation of Nutrition Action (GINA)
is an
interactive platform for sharing standardized
information on nutrition policies and actions, i.e.
what are the commitments made and who is
doing what, where, when, why and how
(including lessons learnt) . It includes WBT in list
of partners and data sources..
The WBT includes assessment, action, and
advocacy. It is an innovative web tool
giving universal access to this
information, and leads to colour
coding and objective scoring to
make it easily understandable for
the policy makers. It is the central
strategy of the global Breastfeeding
Initiative for Child Survival (gBICS),
jointly launched by the International Baby
Food Action Network (IBFAN) and the World
Alliance for Breastfeeding Action (WABA) in 2008.
The WBT was earlier launched in 2004-05 in
South Asia, and its success led to its introduction
in other regions of Asia, Africa, the Arab world
and Latin America in 2008, and in Oceania in
2010.
Introduced in 82 countries, it has led to
documentation in 51 countries, which is the basis
of this report. IBFAN has led this process
i
https://extranet.who.int/nutrition/gina/
i
i
i
“…I think WBTi is areal break through inour ability to measure
inputs to improve IYCF”
Chessa Lutter. RegionalAdvisor Pan AmericanHealth Organization
1Are our babies falling through the gaps?
nationally and brought together concerned
groups like governments, professional bodies,
international organizations and civil society to
accomplish this work. (Detailed national reports
can be downloaded at
)
The WBT report,
documents the gaps in policy and
programmes in 10 areas of action (See box on
indicators below). Although the report lays bare
the gaps, it also shows the action that has been
generated as a result of advocacy. This report is
from 51 countries where 83 million children are
born each year - almost 2/3rd of the children
born in the world.
The WBT helps to track and rank countries. The
WBT tool helps score each indicator on a scale of
10 and provides a colour code - red, yellow,
blue and green in ascending order of
performance - to reflect achievement on each
indicator. Thus, the maximum score for policy
and programmes is 100, and 50 for IYCF
practices. Scoring done by the WBT is based
on IBFAN Asia's guidelines and the WHO tool
provides the key to this.
Table 1 gives the details of various countries'
scores and ranks for indicators 1-10 covering
the policy and programmes. Going by the
ranking on this, 21 countries are coded blue,
27 yellow, and 3 red, with their total scores out
of 100 ranging from 22.5 for Cape Verde to 85
for Sri Lanka.
The 5 countries that scored the highest are Sri
Lanka, Maldives, Kenya, Malawi, and
Nicaragua. The 5 countries that scored the
least are Cape Verde, Taiwan, Indonesia,
Mexico, and Egypt.
http://www.worldbreastfeedingtrends.org/countryl
inks.php
i
i
i
i
“ARE OUR BABIES FALLING
THROUGH THE GAPS? The State of Policies and
Programme Implementation of the Global
Strategy for Infant and Young Child Feeding in
51 Countries”
Where the countries stand on
implementing the Global Strategy?
KEEPING SCORE
The WBT includes assessment, action, and advocacy. The is an innovative web tool giving universal access tothis information, and leads to colour coding and objective scoring to make it easily understandable for thepolicy makers. It is the central strategy of the global Breastfeeding Initiative for Child Survival (gBICS), jointlylaunched by the International Baby Food Action Network (IBFAN) and World Alliance for BreastfeedingAction (WABA) in 2008. The WBT was earlier launched in 2004/05 in South Asia and its success led tointroduction to other regions of Asia, Africa, Afrique, Arab world and Latin American in 2008, and Oceania in2010. Introduced in 82 countries it has led to documentation in 51 countries, which is the basis of this report.IBFAN led this process nationally that brought together concerned groups like governments, professionalbodies, international organizations and civil society to accomplish this work. Detailed national reports can bedownloaded at http://www.worldbreastfeedingtrends.org/countrylinks.php.
i
i
Box 1: The WBTi
2Are our babies falling through the gaps?
MEASURING PROGRESS
HIGH FIVE
The indicators for the 10 areas of action include:
National Policy, Programme and Coordination
Baby Friendly Hospital Initiative (Ten Steps to Successful
Breastfeeding)
Implementation of the International Code
Maternity Protection
Health and Nutrition Care Systems
Mother Support and Community Outreach - Community-
based Support for the Pregnant and Breastfeeding
Mother
Information Support
Infant Feeding and HIV
Infant Feeding During Emergencies
Monitoring and Evaluation
Initiation of Breastfeeding (within 1 hour)
Exclusive Breastfeeding (for first 6 months)
Median Duration of Breastfeeding
Bottle-feeding (<6 months)
Complementary Feeding (6-9 months)
The indicators for five optimal IYCF practices include
�
�
�
�
�
�
�
�
�
�
�
�
�
�
�
Box 2: Indicators of WBTi
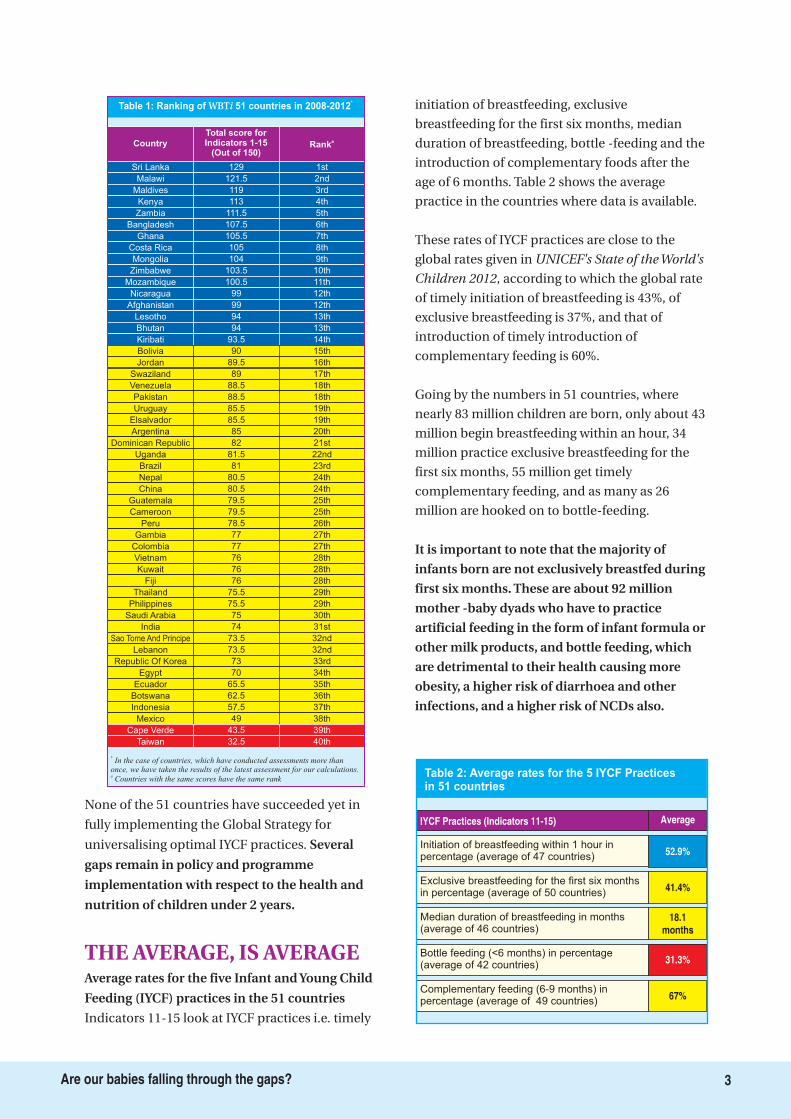
None of the 51 countries have succeeded yet in
fully implementing the Global Strategy for
universalising optimal IYCF practices.
Indicators 11-15 look at IYCF practices i.e. timely
initiation of breastfeeding, exclusive
breastfeeding for the first six months, median
duration of breastfeeding, bottle -feeding and the
introduction of complementary foods after the
age of 6 months. Table 2 shows the average
practice in the countries where data is available.
These rates of IYCF practices are close to the
global rates given in
, according to which the global rate
of timely initiation of breastfeeding is 43%, of
exclusive breastfeeding is 37%, and that of
introduction of timely introduction of
complementary feeding is 60%.
Going by the numbers in 51 countries, where
nearly 83 million children are born, only about 43
million begin breastfeeding within an hour, 34
million practice exclusive breastfeeding for the
first six months, 55 million get timely
complementary feeding, and as many as 26
million are hooked on to bottle-feeding.
Several
gaps remain in policy and programme
implementation with respect to the health and
nutrition of children under 2 years.
Average rates for the five Infant and Young Child
Feeding (IYCF) practices in the 51 countries
It is important to note that the majority of
infants born are not exclusively breastfed during
first six months. These are about 92 million
mother -baby dyads who have to practice
artificial feeding in the form of infant formula or
other milk products, and bottle feeding, which
are detrimental to their health causing more
obesity, a higher risk of diarrhoea and other
infections, and a higher risk of NCDs also.
UNICEF's State of the World's
Children 2012
THE AVERAGE, IS AVERAGE
Sri Lanka 1st
Country
Total score forIndicators 1-15
(Out of 150)Rank
a
Table 1: Ranking of 51 countries in 2008-2012WBTi *
*In the case of countries, which have conducted assessments more than
once, we have taken the results of the latest assessment for our calculations.
Countries with the same scores have the same ranka
Malawi 121.5 2nd
Maldives 119 3rd
Kenya 113 4th
Zambia 111.5 5th
Bangladesh 107.5 6th
Ghana 105.5 7th
Costa Rica 105 8th
Mongolia 104 9th
Zimbabwe 103.5 10th
Mozambique 100.5 11th
Nicaragua 99 12th
Afghanistan 99 12th
Lesotho 94 13th
Bhutan 94 13th
Kiribati 93.5 14th
Bolivia 90 15th
Jordan 89.5 16th
Swaziland 89 17th
Venezuela 88.5 18th
Pakistan 88.5 18th
Uruguay 85.5 19th
Elsalvador 85.5 19th
Argentina 85 20th
Dominican Republic 82 21st
Uganda 81.5 22nd
Brazil 81 23rd
Nepal 80.5 24th
China 80.5 24th
Guatemala 79.5 25th
Cameroon 79.5 25th
Peru 78.5 26th
Gambia 77 27th
Colombia 77 27th
Vietnam 76 28th
Kuwait 76 28th
Fiji 76 28th
Thailand 75.5 29th
Philippines 75.5 29th
Saudi Arabia 75 30th
India 74 31st
Sao Tome And Principe 73.5 32nd
Lebanon 73.5 32nd
Republic Of Korea 73 33rd
Egypt 70 34th
Ecuador 65.5 35th
Botswana 62.5 36th
Indonesia 57.5 37th
Mexico 49 38th
Cape Verde 43.5 39th
Taiwan 32.5 40th
129
Initiation of breastfeeding within 1 hour inpercentage (average of 47 countries)
52.9%
IYCF Practices (Indicators 11-15) Average
Table 2: Average rates for the 5 IYCF Practicesin 51 countries
Exclusive breastfeeding for the first six monthsin percentage (average of 50 countries)
41.4%
Median duration of breastfeeding in months(average of 46 countries)
18.1months
Bottle feeding (<6 months) in percentage(average of 42 countries)
31.3%
Complementary feeding (6-9 months) inpercentage (average of 49 countries)
67%
3Are our babies falling through the gaps?
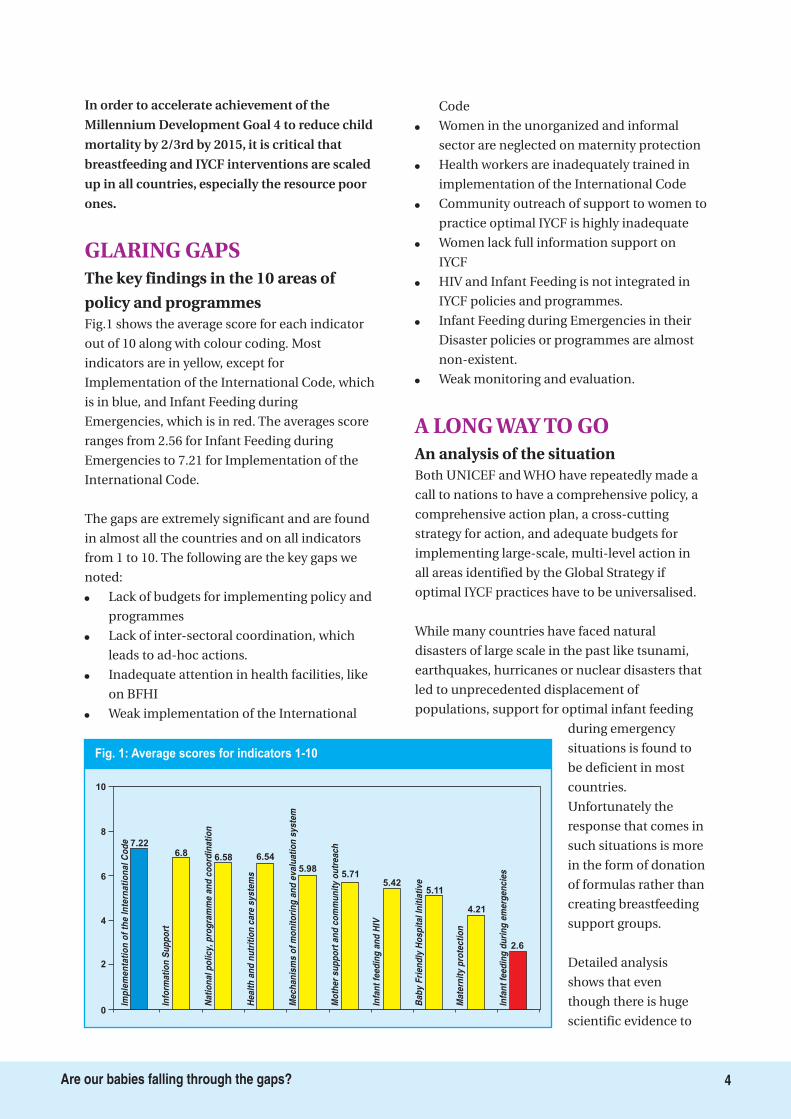
In order to accelerate achievement of the
Millennium Development Goal 4 to reduce child
mortality by 2/3rd by 2015, it is critical that
breastfeeding and IYCF interventions are scaled
up in all countries, especially the resource poor
ones.
The key findings in the 10 areas of
policy and programmes
An analysis of the situation
Fig.1 shows the average score for each indicator
out of 10 along with colour coding. Most
indicators are in yellow, except for
Implementation of the International Code, which
is in blue, and Infant Feeding during
Emergencies, which is in red. The averages score
ranges from 2.56 for Infant Feeding during
Emergencies to 7.21 for Implementation of the
International Code.
The gaps are extremely significant and are found
in almost all the countries and on all indicators
from 1 to 10. The following are the key gaps we
noted:
�
�
�
�
�
�
�
�
�
�
�
Lack of budgets for implementing policy and
programmes
Lack of inter-sectoral coordination, which
leads to ad-hoc actions.
Inadequate attention in health facilities, like
on BFHI
Weak implementation of the International
Code
Women in the unorganized and informal
sector are neglected on maternity protection
Health workers are inadequately trained in
implementation of the International Code
Community outreach of support to women to
practice optimal IYCF is highly inadequate
Women lack full information support on
IYCF
HIV and Infant Feeding is not integrated in
IYCF policies and programmes.
Infant Feeding during Emergencies in their
Disaster policies or programmes are almost
non-existent.
Weak monitoring and evaluation.
Both UNICEF and WHO have repeatedly made a
call to nations to have a comprehensive policy, a
comprehensive action plan, a cross-cutting
strategy for action, and adequate budgets for
implementing large-scale, multi-level action in
all areas identified by the Global Strategy if
optimal IYCF practices have to be universalised.
While many countries have faced natural
disasters of large scale in the past like tsunami,
earthquakes, hurricanes or nuclear disasters that
led to unprecedented displacement of
populations, support for optimal infant feeding
during emergency
situations is found to
be deficient in most
countries.
Unfortunately the
response that comes in
such situations is more
in the form of donation
of formulas rather than
creating breastfeeding
support groups.
Detailed analysis
shows that even
though there is huge
scientific evidence to
GLARING GAPS
A LONG WAY TO GO
Fig. 1: Average scores for indicators 1-10
Imp
lem
en
tati
on
of
the
Inte
rna
tio
na
lC
od
e
Info
rma
tio
nS
up
po
rt
Na
tio
na
lp
oli
cy
,p
rog
ram
me
an
dc
oo
rdin
ati
on
He
alt
ha
nd
nu
trit
ion
ca
res
ys
tem
s
Me
ch
an
ism
so
fm
on
ito
rin
ga
nd
ev
alu
ati
on
sy
ste
m
Mo
the
rs
up
po
rta
nd
co
mm
un
ity
ou
tre
ac
h
Infa
nt
fee
din
ga
nd
HIV
Ba
by
Fri
en
dly
Ho
sp
ita
lIn
itia
tiv
e
Ma
tern
ity
pro
tec
tio
n
Infa
nt
fee
din
gd
uri
ng
em
erg
en
cie
s
10
8
6
4
2
0
7.226.8 6.58 6.54
5.985.71
5.425.11
4.21
2.6
4Are our babies falling through the gaps?
scale up interventions to increase breastfeeding
rates, investment of both human and financial
resources is not commensurate with the need.
Therefore a focus on policy and a legislative
framework to align with the needs is required to
achieve high breastfeeding rates. For example,
Indicator 1 reveals that the mechanism of
coordination is weak, which results in ad hoc
actions rather than the implementation of a
comprehensive strategy at scale. It indicates that
women need more support at both the level of
the facility and the community to carry out
optimal breastfeeding practices. This is borne
out by the low average scores for Indicators
related to Health and Nutrition Systems (6.46 out
of 10), Mother Support and Community Outreach
(5.68 out of 10) and Maternity Protection (4.56
out of 10).
As Indicator 1 on National Policy, Programme
and Coordination shows, while over three
quarters of the countries have a policy, just about
a quarter of them have a budget to implement it.
At the same time, while countries may appear to
have high scores for some indicators, very serious
gaps remain in the area of implementation.
This is especially true of Indicator 3 on the
Implementation of the International Code of
marketing of breast milk substitutes, which
means enforcement of the Code or national
legislation to control marketing and promotion of
infant formula and baby foods. It has received the
highest average score and is the only one in blue.
The subsets reveal that the Code has been
legislated in only about half the countries fully in
17 countries, and partially in 10 countries; it has
been implemented in only 10 of them.
Some of these gaps can be addressed through
strengthening existing laws, and setting up
committees free from conflict of interest. Almost
all the countries have recommended legislating
maternity protection.
The reports point out the immediate benefits of
the WBT - bringing people together to discuss
and analyse as well as building consensus. The
process of ranking and colour coding makes it
easy to understand the state of policy and
programmes, and brings high-level attention to
the issues.
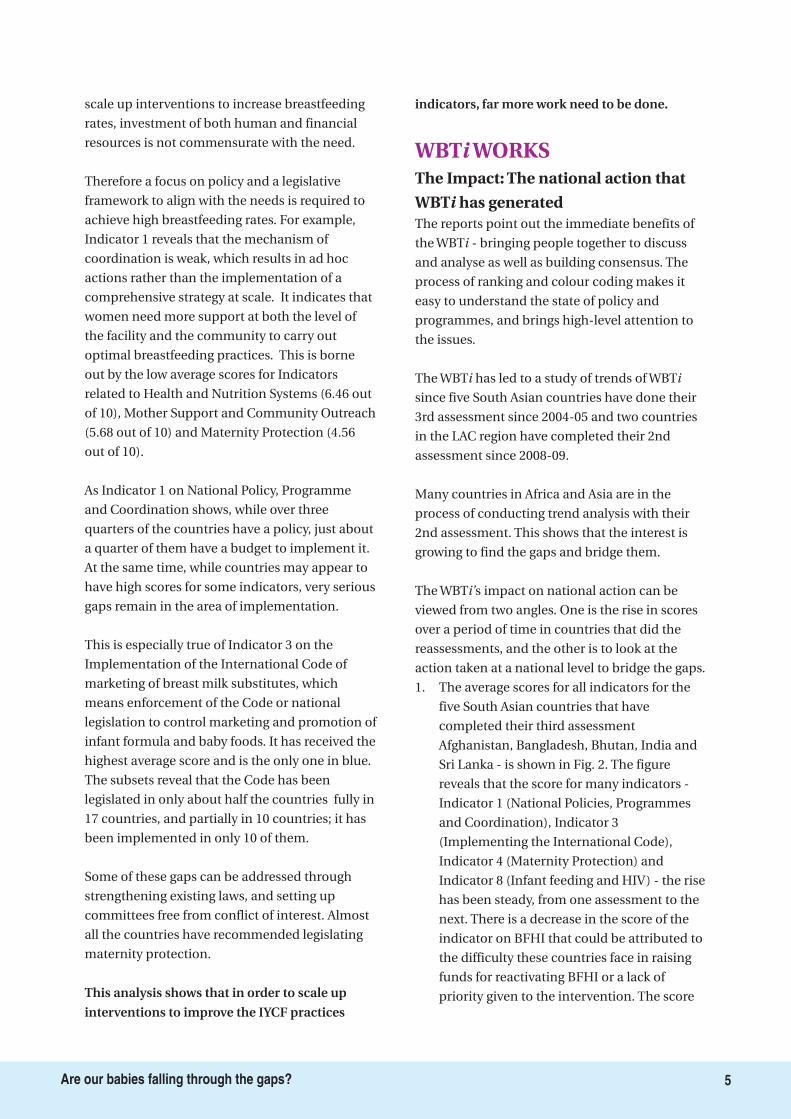
The WBT has led to a study of trends of WBT
since five South Asian countries have done their
3rd assessment since 2004-05 and two countries
in the LAC region have completed their 2nd
assessment since 2008-09.
Many countries in Africa and Asia are in the
process of conducting trend analysis with their
2nd assessment. This shows that the interest is
growing to find the gaps and bridge them.
The WBT s impact on national action can be
viewed from two angles. One is the rise in scores
over a period of time in countries that did the
reassessments, and the other is to look at the
action taken at a national level to bridge the gaps.
1. The average scores for all indicators for the
five South Asian countries that have
completed their third assessment
Afghanistan, Bangladesh, Bhutan, India and
Sri Lanka - is shown in Fig. 2. The figure
reveals that the score for many indicators -
Indicator 1 (National Policies, Programmes
and Coordination), Indicator 3
(Implementing the International Code),
Indicator 4 (Maternity Protection) and
Indicator 8 (Infant feeding and HIV) - the rise
has been steady, from one assessment to the
next. There is a decrease in the score of the
indicator on BFHI that could be attributed to
the difficulty these countries face in raising
funds for reactivating BFHI or a lack of
priority given to the intervention. The scoreThis analysis shows that in order to scale up
interventions to improve the IYCF practices
indicators, far more work need to be done.
The Impact: The national action that
WBT has generatedi
i
i i
i’
WBT WORKSi
5Are our babies falling through the gaps?
for indicator 9 (Infant Feeding during
Emergencies) continues to be in the red,
showing that many countries have not yet
begun to realize its value.
Costa Rica and Dominican Republic have
also moved up to a higher level.
2. The action taken by many countries,
according to the national and regional
coordinators, was a direct result of using
WBT assessment findings effectively for
advocacy. For example,
On the subject of National Policy
Coordination or Funding, in Asia,
Afghanistan, Bhutan, Bangladesh, China, and
Thailand took action. Similarly, Gambia,
Kenya, and Uganda did so in Africa; and
Costa Rica, Dominican Republic, Colombia,
El Salvador, Uruguay, and Guatemala took
action in the LAC region.
On Maternity Protection, many different
types of actions emerged, ranging from
putting up a Bill to increase maternity
protection in Lebanon, Gambia, and
Uruguay; to the launching of new schemes
for women in the unorganised sector in
India; the provision of increased maternity
leave in Vietnam, China and Bangladesh;
allowing mothers to work from home in
Bhutan; extending or improving workplace
facilities in Colombia, Peru, Philippines and
Ecuador; and initiating several activities in
support of women in Brazil, Dominican
Republic, and El
Salvador.
On Support in
Health Care
Facilities,
Bangladesh,
Mongolia, China,
Zambia, Dominican
Republic,
Guatemala and
Lebanon, took
action to strengthen
the basic work on
BFHI in the form of
training of workers
and development of
standards.
Many countries took action on strengthening
implementation of the International Code of
Marketing of Breast Milk Substitutes (Code)
or its provisions. The actions included
developing new drafts, inclusion of recent
World Health Assembly provisions into the
regulations, preparing drafts for approval,
deepening protection levels, integration with
other legislations, and setting up
mechanisms for implementation. Some
countries raised funds to implement, while a
few others trained their staff.
The WBT is an idea whose time has come!
Several countries have successfully used the tool
with impressive results. A recent study by Lutter
and Morrow has shown that it is possible to
increase breastfeeding rates provided countries
work on policy and programmes.
There is also evidence being generated that
specific interventions, particularly skilled
counseling and maternity protection, do lead to
enhanced breastfeeding rates. The following
recommendations have mostly emerged from the
national reports as well as the analysis of the
situation.
�
i
i
�
�
�
�
The way forward and recommendations
WHAT NEXT?
Fig. 2: Average Scores for indicators 1-10 for 5 South Asian Countries 2005-2012
10
8
6
4
2
0
2005
2008
2005 2005
2005
2005
2005
2005
2005
2005
2005
2008
2008
2008
2008
2008
2008
2008
2008
2008
2012
2012
20122
012
2012
2012
2012
2012
2012
20124.1
7
8.1
5.5
5.5
5.3
6.6
7.27.6
2.6
4.8
5.34.9
5.5
6.4
5.6
6.26.6
6.4
6.6
7.4
3.1
4.5
5.9
3.8
2.6
3.63.4
7.0
6.2
Indicator1
Indicator2
Indicator3
Indicator4
Indicator5
Indicator6
Indicator7
Indicator8
Indicator9
Indicator10
6Are our babies falling through the gaps?
General recommendations for countries
Specific recommendations to countries Specific recommendations to the global
community
1. Countries that have begun the WBT process
need to organise their coordination and
funding immediately and adequately, in
order to quickly scale up interventions to
increase breastfeeding rates. They should
also plan for re-assessments after 3-5 years to
study the trends and review action to be
taken, and aim to reach the next level of
performance.
2. Those who have not yet started using the
WBT could begin using this tool.
Develop a comprehensive, cross-sectoral,
multi-level IYCF policy with a plan of action
and a timeline. Budget the policy action and
raise resources for its implementation.
Appoint a coordinating body, with
representation from all sectors involved, to
oversee its comprehensive implementation.
Rejuvenate BFHI with a timeline to cover all
hospitals. Ensure that adequate human and
financial resources are available for this
action.
Legislate the International Code and all
relevant subsequent WHA resolutions and
stringently implement it. Raise public
awareness on the Code/national legislation
and train Code Monitors to take note of
violations for further action.
Extend maternity leave for all women to six
months to enable exclusive breastfeeding.
Extend maternity protection to women
working in the informal/unorganised sector
and raise adequate resources for this.
Integrate IYCF, including the International
Code, Infant Feeding in HIV and Infant
Feeding during Emergencies, in pre-service
and in-service training of health and
nutrition workers, at all levels of the health
and nutrition system.
Build community outreach into the IYCF
policy. Make communities baby friendly by
ensuring the provision of easy access to
skilled counselling and child-care services.
Develop a specific communication strategy
for IYCF.
Integrate HIV and infant feeding into the
IYCF policy, IYCF training for all levels of
health providers and IYCF communication
strategy.
Integrate infant feeding during emergencies
into the IYCF policy, and disaster
management planning including
breastfeeding support services, as a part of
the supply chain.
Include IYCF practice indicators in national
surveys and monitor them annually, or at
least every two years. Use this data to inform
policy.
Build implementation of the Global Strategy
for Infant and Young Child Feeding as a key
priority in the future agenda of child health
and survival.
Create budget lines for implementing the
Global strategy commensurate with the need.
Dedicate specific budget lines to address
breastfeeding and IYCF interventions under
child health or nutrition programming.
Global community should focus on policy
advocacy for legislation on the International
Code of Marketing of Breastmilk Substitutes
(Code) and subsequent World Health
Assembly resolutions , keeping it clear of
conflicts of interests.
In order to increase exclusive breastfeeding
for the first six months, encourage the use of
the WBT tool to initiate action under the UN
Secretary General's Global Strategy for
Women’s and Children's Health, or the
WHO’s Comprehensive Implementation Plan
on Maternal, Infant and Young Child
Nutrition
Donors could choose to help increase
breastfeeding rates by supporting specific
countries with low WBT scores or those LDC
countries where resources are constrained.
Donors could also choose to support specific
indicators with low scores in many countries
e.g. International Code of Marketing of
Breastmilk Substitutes(Code), infant feeding
policy during emergencies, or maternity
protection.
i
i
i
i
�
�
�
�
�
�
�
�
�
�
�
�
�
�
�
�
�
7Are our babies falling through the gaps?
Background
World over about 136 million babies are
born every year, only 48 million - are able
to practice exclusive breastfeeding; and 92
million are NOT. There is thus a need to reach all
families of the world on minute-to-minute basis.
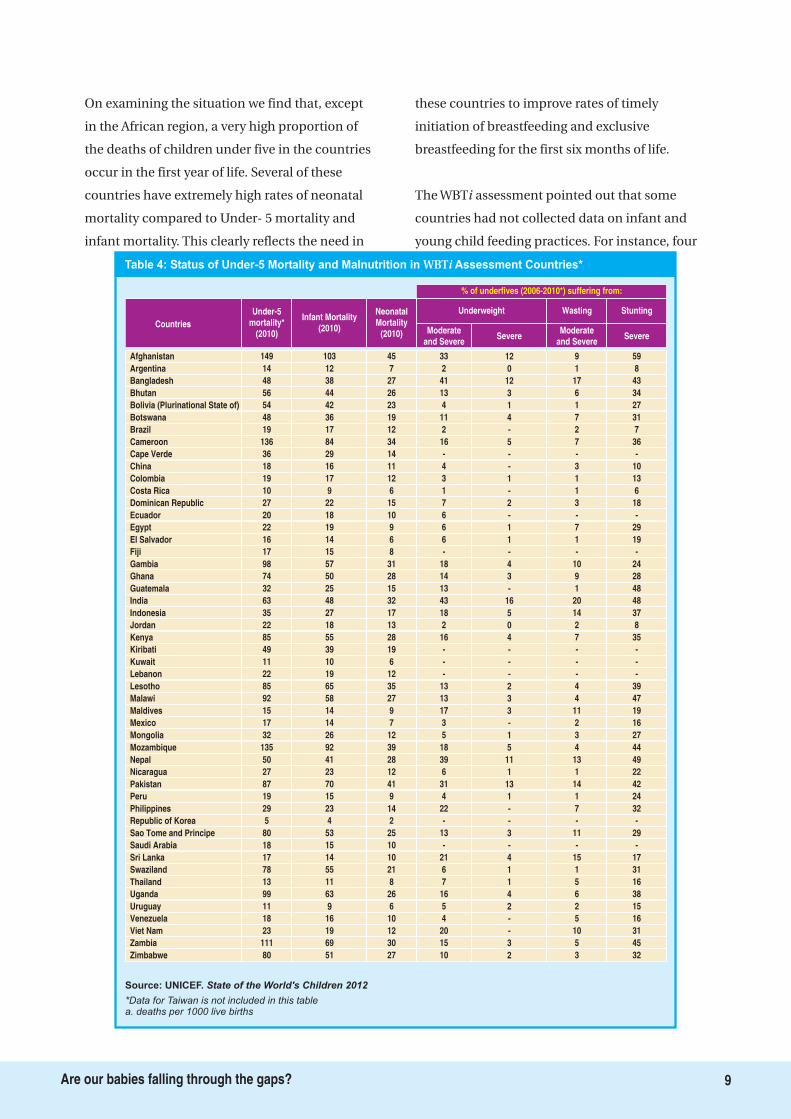
According to UNICEF’s
, 7.61 million children die every
year before they reach their fifth birthday; of
these less than 1% are in industrialized countries.
Of the total number of children under five, 16%
are moderately severe underweight, 9% are
severely underweight; 10% have moderate and
severe wasting, while 27% are moderately and
severely stunted. The report further informs
that only 43% of the children born are initiated
into breastfeeding early, only 37% are
exclusively breastfed for 6 months, only 60%
get adequate and appropriate complementary
foods at 6-8 months, and just 55% continue to
be breastfed for at least two years. Table 3 gives
the region-wise figures for breastfeeding
practices.
In 2011, the World Health Assembly resolution
on Infant and Young Child Nutrition (WHA
63.23) highlighted that “the improvement of
exclusive breastfeeding practices, adequate
and timely complementary feeding, along with
continued breastfeeding for up to two years or
beyond, could save annually the lives of 1.5
million children under five years of age.”
However, in spite of the overwhelming evidence
on the cost-effectiveness of optimal
breastfeeding practices on reduction of child
mortality, morbidity and malnutrition, as well as
its economic value to both the family and the
nation, breastfeeding rates are low almost all over
the world.
IYCF practices need to be viewed in the context of
the state of child health and nutrition in the 51
countries conducting the assessment (Table 4).
State of the Worlds
Children 2012
Region Exclusivelybreastfed
(<6 months)
Introduced to solid,semi-solid or soft
foods (6-8 months)
Breastfed atage 2
(20-23 months)
% of children (20062010*) who are:
Africa 34 68 44
Sub-Saharan Africa 33 69 46
Eastern and SouthernAfrica
49 81 54
West and Central Africa 24 63 42
Middle East and NorthAfrica
34 57 31
Asia 38 55 69
South Asia 45 56 76
East Asia and Pacific 29 54 44
Latin America andCaribbean
42 71 33
CEE/CIS 30 55 22
Industrialized countries - - -
Developing countries 37 60 56
Least developedcountries
42 68 61
World 37 60 55
Source: UNICEF. State of the World's Children 2012
Table 3: Optimal IYCF practice rates by region
8Are our babies falling through the gaps?
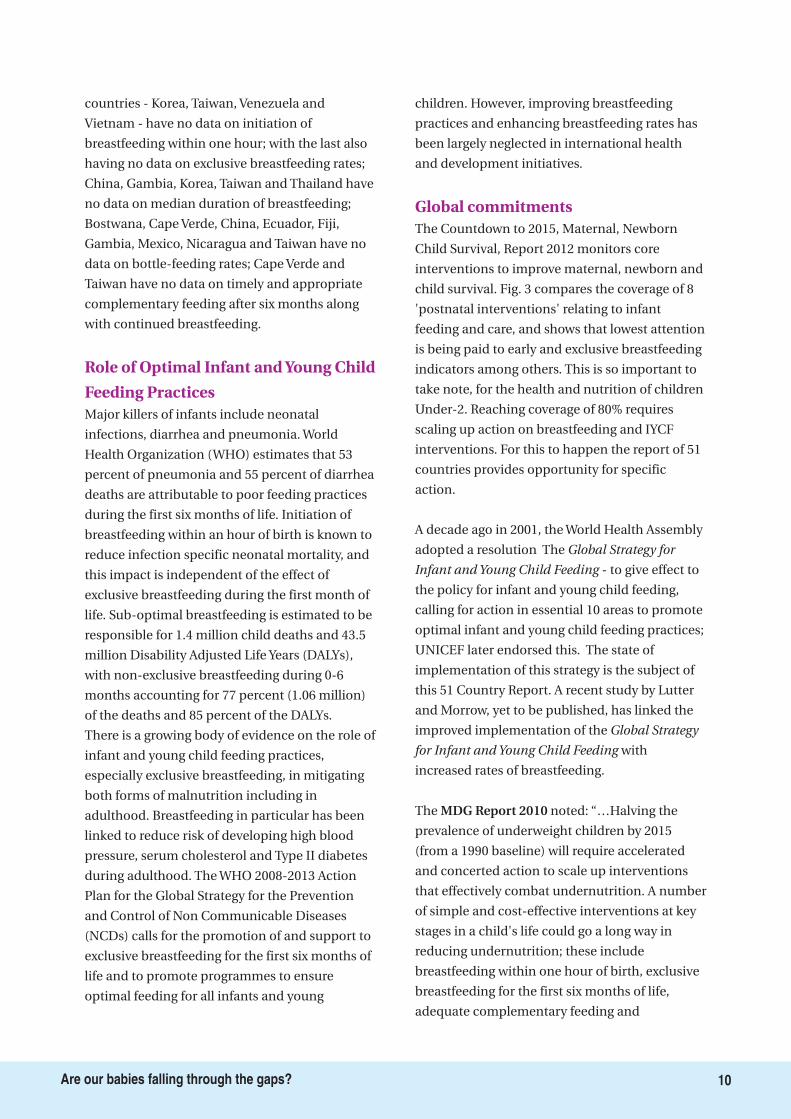
On examining the situation we find that, except
in the African region, a very high proportion of
the deaths of children under five in the countries
occur in the first year of life. Several of these
countries have extremely high rates of neonatal
mortality compared to Under- 5 mortality and
infant mortality. This clearly reflects the need in
these countries to improve rates of timely
initiation of breastfeeding and exclusive
breastfeeding for the first six months of life.
The WBT assessment pointed out that some
countries had not collected data on infant and
young child feeding practices. For instance, four
i
Table 4: Status of Under-5 Mortality and Malnutrition in Assessment Countries*WBTi
Source: UNICEF. State of the World's Children 2012
*Data for Taiwan is not included in this tablea. deaths per 1000 live births
Countries
Afghanistan
Underweight Wasting
% of underfives (2006-2010*) suffering from:
33 12 9
Under-5mortality*
(2010)
Infant Mortality(2010)
NeonatalMortality
(2010)
149 103 45
Stunting
59
Moderateand Severe
SevereModerate
and SevereSevere
Argentina 2 0 114 12 7 8
Bangladesh 41 12 1748 38 27 43
Bhutan 13 3 656 44 26 34
Bolivia (Plurinational State of) 4 1 154 42 23 27
Botswana 11 4 748 36 19 31
Brazil 2 - 219 17 12 7
Cameroon 16 5 7136 84 34 36
Cape Verde - - -36 29 14 -
China 4 - 318 16 11 10
Colombia 3 1 119 17 12 13
Costa Rica 1 - 110 9 6 6
Dominican Republic 7 2 327 22 15 18
Ecuador 6 - -20 18 10 -
Egypt 6 1 722 19 9 29
El Salvador 6 1 116 14 6 19
Fiji - - -17 15 8 -
Gambia 18 4 1098 57 31 24
Ghana 14 3 974 50 28 28
Guatemala 13 - 132 25 15 48
India 43 16 2063 48 32 48
Indonesia 18 5 1435 27 17 37
Jordan 2 0 222 18 13 8
Kenya 16 4 785 55 28 35
Kiribati - - -49 39 19 -
Kuwait - - -11 10 6 -
Lebanon - - -22 19 12 -
Lesotho 13 2 485 65 35 39
Malawi 13 3 492 58 27 47
Maldives 17 3 1115 14 9 19
Mexico 3 - 217 14 7 16
Mongolia 5 1 332 26 12 27
Mozambique 18 5 4135 92 39 44
Nepal 39 11 1350 41 28 49
Nicaragua 6 1 127 23 12 22
Pakistan 31 13 1487 70 41 42
Peru 4 1 119 15 9 24
Philippines 22 - 729 23 14 32
Republic of Korea - - -5 4 2 -
Sao Tome and Principe 13 3 1180 53 25 29
Saudi Arabia - - -18 15 10 -
Sri Lanka 21 4 1517 14 10 17
Swaziland 6 1 178 55 21 31
Thailand 7 1 513 11 8 16
Uganda 16 4 699 63 26 38
Uruguay 5 2 211 9 6 15
Venezuela 4 - 518 16 10 16
Viet Nam 20 - 1023 19 12 31
Zambia 15 3 5111 69 30 45
Zimbabwe 10 2 380 51 27 32
9Are our babies falling through the gaps?
countries - Korea, Taiwan, Venezuela and
Vietnam - have no data on initiation of
breastfeeding within one hour; with the last also
having no data on exclusive breastfeeding rates;
China, Gambia, Korea, Taiwan and Thailand have
no data on median duration of breastfeeding;
Bostwana, Cape Verde, China, Ecuador, Fiji,
Gambia, Mexico, Nicaragua and Taiwan have no
data on bottle-feeding rates; Cape Verde and
Taiwan have no data on timely and appropriate
complementary feeding after six months along
with continued breastfeeding.
Major killers of infants include neonatal
infections, diarrhea and pneumonia. World
Health Organization (WHO) estimates that 53
percent of pneumonia and 55 percent of diarrhea
deaths are attributable to poor feeding practices
during the first six months of life. Initiation of
breastfeeding within an hour of birth is known to
reduce infection specific neonatal mortality, and
this impact is independent of the effect of
exclusive breastfeeding during the first month of
life. Sub-optimal breastfeeding is estimated to be
responsible for 1.4 million child deaths and 43.5
million Disability Adjusted Life Years (DALYs),
with non-exclusive breastfeeding during 0-6
months accounting for 77 percent (1.06 million)
of the deaths and 85 percent of the DALYs.
There is a growing body of evidence on the role of
infant and young child feeding practices,
especially exclusive breastfeeding, in mitigating
both forms of malnutrition including in
adulthood. Breastfeeding in particular has been
linked to reduce risk of developing high blood
pressure, serum cholesterol and Type II diabetes
during adulthood. The WHO 2008-2013 Action
Plan for the Global Strategy for the Prevention
and Control of Non Communicable Diseases
(NCDs) calls for the promotion of and support to
exclusive breastfeeding for the first six months of
life and to promote programmes to ensure
optimal feeding for all infants and young
children. However, improving breastfeeding
practices and enhancing breastfeeding rates has
been largely neglected in international health
and development initiatives.
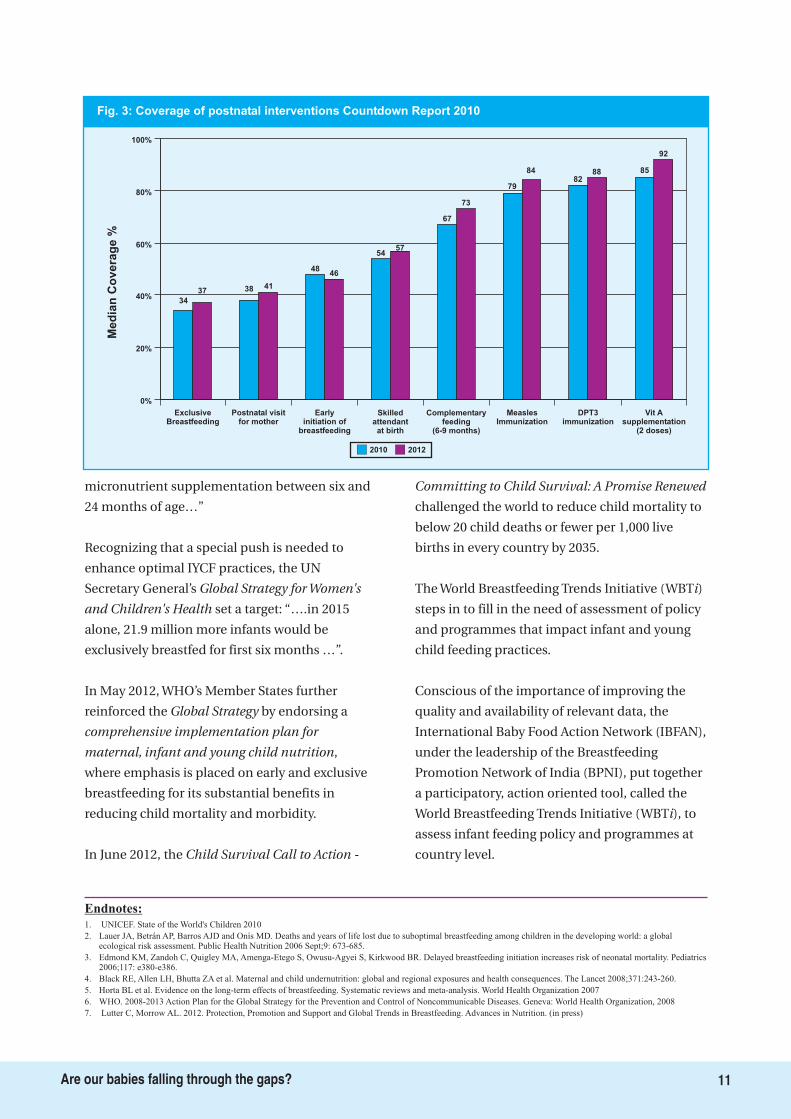
The Countdown to 2015, Maternal, Newborn
Child Survival, Report 2012 monitors core
interventions to improve maternal, newborn and
child survival. Fig. 3 compares the coverage of 8
'postnatal interventions' relating to infant
feeding and care, and shows that lowest attention
is being paid to early and exclusive breastfeeding
indicators among others. This is so important to
take note, for the health and nutrition of children
Under-2. Reaching coverage of 80% requires
scaling up action on breastfeeding and IYCF
interventions. For this to happen the report of 51
countries provides opportunity for specific
action.
A decade ago in 2001, the World Health Assembly
adopted a resolution The
- to give effect to
the policy for infant and young child feeding,
calling for action in essential 10 areas to promote
optimal infant and young child feeding practices;
UNICEF later endorsed this. The state of
implementation of this strategy is the subject of
this 51 Country Report. A recent study by Lutter
and Morrow, yet to be published, has linked the
improved implementation of the
with
increased rates of breastfeeding.
The noted: “…Halving the
prevalence of underweight children by 2015
(from a 1990 baseline) will require accelerated
and concerted action to scale up interventions
that effectively combat undernutrition. A number
of simple and cost-effective interventions at key
stages in a child's life could go a long way in
reducing undernutrition; these include
breastfeeding within one hour of birth, exclusive
breastfeeding for the first six months of life,
adequate complementary feeding and
Global Strategy for
Infant and Young Child Feeding
Global Strategy
for Infant and Young Child Feeding
MDG Report 2010
Role of Optimal Infant and Young Child
Feeding Practices
Global commitments
10Are our babies falling through the gaps?
micronutrient supplementation between six and
24 months of age…”
Recognizing that a special push is needed to
enhance optimal IYCF practices, the UN
Secretary General’s
set a target: “….in 2015
alone, 21.9 million more infants would be
exclusively breastfed for first six months …”.
In May 2012, WHO’s Member States further
reinforced the by endorsing a
,
where emphasis is placed on early and exclusive
breastfeeding for its substantial benefits in
reducing child mortality and morbidity.
In June 2012, the
challenged the world to reduce child mortality to
below 20 child deaths or fewer per 1,000 live
births in every country by 2035.
The World Breastfeeding Trends Initiative (WBT )
steps in to fill in the need of assessment of policy
and programmes that impact infant and young
child feeding practices.
Conscious of the importance of improving the
quality and availability of relevant data, the
International Baby Food Action Network (IBFAN),
under the leadership of the Breastfeeding
Promotion Network of India (BPNI), put together
a participatory, action oriented tool, called the
World Breastfeeding Trends Initiative (WBT ), to
assess infant feeding policy and programmes at
country level.
Global Strategy for Women's
and Children's Health
Global Strategy
comprehensive implementation plan for
maternal, infant and young child nutrition
Child Survival Call to Action -
Committing to Child Survival: A Promise Renewed
i
i
Fig. 3: Coverage of postnatal interventions Countdown Report 2010
100%
80%
60%
40%
20%
0%
Med
ian
Co
vera
ge
%
ExclusiveBreastfeeding
Postnatal visitfor mother
Earlyinitiation of
breastfeeding
Skilledattendantat birth
Complementaryfeeding
(6-9 months)
MeaslesImmunization
DPT3immunization
Vit Asupplementation
(2 doses)
2010 2012
34
37 38 41
4846
5457
67
73
79
8482
88 85
92
1. UNICEF. State of the World's Children 2010
2. Lauer JA, Betrán AP, Barros AJD and Onís MD. Deaths and years of life lost due to suboptimal breastfeeding among children in the developing world: a globalecological risk assessment. Public Health Nutrition 2006 Sept;9: 673-685.
3. Edmond KM, Zandoh C, Quigley MA, Amenga-Etego S, Owusu-Agyei S, Kirkwood BR. Delayed breastfeeding initiation increases risk of neonatal mortality. Pediatrics2006;117: e380-e386.
4. Black RE, Allen LH, Bhutta ZA et al. Maternal and child undernutrition: global and regional exposures and health consequences. The Lancet 2008;371:243-260.
5. Horta BL et al. Evidence on the long-term effects of breastfeeding. Systematic reviews and meta-analysis. World Health Organization 2007
6. WHO. 2008-2013 Action Plan for the Global Strategy for the Prevention and Control of Noncommunicable Diseases. Geneva: World Health Organization, 2008
7. Lutter C, Morrow AL. 2012. Protection, Promotion and Support and Global Trends in Breastfeeding. Advances in Nutrition. (in press)
Endnotes:
11Are our babies falling through the gaps?
Keeping Score
This section presents ranking charts of the 51
countries based on their performance on
policy and programmes as well as a combined
score of all 15 indicators. This is based on
assessment conducted during 2008-12. As some
countries have done the assessment more than
once, we have taken the latest findings for both
policies and practices for this report.
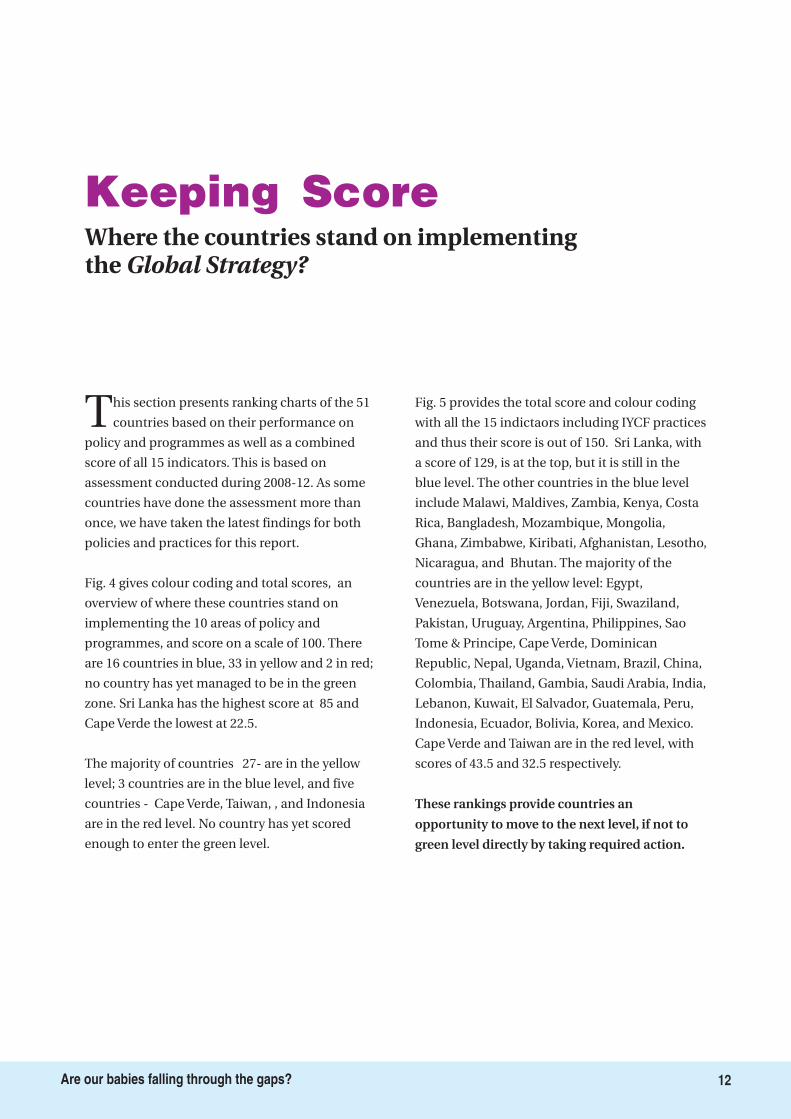
Fig. 4 gives colour coding and total scores, an
overview of where these countries stand on
implementing the 10 areas of policy and
programmes, and score on a scale of 100. There
are 16 countries in blue, 33 in yellow and 2 in red;
no country has yet managed to be in the green
zone. Sri Lanka has the highest score at 85 and
Cape Verde the lowest at 22.5.
The majority of countries 27- are in the yellow
level; 3 countries are in the blue level, and five
countries - Cape Verde, Taiwan, , and Indonesia
are in the red level. No country has yet scored
enough to enter the green level.
Fig. 5 provides the total score and colour coding
with all the 15 indictaors including IYCF practices
and thus their score is out of 150. Sri Lanka, with
a score of 129, is at the top, but it is still in the
blue level. The other countries in the blue level
include Malawi, Maldives, Zambia, Kenya, Costa
Rica, Bangladesh, Mozambique, Mongolia,
Ghana, Zimbabwe, Kiribati, Afghanistan, Lesotho,
Nicaragua, and Bhutan. The majority of the
countries are in the yellow level: Egypt,
Venezuela, Botswana, Jordan, Fiji, Swaziland,
Pakistan, Uruguay, Argentina, Philippines, Sao
Tome & Principe, Cape Verde, Dominican
Republic, Nepal, Uganda, Vietnam, Brazil, China,
Colombia, Thailand, Gambia, Saudi Arabia, India,
Lebanon, Kuwait, El Salvador, Guatemala, Peru,
Indonesia, Ecuador, Bolivia, Korea, and Mexico.
Cape Verde and Taiwan are in the red level, with
scores of 43.5 and 32.5 respectively.
These rankings provide countries an
opportunity to move to the next level, if not to
green level directly by taking required action.
12Are our babies falling through the gaps?
Where the countries stand on implementingthe Global Strategy?
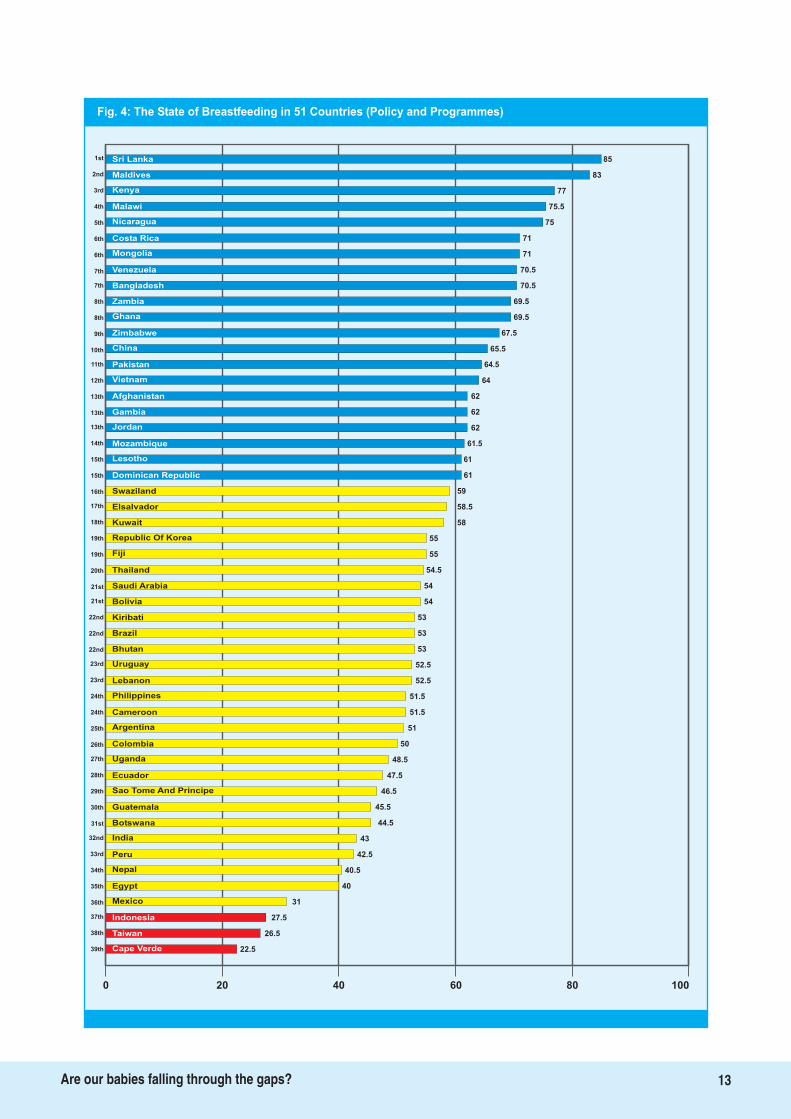
Fig. 4: The State of Breastfeeding in 51 Countries (Policy and Programmes)
85Sri Lanka
Maldives 83
Kenya 77
Malawi 75.5
Nicaragua 75
Costa Rica 71
Mongolia 71
Venezuela 70.5
Bangladesh 70.5
Zambia 69.5
Ghana 69.5
Zimbabwe 67.5
China 65.5
Pakistan 64.5
Vietnam 64
Afghanistan 62
Gambia 62
Jordan 62
Mozambique 61.5
Lesotho 61
Dominican Republic 61
Swaziland 59
Elsalvador 58.5
Kuwait 58
Republic Of Korea 55
Fiji 55
Thailand
Saudi Arabia
Bolivia
Kiribati
Brazil
Bhutan
Uruguay
Lebanon
51
Philippines
Cameroon
Argentina
Colombia
Uganda
54.5
54
54
53
53
53
52.5
52.5
51.5
51.5
50
48.5
47.5
46.5
45.5
Ecuador
Sao Tome And Principe
Guatemala
43
Botswana
India
Peru
Nepal
44.5
42.5
40.5
40
31
27.5
Egypt
Mexico
Indonesia
26.5Taiwan
22.5Cape Verde
0 20 40 60 80 100
13Are our babies falling through the gaps?
1st
2nd
3rd
4th
5th
6th
6th
7th
7th
8th
8th
9th
10th
11th
12th
13th
13th
13th
14th
15th
16th
17th
18th
19th
19th
20th
21st
21st
22nd
22nd
22nd
23rd
23rd
24th
24th
25th
26th
27th
28th
29th
30th
31st
32nd
33rd
34th
35th
36th
37th
38th
39th
15th
Fig. 5: The State of Breastfeeding in 51 Countries measured on a scale of 150
129Sri Lanka
Malawi 121.5
Maldives 119
Kenya 113
Zambia 111.5
Bangladesh 107.5
Ghana 105.5
Costa Rica 105
Mongolia 104
Zimbabwe 103.5
Mozambique 100.5
Nicaragua 99
Afghanistan 99
Lesotho 94
Bhutan 94
Kiribati 93.5
Bolivia 90
Jordan 89.5
Swaziland 89
Venezuela 88.5
Pakistan 88.5
Uruguay 85.5
Elsalvador 85.5
Argentina 85
Dominican Republic 82
Uganda 81.5
Brazil
Nepal
China
Guatemala
Cameroon
Peru
Gambia
Colombia
76
Vietnam
Kuwait
Fiji
Thailand
81
80.5
80.5
79.5
79.5
78.5
77
77
76
76
75.5
75.5
75
74
73.5
Philippines
Saudi Arabia
Sao Tome And Principe
73
Lebanon
Republic Of Korea
Egypt
Ecuador
73.5
70
65.5
62.5
57.5
49
Botswana
Indonesia
Mexico
43.5Cape Verde
32.5Taiwan
0 30 60 90 120 150
India
14Are our babies falling through the gaps?
1st
2nd
3rd
4th
5th
6th
7th
8th
9th
10th
11th
12th
12th
13th
13th
14th
15th
16th
17th
18th
19th
19th
20th
21st
22nd
23rd
24th
24th
25th
25th
26th
27th
27th
28th
28th
28th
29th
29th
30th
31st
32nd
32nd
33rd
34th
35th
36th
37th
38th
39th
40th
18th
Glaring Gaps
15Are our babies falling through the gaps?
The key findings in the 10 areas of policyand programmes
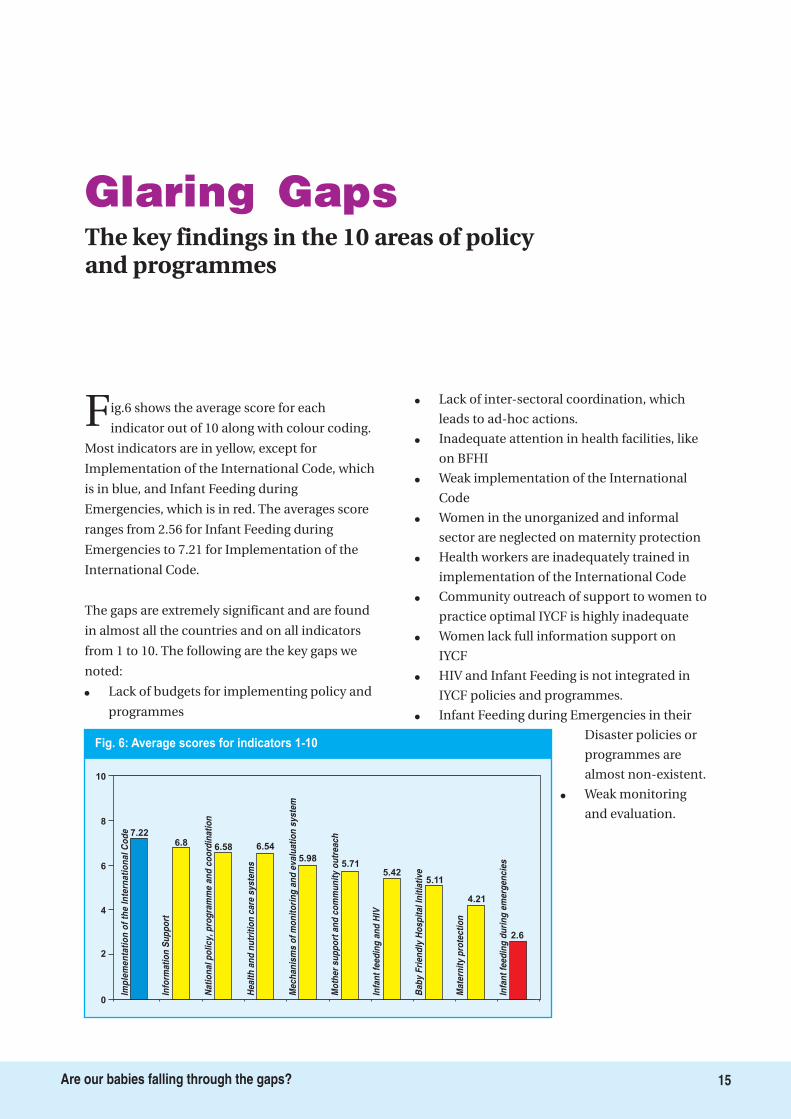
Fig.6 shows the average score for each
indicator out of 10 along with colour coding.
Most indicators are in yellow, except for
Implementation of the International Code, which
is in blue, and Infant Feeding during
Emergencies, which is in red. The averages score
ranges from 2.56 for Infant Feeding during
Emergencies to 7.21 for Implementation of the
International Code.
The gaps are extremely significant and are found
in almost all the countries and on all indicators
from 1 to 10. The following are the key gaps we
noted:
�
�
�
�
�
�
�
�
�
�
�
Lack of budgets for implementing policy and
programmes
Lack of inter-sectoral coordination, which
leads to ad-hoc actions.
Inadequate attention in health facilities, like
on BFHI
Weak implementation of the International
Code
Women in the unorganized and informal
sector are neglected on maternity protection
Health workers are inadequately trained in
implementation of the International Code
Community outreach of support to women to
practice optimal IYCF is highly inadequate
Women lack full information support on
IYCF
HIV and Infant Feeding is not integrated in
IYCF policies and programmes.
Infant Feeding during Emergencies in their
Disaster policies or
programmes are
almost non-existent.
Weak monitoring
and evaluation.
Fig. 6: Average scores for indicators 1-10
Imp
lem
en
tati
on
of
the
Inte
rna
tio
na
lC
od
e
Info
rma
tio
nS
up
po
rt
Na
tio
na
lp
oli
cy
,p
rog
ram
me
an
dc
oo
rdin
ati
on
He
alt
ha
nd
nu
trit
ion
ca
res
ys
tem
s
Me
ch
an
ism
so
fm
on
ito
rin
ga
nd
ev
alu
ati
on
sy
ste
m
Mo
the
rs
up
po
rta
nd
co
mm
un
ity
ou
tre
ac
h
Infa
nt
fee
din
ga
nd
HIV
Ba
by
Fri
en
dly
Ho
sp
ita
lIn
itia
tiv
e
Ma
tern
ity
pro
tec
tio
n
Infa
nt
fee
din
gd
uri
ng
em
erg
en
cie
s
10
8
6
4
2
0
7.226.8 6.58 6.54
5.985.71
5.425.11
4.21
2.6
The first operational target of the
1990 called upon governments
to appoint a national coordinator of
breastfeeding with appropriate powers and
authority, and establish a national committee
composed of multi-sectoral representatives
from government departments, non-
governmental organizations, and health
personnel involved in the matter. Operational
target 5 of the
requires that governments
develop, implement, monitor and evaluate a
comprehensive policy on infant and young child
feeding, in the context of national policies and
programmes for nutrition, child and
reproductive health, and poverty reduction.
The Indicator on
addresses this particular need
of having a national infant and young child
feeding/breastfeeding policy, which is well
implemented for the protection, promotion, and
support of optimal infant and young child
feeding, and a government plan to support the
policy. Besides looking at whether there is a
mechanism for coordination, the subset of
questions provides information on whether the
policy has an attached plan and a budgetary
allocation for putting the plan into action, as
well as the status of its implementation.
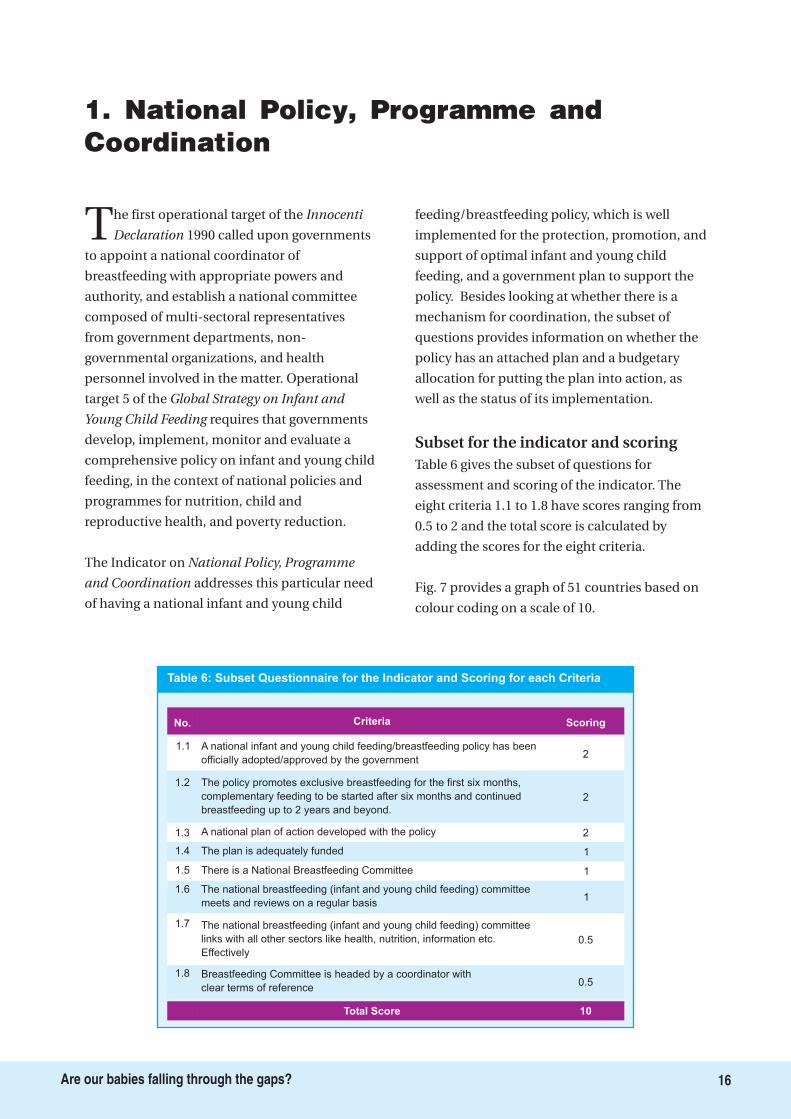
Table 6 gives the subset of questions for
assessment and scoring of the indicator. The
eight criteria 1.1 to 1.8 have scores ranging from
0.5 to 2 and the total score is calculated by
adding the scores for the eight criteria.
Fig. 7 provides a graph of 51 countries based on
colour coding on a scale of 10.
Innocenti
Declaration
Global Strategy on Infant and
Young Child Feeding
National Policy, Programme
and Coordination
Subset for the indicator and scoring
1. National Policy, Programme andCoordination
Criteria Scoring
A national infant and young child feeding/breastfeeding policy has been
officially adopted/approved by the government2
1.2 The policy promotes exclusive breastfeeding for the first six months,
complementary feeding to be started after six months and continued
breastfeeding up to 2 years and beyond.
2
1.3 A national plan of action developed with the policy 2
1.4 The plan is adequately funded 1
1.6 The national breastfeeding (infant and young child feeding) committee
meets and reviews on a regular basis1
Total Score 10
1.7 The national breastfeeding (infant and young child feeding) committee
links with all other sectors like health, nutrition, information etc.
Effectively
0.5
1.5 There is a National Breastfeeding Committee 1
1.1
1.8 Breastfeeding Committee is headed by a coordinator with
clear terms of reference0.5
No.
Table 6: Subset Questionnaire for the Indicator and Scoring for each Criteria
16Are our babies falling through the gaps?
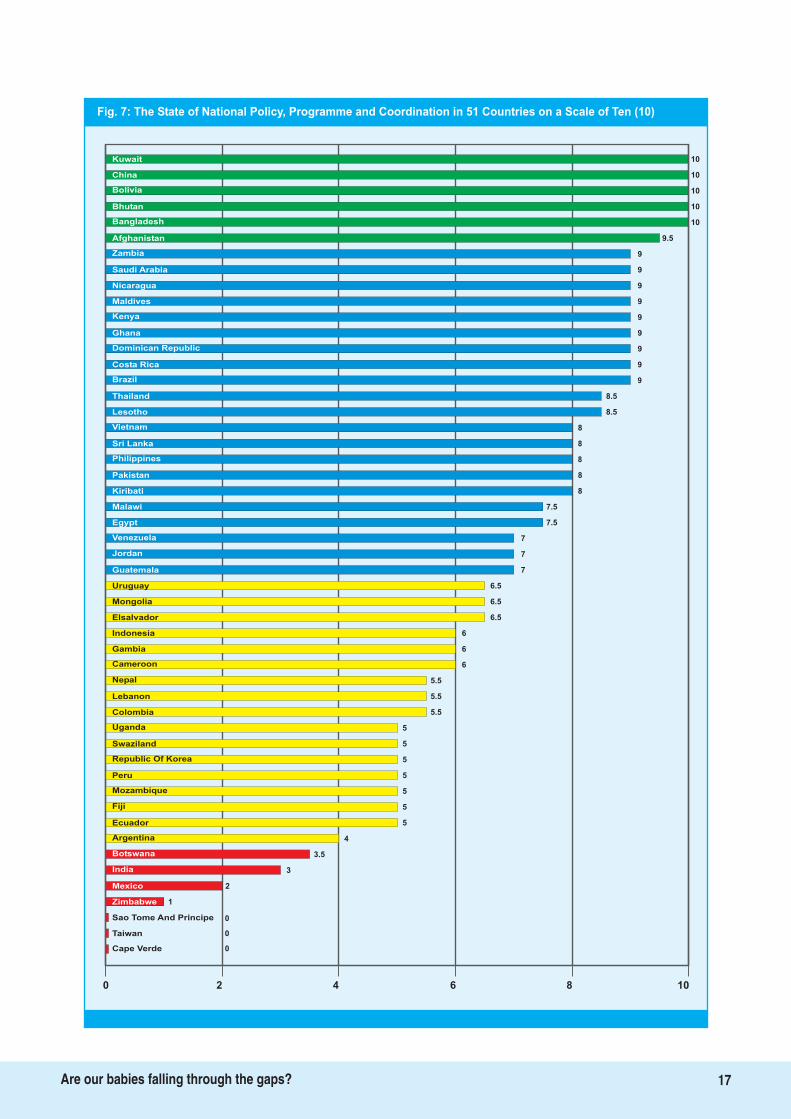
Fig. 7: The State of National Policy, Programme and Coordination in 51 Countries on a Scale of Ten (10)
10Kuwait
China
Bolivia
Bhutan
Bangladesh
Afghanistan
Zambia 9
Saudi Arabia 9
Nicaragua 9
Maldives 9
Kenya 9
Ghana 9
Dominican Republic 9
Costa Rica 9
Brazil 9
Thailand 8.5
Lesotho 8.5
Vietnam 8
Sri Lanka 8
Philippines 8
Pakistan 8
Kiribati 8
Malawi 7.5
Egypt 7.5
Venezuela 7
Jordan 7
Guatemala
Uruguay
Mongolia
Elsalvador
Indonesia
Gambia
Cameroon
5
Nepal
Lebanon
Colombia
Uganda
7
6.5
6.5
6.5
6
6
6
5.5
5.5
5.5
5
5
5
5
5
Swaziland
Republic Of Korea
Mozambique
4
Fiji
Ecuador
Argentina
India
5
3.5
3
2
1
0
Mexico
Sao Tome And Principe
0Taiwan
0
Zimbabwe
0 2 4 6 8 10
Peru
10
10
10
10
9.5
Botswana
Cape Verde
17Are our babies falling through the gaps?
18Are our babies falling through the gaps?
Develop a comprehensive, cross-sectoral, multi-level IYCF policy with a plan of action and a
timeline. Budget the policy and raise resources for its implementation. Appoint a coordinating
body with representation from all involved sectors to oversee its comprehensive
implementation.
Key Recommendation
The average score for this
indicator is 6.58, with
Bangladesh, Bhutan, Bolivia,
China, and Kuwait scoring a
full 10 points each. They are in
the green level together with
Afghanistan, with a score of
9.5. The red level has seven
countries, with Cape Verde,
Sao Tome & Principe and
Taiwan scoring zero each.
There are 21 countries in the
blue level, and 17 in the yellow
level.
Table 7 gives the details of
scoring on each of the sub set
of indicators for all the 51 countries, providing
extensive information on where the gaps are.
A look at the scoring for the sub set of questions
for the indicator (see above table) clearly spells
the need for strengthening policies plans of
action and implementation of optimal
breastfeeding practices. Criterion 1.1 indicates
that nine of the 51 countries do not have a
written national policy on infant and young
child feeding; these are Botswana, Cape Verde,
Columbia, India, Mongolia, Mozambique, Sao
Tome & Principe, Taiwan and Zimbabwe. The
scores for criterion 1.3 show that of those who
have a policy, Argentina, Ecuador, El Salvador,
Guatemala, Lebanon, Mexico, Nepal, Peru,
Uganda, Uruguay , Sri Lanka and Venezuela - do
not have a national plan of action. Only 14
countries have set aside a
budget for implementing IYCF
policies: Afghanistan,
Bangladesh, Bhutan, Bolivia,
China, Fiji, Jordan, Korea,
Kuwait, Maldives, Nicaragua,
Sri Lanka, Thailand and
Vietnam. Criteria 1.5 and 1.6
show that while 38 countries
have National Breastfeeding
Committees, but this body
meets regularly only in 23 of
them.
It is evident from the
assessment that there is a vital
need for countries to develop
policies, translate them into
action plans with adequate budgets and
coordinate action through a specific body such
as the National Breastfeeding/IYCF committee
in order to enhance optimal IYCF rates.
Weak coordination and lack of well defined or
dedicated budgets for action on breastfeeding
and infant and young child feeding is a major
gap, and makes it an opportunity to accelerate
action to scale up interventions in this area.
Only 14 countries out of 51 - Afghanistan,
Bangladesh, Bhutan, Bolivia, China, Fiji, Jordan,
Korea, Kuwait, Maldives, Nicaragua, Sri Lanka,
Thailand and Vietnam - have a budget for
implementing IYCF policies.
Detailed Findings
Key Finding
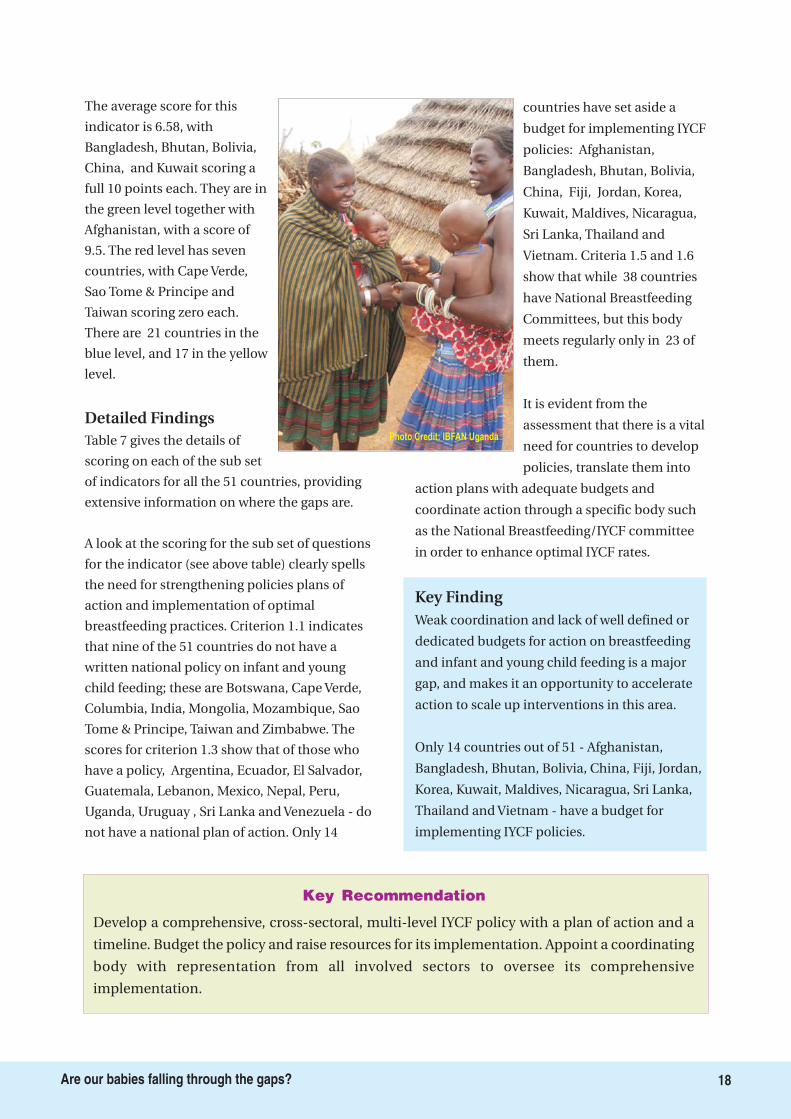
Photo Credit: IBFAN Uganda
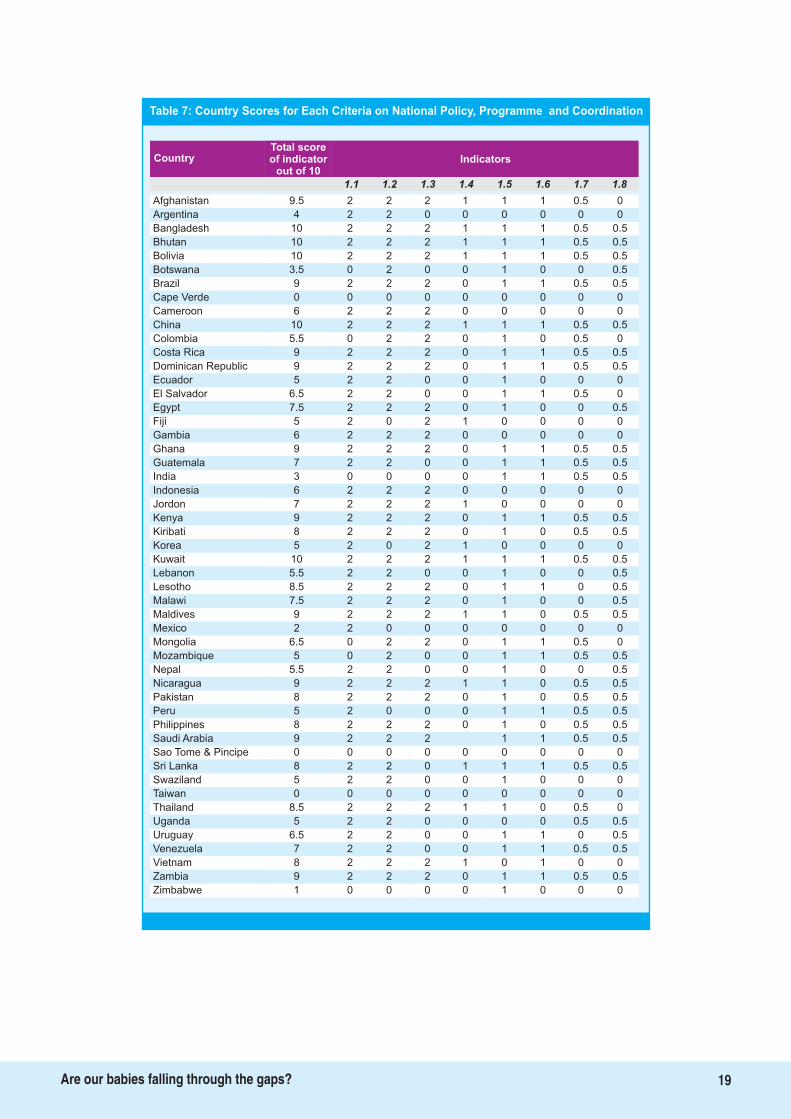
Table 7: Country Scores for Each Criteria on National Policy, Programme and Coordination
Total scoreof indicator
out of 10
Country Indicators
1.1 1.2 1.3 1.4 1.5 1.6 1.7 1.8
Afghanistan 9.5 2 2 2 1 1 1 0.5 0
Argentina 4 2 2 0 0 0 0 0 0
Bangladesh 10 2 2 2 1 1 1 0.5 0.5
Bhutan 10 2 2 2 1 1 1 0.5 0.5
Bolivia 10 2 2 2 1 1 1 0.5 0.5
Botswana 3.5 0 2 0 0 1 0 0 0.5
Brazil 9 2 2 2 0 1 1 0.5 0.5
Cape Verde 0 0 0 0 0 0 0 0 0
Cameroon 6 2 2 2 0 0 0 0 0
China 10 2 2 2 1 1 1 0.5 0.5
Colombia 5.5 0 2 2 0 1 0 0.5 0
Costa Rica 9 2 2 2 0 1 1 0.5 0.5
Dominican Republic 9 2 2 2 0 1 1 0.5 0.5
Ecuador 5 2 2 0 0 1 0 0 0
El Salvador 6.5 2 2 0 0 1 1 0.5 0
Egypt 7.5 2 2 2 0 1 0 0 0.5
Fiji 5 2 0 2 1 0 0 0 0
Gambia 6 2 2 2 0 0 0 0 0
Ghana 9 2 2 2 0 1 1 0.5 0.5
Guatemala 7 2 2 0 0 1 1 0.5 0.5
India 3 0 0 0 0 1 1 0.5 0.5
Indonesia 6 2 2 2 0 0 0 0 0
Jordon 7 2 2 2 1 0 0 0 0
Kenya 9 2 2 2 0 1 1 0.5 0.5
Kiribati 8 2 2 2 0 1 0 0.5 0.5
Korea 5 2 0 2 1 0 0 0 0
Kuwait 10 2 2 2 1 1 1 0.5 0.5
Lebanon 5.5 2 2 0 0 1 0 0 0.5
Lesotho 8.5 2 2 2 0 1 1 0 0.5
Malawi 7.5 2 2 2 0 1 0 0 0.5
Maldives 9 2 2 2 1 1 0 0.5 0.5
Mexico 2 2 0 0 0 0 0 0 0
Mongolia 6.5 0 2 2 0 1 1 0.5 0
Mozambique 5 0 2 0 0 1 1 0.5 0.5
Nepal 5.5 2 2 0 0 1 0 0 0.5
Nicaragua 9 2 2 2 1 1 0 0.5 0.5
Pakistan 8 2 2 2 0 1 0 0.5 0.5
Peru 5 2 0 0 0 1 1 0.5 0.5
Philippines 8 2 2 2 0 1 0 0.5 0.5
Saudi Arabia 9 2 2 2 1 1 0.5 0.5
Sao Tome & Pincipe 0 0 0 0 0 0 0 0 0
Sri Lanka 8 2 2 0 1 1 1 0.5 0.5
Swaziland 5 2 2 0 0 1 0 0 0
Taiwan 0 0 0 0 0 0 0 0 0
Thailand 8.5 2 2 2 1 1 0 0.5 0
Uganda 5 2 2 0 0 0 0 0.5 0.5
Uruguay 6.5 2 2 0 0 1 1 0 0.5
Venezuela 7 2 2 0 0 1 1 0.5 0.5
Vietnam 8 2 2 2 1 0 1 0 0
Zambia 9 2 2 2 0 1 1 0.5 0.5
Zimbabwe 1 0 0 0 0 1 0 0 0
19Are our babies falling through the gaps?
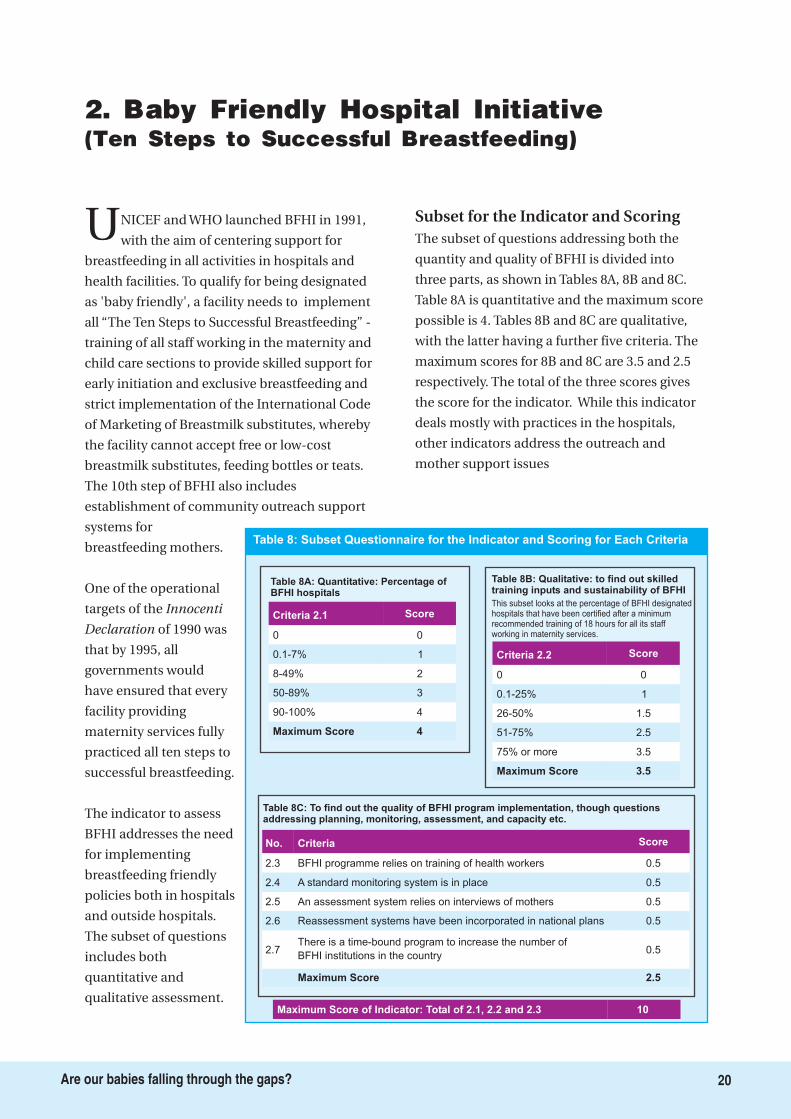
UNICEF and WHO launched BFHI in 1991,
with the aim of centering support for
breastfeeding in all activities in hospitals and
health facilities. To qualify for being designated
as 'baby friendly', a facility needs to implement
all “The Ten Steps to Successful Breastfeeding” -
training of all staff working in the maternity and
child care sections to provide skilled support for
early initiation and exclusive breastfeeding and
strict implementation of the International Code
of Marketing of Breastmilk substitutes, whereby
the facility cannot accept free or low-cost
breastmilk substitutes, feeding bottles or teats.
The 10th step of BFHI also includes
establishment of community outreach support
systems for
breastfeeding mothers.
One of the operational
targets of the
of 1990 was
that by 1995, all
governments would
have ensured that every
facility providing
maternity services fully
practiced all ten steps to
successful breastfeeding.
The indicator to assess
BFHI addresses the need
for implementing
breastfeeding friendly
policies both in hospitals
and outside hospitals.
The subset of questions
includes both
quantitative and
qualitative assessment.
The subset of questions addressing both the
quantity and quality of BFHI is divided into
three parts, as shown in Tables 8A, 8B and 8C.
Table 8A is quantitative and the maximum score
possible is 4. Tables 8B and 8C are qualitative,
with the latter having a further five criteria. The
maximum scores for 8B and 8C are 3.5 and 2.5
respectively. The total of the three scores gives
the score for the indicator. While this indicator
deals mostly with practices in the hospitals,
other indicators address the outreach and
mother support issues
Innocenti
Declaration
Subset for the Indicator and Scoring
2. Baby Friendly Hospital Initiative(Ten Steps to Successful Breastfeeding)
Table 8: Subset Questionnaire for the Indicator and Scoring for Each Criteria
Table 8C: To find out the quality of BFHI program implementation, though questionsaddressing planning, monitoring, assessment, and capacity etc.
Criteria Score
BFHI programme relies on training of health workers 0.5
A standard monitoring system is in place 0.5
An assessment system relies on interviews of mothers 0.5
Reassessment systems have been incorporated in national plans 0.5
Maximum Score 2.5
There is a time-bound program to increase the number of
BFHI institutions in the country0.5
No.
2.3
2.4
2.5
2.6
2.7
Table 8A: Quantitative: Percentage ofBFHI hospitals
Criteria 2.1 Score
0 0
0.1-7% 1
8-49% 2
50-89% 3
Maximum Score 4
90-100% 4
Table 8B: Qualitative: to find out skilledtraining inputs and sustainability of BFHI
Criteria 2.2 Score
0 0
0.1-25% 1
26-50% 1.5
51-75% 2.5
Maximum Score 3.5
75% or more 3.5
This subset looks at the percentage of BFHI designatedhospitals that have been certified after a minimumrecommended training of 18 hours for all its staffworking in maternity services.
Maximum Score of Indicator: Total of 2.1, 2.2 and 2.3 10
20Are our babies falling through the gaps?
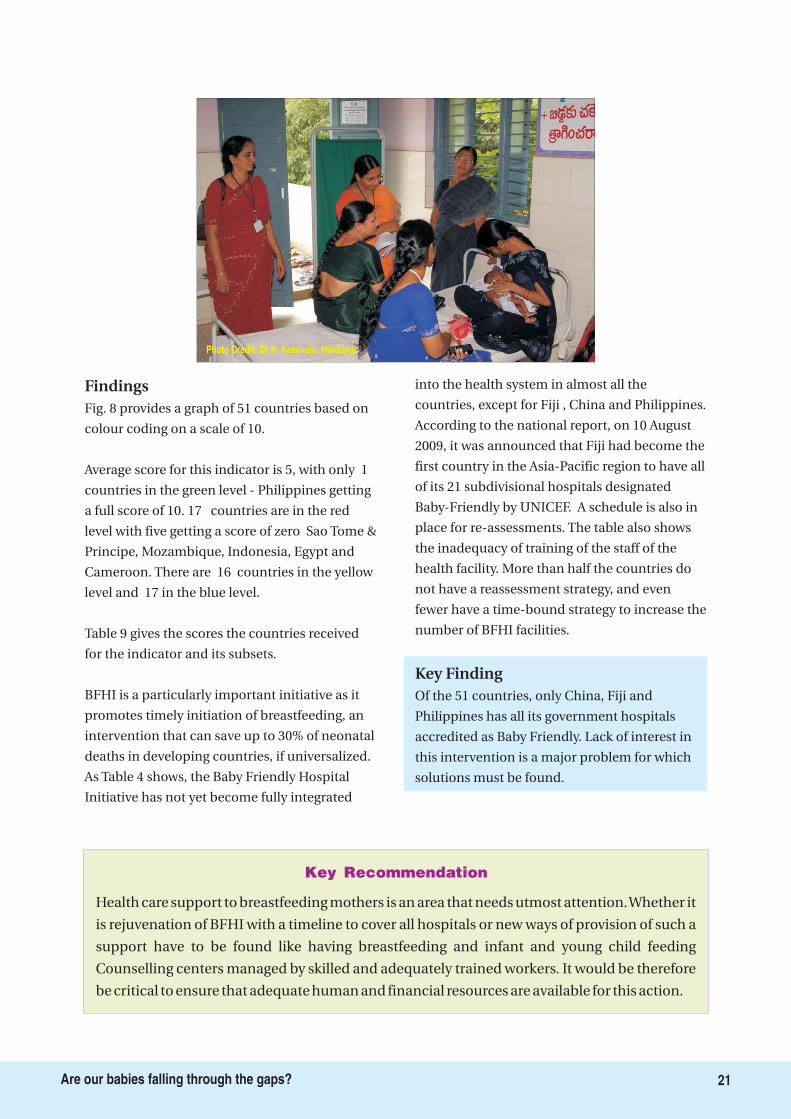
Photo Credit: Dr K. Kesavulu, Hindupur
Key Recommendation
Health care support to breastfeeding mothers is an area that needs utmost attention.Whether it
is rejuvenation of BFHI with a timeline to cover all hospitals or new ways of provision of such a
support have to be found like having breastfeeding and infant and young child feeding
Counselling centers managed by skilled and adequately trained workers. It would be therefore
be critical to ensure that adequate human and financial resources are available for this action.
21Are our babies falling through the gaps?
Findings
Key Finding
Fig. 8 provides a graph of 51 countries based on
colour coding on a scale of 10.
Average score for this indicator is 5, with only 1
countries in the green level - Philippines getting
a full score of 10. 17 countries are in the red
level with five getting a score of zero Sao Tome &
Principe, Mozambique, Indonesia, Egypt and
Cameroon. There are 16 countries in the yellow
level and 17 in the blue level.
Table 9 gives the scores the countries received
for the indicator and its subsets.
BFHI is a particularly important initiative as it
promotes timely initiation of breastfeeding, an
intervention that can save up to 30% of neonatal
deaths in developing countries, if universalized.
As Table 4 shows, the Baby Friendly Hospital
Initiative has not yet become fully integrated
into the health system in almost all the
countries, except for Fiji , China and Philippines.
According to the national report, on 10 August
2009, it was announced that Fiji had become the
first country in the Asia-Pacific region to have all
of its 21 subdivisional hospitals designated
Baby-Friendly by UNICEF. A schedule is also in
place for re-assessments. The table also shows
the inadequacy of training of the staff of the
health facility. More than half the countries do
not have a reassessment strategy, and even
fewer have a time-bound strategy to increase the
number of BFHI facilities.
Of the 51 countries, only China, Fiji and
Philippines has all its government hospitals
accredited as Baby Friendly. Lack of interest in
this intervention is a major problem for which
solutions must be found.
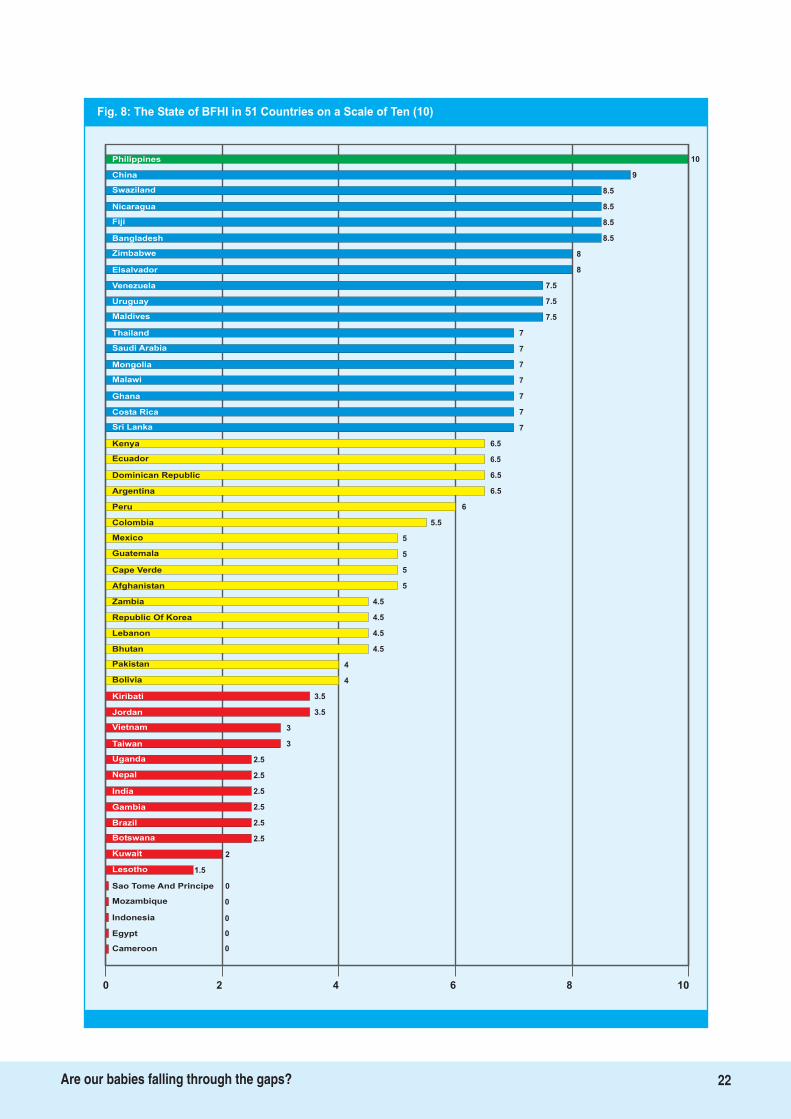
Fig. 8: The State of BFHI in 51 Countries on a Scale of Ten (10)
10Philippines
China
Swaziland
Nicaragua
Fiji
Bangladesh
Zimbabwe 8
Elsalvador 8
Venezuela 7.5
Uruguay 7.5
Maldives 7.5
Thailand 7
Saudi Arabia 7
Mongolia 7
Malawi 7
Ghana 7
Costa Rica 7
Sri Lanka 7
Kenya 6.5
Ecuador 6.5
Dominican Republic 6.5
Argentina 6.5
Peru 6
Colombia 5.5
Mexico 5
Guatemala 5
Cape Verde
Afghanistan
Zambia
Republic Of Korea
Lebanon
Bhutan
Pakistan
3
Bolivia
Kiribati
Jordan
Vietnam
5
5
4.5
4.5
4.5
4.5
4
4
3.5
3.5
3
2.5
2.5
2.5
2.5
Taiwan
Uganda
India
2.5
Gambia
Brazil
Botswana
Lesotho
2.5
2
1.5
0
0
0
Sao Tome And Principe
Mozambique
Indonesia
0Egypt
0Cameroon
0 2 4 6 8 10
Nepal
9
8.5
8.5
8.5
8.5
Kuwait
22Are our babies falling through the gaps?
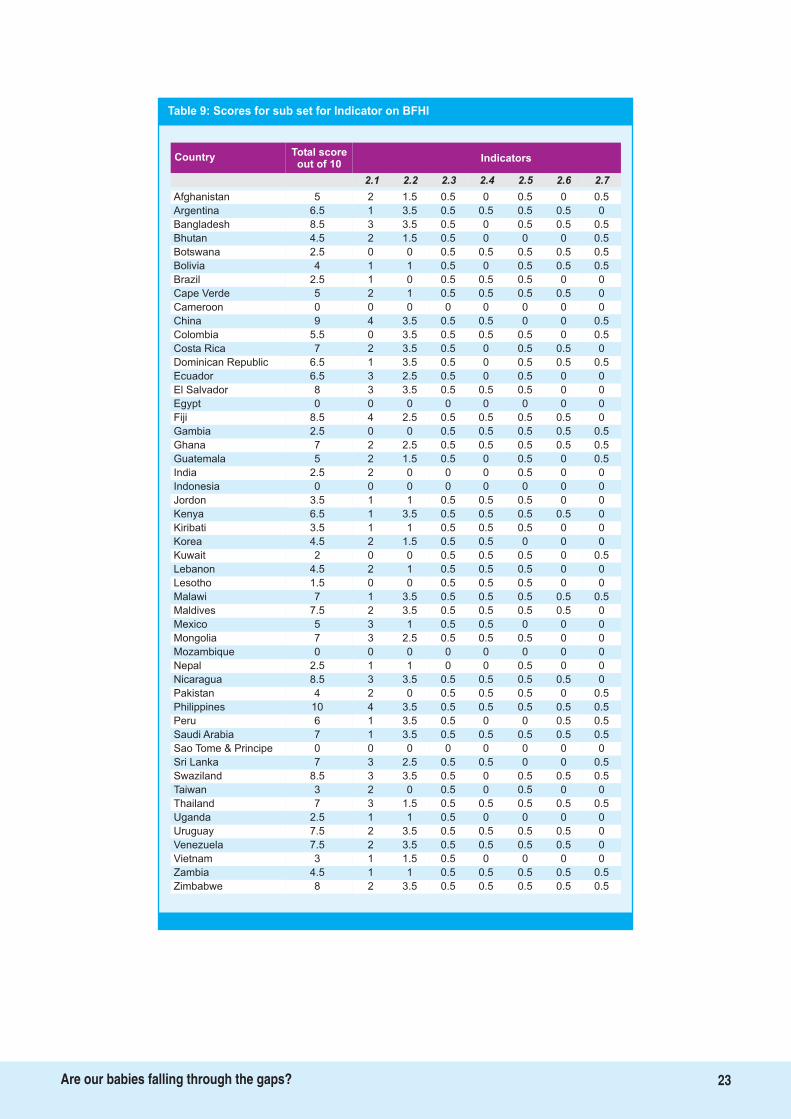
Table 9: Scores for sub set for Indicator on BFHI
Total scoreout of 10
Country Indicators
2.1 2.2 2.3 2.4 2.5 2.6 2.7
Afghanistan 5 2 1.5 0.5 0 0.5 0 0.5
Argentina 6.5 1 3.5 0.5 0.5 0.5 0.5 0
Bangladesh 8.5 3 3.5 0.5 0 0.5 0.5 0.5
Bhutan 4.5 2 1.5 0.5 0 0 0 0.5
Botswana 2.5 0 0 0.5 0.5 0.5 0.5 0.5
Bolivia 4 1 1 0.5 0 0.5 0.5 0.5
Brazil 2.5 1 0 0.5 0.5 0.5 0 0
Cape Verde 5 2 1 0.5 0.5 0.5 0.5 0
Cameroon 0 0 0 0 0 0 0 0
China 9 4 3.5 0.5 0.5 0 0 0.5
Colombia 5.5 0 3.5 0.5 0.5 0.5 0 0.5
Costa Rica 7 2 3.5 0.5 0 0.5 0.5 0
Dominican Republic 6.5 1 3.5 0.5 0 0.5 0.5 0.5
Ecuador 6.5 3 2.5 0.5 0 0.5 0 0
El Salvador 8 3 3.5 0.5 0.5 0.5 0 0
Egypt 0 0 0 0 0 0 0 0
Fiji 8.5 4 2.5 0.5 0.5 0.5 0.5 0
Gambia 2.5 0 0 0.5 0.5 0.5 0.5 0.5
Ghana 7 2 2.5 0.5 0.5 0.5 0.5 0.5
Guatemala 5 2 1.5 0.5 0 0.5 0 0.5
India 2.5 2 0 0 0 0.5 0 0
Indonesia 0 0 0 0 0 0 0 0
Jordon 3.5 1 1 0.5 0.5 0.5 0 0
Kenya 6.5 1 3.5 0.5 0.5 0.5 0.5 0
Kiribati 3.5 1 1 0.5 0.5 0.5 0 0
Korea 4.5 2 1.5 0.5 0.5 0 0 0
Kuwait 2 0 0 0.5 0.5 0.5 0 0.5
Lebanon 4.5 2 1 0.5 0.5 0.5 0 0
Lesotho 1.5 0 0 0.5 0.5 0.5 0 0
Malawi 7 1 3.5 0.5 0.5 0.5 0.5 0.5
Maldives 7.5 2 3.5 0.5 0.5 0.5 0.5 0
Mexico 5 3 1 0.5 0.5 0 0 0
Mongolia 7 3 2.5 0.5 0.5 0.5 0 0
Mozambique 0 0 0 0 0 0 0 0
Nepal 2.5 1 1 0 0 0.5 0 0
Nicaragua 8.5 3 3.5 0.5 0.5 0.5 0.5 0
Pakistan 4 2 0 0.5 0.5 0.5 0 0.5
Philippines 10 4 3.5 0.5 0.5 0.5 0.5 0.5
Peru 6 1 3.5 0.5 0 0 0.5 0.5
Saudi Arabia 7 1 3.5 0.5 0.5 0.5 0.5 0.5
Sao Tome & Principe 0 0 0 0 0 0 0 0
Sri Lanka 7 3 2.5 0.5 0.5 0 0 0.5
Swaziland 8.5 3 3.5 0.5 0 0.5 0.5 0.5
Taiwan 3 2 0 0.5 0 0.5 0 0
Thailand 7 3 1.5 0.5 0.5 0.5 0.5 0.5
Uganda 2.5 1 1 0.5 0 0 0 0
Uruguay 7.5 2 3.5 0.5 0.5 0.5 0.5 0
Venezuela 7.5 2 3.5 0.5 0.5 0.5 0.5 0
Vietnam 3 1 1.5 0.5 0 0 0 0
Zambia 4.5 1 1 0.5 0.5 0.5 0.5 0.5
Zimbabwe 8 2 3.5 0.5 0.5 0.5 0.5 0.5
23Are our babies falling through the gaps?
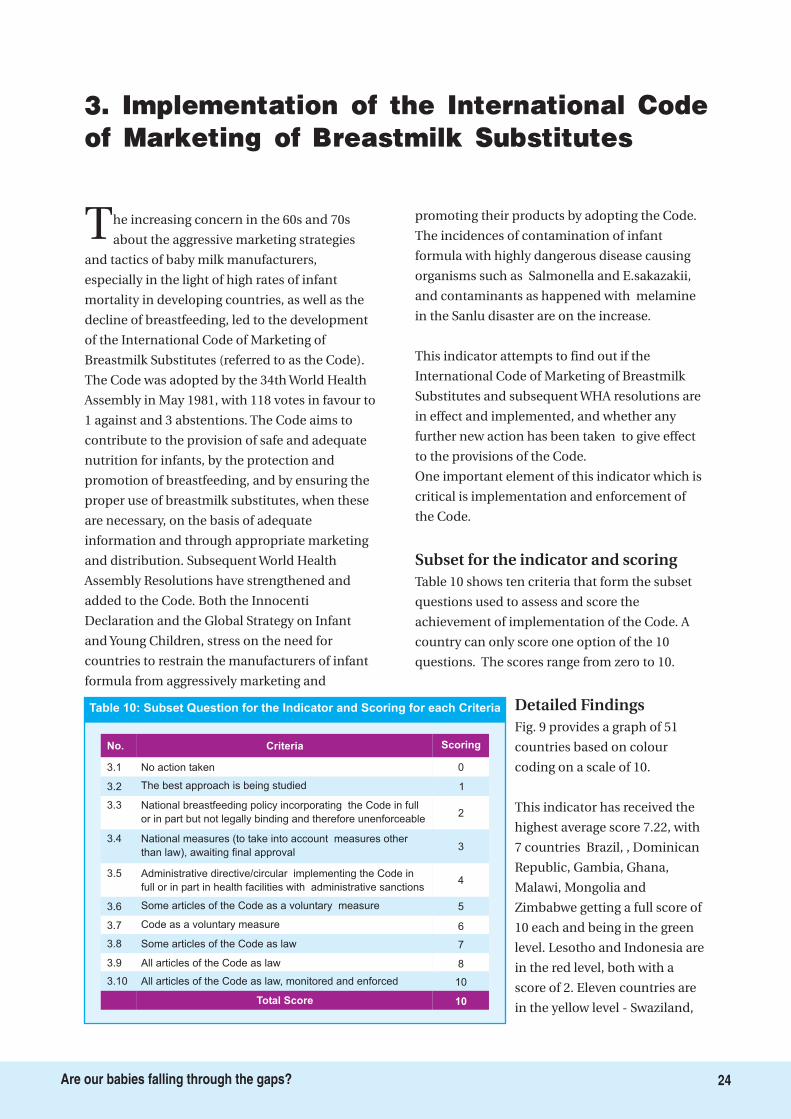
The increasing concern in the 60s and 70s
about the aggressive marketing strategies
and tactics of baby milk manufacturers,
especially in the light of high rates of infant
mortality in developing countries, as well as the
decline of breastfeeding, led to the development
of the International Code of Marketing of
Breastmilk Substitutes (referred to as the Code).
The Code was adopted by the 34th World Health
Assembly in May 1981, with 118 votes in favour to
1 against and 3 abstentions. The Code aims to
contribute to the provision of safe and adequate
nutrition for infants, by the protection and
promotion of breastfeeding, and by ensuring the
proper use of breastmilk substitutes, when these
are necessary, on the basis of adequate
information and through appropriate marketing
and distribution. Subsequent World Health
Assembly Resolutions have strengthened and
added to the Code. Both the Innocenti
Declaration and the Global Strategy on Infant
and Young Children, stress on the need for
countries to restrain the manufacturers of infant
formula from aggressively marketing and
promoting their products by adopting the Code.
The incidences of contamination of infant
formula with highly dangerous disease causing
organisms such as Salmonella and E.sakazakii,
and contaminants as happened with melamine
in the Sanlu disaster are on the increase.
This indicator attempts to find out if the
International Code of Marketing of Breastmilk
Substitutes and subsequent WHA resolutions are
in effect and implemented, and whether any
further new action has been taken to give effect
to the provisions of the Code.
One important element of this indicator which is
critical is implementation and enforcement of
the Code.
Table 10 shows ten criteria that form the subset
questions used to assess and score the
achievement of implementation of the Code. A
country can only score one option of the 10
questions. The scores range from zero to 10.
Fig. 9 provides a graph of 51
countries based on colour
coding on a scale of 10.
This indicator has received the
highest average score 7.22, with
7 countries Brazil, , Dominican
Republic, Gambia, Ghana,
Malawi, Mongolia and
Zimbabwe getting a full score of
10 each and being in the green
level. Lesotho and Indonesia are
in the red level, both with a
score of 2. Eleven countries are
in the yellow level - Swaziland,
Subset for the indicator and scoring
Detailed Findings
3. Implementation of the International Codeof Marketing of Breastmilk Substitutes
Table 10: Subset Question for the Indicator and Scoring for each Criteria
Criteria Scoring
0
The best approach is being studied 1
National breastfeeding policy incorporating the Code in full
or in part but not legally binding and therefore unenforceable2
National measures (to take into account measures other
than law), awaiting final approval3
Some articles of the Code as a voluntary measure 5
Total Score 10
Code as a voluntary measure 6
Administrative directive/circular implementing the Code in
full or in part in health facilities with administrative sanctions4
Some articles of the Code as law 7
No.
All articles of the Code as law 8
All articles of the Code as law, monitored and enforced 10
No action taken
3.2
3.3
3.4
3.6
3.7
3.5
3.1
3.8
3.9
3.10
24Are our babies falling through the gaps?
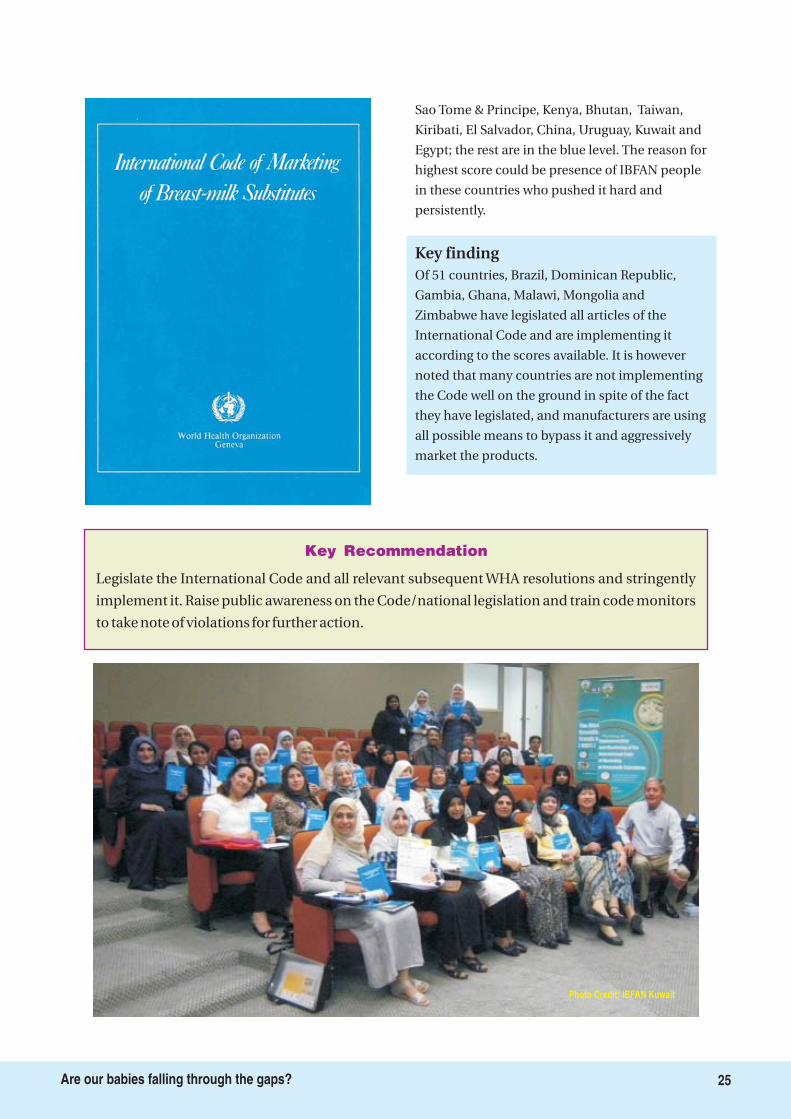
Legislate the International Code and all relevant subsequent WHA resolutions and stringently
implement it. Raise public awareness on the Code/national legislation and train code monitors
to take note of violations for further action.
Key Recommendation
25Are our babies falling through the gaps?
Photo Credit: IBFAN Kuwait
Sao Tome & Principe, Kenya, Bhutan, Taiwan,
Kiribati, El Salvador, China, Uruguay, Kuwait and
Egypt; the rest are in the blue level. The reason for
highest score could be presence of IBFAN people
in these countries who pushed it hard and
persistently.
Of 51 countries, Brazil, Dominican Republic,
Gambia, Ghana, Malawi, Mongolia and
Zimbabwe have legislated all articles of the
International Code and are implementing it
according to the scores available. It is however
noted that many countries are not implementing
the Code well on the ground in spite of the fact
they have legislated, and manufacturers are using
all possible means to bypass it and aggressively
market the products.
Key finding
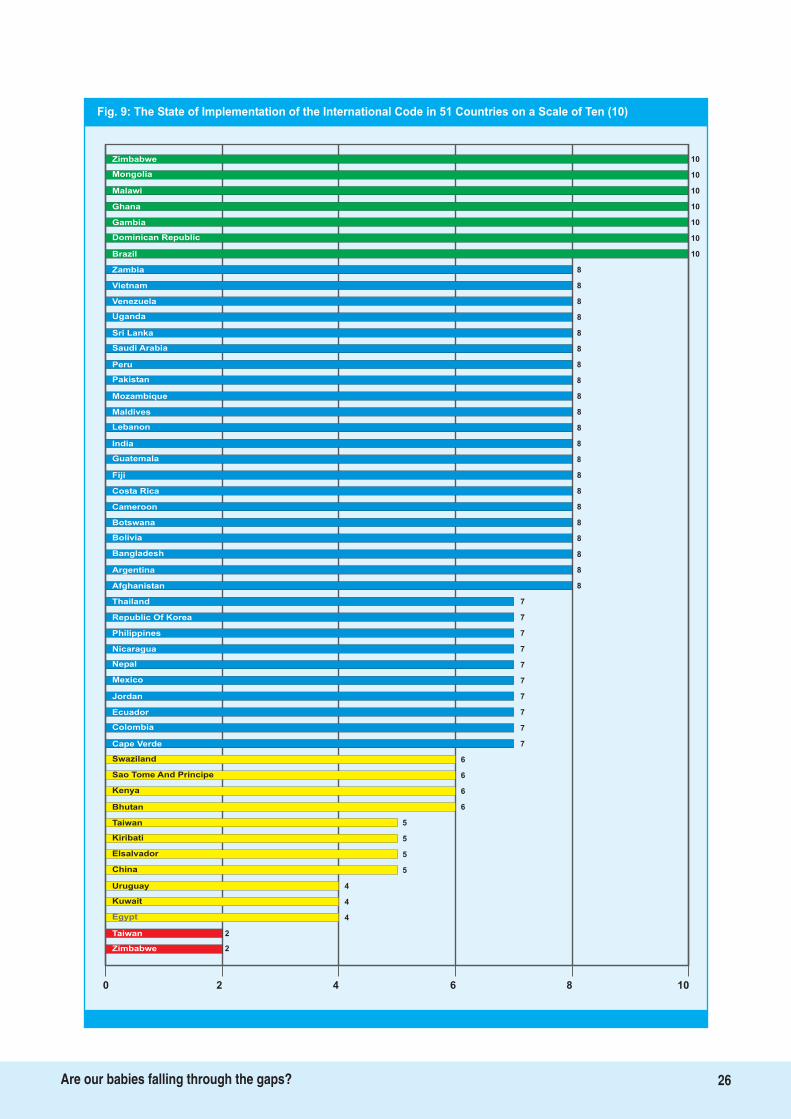
Fig. 9: The State of Implementation of the International Code in 51 Countries on a Scale of Ten (10)
10Zimbabwe
Mongolia
Malawi
Ghana
Gambia
Dominican Republic
Brazil 10
Zambia 8
Vietnam 8
Venezuela 8
Uganda 8
Sri Lanka 8
Saudi Arabia 8
Peru 8
Pakistan 8
Mozambique 8
Maldives 8
Lebanon 8
India 8
Guatemala 8
Fiji 8
Costa Rica 8
Cameroon 8
Botswana 8
Bolivia 8
Bangladesh 8
Argentina
Afghanistan
Thailand
Republic Of Korea
Philippines
Nicaragua
Nepal
7
Mexico
Jordan
Ecuador
Colombia
8
8
7
7
7
7
7
7
7
7
7
6
6
6
6
Cape Verde
Swaziland
Kenya
5
Bhutan
Taiwan
Kiribati
China
5
5
5
4
4
4
Uruguay
Kuwait
Egypt
2Taiwan
2Zimbabwe
0 2 4 6 8 10
Sao Tome And Principe
10
10
10
10
10
Elsalvador
26Are our babies falling through the gaps?
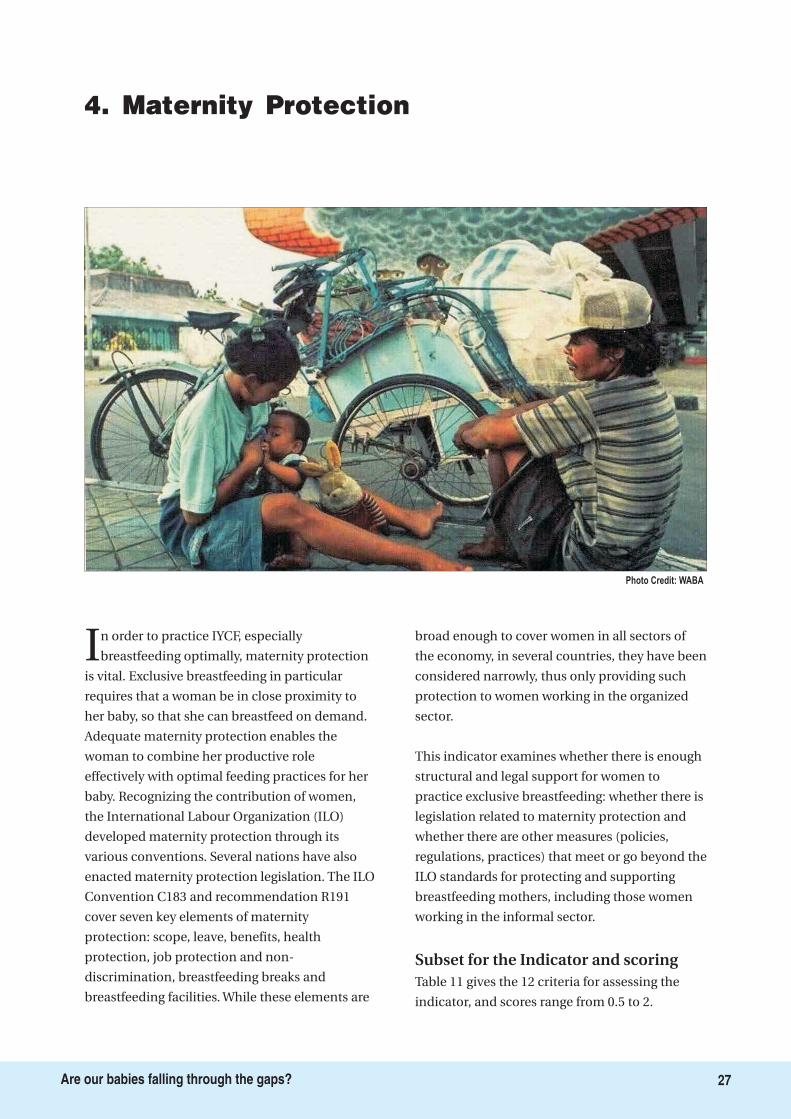
In order to practice IYCF, especially
breastfeeding optimally, maternity protection
is vital. Exclusive breastfeeding in particular
requires that a woman be in close proximity to
her baby, so that she can breastfeed on demand.
Adequate maternity protection enables the
woman to combine her productive role
effectively with optimal feeding practices for her
baby. Recognizing the contribution of women,
the International Labour Organization (ILO)
developed maternity protection through its
various conventions. Several nations have also
enacted maternity protection legislation. The ILO
Convention C183 and recommendation R191
cover seven key elements of maternity
protection: scope, leave, benefits, health
protection, job protection and non-
discrimination, breastfeeding breaks and
breastfeeding facilities. While these elements are
broad enough to cover women in all sectors of
the economy, in several countries, they have been
considered narrowly, thus only providing such
protection to women working in the organized
sector.
This indicator examines whether there is enough
structural and legal support for women to
practice exclusive breastfeeding: whether there is
legislation related to maternity protection and
whether there are other measures (policies,
regulations, practices) that meet or go beyond the
ILO standards for protecting and supporting
breastfeeding mothers, including those women
working in the informal sector.
Table 11 gives the 12 criteria for assessing the
indicator, and scores range from 0.5 to 2.
Subset for the Indicator and scoring
4. Maternity Protection
Photo Credit: WABA
27Are our babies falling through the gaps?
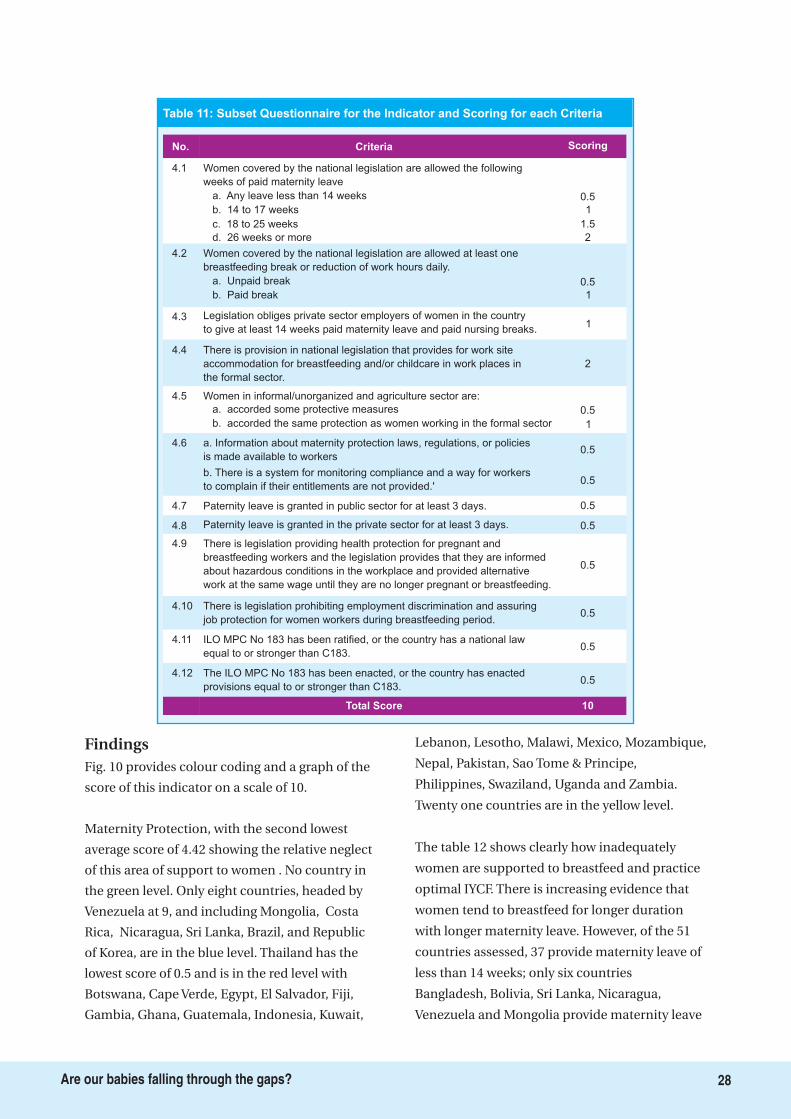
FindingsFig. 10 provides colour coding and a graph of the
score of this indicator on a scale of 10.
Maternity Protection, with the second lowest
average score of 4.42 showing the relative neglect
of this area of support to women . No country in
the green level. Only eight countries, headed by
Venezuela at 9, and including Mongolia, Costa
Rica, Nicaragua, Sri Lanka, Brazil, and Republic
of Korea, are in the blue level. Thailand has the
lowest score of 0.5 and is in the red level with
Botswana, Cape Verde, Egypt, El Salvador, Fiji,
Gambia, Ghana, Guatemala, Indonesia, Kuwait,
Lebanon, Lesotho, Malawi, Mexico, Mozambique,
Nepal, Pakistan, Sao Tome & Principe,
Philippines, Swaziland, Uganda and Zambia.
Twenty one countries are in the yellow level.
The table 12 shows clearly how inadequately
women are supported to breastfeed and practice
optimal IYCF. There is increasing evidence that
women tend to breastfeed for longer duration
with longer maternity leave. However, of the 51
countries assessed, 37 provide maternity leave of
less than 14 weeks; only six countries
Bangladesh, Bolivia, Sri Lanka, Nicaragua,
Venezuela and Mongolia provide maternity leave
Table 11: Subset Questionnaire for the Indicator and Scoring for each Criteria
Criteria Scoring
Women covered by the national legislation are allowed the following
weeks of paid maternity leave
0.5
4.3 Legislation obliges private sector employers of women in the country
to give at least 14 weeks paid maternity leave and paid nursing breaks.1
4.4 There is provision in national legislation that provides for work site
accommodation for breastfeeding and/or childcare in work places in
the formal sector.
2
4.8 Paternity leave is granted in the private sector for at least 3 days.
Total Score 10
4.9 There is legislation providing health protection for pregnant and
breastfeeding workers and the legislation provides that they are informed
about hazardous conditions in the workplace and provided alternative
work at the same wage until they are no longer pregnant or breastfeeding.
0.5
4.7 Paternity leave is granted in public sector for at least 3 days.
4.1
4.10 There is legislation prohibiting employment discrimination and assuring
job protection for women workers during breastfeeding period.0.5
No.
4.11 ILO MPC No 183 has been ratified, or the country has a national law
equal to or stronger than C183.0.5
4.12 The ILO MPC No 183 has been enacted, or the country has enacted
provisions equal to or stronger than C183.0.5
a. Any leave less than 14 weeks
b. 14 to 17 weeks
c. 18 to 25 weeks
d. 26 weeks or more
1
1.5
2
Women covered by the national legislation are allowed at least one
breastfeeding break or reduction of work hours daily.
0.5
4.2
a. Unpaid break
b. Paid break 1
Women in informal/unorganized and agriculture sector are:
0.5
4.5
a. accorded some protective measures
b. accorded the same protection as women working in the formal sector 1
a. Information about maternity protection laws, regulations, or policies
is made available to workers
4.6
0.5
0.5
b. There is a system for monitoring compliance and a way for workers
to complain if their entitlements are not provided.'
0.5
0.5
28Are our babies falling through the gaps?
Extend maternity leave to six months to enable exclusive breastfeeding. Extend maternity
protection to women working in the informal/unorganized sector and raise adequate
resources for this. Ensure workplaces are made baby-friendly.
Key Recommendation
29Are our babies falling through the gaps?
of 18 weeks or more, with the last three providing
at least 26 weeks, enabling women to carry out
exclusive breastfeeding.
While most countries offer at least one paid
nursing break during work hours as indicated by
the scores received for criteria 4.2, 10 countries
offer no breaks at all. 21 countries offer paternity
leave of three days in public sector and 17
countries both in public sector and private sector.
Criterion 4.5 shows that only eight countries offer
women in the informal or un-organised sector
the same level of protection as those offered in
the formal sector, while 11 offer some measure of
protection; the rest of the countries offer no
protection to women working in the unorganized
sector. An ILO Report, Women in labour markets:
Measuring progress and identifying challenges,
published in March 2010, informs that between
1980 and 2008, the rate of female labour force
participation increased from 50.2% to 51.7%.
However, the report adds that in the world's
poorest regions, over 50% of the women work in
vulnerable employment, characterized by low
pay, long hours of work and informal working
arrangements.
With the increasing feminization of labour,
countries need to strengthen maternity
protection, especially for women working in the
unorganized sector, and provide support services
like crèches if rates of optimal IYCF have to
increase.
Level of support to women is minimal, and only 8
countries out of 51 Afghanistan, Cameroon,
Costa Rica, Kiribati, Maldives, Mongolia, Zambia
and Zimbabwe - offer women in the unorganized
and informal sector the same level of maternity
protection as the formal sector. Not all countries
or sectors provide at least 6 months of maternity
leave.
Key finding
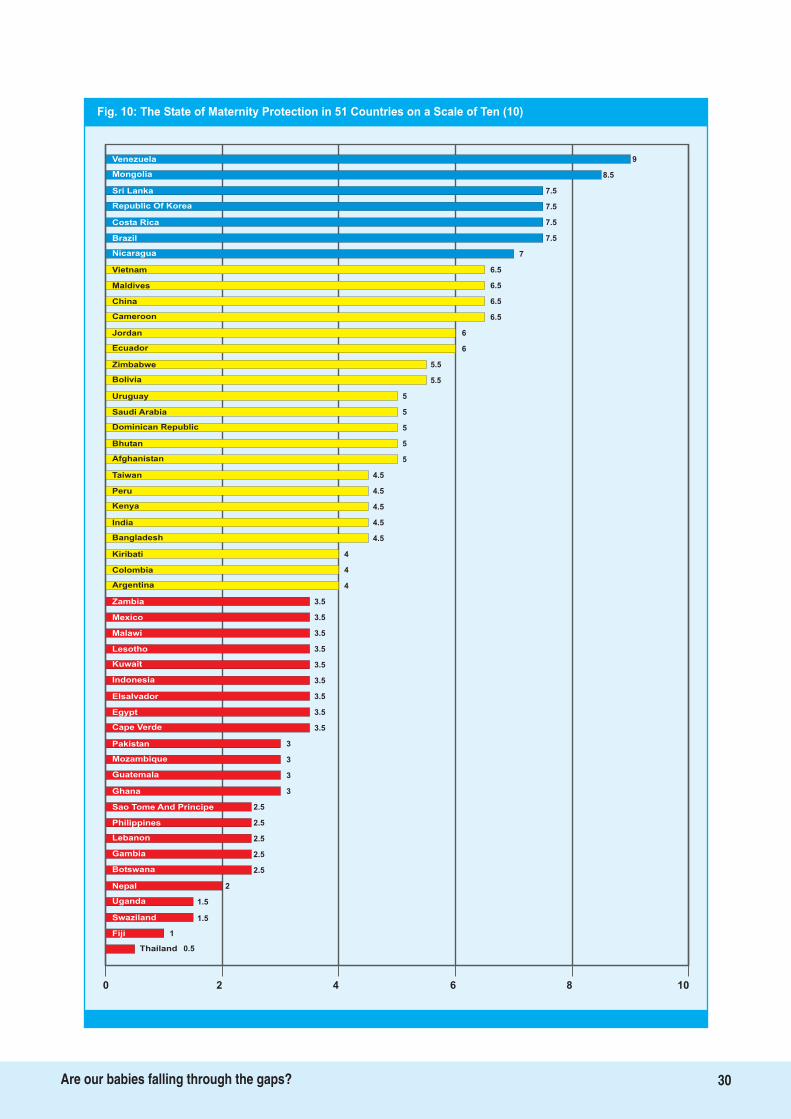
Fig. 10: The State of Maternity Protection in 51 Countries on a Scale of Ten (10)
9
Nicaragua 7
Vietnam 6.5
Maldives 6.5
China 6.5
Cameroon 6.5
Jordan 6
Ecuador 6
Zimbabwe 5.5
Bolivia 5.5
Uruguay 5
Saudi Arabia 5
Dominican Republic 5
Bhutan 5
Afghanistan 5
Taiwan 4.5
Peru 4.5
Kenya 4.5
India 4.5
Bangladesh 4.5
Kiribati 4
Colombia
Argentina
Zambia
Mexico
Malawi
Lesotho
Kuwait
3.5
Indonesia
Elsalvador
Egypt
Cape Verde
4
4
3.5
3.5
3.5
3.5
3.5
3.5
3.5
3.5
3
3
3
3
2.5
Pakistan
Mozambique
Ghana
2.5
Sao Tome And Principe
Philippines
Lebanon
Botswana
2.5
2.5
2.5
2
1.5
1.5
Nepal
Uganda
Swaziland
1Fiji
0.5Thailand
0 2 4 6 8 10
Guatemala
8.5
7.5
7.5
7.5
7.5
Gambia
Venezuela
Mongolia
Sri Lanka
Republic Of Korea
Costa Rica
Brazil
30Are our babies falling through the gaps?
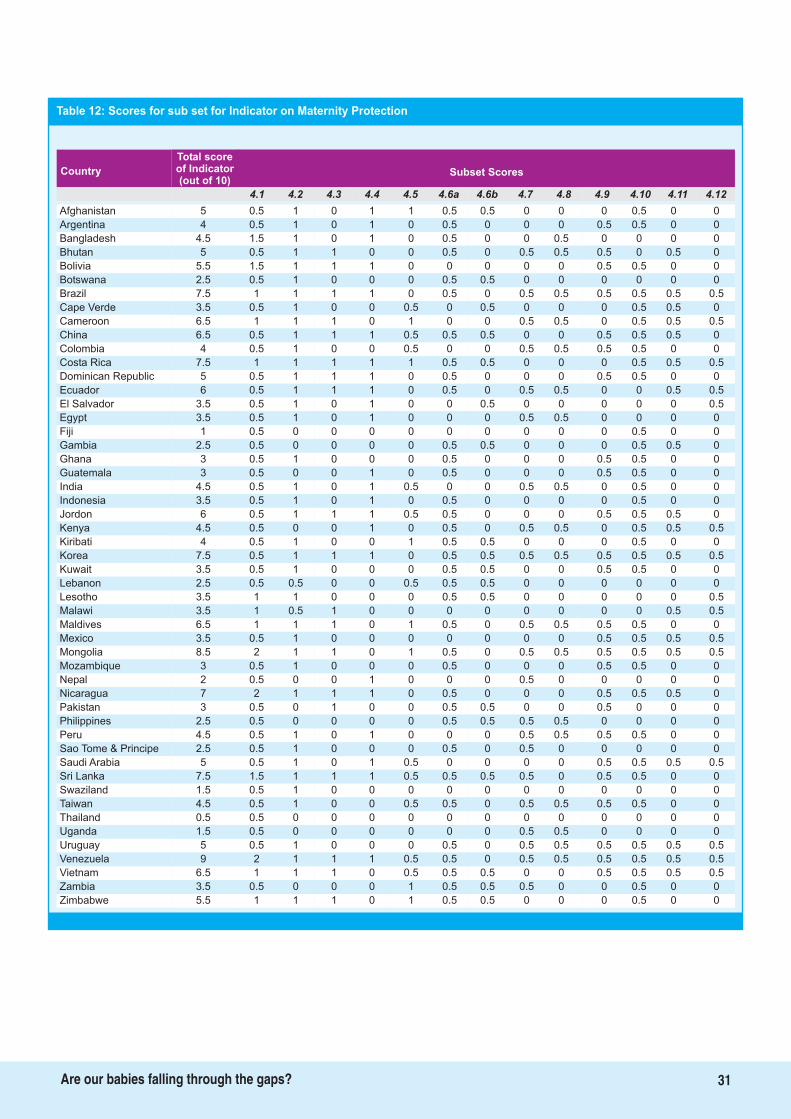
Total scoreof Indicator(out of 10)
Country Subset Scores
4.1 4.2 4.3 4.4 4.5 4.6a 4.6b 4.7 4.8 4.9 4.10 4.11 4.12
31Are our babies falling through the gaps?
Afghanistan 5 0.5 1 0 1 1 0.5 0.5 0 0 0 0.5 0 0
Argentina 4 0.5 1 0 1 0 0.5 0 0 0 0.5 0.5 0 0
Bangladesh 4.5 1.5 1 0 1 0 0.5 0 0 0.5 0 0 0 0
Bhutan 5 0.5 1 1 0 0 0.5 0 0.5 0.5 0.5 0 0.5 0
Bolivia 5.5 1.5 1 1 1 0 0 0 0 0 0.5 0.5 0 0
Botswana 2.5 0.5 1 0 0 0 0.5 0.5 0 0 0 0 0 0
Brazil 7.5 1 1 1 1 0 0.5 0 0.5 0.5 0.5 0.5 0.5 0.5
Cape Verde 3.5 0.5 1 0 0 0.5 0 0.5 0 0 0 0.5 0.5 0
Cameroon 6.5 1 1 1 0 1 0 0 0.5 0.5 0 0.5 0.5 0.5
China 6.5 0.5 1 1 1 0.5 0.5 0.5 0 0 0.5 0.5 0.5 0
Colombia 4 0.5 1 0 0 0.5 0 0 0.5 0.5 0.5 0.5 0 0
Costa Rica 7.5 1 1 1 1 1 0.5 0.5 0 0 0 0.5 0.5 0.5
Dominican Republic 5 0.5 1 1 1 0 0.5 0 0 0 0.5 0.5 0 0
Ecuador 6 0.5 1 1 1 0 0.5 0 0.5 0.5 0 0 0.5 0.5
El Salvador 3.5 0.5 1 0 1 0 0 0.5 0 0 0 0 0 0.5
Egypt 3.5 0.5 1 0 1 0 0 0 0.5 0.5 0 0 0 0
Fiji 1 0.5 0 0 0 0 0 0 0 0 0 0.5 0 0
Gambia 2.5 0.5 0 0 0 0 0.5 0.5 0 0 0 0.5 0.5 0
Ghana 3 0.5 1 0 0 0 0.5 0 0 0 0.5 0.5 0 0
Guatemala 3 0.5 0 0 1 0 0.5 0 0 0 0.5 0.5 0 0
India 4.5 0.5 1 0 1 0.5 0 0 0.5 0.5 0 0.5 0 0
Indonesia 3.5 0.5 1 0 1 0 0.5 0 0 0 0 0.5 0 0
Jordon 6 0.5 1 1 1 0.5 0.5 0 0 0 0.5 0.5 0.5 0
Kenya 4.5 0.5 0 0 1 0 0.5 0 0.5 0.5 0 0.5 0.5 0.5
Kiribati 4 0.5 1 0 0 1 0.5 0.5 0 0 0 0.5 0 0
Korea 7.5 0.5 1 1 1 0 0.5 0.5 0.5 0.5 0.5 0.5 0.5 0.5
Kuwait 3.5 0.5 1 0 0 0 0.5 0.5 0 0 0.5 0.5 0 0
Lebanon 2.5 0.5 0.5 0 0 0.5 0.5 0.5 0 0 0 0 0 0
Lesotho 3.5 1 1 0 0 0 0.5 0.5 0 0 0 0 0 0.5
Malawi 3.5 1 0.5 1 0 0 0 0 0 0 0 0 0.5 0.5
Maldives 6.5 1 1 1 0 1 0.5 0 0.5 0.5 0.5 0.5 0 0
Mexico 3.5 0.5 1 0 0 0 0 0 0 0 0.5 0.5 0.5 0.5
Mongolia 8.5 2 1 1 0 1 0.5 0 0.5 0.5 0.5 0.5 0.5 0.5
Mozambique 3 0.5 1 0 0 0 0.5 0 0 0 0.5 0.5 0 0
Nepal 2 0.5 0 0 1 0 0 0 0.5 0 0 0 0 0
Nicaragua 7 2 1 1 1 0 0.5 0 0 0 0.5 0.5 0.5 0
Pakistan 3 0.5 0 1 0 0 0.5 0.5 0 0 0.5 0 0 0
Philippines 2.5 0.5 0 0 0 0 0.5 0.5 0.5 0.5 0 0 0 0
Peru 4.5 0.5 1 0 1 0 0 0 0.5 0.5 0.5 0.5 0 0
Sao Tome & Principe 2.5 0.5 1 0 0 0 0.5 0 0.5 0 0 0 0 0
Saudi Arabia 5 0.5 1 0 1 0.5 0 0 0 0 0.5 0.5 0.5 0.5
Sri Lanka 7.5 1.5 1 1 1 0.5 0.5 0.5 0.5 0 0.5 0.5 0 0
Swaziland 1.5 0.5 1 0 0 0 0 0 0 0 0 0 0 0
Taiwan 4.5 0.5 1 0 0 0.5 0.5 0 0.5 0.5 0.5 0.5 0 0
Thailand 0.5 0.5 0 0 0 0 0 0 0 0 0 0 0 0
Uganda 1.5 0.5 0 0 0 0 0 0 0.5 0.5 0 0 0 0
Uruguay 5 0.5 1 0 0 0 0.5 0 0.5 0.5 0.5 0.5 0.5 0.5
Venezuela 9 2 1 1 1 0.5 0.5 0 0.5 0.5 0.5 0.5 0.5 0.5
Vietnam 6.5 1 1 1 0 0.5 0.5 0.5 0 0 0.5 0.5 0.5 0.5
Zambia 3.5 0.5 0 0 0 1 0.5 0.5 0.5 0 0 0.5 0 0
Zimbabwe 5.5 1 1 1 0 1 0.5 0.5 0 0 0 0.5 0 0
Table 12: Scores for sub set for Indicator on Maternity Protection
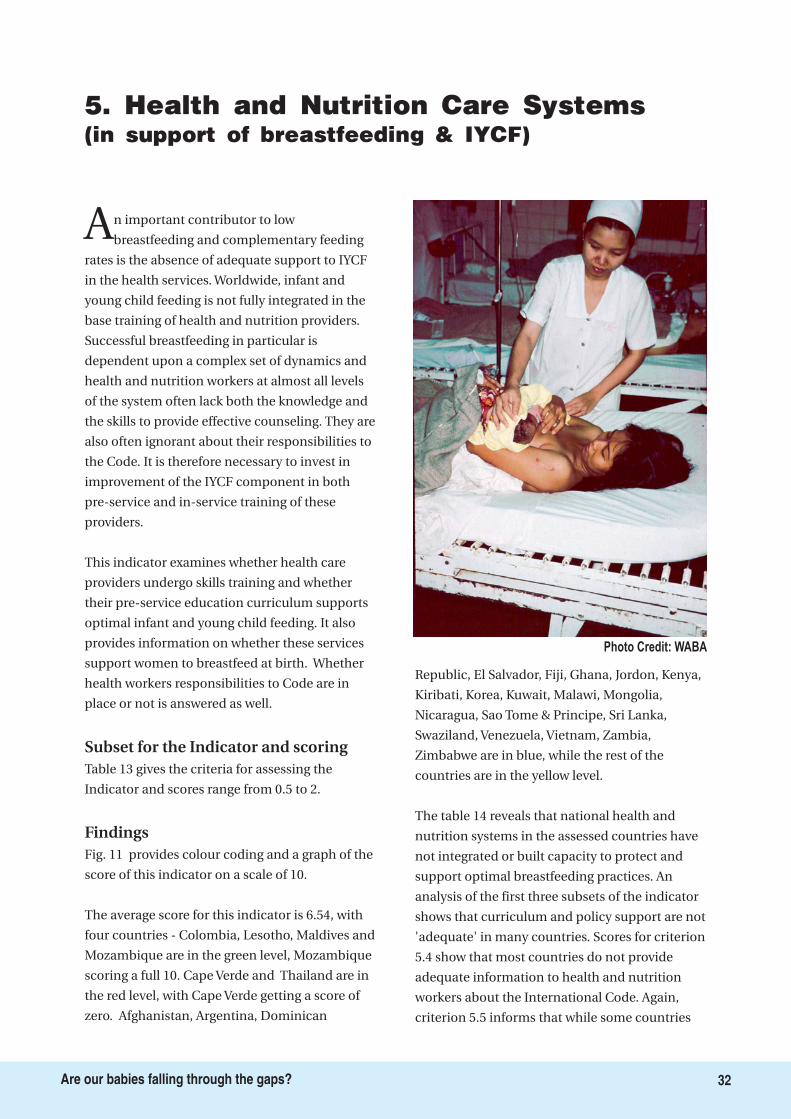
5. Health and Nutrition Care Systems(in support of breastfeeding & IYCF)
An important contributor to low
breastfeeding and complementary feeding
rates is the absence of adequate support to IYCF
in the health services. Worldwide, infant and
young child feeding is not fully integrated in the
base training of health and nutrition providers.
Successful breastfeeding in particular is
dependent upon a complex set of dynamics and
health and nutrition workers at almost all levels
of the system often lack both the knowledge and
the skills to provide effective counseling. They are
also often ignorant about their responsibilities to
the Code. It is therefore necessary to invest in
improvement of the IYCF component in both
pre-service and in-service training of these
providers.
This indicator examines whether health care
providers undergo skills training and whether
their pre-service education curriculum supports
optimal infant and young child feeding. It also
provides information on whether these services
support women to breastfeed at birth. Whether
health workers responsibilities to Code are in
place or not is answered as well.
Table 13 gives the criteria for assessing the
Indicator and scores range from 0.5 to 2.
Fig. 11 provides colour coding and a graph of the
score of this indicator on a scale of 10.
The average score for this indicator is 6.54, with
four countries - Colombia, Lesotho, Maldives and
Mozambique are in the green level, Mozambique
scoring a full 10. Cape Verde and Thailand are in
the red level, with Cape Verde getting a score of
zero. Afghanistan, Argentina, Dominican
Republic, El Salvador, Fiji, Ghana, Jordon, Kenya,
Kiribati, Korea, Kuwait, Malawi, Mongolia,
Nicaragua, Sao Tome & Principe, Sri Lanka,
Swaziland, Venezuela, Vietnam, Zambia,
Zimbabwe are in blue, while the rest of the
countries are in the yellow level.
The table 14 reveals that national health and
nutrition systems in the assessed countries have
not integrated or built capacity to protect and
support optimal breastfeeding practices. An
analysis of the first three subsets of the indicator
shows that curriculum and policy support are not
'adequate' in many countries. Scores for criterion
5.4 show that most countries do not provide
adequate information to health and nutrition
workers about the International Code. Again,
criterion 5.5 informs that while some countries
Subset for the Indicator and scoring
Findings
Photo Credit: WABA
32Are our babies falling through the gaps?
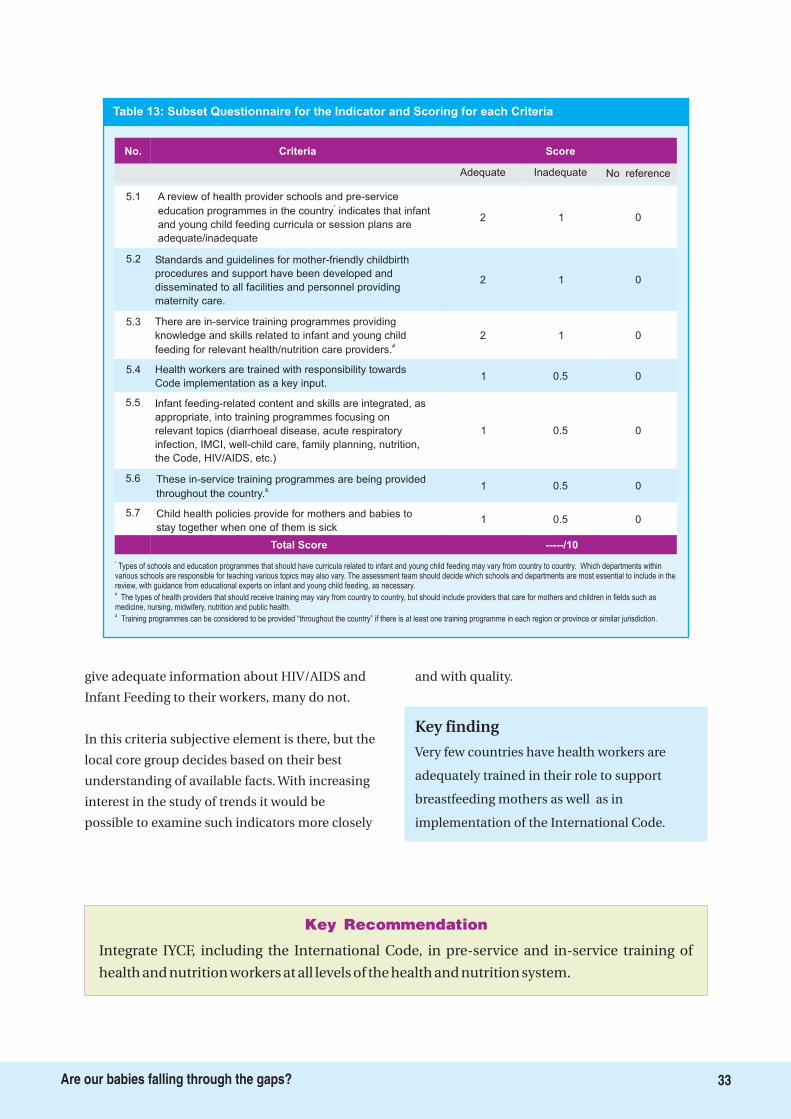
Integrate IYCF, including the International Code, in pre-service and in-service training of
health and nutrition workers at all levels of the health and nutrition system.
Key Recommendation
5.1 A review of health provider schools and pre-service
education programmes in the country indicates that infant
and young child feeding curricula or session plans are
adequate/inadequate
*
Criteria Score
2 1 0
5.2 Standards and guidelines for mother-friendly childbirth
procedures and support have been developed and
disseminated to all facilities and personnel providing
maternity care.
2 1 0
5.3 There are in-service training programmes providing
knowledge and skills related to infant and young child
feeding for relevant health/nutrition care providers.#
2 1 0
5.4 Health workers are trained with responsibility towards
Code implementation as a key input.1 0.5 0
5.5 Infant feeding-related content and skills are integrated, as
appropriate, into training programmes focusing on
relevant topics (diarrhoeal disease, acute respiratory
infection, IMCI, well-child care, family planning, nutrition,
the Code, HIV/AIDS, etc.)
1 00.5
No.
Adequate Inadequate No reference
5.6 These in-service training programmes are being provided
throughout the country.& 1 0.5 0
5.7 Child health policies provide for mothers and babies to
stay together when one of them is sick1 0.5 0
Total Score -----/10
*
#
&
Types of schools and education programmes that should have curricula related to infant and young child feeding may vary from country to country. Which departments withinvarious schools are responsible for teaching various topics may also vary. The assessment team should decide which schools and departments are most essential to include in thereview, with guidance from educational experts on infant and young child feeding, as necessary.
The types of health providers that should receive training may vary from country to country, but should include providers that care for mothers and children in fields such asmedicine, nursing, midwifery, nutrition and public health.
Training programmes can be considered to be provided “throughout the country” if there is at least one training programme in each region or province or similar jurisdiction.
Table 13: Subset Questionnaire for the Indicator and Scoring for each Criteria
33Are our babies falling through the gaps?
give adequate information about HIV/AIDS and
Infant Feeding to their workers, many do not.
In this criteria subjective element is there, but the
local core group decides based on their best
understanding of available facts. With increasing
interest in the study of trends it would be
possible to examine such indicators more closely
and with quality.
Very few countries have health workers are
adequately trained in their role to support
breastfeeding mothers as well as in
implementation of the International Code.
Key finding
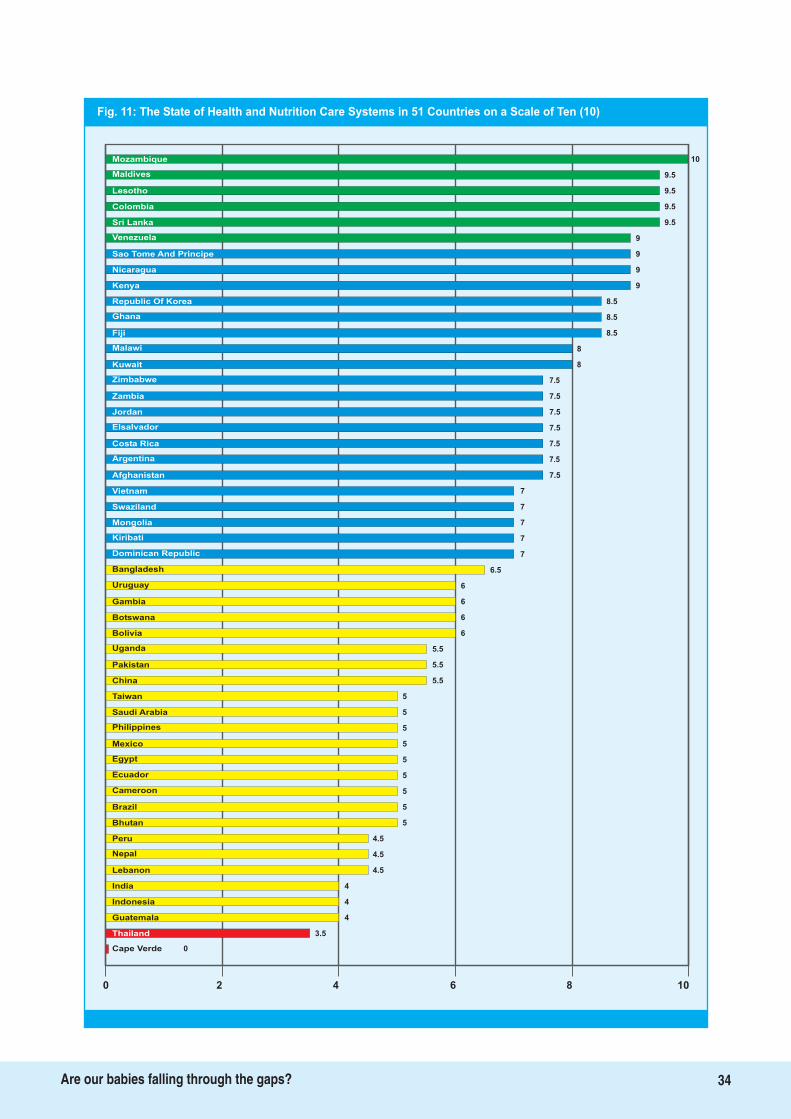
Fig. 11: The State of Health and Nutrition Care Systems in 51 Countries on a Scale of Ten (10)
10Mozambique
Maldives
Lesotho
Colombia
Sri Lanka
Venezuela
Sao Tome And Principe 9
Nicaragua 9
Kenya 9
Republic Of Korea 8.5
Ghana 8.5
Fiji 8.5
Malawi 8
Kuwait 8
Zimbabwe 7.5
Zambia 7.5
Jordan 7.5
Elsalvador 7.5
Costa Rica 7.5
Argentina 7.5
Afghanistan 7.5
Vietnam 7
Swaziland 7
Mongolia 7
Kiribati 7
Dominican Republic 7
Bangladesh
Uruguay
Gambia
Botswana
Bolivia
Uganda
Pakistan
5
China
Taiwan
Saudi Arabia
Philippines
6.5
6
6
6
6
5.5
5.5
5.5
5
5
5
5
5
5
5
Mexico
Egypt
Cameroon
4.5
Brazil
Bhutan
Peru
Lebanon
5
4.5
4.5
4
4
4
India
Indonesia
Guatemala
3.5Thailand
0Cape Verde
0 2 4 6 8 10
Ecuador
9.5
9.5
9.5
9.5
9
Nepal
34Are our babies falling through the gaps?
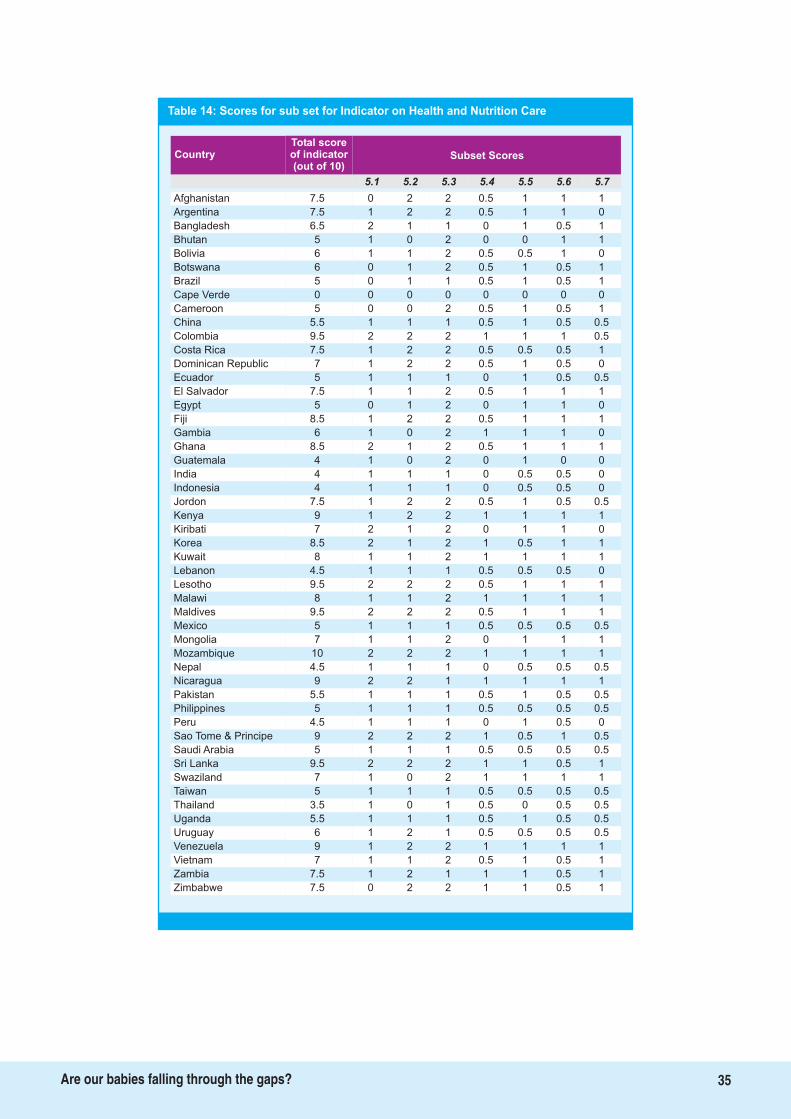
Table 14: Scores for sub set for Indicator on Health and Nutrition Care
Total scoreof indicator(out of 10)
Country Subset Scores
5.1 5.2 5.3 5.4 5.5 5.6 5.7
Afghanistan 7.5 0 2 2 0.5 1 1 1
Argentina 7.5 1 2 2 0.5 1 1 0
Bangladesh 6.5 2 1 1 0 1 0.5 1
Bhutan 5 1 0 2 0 0 1 1
Bolivia 6 1 1 2 0.5 0.5 1 0
Botswana 6 0 1 2 0.5 1 0.5 1
Brazil 5 0 1 1 0.5 1 0.5 1
Cape Verde 0 0 0 0 0 0 0 0
Cameroon 5 0 0 2 0.5 1 0.5 1
China 5.5 1 1 1 0.5 1 0.5 0.5
Colombia 9.5 2 2 2 1 1 1 0.5
Costa Rica 7.5 1 2 2 0.5 0.5 0.5 1
Dominican Republic 7 1 2 2 0.5 1 0.5 0
Ecuador 5 1 1 1 0 1 0.5 0.5
El Salvador 7.5 1 1 2 0.5 1 1 1
Egypt 5 0 1 2 0 1 1 0
Fiji 8.5 1 2 2 0.5 1 1 1
Gambia 6 1 0 2 1 1 1 0
Ghana 8.5 2 1 2 0.5 1 1 1
Guatemala 4 1 0 2 0 1 0 0
India 4 1 1 1 0 0.5 0.5 0
Indonesia 4 1 1 1 0 0.5 0.5 0
Jordon 7.5 1 2 2 0.5 1 0.5 0.5
Kenya 9 1 2 2 1 1 1 1
Kiribati 7 2 1 2 0 1 1 0
Korea 8.5 2 1 2 1 0.5 1 1
Kuwait 8 1 1 2 1 1 1 1
Lebanon 4.5 1 1 1 0.5 0.5 0.5 0
Lesotho 9.5 2 2 2 0.5 1 1 1
Malawi 8 1 1 2 1 1 1 1
Maldives 9.5 2 2 2 0.5 1 1 1
Mexico 5 1 1 1 0.5 0.5 0.5 0.5
Mongolia 7 1 1 2 0 1 1 1
Mozambique 10 2 2 2 1 1 1 1
Nepal 4.5 1 1 1 0 0.5 0.5 0.5
Nicaragua 9 2 2 1 1 1 1 1
Pakistan 5.5 1 1 1 0.5 1 0.5 0.5
Philippines 5 1 1 1 0.5 0.5 0.5 0.5
Peru 4.5 1 1 1 0 1 0.5 0
Sao Tome & Principe 9 2 2 2 1 0.5 1 0.5
Saudi Arabia 5 1 1 1 0.5 0.5 0.5 0.5
Sri Lanka 9.5 2 2 2 1 1 0.5 1
Swaziland 7 1 0 2 1 1 1 1
Taiwan 5 1 1 1 0.5 0.5 0.5 0.5
Thailand 3.5 1 0 1 0.5 0 0.5 0.5
Uganda 5.5 1 1 1 0.5 1 0.5 0.5
Uruguay 6 1 2 1 0.5 0.5 0.5 0.5
Venezuela 9 1 2 2 1 1 1 1
Vietnam 7 1 1 2 0.5 1 0.5 1
Zambia 7.5 1 2 1 1 1 0.5 1
Zimbabwe 7.5 0 2 2 1 1 0.5 1
35Are our babies falling through the gaps?
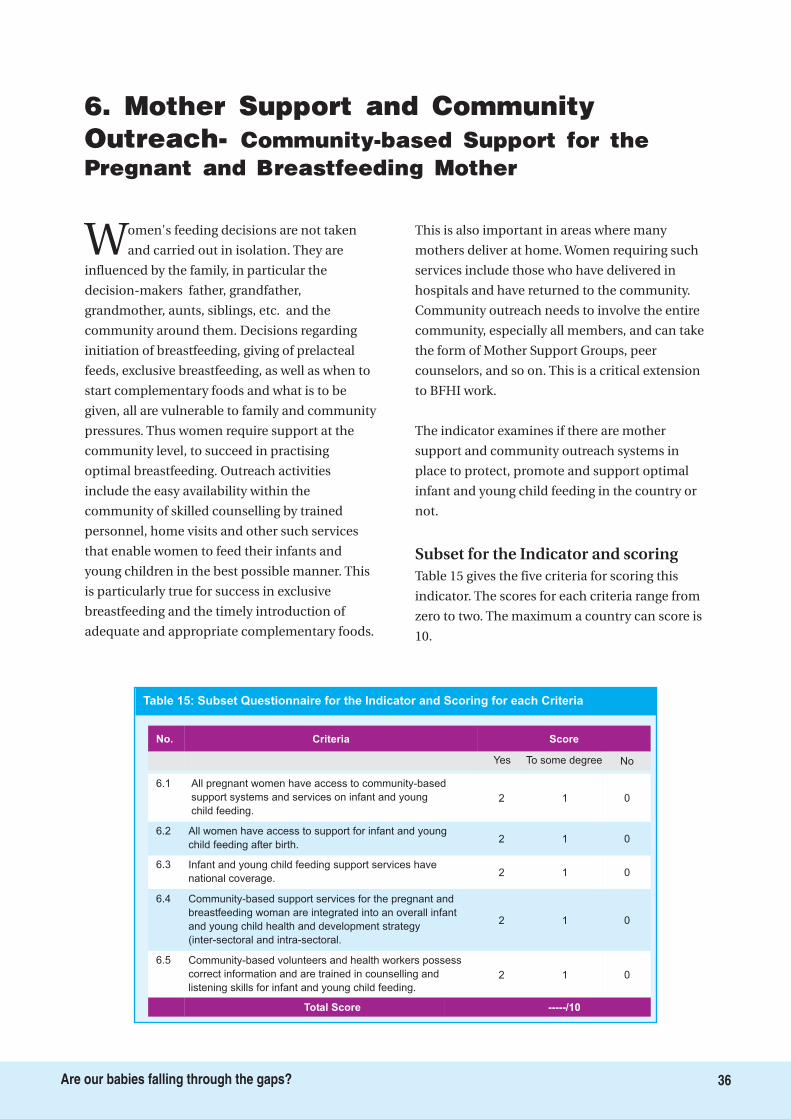
6. Mother Support and CommunityOutreach- Community-based Support for thePregnant and Breastfeeding Mother
Women's feeding decisions are not taken
and carried out in isolation. They are
influenced by the family, in particular the
decision-makers father, grandfather,
grandmother, aunts, siblings, etc. and the
community around them. Decisions regarding
initiation of breastfeeding, giving of prelacteal
feeds, exclusive breastfeeding, as well as when to
start complementary foods and what is to be
given, all are vulnerable to family and community
pressures. Thus women require support at the
community level, to succeed in practising
optimal breastfeeding. Outreach activities
include the easy availability within the
community of skilled counselling by trained
personnel, home visits and other such services
that enable women to feed their infants and
young children in the best possible manner. This
is particularly true for success in exclusive
breastfeeding and the timely introduction of
adequate and appropriate complementary foods.
This is also important in areas where many
mothers deliver at home. Women requiring such
services include those who have delivered in
hospitals and have returned to the community.
Community outreach needs to involve the entire
community, especially all members, and can take
the form of Mother Support Groups, peer
counselors, and so on. This is a critical extension
to BFHI work.
The indicator examines if there are mother
support and community outreach systems in
place to protect, promote and support optimal
infant and young child feeding in the country or
not.
Table 15 gives the five criteria for scoring this
indicator. The scores for each criteria range from
zero to two. The maximum a country can score is
10.
Subset for the Indicator and scoring
Table 15: Subset Questionnaire for the Indicator and Scoring for each Criteria
6.1 All pregnant women have access to community-based
support systems and services on infant and young
child feeding.
Criteria Score
2 1 0
6.2 All women have access to support for infant and young
child feeding after birth.2 1 0
6.3 Infant and young child feeding support services have
national coverage.2 1 0
6.4 Community-based support services for the pregnant and
breastfeeding woman are integrated into an overall infant
and young child health and development strategy
(inter-sectoral and intra-sectoral.
2 1 0
6.5 Community-based volunteers and health workers possess
correct information and are trained in counselling and
listening skills for infant and young child feeding.
2 01
No.
Yes To some degree No
Total Score -----/10
36Are our babies falling through the gaps?
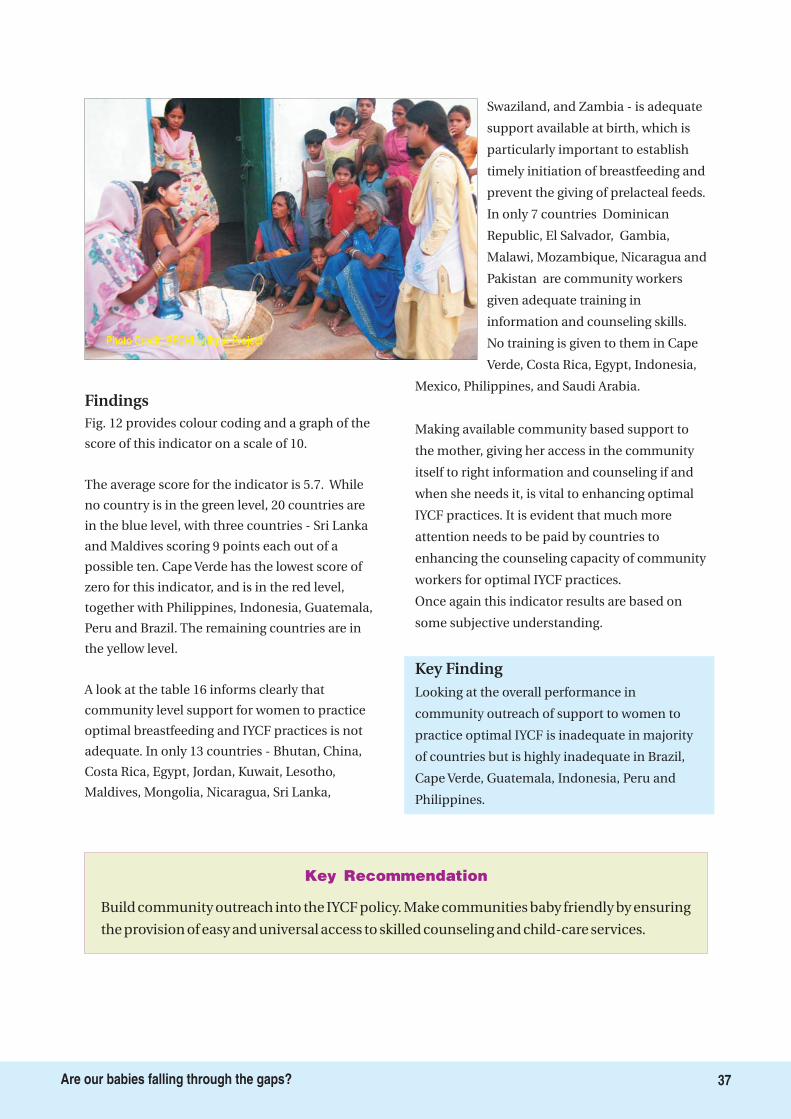
Build community outreach into the IYCF policy. Make communities baby friendly by ensuring
the provision of easy and universal access to skilled counseling and child-care services.
Key Recommendation
37Are our babies falling through the gaps?
Photo Credit: BFCHI Lalitpur Project
Findings
Key Finding
Fig. 12 provides colour coding and a graph of the
score of this indicator on a scale of 10.
The average score for the indicator is 5.7. While
no country is in the green level, 20 countries are
in the blue level, with three countries - Sri Lanka
and Maldives scoring 9 points each out of a
possible ten. Cape Verde has the lowest score of
zero for this indicator, and is in the red level,
together with Philippines, Indonesia, Guatemala,
Peru and Brazil. The remaining countries are in
the yellow level.
A look at the table 16 informs clearly that
community level support for women to practice
optimal breastfeeding and IYCF practices is not
adequate. In only 13 countries - Bhutan, China,
Costa Rica, Egypt, Jordan, Kuwait, Lesotho,
Maldives, Mongolia, Nicaragua, Sri Lanka,
Swaziland, and Zambia - is adequate
support available at birth, which is
particularly important to establish
timely initiation of breastfeeding and
prevent the giving of prelacteal feeds.
In only 7 countries Dominican
Republic, El Salvador, Gambia,
Malawi, Mozambique, Nicaragua and
Pakistan are community workers
given adequate training in
information and counseling skills.
No training is given to them in Cape
Verde, Costa Rica, Egypt, Indonesia,
Mexico, Philippines, and Saudi Arabia.
Making available community based support to
the mother, giving her access in the community
itself to right information and counseling if and
when she needs it, is vital to enhancing optimal
IYCF practices. It is evident that much more
attention needs to be paid by countries to
enhancing the counseling capacity of community
workers for optimal IYCF practices.
Once again this indicator results are based on
some subjective understanding.
Looking at the overall performance in
community outreach of support to women to
practice optimal IYCF is inadequate in majority
of countries but is highly inadequate in Brazil,
Cape Verde, Guatemala, Indonesia, Peru and
Philippines.
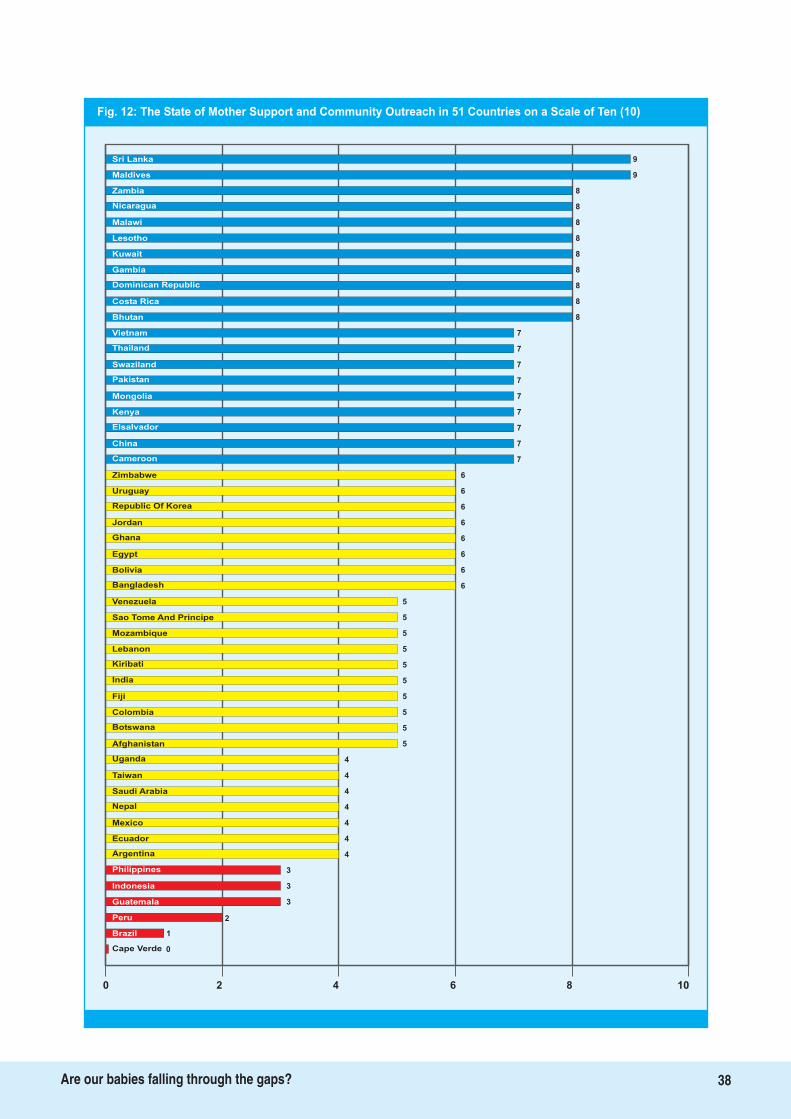
Fig. 12: The State of Mother Support and Community Outreach in 51 Countries on a Scale of Ten (10)
9
Kuwait 8
Gambia 8
Dominican Republic 8
Costa Rica 8
Bhutan 8
Vietnam 7
Thailand 7
Swaziland 7
Pakistan 7
Mongolia 7
Kenya 7
Elsalvador 7
China 7
Cameroon 7
Zimbabwe 6
Uruguay 6
Republic Of Korea 6
Jordan 6
Ghana 6
Egypt 6
Bolivia
Bangladesh
Venezuela
Sao Tome And Principe
Mozambique
Lebanon
Kiribati
5
India
Fiji
Colombia
Botswana
6
5
5
5
5
5
5
5
5
4
4
4
4
Afghanistan
Uganda
Saudi Arabia
4
Nepal
Mexico
Ecuador
Philippines
4
4
3
3
2
Indonesia
Guatemala
Peru
1Brazil
0Cape Verde
0 2 4 6 8 10
Taiwan
9
8
8
8
8
Argentina
Sri Lanka
Maldives
Zambia
Nicaragua
Malawi
Lesotho
6
5
3
38Are our babies falling through the gaps?
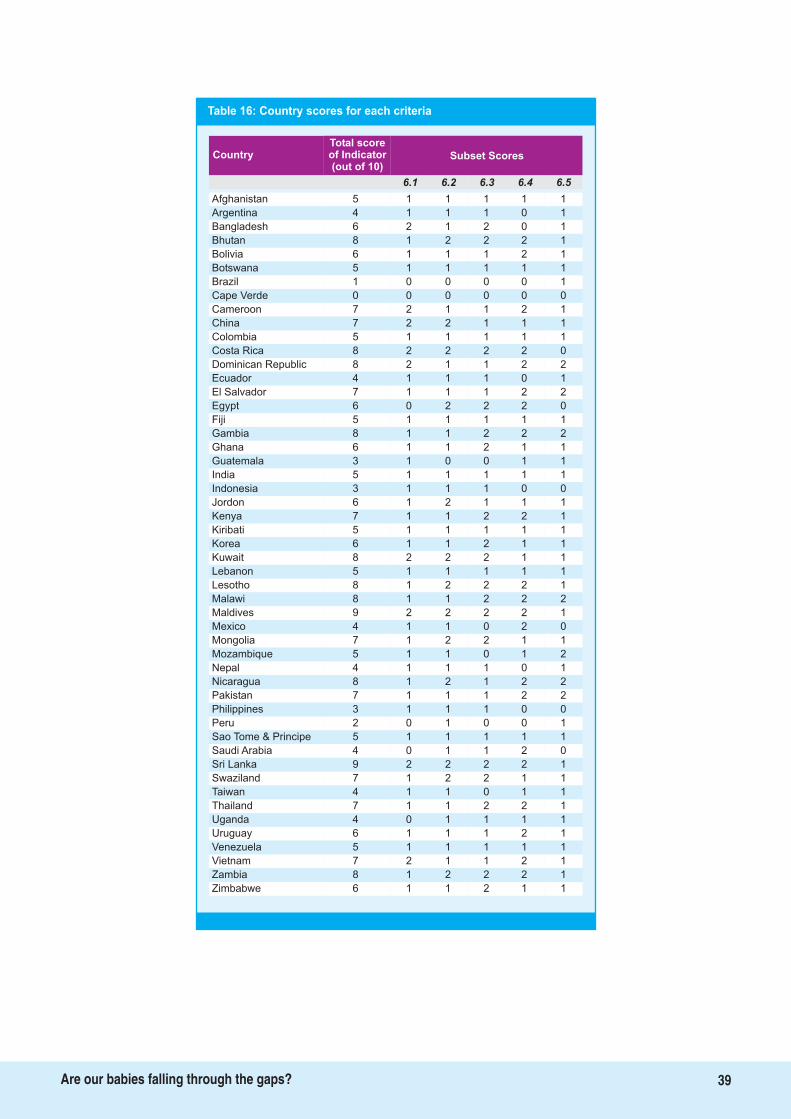
Table 16: Country scores for each criteria
Total scoreof Indicator(out of 10)
Country Subset Scores
6.1 6.2 6.3 6.4 6.5
Afghanistan 5 1 1 1 1 1
Argentina 4 1 1 1 0 1
Bangladesh 6 2 1 2 0 1
Bhutan 8 1 2 2 2 1
Bolivia 6 1 1 1 2 1
Botswana 5 1 1 1 1 1
Brazil 1 0 0 0 0 1
Cape Verde 0 0 0 0 0 0
Cameroon 7 2 1 1 2 1
China 7 2 2 1 1 1
Colombia 5 1 1 1 1 1
Costa Rica 8 2 2 2 2 0
Dominican Republic 8 2 1 1 2 2
Ecuador 4 1 1 1 0 1
El Salvador 7 1 1 1 2 2
Egypt 6 0 2 2 2 0
Fiji 5 1 1 1 1 1
Gambia 8 1 1 2 2 2
Ghana 6 1 1 2 1 1
Guatemala 3 1 0 0 1 1
India 5 1 1 1 1 1
Indonesia 3 1 1 1 0 0
Jordon 6 1 2 1 1 1
Kenya 7 1 1 2 2 1
Kiribati 5 1 1 1 1 1
Korea 6 1 1 2 1 1
Kuwait 8 2 2 2 1 1
Lebanon 5 1 1 1 1 1
Lesotho 8 1 2 2 2 1
Malawi 8 1 1 2 2 2
Maldives 9 2 2 2 2 1
Mexico 4 1 1 0 2 0
Mongolia 7 1 2 2 1 1
Mozambique 5 1 1 0 1 2
Nepal 4 1 1 1 0 1
Nicaragua 8 1 2 1 2 2
Pakistan 7 1 1 1 2 2
Philippines 3 1 1 1 0 0
Peru 2 0 1 0 0 1
Sao Tome & Principe 5 1 1 1 1 1
Saudi Arabia 4 0 1 1 2 0
Sri Lanka 9 2 2 2 2 1
Swaziland 7 1 2 2 1 1
Taiwan 4 1 1 0 1 1
Thailand 7 1 1 2 2 1
Uganda 4 0 1 1 1 1
Uruguay 6 1 1 1 2 1
Venezuela 5 1 1 1 1 1
Vietnam 7 2 1 1 2 1
Zambia 8 1 2 2 2 1
Zimbabwe 6 1 1 2 1 1
39Are our babies falling through the gaps?
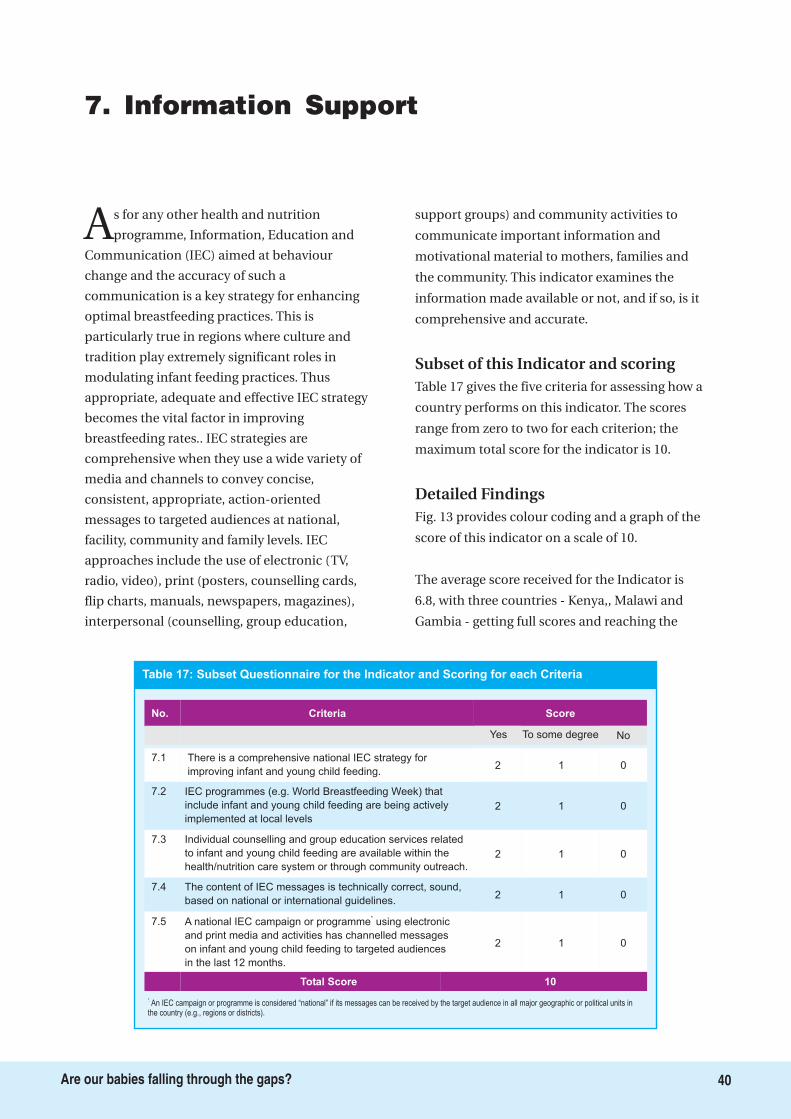
7. Information Support
As for any other health and nutrition
programme, Information, Education and
Communication (IEC) aimed at behaviour
change and the accuracy of such a
communication is a key strategy for enhancing
optimal breastfeeding practices. This is
particularly true in regions where culture and
tradition play extremely significant roles in
modulating infant feeding practices. Thus
appropriate, adequate and effective IEC strategy
becomes the vital factor in improving
breastfeeding rates.. IEC strategies are
comprehensive when they use a wide variety of
media and channels to convey concise,
consistent, appropriate, action-oriented
messages to targeted audiences at national,
facility, community and family levels. IEC
approaches include the use of electronic (TV,
radio, video), print (posters, counselling cards,
flip charts, manuals, newspapers, magazines),
interpersonal (counselling, group education,
support groups) and community activities to
communicate important information and
motivational material to mothers, families and
the community. This indicator examines the
information made available or not, and if so, is it
comprehensive and accurate.
Table 17 gives the five criteria for assessing how a
country performs on this indicator. The scores
range from zero to two for each criterion; the
maximum total score for the indicator is 10.
Fig. 13 provides colour coding and a graph of the
score of this indicator on a scale of 10.
The average score received for the Indicator is
6.8, with three countries - Kenya,, Malawi and
Gambia - getting full scores and reaching the
Subset of this Indicator and scoring
Detailed Findings
7.1
7.2 IEC programmes (e.g. World Breastfeeding Week) that
include infant and young child feeding are being actively
implemented at local levels
Individual counselling and group education services related
to infant and young child feeding are available within the
health/nutrition care system or through community outreach.
7.4
7.5 A national IEC campaign or programme using electronic
and print media and activities has channelled messages
on infant and young child feeding to targeted audiences
in the last 12 months.
*
No.
There is a comprehensive national IEC strategy for
improving infant and young child feeding.
7.3
The content of IEC messages is technically correct, sound,
based on national or international guidelines.
2 01
Criteria Score
2 1 0
2 1 0
2 1 0
2 1 0
Yes To some degree No
Total Score 10
*.An IEC campaign or programme is considered “national” if its messages can be received by the target audience in all major geographic or political units in
the country (e.g., regions or districts).
Table 17: Subset Questionnaire for the Indicator and Scoring for each Criteria
40Are our babies falling through the gaps?
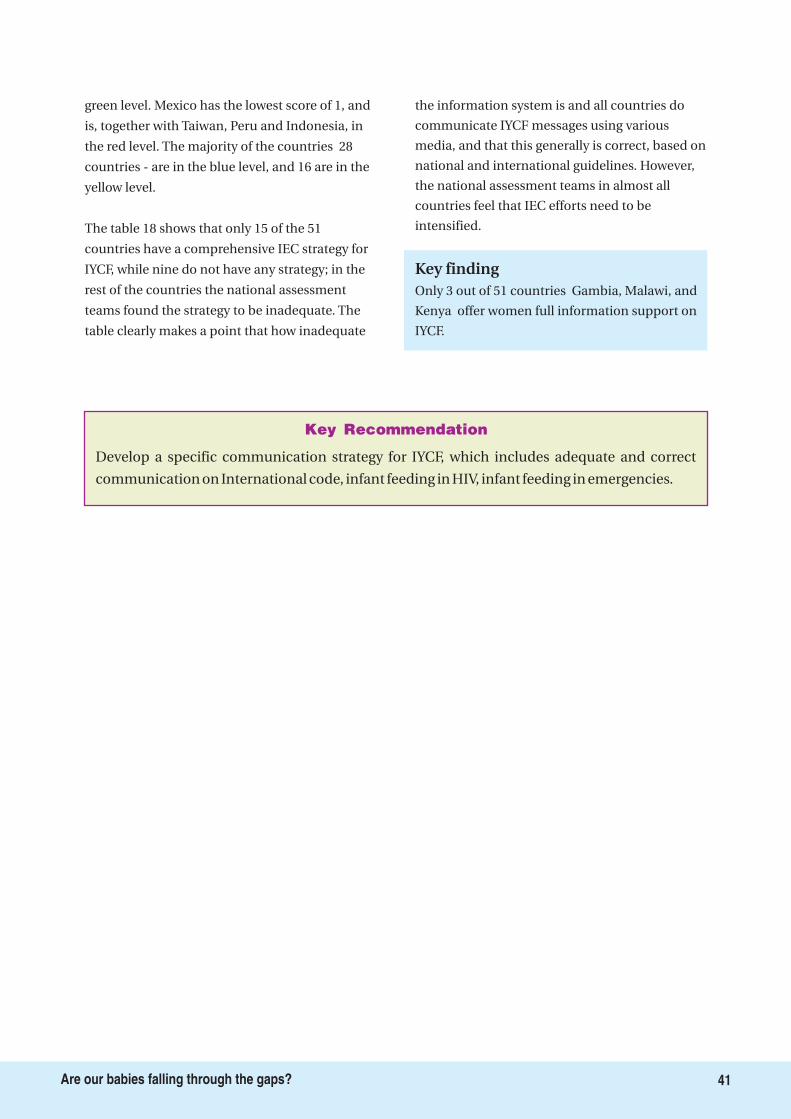
Develop a specific communication strategy for IYCF, which includes adequate and correct
communication on International code, infant feeding in HIV, infant feeding in emergencies.
Key Recommendation
41Are our babies falling through the gaps?
green level. Mexico has the lowest score of 1, and
is, together with Taiwan, Peru and Indonesia, in
the red level. The majority of the countries 28
countries - are in the blue level, and 16 are in the
yellow level.
The table 18 shows that only 15 of the 51
countries have a comprehensive IEC strategy for
IYCF, while nine do not have any strategy; in the
rest of the countries the national assessment
teams found the strategy to be inadequate. The
table clearly makes a point that how inadequate
the information system is and all countries do
communicate IYCF messages using various
media, and that this generally is correct, based on
national and international guidelines. However,
the national assessment teams in almost all
countries feel that IEC efforts need to be
intensified.
Only 3 out of 51 countries Gambia, Malawi, and
Kenya offer women full information support on
IYCF.
Key finding
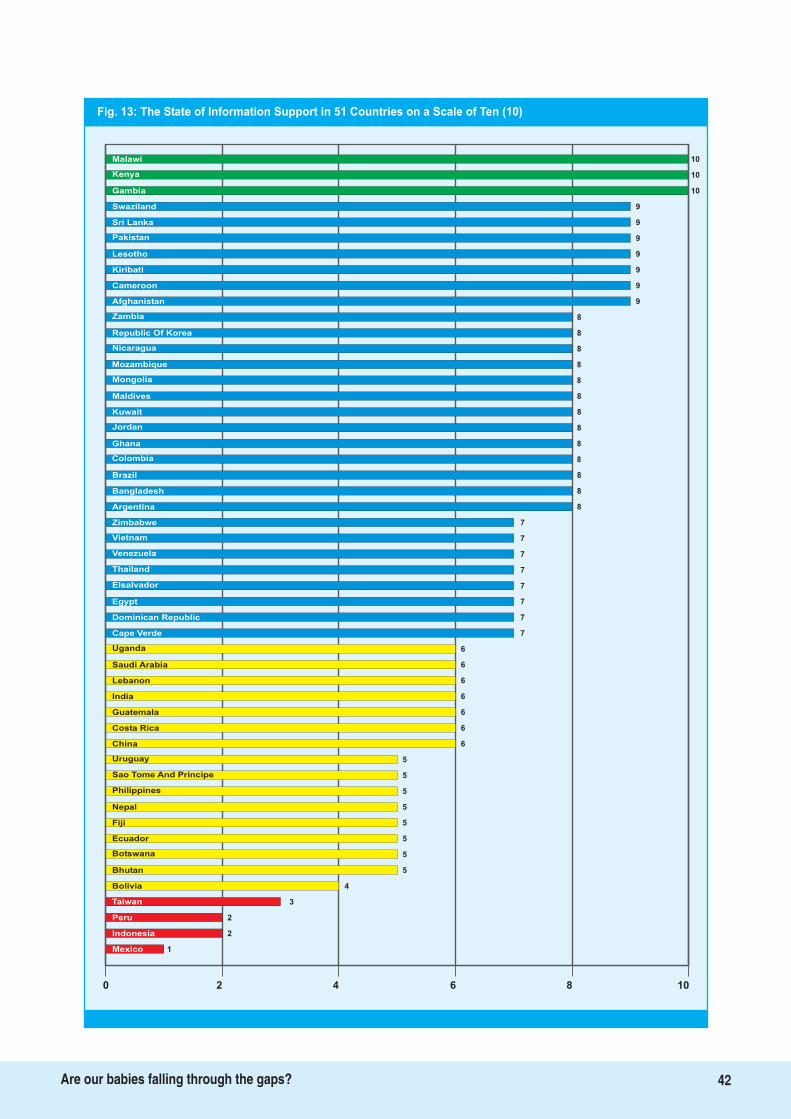
Fig. 13: The State of Information Support in 51 Countries on a Scale of Ten (10)
10Malawi
Kenya
Gambia
Swaziland
Sri Lanka
Pakistan
Lesotho 9
Kiribati 9
Cameroon 9
Afghanistan 9
Zambia 8
Republic Of Korea 8
Nicaragua 8
Mozambique 8
Mongolia 8
Maldives 8
Kuwait 8
Jordan 8
Ghana 8
Colombia 8
Brazil 8
Bangladesh 8
Argentina 8
Zimbabwe 7
Vietnam 7
Venezuela 7
Thailand
Elsalvador
Egypt
Dominican Republic
Cape Verde
Uganda
Saudi Arabia
6
Lebanon
India
Guatemala
Costa Rica
7
7
7
7
7
6
6
6
6
6
6
5
5
5
5
China
Uruguay
Philippines
5
Nepal
Fiji
Ecuador
Bhutan
5
5
5
4
3
2
Bolivia
Taiwan
Peru
2Indonesia
1Mexico
0 2 4 6 8 10
Sao Tome And Principe
10
10
9
9
9
Botswana
42Are our babies falling through the gaps?
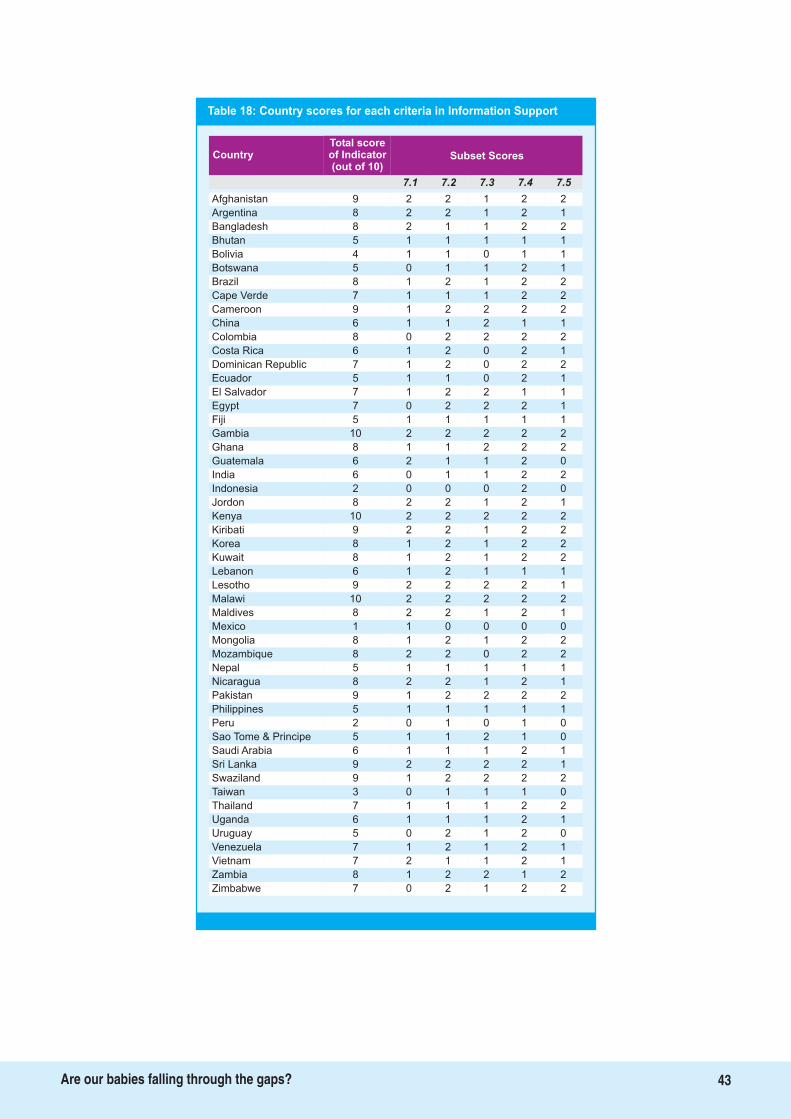
43Are our babies falling through the gaps?
Table 18: Country scores for each criteria in Information Support
Total scoreof Indicator(out of 10)
Country Subset Scores
7.1 7.2 7.3 7.4 7.5
Afghanistan 9 2 2 1 2 2
Argentina 8 2 2 1 2 1
Bangladesh 8 2 1 1 2 2
Bhutan 5 1 1 1 1 1
Bolivia 4 1 1 0 1 1
Botswana 5 0 1 1 2 1
Brazil 8 1 2 1 2 2
Cape Verde 7 1 1 1 2 2
Cameroon 9 1 2 2 2 2
China 6 1 1 2 1 1
Colombia 8 0 2 2 2 2
Costa Rica 6 1 2 0 2 1
Dominican Republic 7 1 2 0 2 2
Ecuador 5 1 1 0 2 1
El Salvador 7 1 2 2 1 1
Egypt 7 0 2 2 2 1
Fiji 5 1 1 1 1 1
Gambia 10 2 2 2 2 2
Ghana 8 1 1 2 2 2
Guatemala 6 2 1 1 2 0
India 6 0 1 1 2 2
Indonesia 2 0 0 0 2 0
Jordon 8 2 2 1 2 1
Kenya 10 2 2 2 2 2
Kiribati 9 2 2 1 2 2
Korea 8 1 2 1 2 2
Kuwait 8 1 2 1 2 2
Lebanon 6 1 2 1 1 1
Lesotho 9 2 2 2 2 1
Malawi 10 2 2 2 2 2
Maldives 8 2 2 1 2 1
Mexico 1 1 0 0 0 0
Mongolia 8 1 2 1 2 2
Mozambique 8 2 2 0 2 2
Nepal 5 1 1 1 1 1
Nicaragua 8 2 2 1 2 1
Pakistan 9 1 2 2 2 2
Philippines 5 1 1 1 1 1
Peru 2 0 1 0 1 0
Sao Tome & Principe 5 1 1 2 1 0
Saudi Arabia 6 1 1 1 2 1
Sri Lanka 9 2 2 2 2 1
Swaziland 9 1 2 2 2 2
Taiwan 3 0 1 1 1 0
Thailand 7 1 1 1 2 2
Uganda 6 1 1 1 2 1
Uruguay 5 0 2 1 2 0
Venezuela 7 1 2 1 2 1
Vietnam 7 2 1 1 2 1
Zambia 8 1 2 2 1 2
Zimbabwe 7 0 2 1 2 2
8. Infant Feeding and HIV
The Global Strategy for IYCF highlights the
importance of correct policy and
programme work in this area for achieving the
targets. The UN Framework for priority action on
infant feeding and HIV activities accords the
highest priority to the development of a
comprehensive national infant and young child
policy that includes HIV and infant feeding.
Updated guidelines of the WHO are based on the
research evidence establishing that antiretroviral
(ARV) interventions to either the HIV-infected
mother or HIV-exposed infant can significantly
reduce the risk of postnatal transmission of HIV
through breastfeeding. The WHO guidelines
further suggest how to strengthen the infant and
young child feeding component in the national
HIV and child health programmes.
The listing also includes implementation and
enforcement of the International Code and
subsequent WHA resolutions, intensification of
efforts to protect, promote and support
appropriate infant and young child feeding while
recognizing HIV as an exceptionally difficult
circumstance, providing adequate support to HIV
positive women to make informed choices and
carry them out successfully, and support research
on HIV and infant feeding.
The indicator explores what kind of support is
made available for women, who are HIV positive
and want to continue breastfeeding, or
breastfeeding is recommended based on the
AFASS criteria or artificial feeding is to be given to
the baby because of certain criteria. We try and
find out if policies and programmes are in place
to ensure that HIV positive mothers are informed
about the risks and benefits of different infant
feeding options and supported in carrying out
their infant feeding decisions.
Table 19 shows the subset of indicator on Infant
Feeding and HIV and the maximum score that
one can achieve. There are nine criteria for
measuring national achievement for this
indicator.
Fig. 14 provides colour coding and a graph of the
score of this indicator on a scale of 10.
The average score of the 51 countries for this
indicator is 5.42. The scores range from 10 for Sri
Lanka to zero for Egypt, Saudi Arabia, Taiwan,
Indonesia and Cape Verde. Twenty countries are
in the blue level, 14 in the yellow level, and 16 are
in the red level; in fact, amongst all indicators,
this indicator has the second highest number of
countries in the red level.
Table 20 gives each country's score on the subset
of questions.
Twelve countries out of 51 have not included
infant feeding and HIV in their IYCF policies; of
the rest, 25 have included it adequately and the
rest to some degree. Seven of the 10 countries
with a score of 0 do not offer VCCT to pregnant
women, and 16 offer it to some of the women. In
countries where there is a policy, at least to some
extent, the policy gives effect to the International
Code in 21 countries, and to some extent in
another 13 countries.
Though Indicator 10 does not have the lowest
average score of all indicators, it is obvious that
several countries need to do much more to
prioritise action on this front to assist and
support women with HIV/AIDS to make
informed choices about feeding their infants. If
Subset for the Indicator and scoring
Findings
44Are our babies falling through the gaps?
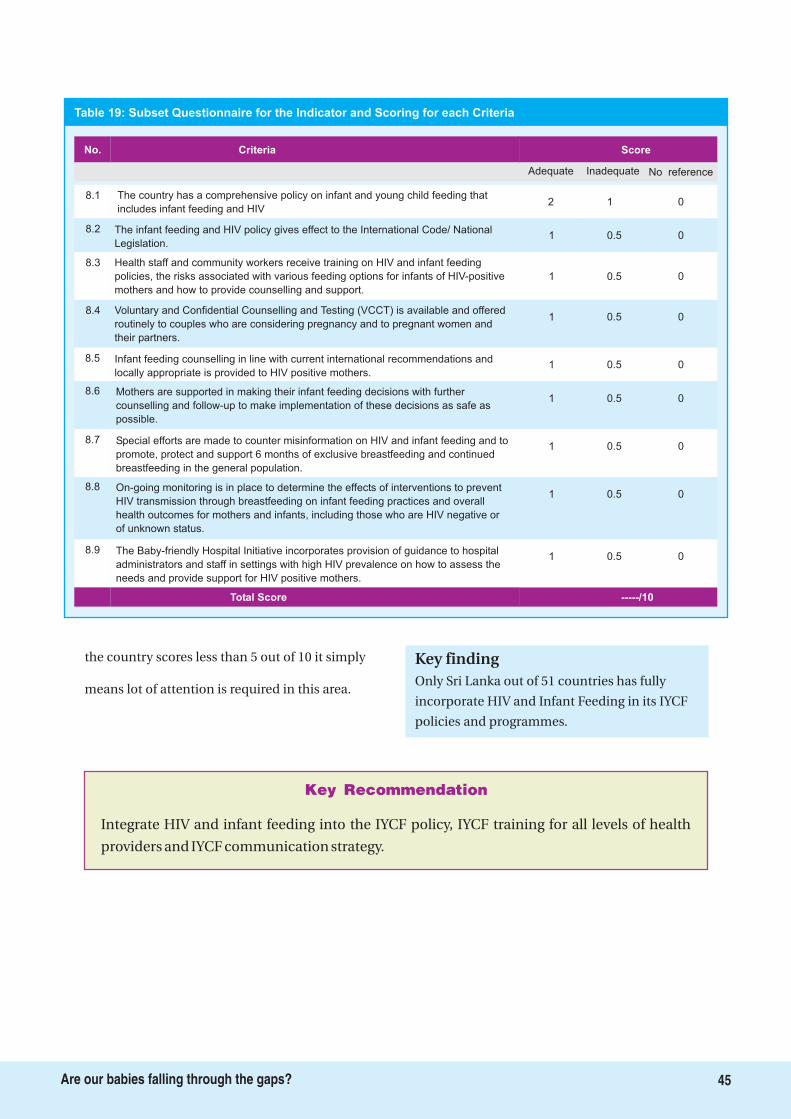
Integrate HIV and infant feeding into the IYCF policy, IYCF training for all levels of health
providers and IYCF communication strategy.
Key Recommendation
Score
2 1 0
1 0.5 0
1 0.5 0
1 0.5 0
1 00.5
Adequate Inadequate No reference
1 0.5 0
1 0.5 0
8.1 The country has a comprehensive policy on infant and young child feeding that
includes infant feeding and HIV
Criteria
8.2 The infant feeding and HIV policy gives effect to the International Code/ National
Legislation.
8.3 Health staff and community workers receive training on HIV and infant feeding
policies, the risks associated with various feeding options for infants of HIV-positive
mothers and how to provide counselling and support.
8.4 Voluntary and Confidential Counselling and Testing (VCCT) is available and offered
routinely to couples who are considering pregnancy and to pregnant women and
their partners.
8.5 Infant feeding counselling in line with current international recommendations and
locally appropriate is provided to HIV positive mothers.
No.
8.6 Mothers are supported in making their infant feeding decisions with further
counselling and follow-up to make implementation of these decisions as safe as
possible.
8.7 Special efforts are made to counter misinformation on HIV and infant feeding and to
promote, protect and support 6 months of exclusive breastfeeding and continued
breastfeeding in the general population.
1 0.5 0
1 0.5 0
-----/10
8.8 On-going monitoring is in place to determine the effects of interventions to prevent
HIV transmission through breastfeeding on infant feeding practices and overall
health outcomes for mothers and infants, including those who are HIV negative or
of unknown status.
8.9 The Baby-friendly Hospital Initiative incorporates provision of guidance to hospital
administrators and staff in settings with high HIV prevalence on how to assess the
needs and provide support for HIV positive mothers.
Total Score
Table 19: Subset Questionnaire for the Indicator and Scoring for each Criteria
45Are our babies falling through the gaps?
the country scores less than 5 out of 10 it simply
means lot of attention is required in this area.Only Sri Lanka out of 51 countries has fully
incorporate HIV and Infant Feeding in its IYCF
policies and programmes.
Key finding
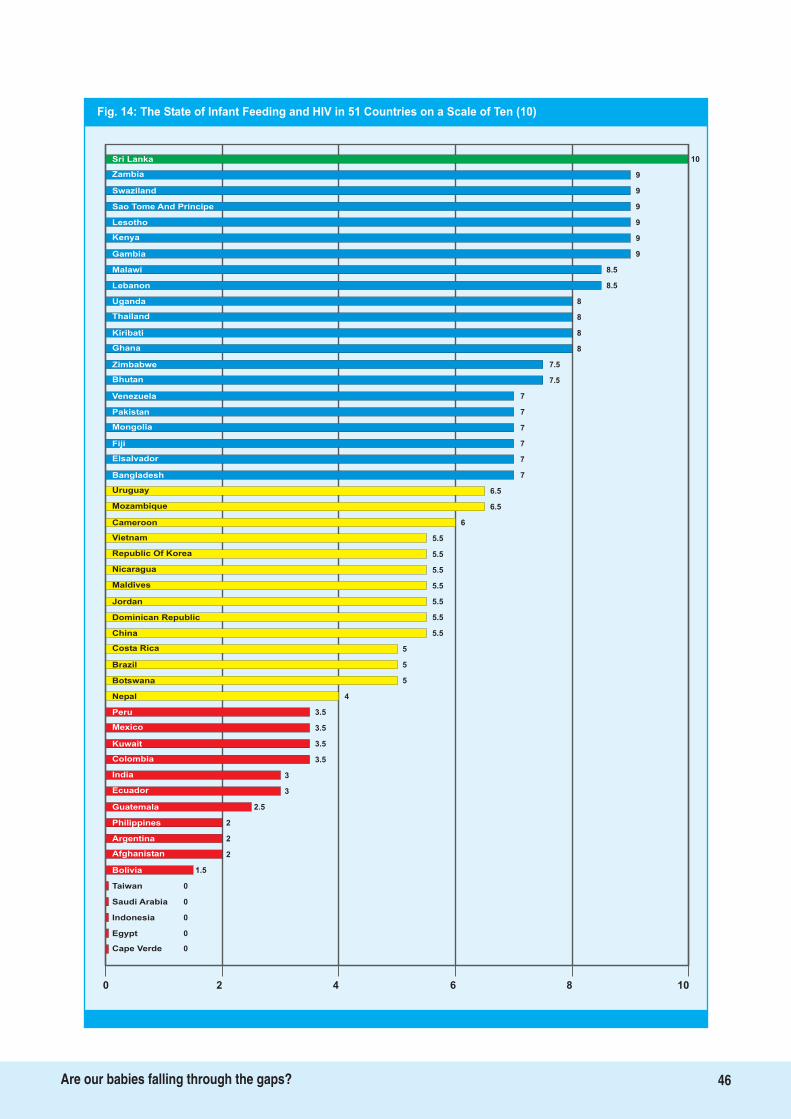
Fig. 14: The State of Infant Feeding and HIV in 51 Countries on a Scale of Ten (10)
10Sri Lanka
Zambia
Swaziland
Sao Tome And Principe
Lesotho
Kenya
Gambia 9
Malawi 8.5
Lebanon 8.5
Uganda 8
Thailand 8
Kiribati 8
Ghana 8
Zimbabwe 7.5
Bhutan 7.5
Venezuela 7
Pakistan 7
Mongolia 7
Fiji 7
Elsalvador 7
Bangladesh 7
Uruguay 6.5
Mozambique 6.5
Cameroon 6
Vietnam 5.5
Republic Of Korea 5.5
Nicaragua
Maldives
Jordan
Dominican Republic
China
Costa Rica
Brazil
3.5
Botswana
Nepal
Peru
Mexico
5.5
5.5
5.5
5.5
5.5
5
5
5
4
3.5
3.5
3.5
3
3
2.5
Kuwait
Colombia
Ecuador
2
Guatemala
Philippines
Argentina
Bolivia
2
2
1.5
0
0
0
Taiwan
Saudi Arabia
Indonesia
0Egypt
0Cape Verde
0 2 4 6 8 10
India
9
9
9
9
9
Afghanistan
46Are our babies falling through the gaps?
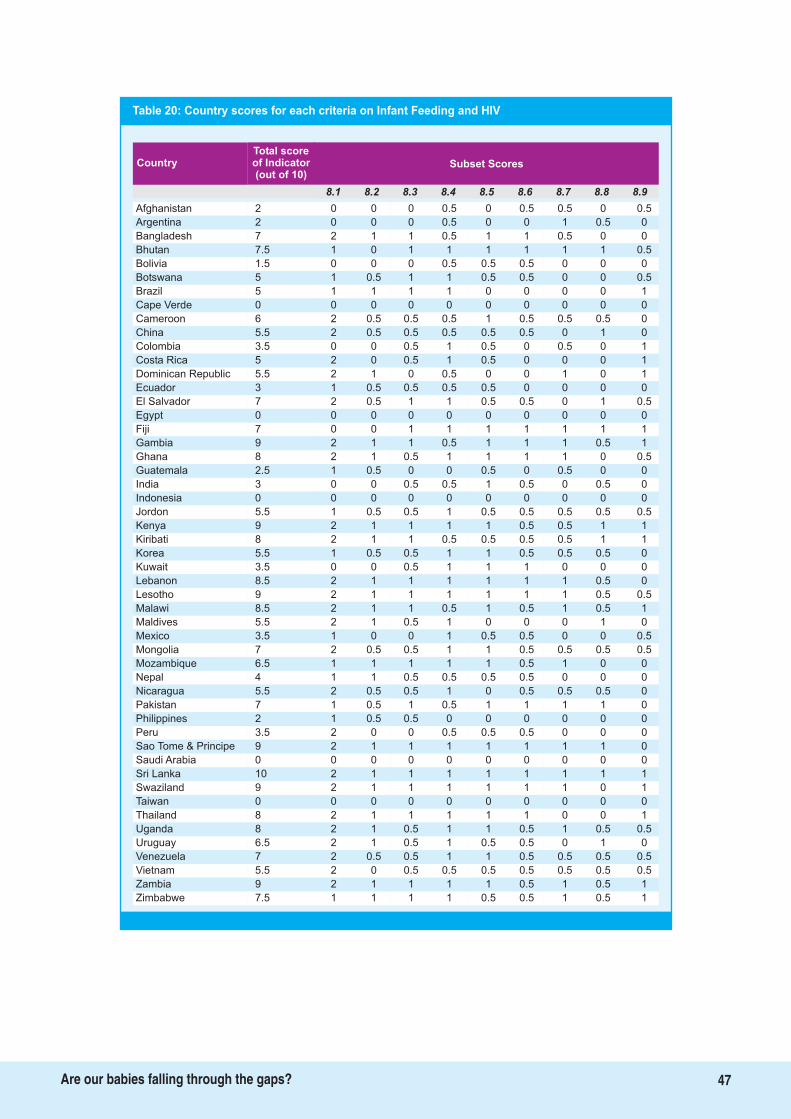
Total scoreof Indicator(out of 10)
Country Subset Scores
8.1 8.2 8.3 8.4 8.5 8.6 8.7 8.8 8.9
Table 20: Country scores for each criteria on Infant Feeding and HIV
Afghanistan 2 0 0 0 0.5 0 0.5 0.5 0 0.5
Argentina 2 0 0 0 0.5 0 0 1 0.5 0
Bangladesh 7 2 1 1 0.5 1 1 0.5 0 0
Bhutan 7.5 1 0 1 1 1 1 1 1 0.5
Bolivia 1.5 0 0 0 0.5 0.5 0.5 0 0 0
Botswana 5 1 0.5 1 1 0.5 0.5 0 0 0.5
Brazil 5 1 1 1 1 0 0 0 0 1
Cape Verde 0 0 0 0 0 0 0 0 0 0
Cameroon 6 2 0.5 0.5 0.5 1 0.5 0.5 0.5 0
China 5.5 2 0.5 0.5 0.5 0.5 0.5 0 1 0
Colombia 3.5 0 0 0.5 1 0.5 0 0.5 0 1
Costa Rica 5 2 0 0.5 1 0.5 0 0 0 1
Dominican Republic 5.5 2 1 0 0.5 0 0 1 0 1
Ecuador 3 1 0.5 0.5 0.5 0.5 0 0 0 0
El Salvador 7 2 0.5 1 1 0.5 0.5 0 1 0.5
Egypt 0 0 0 0 0 0 0 0 0 0
Fiji 7 0 0 1 1 1 1 1 1 1
Gambia 9 2 1 1 0.5 1 1 1 0.5 1
Ghana 8 2 1 0.5 1 1 1 1 0 0.5
Guatemala 2.5 1 0.5 0 0 0.5 0 0.5 0 0
India 3 0 0 0.5 0.5 1 0.5 0 0.5 0
Indonesia 0 0 0 0 0 0 0 0 0 0
Jordon 5.5 1 0.5 0.5 1 0.5 0.5 0.5 0.5 0.5
Kenya 9 2 1 1 1 1 0.5 0.5 1 1
Kiribati 8 2 1 1 0.5 0.5 0.5 0.5 1 1
Korea 5.5 1 0.5 0.5 1 1 0.5 0.5 0.5 0
Kuwait 3.5 0 0 0.5 1 1 1 0 0 0
Lebanon 8.5 2 1 1 1 1 1 1 0.5 0
Lesotho 9 2 1 1 1 1 1 1 0.5 0.5
Malawi 8.5 2 1 1 0.5 1 0.5 1 0.5 1
Maldives 5.5 2 1 0.5 1 0 0 0 1 0
Mexico 3.5 1 0 0 1 0.5 0.5 0 0 0.5
Mongolia 7 2 0.5 0.5 1 1 0.5 0.5 0.5 0.5
Mozambique 6.5 1 1 1 1 1 0.5 1 0 0
Nepal 4 1 1 0.5 0.5 0.5 0.5 0 0 0
Nicaragua 5.5 2 0.5 0.5 1 0 0.5 0.5 0.5 0
Pakistan 7 1 0.5 1 0.5 1 1 1 1 0
Philippines 2 1 0.5 0.5 0 0 0 0 0 0
Peru 3.5 2 0 0 0.5 0.5 0.5 0 0 0
Sao Tome & Principe 9 2 1 1 1 1 1 1 1 0
Saudi Arabia 0 0 0 0 0 0 0 0 0 0
Sri Lanka 10 2 1 1 1 1 1 1 1 1
Swaziland 9 2 1 1 1 1 1 1 0 1
Taiwan 0 0 0 0 0 0 0 0 0 0
Thailand 8 2 1 1 1 1 1 0 0 1
Uganda 8 2 1 0.5 1 1 0.5 1 0.5 0.5
Uruguay 6.5 2 1 0.5 1 0.5 0.5 0 1 0
Venezuela 7 2 0.5 0.5 1 1 0.5 0.5 0.5 0.5
Vietnam 5.5 2 0 0.5 0.5 0.5 0.5 0.5 0.5 0.5
Zambia 9 2 1 1 1 1 0.5 1 0.5 1
Zimbabwe 7.5 1 1 1 1 0.5 0.5 1 0.5 1
47Are our babies falling through the gaps?
9. Infant Feeding During Emergencies
Emergencies and natural disasters pose
serious challenges for Governments, aid
agencies, NGOs and community to provide food,
water, shelter, medical aid and protection to the
affected people. Infants and young children are
among the most vulnerable groups in
emergencies both during manmade and natural
disasters. Interruption of breastfeeding and
inappropriate complementary feeding increase
the risks of illness, malnutrition, and mortality,
especially in situations where other support
services like provision of clean drinking water,
sanitation facilities and medical help may be
inadequate.
The risks of artificial feeding were exposed in
Botswana in 2005/06 where replacement feeding
with infant formula was offered to all HIV-
infected mothers as part of a national
programme to prevent transmission of HIV from
mother to child (PMTCT). Flooding led to
contaminated water supplies, a huge rise in
diarrhoea and malnutrition in young children.
National under five mortality increased by at
least 18% over 1 year. Non-breastfed infants were
50 times more likely to need hospital treatment
than breastfed infants, and much more likely to
die. Use of infant formula 'spilled over' to 15% of
HIV-uninfected women, exposing their infants to
unnecessary risk.
In emergency and relief situations the
responsibility for protecting, promoting and
supporting optimal infant and young child
feeding practices and minimizing harmful
practices should be shared by the emergency-
affected host country and responding agencies,
especially in view of the fact that formula and
packaged food dominate donations.
Optimal feeding of infants and young children
during emergencies requires that national
authorities (or equivalent) responsible for
emergency preparedness and response and
designated staff in national and nutrition
programmes should be adequately prepared for
ensuring optimal feeding practices in
emergencies, including providing traumatized
mothers with the support and counselling them
may require.
This indicator examines whether countries have
in place appropriate policies and programmes to
ensure that mothers, infants and children will be
provided adequate protection and support for
appropriate feeding during emergencies?
Table 21 gives the subset of questions for
It seems this is a much neglected area in spite of
the fact that natural disasters have been a
common occurrence and demonstrate much
needed support to women, In the rapid response
which is required breastfeeding support services
are rarely found. This is therefore a great
opportunity for any country to develop a system
where rapid response should include
breastfeeding counsellors in the supply lines.
Malnutrition increases dramatically, and kills
most rapidly in emergencies. Most children do
not die due to conflicts or natural disasters
themselves, but rather to resulting food
shortages, lack of safe water, inadequate health
care, and poor sanitation and hygiene. Child
survival is a key issue in disasters and need for
specific response including adequate strategies to
maintain optimal infant and young child feeding
(IYCF) is paramount.
Subset for the Indicator and scoring
48Are our babies falling through the gaps?
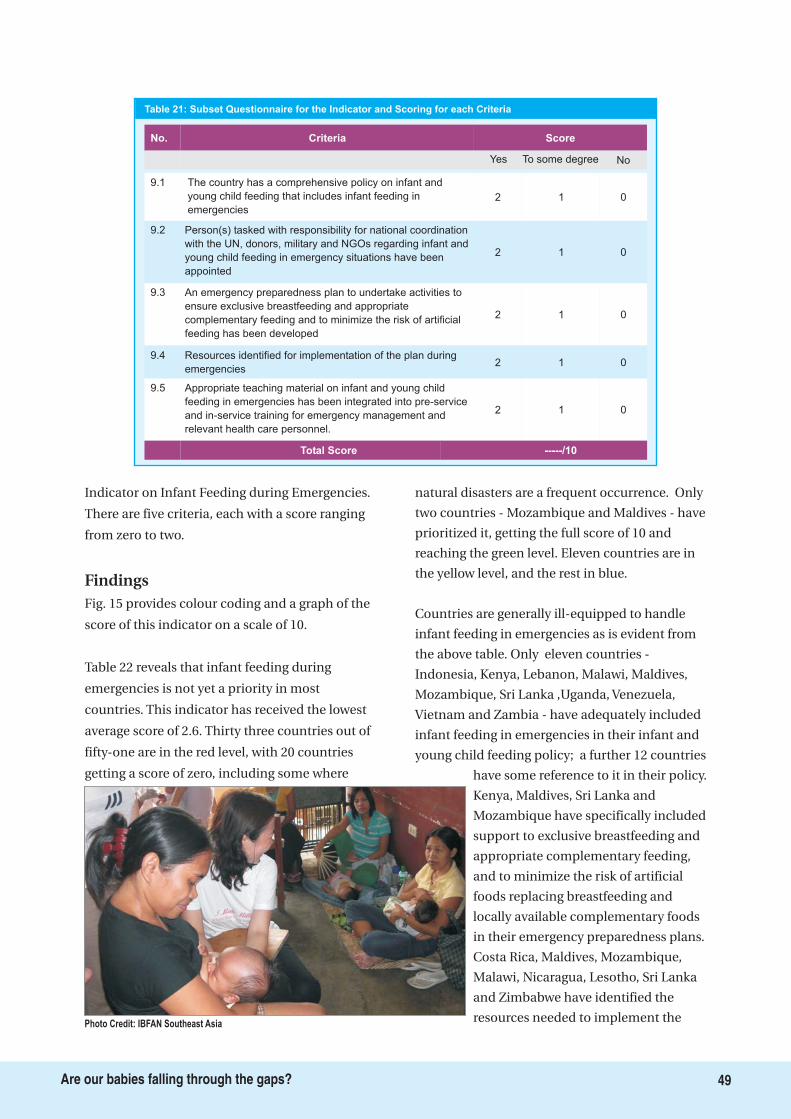
Indicator on Infant Feeding during Emergencies.
There are five criteria, each with a score ranging
from zero to two.
Fig. 15 provides colour coding and a graph of the
score of this indicator on a scale of 10.
Table 22 reveals that infant feeding during
emergencies is not yet a priority in most
countries. This indicator has received the lowest
average score of 2.6. Thirty three countries out of
fifty-one are in the red level, with 20 countries
getting a score of zero, including some where
natural disasters are a frequent occurrence. Only
two countries - Mozambique and Maldives - have
prioritized it, getting the full score of 10 and
reaching the green level. Eleven countries are in
the yellow level, and the rest in blue.
Countries are generally ill-equipped to handle
infant feeding in emergencies as is evident from
the above table. Only eleven countries -
Indonesia, Kenya, Lebanon, Malawi, Maldives,
Mozambique, Sri Lanka ,Uganda, Venezuela,
Vietnam and Zambia - have adequately included
infant feeding in emergencies in their infant and
young child feeding policy; a further 12 countries
have some reference to it in their policy.
Kenya, Maldives, Sri Lanka and
Mozambique have specifically included
support to exclusive breastfeeding and
appropriate complementary feeding,
and to minimize the risk of artificial
foods replacing breastfeeding and
locally available complementary foods
in their emergency preparedness plans.
Costa Rica, Maldives, Mozambique,
Malawi, Nicaragua, Lesotho, Sri Lanka
and Zimbabwe have identified the
resources needed to implement the
Findings
9.1 The country has a comprehensive policy on infant and
young child feeding that includes infant feeding in
emergencies
Criteria Score
2 1 0
9.2
2 1 0
9.3
2 1 0
9.42 1 0
9.5
2 01
No.
Yes To some degree No
Total Score -----/10
Table 21: Subset Questionnaire for the Indicator and Scoring for each Criteria
Person(s) tasked with responsibility for national coordination
with the UN, donors, military and NGOs regarding infant and
young child feeding in emergency situations have been
appointed
An emergency preparedness plan to undertake activities to
ensure exclusive breastfeeding and appropriate
complementary feeding and to minimize the risk of artificial
feeding has been developed
Resources identified for implementation of the plan during
emergencies
Appropriate teaching material on infant and young child
feeding in emergencies has been integrated into pre-service
and in-service training for emergency management and
relevant health care personnel.
Photo Credit: IBFAN Southeast Asia
49Are our babies falling through the gaps?
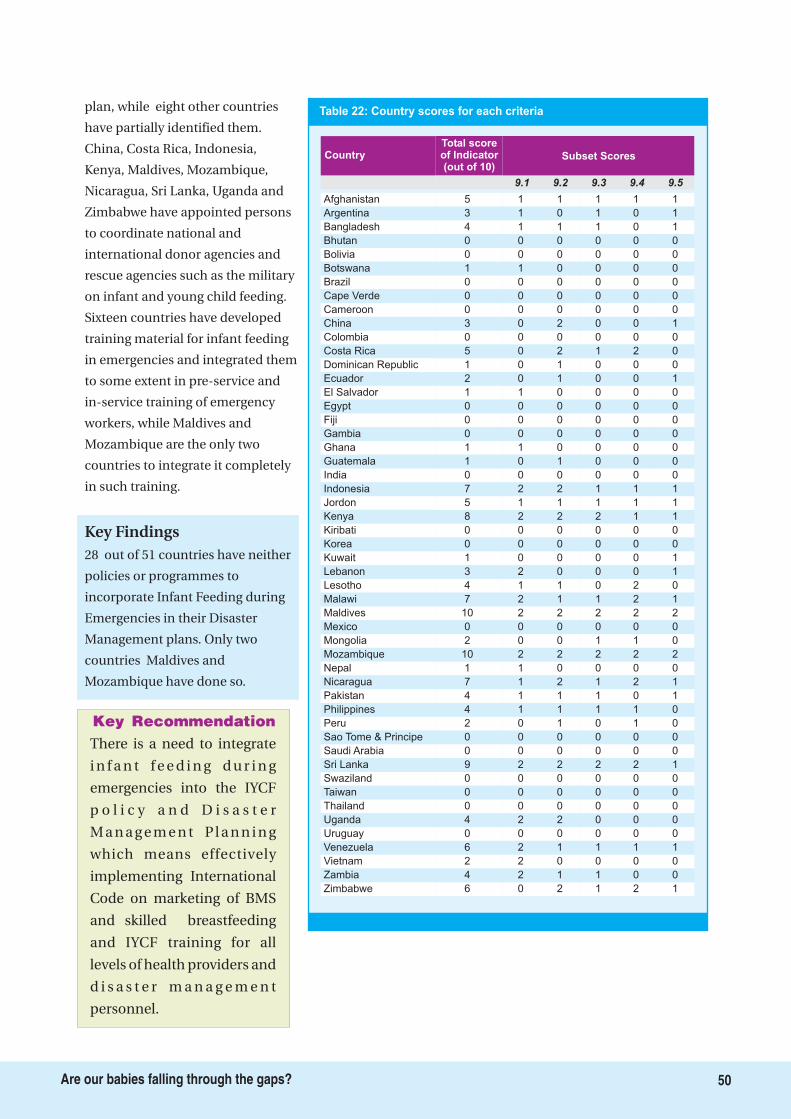
There is a need to integrate
i n f a n t f e e d i n g d u r i n g
emergencies into the IYCF
p o l i c y a n d D i s a s t e r
M a n a g e m e n t P l a n n i n g
which means effectively
implementing International
Code on marketing of BMS
and skilled breastfeeding
and IYCF training for all
levels of health providers and
d i s a s t e r m a n a g e m e n t
personnel.
Key Recommendation
50Are our babies falling through the gaps?
plan, while eight other countries
have partially identified them.
China, Costa Rica, Indonesia,
Kenya, Maldives, Mozambique,
Nicaragua, Sri Lanka, Uganda and
Zimbabwe have appointed persons
to coordinate national and
international donor agencies and
rescue agencies such as the military
on infant and young child feeding.
Sixteen countries have developed
training material for infant feeding
in emergencies and integrated them
to some extent in pre-service and
in-service training of emergency
workers, while Maldives and
Mozambique are the only two
countries to integrate it completely
in such training.
28 out of 51 countries have neither
policies or programmes to
incorporate Infant Feeding during
Emergencies in their Disaster
Management plans. Only two
countries Maldives and
Mozambique have done so.
Key Findings
Table 22: Country scores for each criteria
Total scoreof Indicator(out of 10)
Country Subset Scores
9.1 9.2 9.3 9.4 9.5
Afghanistan 5 1 1 1 1 1
Argentina 3 1 0 1 0 1
Bangladesh 4 1 1 1 0 1
Bhutan 0 0 0 0 0 0
Bolivia 0 0 0 0 0 0
Botswana 1 1 0 0 0 0
Brazil 0 0 0 0 0 0
Cape Verde 0 0 0 0 0 0
Cameroon 0 0 0 0 0 0
China 3 0 2 0 0 1
Colombia 0 0 0 0 0 0
Costa Rica 5 0 2 1 2 0
Dominican Republic 1 0 1 0 0 0
Ecuador 2 0 1 0 0 1
El Salvador 1 1 0 0 0 0
Egypt 0 0 0 0 0 0
Fiji 0 0 0 0 0 0
Gambia 0 0 0 0 0 0
Ghana 1 1 0 0 0 0
Guatemala 1 0 1 0 0 0
India 0 0 0 0 0 0
Indonesia 7 2 2 1 1 1
Jordon 5 1 1 1 1 1
Kenya 8 2 2 2 1 1
Kiribati 0 0 0 0 0 0
Korea 0 0 0 0 0 0
Kuwait 1 0 0 0 0 1
Lebanon 3 2 0 0 0 1
Lesotho 4 1 1 0 2 0
Malawi 7 2 1 1 2 1
Maldives 10 2 2 2 2 2
Mexico 0 0 0 0 0 0
Mongolia 2 0 0 1 1 0
Mozambique 10 2 2 2 2 2
Nepal 1 1 0 0 0 0
Nicaragua 7 1 2 1 2 1
Pakistan 4 1 1 1 0 1
Philippines 4 1 1 1 1 0
Peru 2 0 1 0 1 0
Sao Tome & Principe 0 0 0 0 0 0
Saudi Arabia 0 0 0 0 0 0
Sri Lanka 9 2 2 2 2 1
Swaziland 0 0 0 0 0 0
Taiwan 0 0 0 0 0 0
Thailand 0 0 0 0 0 0
Uganda 4 2 2 0 0 0
Uruguay 0 0 0 0 0 0
Venezuela 6 2 1 1 1 1
Vietnam 2 2 0 0 0 0
Zambia 4 2 1 1 0 0
Zimbabwe 6 0 2 1 2 1
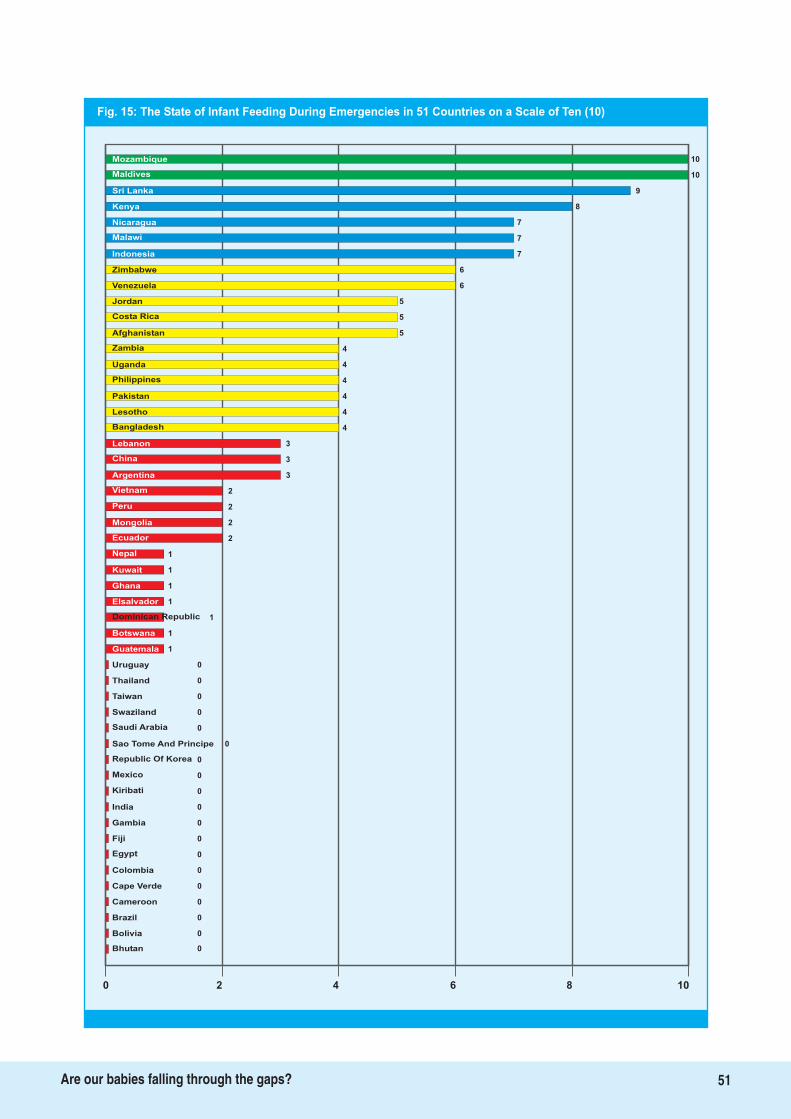
Fig. 15: The State of Infant Feeding During Emergencies in 51 Countries on a Scale of Ten (10)
10Mozambique
Maldives
Sri Lanka
Kenya
Nicaragua
Malawi
Indonesia 7
Zimbabwe 6
Venezuela 6
Jordan 5
Costa Rica 5
Afghanistan 5
Zambia 4
Uganda 4
Philippines 4
Pakistan 4
Lesotho 4
Bangladesh 4
Lebanon 3
China 3
Argentina 3
Vietnam 2
Peru 2
Mongolia 2
Ecuador 2
Nepal 1
Kuwait
Ghana
Elsalvador
Dominican Republic
Botswana
Uruguay
0
Thailand
Taiwan
Swaziland
Saudi Arabia
1
1
1
1
1
1
0
0
0
0
0
0
0
0
0
Sao Tome And Principe
Republic Of Korea
Kiribati
0
India
Gambia
Fiji
Colombia
0
0
0
0
0
0
Cape Verde
Cameroon
Brazil
0Bolivia
0Bhutan
0 2 4 6 8 10
Mexico
10
9
8
7
7
Egypt
Guatemala
51Are our babies falling through the gaps?
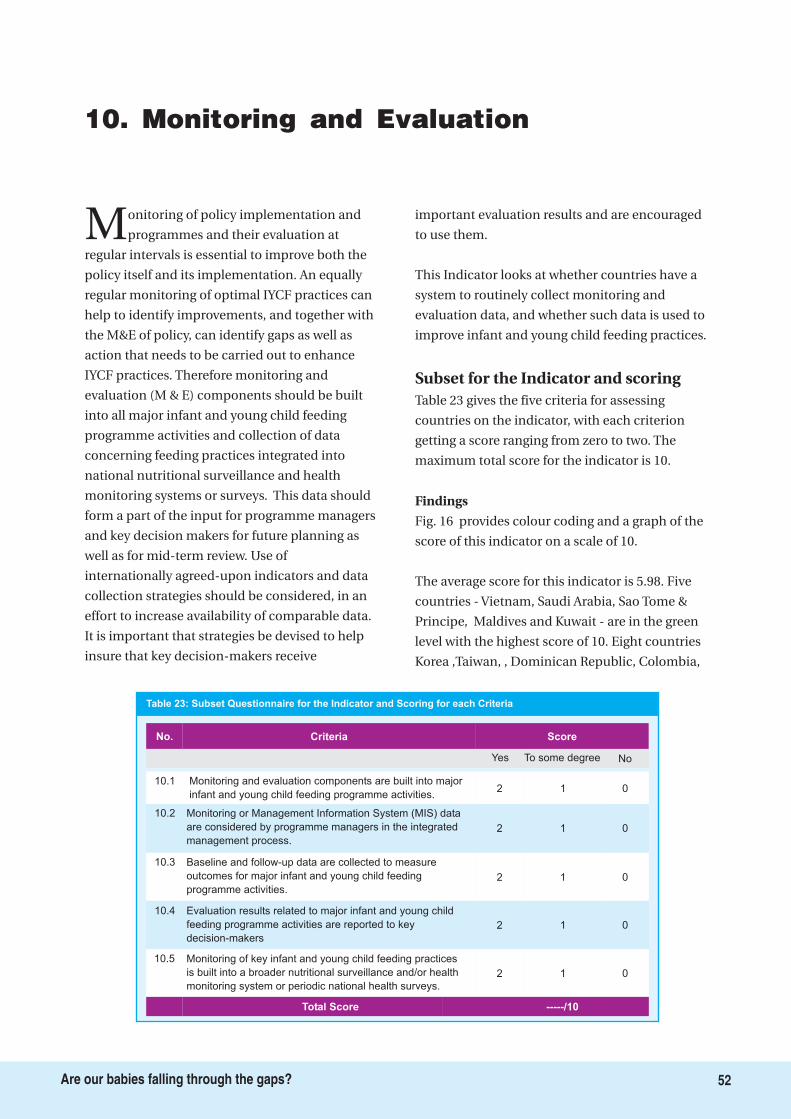
10. Monitoring and Evaluation
Monitoring of policy implementation and
programmes and their evaluation at
regular intervals is essential to improve both the
policy itself and its implementation. An equally
regular monitoring of optimal IYCF practices can
help to identify improvements, and together with
the M&E of policy, can identify gaps as well as
action that needs to be carried out to enhance
IYCF practices. Therefore monitoring and
evaluation (M & E) components should be built
into all major infant and young child feeding
programme activities and collection of data
concerning feeding practices integrated into
national nutritional surveillance and health
monitoring systems or surveys. This data should
form a part of the input for programme managers
and key decision makers for future planning as
well as for mid-term review. Use of
internationally agreed-upon indicators and data
collection strategies should be considered, in an
effort to increase availability of comparable data.
It is important that strategies be devised to help
insure that key decision-makers receive
important evaluation results and are encouraged
to use them.
This Indicator looks at whether countries have a
system to routinely collect monitoring and
evaluation data, and whether such data is used to
improve infant and young child feeding practices.
Table 23 gives the five criteria for assessing
countries on the indicator, with each criterion
getting a score ranging from zero to two. The
maximum total score for the indicator is 10.
Fig. 16 provides colour coding and a graph of the
score of this indicator on a scale of 10.
The average score for this indicator is 5.98. Five
countries - Vietnam, Saudi Arabia, Sao Tome &
Principe, Maldives and Kuwait - are in the green
level with the highest score of 10. Eight countries
Korea ,Taiwan, , Dominican Republic, Colombia,
Subset for the Indicator and scoring
Findings
10.1 Monitoring and evaluation components are built into major
infant and young child feeding programme activities.
Criteria Score
2 1 0
10.2
2 1 0
10.3
2 1 0
No.
Yes To some degree No
Table 23: Subset Questionnaire for the Indicator and Scoring for each Criteria
Monitoring or Management Information System (MIS) data
are considered by programme managers in the integrated
management process.
Baseline and follow-up data are collected to measure
outcomes for major infant and young child feeding
programme activities.
10.4
2 1 0
10.5
2 01
Total Score -----/10
Evaluation results related to major infant and young child
feeding programme activities are reported to key
decision-makers
Monitoring of key infant and young child feeding practices
is built into a broader nutritional surveillance and/or health
monitoring system or periodic national health surveys.
52Are our babies falling through the gaps?
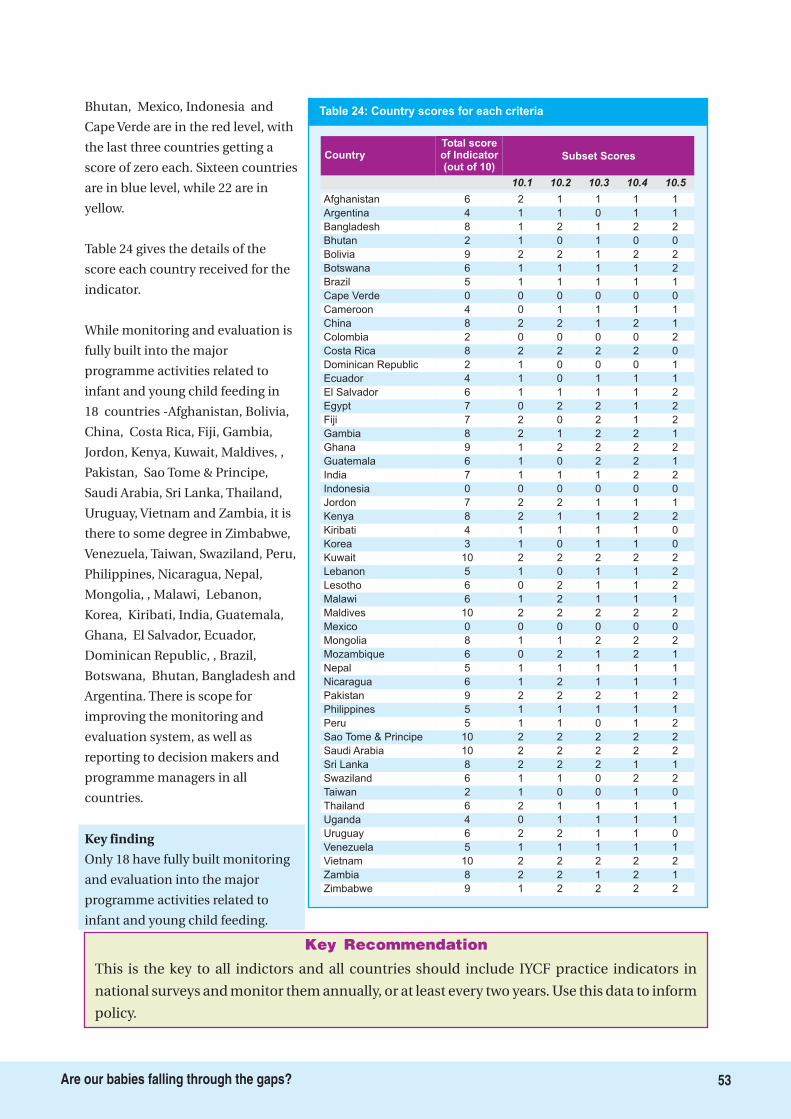
This is the key to all indictors and all countries should include IYCF practice indicators in
national surveys and monitor them annually, or at least every two years. Use this data to inform
policy.
Key Recommendation
Table 24: Country scores for each criteria
Total scoreof Indicator(out of 10)
Country Subset Scores
10.1 10.2 10.3 10.4 10.5
Afghanistan 6 2 1 1 1 1
Argentina 4 1 1 0 1 1
Bangladesh 8 1 2 1 2 2
Bhutan 2 1 0 1 0 0
Bolivia 9 2 2 1 2 2
Botswana 6 1 1 1 1 2
Brazil 5 1 1 1 1 1
Cape Verde 0 0 0 0 0 0
Cameroon 4 0 1 1 1 1
China 8 2 2 1 2 1
Colombia 2 0 0 0 0 2
Costa Rica 8 2 2 2 2 0
Dominican Republic 2 1 0 0 0 1
Ecuador 4 1 0 1 1 1
El Salvador 6 1 1 1 1 2
Egypt 7 0 2 2 1 2
Fiji 7 2 0 2 1 2
Gambia 8 2 1 2 2 1
Ghana 9 1 2 2 2 2
Guatemala 6 1 0 2 2 1
India 7 1 1 1 2 2
Indonesia 0 0 0 0 0 0
Jordon 7 2 2 1 1 1
Kenya 8 2 1 1 2 2
Kiribati 4 1 1 1 1 0
Korea 3 1 0 1 1 0
Kuwait 10 2 2 2 2 2
Lebanon 5 1 0 1 1 2
Lesotho 6 0 2 1 1 2
Malawi 6 1 2 1 1 1
Maldives 10 2 2 2 2 2
Mexico 0 0 0 0 0 0
Mongolia 8 1 1 2 2 2
Mozambique 6 0 2 1 2 1
Nepal 5 1 1 1 1 1
Nicaragua 6 1 2 1 1 1
Pakistan 9 2 2 2 1 2
Philippines 5 1 1 1 1 1
Peru 5 1 1 0 1 2
Sao Tome & Principe 10 2 2 2 2 2
Saudi Arabia 10 2 2 2 2 2
Sri Lanka 8 2 2 2 1 1
Swaziland 6 1 1 0 2 2
Taiwan 2 1 0 0 1 0
Thailand 6 2 1 1 1 1
Uganda 4 0 1 1 1 1
Uruguay 6 2 2 1 1 0
Venezuela 5 1 1 1 1 1
Vietnam 10 2 2 2 2 2
Zambia 8 2 2 1 2 1
Zimbabwe 9 1 2 2 2 2
53Are our babies falling through the gaps?
Bhutan, Mexico, Indonesia and
Cape Verde are in the red level, with
the last three countries getting a
score of zero each. Sixteen countries
are in blue level, while 22 are in
yellow.
Table 24 gives the details of the
score each country received for the
indicator.
While monitoring and evaluation is
fully built into the major
programme activities related to
infant and young child feeding in
18 countries -Afghanistan, Bolivia,
China, Costa Rica, Fiji, Gambia,
Jordon, Kenya, Kuwait, Maldives, ,
Pakistan, Sao Tome & Principe,
Saudi Arabia, Sri Lanka, Thailand,
Uruguay, Vietnam and Zambia, it is
there to some degree in Zimbabwe,
Venezuela, Taiwan, Swaziland, Peru,
Philippines, Nicaragua, Nepal,
Mongolia, , Malawi, Lebanon,
Korea, Kiribati, India, Guatemala,
Ghana, El Salvador, Ecuador,
Dominican Republic, , Brazil,
Botswana, Bhutan, Bangladesh and
Argentina. There is scope for
improving the monitoring and
evaluation system, as well as
reporting to decision makers and
programme managers in all
countries.
Only 18 have fully built monitoring
and evaluation into the major
programme activities related to
infant and young child feeding.
Key finding
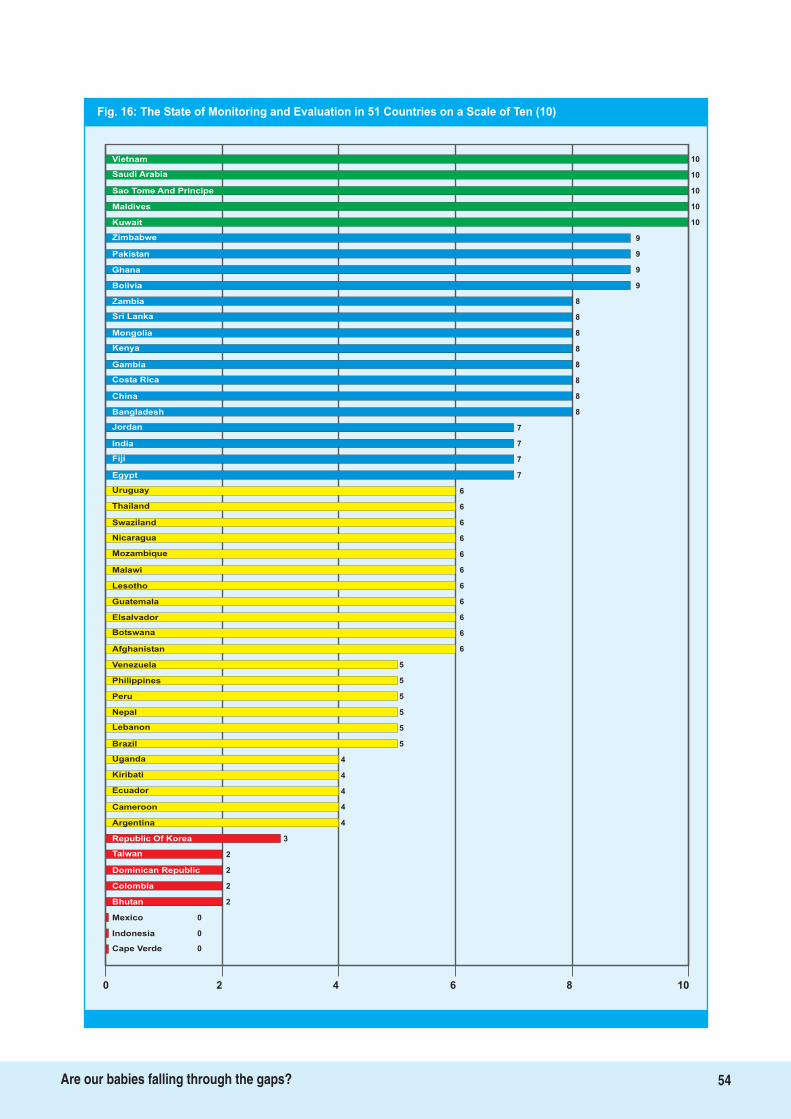
Fig. 16: The State of Monitoring and Evaluation in 51 Countries on a Scale of Ten (10)
10Vietnam
Saudi Arabia
Sao Tome And Principe
Maldives
Kuwait
Zimbabwe
Pakistan 9
Ghana 9
Bolivia 9
Zambia 8
Sri Lanka 8
Mongolia 8
Kenya 8
Gambia 8
Costa Rica 8
China 8
Bangladesh 8
Jordan 7
India 7
Fiji 7
Egypt 7
Uruguay 6
Thailand 6
Swaziland 6
Nicaragua 6
Mozambique 6
Malawi
Lesotho
Guatemala
Elsalvador
Botswana
Afghanistan
Venezuela
5
Philippines
Peru
Nepal
Lebanon
6
6
6
6
6
6
5
5
5
5
5
4
4
4
4
Brazil
Uganda
Ecuador
3
Cameroon
Argentina
Republic Of Korea
Dominican Republic
4
2
2
2
2
0
Colombia
Bhutan
Mexico
0Indonesia
0Cape Verde
0 2 4 6 8 10
Kiribati
10
10
10
10
9
Taiwan
54Are our babies falling through the gaps?
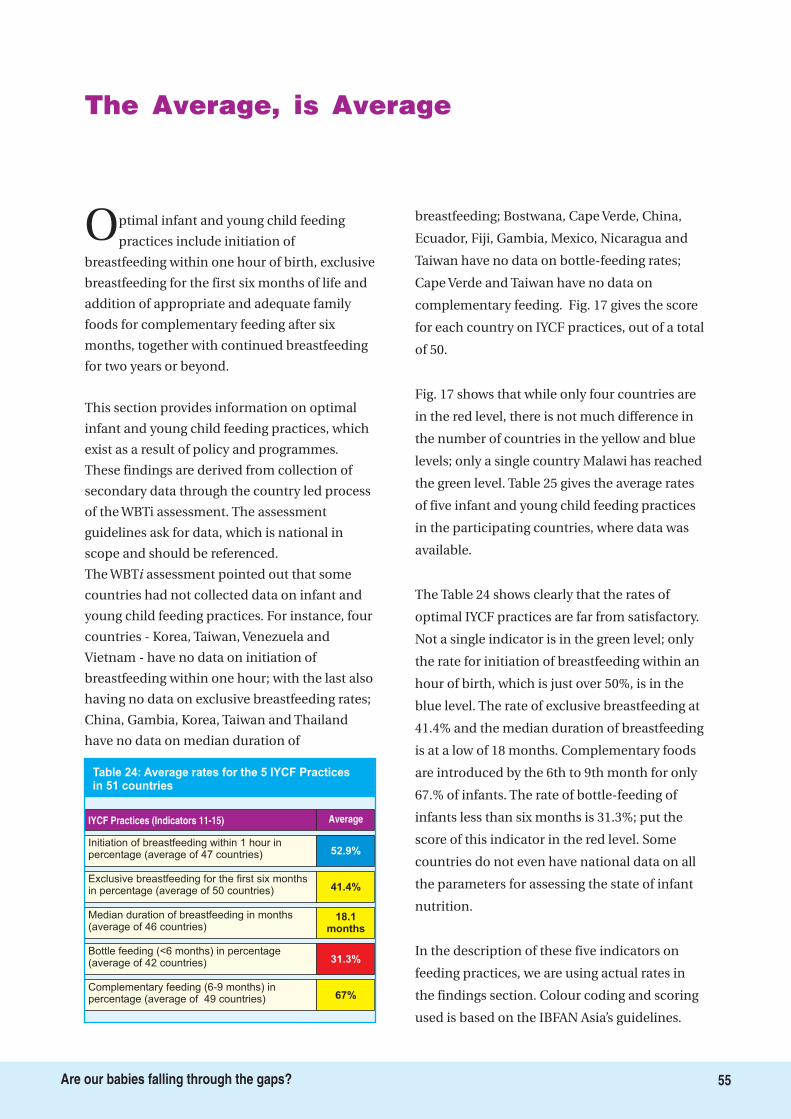
The Average, is Average
Optimal infant and young child feeding
practices include initiation of
breastfeeding within one hour of birth, exclusive
breastfeeding for the first six months of life and
addition of appropriate and adequate family
foods for complementary feeding after six
months, together with continued breastfeeding
for two years or beyond.
This section provides information on optimal
infant and young child feeding practices, which
exist as a result of policy and programmes.
These findings are derived from collection of
secondary data through the country led process
of the WBTi assessment. The assessment
guidelines ask for data, which is national in
scope and should be referenced.
The WBT assessment pointed out that some
countries had not collected data on infant and
young child feeding practices. For instance, four
countries - Korea, Taiwan, Venezuela and
Vietnam - have no data on initiation of
breastfeeding within one hour; with the last also
having no data on exclusive breastfeeding rates;
China, Gambia, Korea, Taiwan and Thailand
have no data on median duration of
breastfeeding; Bostwana, Cape Verde, China,
Ecuador, Fiji, Gambia, Mexico, Nicaragua and
Taiwan have no data on bottle-feeding rates;
Cape Verde and Taiwan have no data on
complementary feeding. Fig. 17 gives the score
for each country on IYCF practices, out of a total
of 50.
Fig. 17 shows that while only four countries are
in the red level, there is not much difference in
the number of countries in the yellow and blue
levels; only a single country Malawi has reached
the green level. Table 25 gives the average rates
of five infant and young child feeding practices
in the participating countries, where data was
available.
The Table 24 shows clearly that the rates of
optimal IYCF practices are far from satisfactory.
Not a single indicator is in the green level; only
the rate for initiation of breastfeeding within an
hour of birth, which is just over 50%, is in the
blue level. The rate of exclusive breastfeeding at
41.4% and the median duration of breastfeeding
is at a low of 18 months. Complementary foods
are introduced by the 6th to 9th month for only
67.% of infants. The rate of bottle-feeding of
infants less than six months is 31.3%; put the
score of this indicator in the red level. Some
countries do not even have national data on all
the parameters for assessing the state of infant
nutrition.
In the description of these five indicators on
feeding practices, we are using actual rates in
the findings section. Colour coding and scoring
used is based on the IBFAN Asia’s guidelines.
i
Initiation of breastfeeding within 1 hour inpercentage (average of 47 countries) 52.9%
IYCF Practices (Indicators 11-15) Average
Table 24: Average rates for the 5 IYCF Practicesin 51 countries
Exclusive breastfeeding for the first six monthsin percentage (average of 50 countries) 41.4%
Median duration of breastfeeding in months(average of 46 countries)
18.1months
Bottle feeding (<6 months) in percentage(average of 42 countries) 31.3%
Complementary feeding (6-9 months) inpercentage (average of 49 countries) 67%
55Are our babies falling through the gaps?
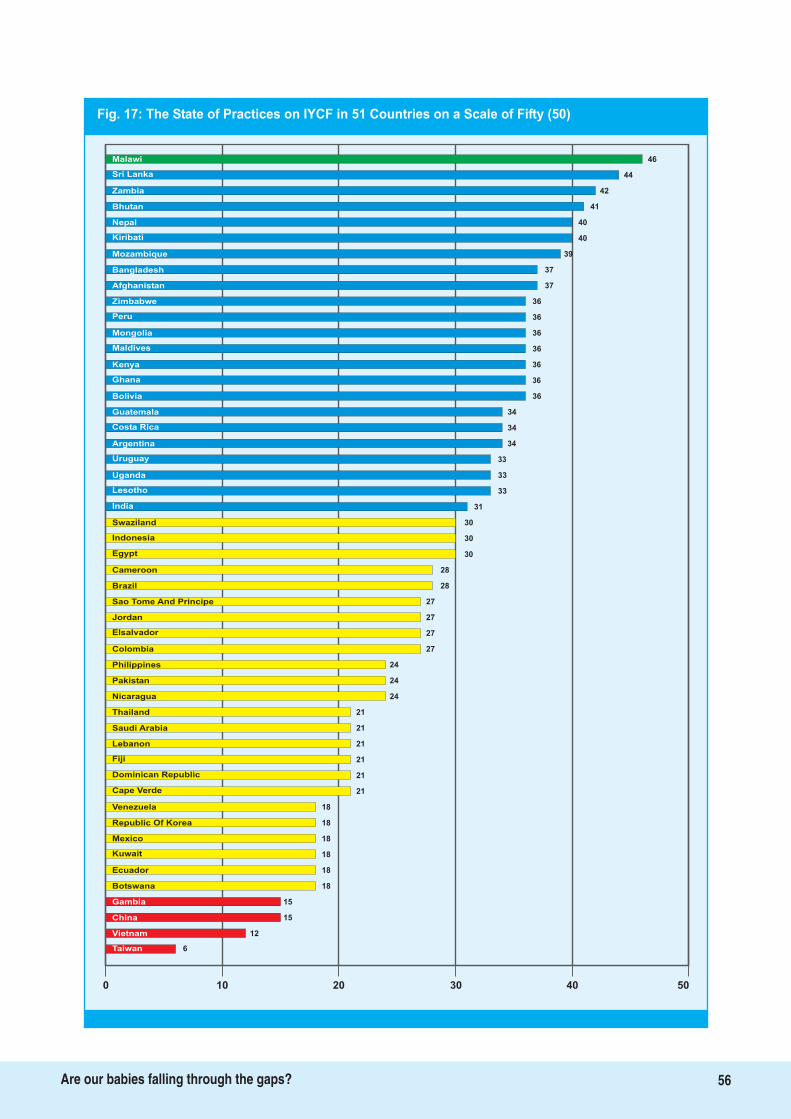
Fig. 17: The State of Practices on IYCF in 51 Countries on a Scale of Fifty (50)
46Malawi
Sri Lanka
Zambia
Bhutan
Nepal
Kiribati
Mozambique 39
Bangladesh 37
Afghanistan 37
Zimbabwe 36
Peru 36
Mongolia 36
Maldives 36
Kenya 36
Ghana 36
Bolivia 36
Guatemala 34
Costa Rica 34
Argentina 34
Uruguay 33
Uganda 33
Lesotho 33
India 31
Swaziland 30
Indonesia 30
Egypt 30
Cameroon
Brazil
Sao Tome And Principe
Jordan
Elsalvador
Colombia
Philippines
21
Pakistan
Nicaragua
Thailand
Saudi Arabia
28
28
27
27
27
27
24
24
24
21
21
21
21
21
18
Lebanon
Fiji
Cape Verde
18
Venezuela
Republic Of Korea
Mexico
Ecuador
18
18
18
18
15
15
Botswana
Gambia
China
12Vietnam
6Taiwan
0 10 20 30 40 50
Dominican Republic
44
42
41
40
40
Kuwait
56Are our babies falling through the gaps?
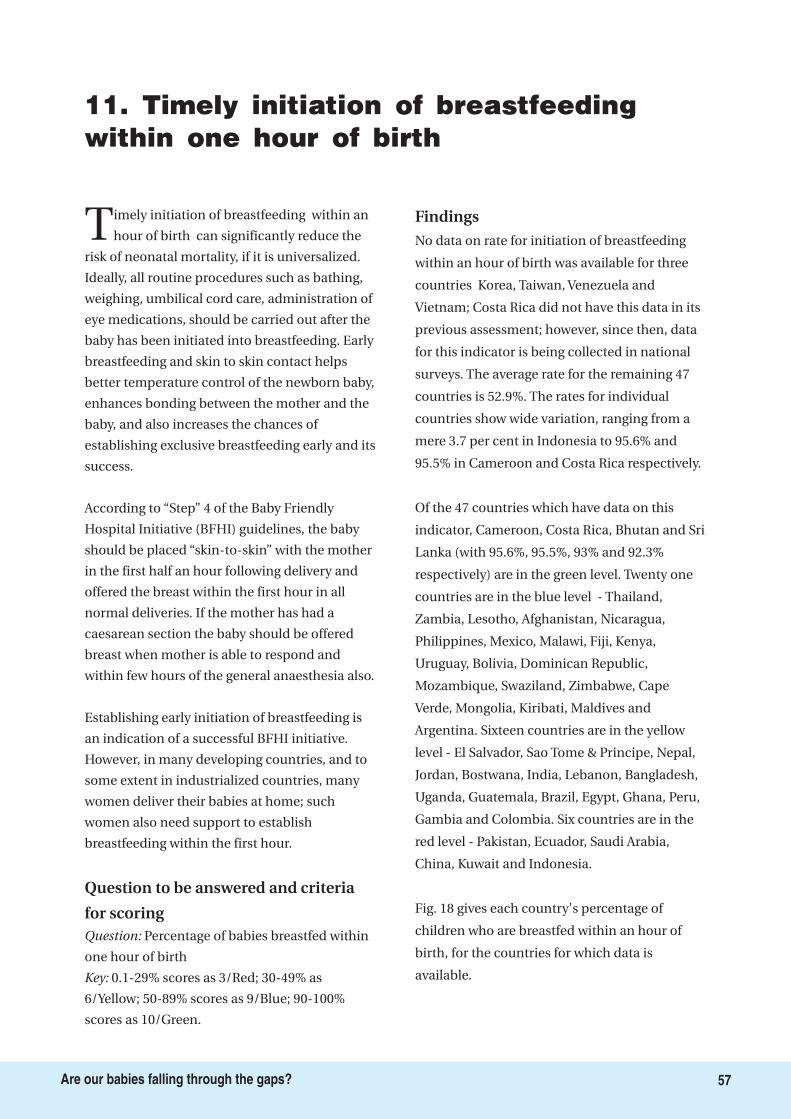
11. Timely initiation of breastfeedingwithin one hour of birth
Timely initiation of breastfeeding within an
hour of birth can significantly reduce the
risk of neonatal mortality, if it is universalized.
Ideally, all routine procedures such as bathing,
weighing, umbilical cord care, administration of
eye medications, should be carried out after the
baby has been initiated into breastfeeding. Early
breastfeeding and skin to skin contact helps
better temperature control of the newborn baby,
enhances bonding between the mother and the
baby, and also increases the chances of
establishing exclusive breastfeeding early and its
success.
According to “Step” 4 of the Baby Friendly
Hospital Initiative (BFHI) guidelines, the baby
should be placed “skin-to-skin” with the mother
in the first half an hour following delivery and
offered the breast within the first hour in all
normal deliveries. If the mother has had a
caesarean section the baby should be offered
breast when mother is able to respond and
within few hours of the general anaesthesia also.
Establishing early initiation of breastfeeding is
an indication of a successful BFHI initiative.
However, in many developing countries, and to
some extent in industrialized countries, many
women deliver their babies at home; such
women also need support to establish
breastfeeding within the first hour.
Percentage of babies breastfed within
one hour of birth
0.1-29% scores as 3/Red; 30-49% as
6/Yellow; 50-89% scores as 9/Blue; 90-100%
scores as 10/Green.
No data on rate for initiation of breastfeeding
within an hour of birth was available for three
countries Korea, Taiwan, Venezuela and
Vietnam; Costa Rica did not have this data in its
previous assessment; however, since then, data
for this indicator is being collected in national
surveys. The average rate for the remaining 47
countries is 52.9%. The rates for individual
countries show wide variation, ranging from a
mere 3.7 per cent in Indonesia to 95.6% and
95.5% in Cameroon and Costa Rica respectively.
Of the 47 countries which have data on this
indicator, Cameroon, Costa Rica, Bhutan and Sri
Lanka (with 95.6%, 95.5%, 93% and 92.3%
respectively) are in the green level. Twenty one
countries are in the blue level - Thailand,
Zambia, Lesotho, Afghanistan, Nicaragua,
Philippines, Mexico, Malawi, Fiji, Kenya,
Uruguay, Bolivia, Dominican Republic,
Mozambique, Swaziland, Zimbabwe, Cape
Verde, Mongolia, Kiribati, Maldives and
Argentina. Sixteen countries are in the yellow
level - El Salvador, Sao Tome & Principe, Nepal,
Jordan, Bostwana, India, Lebanon, Bangladesh,
Uganda, Guatemala, Brazil, Egypt, Ghana, Peru,
Gambia and Colombia. Six countries are in the
red level - Pakistan, Ecuador, Saudi Arabia,
China, Kuwait and Indonesia.
Fig. 18 gives each country's percentage of
children who are breastfed within an hour of
birth, for the countries for which data is
available.
Question to be answered and criteria
for scoring
Findings
Question:
Key:
57Are our babies falling through the gaps?
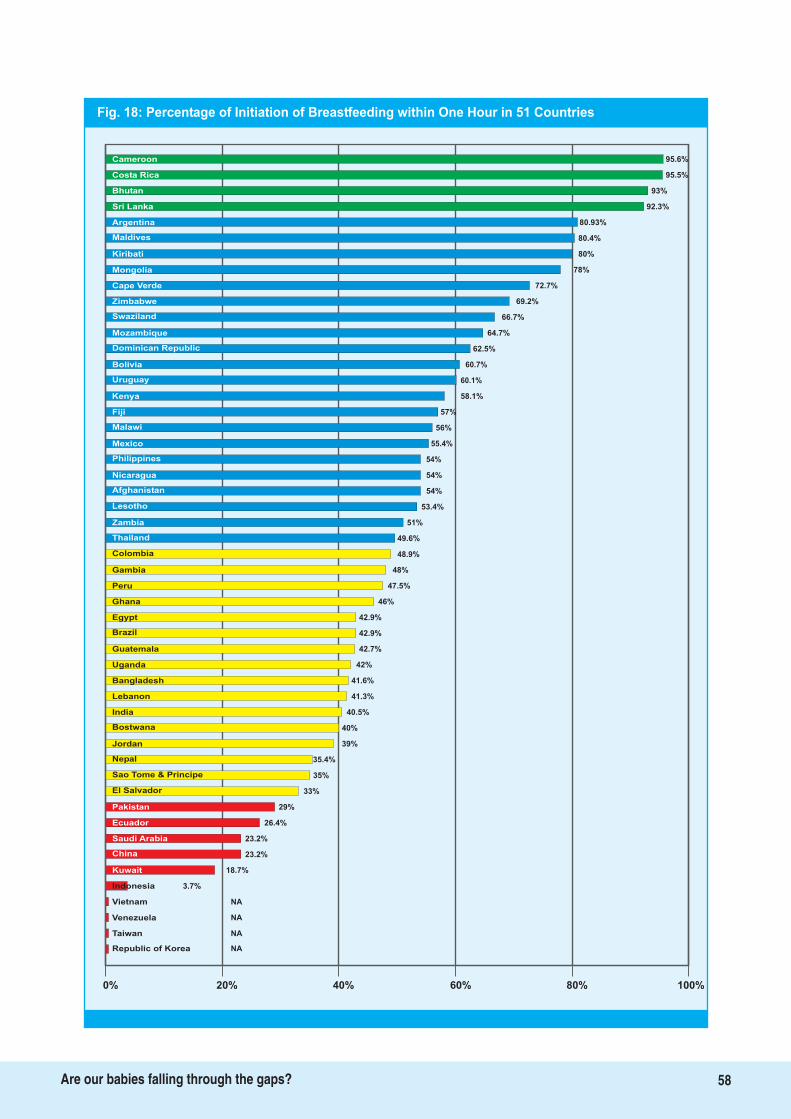
Fig. 18: Percentage of Initiation of Breastfeeding within One Hour in 51 Countries
95.6%Cameroon
Costa Rica
Bhutan
Sri Lanka
Argentina
Maldives
Kiribati 80%
Mongolia 78%
Cape Verde 72.7%
Zimbabwe 69.2%
Swaziland 66.7%
Mozambique 64.7%
Dominican Republic 62.5%
Bolivia 60.7%
Uruguay 60.1%
Kenya 58.1%
Fiji 57%
Malawi 56%
Mexico 55.4%
Philippines 54%
Nicaragua 54%
Afghanistan 54%
Lesotho 53.4%
Zambia 51%
Thailand 49.6%
Colombia 48.9%
Gambia
Peru
Ghana
Egypt
Brazil
Guatemala
Uganda
40%
Bangladesh
Lebanon
India
Bostwana
48%
47.5%
46%
42.9%
42.9%
42.7%
42%
41.6%
41.3%
40.5%
39%
35.4%
35%
33%
29%
Jordan
Nepal
El Salvador
23.2%
Pakistan
Ecuador
Saudi Arabia
Kuwait
26.4%
23.2%
18.7%
3.7%
NA
NA
Indonesia
Vietnam
Venezuela
NATaiwan
NARepublic of Korea
0% 20% 40% 60% 80% 100%
Sao Tome & Principe
95.5%
93%
92.3%
80.93%
80.4%
China
58Are our babies falling through the gaps?
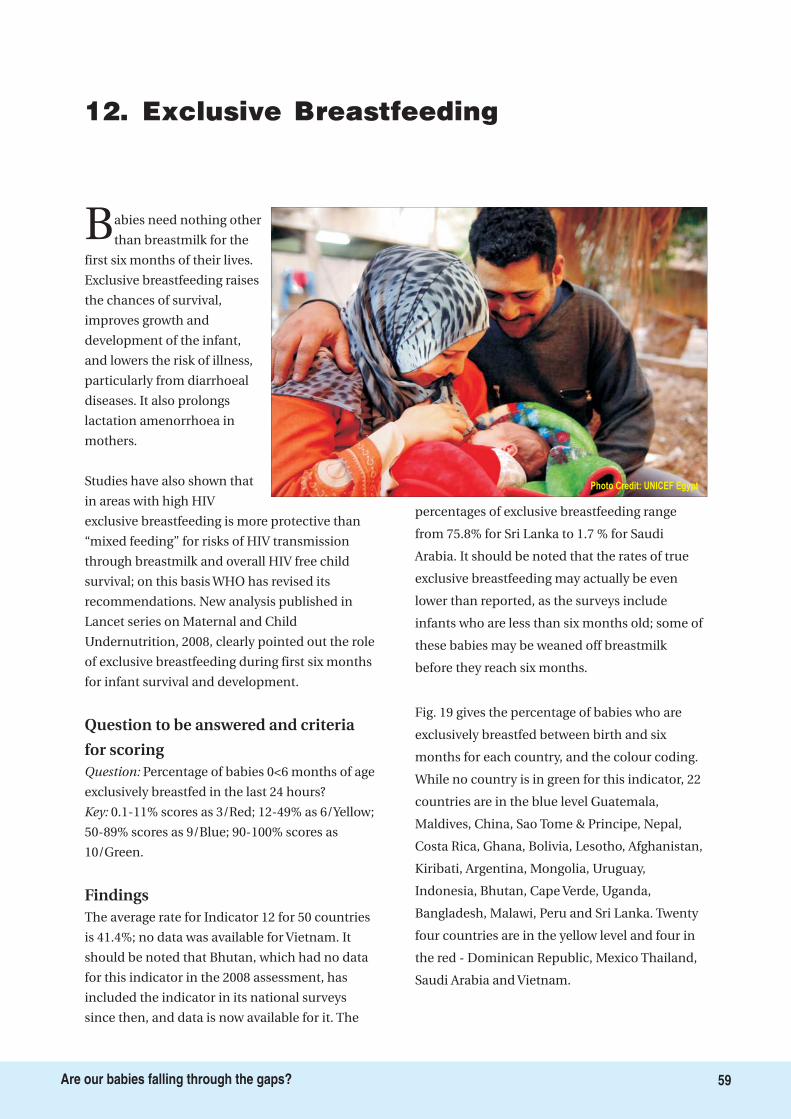
12. Exclusive Breastfeeding
Babies need nothing other
than breastmilk for the
first six months of their lives.
Exclusive breastfeeding raises
the chances of survival,
improves growth and
development of the infant,
and lowers the risk of illness,
particularly from diarrhoeal
diseases. It also prolongs
lactation amenorrhoea in
mothers.
Studies have also shown that
in areas with high HIV
exclusive breastfeeding is more protective than
“mixed feeding” for risks of HIV transmission
through breastmilk and overall HIV free child
survival; on this basis WHO has revised its
recommendations. New analysis published in
Lancet series on Maternal and Child
Undernutrition, 2008, clearly pointed out the role
of exclusive breastfeeding during first six months
for infant survival and development.
Percentage of babies 0<6 months of age
exclusively breastfed in the last 24 hours?
0.1-11% scores as 3/Red; 12-49% as 6/Yellow;
50-89% scores as 9/Blue; 90-100% scores as
10/Green.
The average rate for Indicator 12 for 50 countries
is 41.4%; no data was available for Vietnam. It
should be noted that Bhutan, which had no data
for this indicator in the 2008 assessment, has
included the indicator in its national surveys
since then, and data is now available for it. The
percentages of exclusive breastfeeding range
from 75.8% for Sri Lanka to 1.7 % for Saudi
Arabia. It should be noted that the rates of true
exclusive breastfeeding may actually be even
lower than reported, as the surveys include
infants who are less than six months old; some of
these babies may be weaned off breastmilk
before they reach six months.
Fig. 19 gives the percentage of babies who are
exclusively breastfed between birth and six
months for each country, and the colour coding.
While no country is in green for this indicator, 22
countries are in the blue level Guatemala,
Maldives, China, Sao Tome & Principe, Nepal,
Costa Rica, Ghana, Bolivia, Lesotho, Afghanistan,
Kiribati, Argentina, Mongolia, Uruguay,
Indonesia, Bhutan, Cape Verde, Uganda,
Bangladesh, Malawi, Peru and Sri Lanka. Twenty
four countries are in the yellow level and four in
the red - Dominican Republic, Mexico Thailand,
Saudi Arabia and Vietnam.
Question to be answered and criteria
for scoring
Findings
Question:
Key:
Photo Credit: UNICEF Egypt
59Are our babies falling through the gaps?
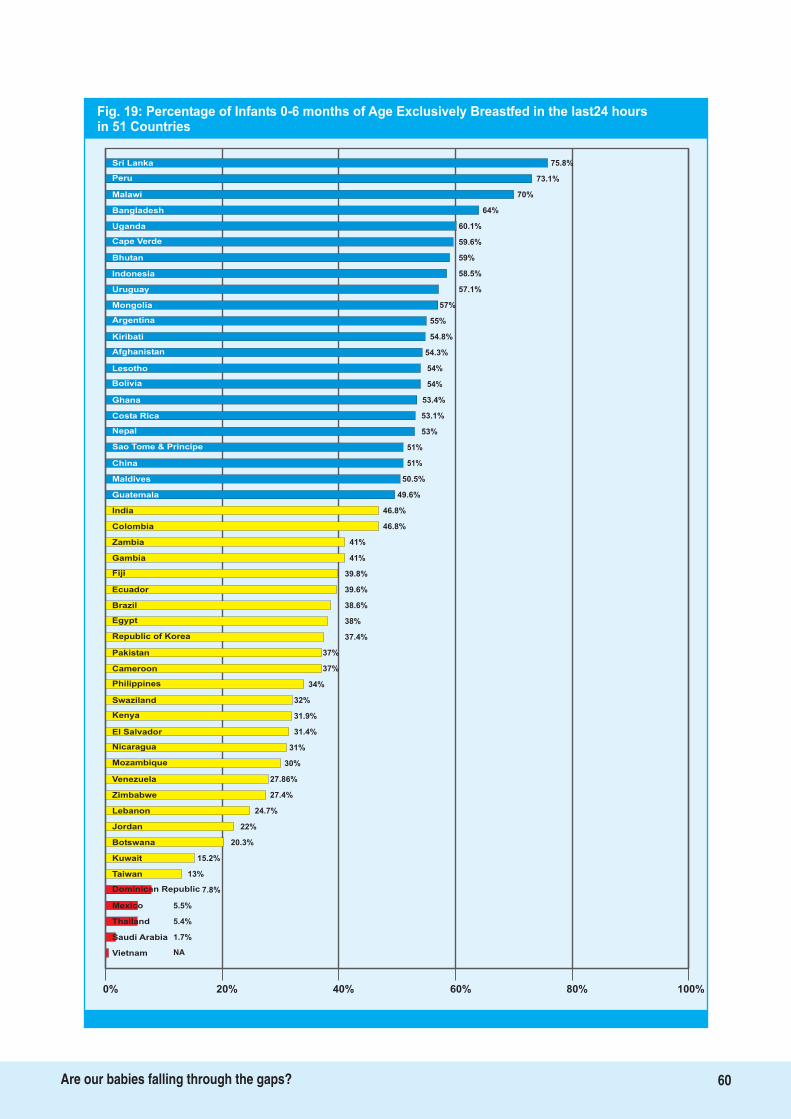
75.8%Sri Lanka
Peru
Malawi
Bangladesh
Uganda
Cape Verde
Bhutan 59%
Indonesia 58.5%
Uruguay 57.1%
Mongolia 57%
Argentina 55%
Kiribati 54.8%
Afghanistan 54.3%
Lesotho 54%
54%Bolivia
53.4%Ghana
53.1%Costa Rica
53%Nepal
51%Sao Tome & Principe
51%China
50.5%Maldives
49.6%Guatemala
46.8%India
46.8%Colombia
41%Zambia
41%Gambia
Fiji
Ecuador
Brazil
Egypt
Republic of Korea
Pakistan
31.4%
Cameroon
Philippines
Swaziland
Kenya
39.8%
39.6%
38.6%
38%
37.4%
37%
37%
34%
32%
31.9%
31%
30%
27.86%
27.4%
24.7%
El Salvador
Nicaragua
Venezuela
20.3%
Zimbabwe
Lebanon
Jordan
Kuwait
22%
15.2%
13%
7.8%
5.5%
5.4%
Taiwan
Dominican Republic
Mexico
1.7%
Thailand
NAVietnam
0% 20% 40% 60% 80% 100%
Mozambique
73.1%
70%
64%
60.1%
59.6%
Botswana
Saudi Arabia
60Are our babies falling through the gaps?
Fig. 19: Percentage of Infants 0-6 months of Age Exclusively Breastfed in the last24 hoursin 51 Countries
13. Median duration of breastfeeding
The “Innocenti Declaration” and the Global
Strategy recommends that babies continue
to be breastfed for two years of age or beyond
along with adequate and appropriate
complementary foods starting after six months of
age. Breastmilk continues to be an important
source of nutrition and fluids and immunological
protection for the infant and the young child. The
continued closeness between mother and child
provided by breastfeeding helps in optimal
development of the infant and young child.
Babies are breastfed for a median
duration of how many months?
0.1-17 months scores as 3/Red; 18-20 as
6/Yellow; 21-22 scores as 9/Blue; 23-24 or beyond
scores as 10/Green.
Data for this indicator was only available in 46
countries; China, Gambia, Korea, Taiwan and
Thailand did not have this data. The average
median duration of breastfeeding for these
countries is 18.1 months, with values ranging
from 46.3 months in Guatemala to 2.7 months in
Kuwait.
The median duration of breastfeeding is over 23
months in nine countries, putting them in the
green level Guatemala, Bangladesh, Nepal, Sri
Lanka, India, Bhutan, Kiribati, Afghanistan and
Malawi. The highest number 22 are in the red
level, with the median duration of breastfeeding
being less than 18 months Kuwait, Dominican
Republic, Uruguay, Fiji, Lebanon, Mexico,
Argentina, Bostwana, Jordan, Saudi Arabia,
Venezuela, Vietnam, Brazil, Philippines, Costa
Rica, Colombia, Cape Verde, Ecuador, Lesotho,
Sao Tome & Principe, Swaziland and Cameroon.
Nine countries are in the yellow level, and six in
the blue.
Fig. 20 gives the colour coding for each country
along with the median duration of breastfeeding.
Question to be answered and criteria
for scoring
Findings
Question:
Key:
Photo Credit: WABA
61Are our babies falling through the gaps?
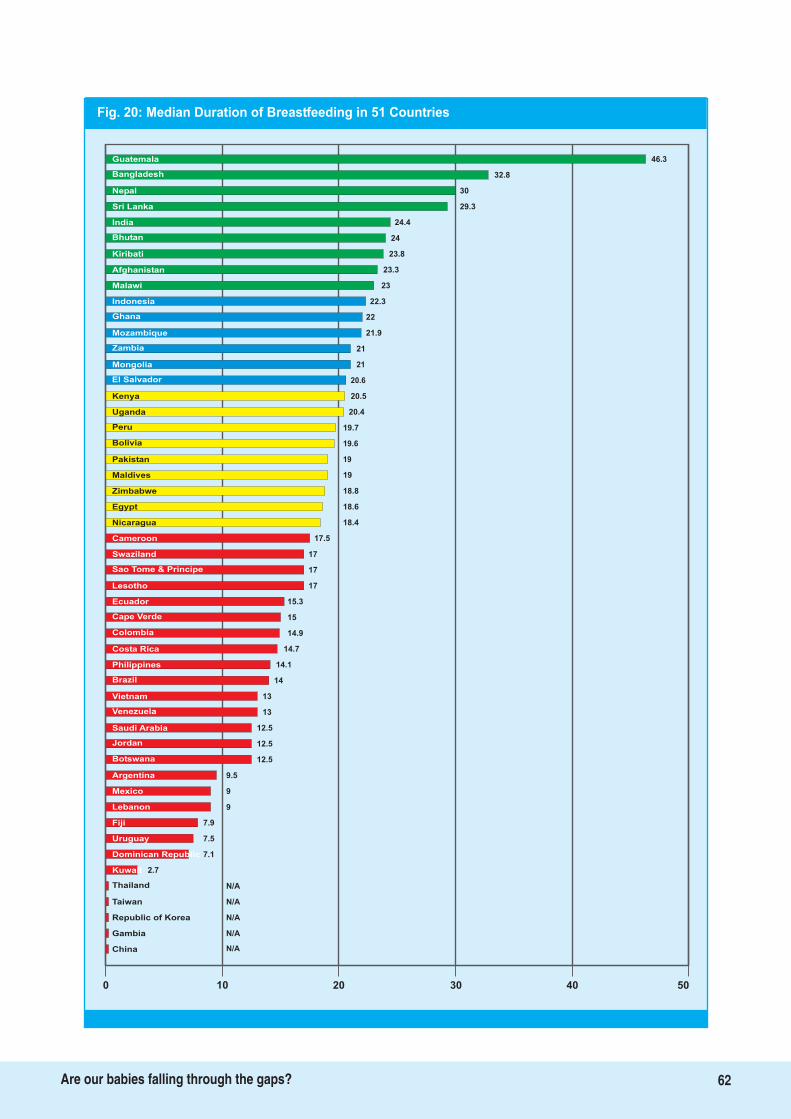
Fig. 20: Median Duration of Breastfeeding in 51 Countries
46.3Guatemala
Bangladesh
Nepal
Sri Lanka
India
Bhutan
Kiribati 23.8
Afghanistan 23.3
Malawi 23
Indonesia 22.3
Ghana 22
Mozambique 21.9
Zambia 21
Mongolia 21
20.6El Salvador
20.5Kenya
20.4Uganda
19.7Peru
19.6Bolivia
19Pakistan
19Maldives
18.8Zimbabwe
18.6Egypt
18.4Nicaragua
17.5Cameroon
17Swaziland
Sao Tome & Principe
Lesotho
Ecuador
Cape Verde
Colombia
Costa Rica
12.5
Philippines
Brazil
Vietnam
Venezuela
17
17
15.3
15
14.9
14.7
14.1
14
13
13
12.5
12.5
9.5
9
9
Saudi Arabia
Jordan
Argentina
7.5
Mexico
Lebanon
Fiji
Dominican Republic
7.9
7.1
2.7
N/A
N/A
N/A
Kuwait
Thailand
Taiwan
N/A
Republic of Korea
N/AChina
0 10 20 30 40 50
Botswana
32.8
30
29.3
24.4
24
Uruguay
Gambia
62Are our babies falling through the gaps?
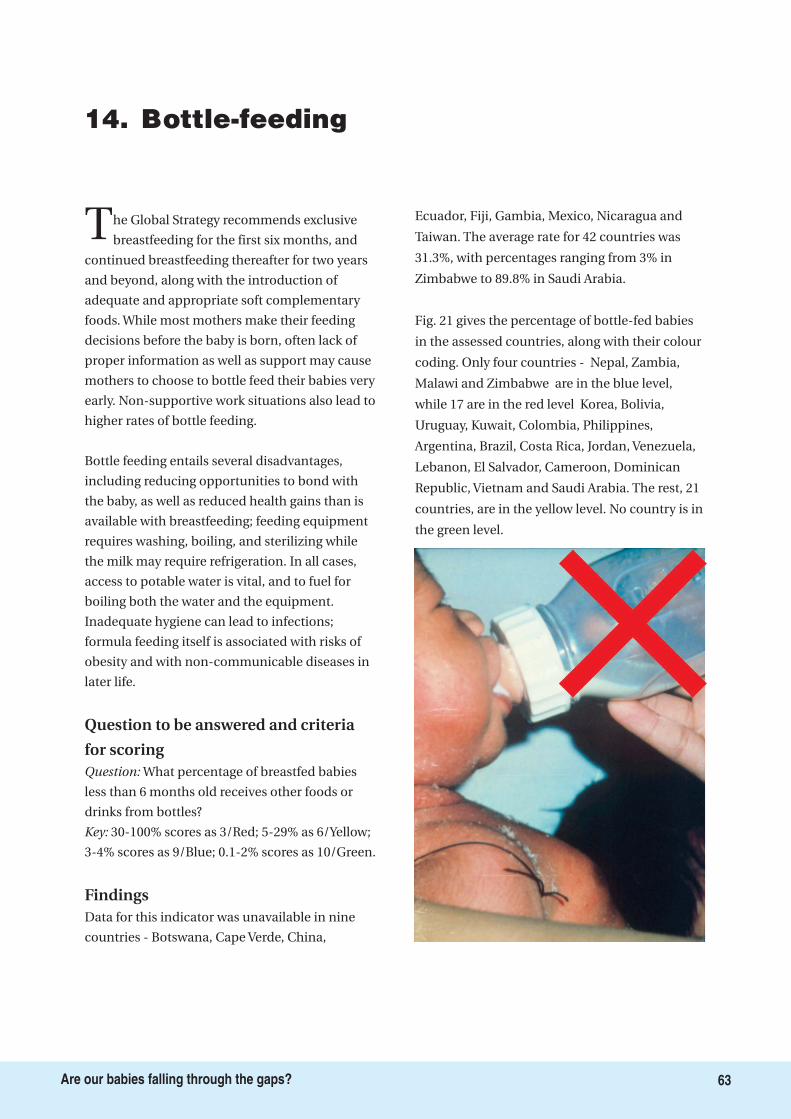
14. Bottle-feeding
The Global Strategy recommends exclusive
breastfeeding for the first six months, and
continued breastfeeding thereafter for two years
and beyond, along with the introduction of
adequate and appropriate soft complementary
foods. While most mothers make their feeding
decisions before the baby is born, often lack of
proper information as well as support may cause
mothers to choose to bottle feed their babies very
early. Non-supportive work situations also lead to
higher rates of bottle feeding.
Bottle feeding entails several disadvantages,
including reducing opportunities to bond with
the baby, as well as reduced health gains than is
available with breastfeeding; feeding equipment
requires washing, boiling, and sterilizing while
the milk may require refrigeration. In all cases,
access to potable water is vital, and to fuel for
boiling both the water and the equipment.
Inadequate hygiene can lead to infections;
formula feeding itself is associated with risks of
obesity and with non-communicable diseases in
later life.
What percentage of breastfed babies
less than 6 months old receives other foods or
drinks from bottles?
30-100% scores as 3/Red; 5-29% as 6/Yellow;
3-4% scores as 9/Blue; 0.1-2% scores as 10/Green.
Data for this indicator was unavailable in nine
countries - Botswana, Cape Verde, China,
Ecuador, Fiji, Gambia, Mexico, Nicaragua and
Taiwan. The average rate for 42 countries was
31.3%, with percentages ranging from 3% in
Zimbabwe to 89.8% in Saudi Arabia.
Fig. 21 gives the percentage of bottle-fed babies
in the assessed countries, along with their colour
coding. Only four countries - Nepal, Zambia,
Malawi and Zimbabwe are in the blue level,
while 17 are in the red level Korea, Bolivia,
Uruguay, Kuwait, Colombia, Philippines,
Argentina, Brazil, Costa Rica, Jordan, Venezuela,
Lebanon, El Salvador, Cameroon, Dominican
Republic, Vietnam and Saudi Arabia. The rest, 21
countries, are in the yellow level. No country is in
the green level.
Question to be answered and criteria
for scoring
Findings
Question:
Key:
63Are our babies falling through the gaps?
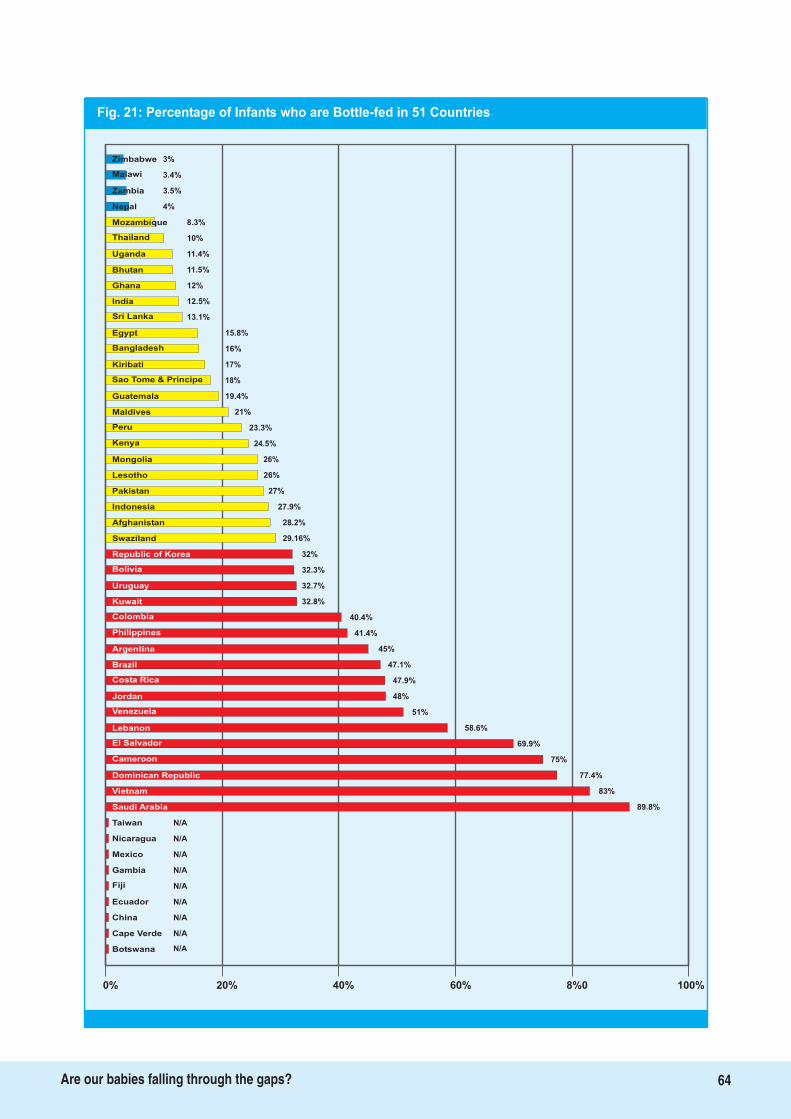
Fig. 21: Percentage of Infants who are Bottle-fed in 51 Countries
3%Zimbabwe
Malawi
Zambia
Nepal
Mozambique
Thailand
Uganda 11.4%
Bhutan 11.5%
Ghana 12%
India 12.5%
Sri Lanka 13.1%
Egypt 15.8%
Bangladesh 16%
Kiribati 17%
18%Sao Tome & Principe
19.4%Guatemala
21%Maldives
23.3%Peru
24.5%Kenya
26%Mongolia
26%Lesotho
27%Pakistan
27.9%Indonesia
28.2%Afghanistan
29.16%Swaziland
32%Republic of Korea
Bolivia
Uruguay
Kuwait
Colombia
Philippines
Argentina
58.6%
Brazil
Costa Rica
Jordan
Venezuela
32.3%
32.7%
32.8%
40.4%
41.4%
45%
47.1%
47.9%
48%
51%
69.9%
75%
77.4%
83%
89.8%
Lebanon
El Salvador
Dominican Republic
N/A
Vietnam
Saudi Arabia
Taiwan
Mexico
N/A
N/A
N/A
N/A
N/A
N/A
Gambia
Fiji
Ecuador
N/A
China
N/ABotswana
0% 20% 40% 60% 8%0 100%
Cameroon
3.4%
3.5%
4%
8.3%
10%
Nicaragua
Cape Verde
64Are our babies falling through the gaps?
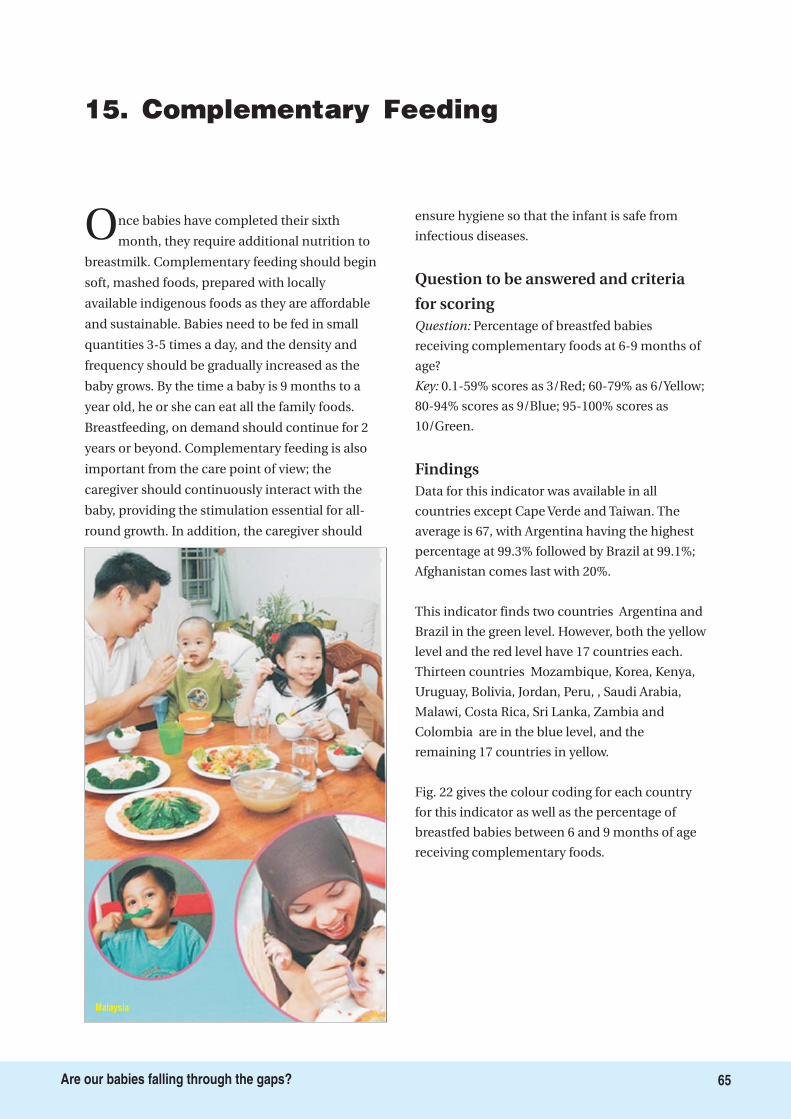
15. Complementary Feeding
Once babies have completed their sixth
month, they require additional nutrition to
breastmilk. Complementary feeding should begin
soft, mashed foods, prepared with locally
available indigenous foods as they are affordable
and sustainable. Babies need to be fed in small
quantities 3-5 times a day, and the density and
frequency should be gradually increased as the
baby grows. By the time a baby is 9 months to a
year old, he or she can eat all the family foods.
Breastfeeding, on demand should continue for 2
years or beyond. Complementary feeding is also
important from the care point of view; the
caregiver should continuously interact with the
baby, providing the stimulation essential for all-
round growth. In addition, the caregiver should
ensure hygiene so that the infant is safe from
infectious diseases.
Percentage of breastfed babies
receiving complementary foods at 6-9 months of
age?
0.1-59% scores as 3/Red; 60-79% as 6/Yellow;
80-94% scores as 9/Blue; 95-100% scores as
10/Green.
Data for this indicator was available in all
countries except Cape Verde and Taiwan. The
average is 67, with Argentina having the highest
percentage at 99.3% followed by Brazil at 99.1%;
Afghanistan comes last with 20%.
This indicator finds two countries Argentina and
Brazil in the green level. However, both the yellow
level and the red level have 17 countries each.
Thirteen countries Mozambique, Korea, Kenya,
Uruguay, Bolivia, Jordan, Peru, , Saudi Arabia,
Malawi, Costa Rica, Sri Lanka, Zambia and
Colombia are in the blue level, and the
remaining 17 countries in yellow.
Fig. 22 gives the colour coding for each country
for this indicator as well as the percentage of
breastfed babies between 6 and 9 months of age
receiving complementary foods.
Question to be answered and criteria
for scoring
Findings
Question:
Key:
65Are our babies falling through the gaps?
Malaysia
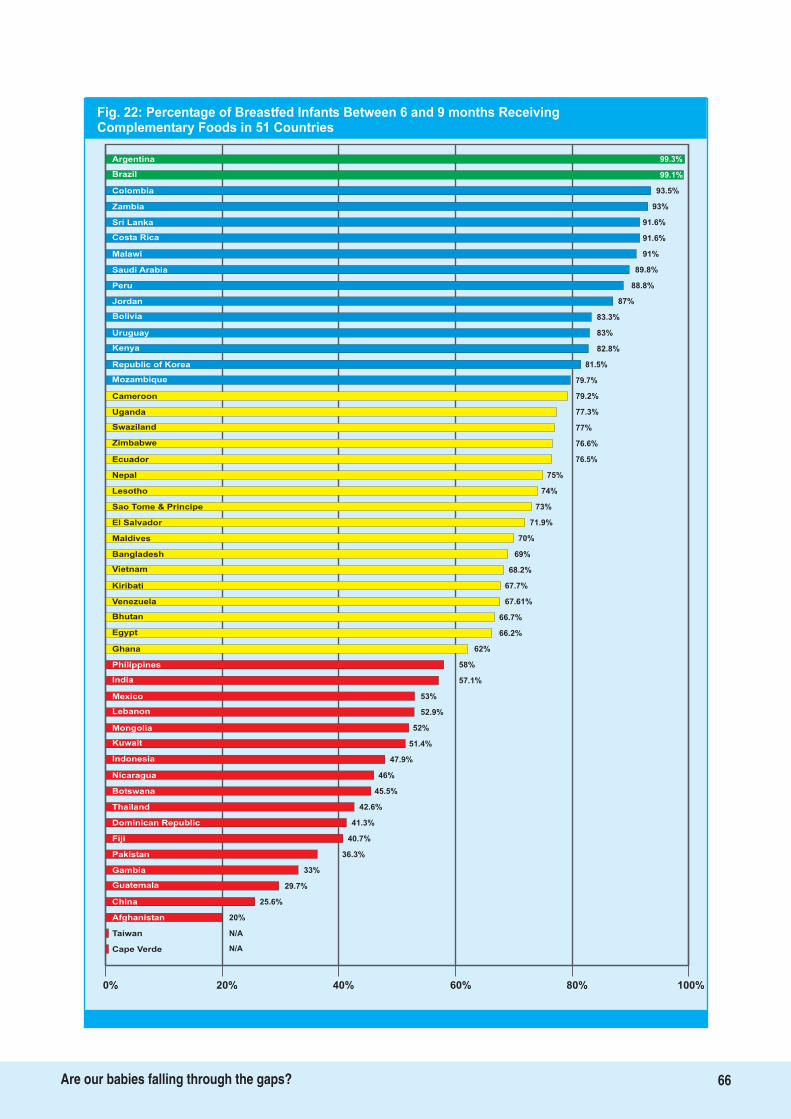
Argentina
Brazil
Colombia
Zambia
Sri Lanka
Costa Rica
Malawi 91%
Saudi Arabia 89.8%
Peru 88.8%
Jordan 87%
Bolivia 83.3%
Uruguay 83%
Kenya 82.8%
Republic of Korea 81.5%
79.7%Mozambique
79.2%Cameroon
77.3%Uganda
77%Swaziland
76.6%Zimbabwe
76.5%Ecuador
75%Nepal
74%Lesotho
73%Sao Tome & Principe
71.9%El Salvador
70%Maldives
69%Bangladesh
Vietnam
Kiribati
Venezuela
Bhutan
Egypt
Ghana
52%
Philippines
India
Mexico
Lebanon
68.2%
67.7%
67.61%
66.7%
66.2%
62%
58%
57.1%
53%
52.9%
51.4%
47.9%
46%
45.5%
42.6%
Mongolia
Kuwait
Nicaragua
40.7%
Botswana
Thailand
Dominican Republic
Pakistan
41.3%
36.3%
33%
29.7%
25.6%
20%
Gambia
Guatemala
China
N/A
Afghanistan
N/ACape Verde
0% 20% 40% 60% 80% 100%
Indonesia
99.1%
93.5%
93%
91.6%
91.6%
Fiji
Taiwan
Fig. 22: Percentage of Breastfed Infants Between 6 and 9 months ReceivingComplementary Foods in 51 Countries
99.3%
66Are our babies falling through the gaps?
This chapter analyses the findings and reports
of individual country in detail, with a view
on actions that can emerge from the WBT
assessment.
We have done the analysis of the reports from
each country and specially looking at finer details
of answers to the sub-set of questions. While the
country reports give a clear cut information on
gaps to give rise to recommendations in each
area of action, there are certain
recommendations that do emerge from the sub
sets and are highly relevant to generate and
sustain action on infant and young child feeding.
We have also analysed this along side available
scientific information.
Lutter and Morrow, in their paper
, showed that implementation of
the Global Strategy is associated with
improvements in exclusive breastfeeding, and
potentially, with breastfeeding duration over a 10
to 20 year period, especially in Brazil and
Colombia. They concluded that there a
significant association between implementation
of the and national improvements
in exclusive breastfeeding rates.
An infant's right to breastfeed is primarily based
on the mother being able to actualize her rights
to successfully breastfeed her infant. She has the
right to be fully informed, the right to adequate
nutrition and health care, and the right to
support if she is working outside the home to
enable her to provide optimal breastfeeding to
her baby. Engesveen, analyzing breastfeeding
from the human rights perspective, concluded
that building mothers' capacity to perform is
essential, as is action to enhance capacity of the
state to create an enabling environment for
breastfeeding women. The 51-country WBT
assessment highlights the need for actions that
must be taken by the State to create this enabling
environment provision of adequate maternity
protection, creating facility and community
based support systems based on availability of
skilled counseling, and strict implementation of
the International Code of Marketing of
Breastmilk Substitutes, and subsequent World
Health Assembly (WHA) resolutions. The
assessment report stresses that governance
systems must both increase the capacity of
countries for carrying out these actions and make
available the financial resources required for this.
The national assessment teams in each country
identified the gaps that exist in policy and made
recommendations for bridging them. However,
while these recommendations were country-
specific, many of them were common to all
countries. These included strengthening policies
i
Protection,
Promotion, Support and Global Trends in
Breastfeeding
Global Strategy
i
1
2
67Are our babies falling through the gaps?
A Long Way to GoAn analysis of the situation
and making them comprehensive, ensuring
adequate budgets for implementing the entire
policy, strengthening human resources for IYCF
as well as the capacity of health providers to
provide skilled counseling, implementation of
the International Code and provision of adequate
maternity protection and community based
support to women to breastfeed. For example, all
the teams recommended that whether the
country has a history of disasters and
emergencies or not and no matter how low the
incidence of HIV was, policies were needed to
cover IYCF in these difficult circumstances. Based
on the findings and analysis, this chapter
examines these areas that need urgent attention
from national and international governance
systems, and some action taken in these areas.
This section deals with Indicators 1 and 10, while
it affects all other indicators in their ability to
scale up interventions to universal level. Bryce et
al, in their paper , draw attention to the need for
creating national policies and action plans; they
also stress on the need for political will and
commitment, without which no significant
change can occur. They further identify creating
legislation as a partial measure to protect
effective actions from political change. Lutter and
Morrow, in their 2012 analysis, have validated this
call. Victora has already pointed out the need for
prioritizing nutrition through allocation of
national and international financial resources to
infant and young child feeding. Bryce et al have
highlighted the ineffectiveness of national and
international initiatives that address just one
issue related to nutrition e.g. growth monitoring
without having nutritional counseling and other
such measures in place. The recent 6-country
programme review on IYCF calls for
comprehensive action on policy and
coordination .
Country after country has noted the need for
both increased human resources as well as
financial allocations if they have to successfully
enhance breastfeeding rates. This seems to be
most striking feature of each report and rightly
so. Development of policies, plans of action,
legislation, and guidelines for the
implementation are key factors for enhancing
breastfeeding rates, and both the development
and its implementation have financial
implications. As noted in a submission to New
Zealand's Health Select Committee, while
political will is needed to translate policies into
action, they are essential to demonstrate political
leadership and ensure effective investment. A
written evidence based policy clearly spelling out
priority areas for action and a budget estimate
assist in advocacy for investment. For example,
the
in 2011 has been used by
the United States Breastfeeding Committee to call
for the appropriation of $15 from the Prevention
million and Public Health Fund for FY 2012 to
support breastfeeding.
Policies on their own cannot change IYCF
practices, as they are impacted by decisions
taken in several sectors such as health, welfare,
labour; IYCF policy needs to be integrated into
these sectors as well as into poverty reduction
programmes. Effective implementation of the
policy thus requires strong coordination with
accountability. Currently, as the analysis of
Indicator 1 reveals, though several countries have
a National Breastfeeding/IYCF committee,
headed by a coordinator with specific terms of
reference, the committee meets rarely; often it
does not have representation of the other sectors
that affect IYCF practices. This results in ad hoc
actions rather than the implementation of a
comprehensive strategy at scale.
And finally, monitoring and evaluation of policies
and programmes on a regular basis is essential
for fine tuning both policy and action. The results
of such exercise must inform both policy makers
as well as those who are implementing the policy
through programmes. Several countries have
3
4
5
6
7
US Surgeon General's Call for Action to
Support Breastfeeding
1. Policy, coordination, and financing
68Are our babies falling through the gaps?
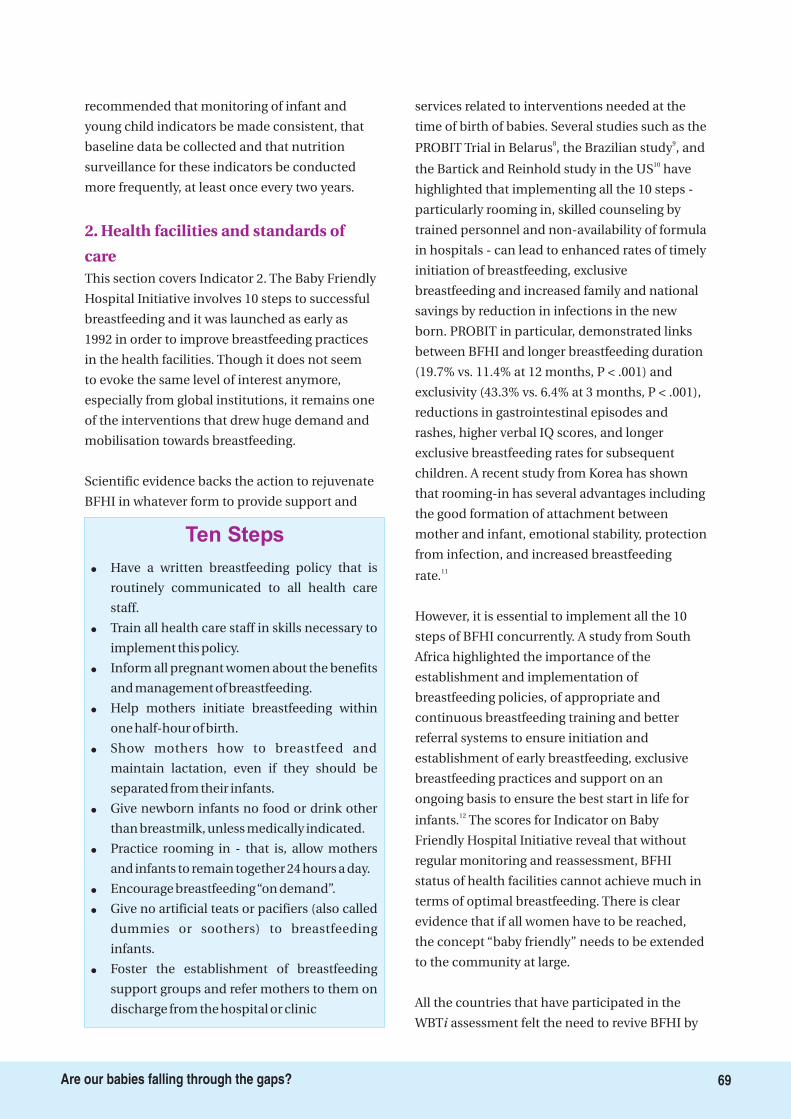
recommended that monitoring of infant and
young child indicators be made consistent, that
baseline data be collected and that nutrition
surveillance for these indicators be conducted
more frequently, at least once every two years.
This section covers Indicator 2. The Baby Friendly
Hospital Initiative involves 10 steps to successful
breastfeeding and it was launched as early as
1992 in order to improve breastfeeding practices
in the health facilities. Though it does not seem
to evoke the same level of interest anymore,
especially from global institutions, it remains one
of the interventions that drew huge demand and
mobilisation towards breastfeeding.
Scientific evidence backs the action to rejuvenate
BFHI in whatever form to provide support and
services related to interventions needed at the
time of birth of babies. Several studies such as the
PROBIT Trial in Belarus , the Brazilian study , and
the Bartick and Reinhold study in the US have
highlighted that implementing all the 10 steps -
particularly rooming in, skilled counseling by
trained personnel and non-availability of formula
in hospitals - can lead to enhanced rates of timely
initiation of breastfeeding, exclusive
breastfeeding and increased family and national
savings by reduction in infections in the new
born. PROBIT in particular, demonstrated links
between BFHI and longer breastfeeding duration
(19.7% vs. 11.4% at 12 months, P < .001) and
exclusivity (43.3% vs. 6.4% at 3 months, P < .001),
reductions in gastrointestinal episodes and
rashes, higher verbal IQ scores, and longer
exclusive breastfeeding rates for subsequent
children. A recent study from Korea has shown
that rooming-in has several advantages including
the good formation of attachment between
mother and infant, emotional stability, protection
from infection, and increased breastfeeding
rate.
However, it is essential to implement all the 10
steps of BFHI concurrently. A study from South
Africa highlighted the importance of the
establishment and implementation of
breastfeeding policies, of appropriate and
continuous breastfeeding training and better
referral systems to ensure initiation and
establishment of early breastfeeding, exclusive
breastfeeding practices and support on an
ongoing basis to ensure the best start in life for
infants. The scores for Indicator on Baby
Friendly Hospital Initiative reveal that without
regular monitoring and reassessment, BFHI
status of health facilities cannot achieve much in
terms of optimal breastfeeding. There is clear
evidence that if all women have to be reached,
the concept “baby friendly” needs to be extended
to the community at large.
All the countries that have participated in the
WBT assessment felt the need to revive BFHI by
8 9
10
11
12
i
2. Health facilities and standards of
care
�
�
�
�
�
�
�
�
�
�
Have a written breastfeeding policy that is
routinely communicated to all health care
staff.
Train all health care staff in skills necessary to
implement this policy.
Inform all pregnant women about the benefits
and management of breastfeeding.
Help mothers initiate breastfeeding within
one half-hour of birth.
Show mothers how to breastfeed and
maintain lactation, even if they should be
separated from their infants.
Give newborn infants no food or drink other
than breastmilk, unless medically indicated.
Practice rooming in - that is, allow mothers
and infants to remain together 24 hours a day.
Encourage breastfeeding“on demand”.
Give no artificial teats or pacifiers (also called
dummies or soothers) to breastfeeding
infants.
Foster the establishment of breastfeeding
support groups and refer mothers to them on
discharge from the hospital or clinic
Ten Steps
69Are our babies falling through the gaps?
integrating it in the health system and
establishing a community linkage. Jordan has
recommended establishing a breastfeeding
committee to advocate for BFHI; Egypt has
included an on-going process for reviving BFHI
in its 5-year plan; Lebanon has recommended
converting all public sector hospitals and health
facilities to BFHI, through upgrading training and
providing refresher courses to existing BFHI
hospital staff; Swaziland has recommended that
BFHI be incorporated in the national quality
assurance programme. All the countries noted
the need for governments to strengthen the
human resource capacity for BFHI, as well as the
need for governments and donor agencies to
invest both in financial and human resources for
this intervention.
This section deals with Indicators 5, 6 and 8.
There is an identified need to effectively link the
health facility with family level action and so is
the need to strengthen curriculum of health
workers who deliver these services, building their
skills appropriate to the needs of breastfeeding
women.
Universalizing access to skilled counseling
requires that the entire health and nutrition
system in the country - from medical and nursing
personnel to field level workers provide the same
information to mothers, that they are equipped
with listening and counseling skills to support the
woman to practice optimal breastfeeding. This
needs special skills to build confidence in women
and strengthen the oxytocin reflex a crucial
hormone needed to make effective milk transfer
from breast to the baby. As this hormone is
dependant on the state of mind of the mother, it
becomes critical to deal with this skillfully. Skilled
workers are required to prevent and solve
breastfeeding problems that can commonly
make a woman give up. Almost all the countries
conducting the WBT assessment identified an
immediate need to incorporate IYCF at all levels
of pre-service and in-service training. Curricula
must be updated according to the latest
recommendations and refresher courses must be
conducted for health personnel at all levels.
The need for updating curricula is particularly
important in the context of HIV, which poses
special challenges to optimal IYCF, particularly to
breastfeeding. The risk of HIV transmission
through breastfeeding has to be balanced against
the risk of death due to artificial feeding.
Additionally, there is evidence that mixed feeding
results in a much higher risk for infants than
exclusive breastfeeding. Mixed feeding not only
leads to increased transmission of HIV via
breastmilk , it also leads to increased morbidity
and mortality due to common childhood
illnesses. However, as the WBT assessment
shows, several countries do not adequately
incorporate infant feeding and HIV in either their
policies or their training curricula. Some
countries, such as Uruguay and Bhutan, do not
offer informed choice to women with HIV, and
babies of these women are exclusively fed on
formula. Findings such as the impact of
antiretroviral drugs in curtailing transmission of
HIV from mother to child has led to changes in
international guidelines.17 More recently, a study
from Botswana on antiretroviral regimens in
pregnancy and breastfeeding has concluded that
all regimens of highly active antiretroviral therapy
(HAART) from pregnancy through 6 months post
partum resulted in high rates of virologic
suppression, with an overall rate of mother-to-
child transmission of 1.1%. These findings need
to be harmonized in both policy and training of
health workers at all levels.
In its Implementing the
, WHO identifies the
need for building up teams of experienced
trainers, clinical practice sessions, refresher
courses and close monitoring as critical
requirements of an effective capacity building
i
i
Global Strategy for Infant
and Young Child Feeding
13
143. Capacity of health providers at the
level of the facility and the community
to provide adequate feeding support
70Are our babies falling through the gaps?
programme. WHO also identifies the need to
have training programmes that include
breastfeeding, complementary feeding, infant
feeding and HIV and growth monitoring.
The countries participating in the assessment
reiterated these points, and stressed the need for
countries to have a training programme that
imparted the same basic knowledge to the health
providers, so that mothers would get the same
messages at every level of the health and
nutrition system. The countries have also noted
the need for adequate budgeting for capacity
building.
This section deals with Indicator 3, 8 and 9. The
World Health Assembly resolution 63.23 of 2010,
calls upon all nations to enact suitable
regulations to end all kinds of “inappropriate”
promotions of baby foods for infants and young
children. It also calls upon the baby food
manufacturers to abide by the International Code
of Marketing of Breastmilk Substitutes and
subsequent relevant World Health Assembly
resolutions. At the same time World Health
Assembly resolution 65.6 calls on member States
to develop mechanisms of dealing with conflicts
of interests in Nutrition programmes and policy
development. All the countries have identified
the need to create public awareness of the Code
and national legislation and the subsequent WHA
resolutions, train health workers on the Code,
and give specific training to code monitors to
identify violations and take action.
Almost all the countries of the world have ratified
the International Code for Marketing of
Breastmilk Substitutes and subsequent WHA
resolutions to protect breastfeeding. However, as
the assessment shows, far more work still needs
to be done for effective enforcement of the Code.
While 10 countries - Afghanistan, Bangladesh,
Brazil, Costa Rica, Dominican Republic, Gambia,
Ghana, Malawi, Mongolia, and Zimbabwe have
scored a full 10 for this indicator, data on IYCF
practices reveals that Dominican Republic, Costa
Rica, Brazil, Afghanistan and Mongolia have
bottle feeding rates of 77.4%, 47.9%, 47.1%, 28.2%
and 26% respectively. This shows clearly that
enforcement is weak.
The WBT assessment shows that several
countries have yet to adopt the Code in full, or
even in part. Different countries have used
different mechanisms for adopting the Code:
Indonesia, has passed decrees, Pakistan has
issued regulations. The Uruguayan Decree 315/94
does not include bottles, teats and other items
used in artificial feeding, or the subsequent WHA
Resolutions, which complement the Code. Egypt
has consolidated the various existing decrees and
directives which give effect to different aspects of
the Code, but gaps continue to exist; the
assessment team recommends that some of these
gaps, such as those related to labeling can be
addressed through strengthening other existing
laws such as the food or labeling laws; it also
recommends that an advisory committee free
from conflict of interest be set up to oversee the
administration of the laws. Lesotho, Swaziland
and Kenya have draft laws whose processing
needs to be fast tracked. On the other hand,
Botswana has a law that is at odds with the
implementation of the South African Customs
Union (SACU); the assessment team noted the
need to sensitise members of SACU to
immediately pass their own laws to implement
the Code; they also recommended the reinstating
of repealed articles in the food labeling laws of
the country.
Countries like Malawi, Ghana, Lesotho,
Swaziland, Uganda, Zambia and Zimbabwe,
where the prevalence of HIV/AIDS amongst the
population between 15 and 49 years of age is
11%, 1.8%, 23.6%, 25.90%, 6.5%, 13.5% and 14.3%
respectively, have a policy on HIV and infant
i
4. Implementation of International
Code, subsequent resolutions of the
World Health Assembly.
5. Dealing with difficult circumstances
71Are our babies falling through the gaps?
feeding, that fully implements the International
Code. Yet, in spite of having policies and
programmes on HIV and Infant Feeding, several
African countries feel that these are inadequate
in terms of training, implementation of the
International Code, and more particularly, male
participation. Another gap that is specially
mentioned by them is the lack of data on how
many children actually develop HIV through
breastfeeding, and the outcomes of PMTCT
(PPTCT )programmes, as well as lack of adequate
attention to the food and nutritional security of
infants with HIV.
Implementing the Code and national legislation
becomes particularly important during
emergencies and disasters. Women, especially
lactating women, are extremely vulnerable to
stress, and this affects their ability to breastfeed
successfully, especially during disasters, where
they bear the greater part of the burden of
providing care and food for the family. Formula
and baby food manufacturers look at this as an
opportunity to advertise their products as “in
kind” donations. A record kept by the
Department of Social Welfare and Development
(DSWD), Philippines, in April 2007 for the victims
of Typhoon 'Reming' showed many such
donations, including those by NGOs and
government agencies, included infant formula
and assorted powdered milk. Forty percent of all
that arrived in the first three days was mostly
from foreign sources and was not monitored. The
evaluation highlighted the need for guidelines
and clear-cut strategies for managing the flood of
donations post-disaster.
This section deals with Indicator 4.
The International Labor Organization (ILO) in its
Convention 102 and 183, set standards of
maternity benefits, including paid maternity
leave; they state:
The benefits should extend throughout the
period of leave .
They should be adequate to maintain the
health and living standard of a woman and
her child.
Today, there are several studies that establish the
link between postnatal leave and breastfeeding. A
study from California concluded that
postpartum maternity leave may have a positive
effect on breastfeeding among full-time workers,
particularly those who hold non-managerial
positions, lack job flexibility, or experience
psychosocial distress, and that pediatricians
should encourage patients to take maternity
leave and advocate for extending paid
postpartum leave and flexibility in working
conditions for breastfeeding women. This finding
was reiterated by a study from South Carolina ,
which found that compared with those returning
to work within 1 to 6 weeks, women who had not
yet returned to work had a greater odds of
initiating breastfeeding, continuing any
breastfeeding beyond 6 months, and
predominant breastfeeding beyond 3 months.
Women who returned to work at or after 13 weeks
postpartum had higher odds of predominantly
breastfeeding beyond 3 months.
Studies from Europe further strengthen this
conclusion. A review of literature on the length of
maternity leaves and health of mothers and
children to evaluate the Swiss situation in view of
the maternity leave policy implemented in 2005,
concluded that there was a positive association
between the length of maternity leave and
mother's mental health and breastfeeding
duration. The UK Millennium Cohort Study
found that mothers employed part-time or self-
employed were more likely to breastfeed for at
least 4 months than those employed full-time.
Mothers were also more likely to breastfeed for at
least 4 months if their employer offered family-
friendly, or they received Statutory Maternity Pay
(SMP) plus additional pay during their maternity
leave rather than SMP alone. The Study
concluded that policies should aim to increase
financial support and incentives for employers to
�
�
15
16
17 18
6. Making maternity protection
universal
72Are our babies falling through the gaps?
offer supportive work arrangements.
A study from Lebanon found that breastfeeding
depended on the duration of the maternity leave,
the possibility of breaks for breastfeeding and the
presence of nurseries at work, and that a rapid
return to work could cause physical and
psychological problems. The authors called for
urgent interventions to prolong maternity leave
and promote breastfeeding among working
women. Another study from Turkey identified
the factors that improve long-term breastfeeding
are successful exclusive breastfeeding in the first
few months, intention of the mother to
breastfeed and sufficient duration of maternity
leave.
Though there is growing acceptance of the need
for maternity protection, including adequate
maternity leave to enhance breastfeeding rates,
the WBT assessment shows this intervention has
not received good support; this indicator received
the second lowest average score amongst the 10
indicators assessed. Almost all the countries have
recommended legislating maternity protection,
especially for the private sector, and better
implementation and monitoring of this indicator;
Mongolia has also recommended improved
implementation of mother-friendly birth
procedures.
While women working in the formal sector do
receive some limited form of protection, women
working in the informal and agricultural sectors
and those who are self-employed, face the most
severe challenges in feeding their infants
optimally. The assessment reveals that only eight
countries offer women in the informal or
unorganized sector the same level of protection
as offered in the formal sector, while 10 offer
some measure of protection; the rest of the
countries offer no protection to women working
in the unorganized sector. All the countries have
noted the need to strengthen maternity
protection, including extending the period of
leave for six months to enable breastfeeding; in
addition they have recommended massive public
awareness campaigns to inform women of their
rights to maternity protection.
19
20
i
1. Lutter C, Morrow AL. 2012. Protection, Promotion and Support and Global Trends in Breastfeeding. Advances in Nutrition. (in press)
2. Engesveen K. 2005. Strategies for Realizing Human Rights to Food, Health and Care for Infants and Young Children in Support of the Millennium Development Goals:Role and Capacity Analysis of Responsible Actors in Relation to Breastfeeding in the Maldives. SCN News. 30: 56-66.
3. Bryce J, Coitinho D, Darnton-Hill I, D, Pelletier D, Pinstrup-Andersen P. Maternal and child undernutrition: effective action at national level. The Lancet 2008; 371:510-26.
4. Victora CG. Nutrition in early life: a global priority. Lancet 2009;374: 1123-1125.
5. Infant and Young Child Programme Review. Consolidated Report of Six-Country Review of Breastfeeding Programmes. AED, UNICEF 2010. Availableat:www.unicef.org/nutrition/files/IYCF_Booklet_April_2010_Web.pdf
6. Every Child Counts. Submission to the Health Select Committee: Inquiry into Preventing Child Abuse and Improving Child Health. New Zealand.
7. USBC. Investing in breastfeeding saves money, helps boost our economy. http://www.usbreastfeeding.org/Portals/0/Advocacy/2011-03-10-One-Pager-Approp-FY12.pdf
8. Kramer MS, Chalmers B, Hodnett ED, Sevkovskaya Z, Dzikovich I, Shapiro S, Collet JP, Vanilovich I, Mezen I, et al, PROBIT Study Group (Promotion ofBreastfeeding Intervention Trial). Promotion of Breastfeeding Intervention Trial (PROBIT): a randomized trial in the Republic of Belarus. JAMA. 2001;285:413-20
9. Lutter CK, Perez-Escamilla R, Segall A, Sanghvi T, Teruya K, Wickham C. The effectiveness of a hospital-based program to promote exclusive breast-feeding amonglow-income women in Brazil. Am J Public Health. 1997;87:659-63
10. Quoted in CNN “Study: Lack of breastfeeding costs lives, billions of dollars”, http://edition.cnn.com/2010/HEALTH/04/05/breastfeeding.costs/index.html?hpt=P1,accessed on 6th April 2010
11. Yoo Min Lee, Kang Hoon Song, Young Mi Kim, Jin Sun Kang, Ji Young Chang, Hyun Joo Seol, Yong Sung Choi, and Chong Woo Bae. Complete rooming-in care ofnewborn infants. Korean J Pediatr. 2010 May;53(5):634-638.
12. D.B.M. Marais; H.E. Koornhof; L.M. Du Plessis; C.E. Naude; K. Smit; - Hertzog E.; - Treurnicht R.; - Alexander M.; - Cruywagen L.; - Kosaber I.. Breastfeedingpolicies and practices in health care facilities in the Western Cape Province, South Africa : original research. South African Journal of Clinical Nutrition. Volume 23.Issue 1. 2010. pp. 40-45
13. Coovadia HM, Rollins NC, Bland RM et al. Mother-to-child transmission of HIV-1 infection during exclusive breastfeeding in the first 6 months of life: an interventioncohort study. Lancet 2007; 369:1107-1116.
14. Black RE, Allen LH, Bhutta ZA, Caulfield LE, de Onis M, Ezzati M, et al , for the Maternal and Child Undernutrition Study Group. Maternal and child undernutrition:global and regional exposures and health consequences. Lancet 2008; 371(9608): 243-260.
15. Guendelman S, Kosa JL, Pearl M, Graham S, Goodman J, Kharrazi M. Juggling work and breastfeeding: effects of maternity leave and occupational characteristics.Pediatrics. 2009 Jan;123(1):e38-46.
16. Chinelo Ogbuanu, Saundra Glover, Janice Probst, Jihong Liu, James Hussey. The Effect of Maternity Leave Length and Time of Return to Work on BreastfeedingPublished online May 29, 2011 (doi: 10.1542/peds.2010-0459). Available at http://pediatrics.aappublications.org/content/early/2011/05/25/peds.2010-0459.abstract
17. Staehelin K, Bertea PC, Stutz EZ Length of maternity leave and health of mother and child--a review. Int J Public Health. 2007;52(4):202-9.
18. Hawkins SS, Griffiths LJ, Dezateux C, Law C; Millennium Cohort Study Child Health Group. The impact of maternal employment on breast-feeding duration in the UKMillennium Cohort Study. Public Health Nutr. 2007 Sep;10(9):891-6. Epub 2007 Mar 7.
19. Saadé N, Barbour B, Salameh P. Maternity leave and experience of working mothers in Lebanon. [Article in French] East Mediterr Health J. 2010 Sep;16(9):994-1002.
20. Camurdan AD, Ilhan MN, Beyazova U, Sahin F, Vatandas N, Eminoglu S. How to achieve long-term breast-feeding: factors associated with early discontinuation.Public Health Nutr. 2008 Nov;11(11):1173-9. Epub 2008 Feb 18.
Endnotes:
73Are our babies falling through the gaps?
What Next?
The WBT is an idea whose time has come!
Several countries have successfully used the
tool with impressive results. A recent study by
Lutter and Morrow has shown that it is possible
to increase breastfeeding rates provided
countries work on policy and programmes.
There is also evidence being generated that
specific interventions, particularly skilled
counseling and maternity protection, do lead to
enhanced breastfeeding rates. The following
recommendations have mostly emerged from the
national reports as well as the analysis of the
situation.
In each of the policy and programme indicators
we have highlighted the key finding and
recommendations that can be taken note of while
taking action in a local context. However, in this
chapter we have tried to provide
recommendations for different levels of
stakeholders.
1. Countries that have begun the WBT process
need to organise their coordination and
funding immediately and adequately, in
order to quickly scale up interventions to
increase breastfeeding rates. They should
also plan for re-assessments after 3-5 years to
study the trends and review action to be
taken, and aim to reach the next level of
performance.
2. Those who have not yet started using the
WBT could begin using this tool.
Develop a comprehensive, cross-sectoral,
multi-level IYCF policy with a plan of action
and a timeline. Budget the policy action and
raise resources for its implementation.
Appoint a coordinating body, with
representation from all sectors involved, to
oversee its comprehensive implementation.
Rejuvenate BFHI with a timeline to cover all
hospitals. Ensure that adequate human and
financial resources are available for this
action.
Legislate the International Code and all
relevant subsequent WHA resolutions and
stringently implement it. Raise public
awareness on the Code/national legislation
and train Code Monitors to take note of
violations for further action.
Extend maternity leave for all women to six
months to enable exclusive breastfeeding.
Extend maternity protection to women
working in the informal/unorganised sector
and raise adequate resources for this.
Integrate IYCF, including the International
Code, Infant Feeding in HIV and Infant
Feeding during Emergencies, in pre-service
i
i
i
�
�
�
�
�
General recommendations for
countries
Specific recommendations to countries
74Are our babies falling through the gaps?
The way forward and recommendations
and in-service training of health and
nutrition workers, at all levels of the health
and nutrition system.
Build community outreach into the IYCF
policy. Make communities baby friendly by
ensuring the provision of easy access to
skilled counselling and child-care services.
Develop a specific communication strategy
for IYCF.
Integrate HIV and infant feeding into the
IYCF policy, IYCF training for all levels of
health providers and IYCF communication
strategy.
Integrate infant feeding during emergencies
into the IYCF policy, and disaster
management planning including
breastfeeding support services, as a part of
the supply chain.
Include IYCF practice indicators in national
surveys and monitor them annually, or at
least every two years. Use this data to inform
policy.
Build implementation of the Global Strategy
for Infant and Young Child Feeding as a key
priority in the future agenda of child health
and survival.
Create budget lines for implementing the
Global strategy commensurate with the need.
Dedicate specific budget lines to address
breastfeeding and IYCF interventions under
child health or nutrition programming.
Global community should focus on policy
advocacy for legislation on the International
Code of Marketing of Breastmilk Substitutes
(Code) and subsequent World Health
Assembly resolutions , keeping it clear of
conflicts of interests.
In order to increase exclusive breastfeeding
for the first six months, encourage the use of
the WBT tool to initiate action under the UN
Secretary General's Global Strategy for
Women’s and Children's Health, or the
WHO’s Comprehensive Implementation Plan
on Maternal, Infant and Young Child
Nutrition
Donors could choose to help increase
breastfeeding rates by supporting specific
countries with low WBT scores or those LDC
countries where resources are constrained.
Donors could also choose to support specific
indicators with low scores in many countries
e.g. International Code of Marketing of
Breastmilk Substitutes(Code), infant feeding
policy during emergencies, or maternity
protection.
�
�
�
�
�
�
�
�
�
�
�
�
i
i
Specific recommendations to the
global community
75Are our babies falling through the gaps?
WBTi Works
The World Health Organisation has
recognised the tool for its usefulness in one
of their Statements issued at the time of World
Breastfeeding Week 2012.
WBT is now being recognised as a valid tool to
study the impact of implementing the
practices. The study by Lutter
and Morrow looked at the impact of
implementing the Global Strategy in twenty-two
WBTi countries in Africa, Asia, the Middle East,
and Latin America, using baseline data collected
13 to 25 years earlier, national infant feeding
survey data collected between 2002 and 2011,
and the WBT survey conducted between 2008
and 2012 . They found a statistically significant
median annual increase in exclusive
breastfeeding for the first six months to be 1.0%
per year in countries in the upper fiftieth
percentile of WBT scores, while the median
increase in exclusive breastfeeding was only 0.2%
per year in countries with the lowest WBT scores.
This annual increase was not associated with
maternal demographic factors such as urban
residence, paid employment, education or gross
national income.
The World Breastfeeding Trends Initiative (WBT )
consists of two distinct activities, one is to assess,
analyse and document the IYCF policy and
programmes, and second is to use the gaps thus
found for advocacy to call for a change at
national level. The entire process is founded on
the principle, that if people know their problems
they tend to fix them. In this chapter, we try to
assess the impact of our work so far on national
actions both in general and specific terms.
The WBT provides an ideal tool for improving
both policy and action, incorporating as it does,
assessment of both processes as well as
outcomes, for nations to create a continuum of
policy to cover all factors that impact infant and
young child feeding, and select and prioritize
actions to adequately protect, promote and
support it. In addition, the assessment provides a
benchmark for each country to judge the impact
or effectiveness of its future actions, and institute
mid-course corrections where needed. These
benchmarks and subsequent assessments also
inform the global community, international
organizations such as WHO and UNICEF, as well
as provide key information to the countdown
process to meeting the MDGs, especially MDG 1
and MDG4.
Using the ABCDE of the World Breastfeeding
Trends Initiative (WBT ) we analyse general
impact.
It is quite evident that the initiative
i
Global
Strategy on IYCF
i
i
i
i
i
i
1
A- Action:
General Impact
76Are our babies falling through the gaps?
The Impact: The national action thatWBT has generatedi
did lead to much needed action. Many countries
have shown progress in scores in individual
indicators or all together. IBFAN groups at
national level coordinated the assessment
process, and thus their own capacity in data
collection and analysis got enhanced. There is
some impact which is general in nature setting
up good process in a country and others are more
specific on overall policy and WBT score, as well
as on individual indicators.
As many 51 countries
have used it successfully. Participation of
multiple stakeholders including government
representatives, health professional organization,
people's organizations, women's and children's
rights groups, UN agencies and other
international organisations, etc. enhanced their
capacity to influence infant feeding policies.
Governments have been serious partner in
conducting assessments (see the list of partners)
in most countries. The fact that more than 480
partners took part in 51 countries makes it a
major impact. The governments led the process
at many places.
This has helped to
reach a consensus on what actions need to be
taken on a priority basis based on which they
developed a set of recommendations.
Countries successfully used the findings
and the colour coding to country stakeholders
and policy makers.
This is what we describe in following sections.
Today, 82 countries are involved in conducting
the WBT assessment, of which 51 have
completed the task of assessment and also used
the findings for national advocacy to call for
change. They include 14 countries from the Latin
American and Caribbean region, 14 from Africa,
eight from South Asia, five from the Arab World,
four each from East Asia and Southeast Asia, and
two from Oceania. Of the 51 countries where
WBTi analyses has been conducted between 2008
and 2012, five countries in the South Asian region
Afghanistan, Bangladesh, Bhutan, India, and Sri
Lanka have completed the assessment thrice,
first in 2005, 2008 and 2012, two countries in the
Latin American and Caribbean region Costa Rica
and Dominican Republic have conducted two
assessments each, one in 2008 and the other in
2012. The rest have conducted just one
assessment, though some of the countries in the
African region are in the process of conducting a
second assessment.
When WBT was launched, study of trends every
3-5 years was recommended. The impact of WBT
on government action started becoming evident
after South Asian countries conducted their first
assessment in 2005. Action was initiated in other
countries. In 2008, the tool was introduced in
several countries in East and Southeast Asia,
Africa and Latin America and Caribbean Region.
The WBT assessment underlines the need for
political will to mainstream breastfeeding and
IYCF policy and programme in national action.
This political will has to translate into action on
several fronts to bring a change. Scoring and
color coding have been effective tools in building
this political will, as in the case of Bhutan and
Afghanistan, which were in the red zone in 2005-
06 assessment, and did not have data on
breastfeeding indicators began doing this. They
moved upwards in the reassessment in 2009-10.
Political will is also apparent in the remedial
actions taken by several countries after analyzing
results of the assessment.
The Box 3 gives an expression of a country
coordinator of Lebanon regarding what WBT did
for them.
The following section provides analysis of the
i
i
i
i
i
i
B-Bringing together:
C-Consensus building:
D: Demonstration of achievement and
gaps:
E-Efficacy /improvement of programmes:
In South Asia
Gain of overall scores
77Are our babies falling through the gaps?
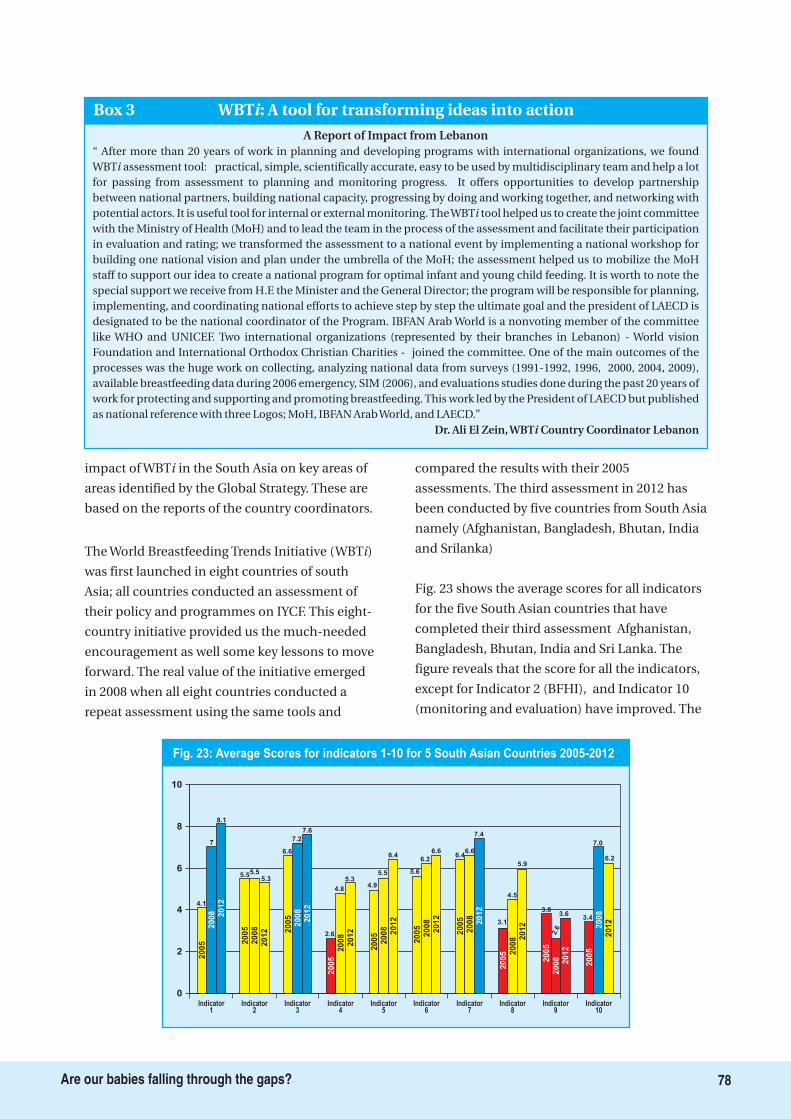
impact of WBT in the South Asia on key areas of
areas identified by the Global Strategy. These are
based on the reports of the country coordinators.
The World Breastfeeding Trends Initiative (WBT )
was first launched in eight countries of south
Asia; all countries conducted an assessment of
their policy and programmes on IYCF. This eight-
country initiative provided us the much-needed
encouragement as well some key lessons to move
forward. The real value of the initiative emerged
in 2008 when all eight countries conducted a
repeat assessment using the same tools and
compared the results with their 2005
assessments. The third assessment in 2012 has
been conducted by five countries from South Asia
namely (Afghanistan, Bangladesh, Bhutan, India
and Srilanka)
Fig. 23 shows the average scores for all indicators
for the five South Asian countries that have
completed their third assessment Afghanistan,
Bangladesh, Bhutan, India and Sri Lanka. The
figure reveals that the score for all the indicators,
except for Indicator 2 (BFHI), and Indicator 10
(monitoring and evaluation) have improved. The
i
i
Indicator1
Indicator2
Indicator3
Indicator4
Indicator5
Indicator6
Indicator7
Indicator8
Indicator9
Indicator10
10
8
6
4
2
0
200
52008
2005 2005
2005
2005
2005
2005
2005
2005
2005
2008
2008
2008
2008
2008
2008
2008
2008
2008
2012
2012
20122
012
2012
2012
2012
2012
2012
20124.1
7
8.1
5.55.55.3
6.6
7.2
7.6
2.6
4.8
5.34.9
5.5
6.4
5.6
6.2
6.66.4
6.6
7.4
3.1
4.5
5.9
3.8
2.6
3.63.4
7.0
6.2
Fig. 23: Average Scores for indicators 1-10 for 5 South Asian Countries 2005-2012
A Report of Impact from Lebanon“ After more than 20 years of work in planning and developing programs with international organizations, we foundWBT assessment tool: practical, simple, scientifically accurate, easy to be used by multidisciplinary team and help a lotfor passing from assessment to planning and monitoring progress. It offers opportunities to develop partnershipbetween national partners, building national capacity, progressing by doing and working together, and networking withpotential actors. It is useful tool for internal or external monitoring. TheWBT tool helped us to create the joint committeewith the Ministry of Health (MoH) and to lead the team in the process of the assessment and facilitate their participationin evaluation and rating; we transformed the assessment to a national event by implementing a national workshop forbuilding one national vision and plan under the umbrella of the MoH; the assessment helped us to mobilize the MoHstaff to support our idea to create a national program for optimal infant and young child feeding. It is worth to note thespecial support we receive from H.E the Minister and the General Director; the program will be responsible for planning,implementing, and coordinating national efforts to achieve step by step the ultimate goal and the president of LAECD isdesignated to be the national coordinator of the Program. IBFAN Arab World is a nonvoting member of the committeelike WHO and UNICEF. Two international organizations (represented by their branches in Lebanon) - World visionFoundation and International Orthodox Christian Charities - joined the committee. One of the main outcomes of theprocesses was the huge work on collecting, analyzing national data from surveys (1991-1992, 1996, 2000, 2004, 2009),available breastfeeding data during 2006 emergency, SIM (2006), and evaluations studies done during the past 20 years ofwork for protecting and supporting and promoting breastfeeding. This work led by the President of LAECD but publishedas national reference with three Logos; MoH, IBFAN ArabWorld, and LAECD.”
i
i
Dr. Ali El Zein, WBT Country Coordinator Lebanoni
WBT : A tool for transforming ideas into actioniBox 3
78Are our babies falling through the gaps?
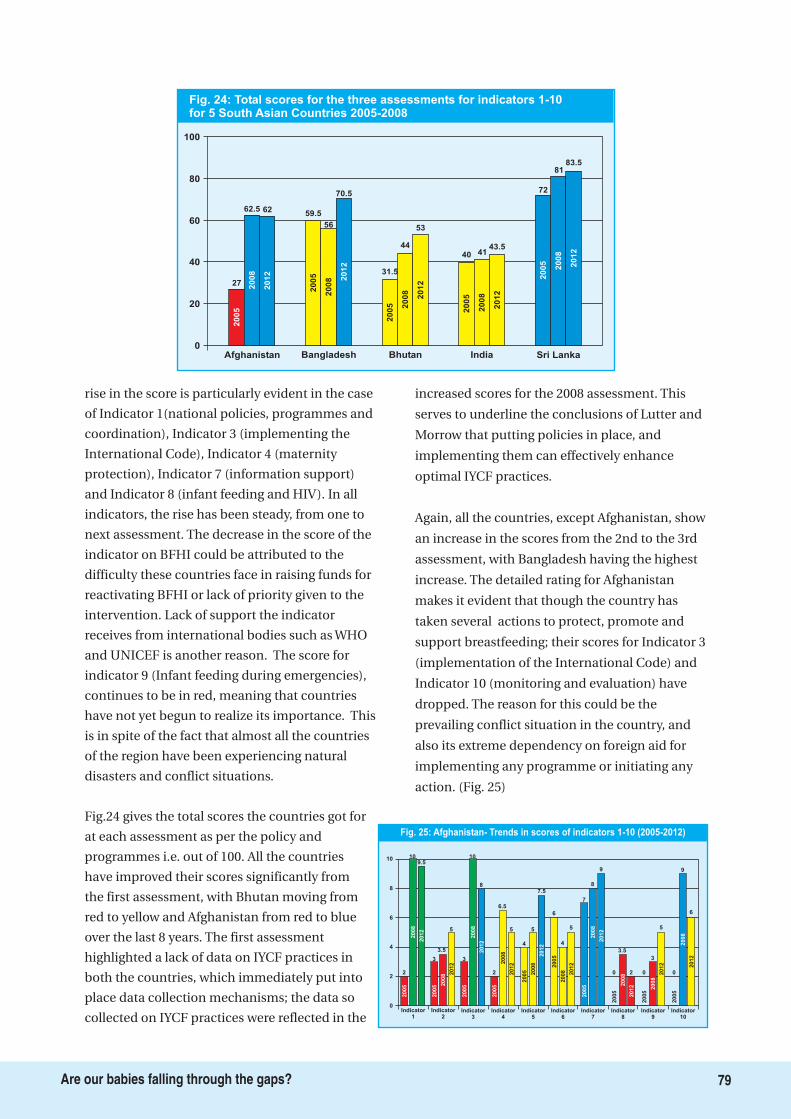
rise in the score is particularly evident in the case
of Indicator 1(national policies, programmes and
coordination), Indicator 3 (implementing the
International Code), Indicator 4 (maternity
protection), Indicator 7 (information support)
and Indicator 8 (infant feeding and HIV). In all
indicators, the rise has been steady, from one to
next assessment. The decrease in the score of the
indicator on BFHI could be attributed to the
difficulty these countries face in raising funds for
reactivating BFHI or lack of priority given to the
intervention. Lack of support the indicator
receives from international bodies such as WHO
and UNICEF is another reason. The score for
indicator 9 (Infant feeding during emergencies),
continues to be in red, meaning that countries
have not yet begun to realize its importance. This
is in spite of the fact that almost all the countries
of the region have been experiencing natural
disasters and conflict situations.
Fig.24 gives the total scores the countries got for
at each assessment as per the policy and
programmes i.e. out of 100. All the countries
have improved their scores significantly from
the first assessment, with Bhutan moving from
red to yellow and Afghanistan from red to blue
over the last 8 years. The first assessment
highlighted a lack of data on IYCF practices in
both the countries, which immediately put into
place data collection mechanisms; the data so
collected on IYCF practices were reflected in the
increased scores for the 2008 assessment. This
serves to underline the conclusions of Lutter and
Morrow that putting policies in place, and
implementing them can effectively enhance
optimal IYCF practices.
Again, all the countries, except Afghanistan, show
an increase in the scores from the 2nd to the 3rd
assessment, with Bangladesh having the highest
increase. The detailed rating for Afghanistan
makes it evident that though the country has
taken several actions to protect, promote and
support breastfeeding; their scores for Indicator 3
(implementation of the International Code) and
Indicator 10 (monitoring and evaluation) have
dropped. The reason for this could be the
prevailing conflict situation in the country, and
also its extreme dependency on foreign aid for
implementing any programme or initiating any
action. (Fig. 25)
100
80
60
40
20
0Afghanistan Bangladesh Bhutan India Sri Lanka
27
62.5 6259.5
56
70.5
31.5
44
53
40 4143.5
72
8183.5
2005
2008
2012
2005
2008 2
012
2005 2008
2012
2005
2008
2012
2005
2008
2012
Fig. 24: Total scores for the three assessments for indicators 1-10for 5 South Asian Countries 2005-2008
10
0Indicator
1Indicator
2Indicator
3Indicator
4Indicator
5Indicator
6Indicator
7Indicator
8Indicator
9Indicator
10
6
8
2
2005
2008
2012
109.5
2005 2
008
5
2005
2008
10
8
2005
6.5
2005
5
7.5
2005
2008 2012
2012
9
0
2005
2008
2012
3.5
2 0
2005
2008
2012
3
5
0
2005
2008
2012
9
6
5
2012
43.5 2
012
2
2008
4
2008
2012
3
2
2012
3
6
4
5
7
2005
2008
8
79Are our babies falling through the gaps?
Fig. 25: Afghanistan- Trends in scores of indicators 1-10 (2005-2012)
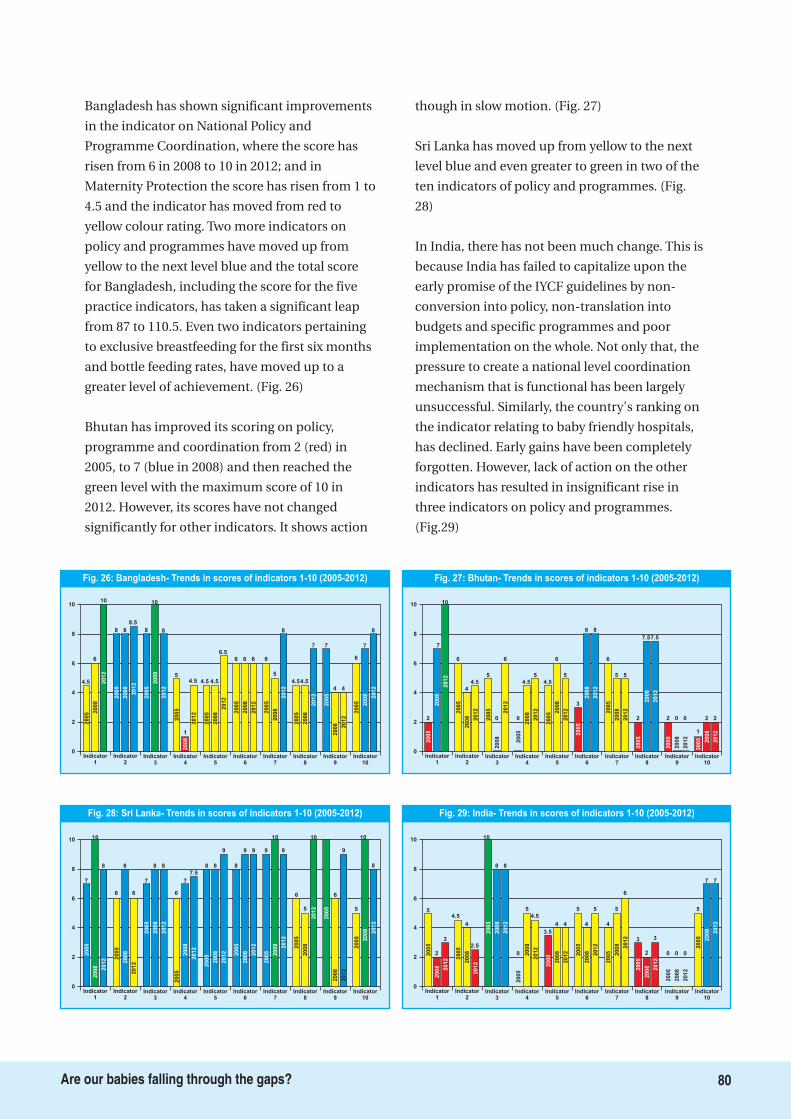
Bangladesh has shown significant improvements
in the indicator on National Policy and
Programme Coordination, where the score has
risen from 6 in 2008 to 10 in 2012; and in
Maternity Protection the score has risen from 1 to
4.5 and the indicator has moved from red to
yellow colour rating. Two more indicators on
policy and programmes have moved up from
yellow to the next level blue and the total score
for Bangladesh, including the score for the five
practice indicators, has taken a significant leap
from 87 to 110.5. Even two indicators pertaining
to exclusive breastfeeding for the first six months
and bottle feeding rates, have moved up to a
greater level of achievement. (Fig. 26)
Bhutan has improved its scoring on policy,
programme and coordination from 2 (red) in
2005, to 7 (blue in 2008) and then reached the
green level with the maximum score of 10 in
2012. However, its scores have not changed
significantly for other indicators. It shows action
though in slow motion. (Fig. 27)
Sri Lanka has moved up from yellow to the next
level blue and even greater to green in two of the
ten indicators of policy and programmes. (Fig.
28)
In India, there has not been much change. This is
because India has failed to capitalize upon the
early promise of the IYCF guidelines by non-
conversion into policy, non-translation into
budgets and specific programmes and poor
implementation on the whole. Not only that, the
pressure to create a national level coordination
mechanism that is functional has been largely
unsuccessful. Similarly, the country's ranking on
the indicator relating to baby friendly hospitals,
has declined. Early gains have been completely
forgotten. However, lack of action on the other
indicators has resulted in insignificant rise in
three indicators on policy and programmes.
(Fig.29)
10
0Indicator
1Indicator
2Indicator
3Indicator
7Indicator
9Indicator
10
6
8
2005
2008 2012
10
8
2008
6
2008
8 8
2012
9
0
2005
2008
2012
6
9
5
2005 2008 2012
10
8
4
8
2012
2005
6
2
2012
9
2005 2008
10
7
2005
7
Indicator4
Indicator5
2005
7
2005
8
9
7.5
2012
6
2008
2008
2012
88
Indicator6
2005
9 9
2008 2012
Indicator8
6
2005
2008
20125
10
Fig. 28: Sri Lanka- Trends in scores of indicators 1-10 (2005-2012)
10
0Indicator
1Indicator
2Indicator
3Indicator
7Indicator
8Indicator
9Indicator
10
6
8
2005
2008 2012
2
3
2008
2.5
2008
8 8
2012
6
3
2005
2008 2012
2
3
0
2005
2008
2012
0 0
5
2005 2008 2012
7 7
44
2012
2005
4.5
2
2012
4
5
4
2005 2008
55
2005
10
Indicator4
Indicator5
2005
5
2005
4 4
4.5
2012
0 2008
2008
2012
5
3.5
Indicator6
2005
2008 2012
Fig. 29: India- Trends in scores of indicators 1-10 (2005-2012)
10
0Indicator
1Indicator
2Indicator
3Indicator
7Indicator
8Indicator
9Indicator
10
6
8
2005 2
008
2012
6
2008
8.5
2008
10
8
2012
8
4.5
2005
2008
2012
4.5
7 7
2005
2008 2012
4 4
6
2005 2008 2012
7
8
4
8
2012
2005
8
2
2012
6 6 6
2005
2008
5
4.5
2005
8
Indicator4
Indicator5
2005
1
2005
4.5
6.5
4.5
2012
5
2008
2008
2012
6
4.5
Indicator6
2005
2008
2012
Fig. 26: Bangladesh- Trends in scores of indicators 1-10 (2005-2012)
1010
0Indicator
1Indicator
2Indicator
3Indicator
4Indicator
5Indicator
6Indicator
7Indicator
8Indicator
9Indicator
10
6
8
2
2005
2008
2012
7
10
2005
2008
4.5
2005
2008
0
6
2005
4.5
2005
6
5
2005
2008
2012
2012
5
2
2005
2008
2012
7.57.5
2
2005
2008
2012
0 0
1
2005 2008
2012
2 2
5
2012
44
2012
0
2008
4.5
2008
2012
6
2
2012
5
3
8 8
6
2005
2008
5
Fig. 27: Bhutan- Trends in scores of indicators 1-10 (2005-2012)
80Are our babies falling through the gaps?
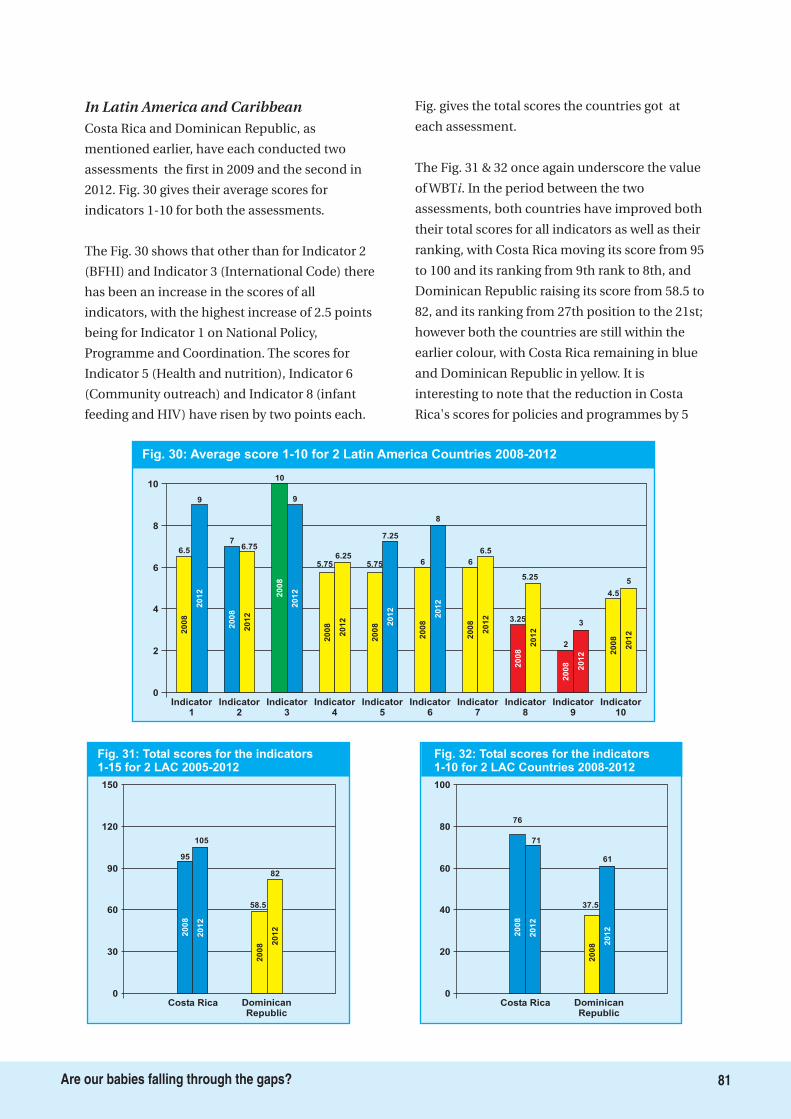
In Latin America and CaribbeanCosta Rica and Dominican Republic, as
mentioned earlier, have each conducted two
assessments the first in 2009 and the second in
2012. Fig. 30 gives their average scores for
indicators 1-10 for both the assessments.
The Fig. 30 shows that other than for Indicator 2
(BFHI) and Indicator 3 (International Code) there
has been an increase in the scores of all
indicators, with the highest increase of 2.5 points
being for Indicator 1 on National Policy,
Programme and Coordination. The scores for
Indicator 5 (Health and nutrition), Indicator 6
(Community outreach) and Indicator 8 (infant
feeding and HIV) have risen by two points each.
Fig. gives the total scores the countries got at
each assessment.
The Fig. 31 & 32 once again underscore the value
of WBT . In the period between the two
assessments, both countries have improved both
their total scores for all indicators as well as their
ranking, with Costa Rica moving its score from 95
to 100 and its ranking from 9th rank to 8th, and
Dominican Republic raising its score from 58.5 to
82, and its ranking from 27th position to the 21st;
however both the countries are still within the
earlier colour, with Costa Rica remaining in blue
and Dominican Republic in yellow. It is
interesting to note that the reduction in Costa
Rica's scores for policies and programmes by 5
i
Fig. 30: Average score 1-10 for 2 Latin America Countries 2008-2012
10
8
6
4
2
0
6.5
9
7
10
9
5.756.25
5.75
7.25
6
8
6
6.5
3.25
5.25
2
3
4.5
5
Indicator1
2008
2012
2008
2012
2008
2012
2008
2012
2008 2
012
2008
2012
2008
2012
2008
2012
2008 2012 2
008
2012
Indicator2
Indicator3
Indicator4
Indicator5
Indicator6
Indicator7
Indicator8
Indicator9
Indicator10
6.75
Fig. 31: Total scores for the indicators1-15 for 2 LAC 2005-2012
150
120
90
60
30
0Costa Rica Dominican
Republic
95
105
2008
2012
58.5
82
2008 2
012
Fig. 32: Total scores for the indicators1-10 for 2 LAC Countries 2008-2012
100
80
60
40
20
0Costa Rica Dominican
Republic
76
71
2008
2012
37.5
61
2008 2
012
81Are our babies falling through the gaps?
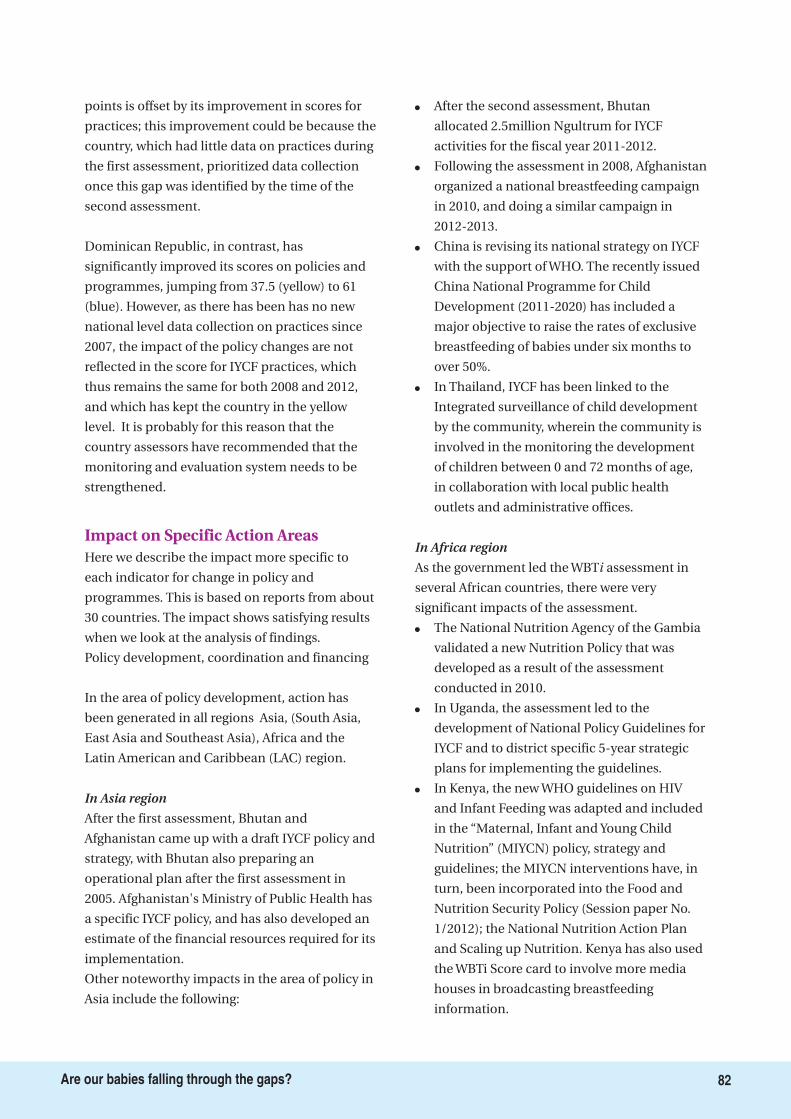
points is offset by its improvement in scores for
practices; this improvement could be because the
country, which had little data on practices during
the first assessment, prioritized data collection
once this gap was identified by the time of the
second assessment.
Dominican Republic, in contrast, has
significantly improved its scores on policies and
programmes, jumping from 37.5 (yellow) to 61
(blue). However, as there has been has no new
national level data collection on practices since
2007, the impact of the policy changes are not
reflected in the score for IYCF practices, which
thus remains the same for both 2008 and 2012,
and which has kept the country in the yellow
level. It is probably for this reason that the
country assessors have recommended that the
monitoring and evaluation system needs to be
strengthened.
Here we describe the impact more specific to
each indicator for change in policy and
programmes. This is based on reports from about
30 countries. The impact shows satisfying results
when we look at the analysis of findings.
Policy development, coordination and financing
In the area of policy development, action has
been generated in all regions Asia, (South Asia,
East Asia and Southeast Asia), Africa and the
Latin American and Caribbean (LAC) region.
After the first assessment, Bhutan and
Afghanistan came up with a draft IYCF policy and
strategy, with Bhutan also preparing an
operational plan after the first assessment in
2005. Afghanistan's Ministry of Public Health has
a specific IYCF policy, and has also developed an
estimate of the financial resources required for its
implementation.
Other noteworthy impacts in the area of policy in
Asia include the following:
After the second assessment, Bhutan
allocated 2.5million Ngultrum for IYCF
activities for the fiscal year 2011-2012.
Following the assessment in 2008, Afghanistan
organized a national breastfeeding campaign
in 2010, and doing a similar campaign in
2012-2013.
China is revising its national strategy on IYCF
with the support of WHO. The recently issued
China National Programme for Child
Development (2011-2020) has included a
major objective to raise the rates of exclusive
breastfeeding of babies under six months to
over 50%.
In Thailand, IYCF has been linked to the
Integrated surveillance of child development
by the community, wherein the community is
involved in the monitoring the development
of children between 0 and 72 months of age,
in collaboration with local public health
outlets and administrative offices.
As the government led the WBT assessment in
several African countries, there were very
significant impacts of the assessment.
The National Nutrition Agency of the Gambia
validated a new Nutrition Policy that was
developed as a result of the assessment
conducted in 2010.
In Uganda, the assessment led to the
development of National Policy Guidelines for
IYCF and to district specific 5-year strategic
plans for implementing the guidelines.
In Kenya, the new WHO guidelines on HIV
and Infant Feeding was adapted and included
in the “Maternal, Infant and Young Child
Nutrition” (MIYCN) policy, strategy and
guidelines; the MIYCN interventions have, in
turn, been incorporated into the Food and
Nutrition Security Policy (Session paper No.
1/2012); the National Nutrition Action Plan
and Scaling up Nutrition. Kenya has also used
the WBTi Score card to involve more media
houses in broadcasting breastfeeding
information.
In Asia region
In Africa region
�
�
�
�
�
�
�
i
Impact on Specific Action Areas
82Are our babies falling through the gaps?
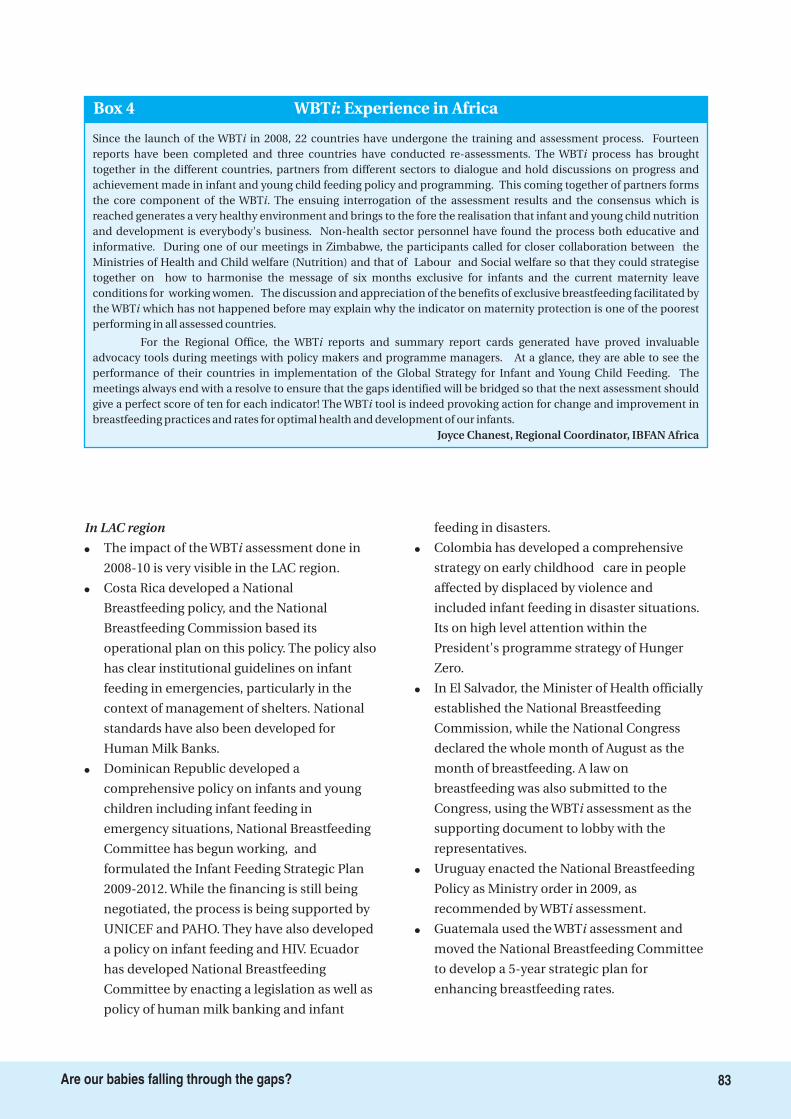
In LAC region
�
�
�
�
�
�
�
The impact of the WBT assessment done in
2008-10 is very visible in the LAC region.
Costa Rica developed a National
Breastfeeding policy, and the National
Breastfeeding Commission based its
operational plan on this policy. The policy also
has clear institutional guidelines on infant
feeding in emergencies, particularly in the
context of management of shelters. National
standards have also been developed for
Human Milk Banks.
Dominican Republic developed a
comprehensive policy on infants and young
children including infant feeding in
emergency situations, National Breastfeeding
Committee has begun working, and
formulated the Infant Feeding Strategic Plan
2009-2012. While the financing is still being
negotiated, the process is being supported by
UNICEF and PAHO. They have also developed
a policy on infant feeding and HIV. Ecuador
has developed National Breastfeeding
Committee by enacting a legislation as well as
policy of human milk banking and infant
feeding in disasters.
Colombia has developed a comprehensive
strategy on early childhood care in people
affected by displaced by violence and
included infant feeding in disaster situations.
Its on high level attention within the
President's programme strategy of Hunger
Zero.
In El Salvador, the Minister of Health officially
established the National Breastfeeding
Commission, while the National Congress
declared the whole month of August as the
month of breastfeeding. A law on
breastfeeding was also submitted to the
Congress, using the WBT assessment as the
supporting document to lobby with the
representatives.
Uruguay enacted the National Breastfeeding
Policy as Ministry order in 2009, as
recommended by WBT assessment.
Guatemala used the WBT assessment and
moved the National Breastfeeding Committee
to develop a 5-year strategic plan for
enhancing breastfeeding rates.
i
i
i
i
Since the launch of the WBT in 2008, 22 countries have undergone the training and assessment process. Fourteenreports have been completed and three countries have conducted re-assessments. The WBT process has broughttogether in the different countries, partners from different sectors to dialogue and hold discussions on progress andachievement made in infant and young child feeding policy and programming. This coming together of partners formsthe core component of the WBT . The ensuing interrogation of the assessment results and the consensus which isreached generates a very healthy environment and brings to the fore the realisation that infant and young child nutritionand development is everybody's business. Non-health sector personnel have found the process both educative andinformative. During one of our meetings in Zimbabwe, the participants called for closer collaboration between theMinistries of Health and Child welfare (Nutrition) and that of Labour and Social welfare so that they could strategisetogether on how to harmonise the message of six months exclusive for infants and the current maternity leaveconditions for working women. The discussion and appreciation of the benefits of exclusive breastfeeding facilitated bythe WBT which has not happened before may explain why the indicator on maternity protection is one of the poorestperforming in all assessed countries.
For the Regional Office, the WBT reports and summary report cards generated have proved invaluableadvocacy tools during meetings with policy makers and programme managers. At a glance, they are able to see theperformance of their countries in implementation of the Global Strategy for Infant and Young Child Feeding. Themeetings always end with a resolve to ensure that the gaps identified will be bridged so that the next assessment shouldgive a perfect score of ten for each indicator! The WBT tool is indeed provoking action for change and improvement inbreastfeeding practices and rates for optimal health and development of our infants.
ii
i
i
i
i
Joyce Chanest, Regional Coordinator, IBFAN Africa
WBT : Experience in AfricaiBox 4
83Are our babies falling through the gaps?
In key areas required for action following impact
has been reported
Recognising the large gaps that exist in the
area of maternity protection, and its vital
importance in supporting women to practice
optimal IYCF, several countries, especially in
Africa, LAC and Asian regions initiated action
in this area.
In the Gambia, the findings of the WBT
assessment were used successfully during the
enactment of the Women's Bill leading to the
incorporation of maternity protection in the
legislation.
Three countries in the LAC region Ecuador,
Colombia and Peru established laws that
allow breastfeeding in public places, and have
set up places for women to use breast pumps
with ease.
In Uruguay, a draft was presented to the
Congress to extend maternity leave and part-
time employment during the period of
lactation, and to harmonize maternity
benefits available in the public and private
sectors.
In Dominican Republic ILO's C183 presented
to Congress
In El Salvador a government and private
fundraising campaign has been developed in
to raise awareness on women's rights,
including their right to breastfeed.
The Brazilian government, working with
IBFAN and PAHO, has developed a training
module to help public and private institutions
set up mother and baby friendly facilities at
the workplace; 22 local governments are
�
�
�
�
�
�
�
i
Maternity Protection
One of the most important aspects of the WBT evaluation in LAC is that it is a national participatory process. Since itsinception, the coordinating team in each country has clearly aimed to involve a range of significant actors, includingprogram directors, policy-makers, civil society organizations, academics and UN agencies. The purpose of this has beento guarantee that the evaluation results will be widely discussed and gaps clearly identified in order to define necessarycourses of action. Thus, with the participation of both government, civil society and academia actors, priorities havebeen defined and proposals for improvement developed. Not only evaluation results but also mechanisms for solutionsare shared in the process. These are then brought before the national public since the necessary changes should havethe backing of the people, organized or not. In this way, the evaluation is complemented by necessary mobilization,action, and vigilance among the most interested sectors among groups of mothers and women, consumers, and others,who, in turn, become real allies for program directors, who understand that most of the time nothing happens withoutsufficient pressure on those in power.
In Latin America and the Caribbean, the WBT process has been an instrument for change. Out of 22 countries in theregion, 14 have conducted a WBT evaluation between 2008 and 2012. Two of these countries, Costa Rica and theDominican Republic, have performed a second evaluation, allowing them to measure the impact of the WBT tool in thechange process. The gaps identified in these evaluations have led to the development of: a 5-year strategic plan for theNational Breastfeeding Commission of Dominican Republic with the support of the United Nations; a national policyon breastfeeding for Costa Rica; and, in both countries, policies on infant feeding in emergency situations with clearlyguidelines, above all in the wake of the Haiti earthquake and a revitalization of the Baby Friendly Hospital Initiative.Costa Rica now has an indicator in the National Survey about the initiation of breastfeeding in the first hour after birth.The Dominican Republic developed exemplary systems and services for forming and supporting lactation consultantsthat help train others, including at the Haitian border.
In the other 11 countries, the impact of the WBT process is notable in improvements like the strategic strengthening ofNational Breastfeeding Commissions which are exercising a straight-forward role in infant-feeding policies; officialmonitoring of the International Code, as well as formal complaints against the companies that violate it and internalmechanisms to keep industry marketing out of the health systems; and national struggles to increase maternity leave,with clear advances in Venezuela, Brazil and Chile. And, most importantly, the WBTi process has left each country withgroups that are experts in the current state of infant-feeding programs and policies in their countries and will serve asacademic and political references, as well as nuclei of national action and networking with other countries in the regionand the world.
i
ii
i
i
Marta Trejos, Regional Coordinator, IBFAN LAC
WBT : Process in Latin American and the CaribbeaniBox 5
84Are our babies falling through the gaps?
participating in monitoring this.
In Vietnam, Asia, successful advocacy was led
to extension the period of maternity leave to
six months.
In Bangladesh, the Prime Minister issued an
order extending paid maternity leave to six
months.
In China, “The Special Rules on the Labor
Protection of Female Employees was issued
on Apr. 28, 2012, replacing the previous
Regulations Concerning the Labor Protection
of Female Staff and Workers (1988). These
Rules extend maternity leave are from 90 days
to 98 days, with the basic payment being
covered by maternity insurance. Government
employees in Hong Kong are entitled to five
days of fully paid paternity leave from April
2012.
The Royal Government of Bhutan issued an
executive order allowing every lactating
mother to work from home every Tuesday till
the baby is two years of age to promote
breastfeeding.
In Philippines, the WBT process of building
consensus was particularly useful in enacting
the new law on Expanded Breastfeeding
Promotion Act that was passed in early 2010
to enable women to breastfeed at the
workplace.
In Lebanon, a new law concerning maternity
leave is in process to be enacted in the
Parliament to scale up the maternity leave
from the current 60 days for the public and 6
weeks for the private sector to 10 weeks.
Several countries took steps to resurrect the
BFHI.
Bangladesh saw a major improvement in
BFHI revitalization, extending accreditation to
63 hospitals at first round with a plan to cover
499 hospitals in next two years.
Mongolia translated the WHO/UNICEF IYCF
counseling manual into Mongolian.
China initiated a pilot of Baby Friendly
Communities in Huairou district in Beijing.
Zambia developed an IYCF Community
package for training the community in IYCF.
Dominican Republic implemented a Rescue
Plan for BFHI in 2011-12, and 11 training
modules were updated to train instructors
who can train community instructors in Haiti
border, a very successful experience that
builds ties with the BFHI.
In Guatemala, the Deputy Hospital Minister
launched a policy which includes compliance
of the 10 steps, with constant evaluation
indicators and results. The budget and
hospital supplies are subject to fulfilment of
this.
In Lebanon, the BFHI was re-launched after a
ten-year freeze, with an IEC campaign and the
participation of 18 public and private
hospitals, where workshops were held. Twenty
eight persons were trained as Trainers of
Trainers, while 14 others were trained as
external assessors. A further 20-hours course
was conducted for 45 staff from 10 hospitals,
and repeated for all hospitals in September.
The WHO/UNICEF resource material on
breastfeeding promotion and support was
translated into Arabic. Funds for all these
activities were raised from World Vision.
In Zambia, the criteria for accreditation were
updated, assessment tools were identified and
trainings conducted for both hospital staff
and the assessors.
As baby food companies continue their
aggressive marketing and promotion of their
foods for infants and young children it became
too important for countries to take action.
Protection of breastfeeding through
implementation of the International Code is
probably the area where the WBT has had the
maximum impact.
Indonesia successfully used the WBT
assessment to include three articles related to
breastfeeding in their Health law N. 23/1992.
�
�
�
�
�
�
�
�
�
�
�
�
�
�
�
�
i
i
i
BFHI, capacity building of health
providers and community outreach
Action on International Code
85Are our babies falling through the gaps?
�
�
�
�
�
�
�
�
�
�
�
China started the revision of the Regulations
on Marketing of Breastmilk Substitutes; the
draft of revised regulations was submitted to
the State Council who collected comments
among general public during November of
2011. The Minister of Health and related
government sections are in the process of
approving final revision; the country has also
conducted a Code training course for heads in
provincial offices of the China Consumer
Association, which will compose a network of
Code monitors.
Hong Kong put in a policy that prevents
public hospitals from accepting free supplies
of infant formula; further, as a result of
advocacy, eight to the 10 private hospitals in
the country have stopped accepting
donations of infant formula.
Bangladesh has strengthened its laws on the
BMS Code to include subsequent WHA
resolutions.
In Thailand, the cabinet acknowledged the
controlling measures on baby milk marketing
and advertisement as proposed by the
Ministry of Public Health.
Ecuador saw the development of a regulation
of food advertising, especially baby food; in
additing, responded to the National Nutrition
Plan resulting from the WBTi assessment, the
new regulation included a regulation on
publicity of infant feeding.
Mexico has been using the assessment to
conduct advocacy on implementing the laws
relating to the International Code.
Costa Rica held two Code Trainings in 2011
and 2012 with financial support from PAHO.
Nicaragua used the score card effectively to
raise US$ 6000 from UNICEF to conduct
advoacy for implementing the Code.
In Swaziland, the Code of marketing has been
included in the Public Health Act which is in
its final stages before enactment.
Uganda used the WBT assessment to raise
US$ 100,000 from UNICEF for a yearlong
project to support work on the International
Code and BFHI.
After a delay in implementing the new
Lebanese Law 47/08, the National
Breastfeeding Committee, in its first meeting,,
formed three subcommittee to deal with
various aspects of the implementation.
Kuwait has begun to develop a local code or
policy document as first step before the
drafting a law.
i
1. Lutter C, Morrow AL. 2012. Protection, Promotion and Support and Global Trends in Breastfeeding. Advances in Nutrition. (in press)
Endnote:
86Are our babies falling through the gaps?
About and theProcess
WBTi
The World Breastfeeding Trends Initiative
(WBT ) is an innovative initiative of the
International Baby Food Action Network
(IBFAN), spearheaded by its Asia regional office,
for tracking, assessing and monitoring
implementation of the
in response to the
global need for focus on infant nutrition and
survival. The initiative aims at strengthening
and stimulating action to protect, promote and
support breastfeeding worldwide.
Using the tool, stakeholders in a country assess
their own implementation of the ,
identify gaps and build national consensus
around actions that are needed and accord
priorities to them. The WBT assessment is not
conducted by an external agency, but by the
people in countries themselves. The WBT team
at IBFAN Asia receives findings from the
national team, and initiates a process of
verification; particularly sources of the
information supplied, and then look for a
national consensus. Once the national team
agrees to the assessment
findings, the WBT team
uploads the report on to the
web-tool that provides the
score and rating/colour coding.
The following are its two objectives:
Firstly, it is intended to help countries assess
whether the action they have taken so far in
the various programme areas is inadequate
or adequate, and the finer detail of the
various criteria on which each programme is
assessed helps them to identify exactly
where action is needed.
Secondly it is intended to assist countries
initiate national action to improve their
performance based on the gaps thus
identified.
This is achieved by diverse national stakeholders
working together on the assessment. This
creates a sense of national ownership and pride
for the exercise and strengthens national
partnerships for effective actions to bridge the
existing gaps.
The WBT is designed to assist countries in
assessing the strengths and
weakness of their policies and
programmes to protect,
promote and support optimal
infant and young child feeding
i
Global Strategy for Infant
and Young Child Feeding
Global Strategy
i
i
i
i
�
�
A tool designed to have a positive impact
on infant feeding practices
Objectives of WBTi
It clearly identifies gaps to helpgovernments, donors, bilateral, UNagencies to commit resources where
they are most needed.
87Are our babies falling through the gaps?
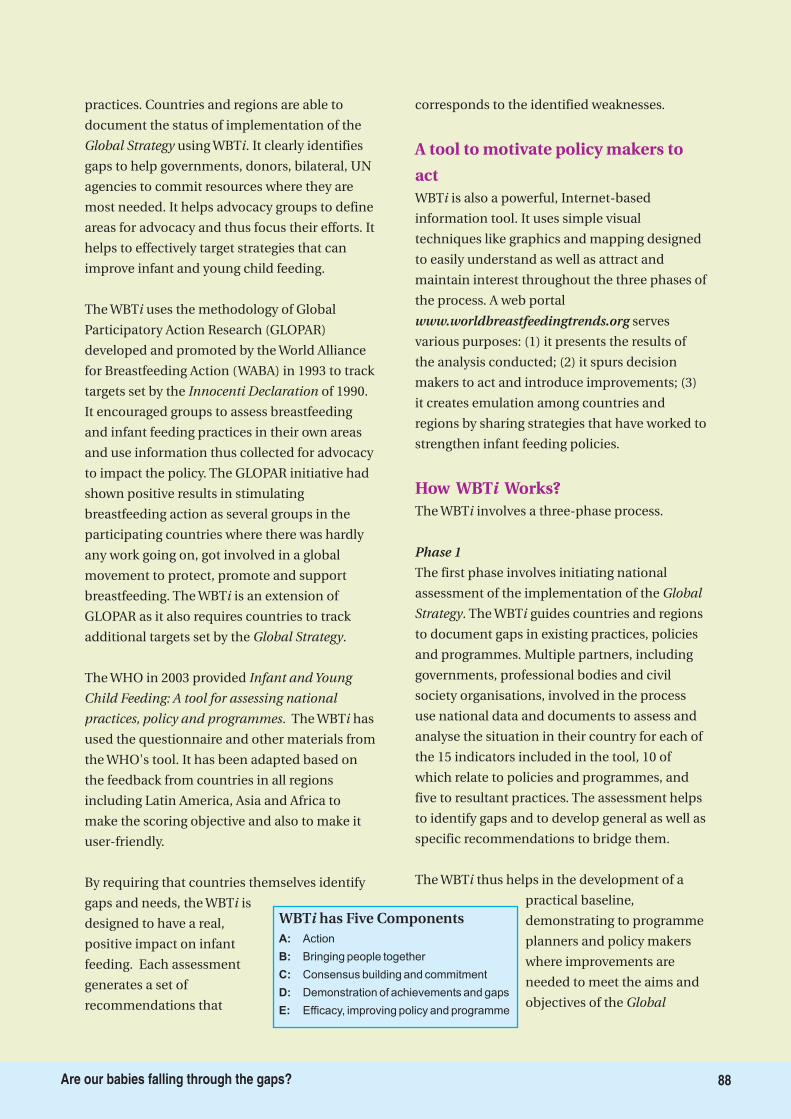
practices. Countries and regions are able to
document the status of implementation of the
using WBT . It clearly identifies
gaps to help governments, donors, bilateral, UN
agencies to commit resources where they are
most needed. It helps advocacy groups to define
areas for advocacy and thus focus their efforts. It
helps to effectively target strategies that can
improve infant and young child feeding.
The WBT uses the methodology of Global
Participatory Action Research (GLOPAR)
developed and promoted by the World Alliance
for Breastfeeding Action (WABA) in 1993 to track
targets set by the of 1990.
It encouraged groups to assess breastfeeding
and infant feeding practices in their own areas
and use information thus collected for advocacy
to impact the policy. The GLOPAR initiative had
shown positive results in stimulating
breastfeeding action as several groups in the
participating countries where there was hardly
any work going on, got involved in a global
movement to protect, promote and support
breastfeeding. The WBT is an extension of
GLOPAR as it also requires countries to track
additional targets set by the .
The WHO in 2003 provided
. The WBT has
used the questionnaire and other materials from
the WHO's tool. It has been adapted based on
the feedback from countries in all regions
including Latin America, Asia and Africa to
make the scoring objective and also to make it
user-friendly.
By requiring that countries themselves identify
gaps and needs, the WBT is
designed to have a real,
positive impact on infant
feeding. Each assessment
generates a set of
recommendations that
corresponds to the identified weaknesses.
WBT is also a powerful, Internet-based
information tool. It uses simple visual
techniques like graphics and mapping designed
to easily understand as well as attract and
maintain interest throughout the three phases of
the process. A web portal
serves
various purposes: (1) it presents the results of
the analysis conducted; (2) it spurs decision
makers to act and introduce improvements; (3)
it creates emulation among countries and
regions by sharing strategies that have worked to
strengthen infant feeding policies.
The WBT involves a three-phase process.
The first phase involves initiating national
assessment of the implementation of the
. The WBT guides countries and regions
to document gaps in existing practices, policies
and programmes. Multiple partners, including
governments, professional bodies and civil
society organisations, involved in the process
use national data and documents to assess and
analyse the situation in their country for each of
the 15 indicators included in the tool, 10 of
which relate to policies and programmes, and
five to resultant practices. The assessment helps
to identify gaps and to develop general as well as
specific recommendations to bridge them.
The WBT thus helps in the development of a
practical baseline,
demonstrating to programme
planners and policy makers
where improvements are
needed to meet the aims and
objectives of the
Global Strategy i
i
Innocenti Declaration
i
Global Strategy
Infant and Young
Child Feeding: A tool for assessing national
practices, policy and programmes i
i
i
i
Global
Strategy i
i
Global
www.worldbreastfeedingtrends.org
Phase 1
A tool to motivate policy makers to
act
How WBT Works?i
A:
B:
C:
D:
E:
Action
Bringing people together
Consensus building and commitment
Demonstration of achievements and gaps
Efficacy, improving policy and programme
WBT has Five Componentsi
88Are our babies falling through the gaps?
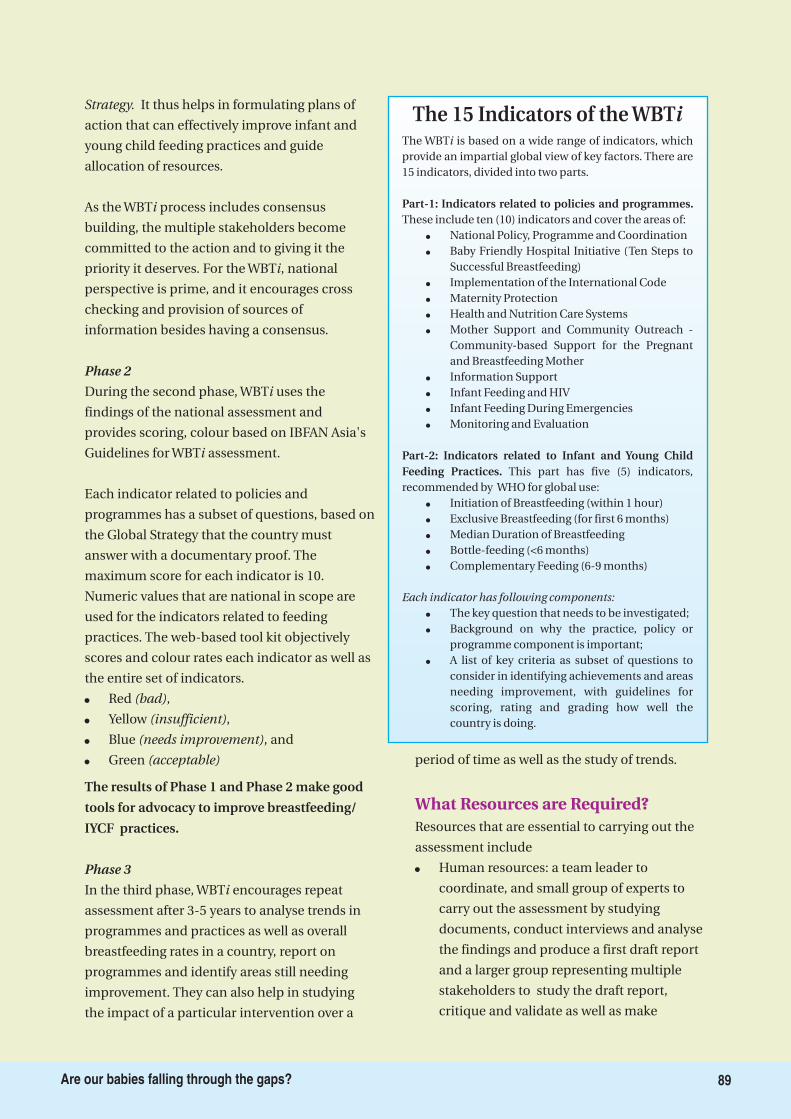
Strategy.
i
i
i
i
(bad)
(insufficient)
(needs improvement)
(acceptable)
i
It thus helps in formulating plans of
action that can effectively improve infant and
young child feeding practices and guide
allocation of resources.
As the WBT process includes consensus
building, the multiple stakeholders become
committed to the action and to giving it the
priority it deserves. For the WBT , national
perspective is prime, and it encourages cross
checking and provision of sources of
information besides having a consensus.
During the second phase, WBT uses the
findings of the national assessment and
provides scoring, colour based on IBFAN Asia's
Guidelines for WBT assessment.
Each indicator related to policies and
programmes has a subset of questions, based on
the Global Strategy that the country must
answer with a documentary proof. The
maximum score for each indicator is 10.
Numeric values that are national in scope are
used for the indicators related to feeding
practices. The web-based tool kit objectively
scores and colour rates each indicator as well as
the entire set of indicators.
Red ,
Yellow ,
Blue , and
Green
In the third phase, WBT encourages repeat
assessment after 3-5 years to analyse trends in
programmes and practices as well as overall
breastfeeding rates in a country, report on
programmes and identify areas still needing
improvement. They can also help in studying
the impact of a particular intervention over a
period of time as well as the study of trends.
Resources that are essential to carrying out the
assessment include
Human resources: a team leader to
coordinate, and small group of experts to
carry out the assessment by studying
documents, conduct interviews and analyse
the findings and produce a first draft report
and a larger group representing multiple
stakeholders to study the draft report,
critique and validate as well as make
Phase 2
Phase 3
�
�
�
�
�
The results of Phase 1 and Phase 2 make good
tools for advocacy to improve breastfeeding/
IYCF practices.
What Resources are Required?
The 15 Indicators of the WBTiThe WBT is based on a wide range of indicators, whichprovide an impartial global view of key factors. There are15 indicators, divided into two parts.
These include ten (10) indicators and cover the areas of:National Policy, Programme and CoordinationBaby Friendly Hospital Initiative (Ten Steps toSuccessful Breastfeeding)Implementation of the International CodeMaternity ProtectionHealth and Nutrition Care SystemsMother Support and Community Outreach -Community-based Support for the Pregnantand Breastfeeding MotherInformation SupportInfant Feeding and HIVInfant Feeding During EmergenciesMonitoring and Evaluation
i
Part-1: Indicators related to policies and programmes.
�
�
�
�
�
�
�
�
�
Part-2: Indicators related to Infant and Young ChildFeeding Practices. This part has five (5) indicators,recommended by WHO for global use:
Initiation of Breastfeeding (within 1 hour)Exclusive Breastfeeding (for first 6 months)Median Duration of BreastfeedingBottle-feeding (<6 months)Complementary Feeding (6-9 months)
The key question that needs to be investigated;Background on why the practice, policy orprogramme component is important;A list of key criteria as subset of questions toconsider in identifying achievements and areasneeding improvement, with guidelines forscoring, rating and grading how well thecountry is doing.
�
�
�
�
�
�
�
�
Each indicator has following components:
�
89Are our babies falling through the gaps?
recommendations based on identified gaps.
Documentation on policy and programmes.
Secondary data (which is national in scope)
on breastfeeding, complementary feeding
and bottle-feeding.
Financial resources for organising meetings,
the coordination, the assessment,
preparation of report, dissemination, and
advocacy.
It is recommended to carry out the assessment
every 3-5 years. An important role of the tool
emerges from re-assessments. A country that
has done well during an assessment may slide
down next time; the scores are figures that are
meant to show how far the country has
progressed on any one issue. If today it has
taken two steps, then it will get a higher figure
than if someone has taken only one step. For
example, India's rating has come down for
national guidelines, because no steps were taken
between 2005 and 2012.
Firstly, it can be used at regular intervals for
countries to assess the improvement in their
implementation.
Secondly, as each indicator is detailed,
moving from broad existence of policy to the
finer details, it allows policy makers and
programme managers to identify specific
gaps for which actions can be initiated.
Thirdly, the colour coding motivates
countries actions to improve their levels, as
it is simple and easy to understand and
stimulate to move to the next colour level.
Fourthly, being web-based, WBT allows
sharing of information and allows countries
to compare their rankings with other
countries, and after reassessments, to
identify what actions were most effective.
And last, but not least, it encourages
peoples' groups and governments to work
together through developing consensus.
�
�
�
�
�
�
�
�
i
Why to Study Trends?
Why WBT is efficient?i
90Are our babies falling through the gaps?
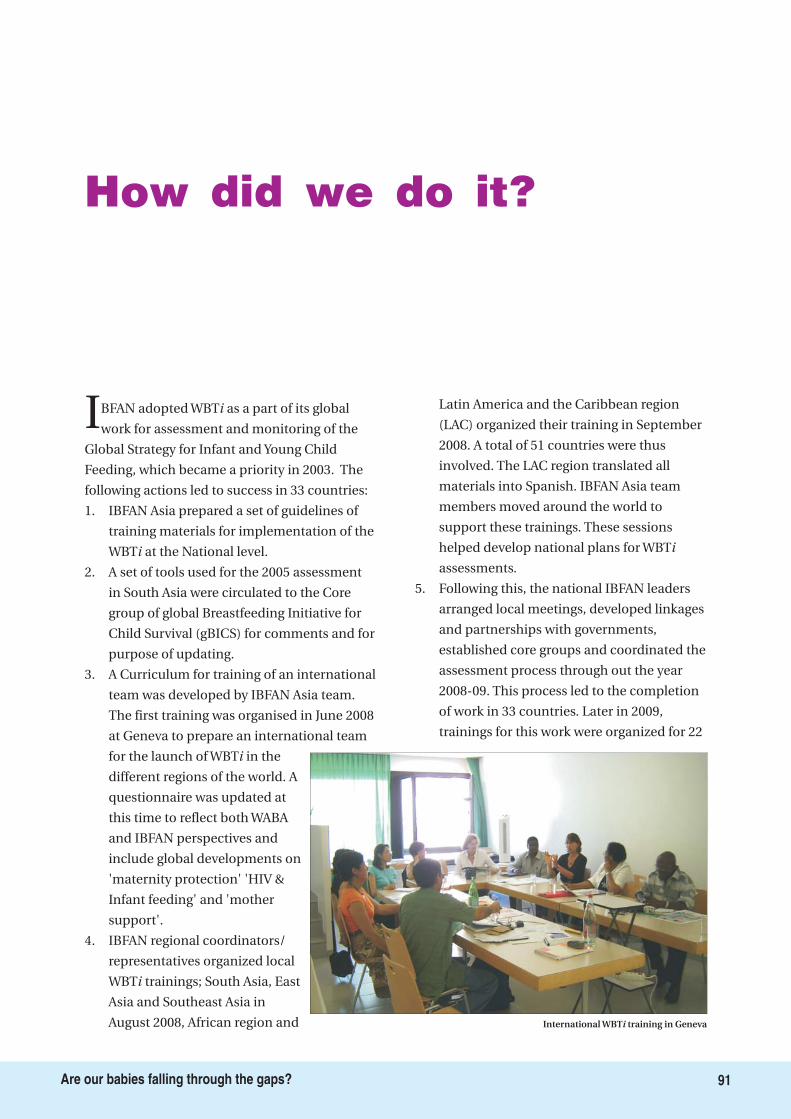
How did we do it?
IBFAN adopted WBT as a part of its global
work for assessment and monitoring of the
Global Strategy for Infant and Young Child
Feeding, which became a priority in 2003. The
following actions led to success in 33 countries:
1. IBFAN Asia prepared a set of guidelines of
training materials for implementation of the
WBT at the National level.
2. A set of tools used for the 2005 assessment
in South Asia were circulated to the Core
group of global Breastfeeding Initiative for
Child Survival (gBICS) for comments and for
purpose of updating.
3. A Curriculum for training of an international
team was developed by IBFAN Asia team.
The first training was organised in June 2008
at Geneva to prepare an international team
for the launch of WBT in the
different regions of the world. A
questionnaire was updated at
this time to reflect both WABA
and IBFAN perspectives and
include global developments on
'maternity protection' 'HIV &
Infant feeding' and 'mother
support'.
4. IBFAN regional coordinators/
representatives organized local
WBT trainings; South Asia, East
Asia and Southeast Asia in
August 2008, African region and
Latin America and the Caribbean region
(LAC) organized their training in September
2008. A total of 51 countries were thus
involved. The LAC region translated all
materials into Spanish. IBFAN Asia team
members moved around the world to
support these trainings. These sessions
helped develop national plans for WBT
assessments.
5. Following this, the national IBFAN leaders
arranged local meetings, developed linkages
and partnerships with governments,
established core groups and coordinated the
assessment process through out the year
2008-09. This process led to the completion
of work in 33 countries. Later in 2009,
trainings for this work were organized for 22
i
i
i
i
i
International WBT training in Genevai
91Are our babies falling through the gaps?
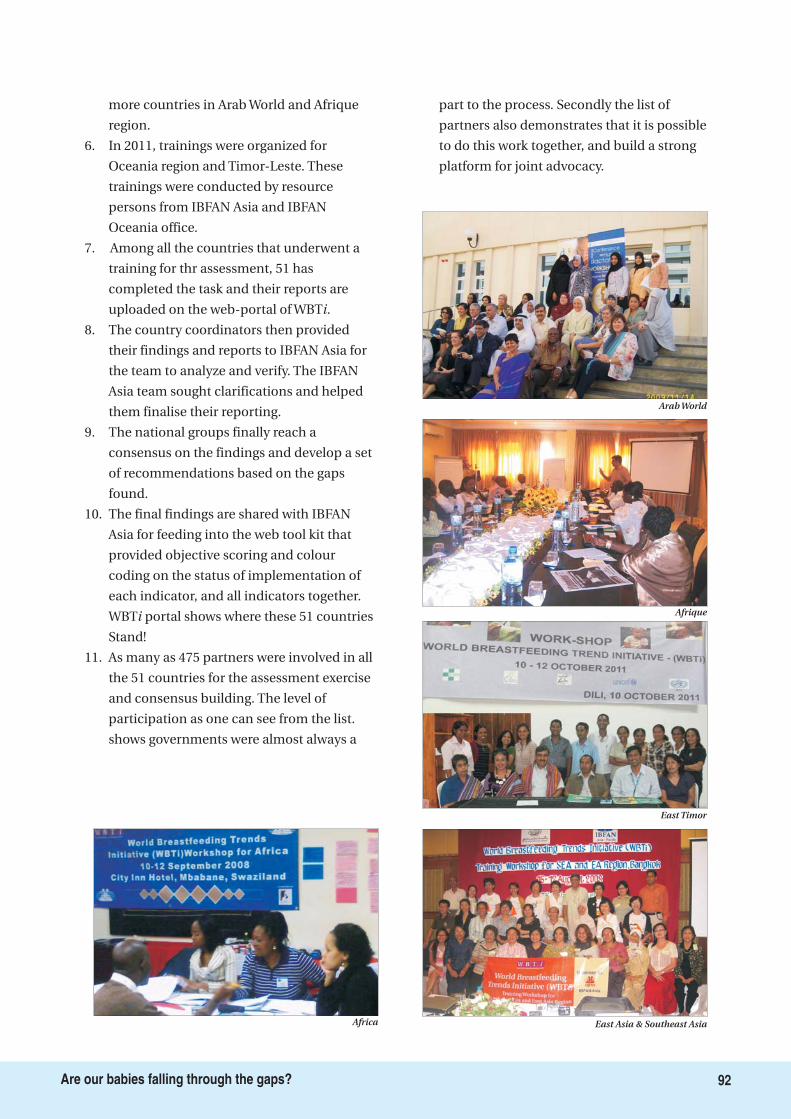
more countries in Arab World and Afrique
region.
6. In 2011, trainings were organized for
Oceania region and Timor-Leste. These
trainings were conducted by resource
persons from IBFAN Asia and IBFAN
Oceania office.
7. Among all the countries that underwent a
training for thr assessment, 51 has
completed the task and their reports are
uploaded on the web-portal of WBT .
8. The country coordinators then provided
their findings and reports to IBFAN Asia for
the team to analyze and verify. The IBFAN
Asia team sought clarifications and helped
them finalise their reporting.
9. The national groups finally reach a
consensus on the findings and develop a set
of recommendations based on the gaps
found.
10. The final findings are shared with IBFAN
Asia for feeding into the web tool kit that
provided objective scoring and colour
coding on the status of implementation of
each indicator, and all indicators together.
WBT portal shows where these 51 countries
Stand!
11. As many as 475 partners were involved in all
the 51 countries for the assessment exercise
and consensus building. The level of
participation as one can see from the list.
shows governments were almost always a
part to the process. Secondly the list of
partners also demonstrates that it is possible
to do this work together, and build a strong
platform for joint advocacy.
i
i Afrique
East Timor
Arab World
East Asia & Southeast AsiaAfrica
92Are our babies falling through the gaps?
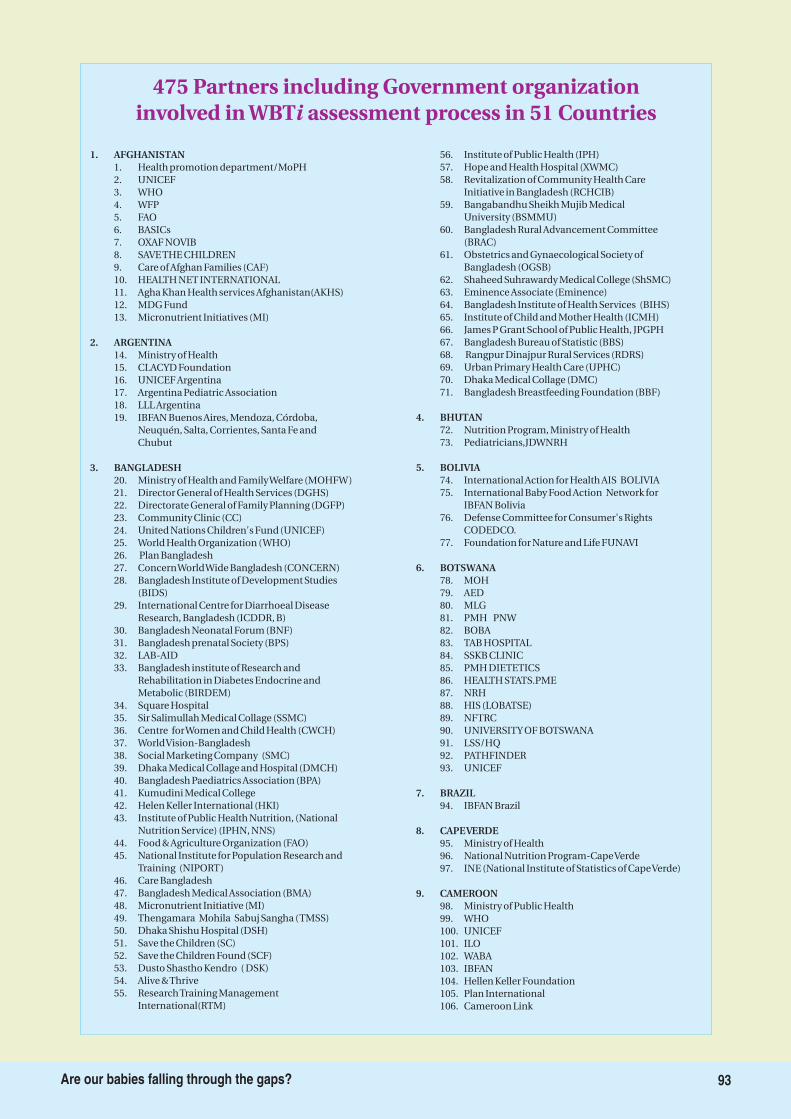
475 Partners including Government organizationinvolved in WBT assessment process in 51 Countriesi
1. AFGHANISTAN
2. ARGENTINA
3. BANGLADESH
4. BHUTAN
5. BOLIVIA
6. BOTSWANA
7. BRAZIL
8. CAPEVERDE
9. CAMEROON
1. Health promotion department/MoPH2. UNICEF3. WHO4. WFP5. FAO6. BASICs7. OXAF NOVIB8. SAVETHE CHILDREN9. Care of Afghan Families (CAF)10. HEALTH NET INTERNATIONAL11. Agha Khan Health services Afghanistan(AKHS)12. MDG Fund13. Micronutrient Initiatives (MI)
14. Ministry of Health15. CLACYD Foundation16. UNICEF Argentina17. Argentina Pediatric Association18. LLL Argentina19. IBFAN Buenos Aires, Mendoza, Córdoba,
Neuquén, Salta, Corrientes, Santa Fe andChubut
20. Ministry of Health and FamilyWelfare (MOHFW)21. Director General of Health Services (DGHS)22. Directorate General of Family Planning (DGFP)23. Community Clinic (CC)24. United Nations Children's Fund (UNICEF)25. World Health Organization (WHO)26. Plan Bangladesh27. ConcernWorldWide Bangladesh (CONCERN)28. Bangladesh Institute of Development Studies
(BIDS)29. International Centre for Diarrhoeal Disease
Research, Bangladesh (ICDDR, B)30. Bangladesh Neonatal Forum (BNF)31. Bangladesh prenatal Society (BPS)32. LAB-AID33. Bangladesh institute of Research and
Rehabilitation in Diabetes Endocrine andMetabolic (BIRDEM)
34. Square Hospital35. Sir Salimullah Medical Collage (SSMC)36. Centre forWomen and Child Health (CWCH)37. WorldVision-Bangladesh38. Social Marketing Company (SMC)39. Dhaka Medical Collage and Hospital (DMCH)40. Bangladesh Paediatrics Association (BPA)41. Kumudini Medical College42. Helen Keller International (HKI)43. Institute of Public Health Nutrition, (National
Nutrition Service) (IPHN, NNS)44. Food & Agriculture Organization (FAO)45. National Institute for Population Research and
Training (NIPORT)46. Care Bangladesh47. Bangladesh Medical Association (BMA)48. Micronutrient Initiative (MI)49. Thengamara Mohila Sabuj Sangha (TMSS)50. Dhaka Shishu Hospital (DSH)51. Save the Children (SC)52. Save the Children Found (SCF)53. Dusto Shastho Kendro ( DSK)54. Alive &Thrive55. ResearchTraining Management
International(RTM)
56. Institute of Public Health (IPH)57. Hope and Health Hospital (XWMC)58. Revitalization of Community Health Care
Initiative in Bangladesh (RCHCIB)59. Bangabandhu Sheikh Mujib Medical
University (BSMMU)60. Bangladesh Rural Advancement Committee
(BRAC)61. Obstetrics and Gynaecological Society of
Bangladesh (OGSB)62. Shaheed Suhrawardy Medical College (ShSMC)63. Eminence Associate (Eminence)64. Bangladesh Institute of Health Services (BIHS)65. Institute of Child and Mother Health (ICMH)66. James P Grant School of Public Health, JPGPH67. Bangladesh Bureau of Statistic (BBS)68. Rangpur Dinajpur Rural Services (RDRS)69. Urban Primary Health Care (UPHC)70. Dhaka Medical Collage (DMC)71. Bangladesh Breastfeeding Foundation (BBF)
72. Nutrition Program, Ministry of Health73. Pediatricians,JDWNRH
74. International Action for Health AIS BOLIVIA75. International Baby Food Action Network for
IBFAN Bolivia76. Defense Committee for Consumer's Rights
CODEDCO.77. Foundation for Nature and Life FUNAVI
78. MOH79. AED80. MLG81. PMH PNW82. BOBA83. TAB HOSPITAL84. SSKB CLINIC85. PMH DIETETICS86. HEALTH STATS.PME87. NRH88. HIS (LOBATSE)89. NFTRC90. UNIVERSITY OF BOTSWANA91. LSS/HQ92. PATHFINDER93. UNICEF
94. IBFAN Brazil
95. Ministry of Health96. National Nutrition Program-CapeVerde97. INE (National Institute of Statistics of CapeVerde)
98. Ministry of Public Health99. WHO100. UNICEF101. ILO102. WABA103. IBFAN104. Hellen Keller Foundation105. Plan International106. Cameroon Link
93Are our babies falling through the gaps?
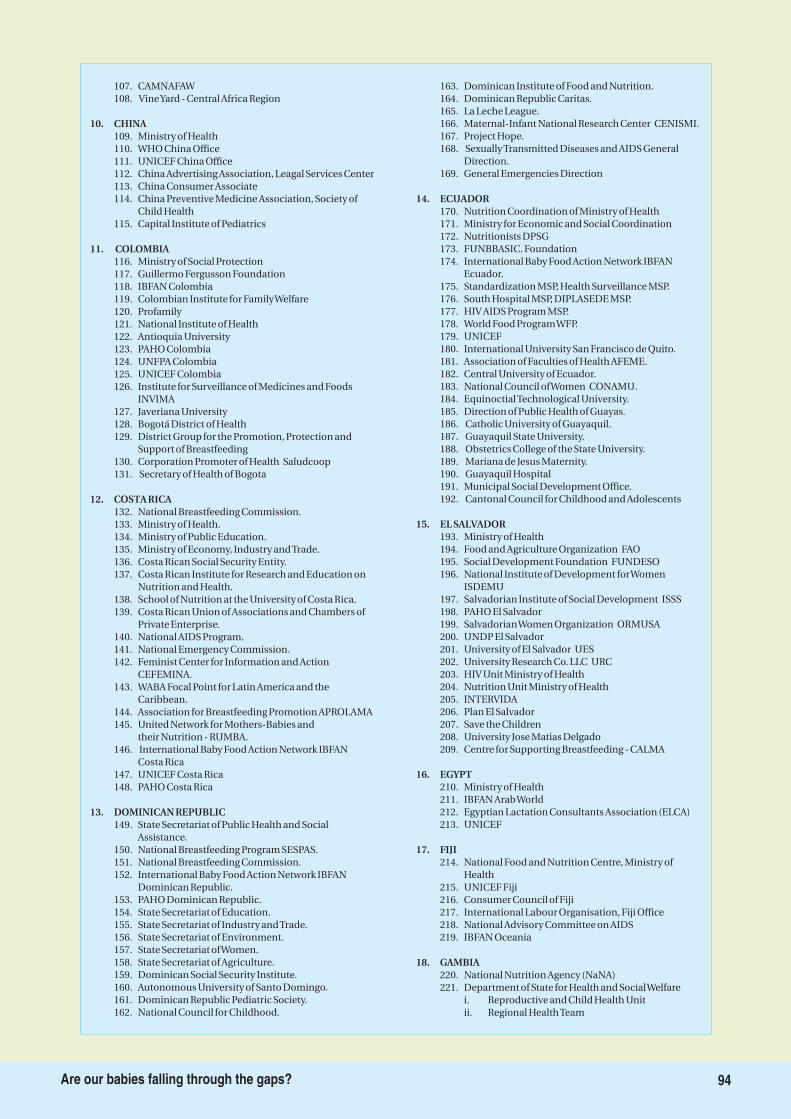
107. CAMNAFAW108. VineYard - Central Africa Region
109. Ministry of Health110. WHO China Office111. UNICEF China Office112. China Advertising Association, Leagal Services Center113. China Consumer Associate114. China Preventive Medicine Association, Society of
Child Health115. Capital Institute of Pediatrics
116. Ministry of Social Protection117. Guillermo Fergusson Foundation118. IBFAN Colombia119. Colombian Institute for FamilyWelfare120. Profamily121. National Institute of Health122. Antioquia University123. PAHO Colombia124. UNFPA Colombia125. UNICEF Colombia126. Institute for Surveillance of Medicines and Foods
INVIMA127. Javeriana University128. Bogotá District of Health129. District Group for the Promotion, Protection and
Support of Breastfeeding130. Corporation Promoter of Health Saludcoop131. Secretary of Health of Bogota
132. National Breastfeeding Commission.133. Ministry of Health.134. Ministry of Public Education.135. Ministry of Economy, Industry andTrade.136. Costa Rican Social Security Entity.137. Costa Rican Institute for Research and Education on
Nutrition and Health.138. School of Nutrition at the University of Costa Rica.139. Costa Rican Union of Associations and Chambers of
Private Enterprise.140. National AIDS Program.141. National Emergency Commission.142. Feminist Center for Information and Action
CEFEMINA.143. WABA Focal Point for Latin America and the
Caribbean.144. Association for Breastfeeding Promotion APROLAMA145. United Network for Mothers-Babies and
their Nutrition - RUMBA.146. International Baby Food Action Network IBFAN
Costa Rica147. UNICEF Costa Rica148. PAHO Costa Rica
149. State Secretariat of Public Health and SocialAssistance.
150. National Breastfeeding Program SESPAS.151. National Breastfeeding Commission.152. International Baby Food Action Network IBFAN
Dominican Republic.153. PAHO Dominican Republic.154. State Secretariat of Education.155. State Secretariat of Industry andTrade.156. State Secretariat of Environment.157. State Secretariat ofWomen.158. State Secretariat of Agriculture.159. Dominican Social Security Institute.160. Autonomous University of Santo Domingo.161. Dominican Republic Pediatric Society.162. National Council for Childhood.
163. Dominican Institute of Food and Nutrition.164. Dominican Republic Caritas.165. La Leche League.166. Maternal-Infant National Research Center CENISMI.167. Project Hope.168. SexuallyTransmitted Diseases and AIDS General
Direction.169. General Emergencies Direction
170. Nutrition Coordination of Ministry of Health171. Ministry for Economic and Social Coordination172. Nutritionists DPSG173. FUNBBASIC. Foundation174. International Baby Food Action Network IBFAN
Ecuador.175. Standardization MSP, Health Surveillance MSP.176. South Hospital MSP, DIPLASEDE MSP.177. HIV AIDS Program MSP.178. World Food ProgramWFP.179. UNICEF180. International University San Francisco de Quito.181. Association of Faculties of Health AFEME.182. Central University of Ecuador.183. National Council ofWomen CONAMU.184. EquinoctialTechnological University.185. Direction of Public Health of Guayas.186. Catholic University of Guayaquil.187. Guayaquil State University.188. Obstetrics College of the State University.189. Mariana de Jesus Maternity.190. Guayaquil Hospital191. Municipal Social Development Office.192. Cantonal Council for Childhood and Adolescents
193. Ministry of Health194. Food and Agriculture Organization FAO195. Social Development Foundation FUNDESO196. National Institute of Development forWomen
ISDEMU197. Salvadorian Institute of Social Development ISSS198. PAHO El Salvador199. SalvadorianWomen Organization ORMUSA200. UNDP El Salvador201. University of El Salvador UES202. University Research Co. LLC URC203. HIV Unit Ministry of Health204. Nutrition Unit Ministry of Health205. INTERVIDA206. Plan El Salvador207. Save the Children208. University Jose Matias Delgado209. Centre for Supporting Breastfeeding - CALMA
210. Ministry of Health211. IBFAN ArabWorld212. Egyptian Lactation Consultants Association (ELCA)213. UNICEF
214. National Food and Nutrition Centre, Ministry ofHealth
215. UNICEF Fiji216. Consumer Council of Fiji217. International Labour Organisation, Fiji Office218. National Advisory Committee on AIDS219. IBFAN Oceania
220. National Nutrition Agency (NaNA)221. Department of State for Health and SocialWelfare
i. Reproductive and Child Health Unitii. Regional HealthTeam
10. CHINA
11. COLOMBIA
12. COSTA RICA
13. DOMINICAN REPUBLIC
14. ECUADOR
15. EL SALVADOR
16. EGYPT
17. FIJI
18. GAMBIA
94Are our babies falling through the gaps?
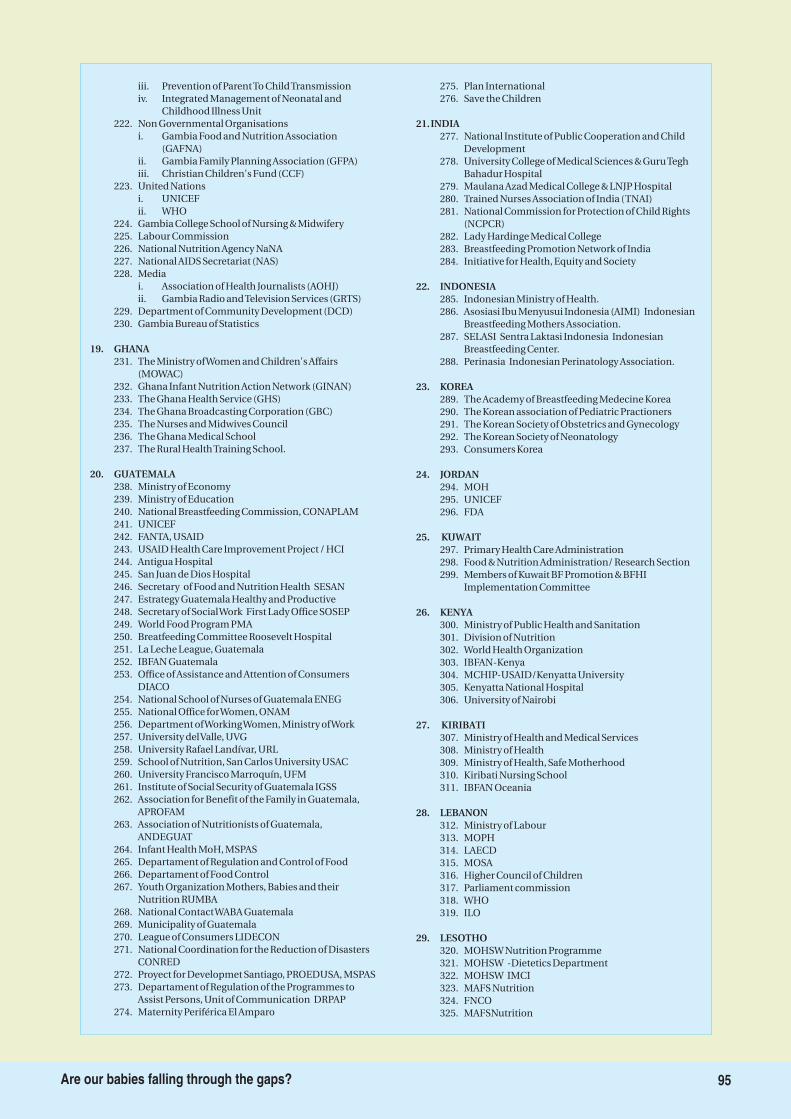
iii. Prevention of ParentTo ChildTransmissioniv. Integrated Management of Neonatal and
Childhood Illness Unit222. Non Governmental Organisations
i. Gambia Food and Nutrition Association(GAFNA)
ii. Gambia Family Planning Association (GFPA)iii. Christian Children's Fund (CCF)
223. United Nationsi. UNICEFii. WHO
224. Gambia College School of Nursing & Midwifery225. Labour Commission226. National Nutrition Agency NaNA227. National AIDS Secretariat (NAS)228. Media
i. Association of Health Journalists (AOHJ)ii. Gambia Radio andTelevision Services (GRTS)
229. Department of Community Development (DCD)230. Gambia Bureau of Statistics
231. The Ministry ofWomen and Children's Affairs(MOWAC)
232. Ghana Infant Nutrition Action Network (GINAN)233. The Ghana Health Service (GHS)234. The Ghana Broadcasting Corporation (GBC)235. The Nurses and Midwives Council236. The Ghana Medical School237. The Rural HealthTraining School.
238. Ministry of Economy239. Ministry of Education240. National Breastfeeding Commission, CONAPLAM241. UNICEF242. FANTA, USAID243. USAID Health Care Improvement Project / HCI244. Antigua Hospital245. San Juan de Dios Hospital246. Secretary of Food and Nutrition Health SESAN247. Estrategy Guatemala Healthy and Productive248. Secretary of SocialWork First Lady Office SOSEP249. World Food Program PMA250. Breatfeeding Committee Roosevelt Hospital251. La Leche League, Guatemala252. IBFAN Guatemala253. Office of Assistance and Attention of Consumers
DIACO254. National School of Nurses of Guatemala ENEG255. National Office forWomen, ONAM256. Department ofWorkingWomen, Ministry ofWork257. University delValle, UVG258. University Rafael Landívar, URL259. School of Nutrition, San Carlos University USAC260. University Francisco Marroquín, UFM261. Institute of Social Security of Guatemala IGSS262. Association for Benefit of the Family in Guatemala,
APROFAM263. Association of Nutritionists of Guatemala,
ANDEGUAT264. Infant Health MoH, MSPAS265. Departament of Regulation and Control of Food266. Departament of Food Control267. Youth Organization Mothers, Babies and their
Nutrition RUMBA268. National ContactWABA Guatemala269. Municipality of Guatemala270. League of Consumers LIDECON271. National Coordination for the Reduction of Disasters
CONRED272. Proyect for Developmet Santiago, PROEDUSA, MSPAS273. Departament of Regulation of the Programmes to
Assist Persons, Unit of Communication DRPAP274. Maternity Periférica El Amparo
275. Plan International276. Save the Children
277. National Institute of Public Cooperation and ChildDevelopment
278. University College of Medical Sciences & GuruTeghBahadur Hospital
279. Maulana Azad Medical College & LNJP Hospital280. Trained Nurses Association of India (TNAI)281. National Commission for Protection of Child Rights
(NCPCR)282. Lady Hardinge Medical College283. Breastfeeding Promotion Network of India284. Initiative for Health, Equity and Society
285. Indonesian Ministry of Health.286. Asosiasi Ibu Menyusui Indonesia (AIMI) Indonesian
Breastfeeding Mothers Association.287. SELASI Sentra Laktasi Indonesia Indonesian
Breastfeeding Center.288. Perinasia Indonesian Perinatology Association.
289. The Academy of Breastfeeding Medecine Korea290. The Korean association of Pediatric Practioners291. The Korean Society of Obstetrics and Gynecology292. The Korean Society of Neonatology293. Consumers Korea
294. MOH295. UNICEF296. FDA
297. Primary Health Care Administration298. Food & Nutrition Administration/ Research Section299. Members of Kuwait BF Promotion & BFHI
Implementation Committee
300. Ministry of Public Health and Sanitation301. Division of Nutrition302. World Health Organization303. IBFAN-Kenya304. MCHIP-USAID/Kenyatta University305. Kenyatta National Hospital306. University of Nairobi
307. Ministry of Health and Medical Services308. Ministry of Health309. Ministry of Health, Safe Motherhood310. Kiribati Nursing School311. IBFAN Oceania
312. Ministry of Labour313. MOPH314. LAECD315. MOSA316. Higher Council of Children317. Parliament commission318. WHO319. ILO
320. MOHSW Nutrition Programme321. MOHSW -Dietetics Department322. MOHSW IMCI323. MAFS Nutrition324. FNCO325. MAFSNutrition
19. GHANA
20. GUATEMALA
21.INDIA
22. INDONESIA
23. KOREA
24. JORDAN
25. KUWAIT
26. KENYA
27. KIRIBATI
28. LEBANON
29. LESOTHO
95Are our babies falling through the gaps?
326. UNICEF-Health & Nutrition327. BCMC-L328. EGPAF329. IBFAN Africa
330. Ministry of Health ( Nutrition Unit)331. Heath Information Management System332. Office of the President and cabinet ,the department of
Nutrition, HIV and AIDS333. Kamuzu Central Hospital
334. Ministry of Health & Family335. Centre for Community Health & Disease Control
(CCHDC )336. Maldives Food & Drug Authority
321. AC MAT Mexico322. IBFAN Mexico323. LLL Mexico
324. Ministry of social welfare and labour (ILO project)325. Ministry of Health (Child health, Nutrition, maternal
health, MIS)326. Public health Institute327. WHO, Mongolia328. Maternal and Child Health Research center329. Mongolian Paediatric association330. Mongolian Midwifery association331. Health Science University of Mongolia (Dep-t of
pediatrics, Der-t of family medicine )332. Child and adolescent support center NGO
333. Ministry of Health334. Department of Nutrition335. Health Department forWomen and Child336. Lawyer Advisor's Cabinet
337. Nepal Breastfeeding Promotion Forum (NEBPROF)338. Nepal Paediatric Society (NEPAS)339. Perinatal Society of Nepal (PESON)340. Department of Child Health, IOM341. Maharajganj Nursing Campus, IOM342. TUTeaching Hospital343. Nutrition Section, Child Health Division344. Kanti Children's Hospital345. Bhabisya Nepal346. Terredes Homes347. Democracy for Election Alliance348. Stupa College of Nursing349. Mother and Infant Research Activity (MIRA)
350. Ministry of Health351. Ministry of the Family352. Ministry of Agriculture MAG-FOR353. Integral Attention of Nicaraguan Children Program -
AIN354. Integral Attention ofWomen Program AIN355. Community Program of Health and Nutrition -
PROCOSAN356. National Program of Micronutrients357. National Program of Breastfeeding358. Attention forVulnerable Groups Program359. WFP Nicaragua360. National Program for Eradication of Infant Chronic
Malnutrition 2008-2015361. Politecnic University - UPOLI362. National Breastfeeding Commission CONALAMA363. Breastfeeding Counselors Network
364. Infant Community Kitchens Friends of Mothers andChildren CICO
365. National system for the Prevention, Mitigation andAttention of Disasters
366. Information System of the Government of NationalUnity SIGRUN
367. Ministry of Health368. Ministry of Law, Justices and Human right369. Ministry of Planning370. The National Nutrition Program371. The MNCH program372. The national Program for Family Planning and
Primary Health Care373. Provincial Health departments of all four provinces.374. Pakistan Paediatric Association375. Public Health Specialist376. USAID377. PAIMAN378. UNICEF379. WHO380. Save the children US381. Save the children UK
382. Ministry of Health383. Ministry of Education384. Ministry ofWork and Promotion of Employment385. Ministry ofWomen386. Center for Social Studies and Publication CESIP387. IBFAN Peru388. Multisectorial Commission for the Promotion,
Protection and Support of Breastfeeding389. Institute for the Defense of the Competence and
Protection of Intellectual Property (INDECOPI)390. IBCLC Consultants
391. Department of Health (DOH)392. UNICEF393. WHO394. ARUGAAN395. Trade Union Congress of the Philippines (TUCP)
Women's Desk
396. Ministry of Health397. Medical Research Institute398. WHO399. UNICEF400. Health Education Bureau401. AIDS Control Prog.402. World Bank403. SarvodayaWomen's Movement404. Nutrition Department, MRI
405. Ministry of Health406. Ministry of Education407. Ministry of Agriculture and Fisheries408. WFP409. WHO410. UNICEF411. International Medical Assistance412. Chamber of Commerce
413. Ministry of Health414. IBFAN ArabWorld415. International Board Certified Lactation Consultant
(IBCLC)
416. Ministry of Health
30. MALAWI
31. MALDIVES
32. MEXICO
33. MONGOLIA
35. NEPAL
36. NICARAGUA
37. PAKISTAN
38. PERU
39. PHILIPPINES
40. SRI LANKA
41. SAOTOME & PRINCIPE
42. KINGDOM OF SAUDI ARABIA
43. SWAZILAND
34. MOZAMBIQUE
96Are our babies falling through the gaps?
417. Ministry of Agriculture418. Children's Coordinating Unit419. National Nutrition Council420. UNICEF421. WHO422. WorldVision423. Action against Hunger424. IBFAN Africa425. EGPAF426. SINAN
427. ChineseWomen Consumers Association (CWCA)428. Chinese Dietetic Society (Taiwan)429. Taiwan Academy of Breastfeeding.
430. Ministry of Public Health431. Department of Health432. Thai Breastfeeding Center Foundation
433. Ministry of Health434. World Food Programme435. Save the Children in Uganda436. IBFAN Uganda
437. Ministry of Labor and Social Security.438. National Directorate of Employment.439. Uruguayan Network to Support Nutrition and Infant
Development RUANDI.440. International Baby Food Action Network IBFAN
Uruguay.441. Social Security Bank.442. Master in Nutrition UCUDAL.443. Committee on Nutrition of the Pediatrics Uruguayan
Society and Pediatrics Deputy Prof.444. MYSU-Women and Health in Uruguay.445. MSP - Food Department.446. UNICEF's Communication Area.447. UNDP Development Project School of Nutrition and
Dietetics.
448. Uruguayan Network of Milk Banks449. Breastfeeding Committee Pediatrics Uruguayan
Society.450. Montevideo Municipality.451. Gender Department PIT-CNT.452. Primary Care Network ASSE.
453. Ministry of Popular Power for Health454. National Breastfeeding Programme455. Faculty of Medicine Central University ofVenezuela456. School of Nutrition and Diet Central University of
Venezuela457. National Director of Health Programmes Ministry of
Health458. National Director of Attention to Mothers, Children
and Adolescents459. IBFANVenezuela
460. Heath Mother and Child Department, MoH461. National Obstetric Hospital462. National Paediatrics Hospital463. Communication and Health Education department464. UNICEFVietnam465. National Institute of Nutrition466. LIGHT467. CEPHAD
468. Ministry of Health469. National Food and Nutrition Commission470. Natural Resources Development College
471. National Nutrition Unit, Ministry of Health and ChildWelfare
472. UNICEF473. Harare City Health474. GOAL Zimbabwe475. SAVE the Children UK
44. TAIWAN
45. THAILAND
46. UGANDA
47. URUGUAY
48. VENEZUELA
49. VIETNAM
50. ZAMBIA
51. ZIMBABWE
97Are our babies falling through the gaps?
Methods to DeriveColour Coding/Rating
Each indicator of WBT has its specific
significance. As mentioned earlier there
are 10 indicators related to policies and
programmes, and five that deal with infant
feeding practices.
The WBT process does not
undertake primary household surveys.
i
i
The indicators that deal with policies and
programmes have each a subset of criteria or
questions that go into finer details of the
achievements or gaps, to indicate how a country
is performing in a particular area. Each
question has a possible score of 0-3 and the
indicator has a maximum score of 10.
Achievement is measured on a scale of 10. In
this assessment several methods are used such
as reading and analysis of policy document or
personal interviews.
Five indicators dealing with infant and young
child feeding practices reveal how effectively a
country has implemented its policies and
programmes. For these indicators, countries
have to use secondary numerical data on each
indicator from a random household survey that
is national in scope.
The maximum score for indicators dealing with
programmes and policies is 100, and for those
dealing with feeding practices is 50, giving an
overall total of 150.
The level of achievement on each indicator is
rated on a scale to provide a colour- rating i.e.
Red, Yellow , Blue or Green.
In the case of 10 policy and programme
indicators, the WBT ratings are given as ‘Green’
for the best achievement and ‘Red’ for the least
achievement; the tool uses 30%, 30-60%, and 60-
90% or above 90% to provide colour rating from
Red, to yellow, to Blue to Green in ascending
order. Each subset question has been assigned a
particular 'score'. Achievement of each indicator
is a total of these scores and is given after the
assessment has been completed with
consensus.
In the case of the 5 indicators of IYCF practices,
the method of the cut-off points for each level of
achievement was adapted from the WHO tool,
where they were selected systematically, based
on an analysis of past achievements on these
indicators in developing countries. In the WHO
tool, the ratings were developed based on an
analysis of percentages achieved by countries on
the various indicators. The results from each
country were rated from the lowest to the
highest, using the Excel software programme.
The results were then divided into five parts. The
i
98Are our babies falling through the gaps?
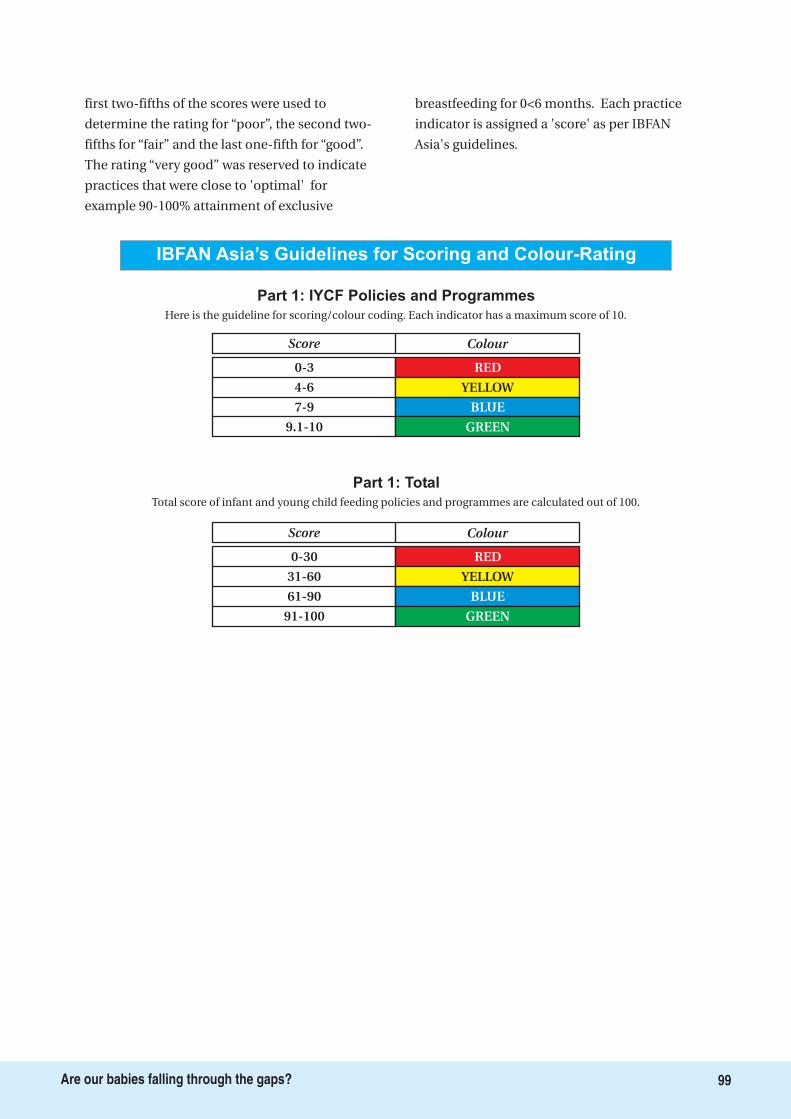
first two-fifths of the scores were used to
determine the rating for “poor”, the second two-
fifths for “fair” and the last one-fifth for “good”.
The rating “very good” was reserved to indicate
practices that were close to 'optimal' for
example 90-100% attainment of exclusive
breastfeeding for 0<6 months. Each practice
indicator is assigned a 'score' as per IBFAN
Asia's guidelines.
IBFAN Asia’s Guidelines for Scoring and Colour-Rating
Part 1: IYCF Policies and Programmes
Here is the guideline for scoring/colour coding. Each indicator has a maximum score of 10.
Score Colour
0-3
4-6
7-9
9.1-10
RED
YELLOW
BLUE
GREEN
Part 1: Total
Total score of infant and young child feeding policies and programmes are calculated out of 100.
Score Colour
0-30
31-60
61-90
91-100
RED
YELLOW
BLUE
GREEN
99Are our babies falling through the gaps?
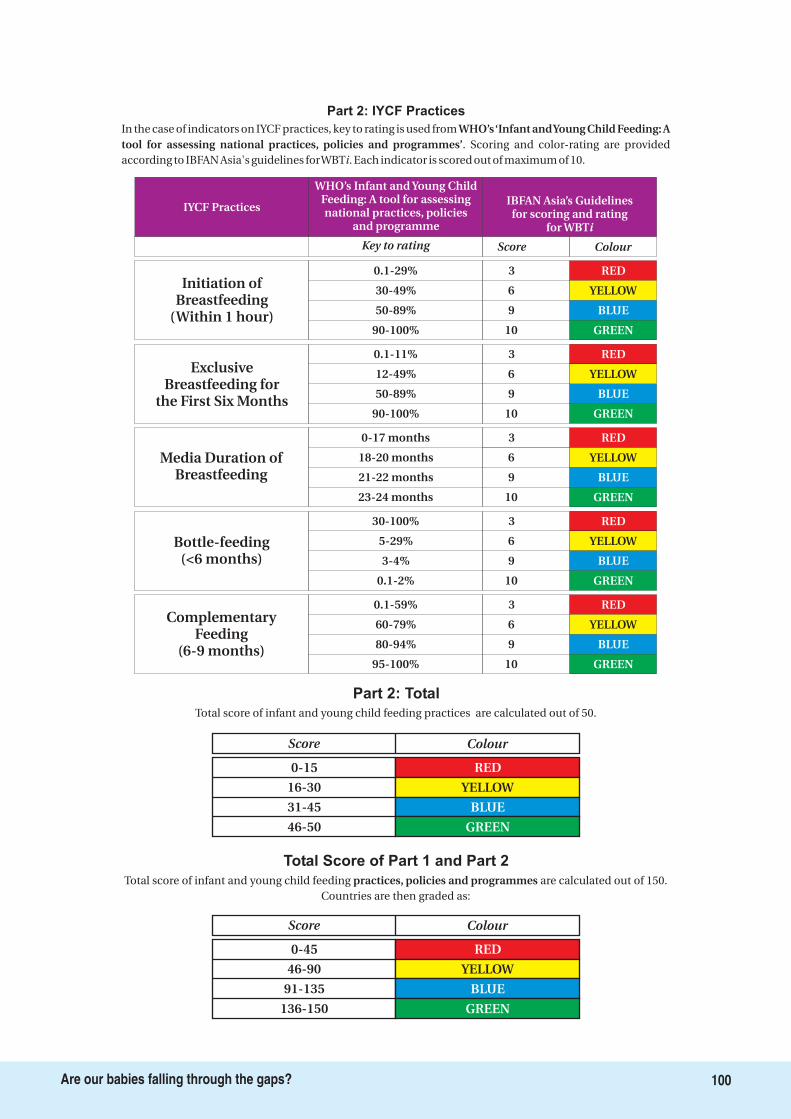
30-100%
5-29%
3-4%
0.1-2%
3
6
9
10
Bottle-feeding(<6 months)
0.1-59%
60-79%
80-94%
95-100%
3
6
9
10
ComplementaryFeeding
(6-9 months)
0-17 months
18-20 months
21-22 months
23-24 months
3
6
9
10
Media Duration ofBreastfeeding
0.1-11%
12-49%
50-89%
90-100%
3
6
9
10
ExclusiveBreastfeeding for
the First Six Months
IYCF Practices
WHO’s Infant and Young ChildFeeding: A tool for assessingnational practices, policies
and programme
IBFAN Asia’s Guidelinesfor scoring and rating
for WBTi
Key to rating Score
0.1-29%
30-49%
50-89%
90-100%
3
6
9
10
Initiation ofBreastfeeding
(Within 1 hour)
Part 2: IYCF Practices
In the case of indicators on IYCF practices, key to rating is used from. Scoring and color-rating are provided
according to IBFAN Asia's guidelines forWBT . Each indicator is scored out of maximum of 10.
WHO’s‘Infant andYoung Child Feeding: Atool for assessing national practices, policies and programmes’
i
Part 2: Total
Total score of infant and young child feeding practices are calculated out of 50.
Score Colour
0-15
16-30
31-45
46-50
RED
YELLOW
BLUE
GREEN
Total Score of Part 1 and Part 2
Total score of infant and young child feeding are calculated out of 150.Countries are then graded as:
practices, policies and programmes
Score Colour
0-45
46-90
91-135
136-150
RED
YELLOW
BLUE
GREEN
RED
RED
BLUE
GREEN
Colour
RED
YELLOW
BLUE
GREEN
YELLOW
RED
YELLOW
BLUE
GREEN
RED
YELLOW
BLUE
GREEN
YELLOW
BLUE
GREEN
100Are our babies falling through the gaps?
Bibliography
1. Aidam BA, Perez-Escamilla R, Lartey A. Lactationcounseling increases exclusive breast-feeding ratesin Ghana. J Nutr. 2005;135:1691-5.
2. Allain A, Kean Y. The Youngest Market, the babyFood Peddlers Undermine Breastfeeding,Multinational Monitor. July August 2008.
3. Anderson AK, Damio G, Young S, Chapman DJ,Perez-Escamilla R. A randomized trial assessing theefficacy of peer counseling on exclusivebreastfeeding in a predominantly Latina low-income community. Arch Pediatr Adolesc Med.2005;159:836-41.
4. Bahl R. et al. Infant feeding patterns and risks ofdeath and hospitalization in the first half of infancy:multicentre cohort study. BullWHO2005; 83:418-426.
5. Bhandari N, Bahl R, Mazumdar S, Martines J, BlackRE, Bhan MK, Infant Feeding Study Group. Effect ofcommunity-based promotion of exclusivebreastfeeding on diarrhoeal illness and growth: acluster randomised controlled trial. Lancet.2003;361:1418-23
6. Bhutta ZA, Ahmed T, Black RE, Dewey SCK,Giugliani E, Haider BA et al. What works?Interventions for maternal and child undernutritionand survival. Lancet 2008; 371(9610): 417-40.
7. Borrel A, Taylor A, McGrath M, Seal A, Hormann E,Phelps L, Mason F. From Policy to Practice:Challenges in Infant Feeding in Emergencies duringthe Balkan crisis. Disasters 2001; 25(2):149-63.
8. Cesar G Victora, Linda Adair, Caroline Fall, Pedro CHallal, Reynaldo Martorell, Linda Richter, HarshpalSingh Sachdev, “Maternal and child undernutrition:consequences for adult health and human capital” ,Maternal and Child Undernutrition 2. Lancet Serieson Maternal and Child Undernutrition” 2008.
9. Chan, Margaret et al. “Meeting the Demand forResults and Accountability: a Call for Action onHealth Data from Eight Global Health Agencies” inPLoS Medicine, Volume 7, Issue 1, January 2010.
10. Chapman DJ, Damio G, Young S, Perez-Escamilla R.
Effectiveness of breastfeeding peer counseling in alow-income, predominantly Latina population: arandomized controlled trial. Arch Pediatr AdolescMed. 2004;158:897-902.
11. Colombo Declaration on Infant and Young ChildFeeding. http://ibfanasia.org/SABPF-6/Colombo-declaration-IYCF.pdf accessed on August 9, 2010.
12. Creek T, Arvelo W, Kim A, Lu L, Bowen A, FinkbeinerT, Zaks L, et al. Role of Infant feeding and HIV in aSevere Outbreak of Diarrhea and Malnutritionamong Young Children, Botswana, 2006. Session 137Poster Abstracts, Conference on Retroviruses andOpportunistic Infections, Los Angeles, 25-28February, 2007.http://www.retroconference.org/2007/Abstracts/29305.htm. Last accessed on 24the July 2010.
13. Darmstadt GL, Bhutta ZA, Cousens S, Adam T,Walker N, de BL. Evidence-based, cost-effectiveinterventions: how many newborn babies can wesave? Lancet 2005; 365: 977-988.
14. Dearden K, Altaye M, De Maza I, De Oliva M, Stone-Jimenez M, Burkhalter BR, Morrow AL. The impactof mother-to-mother support on optimal breast-feeding: a controlled community intervention trialin peri-urban Guatemala City, Guatemala. RevPanam Salud Publica. 2002;12:193-201.
15. Gupta A. INTERNATIONAL OBLIGATIONS FORINFANTS' RIGHT TO FOOD Global Obligations forthe Right to Food Ed. George Kent Rowman &Littlefield Publishers NY .
16. Haider R, Ashworth A, Kabir I, Huttly SR. Effect ofcommunity-based peer counsellors on exclusivebreastfeeding practices in Dhaka, Bangladesh: arandomised controlled trial. Lancet. 2000;356:1643-7.
17. Horton R. Maternal and child undernutrition: anurgent opportunity. Lancet 2008; 371 (9608): 179
18. Horton S, Sanghvi T, Phillips M, Fiedler J, Perez-Escamilla R, Lutter C, Rivera A, Segall-Correa AM.Breastfeeding promotion and priority setting in
101Are our babies falling through the gaps?
health. Health Policy Plan. 1996;11:156-68
19. Infant and young child feeding in emergencies.Operational guidance for emergency relief staff andprogramme managers. Version 2.1 February 2007.Available at:http://www.ennonline.net/pool/files/ife/ops-guidance-2-1-english-010307.pdf. Last accessed on24th July 2010.
20. Infant and Young Child Feeding Programme Review:Consolidated Report of Six-Country Review ofBreastfeeding Programmes. AED, UNICEF, 2010.Available athttp://www.unicef.org/nutrition/files/IYCF_Booklet_April_2010_Web.pdf. Accessed on 6 August 2010.
21. Innocenti Declaration on Infant and Young ChildFeeding 2005. Available at:http://www.unicef.org/nutrition/files/innocenti2005m_FINAL_ARTWORK_3_MAR.pdf accessed onAugust 9, 2010.
22. Jennifer Bryce, Denise Coitinho, Ian Darnton-Hill,David Pelletier, Per Pinstrup-Andersen,” Maternaland child undernutrition: effective action atnational level”, Lancet Series on Maternal and ChildUndernutrition” 2008
23. Jones G, Steketee RW, Black RE, Bhutta ZA, Morris SS, and the Bellagio Child Survival Study Group. Howmany child deaths can we prevent this year? Lancet2003; 362: 65-71
24. Morrow AL, Guerrero ML, Shults J, Calva JJ, Lutter C,Bravo J, Ruiz-Palacios G, Morrow RC, Butterfoss FD.Efficacy of home-based peer counselling to promoteexclusive breastfeeding: a randomised controlledtrial. Lancet. 1999;353:1226-31
25. Multinationals Break Vietnam Law in Formula Sales.http://www.irrawaddy.org/highlight.php?art_id=16820&page=2. Accessed 12 May 2010
26. Perez-Escamilla R, Maradiaga A, Lopez C. Study onthe coverage of the network of community breastfeeding counselors in El Progreso, Honduras.Technical Report, USAID, Washington DC; 1998
27. Perez-Escamilla R, Pollitt E, Lonnerdal B, Dewey KG.Infant feeding policies in maternity wards and theireffect on breast-feeding success: an analyticaloverview. Am J Public Health. 1994;84:89-97.
28. Rafael Pérez-Escamilla, Evidence Based Breast-Feeding Promotion: The Baby-Friendly HospitalInitiative, The American Society for Nutrition J. Nutr.137:484-487, February 2007
29. Tracking Progress in Maternal, Newborn & ChildSurvival. The 2008 Report. Countdown to 2015.Maternal, Newborn & Child Survival. UNICEF, 2008.pg vi. Available at:http://www.countdown2015mnch.org/reports-publications/2008report (1 October 2009)
30. UNICEF November 2009. Tracking Progress on Childand Maternal Malnutrition: A survival anddevelopment priority. Available at:
http://www.unicef.org/publications/files/Tracking_Progress_on_Child_and_Maternal_Nutrition_EN_110309.pdf accessed on August 9, 2010.
31. UNICEF. Nutrition Security and Emergencies.http://www.unicef.org/nutrition/index_emergencies.html. Last accessed on 24th July 2010.
32. United Nations Department of Economic and SocialAffairs (DESA) June 2010. The MillenniumDevelopment Goals Report 2010. Available at:http://www.un.org/millenniumgoals/pdf/MDG%20Report%202010%20En%20r15%20-low%20res%2020100615%20-.pdf accessed onAugust 9, 2010.
33. Victora C. Nutrition in early life: a global priority.Lancet 2009; 374 (9696): 1123-1125.
34. WHO, “Infant and Young Child Feeding: A tool forassessing national practices, policies andprogrammes” published in 2003, available athttp://www.who.int/nutrition/publications/infantfeeding/en/index.html and the Global Strategy forInfant and Young Child Feeding, available athttp://www.who.int/nutrition/publications/infantfeeding/9241562218/en/index.html
35. WHO. Guidelines on HIV and infant feeding. 2010.Principles and recommendations for infant feedingin the context of HIV and a summary of evidence.Available at:http://www.who.int/child_adolescent_health/documents/9789241599535/en/index.html. assessed onAugust 9, 2010.
36. WHO. World Health Statistics 2009. Available at:http://www.who.int/whosis/whostat/2009/en/index.html. Accessed on October 3, 2009.
37. WHO/UNICEF 2010. Countdown to 2015 decadereport (20002010): taking stock of maternal,newborn and child survival. Available at:http://www.countdown2015mnch.org/reports-publications/2010-report. Accessed on August 9,2010.
38. WHO/UNICEF. Global Strategy for Infant and YoungChild Feeding, World Health Organization (WHO),2002. Available at: http://www.who.int/child-adolescenthealth/NUTRITION/global_strategy.htm. Accessedon September 14 2009.
39. World Alliance for Breastfeeding Action.Http://www.waba.org.my
40. World Breastfeeding Trends Initiative (WBTi).Http://worldbreastfeedingtrends.org/
41. Zulfiqar A Bhutta, Tahmeed Ahmed, Robert E Black,Simon Cousens, Kathryn Dewey, Elsa Giugliani,Batool A Haider, Betty Kirkwood, Saul S Morris, H PS Sachdev, Meera Shekar, “What works?Interventions for maternal and child undernutritionand survival”, Maternal and Child Undernutrition 3,Lancet Series on Maternal and ChildUndernutrition” 2008 .
102Are our babies falling through the gaps?
About IBFAN andgBICS
About IBFAN
About gBICS
The International Baby Food Action Network,
IBFAN, consists of public interest groups working
around the world to reduce infant and young
child morbidity and mortality. IBFAN aims to
improve the health and well-being of babies and
young children, their mothers and their families
through the protection, promotion and support
of breastfeeding and optimal infant feeding
practices. IBFAN works for universal and full
implementation of the International Code and
Resolutions.
The global Breastfeeding Initiative for Child
Survival is a worldwide civil society-driven
initiative aiming to accelerate progress in
attaining the health-related Millennium
Development Goals (MDGs) by 2015, especially
Goal 4, reduction of child mortality, by scaling up
early, exclusive and continued breastfeeding. The
Goal of the gBICS Programme is to ensure that
breastfeeding protection, promotion and support
be further recognised as a key intervention to
reduce child mortality and improve children's
health. The Purpose of the gBICS Programme is
to contribute to reduction in child malnutrition
and improvement in infant and young child
survival, health and development through
improved infant feeding practices.
The gBICS is a joint programme with the two
largest organisations of breastfeeding advocates:
the International Baby Food Action Network,
IBFAN and the World Alliance for Breastfeeding
Action, WABA. Before taking action, the gBICS
conducts an important evaluation to establish a
participatory process to assess the situation of
breastfeeding in a country and establish
priorities using the World Breastfeeding Trends
Initiative(WBTi). The WBTi uses innovative web-
based technology as well as the participatory
involvement of key actors to press for effective
policies and programmes at national level.
103Are our babies falling through the gaps?
BP-33, PITAMPURA, DELHI-110034, INDIA
Phone: +91-11-27343608, 42683059 Tel/Fax:+91-11-27343606
Email: [email protected], Website: www.worldbreastfeedingtrends.org/
Breastfeeding Promotion Network of India (BPNI)/
International Baby Food Action Network (IBFAN), Asia
The International Baby Food Action Network (IBFAN) is the 1998 Right Livelihood Award Recipient. It
consists of more than 200 public interest groups working around the world to save lives of infants and young
children by working together to bring lasting changes in infant feeding practices at all levels. IBFAN aims to
promote the health and well being of infants and young children and their mothers through protection,
promotion and support of optimal infant and young child feeding practices. IBFAN works for the universal
and full implementation of ' ' and subsequent
relevant .
International Code of Marketing of Breastmilk Substitutes
World Health Assembly (WHA) resolutions
PUBLISHED BY:
World Breastfeeding TrendsInitiative (WBT )i
Related Documents


