i The William Wrigley Jr. Company March 2, 2015 TEAM 10 Enoch Lau - UID 2012532603 Romina Ferreira- UID 3035212559 David Dang - UID 3035131121 Jaromir Sida -UID 3035129831 Lisha Fan – UID 3035213060

Welcome message from author
This document is posted to help you gain knowledge. Please leave a comment to let me know what you think about it! Share it to your friends and learn new things together.
Transcript

i
The William Wrigley Jr.Company
March 2, 2015
TEAM 10
Enoch Lau - UID 2012532603
Romina Ferreira- UID 3035212559
David Dang - UID 3035131121
Jaromir Sida -UID 3035129831
Lisha Fan – UID 3035213060

2

CONTENTS
EXECUTIVE SUMMARY.................................................................................................3
ACTIVE INVESTOR STRATEGY....................................................................................... 3
INTERNAL ANALYSIS: WILLIAM WRIGLEY JR. COMPANY..................................... .................4
EXTERNAL ANALYSIS: THE BRANDED CONSUMER FOODS AND CANDY INDUSTRY........ .............5
SUBSECTOR ANALYSIS: FUNCTIONAL CONFECTIONERY AND GUM SECTOR..........................5
WRIGLEY’S CAPITAL STRUCTURE...................................................................................6
RESTRUCTURING: INCREASE THE DEBT EQUITY RATIO........................................... .......6
IMPACT OF RECAPITALIZATION.............................................................................. ...... 7
BASICASSUMPTIONS.....................................................................................7
DETERMINING WRIGLEY’S FAIRVALUE................................................................7
ESTIMATING VALUE OF INTANGIBLEASSETS.........................................................7
3
KEY INDICATORS UNDER INDIVIDUAL SCENARIOS.......................................................;.......8
WACC BEFORE AND AFTER RECAPITALIZATION
VOTING CONTROL BY THE WRIGLEY FAMILY
RECOMMENDATION
APPENDICIES
APPENDIX 1
APPENDIX 2
APPENDIX 3
APPENDIX 4
APPENDIX 5
APPENDIX 6
APPENDIX 7
EXECUTIVE SUMMARY
As Susan Chandler, associate at Aurora Borealis, the followingoutlines analyses and recommendations to Wrigley’s board of directorson a leveraged recapitalization. The conclusions arrived at in thisreport will illustrate the effects of a leveraged recapitalization onWrigley’s outstanding shares, book value of equity, price per share ofstock, earnings per share, debt interest coverage ratios and financialflexibility, and voting control. In addition, the report will analyzethe impact of the recapitalization on the company’s WACC.
4

ACTIVE INVESTOR STRATEGY
Blanka Dobrynin, managing partner of Aurora Borealis, founded thecompany to pursue an “active-investor” strategy. This approach allowsthe firm to identify companies that could benefit from capitalrestructuring then investing heavily in the stock of the targetcompany. Furthermore, Aurora Borealis must convince management and theboard that the restructuring will allow the company and itsshareholders to realize value.
Currently, Wrigley has no debt on its balance sheet. Through heractive investor strategy, Dobrynin wants to create a significantfinancial value from changing Wrigley’s capital structure. Byincreasing the company’s debt-to-equity ratio, value could potentiallybe created from the interest tax shield, which would in turn affectvoting control, earnings per share, share price, and financialflexibility.
INTERNAL ANALYSIS: WILLIAM WRIGLEY JR. COMPANY
Wrigley is a manufacturer and distributor of chewing gum. Based inDelaware, the company created in 1891 is a recognized global leader inthe confectionary field and its products are sold in over 180
5
countries to over 3,000 customers. Its product portfolio consists ofbrands such as Juicy Fruit and Wrigley’s Spearmint. Wrigley’s shareprice has significantly outperformed the S&P index and has appreciatedhigher than its peer group over the past few years.
Wrigley is a mature, stable company with low capital requirements. Ithas leading market share in the industry and has enjoyed net incomeand revenue growth higher than GDP. In 2001, Wrigley’s net income was$362,986,000 and has grown 10.3% over the previous year. In 2000 theincrease was $20,759 or 7%, and in 1999 it was of $3,682. In addition,its revenue in 2001 was $2,429,646,000 and has grown 13.2% over theprevious year. Its earnings per share has increased by $0.12 or 11% in2000 and $0.16 or 9% in 2001, along with a steady dividend payoutincrease of $0.04 and $0.045 per share in 2000 and 2001, respectively.
Despite being 111 years old, Wrigley still remains innovative bycontinually introducing new products with various benefits toconsumers, such as breath freshening and tooth whitening. The companyhas also maintained an active in-house research and developmentprogram. The success of their innovative efforts can be shown throughnew product sales growth, which has been increasing year over year.New product sales increased net sales by 10% and 6% in 2001 and 2000,respectively, and accounted for 19.6% and 16.2% of net sales in 2001and 2000, respectively. Since Bill Wrigley became CEO in 1999, thispercentage has grown almost by double, being 10% that year.
Currently, Wrigley has no long-term debt and a market value of equityof $13.1 billion. It has available a $100 million, unsecured, line ofcredit which had no borrowings during 2001. Its current ratio in 2001was 2.7, which signifies that the firm has enough current assets topay off its current liabilities over the next 12 months. Wrigley’scash flow from operations was $390,491,000 in 2001 and $448,283,000 in2000 due to greater working capital requirements as a result ofincreased sales in 2001, combined with reduced working capital in2000. Its healthy cash flow from operations indicates that it is ableto generate sufficient positive cash flow to maintain and grow itsoperations. Next year’s expenditures on property, plant and equipment
6
are forecast to remain at 2001 levels and will be funded fromoperating cash flow. 1
Overall, Wrigley is a healthy, growing company with a continued focuson innovation, strong brand name and favorable product portfolio. Withbrand value and customer contracts as intangible assets, these mayincrease the company’s value. Wrigley is currently well positioned totake on debt and perform a leveraged recapitalization. Blanka Dobryninbelieves that by taking on capital restructuring, value can be createdfor the company and its shareholders.
EXTERNAL ANALYSIS: THE BRANDED CONSUMER FOODS AND CANDY INDUSTRY
Wrigley operates in the branded consumer foods and candy industry,which is fiercely competitive and dominated by a few large players.The industry has experienced a 2-year revenue CAGR of 10%, reflectingnew product innovation and foreign expansion. Wrigley competesdirectly with major confectionary players such as Cadbury Schweppes,Hershey Foods, Kraft Foods and Tootsie Roll Industries.
Wrigley is the third largest company by market capitalization in itspeer group. In the industry, the average long-term debt is $2.9billion and the average long-term debt to market capitalization is9.9%, compared with Wrigley’s $0 in long-term debt. Average industryEPS is $1.65, which is slightly higher than Wrigley’s EPS of $1.61.Average price-to-earnings ratio is 19.6x, compared with Wrigley’s29.3x, implying that Wrigley’s stock is more expensive relative to itspeers. The average cash dividend per share is $0.59, lower thanWrigley’s $0.75 per share. Overall, Wrigley is sitting on par1 Wrigley Annual Report 2001, http://media.corporate-ir.net/media_files/irol/92/92701/reports/annual_2001.pdf
7

financially with most of the industry averages apart from its leverageand P/E ratios.
SUBSECTOR ANALYSIS: FUNCTIONAL CONFECTIONERY AND GUM SECTOR
Wrigley is the leader of the functional confectionery and gum sectorin the confectionery industry. Companies in this industry manufacturefoods rich in carbohydrates and sugar with a functional benefit likedental care gum. Functional products include power mints, sugar-freegum and medicated confectionery and its consumers are mainly adults.
From 1998 to 2001, functional confectionery volumes grew at an averagerate of 5% per annum. In developing markets this growth is evenhigher, on average 6% per annum between 1998 and 2001. Moreover, theretail value for power mints, sugar-free gum and medicatedconfectionery was estimated at $10 billion in 2001, representing the10% of the whole market. 2
Taking into account sugarised gum, sugarfree gum and bubblegum, theretail value of this market was $12.3 billion in 2001. Sugarfree gumdemand growth, between 1998 and 2001, was 7%, showing the demand forfunctional confectionery. This implies companies are making R&Dinvestments and have high brand recognition. Adams, a Pfizersubsidiary, is Wrigley’s follower in this sector, with a 25% of theglobal market share. 3
WRIGLEY’S CAPITAL STRUCTURE
The mixture between long term debt and equity that the firm uses tofinance their operations is actually 100% equity. The financial2 3
http://www.flex-news-food.com/files/CadburySchweppesAcquisitionAdamsCircular_13022003.pdf3
8

managers have been very conservative through the history of thecompany when it comes to decide the best ratio debt to equity, whichaffects the risk and valuation of the firm, and also the leastexpensive sources of funds for the firm. Despite Wrigley being ahealthy and growing company, leverage could magnify both, thepotential rewards to shareholders and the potential financial problemsand risk of business failure.
RESTRUCTURING: INCREASE THE DEBT EQUITY RATIO
The capital structure of a company should be the one that maximizesthe value of the firm. As the WACC is the discount rate of the firmvalue, the optimal capital structure would be the one that minimizesthe WACC.
As mentioned before, Wrigley´s has no debt in its capital structure.However, financing with debt has some benefits over financing withequity. It is a tradeoff decision between the debt against it costs.
First of all, the interest paid is tax deductible, therefore takinginto account the discounted cash flows generated by the deductibletax, the present value of the firm leveraged will exceed the value ofthe unleveraged firm. WACC is also affected by the deductible tax, andfinancial risk could increase, affecting the cost of equity. Moreover,large-mature companies can take benefit of its lower financialdistress costs, the costs than a company which is having trouble tomeet its obligation has, like increased borrowing costs oradministrative costs in the bankrupcy procedure. 4
When making capital decisions, the company’s managers should have moreinformation than an investor, generating asymmetric information. BeingWrigley, a company that has never issued debt, it could be seen as agood signal for the investors, since the value of the corporationcould increase because of tax shields as mentioned before, andtherefore the price of the stock could increase. In addition, it can
4Graham, John; Harvey, Campbell, How Do Cfos Make Capital Budgeting And Capital Structure decisions?, Journal of Applied Corporate Finance,2002.
9

be a signal for the investors of the board’s confidence that the moveis profitable, and that the current stock price is undervalued.Furthermore, issuing debt could imply having an investment bank as aninsider monitoring the company, which can have access to moreinformation than the investors. 5 This is why the market usually reactspositively to the announcement of the firm leverage increasing.Finally, it could be viewed as a tactic to retain control and to makethe company less attractive to potential buyers. This is because bybuying back shares, management would gain more ownership.
IMPACT OF RECAPITALIZATION
The main decision Wrigley would face should it decide to undergo therecapitalization is whether to pay out the proceeds in form of specialdividends or to do a major share repurchase. The ultimate decisionaffects both shareholders and the company so it should not be takenlightly. In order to decide which option is optimal for Wrigley weshould first investigate the hypothetical change in the company’smarket value and impact on other key financial indicators.
BASIC ASSUMPTIONS
Susan and Blanka have decided to focus on the assumption that Wrigleycould borrow $3bn at rate associated with a credit rating between Band BB. Given Wrigley’s current and forecasted financial performancesuch credit rating sounds reasonable but other options shall bediscussed too.
It is further assumed that the company’s current cost of capital is10.11% (see Appendix 1). Moreover, it also equals its cost of equitywhich in turn represents a good estimate of the cost of unlevered5Chen, Li-ju, How the Pecking-Order Theory Explain Capital Structure, The Journal of International Management Studies, 2010
10
equity which will be later used in the post-recapitalization valuationof the company.
DETERMINING WRIGLEY’S FAIR VALUE
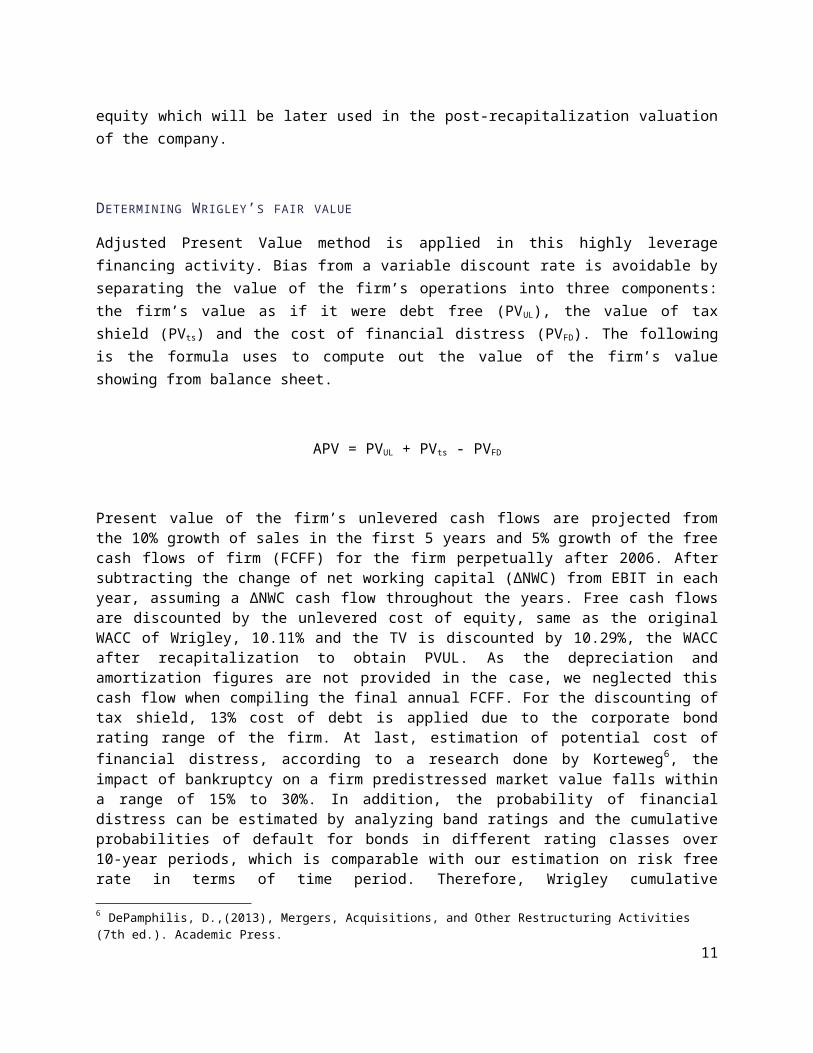
Adjusted Present Value method is applied in this highly leveragefinancing activity. Bias from a variable discount rate is avoidable byseparating the value of the firm’s operations into three components:the firm’s value as if it were debt free (PVUL), the value of taxshield (PVts) and the cost of financial distress (PVFD). The followingis the formula uses to compute out the value of the firm’s valueshowing from balance sheet.
APV = PVUL + PVts - PVFD
Present value of the firm’s unlevered cash flows are projected fromthe 10% growth of sales in the first 5 years and 5% growth of the freecash flows of firm (FCFF) for the firm perpetually after 2006. Aftersubtracting the change of net working capital (ΔNWC) from EBIT in eachyear, assuming a ΔNWC cash flow throughout the years. Free cash flowsare discounted by the unlevered cost of equity, same as the originalWACC of Wrigley, 10.11% and the TV is discounted by 10.29%, the WACCafter recapitalization to obtain PVUL. As the depreciation andamortization figures are not provided in the case, we neglected thiscash flow when compiling the final annual FCFF. For the discounting oftax shield, 13% cost of debt is applied due to the corporate bondrating range of the firm. At last, estimation of potential cost offinancial distress, according to a research done by Korteweg6, theimpact of bankruptcy on a firm predistressed market value falls withina range of 15% to 30%. In addition, the probability of financialdistress can be estimated by analyzing band ratings and the cumulativeprobabilities of default for bonds in different rating classes over10-year periods, which is comparable with our estimation on risk freerate in terms of time period. Therefore, Wrigley cumulative
6 DePamphilis, D.,(2013), Mergers, Acquisitions, and Other Restructuring Activities (7th ed.). Academic Press.
11
probability of distress lies on 19.63% and the impact of bankruptcy is20% of its predistressed market value. (See Appendix 2)
To conclude, adjusted present value of the firm is $7,197,154,000.(see Appendix 3)
ESTIMATING VALUE OF INTANGIBLE ASSETS
By looking at Wrigley’ financial statements we infer that a bigportion of its market value originates from its intangible assets7. Asthese are not accounted for on the balance sheet it only make sense totry to estimate the possible value which is attributable to theintangible assets. For this purpose we have decided to value thecompany using the adjusted present value method considering the sameset of assumptions that will later be used for calculating the post-recapitalization value. Specifically, we assume 10% growth of salesfor the first 5 years and relatively modest 5% growth of the free cashflows for the firm thereafter. Following this approach we get a valueof the company $6,371,417,000 (the value is based purely on theexpected growth of the company given its current earnings generatingability). Based on this assumption and knowing that the market valueis much higher the we can value the intangible asset by taking thedifference between the above calculated value and the marketcapitalization to get a value of $6,731,283 which we attribute to theintangible assets. We also make a simplifying assumption that thisvalue remains constant over years.
7 Mainly brand name, but also market share, technical know-how and a good management team.
12
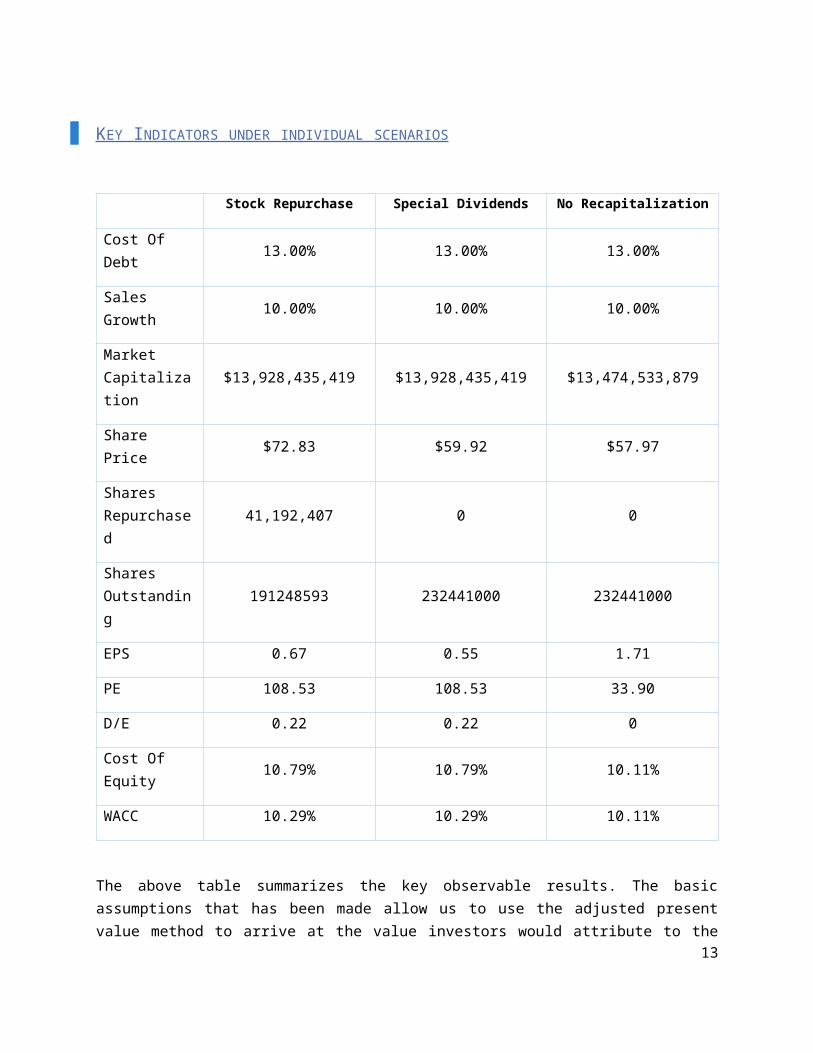
KEY INDICATORS UNDER INDIVIDUAL SCENARIOS
Stock Repurchase Special Dividends No Recapitalization
Cost Of Debt 13.00% 13.00% 13.00%
Sales Growth 10.00% 10.00% 10.00%
Market Capitalization
$13,928,435,419 $13,928,435,419 $13,474,533,879
Share Price $72.83 $59.92 $57.97
Shares Repurchased
41,192,407 0 0
Shares Outstanding
191248593 232441000 232441000
EPS 0.67 0.55 1.71
PE 108.53 108.53 33.90
D/E 0.22 0.22 0
Cost Of Equity 10.79% 10.79% 10.11%
WACC 10.29% 10.29% 10.11%
The above table summarizes the key observable results. The basicassumptions that has been made allow us to use the adjusted presentvalue method to arrive at the value investors would attribute to the
13

cash generating ability of the company (See appendix 2). Adding thatvalue to the value of the intangible assets calculated earlier anddeducing the cost of financial distress then yields the expectedmarket value of the company.
IMPACT ON MARKET CAPITALIZATION
Both share repurchase and paying out special dividends does howeveraffect the market value only indirectly, that is, through thededuction in taxes. None of the debt proceeds are reinvested in thecompany and therefore no new tangible value is created. Despite ofthat there is still in both cases a significant increase in the marketvalue originating from the change in capital structure totaling nearly$454 million. This figure could be even higher but the contribution ofthe debt tax shield is offset by the cost of financial distress andthe increased cost of capital.
IMPACT ON THE SHARE PRICE AND SHARES OUTSTANDING
The recapitalization is also significantly reflected in the shareprice. However, while the share price rises only marginally whenspecial dividends are paid out, it skyrockets when the debt proceedsare used for stocks repurchase. This is an expectable outcome as thebuyback decrease the number of outstanding shares while increasestheir price at the same time.
In case of share repurchase the new share price must reflect the factthat those who decide to sell and those who decide to hold mustreceive the same benefit. In other words, the final price of the sharemust be $72.83. This is the minimum price for which any rationalinvestor would be willing to sell the stock (see Appendix 4). Thecalculation of the share price in the dividend payout scenario is mucheasier as the total number of share remains unchanged and thereforethe share price increase comes purely from the increase in the marketcapitalization. Hence the share price rises by $1.96 to $59.92 (seeAppendix 5).
14
Using the new stock prices, the new number of shares outstanding cannow be calculated. Because paying out special dividends does notaffect the number of shares at all, the only change occurs under therepurchase repurchase scenario when 41,192,407 shares are bought backand withdrawn from circulation. It is only reasonable to assume thatthe repurchase is not targeting Class B holders so the change is fullyprojected into the common shares outstanding.
IMPACT ON EPS AND P/E
One of the most visible impact of the recapitalization is in thechange of earnings per share and the price-earning ratio. From the EPScomparison of repurchase and dividend payout strategy the repurchasestrategy comes out as a winner. This is mainly because while theearnings remain the same in both instances, the number of sharesoutstanding is lower under the repurchase scenario. However, whatmight be surprising is that the P/E ratio is unchanged in both cases.This is given by the fact that the difference in EPS is preciselyoffset by the change in the share price. the difference between thesetwo strategies is however however negligible in comparison to the no-recapitalization case. In both of the earlier cases the EPS dropssignificantly signalling to investors that the company is notgenerating much profits on the money invested by shareholders. That iscertainly not a message Wrigley would like to send to its investors.The sharp increase in the P/E ratio can be offset by a hypotheticalstock split. For example by conducting a 1 for 3 split in therepurchase scenario the P/E could be brought down to 36.23 however atthe price of further decreasing EPS.
IMPACT ON D/E
Raising debt necessarily affect the D/E ratio, which, in Wrigley’scase, is magnified by the complete absence of debt in its capitalstructure. From the industry analysis became apparent that the averageD/E ratio is around 10% whereas Susan is suggesting more than a double
15
of that value. Even though Wrigley’s finance seems to be in a goodstate having such a high D/E in an industry where exists such asignificant difference the book and market value of a company bringsabout a number of issues as already discussed earlier. We will discussthis issues even further in the financial flexibility part and thelater also in the our final recommendation.
IMPACT ON COST OF CAPITAL
The discussion has so far focused the impact of the change but it isimportant to notice that this change comes at a certain cost. The costis in this case reflected in the increase of the cost of capital. Theoriginal cost of unlevered capital and thus also the cost of capitalas such is 10.11%. There is a slight increase of 0.18% after therecapitalization which follows from the introduction of the debt intothe capital structure. Part of the change is then directlyattributable to the difference in the cost of debt and equityfinancing and part of it to the higher cost of equity which is nowlevered and thus considered riskier (Appendix 6).
VARIOUS SCENARIOS
Since our analysis is based on several assumptions, it is a commonpractice to model the situation under various circumstances to see howdoes the outcome change if any of the key variables changes. Wedecided that two key inputs in our model are the cost of debt and theexpected sales growth and we modelled the situation using what webelieve is the best, the most likely and the worst case scenario. Thismodelling then show the power of financial leverage as the good andbad cases are magnified a great deal when leverage is present but itare relatively less volatile otherwise (see Appendix 8)
16

WACC BEFORE AND AFTER RECAPITALIZATION
WACC before recapitalization
For calculating WACC we need to first calculate cost of equity. We ignore cost of debt since Wrigley bears no long-term debt. Hence the cost of capital would equal to cost of equity. The cost of equity is derived from CAPM formula. We assume the risk free rate to be 10yr Treasury bond rate of 4.86%, the market risk premium at 7% and company beta at 0.75 (company has no debt so it doesn’t makesense to use industry beta). Using CAPM we get the cost of equity or WACC of 10.11%.
WACC after recapitalization
WACC will have to account for cost of debt since Wrigley’s taking up $3bn debt. There are several factors that will affect calculation of WACC after recapitalization:
1. Cost of debt – We need to reflect the higher risk from debt financing. The determination of credit rating for Wrigley after recapitalization is subjective. The recommendation is tocalculate the financial ratios presented in Exhibit 6 for Wrigley and see to which credit rating we fit in. Blanka chosea yield of 13% by interpolating between BB and B rated corporate bond yields of 12.75% and 14.66% respectively. Usingthis cost of debt, we then can calculate EBIT interest coverage, which is one of the indicators that determines the credit rating for the company. The following table presents projected interest expense, EBIT and EBIT interest coverage for Wrigley for 5 following years after 2001:
Interest 390,000 390,000 390,000 390,000 390,000EBIT 799,263 731,623 669,667 612,920 560,950EBIT 2.04939248 1.87595663 1.71709414 1.57159082 1.438332624
17
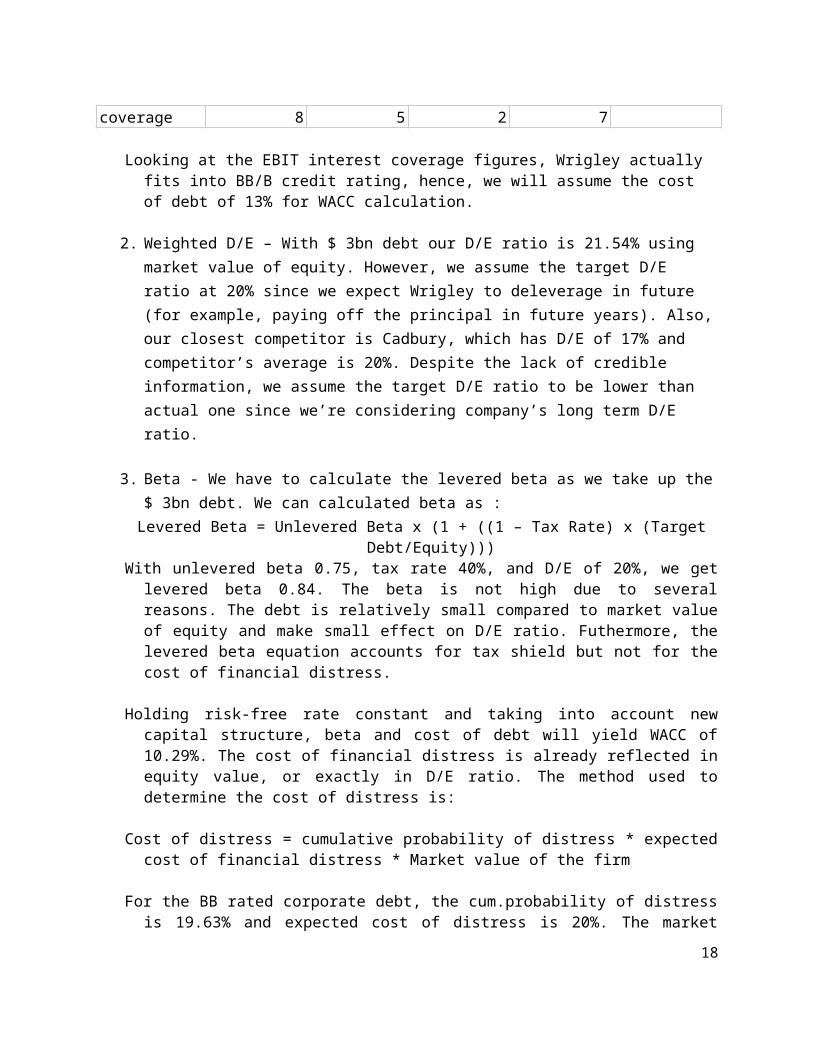
coverage 8 5 2 7
Looking at the EBIT interest coverage figures, Wrigley actually fits into BB/B credit rating, hence, we will assume the cost of debt of 13% for WACC calculation.
2. Weighted D/E – With $ 3bn debt our D/E ratio is 21.54% using market value of equity. However, we assume the target D/E ratio at 20% since we expect Wrigley to deleverage in future (for example, paying off the principal in future years). Also,our closest competitor is Cadbury, which has D/E of 17% and competitor’s average is 20%. Despite the lack of credible information, we assume the target D/E ratio to be lower than actual one since we’re considering company’s long term D/E ratio.
3. Beta - We have to calculate the levered beta as we take up the$ 3bn debt. We can calculated beta as : Levered Beta = Unlevered Beta x (1 + ((1 – Tax Rate) x (Target
Debt/Equity)))With unlevered beta 0.75, tax rate 40%, and D/E of 20%, we get
levered beta 0.84. The beta is not high due to severalreasons. The debt is relatively small compared to market valueof equity and make small effect on D/E ratio. Futhermore, thelevered beta equation accounts for tax shield but not for thecost of financial distress.
Holding risk-free rate constant and taking into account newcapital structure, beta and cost of debt will yield WACC of10.29%. The cost of financial distress is already reflected inequity value, or exactly in D/E ratio. The method used todetermine the cost of distress is:
Cost of distress = cumulative probability of distress * expectedcost of financial distress * Market value of the firm
For the BB rated corporate debt, the cum.probability of distressis 19.63% and expected cost of distress is 20%. The market
18
value of the firm is $ 13, 102 699bn. This yields the cost ofdistress at $ 514 412m (see Appendix 3). Summing this amountto market value of the firm we get market cap of $13,928435bnand we use this figure to determine the D/E ratio. Combining the costs of equity and debt with the revisedcapital weights yields a WACC of 10.29% which is similar toWACC before recapitalization. The company is riskier infinancial terms. Why doesn’t the WACC reflect this? The taxbenefit of using more debt is offsetting the higher cost ofequity. We tried to estimate the cost of financial distress inthe capital structure of the firm but there are other methodsof determining the cost of financial distress.
VOTING CONTROL BY THE WRIGLEY FAMILY
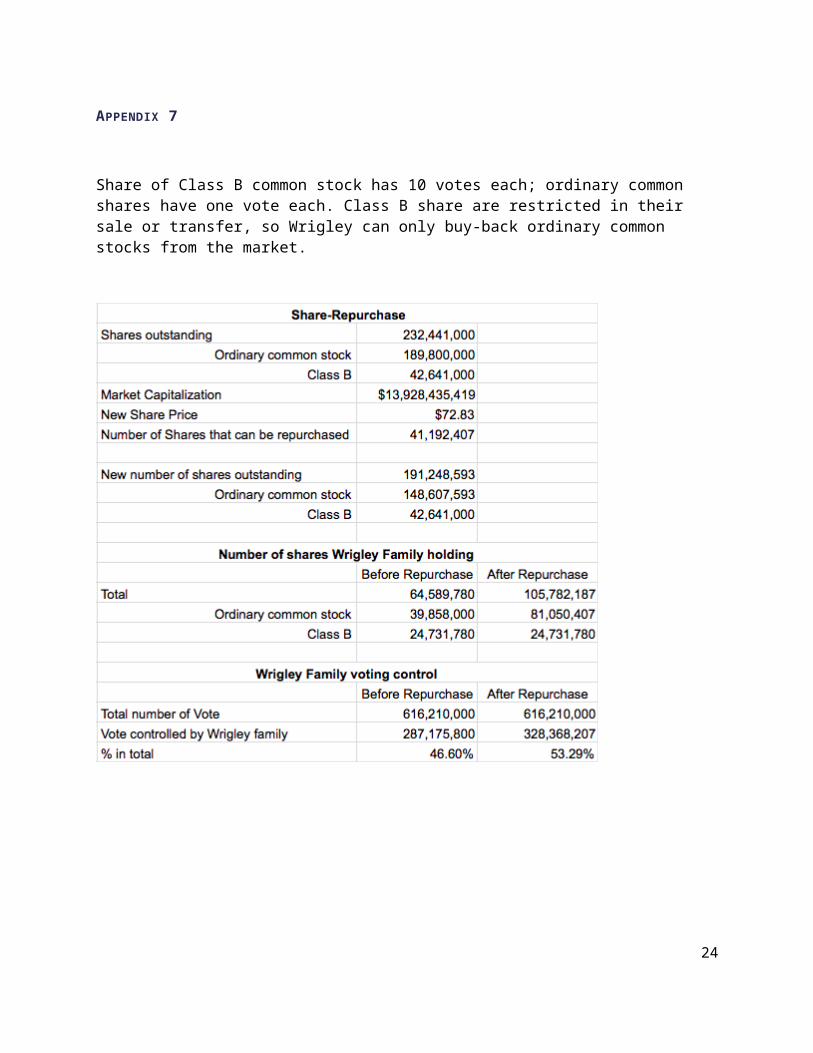
After repurchasing 41,192,407 common stock from the market at $72.83, Wrigley family is holding 328.368 million votes, consist of81.05 million ordinary common stocks and 24.73 million Class B common stocks, representing 53.29% of total number of vote. The family gains 6.68% more votes than before. (See appendix 7)
RECOMMENDATION
EXECUTION FEASIBILITY
19
With no previous highly leverage activity happened before, Wrigley is now raising a debt of 3 billion which may come to a concern of feasibility. Although the raise of debt is beneficial by adding value to the firm as well as surging the share price to $72.83, solely issuing BB rating corporate bond to finance from capital market may not be sufficient to obtain all 3 billion under the inactive debt financing atmosphere. Market’s concern over their credibility can be explained by the comparably high D/E ratio, 21.54%, to the industry average after recapitalization, 9.94%. Therefore, Wrigley may considera mixed debt financing activities. For instance, issuing corporate bond to the market and having a debt portfolio from a bank syndicate.
CONCLUSION
The $454 million increase of market capitalization will be the first time for Wrigley to create significant value to the firm through repurchasing $3 billion worth common shares from the market by debt financing. Despite of the slightly higher D/E ratio induced, light should be shed on a long-term benefit to the expansion strategy of Wrigley in confectionary industry. By inflating the price of shares owned by the Wrigley family, who hold the majourity vote, future merger and acquisition activites can be benefited when making an equity-offer financing structure for exchanging target firm’s shares. Moreoever, repurchasing shares also indicating a bullish signal in themarket, showing the confidence towards the value of the firm, given that market value are more representable in reflecting both intangibleand tangile asset value.
In short, with the current strong financial status, sound business performance and abundant amount of retained earnings and asset, Wrigley should participate in this $3 billion leveraged recapitalization.
20

APPENDICIES
APPENDIX 1
The cost of capital is based on the following assumptions. The risk free rate is approximated by considering the yield of the 10-years U.S. Treasury bonds and the risk premium is 7% as suggested by Ms Chandler. Taking the unlevered beta of 0.75, which is provided by the Value LIne investment survey, the CAPM yields 10.11% as the cost of unlevered equity for Wrigley.
APPENDIX 2
FCFF = EBIT - ΔNet Working Capital + Depreciation and Amortization
21

APPENDIX 3
Cost of Financial Distress = 19.63% x 20% x $13,102,699,000 = $514,411,000
APPENDIX 4
The new share price is derived as follows:
Psell=MarketCapitalization
Sharesoutstanding−IssuedDebtPhold ❑
where Psell=Phold , the reasoning behind this is that if the price for which an investor sells the stock was lower than the price of the stock after the repurchase is done, nobody would sell their shares. Conversely if the repurchase price was higher than the final price, everybody would like to sell it and Wrigley would buy overpriced shares. Therefore the price has to be set so that nobody gains more than anybody else.
APPENDIX 5
22

Share price= NewMarketCapSharesoutstanding
=$13,928,435,419232,441,000
=$59.92
APPENDIX 6
Calculation of levered beta: Betalevered=Betaunlevered∗(1+(1+tc)DE
)
0.84=0.75∗¿
Cost of levered Equity ℜlevered=rf+Betalevered(riskpremium)
10.79=0.0486+0.84(0.07)
23
APPENDIX 7
Share of Class B common stock has 10 votes each; ordinary common shares have one vote each. Class B share are restricted in their sale or transfer, so Wrigley can only buy-back ordinary common stocks from the market.
24

APPENDIX 8
Best Case Most Likely Worst Case
Repurchase DividendsNo
Recapitalization
Repurchase DividendsNo
Recapitalization
Repurchase DividendsNo
Recapitalization
Cost OfDebt 12.75% 12.75% 13.00% 13.00% 13.00% 13.00% 14.66% 14.66% 13.00%
SalesGrowth 10.50% 10.50% 10.50% 10.00% 10.00% 10.00% 8.50% 8.50% 8.50%
Net Sales 2,684,759 2,684,759 2,684,759 2,672,611 2,672,611 2,672,611 2,636,166 2,636,166 2,636,166
Cost ofSales 1,099,363 1,099,363 1,099,363 1,099,363 1,099,363 1,099,363 1,099,363 1,099,363 1,099,363
GrossProfit 1,585,396 1,585,396 1,585,396 1,573,247 1,573,247 1,573,247 1,536,803 1,536,803 1,536,803
InterestExpense 382,590 382,590 0 390,000 390,000 0 439,890 439,890 0
Expenses 1,012,298 1,012,298 1,012,298 1,012,298 1,012,298 1,012,298 1,012,298 1,012,298 1,012,298
1

OperatingIncome 190,508 190,508 573,098 170,950 170,950 560,950 84,615 84,615 524,505
InvestmentIncome 18,869 18,869 18,869 18,869 18,869 18,869 18,869 18,869 18,869
OtherExpenses 3,830 3,830 3,830 3,830 3,830 3,830 3,830 3,830 3,830
EarningsBefore
Income Tax205,547 205,547 588,137 185,989 185,989 575,989 99,655 99,655 539,545
Income Tax 63,720 63,720 182,323 57,657 57,657 178,557 30,893 30,893 167,259
NetEarnings 141,828 141,828 405,815 128,333 128,333 397,433 68,762 68,762 372,286
MarketCapitaliza
tion
14,651,232,261
14,651,232,261
13,543,457,349
13,928,435,419
13,928,435,419
13,474,533,879
11,833,967,279
11,833,967,279
13,274,823,564
SharePrice 75.94 63.03 58.27 72.83 59.92 57.97 63.82 50.91 57.11
2
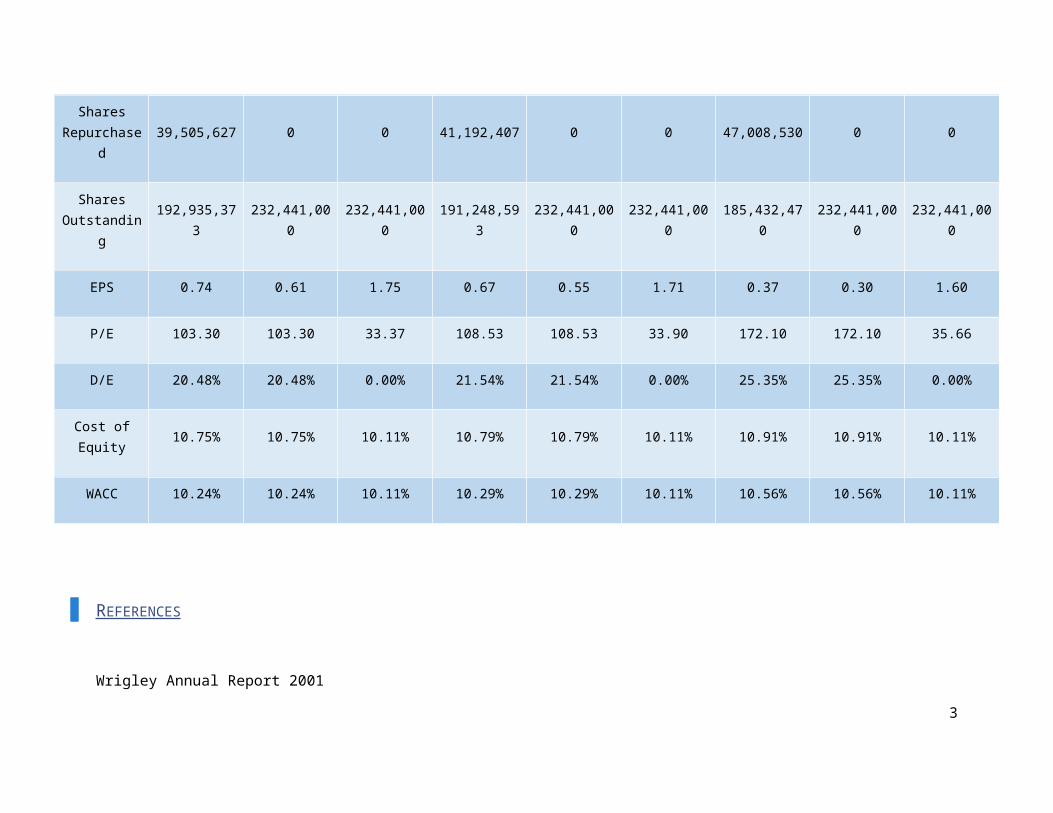
SharesRepurchase
d39,505,627 0 0 41,192,407 0 0 47,008,530 0 0
SharesOutstandin
g
192,935,373
232,441,000
232,441,000
191,248,593
232,441,000
232,441,000
185,432,470
232,441,000
232,441,000
EPS 0.74 0.61 1.75 0.67 0.55 1.71 0.37 0.30 1.60
P/E 103.30 103.30 33.37 108.53 108.53 33.90 172.10 172.10 35.66
D/E 20.48% 20.48% 0.00% 21.54% 21.54% 0.00% 25.35% 25.35% 0.00%
Cost ofEquity 10.75% 10.75% 10.11% 10.79% 10.79% 10.11% 10.91% 10.91% 10.11%
WACC 10.24% 10.24% 10.11% 10.29% 10.29% 10.11% 10.56% 10.56% 10.11%
REFERENCES
Wrigley Annual Report 2001
3
Wrigley Annual Report 2000
Cadbury Schweppes Adam’s Adquisition Circular for Extraordinary Assembly
Graham, John; Harvey, Campbell, How Do Cfos Make Capital Budgeting And Capital Structure decisions?, Journal of Applied Corporate Finance,2002.
Chen, Li-ju, How the Pecking-Order Theory Explain Capital Structure, The Journal of International Management Studies, 2010
DePamphilis, D.,(2013), Mergers, Acquisitions, and Other Restructuring Activities (7th ed.). Academic Press.
4

i
Related Documents