© 2004 Microsoft Corporation. All Rights Reserved. Study Commissioned by Microsoft, Conducted by Forrester Research, Inc., 2003. The Wide Range of Abilities and Its Impact on Computer Technology A Research Study Commissioned by Microsoft Corporation and Conducted by Forrester Research, Inc., in 2003 1

Welcome message from author
This document is posted to help you gain knowledge. Please leave a comment to let me know what you think about it! Share it to your friends and learn new things together.
Transcript
© 2004 Microsoft Corporation. All Rights Reserved. Study Commissioned by Microsoft, Conducted by Forrester Research, Inc., 2003.
The Wide Range of Abilities and Its Impact on Computer Technology
A Research Study Commissioned by Microsoft Corporation and Conducted by Forrester Research, Inc., in 2003
Forrester Oval program, Forrester Wave, WholeView, Technographics, TechStrategy, and TechRankings are trademarks of Forrester Research, Inc.Forrester Research, Inc., 400 Technology Square, Cambridge, MA 02139 USA +1 617/613-6000 Fax: +1 617/613-5000
Amsterdam • Austin • Frankfurt • London • San Francisco • Sydney • Tokyowww.forrester.com Email: [email protected]
1

© 2004 Microsoft Corporation. All Rights Reserved. Study Commissioned by Microsoft, Conducted by Forrester Research, Inc., 2003.
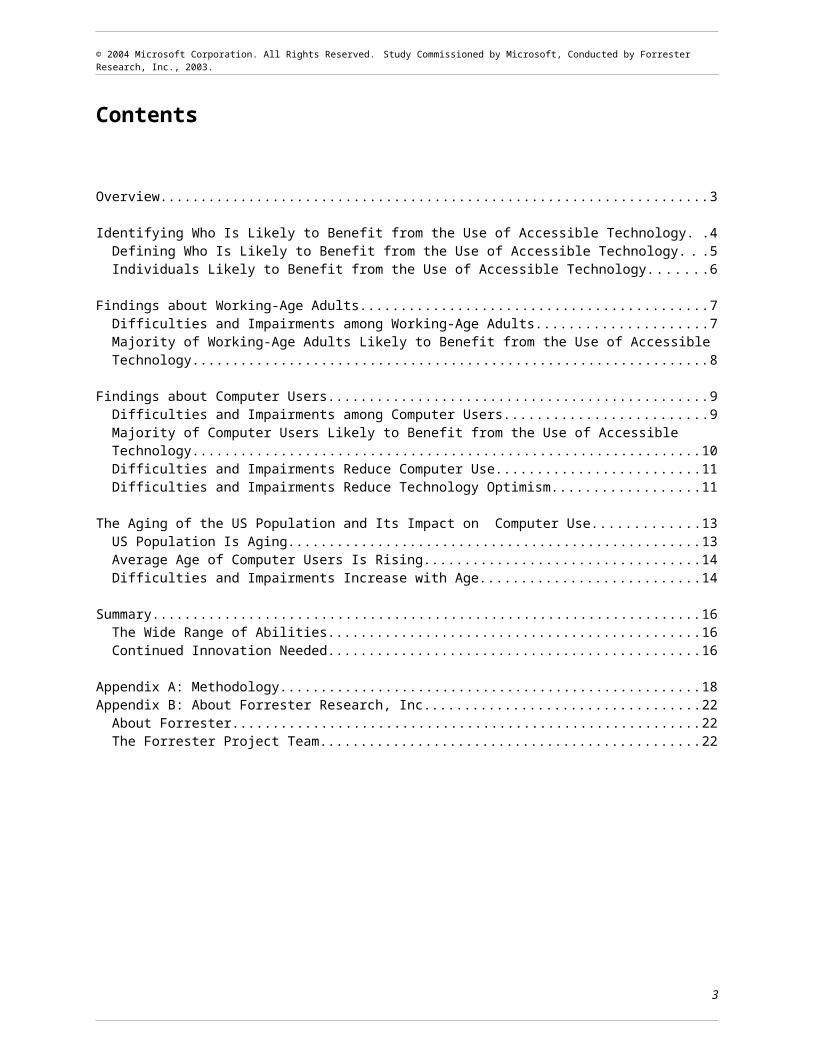
Contents
Overview...................................................................................................................................................... 3
Identifying Who Is Likely to Benefit from the Use of Accessible Technology...............................................4Defining Who Is Likely to Benefit from the Use of Accessible Technology..............................................5Individuals Likely to Benefit from the Use of Accessible Technology......................................................6
Findings about Working-Age Adults.............................................................................................................7Difficulties and Impairments among Working-Age Adults........................................................................7Majority of Working-Age Adults Likely to Benefit from the Use of Accessible Technology......................8
Findings about Computer Users.................................................................................................................. 9Difficulties and Impairments among Computer Users.............................................................................9Majority of Computer Users Likely to Benefit from the Use of Accessible Technology..........................10Difficulties and Impairments Reduce Computer Use.............................................................................11Difficulties and Impairments Reduce Technology Optimism..................................................................11
The Aging of the US Population and Its Impact on Computer Use...........................................................13US Population Is Aging.......................................................................................................................... 13Average Age of Computer Users Is Rising............................................................................................14Difficulties and Impairments Increase with Age.....................................................................................14
Summary................................................................................................................................................... 16The Wide Range of Abilities..................................................................................................................16Continued Innovation Needed...............................................................................................................16
Appendix A: Methodology.......................................................................................................................... 18Appendix B: About Forrester Research, Inc..............................................................................................22
About Forrester..................................................................................................................................... 22The Forrester Project Team.................................................................................................................. 22
2
© 2004 Microsoft Corporation. All Rights Reserved. Study Commissioned by Microsoft, Conducted by Forrester Research, Inc., 2003.
Overview
In 2003, Microsoft Corporation commissioned Forrester Research, Inc., to conduct a study to measure the potential market of people in the United States who are most likely to benefit from the use of accessible technology for computers. Accessible technology enables individuals to adjust their computers to meet their visual, hearing, dexterity, cognitive, and speech needs. It includes both accessibility options built into products as well as specialty hardware and software products (assistive technology products1) that help individuals interact with a computer.
The goals of this study were to identify the range of physical and cognitive abilities among working-age adults and current computer users in the United States, the types of difficulties and impairments that limit the scope of activities and their degree of severity, and the number of people who could potentially benefit from using accessible technology. This information, coupled with aging population trends, can help to explain the aging population's impact on computer use and need for accessible technology.
This report contains a summary of the study and presents its findings about individuals who are likely to benefit from the use of accessible technology. It also includes findings about working-age adults and computer users and presents data about the aging population in the US and its impact on computer use. This report concludes with statements about how these findings affect the information technology (IT) industry.
1 For more information about assistive technology products, see www.microsoft.com/enable/at/.
3

© 2004 Microsoft Corporation. All Rights Reserved. Study Commissioned by Microsoft, Conducted by Forrester Research, Inc., 2003.
Identifying Who Is Likely to Benefit from the Use of Accessible Technology
The main goal of this study was to identify the number of individuals who could potentially benefit from the use of accessible technology. The study was designed to identify individuals who have physical or cognitive difficulties or impairments that restrict their performance of daily tasks and determine who could most likely benefit from using accessible technology. The study identified individuals who considered themselves to have an impairment as well as those who did not but did report having difficulty performing daily tasks. This approach allowed the study to capture information about individuals who "self-identify" as having a disability or impairment as well as individuals who have difficulty with certain tasks but who do not identify themselves as having a disability or impairment.
The study consisted of a nationwide survey conducted by phone and mail. Participants were asked a range of questions designed to assess a variety of difficulties and impairments and degrees of severity to determine how they may impact the individual's use of computers.
The survey covered the five types of difficulties and impairments that would most likely impact computer use: visual, dexterity, hearing, speech, and cognitive.2 For each type of difficulty and impairment, the survey contained the following types of questions:
Difficulties with daily tasks to identify individuals who have difficulty performing daily tasks in each of the five types of difficulties and impairments.
Direct questions about impairments to assess the proportion of the population who self-identify as having an impairment.
Direct questions about impact on employment to allow individuals to communicate their assessment of the restrictions imposed by an impairment.
Participants were also asked a range of lifestyle and demographic questions. For more information about the study's methodology, see Appendix A: Methodology.
2 Cognitive difficulties and impairments refer to an inability to appropriately respond to information presented by sight or sound.
4

© 2004 Microsoft Corporation. All Rights Reserved. Study Commissioned by Microsoft, Conducted by Forrester Research, Inc., 2003.
Defining Who Is Likely to Benefit from the Use of Accessible Technology
Based on answers to the survey questions, survey respondents were placed into one of the following three groups according to the likelihood of benefiting from the use of accessible technology:
Not likely to benefit from the use of accessible technology due to no or minimal difficulties or impairments. This group includes:
Individuals who had trouble performing two or fewer daily tasks in a difficulty/impairment type only some of the time or who never had trouble with any assessed task.
Individuals who did not self-identify as having any type of impairment or report having a difficulty or impairment that impacts employment.
Likely to benefit from the use of accessible technology due to mild difficulties or
impairments. This group includes: Individuals who self-identified as having a difficulty/impairment that did not limit their
employment and daily life. Individuals who reported difficulty with more than one daily task3 within a particular
difficulty/impairment type some or most of the time.
Examples of mild difficulties and impairments include being slightly hard of hearing or having difficulty hearing conversation some, but not most, of the time and experiencing pain in hands, arms, or wrists that limits activities some, but not most, of the time. These individuals are likely to benefit from the ability to customize accessibility options built into software such as increasing font size, turning up volume on computers, and using keyboard shortcuts instead of a mouse.
Very likely to benefit from the use of accessible technology due to severe difficulties or impairments. This group includes:
Individuals who reported having an impairment that limits employment. Individuals who reported difficulty with all of the tasks within a difficulty/impairment type
some of the time and report having an impairment. Individuals who reported difficulty with most of the tasks within a difficulty/impairment type
most of the time.
Examples of severe difficulties and impairments include being blind or deaf, experiencing pain in the hands, arms, or wrists that limits activities most of the time, and having non-correctable vision problems that cause difficulty performing many vision-related tasks. These individuals are likely to benefit both from using the accessibility options built into software (as described above) as well as specialty assistive technology software and hardware designed for specific difficulties and impairments (such as screen readers and voice recognition software).
3 To ensure a conservative estimate, those who only reported some difficulty with one daily task in an impairment type were not included.
5

© 2004 Microsoft Corporation. All Rights Reserved. Study Commissioned by Microsoft, Conducted by Forrester Research, Inc., 2003.
Individuals Likely to Benefit from the Use of Accessible Technology
Figure 1 correlates the degree of severity of difficulties with the three groups of likelihood to benefit from the use of accessible technology—not likely, likely, and very likely:
Individuals who did not have difficulties or impairments, or who have only minimal difficulties, are not likely to benefit from the use of accessible technology.
Individuals who have mild or severe difficulties or impairments are likely or very likely to benefit from the use of accessible technology.
Figure 1: Incidence of Difficulties and Likelihood to Benefit from the Use of Accessible Technology
The remainder of this report focuses on the two groups of individuals who are likely or very likely to benefit from the use of accessible technology.
6
© 2004 Microsoft Corporation. All Rights Reserved. Study Commissioned by Microsoft, Conducted by Forrester Research, Inc., 2003.
Findings about Working-Age Adults
The findings in this section contain information about working-age adults in the US who range from 18 to 64 years old and are likely or very likely to benefit from the use of accessible technology due to mild or severe difficulties and impairments.
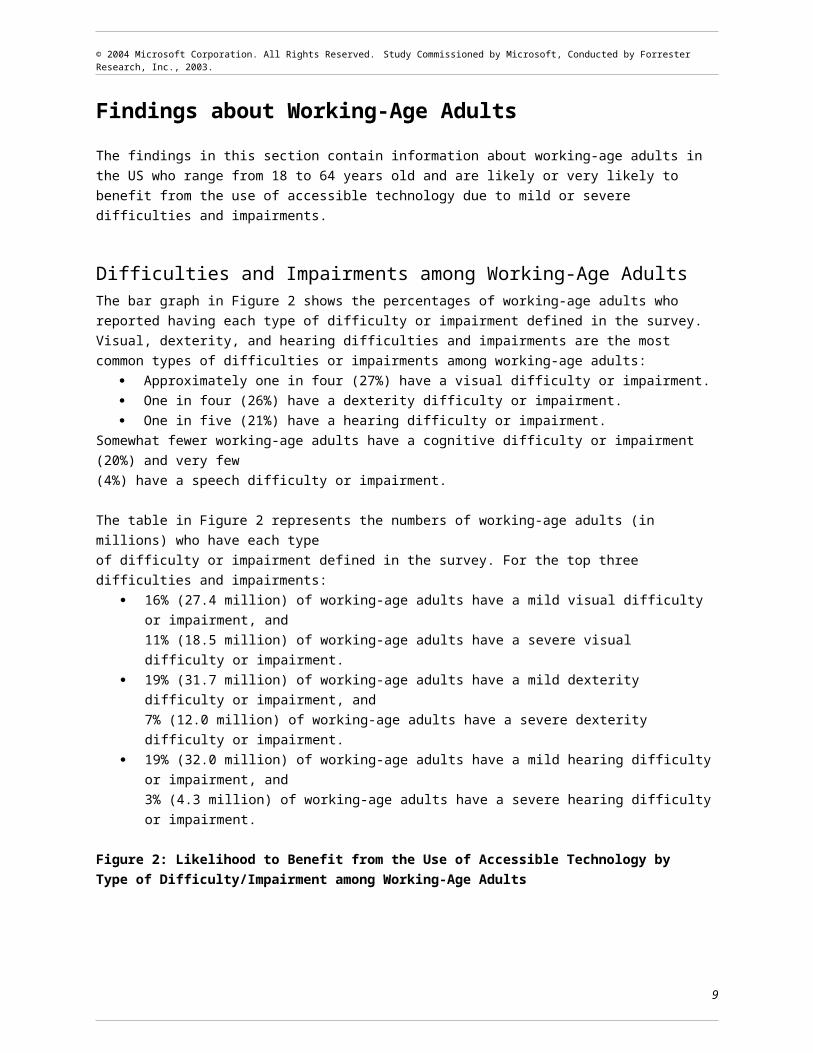
Difficulties and Impairments among Working-Age AdultsThe bar graph in Figure 2 shows the percentages of working-age adults who reported having each type of difficulty or impairment defined in the survey. Visual, dexterity, and hearing difficulties and impairments are the most common types of difficulties or impairments among working-age adults:
Approximately one in four (27%) have a visual difficulty or impairment. One in four (26%) have a dexterity difficulty or impairment. One in five (21%) have a hearing difficulty or impairment.
Somewhat fewer working-age adults have a cognitive difficulty or impairment (20%) and very few (4%) have a speech difficulty or impairment.
The table in Figure 2 represents the numbers of working-age adults (in millions) who have each type of difficulty or impairment defined in the survey. For the top three difficulties and impairments:
16% (27.4 million) of working-age adults have a mild visual difficulty or impairment, and 11% (18.5 million) of working-age adults have a severe visual difficulty or impairment.
19% (31.7 million) of working-age adults have a mild dexterity difficulty or impairment, and 7% (12.0 million) of working-age adults have a severe dexterity difficulty or impairment.
19% (32.0 million) of working-age adults have a mild hearing difficulty or impairment, and 3% (4.3 million) of working-age adults have a severe hearing difficulty or impairment.
Figure 2: Likelihood to Benefit from the Use of Accessible Technology by Type of Difficulty/Impairment among Working-Age Adults
7

© 2004 Microsoft Corporation. All Rights Reserved. Study Commissioned by Microsoft, Conducted by Forrester Research, Inc., 2003.
Majority of Working-Age Adults Likely to Benefit from the Use of Accessible Technology
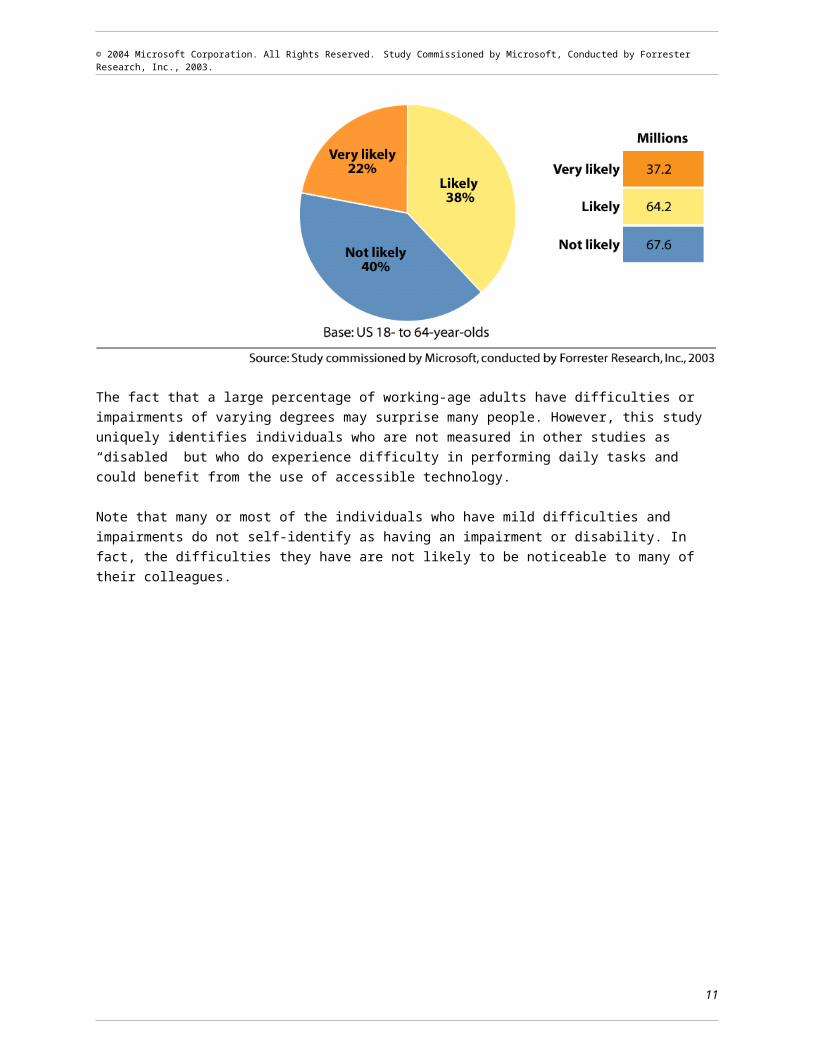
The findings in this study show that the majority of working-age adults are likely to benefit from the use of accessible technology. As shown in the chart in Figure 3, 60% (101.4 million) of working-age adults are likely or very likely to benefit from the use of accessible technology.
The chart in Figure 3 also shows the percentages of working-age adults who are likely or very likely to benefit from the use of accessible technology due to a range of mild to severe difficulties and impairments:
38% (64.2 million) of working-age adults are likely to benefit from the use of accessible technology due to a mild difficulties and impairments.
22% (37.2 million) of working-age adults are very likely to benefit from the use of accessible technology due to a severe difficulties and impairments.
40% (67.6 million) of working-age adults are not likely to benefit due to a no or minimal difficulties or impairments.
Figure 3: Majority of Working-Age Adults Likely to Benefit from the Use of Accessible Technology
The fact that a large percentage of working-age adults have difficulties or impairments of varying degrees may surprise many people. However, this study uniquely identifies individuals who are not measured in other studies as “disabled” but who do experience difficulty in performing daily tasks and could benefit from the use of accessible technology.
Note that many or most of the individuals who have mild difficulties and impairments do not self-identify as having an impairment or disability. In fact, the difficulties they have are not likely to be noticeable to many of their colleagues.
8
© 2004 Microsoft Corporation. All Rights Reserved. Study Commissioned by Microsoft, Conducted by Forrester Research, Inc., 2003.
Findings about Computer Users
This section contains information about working-age computer users in the United States (those who currently use computers either at home, at work, or both, who range from 18 to 64 years old). Information about computer users who are likely or very likely to benefit from the use of accessible technology due to mild or severe difficulties and impairments, the prevalence of different types of difficulties and impairments among computer users, and the impact that difficulties and impairments have on computer use is provided.
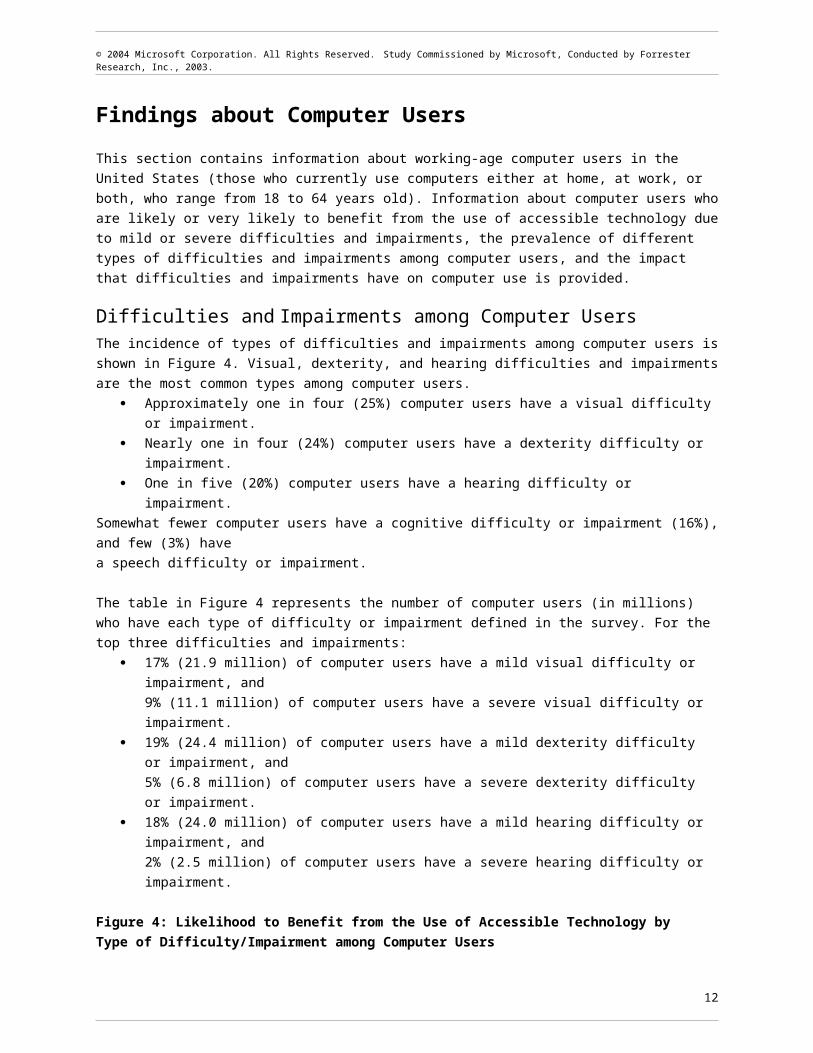
Difficulties and Impairments among Computer UsersThe incidence of types of difficulties and impairments among computer users is shown in Figure 4. Visual, dexterity, and hearing difficulties and impairments are the most common types among computer users.
Approximately one in four (25%) computer users have a visual difficulty or impairment. Nearly one in four (24%) computer users have a dexterity difficulty or impairment. One in five (20%) computer users have a hearing difficulty or impairment.
Somewhat fewer computer users have a cognitive difficulty or impairment (16%), and few (3%) have a speech difficulty or impairment.
The table in Figure 4 represents the number of computer users (in millions) who have each type of difficulty or impairment defined in the survey. For the top three difficulties and impairments:
17% (21.9 million) of computer users have a mild visual difficulty or impairment, and 9% (11.1 million) of computer users have a severe visual difficulty or impairment.
19% (24.4 million) of computer users have a mild dexterity difficulty or impairment, and 5% (6.8 million) of computer users have a severe dexterity difficulty or impairment.
18% (24.0 million) of computer users have a mild hearing difficulty or impairment, and 2% (2.5 million) of computer users have a severe hearing difficulty or impairment.
Figure 4: Likelihood to Benefit from the Use of Accessible Technology by Type of Difficulty/Impairment among Computer Users
9

© 2004 Microsoft Corporation. All Rights Reserved. Study Commissioned by Microsoft, Conducted by Forrester Research, Inc., 2003.
Majority of Computer Users Likely to Benefit from the Use of Accessible Technology
The findings of this study show that the majority of computer users are likely or very likely to benefit from the use of accessible technology. As shown in Figure 5, 57% (74.2 million) of computer users are likely or very likely to benefit from the use of accessible technology due to experiencing mild to severe difficulties or impairments.
The chart in Figure 5 also shows the percentages of computer users who are likely or very likely to benefit from the use of accessible technology due to a range of mild to severe difficulties and impairments:
40% (51.6 million) of computer users are likely to benefit from the use of accessible technology due to experiencing mild difficulties or impairments.
17% (22.6 million) of computer users are very likely to benefit from the use of accessible technology due to experiencing severe difficulties or impairments.
43% (56.2 million) of computer users are not likely to benefit from the use of accessible technology due to experiencing no or minimal difficulties or impairments.
Figure 5: Majority of Computer Users Likely to Benefit from the Use of Accessible Technology
Computer users are as likely as working-age adults to have mild difficulties or impairments, but they are less likely to have severe difficulties or impairments. Among computer users who range from 18 to 64 years old, 40% have a mild difficulty or impairment, compared to 38% of the overall working-age adult population. However, 17% of computer users who range from 18 to 64 years old have a severe difficulty or impairment, compared to 22% of the overall working-age adult population.
10
© 2004 Microsoft Corporation. All Rights Reserved. Study Commissioned by Microsoft, Conducted by Forrester Research, Inc., 2003.
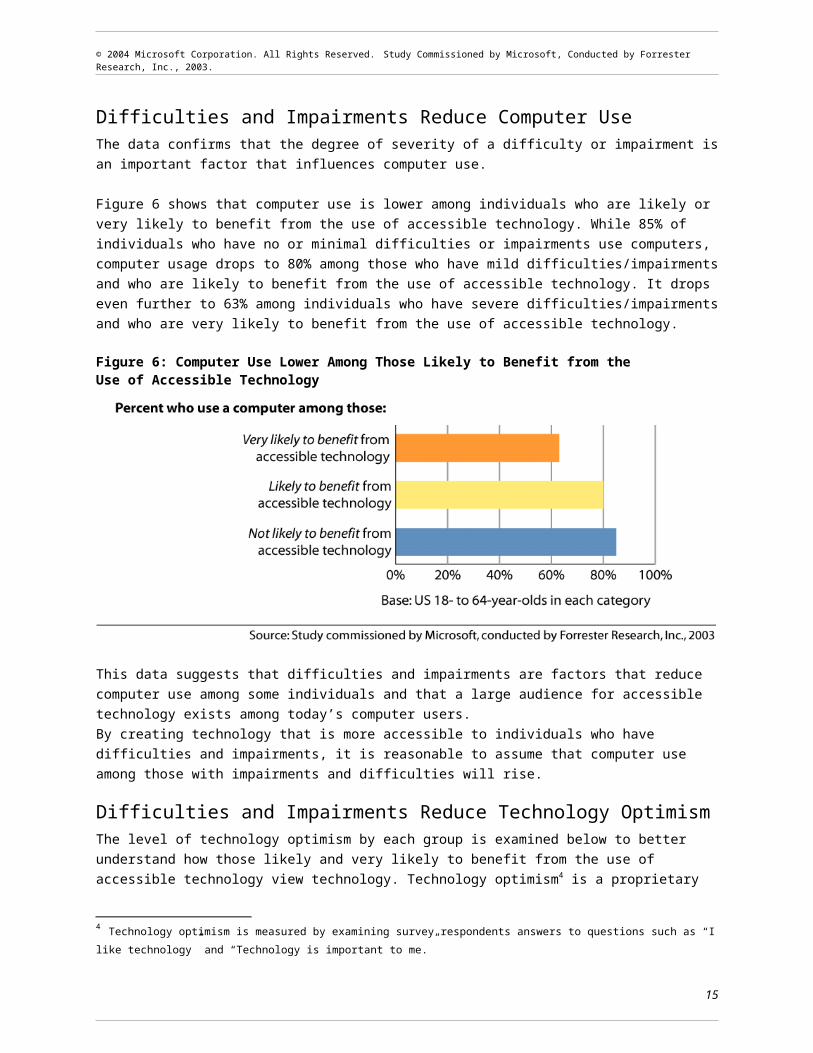
Difficulties and Impairments Reduce Computer UseThe data confirms that the degree of severity of a difficulty or impairment is an important factor that influences computer use.
Figure 6 shows that computer use is lower among individuals who are likely or very likely to benefit from the use of accessible technology. While 85% of individuals who have no or minimal difficulties or impairments use computers, computer usage drops to 80% among those who have mild difficulties/impairments and who are likely to benefit from the use of accessible technology. It drops even further to 63% among individuals who have severe difficulties/impairments and who are very likely to benefit from the use of accessible technology.
Figure 6: Computer Use Lower Among Those Likely to Benefit from the Use of Accessible Technology
This data suggests that difficulties and impairments are factors that reduce computer use among some individuals and that a large audience for accessible technology exists among today’s computer users. By creating technology that is more accessible to individuals who have difficulties and impairments, it is reasonable to assume that computer use among those with impairments and difficulties will rise.
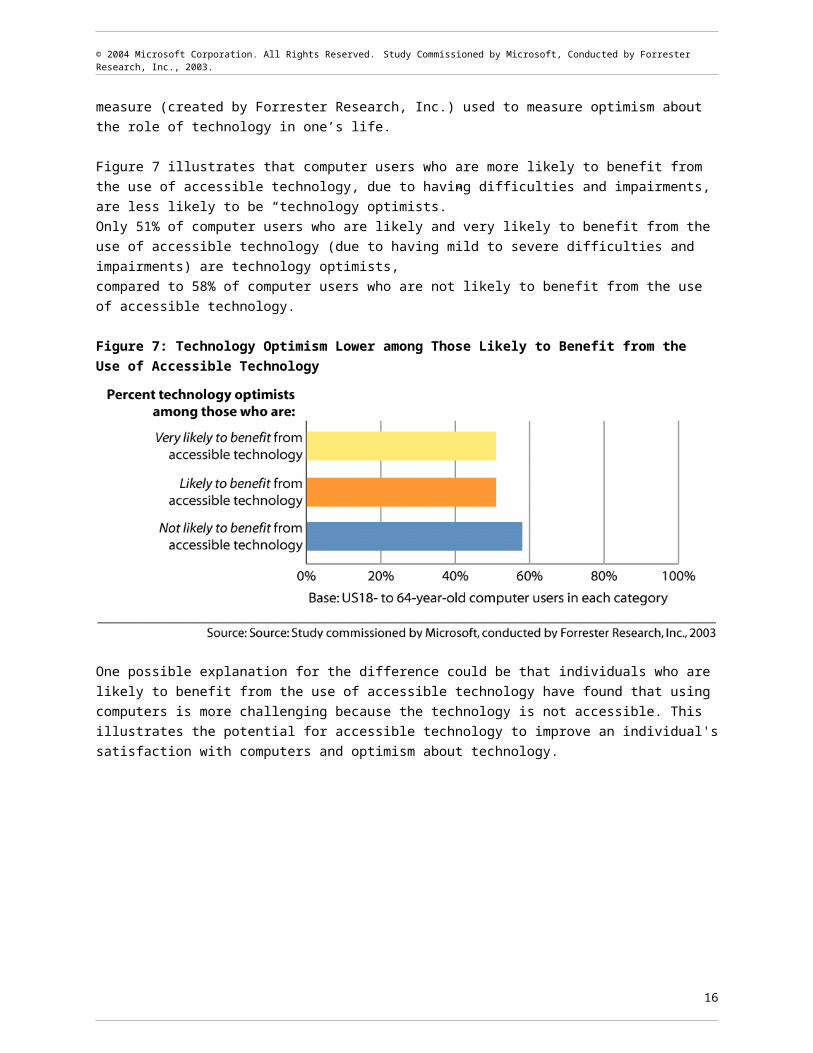
Difficulties and Impairments Reduce Technology OptimismThe level of technology optimism by each group is examined below to better understand how those likely and very likely to benefit from the use of accessible technology view technology. Technology optimism4 is a proprietary measure (created by Forrester Research, Inc.) used to measure optimism about the role of technology in one’s life.
Figure 7 illustrates that computer users who are more likely to benefit from the use of accessible technology, due to having difficulties and impairments, are less likely to be “technology optimists.” Only 51% of computer users who are likely and very likely to benefit from the use of accessible
4 Technology optimism is measured by examining survey respondents answers to questions such as “I like technology” and “Technology is important to me.”
11
© 2004 Microsoft Corporation. All Rights Reserved. Study Commissioned by Microsoft, Conducted by Forrester Research, Inc., 2003.
technology (due to having mild to severe difficulties and impairments) are technology optimists, compared to 58% of computer users who are not likely to benefit from the use of accessible technology.
Figure 7: Technology Optimism Lower among Those Likely to Benefit from the Use of Accessible Technology
One possible explanation for the difference could be that individuals who are likely to benefit from the use of accessible technology have found that using computers is more challenging because the technology is not accessible. This illustrates the potential for accessible technology to improve an individual's satisfaction with computers and optimism about technology.
12

© 2004 Microsoft Corporation. All Rights Reserved. Study Commissioned by Microsoft, Conducted by Forrester Research, Inc., 2003.
The Aging of the US Population and Its Impact on Computer Use
All of the findings presented so far have focused on current working-age adults and computer users who range from 18 to 64 years old. In this section, the findings of the survey are expanded to the entire US population and population trends are considered. Existing data about the rapidly aging US population, the increasing average age of computer users, and the rising occurrence of difficulties and impairments in the population are also presented.
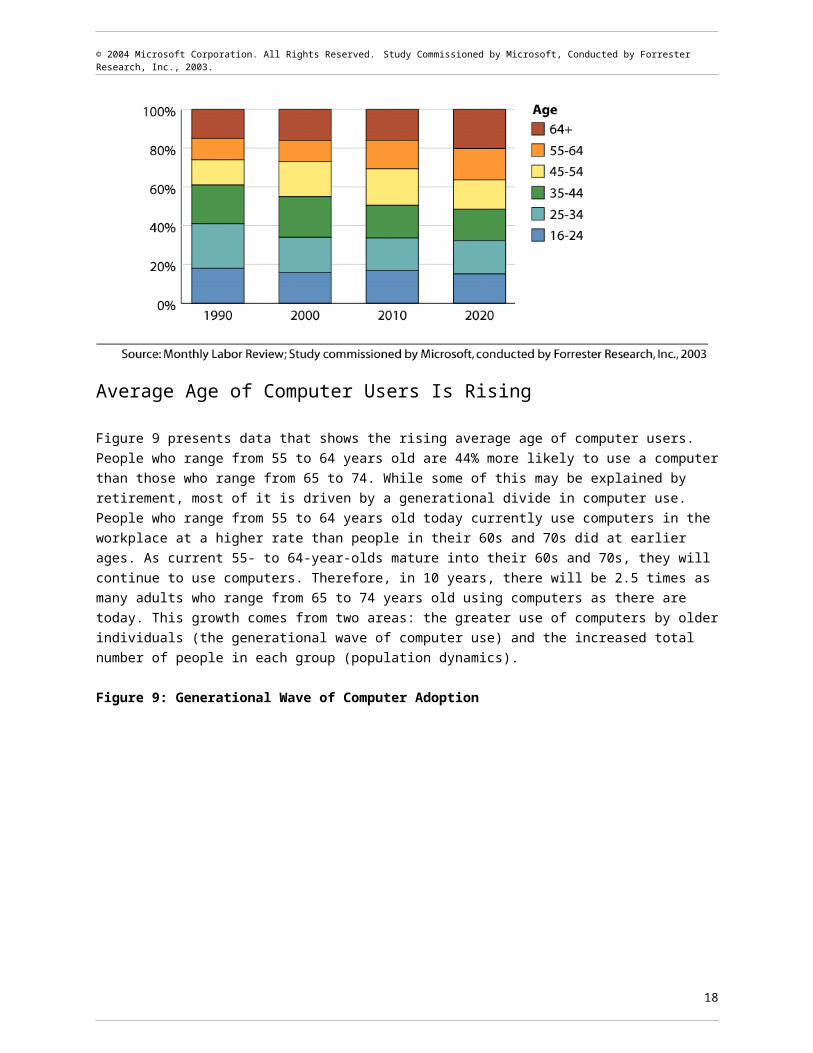
US Population Is AgingFigure 8 presents data from an existing study (Monthly Labor Review, 20005) that found that the average age of the US population is increasing, beginning in 1990 and rising until 2020. In 1990, 40% of the US population was younger than 35 years old; by 2010, only a third will be younger than 35. In 2010, the majority of the US population will be 45 years and older, a change that represents a major turning point for the US population demographic.
This increase will change the profile of the US labor force. With more people being 45 years and older, combined with a growing tendency toward delayed retirement, the labor force will shift toward older workers. This shift will occur slowly, but steadily, over the next several years. By 2020, one in five workers will be 55 years and older. This represents a more than 50% increase over 2000, in which 13% of the labor force was made up of the 55-and-older age group.6 The aging labor force is likely to mean greater pressure from businesses to help keep their aging employees as productive as possible throughout their careers.
Figure 8: Aging US Population
5 Mitra Toossi, “A century of change: the US labor force, 1950-2050” (table 4). Monthly Labor Review, May 2000. 6Toossi, 2002, page 15
13

© 2004 Microsoft Corporation. All Rights Reserved. Study Commissioned by Microsoft, Conducted by Forrester Research, Inc., 2003.
Average Age of Computer Users Is Rising
Figure 9 presents data that shows the rising average age of computer users. People who range from 55 to 64 years old are 44% more likely to use a computer than those who range from 65 to 74. While some of this may be explained by retirement, most of it is driven by a generational divide in computer use. People who range from 55 to 64 years old today currently use computers in the workplace at a higher rate than people in their 60s and 70s did at earlier ages. As current 55- to 64-year-olds mature into their 60s and 70s, they will continue to use computers. Therefore, in 10 years, there will be 2.5 times as many adults who range from 65 to 74 years old using computers as there are today. This growth comes from two areas: the greater use of computers by older individuals (the generational wave of computer use) and the increased total number of people in each group (population dynamics).
Figure 9: Generational Wave of Computer Adoption
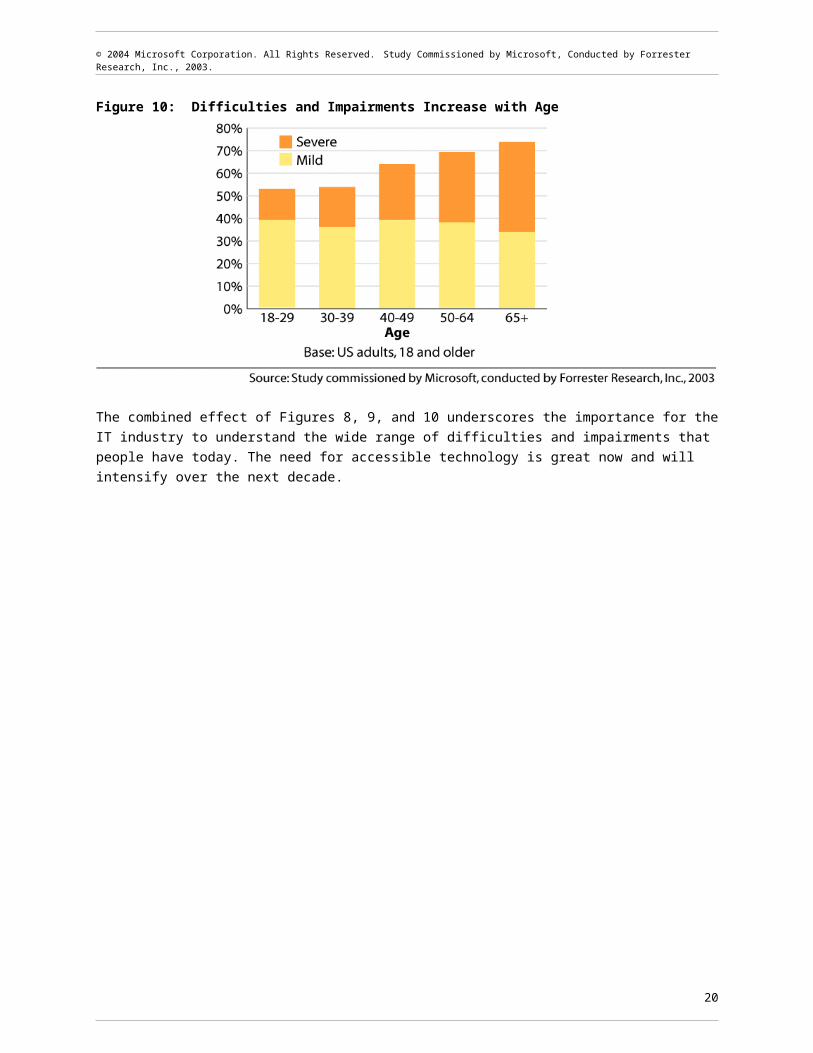
Difficulties and Impairments Increase with Age
Figure 10 presents data that shows that most of the increase in severe difficulties and impairments occurs among people in their 60s and early 70s. More than a third of people in the United States are 65 years and older and have severe difficulties and impairments. In fact, those who range from 65 to 74 years old are just as likely to have a severe difficulty or impairment as individuals who are 65 years and older.
Aging brings about the need for accessible technology in two ways. First, as people age, existing mild difficulties and impairments can become more severe. Second, people are likely to develop new difficulties and impairments as they age. In a population in which the age profile is shifting rapidly toward those most likely to have difficulties and impairments, the total number of people with difficulties and impairments will increase.
14
© 2004 Microsoft Corporation. All Rights Reserved. Study Commissioned by Microsoft, Conducted by Forrester Research, Inc., 2003.
Figure 10: Difficulties and Impairments Increase with Age
The combined effect of Figures 8, 9, and 10 underscores the importance for the IT industry to understand the wide range of difficulties and impairments that people have today. The need for accessible technology is great now and will intensify over the next decade.
15
© 2004 Microsoft Corporation. All Rights Reserved. Study Commissioned by Microsoft, Conducted by Forrester Research, Inc., 2003.
Summary
This report demonstrates that there is an increasing need for accessible technology to allow individuals to customize their computers to help overcome physical and cognitive difficulties and impairments. In the United States, 60% (101.4 million) of working-age adults who range from 18 to 64 years old are likely or very likely to benefit from the use of accessible technology due to difficulties and impairments that may impact computer use. Among current US computer users who range from 18 to 64 years old, 57% (74.2 million) are likely or very likely to benefit from the use of accessible technology due to difficulties and impairments that may impact computer use.
As the US population ages, more US workers and computer users will notice changes in their abilities and experience difficulties and impairments. At the same time, older US workers will remain in the workforce long past previously expected retirement ages. Maintaining productivity among US workers—regardless of abilities, difficulties, and impairments—will become an increasingly vital economic issue for US businesses as the population continues to age. Add to these trends the growing use of computers for work, information, and communication, and it becomes clear that future computer users will demand and expect greater accessibility in computers—regardless of their abilities. There is a strategic business opportunity for IT companies to improve technology optimism, and perhaps customer satisfaction with their own products, by developing more accessible technology for computers.
The Wide Range of AbilitiesAddressing the growing need for accessible technology requires accepting the fact that the concept of “disability” may have limited the understanding of the need for accessible technology. Instead of assuming that accessible technology is only useful to a distinct group of people with disabilities, the IT industry must consider the wide range of people who could benefit from using accessible technology.
For computer technology to be most effective and accessible, however, it is essential to understand the type and the degree of severity of difficulties and impairments people are experiencing, how frequently they occur among current and potential computer users, and the specific ways accessible technology may help people overcome those difficulties and impairments. Forrester Research recommends that further research be done to explore these issues.
Continued Innovation NeededThe findings in this study indicate that that technology currently aimed at people with severe difficulties and impairments can also improve the computing experience for the vast majority of computer users. A large and growing potential market for accessible technology exists to serve individuals who have some degree of difficulty or impairment that impacts their ability to use a computer. Further innovation should be done to make technology even more accessible.
Accessible technology has the potential to powerfully extend, expand, and enhance user experience and productivity. Addressing the needs of those who are likely or very likely to benefit from the use of accessible technology requires an industry-wide effort.
16
© 2004 Microsoft Corporation. All Rights Reserved. Study Commissioned by Microsoft, Conducted by Forrester Research, Inc., 2003.
17
© 2004 Microsoft Corporation. All Rights Reserved. Study Commissioned by Microsoft, Conducted by Forrester Research, Inc., 2003.
Appendix A: Methodology
Forrester conducted a nationwide survey in May through July 2003 to assess the incidence rates and the degree of severity of difficulties and impairments among US working-age adults and computer users. The survey was conducted by phone and mail, yielding a total of 15,477 respondents. Respondents were asked a range of questions about difficulties, impairments, computer use, and attitudes toward technology. Resulting data is representative of the adult US population.
Forrester created a survey, in conjunction with Microsoft’s team, to be fielded to a representative selection of households within the US to assess incidence rates and the degree of severity for several difficulty/impairment types. The difficulty/impairment types are: visual, dexterity, hearing, speech, and cognition. To measure a range of potential demand for accessible technology, a three-pronged approach was developed asking questions about the respondents’ level of functioning within a difficulty/ impairment type; assessing task-based limitations, self-assessed limitations, and difficulties/impairments effecting employment.
Survey questions: The survey was designed to identify individuals who self-identify as having a difficulty or impairment, as well as those who do not consider themselves to have an impairment but do report difficulty with tasks.
The survey contained the following three types of questions:1. Task-based questions: Designed to understand difficulty with ordinary daily tasks in each of
the difficulty/impairment types. The types of questions asked include: “Please indicate how often, if ever, you have difficulty seeing the words and letters in ordinary newspaper print because of your eyesight. If you usually wear glasses or contacts, please indicate whether you have difficulty while wearing glasses or contacts,” and “Please indicate how often, if ever, you have difficulty using a keypad on a phone/dialing the phone because of physical difficulties with your arms, hands, wrists or fingers.”
2. Direct questions about impairments: Designed to assess the proportion of the population who believe that they have an impairment. Individuals were also asked to assess the degree of severity of their impairment. The purpose of asking people for their own assessment was to understand the role of self-identification in seeking out solutions to difficulties with computer tasks. These questions were more direct, for example, “Do you have a visual impairment?”
3. Direct questions about impact on employment: Designed to allow individuals to communicate their assessment of the limitations imposed by their impairment. For example, people identified themselves to have a visual difficulty/impairment were asked directly: “Do you have a visual impairment that limits the kind or amount of work you can do?”
18

© 2004 Microsoft Corporation. All Rights Reserved. Study Commissioned by Microsoft, Conducted by Forrester Research, Inc., 2003.
In addition to a rigorous assessment of respondents’ ability within a difficulty/impairment type, the survey assessed computer usage; technology, health, and life attitudes; employment; accessible technology use; and a range of demographic characteristics.
Sample size: A sample size of 15,000 ensured that the study would capture a large sample of computer users with various impairments. Additionally, this ensured that some low-incidence difficulty/impairment types (like severe hearing impairment) would be sufficiently represented.
Phone and mail surveys: Respondents were contacted by either mail or phone from May to July 2003; 10,464 respondents are members of the mail panel managed by National Family Opinion (NFO); the remaining 5,013 respondents were contacted by phone through random digital dial.
Fielding the surveys by phone and mail allowed us to take advantage of the benefits of each method, accurately capturing a representative sample of the US population while minimizing bias against specific difficulties/impairments that would have challenged answering phone or mail surveys alone. The benefits of the mail survey include that it was more accessible for people with hearing difficulties and impairments and that the panelists know the source of the questionnaire, making them feel more secure revealing private information. Additionally, the mail survey was supplemented with rich background data on panelists (this background data also allows consistency checks on answers like income, age, and gender). The benefits of the phone survey include that the RDD method is more likely to include less traditional household structures, it is more accessible for people with visual difficulties/impairments, and the survey is guided by an interviewer, which reduces errors in the answers.
US focus. Impairments will likely affect people similarly in other countries and our findings will be noteworthy outside of the US. As such, Microsoft made the decision to focus the survey in the US because of the high cost of a multi-country survey and because the survey couldn’t be translated simply. The survey questions would need to be reconsidered to field the survey outside of the US, rather than directly translated, because of the sensitive nature of the research topic. Forrester Research believes that the survey design, and to some extent the research methodology, would need to be customized for each country. A key benefit of a US-only study is that the lessons from this experience can help ensure better execution of non-US versions, if Microsoft decides to invest in research on this topic in other countries.
Weighting the data. Forrester Research uses weights to ensure that the final group of survey respondents gathered through each method is representative of the general US population. Mail surveys were sent to a representative group of households, but the final data was weighted due to differing response rates. Similarly, phone surveying, while providing a random selection of households, creates a self-selected bias in the sample that requires weighting to correct. Weights were created by identifying target characteristics of US households from the June 2003 Current Population Statistics. Sampling was done at the household level, so the weights are designed to ensure that the data is representative of US households and the individuals within them, rather than all individuals.
Although phone-based and mail-based data was weighted along similar grounds and attributes, weights were developed separately to ensure representation across both groups. Each survey was weighted so
19
© 2004 Microsoft Corporation. All Rights Reserved. Study Commissioned by Microsoft, Conducted by Forrester Research, Inc., 2003.
that, when combined, it represented 50% of respondents. While the mail survey actually captured twice as many respondents as the phone survey, mail survey respondents were more likely to identify limitations/disabilities in many cases. As such, the decision to weight them equally provided more conservative estimates of difficulty/impairment rates.
How this study compared with the US Census SIPP. The US Census provides data on disability based on three primary sources: the Survey of Income and Program Participation (SIPP), the decennial census, and the Current Population Statistics (CPS). The SIPP is the only one of these with an extensive set of disability questions and is therefore identified by the Census as the preferred source for examining most disability issues. The following table shows data collected in the SIPP compared with data collected in our research study. Additionally, a question was asked to be comparable to the CPS and Census (“Do you have a physical, mental, or other health condition which prevents you from working or limits the kind or amount of work you can do?”).
Comparison of Question Types Asked in the US Census SIPP vs. This Study
SIPP This Study
Used a wheelchair, cane, crutches, or walker
In the mail survey only; both surveys ask about mobility
Activities – seeing, hearing, speaking, lifting, carrying, using stairs, walking, grasping objects
Seeing, hearing, speaking, using stairs, grasping objects, mobility in general
Activities of daily living: getting around the home, in/out of bed, bathing, dressing, eating, toileting
Direct question about difficulty in getting around the house or ability to do work around the house
Instrumental activities of daily living: going outside the home, keeping track of finances, light housework, taking medication, using the telephone
Using the telephone, writing letters or email, concentrating, formulating thoughts, finding your way in unfamiliar environments
Have specific condition such as learning disability, mental retardation, developmental disability, Alzheimer's, or other mental or emotional condition
Learning disability, memory or reasoning difficulty or impairment
Mental/emotional condition that interferes with daily living, depressed, anxious, trouble getting along with others, trouble concentrating, trouble coping with stress
Concentrating
Condition that limits the ability to work around the house
Condition that limits the ability to work around the house
Condition that makes it difficult to work at a job or business
Condition that makes it difficult to work at a job or business
20
© 2004 Microsoft Corporation. All Rights Reserved. Study Commissioned by Microsoft, Conducted by Forrester Research, Inc., 2003.
-- Pain or shaking in hands, arms, or wrists and limitations from pain, shaking, or other difficulties with hands, arms, wrists
-- Self-defined impairment, by difficulty and impairment type
Accuracy of results: For results based on a randomly chosen sample of this size (N=15,477), there is 95% confidence that the results have a statistical precision of plus or minus 1% of what they would be if the entire adult population of US households had been polled. The phone survey is randomly sampled, but the mail sample is not a random sample; while individuals have been randomly sampled from NFO’s panel for this survey, they have previously chosen to take part in the NFO mail panel.
21
© 2004 Microsoft Corporation. All Rights Reserved. Study Commissioned by Microsoft, Conducted by Forrester Research, Inc., 2003.
Appendix B: About Forrester Research, Inc.
About Forrester Forrester Research identifies and analyzes trends in technology and their impact on business. It provides companies with practical ideas, rigorous research, and objective guidance to help them thrive on technology change.
In February 2003, Giga Information Group became a wholly owned subsidiary of Forrester Research, Inc. Giga provides objective research, pragmatic advice, and personalized consulting to global IT professionals.
Together, Forrester and Giga enable companies to make better strategic decisions that maximize technology investments and achieve identifiable business results.
The Forrester Project TeamForrester’s Custom Consumer Research team helps companies make strategic business decisions by providing analysis of consumer attitudes and behavior and helping to formulate market strategies. To gain a thorough understanding of consumers, the CCR designs, implements, and analyzes proprietary consumer surveys. Furthermore, the CCR may work with data proprietary to clients to provide the best possible assessment of current customer demand issues. In addition to data analysis and consumer research, senior research staff at Forrester combines the consumer analysis with relevant industry analysis. Senior research staff works together to find the best solution for clients’ business problems.
The project team included: Betsey Stevenson, Ph.D. Custom Consumer Research Advisor, who was the lead researcher.
Betsey has experience leading market research for established and nascent technologies and leads Forrester’s Custom Consumer Research team.
James McQuivey, Group Director of Consumer Data® in North America, supervised the execution of the program.
Betsey Stevenson, Ph.D., Custom Consumer Research AdvisorBetsey leads Forrester’s Custom Consumer Research team, helping clients make strategic business decisions by designing, implementing, and analyzing proprietary consumer surveys. She has served as an analyst in Consumer Technographics®, covering a wide range of industries.
Before coming to Forrester, Betsey taught and conducted research in economics at Harvard University. Her work there focused on statistical analysis of individuals to predict behavior in a wide range of consumer, health, and family areas. Betsey also taught courses in applied econometrics at Harvard University. Her writings have appeared in a variety of publications, including The Wall Street Journal.
22

© 2004 Microsoft Corporation. All Rights Reserved. Study Commissioned by Microsoft, Conducted by Forrester Research, Inc., 2003.
Prior to her work at Harvard, Betsey was part of the International Finance group of the Federal Reserve Board, analyzing the financial situation of developing countries and debt restructuring packages.
Betsey graduated from Wellesley College and received an M.A. and Ph.D. in economics at Harvard University with an emphasis on econometric analysis and quantitative research design.
James L. McQuivey, Group DirectorAs the leader of Consumer Technographics® in North America, James directs a team of analysts and associates who track and analyze consumer use of technology products and services. His team conducts original research—surveying hundreds of thousands of households each year—on topics ranging from the spread of broadband to the adoption of wireless devices. This primary research is the largest and longest-running technology research effort in the world and provides Forrester and its clients with the most accurate view of emerging as well as established technologies.
James is regularly consulted for comment on the role of technology in our lives by The Wall Street Journal, The New York Times, London Financial Times, Wired, and USA Today. He has appeared on CNN and CNBC and has been interviewed for National Public Radio’s “All Things Considered” and “Morning Edition.”
Prior to joining Forrester, James conducted new media research and taught advertising at Syracuse University’s prestigious S.I. Newhouse School of Public Communications. During his academic career, James has published articles in journals such as The Journal of Media Economics and The European Journal of Communication. He has presented research at the annual conferences of the International Communications Association, the American Association of Public Opinion Researchers, and the Association for Education in Journalism and Mass Communication.
James holds a Ph.D. (ABD) in mass communications research from Syracuse University and received a master of business administration degree from the University of South Carolina.
23

© 2004 Microsoft Corporation. All Rights Reserved. Study Commissioned by Microsoft, Conducted by Forrester Research, Inc., 2003.
24
Related Documents