Vol. 20 No. 1 • Whitman Journal of Psychology 1 Dear Readers, We are excited to present the Fall 2011 edition of the Walt Whitman Journal of Psychology. The journal is the only student run, high school journal of Psychology in the country. For each edition, we review the submissions from across the nation. In this issue, we have covered a wide range of topics ranging from conformity, cell phone addiction, to self-esteem. In the interest of editorial integrity, we are also reprinting an article in this issue that was previously published with errors. We would like to extend a special gratification to our graduating seniors, whose hard work and dedi- cation to the Journal will be missed. For more information about the journal, visit our website at www.whitmanpsych.com. Best Regards, Leo Doran Nate Eckland Mayhah Suri Associate Editor Associate Editor Associate Editor Piya Chandramani Corinne Osnos Hannah Storey Assistant Editor Assistant Editor Assistant Editor

Welcome message from author
This document is posted to help you gain knowledge. Please leave a comment to let me know what you think about it! Share it to your friends and learn new things together.
Transcript

Vol. 20 No. 1 • Whitman Journal of Psychology 1
Dear Readers,
We are excited to present the Fall 2011 edition of the Walt Whitman Journal of Psychology. The journal is the only student run, high school journal of Psychology in the country. For each edition, we review the submissions from across the nation.
In this issue, we have covered a wide range of topics ranging from conformity, cell phone addiction, to self-esteem. In the interest of editorial integrity, we are also reprinting an article in this issue that was previously published with errors.
We would like to extend a special gratification to our graduating seniors, whose hard work and dedi-cation to the Journal will be missed.
For more information about the journal, visit our website at www.whitmanpsych.com.
Best Regards,
Leo Doran Nate Eckland Mayhah Suri Associate Editor Associate Editor Associate Editor
Piya Chandramani Corinne Osnos Hannah Storey Assistant Editor Assistant Editor Assistant Editor
Vol. 20 No. 1 • Whitman Journal of Psychology2
The Whitman Journal of Psychology7100 Whittier Blvd., Bethesda, MD 20817
Call for Submissions
All research articles completed by high school students are welcome. Please be sure that articles are submitted in APA format with complete references. Full submission details are on page 4.
Faculty AdvisorSheryl Freedman
Associate Editors Leo Doran ‘11Nathaniel Eckland ‘11Mayhah Suri ‘11
Assistant Editors Piya Chandramani ‘12Corinne Osnos ‘12Hannah Storey ‘12
Business ManagersSiona Slepoy ‘12Hannah Sherman ‘11Joey Strella ‘11Caitlin West ‘12
Technical DirectorsJohn Juenemann ‘12Nima Mohseni ‘11
Superintendent, Montgomery County Public SchoolsJerry Weast
Principal, Walt Whitman High SchoolAlan Goodwin
Cover PictureAlyssa Vasiliou
Experimental Psychology PictureNick Adams
Inside Psychology PictureJoey Strella

Vol. 20 No. 1 • Whitman Journal of Psychology 3
Table of ContentsPage
Introduction Letter: The Editors.....................................................................................................1
Contributors...................................................................................................................................2
Instructions to Authors...................................................................................................................4
Experimental Psychology...........................................................................................................5
Exploring the Mad Genius: The Relationship Between Creativity and Mood DisorderLaurel JarombekAdvisor: Elizabeth Matys-RahbarGreenwich High School..........................................................................................................6
Conformity in a Modern American High School Jessica ChengAdvisor: Maria VitaPenn Manor High School.......................................................................................................16
Losing by a Hair: The Effects of Facial Hair on Voting AppealAlain E. Sherman and Bilal AhmedAdvisor: Alison Bange Roslyn High School...............................................................................................................26
Self Esteem vs. DeterminationLiz Smits, Alex Ribble, Tia Fish, Amber Schroedl, and Michelle WittAdvisor: Audrey Damon-WynneMcFarland High School.........................................................................................................40
Inside Psychology......................................................................................................................45
In the Loop? Cell Phone AddictionNathaniel Eckland and Hannah Storey Walt Whitman High School, MD............................................................................................46
The Psychology of TerrorismMayhah Suri and Piya ChandramaniWalt Whitman High School, MD............................................................................................50
Learned HelplessnessLeo Doran and Corinne OsnosWalt Whitman High School, MD............................................................................................55

Vol. 20 No. 1 • Whitman Journal of Psychology4
Content The Whitman Journal of Psychology is
devoted to publishing the research and writing of
high school a forum in which student-conducted
research in the field of psychology may be recog-
nized. The Journal contains research from many
subject matters and is not limited to any specific
type of study.
Manuscript Preparation Authors should prepare manuscripts ac-
cording to guidelines established in the Publica-
tion Manual of the American Psychology Asso-
ciation (5th ed.). The Journal reserves the right
to modify APA style. Manuscripts should be no
longer than 15 pages. Manuscripts should in-
clude an abstract. Additionally, all manuscripts
must include a list of references as well as par-
enthetical documentation in accordance with APA
style. It is suggested that manuscripts include the
following sections: introduction, methods, results
and discussion. Manuscripts are not limited to
these sections.
All manuscripts submitted for consideration
may be mask (blind) reviewed at the request of
the author. Clear notification must be given on
the title page of a manuscript in order for it to be
mask reviewed. It is the author’s responsibility to
ensure that identification is omitted from the man-
uscript. All manuscripts submitted are subject to
editing on the basis of style as well as context. It
is the author’s responsibility to ensure clarity and
felicity of expression.
Manuscript Submissions Submissions should include a cover letter
in which the author’s name, school affiliation, ad-
visor’s name, address, phone number and e-mail
address are given. Authors should keep a copy
of their manuscript to guard against loss. Please
e-mail a copy of your file in Microsoft Word along
with a cover letter with the requirements listed
above to [email protected]. You will get
a confirmation e-mail once we have received your
submission and are able to open the file(s).
Statements contained in The Whitman
Journal of Psychology are the personal views of
the authors and do not constitute Walt Whitman
High School policy unless so indicated. There is
a rolling deadline for submissions.
Published in Bethesda, MD.
Website: www.whitmanpsych.com
Email: [email protected]
The Whitman Journal of Psychology

Vol. 20 No. 1 • Whitman Journal of Psychology 5
Experimental Psychology

Vol. 20 No. 1 • Whitman Journal of Psychology6
Introduction
The notion of the “mad genius” has been
prevalent in western culture for hundreds of years.
Early philosophers such as Socrates and Plato
emphasized the idea of “divine madness”. This
concept intensified during the Romantic era in which
the creative person was seen as distinct from the
average person due to his or her identification with
mental illness, (Becker, 2001). The list of poets,
writers, and artists thought to have suffered from
psychological disorders includes Robert Schumann,
Virginia Woolf, Sylvia Plath, Ernest Hemingway,
Vincent Van Gogh, Edgar Allen Poe, T. S. Eliot, Lewis
Carroll, William Blake, and many others (Lauronen et
al., 2004; Rothenberg, 1990). The question that has
prompted research by psychologists is whether or not
there is a relationship between creativity and mental
disorder, and if one exists, what the relationship
involves specifically.
Although links between creativity and other
disorders such as alcoholism, schizophrenia and
anxiety have been suggested and explored, affective
disorders are the subject of a great deal of current
research. Creativity has been associated with major
depressive disorder, which causes a person to enter
a melancholy state in which he or she feels worthless
and no longer finds satisfaction in activities that
had previously been sources of pleasure. The same
association has been made with bipolar disorder, in
which a person’s mood fluctuates between feelings
associated with depression and an overactive and
buoyant state known as mania. The manic state, in
a moderate form, is characterized by rapid thought
processes, euphoria, and a feeling of invincibility.
This condition can lead to increased productivity and
insight (Jamison, 1995). True mania, however, can be
highly dangerous as mental control disappears and
the person seems to become out of control. These
intense emotional conditions have been linked to
creativity in writers and artists.
However, some question the link between
mental illness and creativity. New studies have
found that a heightened degree of mental illness
does not necessarily correlate with higher scores on
creativity tests in experimental populations. Many
researchers today consider the supposed link to be
a myth created and perpetuated by a culture that
seeks to make its geniuses seem more accessible and
human. Still, there are individuals with depression
or bipolar disorder who went on to produce works
or ideas widely acknowledged as highly creative.
In the case of poets or writers, it is possible that
the content of such works was influenced by the
authors’ experiences with mental illnesses. A causal
relationship between creativity and depression
or bipolar disorder is highly unlikely, though the
Exploring the Mad Genius: The Relationship Between Creativity and Mood Disorder Laurel Jarombek
Advisor: Elizabeth Matys-Rahbar Greenwich High School

Vol. 20 No. 1 • Whitman Journal of Psychology 7
emotions triggered by these afflictions may be
incorporated into a creative product.
Background
Studies on the topic of creativity and
psychological disorder have not conclusively
determined whether the two aspects are related or
not. Many earlier studies, such as those by Jamison
and Andreasen (1995), assert that a relationship does
exist. Andreasen, as cited by Kohányi and Rothenberg
(1990), conducted extensive interviews with thirty
writers at the University of Iowa Writers’ workshop,
with controls matched for education, sex, and age.
She found that 80 percent were afflicted at some
point with an affective disorder, compared with 30
percent of controls, and that 43 percent had bipolar
disorder, compared with 10 percent of controls.
Andreasen also found a higher rate of mood disorder
among the relatives of the writers than among the
relatives of the controls (Kohányi, 2005; Rothenberg,
1990). Kohányi and Rothenberg also cited a study
by Jamison in which autobiographies, biographies
and medical records were used to diagnose 36 poets
from Britain and Ireland with affective disorders. Her
findings suggested a rate of bipolar disorder among
poets of approximately 30 percent, much higher than
the one percent average rate of the disorder (Kohányi,
2005; Rothenberg, 1990).
Several studies suggest that people engaged
in professions requiring emotion and subjectivity are
more prone to psychological disorder. According to
Arnold Ludwig (1998), those whose temperament
suits occupations in the arts are drawn to that field;
this personality is also one that is more susceptible to
mental illness. In his study, he found higher rates of
mental disorders in more subjective and expressive
professions compared to those that are less so. The
prevalence of mental disorders was greater in the
arts than in the sciences, and greater in the visual
and literary arts than in the formal or performing
arts. Depression was more common in poets than
in authors of nonfiction or fiction writing, and artists
with emotive styles had a higher rate of depression
than those with symbolic or formal styles (Ludwig,
1998). Emotional instability seemed to correlate with
professions in the arts, specifically those that focused
on expression, such as poetry and emotive visual
art. This research was extended by James Kaufman
(2005), who studied the rate of mental illness in
Eastern European poets. He used biographical
information on poets, playwrights, fiction writers and
nonfiction writers from the Reader’s Encyclopedia
of Eastern European Literature to determine the
comparative rates of mental disorder. The only
statistically significant difference was that poets were
more likely to have an illness than fiction or nonfiction
writers. These findings also demonstrated that the
correlation between creativity and psychological
disorder was not a direct result of the Western
European or American culture, as it was replicated in
another culture (Kaufman, 2005).
One explanation for why bipolar disorder may
account for increased creativity is that the minds

Vol. 20 No. 1 • Whitman Journal of Psychology8
of individuals who have the disorder may undergo
manic dedifferentiation, in which they use Janusian
processes during periods of mania. This cognitive set
involves the simultaneous consideration of opposite
ideas. This type of thinking often yields new and
creative ideas, and it is argued that people with
bipolar disorder are able to think in this way because
they retain their sanity and connection to real life to a
certain extent, even during mania, unlike people with
schizophrenia. By causing more flexibility regarding
contradictory thoughts that lead to creative theories
and comparisons, bipolar disorder may contribute to
creativity (Anderegg & Gartner, 2001).
There is also considerable research suggesting
that hypomania, a milder form of mania, may increase
creativity, while its more intense form does not.
Author Kay Jamison’s recollections of her experiences
with bipolar disorder reveal that she was largely
unable to function during manic episodes, but when
she was younger and her symptoms were not as
severe, she felt elated, never tired, and optimistic
(Jamison, 1995). This condition, as compared with
the out of control state of mania, would be more
conducive to creativity.
There is also some support for this assertion in
experimental studies. In one such study, the creativity
of a group of 77 subjects comprised of 17 individuals
with bipolar disorder, 16 individuals with cyclothymia
(a less severe form of bipolar disorder characterized
by alternating hypomania and mild depression),
11 non-afflicted relatives of the first group, and
15 controls was assessed using Lifetime Creativity
Scales. Results showed that the non-afflicted
relatives of individuals with bipolar disorder and the
people with cyclothymia had the highest levels of
creativity (Richards, Kinney, Lunde, Benet, & Merzel,
1988). This suggests that people who have milder
symptoms of bipolar disorder and possibly experience
hypomania might also have higher levels of creativity.
Another study used the Adjective Checklist
Creative Personality Scale (ACL-CPS) and the Revised
General Behavior Inventory (GBI) to assess the
creative and bipolar tendencies of 72 students.
Based on GBI scores, participants were categorized
as hyperthymic (hypomania but no depression),
cyclothymic, dysthymic (depressed), or euthymic
(neutral mood patterns). The only significant
difference for results of the ACL-CPS was that the
group with hyperthymic mood patterns scored
higher than any of the other three groups. Six items
on the GBI were the best predictors of creativity,
five of which fell under the hyperthymic category,
while one fell under the cyclothymic category. They
were all characteristic of creative activity, but were
not sufficient for a diagnosis of bipolar disorder
(Shapiro & Weisberg, 1999). The authors suggest
the possibility that creativity scores reflect an overall
positive emotional state, not necessarily a mood
disorder, and that positive emotion may be an effect
of creative periods rather than a cause. There is
support for the relationship between creativity and
emotions characterized by positive tone, moderate

Vol. 20 No. 1 • Whitman Journal of Psychology 9
levels of activation, and promotion motivation in a
meta-analysis of research on mood and creativity
(Baas, De Dreu, & Nijstad, 2008). A study by Silvia
& Kimbrel (2010) also supports the finding that
depression and dysthymic mood patterns do not
predict creativity. Aspects of depression did not
explain variance in creative accomplishments, creative
cognition, everyday creative behaviors or self-beliefs
about creativity.
A study comparing levels of illness in people
with bipolar disorder had similar findings. Using the
Symptom Checklist-90-Revised and clinical diagnosis,
20 people with bipolar disorder and 24 with other
psychological disorders were classified as severely
ill (seven), moderately ill (ten), mildly ill (eighteen),
or recovering (nine). Patients were also tested for
creativity, and the group with bipolar disorder did
not score significantly higher than the group with
other diagnoses. Patients categorized as severely ill,
however, scored lower than other groups. Patients
who were moderately ill scored higher than any of the
other groups (Ghadirian, Gregoire, & Kosmidis, 2000-
2001). Thus, while the severe form of mania may not
be conducive to creative activity, a milder form might
be.
Not all studies have found a positive
correlation between creativity and bipolar disorder or
even just hypomania. In an analysis of the creativity
during the career of composer Robert Schumann,
who is thought to have had bipolar disorder, Robert
Weisberg (1994) found that periods of hypomania
corresponded with greater quantities of work,
but not necessarily greater quality. He composed
approximately four times as many pieces during
hypomania than during depression, but based on the
Schwann and Penguin Guides, the work produced
during hypomanic periods was not more creative.
This suggests that Schumann’s more positive mood
motivated him to work and, as consistent with
symptoms of mania and hypomania, he was more
active during these periods of his life.
Researchers have also considered the
possibility of an indirect connection between
creativity and psychological disorder. One potential
link, personality, was examined in relation to creative
achievement and mental disorder. In their study,
Chávez-Eakle, del Carmen Lara, & Cruz-Fuentes (2006)
evaluated three groups of 30 people for creativity
using the Torrance Tests of Creative Thinking (TTCT),
for personality using the Temperament and Character
Inventory (TCI), and for symptoms of psychological
disorder using the Symptom Check List-90 (SCL-90).
The first group was chosen for creative achievement,
the second was a control and the third was composed
of psychiatric outpatients. The character traits
that correlated positively with creativity, including
novelty seeking, persistence, self-directedness and
cooperativeness, did not correlate positively with
psychological disorder. There was a high negative
correlation between creativity and mental disorder,
demonstrating that common personality traits do not
link the two characteristics.

Vol. 20 No. 1 • Whitman Journal of Psychology10
Another suggested third factor connecting
creativity and psychological disorder is rumination.
The introspective and emotive nature of poetry has
been cited as a possible reason for its correlation with
mental illness, as those who are prone to depression
or other disorders may be drawn to poetry because
of their contemplative nature; the magnification of
emotion by the process of writing poetry may in turn
increase the likelihood of illness (Kaufman & Baer,
2002). One study on this theory tested 99 students
for depression using the Center for Epidemiological
Studies Depression Scale (CES-D). In order to test
creativity, they used the Abbreviated Torrance Test
for Adults, a questionnaire that assesses creative
interests. They also used part of the Purdue Creativity
Test (PCT); and for self-reflective thinking used the
Ruminative Responses Scale (RRS). Both creativity
and depressive symptoms were found to correlate
with self-reflective rumination, though they were not
found to link to each other without this intermediary
(Verhaeghen, Joormann, & Khan, 2005). This suggests
an indirect relationship between creativity and
depression, and that the self-reflection caused by
depression may contribute to the content of creative
work.
Some researchers claim that there is no
connection between creativity and psychological
disorder. Albert Rothenberg (1990), for example,
asserts that creativity is fostered by a healthy
mindset, not one plagued by illness. In his studies
of individuals with creative achievements, he has
not found any universal traits other than high levels
of motivation, although many of these people tend
to be slightly introverted. Two mental processes
that he contends are central to creativity, the
Janusian process and the homospatial process, may
seem outwardly similar to the cognition associated
with mental illness because of the focus on the
simultaneous existence of opposite ideas that at
times transcend logic. But they are healthy and
purposeful, unlike illogical thoughts in patients with
psychological disorders. The strain that these types
of thoughts put on the mind, Rothenberg argues,
would make it incredibly difficult for a person with
an already unstable mind to employ them in creative
endeavors. His studies of eminent creative individuals
who dealt with mental disorders show that periods
of creative activity generally did not occur when
the person was most affected by his or her illness.
Analysis
Clearly, investigation of the link between
creativity and bipolar disorder and other mental
illnesses is incomplete. While correlational studies
have found a connection between these two
attributes, experiments have not yet yielded a
completely sound explanation of the nature of this
relationship.
The methods used in some of the early
studies on the topic have been questioned, hence
detracting from the legitimacy of their findings. For
example, the pool from which Andreasen chose her
subjects, the Iowa Writer’s Workshop, is known as

Vol. 20 No. 1 • Whitman Journal of Psychology 11
a place where many distinguished writers go when
experiencing difficulties in their work, increasing
the chance that her subjects were suffering from a
psychological disorder thus skewing the results of
her study (Schlesinger, 2009; Rothenberg, 1990).
Her study also had a major problem: there were too
few participants for her findings to be generalized.
Jamison’s study had the same issue. One of her
generalizations was based on her percentage that
12.5 percent of visual artists had or once had an
affective disorder was based on a single person.
(Rothenberg, 1990). This small sample size makes it
impossible to draw valid conclusions from her data.
Flawed methods and interpretations may account for
some of the inconsistencies between the studies of
Jamison and Andreasen and subsequent experiments.
Later experiments had more participants and used
more objective measures of creativity as well as
accurate symptoms of psychological disorder, such as
verified tests and questionnaires, instead of simply
choosing people involved in the arts and interviewing
them to determine whether they had been diagnosed
or treated for a psychological illness. The superior
methods of these experiments, though not perfect,
help to discredit the more dubious results of earlier
correlational studies.
Many studies that show evidence for a
connection between creativity and mental illness,
such as those from Ludwig (1998) and Kaufman
(2005), examine the lives of eminent writers, poets,
and artists mainly through biographies and, when
possible, medical records. The problem with this
method of research is that the people who are
studied cannot be given tests evaluating their level
of creativity or psychological disorder, as many of
them are not even alive. Therefore, records of their
emotional patterns that may lead a researcher to
believe that the individual suffered from bipolar
disorder may be flawed or exaggerated by the
biographer. Cultural beliefs concerning the “mad
genius” may lead a biographer to look for such a
condition in a subject where there is none. The
oscillating moods may also just be the natural ups
and downs that accompany the successes and failures
of a creator (Rothenberg, 1990). The pressure
experienced by renowned individuals may also make
them mentally unstable, while not necessarily leading
to an illness that can be diagnosed.
The conclusions drawn by articles on
this topic seem to depend on the type of study
conducted. Correlational studies, such as those
of Jamison and Andreasen as cited by Rothenberg
(1990), Kohányi (2005), and Ludwig (1998), tend
to support a relationship between creativity
and psychological disorder, as does speculative
reasoning, studied by Kohányi (2005), Kaufman
and Baer (2002). Meanwhile, experiments fail to
find a causal relationship between creativity and
affective disorder (Chávez-Eakle et al., 2006; Silvia
& Kimbrel, 2010), and although some began with
the intention of finding such a relationship, many
ended up finding a connection between creativity
Vol. 20 No. 1 • Whitman Journal of Psychology12
and mild or moderate hypomania (because of the
nature of their experimental procedure) (Richards et
al., 1988; Shapiro and Weisberg, 1999; Ghadirian et
al., 2000-2001). Since different methods may have
produced different results, the inconsistencies from
the research may be reconcilable.
There is also a controversy as to whether the
mental processes associated with creativity require a
healthy mindset or whether they can be carried out
during the manic phase of bipolar disorder. Anderegg
and Gartner (2001) argue that the dedifferentiation
and seemingly Janusian processes that occur during
mania indicate creativity, but Rothenberg (1990)
insists that this is not the case. While he does say
that people experiencing mania think in illogical ways
that resemble the Janusian process, he claims that
they are not able to use these thoughts to generate
metaphors, theories, or anything else that can
contribute to creative production. While mania can
induce the creation of novel thoughts, these thoughts
are not put to use and are therefore deemed
invaluable. As value is a necessary component of
creativity (Myers, 2004), the thoughts that form
during mania cannot be considered creative. Based
on Jamison’s (1995) accounts of bipolar disorder
and her experiences of the manic state, it would be
nearly impossible for a person in that condition to
concentrate enough to transform irrational thoughts
into coherent, creative works. Contrary to the claims
of Anderegg and Gartner, Jamison contends that
a person experiencing true mania is not grounded
in reality enough to derive any creative production
from the many illogical thoughts that occur to him
or her. While hypomania may help in the creative
process by increasing processing speed and elevating
the person’s mood, mania would not. The thought
processes that occur during creative activity are
generally healthy ones, and thus would not be directly
associated with an “unhealthy” state such as mania.
Discussion
While there is not a causal relationship
between creativity and psychological disorders,
specifically that of bipolar disorder, the experience
of this illness may enhance creativity if the latter
is already present in the afflicted individual.
Experimental studies have shown that symptoms of
disorders do not predict increased scores on various
creativity tests, but according to correlational studies
there is some sort of relationship, though it is most
likely indirect. The idea of the “mad genius” would
not have lasted so long if it were not based in any
fact, and observation of creative geniuses has shown
that there are many prominent individuals who do
suffer from mental illnesses. Studies have narrowed
down the phase in the bipolar cycle in which
creativity is most likely to be enhanced; hypomania
is the only condition in which subjects have shown
greater creativity, and a meta-analysis of samples
not associated with disorders show that creativity
is correlated with positive, active, and intrinsically
motivated emotions (Baas, De Dreu, & Nijstad, 2008).
Thus, it makes sense that hypomania, an overactive

Vol. 20 No. 1 • Whitman Journal of Psychology 13
state characterized by extreme optimism and positive
affect, would be conducive to creative production.
The strong emotions and powerful experiences felt
and recollected by people who have bipolar disorder
(Jamison, 1995) may be incorporated into the writing
and artwork of those who already had creative
tendencies, and this emotional content may increase
the quality of their work. Bursts of creativity would
be more likely to occur when people have greater
mental health, but they could still use ideas gained
from introspection during periods of depression
or mania in their writing or art. As Romantic poet
William Wordsworth remarked, “All good poetry
is the spontaneous overflow of powerful feelings
recollected in tranquility.” Creative individuals might
use the “powerful feelings” they experienced as a
result of their mental illness to write poetry or engage
in other artistic activities when their emotions are less
intense and their minds are in a healthier place.
Potential complications concerning data on
the connection between creativity and psychological
disorder is the subjectivity of the variables. It is
difficult to evaluate levels of these factors objectively
and in a way that can be assessed statistically
when both, especially creativity, can be open to
interpretation. Also, not much true experimentation
is possible because bipolar disorder and depression
cannot be inflicted on subjects, so a causal
relationship cannot be proven or disproven using
conventional experimental methods. Researchers
must make do with studying the levels in which these
factors exist in subjects and make inferences from
that data. They are both closely connected to an
individual’s personality, so it is nearly impossible to
assess how a person’s creativity would be affected if
he or she did or did not have a disorder (Chávez-Eakle
et al., 2006).
With the amount of information presently
available, many of the conclusions drawn concerning
this issue are forced to be at least partly speculative.
These hypotheses must be tested to discover the
true nature of the connection between psychological
disorder and creativity. Modern-day “creative
geniuses” must be used to test for disorders instead
of relying on biographies to determine the real
correlation between the two conditions. Researchers
should test levels of creativity in the same individuals
at different stages of the bipolar cycle to find out
whether creativity is really highest at hypomania and
healthy periods, and whether the creativity of people
with bipolar disorder experiencing hypomania should
be compared with people experiencing extremely
positive moods but do not have any psychological
disorder. Only when all the hypotheses are tested
and the findings are replicated will researchers be
capable of determining whether or not the term “mad
genius” is an appropriate title.
References
Anderegg, D., & Gartner, G. (2001). Manic dedifferentation and the creative process. Psychoanalytic Psychology, 18(2), 365-379. doi:10.1037/0736- 9735.18.2.365.

Vol. 20 No. 1 • Whitman Journal of Psychology14
Baas, M., De Dreu, C., & Nijstad, B. (2008). A meta- analysis of 25 years of mood-creativity research: Hedonic tone, activation, or regulatory focus?. Psychological Bulletin, 134(6), 779-806. doi:10.1037/ a0012815.
Becker, G. (2001). The association of creativity and psychopathology: Its cultural-historical origins. Creativity Research Journal, 13(1), 45- 53. doi:10.1207/S15326934CRJ1301.
Chávez-Eakle, R., del Carmen Lara, M., & Cruz- Fuentes, C. (2006). Personality: a possible bridge between creativity and psychopathology?. Creativity Research Journal, 18(1), 27-38. doi:10.1207/s15326934crj1801.
Ghadirian, A., Gregoire, P., & Kosmidis, H. (2000). Creativity and the Evolution of
Psychopathologies. Creativity Research Journal, 13(2), 145-148. doi:10.1207/S15326934CRJ1302.
Jamison, K. R. (1995). An unquiet mind: A memoir of moods and madness. New York: Vintage Books.
Kaufman, J. (2005). The Door That Leads Into Madness: Eastern European Poets
and Mental Illness. Creativity Research Journal, 17(1), 99-103. doi:10.1207/s15326934crj1701_8.
Kaufman, J., & Baer, J. (2002). I bask in dreams of suicide: mental illness, poetry, and women. Review of General Psychology, 6(3), 271-286. doi:10.1037/1089- 2680.6.3.271
Kohányi, A. (2005). Four Factors That May Predict the Emergence of Creative Writing: A Proposed Model. Creativity Research Journal, 17(2/3),
195-205. doi:10.1207/s15326934crj1702&3_6.
Lauronen, E., Veijola, J., Isohanni, I., Jones, P., Nieminen, P., & Isohanni, M. (2004). Links Between Creativity and Mental Disorder. Psychiatry: Interpersonal and Biological Processes, 67(1), 81-98. doi:10.1521/ psyc.67.1.81.31245.
Ludwig, A. (1998). Method and Madness in the Arts and Sciences. Creativity Research Journal, 11(2), 93.
Myers, D. G. (2004). Psychology. New York: Worth Publishers.
Richards, R., Kinney, D., Lunde, I., Benet, M., & Merzel, A. (1988). Creativity in manic- depressives, cyclothymes, their normal relatives, and control subjects. Journal of Abnormal Psychology, 97(3), 281- 288. doi:10.1037/0021-843X.97.3.281.
Rothenberg, A. (1990). Creativity & madness: New findings and old stereotypes. Baltimore: The Johns Hopkins University Press.
Schlesinger, J. (2009). Creative mythconceptions: a closer look at the evidence for the “mad genius” hypothesis. Psychology of Aesthetics, Creativity, and the Arts, 3(2), 62- 72. doi:10.1037/a0013975.
Schuldberg, D. (2001). Creativity and psychopathology: Categories, dimensions,
and dynamics. Creativity Research Journal, 13(1), 105-110. doi:10.1207/S15326934CRJ1301.
Shapiro, P., & Weisberg, R. (1999). Creativity and Bipolar Diathesis: Common Behavioural and Cognitive Components. Cognition & Emotion, 13(6), 741-762. doi: 10.1080/02699939937906

Vol. 20 No. 1 • Whitman Journal of Psychology 15
Silvia, P., & Kimbrel, N. (2010). A dimensional analysis of creativity and mental illness: do anxiety and depression symptoms predict creative cognition, creative accomplishments, and creative self-concepts?. Psychology of Aesthetics, Creativity, and the Arts, 4(1), 2-10. doi:10.1037/a0016494.
Verhaeghen, P., Joorman, J., & Khan, R. (2005). Why we sing the blues: the relation between self- reflective rumination, mood, and creativity. Emotion, 5(2), 226-232. doi:10.1037/1528-354 -2.5.2.226.
Weisberg, R. (1994). Genius and madness? A quasi- experimental test of the hypothesis that manic-depression increases creativity. Psychological Science, 5(6), 361-367. doi:10.1111/j.1467-9280.1994. tb00286.x.
Vol. 20 No. 1 • Whitman Journal of Psychology16
Abstract
The results of a student-run replication of
Asch’s study on conformity are presented. Factors
were age, gender, levels of introversion/extraversion,
partner/ no partner, and group size. Asch’s results
revealed that 75% of participants conform at least
once to the group’s incorrect responses (Asch,
1955). Experimental results showed a 67.65%
rate of conformity. In Asch’s study, participants
conformed 35.10% of the time with four confederates
and 35.20% of the time with six (Asch, 1955). The
experiment yielded 21.45% and 8.57% of the time
respectively. Underclassmen (20.89%) conformed
more than upperclassmen (17.05%) but less
(22.64%) when the group sizes were the same.
Males conformed (21%) more than females (18.5%),
extraverts (6.32%) more than introverts (0%), a
participant without a partner more (20.42%) than a
participant with a partner (0%), and participants tested
with four confederates (22.64%) more than with six
confederates (8.57%).
Keywords: upperclassmen (eleventh and
twelfth graders), underclassmen (ninth and tenth
graders).
Conformity in a Modern American High School
Solomon E. Asch of Swarthmore College
conducted an experiment in the 1950’s on the effect
of group pressure on conformity. However, the
experiment was blind; participants in his study did not
have knowledge of the true purpose of the experiment
before they began. Only after the experiment was
completed did Asch reveal that it was not a test of
“visual judgment,” but of how the influence of social
pressure affects opinions (Asch, 1955). In the
original experiment, as referenced in Opinions and
Social Pressure, college students participating in the
experiment entered a room of similarly aged students
and were asked which of three lines matched the
height of a standard line of comparison. Seated
strategically in the middle of the group, they listened
as the others gave consistently incorrect answers
for most of the trials. The purpose was to see if the
participants would conform to the opinions of the
confederates who were responding incorrectly on
purpose despite what they saw (Asch, 1955). The
same question was asked in this experiment, but the
factors affecting conformity were group size (which
Asch also tested), upperclassmen vs. underclassmen,
introversion vs. extraversion, and gender. This
experiment, which replicates Asch’s study, was
conducted at a suburban high school in Pennsylvania.
Method
The parameters were based on Asch’s study
and APA ethical guidelines. The student tried to stay
as faithful to the original experiment as possible.
Working with an advisor, the student received
permission from the school principal to conduct the
Conformity in a Modern American High School Jessica Cheng
Advisor: Maria VitaPenn Manor High School
Vol. 20 No. 1 • Whitman Journal of Psychology 17
study.
Preparation and Set-up
The effort cards that were used to conduct
the experiment were modeled after the card that
Asch used. There were 18 sets of cards with two
cards each. One card contained the standard line
of comparison and the other contained the three
comparison lines clearly labeled A, B, and C. The
size of the cards was equal, the standard line of
comparison was set in the middle of the card, and
lines A, B, and C were spaced 3 inches apart from
each other on the second card. All lines began the
same distance from the bottom of the card. The lines
that did not match the standard were between three
fourths of an inch to one and three fourths of an inch
different than the standard (Asch, 1955). There was
only one correct answer and the order of the answers
contained no pattern. Asch tested his cards on a
group without any group pressure and the group
answered incorrectly less than one percent of the time
(Asch, 1955). To make sure that the cards used in the
experiment were adequately easy to answer correctly,
the experimenter had classes write down their
individual answers on paper and hand them in. The
incorrect responses occurred 0.9259% of the time.
Participants
From a list of all the students in the school,
over 175 students were randomly selected to
participate in the experiment by simply putting a
check mark beside student ID numbers. Each of
these students was given a packet to complete and
return if they wished to participate in the experiment.
The packet contained false information regarding the
purpose of the experiment. The packet was presented
as a test of visual perception. It also asked questions
about the participant’s age, grade, and gender and
contained an introversion/extraversion test taken from
the book Personality Test written by Lenore Thomson.
Examples of questions that were used are “Do you
prefer a social life that includes: A) many friends and
acquaintances? or B) a few that you feel close to?”
where A revealed an extraverted personality and B an
introverted one (Thomson, 1998, p. 14). There were
fourteen questions total.
Participants were tested with others in their
age group. There were 34 total participants. There
were 17 males, 16 females and one unknown,
and there was one person whose gender was not
recorded. The number of upperclassmen tested
was 15, and the number of underclassmen tested
was 19. Of the upperclassmen, six were tested
with six confederates and nine were tested with four
confederates. All the underclassmen were tested
with four confederates present. For the introversion/
extraversion part of the experiments, introverts
totaled six, extraverts eight, and unknown personality
types 19. All 32 participants were in a room full of
confederates except two had a partner that answered
correctly with them.
Confederates
Upperclassmen confederates consisted of
students currently enrolled in Advanced Placement
Psychology who had knowledge of the experiment.
Underclassmen confederates were younger siblings
of the experimenter’s friends. They were informed
about the purpose of the experiment and its

Vol. 20 No. 1 • Whitman Journal of Psychology18
background in the form that they received and were
given a brief introduction by the experimenter prior
to experimentation. All the confederates agreed
to give up their homeroom time to participate and
also received a form to complete and return before
experimentation began.
Ethics
APA provides guidelines for ethical
experimentation. The code of ethics requires that 1)
experimenters must obtain informed consent, 2) they
must protect participants from physical and mental
harm, 3) they must maintain the confidentiality of all
participants, and 4) they must debrief participants
after the experiment (Myers, 2007). Because some
participants were under legal age and therefore
unable to provide consent, it was necessary to obtain
their parent/guardian’s consent and the under-age
participant’s assent (“Ethical Issues,” 2005). In the
packets that the randomly selected students were
given, it was explained that there was no danger
involved in the experiment, but if they felt threatened
at any time during the experiment, they could leave.
All participants were referred to by ID numbers rather
than their names, and the confederates had to agree
that they would not talk about the experiment or the
participants. Debriefing procedure occurred after the
experiment was over and will be discussed later.
During the Experiment
The experiment began when the participant
was called to the classroom after all the confederates
had arrived. They were led to assume that they were
the last to be called into the room. Everyone was
then led to another room where testing would occur
and were told they would be randomly seated. The
participant was always seated in the exact middle
of the group and the group consisted of an equal
number of male and female confederates on the
majority of occasions. Before trials were started,
the experiment was explained briefly. If no one had
questions and understood that they could leave at any
time, the experiment began. Confederates were told
to repeat what the first trained confederate said. The
first and second trials were always answered correctly
in Asch’s experiment and so the same procedure was
used in the student-run experiment (Asch, 1955).
Confederates also answered correctly numbers
six, nine, thirteen, and seventeen in the student’s
experiment. Six trials of the 18 were correctly
answered and 12 out of 18 were answered incorrectly,
all unanimously. The lead confederate was told to
pick the next best answer when answering incorrectly.
Each person in the room gave their answer
out loud going down the line. The answers were
all recorded in a table as answering occurred. The
experimenter was seated in the middle of the table
and there was about two tables width separating the
participant from the cards. The cards were turned
towards each person as they answered to give the
appearance that everyone was looking from an
optimal viewing angle, directly in front of them. The
participants often appeared to be concentrating very
hard on the lines and glanced around in discomfort
before and after they answered. Sometimes they
would laugh nervously or would whisper to the person
beside them in confusion. One female subject was
even shaking slightly as she answered.

Vol. 20 No. 1 • Whitman Journal of Psychology 19
After all the trials were complete, the
experimenter thanked everyone for their participation
and informed the group that debriefing would occur.
Again, the experimenter said random selection would
determine the order of debriefing as it had the order
of seating and the confederates left the room as the
participant was selected to go first.
Debriefing
The debriefing procedure was modeled
after a sample procedure researched. Once the
experimenter and participant were alone, the first
question the experimenter asked was “How did it
go?” Most said that it went “okay.” Then, participants
were asked if they had any questions about the
experiment. Most had no questions, but when they
did, the experimenter answered their questions. Most
questions were requests for clarification on what they
were supposed to do. “We were matching the lines
with the ones that were the same, right?” Following
this the experimenter would often note that, “I noticed
you answered differently than everyone else a couple
of times. Do you have any idea why that might be?”
Several excuses were given and the participants
seemed a bit disconcerted or embarrassed that
they had disagreed. Some thought that the others,
because of the angles from which they were seeing,
were wrong. Others worried that maybe they needed
glasses or were crazy. One person said they had
just gotten their prescription changed, another that
they thought they had 20/20 vision and a third kept
exclaiming throughout the entire experiment that she
“must be crazy”. Additionally, a few of the participants
thought that the others in the group were just saying
what the first person was saying just to fit in.
The participants were then told that they had been
deceived, that the actual purpose of the experiment
had been group pressure and not visual perception.
The experimenter apologized for the deception and
explained that it was necessary in order to obtain
unbiased results. No one was upset by the revelation
or accepted the offer of removing their results from
the study. Several participants thought it was quite
clever and said that it reminded them of the TV show
Punk’d hosted by Ashton Kutcher. Next, participants
were told how many times they conformed to the
group’s incorrect responses. When asked if they
recalled doing this, some participants admitted that
they had purposefully gone along with the group even
though they knew the answer was wrong. Others did
not recall answering incorrectly and just thought that
the answer they were giving was correct. Finally, if
there were no more questions after the revelation,
the participants were implored to not tell anyone the
true nature of the experiment so that testing could
continue (“Ethical Issues,” 2005).
Results of the Experiment
The effect of the number of confederates on
conformity was opposite of what Asch showed. The
group size that produced the most conformity had
six confederates (Asch, 1955). In the student-run
experiment, a group with six confederates conformed
to the incorrect response of the group 8.57% of the
time whereas conformity occurred 22.64% of the
time with four confederates. Those tested were all

Vol. 20 No. 1 • Whitman Journal of Psychology20
upperclassmen. Conformity occurred more often to
the smaller rather than the larger group (see Figure 1).
Underclassmen conformed less than
upperclassmen when the percentages of the groups
with four confederates were compared, but when
compared with the total percent of conformity for
upperclassmen i.e. the percent with a group of four
confederates and the percent with six confederates
combined, upperclassmen conformed less (see
Figure 2).
In comparing the percents of conformity
between male and female participants, the data
showed that male participants conformed more often
than female participants. One person’s gender was
not recorded and therefore is not included in the data
(see Figure 3).
Additionally, there was no data collected on
the personalities of most participants and thus those
participants are not included in the calculations of the
following percents. Introverts conformed 0% of the
time, extraverts conformed 6.32% of the time, and
the one person that scored a tie on the introversion/
extraversion test conformed 50% of the time (see
Figure 4).
Figure 5 displays data that should not
have occurred. Two participants, instead of being
surrounded by all confederates, had a partner in the
form of a confederate that did not understand that
they were supposed to respond incorrectly. Those
two participants conformed 0% of the time whereas
the other participants conformed 20.42% of the time.
Figures 6 and 7 both show the amount of
conformity in number of trials incorrectly answered
versus the frequency of this occurring. The
graphs are skewed to the right. Figure 7 displays
a moderately strong negative correlation meaning
that as the number of questions that were incorrectly
answered increased, the frequency decreased.
Calculation of Results
When calculating the percentage of times
that a participant conformed, the experimenter
took the number of incorrect answers given by the
participant when the confederates were also wrong
(as opposed to a participant going against the group
when the group was correct) divided by the number of
incorrect answers given by the group of confederates.
Because confederates were instructed to only get
six specific answers correct out of eighteen trials, if a
participant answered incorrectly six times, they were
said to have conformed 50% of the time (6/12 =0.50).
However, in some instances, the lead confederate
made a mistake and answered a trial correctly
that they were not supposed to. In this case, the
experimenter divided by eleven instead of twelve.
Another calculation that was made is
that of the standard value to which the results
were compared. The standard value for the total
experiment was determined to be 35.12%. This
was found by taking the percentage of participants
who were tested with a group of six confederates
multiplied by the percentage of conformity that Asch
received with six confederates. This number was then
added to the product of the percentage of participants
that were tested with four confederates and the
percentage of participants that Asch received with four
confederates.

Vol. 20 No. 1 • Whitman Journal of Psychology 21
Analysis
Underclassmen conformed less than
upperclassmen in the case of four confederates.
Underclassmen may conform less to a group because
they do not know each other as well; upperclassmen
have known peers in their age group for longer
and have a better idea of each other’s truthfulness
and intelligence, which may have led to increased
conformity.
On the other hand, when upperclassmen’s
conformity is looked at they conformed less than
underclassmen. Perhaps this can be explained by
the insecurities of underclassmen, becase they do
not know each other as well as the upperclassman
do and therefore try harder to impress. Also,
upperclassmen may be more comfortable going
against the group because their friendships with
the confederates are more stable by their junior
and senior year. Additionally, high school may have
taught upperclassmen to think for themselves.
Upperclassmen probably have more experience
dealing with peer pressure and other tests that come
with age.
Participants conformed more with four
confederates than with six confederates likely
because with six confederates, the group was too
large for conformity to increase. Participants thought
that it was very unlikely for all six confederates to
answer unanimously and incorrectly.
While females are often thought of as being
more social beings than the males, male participants
gave in to group pressure more often. This
occurrence may be attributed to a desire by the male
participants to appear intelligent in the eyes of the
female confederates and female experimenter.
Personality affects the way problems are
approached, friendships are made, and the world is
viewed. Introverts were found to conform less than
extraverts. In Personality Type, the author states that
extraverts “act before reflecting” and “are influenced
by and gauge their worth by the expectations and
attention of others,” so the fact that extraverts
conformed more than introverts is logical (Thomson,
1998). Furthermore, the one participant that scored
equally as an introvert and extravert may have
conformed more than both introverts and extraverts
because “close or even scores in a category tend to
suggest that the person hasn’t developed a clear-cut
sense of self” (Thomson, 1998, p. 25).
Results were easiest to explain when
participants conformed less when they had a partner
present than when they were alone facing the group.
When another person that agreed on the correct
answer was present, participants were not singled out
as the lone person to be answering incorrectly. The
situation changed from one of an “I” to a “we,” causing
different responses. Instead of an in-group of one,
there was an in-group of two. It was safer and easier
to give an opinion when there was someone that
thought the same way.
Comparison of Results to Standard
Table 1 shows the standard results (the
results that the experiment should have gotten), the
experimental results, and the percent errors. Asch’s
study revealed that 75% of participants will conform to
the group at least once (Asch, 1955). The student-run

Vol. 20 No. 1 • Whitman Journal of Psychology22
experiment attained a result of 67.65% of participants
conforming at least once. Percent error was 9.80%.
For a group with four confederates, the
standard value was conformity 35.10% of the time. In
comparison, the high school experiment showed that
participants conformed 21.45% of the time in a group
of the same number of confederates, a percent error
of 38.89%. Recall that n=28.
For a group with six confederates, the
standard value was conformity 35.20% of the time. In
comparison, the high school experiment showed that
participants conformed 8.57% of the time in a group
with the same number of confederates, a percent
error of 75.65% (n= 6).
Through calculation, the standard for the
percent of time total conformed was determined to
be 35.12%. The student-run experiment arrived at
a value of conformity 19.20% of the time, which is a
percent error of 45.32% (n=34).
Overall, the number of participants that
conformed and the amount that they conformed was
much less in the experiment than a look at Asch’s
results from the 1950s would have predicted.
Reasons for Error
There are several reasons for the
discrepancies between the standard values and those
obtained by the experimenter:
The lines chosen for the confederates
to answer incorrectly were chosen without any
consideration for how obvious they were to match.
This may not even be an error because the difference
between the comparison lines and the standard for
each trial were all basically the same, within ¾ of
an inch to 1¾ inches. Asch showed that even when
the difference between the lines was seven inches,
conformity still occurred (Asch, 1955).
At one point, with a lack of participants to test,
two confederates found one participant who thought it
suspicious that the two confederates were also part of
the group that was, to their knowledge, being tested.
The fact that the leading confederate was
not very convincing could also account for some
of the result errors. When testing began with the
underclassmen, the leading confederate was not able
to differentiate between the lengths of the lines. She
had not worn her glasses for over a year because
she said her vision was fine; but when asked which
of the three lines matched the standard, she not
only answered incorrectly on the first trial, but also
hesitated for several seconds and appeared unsure
on all the other trials.
Since there were only around 400 to
500 students per class, the population that the
experimenter was pulling from was too small. Most,
if not all the participants knew at least one of the
confederates, whereas in the Asch experiment, the
participants were pulled from three colleges in the
area not including Swarthmore (Asch, 1955). When
the experimenter asked for suggestions from the
participants, it was often suggested that the group
size (six confederates) was too large to be believable.
Despite the fact that over 175 forms were given to
randomly selected students, only n=15 who handed in
the forms were tested. This means that the attempt
at random selection failed. Those that handed their
forms in may have been more intelligent, sociable,

Vol. 20 No. 1 • Whitman Journal of Psychology 23
responsible, etc. The remaining n=19 participants
had to be selected from homerooms during the testing
time. Most of these participants were volunteers,
which meant that they could have been more outgoing
or confident.
The fact that this was a student-run
experiment as opposed to an experiment conducted
by a respected adult or an accredited university
may have detracted from the results attained. For
example, according to Psychology: Eighth Edition
in Modules, when Stanley Milgram conducted his
experiments at Yale University his obedience results
were higher than when he was at a lesser known
university (Myers, 2007).
Another reason that the results of the
experiment were not very close to the standard
was that the experimental results were actually
valid. In the 21st century, America may be a more
individualistic country than it was over sixty years ago
in the 1950s. Participants since Asch’s time may be
less likely to conform.
Discussion
To conclude, the results of the student-run
experiment in one modern American high school
indicate that Asch’s results are applicable on a
local, more personal level. Though the results did
not match exactly those of Solomon Asch, and in
some cases contradicted his results, they are still
thought provoking. With a sample size more than
one-third less than that of an ideal experiment and
some confounding variables, the results are hardly
foolproof; the worth of the experiment comes not in
the actual data, but in the lessons about testing that
were learned.
Conducting an experiment as a high school
student takes days of preparation. Researching
information on the topic in question, writing papers
about methods and ethics, as well as presenting the
idea to an advisor and the principal for consideration
all had to be completed before experimentation
can begin. Permission slips, hall-passes, testing
schedules, and props for the experiment must be
considered and confederates must be sought and
trained. Reminders that will for the most part be
ignored will have to be sent out because only about
10% of the student population will return their packets
by the due date.
Finally, with those points in order,
experimentation can begin. While setting up
this experiment, the experimenter had to handle
confused confederates and necessary changes to
the experiment, like the change in the number of
confederates. Only a limited number of trials could
be run because of space and time constraints due to
school activities, standardized test remediation, and
clubs. But with perseverance, passion, and planning,
achievement is possible.
Students in the school had a chance to
participate in something unique, while challenging
their beliefs about what peer pressure means. Peer
pressure was transformed from mothers questioning,
“If all your friends jumped off a bridge would you?”
to something more subtle and pervasive, something
that truly influences seemingly monotonous actions
in everyday activities. Conformity is not always
negative, and it was not the point of the experiment

Vol. 20 No. 1 • Whitman Journal of Psychology24
to prove that students give in to the influence of
the group too often. The point was to make people
think about what they really see and think, what they
believe in and why, how others have an effect on
them and how they can have an effect on others.
In a modern American high school, conformity
was present as it probably is in any setting. It is
not something made up for psychology textbooks.
It is a fact of life and one that cannot and should
not be changed. To acknowledge its presence
was the important point. Will future studies show
that American high schoolers conform, that an
introverted personality means less conformity, or that
four confederates are better than six? Only future
research can answer these questions.
Figure 1. The Effect of Confederates on Conformity.
This data only includes upperclassmen.
Figure 2. The Effect of Grade on Conformity.
The upper total is the percent of conformity
for upperclassmen with four and six
confederates combined. The other two
bars are just with four confederates.
Figure 3. The Effect of Gender on Conformity. Male
participants conformed more often than female
participants.
Figure 4. The Effect of Personality on Conformity.
Introverts never conformed. Extraverts conformed
but not often. The one person that tied on the
introversion/extraversion test conformed six times.

Vol. 20 No. 1 • Whitman Journal of Psychology 25
Figure 5. The Effect of Having a Partner on
Conformity. Two participants had another student in
the room agree with them on the correct answer. They
did not conform at all.
Figure 6. The Number of Times Participants
Conformed. A frequency graph of the number
of time participants conformed showed that as
number of times conformed increased, generally
frequency decreased.
Figure 7. The Regression of Number of the Number of
Times Conformed vs. Frequency. The equation of the
least-squares regression line was y= -0.06561+6.8022.
R= -0.0809986 r2= 0.0656077
References
Asch, S. (1955). Opinions and Social Pressure.
Scientific American, 193,31-35.
Effective Debriefing. (2005). Wadsworth Cengage
Learning. Retrieved from http://www.
wadsworth.com/psychology_d/templates/
student_resources/workshopsres_methd/
debrief/debrief_1.html
Ethical Issues. 2005. Wadsworth Cengage
Learning. Retrieved from
http://www.wadsworth.com/psychology_d/
templates/student_resources/workshops/
res_ethd/ethics/ethics_16.html (slides 1-17).
Myers, D.G. (2007). Psychology Eight Edition in
Modules. U.S: Worth Publishers. (27)
Thomson, L. (1998). Personality Type: An
owner’s manual. Boston, Massachusetts:
Shambhala Publications.

Vol. 20 No. 1 • Whitman Journal of Psychology26
Abstract
Previous researchers have established
that facial features can act as voting cues and
influence voters’ perceptions of a politician’s
beliefs and abilities. However, no study has
determined whether facial hair is a liability for
political candidates. This experiment examined
the effects of facial hair on a politician’s perceived
aggressiveness, competence, political ideology,
age and voting appeal. One hundred library
patrons were randomly assigned to view one of
four photographs of a supposed politician, each
with a different style of facial hair. Participants
then completed a survey measuring their
perceptions of him. When compared to the
politicians with facial hair, a clean-shaven
politician was perceived to be significantly less
aggressive, more competent, less conservative,
more appealing to voters, and younger.
Introduction
Beginning in the early 1900s and
extending into the modern day, the United
States has experienced a gradual decline in the
number of politicians with facial hair. In the past,
facial hair was quite popular among politicians.
Between the presidencies of Abraham Lincoln
(1861-1864) and William Howard Taft (1909-
1913), all but two Presidents had facial hair
(Herrick, Mendez, & Pryor, 2010). However,
Taft was the last President to have a mustache,
and Benjamin Harrison (1889-1893) was the
last president to have a beard (Knight-Ridder
Newspapers, 1996). In addition, Thomas Dewey
is thought to have lost a significant number of
votes to Harry Truman in the 1948 presidential
election because of his mustache (Buchwald,
1984, p. 3; Knight-Ridder Newspapers, 1996).
Furthermore, at the beginning of the 110th United
States Congress, less than 5% of Congressmen
had facial hair (Herrick et al., 2010). The present
study sought to examine how various levels
of facial hair influence voters’ perceptions of a
politician’s aggressiveness, competence, political
ideology, voting appeal and age.
Many cognitive theorists have established
that various physical attributes assist individuals
in making judgments of others. According to one
study, the limited information processing abilities
of humans cause them to resort to heuristic
inferential strategies in order to economize
their perception and encoding of input (Terry &
Krantz, 1993). The study goes on to say that
individuals quickly form complex impressions of
people from meager information, oftentimes a
consensual schema. A schema is a hypothetical
cognitive structure that functions essentially as a
Losing by a Hair: The Effects of Facial Hair on Voting AppealAlain E. Sherman and Bilal Ahmed
Advisor: Alison Bange Roslyn High School

Vol. 20 No. 1 • Whitman Journal of Psychology 27
set of rules governing how individuals perceive
another person. Various traits are associated
with schemata, and when a particular schema is
activated, the associated traits are attributed to
the target person in the form of a first impression.
Many studies have established that facial hair
attributes to impression formation by affecting
perceptions of an individual’s beliefs and abilities
(e.g., Addison, 1989; Kenny & Fletcher, 1973;
Pancer & Meindl, 1978; Terry & Krantz, 1993;
Wogalter & Hosie, 2001). Voters are cognitive
“misers” looking for shortcuts to evaluate political
candidates, and oftentimes, facial features are
used as voting cues (Bull & Hawkes, 1982;
Hellström & Tekle, 1994; Herrick et al., 2010).
One study gave realistic examples attesting to
the importance of facial looks in political life by
showing how mere facial photographs of British
Members of Parliament led viewers to make
interpersonal judgments of them (Bull & Hawkes,
1982). All of these findings support the theory
that facial hair activates certain schemata and is
therefore a liability for political candidates at the
polls (Armstrong & Graefe, 2010; Herrick et al.,
2010).
Previous research has established
that facial hair is associated with increased
perceptions of aggressiveness. Many studies
have found that when compared to clean-shaven
men, those with facial hair are perceived as
more aggressive, dominant, and masculine
(e.g., Addison, 1989; Kenny & Fletcher, 1973;
Pancer & Meindl, 1978; Pellegrini, 1973; Reed
& Blunk, 1990; Roll & Verinis, 1971). One study
explained the association of facial hair with
aggressiveness through evolutionary theory
(Muscarella & Cunningham, 1996). According
to the theory, facial hair evolved as a signal of
threat and dominance because it increases the
apparent size of the lower jaw. The jaw and
mouth are associated with teeth, which were
seen, evolutionarily, as a weapon.
Although unshorn men are typically
perceived as being more aggressive, high
levels of aggressiveness may be detrimental
to a politician. Virility can be seen as politically
helpful (e.g., an aggressive president is needed
for issues such as war); however, being overly
aggressive is generally unappealing to voters,
as many Americans want to see politicians with
more compassionate traits (Huddy & Terkildsen,
1993). According to one study, overly aggressive
men seem more threatening; they are too
supportive of the use of violent means to solve
problems and not supportive enough of social
policies (Herrick et al., 2010).
Although few in number, there have been
studies stating that the presence of facial hair
can influence perceptions of an individual’s
competence. One study found that bearded

Vol. 20 No. 1 • Whitman Journal of Psychology28
men are perceived as more competent than
clean-shaven men (Reed & Blunk, 1990).
However, more studies found that facial hair
decreases perceived competence (Muscarella
& Cunningham, 1996; Terry & Krantz, 1993).
According to one theory, beards evoke the
schema of a virile man (Roll & Verinis, 1970). But
since they are also associated with nonconformity
(Pellegrini, 1976), they detract from perceived
competence (Terry & Krantz, 1993). Therefore,
it is believed that the presence of facial hair
decreases an individual’s perceived competence.
Few researchers have examined the
effects of facial hair on perceived political
ideology, and these studies have yielded
inconsistent results. Studies have shown that
bearded men are perceived as liberal, while
clean-shaven men are perceived as conservative
(Lino de Souza, Baião, & Otta, 2003; Pellegrini,
1976). On the other hand, another study found
the opposite to be true (Herrick et al., 2010).
Herrick et al. (2010) tested a sample highly
relevant to the present study, while Lino de
Souza et al. (2003) conducted their experiment in
a foreign country. Moreover, facial hair fashions
and political ideals are constantly changing
(Pedersen, 2001). Facial hair preferences are
likely to be different now than they were in 1976
when Pellegrini conducted his experiment. This
suggests that a bearded face is associated with a
conservative ideology, which may not hold true in
other countries.
The impact of facial hair on a politician’s
general electability has been insufficiently
examined. Findings from an experiment show
that the rate of bearded applicants that are
selected for professional leadership positions is
lower when compared to non-bearded applicants
(Shannon & Stark, 2003). Another study found
that men with facial hair are not typically viewed
as politicians (Hellström & Tekle, 1994). One
study predicted that facial hair would have a
negative effect on the evaluation of candidates
in an election given that most politicians,
especially in recent years, are clean-shaven.
However, no empirical data has supported this
conjecture (Armstrong and Graefe, 2010). In a
recent study, it was hypothesized that facial hair
would be disadvantageous at the polls because
the unshaven politicians would be perceived
as overly masculine (Herrick et al., 2010).
Interestingly, it was found that men with facial
hair did not differ from clean-shaven men in their
general electability; however, the authors state
that this finding may have been biased by the
conservative sample or by the current wars in
Iraq and Afghanistan. Overall, they still present
the theory that facial hair is detrimental to a
politician, but highly recommend further research.
Previous researchers have found that

Vol. 20 No. 1 • Whitman Journal of Psychology 29
facial hair increases perceptions of age, (Lino de
Souza et al., 2003; Muscarella & Cunningham,
1996; Pellegrini, 1973; Wogalter & Hosie,
2001) but it is still debatable whether or not age
is beneficial to a politician. One study states
that there is an association of specific traits to
older people, such as a sense of responsibility,
experience, and wisdom (Lino de Souza et al.,
2003) but, there seems to be a recent “youth
movement” in American politics. In 2008, many
new Congressmen and Senators were elected,
most of them in their thirties and some even in
their late twenties. For example, Aaron Schock,
the youngest member of the United States House
of Representatives, beat his two older competitors
at age 27 in the 2008 elections. Schoenburg
(2009) presents the idea that more people vote
for younger politicians because they are the ones
bringing change to America, while older politicians
are perceived as having outdated ideologies. A
good example of this is the presidential election
of 2008. Barack Obama, a relatively young
Democrat, gained public support with his slogan
“Change We Need,” eventually leading up to his
victory over his older Republican competitor John
McCain, who was frequently criticized for being
“too old” and “unable to conform.” In these tough
times, American voters are looking for change,
and younger politicians are advertising it.
Although there is no present literature
examining whether the style of facial hair
impacts a politician’s voting appeal, an indirect
relationship is believed to exist between the
amount of facial hair on a politician’s face
and voting appeal. Full beards are seen as
exceedingly masculine; therefore, bearded
men are less electable, especially to women
(Herrick et al., 2010). This overly masculine
appearance gives the impression that bearded
politicians are not gentle, compassionate or kind.
In the experiment conducted by Lino de Souza
et al. (2003), mustached men were preferred
as leaders over bearded men. In another
experiment, a mustached man was rated more
likely to effectuate change than a bearded man
(Roll & Verinis, 1971). For these reasons, it was
hypothesized that a mustache would be more
favorable to a politician when compared to a
beard and a beard with a mustache.
While there are many aspects of the
present study that have been researched in
the past, several new contributions were made
to the field of political psychology. There have
been many studies that have found distinct
relationships between facial hair, aggressiveness,
and competence (e.g. Addison, 1989; Kenny &
Fletcher, 1973; Pellegrini, 1973; Reed & Blunk,
1990 Roll & Verinis, 1971); but none have
examined these effects in a political context.
The present study also sought to clarify literary

Vol. 20 No. 1 • Whitman Journal of Psychology30
inconsistencies regarding the effects of facial hair
on perceived competence and political ideology.
In addition, no studies have truly established
whether facial hair is a liability for politicians at
the polls, but the present study sought to find
a definitive answer. Furthermore, the present
study was the first to adequately examine the
differences between various types of facial hair
(mustache, beard, and beard with mustache)
when measuring their effects on perceived
aggressiveness, competence, political ideology,
voting appeal, and age.
In order to determine the effects of facial
hair on a politician’s perceived aggressiveness,
competence, political ideology, voting appeal and
age, the following hypotheses were tested: (1)
Compared to participants exposed to a politician
with facial hair (mustache, beard, and beard
with mustache), participants exposed to a clean-
shaven politician will (a) report lower levels of
perceived aggressiveness, (b) report higher
levels of perceived competence, (c) report lower
levels of perceived conservatism, (d) be more
likely to vote for the politician, and (e) report
that the politician is younger. (2) Compared to
participants exposed to a bearded politician and
participants exposed to a politician with both a
beard and a mustache, participants exposed to
a mustached politician will (a) report lower levels
of perceived aggressiveness, (b) report higher
levels of perceived competence, (c) report lower
levels of perceived conservatism, (d) be more
likely to vote for the politician, and (e) report that
the politician is younger.
Method
Participants
The sample for the experiment consisted
of 100 patrons at a public library located in a
suburb within the New York Metropolitan Area.
A power analysis was employed to obtain a
sample size representative of the population.
Each participant was randomly assigned to one
of four conditions. To be included in the sample,
participants had to be registered voters. In
addition, written consent was required from all
participants.
Materials
Four photographs of a supposed
Congressman acted as the experimental stimuli.
The first photograph displayed a clean-shaven
man in professional attire with an American
flag in the background. The purpose of this
was to realistically imitate the Congressional
photographs displayed on the United States
government’s website. The second, third, and
fourth photographs showed the same man
against the same backdrop. However, the man
had a mustache in version two, a beard in
version three, and both a beard and a mustache
in version four. Adobe Photoshop was used to
Vol. 20 No. 1 • Whitman Journal of Psychology 31
add the facial hair to the photographs as well as
the American flag background. The image of the
man was taken from the University of Missouri
System’s website (Charton & Tinney, 2007).
Prior to experimentation, the individual portrayed
in the stimuli gave written consent to use his
photograph in the study. The photographs are
displayed in Figure 1.
Procedure
Prior to experimentation, approval by an
Institutional Review Board was obtained. Additionally,
permission from the library director was granted. The
researchers explained that they were conducting
an experiment concerning the public’s responses to
various photographs of politicians. Upon completion
of the consent form, participants were randomly
assigned to view one of the four photographs of
the fictitious politician and were told to complete a
survey asking for their perceptions of the politician.
Participants were given as much time as necessary
to complete the survey and were assured that their
responses would remain anonymous. All participants
completed the survey within 15 minutes after
receiving it and proceeded to fill out a manipulation
check. The manipulation check asked participants
to recall the type of facial hair that the politician had.
Immediately upon their completion of the survey
and manipulation check, all of the participants were
debriefed.
Dependent Measures
The Perceptions of Congressman Survey
was created for use in the present study.
Consisting of 29 items, the survey was composed
of three scales (the Perceived Aggressiveness
scale, the Perceived Competence scale, and
the Perceived Political Ideology scale) and two
single-item measures (the Voting Appeal single-
item measure and the Perceived Age single-item
measure).
Items one through seventeen were
answered on a five-point Likert-type scale
measuring agreement for particular statements.
A response of one indicated strong disagreement
with the statement. A response of six indicated
strong agreement with the statement. Items 18
through 24 were answered on a six-point bipolar
scale. For item 18, participants who marked one
indicated that they felt the politician was very
liberal. Participants who marked six indicated
that they felt the politician was very conservative.
For items 19 through 24, an answer of one was
labeled “Very Unlikely,” and an answer of six was
labeled “Very Likely.” Item 24 asked participants to
report their likelihood to vote for the Congressman.
Item 25 was open-ended and asked participants to
estimate the age of the politician. Items 26 through
29 asked participants for demographic information,
including their gender, race, year of birth, and
political affiliations.
Vol. 20 No. 1 • Whitman Journal of Psychology32
The Perceived Aggressiveness scale
consisted of nine items and was adapted
from Muscarella and Cunningham’s (1996)
Aggressiveness and Appeasement scales
and Huddy and Terkildsen’s (1993) Warmth/
Expressiveness and Instrumentality scales.
The scale included statements such as, “This
Congressman is aggressive.” Three items on the
Perceived Aggressiveness scale were reverse-
scored to avoid a response set, and the scale
had a Cronbach’s Alpha of .90.
The Perceived Competence scale was
adapted from Muscarella and Cunningham’s
(1996) Social Maturity scale and consisted
of eight items. One question read, “This
Congressman has experience in his area of
office.” The scale had a Cronbach’s Alpha of .96.
The Perceived Political Ideology scale
consisted of six items and was adapted from
Herrick et al.’s (2010) Use of Violence and
Compassion Group 2 scales. One item on the
scale read, “What is the likelihood that this
Congressman supports legislation that assists the
military and defense?” One item on the scale was
reversed-scored, and the scale had a Cronbach’s
Alpha of .91.
Written permission from the authors of the
instruments was obtained prior to data collection.
Results
Five one-way analyses of variance
(ANOVAs) were used to examine the effects
of facial hair on perceived aggressiveness,
perceived competence, perceived political
ideology, voting appeal and perceived age.
An alpha value of p < .05 was used as
the criterion for statistical significance. A t-test
was employed to examine the effect of facial
hair on perceived age. Pearson correlations
were also used to correlate the dependent
variables. Additionally, Tukey-HSD post-hoc
tests were employed to examine the effects of
the individual levels of the independent variable
(i.e., clean-shaven, mustache, beard and beard
with mustache) on perceived aggressiveness,
perceived competence, perceived political
ideology, voting appeal and perceived age. One
proportion z-tests were used to determine how
representative the sample was of the entire
population.
An ANOVA revealed a significant main
effect of facial hair on perceived aggressiveness,
F(3) = 5.80, p < .001, ηp2 = .17. Supporting the
experimental hypothesis, participants who viewed
the clean-shaven politician reported significantly
lower levels of perceived aggressiveness (M =
2.68) when compared to participants who viewed
the mustached politician (M = 3.24), the bearded
politician (M = 3.49), and the politician with both

Vol. 20 No. 1 • Whitman Journal of Psychology 33
a beard and a mustache (M = 3.46). Tukey-HSD
post-hoc tests did not reveal any significant
differences between the mustache, beard,
and beard with mustache groups. Results are
displayed in Figure 2.
As hypothesized, facial hair significantly
decreased perceptions of competence, F(3)
= 4.69, p < .01, ηp2 = .14. The clean-shaven
politician was perceived to be more competent
(M = 3.61) than the mustached politician (M
= 2.68), the bearded politician (M = 2.97) and
the politician with the beard and the mustache
(M = 3.04). No significant differences between
the mustache, beard and beard and mustache
groups were found. Results are displayed in
Figure 3.
As can be seen in Figure 4, participants
who viewed the clean-shaven politician (M
= 2.95) reported significantly lower levels of
perceived conservatism when compared to
participants who viewed the mustached politician
(M = 3.90), the bearded politician (M = 3.75) and
the politician with both a beard and a mustache
(M = 3.89), F(3) = 4.39, p < .01, ηp2 = .13.
However, no significant differences between the
three facial hair groups were found.
As depicted in Figure 5, participants who
viewed the clean-shaven politician (M = 4.12)
were significantly more inclined to vote for him
than when compared to participants who viewed
the mustached politician (M = 2.61), the bearded
politician (M = 2.71), and the politician with the
beard and mustache (M = 2.43), F(3) = 10.25, p
< .00001, ηp2 = .26. Contrary to the hypothesis,
the three types of facial hair led to statistically
equivalent expressions of voting appeal.
When analyzed using an ANOVA, the four
types of facial hair led to statistically equivalent
expressions of perceived age, F(3) = 1.83, p =
.15, ηp2 = .06; however, the observed power
was unusually low. Researchers in the past
have employed a t-test to examine the effect
of facial hair on perceived age (Lino de Souza
et al., 2003; Muscarella & Cunningham, 1996;
Pellegrini, 1973; Wogalter & Hosie, 2001).
When analyzed using a t-test, facial hair made
the politician appear significantly older, t(89) =
-2.34, p = .02. The clean-shaven politician was
perceived as approximately three years younger
(M = 46.38) than the politicians with facial hair (M
= 49.48). This can be seen in Figure 6.
Perceived aggressiveness was negatively
correlated with voting appeal, r = -.52, p < .05.
Additionally, perceived age was significantly and
negatively correlated with voting appeal, r = -.38,
p < .05. These results are displayed in Figures 7
and 8, respectively.

Vol. 20 No. 1 • Whitman Journal of Psychology34
Discussion
As hypothesized, facial hair was found
to significantly increase perceptions of the
politician’s perceived aggressiveness. This
finding is consistent with work of previous
researchers (e.g., Addison, 1989; Kenny &
Fletcher, 1973; Pancer & Meindl, 1978; Pellegrini,
1973; Reed & Blunk, 1990; Roll & Verinis,
1971) and can be explained by Muscarella and
Cunningham’s (1996) theory. Participants may
have perceived the barbed politicians to be more
aggressive than the clean-shaven politician
because of seemingly larger size of the lower
jaw. This may have given the impression that
the politicians were antagonistic because of the
evolutionary connection to ferocity. This finding
may have also been influenced by common
stereotypes. Participants often commented that
the politician with both the beard and mustache
resembled a lumberjack, an occupation that is
associated with tremendous strength and virility.
Additionally, there has long been an association
in the media between mustaches and villainy
(Roll & Verinis, 1971). This may have led
participants to perceive the politicians with facial
hair as highly aggressive.
Consistent with recent theories,
aggressiveness was moderately and negatively
correlated with voting appeal. The older the
politician appeared, the less appealing he was
to participants. Being overly aggressive was not
appealing to participants, likely due to the fact that
many Americans want to see a politician with more
sympathetic traits (Huddy & Terkildsen, 1993).
Additionally, the politicians who were viewed as
highly aggressive may have also been perceived
as too supportive of violent means to solve
problems and not supportive enough of issues
such as the environment (Herrick et al., 2010).
Overall, the politicians with facial hair were
perceived as significantly less competent than the
clean-shaven politician. This result supports the
work of Muscarella and Cunningham (1996) and
Terry and Krantz (1993); however, it disproves
the findings from Reed and Blunk’s (1990)
investigation. The generally held stereotype is
that most competent professionals are clean-
shaven, while uneducated individuals tend to
have facial hair. It is likely that voters would
perceive a politician with a background requiring
education as more competent than a politician
who has less experience. In addition, Pellegrini
(1976) found that a bearded face was associated
with nonconformity. If this is true, the bearded
politician’s perceived nonconformity likely
detracted from his perceived competence.
The clean-shaven politician was
associated with liberalism, while the unshorn
politicians were associated with conservatism.
This finding is consistent with Herrick et al.’s
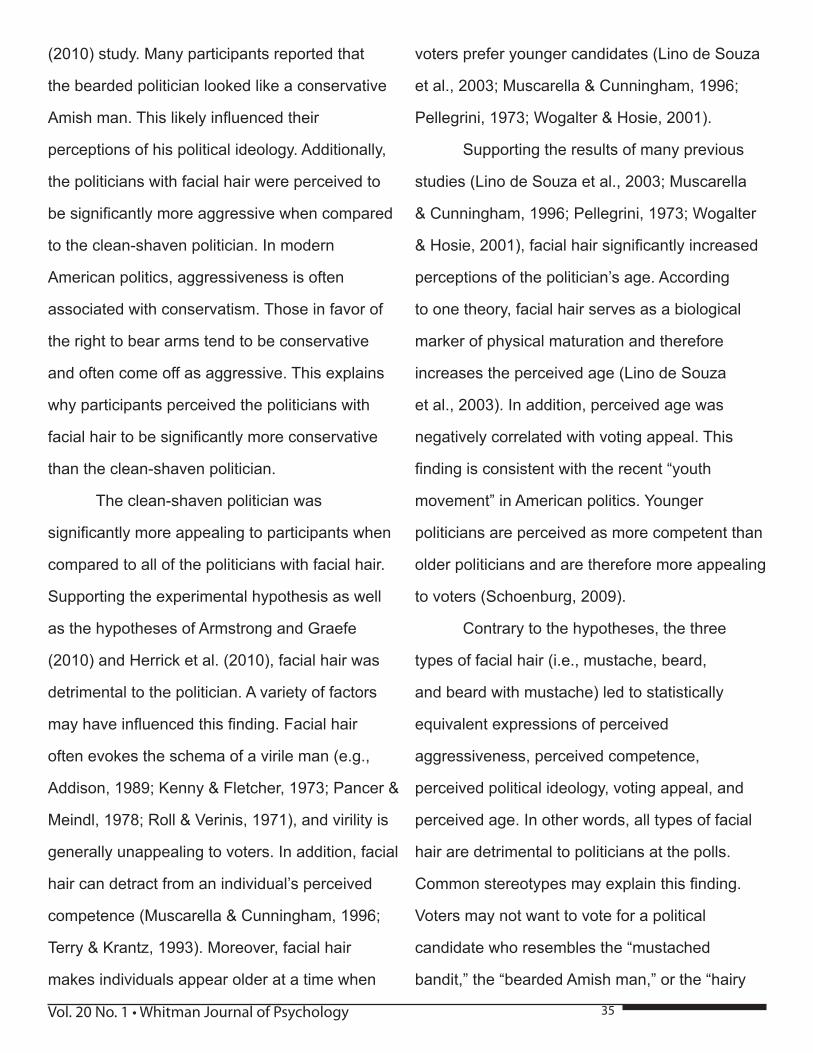
Vol. 20 No. 1 • Whitman Journal of Psychology 35
(2010) study. Many participants reported that
the bearded politician looked like a conservative
Amish man. This likely influenced their
perceptions of his political ideology. Additionally,
the politicians with facial hair were perceived to
be significantly more aggressive when compared
to the clean-shaven politician. In modern
American politics, aggressiveness is often
associated with conservatism. Those in favor of
the right to bear arms tend to be conservative
and often come off as aggressive. This explains
why participants perceived the politicians with
facial hair to be significantly more conservative
than the clean-shaven politician.
The clean-shaven politician was
significantly more appealing to participants when
compared to all of the politicians with facial hair.
Supporting the experimental hypothesis as well
as the hypotheses of Armstrong and Graefe
(2010) and Herrick et al. (2010), facial hair was
detrimental to the politician. A variety of factors
may have influenced this finding. Facial hair
often evokes the schema of a virile man (e.g.,
Addison, 1989; Kenny & Fletcher, 1973; Pancer &
Meindl, 1978; Roll & Verinis, 1971), and virility is
generally unappealing to voters. In addition, facial
hair can detract from an individual’s perceived
competence (Muscarella & Cunningham, 1996;
Terry & Krantz, 1993). Moreover, facial hair
makes individuals appear older at a time when
voters prefer younger candidates (Lino de Souza
et al., 2003; Muscarella & Cunningham, 1996;
Pellegrini, 1973; Wogalter & Hosie, 2001).
Supporting the results of many previous
studies (Lino de Souza et al., 2003; Muscarella
& Cunningham, 1996; Pellegrini, 1973; Wogalter
& Hosie, 2001), facial hair significantly increased
perceptions of the politician’s age. According
to one theory, facial hair serves as a biological
marker of physical maturation and therefore
increases the perceived age (Lino de Souza
et al., 2003). In addition, perceived age was
negatively correlated with voting appeal. This
finding is consistent with the recent “youth
movement” in American politics. Younger
politicians are perceived as more competent than
older politicians and are therefore more appealing
to voters (Schoenburg, 2009).
Contrary to the hypotheses, the three
types of facial hair (i.e., mustache, beard,
and beard with mustache) led to statistically
equivalent expressions of perceived
aggressiveness, perceived competence,
perceived political ideology, voting appeal, and
perceived age. In other words, all types of facial
hair are detrimental to politicians at the polls.
Common stereotypes may explain this finding.
Voters may not want to vote for a political
candidate who resembles the “mustached
bandit,” the “bearded Amish man,” or the “hairy

Vol. 20 No. 1 • Whitman Journal of Psychology36
brute” (Terry & Krantz, 1993). The limited sample
size may have also influenced this finding.
While participants were randomly selected,
the homogeneous nature of the sample is not
entirely representative of the general population
of American voters and therefore limits the
external validity of findings. By comparing the
present study’s demographics to the national
statistics from the 2009 United States Census
using one proportion z-tests, several groups were
found to be significantly underrepresented (e.g.,
African Americans and males), while others were
found to be significantly overrepresented (e.g.,
Caucasians and females) (United States Census
Bureau, 2009). Although participants were
asked to report their likelihood of voting for the
politician, they were not actually voting; therefore,
their willingness to vote for the Congressman
may not have been accurately measured.
The verisimilitude of the Adobe Photoshop
photographs may have also been a limiting factor.
It would be more practical to present a politician
with real facial hair.
Seeing as the present experiment was
conducted within the New York Metropolitan
Area, it would be valuable to extend this
line of research by collecting data in various
regions of the United States. Doing this would
provide a broader sample that would be more
representative of the population. It would also
be interesting to conduct a similar experiment
several years from now to see if voters’ attitudes
toward politicians with facial hair have changed.
It is clear that the number of politicians
with facial hair has been gradually declining
over the years, but, very few researchers have
examined this phenomenon. The present study
suggests that individuals are less likely to vote for
politicians that are visually displeasing to them.
Many voters make interpersonal judgments about
politicians solely off photographs and do not fully
understand or care about what the politicians
believe. Therefore, it is of utmost importance
that politicians appeal to voters ideologically as
well as aesthetically. Results indicate that facial
hair activates certain schemata and is a liability
for political candidates at the polls. It makes
politicians appear aggressive and incompetent.
In this day and age, facial hair is used as a voting
cue, and it is imperative that politicians seeking
office do not grow beards or mustaches in order
to maximize their chances of winning an election.

Vol. 20 No. 1 • Whitman Journal of Psychology 37
Figure 1. Photographs of politician
Figure 2. The impact of facial hair on perceived
aggressiveness
Figure 3. The impact of facial hair on perceived
competence.
Figure 4. The impact of facial hair on perceived
political ideology
Figure 5. The impact of facial hair on voting
appeal
Table 1. The impact of facial hair on perceived
aggressiveness, competence, political ideology,
and voting appeal
Figure 6. The impact of facial hair on perceived
age
Figure 7. The relationship between perceived ag-
gressiveness and voting appeal

Vol. 20 No. 1 • Whitman Journal of Psychology38
Figure 8. The relationship between perceived age
and voting appeal
References
Addison, W. E. (1989). Beardedness as a factor
in perceived masculinity. Perceptual and
Motor Skills, 68, 921-922.
Armstrong, J. S., & Graefe, A. (2010). Predict
ing elections from biographical information
about candidates: a test of the index
method. Manuscript submitted for publica-
tion, Marketing Department at the Whar-
ton School, University of Pennsylvania,
Philadelphia, PA. Retrieved from http://
marketing.wharton.upenn.edu/documents/
research/PollyBio77.pdf
Buchwald, A. (1984, April 9). Race or facial hair?
The Southeast Missourian, p. 3.
Bull, R., & Hawkes, C. (1982). Judging politicians
by their faces. Political Studies, 30, 95-101.
Charton, S., & Tinney, J. (2007, June 11). Univer-
sity of Missouri vice president John Gard-
ner appointed VP for Washington State
University. University of Missouri System.
Retrieved September 30, 2010, from http://
www.umsystem.edu/ums/news/releases/
news07061101.shtml
Hellström, Å., & Tekle, J. (1994). Person percep-
tion through facial photographs: effects of
glasses, hair, and beard on judgments of
occupation and personal qualities. Euro-
pean Journal of Social Psychology, 24, 693-
705.
Herrick, R., Mendez, J., & Pryor, B. (2010). Razors
edge: the politics of facial hair. Unpublished
manuscript, Department of Political Sci-
ence, Oklahoma State University, Stillwater,
OK. Retrieved from http://papers.ssrn.com/
sol3/papers.cfm?abstract_id=1643020##
Huddy, L., & Terkildsen, N. (1993). The conse-
quences of gender stereotypes for women
candidates at different levels and types of
office. Political Research Quarterly, 46(3),
503-525.
Kenny, C. T., & Fletcher, D. (1973). Effects of
beardedness on person perception. Per-
ceptual and Motor Skills, 37, 413-414.
Knight-Ridder Newspapers (1996, November 2).
Facial hair unacceptable for presidential
politics. Reading Eagle, p. 14.
Lino de Souza, A. A., Baião, V. B., & Otta, E.
(2003). Perception of men’s personal quali-
ties and prospect of employment as a func-

Vol. 20 No. 1 • Whitman Journal of Psychology 39
tion of facial hair. Psychological Reports,
92, 201-208.
Muscarella, F., & Cunningham, M. R. (1996). The
evolutionary significance and social percep-
tion of male pattern baldness and facial
hair. Ethology and Sociobiology, 17, 99-117.
Pancer, S., & Meindl, J. (1978). Length of hair and
beardedness as determinants of personality
impressions. Perceptual and Motor Skills,
46, 1328-1330.
Pedersen, E. L. (2001). Men’s head and facial hair
in the far west: 1873 to 1899. Clothing and
Textiles Research Journal, 19(4), 158-170.
Pellegrini, R. J. (1973). Impressions of male per-
sonality as a function of beardedness.
Psychology: A Journal of Human Behavior,
10, 29-33.
Reed, J. A., & Blunk, E. M. (1990). The influence
of facial hair on impression formation. So-
cial Behavior and Personality, 18(1), 169-
176.
Roll, S., & Verinis, J. S. (1971). Stereotypes of
scalp and facial hair as measured by the
semantic differential. Psychological Re-
ports, 28, 975-980.
Schoenburg, B. (2009, March 29). Young politi-
cians: trend or coincidence? The State
Journal-Register. Retrieved October 16,
2010, from
http://www.sj-r.com/news/x1931048925/Young-
politicians-Trend-or-coincidence
Shannon, M. L., & Stark, C. P. (2003). The influ-
ence of physical appearance on personnel
selection. Social Behavior and Personality,
31(6), 613-624.
Terry, R. L., & Krantz, J. H. (1993). Dimensions of
trait attributions associated with eyeglass-
es, men’s facial hair, and women’s hair
length. Journal of Applied Social Psychol-
ogy, 23(21), 1757-1769.
United States Census Bureau (2009). Race.
U.S. Census Bureau American Fact-
Finder. Retrieved February 13, 2011,
from http://factfinder.census.gov/serv-
let/DTTable?_bm=y&-context=dt&-
ds_name=ACS_2009_1YR_
G00_&-CONTEXT=dt&-mt_
name=ACS_2009_1YR_G2000_C02003&-
tree_id=306&-redoLog=false&-all_geo_
types=N&-geo_id=01000US&-format=&-_
lang=en
Wogalter, M. S., & Hosie, J. A. (2001). Effects of
cranial and facial hair on perceptions of age
and person. The Journal of Social Psychol-
ogy, 131(4), 589-591.

Vol. 20 No. 1 • Whitman Journal of Psychology40
Self Esteem vs. DeterminationLiz Smits, Alyx Ribble, Tia Fish, Amber Schroedl, and Michelle Witt
Advisor: Audrey Damon-WynneMcFarland High School
Abstract
After watching a video demonstrating
learned helplessness, a group of experimenters
becamine intrigued with the subject. In the film,
half of the students in a classroom were given
impossible word scrambles, while the other half
was given fairly easy word scrambles. The film
showed how students learn to give up easily
when they become discouraged by their other
classmates’ immediate success. After watching
this film the experimenters used this this idea to
form this experiment.
The goal of the experiment was to see if
there is a correlation between self-esteem and
determination. First high school students were
given a self-esteem test created by Dr. Morris
Rosenberg. They were asked to answer truthfully,
and were ensured that their information would
remain confidential. After the self-esteem tests
were completed, students were given a five ques-
tion quiz. This quiz consisted of word problems,
sequences, and word scrambles. The last ques-
tion was made impossible, so that students would
not finish too quickly. Students’ times were re-
corded as a way to measure their determination.
Their time was then compared with the score
they received on the self-esteem test.
Surprisingly, no correlation was found
between self-esteem and determination. These
results could be due to certain confounding
variables that were encountered throughout this
experiment.
Introduction
Learned helplessness refers to the hope-
lessness and passive resignation an animal or
human learns when they are unable to avoid
repeated aversive events (Myers 2001). This
means that people who have failed in the past
are more likely to give up in the future. Many ex-
periments have already been conducted on this
topic and have confirmed the results of learned
helplessness.
One of the most famous experiments on
this subject was done by Martin Seligman in
1975 and 1991. He strapped dogs in harnesses
and repeatedly shocked them with no chance
to escape the pain. Seligman would later place
the dogs in a situation were they could escape
the electric shocks by leaping over a hurdle, but
they still would not. The dogs were conditioned to
believe that they could not escape, so even when
they were given the opportunity, they did not take
it (Myers 2001).
The experimenters decided to branch off
this idea of learned helplessness to see if there
was a correlation between a person’s self-esteem

Vol. 20 No. 1 • Whitman Journal of Psychology 41
and their determination. We hypothesized that
a person with low self-esteem would give up
earlier on a difficult task than a person with a
higher self-esteem. This relates back to learned
helplessness, because if people feel bad about
themselves, they are less likely to work hard on
difficult tasks.
The difference between Seligman’s experi-
ment and this one is that self-esteem became
a factor. People, instead of dogs, were used as
subjects. Participants’ past experiences were
evaluated using self-esteem thinking that would
affect their determination in future situations. The
purpose of this experiment was not only to see
if there was a correlation between self-esteem
and determination, but also to see how similar
the results were to Seligman’s results concerning
learned helplessness.
Method
The participants in the study were high
school students randomly selected from classes
in McFarland High School. The selections were
made from two Physical Education classes with
students ranging from sophomores to seniors.
Students enrolled in study hall, foods class, and
marketing classes were also used, all of which
included students from 9th to 12th grade.
Before the experiment began, participants
were briefed and asked to sign a consent form to
confirm their participation.
Procedure
The hypothesis of the experiment pre-
sumed that people with higher self-esteem would
have more determination, and therefore work for
a longer period of time on a difficult quiz. Partici-
pants took both a self-esteem test and a five-
question quiz. Participants were informed that
anything they put down on either quiz would be
completely confidential since each person was
known not by name but by the number listed on
their test. The subjects were instructed to fill out
the self-esteem test with complete honesty and
to complete the five-question quiz to the best of
their ability. They were also told that when they
believed they had finished the quiz, they were to
turn it in to the researchers who then recorded
how long it took each participant.
The self-esteem test used was the ex-
act same one that Rosenberg used in his ex-
periment. The test consisted of ten questions in
which the students rated themselves with an-
swers of either strongly agree, agree, disagree,
or strongly disagree. Each of these answers was
given a score (0, 1, 2, or 3) and once the test was
finished being graded, the scores were added up
and given a score out of 30.
The five-question quiz consisted of prob-
lems such as word problems, pattern and number
sequences, and word scrambles. The problems
on this quiz became increasingly harder. The

Vol. 20 No. 1 • Whitman Journal of Psychology42
decision to format the quiz in such a way was in-
tentional, preventing the subjects from becoming
discouraged early on. In order to prevent the par-
ticipants from finishing too quickly, the last ques-
tion on the quiz was deliberately made impossible
to solve. The actual answers to the quizzes were
not as important as the time each participant
took, but the quizzes were graded regardless and
placed out of four.
Follow Up
At the end of each trial, the students in
each of the six classes were immediately de-
briefed after everyone finished the quiz. They
were told about the intentions of the study and
re-informed of their confidentiality. They were
also made aware of the possibility that the infor-
mation could be published, but confidentiality was
reinforced. Lastly, they were instructed to contact
any of the researchers with any questions or
concerns they may have had after the experiment
was finished.
Results
The data compiled from each of the six
classrooms proved the hypothesis wrong. Self-
esteem was found to have no correlation with de-
termination. The students were asked to answer
the self-esteem quizzes with honesty and were
reassured that all information would remain con-
fidential. No names would be given, and partici-
pants would be known by the number written on
their sheets. We found that students’ self-esteem
ranged from as low as five to as high as thirty,
thirty being highest possible score. Most of the
students’ scores were found in the upper teens
and twenties. According to Rosenberg, anything
above fifteen was thought of as normal, with few
self-esteem issues; however anything below
this was considered unhealthy and indicated the
presence of self-esteem issues. The results were
as suspected. Most students scored highly (there
were several thirties), while some scored well
below average.
After the self-esteem tests were collected,
students were instructed to start their quizzes.
When the students felt they were finished, they
were asked to turn in their tests and a time was
then recorded. As was suspected, the times
ranged greatly. The lowest time was 2:40, and
the highest was 12:29. Most classes’ times were
chunked together; once one student handed in
his or her quiz, the rest of the students would
hand in their quizzes shortly after. The average
times found were between three to six minutes,
while a few outliers took more than ten minutes.
We also figured out the number correct out of
four (excluding the fifth impossible question) each
student received, but this was not measured.
A high school math teacher was consulted,
and scatter plot graphs were created to show the
correlation between the time that was taken on

Vol. 20 No. 1 • Whitman Journal of Psychology 43
the quiz and the score each student received on
the self-esteem quiz. The time was changed to
seconds and then the data was entered to form a
scatter plot. All the data was entered into charts.
The graphs showed that there was no positive or
negative correlation between the two variables.
Each class looked very different from one anoth-
er, but for the most part the points were scattered
and randomly placed on the graph. This proves
that there is no correlation between self-esteem
and determination.
Discussion
Some potential errors with the experiment
are the environment the students were in while
completing the tests and the distractions they
were surrounded by. Because six different class-
es of students were tested, the environment they
were in varied. While three of the classes were
in a normal classroom seated at desks or tables,
two of the classes were in the gym and were
seated on the floor, and the last class was in a
computer lab. The students were also presented
with a number of different distractions. Many
students did not take the quiz seriously, and were
talking throughout the experiment. If it were to
be redesigned, all student participants would
be placed in the same environment. If the par-
ticipants had been seated in a classroom sepa-
rated by desks, the testing may have been taken
more seriously. Also, a small number of students
should be chosen, rather than a whole class of
students. This method limits distractions and peer
pressure by classmates, preventing students
from feeling rushed and pressured by those that
are giving up more quickly.
Since the results were not statistically
significant and the hypothesis was wrong, it was
concluded that self-esteem does not play a part
in determination. One explanation for this was
that the students did not take the experiment
seriously. Another was that some of the partici-
pants were older than the researchers and did
not have as much respect for researchers as
they would for an authority figure. Students were
also interrupted in the middle of their class work
so they were all rushed through the test in order
to continue their work. This could have resulted
in pressure to compete the work faster. It is also
possible that a lot of the students did not have
the motivation to really try on the quiz, so as
they saw other peers finishing, they were more
inclined to give up. Many of the classes also had
a wide range of grade levels in the classroom,
possibly leading the students of younger levels
to feel as if they needed to be done in the same
time as the older students.

Vol. 20 No. 1 • Whitman Journal of Psychology44
Sample Quiz
Please answer the following questions to the
best of your ability. If you cannot figure out any
questions feel free the pass or skip that question.
Remember all the quizzes are confidential.
1. For the following sequence of figures, deter-
mine the possible pattern, and draw the next
figure according to the pattern:
2. List the next three terms to complete the fol-
lowing pattern:
0,1,3,6,10.......
3. At a volleyball game, the players stood in a row
ordered by height. If Kent is shorter than Mischa,
Sally is taller than Mischa, and Vera is taller than
Sally, who is the tallest and who is the shortest?
4. Four years ago, Jane was twice as old as
Sam. Four years on from now, Sam will be 3/4 of
Jane’s age. How old is Jane now?
5. Unscramble the following word:
EMEERTPEUPT
References
Areas, Specialty. “University of Maryland Depart
ment of Sociology.” College of Behavioral
and Social Sciences - University of Mary
land - College of Behavioral & Social Sci
ences. Web. 24 Mar. 2011. <http://www.
bsos.umd.edu/socy/research/rosenberg.htm>.
Myers, David G. Psychology. Sixth ed. New York
City: Worth, 2001. Print.

Vol. 20 No. 1 • Whitman Journal of Psychology 45
Inside PsychologyInside Psychology

Vol. 20 No. 1 • Whitman Journal of Psychology46
Introduction
In the information age, the benefits of
technology are seen every day. Computers have
become faster and can hold more data, the
Internet connects people all around the world,
and cell phones allow people to do business
and parents to keep track of their children. While
benefits are blatant, dependence on technology
has become so great that some are becoming
addicted. Cell phone addiction is an emerging
dependence which inhibits both adults and
teenagers from leading normal lives. This article
will explore what it means to be addicted to a cell
phone, how it is becoming a major issue, and what
can be done to remedy the addiction.
What it means to be addicted to a cell phone
An addiction is a compulsive dependence
on a behavior or substance that has both physical
and psychological components. It is characterized
by the building up of a tolerance (the need for
a greater amount of the behavior or substance
to produce the same effect) and physiological
withdrawal symptoms when addictive cravings are
not satisfied.
Addictions can become especially
problematic when they begin to negatively affect
the way a person lives their life. People who are
consumed with an addiction exhibit impaired
judgement, lack of motivation resulting in shifted
priorities and antisocial behavior (“Psychology,”
2004).
Withdrawal occurs when people
attempt to break an addiction. The stronger
the addiction, the harder it is to break. Typical
emotional withdrawal symptoms include anxiety,
restlessness, poor concentration and higher
levels of irritability. Physical withdrawal symptoms
include muscle tension, faster heartbeat,
sweating and tightness in the chest. These
symptoms occur because the body is not used
to being without the substance, and therefore
has trouble functioning normally without it
(“Withdrawl”, 2001).
While cell phones do not contain
chemicals that the body adapts to, one can
become psychologically dependent on the feeling
of being connected. This leads to compulsive
behaviors such as constantly checking a cell
phone or being unable to leave the house
without a cell phone. The “cycle” of addiction is
as follows: first, a person will do the behavior
because it feels good, or “sensation seeking”,
and then they do the behavior because it
makes them feel better, or “self-medicating”
In The Loop? Cell Phone AddictionNathaniel Eckland and Hannah Storey
Walt Whitman High School, MD

Vol. 20 No. 1 • Whitman Journal of Psychology 47
(Webster, 2002). A person can transition quickly
from the voluntary period of their addiction to
the involuntary and compulsive period of their
addiction.
In September of 2006, Good Morning
America Weekend Edition challenged a couple
to go without cell phones for five days and track
their “withdrawal” through video diaries. Before
the challenge, the couple used over 4,000
minutes a month on their phones and described
their cell phones as “vital to their lives” (“Can
you”, 2007). Throughout the challenge, the
couple experienced distress and distrust of each
other, and both failed to actually go five full days
without using their phones. Dr. Harris Stratyner
of Mount Sinai Medical Center administered
the challenge. He was fascinated when he saw
that the cell phone had become the middleman
in their relationship, and described the couple
as having “classic signs of addiction” (“Can
you”, 2007). Similar to a drug but without the
chemicals, cell phones were able to produce
typical emotional withdrawal symptoms.
How Cell Phone Addiction is Becoming a
Major Issue
In June of 2008, two Spanish children,
ages 12 and 13, were admitted to a mental health
institution to be treated for their addiction to their
cell phones. The children were reported to have
“serious difficulties leading normal lives” because
of the amount of time they spent on their phones
(“Spain”, 2008). Both children were doing poorly
in school and had begun lying to their parents
since the cell phone “addiction” escalated. The
drop in grades and bad behavior are examples
of classic consequences of a serious addiction.
Similar to a drug addict going through a detox
process, the children had to learn to cope without
their cell phones for the three months while they
were in rehab.
While most teenagers are not sent to
rehabilitation for cell phone use, cell phones are
changing the ways teenagers view themselves
and their peers. According to a CTIA survey of
2000 American teens, cell phones have “become
a vital part of their identities” and are considered
a valid measure of social status and popularity
(Reardon, 2008). The survey reported that 28%
of teens see having the latest, coolest cell phone
as “absolutely essential” because their phones
“say things about them as people” (Reardon,
2008). This addictive behavior could possibly be
explained by Abraham Maslow’s Hierarchy of
Needs, a theory that ranks the “needs” people
must meet, in order, before they can reach their
true potential. One of the steps on the way to the
highest level, “self-actualization” is the need for
belonging with both friends and family. Maslow’s
hierarchy of needs explains addiction to the
feeling of being connected through the need for
Vol. 20 No. 1 • Whitman Journal of Psychology48
belonging (Kassin, 2004).
Cell phone overuse becomes a bigger
problem if the user has “underlying” depression
or anxiety (Frawley, 2007). When anxiety
disorders are paired with the stress that
comes when phone calls and messages are
not answered immediately, mild depression or
anxiety can actually worsen.
What can be done to remedy the “addiction”
The suggestions for treating a “cell phone
addiction” are simple. Like any other addiction,
the best way to overcome it is step by step.
Down-grading to a simpler phone with less
features means less applications to constantly
check. The number of hours that the phone
is used should be limited. This is especially
important for parents who think their children are
addicted to their phones (“Spain”, 2008).
Conclusion
While recent advances in technology, cell
phones especially, claiming to connect people
to their business and personal lives are alluring
and seem convenient, the level of dependence
people have on technology is only getting worse,
and is affecting people at younger and younger
ages. With both physical and psychological
ramifications, an addiction to cell phones is
debilitating to different aspects of a person’s life.
Cell phone addiction cannot be “treated” because
it is not an actual disease or disorder, but cell
phone use can be limited in order to reduce
the level of addiction or the risk of becoming
addicted.
References
Can you Live Without a Cell Phone? (2007,
January 10). Retrieved from http://
abcnews.go.com/GMA/OnCall/
story?id=2665376&page=1.
Frawley Birdwell, A. (2007, January 18). Addicted
to phones? Cell phone use becoming
a major problem for some, expert
says. Retrieved from http://news.ufl.
edu/2007/01/18/cell-addiction/.
Kassin, S. (2004). Psychology. New York:
Pearson Education.
Leshner, A. (2001, March). The Essence of Drug
Addiction. Retrieved from http://archives.
drugabuse.gov/published_articles/
Essence.html.
Puente, M., Balmori, A. (2007, March).
Addiction to cell phones: Are there
Neurophysiological Mechanisms Involved?
Proyecto, 61. Retrieved from http://www.
emfacts.com/papers/cell_addict_en.pdf.
Reardon, M. (2008, September 15). Teens View
Cell Phones as Essential. Retrieved
from http://news.cnet.com/8301-1035_3-
10041377-94.html.

Vol. 20 No. 1 • Whitman Journal of Psychology 49
Spain Treats Child Phone Addicts. (2008, June
13). Retrieved from http://news.bbc.
co.uk/2/hi/7452463.stm.
Webster, J. (2002, January 7). Addiction and
the Reward Circuit. Retrieved from http://
serendip.brynmawr.edu/bb/neuro/neuro00/
web3/Webster.html

Vol. 20 No. 1 • Whitman Journal of Psychology50
Introduction
Terrorism is defined as the “systematic
use of terror especially as a means of coercion”
(“Terrorism”). The word “terrorist” was first used
during the late 18th century in France, during the
Reign of Terror, part of the French Revolution
(Furstenberg, 2007). Since then, the image of
who a terrorist is and what that person does has
changed, and in recent decades, more and more
nations have been affected by terrorist attacks.
In the 1970’s, the study of the psychology
of terrorism emerged as a response to the
increasing number of terrorist attacks. During
the 1970’s and 1980’s, much of the research
related to European movements, such as the
Irish Republican Army in Northern Ireland and
the Red Army Faction (Baader-Meinhof Gang) in
Germany. However, recently attention has been
directed toward Islamic-fundamentalist groups
such as al-Qaeda. This article explores several
theories concerning terrorist motivations and
the different approaches researchers use when
studying terrorism.
Mentally Ill vs. Sane
For years, the most common explanation
given as to why someone transforms into a
terrorist was that they were mentally unstable
and most likely a psychopath. However, studies
about mental illness in terrorists have shown
that mental illness is not the answer. In fact,
“comparisons of terrorists with non-terrorists
brought up in the same neighborhoods find
psychopathology rates similar and low in both
groups” (McCauley). This data strengthens
the theory that terrorists are generally rational,
logical people who act the way they do because
of personal choice or societal pressure, not
because of a mental imbalance. The planning
and calculation required to plan a terrorist attack
demands intelligence and focus; therefore
individuals suffering from mental illness would
not have the mental capacity to successfully
complete these tasks. Overall, there is more
evidence supporting the idea that the majority of
terrorists who belong to a terrorist organization
are sane people.
Four Stages
In 2003, Randy Borum, Ph.d. published
an article about the progression from a regular
member of society to a terrorist. In it, he outlines
a four-stage process that most terrorists go
through. First, the person identifies an adverse
component of his or her environment. This may
be high unemployment rates, lack of opportunity
or any other factor that would inhibit personal
growth. Then, the person realizes that other
The Psychology of TerrorismMayhah Suri and Piya Chandramani
Walt Whitman High School, MD

Vol. 20 No. 1 • Whitman Journal of Psychology 51
people are not suffering due to this adverse
factor. A young person may realize that other
young people in different countries have fewer
problems finding employment and supporting
themselves, while they cannot find a job in their
country. This creates a feeling of injustice.
Next, the person finds a group to blame for this
adverse condition. For example, in terms of
unemployment, people often direct their sense
of injustice at immigrants for “stealing” their
jobs. Consequently, the person characterizes
the group who is responsible for the adverse
condition as a fundamentally bad or evil group
of people because “good people would not
intentionally inflict adverse conditions on others”
(Borum, 2003). The act of characterizing a group
of people as “bad people” dehumanizes them
and lessens the emotional impact of committing a
violent act against them (Borum, 2003).
Approaches
Drive Theory (Frustration-Aggression)
is known as the “master explanation” for
aggression. It is a two-part theory stating that
“aggression is always produced by frustration,
and frustration always produces aggression”
(Borum, 2004a, p.12). However, empirical
evidence shows that frustration does not always
lead to aggression. The drive-theory hypothesis
suggests that only frustration caused by extreme
disagreeability will lead to aggression. Thus,
this research implies that frustration leads to
anger, which consequently leads to aggression.
While subsequent research findings have, at
times, been inconsistent or contradictory “it is
reasonable to conclude that aversive stimuli do
facilitate, but probably not instigate, aggressive
behavior” (Borum, 2004a, p.12).
The Social Learning theory posits that
behaviors are learned through contingencies,
and established through actions and the
implications of these actions. According to this
theory, behaviors that produce positive or desired
outcomes are repeated, while behaviors followed
by aversive consequences are extinguished.
Although behavior can be learned and reinforced
through personal experience, it can also be
indirectly encouraged through speculation of
contingencies in one’s environment. Aggression
can be considered an example of a learned
behavior. Thus, “it is argued that through
observation we learn consequences for the
behavior, how to do it, to whom it should be
directed, what provocation justifies it, and when it
is appropriate” (Borum, 2004a, p.13). Therefore,
since terrorism is an extension of aggression, it
can also be deemed a learned behavior.
Another approach to studying terrorism
is social psychology. Group dynamics and the
desire to be a part of a society, even if it is
outside of the mainstream, are important reasons

Vol. 20 No. 1 • Whitman Journal of Psychology52
as to why a person joins a terrorist organization
(Hudson, 1999). These group-based cognitive
processes are also important factors in keeping
terrorist groups together. After joining a terrorist
organization, membership in that organization
becomes the most important part of how a
terrorist identifies him or herself. Leaders can
exploit the fact that belonging to the group is so
important to its members by applying tremendous
amounts of pressure to comply with the risk
of expulsion (Borum, 2004b). The force that
keeps these groups together despite often high
levels of internal tension is defining something
or someone as the common enemy. The
organization is good, the enemy is bad, and as
long as there is an enemy, the group will be able
to overcome internal dissidence (Borum, 2004b).
The theories of social psychology are perhaps
the most substantial arguments to the theory that
all terrorists are mentally unstable. Members
of terrorist organizations follow what is termed
“psycho-logic” (Hudson, 1999, p. 28). According
to this theory, people join terrorist organizations
because the organization’s definition of good and
evil is aligned with theirs. While this definition
may represent a flawed sense of reality, the
rest of the cognitive and behavioral processes
follow a logical order. This “psycho-logic” is the
reason that terrorist organizations are successful
in recruiting members. The leaders know their
audience and market the organization in a way
that makes rational sense to the recruits (Borum,
2004b).
Case Studies
Adam Yahiye Gadahn, formerly known as
Adam Pearlman, was born in Southern California
to a Christian family although Gadahn’s father
had converted to Judaism from Christianity.
As described by his peers in Santa Ana, CA,
Gadahn was very introverted and had very limited
social interaction. At the age of 17, Gadahn
was exposed to Islamic ideology by studying
the religion at the Islamic Society of Orange
County, California. In such an environment
where individuals share similar beliefs, group
polarization can occur where peoples’ initial
views are entrenched and intensified merely
by the presence of others holding the same
beliefs. Additionally, positive reinforcement
from like-minded group members could largely
account for developing or hardening views.
Once an individual becomes part of a group,
such as terrorist groups with extremist views,
deindividuation can occur, causing someone to
engage in violent acts or to act in a manner that
is aberrant. This fostering of hostile behavior and
encouragement by like-minded group members
could also promote mob mentality, which is
the tendency of people to behave in ways that
imitate actions of others in their group. Two years

Vol. 20 No. 1 • Whitman Journal of Psychology 53
later, following his conversion to Islam, Gadahn
was arrested for assaulting his former mentor,
Haytham Bundakji, due to Bundakji’s supposed
intimacy with the Jewish Community and
“interpretation of Islam” (Adam, 2007). In 1998,
Gadahn moved to Pakistan and was integrated
into Al Qaeda personnel as a translator and
propagandist.
David Headley, born a Pakistani-American
named Daood Gilani, was born to a Pakistani
father and an American mother. After his parents’
divorce, Headley moved to Pakistan with his
father where he was raised in a strict Muslim
environment until returning to the US where he
lived with his mother who worked as a bartender
in Philadelphia. The contradictory circumstances
under which he was brought up could have
generated internal cultural conflicts which may
have resulted in his radicalization. Headley’s
mother explains that “he would clearly state he
had contempt for infidels. He kept talking about
the return of the 14th century, saying Islam
was going to take over the world” (Fitzpatrick,
Fletcher, & James, 2009). Headley “allegedly
received training from Kashmiri separatist group
Lashkar-e-Taiba (LeT) from February 2002
to December 2003. The group, which aims to
drive Indian forces out of the disputed territory
of Kashmir, is considered a foreign terrorist
operation by the U.S. government” (Fitzpatrick
et al., 2009). Headley changed his originally
Pakistani name to an American name in order
to make his frequent travels to India easier.
After scoping out the areas surrounding the Taj
Mahal Hotel in Mumbai, Headley proceeded to
carry out an attack on the hotel in 2008 resulting
in the massacre of hundreds of people. The
frustration-aggression theory could provide some
explanation as to why Headley became so radical
in his beliefs. The distress and pain caused
by his parent’s divorce could have generated
feelings of alienation ultimately influencing his
transformation. The frustration he harbored from
his parents’ divorce could have, in turn, produced
feelings of disappointment in him which could
have evolved into hostility and aggression. This
theory, along with other social factors, could
provide insight into Headley’s dramatic revolution
into one of the world’s most brutal terrorists.
Conclusion
When analyzing a person’s motivation
for becoming a terrorist, it is difficult to ignore
economic, social, and religious factors to focus
solely on psychological reasons. Therefore, it is
difficult to make psychological diagnoses of what
type of person a terrorist is before becoming a
terrorist. Also, different researchers have found
different reasons and different characterizations
of terrorist motivations. Some psychologists
blame the terrorists’ environments, and others

Vol. 20 No. 1 • Whitman Journal of Psychology54
see the catalyst in personal failures. One
generally agreed upon idea, though, is that as
a population, terrorists “appear to have been
unsuccessful in obtaining a desired traditional
place in society, which has contributed to their
frustration. The underlying need to belong to a
terrorist group is symptomatic of an incomplete
or fragmented psychosocial identity” (Hudson,
1990, p. 25). While the reasons for their personal
failures may vary, it is an accepted theory that
most members of terrorist organizations have
been unable to find a role in whatever social
structure they were born into. In terrorism,
just as in any other field of psychology, the
varying theories, ideas, and the numerous
exceptions to the rules make it difficult to ascribe
one overall reason or solution. Although it is
difficult to attribute the cause of an individuals
radical transformation into a terrorist, there are
numerous developing theories and ideas, which
can provide insight into this progression.
References
Adam. (2007 May 31st). Adam yahiye gadahn.
Global Jihad. Retrieved from http://www.
globaljihad.net/view_page.asp?id=226
Borum, R. (2003, July). Understanding the
terrorist mindset retrieved from http://www.
au.af.mil/au/awc/awcgate/fbi/terrorist_
mindset.pdf
Borum, R. (2004). Psychology of Terrorism
retrieved from
http://www.ncjrs.gov/pdffiles1/nij/
grants/208551.pdf
Borum, R. (2004). Retrieved from http://
worlddefensereview.com/docs/
PsychologyofTerrorism0707.pdf
Fitzpatrick, L., Fletcher, D., James, Randy.
(2009 December 9th). Alleged terrorism
plotte David Headley. Time. Retrieved
from http://www.time.com/time/nation/
article/0,8599,1946462,00.html
Furstenberg, F. (2007, October 27). Bush’s
dangerous liaisons. The New York Times.
Retrieved from http://www.nytimes.
com/2007/10/28/opinion/28furstenberg.
html?ei=5087&em=&en=6 eaa390a911d2
d4&ex=1193803200&adxnnl=1&adxnnlx=1
305109763VtWxLRKfwSM a66EjppPLA
Hudson, R.A. (1999, September). The sociology
and psychology of terrorism: who
becomes a terrorist and why? retrieved
from http://www.au.af.mil/au/awc/
awcgate/loc/soc_psych_of_terrorism.pdf
McCauley, C.R. Psychology of terrorism retrieved
from http://essays.ssrc.org/sept11/essays/
mccauley.htm
Terrorism (n.d.). In Merriam-Webster.
com. Retrieved from http://www.
merriamwebster.com/dictionary/terrorism

Vol. 20 No. 1 • Whitman Journal of Psychology 55
Learned Helplessness Leo Doran and Corinne OsnosWalt Whitman High School, MD
Learned helplessness, in its generic dic-
tionary form, is defined as “a mental condition in
which one becomes unable to help oneself due to
previous failed attempts at controlling one’s life”
(Learned, n.d.). This is a fairly new concept that
was first researched in the 1960’s and is increas-
ingly being identified as the root of modern prob-
lems such as depression, poverty, and failure to
thrive. Learned helplessness is therefore be-
lieved to affect large portions of the world’s popu-
lation, and should continue to be studied closely.
At first, learned helplessness seems to
contradict one of the most fundamental psycho-
logical principles: operant conditioning. The term
operant conditioning was coined by renowned
behavioral psychologist B.F. Skinner, referring to
instincts present in both humans and animals to
continue behaviors once they are reinforced. In
other words, a subject will continue a behavior
to either avoid a negative response or to obtain
a positive one. For example, if a group of dogs
was subjected to an aversive stimulus such as a
shock that could only be ended through pressing
a lever, then the dogs would be reinforced nega-
tively to continue to press the lever in order to
avoid the pain. However, unexpected results oc-
curred when this experiment was slightly modified
by University of Pennsylvania psychologist Mar-
tin Seligman in 1967. In Seligman’s experiment,
there were three groups: Group A consisted of the
dogs that were merely harnessed (distressed) for
a duration of time then released. Group B con-
sisted of the dogs that received shocks but had
a lever to end the pain. Group C consisted of the
dogs that received shocks but had a lever that did
not relieve the pain. Seligman found that the dogs
in group A and B quickly recovered from the dis-
tress, but that the dogs in group C remained trau-
matized, resulting in an overall sense of apathy
and depression-like symptoms (Seligman, 1967).
Seligman therefore stumbled upon the idea of
learned helplessness which has been accepted
as a psychological condition ever since.
In the 1970’s Seligman’s theory was refor-
mulated to relate to depression. In fact, the two
are intertwined to a certain degree. According to
theorists, learned helplessness results in depres-
sion if three factors are in occurrence; the indi-
vidual is aware of uncontrollable factors in their
environment, the individual views the situation as
unchangeable, and the individual blames him or
herself for their helplessness. The two seem to be
intricately intertwined, as it stands to reason that
a common symptom of depression is feelings of
helplessness.

Vol. 20 No. 1 • Whitman Journal of Psychology56
Poverty
A primary cause of learned helplessness is
repeated exposure to events that are perceived
by the individual to be uncontrollable. This may
help to explain the cycle of poverty. Many per-
sons struggling to live amidst poverty may reach
the conclusion that the amount of effort they put
forth is futile, as they believe that they are inca-
pable of changing their present state. This usually
occurs after an individual attempts to break free
of the cycle of poverty repeatedly, and repeatedly
fails. The person may then adopt the belief that a
change of state is implausible, rendering the situ-
ation as completely out of his or her control.
Rather than continue attempts to im-
prove upon their situation, the poor who suffer
from learned helplessness will often give up and
accept what they have come to believe is their
fate. The eight hour, five day work week though
typical, may not be possible for these afflicted
individuals. Although they observe that it works
for others, they are overwhelmed by the pros-
pect that it will not work for them. In actuality, the
primary force holding these people back is their
apathetic perception of themselves.
The homeless, at the lowest tier of poverty,
are prime examples of the detrimental effects of
this phenomenon. Day after day many traipse
through the same routes begging for money and
hoping for generous onlookers. Usually, there are
more than a few of these onlookers. Therefore,
every time the homeless person is given some-
thing without having to work for it, the belief that
he or she can live this way is reinforced (Pa-
gliarini, 2010). This is essentially what it means
to ‘learn’ to be helpless. Generational poverty,
which is poverty that occurs in families where
two or more generations are affected, has also
been linked to learned helplessness (Engle, n.d.).
Here, the sentiments of defenselessness against
poverty are passed on to the children of the af-
fected, who then adopt the same point of view
and further continue the cycle (A Second Theory,
2011).
Elderly
Seligman’s theory can be further tied to
problems affecting the elderly, namely that of fail-
ure to thrive. This term refers to a deviation from
the normal that is characterized by declining vig-
or, weight, function, and reserve (Woolley, 2004).
Originally only a condition applied to infants, it
has now been expanded to also affect those in
their last years of life. Failure to thrive has been
used to “denote a range of circumstances includ-
ing physical and mental deterioration, abuse and
neglect, and rapidly progressing frailty” (Woolley,
2004).
The basis of this theory is that by refer-
ring to patients using the term ‘failure to thrive’,
can “reinforce the stereotype of elderly people as

Vol. 20 No. 1 • Whitman Journal of Psychology 57
demented and decrepit” and “may actually hinder
the urgent search for treatable, reversible causes
of an elder’s deterioration” (Woolley, 2004).
Further, it has been speculated that the label
promotes an “intellectual laziness” among the
elderly (Woolley, 2004). Relating to the condition
of learned helplessness, these individuals begin
to see themselves as incapable thereby acceler-
ating their demise.
Clara Fitzgerald, a health speaker at Se-
nior Years Family Education Day held in Camp-
bellford in 2005, is well versed in the connection
between learned helplessness and the elderly.
Fitzgerald asserts that caretakers of the elderly
often inadvertently encourage them to be more
dependent on their services and become “less
engaged in life” overall (Learned Helplessness an
Issue, 2005). If they are continuously assisted by
others because of this perceived incapability, they
may learn to believe they are helpless, even if
this is not the case. The help that is being pro-
vided may have the opposite of a beneficial effect
despite the good intentions, as passivity is taught
and reinforced.
In the words of Martin Seligman, “uncon-
trollable events can significantly debilitate organ-
isms; they produce passivity in the face of trau-
ma” (1972). Learned helplessness is a serious
problem because once “a person has adopted a
learned helplessness attitude, the likelihood of
developing further skills and resources is signifi-
cantly reduced,” which can hinder development
at any age (Kastenbaum, 1993). Although the
afflicted groups form large swaths of the popu-
lation, learned helplessness can manifest itself
in many other forms. It does not discriminate; it
can happen to anyone, at any age. In fact, most
people are afflicted with symptoms at some point
and merely unaware, but are able to pull them-
selves out before a downward spiral results.
When combating learned helplessness, it
is important to remember that the afflicted indi-
viduals still have the power to change unpleasant
circumstances, but that irrational schemas in their
minds have become impediments to changing
their behavior. In order to change the behavior,
one must make an effort to go against the sche-
ma to achieve at what they are convinced they
cannot.
References
Engle, D. (n.d.). Understanding Poverty. Re-
trieved May 9, 2011, from http://old.stjoan.
com/er6/poverty/poverty.htm
Learned Helplessness. (n.d.). Dictionary.com’s
21st Century Lexicon. Retrieved May 11,
2011, from Dictionary.com website: http://
dictionary.reference.com/browse/learned
helplessness

Vol. 20 No. 1 • Whitman Journal of Psychology58
Kastenbaum, R. (Ed.). (1993). Encyclopedia of
Adult Development. Phoenix: Oryx.
Learned Helplessness an Issue in Elder Care.
(2005, April 18). Retrieved May 7, 2011,
from Campbellford website: http://www.
retirementhomes.com
Pagliarini, R. (2010, March 8). Learned Helpless-
ness: The Secret to Being Poor. Retrieved
May 9, 2011, from http://moneywatch.bnet.
com/career-advice/blog/other-8-hours/the-
secret-to-being-poor/1288/
A Second Theory Regarding the Vicious Cycle of
Poverty: A Culture of Poverty. (2011, Janu-
ary 1). Retrieved May 10, 2011, from Real
Poverty website: http://www.realpoverty.
org/a-second-theory-regarding-the-vicious-
cycle-of-poverty-a-culture-of-poverty/
Seligman, M. (1967). Failure to Escape Traumatic
Shock. Journal of Experimental Psychology,
74, 1-9.
Seligman, M. (1972, February). Learned Help-
lessness. Annual Review of Medicine, 23,
407-412 . Retrieved from http://www.annual-
reviews.org/doi/abs/10.1146/annurev.me.23.
020172.002203?journalCode=med
Woolley, D. C., M.D., M.P.H. (2004, July 15). How
Useful Is the Concept of ‘Failure to Thrive’ in
Care of the Aged? [Editorial]. American Fam-
ily Physician, 248-257. Retrieved from http://
www.aafp.org/afp/2004/0715/p248.html
Related Documents