www.echo-health.eu Conclusions to draw from the analysis of variation in times of saving targets experiences from member countries of the ECHO Project Enrique Bernal-Delgado & Sandra García-Armesto

The Wennberg International Collaborative Policy Conference. E.bernal-delgado 20150529
Jul 28, 2015
Welcome message from author
This document is posted to help you gain knowledge. Please leave a comment to let me know what you think about it! Share it to your friends and learn new things together.
Transcript

www.echo-health.eu
Conclusions to draw from the analysis of variation in times of saving targets
experiences from member countries of the ECHO Project
Enrique Bernal-Delgado & Sandra García-Armesto

www.echo-health.eu
RESPONSES TO AUSTERITY
Health Foundation, 2014 WHO, 2014

www.echo-health.eu
• Limited efforts to promote structural change – Open and honest debate with all stakeholders before any
decision – Investing to implement more sustainable care models – Building upon the values and principles of the existing system
• Major changes without any programme to monitor or evaluate impact
• Short-term measures to reduce (or slow down growth of) public budget have been more prevalent – Services reduction, even closures – Wage restraints - Workforce constrains – Increasing users cost sharing (out of pocket, taxes increase) – Policies on pharmaceutical pricing

www.echo-health.eu
SAVINGS VS. VALUE

www.echo-health.eu
• Macro – insurer level – Priori authorization / Selective Dropping / Limiting indications – Patients cost sharing – Value based insurance design
• Meso – purchasers – Risk sharing – Capitation / Pay for performance – Care coordination – Benchmarking upon performance profiles
• Micro – clinical – Clinical decision support tool – Clinician feed back – – Patient education and empowerment
Proposals to increase value
Colla C Swimming Against the Current – What might work to reduce low-value care NEJM 2014;371:1280-3

www.echo-health.eu
ATLAS VPM & ECHO Use the routinely collected data – administrative data – to map out and monitor differences in performance across providers

www.echo-health.eu

www.echo-health.eu
Basic features
• ECHO employs routinely collected administrative data – hospital discharges, demographic and socioeconomic data, supply features.
• ECHO has set about the task of bringing together patient-level data from Austria, Denmark, England, Portugal, Slovenia and Spain, making them comparable – 200 million episodes
• ECHO is expanding the usual approach in healthcare performance
international comparison (built upon average values and average benchmark), adding variation within and across countries.
• Systematic variation is shown for a variety of comparable
performance indicators

www.echo-health.eu
HOW ARE ATLAS VPM & ECHO CONTRIBUTING TO INCREASE VALUE
Engaging stakeholders Eliciting variations in value reliably Backing dialogue on policy and organizational change
www.echo-health.eu
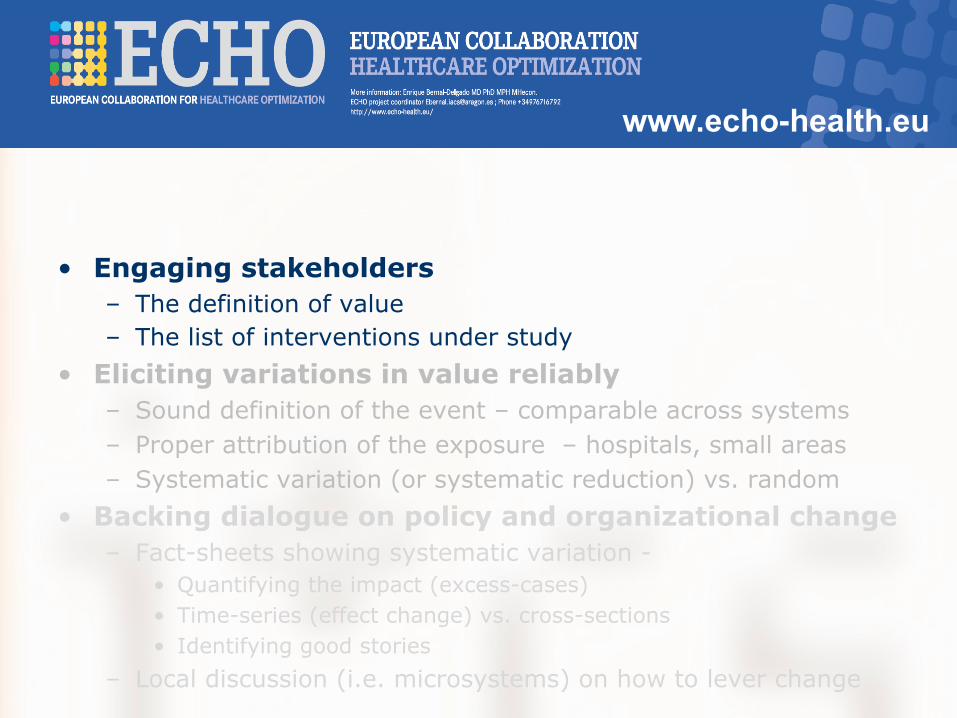
• Engaging stakeholders – The definition of value – The list of interventions under study
• Eliciting variations in value reliably – Sound definition of the event – comparable across systems – Proper attribution of the exposure – hospitals, small areas – Systematic variation (or systematic reduction) vs. random
• Backing dialogue on policy and organizational change – Fact-sheets showing systematic variation -
• Quantifying the impact (excess-cases) • Time-series (effect change) vs. cross-sections • Identifying good stories
– Local discussion (i.e. microsystems) on how to lever change

www.echo-health.eu
DEFINITION OF VALUE
Underuse of effective interventions Effective interventions applied to non-eligible patients Interventions with a more cost-effective alternative Essentially ineffective interventions Low quality interventions Unsafe interventions

www.echo-health.eu
• Engaging stakeholders – The definition of value – The list of interventions under study
• Eliciting variations in value reliably – Sound definition of the event – comparable across systems – Proper attribution of the exposure – hospitals, small areas – Systematic variation (or systematic reduction) vs. random
• Backing dialogue on policy and organizational change – Fact-sheets showing systematic variation -
• Quantifying the impact (excess-cases) • Time-series (effect change) vs. cross-sections • Identifying good stories
– Local discussion (i.e. microsystems) on how to lever change
www.echo-health.eu
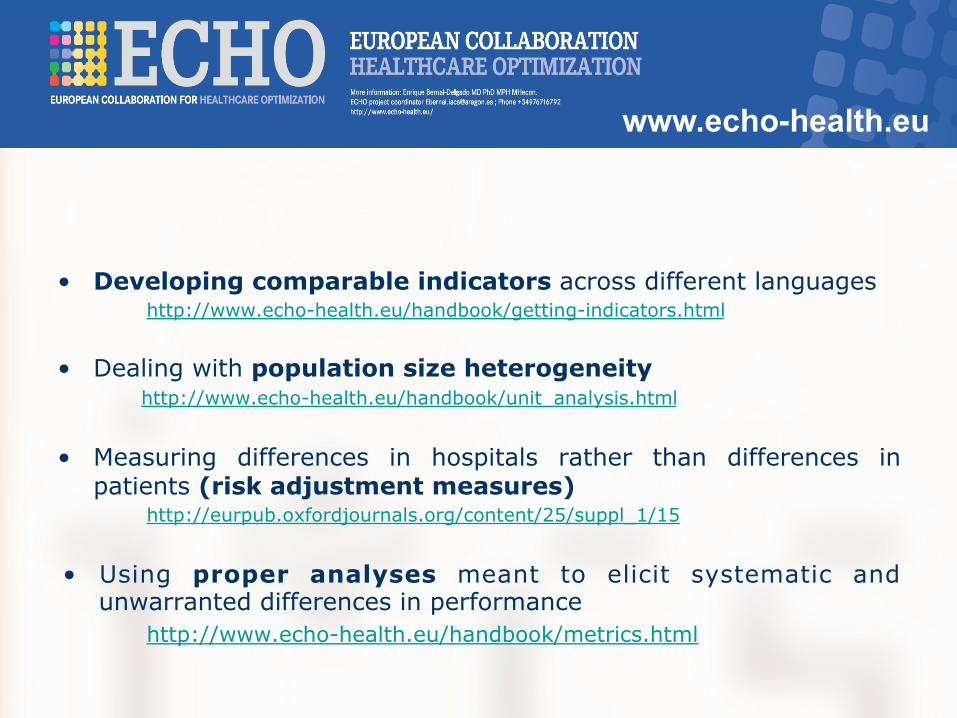
• Developing comparable indicators across different languages http://www.echo-health.eu/handbook/getting-indicators.html
• Dealing with population size heterogeneity http://www.echo-health.eu/handbook/unit_analysis.html
• Measuring differences in hospitals rather than differences in patients (risk adjustment measures)
http://eurpub.oxfordjournals.org/content/25/suppl_1/15
• Using proper analyses meant to elicit systematic and unwarranted differences in performance
http://www.echo-health.eu/handbook/metrics.html

www.echo-health.eu
• Engaging stakeholders – The definition of value – The list of interventions under study
• Eliciting variations in value reliably – Sound definition of the event – comparable across systems – Proper attribution of the exposure – hospitals, small areas – Systematic variation (or systematic reduction) vs. random
• Backing dialogue on policy and organizational change – Fact-sheets showing systematic variation -
• Quantifying the impact (excess-cases) • Time-series (effect change) vs. cross-sections • Identifying good stories
– Local discussion (i.e. microsystems) on how to lever change

www.echo-health.eu
Impact [Potentially avoidable hospitalizations in chronic and fragile patients]
STANDARDIZED RATES POTENTIALLY AVOIDABLE CASES

www.echo-health.eu
.
Over time evolution C-section in low risk deliveries

www.echo-health.eu Good stories to learn from [Mortality after PCI]
www.echo-health.eu

www.echo-health.eu
EXAMPLES OF VARIATIONS IN LOW-VALUE CARE IN THE ECHO COUNTRIES
Additional material

www.echo-health.eu
0 5 10 15 20 25 30 35 40 45 50 55 60 65 70 75
Q1 Q2 Q3 Q4 Q5
Underuse of effective care [PCI burden of ischemic disease and social gradient]
PC
I sta
ndar
dize
d ra
te
Burden of ischemic disease
0
6
12
18
24
30
2002 2003 2004 2005 2006 2007 2008 2009
Standardised Rate
Q1 Q2 Q3 Q4 Q5
Blue line represents PCI rate in the less affluent areas; red line represents PCI
rates in the better off areas. Is there underuse in the worse off areas?
Each dot represents a healthcare area – age-sex standardized rate. Q1 to Q5 represent quintiles of ischemic disease rates. Q1 the lowest burden, Q5 the highest burden. Is there underuse of PCI in the areas in Q5 inside circle?

www.echo-health.eu
DENMARK ENGLAND PORTUGAL SLOVENIA SPAIN
SR 40.13 19.55 7.02 21.45 8.58
EQ5-95 1.66 4.69 46.80 3.54 35.36
SCV 0.16 0.28 2.19 0.20 1.26
.
Effective surgery in non-eligible patients [C-section in low risk deliveries]
Dots represent areas – age-sex standardized rates (natural scale on the left, normalized scale on the right). SR: standardized rate; EQ5-95: ratio between the 5th and 95th percentile. SCV: Systematic Component of Variation. Map represents standardized utilization ratio – bluish areas are above the expected

www.echo-health.eu Intervention with existing more cost-effective alternative [Hysterectomy in benign conditions]
DENMARK ENGLAND PORTUGAL SLOVENIA SPAIN
SR 21.84 19.01 21.44 18.18 14.77
EQ5-95 1.98 2.27 1.83 2.34 2.95
SCV 0.14 0.07 0.09 0.04 0.09
Dots represent areas – age-sex standardized rates (natural scale on the left, normalized scale on the right). SR: standardized rate; EQ5-95: ratio between the 5th and 95th percentile. SCV: Systematic Component of Variation. Map represents standardized rates– the darker the colour, the higher the rate.

www.echo-health.eu Essentially ineffective care [Tonsillectomy in children]
DENMARK ENGLAND PORTUGAL SLOVENIA SPAIN
SR 33.4 39.8 62.3 83.7 30.1
EQ5-95 3.9 2.5 3.4 2.5 4.8
SCV 0.21 0.09 0.34 0.66 0.23
Dots represent areas – age-sex standardized rates (natural scale on the left, normalized scale on the right). SR: standardized rate; EQ5-95: ratio between the 5th and 95th percentile. SCV: Systematic Component of Variation. Map represents excess cases with regard to areas in Percentile 10th of the distribution of rates – the darker the colour, the higher the excess-cases.

www.echo-health.eu
-50
0
50
100
150
200
Adj
uste
d C
ase
Fata
lity
Rat
e x
1,00
0 pa
tient
s
0 500 1000 1500
Patient undergoing surgery
CI-95 CI-99
RIS
K-AD
JUSTE
D C
ASE
FATA
LITY
RAT
ES -
(CABG
) Low quality care [Mortality after CABG]
Dots represent hospitals - adjusted case-fatality rate in patients undergoing CABG. Hospitals beyond the
upper confidence interval represent either alerts (beyond the red line) or alarms (beyond the dashed-line)
Conversely, those hospitals beyond the lower confidence intervals are good or the best performers.

www.echo-health.eu Unsafe care [PTE & DVT after surgery]
Denmark England Portugal Slovenia Spain aIR 1,43 7,55 0,87 4,36 1,87 EQ 25-‐75 2,11 1,48 3,84 2,04 3,16
Dots represent hospitals - adjusted incidence of Pulmonary Thromboembolism and Deep Venous Thrombosis (natural scale on the left, normalized scale on the right).
Table: aIR: adjusted incidence rate; EQ25-75: ratio between the 1st and 3rd quartile.

www.echo-health.eu
Conclusions to draw from the analysis of variation in times of saving targets
experiences from member countries of the ECHO Project
Enrique Bernal-Delgado & Sandra García-Armesto
Related Documents