Michael Shaoul,Ph.D. [email protected] No employee of Marketfield, nor Marketfield itself, receives compensation directly or indirectly in connection with the opinions expressed in this report. Please see the important disclosures at the end of the report for more complete information. The Weekly Speculator May 09, 2013 Timothy Brackett [email protected] Ranita Ragunathan [email protected] Brendan Moynihan [email protected] Due to a full days travel on Wednesday, we will confess to writing this week’s summary on Tuesday afternoon and so we trust that if markets make us look foolish over the next 24 hours, our readers will have some understanding. Our view in recent weeks was that the US equity market was undergoing an important consolidation between 1550 and 1600 in the SPX. While internal risks from earnings seemed to us to be negligible (this has proved to be another solid earnings season overall) and US economic data was likely to avoid a spring swoon, we had been concerned of external pressures coming either from a rapid rise in domestic US interest rates or from a further collapse of sentiment in the emerging market complex. Put simply neither of the latter have yet taken place, although relative performance has of course been terrible. This is yet more evidence of our thesis that in a world of excess liquidity, the early stages of a bear market are more likely to make themselves felt via relative underperformance than actual price loss. To be clear this is a much more pleasant state of affairs; we would rather suffer an opportunity cost of 15% (as has been the case of emerging market equities versus the SPX so far this year) and be flat for the year than suffer a drawdown of a similar amount, but it does help sharpen the senses. This matters a great deal, since 2013 has been the first time since the start of this bull market that a well diversified basket of credit, gold and non-US equities has stalled in the face of torrid gains being delivered by US equities. The events of last week therefore strike us as potentially momentous, with the solid economic data supplied by the ISM, Initial claims and Non-Farm Payroll reports greatly reducing the risk of a spring “data swoon” and the subsequent burst through 1,600 by the SPX allowing the index to enter blue sky territory for the first time in 13 years (we are ignoring the fact that the 2007 high briefly exceeded that of the 2000’s, since the writing was already on the wall for that economic cycle by the time this took place).

The Weekly Speculator - Raymond James Financial · 2013-05-16 · [email protected] No employee of Marketfield, ... The Weekly Speculator May 09, 2013 Timothy Brackett ... notching
Jul 09, 2018
Welcome message from author
This document is posted to help you gain knowledge. Please leave a comment to let me know what you think about it! Share it to your friends and learn new things together.
Transcript

Michael Shaoul,[email protected]
No employee of Marketfield, nor Marketfield itself, receives compensation directly or indirectly in connection with the opinions expressed in this report.Please see the important disclosures at the end of the report for more complete information.
The Weekly SpeculatorMay 09, 2013
Timothy [email protected]
Ranita [email protected]
Brendan [email protected]
Due to a full days travel on Wednesday, we will confess to writing this week’s summary on Tuesday afternoon and so we trust that if markets make us look foolish over the next 24 hours, our readers will have some understanding. Our view in recent weeks was that the US equity market was undergoing an important consolidation between 1550 and 1600 in the SPX. While internal risks from earnings seemed to us to be negligible (this has proved to be another solid earnings season overall) and US economic data was likely to avoid a spring swoon, we had been concerned of external pressures coming either from a rapid rise in domestic US interest rates or from a further collapse of sentiment in the emerging market complex.
Put simply neither of the latter have yet taken place, although relative performance has of course been terrible. This is yet more evidence of our thesis that in a world of excess liquidity, the early stages of a bear market are more likely to make themselves felt via relative underperformance than actual price loss. To be clear this is a much more pleasant state of affairs; we would rather suffer an opportunity cost of 15% (as has been the case of emerging market equities versus the SPX so far this year) and be flat for the year than suffer a drawdown of a similar amount, but it does help sharpen the senses. This matters a great deal, since 2013 has been the first time since the start of this bull market that a well diversified basket of credit, gold and non-US equities has stalled in the face of torrid gains being delivered by US equities.
The events of last week therefore strike us as potentially momentous, with the solid economic data supplied by the ISM, Initial claims and Non-Farm Payroll reports greatly reducing the risk of a spring “data swoon” and the subsequent burst through 1,600 by the SPX allowing the index to enter blue sky territory for the first time in 13 years (we are ignoring the fact that the 2007 high briefly exceeded that of the 2000’s, since the writing was already on the wall for that economic cycle by the time this took place).
2
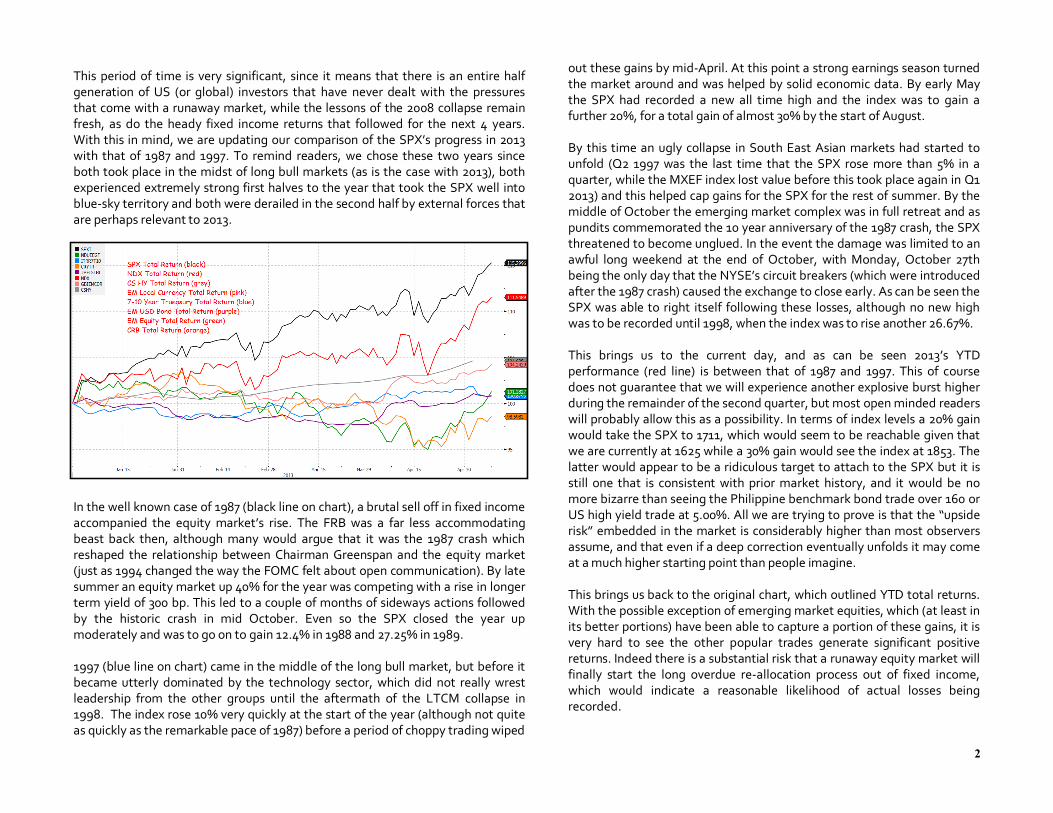
This period of time is very significant, since it means that there is an entire half generation of US (or global) investors that have never dealt with the pressures that come with a runaway market, while the lessons of the 2008 collapse remain fresh, as do the heady fixed income returns that followed for the next 4 years. With this in mind, we are updating our comparison of the SPX’s progress in 2013 with that of 1987 and 1997. To remind readers, we chose these two years since both took place in the midst of long bull markets (as is the case with 2013), both experienced extremely strong first halves to the year that took the SPX well into blue-sky territory and both were derailed in the second half by external forces that are perhaps relevant to 2013.
In the well known case of 1987 (black line on chart), a brutal sell off in fixed income accompanied the equity market’s rise. The FRB was a far less accommodating beast back then, although many would argue that it was the 1987 crash which reshaped the relationship between Chairman Greenspan and the equity market (just as 1994 changed the way the FOMC felt about open communication). By late summer an equity market up 40% for the year was competing with a rise in longer term yield of 300 bp. This led to a couple of months of sideways actions followed by the historic crash in mid October. Even so the SPX closed the year up moderately and was to go on to gain 12.4% in 1988 and 27.25% in 1989.
1997 (blue line on chart) came in the middle of the long bull market, but before it became utterly dominated by the technology sector, which did not really wrest leadership from the other groups until the aftermath of the LTCM collapse in 1998. The index rose 10% very quickly at the start of the year (although not quite as quickly as the remarkable pace of 1987) before a period of choppy trading wiped
out these gains by mid-April. At this point a strong earnings season turned the market around and was helped by solid economic data. By early May the SPX had recorded a new all time high and the index was to gain a further 20%, for a total gain of almost 30% by the start of August.
By this time an ugly collapse in South East Asian markets had started to unfold (Q2 1997 was the last time that the SPX rose more than 5% in a quarter, while the MXEF index lost value before this took place again in Q1 2013) and this helped cap gains for the SPX for the rest of summer. By the middle of October the emerging market complex was in full retreat and as pundits commemorated the 10 year anniversary of the 1987 crash, the SPX threatened to become unglued. In the event the damage was limited to an awful long weekend at the end of October, with Monday, October 27th being the only day that the NYSE’s circuit breakers (which were introduced after the 1987 crash) caused the exchange to close early. As can be seen the SPX was able to right itself following these losses, although no new high was to be recorded until 1998, when the index was to rise another 26.67%.
This brings us to the current day, and as can be seen 2013’s YTD performance (red line) is between that of 1987 and 1997. This of course does not guarantee that we will experience another explosive burst higher during the remainder of the second quarter, but most open minded readers will probably allow this as a possibility. In terms of index levels a 20% gain would take the SPX to 1711, which would seem to be reachable given that we are currently at 1625 while a 30% gain would see the index at 1853. The latter would appear to be a ridiculous target to attach to the SPX but it is still one that is consistent with prior market history, and it would be no more bizarre than seeing the Philippine benchmark bond trade over 160 or US high yield trade at 5.00%. All we are trying to prove is that the “upside risk” embedded in the market is considerably higher than most observers assume, and that even if a deep correction eventually unfolds it may come at a much higher starting point than people imagine.
This brings us back to the original chart, which outlined YTD total returns. With the possible exception of emerging market equities, which (at least in its better portions) have been able to capture a portion of these gains, it is very hard to see the other popular trades generate significant positive returns. Indeed there is a substantial risk that a runaway equity market will finally start the long overdue re-allocation process out of fixed income, which would indicate a reasonable likelihood of actual losses being recorded.
S&P 500
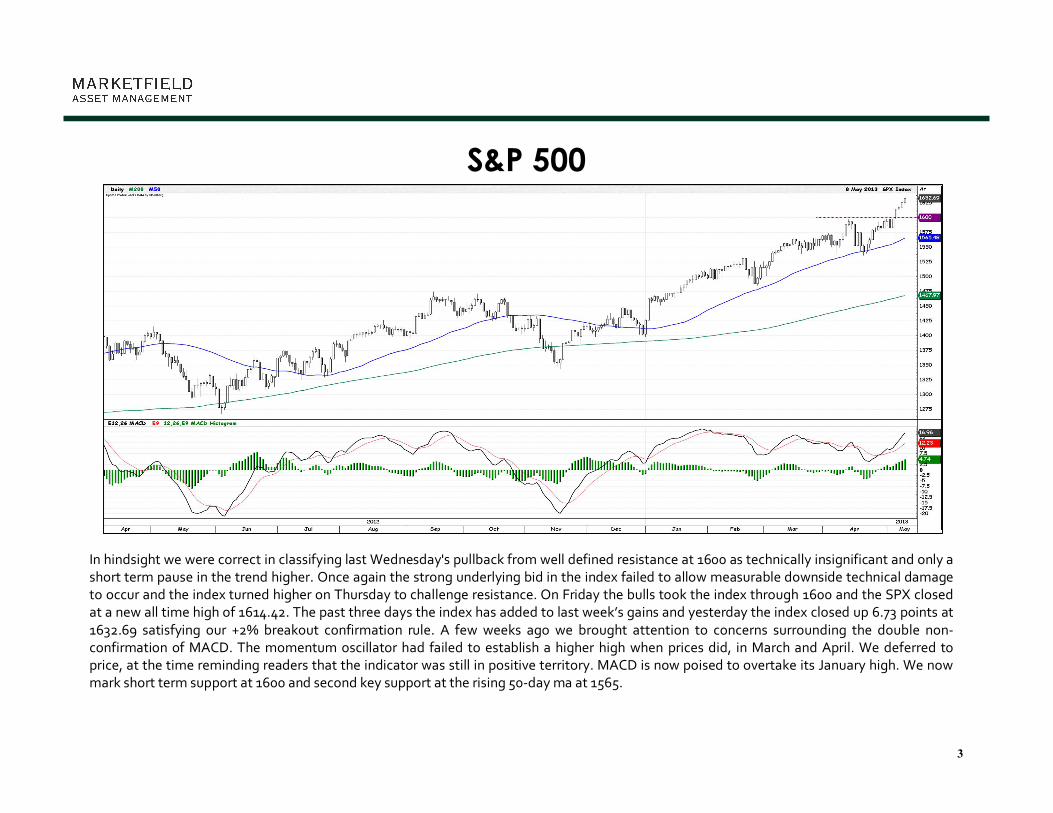
In hindsight we were correct in classifying last Wednesday's pullback from well defined resistance at 1600 as technically insignificant and only a short term pause in the trend higher. Once again the strong underlying bid in the index failed to allow measurable downside technical damage to occur and the index turned higher on Thursday to challenge resistance. On Friday the bulls took the index through 1600 and the SPX closed at a new all time high of 1614.42. The past three days the index has added to last week’s gains and yesterday the index closed up 6.73 points at 1632.69 satisfying our +2% breakout confirmation rule. A few weeks ago we brought attention to concerns surrounding the double non-confirmation of MACD. The momentum oscillator had failed to establish a higher high when prices did, in March and April. We deferred to price, at the time reminding readers that the indicator was still in positive territory. MACD is now poised to overtake its January high. We now mark short term support at 1600 and second key support at the rising 50-day ma at 1565.
3

NASDAQ 100
In concert with the strong rally in the broader US equity market late last week, the NDX was able to extend its gains and move farther away from previous resistance, now short term support at the 2875. MACD has turned higher, breaking out of the sideways churn that had been in place since the end of last year and is tracking higher. This week’s chart of the NDX includes an additional panel below MACD. This charts the relative performance of the NDX vs. the SPX. Since the low last November the NDX has underperformed the large cap index, struggling to keep pace with the broader market. That trend has been quietly changing since the beginning of this month, when the indicator broke out of its intermediate term downtrend and suggested that at the very least that the NDX would participate more fully in any continuation of the rally in the broader equity market. We now mark key secondary support at the 2850 level.
4

Russell 2000
In our note on the RTY in last week's Speculator, we brought attention to the "distributive" qualities of the consolidation pattern that had been developing in the index over the past three months. Buyers of small cap stocks finally ate through that supply in the RTY and broke out to a new high last Friday. Prices have continued to rally this week, notching a five day gain of 1.68% in the index vs. a 1.13% gain in the SPX and 0.80% in the NDX. This sharp turn in MACD reminds us of the sharp move in the oscillator last November, when prices lifted off the lows. We are raising key support to the 920 level.
5

VXO
The VXO Index pushed lower toward the bottom of the previously identified range of 11.00 to 16.00 closing at 11.57 yesterday, the lowest since the March 15 low of 10.56. Entrenching itself in this narrow of a range is not without precedent. The VXO traded between 11.00 and 18.00 from September 2004 until May 2006, a period when the SPX Index rose 20%. Elsewhere, the more widely watched VIX Index resumed its more traditional pattern of moving opposite the SPX about 80 % of the time. At the end of April, the two moved in lock-step for 4 consecutive days, the longest stretch since February 2007, when the subprime crisis first reared its head. That string suggested a general belief that the stock market rally would stall as investors paid up to take out equity market protection as the SPX scored new all-time high. It is also indicative of the fact that there is an entire half generation of US (or global) investors that have never dealt with the pressures that come with a runaway market.
6

Morgan Stanley Emerging Markets
The MXEF’s close above its 50 day ma last week proved sufficient for the index to make a successful assault on resistance at 1,040 and has since managed to tack on gains to close at 1,061.62 at yesterday. The relative underperformance of the MXEF versus the SPX thus far this year stimulated flows over the past 2 weeks, and now the burden of proof lies with the bulls as to whether they are willing to carry the market through strong resistance at 1,075-1,085, a level that topped the market in February 2012 and again in January of this year. Momentum has turned up and this will tend to support the market in the near term. Initial support is at 1,040.
7

10 Year Treasury Note
The two month long grind lower in 10 year yields came to a terminus at just above the 1.60% level last Wednesday. Last Friday's Non-Farm Payroll Report brought on a sharp reversal in the intermediate trend, with yields rallying more than 11bps that day. This was the largest one day move in 10 year rates (in either direction) since September of last year and it appears as though a number of people were caught wrong footed. Such a sharp move from just above key support reduces the odds that the yields reached in the fall of last year will be tested. That said it still remains to be seen whether 10 year yields will remain range bound or move higher. What we can say is that the recent price action further suggests that it is an excellent time to reduce exposure to long dated treasuries.
8

US Dollar
Aside from an oversold bounce in the USD late last week from just above the 81.25, and the backing and filling price action that has unfolded this week, the USD remains mired in a longer term trading range that is occasionally interrupted by shorter term trending moves. The shorter term sideways meanderings have been in concert with MACD waffling above and below dead neutral as we witnessed in the December-January period. The flattening of the momentum indicator since the start of this month may be suggesting that the greenback is about to enter another phase of sideways chop. Our longer term thesis remains unchanged, in that it would require either a move below 78.50 or above the 84 level for the index to be seen breaking out of the longer term range. That said, we continue to believe that the fundamental strength accumulating in the USD makes an upside breakout more likely.
9

Gold
Gold prices have tracked sideways over the past five trading days in a $45.00 range between $1,440 and $1,485. The yellow metal is in the middle of what we still classify as a recovery rally, which at Friday's intraday peak had recovered 61.8% of the four day selloff that started on April 9th. It may be that there is additional upside to the oversold rally, but at some point the appetite of global retail investors who believe they are capturing bargain prices will become satiated. When prices resume their pullback, gold will likely find short term support at $1,400 with a failure to hold that level leading to a full retest of the April 16th low. Any extension of the oversold rally should find resistance at last week’s high ($1,485) and the 50 day ma ($1, 530); the latter should be sufficiently strong to resist any attempt by the bulls to extend its gains.
10
Crude Oil
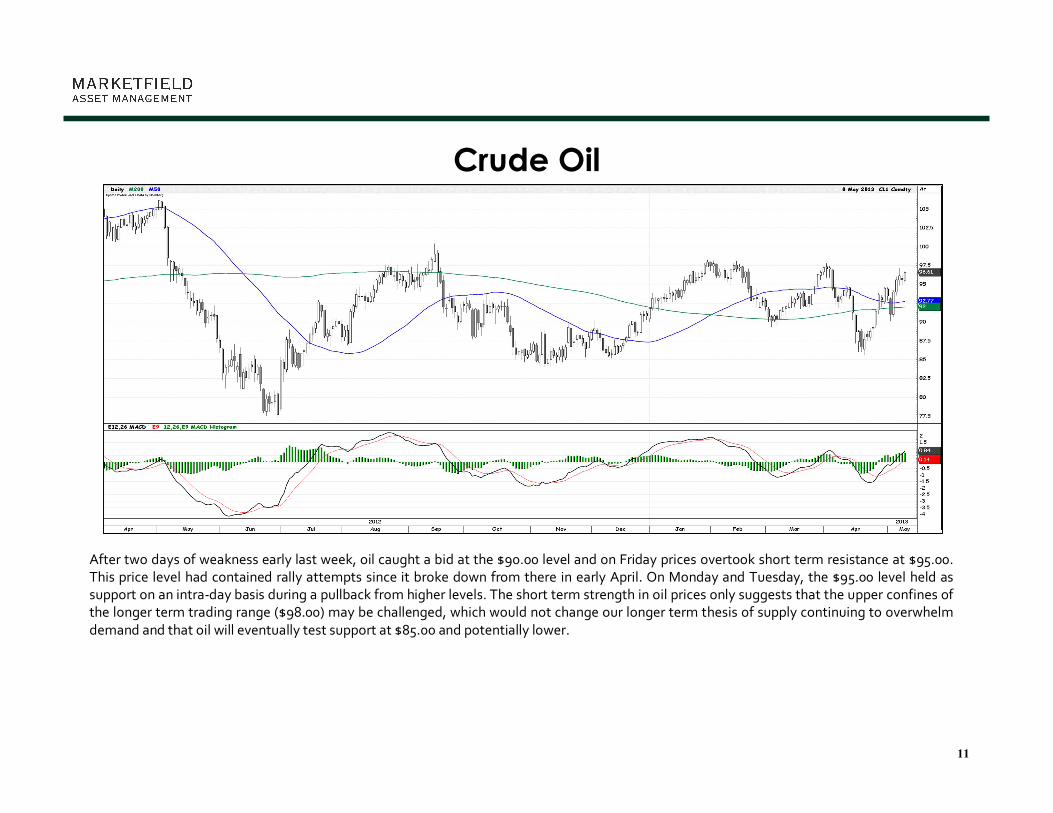
After two days of weakness early last week, oil caught a bid at the $90.00 level and on Friday prices overtook short term resistance at $95.00. This price level had contained rally attempts since it broke down from there in early April. On Monday and Tuesday, the $95.00 level held as support on an intra-day basis during a pullback from higher levels. The short term strength in oil prices only suggests that the upper confines of the longer term trading range ($98.00) may be challenged, which would not change our longer term thesis of supply continuing to overwhelm demand and that oil will eventually test support at $85.00 and potentially lower.
11

Copper
Copper's MACD scored a nominal divergence with price on May 2, enough to trigger the rebound from $6,800 support through initial resistance at $7,250 and challenge the next level at $7,500, which marked the lows from September and November 2012 and mid-March of this year. Despite the rally so far, the structure of lower highs and lower lows remains intact, which suggests lower prices going forward. The market's close at $7,419, under the 50 day ma ($7,458) still keeps the market on the defensive below that level. Closing above the 50 day ma would open the market for a test of horizontal resistance at $7,645. Above that, the 200 day ma comes in at $7,804. With the 50 week ma having only recently crossed below the 200 week, the intermediate term pressure for lower prices will remain.
12
The information provided herein represents the opinion of Marketfield and is not intended to be a forecast of future events, or a guarantee of future results. This report is for informational purposes only, is not an offer to buy or sell any specific security, and is not intended to provide specific investment advice because it does not take into account the differing needs of individual clients. This report is based upon information that Marketfield Asset Management LLC believes to be reliable, but no representation is made by Marketfield Asset Management LLC as to its completeness or accuracy. This report is not a complete analysis of every material fact concerning any company, industry or security. Marketfield Asset Management LLC assumes that it will be read in conjunction with any other available reports and data. Opinions expressed herein are subject to change without notice. No investor should rely on the views, opinions or any suggestions contained herein. Investors are advised to consult with their own individual advisers on their specific situation before taking any action based on any information contained in this report.
© 2013 Marketfield Asset Management LLC. All rights reserved. Charts are courtesy of Bloomberg, Inc.
DISCLAIMER
Related Documents