[T YPE THE COMPANY ADDRESS ] [T YPE THE COMPANY ADDRESS ] The Washington Metropolitan Area 2030 Economic Outlook: Standard Forecast By Stephen S. Fuller, Ph.D. Dwight Schar Faculty Chair and University Professor Director, Center for Regional Analysis George Mason University Fairfax, Virginia and Ellen Harpel, Ph.D. CRA Consultant March 2009 Technical Report No. 1 Prepared for The 2030 Group www.The2030Group.org

Welcome message from author
This document is posted to help you gain knowledge. Please leave a comment to let me know what you think about it! Share it to your friends and learn new things together.
Transcript
[ T Y P E T H E C O M P A N Y A D D R E S S ] [ T Y P E T H E C O M P A N Y A D D R E S S ]
The Washington Metropolitan Area 2030 Economic Outlook:
Standard Forecast
By
Stephen S. Fuller, Ph.D. Dwight Schar Faculty Chair and University Professor
Director, Center for Regional Analysis George Mason University
Fairfax, Virginia
and
Ellen Harpel, Ph.D. CRA Consultant
March 2009
Technical Report No. 1
Prepared for The 2030 Group www.The2030Group.org
The Washington Metropolitan Area,
2030 Economic Outlook: Standard Forecast
Key Research Findings The Washington metropolitan area (see appendix for definition) will experience substantial growth in population, jobs and output value over the next twenty years but due to its constrained boundaries (contiguity to the Baltimore metropolitan area), growing dependency on non‐resident labor, and structure of its economy, it will not grow as fast as the Dallas‐Fort Worth and Atlanta metropolitan areas. The question is whether this projected economic future can be altered to achieve a structural capacity to accelerate the Washington area’s growth by building on its merging comparative advantages thereby advancing its economy faster than if
tethese effor s to reposition the economy were not undertaken. The first step in answering that question is to more fully understand the comparative positions of the Washington area economy relative to the economies of allas‐Fort Worth and Atlanta and their projected growth patterns over the next wentyDt
years. The analyses reported herein can be summarized as follows:
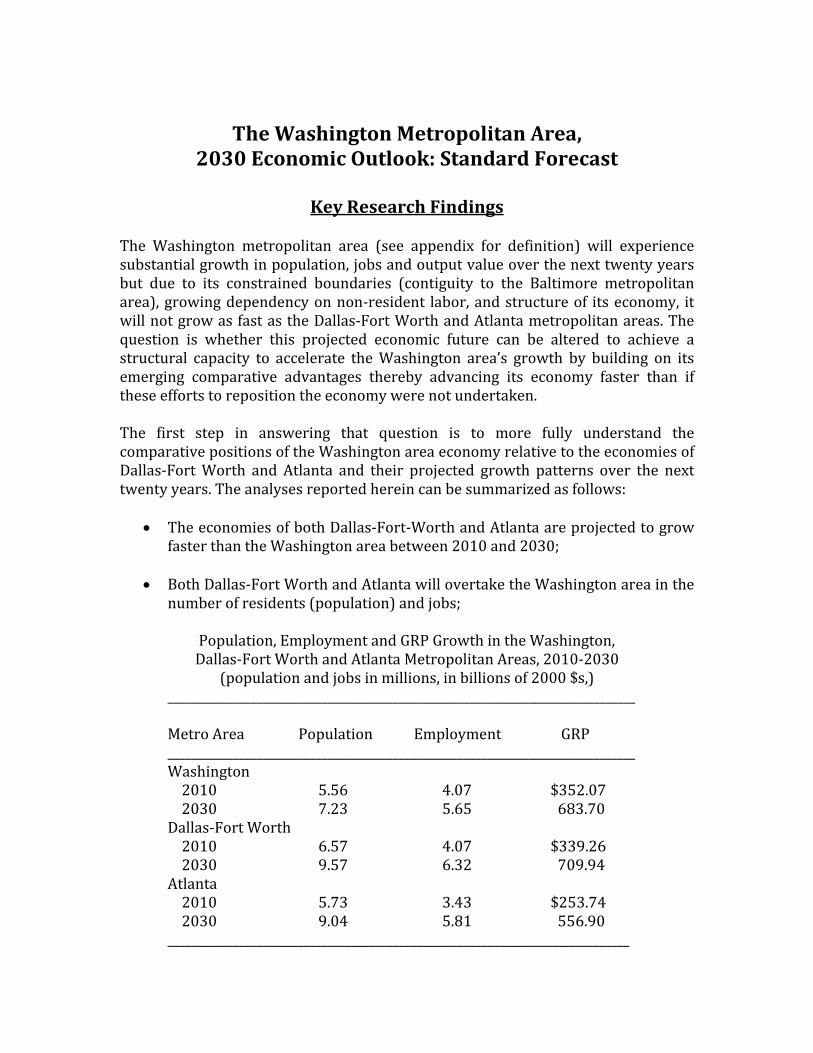
• The economies of both Dallas‐Fort‐Worth and Atlanta are projected to grow faster than the Washington area between 2010 and 2030;
• Both Dallas‐Fort Worth and Atlanta will overtake the Washington area in the num
ber of residents (population) and jobs;
Pop n, ulation, Employment and GRP Growth in the WashingtoDallas‐Fort Worth and Atlanta Metropolitan Areas, 2010‐2030
(population and jobs in millions, in billions of 2000 $s,) __ ____ ____________________ ______________ ____________________ ___________________
Po ulation Employment GRP
_ _______ __ _ _____ _____________________ Metro Area p ______
ton _________ _ _______ ______ ____________ _
Washing
5.56 4.07 $352.07 2010
ort Worth 2030 7.23 5.65 683.70 Dallas‐F
4.07 $339.26 2010 6.57 2030 9.57 6.32 709.94 Atlanta 2010 5.73 3.43 $253.74 2030 9.04 5.81 556.90 ______________________________________________________________________________
2
Sources: NPA Data Services, Inc., GMU Center for Regional Analysis • The Washington area economy will be increasingly impacted by its growing
commuter dependency that results in the transfer of income (Table 3) and consumer spending potential to jurisdictions outside of the metropolitan area as seen in disproportionally smaller employment in consumer and retail services, local government services and health services than exists in other metropolitan areas;
• If the Washington area economy had proportionally scaled consumer service
sectors to Dallas‐Fort Worth and Atlanta, its gross regional product would be an estimated 11.4% larger in 2010 and 14.2% larger by 2030 than currently forecast;
• Still, the Washington area economy is larger than what would be normally
supported by its smaller population and resident job bases;
• The Washington area’s larger economy is partially explained by its greater number of workers per capita (more workers per household) and fewer dependents; it is also explained by the economy’s structure that favors higher‐valued business activities and more advanced occupations supported by less cyclically sensitive core industries (e.g., the federal government,
education
international business, hospitality, and health, technology);
• The private sector strength in the Washington area economy is found in its service sector that is projected to account for between 60 and 70% of all net job growth over the next twenty years as well as similar percentages of new earnings; these are significantly greater percentages than projected for the
Dallas‐Fort Worth or Atlanta economies (Figures 6, 7, 8);
• The primary sources of new private sector jobs are found in professional and business services, health services and education services incorporating occupations that are projected to enjoy above‐average growth rates and for which the Washington area has both numerical and earnings advantages, including business and financial operations; computer and mathematical; education and training; protective services; arts, design, entertainments, sports and media; legal; life, physical, and social science; and community and
social services (Figures 9‐16) Historically, the growth of the Washington area economy has been dominated by its primary core sectors consisting of federal and national capital functions. While driving the area’s economy along a less cyclical growth trajectory these core sectors also have supported the growth of occupations and businesses that are projected to be both rapidly growing and high value added. These faster growing sub‐sectors, in combination with the area’s historic strengths and its emerging attractiveness as a
3
global center for governmental and international business activities, may provide the framework for raising the economy’s growth trajectory in the coming decades.
Introduction
By 2030, the Washington metropolitan area is projected to have a resident population of 7.2 million people, up almost 30 percent from 2010, an employment base totaling 5.6 million jobs inclusive of part‐time, contract, full‐time and self‐employed workers representing a gain of almost 40 percent, and an economy totaling $832.7 billion (in 2008 $s) reflecting growth of almost 95 percent. With the Washington area’s population projected to increase 30 percent, its job base to increase almost 40 percent and its economy to expand by almost 95 percent between 2010 and 2030, the future would appear to be on a course that would dvance it from its present ranking as fourth largest metropolitan area economy in athe U.S. But, this may not be the case. The Dallas‐Fort Worth metropolitan area economy, which is currently the fifth largest in the nation, is projected to out‐perform the Washington area economy over the next 20 years by these measures. With economic growth of 110 percent projected over this period, it will overtake the Washington area. While the Atlanta metropolitan area economy will not surpass the dollar value of the Washington area economy by 2030, its growth rate of 120 percent suggests that it will surpass the Washington metropolitan area’s economy in the longer term. And, both of these etropolitan areas are projected to surpass the Washington area in the total
3mnumber of jobs and population between 2010 and 20 0. The analyses in this report will document the population, employment and economic growth patterns projected for these three metropolitan areas between 2005 and 2030 and examine the reasons for their future performance differences. By documenting these performance differences, these analyses will identify the unique characteristics of the Washington economy that explain its economic outlook. These unique strengths (and weaknesses) may also represent opportunities that could result in a different growth path if the underlying onditions necessary for accelerating their growth were promoted through
ecredirected public policy actions by the area’s local and state governm nts. This comparative analysis and identification of the underlying strengths and specializations in the Washington area economy will establish the framework for detailed analyses and projections of possible future economic activities that could combine with the Washington area’s current core industrial structure to drive employment and income growth at a greater rate than currently forecast.
Population, Employment and Economic Growth:
The Washington Area, DallasFort Worth and Atlanta
4
The Washington area ranks higher in terms of jobs than population; that is, its employment base is not supported by a resident population to the same extent as in other metropolitan areas. This is a result of its adjacency with the Baltimore metropolitan area that supplies it with labor resources, as do other adjacent jurisdictions to the south, east and west. The Washington area laborshed also extends into Pennsylvania and Delaware. The Dallas‐Fort Worth and Atlanta etropolitan areas do not abut other major metropolitan areas and can expand m
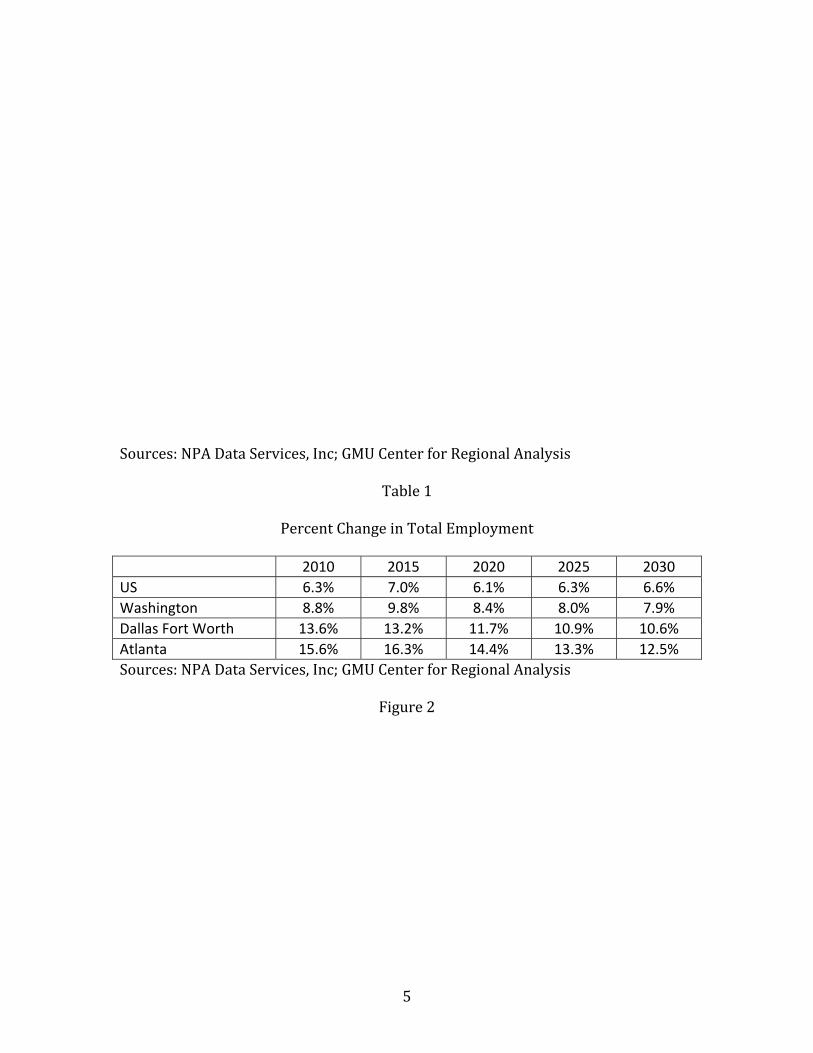
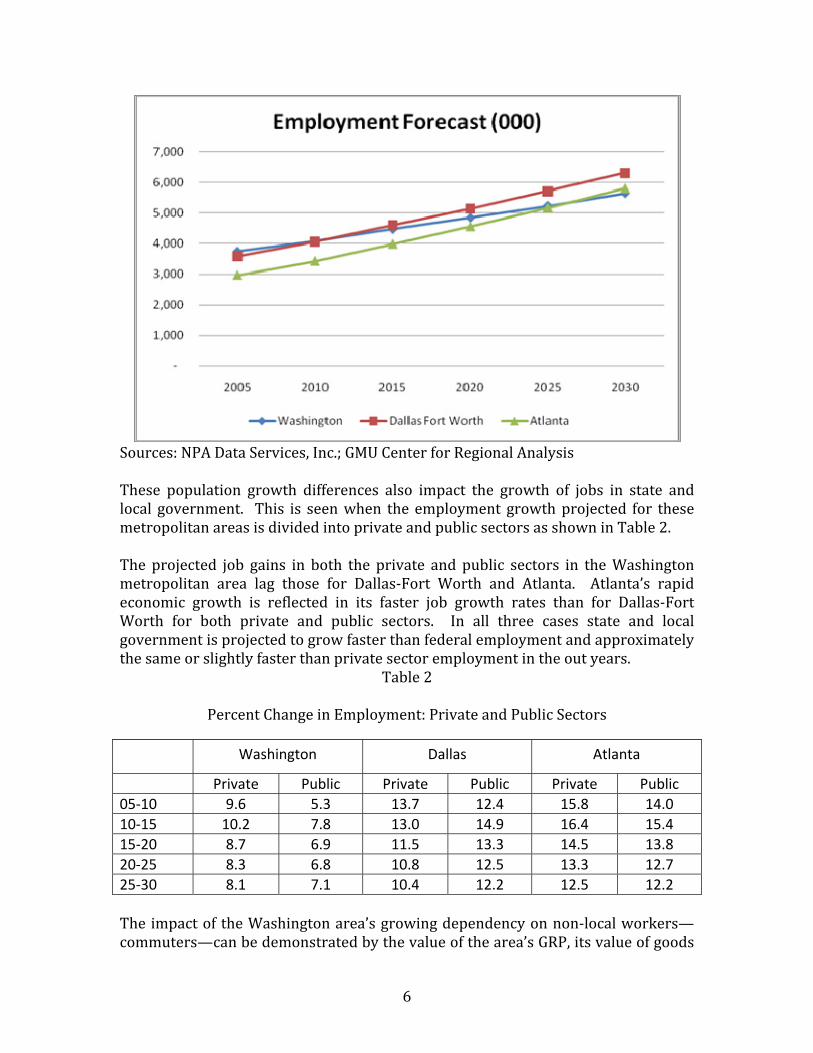
their boundaries as their economic influence expands over time. Why is this important? The workers commuting into the Washington area from beyond its metropolitan boundaries (e.g., Howard and Anne Arundel Counties) return home at night with their pay checks and spend their earnings in their local economies supporting retail and consumer and government services there and not in the metropolitan area in which they work. As a result of the Washington area’s onstrained boundaries, its economic structure differs from that of most other cmetropolitan areas. This affects its job and income mix as well as its fiscal base. As can be seen in Figures 1 and 2 and Table 1, the Washington area is projected to grow more slowly than the Dallas‐Fort Worth and Atlanta metropolitan areas. It is surpassed by 2010 by both in terms of population and by 2015 and 2025 is surpassed for the number of jobs respectively by Dallas‐Fort Worth and Atlanta. By 2030, Dallas‐Fort Worth is projected to have 2.3 million more residents than the Washington metropolitan area and Atlanta’s projected population will exceed that in the Washington area by 1.8 million. These population differences translate into a retail market potential advantage that will support residentially based services at a greater level than in the Washington area.
Figure 1
5
S ources: NPA Data Services, Inc; GMU Center for Regional Analysis
Table 1
Percent Change in Total Employment 2010 2015 2020 2025 2030 US 6.3% 7.0% 6.1% 6.3% 6.6% Washington 8.8% 9.8% 8.4% 8.0% 7.9% Dallas Fort Worth 13.6% 13.2% 11.7% 10.9% 10.6% Atlanta 15.6% 16.3% 14.4% 13.3% 12.5% Sources: NPA Data Services, Inc; GMU Center for Regional Analysis
Figure 2
6
Sources: NPA Data Services, Inc.; GMU Center for Regional Analysis These population growth differences also impact the growth of jobs in state and ocal government. This is seen when the employment growth projected for these
‐
1,000
2,000
3,000
4,000
5,000
6,000
7,000
2005 2010 2015 2020 2025 2030
Employment Forecast (000)
Washington Dallas Fort Worth Atlanta
lmetropolitan areas is divided into private and public sectors as shown in Table 2. The projected job gains in both the private and public sectors in the Washington metropolitan area lag those for Dallas‐Fort Worth and Atlanta. Atlanta’s rapid economic growth is reflected in its faster job growth rates than for Dallas‐Fort Worth for both private and public sectors. In all three cases state and local government is projected to grow faster deral employment and approximately the same or slightly faster than private sector employment in the out years.
than fe
Table 2
Percent Change in Employment: Private and Public Sectors
Washington Dallas Atlanta
Private Public Private Public Private Public 05‐10 9.6 5.3 13.7 12.4 15.8 14.0 10‐15 10.2 7.8 13.0 14.9 16.4 15.4 15‐20 8.7 6.9 11.5 13.3 14.5 13.8 20‐25 8.3 6.8 10.8 12.5 13.3 12.7 25‐30 8.1 7.1 10.4 12.2 12.5 12.2 The impact of the Washington area’s growing dependency on non‐local workers—commuters—can be demonstrated by the value of the area’s GRP, its value of goods
7
ar
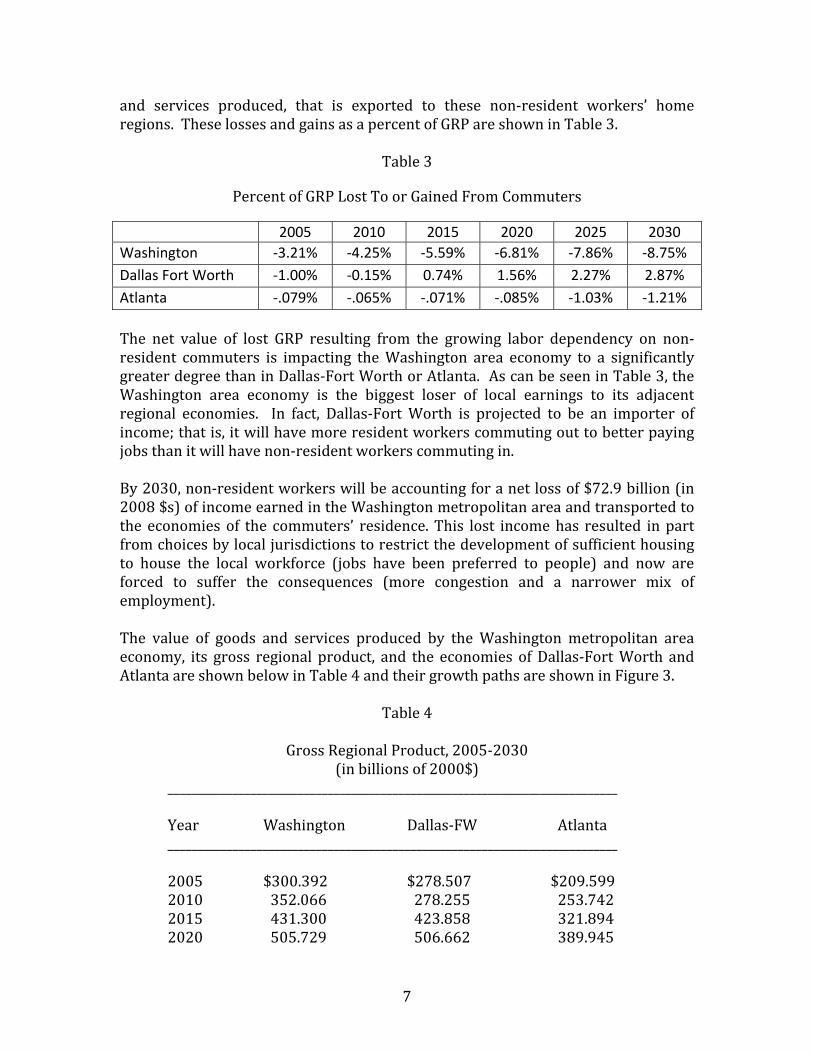
nd services produced, that is exported to these non‐resident workers’ home egions. These losses and gains as a percent of GRP are shown in Table 3.
Table 3
Percent of GRP Lost To or Gained From Commuters
2005 2010 2015 2020 2025 2030 Washington ‐3.21% ‐4.25% ‐5.59% ‐6.81% ‐7.86% ‐8.75% Dallas Fort Worth ‐1.00% ‐0.15% 0.74% 1.56% 2.27% 2.87% Atlanta ‐.079 ‐.065% ‐.071% ‐.085% ‐1.03% ‐1.21% % The net value of lost GRP resulting from the growing labor dependency on non‐resident commuters is impacting the Washington area economy to a significantly greater degree than in Dallas‐Fort Worth or Atlanta. As can be seen in Table 3, the Washington area economy is the biggest loser of local earnings to its adjacent regional economies. In fact, Dallas‐Fort Worth is projected to be an importer of ncome; that is, it will have more resident workers commuting out to better paying ijobs than it will have non‐resident workers commuting in. By 2030, non‐resident workers will be accounting for a net loss of $72.9 billion (in 2008 $s) of income earned in the Washington metropolitan area and transported to the economies of the commuters’ residence. This lost income has resulted in part from choices by local jurisdictions to restrict the development of sufficient housing to house the local workforce (jobs have been preferred to people) and now are orced to suffer the consequences (more congestion and a narrower mix of femployment). The value of goods and services produced by the Washington metropolitan area economy, its gross regional product, and the economies of Dallas‐Fort Worth and Atlanta are shown below in Table 4 and their growth paths are shown in Figure 3.
Table 4
Gross Regional Product, 2005‐2030
(in billions of 2000$) ____________________________________________________________________________
Washington Dallas‐FW Atlanta _______ _____________ _____ _______
Year _ _______ _ ____________ ___________ _ ___________
2005 $300.392 $278.507 $209.599 2010 352.066 278.255 253.742 2015 431.300 423.858 321.894 2020 505.729 506.662 389.945
8
2025 588.797 600.874 467.424 9 556.896 ___________________________
2030 683.695 709.93_________________________________________________
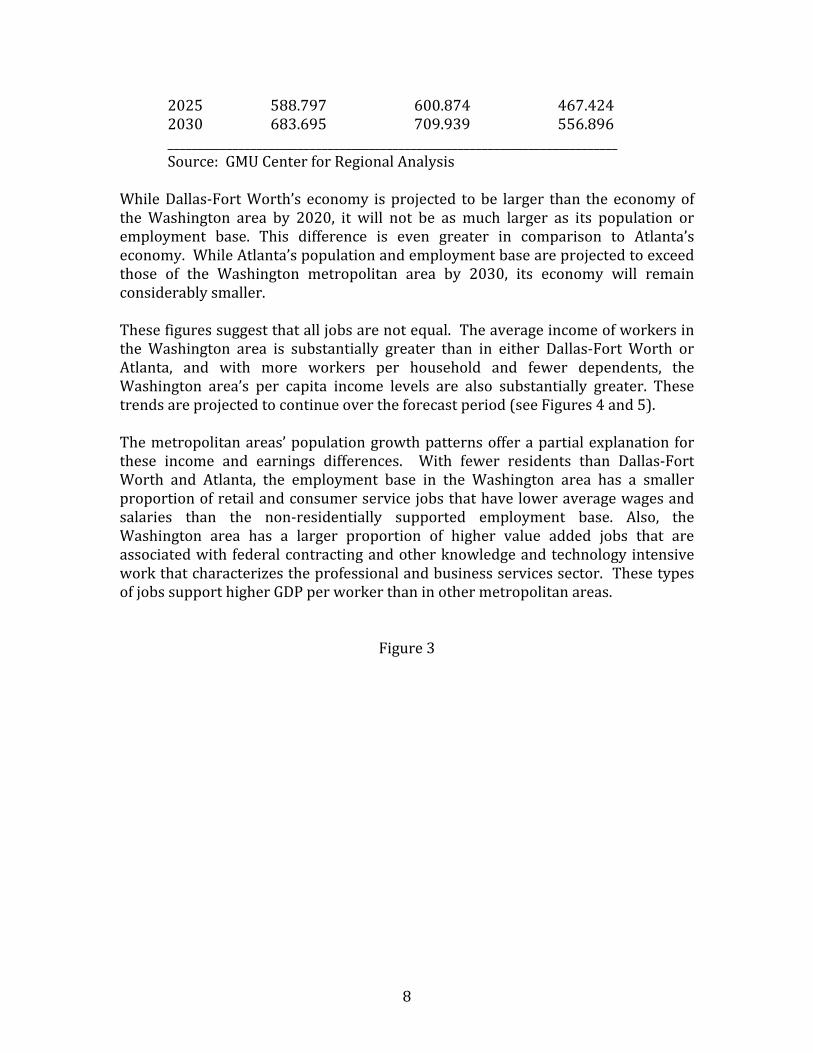
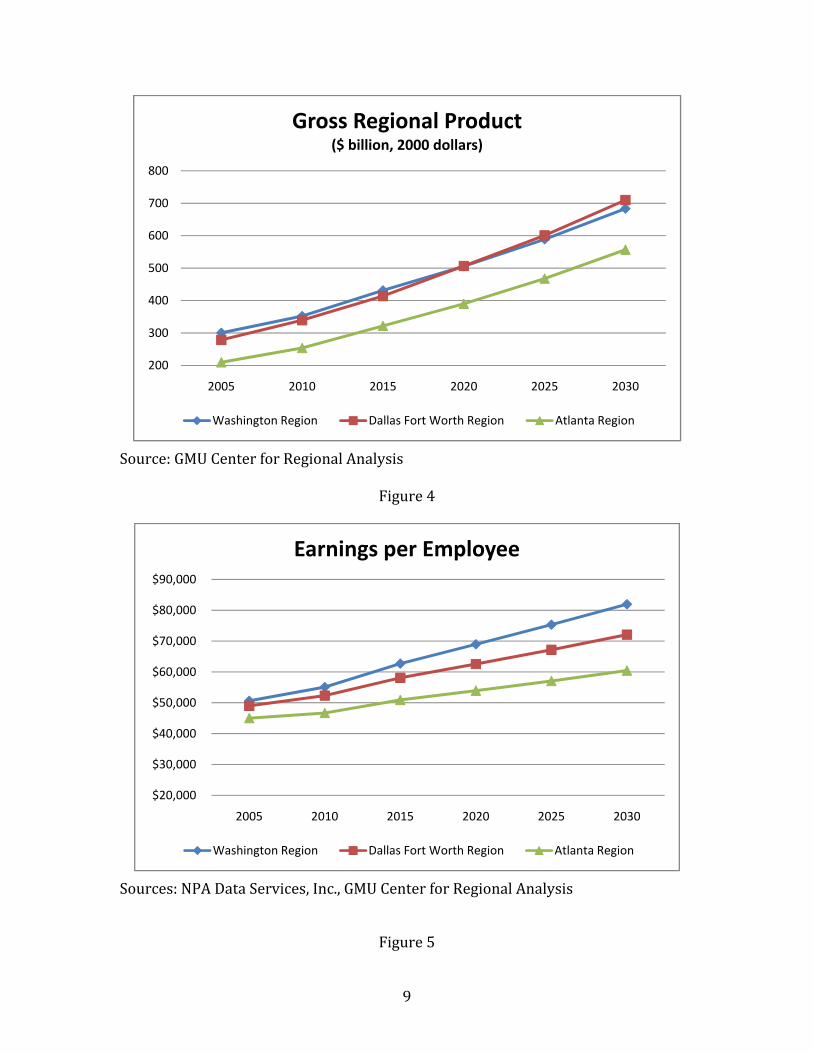
Source: GMU Center for Regional Analysis While Dallas‐Fort Worth’s economy is projected to be larger than the economy of the Washington area by 2020, it will not be as much larger as its population or employment base. This difference is even greater in comparison to Atlanta’s economy. While Atlanta’s population and employment base are projected to exceed hose of the Washington metropolitan area by 2030, its economy will remain tconsiderably smaller. These figures suggest that all jobs are not equal. The average income of workers in the Washington area is substantially greater than in either Dallas‐Fort Worth or Atlanta, and with more workers per household and fewer dependents, the ashington area’s per capita income levels are also substantially greater. These W
trends are projected to continue over the forecast period (see Figures 4 and 5). The metropolitan areas’ population growth patterns offer a partial explanation for these income and earnings differences. With fewer residents than Dallas‐Fort Worth and Atlanta, the employment base in the Washington area has a smaller proportion of retail and consumer service jobs that have lower average wages and salaries than the non‐residentially supported employment base. Also, the Washington area has a larger proportion of higher value added jobs that are associated with federal contracting and other knowledge and technology intensive ork that characterizes the professional and business services sector. These types f jobs support higher GDP per worker than in other metropolitan areas. wo
Figure 3
9
Source: GMU Center for Regional Analysis
Figure 4
200
300
400
500
600
700
800
2005 2010 2015 2020 2025 2030
Gross Regional Product ($ billion, 2000 dollars)
Washington Region Dallas Fort Worth Region Atlanta Region
Sources: NPA Data Services, Inc., GMU Center for Regional Analysis
Figure 5
$20,000
$30,000
$40,000
$50,000
$60,000
$70,000
$80,000
$90,000
2005 2010 2015 2020 2025 2030
Earnings per Employee
Washington Region Dallas Fort Worth Region Atlanta Region
10
Sources: NPA Data Services, Inc.; GMU Center for Regional Analysis
$20,000
$30,000
$40,000
$50,000
$60,000
$70,000
$80,000
2005 2010 2015 2020 2025 2030
Per Capita Personal Income
Washington Dallas Fort Worth Atlanta
Sources of Economic Strength in the Washington Area Economy
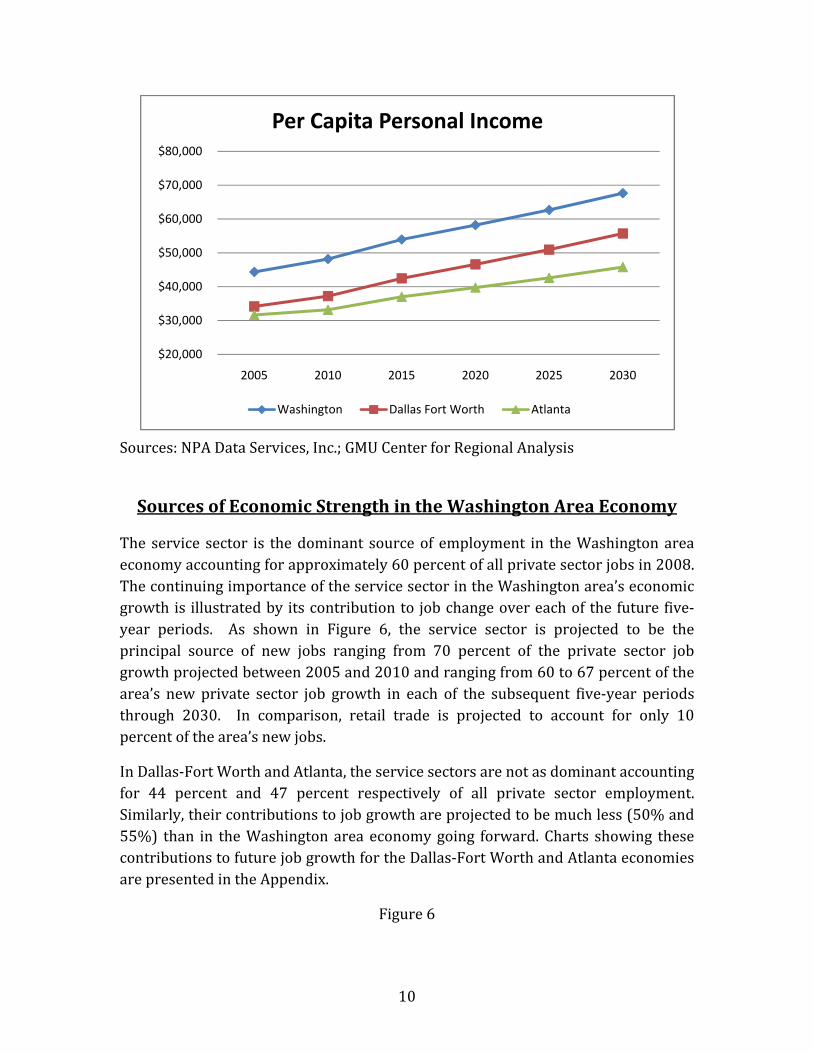
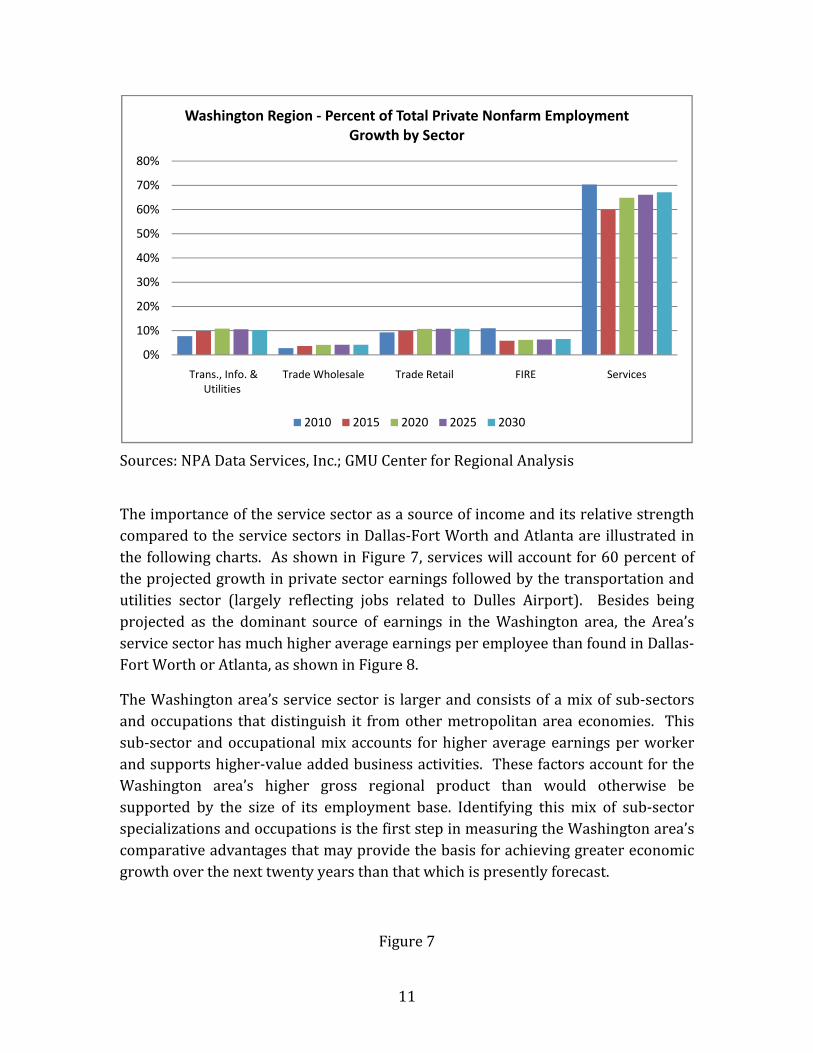
The service sector is the dominant source of employment in the Washington area economy accounting for approximately 60 percent of all private sector jobs in 2008. The continuing importance of the service sector in the Washington area’s economic growth is illustrated by its contribution to job change over each of the future five‐year periods. As shown in Figure 6, the service sector is projected to be the principal source of new jobs ranging from 70 percent of the private sector job growth projected between 2005 and 2010 and ranging from 60 to 67 percent of the area’s new private sector job growth in each of the subsequent five‐year periods through 2030. In comparison, retail trade is projected to account for only 10 percent of the area’s new jobs.
In Dallas‐Fort Worth and Atlanta, the service sectors are not as dominant accounting for 44 percent and 47 percent respectively of all private sector employment. Similarly, their contributions to job growth are projected to be much less (50% and 55%) than in the Washington area economy going forward. Charts showing these contributions to future job growth for the Dallas‐Fort Worth and Atlanta economies are presented in the Appendix.
Figure 6
11
Sources: NPA Data Services, Inc.; GMU Center for Regional Analysis
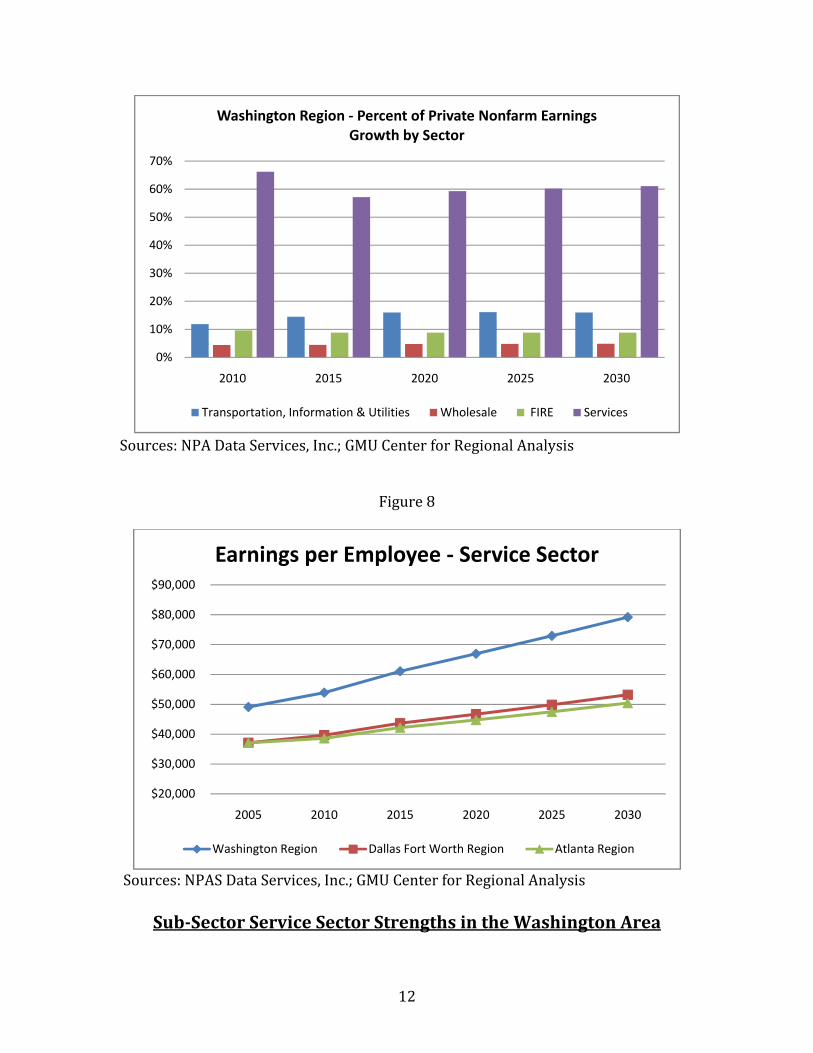
The importance of the service sector as a source of income and its relative strength compared to the service sectors in Dallas‐Fort Worth and Atlanta are illustrated in the following charts. As shown in Figure 7, services will account for 60 percent of the projected growth in private sector earnings followed by the transportation and utilities sector (largely reflecting jobs related to Dulles Airport). Besides being projected as the dominant source of earnings in the Washington area, the Area’s service sector has much higher average earnings per employee than found in Dallas‐
0%
10%
20%
30%
40%
50%
60%
70%
80%
Trans., Info. & Utilities
Trade Wholesale Trade Retail FIRE Services
Washington Region ‐ Percent of Total Private Nonfarm Employment Growth by Sector
2010 2015 2020 2025 2030
Fort Worth or Atlanta, as shown in Figure 8.
The Washington area’s service sector is larger and consists of a mix of sub‐sectors and occupations that distinguish it from other metropolitan area economies. This sub‐sector and occupational mix accounts for higher average earnings per worker and supports higher‐value added business activities. These factors account for the Washington area’s higher gross regional product than would otherwise be supported by the size of its employment base. Identifying this mix of sub‐sector specializations and occupations is the first step in measuring the Washington area’s comparative advantages that may provide the basis for achieving greater economic growth over the next twenty years than that which is presently forecast.
Figure 7
12
S
ources: NPA Data Services, Inc.; GMU Center for Regional Analysis
0%
10%
20%
30%
40%
50%
60%
70%
2010 2015 2020 2025 2030
Washington Region ‐ Percent of Private Nonfarm Earnings Growth by Sector
Transportation, Information & Utilities Wholesale FIRE Services
Figure 8
Sources: NPAS Data Services, Inc.; GMU Center for Regional Analysis
$20,000
$30,000
$40,000
$50,000
$60,000
$70,000
$80,000
$90,000
2005 2010 2015 2020 2025 2030
Earnings per Employee ‐ Service Sector
Washington Region Dallas Fort Worth Region Atlanta Region
SubSector Service Sector Strengths in the Washington Area
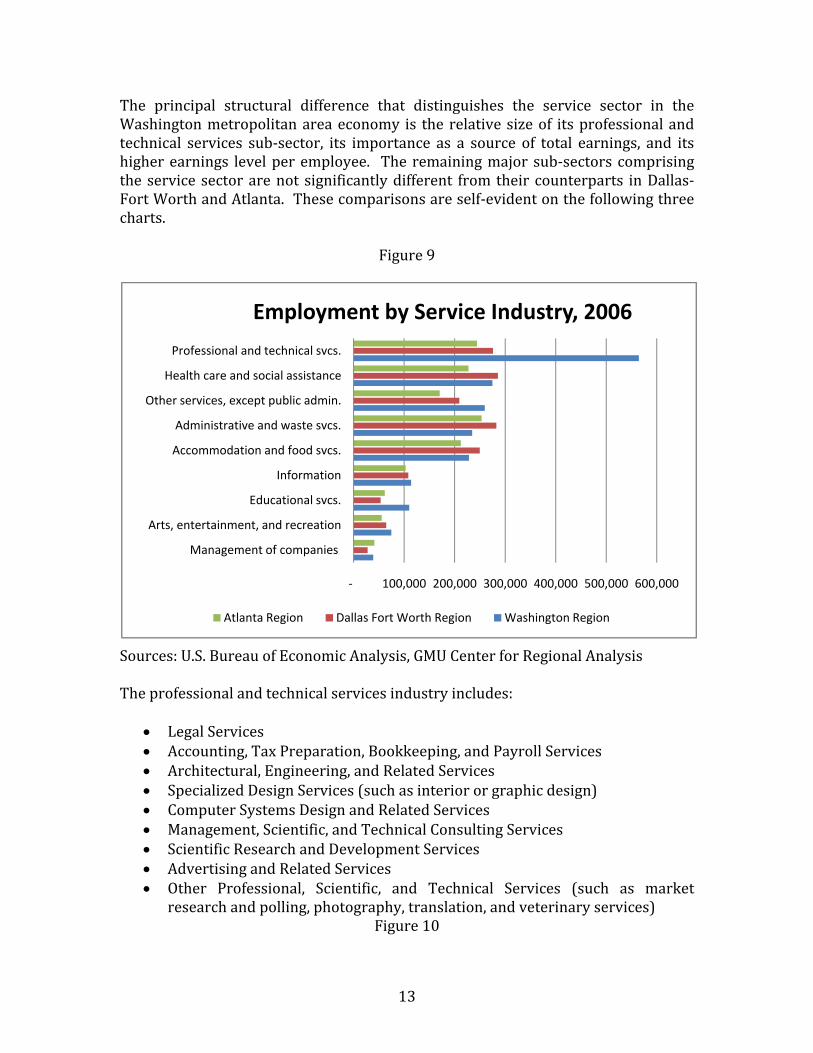
The principal structural difference that distinguishes the service sector in the Washington metropolitan area economy is the relative size of its professional and technical services sub‐sector, its importance as a source of total earnings, and its higher earnings level per employee. The remaining major sub‐sectors comprising the service sector are not significantly different from their counterparts in Dallas‐ort Worth and Atlanta. These comparisons are self‐evident on the following three harts. Fc
Figure 9
13
Sources: U.S. Bureau of Economic Analysis, GMU Center for
he pro echnical services industry includes:
Regional Analysis T
‐ 100,000 200,000 300,000 400,000 500,000 600,000
Management of companies
Arts, entertainment, and recreation
Educational svcs.
Information
Accommodation and food svcs.
Administrative and waste svcs.
Other services, except public admin.
Health care and social assistance
Professional and technical svcs.
Employment by Service Industry, 2006
Atlanta Region Dallas Fort Worth Region Washington Region
fessional and t
• Legal Services • Accounting, Tax Preparation, Bookkeeping, and Payroll Services
• ign) • Architectural, Engineering, and Related Services
• Specialized Design Services (such as interior or graphic des
s • ng Services
Computer Systems Design and Related Servicenical Consulti
• Management, Scientific, and Tech
f n•
Scienti ic Research a d Development Services Advertising and Related Services
• Other Professional, Scientific chnical Services (such as market research and polling, photogra lation, and veterinary services)
, and Tephy, ransFigure 10
t
14
Sources: U.S. Bureau of Economic Analysis, GMU Center for Regional Analysis
$‐ $20,000,000 $40,000,000 $60,000,000
Management of companies
Arts, entertainment, and recreation
Educational services
Information
Accommodation and food services
Administrative and waste services
Other services, except public admin.
Health care and social assistance
Professional and technical services
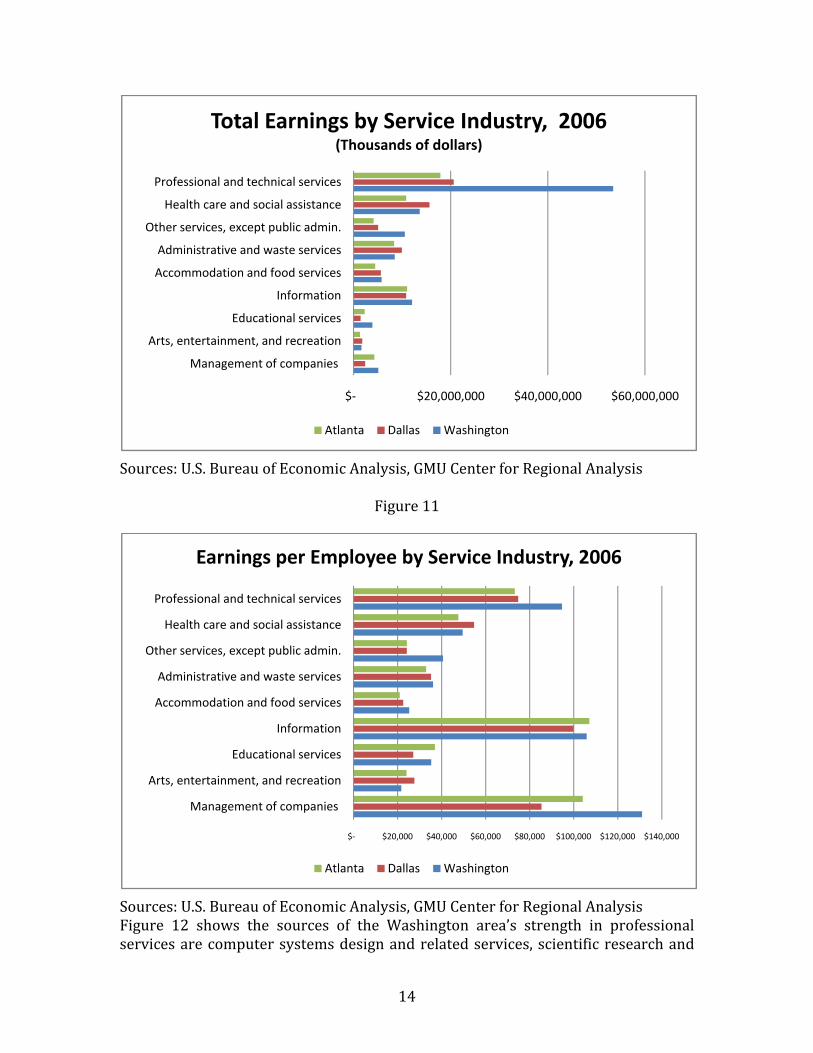
Total Earnings by Service Industry, 2006(Thousands of dollars)
Atlanta Dallas Washington
Figure 11
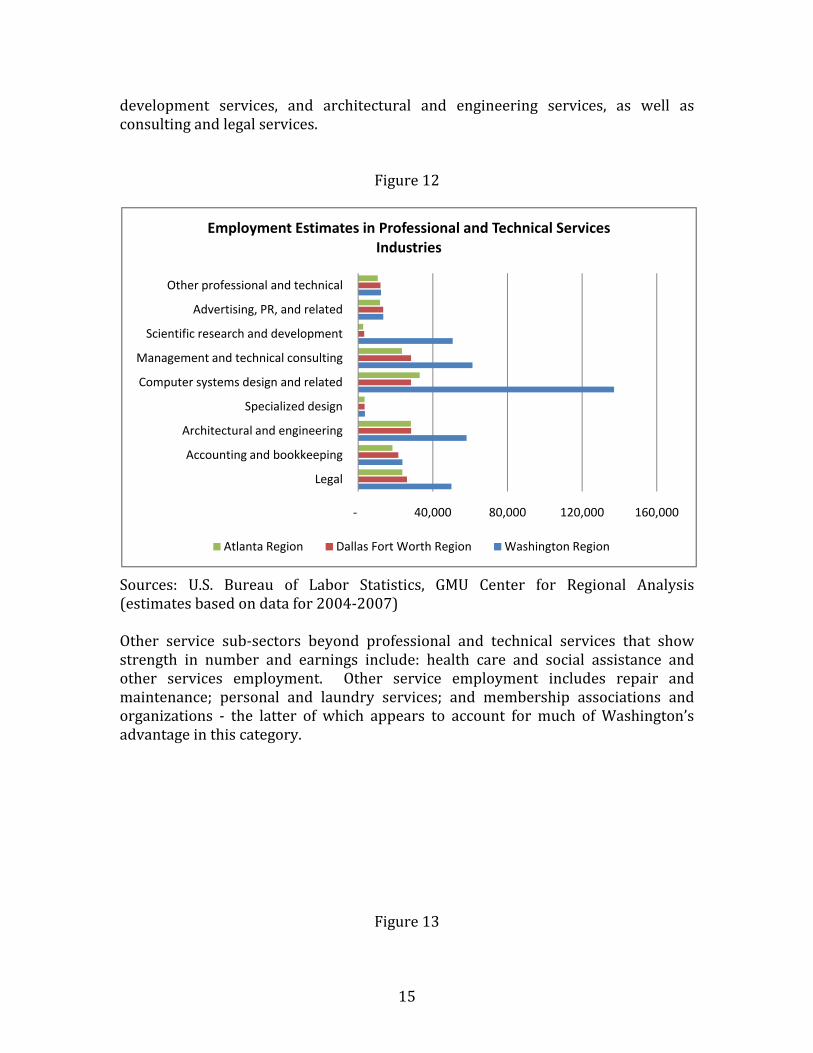
Sources: U.S. Bureau of Economic Analysis, GMU Center for Regional Analysis Figure 12 shows the sources of the Washington area’s strength in professional services are computer systems design and related services, scientific research and
$‐ $20,000 $40,000 $60,000 $80,000 $100,000 $120,000 $140,000
Management of companies
Arts, entertainment, and recreation
Educational services
Information
Accommodation and food services
Administrative and waste services
Other services, except public admin.
Health care and social assistance
Professional and technical services
Earnings per Employee by Service Industry, 2006
Atlanta Dallas Washington
dc
evelopment services, and architectural and engineering services, as well as onsulting and legal services.
Figure 12
15
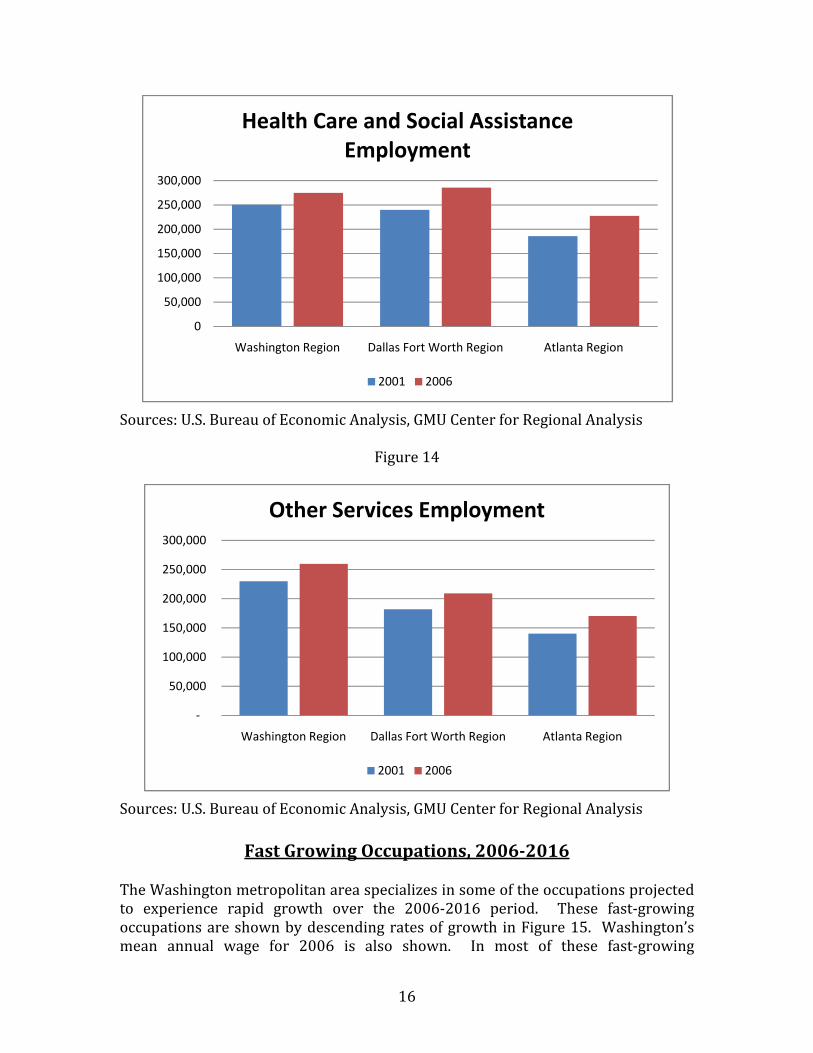
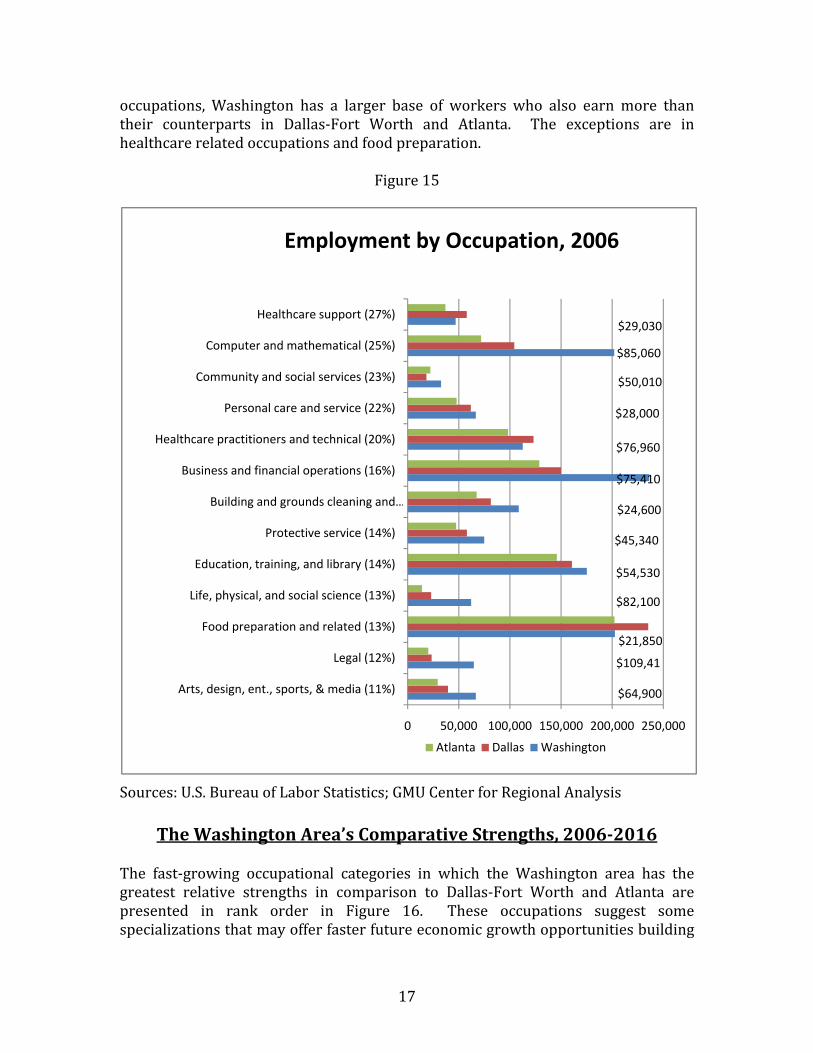
Sources: U.S. Bureau of Labor Statistics, GMU Center for Regional Analysis (estimates based on data for 2004‐2007) Other service sub‐sectors beyond professional and technical services that show strength in number and earnings include: health care and social assistance and other services employment. Other service employment includes repair and maintenance; personal and laundry services; and membership associations and rganizations ‐ the latter of which appears to account for much of Washington’s dvantage in this category.
‐ 40,000 80,000 120,000 160,000
Legal
Accounting and bookkeeping
Architectural and engineering
Specialized design
Computer systems design and related
Management and technical consulting
Scientific research and development
Advertising, PR, and related
Other professional and technical
Employment Estimates in Professional and Technical Services Industries
Atlanta Region Dallas Fort Worth Region Washington Region
oa
Figure 13
16
Sources: U.S. Bureau of Economic Analysis, GMU Center for Regional Analysis
0
50,000
100,000
150,000
200,000
250,000
300,000
Washington Region Dallas Fort Worth Region Atlanta Region
Health Care and Social Assistance Employment
2001 2006
Figure 14
Sources: U.S. Bureau of Economic Analysis, GMU Center for Regional Analysis
‐
50,000
100,000
150,000
200,000
250,000
300,000
Washington Region Dallas Fort Worth Region Atlanta Region
Other Services Employment
2001 2006
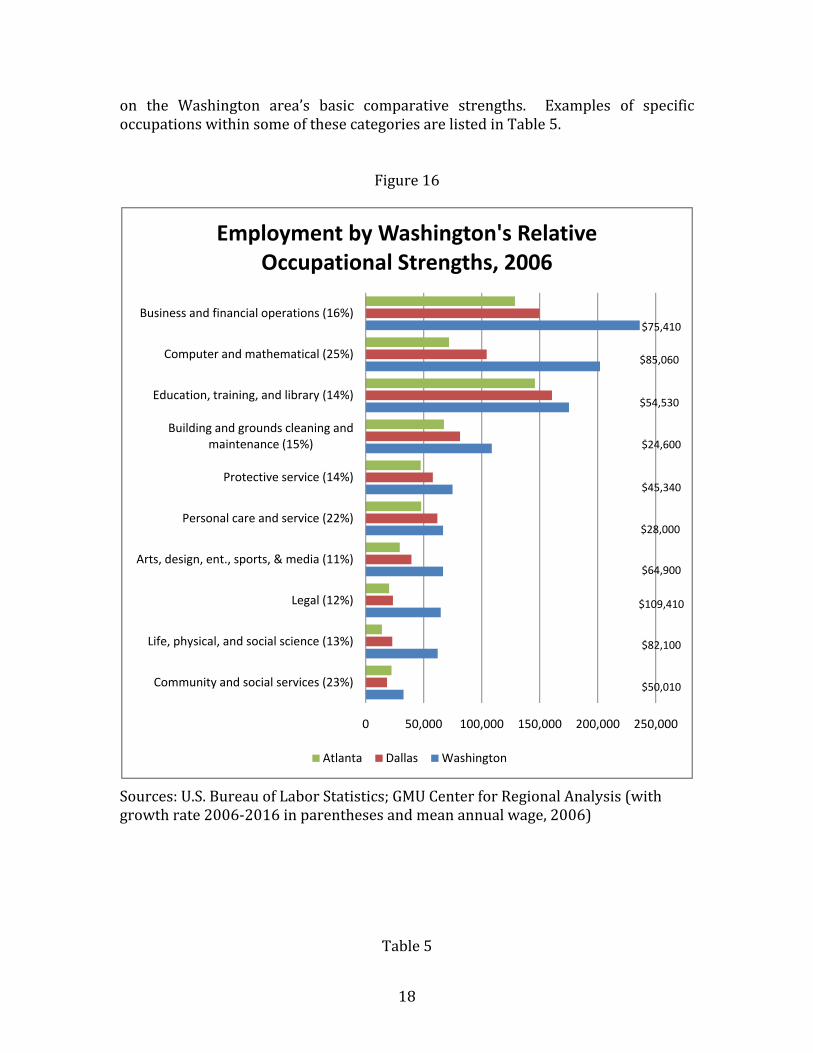
Fast Growing Occupations, 20062016
The Washington metropolitan area specializes in some of the occupations projected to experience rapid growth over the 2006‐2016 period. These fast‐growing occupations are shown by descending rates of growth in Figure 15. Washington’s mean annual wage for 2006 is also shown. In most of these fast‐growing
occupations, Washington has a larger base of workers who also earn more than heir counterparts in Dallas‐Fort Worth and Atlanta. The exceptions are in ealthcare related occupations and food preparation. th
Figure 15
Sources: U.S. Bureau of Labor Statistics; GMU Center for Regional Analysis
0 50,000 100,000 150,000 200,000 250,000
Arts, design, ent., sports, & media (11%)
Legal (12%)
Food preparation and related (13%)
Life, physical, and social science (13%)
Education, training, and library (14%)
Protective service (14%)
Building and grounds cleaning and …
Business and financial operations (16%)
Healthcare practitioners and technical (20%)
Personal care and service (22%)
Community and social services (23%)
Computer and mathematical (25%)
Healthcare support (27%)
Employment by Occupation, 2006
Atlanta Dallas Washington
$64,900
$29,030
$85,060
$50,010
$28,000
$76,960
$75,410
$24,600
$45,340
$54,530
$82,100
$21,850
$109,41
17
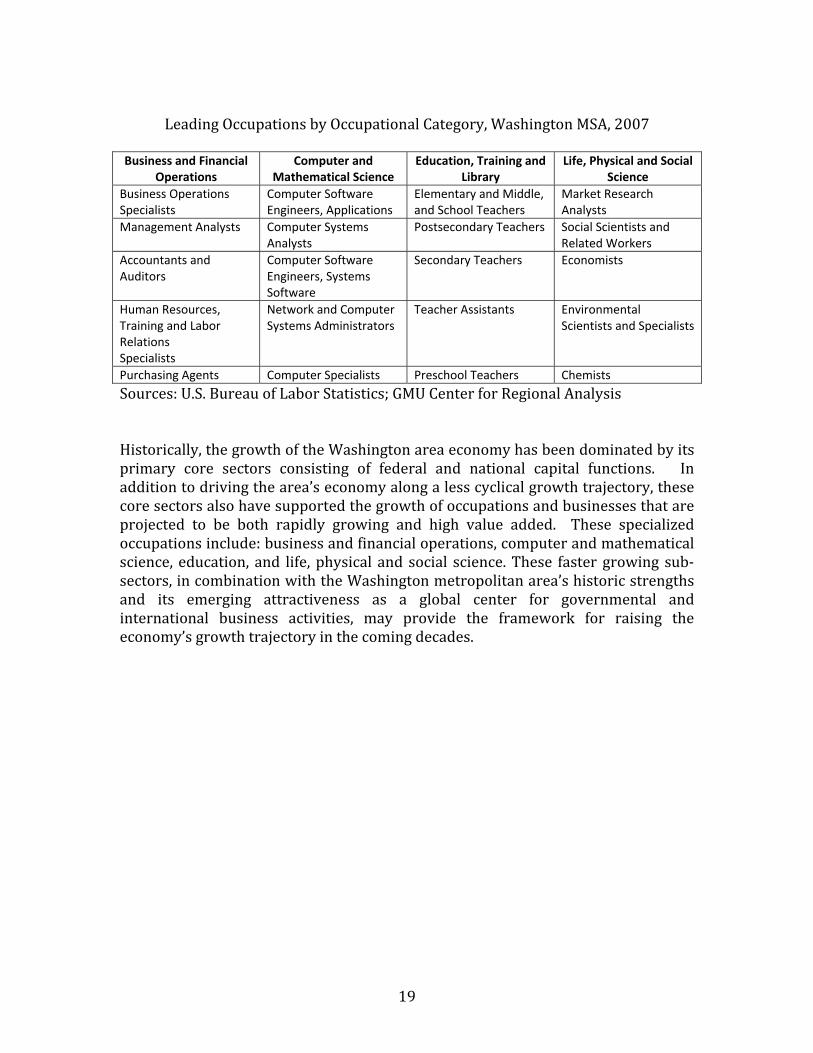
The Washington Area’s Comparative Strengths, 20062016
The fast‐growing occupational categories in which the Washington area has the greatest relative strengths in comparison to Dallas‐Fort Worth and Atlanta are presented in rank order in Figure 16. These occupations suggest some specializations that may offer faster future economic growth opportunities building
oo
n the Washington area’s basic comparative strengths. Examples of specific ccupations within some of these categories are listed in Table 5.
Figure 16
18
Sg
ources: U.S. Bureau of Labor Statistics; GMU Center for Regional Analysis (with rowth rate 2006‐2016 in parentheses and mean annual wage, 2006)
0 50,000 100,000 150,000 200,000 250,000
Community and social services (23%)
Life, physical, and social science (13%)
Legal (12%)
Arts, design, ent., sports, & media (11%)
Personal care and service (22%)
Protective service (14%)
Building and grounds cleaning and maintenance (15%)
Education, training, and library (14%)
Computer and mathematical (25%)
Business and financial operations (16%)
Employment by Washington's Relative Occupational Strengths, 2006
Table 5
Atlanta Dallas Washington
$75,410
$85,060
$54,530
$24,600
$45,340
$28,000
$64,900
$109,410
$82,100
$50,010
19
Leading Occupations by Occupational Category, Washington MSA, 2007
Business and Financial
Operations Computer and
Mathematical Science Education, Training and
Library Life, Physical and Social
Science Business Operations Specialists
Computer Software Engineers, Applications
Elementary and Middle, and School Teachers
Market Research Analysts
Management Analysts Computer Systems Analysts
Postsecondary Teachers Social Scientists and Related Workers
Accountants and Auditors
Computer Software Engineers, Systems Software
Secondary Teachers Economists
Human Resources, Training and Labor Relations Specialists
Network and Computer Systems Administrators
Teacher Assistants Environmental Scientists and Specialists
Purchasing Agents Computer Specialists Preschool Teachers Chemists
Sources: U.S. Bureau of Labor Statistics; GMU Center for Regional Analysis Historically, the growth of the Washington area economy has been dominated by its primary core sectors consisting of federal and national capital functions. In addition to driving the area’s economy along a less cyclical growth trajectory, these core sectors also have supported the growth of occupations and businesses that are projected to be both rapidly growing and high value added. These specialized occupations include: business and financial operations, computer and mathematical science, education, and life, physical and social science. These faster growing sub‐sectors, in combination with the Washington metropolitan area’s historic strengths and its emerging attractiveness as a global center for governmental and ternational business activities, may provide the framework for raising the conomy’s growth trajectory in the coming decades. in
e
Appendices
Sources: NPA Data Services, Inc.; GMU Center for Regional Analysis
20
S
ources: NPA Data Services, Inc.; GMU Center for Regional Analysis
21
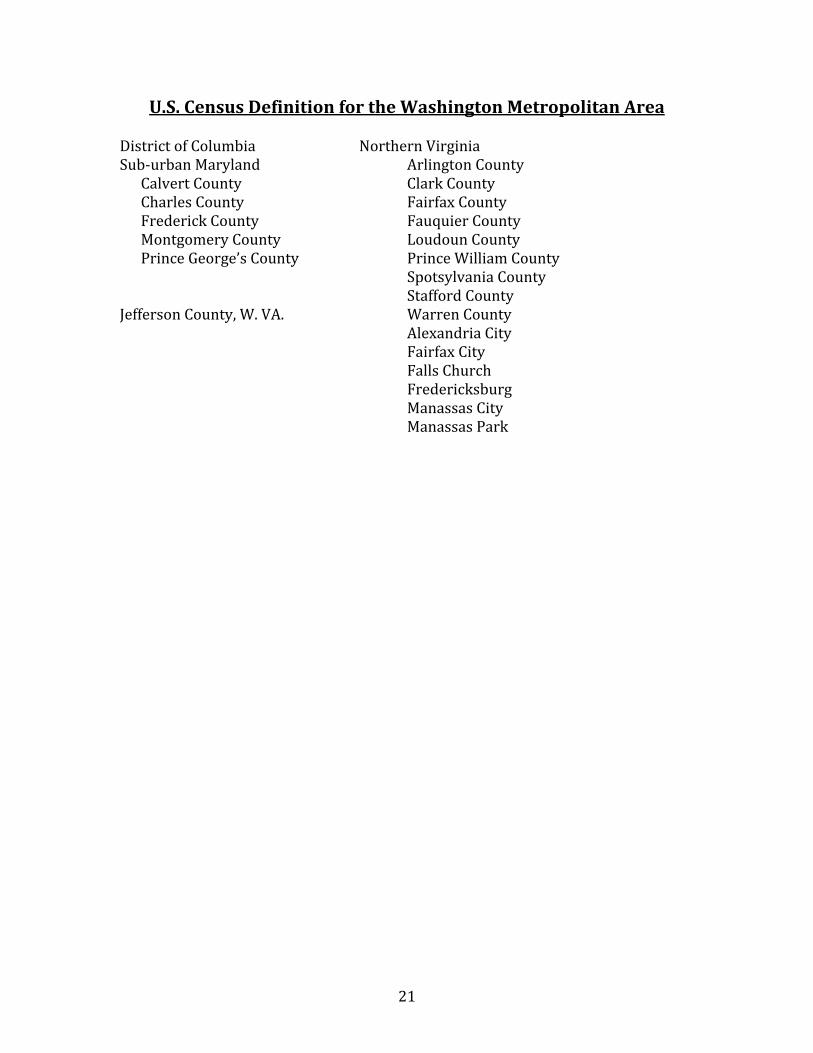
U.S. Census D n the Washingtoefinitio for n Metropolitan Area
a d ty
District of Columbi Northern Virginia Sub‐urban Marylan Arlington Coun Calvert County Clark County Charles County Fairfax County Frederick County Fauquier County Montgomery County Prince George’s County y Loudoun County
ountnty
Prince William Cu Spotsylvania Co
efferson County, W. VA. Stafford County
nty ty
J Warren Cou Alexandria Ci Fairfax City
Falls Church Fredericksburg Manassas City Manassas Park
Related Documents