1 The volatile content of magmas from Arenal volcano, Costa Rica Jennifer A. Wade* 1 , Terry Plank 1 , William G. Melson 2 , Gerardo J. Soto 3 , Erik Hauri 4 1 Department of Earth Sciences, Boston University, Boston, MA 02215, USA 2 Division of Petrology and Volcanology, National Museum of Natural History, Smithsonian Institution, Washington, DC 20560, USA 3 Consultant, Apdo. 360-2350 San Francisco de Dos Ríos, Costa Rica. 4 Department of Terrestrial Magnetism, Carnegie Institution of Washington, Washington, DC 20015, USA * Corresponding author. Tel: 617-353-4085; Fax: 617-353-3290; Email: [email protected]

Welcome message from author
This document is posted to help you gain knowledge. Please leave a comment to let me know what you think about it! Share it to your friends and learn new things together.
Transcript
1
The volatile content of magmas from Arenal volcano, Costa Rica
Jennifer A. Wade*1, Terry Plank1, William G. Melson2, Gerardo J. Soto3, Erik Hauri4
1 Department of Earth Sciences, Boston University, Boston, MA 02215, USA
2 Division of Petrology and Volcanology, National Museum of Natural History,
Smithsonian Institution, Washington, DC 20560, USA
3 Consultant, Apdo. 360-2350 San Francisco de Dos Ríos, Costa Rica.
4 Department of Terrestrial Magnetism, Carnegie Institution of Washington, Washington,
DC 20015, USA
* Corresponding author. Tel: 617-353-4085; Fax: 617-353-3290; Email: [email protected]
2
Abstract
We provide the first direct measurements of water in mafic melts from Arenal
volcano, Costa Rica. Ion microprobe analyses of olivine-hosted melt inclusions (MI)
from the prehistoric ET3 and ET6 tephra layers reveal high concentrations of volatile
species: ~1-4 wt% H2O, 50-300 ppm CO2, and > 3000 ppm S and Cl. The MI with the
highest water concentrations are the most mafic, and the dataset as a whole records a
history of degassing coupled with fractionation and ascent from ~ 2 kbar to 0.2 kbar.
Arenal MI form two groups based on their Al, CO2 and S contents. The ET3 high-Al MI
were trapped at the highest pressure, are closest to equilibrium with their host olivines
(~Fo79), which are closest to equilibrium with the bulk rock liquid. These MI are
excellent candidates for Arenal parental liquids, and can generate most Arenal volcanic
rock compositions by crystal accumulation (up to 30%), or crystal fractionation at a range
of pressure (0.5 – 3 kb) and H2O contents (0.5-3.5 wt%). The new sulfur data reported
here predict total sulfur output over the past ~30 years from bulk basaltic andesite liquid
that matches well spectroscopic estimates, and resolves the previously noted imbalance.
MI from different ET3 and ET6 samples show different F/Cl, while most trace element
ratios show a limited range similar to that of the host rocks. The high water content (4
wt% H2O) of Arenal basaltic magma is somewhat surprising given the weak subduction
signal recorded geochemically (e.g., low 10
Be and B). The Arenal MI data contribute to a
positive correlation between primary water contents and Ba/La in Central American
volcanoes, although further testing is required given the small number of data points, and
the expectation that water and trace elements should have different sources in the
subduction zone.
1. Introduction
Arenal volcano is a small (~ 15 km3; Carr, 1984) and young (~ 7000 yrs, Soto et
al., 1998; Soto and Alvarado, this issue) stratovolcano located in northwest Costa Rica. It
falls in the center of the Costa Rican portion of the Central American volcanic front.
Arenal’s history has been dominated by four ~800-year-long cycles between subplinian
eruptions, with strong strombolian and minor eruptions in between (Borgia et al., 1988;
Ghigliotti et al., 1993; Soto et al., 1998).
3
The volcano’s cyclic eruptive history has been recorded in a layered stratigraphy
that has been well-studied, particularly since the onset of the current, steady-state
andesitic eruption in 1968 (Melson and Sáenz, 1973; Melson, 1983; Reagan et al., 1987;
Borgia et al., 1988; Beard and Borgia, 1989; Cigolini, 1998; Streck et al., 2002, 2005,
and manuscripts from this issue). Petrological models for the evolution of Arenal
magmas place different emphasis on the importance of crystal fractionation, magma
mixing, crystal accumulation, and entrainment of xenoliths and xenocrysts of different
compositions. A common theme, however, is the continuous supply to the Arenal system
of mafic precursor magma. This often "unseen" parent magma is inferred to have high
water contents ( 3 wt%), manifest in eruptives with high Al concentrations, high-An
plagioclase, and most significantly, hornblende (Reagan et al., 1987; Borgia et al., 1988).
This view of a prevalent, parental magma with high initial water contents runs counter to
geochemical evidence that Arenal magmas have a weak ‘subduction signal,’ with low
values of various slab tracers (e.g., 10Be, Tera et al., 1986; B/La, Leeman et al., 1994).
Resolving this apparent contradiction requires direct measurements of the water content
of Arenal magmas, which is the purpose of this study.
Water plays a vital role in subduction zones. Originally present in slab sediments
and hydrous minerals of the subducting lithosphere, and later released in dehydration and
melting reactions, water drives mantle melting, and influences crystal fractionation and
eruption style (Sisson and Grove, 1993; Stolper and Newman, 1994; Roggensack et al.,
1997). Despite its central role in these processes, few quantitative measurements of H2O
have been made in arc volcanoes, as all magma degasses upon ascent and eruption. Rare
olivines, however, may trap melt at depths greater than H2O-vapor saturation and the
analysis of such melt inclusions may thus permit robust estimates of the initial H2O
content of arc magmas (Anderson, 1979; Sisson and Layne, 1993).
Central America is a good place to look for variations in magmatic water content
because other tracers from the slab, such as 10Be, Ba/La, and U/Th show systematic
variations along strike, peaking in Nicaragua and descending to the northwest into
Guatemala, and southeast into Costa Rica (Carr et al., 1990; Leeman et al., 1994; Patino
et al., 2000). Water concentration has been measured in olivine-hosted melt inclusions in
a few volcanoes along the Central American arc. Cerro Negro in Nicaragua lies near the

4
geographical peak in slab tracers (including 10Be and Ba/La), and basaltic melt inclusions
contain, on average, ~5 wt% H2O (Roggensack et al., 1997; Roggensack, 2001). To the
northwest in Guatemala and southeast in Costa Rica, where Ba/La is generally much
lower, magmatic water contents are also lower (~2 wt% at Pacaya and ~4 wt% at Fuego;
Walker et al., 2003 and ~3% at Irazú; Benjamin et al., 2004). Still it is unclear whether or
not “slab tracers” like Ba/La are directly related to H2O contents. Specifically, are the
sources of Ba and Be (and the means by which they are transported from the slab) the
same as those which deliver H2O?
We have made the first direct measurements of H2O, in addition to several other
volatile species (e.g. CO2, S, Cl, F) dissolved in olivine-hosted melt inclusions from
Arenal tephra, in order to better constrain the nature of the parent magma, as well as to
evaluate whether or not traditional “slab tracers” are accurate fluid proxies. Both
geographically and geochemically, Arenal falls in the middle, between Cerro Negro's
wet, high-slab signal and Irazú's low slab signal near the southeast terminus of the
Central American volcanic arc (Fig. 1).
2. Background
2.1 Eruptive history of Arenal
Arenal awoke from its most recent period of quiescence (since ~1700 AD) in
July, 1968 and continues to erupt as of this writing. Borgia et al. (1988) describe the
stratigraphy based on alumina content within each of the four eruptive cycles in Arenal’s
past, composed of a high alumina group (HAG, > 20% Al2O3), low alumina group
(LAG), an intermediate group, and finally the dacitic and basaltic tephras, two of which
are discussed in detail in this text (tephra units ET3 and ET6, originally described by
Melson, 1983). In their model, an ‘unseen’ basaltic magma evolves early, and through
fractionation and the redistribution of phases, generates a zoned andesite body, which
then evolves into an andesite/dacite cap. Throughout this period of zonation and
fractionation, the mafic, parent magma may be mixing with its own products (such as
plagioclase or gabbroic cumulates) or entraining crustal xenoliths (Cigolini, 1998).
When this zoned magma body erupts, it generates the Al-zoned stratigraphy observed on
the slopes of Arenal today. Based on the observance of hornblende solely in material

5
from the first blasts of the current eruption (Borgia et al., 1988; Reagan et al., 1987), this
model proposes that the beginning of each eruptive phase is marked by high-pH2O, which
decreases over the course of the cycle.
2.2 Previous H2O estimates from Arenal eruptives
The first estimates of water concentration in Arenal magmas were made using the
difference from 100% of major element analyses by electron microprobe (sum-deficit
technique). Anderson (1979) studied lapilli from the earliest blast of the 1968 eruption.
The recent eruption is olivine-poor, and the only inclusions available were plagioclase-,
pyroxene-, and magnetite-hosted andesite-dacite melts, which yielded H2O contents of 0-
7 wt% (Fig. 2a). The inclusions with the lowest water concentration are most likely
degassed, but if Arenal magmas do indeed contain up to 7% H2O, these would be the
highest-water contents measured in mafic Central American magmas. Sum-deficit H2O
estimates of 3.6 and 4.5 wt% were made by Melson (1983; Fig 2a) in 2 basaltic-andesite
melt inclusions in one olivine (Fo75) from a prehistoric tephra, ET6 (recently re-named
AR-16 by Soto and Alvarado, this issue). Such high water contents are not surprising
considering the units were explosive. Melson (1983)’s estimate of the H2O content in
ET6 is the estimate most widely used as representative of the Arenal mafic parent.
Other estimates of magmatic water contents at Arenal are more indirect. Borgia
et al. (1988) suggest that a buildup of pH2O (leading to variable H2O contents) in the pre-
eruptive body beneath Arenal might contribute to the volcano’s cyclic explosivity.
Streck et al. (2005) suggest a correlation between high-An plagioclase and deep,
continuously-replenishing high-H2O source magmas. Reagan et al. (1987) note that
hornblende is present in materials ejected during the early, explosive stages of the current
eruption, but then disappears, indicating high pH2O conditions (4-9 wt% H2O, although
they ultimately preferred the lower end of that range) (Fig. 2a). Beard and Borgia (1989)
also use the presence of hornblende in gabbroic enclaves to indicate 3-5% H2O in Arenal
basaltic andesites.
In summary, previous estimates support a water-rich magma parental to Arenal,
but considerable uncertainty exists as to actual H2O abundances. Sum-deficit
measurements can yield useful estimates of water concentration (within 1% of measured

6
values; Sisson and Layne, 1993), but pitfalls in microprobe analyses can lead to low
sums. The stability of amphibole is dependent on several parameters, including
temperature, pressure, and Na content (Sisson and Grove, 1993), in addition to water.
Our goal is thus to make the first direct measurements of water and other volatile species
in Arenal magmas, in order to constrain primary volatile compositions and test existing
petrologic models.
2.3 Explosive tephra units ET3 and ET6
As the first formed mineral in a mafic magma, olivine is the most likely to trap primitive
melt at high pressures, before the magma has substantially degassed its water. Olivines
found in lapilli tephra, rather than lavas, are strongly preferred, as the inclusions within
them cool quickly, minimizing loss of H out of the olivine by diffusion or through cracks
(Hauri, 2002). Lapilli < 3 cm further minimizes post-entrapment effects such as
crystallization of the glass, or reaction between the melt and the host grain (Luhr, 2001).
We have therefore focused our sampling on two of the most mafic tephra units in
Arenal’s eruptive history: ET3 (deposited ~930 BP) and ET6 (deposited ~1250 BP; Soto
and Alvarado, 2005). The new nomenclature in Soto and Alvardo (this issue) redefines
ET3 as AR-19 and ET6 as AR-16, but we retain here the original ET sample names to
prevent confusion with the previous work cited within this study. These units were first
described by Melson (1983) at ‘El Tajo’ (a former quarry west of the volcano, presently
under the water of Arenal reservoir). ET3 and ET6 mark the mafic eruptions that end two
of the four 800-year-long eruptive cycles in Arenal’s history (Melson and Sáenz, 1973;
Melson, 1983; Borgia et al., 1988; Soto et al., 1998). These prehistoric units contrast
with materials from the current ‘andesitic steady-state eruption’ in which olivine is
exceedingly rare (Reagan et al., 1987; Streck et al., 2005).
Tephra from the ET3 and ET6 units are very similar to each other in composition,
although ET3, which belongs to the HAG of Borgia et al. (1988) is higher in Al and Na,
and contains fewer plagioclase phenocrysts than ET6 (part of the LAG; Borgia et al.,
1988). Stratigraphically, ET3 is much thicker and more voluminous than ET6, although
erosion during the repose period after deposition of each may have obscured their true
eruptive volumes (Melson, 1983; Soto et al., 2000). Both deposits (ET6 and ET3) are

7
characterized by several layers of coarse, black lapilli separated by fine lapilli, ashes, and
accretionary lapilli, which most likely indicate repeated explosive events, probably
separated by short repose periods marked by unconformities, as can be seen in the most
proximal sections of ET3 (Melson, 1983; Soto et al., 1998, 2000). Compositional
variations with the ET3 unit are systematic with stratigraphic level, and record decreasing
crystal accumulation towards the top (Bolge et al., 2004).
Two new samples of lapilli from ET3 (AR0301 and AR0302; Table 1) were
collected in January, 2003 from a roadcut along the Entrance to Mirador El Silencio,
between La Fortuna and Sangregado Dam (UTM coordinates: 456150 m.E, 274080m.N).
These samples both yielded olivine-hosted melt inclusions, and are the primary focus of
this study. Sample AR0302 was taken immediately above ET4, and represents the basal
deposit and thus the first tephra of the ET3 eruption. AR0301 was collected 20 cm above
AR0302. The dominant phenocryst in AR0301 is plagioclase, and grains are fairly
uniformly-sized. This vesicular sample also contains clinopyroxene and minor olivine.
The dominant phenocryst in AR0302 is also plagioclase, with larger populations of
clinopyroxene and olivine than AR0301. AR0302 is much coarser-grained and less
vesicular than AR0301. We also analyzed olivine-hosted melt inclusions in thin sections
from the ET3 and ET6 samples originally described by Melson et al. (1983) from the type
El Tajo section. These samples are indicated by their National Museum of Natural
History (NMNH) sample number (Table 1).
3. Analytical Methods
Each hand sample was brushed, rinsed with MilliQ water to remove surface
impurities, and dried. Visibly unweathered sections were cut from each sample, and a
portion was powdered for bulk-rock analysis while the remainder was gently crushed in
an alumina jaw-crusher and sieved for mineral picking.
3.1 Melt inclusions: major, trace, and volatile element analyses
While picking olivine-hosted inclusions, we sought naturally glassy melt
inclusions, avoiding those that were cracked or breached, or touching the outer edge of
the host olivine. Olivines were very rare in the fractions picked (ranging from 250 –

8
1000 µm), averaging only one olivine grain per 150 g of sample. Of those olivines,
~30% yielded viable inclusions. Olivines were polished to expose inclusions, and then
mounted either directly in indium metal (to minimize background in the ion probe; Hauri
et al., 2002), or first in dental resin to be transferred to indium for volatile analysis.
Major element, S, and Cl concentrations in some inclusions were determined by
electron microprobe on a JEOL JXA-733 Superprobe at the Massachusetts Institute of
Technology using a 10 nA beam current, 10 µm spot, and 15 kV accelerating voltage.
Elements were counted for 40 s, except for Na which was counted for 5-10 s. Major
element concentrations were also determined on a Cameca SX 100 electron microprobe
at the American Museum of Natural History using somewhat different conditions: 10 nA,
12 µm, and 15 kV, with on-peak count times of 30 seconds. Chlorine and sulfur were
acquired at 40 nA, 12 µm, and 15 kV. Low totals in some samples are most likely due to
alkali loss (especially Na) during analysis, a common consequence of electron probe
analysis of hydrous glass (Devine et al., 1995). Uncertainty on S and Cl by EMP is ~ 3%
at AMNH (based of replicate analyses of the JDF glass standard in one session) and <
12% at MIT (based on replicate analyses of inclusions in 2 separate sessions).
Volatile (H2O, CO2, F, Cl, and S) concentrations in melt inclusions were
determined at the Carnegie Institution of Washington using a Cameca 6-F ion microprobe
using an 8 nA beam current, 30 µm spot, 5 kV accelerating voltage. On-peak count time
was ~5 s, and other protocols followed those in Hauri (2002). Some inclusions which
had been carbon-coated for EMP analysis prior to SIMS yielded very high CO2
concentrations (1000's of ppm CO2) which we interpreted as carbon contamination (Table
1). Precision on the SIMS (at DTM) is <1.5% 2 based on replicate analyses of melt
inclusions during the same session. However, the accuracy may be closer to 10% based
on uncertainty in the working curves developed for each session. Because S and Cl
contents were determined in 3 separate labs, during 7 different sessions, there is
variability between multiple analyses of single inclusions. Lab-to-lab variations arise
from the different standards and calibration strategies used, for example the use of sulfide
standards versus natural glasses (typically MORB), none of which are ideal for arc melt
inclusions. Nonetheless, replicate analyses agree on average by 12% (for S) and 9% (for
Cl).

9
Wavelength dispersive S K scans were performed on 5 inclusions to determine
speciation of dissolved S (Wallace and Carmichael, 1992). Analyses were performed by
EMP at the AMNH, following the methods of Mandeville et al. (in review). FeS and
BaSO4 were analyzed as in Carroll and Rutherford (1988), using a 40 nA beam current,
12 µm spot, and 15 keV accelerating voltage. Twelve to sixteen continuous S X-ray
scans were carried out for each inclusion, and the beam was moved within the inclusion
every 4-5 accumulations, in order to avoid oxidation effects due to local heating (Wallace
and Carmichael, 1992; Metrich and Clocchiatti, 1996). fO2 was calculated from the
sulfur-speciation model of Wallace and Carmichael (1994).
Trace element concentrations were determined in inclusions larger than 50µm in
diameter by laser-ablation inductively coupled plasma mass spectrometry (LA-ICP-MS)
at Boston University using a Merchantek/VG Microprobe II 213 nm Nd-YAG laser
ablation system coupled to a VG PQ ExCell quadrupole ICP-MS. Samples were ablated
in a He-Ar mixture at a flow rate of 700 mL/min. The laser was operated in spot-drill
mode at 5 Hz, at 80% power (0.118 – 0.137 mJ/pulse), for an energy density of ~ 6 J cm-
2. The beam expander (collimator) and iris were both set to 0%, resulting in a spot size of
40 µm. Dwell time for all elements was 20 ms. Laser data were acquired in time-
resolved mode, and calibrated against USGS glass BHVO-2g using the values in Kelley
et al. (2003), with 43
Ca as an internal standard. Precision on replicate analyses of BCR-
2g was 8% rsd.
3.2 Bulk-rock major and trace element analyses
In order to provide context for the melt inclusions from newly-sampled material,
host bulk rocks were analyzed for major and trace elements at Boston University,
following the techniques described by Kelley et al. (2003). Solutions were prepared for
major element analysis using LiBO2 fusions, and each resulting solution was diluted
~4300 x the original sample weight. Ten major elements were measured in these
solutions using a Jobin-Yvon 170C ICP-AES. Sample powders were prepared for trace
element analysis following HF-HNO3 digestion in Teflon screw-top vials, and resulting
solutions were diluted to ~2000 x the original powder weight. Thirty trace elements were
measured in these solutions using the VG PQ ExCell quadrupole ICP-MS at Boston
10
University. Raw ICP-MS and ICP-ES counts were blank-subtracted, corrected for drift
using an external solution (analyzed every 5 samples), and corrected for the dilution
weight. USGS standards BHVO-1 and BIR, as well as internal lab standards K1919 and
MAS1722 were used as calibration standards, using the values in Kelley et al. (2003).
Reproducibility of replicate ICP-ES and ICP-MS analyses is generally < 3% rsd.
3.3 Olivine hosts: major and trace element analyses
Major element concentrations in olivines were determined by electron microprobe
on a JEOL JXA-733 Superprobe at MIT, using the same conditions as the glass, although
on-peak counting times were 60 s for Fe, 20 s for Na, Ca, and Si, and 40 s for all other
elements, and at the AMNH, with on-peak counting times of 20 s for Na and Al, and 30 s
for all other elements. Transition metal, and Mg, and Fe concentrations were measured at
BU by LA-ICP-MS as above, except the laser was operated in line-scan (raster) mode at
10 Hz, 50% power (0.176 mJ/pulse), and a scan rate of 3 µm/s. Raster width was ~20
µm, with the beam expander (collimator) set to100%, and the iris to 10%. Dwell time for
all elements was 20 ms. Laser data were acquired in time-resolved mode, and calibrated
against USGS standard BIR-1g. Reproducibility of forsterite in the San Carlos Olivine
standard was < 1 % 2 (Table A1).
4. Results
4.1 Whole-rock compositions
Tephra from ET3 and ET6 contain some of the highest MgO, FeO, CaO, and
Al2O3, and lowest Na2O reported for Arenal (Fig. 4; Table 3). The new ET3 samples
reported here (AR0301 and AR0302) are basalts (50-52 wt% SiO2; Mg# = 53) and fall
within the range of previous ET3 analyses, correlating with the high Al2O3 (>20 wt%),
CaO (~11 wt%) and Ba/La (> 43) of the base of the ET3 section (Bolge et al., 2004; Fig.
5). Some of these chemical characteristics are thought to derive from excess plagioclase
at the top of the magma body prior to eruption of ET3 (Bolge et al., 2004).

11
4.2 Olivine phenocrysts
Nineteen olivines from ET3 and five from ET6 were analyzed for major and, in
some cases, trace element concentrations (Table A1). Figure 6 shows a histogram of the
olivine population from ET3 samples AR0301 and AR0302. Cores range from Fo76 to
Fo81 and rims range from Fo75-68, and thus the olivine grains as a group show normal
zoning. The upper range of the olivine forsterite contents (Fo81) is the dominant
population, and is in approximate equilibrium with the whole rock Mg# (assuming KD
(Oliv-Liq)Fe/Mg = 0.3 and Fe3+/Fe Fe = 10-20%). The olivine rims approach composition in
equilibrium with ET3 matrix glass (from Melson, 1983; Fig. 7). Thus the olivines in
these ET3 samples could have formed by closed system crystallization, with the first
olivines crystallizing from the bulk magma, and later olivines and rims forming from the
residual liquids. In comparison, the current eruption includes rare olivines (Streck et al.,
2005), and while some compositionally overlap with those from ET3 (Fig. 6), the
population's peak is shifted to lower mean Fo contents (<Fo75), consistent with the more
evolved whole rocks observed.
4.3 Melt inclusions- major elements and trace elements
Fifteen olivine-hosted melt inclusions from ET3 and four from ET6 were
analyzed for this study. All but one inclusion (NMNH ET3b) are fully enclosed, with
round, oval, oblong, or rectangular morphologies (Table 1). Figure 7 shows the Mg# of
the melt inclusions plotted against the Fo content of the host olivines. As is commonly
observed, Arenal melt inclusions have Mg#'s that are too low to be in equilibrium with
their host olivines. This is typically interpreted as a result of post-entrapment
crystallization of olivine within the melt inclusion during cooling (e.g., Cervantes and
Wallace, 2003). Notably, however, a few ET3 melt inclusions are in actual equilibrium
with their olivine hosts (Fig. 7), and so were likely trapped at a temperature similar to that
of the pre-eruptive magma. Melt inclusions trapped in higher-Fo olivines (> Fo75) tend to
be closer to equilibrium with their hosts than those trapped in lower-Fo olivine (< Fo75).
The six inclusions hosted in the lowest-Fo olivines are from the NMNH ET3 and ET6
thin sections, and all have low Al2O3 (see below). We assume that post-entrapment
crystallization is the main process that has led to a lack of equilibrium between melt

12
inclusion and host, and to correct for this, we added equilibrium olivine in 1% increments
into glass compositions until glass and olivine host satisfied KD (as above). The amount
of olivine that was added to achieve equilibrium ranged from 0-12%, and averaged 4%
(Table 1), typical again of other studies (Sisson and Layne, 1993; Cervantes and Wallace,
2003).
Melt inclusion compositions range from basalt to andesite (~ 50–59 wt% SiO2),
whether considering the uncorrected data and or the data corrected for post-entrapment
crystallization of olivine (Table 1). Once renormalized to volatile-free compositions, the
melt inclusions shift to a higher range in SiO2 (~ 51-61 wt%)and fall generally within the
range of other Arenal whole rocks in MgO and SiO2 (Fig. 4). Notably, FeO in the
renormalized melt inclusion compositions are higher than the whole rock compositions,
and so have not suffered from the kinds of Fe-loss effects described by Danyushevsky et
al. (2004; Fig. 4). However, nearly all inclusions have lower Al2O3 than Arenal whole
rocks at the same MgO (including all ET3 and ET6 whole rocks; Fig. 4). Not only are
they low, but they break into two groups of high- and low-Al, which correlate with
volatile concentrations (discussed below). For this reason, we will hereafter refer to the
two groups as HAMI (High Aluminum Melt Inclusions, with > 16.5 wt% Al2O3 in the
olivine-corrected compositions in Table 1) and LAMI ( 16.5 wt% Al2O3). Note that
these groups are different from those defined by Borgia et al. (1988), which were based
on whole rock compositions and discriminated by a much higher Al2O3 (20 wt%).
AR0301 HAMI have slightly higher Al2O3 than the HAMI from AR0302. The LAMI
form a systematic trend in their disequilibrium from host olivines (Fig. 7), and in general
represent more modified compositions. In fact, there are no volcanic rocks erupted from
Arenal that overlap with the LAMI, although many overlap with ET3 matrix glass
compositions (Bolge et al., 2004; Fig 4).
Melt inclusion REE patterns are nearly parallel to each other, as well as to most
whole-rocks from Arenal (Fig. 8). REE concentrations rise with SiO2 and P2O5, and
decreasing MgO, consistent with magma fractionation. Trace element ratios (e.g. Sm/La
and Ba/La; Fig. 5b) fall within the range for other Arenal rocks. Ba/La in the AR0301
melt inclusions (41-43) is nearly identical to that in the AR0301 whole rock (43; Fig. 5b).
The AR0302 melt inclusions include an anomalously low Ba/La value (35) and one (48)

13
that is similar to the whole rock value (45). The similarity in Ba/La between the ET3
melt inclusions and whole rocks provides evidence that the melt inclusions are indeed
derived from ET3 magma, and that ET3 whole rock Ba/La is not strongly affected by
plagioclase accumulation.
4.4 Melt inclusions- volatile content
Water concentrations in Arenal melt inclusions range from 1.1 to 3.9 wt% (Table
1, Fig. 9). These values correlate broadly with host Fo content (Fig. 9) and the SiO2
concentration in the melt inclusion (Fig. 2a), reflecting coupled crystal fractionation and
H2O degassing. CO2 in the melt inclusions varies from 50-300 ppm, and describes what
is best modeled as a closed-system degassing trend with H2O (Fig. 9). Mixed H2O-CO2
vapor-saturation isobars suggest that the highest-H2O inclusions from Arenal were
trapped at ~2 kbar, and the lowest at ~0.2 kbar (Fig. 9). HAMI were trapped at higher
pressures (> 1.2 kbar) than LAMI, as indicated by their higher H2O and CO2 contents.
These pressures are minima, however, as S and Cl will lower CO2 and H2O solubility in
melts, and so raise vapor saturation pressures (Webster, 2005). Based on crystal-melt
equilibria, Reagan et al. (1987), Cigolini (1998) and Ryder et al. (this issue) estimate 4-10
kbar crystallization pressures for modern Arenal magmas.
The melt inclusions with the highest water concentrations also have the highest
sulfur (~3000 ppm; Fig. 10a), and H2O and S together define a degassing trend analogous
to that of H2O and CO2. Modeling such a trend is more difficult than for H2O-CO2, given
the lack of experimental constraints on sulfur solubility in melts that are saturated with a
mixed vapor, and the complication of multiple sulfur species as a function of oxidation
state (Wallace and Carmichael, 1992). We thus take the approach of Sisson and Layne
(1993), and calculate a degassing path based on a constant partition coefficient between
vapor and melt, and independent constraints on the modal proportion of vapor, liquid, and
crystals, derived from the H2O-K2O relationships (Fig. 10a). While this exercise does not
take into account the importance of T, P, and fO2 controls on sulfur solubility, it does at
least provide a comparison to Sisson and Layne's calculation for Fuego melt inclusions.
We can create the Arenal S-H2O degassing path given 6 wt% vapor in the bulk separating
assemblage (e.g. with the other 94% being crystals), and a D(vapor/liquid) for sulfur of 70.

14
This calculation is consistent with the H2O-CO2 path shown in Fig. 9, as the vapor is
dominated by H2O along the path (> 97 wt%; Newman and Lowenstern, 2002). The
parameters calculated above for Arenal are broadly similar to those estimated for Fuego,
with Arenal having slightly less H2O in the mode (6% vs. 8% for Fuego) and a higher D
for S (70 vs. 34 for Fuego). The differences are consistent with Arenal melts having
lower overall water contents (1-4 wt% vs. 1-6 wt% for Fuego), and so less water vapor
in the mode. Arenal melts also record lower vapor saturation pressures (< 2 kbar vs. > 3
kbar for Fuego), consistent with a lower sulfur solubility in the melt (higher D).
The calculated sulfur degassing curve passes through all of the ET3 and ET6 melt
inclusions, except for two HAMI from AR0301. Melts from this sample appear to have
lower water for a given sulfur, which could be a primary feature of the parental melt. All
of the LAMI have < 1200 ppm S, and so reflect more degassed compositions than HAMI.
K- measurements indicate that most of the sulfur dissolved in Arenal melt inclusions is
speciated as sulfate (58-84% of total sulfur; Table 1), which means that none of the MI
contain enough sulfide species to saturate a sulfide phase (assuming 1200 ppm as the
limit of sulfide solubility in melts with 8 wt% FeOT; Wallace and Carmichael, 1992;
Fig. 10a). The high sulfur concentrations in least degassed Arenal melt inclusions, many
> 2000 ppm, also appear to reflect a lack of sulfide saturation during mantle melting, and
possible excess sulfur in the mantle source (Wallace, 2005). The measured sulfur
species, combined with the formulations in Wallace and Carmichael (1992) yield a range
of fO2 from 0.5 to 1.1 log units above NNO, or an average fO2 of NNO +0.9 (Table 1).
Such high fO2 estimates are typical of arc magmas (Carmichael, 1991; Wallace and
Carmichael, 1992; 1994; Metrich and Clocchiatti, 1996; Wallace, 2005) and fall within
the range of estimates made for Arenal by some previous workers. Reagan et al. (1987)
calculate ~NNO +0.3 based on coexisting titanomagnetite and ilmenite grains in a
gabbroic xenolith expelled during the recent eruption, while Beard and Borgia (1989)
calculate NNO +1 based on magnetite in gabbroic enclaves. Ryder et al. (this issue)
conclude that fO2 must be at least QFM+2 (~ NNO+1.2) in order to match the
fractionation assemblage of Stage 1 (1968-1971) Arenal magmas. With the exception of
the higher gabbroic estimates in Cigolini (1988; ~NNO +2), most studies, including the

15
melt inclusion-derived estimates here, thus support fO2 in the range of NNO +0.5 to +1
for Arenal mafic magmas.
In contrast to the progressive degassing of H2O, CO2, and S (Figs. 9, 10), Arenal
melt inclusions record increasing concentrations of F and Cl with SiO2 (Fig. 11). This is
consistent with the higher solubility of F and Cl (relative to H2O, CO2 and S) in mafic to
intermediate melt compositions (Webster, 2004). Similar degassing calculations for S
and Cl predict a D(vapor/liquid) of 6 for Cl, although value between 0 and 13 will produce a
degassing curve that passes through some portion of the melt inclusion data. The lower
D values, however, are consistent with the greater melt solubility of Cl than S, and the
incompatible behavior of Cl. Chlorine correlates well with other trace elements, such as
U (Fig. 11b), that are highly incompatible in crystals and vapors under these conditions.
Cl and F also correlate well in the ET6 melt inclusions, and within HAMI from different
samples (Fig 11a). Different F/Cl variations may reflect different parental magma
compositions for ET6, and different phases of the ET3 eruption. ET6 melt inclusions
also appear to have lower Cl for the same S as ET3 inclusions.
In summary, the most primitive melt inclusions from Arenal are high-alumina
basaltic liquids hosted in Fo76-79 olivines and contain up to 4 wt% H2O, > 200 ppm CO2, >
2000 ppm S, ~ 1500 ppm Cl and > 300 ppm F. The olivines that host these melt
inclusions are near equilibrium with whole rock compositions, and the melt inclusions
have trace element ratios similar to those in the whole rock hosts. Thus these volatile
estimates are reasonable for the ET3 parent magma. The ET6 melt inclusions are more
evolved, but have similar H2O-CO2 and S histories to the ET3 magmas, and so
presumably reflect a magma with a similar volatile budget to ET3 (albeit with slightly
different Cl and F). Taken as a whole, the melt inclusions record the systematic
degassing of H2O, CO2, and S upon ascent from >2 kbar to 0.2 kbar. Measures of magma
differentiation, such as Si, K and Fo covary with volatile contents, suggesting a coupled
process of ascent, degassing, and crystallization. The most degassed melt inclusions, with
H2O-CO2 vapor saturation pressures of < 1.2 kbar, also have unusual, low-Al
compositions that are unlike most volcanic rocks from Arenal.

16
5. Discussion
5.1 Implications for the differentiation of Arenal magmas
The data we report here for Arenal melt inclusions provides us with the
opportunity to reassess petrologic models for the differentiation of Arenal magmas. Most
rock samples collected from arc volcanoes are mixtures of crystals and liquid to varying
degrees. This is especially true of Arenal, where a high degree of crystallinity, in the
form of phenocrysts (Bolge, et al., 2004), xenocrysts (Streck et al., 2004) and xenoliths
(Reagan et al., 1987; Beard and Borgia, 1989; Cigolini, 1998), is widespread in mafic and
intermediate eruptives. Melt inclusions represent rare samples of magmatic liquid, and
can clarify the relative role of liquid and crystal in making up whole rock compositions,
and the extent to which whole rocks represent liquid compositions.
Here we provide an overview of the compositional spectrum of Arenal volcanic
rocks. Our inferences are based largely on MgO-Al2O3 systematics, as alumina has long
been recognized as a dominant vector of variability in Arenal volcanics, and relates
directly to processes involving plagioclase, the dominant crystalline phase (Borgia, et al.,
1988; Bolge et al., 2004) and (Fig. 12). We begin with the premise that the HAMI of
ET3 are potential liquids. These inclusions represent melt trapped at the highest
pressures, have the least degassed compositions, and are closest to equilibrium with the
host olivines. It follows that their major element compositions are the closest to actual
parental Arenal liquids.
In order to facilitate discussion of magma variation, we present a model
composition which we believe to be the best estimate of an Arenal parent magma (Table
2). We start with the major element composition of the highest MgO melt inclusion
(after olivine-correction, AR0302-5b). Because Na2O in this MI was likely lost during
the microprobe analysis, and P2O5 was not measured, we use values appropriate to whole
rocks in the same compositional range. A water content of 4.0 wt% was chosen to reflect
the maximum measured in Arenal melt inclusions (3.93 wt%), Other volatile species
were chosen to be consistent with H2O of 4 wt%, given the trends in Figures 9-10 and
F/Cl of 0.2 (Fig. 11). The composition was then re-normalized to 100% (both including
the volatiles, and without; Table 2). Clearly more than one parental magma feeds the

17
Arenal system, but the compositional features of this parent provides a useful reference to
the whole rock population.
In comparison to the HAMI and the model parent, virtually all the ET3 whole
rock samples are enriched in Al2O3, some by several wt% Al2O3 (up to 21 wt%; Fig. 12).
If the HAMI are liquids, then these whole rock samples are derived from more aluminous
parents, or have accumulated aluminous crystals. The fact that ET3 whole rocks are
otherwise similar to their melt inclusions (e.g. in terms of Ba/La and REE, Figs. 5 and 8),
does not support a wide variation in parental compositions. Instead, it is more likely that
the ET3 whole rocks are not liquids, but have accumulated an aluminous crystal
assemblage. This is supported by petrographic observations, modal analyses, and least
squares mixing calculations of ET3 whole rocks samples (Borgia et al., 1988; Bolge et
al., 2004). Moreover, the REE patterns of our ET3 samples (the whole rock hosts to the
melt inclusions) possess large positive Eu anomalies (Eu/Eu* of ~ 1.25, where Eu* is the
Eu chondrite-normalized concentration interpolated between Sm and Gd; Fig. 8; Table
4), which is a common feature of the ET3 whole rock population (Bolge et al., 2004).
Such a Eu anomaly can be generated by up to 30% accumulation of plagioclase
(assuming Sm = 0.17, Eu = 0.37 and Gd = 0.13 ppm; as in some Arenal plagioclases,
Reagan et al., this issue). In agreement with this result, crystal accumulation calculations
(Fig. 12) also show that the ET3 whole rock hosts (with > 20 wt% Al2O3) can be
produced from the model parent by 30-40% accumulation of mixtures of plagiolcase
(An90) and cpx, phases which are commonly observed as crystal clots (Borgia et al.,
1988) cognates (Beard and Borgia, 1989) or glomerocrysts (Borgia et al., 1988). Thus, it
seems reasonable that virtually all of the ET3 whole rocks have accumulated excess
plagioclase and clinopyroxene, and that the melt inclusions provide better samples of true
liquid compositions.
Although from a different eruption, our ET3 melt inclusions may also contribute
to the understanding of the current, on-going eruption. While most of our HAMI have
lower Al2O3 than any modern Arenal whole rocks, two HAMI from AR0301 overlap the
whole rock compositions from the on-going eruption (Fig 12). One of the inclusions
(AR0301-13a) has nearly identical MgO-Al2O3 to the inferred parent of the Stage 1
eruption (1968-1971; Ryder et al., this issue; Fig 12), although it is significantly higher in
18
FeO (Fig. 4). Thus, our MI data lend some support to the assumption in Ryder et al. (this
issue) that volcanic rocks from the on-going eruption represent liquid compositions. On
the other hand, the whole rocks of the on-going eruption possess a pervasive Eu anomaly
(Eu/Eu* ~ 1.1), which may derive from plagioclase accumulation or dissolution. Future
work may test this proposition for individual samples, by relating modal abundances of
crystals to trace element features sensitive to plagiolcase and clinopyroxene
accumulation, such as Eu anomalies and Sc excesses.
The population of whole rock samples with < 19% Al2O3 are comprised mainly of
more evolved tephras (< 3.5 wt% MgO), particularly from ET2, 4, and 5 (Fig. 12). These
more felsic samples generally contain fewer crystals than the more mafic samples
(Melson, 1983), and may more closely approximate liquids. Indeed, liquid line of
descent calculations (using the pMELTS algorithm of Ghiorso et al., 2002) demonstrate
that these tephras, as well as most of the HAMI, may be derived from the model parent
by crystal fractionation of a wet magma (3-4% H2O) at moderate pressure (~3 kbar; Fig.
12). Thus, the HAMI and these tephras, taken together, may record a dominant, wet
liquid line of descent for Arenal magmas. The break along the LLD between rocks with
increasing Al2O3 with decreasing MgO, and those with decreasing Al2O3 may mark the
late appearance of plagioclase on the high-pH2O cotectic. The cumulate complements to
low-MgO liquids on this liquid line of descent also predict solid compositions very
similar to those needed to generate high-MgO, high-Al2O3 rocks from the HAMI by
crystal accumulation (Fig. 12). If the volcanic rocks of the on-going eruption represent
liquid compositions, then they require even greater suppression of plagioclase, due to
higher water contents and/or higher pressures of crystallization than the low alumina
tephras. This inference is consistent with the high pressures (~ 4kb) of differentiation
also estimated by Ryder et al. (this issues) from their MELTS modeling.
The remaining Arenal magma compositions are the LAMI from ET3 and ET6.
These inclusions contain less CO2 and S than the HAMI of Group A, and so reflect
trapping at lower pressures (1.2 - 0.2 kbar) along decompressing, degassing paths (Figs.
9, 10). Figure 7 shows that these inclusions become progressively further out of
equilibrium as host Fo contents decrease, reflecting progressively more post-entrapment
crystallization and cooling prior to eruption. The low aluminum compositions are

19
consistent with calculated LLD resulting from early plagioclase fractionation at low-
pH2O (~ 0.5 kb, similar to their trapping pressures; Fig. 12). While this low pH2O origin
of the LAMI seems reasonable given the observations, it is somewhat problematic in that
these compositions are never observed in the whole rock population. LAMI do, however,
resemble ET3 matrix glass (Fig. 12), supporting the notion that these are residual liquids
formed at low pressure, and not caused by some post-entrapment effect unique to the
melt inclusions. Thus, LAMI represent residual liquids which may have formed in a
shallow mush zone and sampled as glass inclusions or matrix between phenocrysts, and
entrained in erupting magmas.
In summary, the melt inclusion data presented here provide baseline parental
liquid compositions (HAMI), against which the effects of crystal accumulation (in ET3
whole rocks) and crystal fractionation at high pH2O (HAMI and low Al2O3 tephra) and
low pH2O (LAMI) can be identified. Thus, the broad range of compositions erupted at
Arenal may be produced by the complementary process of crystal fractionation and
accumulation, from what could be a fairly restricted range of parental liquids. The ET3
HAMI may represent liquids parental to most of Arenal eruptives, and in this way, may
relate to the "unseen" compositions referred to in several studies of Arenal (Reagan et al.,
1987; Borgia et al., 1988; Beard and Borgia, 1989; Williams-Jones et al., 2001; Streck et
al., 2005).
5.2 The H2O content of Arenal magmas
The new melt inclusion data reported here demonstrate that Arenal magmas are
indeed wet, with H2O contents in ET3 and ET6 melt inclusions ranging from 1.1 – 3.9
wt%. The highest water contents are found in the lowest silica melt inclusions (~ 50%,
Fig. 2a), trapped at the highest pressures up to 2 kbar (Fig. 9). The lowest water contents
are found in the more silicic melt inclusions (~ 57%), trapped at low pressures near 0.2
kbar (Fig. 9). Therefore, as Arenal magmas differentiate, they ascend and degas, driving
further crystallization, and finally eruption. On a silica-H2O diagram (Fig. 2a), the melt
inclusions form two arrays, one correlating with higher pressures of entrapment (> 1
kbar, as recorded by their H2O-CO2 vapor saturation pressures, Fig. 9), and the other,
with a greater loss of water per increase in silica, correlating with lower pressures of

20
entrapment (< 1 kbar). ET6 inclusions appear to be restricted to the higher P array. Both
arrays converge at the low silica end, approaching 4 wt% H2O in basaltic melt inclusions.
Thus, our best estimate of the ET3 basaltic magma is 4 wt% H2O. These basaltic
melt compositions, however, are certainly not primary (i.e., not in equilibrium with
mantle peridotite), and a significant history of crystallization and degassing may have
preceded entrapment. In fact, if we back-project the H2O-CO2 degassing trend for
Arenal, it appears to intersect the melt inclusion data for Cerro Negro, with > 5% water
(Fig. 9). Such high water contents for Arenal, however, are not supported by the H2O-S
degassing path, which is highly curved and asymptotically approaches 4% water at very
high sulfur (> 3000 ppm), in excess of all sulfur measurements for Cerro Negro (Fig.
10a). In the lack of any other data, we therefore propose 4 wt% water as an upper limit
for Arenal basalts.
In support of this estimate is a calculation based on the Ca-Na exchange
hygrometer in Sisson and Grove (1993). Pairing the most mafic ET3 inclusions (> 5%
MgO; Table 1) with the maximum An measured in the basalt ET3 unit (An92.8-93.1) yields a
magmatic water content of ~4.5 wt% water (Fig. 2b). Although dependent to a large
degree on the plagioclase-melt pairing assumptions, this result is in excellent accord with
the maximum water contents measured in ET3 inclusions (3.8 - 3.9 wt%). Further work
targeting melt inclusions in high An plagioclases (although we found none suitably large
enough in our ET3 samples) should test this method, which has enjoyed some success in
other studies (Straub and Layne, 2003).
Confirmation of relatively high water contents in the late stages of two of
Arenal’s eruptive cycles (ET3 and ET6) cause us to reconsider the notion, based on the
presence of hornblende in the early blasts of the current eruption, that pH2O is highest
early in the eruptive cycle, and decreases over the course of the eruption (Borgia et al.,
1988). Phenocryst data reported by Borgia et al. (1988) in fact indicate the opposite
(their Figs. 10b, c). The eruptions leading up to ET3 and ET6, which are late in their
respective cycles, show a decrease in modal plagioclase content, with an increase in An
content. Because both suppression of plagioclase and high-An contents characterize wet
magmas (e.g., Sisson and Grove, 1993), it seems likely that pH2O was actually higher in
the later stages of the eruptive cycles, and not the beginning. Hornblende found in

21
enclaves ejected during the early stages of the current eruption in 1968 are not in
equilibrium with the host volcanic rocks (Beard and Borgia, 1989) and could have been
derived from pre-existing cumulates (Cigolini, 1998).
With a solid understanding of the water variations as a function of Arenal magma
evolution, we are now in a position to test predictions of previous studies as to the water
content of Arenal magmas. The most direct comparison is with the sum deficit estimates
of ET6 melt inclusions by Melson (1983), since this is the same sample in which we
obtained SIMS measurements. The sum deficit estimates, which fall between 3.5 and 4.3
wt% H2O, are higher than, but generally overlap with, our new measurements (2.8 – 3.5
wt% H2O; Fig 2a). The more precise SIMS data, however, define a systematic decline of
water with increasing silica not observed in the earlier measurements (Fig. 2a). ET6 melt
inclusions have fairly low sulfur (< 1500 ppm), but otherwise fall on the same S-H2O
degassing trend as ET3. Thus, they may have experienced more degassing, and
backtrack to higher H2O than measured (Fig. 10a). Our best estimate for ET6 (> 3.5 wt%
H2O) is in general accord with the values used by previous workers based on Melson's
original work (~ 4wt%).
Other petrological predictions of water content for Arenal magmas have been
made using volcanic materials from the recent eruption (since 1968), and so are not
strictly comparable to our ET3 and ET6 measurements. Nonetheless, the similarity in
major and trace element contents of ET3 and recent eruptives invites such a comparison.
Several studies used the presence of hornblende, combined with the co-existence of other
phases, to argue for water contents from 3-5 wt% in basaltic andesites (Fig. 2a; Reagan et
al., 1987; Beard and Borgia, 1989). This range generally exceeds that measured here in
basaltic andesite melt inclusions (< 3%), but not that in the basaltic melt inclusions (3-
4%). Arenal basaltic melts (i.e. with SiO2 < 52 wt%), however, generally have Na2O (<
3%), too low to stabilize hornblende (Fig. 4c, d; Sisson and Grove, 1993), and so the
hornblende-based estimates more reasonably apply to compositions > 56% silica (as is
appropriate to the Stage 1 lavas of the on-going eruption; Regan et al., 1987). The wide
range of water estimates derived from hornblende stability underscore its use as a blunt
tool, which requires independent knowledge of other parameters (e.g. Na, T and P) to use
with greater precision. Likewise, the sum deficit estimates from Anderson (1979) predict

22
values between 0 and 7%, in mostly dacitic melts (Fig. 2a). We find no evidence for
water contents higher than 4% in our samples, and so the higher previous estimates either
derive from imprecision in the previous techniques, or a fundamental difference in the
way that the modern eruption evolves. We note, however, that the estimates of Ryder et
al. (2005-this issue) using MELTS (2.5 wt% H2O) conform well to our measurements for
ET3 basaltic andesite inclusions (Fig. 2a).
In summary, petrologic inferences, and now direct measurements in melt
inclusions indicate that Arenal magmas contain up to 4 wt% H2O. Although some
previous workers estimated much higher H2O contents for silicic compositions from the
recent eruption, these have yet to be confirmed with direct measurements. Olivine is rare
in the current eruption, but future work could focus on melt inclusions within other
phases (such as high An plagioclases and high Mg# clinopyroxenes), coupled with the
use and development of geohygrometers.
5.3 Implications for S fluxes
We can also use the new sulfur data presented here to help reconcile the
petrologic vs. spectroscopic estimates of sulfur output at Arenal. Williams-Jones et al.
(2001) measured SO2 fluxes in the volcanic plume at Arenal using correlation
spectrometry (COSPEC) in 1982, 1995, and 1996. With these data, they estimate that at
least 1.3 Mt (and as much as 3.9 Mt) of SO2 has been emitted from Arenal between 1968
and 1996. This output is much larger than what they calculated from S concentrations in
clinopyroxene- and plagioclase-hosted melt inclusions in recent surge and lava deposits,
which averaged 356 ppm. Assuming that the total volume of material extruded from
Arenal since 1968 was ~4.6 x 10⁸ m3, their calculation resulted in the emission of SO2
(ESO2) = 0.41 Mt, a factor of 3-9 times lower than the COSPEC estimate. To account for
this discrepancy, they invoke a continuously-replenishing sulfur-rich basaltic magma.
Our sulfur data suggest an alternative explanation, however. The inclusions used
by Williams-Jones et al. (2001) were dacitic (Fig. 4), and considerably more degassed
than we would predict for the basaltic andesite eruption they were trying to model. Fig.
13 shows sulfur in our mafic to intermediate melt inclusions, compared to their dacitic
inclusions. The inclusions as a whole define a sulfur degassing trend as silica in the melt

23
increases. If our pre-historic melt inclusions are representative of the modern magmas,
then this trend would predict between 500 and 1500 ppm sulfur in undegassed basaltic
andesite magma containing 54-55 % SiO2, like the bulk of the modern eruption (Reagan
et al., 1987). This effect alone raises the petrologic estimate by a factor of 1.5 - 4.3, and
into the range of the COSPEC estimates. But Williams-Jones et al. (2001) also assume
that their dacitic melt inclusions represent only 50% of the erupted volume, with the other
50% being crystals. If we assume instead that the entire volume of erupted magma was
once a bulk basaltic andesite liquid, then the estimates increase by another factor of 2 (3-
9), almost precisely within the COSPEC range (Fig. 13).
Quantitative degassing of the observed volume of basaltic andesite liquid erupted
from 1968-1996 provides ample sulfur to account for what is measured by COSPEC. In
fact, given that parental Arenal basaltic magmas begin with > 2000 ppm sulfur, a large
surplus of petrologic sulfur must be degassed or lost to other regions of the crust and not
contribute to the volcanic plume. This means that SO2 fluxes measured in volcanic
plumes may grossly underestimate basaltic fluxes.
5.4 Implications for slab proxies
A final implication of our results is for the cycling of water and other tracers from
the downgoing plate to the mantle source beneath Arenal. Because water measurements
in arc magmas are rare, existing literature has relied on various proxies, such as boron
(Leeman et al., 1994) and Ba/La (Walker et al., 1995), based on their presumed "fluid-
mobile" behavior. Now that we have both an estimate of magmatic H2O and trace
element data on a set of melt inclusions, we can evaluate the accuracy of slab-derived
fluid proxies such as Ba/La. It is first important to note the similarity in Ba/La between
our melt inclusions and Arenal whole rocks, particularly those from ET3 (Table 4, Fig.
5b). Moreover, the relative constancy in Ba/La (41-43) in ET3 sample AR0301 (Table 4),
over a large range in silica (50-57%), provides evidence against crustal contamination, as
has been proposed by Cigolini (1998), based on the presence of crustal xenoliths in the
early phase of the recent eruption. These observations support an uncontaminated,
common lineage between the parent magma of the melt inclusions and the ET3 whole
rocks.
24
The water contents of Arenal basaltic melt inclusions (~ 4 wt%) are less than
those from Fuego (4-5 wt%; Roggensack, 2001b; Sisson and Layne, 1993) and Cerro
Negro (5-6 wt%; Roggensack et al., 1997) but greater than those from Irazú (~ 3 wt%;
Benjamin, 2004), and this is the same sense of variation as Ba/La (e.g., from > 100 for
Cerro Negro, and < 25 for Irazú). Before comparing these variations in detail, however,
water contents must be corrected for differences in the extent of differentiation with
respect to primary magmas. If we add olivine to the melt inclusion compositions until
they are in equilibrium with mantle olivine (Fo90), there is much less difference in
primary water contents (H2OFo90) along-arc (Fig. 14). Cerro Negro is still the wettest (avg.
H2OFo90 ~3.6 wt%) and Irazú the driest (avg. H2OFo90 ~2.4 wt%, higher only than
Guatemalan behind-the-front (BVF) volcanoes; Fig. 14), but the total range is now only a
factor of 1.5. Within this restricted range, the primary H2OFo90 contents do correlate with
Ba/La, and so there is some basis for using Ba/La as a water proxy. Moreover, within
ET3 samples from Arenal, AR0302 appears to have slightly higher water (also at constant
S; Fig 10a), as well as higher Ba/La (Fig. 14), so these parameters may correlate at a fine
scale.
The variation of Ba/La with water, however, is not simply related to progressive
addition of a H2O-rich and Ba/La-rich component to a MORB or OIB mantle. All the
Central American magmas have water contents that are significantly higher than MORB
or OIB, despite the fact that Ba/La approaches OIB values in Irazú. In fact, these results
are counter to previous notions that Costa Rican volcanics derive largely from an
enriched OIB mantle with a weak or absent subduction component (e.g. Herrstrom et al.,
1995; Carr, 1984; Patino et al., 2000). Arenal MI with > 3 wt% H2O have H2O/Ce of
1000 – 2300 (Table 4), roughly an order of magnitude higher than that in the MORB-OIB
mantle (H2O/Ce = 100-250; Dixon et al., 2002). Even without subtracting the Ce
contributions from the slab, this requires up to an order of magnitude higher H2O in the
mantle source to Arenal than MORB-OIB mantle.
Even more noteworthy are the high Cl contents in Costa Rican magmas (Arenal
and Irazú), higher than those in Nicaraguan magmas. Thus for some slab tracers (Cl),
Costa Rican volcanoes actually bear a dominant signal. The ratio of Cl to H2O also
varies systematically from volcano to volcano, with the lowest ratios at Cerro Negro, and

25
the highest at Irazú (Fig. 15). If we convert these to equivalent salinities (following Kent
et al., 2002), then the Cerro Negro fluid is similar to seawater salinity (~ 3%), while the
Irazú fluid is five times more saline. Thus, questions as to the mantle composition aside,
different slab components appear to feed the different volcanoes along the Central
American arc, from a water-rich, low salinity, high Ba/La fluid at Cerro Negro, to a fluid
with the opposite characteristics at Irazú, and Arenal falling in between.
What is the source of these different slab components that vary along the arc?
There are three key parameters that vary along-strike of the trench that may contribute to
differences in the slab component. First is the extent of hydration of the down-going
plate, which appears to be greater off Nicaragua than Costa Rica. This is based on the
extent of outer rise faulting (Ranero et al., 2003), the seismic velocity of the slab
waveguide (Abers et al., 2003), and low- 18O values in wet Nicaraguan lavas which may
be a result of serpentine-derived fluids (Eiler et al., 2005). Second is the greater
contribution to Nicaragua volcanoes of the uppermost pelagic sediments, which contain
high 10Be and Ba/La (Patino et al., 2000), than to Costa Rica volcanoes (Tera et al.,
1986), where the uppermost sediment appears to be underplated (Morris et al., 2002).
Third is the appearance of Galapagos-derived igneous and volcaniclastic material to the
south at the Cocos Ridge and nearby seamounts (Werner et al., 1999; Hoernle, et al.,
2000), which contribute material to central Costa Rica (Arenal to Irazú) with low Ba/La
(like OIB) and presumably high water and Cl (seawater-altered volcaniclastic sediments
and igneous rocks). As a result of these effects, the high water, Ba/La and 10Be of
Nicaragua may relate to the greater hydration of the crust and efficient subduction of
pelagic sediments, while the lower water, 10Be and Ba/La of Costa Rica relates to loss of
the pelagic sediment and gain of OIB volcanic material to the subduction zone. With
multiple sources potentially contributing along the arc (serpentine, altered ocenic crust,
pelagic sediments, and volcaniclastic material), a simple H2O proxy seems unlikely.
Clearly the above hypotheses, as well as the basis for the Ba/La proxy, require testing
with more measurements of the volatile content of Central American volcanoes.
6. Conclusions
With a relatively small number of well-chosen MI, we are able to determine an

26
elusive but fundamental parameter in Arenal magmas: the volatile content of the basaltic
liquid parental to Arenal eruptives. We have made here the first direct water
measurements of Arenal melts, and related them to the magmatic evolution and
subducted sources beneath Arenal volcano. Below are the main results and conclusions
of this work:
1. Olivine-hosted melt inclusions from prehistoric ET3 tephra include high-aluminum
basaltic liquids hosted in Fo76-79 olivines and contain up to 4 wt% H2O, 300 ppm CO2,
3000 ppm S, 1500 ppm Cl and 300 ppm F. Unlike some melt inclusions in the literature,
these are close to equilibrium with their host olivines, and reflect trace element
compositions similar to that of the host magma. The population of olivine phenocrysts in
ET3 tephra could have formed during crystallization of the host magma, and do not
appear to be exotic. Thus the volatile and major element contents of the ET3 melt
inclusions presumably reflect that of the ET3 parental liquids, and we present here an
Arenal “model parent” based on the most mafic and least degassed MI compositions
(Table 2).
2. The high sulfur concentrations (>2500 ppm) of the least degassed ET3 inclusions are
in excess of what would be expected for sulfide-saturated melts from the mantle. This is
consistent with 58-84% of the total sulfur speciated as sulfate, and high fO2 in Arenal
mafic magmas (NNO +0.5 to +1.1).
3. H2O, CO2 and S covary in a manner consistent with degassing of a vapor phase, from 2
kbar to 0.2 kbar. Cl and F, on the other hand, behave like, and correlate with, other
incompatible trace elements (e.g. U). These relationships are expected from the known
solubility of volatile species in silicate melts. F/Cl varies by more than a factor of 2
between different samples of ET3.
4. Degassing and ascent, as estimated from vapor saturation relationships, correlate with
measures of magma differentiation, such as Si, K and Fo. Therefore polybaric crystal
fractionation, with decreasing pH2O, is one driver of magma evolution at Arenal. The

27
most degassed melts, with H2O-CO2 vapor saturation pressures of < 1.2 kbar, also have
unusual, low-Al compositions that are unlike any erupted lava or tephra from Arenal.
They are similar, however, to matrix glass compositions, and appear to be residual liquids
formed and trapped at shallow depths in the magmatic plumbing system.
5. The high alumina melt inclusions are better candidates for Arenal liquids than ET3
whole rocks, most of which have suffered as much as 30-40% crystal accumulation of
plagioclase and clinopyroxene. A few melt inclusions from ET3 olivines are similar to
parental and derivative melts inferred for the on-going eruption by Ryder et al (this
issue). Some Arenal volcanic rocks and glasses lie on model liquid lines of descent
derived from the model parent, at different pressures (0.5 – 3 kb) and H2O (0.5 – 3.5
wt%). In the case of Arenal, melt inclusions provide not just volatile information, but
otherwise unmeasured and unseen magmatic liquid compositions.
6. Using ET3 and ET6 melt inclusions as analogs, quantitative degassing of the observed
volume of basaltic andesite liquid erupted in 1968-1996 could have provided ample
sulfur to account for that measured by COSPEC.
7. Based on H2O-S degassing systematics, 4% H2O is the best maximum estimate for
undegassed mafic ET3 magmas. This estimate is somewhat lower than the earlier
estimates of Melson (1983) by sum deficit for ET6, and present data define well the
polybaric degassing paths from basalt to andesite. The similarity between ET3 and ET6
tephra and recent eruptives suggest that 4% water may be typical of modern mafic
precursors as well.
8. The high water and Cl contents of Arenal magmas were not predicted by other
geochemical tracers of the slab (10
Be, Ba/La, B/La, U/Th), which show a weak
subduction signal. For example, Ba/La in Arenal is almost 3 times lower than for Cerro
Negro in Nicaragua, while calculated primary water contents are only 1.3 times lower.
Existing data from four Central American volcanoes (Irazú, Arenal, Fuego and Cerro
Negro) show a positive relationship between H2O and Ba/La, but with a high H2OFo90

28
intercept, suggesting sources of water in the subduction zone from low-Ba/La materials.
This makes sense given that pelagic sediments will contribute high Ba/La, but other
hydrous sources (e.g. altered oceanic crust, serpentinintes, volcaniclastic sediments) may
not.
7. Acknowledgements
We thank Geoff Abers, Guillermo Alvarado, and Jim Gill for their valuable comments
and support, and Louise Bolge for conversation, perspective, and data. Detailed and
helpful reviews from Mark Reagan, Kurt Roggensack and an anonymous reviewer
greatly improved the text and presentation of the data. Thanks to Nilanjan Chatterjee,
Charles Mandeville, and Mindy Zimmer for analytical help, and to ICE and the
MARGINS program for continued sponsorship of our endeavors. This work was made
possible by NSF OCE-0001897 and OCE-0203650 (PI, Plank).

8. References
Abers, G.A., T. Plank, and B.R. Hacker, 2003. The wet Nicaraguan slab. GeophysicalResearch Letters 30(2): doi: 10.1029/2002GL015649.
Anderson, A.T., 1979. Water in some hypersthenic magmas. Journal of Geology 87, 509-
531.
Asimow, P.D., J.E. Dixon, C.H. Langmuir, 2004. A hydrous melting and fractionation
model for mid-ocean ridge basalts: Application to the Mid-Atlantic Ridge near the
Azores. Geochemistry, Geophysics, Geosystems 5(1): doi: 10.1029/2003GC000568.
Beard, J.S., A. Borgia, 1989. Temporal variation of mineralogy and petrology in cognate
gabbroic enclaves at Arenal volcano, Costa Rica. Contributions to Mineralogy and
Petrology 103, 110-122.
Benjamin, E.R., T. Plank, E.H. Hauri, K.A. Kelley, J.A. Wade, G.E. Alvarado, 2004.
Water content of a hypothetically dry magma: the 1723 and 1963-65 eruptions of Irazú
volcano, Costa Rica. Eos, Trans. AGU, 85(17) Jt. Assem. Suppl., Abstract V54B-02.
Bolge, L.L., M.J. Carr, M.D. Feigenson, A.Borgia, 2004. The geochemistry and
magmatic evolution of Explosive Tephra 3 and 4 from Arenal Volcano, Costa Rica.
Revista Geológica de América Central, G.J. Soto and G.E. Alvarado, eds. Universidad
de Costa Rica.
Bolge, L.L., M.J. Carr, M.D. Feigenson, G.E. Alvarado, (this issue). Geochemical
stratigraphy and magmatic evolution at Arenal volcano, Costa Rica. Journal of
Volcanology and Geothermal Research.
Borgia, A., C. Poore, M.J. Carr, W.G. Melson, G.E. Alvarado, 1988. Structural,
stratigraphic, and petrologic aspects of the Arenal-Chato volcanic system, Costa Rica:
Evolution of a young stratovolcanic complex. Bulletin of Volcanology 50, 86-105.
Carmichael, I.S.E., 1991. The redox states of basic and silicic magmas: a reflection of
their source regions? Contributions to Mineralogy and Petrology 106, 129-141.
Carr, M.J., 1984. Symmetrical and segmented variation of physical and geochemical
characteristics of the Central American volcanic front. Journal of Volcanology and
Geothermal Research 20, 231-252.
Carr, M.J., M.D. Feigenson, L.C. Patino, J.A. Walker, 2003. Volcanism and
geochemistry in Central America: Progress and Problems. Inside the Subduction
Factory, Geophysical Monograph, vol. 138. The American Geophysical Union, 153-179.

Carroll, M.R., M.J. Rutherford, 1988. Sulfur speciation in hydrous experimental glasses
of varying oxidation state: Results from measured wavelength shifts of sulfur X-rays.
American Mineralogist 73, 845-849.
Cervantes, P., P.J. Wallace, 2003. Magma degassing and basaltic eruption styles; a case
study of approximately 2000 year BP Xitle Volcano in central Mexico. Journal of
Volcanology and Geothermal Research 120(3-4), 249-270.
Cigolini, C., 1998. Intracrustal origin of Arenal basaltic andesite in the light of solid-melt
interactions and related compositional buffering. Journal of Volcanology and Geothermal
Research 86, 277-310.
Danyushevsky, L.V., R.A. Leslie, A.J. Crawford, P. Durance, 2004. Melt inclusions in
primitive olivine phenocrysts: the role of localized reaction processes in the origin of
anomalous compositions. Journal of Petrology 45(12), 2531-2553.
Devine, J.D., J.E. Gardner, H.P. Brack, G.D. Layne, M.J. Rutherford, 1995. Comparison
of microanalytical methods for estimating H2O contents of silicic volcanic glasses.
American Mineralogist 80(3-4), 319-328.
Dixon, J.E., L. Leist, C. Langmuir, J-G. Schilling, 2002. Recycled dehydratrated
lithosphere observed in plume-influenced mid-ocean-ridge basalt. Nature 420, 385-389.
Eiler, J.M., M.J. Carr, M. Reagan, E. Stolper, 2005. Oxygen isotope constraints on the
sources of Central American arc lavas. Geochemistry, Geophysics, Geosystems 6(7),
doi: 10.1029/2004GC000804.
Ghigliotti, M., A. Frullani, G.E. Alvarado, G.J. Soto, 1993. Distribución areal y
caracteristicas de los depositos de tefra màs recientes (1080-1968 dC) del Volcán Arenal.
Boletín Observatorio Vulcanológico del Arenal 4(8), 11-33.
Ghiorso, M.S., M.M. Hirschmann, P.W. Reiners, V. C. Kress, III, 2002. The pMELTS: A
revision of MELTS for improved calculation of phase relations and major element
partitioning related to partial melting of the mantle to 3 GPa. Geochemistry, Geophysics,
Geosystems 3(5), doi: 10.1029/2001GC000217.
Ghiorso, M.S., R.O. Sack, 1995. Chemical mass transfer in magmatic processes. IV. A
revised and internally consistent thermodynamic model for the interpolation and
extrapolation of liquid-solid-equilibria in magmatic systems at elevated temperatures and
pressures. Contributions to Mineralogy and Petrology, 119, 197-212.
Hauri, E., J. Wang, J.E. Dixon, P.L. King, C. Mandeville, S. Newman, 2002. SIMS
analysis of volatiles in silicate glasses 1. Calibration, matrix effects and comparisons with
FTIR. Chemical Geology, 183, 99-114.
Hauri, E., 2002. SIMS analysis of volatiles in silicate glasses. 2: isotopes and abundances
in Hawaiian melt inclusions. Chemical Geology 183, 115-141.
Herrstrom, E.A., M.K. Reagan, J.D. Morris, 1995. Variations in lava compositionassociated with flow of asthenosphere beneath southern Central America. Geology 23(7),617-620.
Hoernle, K., R. Werner, J. Phipps Morgan, D. Garbe-Schonberg, J. Bryce, J Mrazek,2000. Existence of complex spatial zonation in the Galapagos plume for at least 14 m.y.Geology 28(5), 435-438.
Kelley, K.A., T. Plank, J. Ludden, H. Staudigel, 2003. Composition of altered oceanic
crust at ODP Sites 801 and 1149. Geochemistry, Geophysics, Geosystems 4(6), doi:
10.1029/2002GC000435.
Kent, A.J.R., D.W. Peate, S. Newman, E.M. Stolper, J. Pearce, 2002. Chlorine in
submarine glasses from the Lau Basin: seawater contamination and constraints on the
composition of slab-derived fluids. Earth and Planetary Science Letters 202 361-377.
Leeman, W.P., M.J. Carr, and J.D. Morris, 1994. Boron geochemistry of the CentralAmerica Volcanic Arc: Constraints on the genesis of subduction-related magmas.Geochimica et Cosmochimica Acta 58, 149-168.
Luhr, J.F., 2001. Glass inclusions and melt volatile contents at Paricutin Volcano,
Mexico. Contributions to Mineralogy and Petrology, doi: 10.1007/s004100100293.
Mandeville, C.W., J.D. Webster, C. Tappen, B.E. Taylor, A. Timbal, A. Sasaki, E. Hauri,
C.R. Bacon, (in review). Stable isotope and petrologic evidence for open-system
degassing during the climactic and pre-climactic eruptions of Mt. Mazama, Crater Lake,
Oregon. Geochimica et Cosmochimica Acta.
Melson, W.G., 1983. Alternation between acidic and basic magmas in major explosive
eruptions of Arenal volcano, Costa Rica. Boletin de Volcanologia, Universidad Nacional,
Costa Rica 14, 65-74.
Melson, W.G., R. Saenz, 1973. Volume, energy, and cyclicty of eruptions of Arenal
volcano, Costa Rica. Bulletin of Volcanology 37, 416-437.
Metrich, N., R. Clocchiatti, 1996. Sulfur abundance and its speciation in oxidized
alkaline melts. Geochimica et Cosmochimica Acta 60(21), 4151-4160.
Morris, J., R. Valentine, T. Harrison, 2002. 10
Be imaging of sediment accretion and
subduction along the northeast Japan and Costa Rica convergent margins. Geology 30(1),
59-62.

Newman, S., J.B. Lowenstern, 2002. VolatileCalc: a silicate melt H2O-CO2 solution
model written in Visual Basic for Excel. Computers and Geosciences 28, 597-604.
Patino, L.C., M.J. Carr, M. D. Feigenson, 2000. Local and regional variations in Central
American arc lavas controlled by variations in subducted sediment input. Contributions to
Mineralogy and Petrology 138, 265-283.
Plank, T., C.H. Langmuir, 1998. The chemical composition of subducting sediment and
its consequences for the crust and mantle. Chemical Geology 145, 325-394.
Ranero, C.R., J. Phipps Morgan, K. McIntosh, C. Reichert, 2003. Bending-related
faulting and mantle serpentinization at the Middle America trench. Nature 425, 367-373.
Reagan, M.K., J.B. Gill, E.Malavassi, M.O. Garcia, 1987. Changes in magma
composition at Arenal volcano, Costa Rica, 1968-1985: Real-time monitoring of open-
system differentiation. Bulletin of Volcanology 49, 415-434.
Reagan, M.K., F.J. Tepley, III, J.B. Gill, M. Wortel, J. Garrison, (this issue). Timescales
of degassing and crystallization implied by 210
Po - 210
Pb - 226
Ra disequilibrium for
andesitic lavas erupted from Arenal volcano.
Roggensack, K., R.L. Hervig, S.B McKnight, S.L. Williams, 1997. Explosive basaltic
volcanism from Cerro Negro volcano: Influence of volatiles on eruptive style. Science
277, 1639-1642.
Roggensack, K., 2001a. Sizing up crystals and their melt inclusions: a new approach to
crystallization studies. Earth and Planetary Science Letters 187, 221-237.
Roggensack, K., 2001b. Unraveling the 1974 eruption of Fuego volcano (Guatemala)
with small crystals and their young melt inclusions. Geology 29(10), 911-914.
Ryder, C.H., J.B. Gill, F. Tepley, III, F. Ramos, M.K. Reagan, (this issue). Closed to
open system differentiation at Arenal Volcano (1968-2003).
Salters, V.J.M., A. Stracke, 2004. Composition of the depleted mantle. Geochemistry,
Geophysics, Geosystems 5(5), doi: 10.1029/2003GC000597.
Sisson, T.W., T.L. Grove, 1993. Experimental investigations of the role of H2O in calc-
alkaline differentiation and subduction zone magmatism. Contributions to Mineralogy
and Petrology 113, 143-166.
Sisson, T.W., G.D. Layne, 1993. H2O in basaltic andesite glass inclusions from four
subduction-related volcanoes. Earth and Planetary Science Letters 117, 619-635.

Soto, G.J., G.E. Alvarado, J. Bonilla, J. Madrigal, A. Mata, R. Ramirez, L. Rojas, J.
Salazar, E. Tristán, A. Villegas, 2000. Las facies proximales de la gran erupción
piroclástica basáltica ET-3 del volcán Arenal. Boletín OSIVAM 12(23-24), 54-63.
Soto, G.J., G.E. Alvarado, M. Ghigliotti, 1998. El registro eruptivo del Arenal en el
lapso 3000-7000 años antes del presente y nuevas deducciones sobre la edad del volcán.
Boletín OSIVAM 9(17-18), 19-49.
Soto, G.J., G.E. Alvarado, (this issue). Eruptive history of Arenal volcano, Costa Rica,
7ka to present. Journal of Volcanology and Geothermal Research.
Stolper, E., S. Newman, 1994. The role of water in the petrogenesis of Mariana trough
magmas. Earth and Planetary Science Letters 121, 293-325.
Straub, S.M., G.D. Layne, 2003. The systematics of chlorine, fluorine, and water in Izuarc front volcanic rocks: Implications for volatile recycling in subduction zones.Geochimica et Cosmochimica Acta 67(21), 4179-4203.
Streck, M.J., M.A. Dungan, E. Malavassi, M.K. Reagan, F. Bussy, 2002. The role of
basalt replenishment in the generation of basaltic andesites of the ongoing activity at
Arenal volcano, Costa Rica: evidence from clinopyroxene and spinel. Bulletin of
Volcanology 64, 316-327.
Streck, M.J., M.A. Dungan, F. Bussy, E. Malavassi, 2005. Mineral inventory of
continuously eruption basaltic andesites at Arenal volcano, Costa Rica: implications for
interpreting monotonous, crystal-rich, mafic arc stratigraphies. Journal of Volcanology
and Geothermal Research 140, 133-155.
Sun, S., W.F. McDonough, 1989. Chemical and isotopic systematics of oceanic basalts:
implications for mantle composition and processes. In: Saunders, A. D. & Norrey, M. J.
(eds) Magmatism in the Ocean Basins. Geological Society, London, Special Publications
42, 313-345.
Tera, F., L.D. Brown, J.D. Morris, S.I. Sacks, J. Klein, R.Middleton, 1986. Sediment
incorporation in island-arc magmas: inferences from 10
Be. Geochimica et Cosmochimica
Acta 50, 535-550.
Walker, J.A., M.J. Carr, L.C. Patino, C.M. Johnson, M.D. Feigenson, and R.L. Ward,1995. Abrupt change in magma generation processes across the Central American arc insoutheastern Guatemala: flux-dominated melting near the base of the wedge todecompression melting near the top of the wedge. Contributions to Mineralogy andPetrology 120, 378-390.
Walker, J.A., K. Roggensack, L.C. Patino, B.I. Cameron, and O. Matias, 2003. The water
and trace element contents of melt inclusions across an active subduction zone.
Contributions to Mineralogy and Petrology 146(1), 62-77.

Wallace, P.J., 2005. Volatiles in subduction zone magmas: concentrations and fluxes
based on melt inclusion and volcanic gas data. Journal of Volcanology and Geothermal
Research 140, 217-240.
Wallace, P.J., I.S.E. Carmichael, 1992. Sulfur in basaltic magmas. Geochimica et
Cosmochimica Acta 56, 1863-1874.
Wallace, P.J., I.S.E. Carmichael, 1994. S speciation in submarine basaltic glasses as
determined by measurements of SKa X-ray wavelength shifts. American Mineralogist 79,
161-167.
Webster, J.D., 2004. The exsolution of magmatic hydrosaline chloride liquids. Chemical
Geology 210(1-4), 33-48.
Webster, J.D. 2005. Consequences of exsolution of H2O-, CO2-, SO2-, Cl-bearing
volatile phases on the physical and chemical properties of magma. Goldschmidt
Conference Abstracts A151.
Werner, R., K. Hoernle, P. van de Bogaard, C. Ranero, and R. von Huene, 1999.Drowned 14-m.y.-old Galapagos archipelago off the coast of Costa Rica: implications fortectonic and evolutionary models. Geology 27(6), 499-502.
Williams-Jones, G., J. Stix, M. Heiligmann, J. Barquero, E. Fernandez, E.D. Gonzalez,
2001. A model of degassing and seismicity at Arenal Volcano, Costa Rica. Journal of
Volcanology and Geothermal Research 108, 121-139.

Costa
Rica
Nicaragua
60 km
Arenal
Irazú
Cocos plate
Caribbean plate
Middle-Am
erica Trench
Honduras
Panama
E.S.
Guatemala
Cocos RidgeSeamounts
Cerro Negro
Figure 1
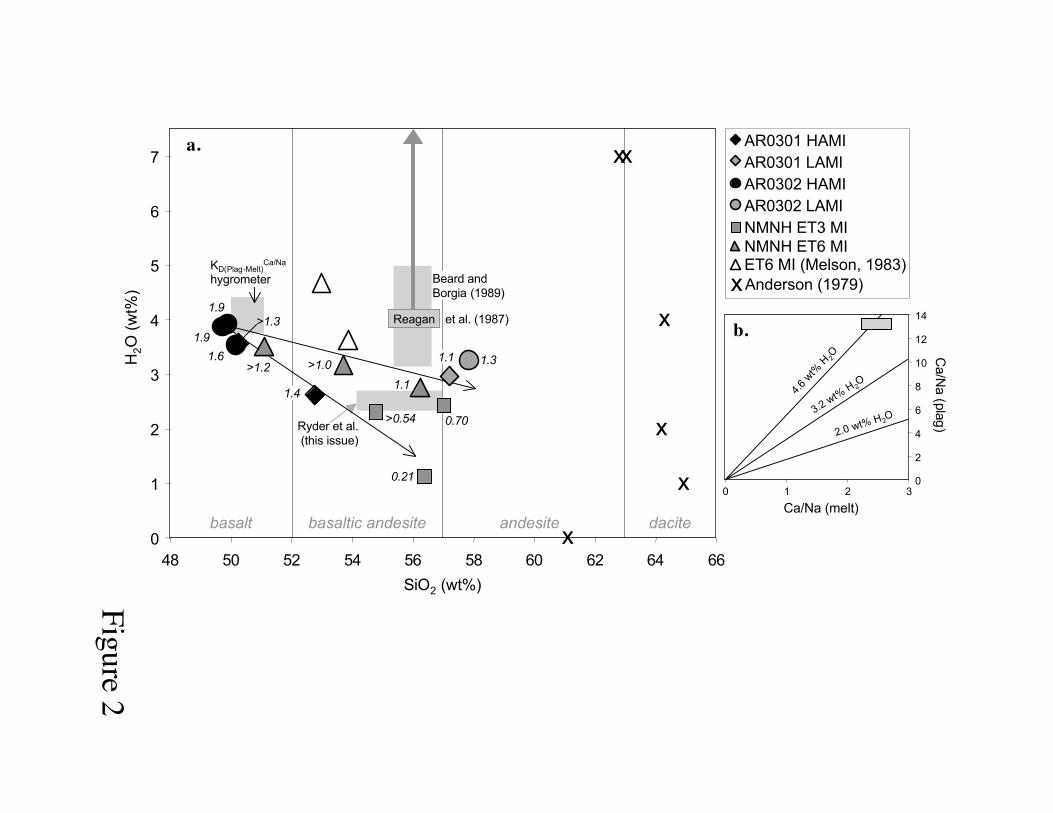
0
1
2
3
48 50 52 54 56 58 60 62 64 66
SiO2 (wt%)
H2O
(w
t%)
4
5
6
7
Beard and
Borgia (1989)
xx
x
x
x
xbasalt basaltic andesite andesite dacite
Ryder et al.
(this issue)
KD(Plag-Melt)Ca/Na
hygrometer
0
2
4
6
8
10
12
14
0 1 2 3
Ca/Na (melt)
Ca/N
a (p
lag
)
4.6
wt%
H2O
3.2 wt%
H 2O
2.0 wt% H2O
a.
b.
Figure 2
Reagan et al. (1987)
NMNH ET6 MI
AR0301 HAMI
AR0301 LAMI
AR0302 HAMI
AR0302 LAMI
NMNH ET3 MI
Anderson (1979) xET6 MI (Melson, 1983)
1.9
1.9
1.6
>1.3
>1.2 >1.0
1.4
>0.54
0.21
1.1
0.70
1.1 1.3
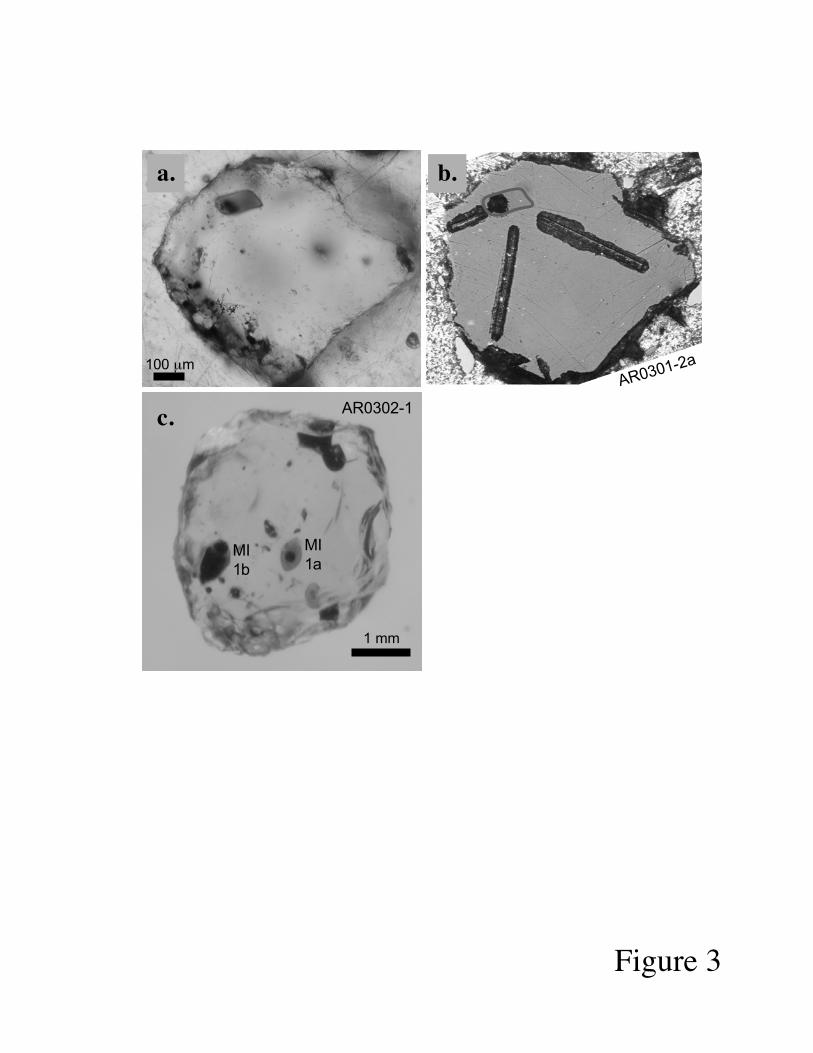
100 µmAR0301-2a
Figure 3
a. b.
c. AR0302-1
1 mm
MI
1aMI
1b

4
5
6
7
8
9
10
11
12
0 1 2 3 4 5 6 7
MgO (wt%)
FeO
* (w
t%)
3
4
5
6
7
8
9
10
11
12
CaO
(w
t%)
1 2 3 4 5 6 7
MgO (wt%)
49
51
53
55
57
59
61
63
65
67
SiO
2 (wt%
)
15
16
17
18
19
20
21
22
Al2 O
3 (wt%
)
Figure 4
Other Arenal WRET3 WRET3 WR (BU)
ET6 WR
NMNH ET6 MI
AR0302 HAMI
AR0301 HAMIAR0302 LAMI
AR0301 LAMI
NMNH ET3 MI
Anderson (1979) MIWilliams-Jones et al. (2001) MINMNH ET3+6 matrix glass
AR model parent
1968-2003 WR
NMNH
ET6
NMNHET3
AR0301
AR0302

8
9
10
11
12
40 42 44
Ba/La
CaO
(w
t%) NMNH
stratigraphic
bottom of ET3
stratigraphic
top of ET3
AR0302
AR0301
AR0301 HAMI
AR0301 LAMI
AR0302 HAMI
AR0302 LAMI
ET3 WR (BU)
41 43 45
Figure 5
0 20 40 60 80 100 1200.1
0.2
0.3
0.4
0.5
0.6
Sm
/La
Ba/La
a. b.Cerro
Negro
Irazú
Arenal

68 69 70 71 72 73 74 75 76 77 79 80
Fo olivine
1
2
3
4
frequency
cores
n = 11, avg = 79
rims
n = 5, avg = 73
78 81 82 83
ET3
WR
range of ET3 melt inclusion hosts
5
Figure 6
1968-2000

Figure 7
15
20
25
30
35
45
50
55
60
71 72 73 74 75 76 77 78 79 80
Fo host olivine
Mg# M
I (u
ncorr
ecte
d)
Kd = 0.3
- HAMI
- LAMI
81 82
40 ET3 matrix glass
ET6 matrix glass
NMNH
ET3 WRNMNH
ET6 WR
AR0301 & AR0302 WRto 82.6
to 84.1
to 69.8
NMNH ET3 MI
NMNH
ET6 MI
NMNH
ET6 MI
AR0301 & 02 MI
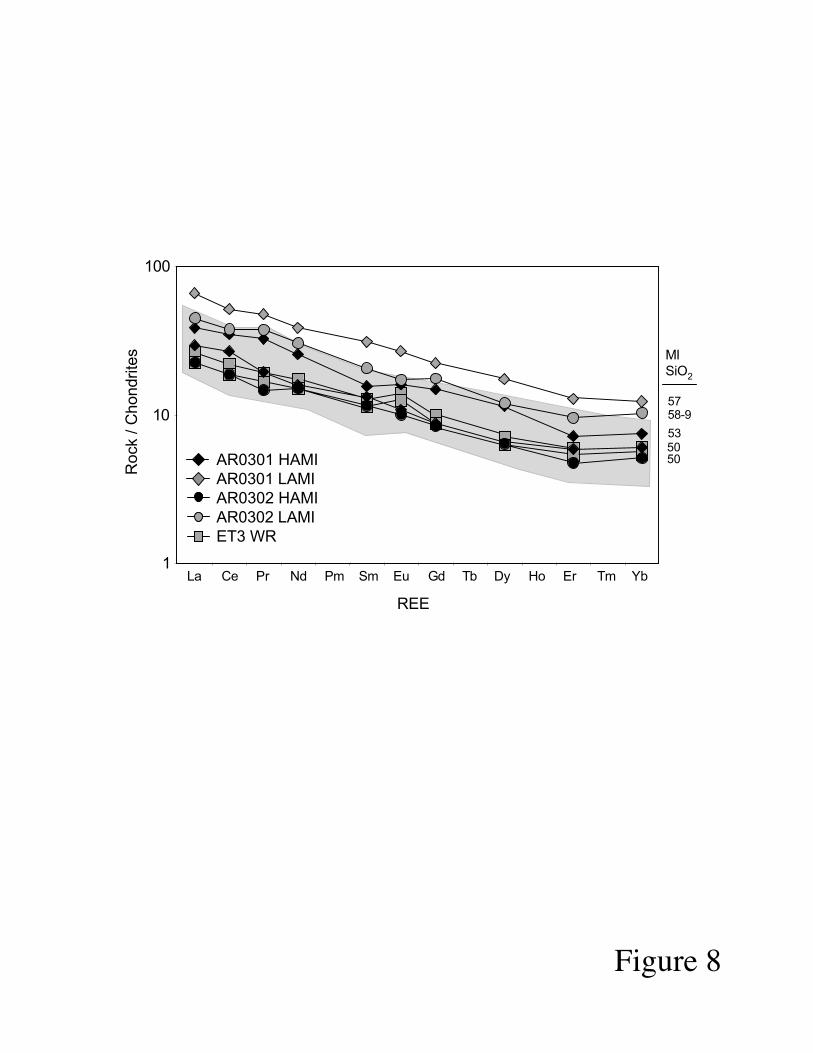
Figure 8
1
10
100
Ro
ck /
Chondrite
s
AR0301 HAMI
AR0301 LAMI
AR0302 HAMI
AR0302 LAMI
ET3 WR
La Ce Pr Nd Pm Sm Eu Gd Tb Dy Ho Er Tm Yb
REE
MI
SiO2
5758-9
535050

Figure 9
0
200
400
600
800
1000
1200
0 1 2 3 4 5 6 7H2O (wt%)
CO
2 (
ppm
)
0
50
100
150
200
250
300
350
400
0.0 0.5 1.0 1.5 2.0 2.5 3.0 3.5 4.0 4.5 5.0
H2O (wt%)
CO
2 (
pp
m)
0.1 kbar
0.2 kbar
0.5 kbar
1.0
kbar
1.5
kbar
2.0
kbar
2.5
kbar
3.0
kbar
75
79
79
76
76
79 77
77
7373
AR0302 HAMI
AR0302 LAMI
AR0301 HAMI
AR0301 LAMINMNH ET3 MI
NMNH ET6 MI
Cerro Negro MI
AR model parent75 Fo of host

.
Figure 10
0
500
1000
1500
2000
2500
3000
3500
0 1 2 3 4 5 6
H2O (wt%)
S (
ppm
)
0 500 1000 1500 2000 2500 3000 3500 4000
Cl (ppm)
AR0302 HAMI
AR0301 HAMI
AR0302 LAMIAR0302 HAMI
NMNH ET3 MI
NMNH ET6 MI
AR model parent
Cerro Negro MIFuego MI
0.2
0.6
1.0
0 1 2 3 4 5
H2O (wt%)
K2O
(w
t%)
sulfide saturation
a. b.

Figure 11
U/Cl =
0.0
0023
F/Cl =
0.4
4
AR0302 HAMI
AR0301 HAMI
AR0302 LAMI
AR0301 LAMI
NMNH ET3 MI
NMNH ET6 MI
400
600
800
1000
F (
pp
m)
57.252.8
50.3
49.7
49.9
57.8
50.2
56.4
57.0
54.8
53.3
50.6
56.2
500 1000 1500 2000 2500 3000
0.2
0.3
0.4
0.5
0.6
U (
ppm
)
Cl (ppm)
57.257.8
52.8
50.3
50.2
a.
b.
200
0.7
F/Cl =
0.26
F/Cl = 0.17
3500

Figure 12
Other Arenal WR
ET3 WRET3 WR (BU)
ET6 WR
NMNH ET6 MI
AR0301 HAMIAR0302 HAMIAR0301 LAMIAR0302 LAMI
NMNH ET3 MI
ET3 Matrix Glass
AR model parent
P
D
observed parent
calculated daughters
D1 and D2
From Ryder et al., this issue:
1968-2003 WR
14
16
18
20
22
24
1 2 3 4 5 6 7
MgO (wt%)
Al 2
O3 (
wt%
)
P
D
5%
20%
40%
75%
An90, 2
5%
cpx
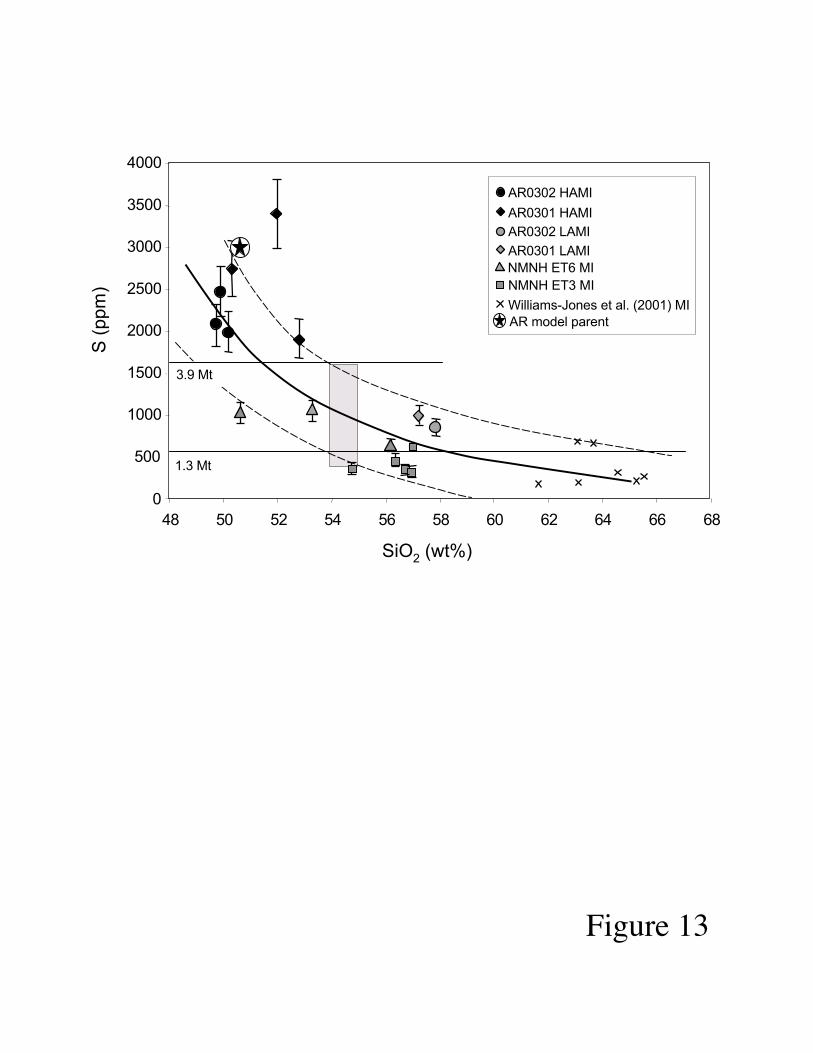
Figure 13
0
500
1000
1500
2000
2500
3000
3500
4000
48 50 52 54 56 58 60 62 64 66 68
SiO2 (wt%)
S (
pp
m)
NMNH ET6 MI
AR0302 HAMI
AR0301 HAMI
AR0302 LAMI
AR0301 LAMI
NMNH ET3 MI
Williams-Jones et al. (2001) MI
3.9 Mt
1.3 Mt
AR model parent
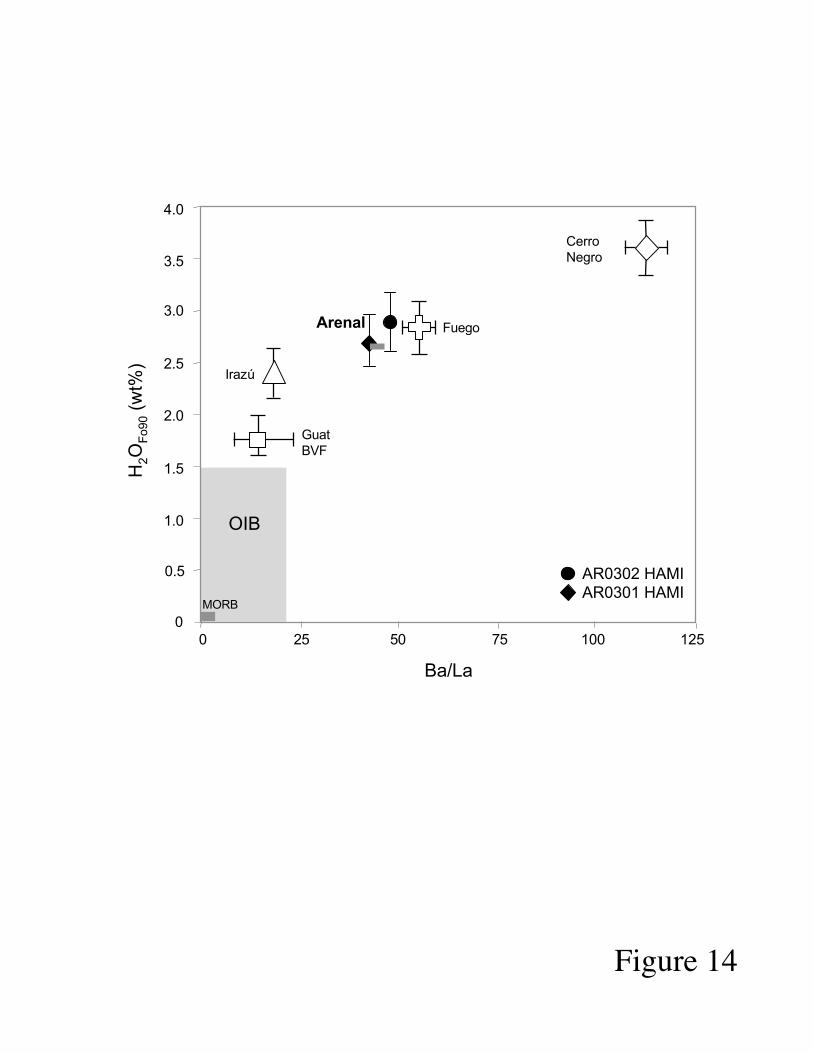
Figure 14
H2O
Fo90 (
wt%
)
4.0
3.5
3.0
2.5
2.0
1.5
1.0
1257525
Ba/La
100500
Irazú
Cerro
Negro
0.5
0
MORB
OIB
AR0302 HAMI
AR0301 HAMI
Arenal Fuego
Guat
BVF

Figure 15
0
500
1000
1500
2000
2500
3000
0 1 2 3 4 5 6 7
H2O (wt%)
Cl (p
pm
)
15%
sal
inity
3% salinity
M
OIB
Cerro Negro MI
AR0301 HAMI
Fuego MI
AR0302 HAMI
Irazu MI (avg)

FIGURE CAPTIONS
Figure 1. Map of Central America, with arc-front volcanoes as triangles.
Figure 2. a) Summary of previous H2O estimates for Arenal compositions, plus new
melt inclusion data in ET3 and ET6 olivines. Reagan et al. (1987) estimate > 4% H2O
based on the presence of hornblende and An94 plagioclase in the early phases of the
current eruption, requiring pH2O up to 5 kbar. Estimate from Beard and Borgia (1989) is
also based on the presence of hornblende. The estimate by Ryder et al. (2005) is derived
from MELTS modeling. Data points are olivine-hosted melt inclusions from this study
(Table 1) and plag-, cpx-, and magnetite-hosted melt inclusions from Anderson (1979).
Open NMNH ET6 points are original sum-deficit estimate from Melson (1983). Values
adjacent to data points indicate H2O-CO2 vapor saturation pressures from Figure 9. b)
Plagioclase-melt Ca/Na exchange hygrometer from Sisson and Grove (1993). Lines of
constant water represent KD(plag-melt)Ca/Na
of 5.5 (2 kbar H2O-saturated), KD = 3.4 (1 kbar
H2O-saturated), and KD = 1.7 (2 wt% H2O). Ca/Na ratios are molar. H2O saturation at 1
and 2 kbar revised from values given by Sisson and Grove (1993) to be consistent with
the solubility model in Newman and Lowenstern (2002) used in this study (e.g. see Fig.
9). Plag Ca/Na is based on maximum An (92.8-93.1) measured in basal ET3 units (Bolge
et al., 2004).
Figure 3. Photographs of Arenal ET3 olivine hosted melt inclusions. a) Transmitted-light photograph taken pre-ablation. b) Reflected-light photograph taken post-ablation,showing LA-ICP-MS raster tracks used to measure olivine Fo and ablation pit used tomeasure trace elements in glass. c) AR0302-1a and 1b are the ET3 inclusions with thehighest-measured water contents (both ~3.9 wt% H2O).
Figure 4. Major element variations in Arenal whole rocks, as well as melt inclusionsfrom ET tephras. Whole rocks studied here labeled in panel a. Olivine-hosted MI, aswell as matrix glass from ET3 and ET6 are from this study and Melson (1983; Table 1).Large, light gray field encompasses Arenal whole rocks (Carr et al., 2003; data pointsshown); small, darker gray field encompasses the main population of ET3 matrix glassfrom Bolge et al. (2004); data points not shown. Pyroxene, plagioclase, and magnetite-hosted melt inclusions from the current eruption from Anderson (1979), and pyroxene-hosted inclusions from Williams-Jones et al. (2001). Point labeled “1968-2003 WR”from Ryder et al. (this issue). Melt inclusion compositions from this study have beencorrected for post-entrapment olivine crystallization (Table 1). All compositions plottedhave been normalized to volatile-free, 100% totals, except those melt inclusions in Table1 that have low totals (< 96%, in part due to alkali loss). In these cases, compositionshave been normalized volatile-free, assuming original total of 96%, in order to preventover-correction.

Figure 5. a) The two ET3 samples studied here derive from the base of the ET3 tephraunit, where both CaO and Ba/La are highest (white squares are ET3 whole rocks fromBolge et al., 2004). Line marks the expected position of the NMNH ET3 sample withinBolge et al.’s geochemical stratigraphy, given its CaO content (Table 3). Error barsrepresent 3% uncertainty based on replicate analyses. b) Trace elements systematicallyvary along the Central American arc, and the Arenal MI fall within the range of Arenalwhole rocks (shaded field). Irazú and Cerro Negro, and Arenal whole rock data from Carret al. (2003). Error bars represent 8% uncertainty (Table 4).
Figure 6. Histogram of the olivine analyses from ET3 samples AR0302 and AR0301.Some olivines were analyzed in multiple locations within the same grain (see Table A1).Forsterite content (Fo) in equilibrium with whole rocks is plotted as a circle, assumingKD
Fe/Mg = 0.3 and 5-20% of total Fe in the melt is Fe3+. Also shown is the total range ofFo contents of olivines that host melt inclusions. The shaded field encloses a compilationof microprobe analyses of olivine from the current eruption for comparison after Fig. 2cin Streck et al. (2005). Their olivine frequency was reduced by a factor of 6 to fit thefigure.
Figure 7. Mg# of the melt inclusion versus forsterite of the adjacent olivine. These meltcompositions have not been corrected for post-entrapment crystallization (e.g. raw EMPdata, Table 1). The curve plotted (KD
Fe/Mg = 0.3) represents equilibrium between inclusionand host. Data (from Table 1) are plotted as bars, for which Fe3+/ Fe in the melt is allowedto vary from 5% (bar bottom) to 20% (bar top). Also shown are compositions along thecurve that would be in equilibrium with various relevant whole rock and glasscompositions.
Figure 8. Chondrite-normalized rare earth element (REE) patterns for Arenal MI’s andwhole rocks (Table 4). The shaded field encloses Arenal whole rock data (sources as inFig. 2).
Figure 9. Volatile (H2O and CO2) concentrations in Arenal melt inclusions, plotted withvapor saturation isobars calculated for basaltic melts from VolatileCalc (Newman andLowenstern, 2002). Samples compromised by carbon contamination not plotted, butlisted in Table 1. Error bars indicate 10% rsd, external SIMS precision (see section 3.1 oftext). Solid black curve traces a closed-system degassing path assuming startingconditions of 1100oC, 10% exsolved vapor, and 49% SiO2. Fo of host olivine decreaseswith progressive degassing. Inset relates Arenal MI to Cerro Negro MI Cerro Negrodata from Roggensack et al., 1997; Roggensack, 2001a.
Figure 10. Water, sulfur, and Cl degassing in Arenal MI’s, compared to other Central
American MI’s. The solid degassing paths are after Fig. 6 in Sisson and Layne (1993),
calculated for Arenal assuming a constant DSfluid/melt
= 70 and DClfluid/melt
= 6. The dashed
lines are Fuego S and Cl degassing paths from Sisson and Layne (1993). Inset shows
K2O-H2O data used to calculate the proportion of H2O vapor in the bulk separating
assemblage (line shows model for 6% H2O vapor, assuming KD(Xtal-Melt) = 0 for K2O.
Sulfide solubility from Wallace (2005), and corresponds to the limit for sulfide-saturated

basaltic melt (1150°C, 8 wt% FeOT, 1 bar and NNO-2). Cerro Negro data from
Roggensack et al. (1997) and Roggensack (2001a), Fuego data from Roggensack
(2001b) and Sisson and Layne (1993). Error bars for H2O indicate 10% rsd. S and Cl
plotted as average (+/- stdev) of the multiple measurements listed in Table 1. If singlemeasurements were made, error bars are the average uncertainty (12% for S and Cl; seesection 3.1 of text).
Figure 11. a) Cl vs F and b) Cl vs. U in Arenal melt inclusions (Tables 1, 3). As Cl andF increase during fractionation, so do incompatible elements such as U. Values adjacentto data points denote olivine-corrected SiO2 content of the inclusion in wt%. The ET6point without a SiO2 value was not analyzed for major elements (Table 1). Lines ofconstant ratio are shown for reference. Error bars indicate 8% rsd for U, and 9% for Fand Cl (see section 3.1 of text).
Figure 12. Al2O3 variation with MgO in Arenal whole rocks and melt inclusions. Datasources and corrections/normalizations as in Fig. 4. Small gray field encompasses mainpopulation of ET3 matrix glass (Bolge et al., 2004). Thin gray line calculated by mixingbetween model parent (Table 2) and end-member cumulate assemblages containingplagioclase and cpx in the proportion indicated. Tick marks on the line represent 5%total crystal addition. Lower, dashed black line is liquid line of descent (LLD) generatedfrom MELTS (Ghiorso and Sack, 1995) with 0.5 wt% H2O at 500 bars. Black solid lineis LLD generated from pMELTS (Ghiorso et al., 2002) with 3.5 wt% H2O at 3 kbar. Wechose to use pMELTS for the high H2O and high pressure LLD because it includessignificantly more phase equilibrium constraints at > 1 atm pressure, as well as animproved reference model for the state properties of water dissolved in melt (Ghiorso etal., 2002). MELTS is preferred for low-P, low-H2O calculations (Asimow et al., 2004).The clinopyroxene used for mixing calculations contains 5 wt% Al2O3 and 15 wt% MgO.Thick gray line represents the possible LLD from the observed parent of Ryder et al. (thisissue) to their calculated daughter compositions.
Figure 13. Variation of sulfur as a function of silica in ET 3 and ET6 olivine-hosted melt
inclusions (this study, Table 1) and cpx- and plag-hosted melt inclusions from the modern
eruption (Williams-Jones et al., 2001). Melt inclusions describe a systematic degassing
trend (solid line) for Arenal magmas, from > 3000 ppm in parental basalts, to 500-1500
ppm for the basaltic andesites of the modern eruption (shown as a shaded bar), to
degassed dacites (< 700 ppm). Modern eruption estimate (shaded bar) derives from
restricted silica range of 54-55% observed for most of the modern eruption (Reagan et al.,
1987), and the full width of the sulfur degassing trend (curves fit by eye). This range is
virtually identical to that required to explain the COSPEC-derived sulfur outputs at the
Arenal plume from 1968-1996 (1.3-3.9 Mt; Williams-Jones et al., 2001). Sulfur outputs
calculated using parameters in Williams-Jones et al. (2001), but assuming phi(melt) = 1.0
instead of 0.5, or that the volume of erupted material is a bulk liquid of the concentration
given by the lines. Sulfur error bars as in Fig. 10.
Figure 14. Ba/La versus H2O in Arenal, Irazú, Cerro Negro, Fuego, and Guatemalan
BVF melt inclusions, calculated to be in equilibrium with the mantle (Fo90), assuming
KDMg/Fe
= 0.3 and that 20% of iron is Fe3+
. Open symbols are the averages for each
volcano (error bars enclose the total range), and Arenal ET3 points are plotted
individually (error bars indicate 10% rsd). Gray bar is possible range for ET6, based on
the highest-H2O MI and the range in Ba/La for the unit (Bolge et al., 2005). Guatemalan
BVF data from Walker et al. (2003). Irazú data is unpublished (Benjamin et al.). Other
data sources as in Figure 10, and exclude those that may have degassed significant water(i.e. with S < 1000 ppm, and CO2 < 200 ppm). Maximum H2O in OIB comes from data
in Dixon et al. (2002), assuming average OIB Ce of 80 ppm (Sun and McDonough, 1989)
and the high end of OIB range for H2O/Ce of 200 (also from Dixon et al., 2002). MORB
from Salters and Stracke (2004) assuming mean mantle melt fraction of 10%.
Figure 15. Water and chlorine in Arenal MI’s, compared to other Central American
MI’s. Lines of constant Cl/H2O and calculated salinities (after Kent et al., 2002). Meltinclusion data sources as in Fig. 10 and 14, and were screened for degassing as in Fig. 14.

Table 1.
Major element and volatile analyses of melt inclusions
Unit ET3 ET3 ET3 ET3 ET3 ET3 ET3
Sample Name AR0301-1a AR0301-2a AR0301-3b AR0301-13a AR0301-13b AR0302-1a AR0302-1b
Notes LAMI HAMI HAMI HAMI HAMI HAMI HAMI
SiO2 57.42 53.23 51.73 50.29 51.97 49.71 50.60
TiO2 1.68 0.85 2.77 0.82 1.36 0.70 0.57
Al2O3 15.64 18.40 19.90 18.83 18.15 17.92 19.08
FeO 6.07 7.90 5.41 7.36 6.67 7.79 6.51
Fe2O3 1.69 2.19 1.50 2.04 1.85 2.16 1.81
MnO 0.12 0.23 0.16 0.20 0.30 0.22 0.17
MgO 3.02 3.24 2.74 4.76 3.97 4.18 2.21
CaO 5.88 8.02 10.80 9.56 7.51 9.20 9.64
Na2O 2.30 2.56 2.53 3.14 4.15 2.53 2.84
K2O 0.60 0.45 0.32 0.63 0.73 0.46 0.50
P2O5 0.27 0.17 0.20 0.19 0.16 0.13
Total 94.7 97.3 97.9 97.8 96.8 95.0 94.1
Mg# 47.0 42.3 47.4 53.5 51.5 48.9 37.7
H2O (wt%) 2.95 2.61 3.56 3.88 3.93
CO2 (ppm) 118 310 c.c 170 179
F (ppm) 649 610 576 315 326
S (ppm)1 1070 2000 2480 2170 2770
S (ppm)2 1060 1970 2300 1980 2190
S (ppm)3 887 1790 3020 3400
% SO4 of total sulfate 84% 84% 78%
log fO2 ( NNO) + 1.10 + 1.10 + 0.93
Cl (ppm)1 2920 1540 1290 1490 1740
Cl (ppm)2 2790 1320 1100 1780 1970
Cl (ppm)3 2550 1540 1280 1720
host-corrected compositions
olivine added 1% 3% 3% 0% 0% 0% 6%
SiO2 57.23 52.78 51.35 50.29 51.97 49.71 49.88
TiO2 1.68 0.83 2.77 0.82 1.36 0.70 0.54
Al2O3 15.49 17.86 19.32 18.83 18.15 17.92 18.00
FeO 6.24 8.4 5.89 7.36 6.67 7.8 7.61
Fe2O3 1.67 2.1 1.46 2.04 1.85 2.2 1.70
MnO 0.12 0.22 0.16 0.20 0.30 0.22 0.16
MgO 3.37 4.22 3.81 4.76 3.97 4.18 4.14
CaO 5.82 7.79 10.49 9.56 7.51 9.20 9.09
Na2O 2.28 2.49 2.46 3.14 4.15 2.53 2.68
K2O 0.59 0.44 0.31 0.63 0.73 0.46 0.47
P2O5 0.27 0.17 0.20 0.19 0.16 0.12
Total 94.8 97.3 98.0 97.8 96.8 95.0 94.4
Mg# 49.0 47.2 53.6 53.5 51.5 48.9 49.2
Fo source LA LA LA LA LA EMP EMP
Fo host 76.6 75.4 78.6 77.3 77.3 75.7 75.7
Fo equilibrium olivine 75 71 75 79 78 76 67
long axis (µm) 95 125 37 75 23 250 300
short axis (µm) 50 55 12 60 15 155 250
MI shape oval rectangular oval football oval oval oval
MI features b a, b a a
Major elements in melt inclusions were acquired by EMP at either the AMNH or MIT (in italics) except for NMNH
ET6e and ET6f, which are reproduced from Melson (1983). H2O, CO2, and F data collected by SIMS at DTM, 'c.c'
indicates carbon contamination. S and Cl data were collected at 3 different labs, indicated by footnotes: 1 = SIMS at
DTM; 2 = EMP at MIT; 3 = EMP at AMNH. See section 3.1 of the text for a discussion of accuracy and inter-lab
calibration. Percent sulfate determined by S-K shift analyses at AMNH. log f O2 calculated at 1100oC and 3kbar from
Huebner and Sato (1970). FeO-Fe2O3 calculated assuming 20% total Fe as Fe3+ (based on f O2 from S-K and pMELTS
Fe-speciation model (Ghiroso et al., 2002)). Melt inclusion major element compositions have been corrected for
sidewall crystallization by adding equilibrium olvine back into the glass composition in 1% increments until the glass
was in equilibrium with the adjacent host. Fo (molar Mg/(Mg+Fe)) acquired by either EMP at MIT or LA-ICP-MS at
BU. MI features: a = vapor or shrinkage bubble present, b = oxide crystal present, c = fracture running through.
AR0301 and AR0302 samples were collected for this study from tephra unis ET3 and ET6 (originally defined by Melson
(1983) and recently renamed AR-19 and AR-16, respectively, by Soto and Alvarado (this issue)). NMNH samples are
thin sections from the Smithsonian National Museum of Natural History (ET3 ID: 113852-3.4; ET6 ID: 113852-3.2).

Table 1. continued
Unit ET3 ET3 ET3 ET3 ET3 ET3 ET3
Sample Name AR0302-4a AR0302-4a AR0302-5a AR0302-5a AR0302-5b NMNH ET3a NMNH ET3b
Notes LAMI replicate HAMI replicate HAMI LAMI LAMI
SiO2 58.23 59.47 50.51 51.66 52.22 57.93 58.21
TiO2 1.28 1.13 0.91 0.80 0.77 1.25 1.21
Al2O3 16.27 16.52 17.63 18.13 18.80 15.83 15.81
FeO 5.81 5.48 8.00 8.01 7.14 8.50 7.36
Fe2O3 1.61 1.52 2.22 2.22 1.98 2.36 2.04
MnO 0.12 0.08 0.19 0.19 0.16 0.23 0.14
MgO 2.68 2.55 4.21 4.15 1.99 2.24 2.10
CaO 6.03 5.93 8.24 8.13 8.05 7.88 6.69
Na2O 2.44 2.59 1.74 1.99 1.98 2.99 2.85
K2O 0.39 0.34 0.24 0.25 0.32 0.86 0.48
P2O5 0.41 0.36 0.17 0.12
Total 95.3 96.0 94.1 95.7 93.4 100.1 96.9
Mg# 45.1 45.4 48.4 48.0 33.2 32.0 33.7
H2O (wt%) 3.26 3.54 1.10 2.41
CO2 (ppm) 83.7 177.4 41.0 47.5
F (ppm) 667 308 461 557
S (ppm)1 890 2170 447 619
S (ppm)2 834 970 1950 2190 567 820
S (ppm)3 852 1880
% SO4 of total sulfate 78% 58%
log fO2 ( NNO) + 0.93 + 0.51
Cl (ppm)1 2570 1670 1570 1780
Cl (ppm)2 2140 2540 1270 1090 1880 1970 1910
Cl (ppm)3 2340 1850
host-corrected compositions
olivine added 2% 2% 3% 3% 12% 8% 6%
SiO2 57.84 59.058 50.16 51.286 50.68 56.40 57.03
TiO2 1.26 1.11 0.88 0.78 0.69 1.16 1.21
Al2O3 15.95 16.20 17.12 17.60 16.79 14.66 14.92
FeO 6.17 5.83 8.4 8.4 9.1 10.0 8.6
Fe2O3 1.58 1.49 2.2 2.2 1.8 2.2 1.9
MnO 0.12 0.08 0.18 0.18 0.14 0.23 0.13
MgO 3.37 3.25 5.25 5.18 5.66 4.56 3.90
CaO 5.91 5.93 8.00 7.89 7.19 7.30 6.31
Na2O 2.39 2.54 1.69 1.93 1.77 2.77 2.69
K2O 0.38 0.33 0.23 0.24 0.29 0.80 0.45
P2O5 0.40 0.35 0.17 0.12
Total 95.4 96.2 94.2 95.8 94.1 100.1 97.1
Mg# 49.4 49.9 52.7 52.4 52.5 44.7 44.8
Fo source EMP LA LA EMP EMP
Fo host 76.9 79.0 79.0 73.3 72.7
Fo equilibrium olivine 73 73 76 75 62 61 63
long axis (µm) 95 205 40 35 110
short axis (µm) 70 115 35 30 40
MI shape oblong oblong oval oval oval round hourglass
MI features b b a a c
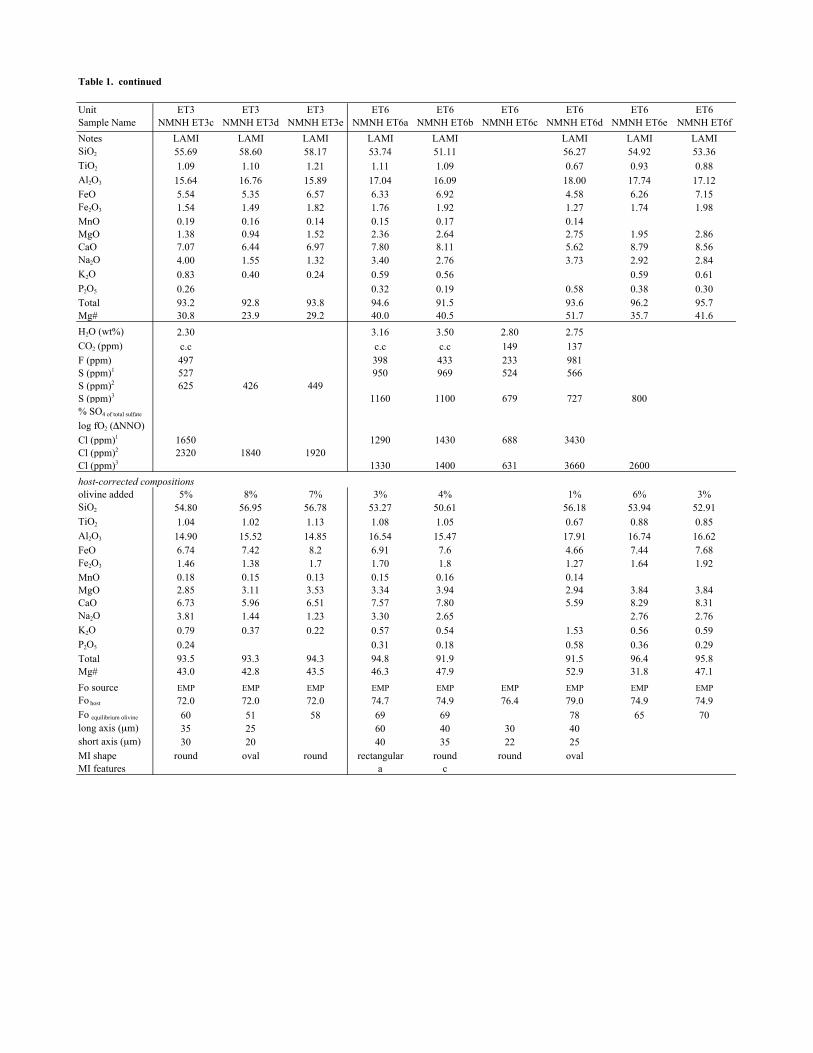
Table 1. continued
Unit ET3 ET3 ET3 ET6 ET6 ET6 ET6 ET6 ET6
Sample Name NMNH ET3c NMNH ET3d NMNH ET3e NMNH ET6a NMNH ET6b NMNH ET6c NMNH ET6d NMNH ET6e NMNH ET6f
Notes LAMI LAMI LAMI LAMI LAMI LAMI LAMI LAMI
SiO2 55.69 58.60 58.17 53.74 51.11 56.27 54.92 53.36
TiO2 1.09 1.10 1.21 1.11 1.09 0.67 0.93 0.88
Al2O3 15.64 16.76 15.89 17.04 16.09 18.00 17.74 17.12
FeO 5.54 5.35 6.57 6.33 6.92 4.58 6.26 7.15
Fe2O3 1.54 1.49 1.82 1.76 1.92 1.27 1.74 1.98
MnO 0.19 0.16 0.14 0.15 0.17 0.14
MgO 1.38 0.94 1.52 2.36 2.64 2.75 1.95 2.86
CaO 7.07 6.44 6.97 7.80 8.11 5.62 8.79 8.56
Na2O 4.00 1.55 1.32 3.40 2.76 3.73 2.92 2.84
K2O 0.83 0.40 0.24 0.59 0.56 0.59 0.61
P2O5 0.26 0.32 0.19 0.58 0.38 0.30
Total 93.2 92.8 93.8 94.6 91.5 93.6 96.2 95.7
Mg# 30.8 23.9 29.2 40.0 40.5 51.7 35.7 41.6
H2O (wt%) 2.30 3.16 3.50 2.80 2.75
CO2 (ppm) c.c c.c c.c 149 137
F (ppm) 497 398 433 233 981
S (ppm)1 527 950 969 524 566
S (ppm)2 625 426 449
S (ppm)3 1160 1100 679 727 800
% SO4 of total sulfate
log fO2 ( NNO)
Cl (ppm)1 1650 1290 1430 688 3430
Cl (ppm)2 2320 1840 1920
Cl (ppm)3 1330 1400 631 3660 2600
host-corrected compositions
olivine added 5% 8% 7% 3% 4% 1% 6% 3%
SiO2 54.80 56.95 56.78 53.27 50.61 56.18 53.94 52.91
TiO2 1.04 1.02 1.13 1.08 1.05 0.67 0.88 0.85
Al2O3 14.90 15.52 14.85 16.54 15.47 17.91 16.74 16.62
FeO 6.74 7.42 8.2 6.91 7.6 4.66 7.44 7.68
Fe2O3 1.46 1.38 1.7 1.70 1.8 1.27 1.64 1.92
MnO 0.18 0.15 0.13 0.15 0.16 0.14
MgO 2.85 3.11 3.53 3.34 3.94 2.94 3.84 3.84
CaO 6.73 5.96 6.51 7.57 7.80 5.59 8.29 8.31
Na2O 3.81 1.44 1.23 3.30 2.65 2.76 2.76
K2O 0.79 0.37 0.22 0.57 0.54 1.53 0.56 0.59
P2O5 0.24 0.31 0.18 0.58 0.36 0.29
Total 93.5 93.3 94.3 94.8 91.9 91.5 96.4 95.8
Mg# 43.0 42.8 43.5 46.3 47.9 52.9 31.8 47.1
Fo source EMP EMP EMP EMP EMP EMP EMP EMP EMP
Fo host 72.0 72.0 72.0 74.7 74.9 76.4 79.0 74.9 74.9
Fo equilibrium olivine 60 51 58 69 69 78 65 70
long axis (µm) 35 25 60 40 30 40
short axis (µm) 30 20 40 35 22 25
MI shape round oval round rectangular round round oval
MI features a c

Table 2.
SiO2 51.00
TiO2 0.73
Al2O3 16.89
FeO 9.30
Fe2O3 1.88
MnO 0.18
MgO 5.70
CaO 7.43
Na2O 2.42
K2O 0.29
P2O5 0.19
Total 96.0
Mg# 52.2
H2O (wt%) 4.00
CO2 (ppm) 300
F (ppm) 300
S (ppm) 3000
Cl (ppm) 1500
Composition of the
Arenal model parent
Based on one of the most
primitive ET3 HAMI
(AR0302-5b) and
calculated as discussed in
Section 5.1 of the text.

Table3.
Major element analyses of whole rocks and matrix glass
Unit ET3 ET3 ET3 ET3 ET6 ET6
Sample AR0301 AR0302 NMNH ET3 NMNH ET3g NMNH ET6 NMNH ET6g
Type WR WR WR MG WR MG
SiO2 51.6 50.3 52.4 58.0 51.4 55.3
TiO2 0.62 0.59 0.58 1.00 0.56 0.78
Al2O3 20.6 20.9 20.1 16.8 18.2 18.5
FeO* 8.40 7.93 8.14 8.70 9.09 7.50
MnO 0.16 0.15
MgO 5.37 5.08 4.74 3.22 6.48 3.34
CaO 10.8 11.2 10.4 6.98 9.9 8.69
Na2O 2.52 2.56 2.69 3.45 2.02 3.35
K2O 0.40 0.41 0.42 0.90 0.31 0.57
P2O5 0.14 0.12 0.14 0.35 0.12 0.36
Total 100.6 99.3 99.6 99.4 98.1 98.4
Mg# 53.3 53.3 50.9 39.7 56.0 44.3
H2O- 2.2% 1.1%
LOI 0.7% 2.2%
Major elements for AR0301 and AR0302 acquired by ICP-AES at BU. Total Fe reported as FeO*.
LOI = water lost on ignition. NMNH whole rock (WR) and matrix glass (MG) samples reproduced
from Melson (1983).

Table 4.
Trace element compositions of ET3 melt inclusions and whole rocks
Unit ET3 ET3 ET3 ET3 ET3 ET3 ET3
Sample Name AR0301-1a AR0301-2a AR0301-13a AR0302-4a AR0302-5a AR0301 AR0302
Type MI MI MI MI MI average %RSD WR WR
Li 9.12 11.66 7.95 8.92 4.61 10.085 12% 6.45 5.90
Sc 22.57 21.51 26.97 16.76 17.53 34.54 7% 23.88 21.52
V 260 186 165 134 160 389 6% 204 179
Cr 3.93 16.05 10.68 5.30 13.24 13.79 9% 37.73 33.34
Co 18.2 26.2 36.8 14.9 26.2 39.3 9% 28.4 27.0
Ni 9.56 12.76 26.27 1.02 8.20 10.4 16% 27.97 25.80
Cu 255 470 428 313 69.4 28.5 12% 114.5 99.1
Zn 67.6 105 143 60.1 75.6 152 10% 67.1 60.7
Rb 15.92 11.82 11.84 11.56 6.33 52.5 9% 7.00 6.37
Sr 450 772 682 397 420 348 10% 691 667
Y 26.6 18.8 14.7 19.6 10.1 38.4 10% 13.7 12.1
Zr 60.2 46.6 37.1 72.3 27.2 209 7% 37.5 32.0
Nb 5.90 2.97 3.10 5.30 2.89 14 4% 3.03 2.77
Ba 922 511 397 514 347 670 4% 364 325
La 21.3 12.4 9.45 14.4 7.25 25.5 3% 8.48 7.20
Ce 43.1 29.3 22.3 31.6 15.6 55.1 3% 18.3 15.6
Pr 6.07 4.14 2.45 4.78 1.86 7.10 7% 2.44 2.11
Nd 23.8 15.7 9.70 18.8 9.27 30.0 6% 10.64 9.19
Sm 6.14 3.08 2.61 4.07 2.28 6.90 3% 2.51 2.23
Eu 2.00 1.20 0.808 1.29 0.750 2.10 6% 1.037 0.941
Gd 5.97 3.96 2.32 4.74 2.26 7.50 10% 2.63 2.35
Tb 1.05 0.815 0.354 0.571 0.305 1.16 13% 0.391 0.350
Dy 5.82 3.81 3.28 3.98 2.13 6.99 14% 2.37 2.08
Er 2.79 1.56 1.27 2.09 1.03 3.87 11% 1.30 1.16
Yb 2.62 1.59 1.28 2.20 1.09 3.71 11% 1.29 1.15
Hf 1.83 1.12 0.97 2.44 1.07 5.43 9% 1.06 0.91
Ta 0.310 0.278 0.169 0.570 0.200 0.890 15% 0.161 0.146
Pb 5.95 3.97 3.25 3.39 2.35 11.1 8% 2.14 1.94
Th 1.34 0.570 1.03 1.19 0.450 6.29 11% 0.604 0.499
U 0.594 0.348 0.285 0.567 0.276 1.77 7% 0.237 0.205
BCR-2g
Melt inclusion (MI) trace elements acquired by LA-ICP-MS at BU. 43Ca was used as an internal standard (see Table 1). Whole-rock
(WR) trace elements acquired by solution ICP-MS. Average RSD of replicate analyses of BCR-2g was 8%.
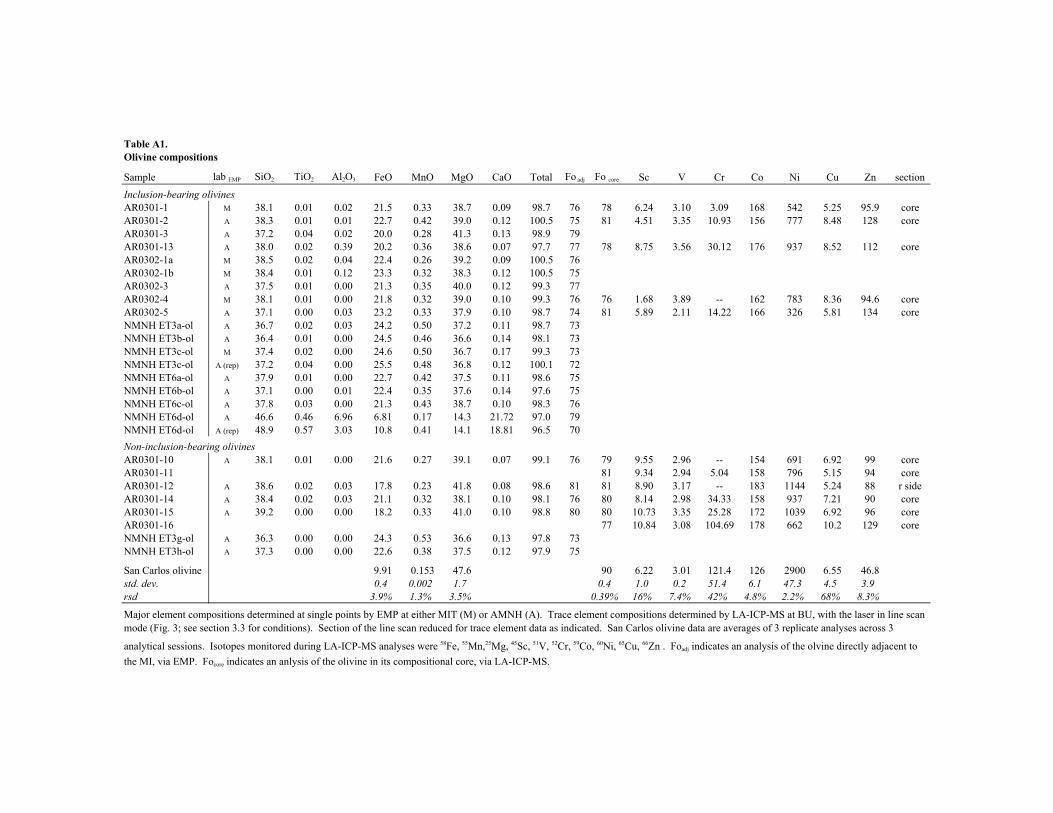
Table A1.
Olivine compositions
Sample lab EMP SiO2 TiO2 Al2O3 FeO MnO MgO CaO Total Fo adj Fo core Sc V Cr Co Ni Cu Zn section
Inclusion-bearing olivines
AR0301-1 M 38.1 0.01 0.02 21.5 0.33 38.7 0.09 98.7 76 78 6.24 3.10 3.09 168 542 5.25 95.9 core
AR0301-2 A 38.3 0.01 0.01 22.7 0.42 39.0 0.12 100.5 75 81 4.51 3.35 10.93 156 777 8.48 128 core
AR0301-3 A 37.2 0.04 0.02 20.0 0.28 41.3 0.13 98.9 79
AR0301-13 A 38.0 0.02 0.39 20.2 0.36 38.6 0.07 97.7 77 78 8.75 3.56 30.12 176 937 8.52 112 core
AR0302-1a M 38.5 0.02 0.04 22.4 0.26 39.2 0.09 100.5 76
AR0302-1b M 38.4 0.01 0.12 23.3 0.32 38.3 0.12 100.5 75
AR0302-3 A 37.5 0.01 0.00 21.3 0.35 40.0 0.12 99.3 77
AR0302-4 M 38.1 0.01 0.00 21.8 0.32 39.0 0.10 99.3 76 76 1.68 3.89 -- 162 783 8.36 94.6 core
AR0302-5 A 37.1 0.00 0.03 23.2 0.33 37.9 0.10 98.7 74 81 5.89 2.11 14.22 166 326 5.81 134 core
NMNH ET3a-ol A 36.7 0.02 0.03 24.2 0.50 37.2 0.11 98.7 73
NMNH ET3b-ol A 36.4 0.01 0.00 24.5 0.46 36.6 0.14 98.1 73
NMNH ET3c-ol M 37.4 0.02 0.00 24.6 0.50 36.7 0.17 99.3 73
NMNH ET3c-ol A (rep) 37.2 0.04 0.00 25.5 0.48 36.8 0.12 100.1 72
NMNH ET6a-ol A 37.9 0.01 0.00 22.7 0.42 37.5 0.11 98.6 75
NMNH ET6b-ol A 37.1 0.00 0.01 22.4 0.35 37.6 0.14 97.6 75
NMNH ET6c-ol A 37.8 0.03 0.00 21.3 0.43 38.7 0.10 98.3 76
NMNH ET6d-ol A 46.6 0.46 6.96 6.81 0.17 14.3 21.72 97.0 79
NMNH ET6d-ol A (rep) 48.9 0.57 3.03 10.8 0.41 14.1 18.81 96.5 70
Non-inclusion-bearing olivines
AR0301-10 A 38.1 0.01 0.00 21.6 0.27 39.1 0.07 99.1 76 79 9.55 2.96 -- 154 691 6.92 99 core
AR0301-11 81 9.34 2.94 5.04 158 796 5.15 94 core
AR0301-12 A 38.6 0.02 0.03 17.8 0.23 41.8 0.08 98.6 81 81 8.90 3.17 -- 183 1144 5.24 88 r side
AR0301-14 A 38.4 0.02 0.03 21.1 0.32 38.1 0.10 98.1 76 80 8.14 2.98 34.33 158 937 7.21 90 core
AR0301-15 A 39.2 0.00 0.00 18.2 0.33 41.0 0.10 98.8 80 80 10.73 3.35 25.28 172 1039 6.92 96 core
AR0301-16 77 10.84 3.08 104.69 178 662 10.2 129 core
NMNH ET3g-ol A 36.3 0.00 0.00 24.3 0.53 36.6 0.13 97.8 73
NMNH ET3h-ol A 37.3 0.00 0.00 22.6 0.38 37.5 0.12 97.9 75
San Carlos olivine 9.91 0.153 47.6 90 6.22 3.01 121.4 126 2900 6.55 46.8
std. dev. 0.4 0.002 1.7 0.4 1.0 0.2 51.4 6.1 47.3 4.5 3.9
rsd 3.9% 1.3% 3.5% 0.39% 16% 7.4% 42% 4.8% 2.2% 68% 8.3%
Major element compositions determined at single points by EMP at either MIT (M) or AMNH (A). Trace element compositions determined by LA-ICP-MS at BU, with the laser in line scan
mode (Fig. 3; see section 3.3 for conditions). Section of the line scan reduced for trace element data as indicated. San Carlos olivine data are averages of 3 replicate analyses across 3
analytical sessions. Isotopes monitored during LA-ICP-MS analyses were 58Fe, 55Mn,25Mg, 45Sc, 51V, 52Cr, 59Co, 60Ni, 65Cu, 66Zn . Foadj indicates an analysis of the olvine directly adjacent to
the MI, via EMP. Focore indicates an anlysis of the olivine in its compositional core, via LA-ICP-MS.
Related Documents