PASJ: Publ. Astron. Soc. Japan 55, 75–86, 2003 February 25 c 2003. Astronomical Society of Japan. The Virgo High-Resolution CO Survey: III. NGC 4254 Yoshiaki SOFUE, 1 Jin KODA, 1, 2 Hiroyuki NAKANISHI, 1 and Makoto HIDAKA 1 1 Institute of Astronomy, The University of Tokyo, Mitaka, Tokyo 181-0015 2 Nobeyama Radio Observatory, National Astronomical Observatory, Minamimaki, Minamisaku, Nagano 384-1305 [email protected] (Received 2002 August 15; accepted 2002 October 15) Abstract We present high-angular-resolution (1. 5–5 ) interferometer observations of the 12 CO (J = 1–0) line emission in the central region of the SA(s)c galaxy NGC 4254 (M 99). The observations were obtained using the Nobeyama Millimeter-wave Array (NMA) during the course of a long-term CO-line survey of Virgo spirals. We present the spectra, channel maps, integrated intensity distributions, velocity fields, position–velocity diagrams, and compare the data with various optical images. The rotation velocity is already finite at the nucleus, or at least it rises steeply to 80kms −1 within the central 1 , indicating the existence of a massive core of 10 8 M within 1 (80 pc) radius. The CO intensity maps show that the inner disk has well-developed multiple spiral arms, winding out from a bar-shaped elongated molecular complex. In addition to the bisymmetric spiral arms, an asymmetric tightly wound arm with high molecular gas density is found to wind out from the molecular bar. The molecular spiral arms, particularly the tightly wound arm, well traces optical dark lanes, and are associated with Hα arms having many H II regions. The inner asymmetric spiral structures can be explained by ram-pressure distortion of inter-arm low density regions of the inner disk by the intra-cluster gas wind, and is indeed reproduced by a hydrodynamical simulation. Key words: clusters: individual (Virgo) — galaxies: individual (NGC 4254, M 99) — galaxies: ISM — galaxies: kinematics and dynamics — galaxies: spiral arms — ISM: molecular gas — ISM: ram pressure 1. Introduction The Virgo member spiral NGC 4254 (M 99) is an SA(s)c galaxy (RC3) with an optical radius of 5. 36 (de Vaucouleurs et al. 1991), and an inclination angle of 42 ◦ (Phookun et al. 1993). We adopted the Cepheid calibrated distance of 16.1Mpc of the Virgo Cluster for this galaxy (Ferrarese et al. 1996), with which the Tully–Fisher distance of 16.8 Mpc is consistent (Sch¨ oniger, Sofue 1997). The parameters of the galaxy are given in table 1. Optical images show that the galaxy is dominated by a three- arm structure, exhibiting m = 1 and m = 3 modes (Iye et al. 1982; Gonz´ alez, Graham 1996). This one-armed structure is also seen in the H I gas distribution (Phookun et al. 1993). Such an asymmetric spiral pattern is often observed in tidally inter- acting galaxies, but there is apparently no massive companion around NGC 4254. Moreover, a tidal interaction generally pro- duces a bisymmetric structure with near and far side arms, and the resultant spiral structure shows m = 2 mode features, but not the m = 1 or m = 3 mode. Therefore, the asymmetric spiral pattern of NGC 4254 would be due to some other mechanisms, such as an interaction with the intracluster medium (ICM), as suggested by the H I head–tail structure. It is an interesting question as to how deeply the ICM ram effect can affect the galactic disks and whether the molecular disks are indeed disturbed. In fact, Hidaka and Sofue (2002) have shown by a numerical simulation that a ram effect by ICM wind can produce lopsided molecular arms in the cen- tral few kpc region, if the inter-arm gas density is low enough even though the mean radial density is high enough to avoid the ram effect. In such a circumstance, the ICM ram pressure perturbs the orbits of the low-density inter-arm gas, which re- sults in significantly displaced shocked arms from unperturbed arms. In this paper, we present high-resolution 12 CO (J = 1–0) line observations of NGC 4254 using the Nobeyama mm-wave Array (NMA) in AB, C, and D array configurations. The ob- servational parameters and detailed procedures are described in the first paper of this series, reporting the high-resolution CO line Virgo survey(ViCS: Sofue et al. 2003a). We discuss the kinematics and ISM properties based on the CO data, and compare the result with various optical images. Environmental effects, such as the tidal interaction and/or the ram-pressure ef- fects, would be an interesting subject for some Virgo galaxies located near to the cluster center and moving in the dense intra- cluster medium. Based on the CO data, we discuss the possi- bility that the distribution and kinematics of molecular clouds in the central region can be affected by the ram-pressure effect of the intracluster medium. 2. Observations 12 CO (J = 1–0) high-angular-resolution interferometer ob- servations of the central region of NGC 4254 were carried out on 2000 March 10–11, 2000 February 4–5, and 1999 December 8, using the Nobeyama Millimeter Array (NMA) in the AB, C, and D configuration, respectively. Table 2 gives the observational parameters. Each observation run took typi- cally 8 hours, including calibrations. The pointing center was at R.A. (J2000) = 12 h 18 m 50. s 03, Dec. (J2000) = + 14 ◦ 24 52. 8, adopted from Condon et al. (1990). However, this position was found to be 5. 9 to the east and 6. 3 to the south of the

Welcome message from author
This document is posted to help you gain knowledge. Please leave a comment to let me know what you think about it! Share it to your friends and learn new things together.
Transcript

PASJ: Publ. Astron. Soc. Japan 55, 75–86, 2003 February 25c© 2003. Astronomical Society of Japan.
The Virgo High-Resolution CO Survey: III. NGC 4254
Yoshiaki SOFUE,1 Jin KODA,1, 2 Hiroyuki NAKANISHI,1 and Makoto HIDAKA1
1Institute of Astronomy, The University of Tokyo, Mitaka, Tokyo 181-00152Nobeyama Radio Observatory, National Astronomical Observatory, Minamimaki, Minamisaku, Nagano 384-1305
(Received 2002 August 15; accepted 2002 October 15)
Abstract
We present high-angular-resolution (1.′′5–5′′) interferometer observations of the 12CO (J = 1–0) line emissionin the central region of the SA(s)c galaxy NGC 4254 (M 99). The observations were obtained using the NobeyamaMillimeter-wave Array (NMA) during the course of a long-term CO-line survey of Virgo spirals. We present thespectra, channel maps, integrated intensity distributions, velocity fields, position–velocity diagrams, and comparethe data with various optical images. The rotation velocity is already finite at the nucleus, or at least it rises steeplyto 80kms−1 within the central 1′′, indicating the existence of a massive core of 108 M� within 1′′ (80 pc) radius. TheCO intensity maps show that the inner disk has well-developed multiple spiral arms, winding out from a bar-shapedelongated molecular complex. In addition to the bisymmetric spiral arms, an asymmetric tightly wound arm withhigh molecular gas density is found to wind out from the molecular bar. The molecular spiral arms, particularly thetightly wound arm, well traces optical dark lanes, and are associated with Hα arms having many H II regions. Theinner asymmetric spiral structures can be explained by ram-pressure distortion of inter-arm low density regions ofthe inner disk by the intra-cluster gas wind, and is indeed reproduced by a hydrodynamical simulation.
Key words: clusters: individual (Virgo) — galaxies: individual (NGC 4254, M 99) — galaxies: ISM — galaxies:kinematics and dynamics — galaxies: spiral arms — ISM: molecular gas — ISM: ram pressure
1. Introduction
The Virgo member spiral NGC 4254 (M 99) is an SA(s)cgalaxy (RC3) with an optical radius of 5.′36 (de Vaucouleurset al. 1991), and an inclination angle of 42◦ (Phookunet al. 1993). We adopted the Cepheid calibrated distance of16.1 Mpc of the Virgo Cluster for this galaxy (Ferrarese et al.1996), with which the Tully–Fisher distance of 16.8 Mpc isconsistent (Schoniger, Sofue 1997). The parameters of thegalaxy are given in table 1.
Optical images show that the galaxy is dominated by a three-arm structure, exhibiting m = 1 and m = 3 modes (Iye et al.1982; Gonzalez, Graham 1996). This one-armed structure isalso seen in the H I gas distribution (Phookun et al. 1993). Suchan asymmetric spiral pattern is often observed in tidally inter-acting galaxies, but there is apparently no massive companionaround NGC 4254. Moreover, a tidal interaction generally pro-duces a bisymmetric structure with near and far side arms, andthe resultant spiral structure shows m = 2 mode features, butnot the m = 1 or m = 3 mode. Therefore, the asymmetric spiralpattern of NGC 4254 would be due to some other mechanisms,such as an interaction with the intracluster medium (ICM), assuggested by the H I head–tail structure.
It is an interesting question as to how deeply the ICM rameffect can affect the galactic disks and whether the moleculardisks are indeed disturbed. In fact, Hidaka and Sofue (2002)have shown by a numerical simulation that a ram effect byICM wind can produce lopsided molecular arms in the cen-tral few kpc region, if the inter-arm gas density is low enougheven though the mean radial density is high enough to avoidthe ram effect. In such a circumstance, the ICM ram pressure
perturbs the orbits of the low-density inter-arm gas, which re-sults in significantly displaced shocked arms from unperturbedarms.
In this paper, we present high-resolution 12CO (J = 1–0)line observations of NGC 4254 using the Nobeyama mm-waveArray (NMA) in AB, C, and D array configurations. The ob-servational parameters and detailed procedures are describedin the first paper of this series, reporting the high-resolutionCO line Virgo survey (ViCS: Sofue et al. 2003a). We discussthe kinematics and ISM properties based on the CO data, andcompare the result with various optical images. Environmentaleffects, such as the tidal interaction and/or the ram-pressure ef-fects, would be an interesting subject for some Virgo galaxieslocated near to the cluster center and moving in the dense intra-cluster medium. Based on the CO data, we discuss the possi-bility that the distribution and kinematics of molecular cloudsin the central region can be affected by the ram-pressure effectof the intracluster medium.
2. Observations
12CO (J = 1–0) high-angular-resolution interferometer ob-servations of the central region of NGC 4254 were carriedout on 2000 March 10–11, 2000 February 4–5, and 1999December 8, using the Nobeyama Millimeter Array (NMA)in the AB, C, and D configuration, respectively. Table 2 givesthe observational parameters. Each observation run took typi-cally 8 hours, including calibrations. The pointing center wasat R.A. (J2000) = 12h18m50.s03, Dec. (J2000) = + 14◦24′52.′′8,adopted from Condon et al. (1990). However, this positionwas found to be 5.′′9 to the east and 6.′′3 to the south of the

76 Y. Sofue et al. [Vol. 55,
Table 4. Parameters of maps.†
Beam Velocity r.m.s. noise Tb for
Resolution Weighting FWHM P.A. Resolution Sampling σ 1Jybeam−1
(arcsec) (deg) (kms−1) (kms−1) (mJybeam−1) (K)
Low Taper 5.22× 3.45 152.0 21.0 10.5 19.6 5.1Medium Natural 2.99× 2.34 148.0 21.0 10.5 15.4 13.2
High Uniform 1.67× 1.53 167.5 21.0 10.5 21.3 36.0† The map centers are set at the derived dynamical center: (α2000, δ2000) = (12h18m49.s609, + 14◦24′53.′′1).
Table 1. Properties of observed galaxies.
Morphology1 SA(s)cNED position2 (J2000) α = 12h18m49.s56
δ = + 14◦24′59.′′4Apparent magnitude1 10.44
Systemic velocity1 2407kms−1
Inclination angle3 42◦
Position angle3 68◦
Assumed distance4 16.1 Mpc (1′′ = 78.06pc)References: 1. de Vaucouleur et al. (1991); 2. NASA ExtragalacticDatabase (〈http://nedwww.ipac.caltech.edu/〉); 3. Phookun et al.(1993); 4. Ferrarese et al. (1996).
Table 2. Observation Parameters.
Observed center frequency 114.353 GHzArray configurations AB, C, and DObserving field center (Condon et al. 1990):
α(J2000) 12h18m50.s03δ(J2000) + 14◦24′52.′′8
Derived dynamical center:(assumed to be nucleus position � map center in this paper)
α(J2000) 12h18m49.s61δ(J2000) + 14◦24′59.′′1
Central velocity 2400kms−1
Frequency channels 256Total bandwidth 512 MHzVelocity coverage 1342kms−1
Velocity resolution 5.24kms−1
Amplitude and phase calibrator 3C 273Primary beam 65′′
Cell size 0.′′25
Table 3. Comparison of our center position with other observations.
R.A. (J2000) Dec. (J2000) References
12h18m49.s61 + 14◦24′59.′′1 CO: This work12h18m49.s63 + 14◦24′58.′′8 CO: Sakamoto et al. (1999)12h18m49.s43 + 14◦24′59.′′5 B-band photometry: Yasuda
et al. (1995)12h18m49.s73 + 14◦24′58.′′8 IRAS: Soifer et al. (1987)
newly determined kinematical center of the galaxy using ourhigh-resolution CO-line velocity field. In this work, there-fore, we adopted the new kinematical center as our origin ofthe maps, whose coordinates are R.A. (J2000) = 12h18m49.s61and Dec. (J2000) = + 14◦24′59.′′1. The present center positionmay be compared with the other observations listed in table 3,which all coincide within ∼±0.′′5.
We also observed nearby radio point source 3C 273 as aflux and phase calibrator every 20 min. Because the intrinsicflux density of 3C 273 at the observing frequency was non-periodically variable, we performed flux calibration for eachobservation. The flux density of 3C 273 was 11.25, 12.40,and 11.26 Jy, in the observations of the AB, C, and D con-figurations, respectively. We used a spectro-correlator system,Ultra Wide Band Correlator (UWBC: Okumura et al. 2000) ina narrow-band mode, which had 256 channels; the total band-width was 512 MHz. One channel corresponded to 5.24kms−1
at the observing frequency.The raw data were calibrated using UVPROC-II, a first-
stage reduction system developed at the Nobeyama RadioObservatory (NRO), and were then Fourier-transformed usingthe NRAO Astronomical Image Processing System (AIPS). Wereduced the thus-obtained dirty map by the CLEAN methodusing three different weighting functions and tapering, as sum-marized in table 4.
First, we obtained low-resolution maps using a naturalweighting function, tapered by a Gaussian function having de-viations of 60 kλ and a cut-off at greater than 80 kλ in (u, v)space. The data were averaged in 4 bins, yielding a 128-channel data cube with a velocity resolution of 21 km s−1; thechannel increment was 2, corresponding to 10.4 km s−1. Thesynthesized beam was 5.′′22× 3.′′45, and the obtained channelhad a typical r.m.s. noise of 19.6mJy beam−1.
Second, we obtained the most representative maps from thepresent observations using a natural weighting function, no ta-per. The data were averaged in 4 bins (21km s−1) of the orig-inal channels, and the channel increment was 2 (10.4 km s−1),yielding a 128-channel data cube. The synthesized beam was2.′′99×2.′′33, and the typical r.m.s. noise on a channel map was15.4mJy beam−1.
Third, we obtained high-resolution maps, using a uniformweighting function, no taper. The data were averaged in 2bins giving a velocity resolution of 10.4 km s−1; the channelincrement was 2 (10.4 km s−1). The synthesized beam was1.′′67×1.′′53, and the typical r.m.s. noise was 21.3mJy beam−1.

No. 1] The Virgo High-Resolution CO Survey: III. NGC 4254 77
3. Results
3.1. Spectra
Figures 1a and b show CO line spectra averaged in a 1′ ×1′ squared region (4.89 kpc square) around the center and a20′′×20′′ squared region (1.69 kpc square), respectively. Bothspectra indicate double horn shapes, typical for a rotating disk.However, the central spectrum in figure 1b has a much nar-rower width, ∼ 130kms−1, than that of the outer region, wherethe width is 210 km s−1. Since the double-horn feature is typ-ical for a rotating disk with a constant rotation velocity, theclearly different velocity widths suggest that the disk rotationvelocity varies step-like at a few kpc from the center, which isdiscussed in a more detail using position–velocity diagrams ina later section.
Figure 1c shows a CO line spectrum of NGC 4254 obtainedby convolution with a synthesized Gaussian beam of FWHM45′′ in order to compare the present CO intensity with thatof the FCRAO 14-m single-dish observation (Kenney, Young1988). Here and throughout this paper, no primary beam cor-rection has been applied. The peak intensity and the inte-grated intensity of our NMA observation are 2.39 Jy Beam−1
and 325.58 Jy Beam−1 km s−1, corresponding to 106 mK and14.8 K km s−1, respectively. A FCRAO CO observation ofNGC 4254 shows that the peak intensity is 89/ηB mK, and theintegrated intensity is (10.6±2.0)/ηB Kkms−1, where ηB is thebeam efficiency of the FCRAO 14 m telescope, which is equalto 0.53±0.04. Hence, the integrated intensity of our NMA ob-servation covers 74% of the integrated intensity of the FCRAOsingle-dish observation.
3.2. CO Intensity Maps
Figure 2 shows channel maps at a velocity separation of10.4 km s−1. Each channel map displays an averaged bright-ness in a 21kms−1 velocity range. The CO emission is visiblefrom the 6th channel at Vlsr = 2300kms−1 to the 27th channel at2517kms−1. The distributions in individual channel maps aregenerally along iso-velocity lines, typical for a rotating diskgalaxy, while they are patchy, indicating that the distribution isnot uniform, but concentrated in the arms.
Figure 3 shows the total CO intensity map at a low resolutionof 5.′′22 × 3.′′45. Figure 4a shows the total CO intensity mapat the representative resolution of 2.′′33× 2.′′99 using a naturalweighting function. The major and minor axes across the dy-namical center are shown by the big crosses in figures 3 and 4a.Figure 5a shows the same view but at the highest resolution of1′′.67× 1′′.53 with uniform weighting.
3.2.1. Central CO barThe CO emission shows an elongated bar-like concentration
around the map center (kinematical center) with the major axisat a P.A. of about 50◦, being displaced from the galaxy’s majoraxis at P.A. = 68◦. The center of gravity of this bar is slightlyoffset from the kinematical center toward the north. Althoughthe CO distribution shows a bar feature, the optical morphol-ogy is non-barred SA(s)c type (RC3). In fact, no bar feature isrecognized in either the R-band image shown in figure 6a or inK-band image in figure 8, as is shown later.
Fig. 1. (a) (Top:) Spectrum averaged in the central 60′′ squared area,showing a double-horn shape indicative of a rotating disk. (b) (Middle:)Spectrum averaged in the central 20′′ squared area, showing a dou-ble-horn shape, but with a much narrower width than in figure 1a, in-dicative of a rotating disk at a slower velocity. (c) (Bottom:) Spectrumat the center after convolved with a Gaussian beam of FWHM 45′′.

78 Y. Sofue et al. [Vol. 55,
Fig. 2. Channel maps of the CO-line intensity at a 10.4 km s−1 velocity increment, each indicating the CO-line intensity integrated in a 21 km s−1
velocity range. The 10th, 15th, and 20th channels correspond to Vlsr = 2340.2, 2392.6, and 2444.2 km s−1, respectively. The intensity unit is thebrightness temperature in K. Contours are drawn at every 20% of the peak intensity of 3.93 K.
3.2.2. Spiral armsTwo major spiral arms are winding out from both ends of
this central molecular bar in an counterclockwise direction, andextend until the field edge. In figure 3 we name the westernmajor arm Arm I, and the eastern major arm Arm II. At R.A. =12h18m51.s5, Dec. = 14◦24′10′′ (J2000), there is a segment ofan arm-like feature with a dense molecular complex, runningparallel to Arm II.
3.2.3. Tightly wound armSoon after it starts from the eastern end of the central CO
bar, Arm II bifurcates into a more tightly wound dense arm,which we call Arm III, as indicated in figure 3. The westernend of this tightly-wound arm runs closely parallel to Arm I, asis more clearly seen in figures 4a and 5a. This tight arm has amuch higher brightness, about twice to three times that of thetwo major spiral arms.
3.2.4. North–South asymmetryThe global distribution of molecular gas in the observed re-
gion of NGC 4254, as shown in figures 3 to 5, is highly asym-metric with respect to the major axis. The southern half is muchCO brighter compared to the northern half. Most of the asym-metry comes from the tight CO arm, Arm III.
3.3. Velocity Field
Figure 4b shows an intensity-weighted velocity field corre-sponding to figure 4a with natural weighting, and figure 4c isan overlay of the same velocity field on the integrated intensitymap at a lower resolution in the gray scale, which is the sameas figure 3. Figure 5c shows the velocity field for the centralregion at high resolution, corresponding to figure 5b. Figure 5denlarges the central 4′′ region of figure 5c.
We determined the kinematical center as the position wherethe iso-contours run most tightly in the high-resolution veloc-ity field in figures 5c and d: R.A. (J2000) = 12h18m49.s61 and

No. 1] The Virgo High-Resolution CO Survey: III. NGC 4254 79
Fig. 3. Integrated CO-line intensity map (the zero-th moment map)of NGC 4254. The uv weighting function is natural, and tapered.The synthesized beam is 5.′′22 × 3.′′45 (P.A. = 152◦). The con-tour levels are every 10% of the peak intensity of 85.2 K km s−1
(16.6 Jy beam−1 km s−1). The major and minor axes are indicated bythe cross.
Dec. (J2000) = + 14◦24′53.′′1 with an accuracy of ±0.′′3. Weadopt these coordinates as the center position of the galaxy,and assume that the position coincides with the nucleus. Thesecoordinates are in accordance with the dynamical center de-termined by applying the task GAL in the AIPS reductionpackage, which uses a Brandt rotation curve to fit the (R.A.,Dec., Velocity) cube. The fitted result to the entire diskin the observed area was R.A. (J2000) = 12h18m49.s56 andDec. (J2000) = + 14◦24′58.′′5. The GAL fitting also gave theposition angle of the molecular disk to be P.A. = 66.◦5, inclina-tion 38.◦8, and the systemic velocity 2403.6kms−1, which areconsistent with the adopted parameters in table 1.
The general pattern of the velocity field in figure 4b showsa symmetric spider diagram, indicating a regular circular rota-tion of the CO disk, with the eastern half red-shifted and thewestern half blue-shifted. Assuming that the spiral arms aretrailing, the rotation is clockwise and, accordingly, the north-ern side is the near side. On smaller scales, the non-circularvelocity components are superimposed. Individual spiral armsshow iso-velocity contours running obliquely to those expectedfrom a circular rotation, indicating non-circular streaming mo-tion due to spiral density waves.
The central CO bar, whose major axis is at about P.A. = 50◦,is rotating rather circularly with the node of the velocity fieldcoinciding with that of the P.A. of the galaxy at 68◦. However,the very central region within 2′′ from the nucleus is super-posed by non-circular motion, where the iso-velocity contoursrun in an integral-sign shape with their average direction in thenorth–south, and the velocity node is at P.A.= 80◦, significantlydisplaced from the galaxy’s major axis.
3.4. Overlays on Optical Images
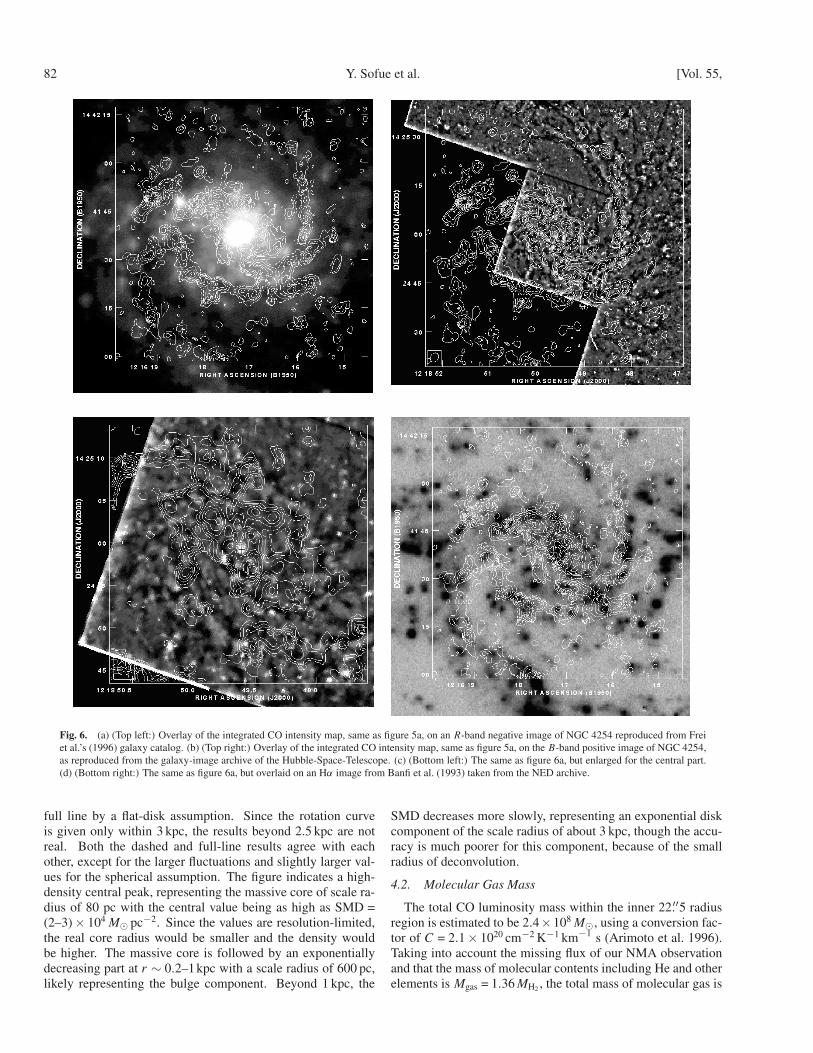
In figure 6a we overlay our CO intensity contour map atmedium resolution (figure 4a) on a g-band image from thePrinceton Galaxies Catalogue obtained with the Palomar 1.5-mtelescope by Frei et al. (1996). The kinematical center was as-sumed to coincide with the optical nucleus. Scaling and posi-tioning are accurate within an error of about 2′′, which appliesto all the following overlays. Figure 6b shows the same region,but superposed on a 5957 A-band image from the HST WFPC2archive. Figure 6c shows the central region with the high-resolution CO contour map on the HST image as in figure 6b.The CO arms, particularly the tightly-wound dense CO arm(Arm III), well trace the optical dust lanes running along the in-ner sides of the optical spiral arms. An inner dust lane at about6′′ south-east of the nucleus is also traced by a CO arm, start-ing from the eastern mid-point of the central CO bar. Inside theCO bar, most of the CO clumps are generally associated withdust lanes and/or dusty clumps. However, the molecular bar,itself, does not well draw an overall spiral pattern, whereas theHST optical image within 10′′ of the nucleus shows symmetricamorphous spiral patterns.
Figure 6d shows an overlay of a medium-resolution CO mapon a negative Hα image taken from the NED archive of a sur-vey of H II regions in spiral galaxies obtained by Banfi et al.(1993) using the 2.1-m KPNO telescope. This figure demon-strates an excellent global correlation of molecular arms andclouds with H II regions, indicating that star formation occursin spiral arms with dense molecular clouds. A more detailedinspection of figure 6d reveals, however, that some intensemolecular clouds are not directly superposed on H II regions,but are slightly displaced from the star-forming region. Also,some strongest H II regions are not superposed by CO clumps,but are slightly shifted from molecular cloud centers. The dis-placement generally occurs in the direction perpendicular tothe arms in the sense that the H II regions are located outsideof the CO arms (dark lanes). This is reasonably explainedby the galactic shock-wave theory. However, the displacementalso occurs among H II regions and molecular clumps along thearms. This fact shows that intense molecular clouds are placeswhere star formation has not yet started. On the other hand,the strongest H II regions have already exhausted their parentmolecular clouds.
3.5. PV Diagram
The position–velocity (PV) diagrams along the major axisat P.A. = 68◦ crossing the nucleus of NGC 4254 are shown infigures 7a to c in the order of low, medium, and high resolu-tions, respectively. The slit widths are 10′′, 3′′, and 2′′, respec-tively. Figure 7c enlarges the central part.
Emission in the PV diagram is separated into two major con-centrations around the nucleus at finite velocity offsets of about±40kms−1 from the systemic velocity. The PV diagram showsa clear intensity minimum at the nucleus, which is prominentin figure 7c, despite the continuous distribution of CO emissionin the integrated intensity maps (figures 3 to 5). This indicatesthat the rotation velocity rises very steeply within the central1′′ or less.
After attaining the intensity maximum in the PV diagram,

80 Y. Sofue et al. [Vol. 55,
Fig. 4. (a) (Top left:) Integrated CO intensity map. The uv weighting function is natural, and non-tapered. The synthesized beam is 2.′′99 × 2.′′34(P.A. = 148◦). The central cross indicates the dynamical center and the major and minor axes. Because the attenuation due to the primary beam patternis not corrected, the noise level is uniform in this image. The contour levels are every 10% of the peak flux of 110.3Kkm s−1 (8.33Jy beam−1 km s−1).The r.m.s. noise in the map is 1σ = 388mJybeam−1 kms−1. (b) (Top right:) Velocity field of NGC 4254 (first moment map) corresponding to figure 4a.The synthesized beam is equal to that of figure 4a. The interval of the iso-velocity contours is 10km s−1. (c) (Bottom:) Overlay of the velocity field onthe low-resolution intensity distribution from figure 3 in gray.
the velocity increases more gently toward the edges of the bar.Near the ends of the bar, the PV velocity increases step-like,and attains maximum velocities of about ±100 km s−1 in thespiral arms.
4. Discussion
4.1. Rotation Curve and Dynamical Mass
The inclination angle of NGC 4254 was obtained to bei = 42◦ from H I data (Phookun et al. 1993). Figure 8 showsa contour-form K-band image taken from NED data archive of
the near-IR surface photometry of spiral galaxies (Mollenhof,Heidt 2001). We determined the inclination angle by an ellipsefit to the iso-intensity contours of the K-band image, and ob-tained an inclination angle of i = 42◦(±1◦), consistent with theearlier value. We adopted this inclination angle in the presentwork. On the other hand, more face-on values have beenobtained from CO observations: 29◦ (Sakamoto et al. 1999)or 28◦ (Kenney, Young 1988). Our CO maps, representingthe two open spiral arms, also suggest a more face-on value.However, we may rely more on the inclinations from NIR im-ages, because the CO maps manifest spiral-shocked gaseous

No. 1] The Virgo High-Resolution CO Survey: III. NGC 4254 81
Fig. 5. (a) (Top left:) Integrated CO intensity map of NGC 4254, with uniform weighting. The synthesized beam is 1.′′68× 1.′′53 (P.A. = 167.◦5). Thecontour levels are every 10% of the peak flux of 205.3Kkms−1 (5.694Jy beam−1 kms−1). (b) (Top right:) Enlargement of the central part of figure 5a.The beam size and contour intervals are the same as figure 5a. (c) (Bottom:) Velocity field of NGC 4254 (first moment map) corresponding to figure 5a.The synthesized beam is equal to that of figure 5a. The interval of the iso-velocity contours is 10km s−1.
arms, but not necessarily the backbone stellar disk.We used PV diagrams to obtain a rotation curve by applying
an iteration method developed by Takamiya and Sofue (2002)and Sofue et al. (2003b). Figure 9a shows the obtained rotationcurve with an inclination angle of 42◦ being corrected. The ro-tation velocity rises steeply in the central ∼ 100pc, and reachesto 120kms−1 maximum, followed by a small dip at 250 pc. Itthen rises to a maximum velocity of 190kms−1 at r ∼ 900pc,and declines to 150 km s−1 at 1.5 kpc. This maximum may bedue to the central bulge. Then, the rotation velocity graduallyincreases, representing the disk component. The small-scalefluctuation of amplitudes by ∼ ±10 km s−1 may not be real
and, hence, the small local dips should not be taken seriously.The dynamical mass in the central 100 pc is 3×10⁸ M� for a
rotation velocity of 120kms−1, and the mass within 1 kpc is 7×10⁹ M� for 180kms−1. The high central velocity and massivecore within the 100 pc region of the nucleus was observed formany galaxies (Takamiya, Sofue 2000; Sofue et al. 2001; Kodaet al. 2002).
We calculated the surface-mass distributions (SMD) us-ing the observed rotation curve by applying a deconvolutionmethod described in Takamiya and Sofue (2000). Figure 9bshows the derived mass distributions, where the dashed linewas calculated by a spherical-symmetry assumption, and the
82 Y. Sofue et al. [Vol. 55,
Fig. 6. (a) (Top left:) Overlay of the integrated CO intensity map, same as figure 5a, on an R-band negative image of NGC 4254 reproduced from Freiet al.’s (1996) galaxy catalog. (b) (Top right:) Overlay of the integrated CO intensity map, same as figure 5a, on the B-band positive image of NGC 4254,as reproduced from the galaxy-image archive of the Hubble-Space-Telescope. (c) (Bottom left:) The same as figure 6a, but enlarged for the central part.(d) (Bottom right:) The same as figure 6a, but overlaid on an Hα image from Banfi et al. (1993) taken from the NED archive.
full line by a flat-disk assumption. Since the rotation curveis given only within 3 kpc, the results beyond 2.5 kpc are notreal. Both the dashed and full-line results agree with eachother, except for the larger fluctuations and slightly larger val-ues for the spherical assumption. The figure indicates a high-density central peak, representing the massive core of scale ra-dius of 80 pc with the central value being as high as SMD =(2–3)× 104 M� pc−2. Since the values are resolution-limited,the real core radius would be smaller and the density wouldbe higher. The massive core is followed by an exponentiallydecreasing part at r ∼ 0.2–1kpc with a scale radius of 600 pc,likely representing the bulge component. Beyond 1 kpc, the
SMD decreases more slowly, representing an exponential diskcomponent of the scale radius of about 3 kpc, though the accu-racy is much poorer for this component, because of the smallradius of deconvolution.
4.2. Molecular Gas Mass
The total CO luminosity mass within the inner 22.′′5 radiusregion is estimated to be 2.4×10⁸ M�, using a conversion fac-tor of C = 2.1× 1020 cm−2 K−1 km−1 s (Arimoto et al. 1996).Taking into account the missing flux of our NMA observationand that the mass of molecular contents including He and otherelements is Mgas = 1.36MH2 , the total mass of molecular gas is

No. 1] The Virgo High-Resolution CO Survey: III. NGC 4254 83
Fig. 7. (a) (Top left:) Position–velocity diagram of the CO emission in NGC 4254 from the tapered cube (5.′′22 × 3.′′45 beam, velocity resolution21kms−1) along a 10′′-width slit on the major axis (P.A. = 68◦) across the kinematical center. the contour levels are at 5, 10, 20, . . . , 100% of the peakvalue of 1.73 K (0.349Jybeam−1). The velocity centroid is 2402.6kms−1. (b) (Top right:) Same as figure 7a, but for natural weighting and a non-taperedcube (2.′′99× 2.′′34 beam, and velocity resolution 21kms−1) along a 3′′-width slit on the major axis. The contour levels are at 5, 10, 20, 30, . . . , 100%of the peak value of 3.23 K (0.248 Jy beam−1). (c) (Bottom:) Same as figure 7a, but for the central part from the high-resolution cube (1.′′68 × 1.′′53beam, and velocity resolution of 10.4 km s−1) in a 2′′-width slit along the major axis. The contour levels are every 10% of the peak value of 5.46 K(0.152 Jybeam−1).

84 Y. Sofue et al. [Vol. 55,
Fig. 8. K-band image of NGC 4254 in a contour form, taken from theNED archive of the NIR survey of nearby galaxies by Molenhoff andHeidt (2001). The displayed area is 4′ × 4′ around the nucleus, and1 pixel corresponds to 1′′. The contours are drawn at 2, 4, . . . , 12, 15,20, . . . , 30, 40, . . . , 100% of the peak value of 7.34DN pixel−1.
calculated to be 4.3×10⁸ M�. The CO luminosity mass withinthe inner 5′′ radius region, where a missing flux correction isnot needed, is 4.0×10⁷M�. The luminosity mass to dynamicalmass ratio in the inner 5′′ is 0.15, much larger than that in theinner 22.′′5, where the ratio is 0.026. If we adopt a more face-on value for the inclination, e.g. 29◦, the above ratios shouldbe decreased by a factor of 0.52. Hence, the molecular-gasmass in NGC 4254 is not particularly large compared with thedynamical mass.
4.3. Origin of the North–South Asymmetry in CO
Environmental effects, such as the tidal interaction and/orthe ram-pressure effects, are an interesting subject concerningthe Virgo galaxies. NGC 4254, which is apparently not asso-ciated with a companion galaxy, is known for its distorted H Istructure, and the lopsidedness is supposed to be the result of anenvironmental effect due to the ram pressure by the intraclus-ter medium (Phookun et al. 1993). The outer H I gas is largelyextended in the northeastern area over 2′′ (∼ 10kpc), and is as-sociated with several bifurcated optical arms. One prominentoptical/H I arm extends from the south-to-western region; thisprominent one-armed feature leads to the m = 1 mode based ona spiral mode analysis (Iye et al. 1982).
It was long believed that the inner disks are stable and notdisturbed by such an environmental effect as the ram pres-sure (Vollmer et al. 2001). However, simulations have al-ready shown that the ram effect is significant, even on the in-ner disks (Sofue 1994). Recently, we examined the ram ef-fect on the inner molecular disk in detail, and showed that itis significant when it acts on the inter-arm regions, where thegas density is much lower than in the arm regions, and hence
Fig. 9. (a) (Upper:) Rotation curve for the inner 3 kpc of NGC 4254obtained by the iteration method using the PV diagram, as describedin Takamiya and Sofue (2002) and Sofue et al. (2003b). (b) (Lower:)Surface-mass distribution (SMD) obtained by deconvolution of the ro-tation curve using the method described in Takamiya and Sofue (2000).The full line represents the result for a flat-disk assumption, and the dot-ted line for a spherical-symmetry assumption of the mass distribution.Note the three components: the central massive core at 0–100 pc witha scale radius of 80 pc, a bulge at 0.1–1 kpc, and the disk component at1 to 2.5 kpc.
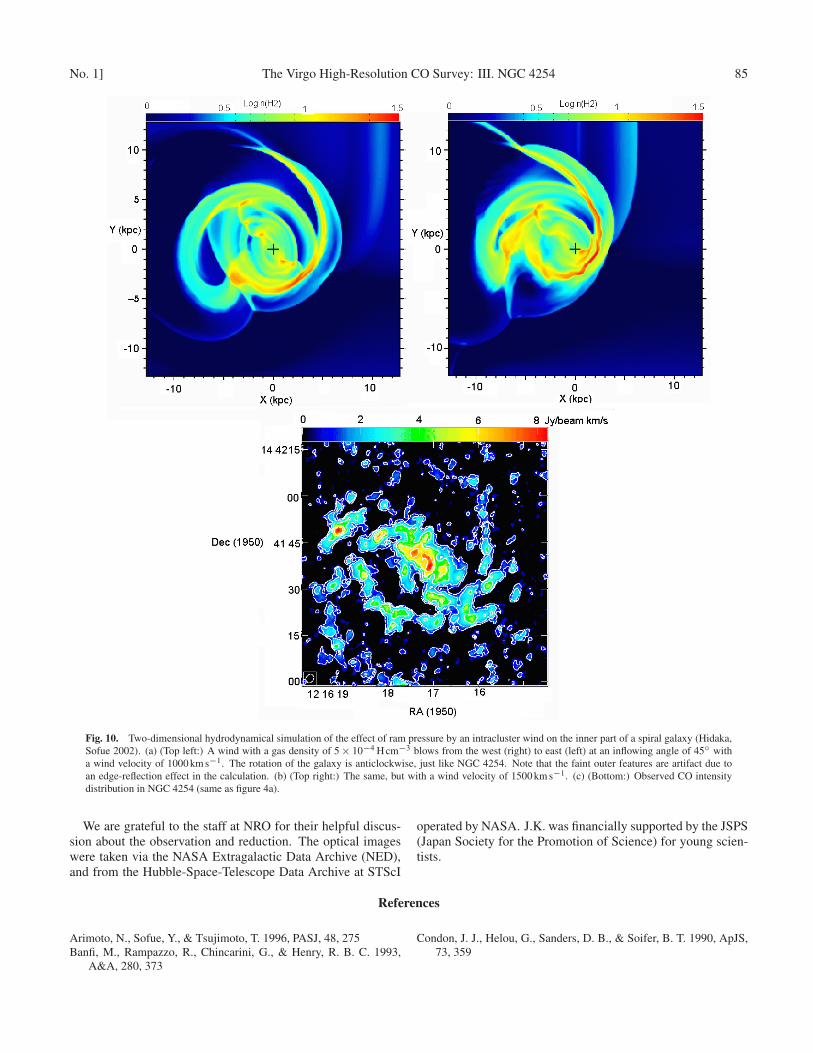
the ram-pressure easily disturbs the orbits of the inter-arm gas(Hidaka, Sofue 2002). The disturbed orbits of inter-arm gasleads to a significant displacement of the shocked arms fromthe regular bisymmetric arm positions, resulting in distortedinner molecular spiral structures. Figures 10a (top right) and10b (top left) show the result of our two-dimensional hydrody-namical simulation of ram pressure on a gas disk with spiralarms. Here, the intracluster wind blows from the west towardthe east at an inflowing angle of 45◦ to the galactic plane witha wind velocity of 1000 and 1500kms−1, respectively, and theICM density is assumed to be 5 × 10⁻⁴ H cm−3. A detaileddescription of the model and simulation procedure is given inHidaka and Sofue (2002).
The simulation may be compared with the observed CO in-tensity distribution, shown in figure 10c (bottom), the sameas figure 4a. The distribution of molecular gas in the central1′ region of NGC 4254 is extended to the south-eastern half,where the tightly wound CO arm is most prominent. This tightarm winds out to the north, followed by the NE optical outerarms. The western arm winds out to the south, and continuesto the optical/H I one-armed spiral arm. These asymmetric armstructures, particularly the tight CO arm (Arm III), are wellmimicked by the simulation in figures 10a and b, although thedetails are not necessarily reproduced.
No. 1] The Virgo High-Resolution CO Survey: III. NGC 4254 85
Fig. 10. Two-dimensional hydrodynamical simulation of the effect of ram pressure by an intracluster wind on the inner part of a spiral galaxy (Hidaka,Sofue 2002). (a) (Top left:) A wind with a gas density of 5 × 10⁻⁴ H cm−3 blows from the west (right) to east (left) at an inflowing angle of 45◦ witha wind velocity of 1000 km s−1. The rotation of the galaxy is anticlockwise, just like NGC 4254. Note that the faint outer features are artifact due toan edge-reflection effect in the calculation. (b) (Top right:) The same, but with a wind velocity of 1500 km s−1. (c) (Bottom:) Observed CO intensitydistribution in NGC 4254 (same as figure 4a).
We are grateful to the staff at NRO for their helpful discus-sion about the observation and reduction. The optical imageswere taken via the NASA Extragalactic Data Archive (NED),and from the Hubble-Space-Telescope Data Archive at STScI
operated by NASA. J.K. was financially supported by the JSPS(Japan Society for the Promotion of Science) for young scien-tists.
References
Arimoto, N., Sofue, Y., & Tsujimoto, T. 1996, PASJ, 48, 275Banfi, M., Rampazzo, R., Chincarini, G., & Henry, R. B. C. 1993,
A&A, 280, 373
Condon, J. J., Helou, G., Sanders, D. B., & Soifer, B. T. 1990, ApJS,73, 359

86 Y. Sofue et al.
de Vaucouleurs, G., de Vaucouleurs, A., Corwin, H. G., Jr., Buta, R. J.,Paturel, G., & Fouque, P. 1991, Third Reference Catalog of BrightGalaxies (New York: Springer-Verlag)
Ferrarese, L., et al. 1996, ApJ, 464, 568Frei, Z., Guhathakurta, P., Gunn, J. E., & Tyson, J. A. 1996, AJ, 111,
174Gonzalez, R. A., & Graham, J. R. 1996, ApJ, 460, 651Hidaka, M., & Sofue, Y. 2002, PASJ, 54, 33Iye, M., Okamura, S., Hamabe, M., & Watanabe, M. 1982, ApJ, 256,
103Kenney, J. D., & Young, J. S. 1988, ApJS, 66, 261Koda, J., Sofue, Y., Kohno, K., Nakanishi, H., Onodera, S., Okumura,
S. K., & Irwin, J. A. 2002, ApJ, 573, 105Mollenhoff, C., & Heidt, J. 2001, A&A, 368, 16Okumura, S. K., et al. 2000, PASJ, 52, 393Phookun, B., Vogel, S. N., & Mundy, L. G. 1993, ApJ, 418, 113Sakamoto, K., Okumura, S. K., Ishizuki, S., & Scoville, N. Z. 1999,
ApJS, 124, 403
Schoniger, F., & Sofue, Y. 1997, A&A, 323, 14Sofue, Y. 1994, ApJ, 423, 207Sofue, Y., Koda, J., Kohno, K., Okumura, S. K., Honma, M.,
Kawamura, A., & Irwin, J. A. 2001, ApJ, 547, L115Sofue, Y., Koda, J., Nakanishi, H., & Onodera, S. 2003b, PASJ, 55,
59Sofue, Y., Koda, J., Nakanishi, H., Onodera, S., Kohno, K., Tomita,
A., & Okumura, S. K. 2003a, PASJ, 55, 17Soifer, B. T., Sanders, D. B., Madore, B. F., Neugebauer, G.,
Danielson, G. E., Elias, J. H., Lonsdale, C. J., & Rice, W. L. 1987,ApJ, 320, 238
Takamiya, T., & Sofue, Y. 2000, ApJ, 534, 670Takamiya, T., & Sofue, Y. 2002, ApJ, 576, L15Vollmer, B., Cayatte, V., Balkowski, C., & Duschl, W. J. 2001, ApJ,
561, 708Yasuda, N., Okamura, S., & Fukugita, M. 1995, ApJS, 96, 359
Related Documents