The Vienna Life Sciences Cluster – an Entrepreneurial Ecosystem Analysis Pablo Collazzo WU-Vienna University of Economics and Business Abstract The life sciences cluster in Vienna has brewed a vibrant mix of start-ups, particularly early-stage R&D and manufacturing ventures, which have been instrumental in the development of the local entrepreneurial ecosystem. Even if the entrepreneurial ecosystem concept has emerged as a powerful analytical framework to assess the economic development of regions and clusters, it remains only marginally applied to the life sciences industry, one that relies heavily on the innovation capacity of entrepreneurial ventures. Based on an exploratory factor analysis conducted with data from Vienna’s early-stage R&D and manufacturing firms, this paper examines the ecosystem needs and expectations from those firms so that they can achieve sustained growth. The results suggest that innovation and organic growth, paired with favorable public policies and regional initiatives, are likely to explain the successful development of Vienna’s early-stage R&D and manufacturing life sciences firms. The findings arguably underline the need for industry and policy-making to jointly shape the regulatory framework, together with the steering role of the cluster manager in fueling the development of this regional network. Key words: Entrepreneurial ecosystem; cluster management; exploratory factor analysis

Welcome message from author
This document is posted to help you gain knowledge. Please leave a comment to let me know what you think about it! Share it to your friends and learn new things together.
Transcript
The Vienna Life Sciences Cluster – an Entrepreneurial Ecosystem Analysis
Pablo Collazzo WU-Vienna University of Economics and Business
Abstract
The life sciences cluster in Vienna has brewed a vibrant mix of start-ups, particularly early-stage
R&D and manufacturing ventures, which have been instrumental in the development of the local
entrepreneurial ecosystem. Even if the entrepreneurial ecosystem concept has emerged as a
powerful analytical framework to assess the economic development of regions and clusters, it
remains only marginally applied to the life sciences industry, one that relies heavily on the
innovation capacity of entrepreneurial ventures. Based on an exploratory factor analysis conducted
with data from Vienna’s early-stage R&D and manufacturing firms, this paper examines the
ecosystem needs and expectations from those firms so that they can achieve sustained growth. The
results suggest that innovation and organic growth, paired with favorable public policies and
regional initiatives, are likely to explain the successful development of Vienna’s early-stage R&D
and manufacturing life sciences firms. The findings arguably underline the need for industry and
policy-making to jointly shape the regulatory framework, together with the steering role of the
cluster manager in fueling the development of this regional network.
Key words: Entrepreneurial ecosystem; cluster management; exploratory factor analysis

2
1. INTRODUCTION
Location, an intrinsically unique endowment, is likely to be a significant source of competitive
advantage. Centrally located in Europe, Austria offers an attractive business environment, ranked
18th in the Ease of Doing Business Index (World Bank, 2017), with Vienna, its capital city,
recurrently topping the list of most livable cities (Mercer Quality of Living Survey, 2010-2017).
The life sciences industry, which includes biotechnology, pharmaceuticals and medical technology,
has a strong presence in Austria, particularly in Vienna, house to more than 480 life sciences
organizations, a share of 53 percent of the industry, relative to the rest of the country, accounting
for 43 percent of the workforce and 52 percent of the turnover of the life sciences sector. Those
firms are engaged in research and development (R&D) and manufacturing or act as supply-, sales-
and service companies. The 133 R&D and manufacturing firms, which account for about 30 percent
of the industry and employ more than 10,000 people, represent a critical driver of industrial growth.
These include large companies, such as Novartis Pharma GmbH or Pfizer Corporation Austria
GmbH, but also a significant and ever growing number of early-stage ventures (Life Sciences
Austria-Vienna, LISAvienna, 2015).
On top of its industrial muscle, Vienna has positioned itself as an attractive location for life sciences
research and academia, with 18 dedicated research institutions (seven universities and eleven non-
university institutions in medicine, medical engineering, bioinformatics and biotechnology) that
supply a skilled workforce to the city’s life sciences sector. Additionally, the LISAvienna 2015
report points at the city’s capabilities for conducting clinical trials, not least since Vienna hosts 27
hospitals. On the back of such evidence, Goldstein, Peer and Sedlacek (2013) argue for Vienna’s
competitive advantage as research hub in the life sciences industry and high potential for the
commercialization of scientific knowledge. The commercialization of scientific knowledge may

3
be achieved through joint innovation development between research institutions and life sciences
firms, or through spin-off ventures resulting from university research. In fact, Goldstein et al.
(2013) state that, together with information technology, the life sciences industry accounts for the
majority of spin-off activities in the city. These factors turn R&D and manufacturing companies
into valuable assets and growth levers for the industry and the city altogether.
Moreover, public and private sources of financial capital for life sciences firms have been widely
available. Only in 2014, biotechnology firms received circa 71 million EUR of external financing
in the form of venture capital funding, business angel capital, loans or subsidies, which accounted
for an accumulated increase of more than 22 percent since 2010 (LISAvienna, 2015). Such
evidence suggests the awareness of capital providers of Vienna’s attractiveness for research and
innovation in the life sciences industry.
Emerging as a loosely connected set of firms, it became apparent that the industry needed
coordination to exploit the synergies across the city’s research and industrial capabilities. Such
coordination role was assigned to LISAvienna in 2002 by AWS (Austria Wirtschaftsservice), the
Austrian federal development and financing agency. Operated by AWS on behalf of the Austrian
Federal Ministry of Science, Research and Economy and the city of Vienna, LISAvienna supports
innovative companies in the domains of biotechnology, pharmaceuticals and medical technology
through activities such as matching and networking, information- and consulting services as well
as marketing of the life sciences cluster (LISAvienna, 2015).
2. RESEARCH PURPOSE AND SCOPE
The set of life sciences firms and related organizations co-locating in Vienna, arguably accounts
for a local cluster, defined by Porter as a geographically-bound network of interconnected firms,
suppliers and specialized institutions in a given industry (Porter, 1990). This cluster is fairly

4
fragmented and largely dominated by small, early-stage ventures. According to LISAvienna
(2015), 35 percent of all R&D and manufacturing firms were younger than five years, which is
rather typical for the life sciences (Bratic, Blok and Gostola, 2014). As a knowledge-intensive
industry, characterized by long and costly product development and trial periods, with a highly
uncertain return of investment (Bialojan and Schuler, 2003; Kim, 2015), life sciences are
particularly challenging for the small size, young firms that dominate this Viennese cluster. This
feature explains the focus of this paper on early-stage R&D and manufacturing firms, which
account for the largest share of players in the cluster, while representing a significant lever for the
city’s entrepreneurial ecosystem.
This study builds on the concept of entrepreneurial ecosystems, which refers to cities, industrial
clusters, regions or economies, where fostering entrepreneurship is part of the strategy to boost
economic development (Isenberg, 2014). The concept of an entrepreneurial ecosystem can be
described as a cost-effective strategy for supporting high-growth firms and thus boosting economic
development (Mason and Brown, 2013). Isenberg’s framework systematically divides
entrepreneurial ecosystems according to growth drivers, that can be leveraged by policy makers in
their economic development strategies (Isenberg, 2011a, 2011b, 2014, 2016; Isenberg and
Onyemah, 2016).
Although Isenberg's framework gives an overview on what elements of the entrepreneurial
ecosystem provide value to its players, it is purposely generic, as it refers to no specific industry or
stakeholder. Hence, it arguably provides no insight into ordering and prioritizing its elements, a
potentially significant shortcoming when it comes to the choices of start-ups and policy makers.
While there is some literature on the relevance of ecosystem components to early-stage firms
(World Economic Forum, 2013, 2014), these are typically country-level and non-industry-specific.

5
As a contribution to fill in this gap, this paper explores what early-stage R&D and manufacturing
firms in the Vienna life sciences cluster need and expect from the entrepreneurial ecosystem. More
specifically, this study investigates the underlying constructs that organize the elements of the
entrepreneurial ecosystem that drive growth in those early-stage R&D and manufacturing firms
clustered in Vienna.
A set of variables to assess the entrepreneurial ecosystem is developed from the literature, and fed
a survey directed at the cluster’s early-stage R&D and manufacturing firms. An exploratory factor
analysis was then run with the data collected through the survey, in order to identify the underlying
factors that should cater to the needs of those early-stage firms in the cluster.
3. OVERVIEW OF RELEVANT LITERATURE
3.1 The Life Sciences Industry
In order to grasp the distinctive features of the life sciences industry, as well as to gain insight on
the challenges of early-stage firms, a brief overview of the industry follows, identifying value
drivers and industry-specific variables included in the survey and factor analysis.
The industry boundaries are defined by LISAvienna, the cluster manager, which defines life
sciences as encompassing biotechnology, pharmaceuticals and medical technology (LISAvienna,
2015). Firms of all sizes populate the industry, facilitating development, manufacturing and sales
by supplying raw materials, consumables, equipment or analytical tools, research- and clinical trial
services or engaging in the wholesale and distribution of products (Bratic et al., 2014). Therefore,
it is not only companies, but also all types of research- and educational institutions that play a
critical role in life sciences. The market is mainly business-to-business driven, with customers in
the public and private sector, ranging from governments, large corporations, to healthcare
providers, farmers and growers. Revenues are usually generated via product-, service- or patent

6
sales or licensing fees (Marketline, 2012). The life sciences industry is typically rather fragmented
(Bratic et al., 2014), with a mix of large corporations, such as Pfizer, Roche or Johnson & Johnson,
and a high number of small firms of different maturity, the latter often resulting from spin-offs out
of academic research (Goldstein et al., 2013). Start-ups usually face high initial investment costs
(Kim, 2015), e.g. in technology or equipment, followed by equally high product development costs,
including time-intensive, rigorous trialing- and approval processes before product launch -if such
launch is approved at all (Bratic et al., 2014). This results in a significant level of uncertainty and
risk for those early-stage firms, while larger players benefit from economies of scale in R&D or
manufacturing, plus a strong bargaining power as clients -and often acquirers- of those small firms.
The complexity of the industry is further compounded by its heavily regulated nature, with public
policies shaping product development- and clinical trialing process, safety and efficacy the of end-
product, supply chain efficacy, operational processes, intellectual property as well as information
security (Cooke, 2007).
3.2 Entrepreneurial Ecosystems
Cities, industrial clusters, regions or economies, where fostering entrepreneurship is part of the
strategy to boost economic development, can be referred to as entrepreneurial ecosystems
(Isenberg, 2014). Entrepreneurial ecosystems show similarity to natural ecosystems, characterized
by a lack of central control, vivid interaction between its players and creation of value resulting
from its members' actions aiming at satisfying their personal needs, hence accounting for a certain
level of self-organization and self-sustainment (Isenberg, 2016). Silicon Valley represents one of
the most developed and thriving entrepreneurial ecosystems and comprises a wide range of
independent and autonomous technology firms, supporting firms, research institutions, paired with
a deep talent pool as well as wide social networks and a culture that encourages innovation (World

7
Economic Forum, 2014). Another characteristic that entrepreneurial ecosystems have in common
with natural ecosystems is that they are unique and cannot be replicated, since they are results of
complex interaction and develop per their life-cycle (Isenberg, 2011b). Therefore, Isenberg
(2011b) notes that trying to imitate a successful entrepreneurial ecosystem, such as Silicon Valley,
would not be possible.
The output of a functioning entrepreneurial ecosystem is thriving entrepreneurship that leads to
continuous growth (Isenberg, 2016), e.g. in the form of job creation, long-term productivity
increases and ultimately GDP growth, as well as to an overall enriched economy and society
(Isenberg, 2011a). This type of output is produced when the success created by firms in the
ecosystem becomes available for future ventures and, at the same time, inspires others to engage
in entrepreneurship, further triggering geographic concentration of entrepreneurship (Isenberg,
2016). Thus, strictly speaking, entrepreneurship is not only considered as output of the
entrepreneurial ecosystem, but also as input that sustains it (Stam, 2015).
Research by the World Economic Forum (2014) indicates that high-growth ventures1 usually play
a pivotal role in creating and sustaining entrepreneurial ecosystems. It shows that these are often,
but not necessarily, small companies and especially those in their start-up- or early-stage phase. In
his study of San Diego’s biotechnology cluster, Kim (2015) argues that, rather than a group of large
companies, it was a number of small biotechnology firms that were critical to the cluster’s
development, since they promoted knowledge-creation and knowledge-sharing with other players.
Entrepreneurs add value to the ecosystem by creating value for customers, in the form of developed
or acquired new assets as well as by recombining or repurposing existing assets (Isenberg, 2016).
1 Isenberg and Onyemah (2016) define high-growth firms as those accounting for 20% p.a. growth in revenues or
headcount in 3 consecutive years after having reached a minimum of 10 people and 1 million USD in revenues.
8
At the same time they capture economic value for themselves, which enables them to further grow
and innovate (Isenberg, 2016). An increase in the number of firms, which “grow consistently and
significantly” (Isenberg and Onyemah, 2016) fuels further development of entrepreneurial
ecosystems. In fact, the value of an entrepreneurial ecosystem should not be measured by growth
in the total number of firms, but rather by growth within firms that are already part of the system
(Isenberg, 2014; Stam, 2015). And high-growth firms are often –yet not necessarily- early-stage
companies (Isenberg, 2016).
While a strong group of ambitious entrepreneurs is a crucial driver of an entrepreneurial ecosystem
development (Kim, 2015; Stam, 2015), it is important to emphasize that it is not the only driver.
This assumption would simply contradict the symbiotic nature of entrepreneurial ecosystems. In
fact, Isenberg (2016) argues that it is the collective of different stakeholders of the entrepreneurial
ecosystem that promote entrepreneurship directly or indirectly -while acting in a way to meet their
needs, their actions "make entrepreneurship more likely, prevalent, and self-sustaining". For
instance, Isenberg and Onyemah (2016) argue that when venture capitalists invest in early-stage
firms in order to meet their needs -that is, generating a return on investment-, they directly promote
entrepreneurship. Stock exchanges, on the other hand, indirectly facilitate entrepreneurship in a
given region with their mere presence (Isenberg & Onyemah, 2016). In order to maintain this type
of stakeholder interaction and thus keep the entrepreneurial ecosystem self-sustaining in the long
run, it is certainly critical that a large share of its stakeholders benefit from it (Isenberg, 2014).
With high-growth ventures at the base, entrepreneurial ecosystems are shaped by a set of
complementary domains, namely "a conducive culture, enabling policies and leadership,
availability of appropriate finance, quality human capital, venture-friendly markets for products,
and a range of institutional and infrastructural supports" (Isenberg and Onyemah, 2016).
9
Although not explicitly recognized as a domain in Isenberg’s model, there is one area that is
recurrently mentioned in the entrepreneurial ecosystem literature and that strongly impacts
performance of firms in knowledge-intensive industries: the creation, accumulation and
dissemination of knowledge through social networks (Kim, 2015; Montalvo, 2011; Zhang & Li,
2010). Since the life sciences industry is knowledge-intensive (Kim, 2015; Montalvo, 2011), it
benefits substantially from information exchange and subsequent knowledge spillovers (Isenberg,
2011a), or “innovative interaction” (Cooke, 2007). As this paper focuses on the entrepreneurial
ecosystem in the life sciences industry, social networks has been added as complimentary domain.
All in all, Isenberg’s model provides valuable insights into the drivers of entrepreneurial
development that make an entrepreneurial ecosystem sustainable. He argues that the policy
framework lays the foundation for the development of entrepreneurial ecosystems as it may
increase the attractiveness of the region and thus the size of the accessible market. While the policy
framework can also fuel a culture that encourages entrepreneurial activities, culture impactors
further stimulate and sustain it (Isenberg, 2016). Moreover, educational institutions build on that
policy framework to enable the development of entrepreneurial skills (Isenberg, 2016; Keng Wan
Ng, 2015). At the same time, they help create a community that embraces entrepreneurship
(Isenberg, 2016) and provide companies with much needed human capital (Keng Wan Ng, 2015).
But besides talent, access to financial capital is a key input to firm performance and growth,
especially in early stages. Furthermore, support organizations and service intermediaries, act, next
to their conventional support services, as catalysts for knowledge creation and -spillovers (Zhang
and Li, 2010). Yet funding, support services or human capital are only relevant if there is market
demand to generate revenue from. To that extent, more mature companies that engage with start-
ups as potential customers, become essential (Isenberg, 2011a). Finally, besides active social
10
networks within the entrepreneurial ecosystem, those from outside are of significant value,
particularly in knowledge-intensive industries such as life sciences, that rely on innovation
capacity, greatly enhanced by tacit and explicit social network exchanges (Montalvo, 2011).
4. RESEARCH GAP AND RESEARCH QUESTION
As noted, the literature suggests a wide variety of factors in different domains, including policy,
finance, culture, human capital, support, markets and social networks contribute to the successful
development of the entrepreneurial ecosystem. However, the relative importance of each factor, as
well as the underlying constructs that drive such relative importance, vary from industry to industry
and from actor to actor (Isenberg, 2014).
Reports by the World Economic Forum (2013, 2014), which investigated the value perception of
firms towards their entrepreneurial ecosystem do exist. However, these provide only limited
implications for the life sciences industry, and less so for the Viennese cluster, which accounts for
the gap in the literature hereby addressed.
This study aims at identifying the needs and expectations of early-stage, R&D and manufacturing
life sciences firms clustered in Vienna. The reason for this choice of population is that Vienna’s
competitive advantage lies in its preeminent position as research and innovation hub (LISAvienna,
2015). The city’s outstanding mix of research institutions, universities and highly skilled
workforce, makes the cluster’s R&D and manufacturing companies its driving force. Moreover, as
noted in section 3.1, the life sciences industry can be particularly challenging for small, early-stage
firms. Thus, insight into their needs and expectations, along with the relative impact of such
demands as growth engines, may turn into an effective lever to stimulate the entrepreneurial
ecosystem.

11
The research question is therefore defined as follows:
What are the underlying factors that drive the domains of the entrepreneurial ecosystem relevant
for the success and growth of early-stage R&D and manufacturing firms in the Vienna life sciences
cluster? In other words, which factors show the highest correlations between the observed variables
related to their relative importance for success and growth of these firms?
The findings -and expected contribution of this research- would arguably signal all stakeholders,
from policy makers to clustered firms and related entities, along with the cluster manager
(LISAvienna) as to what the needs and expectations of early-stage R&D and manufacturing firms
are, hence how to best support them and stimulate the development of the cluster and its underlying
entrepreneurial ecosystem.
The analytical part, run on data collected through a survey measuring companies’ normative view
on the ecosystem domains, and a subsequent exploratory factor analysis to identify the underlying
constructs that drive their needs and expectations, follows in the next session.
5. METHODOLOGY
5.1. Construct of Variables and Survey
In order to measure the relative importance of the entrepreneurial ecosystem domains, as perceived
by Vienna’s early-stage R&D and manufacturing life sciences firms, this study builds on Isenberg’s
model discussed above.
The initial pool of measurement variables was developed from the literature, in particular from
Isenberg’s framework of entrepreneurial ecosystems (Isenberg, 2011b, 2016; Isenberg
& Onyemah, 2016). They were clustered into six distinctive domains that depicted Isenberg’s
ecosystem domains, (1) Policy, (2) Finance, (3) Culture, (4) Supports, (5) Human Capital and (6)
Markets. Further, a seventh domain, (7) Social Networks was added to the construct, as it is a

12
critical component for growth in the life sciences industry. Finally, each domain was completed
for individual items that are specific to the life sciences industry in Vienna. The final 71 variables
(elements in the entrepreneurial ecosystem that contribute to its development) from all seven
distinct domains were clustered into 18 categories based on their subject matter.
As this study examines the normative view of Vienna’s R&D and manufacturing life sciences
firms, it was intended to create a sample of companies whose business activities comprised R&D
and manufacturing and which are in their seed- and start-up or early-stage phase, i.e. are five years
old or younger (Van Osnabrugge and Robinson, 2000). The population size of R&D and
manufacturing life sciences companies in the cluster (N = 46) was based on LISAvienna (2015).
The minimum sample size (n = 28) was calculated with an estimated confidence interval of 0.95.
The standard deviation was estimated at a less demanding score of 2.0 (Leys, Klein, Bernard, and
Licata, 2013), based on the assumption of overall low variability across samples considering the
already highly specified nature of the population. The minimum sample size was reached with a
total of 28 observations.
To provide a suitable measure for the relative importance of the defined items, and thus gain insight
into the companies’ expectations and needs from the entrepreneurial ecosystem, a quantitative
survey was designed. The questionnaire contained the 71 derived measurement variables and asked
participants how important they perceived them for the success and growth of their company.
Participants were required to provide their personal opinion on a five-point Likert scale ranging
from very important to not important.
In order to confirm that the participants possessed the attributes to be part of the sample,
demographic variables were included. Firstly, to confirm that the company was part of the life
sciences industry, as defined by LISAvienna (2015), it was inquired whether it operated in the areas

13
of biotechnology, pharmaceuticals or medical devices. Secondly, to confirm that the company’s
business activities comprised R&D and manufacturing, the firm’s core activities were asked.
Finally, to confirm the firm’s phase of maturity, its current life-cycle stage was inquired.
Following Zhang and Li (2010), additional control variables were included in the questionnaire to
account for potential variations in results or unanticipated results, since participants’ perceptions
may vary across companies with different attributes (Zhang and Li, 2010). These included
company size and the type of obtained finance. Moreover, to ensure that respondents were
knowledgeable of the industry and had the ability to provide a valid assessment, their number of
years of life sciences work experience was measured (Zhang and Li, 2010). Finally, to grasp the
respondents’ involvement or experience in strategic decision-making, their position within the
company was measured (Zhang and Li, 2010). These last two elements not only gave insight into
the respondents’ knowledge on the subject, but also on their motivation to answer accurately on a
survey that covered a topic that was strategic in nature (Eichhorn, 2014).
Another issue that needed to be addressed was the possibility of common method bias. According
to Eichhorn (2014), this type of bias occurs frequently in empirical research involving surveys and
using a single method of data collection. In fact, the study notes that the survey design itself may
cause participants to unconsciously influence their response or answer inaccurately, due to, for
instance, a lack of knowledge on the topic, complexity of the questions or unfamiliarity with the
online format or used language. To lower common method bias, several procedural measures were
implemented. Firstly, the entire questionnaire was pilot-tested, and changes were made regarding
wording and formulation of several variables. Moreover, a number of measurement variables that
account for specificities of the life sciences cluster in Vienna, were added based on the inputs of
the cluster management of LISAvienna. Secondly, the participant’s time for completion of the

14
questionnaire was measured, to make sure that the length did not exceed the 10-minute time frame,
which might have caused a substantial decrease in the response rate. Thirdly, to prevent self-
reporting bias, the participants were assured in the introduction of the questionnaire, that their
answers were strictly anonymous and there was no right or wrong answer to the questions
(Eichhorn, 2014; Zhang and Li, 2010). This should have lowered the probability of participants
evaluating their own answers based on their personal attitude towards the research topic (Eichhorn,
2014) and decreased the overall tendency of giving socially-desirable answers (Zhang and Li,
2010). Finally, no options such as Don’t know or Not applicable were included in order to prevent
missing values in the analysis.
To collect the data, the questionnaire was sent out in the form of an online survey. The format of
an online survey was chosen in the hope of obtaining a higher response rate resulting from a broader
outreach and ease of completion. A combined approach of gathering responses by sending out the
online survey via email and contacting respondents via phone to follow-up was performed.
Participants’ contact details were provided by LISAvienna.
5.2. Exploratory Factor Analysis
The data collected in the survey indicated the relative importance of the various elements of the
entrepreneurial ecosystem for the participants’ success and growth. In order to identify its
underlying constructs, an exploratory factor analysis was conducted.
As a first step, the entire set of 71 items from the survey was used as items for the analysis. Yet
problems were encountered with the observation-to-item ratio, as the number of 71 observed
variables was simply too high for the number of 28 observations (Howard, 2016). As a result, it
was decided to perform the exploratory analyses using the 18 main categories that organize the 71
survey items as observed variables. The scores of the 18 categories were calculated as weighted

15
average scores of each category’s respective variables. After all, since factors tend to be relatively
abstract constructs (Yong and Pearce, 2013), a factor analysis performed with observed variables
that are not as excessively specific as the 71 items, made it easier to examine and name the
underlying constructs of the data set. Therefore the 18 observed variables used for the factor
analysis are in fact the 18 categories of the entire set of 71 variables from the survey. The observed
variables ultimately used for the factor analysis are illustrated in Table 1 below.
Table 1 – Observed variables used for the exploratory factor analysis
Policy P 1 Public priority for entrepreneurshipP 2 Tax incentivesP 3 Venture-friendly legislationP 4 Policy initiatives for innovationP 5 Lower complexity and support regarding regulatory compliance
Finance F 1 Access to financial capitalF 2 Lowered bureaucratic effort to obtain financial capital
Culture C 1 Communication of success stories and assets of the Vienna life science clusterC 2 Favorable culture and societal norms
Supports S 1 Access to support organizations and -professionalsS 2 Access to service professionals
Human capital H 1 Availability of a talent poolH 2 Access to further training and learning resources
Markets M 1 Access to different types of customers in the domestic marketM 2 Access to different types of customers in foreign marketsM 3 Non-organic growth opportunities
Social networks N 1 Active social networks within the Vienna life science clusterN 2 Active social networks with players outside the Vienna life science cluster
Source: Author
After collecting the data, various measures were performed to inspect the dataset for patterned
relationships and ensure the absence of multicollinearity or singularity. As a first step, Bartlett’s

16
test of sphericity was performed. The Kaiser–Meyer–Olkin (KMO) measure of sampling adequacy
was used as an additional indicator for appropriateness of the data set for exploratory factor
analysis. Howard (2016) recommends a KMO measure higher than 0.6, so such score was used as
a threshold for overall sampling adequacy. When applied to all 18 observed variables, the Bartlett’s
test was significant. Yet the KMO criterion was below 0.6. Due to their excessively low level of
sampling adequacy, the five variables (F1) Access to financial capital, (F2) Lowered bureaucratic
effort to obtain financial capital, (H2) Access to further training and learning resources, (M3)
Non-organic growth opportunities and (C1) Communication of success stories and assets of the
Vienna life sciences cluster were taken out. The tests were re-performed with the remaining 13
variables and now displayed a significant Bartlett’s test as well as KMO criterion of above 0.6.
Finally, to confirm the absence of singularity or multicollinearity, the Squared Multiple Correlation
(SMC) was computed (Yong and Pearce, 2013). None of the variables implied singularity nor
multicollinearity. Therefore all 13 observed variables were retained for further analysis.
In order to determine the appropriate number of factors for the analysis, a visual scree plot (VSP)
was computed. The VSP suggested to retain two factors. Moreover, Horn’s parallel analysis was
used to compute the suggested factors to retain (Howard, 2016). The parallel analysis revealed that
only one factor should be retained.
A Maximum Likelihood Analysis (MLA) was performed to identify the underlying factors and
loadings of the observed variables (n = 13) on the retained factors. As factor rotation method,
varimax rotation was used, since it enables the most comprehensible interpretation (Howard, 2016).
Due to the contradictory suggestions of the two factor retention methods, the MLA was performed
with both one factor and two factors. The results displayed that two factors should be used, since
the null-hypothesis that one factor was enough was rejected by a significant p-value of 0.037.

17
Therefore, the factor analysis was ultimately performed with two factors. After the rotation,
variables were attributed to the retained factors based on their level of loadings onto each factor.
The resulting factor loading matrix is presented in Table 2, while Table 3 displays the factor
loadings.
Table 2 – Factor matrix from MLA performed with two factors
Source: Author
Call:
factanal (x = x, factors = 2, covmat = NULL, rotation = "varimax")
Uniquenesses:
P1 P2 P3 P4 P5 S1 S2 H1 M1 M2 N1 N2 C2
0.60 0.69 0.87 0.49 0.66 0.45 0.43 0.63 0.22 0.41 0.61 0.41 0.68
Loadings:
Factor1 Factor2
P2 0.55P4 0.62
P5 0.52S1 0.74
S2 0.74
H1 0.54N1 0.56
N2 0.74P1 0.61
M1 0.87M2 0.72
P3
C2 0.42
Factor 1 Factor 2
SS loadings 3.50 2.34
Proportion Var 0.27 0.18
Cumulative Var 0.27 0.45
Test of the hypothesis that 2 factors are sufficient.
The chi square statistic is 63.21 on 53 degrees of freedom.
The p-value is 0.159
18
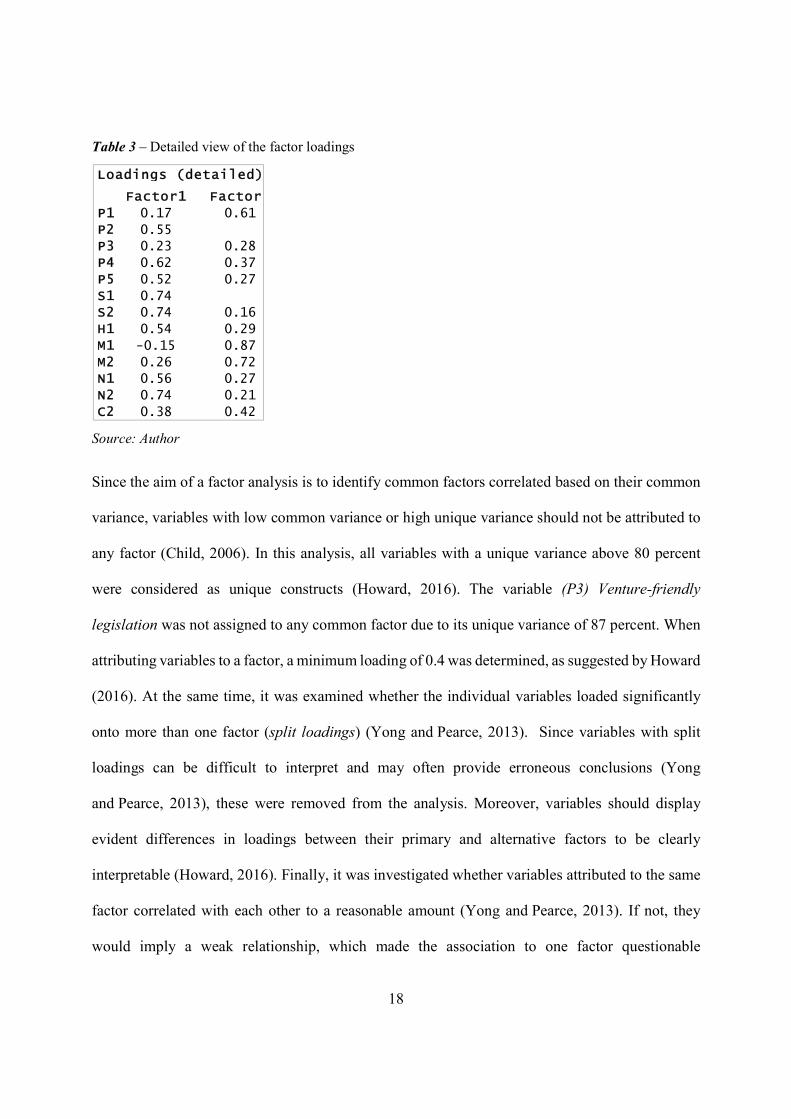
Table 3 – Detailed view of the factor loadings
Source: Author
Since the aim of a factor analysis is to identify common factors correlated based on their common
variance, variables with low common variance or high unique variance should not be attributed to
any factor (Child, 2006). In this analysis, all variables with a unique variance above 80 percent
were considered as unique constructs (Howard, 2016). The variable (P3) Venture-friendly
legislation was not assigned to any common factor due to its unique variance of 87 percent. When
attributing variables to a factor, a minimum loading of 0.4 was determined, as suggested by Howard
(2016). At the same time, it was examined whether the individual variables loaded significantly
onto more than one factor (split loadings) (Yong and Pearce, 2013). Since variables with split
loadings can be difficult to interpret and may often provide erroneous conclusions (Yong
and Pearce, 2013), these were removed from the analysis. Moreover, variables should display
evident differences in loadings between their primary and alternative factors to be clearly
interpretable (Howard, 2016). Finally, it was investigated whether variables attributed to the same
factor correlated with each other to a reasonable amount (Yong and Pearce, 2013). If not, they
would imply a weak relationship, which made the association to one factor questionable
Loadings (detailed):
Factor1 Factor2
P1 0.17 0.61
P2 0.55P3 0.23 0.28
P4 0.62 0.37
P5 0.52 0.27
S1 0.74S2 0.74 0.16
H1 0.54 0.29
M1 -0.15 0.87
M2 0.26 0.72N1 0.56 0.27
N2 0.74 0.21
C2 0.38 0.42

19
(Tabachnick & Fidell, 2007). The correlation matrix (Table 4 below) revealed that (S2) Access to
service professionals and (H1) Availability of a talent pool correlated insufficiently with more than
two variables. Moreover, the variable (C2) Favorable culture and societal norms displayed split
loadings as well as overall weak to insignificant correlation with the other variables. Hence the
three variables were omitted from the factors.
Table 4 – Correlation matrix of the 13 retained observed variables
Source: Author
With respect to the factors, only those were declared as common factors that computed an
eigenvalue of more than 1.0 and had at least three variables attributed to it (Tabachnick and Fidell,
2007). As both factors displayed a sufficient eigenvalue and comprised more than three variables,
these were retained as common factors and explained 45 percent of the overall variance.
As a last step, a Cronbach’s alpha test was conducted to confirm the reliability of the determined
groupings (Tavakol and Dennick, 2011). Both groupings illustrated a sufficient raw alpha score of
above 0.7 (Tavakol and Dennick, 2011).
P1 P2 P3 P4 P5 S1 S2 H1 M1 M2 N1 N2 C2
P1 1.00 0.13 0.38 0.37 0.22 0.09 0.20 0.17 0.53 0.36 0.43 0.23 0.40
P2 0.13 1.00 0.38 0.45 0.61 0.38 0.25 0.30 -0.12 -0.05 0.36 0.29 0.26
P3 0.38 0.38 1.00 0.34 0.20 0.07 0.35 0.25 0.21 0.16 0.07 0.05 0.27
P4 0.37 0.45 0.34 1.00 0.56 0.28 0.50 0.37 0.18 0.48 0.39 0.62 0.34
P5 0.22 0.61 0.20 0.56 1.00 0.37 0.26 0.27 0.16 0.30 0.42 0.35 0.41
S1 0.09 0.38 0.07 0.28 0.37 1.00 0.65 0.48 -0.08 0.20 0.57 0.53 0.24
S2 0.20 0.25 0.35 0.50 0.26 0.65 1.00 0.51 0.02 0.35 0.26 0.66 0.34
H1 0.17 0.30 0.25 0.37 0.27 0.48 0.51 1.00 0.14 0.49 0.25 0.35 0.49
M1 0.53 -0.12 0.21 0.18 0.16 -0.08 0.02 0.14 1.00 0.60 0.18 0.08 0.27
M2 0.36 -0.05 0.16 0.48 0.30 0.20 0.35 0.49 0.60 1.00 0.25 0.37 0.42
N1 0.43 0.36 0.07 0.39 0.42 0.57 0.26 0.25 0.18 0.25 1.00 0.60 0.34
N2 0.23 0.29 0.05 0.62 0.35 0.53 0.66 0.35 0.08 0.37 0.60 1.00 0.24
C2 0.40 0.26 0.27 0.34 0.41 0.24 0.34 0.49 0.27 0.42 0.34 0.24 1.00
20
Ultimately, the retained factors were named based on the content and the direction of loadings of
their attributed variables. The findings are discussed in the following section.
6. DISCUSSION OF FINDINGS
This paper intends to shed light on the underlying constructs of the elements relevant for the success
and growth of early-stage R&D and manufacturing companies in the entrepreneurial ecosystem of
the Vienna life sciences industry. Moreover, it aims at gaining insight into what elements are of
particular importance for these companies.
The results of the exploratory factor analysis confirm the existence of two underlying common
factors. These organize the elements that drive the growth and success of Vienna’s early-stage
R&D and manufacturing life sciences companies. Furthermore, one variable with high unique
variance that represents a construct of its own has been found.
The first factor accounts for 27 percent of the total variance. It is described by the following six
variables from the domains Supports, Social Networks and Policy: (S1) Access to support
organizations- and professionals, (N2) Active social networks with players outside the Vienna life
sciences cluster, (P4) Policy initiatives for innovation, (N1) Active social networks within the
Vienna life sciences cluster, (P2) Tax incentives and (P5) Lower complexity and support regarding
regulatory. The items are listed in descending order based on their loadings onto the factor. All
items load relatively strongly -with loadings ranging from 0.74 to 0.52 and only slight value
differences- and positively onto the factor, which suggests a positive relationship between the
variables and their underlying construct.
When looking at their contents, the factor’s associated items encompass a variety of elements that
enable and promote innovation. Thus, the factor is summarized as Innovation and results suggest

21
that it is an interplay of an active support- and service network, policy incentives for innovation
and social networks within as well as with players outside the ecosystem. Innovation resulting as
an important driver for companies that focus on upstream activities is not surprising, given the
disruptive nature of the life sciences industry, where the ability to innovate gives a competitive
advantage. In line with the literature, the element (S1) Support organizations and -professionals
that includes incubators, accelerators and mentors or advisers, directly contributes to knowledge
spillovers and induces innovation by supporting particularly early-stage companies in terms of
education, advisory or provision of finance or facilities, such as laboratory spaces (Hathaway,
2016; Isenberg, 2016). Moreover, the element comprises a functioning infrastructure of support
organizations and -professionals that improves capability and speed of product innovation, since it
enables companies to focus on their core activities (Zhang and Li, 2010). This is particularly crucial
for early-stage companies in an industry, such as life sciences, where initial costs are high (Kim,
2015) and the time before an initial return on investment is comparatively long (Marketline, 2012).
Secondly, the category (P4) Policy initiatives for innovation, which comprises government
assistance schemes, support for clinical trials or incentives for R&D, can directly steer innovation
activities. This is also the case for (P2) Tax incentives. The fact that (P5) Lower complexity and
support regarding regulatory compliance loaded onto the factor Innovation illustrates once more
the influential role of the regulatory framework on innovation activities in this industry. The policy
framework seems to be perceived as enabler of innovation, but at the same time as impediment
(Herzlinger, 2006). Thus, policy makers can push the speed of innovation by developing a less
complex and more supportive environment in terms of regulatory compliance. Finally, as suggested
by Montalvo (2011), innovation in a knowledge-intensive industry, such as life sciences, can be
induced particularly by the elements (N1) Active social networks within the Vienna life sciences
cluster and (N2) Active social networks with players outside the Vienna life sciences cluster. Social

22
networks increase innovation search and -scope and enable the necessary interaction for knowledge
exchange (Isenberg, 2011a; Kim, 2015; Montalvo, 2011). For companies, whose core lies on
upstream- rather than marketing- and sales activities, and especially for young ones, which often
do not possess extensive networks, offering social networks can be key for fueling their success
and growth (Montalvo, 2011). Social networks leading to collaboration between players of the
same or different ecosystems, can catalyze innovation through spillovers of explicit and
particularly tacit knowledge (Kim, 2015; Montalvo, 2011). Especially in locations where R&D
capabilities are a key competitive advantage, like in Vienna, collaboration between companies and
R&D institutions as well as spin-offs, can be leveraged to achieve high impact on cluster
development. The element of social networks seems to touch and affect almost every other domain
of the entrepreneurial ecosystem. For instance, the needed knowledge spillovers can also happen
by means of informal, non-market interaction (Montalvo, 2011) fueled by (S1) Support
organizations- and professionals, e.g. by organizing networking events. Moreover, early-stage
companies can strongly increase their scope and speed of innovation search when plugging into
the vast social networks of support- and service organizations or benefit from their insight into
market- and collaboration opportunities (Zhang and Li, 2010).
The second factor resulting from the analysis explains 18 percent of the total variance. The factor
is associated particularly with the domain Markets, but also encompasses the domain Policy. It is
described by three observed variables: (M1) Access to different types of customers in the domestic
market, (M2) Access to different types of customers in foreign markets and (P1) Public priority for
entrepreneurship. The observed variables are listed in descending order based on their factor
loadings. Again, all items load positively and relatively strongly onto the factor, with small loading
differences between them -values range from 0.87 to 0.61. Content-wise the attributed variables

23
consist of elements that instigate organic growth of companies. Hence, the second factor is
summarized as Organic growth. Based on the results of the analysis, organic growth is driven by
the interplay of exogenous demand by different types of customers, together with policy support
that enhances the overall attractiveness of the ecosystem and potentially triggers further
exogeneous demand. The finding that organic growth is an essential factor for young life sciences
companies is rather intuitive, given the vast amount of required financial- and human capital to
transform ideas into products (Kim, 2015) and the fact that economies of scale represent a strong
competitive advantage in this industry (Marketline, 2012). As suggested by the grouped variables,
organic growth can be directly induced by (M1) Access to different types of customers in the
domestic market and (M2) Access to different types of customers in foreign markets. They include
business customers, such as large corporations or SMEs, governments or medical insurance
companies. Customers and market opportunities are a key accelerator of organic growth, since they
allow for companies to generate revenues, which represent resources for scaling and expansion.
Stam (2015) argues that the level of exogenous demand and thus the potential for growth, is
partially tied to the relative position of the entrepreneurial ecosystem. This position, in turn, can be
influenced by the involvement of policy makers. Hence, the variable (P1) Public priority for
entrepreneurship describes how policy makers indirectly stimulate organic growth of companies.
It includes the implementation of an official entrepreneurship policy, which not only supports
companies in the entrepreneurial ecosystem, but also increases its publicity and social legitimacy
(Isenberg, 2014). Moreover, policy makers can also actively encourage different players to invest
into the entrepreneurial ecosystem to fuel the growth of companies (Isenberg, 2014). These
measures are particularly valuable for R&D and manufacturing companies, considering that their
focus lies on upstream activities rather than on establishing their own market channels.

24
Additionally, a type of unique factor, (P3) Venture-friendly legislation, was identified due to its
significantly high unique variance, as shown in Table 4 above. As a venture-friendly legislation
represents to a certain extent a prerequisite for the success and growth of early-stage companies, it
is not surprising that it emerges as an underlying construct of its own. A venture-friendly legislation
is likely to encourage a favorable environment for the founding of a company, the conduct of
business and even for the event of failure (Isenberg, 2011a).
Although the exploratory factor analysis has identified the underlying constructs that organize the
entrepreneurship ecosystem elements relevant for success and growth, it said nothing about how
early-stage R&D and manufacturing companies perceived their importance in absolute terms.
However, the insights gained from the survey revealed that categories from the domain Policy were
overall perceived as most important. In fact, the descriptive statistics2 revealed that the upper bound
of scores in terms of mean and median was dominated by observed variables related to policy
topics. These included the categories (P2) Tax incentives, (P3) Venture-friendly legislation and
(P5) Lower complexity and support regarding regulatory compliance. Moreover, (F2) Lowered
bureaucratic effort to obtain financial capital and (S1) Access to support organizations and -
professionals, which fall under the domains Finance and Supports were among the five highest
scores as well. Arguably financial landscape and support infrastructure tend to be influenced by
the existing policy framework. As mean and median did not differ significantly and sample
standard deviation had its maximum at 1.18, the scores seemed to provide a rather unambiguous
picture of the perceived importance of variables for the success and growth of the participating
2 The descriptive statistics of the observed variables (n = 18) used for the factor analysis were calculated as weighted
averages of the respective scores of their associated measurement variables from the survey (n = 71). The scores range
from 5 (very important) to 1 (not important).

25
companies. It could be therefore argued that the domain Policy is unanimously perceived as the
most influential element for growth and success by the cluster’s early-stage R&D and
manufacturing firms. The pivotal role of the policy framework is not surprising given the highly-
regulated nature of this industry. A complete overview of the descriptive statistics is presented in
Table 5 below.
Table 5 – Survey results – Descriptive statistics
Source: Author
Summarizing, the findings illustrate how the underlying pattern related to success and growth of
early-stage R&D and manufacturing firms in the cluster is multifold. The factor analysis revealed
the existence of two underlying common factors: Innovation and Organic growth. The domains
Supports, Social Networks and Policy are sources of the factor Innovation, while Markets and
Policy describe the factor Organic growth. Furthermore, the domain Policy drives the unique
construct Venture-friendly legislation. It is evident that the domain Policy feeds into each of the
resulting factors and is even perceived as highly relevant for success and growth in absolute terms.
This reinforces the critical influence of policy makers in the Vienna life sciences cluster. The
findings are consistent with the literature on the life sciences industry and entrepreneurial
ecosystems, i.e. enabling factors of knowledge-intensive clusters include the invigoration of
innovation and collaboration (Kim, 2015; Montalvo, 2011; Zhang and Li, 2010) as well as the
F1 F2 P1 P2 P3 P4 P5 S1 S2Average mean 3.52 4.32 3.99 4.42 4.21 3.70 4.10 4.17 3.55Average median 3.50 4.75 4.33 4.75 4.38 3.67 4.00 4.13 3.75Average Sample Standard Deviation 1.17 0.94 0.77 0.80 0.79 0.99 0.96 1.00 0.98
H1 H2 M1 M2 M3 N1 N2 C1 C2Average mean 4.01 3.71 3.82 3.71 3.68 3.90 3.85 3.05 2.80Average median 4.33 4.00 3.88 3.75 3.83 4.00 3.83 3.00 3.00Average Sample Standard Deviation 0.91 1.10 1.08 1.10 1.18 1.01 0.97 0.83 0.88

26
stimulation of entrepreneurial growth (Isenberg, 2010; Isenberg and Onyemah, 2016; Montalvo,
2011) and are enhanced by targeted public policies and regional initiatives (Isenberg, 2011a;
Montalvo, 2011; Stam, 2015).
7. THEORETICAL AND MANAGERIAL IMPLICATIONS
The above findings arguably have multiple theoretical and managerial implications. While building
on Isenberg’s universal framework for measuring entrepreneurial ecosystems (Isenberg, 2010,
2011a, 2016; Isenberg and Onyemah, 2016), this paper develops a construct of variables specific
for ecosystems in the life sciences industry, and tailor-made to measure the ecosystem of the
Vienna life sciences cluster. The framework hereby developed may be used as a basis for future
research on this entrepreneurial ecosystem relative to any industry player.
Besides the theoretical implications, the study has the potential to improve practice and policy-
making, by signaling to all relevant stakeholders, from cluster members to public officials, the need
to better align their efforts to nurture the cluster’s entrepreneurial drive. For the cluster manager,
LISAvienna, the findings unveiled the determinants that would ultimately boost the development
of the network: promotion of innovation and organic growth.
One important lever for stimulating innovation in this cluster would be a closer collaboration
between R&D and manufacturing firms and universities and research institutions. That would lead
to more industry-relevant research, with better commercialization prospects, hence more capable
of generating the revenue that would unlock the sought-after organic growth. As Vienna has a
relatively small domestic market compared to rival clusters, such as those in Berlin or London,
(Cooke, 2007), its strength in research and development becomes an even more critical factor. Such
scientific muscle shapes the city’s location attractiveness for the life sciences industry. The
cluster’s strong knowledge assets help explain the recurrence of university-industry spin-offs

27
(Goldstein et al., 2013). Yet the findings suggest the frequent divergence between the scientific,
publishing-oriented research produced by universities and the commercial, product development-
driven research demanded by the industry, may become a liability for the cluster and the
entrepreneurial ecosystem altogether. Although this might appear counter-intuitive, as many life
science ventures are spin-offs from scientific institutions (Goldstein et al., 2013), the scientific-
impact to commercial-impact mismatch is likely to leave innovation capacity unexploited,
hindering firm growth and cluster development. This may well account as a call for action to
LISAvienna, the cluster manager, to align industry and academia around the right incentives or
resource provision.
In addition, the study revealed the unsurprisingly pivotal role of the policy framework for early-
stage R&D and manufacturing companies in the cluster, which they perceive as an enabler but also
an impediment for their success and growth. While policy incentives for venture development can
spur innovation, too much regulation can curtail it. As life sciences is one of the most regulated
industries, innovation may not run free, but steered by policy makers. Although a high level of
regulation is needed when broad societal needs are at stake, such as health care (Herzlinger, 2006),
in others it might have detrimental long-term impact on growth. Namely, it results in industrial
players’ and customers’ demands clashing with those of regulators. This consequently impedes
innovation and organic growth- or scaling capabilities that stem from product commercialization,
e.g. in the form of a reduced speed of product development or limited variety of product types. In
fact, in his study on biotechnology clusters, Cooke (2007) contrasts the more liberal policy
approaches in the United Kingdom, with Germany’s highly regulated and coordinated system,
regarding for instance product development, and finds the former superior in terms of innovation
speed and attractiveness for investors, firms and research organizations. As Vienna’s competitive

28
advantage lies in research and development and as upstream activities are particularly scrutinized
by regulators in life sciences (Bratic et al., 2014), the cluster’s attractiveness might decline in the
long term if innovation is not unleashed by means of a less complex regulatory landscape. This
research suggests the need of a more engaging conversation between policy makers, cluster
managers and firms in the network. Of course, loosening the regulatory landscape cannot happen
overnight, nor would it be wise to adapt all types of life sciences sectors, such as health care.
However, a long-term goal might be to gradually ease up regulatory compliance requirements in
areas where evidence points at no harm in so doing. These may include sectors such of food
technology, plants or fertilizers. After all, this might not only boost innovation and company
growth in life sciences, but also in related industries.
8. LIMITATIONS AND FUTURE RESEARCH
While the implications addressed to cluster management and policy makers represent potential
levers for enhancing the overall entrepreneurial ecosystem, they are still derived from a rather small
share of the whole life sciences cluster (N = 480), namely early-stage R&D and manufacturing
firms (n = 46). As Vienna’s strength lies in its research capacity, and the life sciences industry is
particularly challenging for young companies, this may be a lead worth further research. A broader
overview of this entrepreneurial ecosystem may result from exploring other company segments,
such as the whole set of R&D and manufacturing firms (n = 133) or supply-, sales- and service
companies (n = 301). This would require not only a larger sample, but also overcoming barriers to
access industry players in the cluster.
Furthermore, as the study largely assesses the normative view of the cluster’s early-stage R&D and
manufacturing firms -what these players need and expect from the entrepreneurial ecosystem-, the
positive insight -the perception of the benefits and support they actually receive from the

29
ecosystem-, although arguably implied in the shortcomings, is not explicitly addressed in the paper.
So while beyond the scope of this study, such positive approach would account for another
opportunity for future, related research.
Finally, with regards to the construct of variables hereby developed, this study may serve as a basis
for further research not just within the Vienna life sciences cluster, but may well be replicated for
the analysis of different ecosystems. Even though this cluster in Vienna could be regarded as fairly
unique, the rationale behind its location factors may apply to other life sciences clusters, hence
opening up another avenue for future research.

30
References
Bahrami, H., and Evans, S. (1995). Flexible re-cycling and high-technology entrepreneurship.
California Management Review, 37, 62–89.
Bialojan, S., and Schuler, J. (2003). Commercial biotechnology in Germany: An overview.
Journal of Commercial Biotechnology, 10(1), 15–21.
Bratic, W., Blok, J. R., and Gostola, M. M. (2014). Valuation of early-stage companies in the
biotechnology industry. Journal of Commercial Biotechnology, 20(2), 51–58.
Child, D. (2006). The essentials of factor analysis (3rd ed.). New York, USA: Continuum
International Publishing.
Cohrssen, J. J., and Miller, H. I. (2015, September 30). Biotech Regulation: Will Government
Become The Solution Instead Of The Problem? Forbes.
Cooke, P. (2007). European asymmetries: A comparative analysis of German and UK
biotechnology clusters. Science and Public Policy, 34(7), 454–474.
Eichhorn, B. R. (2014). Common Method Variance Techniques. Cleveland State University,
USA.
Goldstein, H., Peer, V., and Sedlacek, S. (2013). Vienna as a Region of Knowledge: Increasing
the Generation of University Spin-offs. MODUL University Vienna, Austria.
Hathaway, I. (2016, March 1). What Startup Accelerators Really Do. Harvard Business Review
Digital Articles.
Herzlinger, R. E. (2006). Why Innovation in Health Care Is So Hard. Harvard Business Review,
84(5), 58–66.
Howard, M. C. (2016). A Review of Exploratory Factor Analysis Decisions and Overview of
Current Practices: What We Are Doing and How Can We Improve? International Journal of
Human-Computer Interaction, 32(1), 51–62.
Isenberg, D. J. (2010). How to Start an Entrepreneurial Revolution. Harvard Business Review,
88(6), 40–50.
Isenberg, D. J. (2011a). The Entrepreneurship Ecosystem Strategy as a New Paradigm for
Economic Policy: Principles for Cultivating Entrepreneurship. Retrieved from The Babson
Entrepreneurship Ecosystem Project website: entrepreneurial-revolution.com/2011/05/11/the-

31
entrepreneurship-ecosystem-strategy-as-a-new-paradigm-for-economic-policy-principles-for-
cultivating-entrepreneurship/
Isenberg, D. J. (2011b, May 25). Introducing the Entrepreneurship Ecosystem: Four Defining
Characteristics. Forbes.
Isenberg, D. J. (2014, May 12). What an Entrepreneurship Ecosystem Actually Is. Harvard
Business Review Digital Articles.
Isenberg, D. J. (2016). Applying the Ecosystem Metaphor to Entrepreneurship: Uses and
Abuses. The Antitrust Bulletin, 61(4), 564–573.
Isenberg, D. J., and Onyemah, V. (2016). Fostering Scale Up Ecosystems for Regional
Economic Growth: Innovations Case Narrative: Manizales-Mas and Scale Up Milwaukee.
Innovations: Technology, Governance, Globalization, 11(1-2), 60–79.
Keng Wan Ng, R. (2015). An Empirical Analysis of the Singapore Entrepreneurship
Ecosystem: A Case Study for BRIC Economies to Ponder. In M. J. Manimala & K. P. Wasdani
(Eds.), Entrepreneurial Ecosystem (pp. 57–89). New Delhi: Springer India.
Kim, S.-T. (2015). Regional Advantage of Cluster Development: A Case Study of the San
Diego Biotechnology Cluster. European Planning Studies, 23(2), 238–261.
Leys, C., Klein, O., Bernard, P., and Licata, L. (2013). Detecting outliers: Do not use standard
deviation around the mean, use absolute deviation around the median. Journal of Experimental
Social Psychology, 49(4), 764–766.
LISAvienna. (2015). Vienna Life Sciences Report 2015/2016. Retrieved from LISAvienna
website: http://lisavienna.at/de/downloads/vienna-life-science-report
Malecki, E. J. (2011). Connecting local entrepreneurial ecosystems to global innovation
networks: Open innovation, double networks and knowledge integration. International Journal
of Entrepreneurship and Innovation Management, 14, 36–59.
Marketline. (2012). Pharmaceuticals, Biotechnology & Life Sciences Industry Profile: Global.
Pharmaceuticals, Biotechnology & Life Sciences Industry Profile: Global, 1–33.
Mason, C., & Brown, R. (2013). Entrepreneurial Ecosystems and Growth Oriented
Entrepreneurship. The Hague, Netherlands.

32
Montalvo, F. (2011). Economic growth and innovation: Lessons in knowledge sharing from
bioscience clusters in Ohio and Puerto Rico. Global Business and Organizational Excellence,
31(1), 54–62.
Stam, E. (2015). Entrepreneurial Ecosystems and Regional Policy: A Sympathetic Critique.
European Planning Studies, 23(9), 1759–1769.
Tabachnick, B. G., and Fidell, L. S. (2007). Using multivariate statistics (5. ed.). Pearson
international edition. Boston, MA: Pearson and Allyn & Bacon.
Tavakol, M., and Dennick, R. (2011). Making sense of Cronbach's alpha. International Journal
of Medical Education, 2, 53–55.
Van Osnabrugge, M., and Robinson, R. J. (2000). Angel Investing: Matching Start-up Funds
with Start-up Companies - The Guide for Entrepreneurs, Individual Investors, and Venture
Capitalists (1st Ed.). San Francisco, USA: Jossey-Bass.
World Economic Forum. (2013). Entrepreneurial Ecosystems Around the Globe and Company
Growth Dynamics. Retrieved from www.weforum.org/reports/entrepreneurial-ecosystems-
around-globe-and-company-growth-dynamics
World Economic Forum. (2014). Entrepreneurial Ecosystems around the Globe and Early-
Stage Company Growth Dynamics. Retrieved from World Economic Forum website:
http://reports.weforum.org/entrepreneurial-ecosystems-around-the-globe-and-early-stage-
company-growth-dynamics/
Yong, A. G., and Pearce, S. (2013). A Beginner’s Guide to Factor Analysis: Focusing on
Exploratory Factor Analysis. Tutorials in Quantitative Methods for Psychology, 9(2), 79–94.
Zhang, Y., and Li, H. (2010). Innovation search of new ventures in a technology cluster: The
role of ties with service intermediaries. Strategic Management Journal, 31(1), 88–109.
Related Documents