The FAST-REFERENCE PROBLEM SOLVER for EXECUTIVES and ACCOUNTANTS Steven M. Bragg Includes: ■ Capital budgeting techniques ■ Foreign exchange risk management ■ Essential GAAP ■ Working capital management techniques ■ Stock registration alternatives ■ Key performance metrics THE VEST POCKET Controller VEST POCKET Controller

Welcome message from author
This document is posted to help you gain knowledge. Please leave a comment to let me know what you think about it! Share it to your friends and learn new things together.
Transcript
The all-new fast-reference problem solver
Accounting
T he Vest Pocket Controller is the handy pocket pr oblem solver that gives today’s busy executives and accountants the helpful
information they need in a quick-r eference format.
Whether in public practice or priv ate industr y, professionals will always have this reliable reference tool at their fingertips because it easily goes anywhere—to a client ’s office, on a business trip , or to an important lunch meeting.
Providing concise answ ers to the questions y ou ar e most likely to encounter during a typical business day , The V est Pocket Controller covers:
• The most heavily used GAAP accounting standar ds• The management areas a controller is likely to encounter• A variety of financial analysis topics with a par ticular focus on bottleneck analysis
• Metrics a controller is most likely to need, along with helpful examples
• The primary control systems you need to ensure your transactions are as error-free as possible
• How to analyze capital budgeting proposals so that only truly necessary assets are acquired
Packed with practical techniques and rules of thumb for analyzing, evaluating, and solving the day-to-day pr oblems ev ery contr oller faces, The Vest Pocket Controller helps y ou quickly pinpoint what to look for, what to watch out for , what to do, and ho w to do it. Its easy-to-use Q & A format offers hundr eds of explanations sup-ported by a multitude of examples, tables, char ts, and ratios.
Convenient and compr ehensive, The Vest P ocket Contr oller is a powerful companion for the ever-changing world of the controller.
STEVEN M. BRA GG, CPA, has been the chief financial officer or controller of four companies, as w ell as a consulting manager at E rnst & Young and auditor at D eloitte. H e is the author of over thir ty books primarily targeted to ward controllers and their needs. B ragg r eceived a master ’s degr ee in finance fr om Bentley College, an MBA from Babson College, and a bachelor ’s degree in economics from the University of Maine.
The FAST-REFERENCE PROBLEM SOLVER for EXECUTIVES and ACCOUNTANTS
Steven M. Bragg
Includes:■ Capital budgeting techniques■ Foreign exchange risk management■ Essential GAAP■ Working capital management techniques■ Stock registration alternatives■ Key performance metrics
THEVESTPOCKET
Controller
PMS 279 PMS 2623 GLOSSY
THE VEST POCKET Controller
Bragg
$29.95 USA/$35.95 CAN

E1BINDEX 03/10/2010 Page 418
E1FFIRS 03/04/2010 Page 1
Additional Praise for The Vest Pocket Controller
``The Vest Pocket Controller presents the accounting com-munity with a fantastic resource that provides relevantand concise guidance. The question-and-answer formatallows the reader the opportunity to find the answer andreview the accounting treatment with some additionalinsight and commentary. The Vest Pocket Controller is anindispensable guide for all accountants.''
—Josh Nowack, CPA, MBA, Nowack StrategicBusiness Advisory & CPA
``The Vest Pocket Controller provides important informa-tion in an easy-to-use format. This book should be re-quired reading for anyone in an accounting or financerole as it is a resource that will be referenced time andagain. Since reading the book for the first time, I find my-self referring to its content on a regular basis. Not onlywill you find The Vest Pocket Controller in my vest pocket,but I will also be giving it to everyone in my accountingdepartment.
—Steven Randall, Managing Partner, Vonya Global LLC
``This book is a quick reference guide for a controller. Itprovides clear and concise answers with explanations tothe various questions a controller may have in his day-to-day operations, with plenty of examples. A valuable addi-tion to any controller’s library.''
—Priya K Srinvasan, Owner, Priya K Srinivasan CPA
``The Vest Pocket Controller is a comprehensive, incrediblywell-organized reference for controllers and accountingprofessionals alike complete with real-world scenariosand easy-to-follow journal entries. Once again, StevenBragg has put together a must-have accounting ‘cheatsheet’ for CPAs, accountants, and all level of financeprofessionals.''
—Adrienne Gonzalez, Founding Editor,JrDeputyAccountant.com
``Steve provides a clear and effective guide for readersfrom accountants to financial managers. This book coverskey topics concisely and clearly and earns a place as a keyreference book.''
—Paul Apodaca, Principal at Apodaca Consultingand Finance Manager, WONIK Quartz International

E1FFIRS 03/04/2010 Page 2

E1FFIRS 03/04/2010 Page 3
TheVestPocketController

E1FFIRS 03/04/2010 Page 4

E1FFIRS 03/04/2010 Page 5
THEVESTPOCKETCONTROLLER
Steven M. Bragg
John Wiley & Sons, Inc.
E1FFIRS 03/04/2010 Page 6
Copyright# 2010 by John Wiley & Sons, Inc. All rights reserved.
Published by John Wiley & Sons, Inc., Hoboken, New Jersey.
Published simultaneously in Canada.
No part of this publication may be reproduced, stored in a retrievalsystem, or transmitted in any form or by any means, electronic,mechanical, photocopying, recording, scanning, or otherwise, except aspermitted under Section 107 or 108 of the 1976 United States CopyrightAct, without either the prior written permission of the Publisher, orauthorization through payment of the appropriate per-copy fee to theCopyright Clearance Center, Inc., 222 Rosewood Drive, Danvers, MA01923, (978) 750-8400, fax (978) 646-8600, or on the web at www.copyright.com. Requests to the Publisher for permission should be addressed to thePermissions Department, John Wiley & Sons, Inc., 111 River Street,Hoboken, NJ 07030, (201) 748-6011, fax (201) 748-6008, or online at www.wiley.com/go/permissions.
Limit of Liability/Disclaimer of Warranty: While the publisher and authorhave used their best efforts in preparing this book, they make norepresentations or warranties with respect to the accuracy or completenessof the contents of this book and specifically disclaim any impliedwarranties of merchantability or fitness for a particular purpose. Nowarranty may be created or extended by sales representatives or writtensales materials. The advice and strategies contained herein may not besuitable for your situation. You should consult with a professional whereappropriate. Neither the publisher nor author shall be liable for any loss ofprofit or any other commercial damages, including but not limited tospecial, incidental, consequential, or other damages.
For general information on our other products and services or for technicalsupport, please contact our Customer Care Department within the UnitedStates at (800) 762-2974, outside the United States at (317) 572-3993 or fax(317) 572-4002.
Wiley also publishes its books in a variety of electronic formats. Somecontent that appears in print may not be available in electronic books. Formore information about Wiley products, visit our web site atwww.wiley.com.
Library of Congress Cataloging-in-Publication DataBragg, Steven M.
The vest pocket controller/Steven M. Bragg.p. cm.
Includes index.ISBN 978-0-470-59373-8 (pbk.)
1. Managerial accounting. 2. Corporations–Accounting.3. Accounting. I. Title.HF5657.4.B723 2010658.15'11–dc22
2009051056
Printed in the United States of America
10 9 8 7 6 5 4 3 2 1
E1FTOC 03/10/2010 Page 7
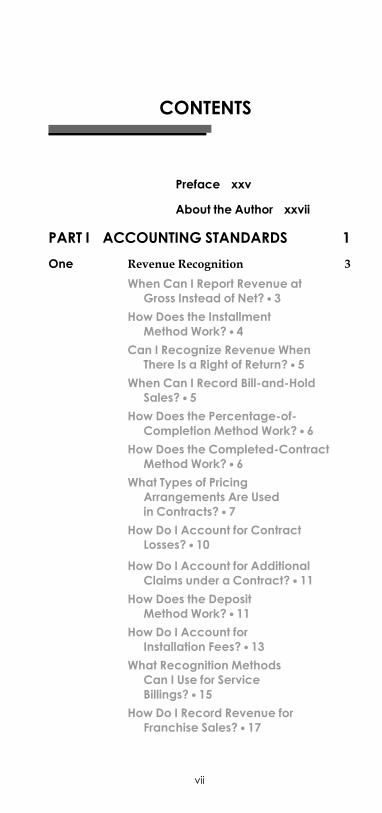
CONTENTS
Preface xxv
About the Author xxvii
PART I ACCOUNTING STANDARDS 1
One Revenue Recognition 3
When Can I Report Revenue atGross Instead of Net? � 3
How Does the InstallmentMethod Work? � 4
Can I Recognize Revenue WhenThere Is a Right of Return? � 5
When Can I Record Bill-and-HoldSales? � 5
How Does the Percentage-of-Completion Method Work? � 6
How Does the Completed-ContractMethod Work? � 6
What Types of PricingArrangements Are Usedin Contracts? � 7
How Do I Account for ContractLosses? � 10
How Do I Account for AdditionalClaims under a Contract? � 11
How Does the DepositMethod Work? � 11
How Do I Account forInstallation Fees? � 13
What Recognition MethodsCan I Use for ServiceBillings? � 15
How Do I Record Revenue forFranchise Sales? � 17
vii
E1FTOC 03/10/2010 Page 8
Two Investment Accounting 19
Which Securities Are Designatedas Marketable EquitySecurities? � 19
What Is the Accounting forMarketable Equity Securities? � 19
What Is the Accounting for Transfersbetween Available-for-Sale andTrading Investments? � 22
What Is the Accounting forInvestments in Debt Securities? � 24
What Is the Accounting for DebtSecurities among Portfolios? � 25
How Are Deferred Tax EffectsRecognized for Changes inInvestment Valuation? � 26
What Is the Accounting for SignificantEquity Investments? � 26
What Is the Accounting for anInvestment Amortization? � 29
What Is the Accounting for anEquity Method InvestmentImpairment? � 29
When Is the Equity MethodNo Longer Used? � 30
What Are the Key Decisions forRecording Gains or Losseson Securities? � 30
Three Inventory Accounting 33
How Do I Account for Goodsin Transit? � 33
How Does Inventory OwnershipVary under Different DeliverySituations? � 33
How Do I Account for ConsignedInventory? � 34
What Overhead Do I Allocateto Inventory? � 35
How Do I Account for the Lowerof Cost or Market Rule? � 36
How Does the First-in, First-outValuation Method Work? � 38
viii Contents
E1FTOC 03/10/2010 Page 9
What Are the Advantagesand Disadvantages of FIFOValuation? � 40
How Does the Last-in, First-outValuation Method Work? � 41
What Are the Advantages andDisadvantages of LIFOValuation? � 43
How Does the Dollar-Value LIFOValuation Method Work? � 44
How Does the Link-ChainValuation Method Work? � 46
How Does the Weighted-AverageValuation Method Work? � 49
Four Fixed Asset Accounting 53
What Is Included in the CapitalizedCost of a Fixed Asset? � 53
What Is the Price of a PurchasedFixed Asset? � 53
What Is the Price of a FixedAsset Obtained through anExchange? � 54
What Is the Price of a Fixed AssetObtained with a Trade-in? � 55
What Is the Price of a Group ofFixed Assets? � 57
What Is the Accounting forImprovements to FixedAssets? � 58
How Is Interest Associated witha Fixed Asset Capitalized? � 59
What Is the Accounting for a FixedAsset Disposition? � 61
What Is the Accounting for an AssetRetirement Obligation? � 62
What Is the Accounting forDonated Assets? � 64
What Is the Accounting forConstruction in Progress? � 65
What Is the Accounting for Land? � 66What Is the Accounting for Leasehold
Improvements? � 66
Contents ix
E1FTOC 03/10/2010 Page 10
How Is an Asset’s Depreciation BasisCalculated? � 66
What Are the General DepreciationConcepts? � 67
How Is Straight-Line DepreciationCalculated? � 68
How Is Double-Declining BalanceDepreciation Calculated? � 68
How Is Sum-of-the-Years’ DigitsDepreciation Calculated? � 69
How Is Units-of-ProductionDepreciation Calculated? � 70
What Is the Accounting forAsset Impairment? � 71
What Is the Accounting forIntangible Assets? � 72
Five Debt Accounting 75
When Is Debt Categorized asShort-Term or Long-Term? � 75
How Are Bonds Sold at a Discountor Premiu1m Recorded? � 76
What Is the EffectiveInterest Method? � 77
How Is Debt Issued with No StatedInterest Rate Recorded? � 79
How Are Debt Issuance CostsRecorded? � 79
How Is a Debt Issuance withAttached Rights Recorded? � 80
How Is a Debt Issuance forProperty Recorded? � 81
How Is a Debt ExtinguishmentRecorded? � 82
How Is a Temporary or PermanentBond Default Recorded? � 83
How Is a Restructured BondObligation Recorded? � 83
How Is an Asset Transfer to EliminateDebt Recorded? � 83
How Is Convertible DebtRecorded? � 84
x Contents
E1FTOC 03/10/2010 Page 11
How Is Debt Issued with StockWarrants Recorded? � 86
Six Stockholders' Equity 87
What Is Par Value? � 87How Is Stock Valued that Is Issued
for Property or Services? � 87What Are the Characteristics of
Preferred Stock? � 88What Is Convertible Preferred
Stock? � 88What Is a Stock Split? � 89What Is a Stock Subscription? � 90What Is Retained Earnings? � 91What Is a Stock Warrant? � 92What Are the Key Dates
Associated with Dividends? � 93What Is a Property Dividend? � 93What Is a Stock Dividend? � 94What Is a Liquidating
Dividend? � 95What Is Treasury Stock? � 96What Is the Constructive
Retirement Method? � 97What Is a Stock Option? � 97How Is a Stock Option Recorded
under the Intrinsic ValueMethod? � 97
How Is a Stock Option Recordedunder the Fair Value Method? � 99
How Do Option Expirations ImpactCompensation Expense? � 100
What Happens When an OptionExpires? � 101
What Happens if the CompanyBuys Options from the OptionHolder? � 101
How Is the Option Vesting PeriodRecognized? � 101
What Are Stock AppreciationRights? � 103
Contents xi
E1FTOC 03/10/2010 Page 12
How Do I Account for StockAppreciation Rights? � 103
How Does an Employee StockOwnership Plan Work? � 104
Seven Lease Accounting 107
What Is the Accounting foran Operating Lease by theLessee? � 107
What Is the Accounting for aCapital Lease by theLessee? � 108
How Does the Lessor Accountfor an Operating Lease? � 111
How Does the Lessor Accountfor a Sales-Type Lease? � 111
How Does the Lessor Account fora Direct Financing Lease? � 114
What Is the Accounting for aLease Termination? � 118
What Is the Accounting for a LeaseExtension by the Lessee? � 118
What Is the Accounting for a LeaseExtension by the Lessor? � 119
What Is the Accounting for aSublease? � 119
What Is the Accounting for a Sale-Leaseback Transaction? � 119
Eight Foreign Currency Accounting 121
What Is the Goal of ForeignCurrency Accounting? � 121
How Does the Current RateMethod Convert ForeignCurrency Transactions intoU.S. Dollars? � 121
How Does the RemeasurementMethod Convert ForeignCurrency Transactions intoU.S. Dollars? � 124
What Conversion Method Is Usedfor Occasional ForeignCurrency Transactions? � 126
xii Contents
E1FTOC 03/10/2010 Page 13
How Do I Decide Which ConversionMethod to Use? � 127
What Is the Accounting for ForeignCurrency TranslationAdjustments? � 127
What Exchange Rates Are Usedfor Conversion Calculations? � 128
How Is Foreign ExchangeHandled in IntercompanyTransactions? � 129
PART II ACCOUNTINGMANAGEMENT 131
Nine Closing the Books 133
What Types of Closes Are There? � 133What Problems Contribute to a
Delayed Close? � 133How Does Activity Acceleration
Improve the Close? � 134How Do Reporting Changes
Improve the Close? � 135How Can Journal Entry
Optimization Improve theClose? � 136
How Can I Improve theInventory Close? � 136
How Can I Improve thePayroll Close? � 137
How Can I Improve thePayables Close? � 137
What is Included in a ClosingChecklist? � 138
What Extra Closing StepsAre Needed by a PublicCompany? � 139
Ten Cash Management 141
What Types of Float Are Associatedwith a Check Payment? � 141
What Is Value Dating? � 143What Is a Lockbox? � 143What Is Remote Deposit
Capture? � 143
Contents xiii
E1FTOC 03/10/2010 Page 14
Why Is Cash ConcentrationUseful? � 144
What Strategies Are Availablefor Cash Concentration? � 144
What Is Physical Sweeping? � 145When Do Sweeps Occur? � 146When Are Intercompany Loans
Linked to Cash Sweeps? � 147What Is Notional Pooling? � 147What Is a Bank Overlay
Structure? � 148What Short-Term Investment
Options Are Available? � 148What Investment Strategies
Are Used for Short-TermInvestments? � 150
Eleven Receivables Management 153
How Do I Create and Maintaina Credit Policy? � 153
How Do I Obtain FinancialInformation AboutCustomers? � 154
How Does a Credit-GrantingSystemWork? � 155
What Payment Terms ShouldI Offer to Customers? � 156
When Should I Review CustomerCredit Levels? � 157
How Can I Adjust the InvoiceContent and Layout toImprove Collections? � 157
How Can I Adjust Billing Deliveryto Improve Collections? � 158
Should I Offer Early PaymentDiscounts? � 159
How Do I Optimize CustomerContacts? � 159
How Do I Manage CollectionInformation? � 160
How Do I Handle PaymentDeductions? � 161
xiv Contents
E1FTOC 03/10/2010 Page 15
How Do I Collect OverduePayments? � 162
When Should I Take Legal Action toCollect from a Customer? � 164
Twelve Inventory Management 165
How Do I Increase the Accuracyof Inventory Records? � 165
How Do I Reduce the Number ofStock-Keeping Units inInventory? � 168
How Do I Reduce InventoryPurchases? � 169
How Do I Compress InventoryStorage Space? � 170
How Do I Avoid Inventory Losses onShort Shelf Life Items? � 171
How Do I Improve PickingEfficiency? � 171
How Do I Store Inventory toReduce Picking Travel? � 173
How Do I Reduce InventoryScrap? � 173
How Do I Identify ObsoleteInventory? � 174
How Do I Sell ObsoleteInventory? � 176
Thirteen Debt Management 177
What Is Commercial Paper? � 177What Is Factoring? � 177What Is Accounts Receivable
Financing? � 178What Is Field Warehouse
Financing? � 178What Is Floor Planning? � 179What Is an Operating Lease? � 179What Is a Capital Lease? � 180What Is a Line of Credit? � 180What Is a Bond? � 180What Types of Bonds Can
Be Issued? � 181
Contents xv
E1FTOC 03/10/2010 Page 16
What Is a Bridge Loan? � 182What Is Receivables
Securitization? � 182What Is a Sale and Leaseback
Arrangement? � 183How Does One Interact with Credit
Rating Agencies? � 184How Do the Credit Rating
Agency Scores Compareto Each Other? � 185
Forteen Equity Registration 187
What Methods Are Used toRegister Stock for Sale? � 187
What Are the Contents of aForm S-1? � 187
When Is a Form S-3 Used? � 189When Is a Form S-8 Used? � 190What Is a Shelf Registration? � 191Why Must a Registration Statement
Be Declared Effective? � 192When Can the Regulation
A Exemption Be Used? � 192What Are the Advantages of Using
a Regulation A Exemption? � 193What Is the Process for Using the
Regulation A Exemption? � 193What Are the Restrictions on
Using the RegulationD Exemption? � 194
When Can Rule 144 be Usedto Register Stock? � 195
PART III FINANCIAL ANALYSIS 197
Fifteen Financial Analysis 199
How Do I Calculate theBreakeven Point? � 199
What Is the Impact of Fixed Costson the Breakeven Point? � 200
What Is the Impact of VariableCost Changes on the BreakevenPoint? � 201
xvi Contents
E1FTOC 03/10/2010 Page 17
How Do Pricing Changes Alterthe Breakeven Point? � 202
How Can the Product Mix AlterProfitability? � 203
How Do I Calculate PriceVariances? � 204
How Do I Calculate EfficiencyVariances? � 206
How Do I Conduct a ProfitabilityAnalysis for Services? � 207
How Are Profits Affected by theNumber of Days in a Month? � 210
Which Research and DevelopmentProjects Should be Funded? � 211
How Do I Create a ThroughputAnalysis Model? � 213
How Do I Determine if MoreVolume at a Lower PriceCreates More Profit? � 216
Should I Outsource Production? � 218Should I Add Staff to the Bottleneck
Operation? � 220Should I Produce a New Product? � 222
Sixteen Pricing Analysis 227
What Is the Lowest Price that IShould Accept? � 227
How Do I Set Long-Range Prices? � 229How Should I Set Prices over the
Life of a Product? � 231How Should I Set Prices against
a Price Leader? � 232How Do I Handle a Price War? � 233How Do I Handle Dumping by
a Foreign Competitor? � 234When Is Transfer Pricing
Important? � 235How Do Transfer Prices Alter
Corporate Decision Making? � 235How Does the External Market
Price Work as a Transfer PricingMethod? � 236
Contents xvii
E1FTOC 03/10/2010 Page 18
How Does Adjusted Market PricingWork as a Transfer PricingMethod? � 237
How Do Negotiated Transfer PricesWork as a Transfer PricingMethod? � 238
How Does the Contribution MarginWork as a Transfer PricingMethod? � 239
How Does the Cost-Plus MethodWork as a Transfer PricingMethod? � 240
How Do the Transfer PricingMethods Compare toEach Other? � 242
Seventeen Cost Reduction Analysis 243
What Reports Are Used for CostReduction Projects? � 243
What Is Spend Analysis? � 244How Is the Spend Database
Constructed? � 247How Does Supplier Consolidation
Work? � 248How Does Parts Consolidation
Work? � 250Can Spend Analysis Work for
MRO Items? � 250What Is Spend Compliance? � 251Which Reports Should Be Used
for Spend Analysis? � 252What Is the Analysis for a
Workforce Reduction? � 255What Is the Cost of a Workforce
Reduction? � 260What Are the Alternatives to a
Workforce Reduction? � 261How Does 5S Analysis Reduce
Costs? � 262How Are Check Sheets Used? � 263How Is Error Quantification
Used? � 265
xviii Contents
E1FTOC 03/10/2010 Page 19
How Is Fixed Cost AnalysisUsed? � 265
How Are Ishikawa DiagramsUsed? � 266
How Is Value StreamMappingUsed? � 266
What Is Waste Analysis? � 268
Eighteen Metrics 271
How Do I Calculate AccountsPayable Turnover? � 271
How Do I Calculate AccountsReceivable Turnover? � 272
How Do I Calculate theAverage ReceivableCollection Period? � 273
How Do I Calculate the Cash-to-Working-Capital Ratio? � 275
How Do I Calculate the CoreGrowth Rate? � 276
How Do I Calculate the Cost ofCapital? � 277
How Do I Calculate the CurrentRatio? � 280
How Do I Calculate CustomerTurnover? � 281
How Do I Calculate the DebtCoverage Ratio? � 283
How Do I Calculate the Debt-to-Equity Ratio? � 284
How Do I Calculate the DividendPayout Ratio? � 285
How Do I Calculate EconomicValue Added? � 286
How Do I Calculate ExpenseCoverage Days? � 289
How Do I Calculate Fixed ChargeCoverage? � 290
How Do I Calculate InventoryAccuracy? � 292
How Do I Calculate InventoryTurnover? � 294
Contents xix
E1FTOC 03/10/2010 Page 20
How Do I Calculate the Marginof Safety? � 296
How Do I Calculate Net Worth? � 297How Do I Calculate the Price/
Earnings Ratio? � 299How Do I Calculate the
Quick Ratio? � 300How Do I Calculate Times
Interest Earned? � 301How Do I Calculate Working
Capital Productivity? � 303
PART IV CONTROL SYSTEMS 305
Nineteen Budgeting 307
Why Is Budgeting Important? � 307How Do the Various Budgets
Fit Together? � 307How Is the Revenue Budget
Constructed? � 310How Are the Production
and Inventory BudgetsConstructed? � 312
How Is the Purchasing BudgetConstructed? � 314
How Is the Direct Labor BudgetConstructed? � 314
How Is the Overhead BudgetConstructed? � 318
How Is the Cost of Goods SoldBudget Constructed? � 318
How Is the Sales DepartmentBudget Constructed? � 323
How Is the Marketing BudgetConstructed? � 323
How Is the General andAdministrative BudgetConstructed? � 326
How Is the Staffing BudgetConstructed? � 326
How Is the Facilities BudgetConstructed? � 326
xx Contents
E1FTOC 03/10/2010 Page 21
How Is the Research DepartmentBudget Constructed? � 332
How Is the Capital BudgetConstructed? � 332
How Are the Budgeted FinancialStatements Constructed? � 336
How Is the Financing BudgetConstructed? � 336
What Is a Flex Budget? � 340
Twenty Capital Budgeting 341
What Is Capital Budgeting? � 341What Are the Problems with Capital
Budgeting Analysis? � 341Why Focus on Bottleneck
Investments? � 342When Should I Invest in a
Bottleneck Operation? � 343What Capital Budgeting Application
Form Should I Use? � 344Should I Invest in Upstream
Workstations? � 345Should I Invest in Downstream
Workstations? � 346Should I Lease an Asset or
Buy It? � 347What Is Net Present Value? � 349What Cash Flows Are Included
in a Net Present ValueCalculation? � 350
What Is Investment Payback? � 351
Twenty-One Control Systems 355
What Are the Controls for aComputerized AccountsPayable System? � 355
What Are the Controls forProcurement Cards? � 357
What Are the Controls for OrderEntry, Credit, and Shipping? � 359
What Are the Controls for Drop-Shipped Orders? � 361
Contents xxi
E1FTOC 03/10/2010 Page 22
What Are the Controls for aPerpetual InventoryTracking System? � 362
What Are the Controls for Billing? � 364What Are the Controls for
Collections? � 367What Are the Controls for
Check Receipts? � 370What Are the Controls for
Investments? � 372What Are the Controls for
Payroll? � 374
PART V PUBLIC COMPANYACCOUNTING 379
Twenty-Two SEC Filings 381
What Is the Form 8-K? � 381What Information Is
Included in the Annual andQuarterly Reports? � 388
When Must Annual and QuarterlyReports be Filed? � 391
What Is the Form S-1? � 391What Is the Form S-3? � 393What Is the Form S-8? � 394What Forms Require a Payment
to the SEC? � 394How Do I Make a Fedwire
Payment? � 395
Twenty-Three Public Company Accounting Topics 397
When Is Interim ReportingRequired? � 397
What Is the Integral View ofInterim Reporting? � 397
What Is the Discrete View ofInterim Reporting? � 398
How Are Changes in AccountingPrinciple and EstimateAccounted for in InterimPeriods? � 398
xxii Contents

E1FTOC 03/10/2010 Page 23
When Is Segment InformationRequired? � 398
How Are Reportable SegmentsDetermined? � 399
How Is Basic Earnings per ShareCalculated? � 401
How Is Diluted Earnings per ShareCalculated? � 403
What Methods Are Used forCalculating Diluted Earningsper Share? � 403
How Should Non-GAAPInformation Be Disclosed? � 404
Index 405
Contents xxiii

E1FTOC 03/10/2010 Page 24
E1FPREF 03/04/2010 Page 25
PREFACE
This is a handy pocket problem solver for the controller.It covers the multitude of areas that a controller may ad-dress during the working day—accounting standards,management issues, financial analysis, controls, and evenhow to handle a variety of public company issues. It doesso with hundreds of concise explanations that are sup-ported by a multitude of examples, tables, charts, and ra-tios. The layout is designed for quick comprehension ofsuch questions as:
m Should I report revenue at gross or net?m What are the different types of marketable securities,
and how do I account for them?m How do I use the FIFO and LIFO inventory valua-
tion methods?m How do I account for bond discounts and premiums?m How do I record a treasury stock transaction?m When is a lease a capital lease?m How do I convert foreign currency transactions into
the home currency?m How do I achieve a fast close?m How do I set up cash sweeping or notional pooling?m How do I create a perpetual inventory system?m What exemptions are available for stock registrations?m How do I create a throughput analysis model?m How do I set long-range prices?m How do I create a spend analysis system?m Should I lease an asset or buy it?m What controls should I implement for the core
accounting systems?
Part I (Chapters 1–8) covers the most heavily usedGAAP accounting standards. These standards are segre-gated into the topics of revenue recognition, investments,inventory, fixed assets, debt, stockholders’ equity, leases,and foreign currency accounting. Numerous explanatoryexamples are intermingled with the text.
Part II (Chapters 9–14) addresses a number of manage-ment areas that a controller is likely to encounter. Theseinclude a discussion of the steps needed to close the
xxv
E1FPREF 03/04/2010 Page 26
books, the banking structures needed to marshal cash intothe proper investments, how to accelerate the collection ofreceivables, what can be done to minimize the investmentin inventory, what types of debt are available, and how toregister equity for sale.
Part III (Chapters 15–18) delves into a variety of finan-cial analysis topics, with a particular focus on bottleneckanalysis, how to set prices correctly, and how to reducecosts. Chapter 18 contains a number of the metrics that acontroller is most likely to need, along with helpfulexamples.
Part IV (Chapters 19–21) describes the primary controlsystems that a controller needs to ensure that transactionsare as error-free as possible. It also describes a comprehen-sive budgeting system and how to analyze capital budget-ing proposals so that only truly necessary assets areacquired.
Part V (Chapters 22–23) covers a number of the morecommon reports that must be filed periodically with theSEC as well as the accounting issues that are specific tothe public company: earnings per share, interim reporting,and segment reporting.
Throughout, The Vest Pocket Controller has been struc-tured to provide concise answers to the questions that acontroller is most likely to encounter during a typicalbusiness day. Keep it handy for easy reference and dailyuse.
xxvi Preface
E1FLAST 03/04/2010 Page 27
ABOUT THE AUTHOR
Steven Bragg, CPA, has been the chief financial officer orcontroller of four companies as well as a consulting man-ager at Ernst & Young and auditor at Deloitte & Touche.He received a master’s degree in finance from BentleyCollege, an MBA from Babson College, and a bachelor’sdegree in economics from the University of Maine. He hasbeen the two-time president of the Colorado MountainClub and is an avid alpine skier, mountain biker, and cer-tified master diver. Mr. Bragg resides in Centennial, Colo-rado. He has written the following books through JohnWiley & Sons except where indicated:
Accounting and Finance for Your Small BusinessAccounting Best PracticesAccounting Control Best PracticesAccounting Policies and Procedures ManualAdvanced Accounting Systems (Institute of Internal Auditors)Billing and Collections Best PracticesBusiness Ratios and FormulasThe Controller’s FunctionController’s Guide to CostingController’s Guide to Planning and Controlling OperationsController’s Guide: Roles and Responsibilities for the New
ControllerControllershipCost AccountingCost Reduction AnalysisEssentials of PayrollFast CloseFinancial AnalysisGAAP GuideGAAP Policies and Procedures ManualGAAS GuideInventory AccountingInventory Best PracticesInvestor RelationsJust-in-Time AccountingManagement Accounting Best PracticesManaging Explosive Corporate GrowthMergers and Acquisitions
xxvii

E1FLAST 03/04/2010 Page 28
The New CFO Financial Leadership ManualOutsourcingPayroll AccountingPayroll Best PracticesRevenue RecognitionRun the Rockies (CMC Press)Running a Public CompanySales and Operations for Your Small BusinessThe Ultimate Accountants’ReferenceThe Vest Pocket ControllerThroughput AccountingTreasury Management
xxviii About the Author

E1FLAST 03/04/2010 Page 29
FREE ONLINERESOURCESBY STEVE BRAGG
Mr. Bragg Steve issues a free accounting best practicespodcast. You can sign up for it at www.accountingtools.com, or access it through iTunes.
xxix

E1FLAST 03/04/2010 Page 30

E1C01 03/04/2010 Page 1
PART I
ACCOUNTINGSTANDARDS

E1C01 03/04/2010 Page 2
E1C01 03/04/2010 Page 3
CHAPTER 1
REVENUE RECOGNITION
When Can I Report Revenue at GrossInstead of Net?
Reporting on a ‘‘gross’’ basis is appropriate when theentity takes ownership of the goods being sold to its cus-tomers, with the risks and rewards of ownership accruingto it. For example, if the entity runs the risk of obsolescenceor spoilage during the period it holds the merchandise,gross reporting would normally be appropriate. However,if the entity merely acts as an agent for the buyer or sellerfrom which it earns a commission, ‘‘net’’ reporting wouldbe more appropriate. These factors are indicators that reve-nue should be recorded at its gross amount:
m The company that is the primary obligor in the ar-rangement is the company responsible for the fulfill-ment of the order, including the acceptability of theproduct or service to the customer.
m The company has general inventory risk. This existsif a company takes title to a product before the prod-uct is ordered by a customer or will take title to theproduct if the customer returns it.
m The company has physical loss inventory risk. Thisexists if the title to the product is transferred to thecompany at the shipping point and then transferredto the customer upon delivery.
m The company establishes the selling price.m The company changes the product or performs part
of the service.m The company has multiple suppliers for the product
or service ordered by the customer.m The company is involved in determining the nature,
type, characteristics, or specifications of the productor service by the customer.
m The company has credit risk for the amount billed tothe customer. This exists if the company must pay
3
E1C01 03/04/2010 Page 4
the supplier irrespective of whether the customerhas paid.
A company should record revenue at its net value if apreponderance of the preceding bullet points were not thecase, and especially if it is being paid what is in essence acommission.
How Does the Installment Method Work?
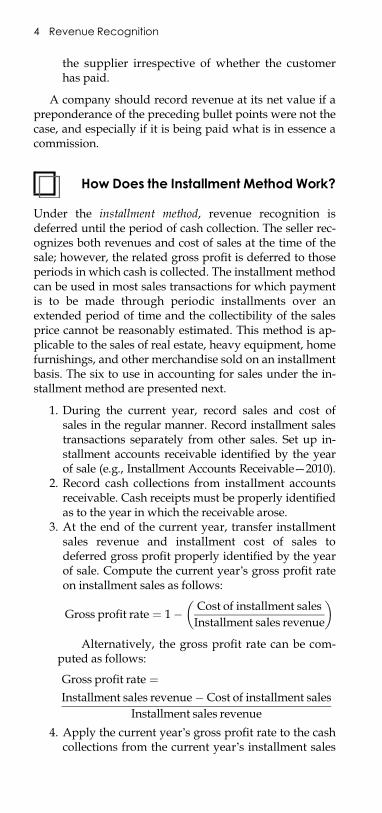
Under the installment method, revenue recognition isdeferred until the period of cash collection. The seller rec-ognizes both revenues and cost of sales at the time of thesale; however, the related gross profit is deferred to thoseperiods in which cash is collected. The installment methodcan be used in most sales transactions for which paymentis to be made through periodic installments over anextended period of time and the collectibility of the salesprice cannot be reasonably estimated. This method is ap-plicable to the sales of real estate, heavy equipment, homefurnishings, and other merchandise sold on an installmentbasis. The six to use in accounting for sales under the in-stallment method are presented next.
1. During the current year, record sales and cost ofsales in the regular manner. Record installment salestransactions separately from other sales. Set up in-stallment accounts receivable identified by the yearof sale (e.g., Installment Accounts Receivable—2010).
2. Record cash collections from installment accountsreceivable. Cash receipts must be properly identifiedas to the year in which the receivable arose.
3. At the end of the current year, transfer installmentsales revenue and installment cost of sales todeferred gross profit properly identified by the yearof sale. Compute the current year’s gross profit rateon installment sales as follows:
Gross profit rate ¼ 1� Cost of installment salesInstallment sales revenue
� �
Alternatively, the gross profit rate can be com-puted as follows:
Gross profit rate ¼Installment sales revenue� Cost of installment sales
Installment sales revenue
4. Apply the current year’s gross profit rate to the cashcollections from the current year’s installment sales
4 Revenue Recognition
E1C01 03/04/2010 Page 5
to compute the realized gross profit from the currentyear’s installment sales.
Realized gross profit ¼Cash collections from current year’s installmentsales� Current year’s gross profit rate
5. Separately apply each of the previous years’ grossprofit rates to cash collections from those years’ in-stallment sales to compute the realized gross profitfrom each of the previous years’ installment sales.
Realized gross profit ¼Cash collections from previous years’ installmentsales� Previous years’ gross profit rate
6. Defer the current year’s unrealized gross profit tofuture years. The deferred gross profit to carry for-ward to future years is computed as follows:
Deferred gross profit ð2010Þ ¼Ending balance installment account receivableð2010Þ �Gross profit rate ð2010Þ
Can I Recognize Revenue When ThereIs a Right of Return?
A company can record revenue from a sales transaction atthe time of the sale if all of the next conditions are met,and the company must accrue any estimated losses (suchas warranty or sales returns) at the same time:
m The sale price is fixed on the sale date.m The buyer is obligated to pay the seller.m The buyer’s payment obligation would not be
changed if the product is subsequently damaged ordestroyed.
m The seller does not have significant future perform-ance obligations connected to the sale.
m The amount of future returns can be reasonablyestimated.
When Can I Record Bill-and-Hold Sales?
In a bill-and-hold situation, a company bills its customerbut stores the sold goods on behalf of the customer. Thisscenario presents a high risk for fraud, since customersmay not agree to or be aware of the sales. Accordingly, all
When Can I Record Bill-and-Hold Sales? 5
E1C01 03/04/2010 Page 6
of the next factors must be present before a bill-and-holdtransaction can be recorded as revenue:
m The customer requests this arrangement.m The customer has a substantial business purpose for
doing so.m There is a fixed delivery schedule to the customer.m The goods are both segregated and ready for shipment.
How Does the Percentage-of-Completion Method Work?
The principal method for recognizing revenue under along-term construction contract is the percentage-of-comple-tion method. It recognizes income as work on a contract (orgroup of closely related contracts) progresses. The re-cognition of revenues and profits is related to costsincurred in providing the services required under thecontract.
Under this method, work in progress (WIP) is accumu-lated in the accounting records. If the cumulative billingsto date under the contract exceed the amount of the WIPplus the portion of the contract’s estimated gross profit at-tributable to that WIP, the contractor recognizes a currentliability captioned ‘‘billings in excess of costs and esti-mated earnings.’’ This liability recognizes the remainingobligation of the contractor to complete additional workprior to recognizing the excess billing as revenue.
If the reverse is true—that is, the accumulated WIP andgross profit earned exceed billings to date—the contractorrecognizes a current asset captioned ‘‘costs and estimatedearnings in excess of billings.’’ This asset represents theportion of the contractor’s revenues under the contractthat have been earned but not yet billed under the con-tract provisions. Where more than one contract exists,these assets and liabilities are determined on a project-by-project basis, with the accumulated assets and liabilitiesbeing separately stated on the balance sheet. Assets andliabilities are not offset unless a right of offset exists. Thus,the net debit balances for certain contracts are not ordinar-ily offset against net credit balances for other contracts.
How Does the Completed-ContractMethod Work?
The completed-contract method recognizes income onlywhen a construction contract is complete or substantially
6 Revenue Recognition
E1C01 03/04/2010 Page 7
complete. It is most commonly used for shorter-durationcontracts or when it is not possible to use the percentage-of-completion method.
Under this method, contract costs and related billingsare accumulated in the accounting records and reportedas deferred items on the balance sheet until the project iscomplete or substantially complete. A contract is regardedas substantially complete if remaining costs of completionare immaterial. When the accumulated costs (WIP) exceedthe related billings, the excess is presented as a current as-set (inventory account). If billings exceed related costs, thedifference is presented as a current liability. This determi-nation is also made on a project-by-project basis with theaccumulated assets and liabilities being stated separatelyon the balance sheet. An excess of accumulated costs overrelated billings is presented as a current asset, and in mostcases an excess of accumulated billings over related costsis presented as a current liability.
What Types of Pricing ArrangementsAre Used in Contracts?
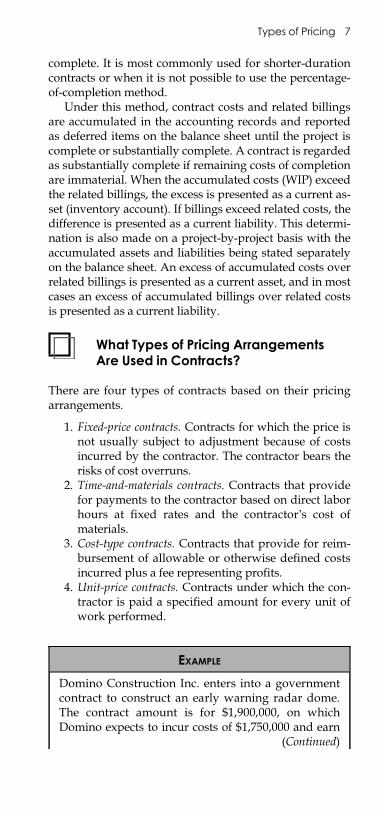
There are four types of contracts based on their pricingarrangements.
1. Fixed-price contracts. Contracts for which the price isnot usually subject to adjustment because of costsincurred by the contractor. The contractor bears therisks of cost overruns.
2. Time-and-materials contracts. Contracts that providefor payments to the contractor based on direct laborhours at fixed rates and the contractor’s cost ofmaterials.
3. Cost-type contracts. Contracts that provide for reim-bursement of allowable or otherwise defined costsincurred plus a fee representing profits.
4. Unit-price contracts. Contracts under which the con-tractor is paid a specified amount for every unit ofwork performed.
EXAMPLE
Domino Construction Inc. enters into a governmentcontract to construct an early warning radar dome.The contract amount is for $1,900,000, on whichDomino expects to incur costs of $1,750,000 and earn
(Continued)
Types of Pricing 7
E1C01 03/04/2010 Page 8
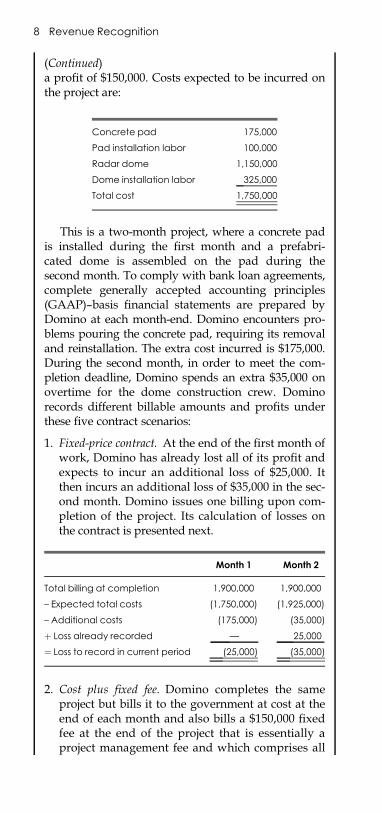
(Continued)a profit of $150,000. Costs expected to be incurred onthe project are:
Concrete pad 175,000
Pad installation labor 100,000
Radar dome 1,150,000
Dome installation labor 325,000
Total cost 1,750,000
This is a two-month project, where a concrete padis installed during the first month and a prefabri-cated dome is assembled on the pad during thesecond month. To comply with bank loan agreements,complete generally accepted accounting principles(GAAP)–basis financial statements are prepared byDomino at each month-end. Domino encounters pro-blems pouring the concrete pad, requiring its removaland reinstallation. The extra cost incurred is $175,000.During the second month, in order to meet the com-pletion deadline, Domino spends an extra $35,000 onovertime for the dome construction crew. Dominorecords different billable amounts and profits underthese five contract scenarios:
1. Fixed-price contract. At the end of the first month ofwork, Domino has already lost all of its profit andexpects to incur an additional loss of $25,000. Itthen incurs an additional loss of $35,000 in the sec-ond month. Domino issues one billing upon com-pletion of the project. Its calculation of losses onthe contract is presented next.
Month 1 Month 2
Total billing at completion 1,900,000 1,900,000
– Expected total costs (1,750,000) (1,925,000)
– Additional costs (175,000) (35,000)
þ Loss already recorded — 25,000
¼ Loss to record in current period (25,000) (35,000)
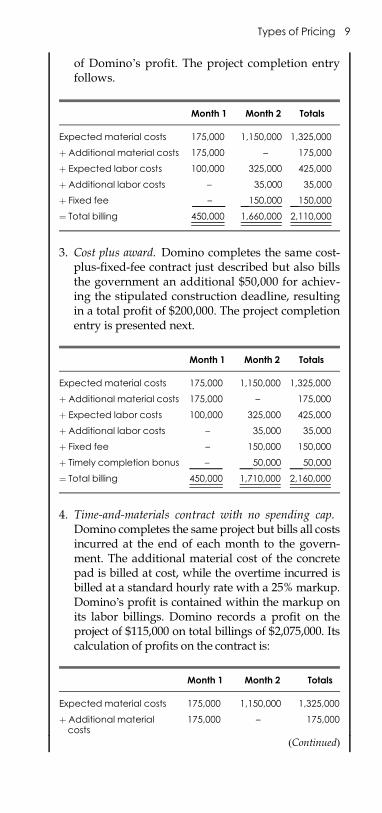
2. Cost plus fixed fee. Domino completes the sameproject but bills it to the government at cost at theend of each month and also bills a $150,000 fixedfee at the end of the project that is essentially aproject management fee and which comprises all
8 Revenue Recognition
E1C01 03/04/2010 Page 9
of Domino’s profit. The project completion entryfollows.
Month 1 Month 2 Totals
Expected material costs 175,000 1,150,000 1,325,000
þ Additional material costs 175,000 – 175,000
þ Expected labor costs 100,000 325,000 425,000
þ Additional labor costs – 35,000 35,000
þ Fixed fee 100–0 150,000 150,000
¼ Total billing 450,000 1,660,000 2,110,000
3. Cost plus award. Domino completes the same cost-plus-fixed-fee contract just described but also billsthe government an additional $50,000 for achiev-ing the stipulated construction deadline, resultingin a total profit of $200,000. The project completionentry is presented next.
Month 1 Month 2 Totals
Expected material costs 175,000 1,150,000 1,325,000
þ Additional material costs 175,000 – 175,000
þ Expected labor costs 100,000 325,000 425,000
þ Additional labor costs – 35,000 35,000
þ Fixed fee – 150,000 150,000
þ Timely completion bonus 100–0 50,000 50,000
¼ Total billing 450,000 1,710,000 2,160,000
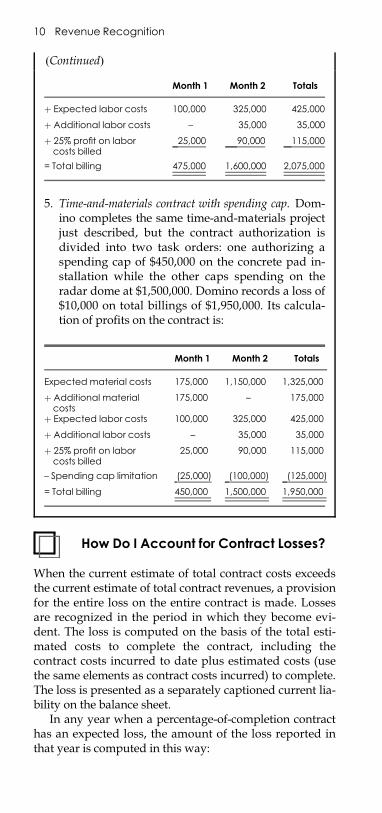
4. Time-and-materials contract with no spending cap.Domino completes the same project but bills all costsincurred at the end of each month to the govern-ment. The additional material cost of the concretepad is billed at cost, while the overtime incurred isbilled at a standard hourly rate with a 25% markup.Domino’s profit is contained within the markup onits labor billings. Domino records a profit on theproject of $115,000 on total billings of $2,075,000. Itscalculation of profits on the contract is:
Month 1 Month 2 Totals
Expected material costs 175,000 1,150,000 1,325,000
þ Additional materialcosts
175,000 – 175,000
(Continued)
Types of Pricing 9
E1C01 03/04/2010 Page 10
How Do I Account for Contract Losses?
When the current estimate of total contract costs exceedsthe current estimate of total contract revenues, a provisionfor the entire loss on the entire contract is made. Lossesare recognized in the period in which they become evi-dent. The loss is computed on the basis of the total esti-mated costs to complete the contract, including thecontract costs incurred to date plus estimated costs (usethe same elements as contract costs incurred) to complete.The loss is presented as a separately captioned current lia-bility on the balance sheet.
In any year when a percentage-of-completion contracthas an expected loss, the amount of the loss reported inthat year is computed in this way:
Month 1 Month 2 Totals
þ Expected labor costs 100,000 325,000 425,000
þ Additional labor costs – 35,000 35,000
þ 25% profit on laborcosts billed
25,000 90,000 115,000
= Total billing 475,000 1,600,000 2,075,000
5. Time-and-materials contract with spending cap. Dom-ino completes the same time-and-materials projectjust described, but the contract authorization isdivided into two task orders: one authorizing aspending cap of $450,000 on the concrete pad in-stallation while the other caps spending on theradar dome at $1,500,000. Domino records a loss of$10,000 on total billings of $1,950,000. Its calcula-tion of profits on the contract is:
Month 1 Month 2 Totals
Expected material costs 175,000 1,150,000 1,325,000
þ Additional materialcosts
175,000 – 175,000
þ Expected labor costs 100,000 325,000 425,000
þ Additional labor costs – 35,000 35,000
þ 25% profit on laborcosts billed
25,000 90,000 115,000
– Spending cap limitation (25,000) (100,000) (125,000)
= Total billing 450,000 1,500,000 1,950,000
(Continued)
10 Revenue Recognition
E1C01 03/04/2010 Page 11
Reported loss ¼Total expected lossþAll profit previously recognized
How Do I Account for Additional Claimsunder a Contract?
Claims represent amounts in excess of the agreed-on con-tract price that a contractor seeks to collect from custom-ers for unanticipated additional costs. The recognition ofadditional contract revenue relating to claims is appro-priate if it is probable that the claim will result in addi-tional revenue and if the amount can be estimatedreliably. All of the next four conditions must exist inorder for the probable and estimable requirements tobe satisfied.
1. The contract or other evidence provides a legal basisfor the claim.
2. Additional costs are not the result of deficiencies inthe contractor’s performance.
3. Additional costs are identifiable and reasonable.4. The evidence supporting the claim is objective and
verifiable, not based on management’s ‘‘feel’’ for thesituation or on unsupported representations.
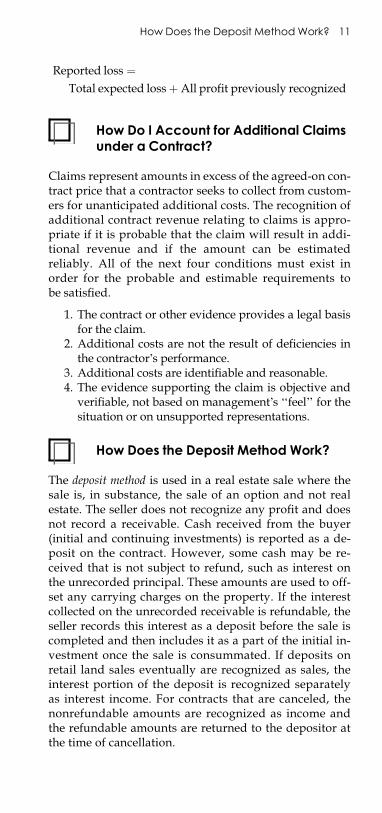
How Does the Deposit Method Work?
The deposit method is used in a real estate sale where thesale is, in substance, the sale of an option and not realestate. The seller does not recognize any profit and doesnot record a receivable. Cash received from the buyer(initial and continuing investments) is reported as a de-posit on the contract. However, some cash may be re-ceived that is not subject to refund, such as interest onthe unrecorded principal. These amounts are used to off-set any carrying charges on the property. If the interestcollected on the unrecorded receivable is refundable, theseller records this interest as a deposit before the sale iscompleted and then includes it as a part of the initial in-vestment once the sale is consummated. If deposits onretail land sales eventually are recognized as sales, theinterest portion of the deposit is recognized separatelyas interest income. For contracts that are canceled, thenonrefundable amounts are recognized as income andthe refundable amounts are returned to the depositor atthe time of cancellation.
How Does the Deposit MethodWork? 11
E1C01 03/04/2010 Page 12
EXAMPLE
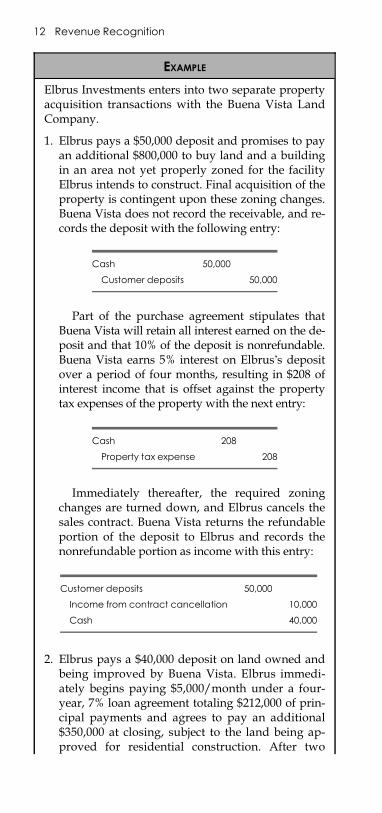
Elbrus Investments enters into two separate propertyacquisition transactions with the Buena Vista LandCompany.
1. Elbrus pays a $50,000 deposit and promises to payan additional $800,000 to buy land and a buildingin an area not yet properly zoned for the facilityElbrus intends to construct. Final acquisition of theproperty is contingent upon these zoning changes.Buena Vista does not record the receivable, and re-cords the deposit with the following entry:
Cash 50,000
Customer deposits 50,000
Part of the purchase agreement stipulates thatBuena Vista will retain all interest earned on the de-posit and that 10% of the deposit is nonrefundable.Buena Vista earns 5% interest on Elbrus’s depositover a period of four months, resulting in $208 ofinterest income that is offset against the propertytax expenses of the property with the next entry:
Cash 208
Property tax expense 208
Immediately thereafter, the required zoningchanges are turned down, and Elbrus cancels thesales contract. Buena Vista returns the refundableportion of the deposit to Elbrus and records thenonrefundable portion as income with this entry:
Customer deposits 50,000
Income from contract cancellation 10,000
Cash 40,000
2. Elbrus pays a $40,000 deposit on land owned andbeing improved by Buena Vista. Elbrus immedi-ately begins paying $5,000/month under a four-year, 7% loan agreement totaling $212,000 of prin-cipal payments and agrees to pay an additional$350,000 at closing, subject to the land being ap-proved for residential construction. After two
12 Revenue Recognition
E1C01 03/04/2010 Page 13
How Do I Account for Installation Fees?
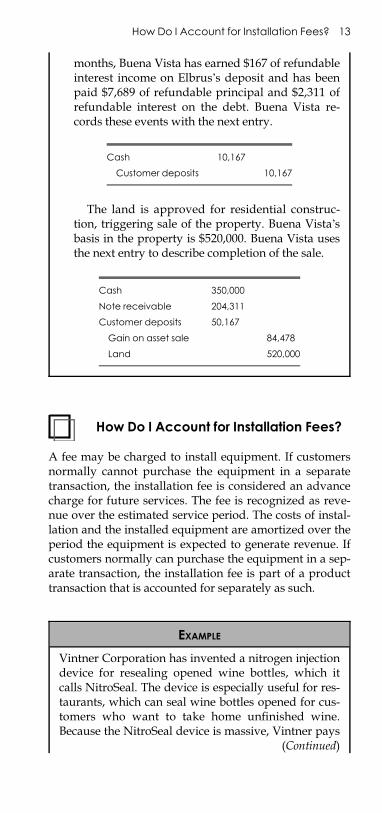
A fee may be charged to install equipment. If customersnormally cannot purchase the equipment in a separatetransaction, the installation fee is considered an advancecharge for future services. The fee is recognized as reve-nue over the estimated service period. The costs of instal-lation and the installed equipment are amortized over theperiod the equipment is expected to generate revenue. Ifcustomers normally can purchase the equipment in a sep-arate transaction, the installation fee is part of a producttransaction that is accounted for separately as such.
months, Buena Vista has earned $167 of refundableinterest income on Elbrus’s deposit and has beenpaid $7,689 of refundable principal and $2,311 ofrefundable interest on the debt. Buena Vista re-cords these events with the next entry.
Cash 10,167
Customer deposits 10,167
The land is approved for residential construc-tion, triggering sale of the property. Buena Vista’sbasis in the property is $520,000. Buena Vista usesthe next entry to describe completion of the sale.
Cash 350,000
Note receivable 204,311
Customer deposits 50,167
Gain on asset sale 84,478
Land 520,000
EXAMPLE
Vintner Corporation has invented a nitrogen injectiondevice for resealing opened wine bottles, which itcalls NitroSeal. The device is especially useful for res-taurants, which can seal wine bottles opened for cus-tomers who want to take home unfinished wine.Because the NitroSeal device is massive, Vintner pays
(Continued)
How Do I Account for Installation Fees? 13
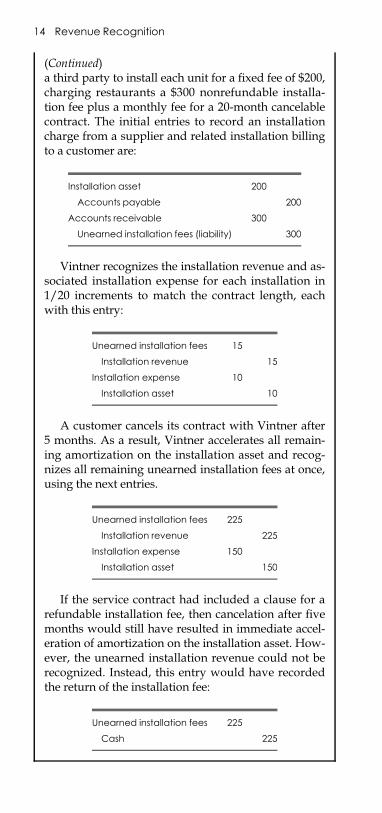
E1C01 03/04/2010 Page 14
(Continued)a third party to install each unit for a fixed fee of $200,charging restaurants a $300 nonrefundable installa-tion fee plus a monthly fee for a 20-month cancelablecontract. The initial entries to record an installationcharge from a supplier and related installation billingto a customer are:
Installation asset 200
Accounts payable 200
Accounts receivable 300
Unearned installation fees (liability) 300
Vintner recognizes the installation revenue and as-sociated installation expense for each installation in1/20 increments to match the contract length, eachwith this entry:
Unearned installation fees 15
Installation revenue 15
Installation expense 10
Installation asset 10
A customer cancels its contract with Vintner after5 months. As a result, Vintner accelerates all remain-ing amortization on the installation asset and recog-nizes all remaining unearned installation fees at once,using the next entries.
Unearned installation fees 225
Installation revenue 225
Installation expense 150
Installation asset 150
If the service contract had included a clause for arefundable installation fee, then cancelation after fivemonths would still have resulted in immediate accel-eration of amortization on the installation asset. How-ever, the unearned installation revenue could not berecognized. Instead, this entry would have recordedthe return of the installation fee:
Unearned installation fees 225
Cash 225
14 Revenue Recognition
E1C01 03/04/2010 Page 15
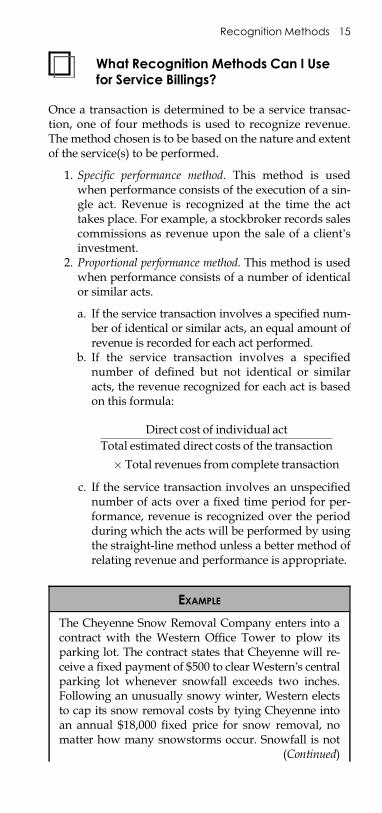
What Recognition Methods Can I Usefor Service Billings?
Once a transaction is determined to be a service transac-tion, one of four methods is used to recognize revenue.The method chosen is to be based on the nature and extentof the service(s) to be performed.
1. Specific performance method. This method is usedwhen performance consists of the execution of a sin-gle act. Revenue is recognized at the time the acttakes place. For example, a stockbroker records salescommissions as revenue upon the sale of a client’sinvestment.
2. Proportional performance method. This method is usedwhen performance consists of a number of identicalor similar acts.
a. If the service transaction involves a specified num-ber of identical or similar acts, an equal amount ofrevenue is recorded for each act performed.
b. If the service transaction involves a specifiednumber of defined but not identical or similaracts, the revenue recognized for each act is basedon this formula:
Direct cost of individual actTotal estimated direct costs of the transaction
� Total revenues from complete transaction
c. If the service transaction involves an unspecifiednumber of acts over a fixed time period for per-formance, revenue is recognized over the periodduring which the acts will be performed by usingthe straight-line method unless a better method ofrelating revenue and performance is appropriate.
EXAMPLE
The Cheyenne Snow Removal Company enters into acontract with the Western Office Tower to plow itsparking lot. The contract states that Cheyenne will re-ceive a fixed payment of $500 to clear Western’s centralparking lot whenever snowfall exceeds two inches.Following an unusually snowy winter, Western electsto cap its snow removal costs by tying Cheyenne intoan annual $18,000 fixed price for snow removal, nomatter how many snowstorms occur. Snowfall is not
(Continued)
Recognition Methods 15
E1C01 03/04/2010 Page 16
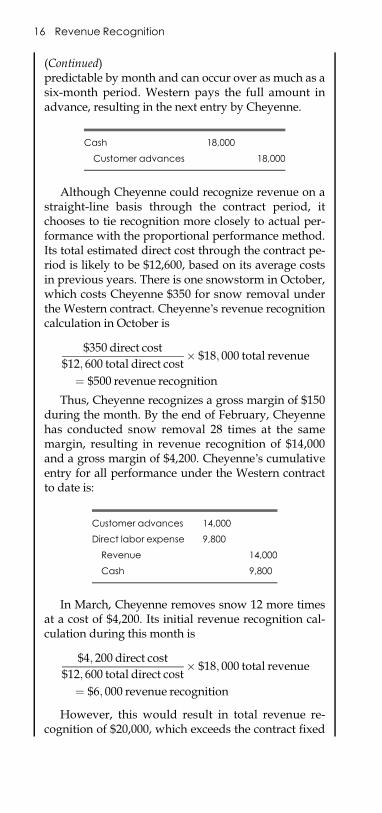
(Continued)predictable by month and can occur over as much as asix-month period. Western pays the full amount inadvance, resulting in the next entry by Cheyenne.
Cash 18,000
Customer advances 18,000
Although Cheyenne could recognize revenue on astraight-line basis through the contract period, itchooses to tie recognition more closely to actual per-formance with the proportional performance method.Its total estimated direct cost through the contract pe-riod is likely to be $12,600, based on its average costsin previous years. There is one snowstorm in October,which costs Cheyenne $350 for snow removal underthe Western contract. Cheyenne’s revenue recognitioncalculation in October is
$350 direct cost$12; 600 total direct cost
� $18; 000 total revenue
¼ $500 revenue recognition
Thus, Cheyenne recognizes a gross margin of $150during the month. By the end of February, Cheyennehas conducted snow removal 28 times at the samemargin, resulting in revenue recognition of $14,000and a gross margin of $4,200. Cheyenne’s cumulativeentry for all performance under the Western contractto date is:
Customer advances 14,000
Direct labor expense 9,800
Revenue 14,000
Cash 9,800
In March, Cheyenne removes snow 12 more timesat a cost of $4,200. Its initial revenue recognition cal-culation during this month is
$4; 200 direct cost$12; 600 total direct cost
� $18; 000 total revenue
¼ $6; 000 revenue recognition
However, this would result in total revenue re-cognition of $20,000, which exceeds the contract fixed
16 Revenue Recognition
E1C01 03/04/2010 Page 17
3. Completed performance method. This method is usedwhen more than one act must be performed andwhen the final act is so significant to the entire trans-action taken as a whole that performance cannot beconsidered to have taken place until the perform-ance of that final act occurs.
4. Collection method. This method is used in circum-stances when there is a significant degree of uncer-tainty surrounding the collection of service revenue.Under this method, revenue is not recognized untilthe cash is collected.
How Do I Record Revenue forFranchise Sales?
Revenue is recognized, with a provision for bad debts,when the franchisor has substantially performed all mate-rial services or conditions. Only when revenue is collectedover an extended period of time and collectibility cannotbe predicted in advance would the use of the installmentmethod of revenue recognition be appropriate. Substan-tial performance means:
m The franchisor has no remaining obligation to eitherrefund cash or forgive any unpaid balance due.
m Substantially all initial services required by theagreement have been performed.
m No material obligations or conditions remain.
If initial franchise fees are large compared to servicesrendered and continuing franchise fees are small com-pared to services to be rendered, a portion of the initial feeis deferred in an amount sufficient to cover the costs offuture services plus a reasonable profit, after consideringthe impact of the continuing franchise fee.
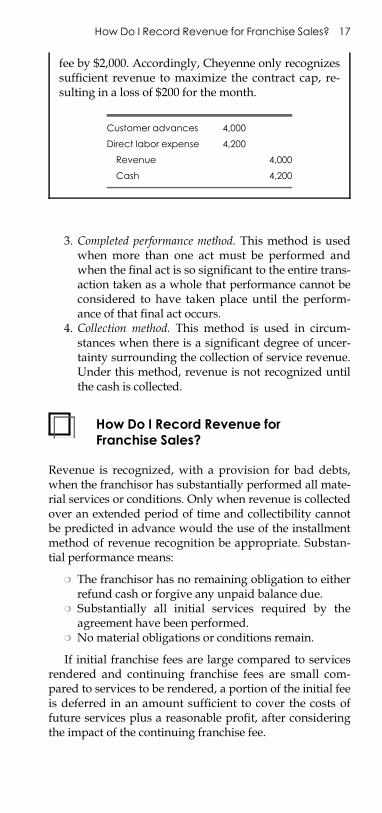
fee by $2,000. Accordingly, Cheyenne only recognizessufficient revenue to maximize the contract cap, re-sulting in a loss of $200 for the month.
Customer advances 4,000
Direct labor expense 4,200
Revenue 4,000
Cash 4,200
How Do I Record Revenue for Franchise Sales? 17
E1C01 03/04/2010 Page 18
EXAMPLE
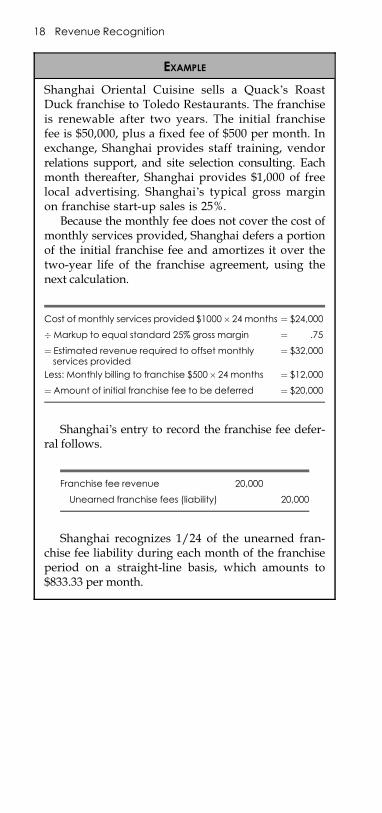
Shanghai Oriental Cuisine sells a Quack’s RoastDuck franchise to Toledo Restaurants. The franchiseis renewable after two years. The initial franchisefee is $50,000, plus a fixed fee of $500 per month. Inexchange, Shanghai provides staff training, vendorrelations support, and site selection consulting. Eachmonth thereafter, Shanghai provides $1,000 of freelocal advertising. Shanghai’s typical gross marginon franchise start-up sales is 25%.
Because the monthly fee does not cover the cost ofmonthly services provided, Shanghai defers a portionof the initial franchise fee and amortizes it over thetwo-year life of the franchise agreement, using thenext calculation.
Cost of monthly services provided$1000� 24 months ¼ $24,000
�Markup to equal standard 25% gross margin ¼ .75
¼ Estimated revenue required to offset monthlyservices provided
¼ $32,000
Less: Monthly billing to franchise $500� 24 months ¼ $12,000
¼ Amount of initial franchise fee to be deferred ¼ $20,000
Shanghai’s entry to record the franchise fee defer-ral follows.
Franchise fee revenue 20,000
Unearned franchise fees (liability) 20,000
Shanghai recognizes 1/24 of the unearned fran-chise fee liability during each month of the franchiseperiod on a straight-line basis, which amounts to$833.33 per month.
18 Revenue Recognition
E1C02 03/04/2010 Page 19
CHAPTER 2
INVESTMENT ACCOUNTING
Which Securities Are Designated asMarketable Equity Securities?
Marketable securities are investments that can be easilyliquidated through an organized exchange, such as theNew York Stock Exchange. If a company also holds secu-rities that are intended for the control of another entity,these securities should be segregated as a long-term in-vestment. Marketable securities must be grouped into oneof three categories at the time of purchase and reevaluatedperiodically to see if they still belong in the designatedcategories:
1. Available for sale. This category includes both debtand equity securities. It contains those securities thatdo not readily fall into either of the next two catego-ries. It can include investments in other companiesthat comprise less than 20% of total ownership.
2. Held to maturity. This category includes only debt se-curities for which the company has both the intentand the ability to hold them until their time ofmaturity.
3. Trading securities. This category includes both debtand equity securities that the company intends tosell in the short term for a profit. It can include in-vestments in other companies comprising less than20% of total ownership.
What Is the Accounting for MarketableEquity Securities?
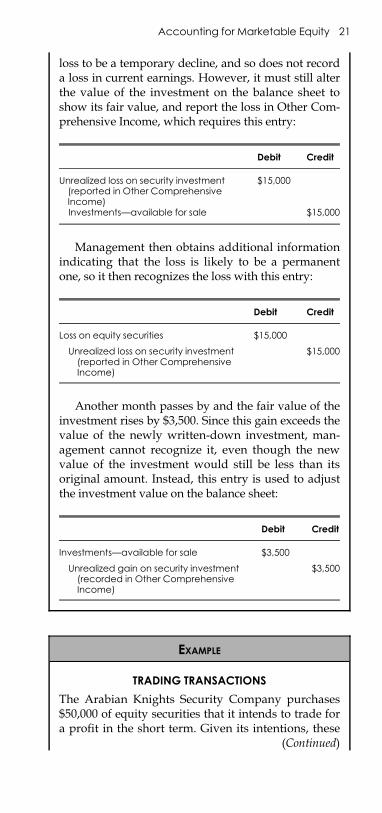
Available-for-sale securities are reported on the balancesheet at their fair value, while unrealized gains and lossesare charged to an equity account and reported in othercomprehensive income in the current period. The balancein the equity account is eliminated only upon sale of the
19
E1C02 03/04/2010 Page 20
underlying securities. If a permanent reduction in thevalue of an individual security occurs, the unrealized lossis charged against earnings, resulting in a new and lowercost basis in the remaining investment. Any subsequentincrease in the value of such an investment above the newcost basis cannot be formally recognized in earnings untilthe related security is sold, and so the interim gains will betemporarily parked in the unrealized gains account in theequity section of the balance sheet.
All interest, realized gains or losses, and debt amorti-zation for available-for-sale securities are recognizedwithin the continuing operations section of the incomestatement. The listing of these securities on the balancesheet under either current or long-term assets is depen-dent on their ability to be liquidated in the short term andto be available for disposition within that time frame, un-encumbered by any obligations.
The amortized cost of held-to-maturity securities is re-corded on the balance sheet. These securities are likely tobe listed on the balance sheet as long-term assets. If mar-ketable securities are shifted into the held-to-maturity cate-gory from debt securities in the available-for-sale category,their unrealized holding gain or loss should continue to bestored in the equity section while being gradually amor-tized down to zero over the remaining life of each security.
Trading securities are recorded on the balance sheet attheir fair value. This type of security is always positionedin the balance sheet as a current asset.
EXAMPLE
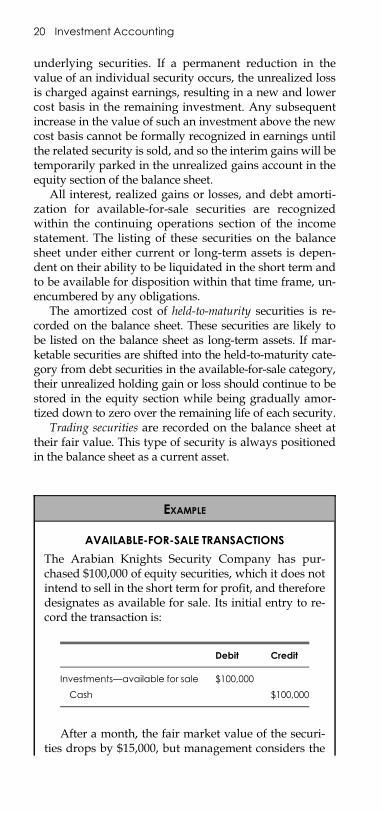
AVAILABLE-FOR-SALE TRANSACTIONS
The Arabian Knights Security Company has pur-chased $100,000 of equity securities, which it does notintend to sell in the short term for profit, and thereforedesignates as available for sale. Its initial entry to re-cord the transaction is:
Debit Credit
Investments—available for sale $100,000
Cash $100,000
After a month, the fair market value of the securi-ties drops by $15,000, but management considers the
20 Investment Accounting
E1C02 03/04/2010 Page 21
loss to be a temporary decline, and so does not recorda loss in current earnings. However, it must still alterthe value of the investment on the balance sheet toshow its fair value, and report the loss in Other Com-prehensive Income, which requires this entry:
Debit Credit
Unrealized loss on security investment(reported in Other ComprehensiveIncome)
$15,000
Investments—available for sale $15,000
Management then obtains additional informationindicating that the loss is likely to be a permanentone, so it then recognizes the loss with this entry:
Debit Credit
Loss on equity securities $15,000
Unrealized loss on security investment(reported in Other ComprehensiveIncome)
$15,000
Another month passes by and the fair value of theinvestment rises by $3,500. Since this gain exceeds thevalue of the newly written-down investment, man-agement cannot recognize it, even though the newvalue of the investment would still be less than itsoriginal amount. Instead, this entry is used to adjustthe investment value on the balance sheet:
Debit Credit
Investments—available for sale $3,500
Unrealized gain on security investment(recorded in Other ComprehensiveIncome)
$3,500
EXAMPLE
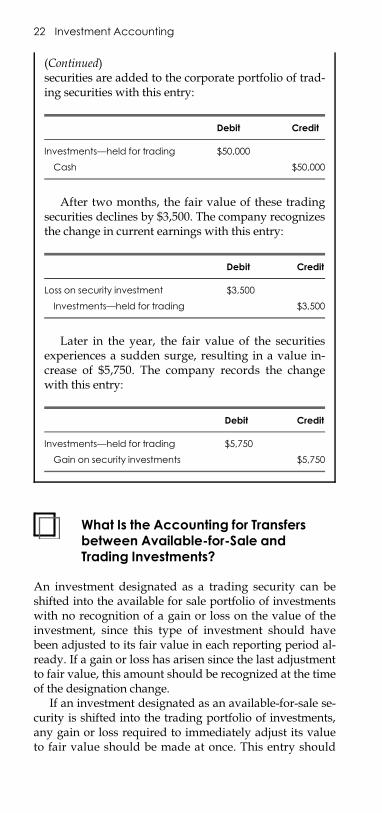
TRADING TRANSACTIONS
The Arabian Knights Security Company purchases$50,000 of equity securities that it intends to trade fora profit in the short term. Given its intentions, these
(Continued)
Accounting for Marketable Equity 21
E1C02 03/04/2010 Page 22
What Is the Accounting for Transfersbetween Available-for-Sale andTrading Investments?
An investment designated as a trading security can beshifted into the available for sale portfolio of investmentswith no recognition of a gain or loss on the value of theinvestment, since this type of investment should havebeen adjusted to its fair value in each reporting period al-ready. If a gain or loss has arisen since the last adjustmentto fair value, this amount should be recognized at the timeof the designation change.
If an investment designated as an available-for-sale se-curity is shifted into the trading portfolio of investments,any gain or loss required to immediately adjust its valueto fair value should be made at once. This entry should
(Continued)securities are added to the corporate portfolio of trad-ing securities with this entry:
Debit Credit
Investments—held for trading $50,000
Cash $50,000
After two months, the fair value of these tradingsecurities declines by $3,500. The company recognizesthe change in current earnings with this entry:
Debit Credit
Loss on security investment $3,500
Investments—held for trading $3,500
Later in the year, the fair value of the securitiesexperiences a sudden surge, resulting in a value in-crease of $5,750. The company records the changewith this entry:
Debit Credit
Investments—held for trading $5,750
Gain on security investments $5,750
22 Investment Accounting
E1C02 03/04/2010 Page 23
include an adjustment from any prior write-down invalue that may have occurred when securities were classi-fied as available for sale.
EXAMPLE
TRANSFER FROM THE TRADING PORTFOLIO TO THE
AVAILABLE-FOR-SALE PORTFOLIO
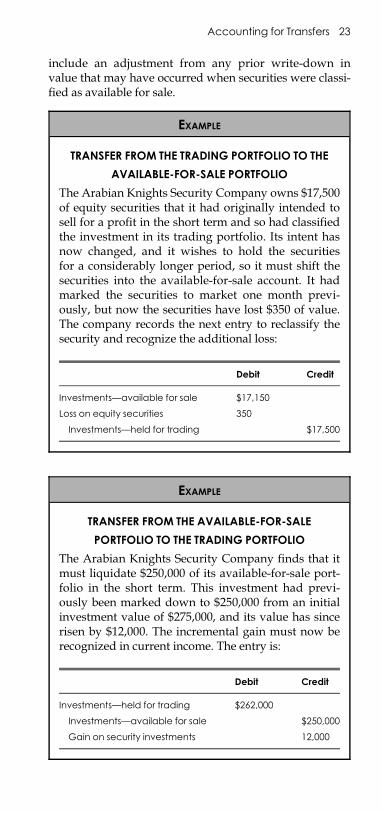
The Arabian Knights Security Company owns $17,500of equity securities that it had originally intended tosell for a profit in the short term and so had classifiedthe investment in its trading portfolio. Its intent hasnow changed, and it wishes to hold the securitiesfor a considerably longer period, so it must shift thesecurities into the available-for-sale account. It hadmarked the securities to market one month previ-ously, but now the securities have lost $350 of value.The company records the next entry to reclassify thesecurity and recognize the additional loss:
Debit Credit
Investments—available for sale $17,150
Loss on equity securities 350
Investments—held for trading $17,500
EXAMPLE
TRANSFER FROM THE AVAILABLE-FOR-SALE
PORTFOLIO TO THE TRADING PORTFOLIO
The Arabian Knights Security Company finds that itmust liquidate $250,000 of its available-for-sale port-folio in the short term. This investment had previ-ously been marked down to $250,000 from an initialinvestment value of $275,000, and its value has sincerisen by $12,000. The incremental gain must now berecognized in current income. The entry is:
Debit Credit
Investments—held for trading $262,000
Investments—available for sale $250,000
Gain on security investments 12,000
Accounting for Transfers 23
E1C02 03/04/2010 Page 24
What Is the Accounting for Investmentsin Debt Securities?
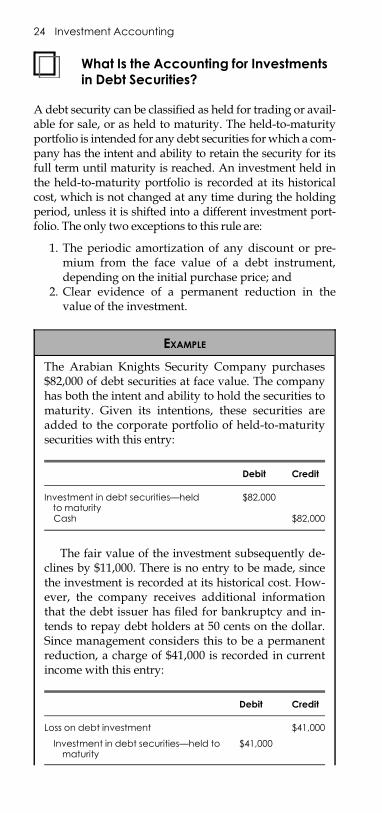
A debt security can be classified as held for trading or avail-able for sale, or as held to maturity. The held-to-maturityportfolio is intended for any debt securities forwhich a com-pany has the intent and ability to retain the security for itsfull term until maturity is reached. An investment held inthe held-to-maturity portfolio is recorded at its historicalcost, which is not changed at any time during the holdingperiod, unless it is shifted into a different investment port-folio. The only two exceptions to this rule are:
1. The periodic amortization of any discount or pre-mium from the face value of a debt instrument,depending on the initial purchase price; and
2. Clear evidence of a permanent reduction in thevalue of the investment.
EXAMPLE
The Arabian Knights Security Company purchases$82,000 of debt securities at face value. The companyhas both the intent and ability to hold the securities tomaturity. Given its intentions, these securities areadded to the corporate portfolio of held-to-maturitysecurities with this entry:
Debit Credit
Investment in debt securities—heldto maturity
$82,000
Cash $82,000
The fair value of the investment subsequently de-clines by $11,000. There is no entry to be made, sincethe investment is recorded at its historical cost. How-ever, the company receives additional informationthat the debt issuer has filed for bankruptcy and in-tends to repay debt holders at 50 cents on the dollar.Since management considers this to be a permanentreduction, a charge of $41,000 is recorded in currentincome with this entry:
Debit Credit
Loss on debt investment $41,000
Investment in debt securities—held tomaturity
$41,000
24 Investment Accounting
E1C02 03/04/2010 Page 25
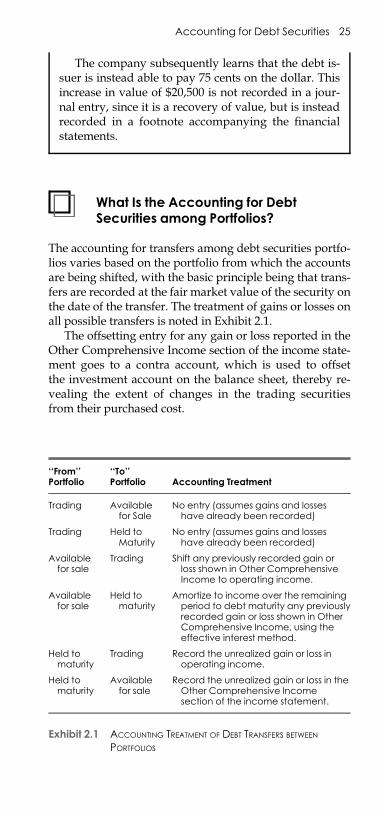
What Is the Accounting for DebtSecurities among Portfolios?
The accounting for transfers among debt securities portfo-lios varies based on the portfolio from which the accountsare being shifted, with the basic principle being that trans-fers are recorded at the fair market value of the security onthe date of the transfer. The treatment of gains or losses onall possible transfers is noted in Exhibit 2.1.
The offsetting entry for any gain or loss reported in theOther Comprehensive Income section of the income state-ment goes to a contra account, which is used to offsetthe investment account on the balance sheet, thereby re-vealing the extent of changes in the trading securitiesfrom their purchased cost.
The company subsequently learns that the debt is-suer is instead able to pay 75 cents on the dollar. Thisincrease in value of $20,500 is not recorded in a jour-nal entry, since it is a recovery of value, but is insteadrecorded in a footnote accompanying the financialstatements.
‘‘From’’Portfolio
‘‘To’’Portfolio Accounting Treatment
Trading Availablefor Sale
No entry (assumes gains and losseshave already been recorded)
Trading Held toMaturity
No entry (assumes gains and losseshave already been recorded)
Availablefor sale
Trading Shift any previously recorded gain orloss shown in Other ComprehensiveIncome to operating income.
Availablefor sale
Held tomaturity
Amortize to income over the remainingperiod to debt maturity any previouslyrecorded gain or loss shown in OtherComprehensive Income, using theeffective interest method.
Held tomaturity
Trading Record the unrealized gain or loss inoperating income.
Held tomaturity
Availablefor sale
Record the unrealized gain or loss in theOther Comprehensive Incomesection of the income statement.
Exhibit 2.1 ACCOUNTING TREATMENT OF DEBT TRANSFERS BETWEEN
PORTFOLIOS
Accounting for Debt Securities 25
E1C02 03/04/2010 Page 26
How Are Deferred Tax EffectsRecognized for Changes inInvestment Valuation?
A deferred tax benefit or tax liability should be recognizedalongside the recognition of any change in the fair valueof an investment listed in either a trading or available-for-sale portfolio or of a permanent decline in the value of adebt security being held to maturity. The tax impactvaries by investment type, and is noted as:
m Gains or losses on the trading portfolio. The deferred taxeffect is recognized in the income statement. If thereis a loss in value, debit the Deferred Tax Benefitaccount and credit the Provision for Income Taxesaccount. If there is a gain in value, debit the Provi-sion for Income Taxes account and credit theDeferred Tax Liability account.
m Gains or losses on the available-for-sale portfolio. Thesame treatment noted for gains or losses on thetrading portfolio, except that taxes are noted inthe Other Comprehensive Income section of the in-come statement.
m Gains or losses on the held-to-maturity portfolio. There isno tax recognition if changes in value are consideredto be temporary in nature. If there is a permanentreduction in value, the treatment is identical to thetreatment of losses in the trading portfolio, as justnoted.
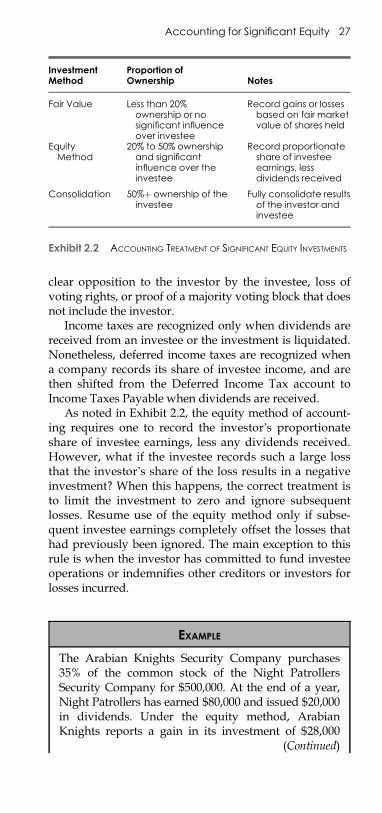
What Is the Accounting for SignificantEquity Investments?
There are three ways to account for an investment:
1. Report the investment at its fair value2. Report it under the ‘‘equity method’’3. Fully consolidate the results of the investee in the in-
vesting company’s financial statements
The rules under which each of these methods is ap-plied are noted in Exhibit 2.2.
The presence of ‘‘significant influence’’ over an investeeis assumed if the investor owns at least 20% of its com-mon stock. However, this is not the case if there is clearevidence of not having influence, such as being unable toobtain financial information from the investee, not beingable to place a representative on its board of directors,
26 Investment Accounting
E1C02 03/04/2010 Page 27
clear opposition to the investor by the investee, loss ofvoting rights, or proof of a majority voting block that doesnot include the investor.
Income taxes are recognized only when dividends arereceived from an investee or the investment is liquidated.Nonetheless, deferred income taxes are recognized whena company records its share of investee income, and arethen shifted from the Deferred Income Tax account toIncome Taxes Payable when dividends are received.
As noted in Exhibit 2.2, the equity method of account-ing requires one to record the investor’s proportionateshare of investee earnings, less any dividends received.However, what if the investee records such a large lossthat the investor’s share of the loss results in a negativeinvestment? When this happens, the correct treatment isto limit the investment to zero and ignore subsequentlosses. Resume use of the equity method only if subse-quent investee earnings completely offset the losses thathad previously been ignored. The main exception to thisrule is when the investor has committed to fund investeeoperations or indemnifies other creditors or investors forlosses incurred.
InvestmentMethod
Proportion ofOwnership Notes
Fair Value Less than 20%ownership or nosignificant influenceover investee
Record gains or lossesbased on fair marketvalue of shares held
EquityMethod
20% to 50% ownershipand significantinfluence over theinvestee
Record proportionateshare of investeeearnings, lessdividends received
Consolidation 50%þ ownership of theinvestee
Fully consolidate resultsof the investor andinvestee
Exhibit 2.2 ACCOUNTING TREATMENT OF SIGNIFICANT EQUITY INVESTMENTS
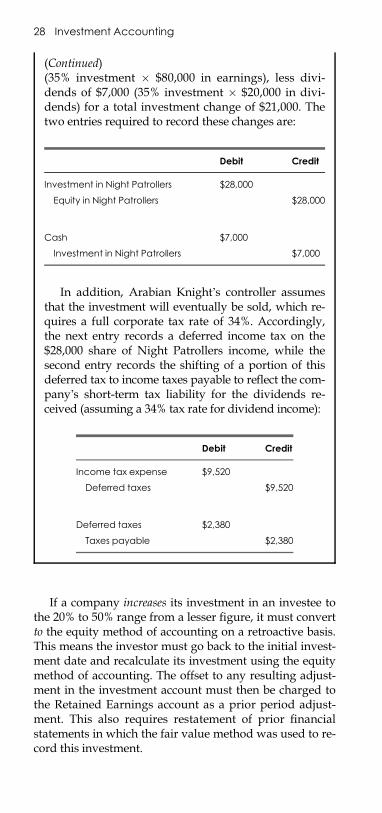
EXAMPLE
The Arabian Knights Security Company purchases35% of the common stock of the Night PatrollersSecurity Company for $500,000. At the end of a year,Night Patrollers has earned $80,000 and issued $20,000in dividends. Under the equity method, ArabianKnights reports a gain in its investment of $28,000
(Continued)
Accounting for Significant Equity 27
E1C02 03/04/2010 Page 28
If a company increases its investment in an investee tothe 20% to 50% range from a lesser figure, it must convertto the equity method of accounting on a retroactive basis.This means the investor must go back to the initial invest-ment date and recalculate its investment using the equitymethod of accounting. The offset to any resulting adjust-ment in the investment account must then be charged tothe Retained Earnings account as a prior period adjust-ment. This also requires restatement of prior financialstatements in which the fair value method was used to re-cord this investment.
(Continued)(35% investment � $80,000 in earnings), less divi-dends of $7,000 (35% investment � $20,000 in divi-dends) for a total investment change of $21,000. Thetwo entries required to record these changes are:
Debit Credit
Investment in Night Patrollers $28,000
Equity in Night Patrollers $28,000
Cash $7,000
Investment in Night Patrollers $7,000
In addition, Arabian Knight’s controller assumesthat the investment will eventually be sold, which re-quires a full corporate tax rate of 34%. Accordingly,the next entry records a deferred income tax on the$28,000 share of Night Patrollers income, while thesecond entry records the shifting of a portion of thisdeferred tax to income taxes payable to reflect the com-pany’s short-term tax liability for the dividends re-ceived (assuming a 34% tax rate for dividend income):
Debit Credit
Income tax expense $9,520
Deferred taxes $9,520
Deferred taxes $2,380
Taxes payable $2,380
28 Investment Accounting
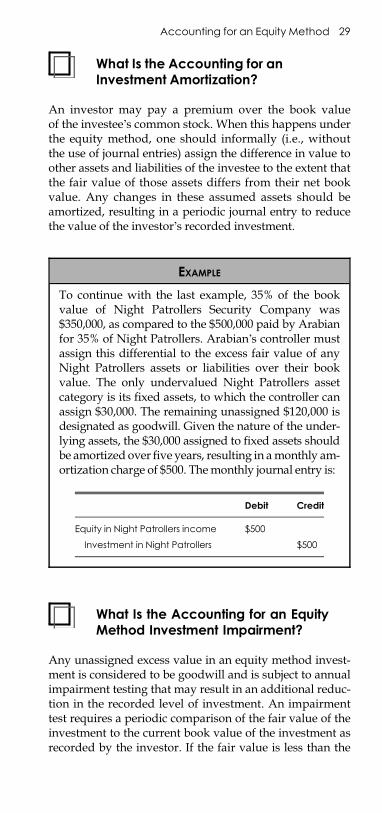
E1C02 03/04/2010 Page 29
What Is the Accounting for anInvestment Amortization?
An investor may pay a premium over the book valueof the investee’s common stock. When this happens underthe equity method, one should informally (i.e., withoutthe use of journal entries) assign the difference in value toother assets and liabilities of the investee to the extent thatthe fair value of those assets differs from their net bookvalue. Any changes in these assumed assets should beamortized, resulting in a periodic journal entry to reducethe value of the investor’s recorded investment.
What Is the Accounting for an EquityMethod Investment Impairment?
Any unassigned excess value in an equity method invest-ment is considered to be goodwill and is subject to annualimpairment testing that may result in an additional reduc-tion in the recorded level of investment. An impairmenttest requires a periodic comparison of the fair value of theinvestment to the current book value of the investment asrecorded by the investor. If the fair value is less than the
EXAMPLE
To continue with the last example, 35% of the bookvalue of Night Patrollers Security Company was$350,000, as compared to the $500,000 paid by Arabianfor 35% of Night Patrollers. Arabian’s controller mustassign this differential to the excess fair value of anyNight Patrollers assets or liabilities over their bookvalue. The only undervalued Night Patrollers assetcategory is its fixed assets, to which the controller canassign $30,000. The remaining unassigned $120,000 isdesignated as goodwill. Given the nature of the under-lying assets, the $30,000 assigned to fixed assets shouldbe amortized overfive years, resulting in amonthly am-ortization charge of $500. Themonthly journal entry is:
Debit Credit
Equity in Night Patrollers income $500
Investment in Night Patrollers $500
Accounting for an Equity Method 29
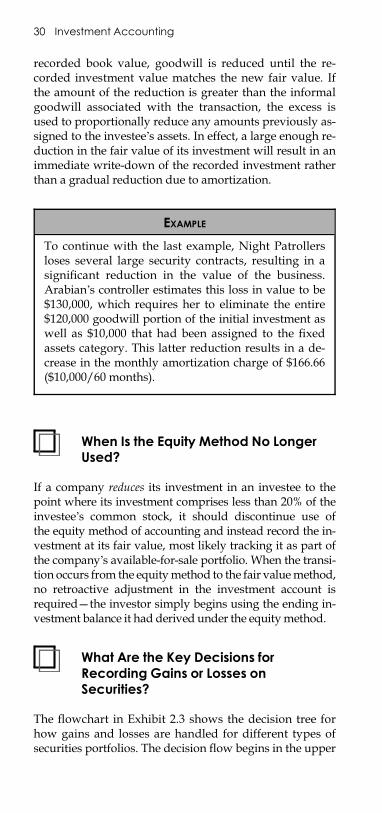
E1C02 03/04/2010 Page 30
recorded book value, goodwill is reduced until the re-corded investment value matches the new fair value. Ifthe amount of the reduction is greater than the informalgoodwill associated with the transaction, the excess isused to proportionally reduce any amounts previously as-signed to the investee’s assets. In effect, a large enough re-duction in the fair value of its investment will result in animmediate write-down of the recorded investment ratherthan a gradual reduction due to amortization.
When Is the Equity Method No LongerUsed?
If a company reduces its investment in an investee to thepoint where its investment comprises less than 20% of theinvestee’s common stock, it should discontinue use ofthe equity method of accounting and instead record the in-vestment at its fair value, most likely tracking it as part ofthe company’s available-for-sale portfolio. When the transi-tion occurs from the equitymethod to the fair valuemethod,no retroactive adjustment in the investment account isrequired—the investor simply begins using the ending in-vestment balance it had derived under the equitymethod.
What Are the Key Decisions forRecording Gains or Losses onSecurities?
The flowchart in Exhibit 2.3 shows the decision tree forhow gains and losses are handled for different types ofsecurities portfolios. The decision flow begins in the upper
EXAMPLE
To continue with the last example, Night Patrollersloses several large security contracts, resulting in asignificant reduction in the value of the business.Arabian’s controller estimates this loss in value to be$130,000, which requires her to eliminate the entire$120,000 goodwill portion of the initial investment aswell as $10,000 that had been assigned to the fixedassets category. This latter reduction results in a de-crease in the monthly amortization charge of $166.66($10,000/60 months).
30 Investment Accounting
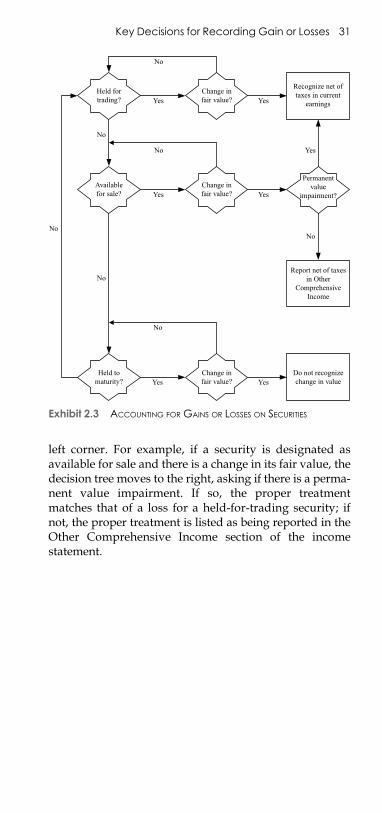
E1C02 03/04/2010 Page 31
left corner. For example, if a security is designated asavailable for sale and there is a change in its fair value, thedecision tree moves to the right, asking if there is a perma-nent value impairment. If so, the proper treatmentmatches that of a loss for a held-for-trading security; ifnot, the proper treatment is listed as being reported in theOther Comprehensive Income section of the incomestatement.
Held fortrading?
Availablefor sale?
Change infair value?
Change infair value?
Change infair value?
Recognize net oftaxes in current
earnings
Permanentvalue
impairment?
Report net of taxesin Other
ComprehensiveIncome
Do not recognizechange in value
No
No
Held tomaturity?
No
No
No
No
No
YesYes
Yes
YesYes
YesYes
Exhibit 2.3 ACCOUNTING FOR GAINS OR LOSSES ON SECURITIES
Key Decisions for Recording Gain or Losses 31

E1C02 03/04/2010 Page 32
E1C03 03/04/2010 Page 33
CHAPTER 3
INVENTORY ACCOUNTING
How Do I Account for Goods in Transit?
Inventory that is in transit to the buyer continues to beowned by the seller as long as that entity is responsiblefor the transportation costs. If the seller is only paying fortransportation to a certain point, such as to a third-partyshipper, its ownership stops at that point and is trans-ferred to the buyer.
In reality, companies do not usually track goods intransit, preferring instead to not count them if they haveeither already left the facility (in the case of the seller) orhave not yet arrived at the facility (in the case of thebuyer). The reason for avoiding this task is the difficultyin determining the amount of goods in transit that belongto the company. This avoidance has minimal impact onthe receiving company’s record keeping, since a missinginventory item would have required both a debit to an in-ventory account and a credit to a liability account, whichcancel each other out.
How Does Inventory Ownership Varyunder Different DeliverySituations?
The transfer of ownership varies among the buyer, seller,and shipping company, depending on the terms of thesetypes of shipments:
m If goods are shipped under a cost, insurance, andfreight (C&F) contract, the buyer is paying for all de-livery costs and so acquires title to the goods as soonas they leave the seller’s location.
m If goods are shipped free alongside (FAS), it is payingfor delivery of the goods to the side of the ship thatwill transport the goods to the buyer. If so, it retainsownership of the goods until they are alongside the
33
E1C03 03/04/2010 Page 34
ship, at which point the buyer acquires title to thegoods.
m If goods are shipped free on board (FOB) destination,transport costs are paid by the seller, and ownershipwill not pass to the buyer until the carrier deliversthe goods to the buyer.
m As indicated by the name, an ex-ship delivery meansthat the seller pays for a delivery until it has departedthe ship, so it retains title to the goods until that point.
m If goods are shipped FOB shipping point, transportcosts are paid by the buyer, and ownership passesto the buyer as soon as the carrier takes possessionof the delivery from the seller.
m If goods are shipped FOB to a specific point, such asNashville, the seller retains title until the goodsreach Nashville, at which point ownership transfersto the buyer.
How Do I Account for ConsignedInventory?
Consigned inventory is any inventory shipped by a com-pany to a reseller, while retaining ownership until theproduct is sold by the reseller. Until sold, the inventoryremains on the books of the originating company and noton the books of the reseller. A common cause of inventoryvaluation problems is the improper recording of consign-ment inventory on the books of a reseller. Inventory thathas been sold with a right of return receives treatment sim-ilar to consignment inventory if the amount of future in-ventory returns cannot be reasonably estimated. Until theprobability of returns is unlikely, the inventory must re-main on the books of the selling company, even thoughlegal title to the goods has passed to the buyer.
EXAMPLE
A company has sold a large shipment of refrigeratorsto a new customer. Included in the sales agreement isa provision allowing the customer to return one-thirdof the refrigerators within the next 90 days. Since thecompany has no experience with this customer, itcannot record the full amount of the sale. Instead, itrecords that portion of the sale associated with therefrigerators for which there is no right of return andwaits 90 days until the right of return has expiredbefore recording the remainder of the sale.
34 Inventory Accounting
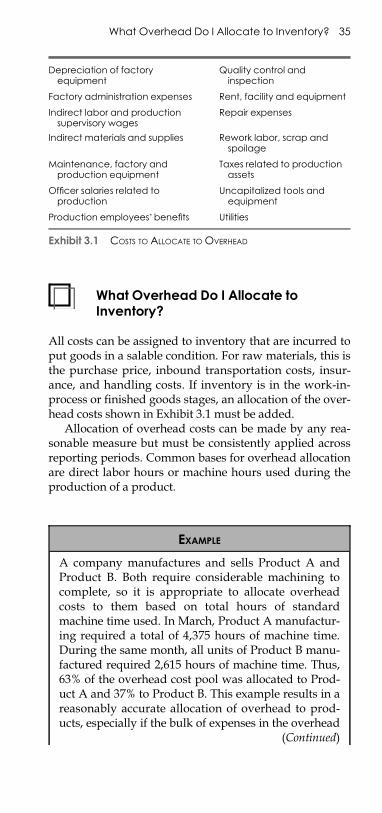
E1C03 03/04/2010 Page 35
What Overhead Do I Allocate toInventory?
All costs can be assigned to inventory that are incurred toput goods in a salable condition. For raw materials, this isthe purchase price, inbound transportation costs, insur-ance, and handling costs. If inventory is in the work-in-process or finished goods stages, an allocation of the over-head costs shown in Exhibit 3.1 must be added.
Allocation of overhead costs can be made by any rea-sonable measure but must be consistently applied acrossreporting periods. Common bases for overhead allocationare direct labor hours or machine hours used during theproduction of a product.
Depreciation of factoryequipment
Quality control andinspection
Factory administration expenses Rent, facility and equipment
Indirect labor and productionsupervisory wages
Repair expenses
Indirect materials and supplies Rework labor, scrap andspoilage
Maintenance, factory andproduction equipment
Taxes related to productionassets
Officer salaries related toproduction
Uncapitalized tools andequipment
Production employees’benefits Utilities
Exhibit 3.1 COSTS TO ALLOCATE TO OVERHEAD
EXAMPLE
A company manufactures and sells Product A andProduct B. Both require considerable machining tocomplete, so it is appropriate to allocate overheadcosts to them based on total hours of standardmachine time used. In March, Product A manufactur-ing required a total of 4,375 hours of machine time.During the same month, all units of Product B manu-factured required 2,615 hours of machine time. Thus,63% of the overhead cost pool was allocated to Prod-uct A and 37% to Product B. This example results in areasonably accurate allocation of overhead to prod-ucts, especially if the bulk of expenses in the overhead
(Continued)
What Overhead Do I Allocate to Inventory? 35
E1C03 03/04/2010 Page 36
How Do I Account for the Lowerof Cost or Market Rule?
A company is required to recognize an additional ex-pense in its cost of goods sold in the current period forany of its inventory whose replacement cost (subject tocertain restrictions) has declined below its carrying cost.If the market value of the inventory subsequently risesback to or above its original carrying cost, its recordedvalue cannot be increased back to the original carryingamount.
More specifically, the lower of cost or market (LCM) cal-culation means that the cost of inventory cannot berecorded higher than its replacement cost on the openmarket; the replacement cost is bounded at the high endby its eventual selling price, less costs of disposal. Nor canit be recorded lower than that price, less a normal profitpercentage. The concept is best demonstrated with thefour scenarios listed in the next example.
(Continued)pool relate to the machining equipment used to com-plete the products. However, if a significant propor-tion of expenses in the overhead cost pool could bereasonably assigned to some other allocation mea-sure, these costs could be stored in a separate costpool and allocated in a different manner. For example,if Product A was quite bulky and required 90% of thestorage space in the warehouse, as opposed to 10% forProduct B, 90% of the warehouse-related overheadcosts could be reasonably allocated to Product A.
EXAMPLE
In the next table, the numbers in the first six columnsare used to derive the upper and lower boundaries ofthe market values that will be used for the lower ofcost or market calculation. By subtracting the comple-tion and selling costs from each product’s sellingprice, we establish the upper price boundary (in bold)of the market cost calculation. By subtracting the nor-mal profit from the upper cost boundary of eachproduct, we establish the lower price boundary.
36 Inventory Accounting
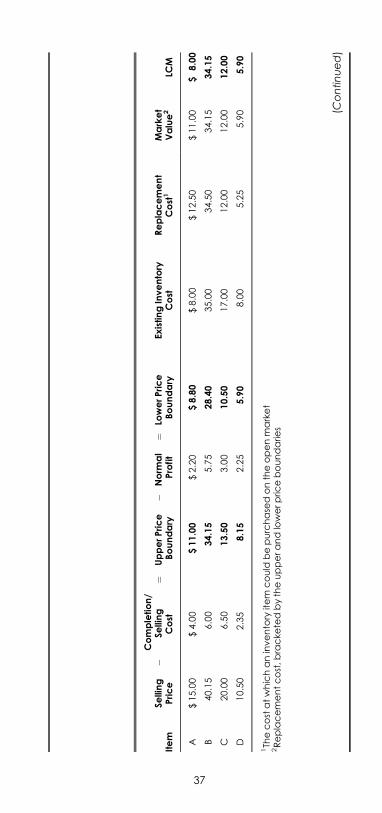
E1C03 03/04/2010 Page 37
Item
Selling
Price
Completion/
�Se
lling
Cost
¼UpperPrice
Boundary
�Norm
al
Profit
¼Lo
werPrice
Boundary
ExistingInventory
Cost
Replacement
Cost1
Market
Value2
LCM
A$15.00
$4.00
$11.00
$2.20
$8.80
$8.00
$12.50
$11.00
$8.00
B40.15
6.00
34.15
5.75
28.40
35.00
34.50
34.15
34.15
C20.00
6.50
13.50
3.00
10.50
17.00
12.00
12.00
12.00
D10.50
2.35
8.15
2.25
5.90
8.00
5.25
5.90
5.90
1Th
ecostatwhichaninventory
item
could
bepurchase
dontheopenmarket
2Replacementcost,bracke
tedbytheupperandlowerpric
eboundarie
s
(Continued)
37
E1C03 03/04/2010 Page 38
How Does the First-in, First-out ValuationMethod Work?
The first-in, first-out (FIFO) valuation method assumes thatthe oldest parts in stock are always used first, whichmeans that their associated costs are used first as well.The concept is best illustrated with the next example.
(Continued)Using this information, the LCM calculation for
each of the listed products is:
m Product A, replacement cost higher than existing inven-tory cost. The market price cannot be higher thanthe upper boundary of $11.00, which is still higherthan the existing inventory cost of $8.00. Thus, theLCM is the same as the existing inventory cost.
m Product B, replacement cost lower than existing inven-tory cost but higher than upper price boundary. The re-placement cost of $34.50 exceeds the upper priceboundary of $34.15, so the market value is desig-nated at $34.15. This is lower than the existing in-ventory cost, so the LCM becomes $34.15.
m Product C, replacement cost lower than existing inven-tory cost and within price boundaries. The replace-ment cost of $12.00 is within the upper and lowerprice boundaries, and so is used as the marketvalue. This is lower than the existing inventory costof $17.00, so the LCM becomes $12.00.
m Product D, replacement cost lower than existing inven-tory cost but lower than lower price boundary. The re-placement cost of $5.25 is below the lower priceboundary of $5.90, so the market value is desig-nated as $5.90. This is lower than the existing in-ventory cost of $8.00, so the LCM becomes $5.90.
EXAMPLE
In the first row of the table shown in Exhibit 3.2, wecreate a single layer of inventory that results in50 units of inventory, at a per-unit cost of $10.00. Sofar, the extended cost of the inventory is the same aswe saw under the Last In, First Out, (LIFO), but thatwill change as we proceed to the second row of data.In this row, we have monthly inventory usage of
38 Inventory Accounting
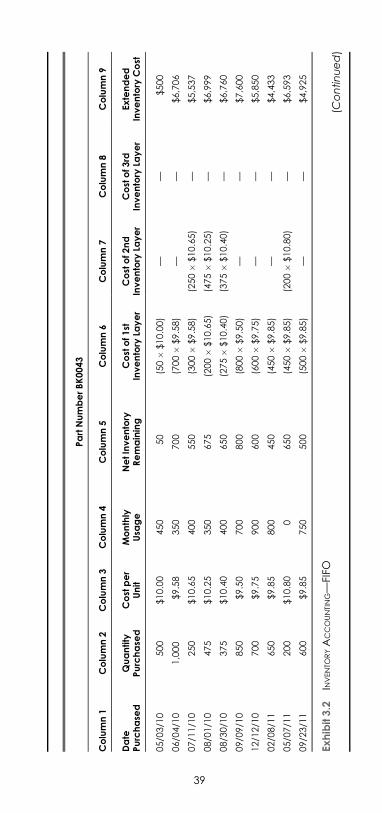
E1C03 03/04/2010 Page 39
PartNumberBK0043
Column1
Column2
Column3
Column4
Column5
Column6
Column7
Column8
Column9
Date
Purchase
dQuantity
Purchase
dCostper
Unit
Monthly
Usa
ge
NetInventory
Remaining
Costof1
stInventory
Layer
Costof2
nd
Inventory
Layer
Costof3
rdInventory
Layer
Extended
Inventory
Cost
05/03/10
500
$10.00
450
50
(50�
$10.00)
——
$500
06/04/10
1,000
$9.58
350
700
(700�
$9.58)
——
$6,706
07/11/10
250
$10.65
400
550
(300�
$9.58)
(250�
$10.65)
—$5,537
08/01/10
475
$10.25
350
675
(200�
$10.65)
(475�
$10.25)
—$6,999
08/30/10
375
$10.40
400
650
(275�
$10.40)
(375�
$10.40)
—$6,760
09/09/10
850
$9.50
700
800
(800�
$9.50)
——
$7,600
12/12/10
700
$9.75
900
600
(600�
$9.75)
——
$5,850
02/08/11
650
$9.85
800
450
(450�
$9.85)
——
$4,433
05/07/11
200
$10.80
0650
(450�
$9.85)
(200�
$10.80)
—$6,593
09/23/11
600
$9.85
750
500
(500�
$9.85)
——
$4,925
Exhibit3.2
INVENTO
RYA
CCOUNTING—
FIFO
(Continued)
39
E1C03 03/04/2010 Page 40
What Are the Advantages andDisadvantages of FIFOValuation?
There are several factors to consider before implementinga FIFO costing system. They are:
m Fewer inventory layers. The FIFO system generally re-sults in fewer layers of inventory costs in the inven-tory database than does a last-in, first out (LIFO)system (as explained next), because a LIFO systemwill leave some layers of costs completely untouchedfor long time periods if inventory levels do not drop.Conversely, a FIFO system will continually clear outold layers of costs, so that multiple costing layers donot have a chance to accumulate.
m Reduces taxes payable in periods of declining costs.Though it is very unusual to see declining inventorycosts, it sometimes occurs in industries where thereis either strong price competition among suppliersor else extremely high rates of innovation that inturn lead to cost reductions. In such cases, using theearliest costs first will result in the immediate re-cognition of the highest possible expense, which re-duces the reported profit level and therefore reducestaxes payable.
m Shows higher profits in periods of rising costs. Since itcharges off the earliest costs first, any very recentincrease in costs will be stored in inventory ratherthan being immediately recognized. This will result
(Continued)350 units, which FIFO assumes will use the entirestock of 50 inventory units that were left over at theend of the preceding month, as well as 300 units thatwere purchased in the current month. This wipes outthe first layer of inventory, leaving us with a singlenew layer that is composed of 700 units at a cost of$9.58 per unit. In the third row, there are 400 units ofusage, which again comes from the first inventorylayer, shrinking it down to just 300 units. However,since extra stock was purchased in the same period,we now have an extra inventory layer that is com-prised of 250 units, at a cost of $10.65 per unit.Exhibit 3.2 proceeds using the same FIFO layeringassumptions.
40 Inventory Accounting
E1C03 03/04/2010 Page 41
in higher levels of reported profits, though the at-tendant income tax liability will also be higher.
m Less risk of outdated costs in inventory. Because oldcosts are used first in a FIFO system, there is noway for old and outdated costs that might eventu-ally flow into the cost of goods sold to accumulate ininventory.
How Does the Last-in, First-out ValuationMethod Work?
In a supermarket, the shelves are stocked several rowsdeep with products. A shopper will walk by and pickproducts from the front row. If the stocking person islazy, he will then add products to the front row locationsfrom which products were just taken rather than shiftingthe oldest products to the front row and putting new onesin the back. This concept of always taking the newestproducts first is called last-in, first-out, or LIFO. The con-cept is best illustrated with an example.
EXAMPLE
The Magic Pen Company has made 10 purchases,which are itemized in the table shown in Exhibit 3.3.The company has purchased 500 units of a productwith part number BK0043 on May 3, 2010 (as noted inthe first row of data) and uses 450 units during thatmonth, leaving the company with 50 units. These 50units were all purchased at a cost of $10.00 each, sothey are itemized in Column 6 as the first layer of in-ventory costs for this product. In the next row of data,an additional 1,000 units were bought on June 4, 2010,of which only 350 units were used. This leaves an ad-ditional 650 units at a purchase price of $9.58, whichare placed in the second inventory layer, as noted onColumn 7. In the third row, there is a net decrease inthe amount of inventory, so this reduction comes outof the second (or last) inventory layer in Column 7;the earliest layer, as described in Column 6, remainsuntouched, since it was the first layer of costs addedand will not be used until all other inventory has beeneliminated. Exhibit 3.3 continues through seven moretransactions, at one point increasing to four layers ofinventory costs.
How Does the Last-in, First-out Valuation MethodWork? 41
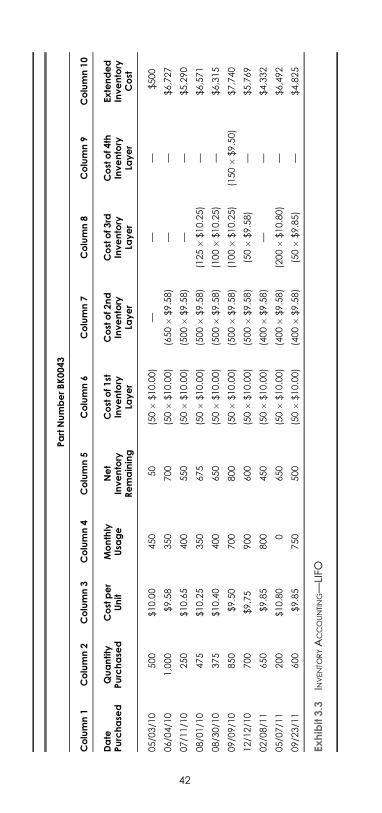
E1C03 03/04/2010 Page 42
PartNumberBK0043
Column1
Column2
Column3
Column4
Column5
Column6
Column7
Column8
Column9
Column10
Date
Purchase
dQuantity
Purchase
dCostper
Unit
Monthly
Usa
ge
Net
Inventory
Remaining
Costof1
stInventory
Layer
Costof2
nd
Inventory
Layer
Costof3
rdInventory
Layer
Costof4
thInventory
Layer
Extended
Inventory
Cost
05/03/10
500
$10.00
450
50
(50�
$10.00)
——
—$500
06/04/10
1,000
$9.58
350
700
(50�
$10.00)
(650�
$9.58)
——
$6,727
07/11/10
250
$10.65
400
550
(50�
$10.00)
(500�
$9.58)
——
$5,290
08/01/10
475
$10.25
350
675
(50�
$10.00)
(500�
$9.58)
(125�
$10.25)
—$6,571
08/30/10
375
$10.40
400
650
(50�
$10.00)
(500�
$9.58)
(100�
$10.25)
—$6,315
09/09/10
850
$9.50
700
800
(50�
$10.00)
(500�
$9.58)
(100�
$10.25)
(150�
$9.50)
$7,740
12/12/10
700
$9.75
900
600
(50�
$10.00)
(500�
$9.58)
(50�
$9.58)
—$5,769
02/08/11
650
$9.85
800
450
(50�
$10.00)
(400�
$9.58)
——
$4,332
05/07/11
200
$10.80
0650
(50�
$10.00)
(400�
$9.58)
(200�
$10.80)
—$6,492
09/23/11
600
$9.85
750
500
(50�
$10.00)
(400�
$9.58)
(50�
$9.85)
—$4,825
Exhibit3.3
INVENTO
RYA
CCOUNTING—
LIFO
42
E1C03 03/04/2010 Page 43
What Are the Advantages andDisadvantages of LIFOValuation?
There are several factors to consider before implementinga LIFO costing system. They are:
m Many layers. The LIFO cost flow approach can resultin a large number of inventory layers, as shown inthe exhibit. Though this is not important when acomputerized accounting system is used that willautomatically track a large number of such layers, itcan be burdensome if the cost layers are manuallytracked.
m Alters the inventory valuation. If there are significantchanges in product costs over time, the earliestinventory layers may contain costs that are wildlydifferent from market conditions in the currentperiod, which could result in the recognition of un-usually high or low costs if these cost layers are everaccessed.
m Reduces taxes payable in periods of rising costs. In aninflationary environment, costs that are charged offto the cost of goods sold as soon as they are incurredwill result in a higher cost of goods sold and a lowerlevel of profitability, which in turn results in a lowertax liability. This is the principle reason why LIFO isused by most companies.
m Requires consistent usage for all reporting. Under IRSrules, if a company uses LIFO to value its inventoryfor tax reporting purposes, it must do the same forits external financial reports. The result of this rule isthat a company cannot report lower earnings for taxpurposes and higher earnings for all other purposesby using an alternative inventory valuation method.However, it is still possible to mention in a footnotewhat profits would have been if some other methodhad been used.
m Interferes with the implementation of just-in-time sys-tems. As just noted, clearing out the final cost lay-ers of a LIFO system can result in unusual cost ofgoods sold figures. If these results will cause asignificant skewing of reported profitability, com-pany management may oppose the implementa-tion of advanced manufacturing concepts, such asjust-in-time, that reduce or eliminate inventorylevels.
Advantages and Disadvantages of LIFO 43
E1C03 03/04/2010 Page 44
How Does the Dollar-Value LIFOValuation Method Work?
This method computes a conversion price index for theyear-end inventory in comparison to the base-year cost.This index is computed separately for each company busi-ness unit. The conversion price index can be computedwith the double-extension method. Under this approach, thetotal extended cost of the inventory at both base yearprices and the most recent prices are calculated. Then thetotal inventory cost at the most recent prices is divided bythe total inventory cost at base year prices, resulting in aconversion price percentage, or index. The index repre-sents the change in overall prices between the currentyear and the base year. This index must be computed andretained for each year in which the LIFO method is used.
Tax regulations require that any new item added to in-ventory, no matter how many years after the establish-ment of the base year, have a base-year cost included inthe LIFO database for purposes of calculating the index.This base-year cost is supposed to be the one in existenceat the time of the base year, which may require considera-ble research to determine or estimate. Only if it is im-possible to determine a base-year cost can the current costof a new inventory item be used as the base-year cost.
EXAMPLE
ABC Company carries a single item of inventory instock. It has retained this year-end information aboutthe item for the past four years:
YearEnding UnitQuantity
EndingCurrentPrice
Extended at CurrentYear-End Price
1 3,500 $32.00 $112,000
2 7,000 34.50 241,500
3 5,500 36.00 198,000
4 7,250 37.50 271,875
The first year is the base year upon which thedouble-extension index will be based in later years.In the second year, ABC extends the total year-end in-ventory by both the base-year price and the current-year price, as shown next.
44 Inventory Accounting
E1C03 03/04/2010 Page 45
Year-EndQuantity
Base-YearCost
Extendedat Base-Year Cost
EndingCurrentPrice
Extended atEnding
Current Price
7,000 $32.00 $224,000 $34.50 $241,500
To arrive at the index between year 2 and thebase year, ABC divides the extended ending currentprice of $241,500 by the extended base-year cost of$224,000, yielding an index of 107.8%.
The next step is to calculate the incrementalamount of inventory added in year 2, determine itscost using base-year prices, and multiply thisextended amount by our index of 107.8% to arrive atthe cost of the incremental year 2 LIFO layer. The in-cremental amount of inventory added is the year-endquantity of 7,000 units, less the beginning balance of3,500 units, which is 3,500 units. When multiplied bythe base-year cost of $32.00, ABC arrives at an incre-mental increase in inventory of $112,000. Finally,ABC multiplies the $112,000 by the price index of107.8% to determine that the cost of the year 2 LIFOlayer is $120,736.
Thus, at the end of year 2, the total double-extension LIFO inventory valuation is the base-yearvaluation of $112,000 plus the year 2 layer’s valuationof $120,736, totaling $232,736.
In year 3, the amount of ending inventory has de-clined from the previous year, so no new layering cal-culation is required. Instead, ABC assumes that theentire reduction of 1,500 units during that year wastaken from the year 2 inventory layer. To calculatethe amount of this reduction, ABC multiplies the re-maining amount of the year 2 layer (5,500 units lessthe base year amount of 3,500 units, or 2,000 units)times the ending base year price of $32.00 and theyear 2 index of 107.8%. This calculation results in anew year 2 layer of $68,992.
Thus, at the end of year 3, the total double-extension LIFO inventory valuation is the base layerof $112,000 plus the reduced year 2 layer of $68,992,totaling $180,992.
In year 4, there is an increase in inventory, so ABCcalculates the presence of a new layer using the nexttable.
(Continued)
Dollar-Value LIFO Valuation 45
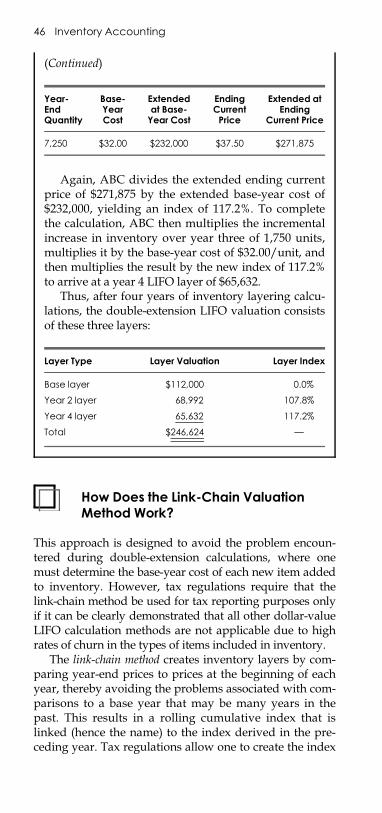
E1C03 03/04/2010 Page 46
How Does the Link-Chain ValuationMethod Work?
This approach is designed to avoid the problem encoun-tered during double-extension calculations, where onemust determine the base-year cost of each new item addedto inventory. However, tax regulations require that thelink-chain method be used for tax reporting purposes onlyif it can be clearly demonstrated that all other dollar-valueLIFO calculation methods are not applicable due to highrates of churn in the types of items included in inventory.
The link-chain method creates inventory layers by com-paring year-end prices to prices at the beginning of eachyear, thereby avoiding the problems associated with com-parisons to a base year that may be many years in thepast. This results in a rolling cumulative index that islinked (hence the name) to the index derived in the pre-ceding year. Tax regulations allow one to create the index
(Continued)
Year-EndQuantity
Base-YearCost
Extendedat Base-Year Cost
EndingCurrentPrice
Extended atEnding
Current Price
7,250 $32.00 $232,000 $37.50 $271,875
Again, ABC divides the extended ending currentprice of $271,875 by the extended base-year cost of$232,000, yielding an index of 117.2%. To completethe calculation, ABC then multiplies the incrementalincrease in inventory over year three of 1,750 units,multiplies it by the base-year cost of $32.00/unit, andthen multiplies the result by the new index of 117.2%to arrive at a year 4 LIFO layer of $65,632.
Thus, after four years of inventory layering calcu-lations, the double-extension LIFO valuation consistsof these three layers:
Layer Type Layer Valuation Layer Index
Base layer $112,000 0.0%
Year 2 layer 68,992 107.8%
Year 4 layer 65,632 117.2%
Total $246,624 —
46 Inventory Accounting
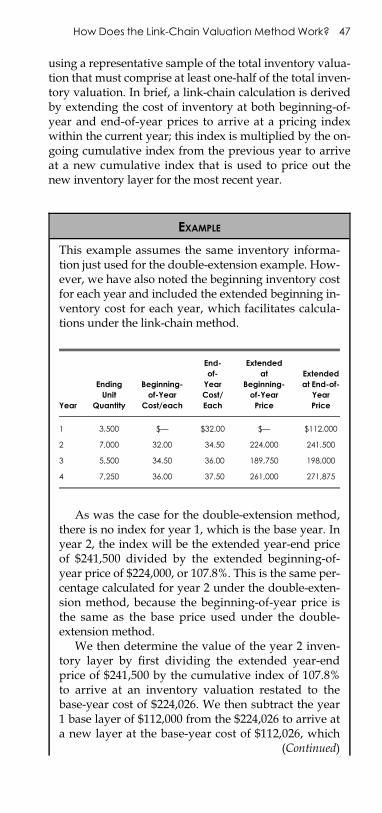
E1C03 03/04/2010 Page 47
using a representative sample of the total inventory valua-tion that must comprise at least one-half of the total inven-tory valuation. In brief, a link-chain calculation is derivedby extending the cost of inventory at both beginning-of-year and end-of-year prices to arrive at a pricing indexwithin the current year; this index is multiplied by the on-going cumulative index from the previous year to arriveat a new cumulative index that is used to price out thenew inventory layer for the most recent year.
EXAMPLE
This example assumes the same inventory informa-tion just used for the double-extension example. How-ever, we have also noted the beginning inventory costfor each year and included the extended beginning in-ventory cost for each year, which facilitates calcula-tions under the link-chain method.
Year
Ending
Unit
Quantity
Beginning-
of-Year
Cost/each
End-
of-
Year
Cost/
Each
Extended
at
Beginning-
of-Year
Price
Extended
at End-of-
Year
Price
1 3,500 $— $32.00 $— $112,000
2 7,000 32.00 34.50 224,000 241,500
3 5,500 34.50 36.00 189,750 198,000
4 7,250 36.00 37.50 261,000 271,875
As was the case for the double-extension method,there is no index for year 1, which is the base year. Inyear 2, the index will be the extended year-end priceof $241,500 divided by the extended beginning-of-year price of $224,000, or 107.8%. This is the same per-centage calculated for year 2 under the double-exten-sion method, because the beginning-of-year price isthe same as the base price used under the double-extension method.
We then determine the value of the year 2 inven-tory layer by first dividing the extended year-endprice of $241,500 by the cumulative index of 107.8%to arrive at an inventory valuation restated to thebase-year cost of $224,026. We then subtract the year1 base layer of $112,000 from the $224,026 to arrive ata new layer at the base-year cost of $112,026, which
(Continued)
How Does the Link-Chain Valuation MethodWork? 47
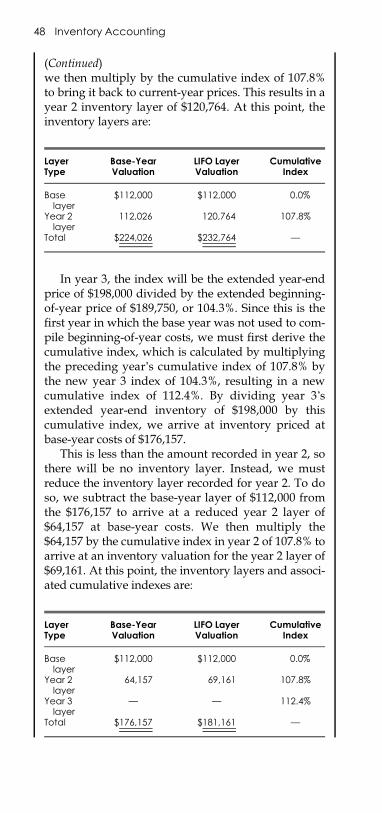
E1C03 03/04/2010 Page 48
(Continued)we then multiply by the cumulative index of 107.8%to bring it back to current-year prices. This results in ayear 2 inventory layer of $120,764. At this point, theinventory layers are:
LayerType
Base-YearValuation
LIFO LayerValuation
CumulativeIndex
Baselayer
$112,000 $112,000 0.0%
Year 2layer
112,026 120,764 107.8%
Total $224,026 $232,764 —
In year 3, the index will be the extended year-endprice of $198,000 divided by the extended beginning-of-year price of $189,750, or 104.3%. Since this is thefirst year in which the base year was not used to com-pile beginning-of-year costs, we must first derive thecumulative index, which is calculated by multiplyingthe preceding year’s cumulative index of 107.8% bythe new year 3 index of 104.3%, resulting in a newcumulative index of 112.4%. By dividing year 3’sextended year-end inventory of $198,000 by thiscumulative index, we arrive at inventory priced atbase-year costs of $176,157.
This is less than the amount recorded in year 2, sothere will be no inventory layer. Instead, we mustreduce the inventory layer recorded for year 2. To doso, we subtract the base-year layer of $112,000 fromthe $176,157 to arrive at a reduced year 2 layer of$64,157 at base-year costs. We then multiply the$64,157 by the cumulative index in year 2 of 107.8% toarrive at an inventory valuation for the year 2 layer of$69,161. At this point, the inventory layers and associ-ated cumulative indexes are:
LayerType
Base-YearValuation
LIFO LayerValuation
CumulativeIndex
Baselayer
$112,000 $112,000 0.0%
Year 2layer
64,157 69,161 107.8%
Year 3layer
— — 112.4%
Total $176,157 $181,161 —
48 Inventory Accounting
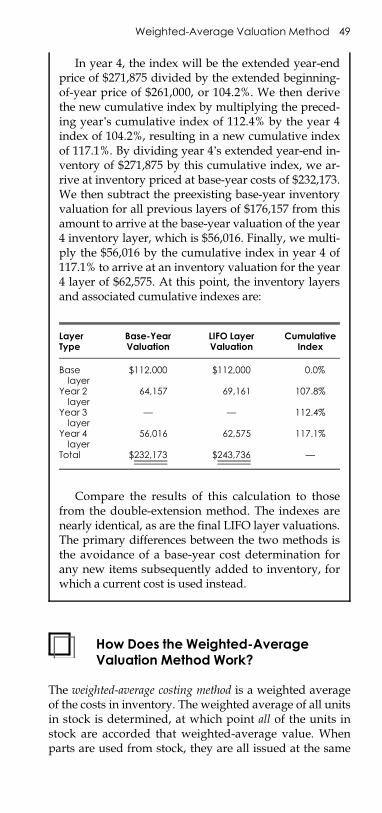
E1C03 03/04/2010 Page 49
How Does the Weighted-AverageValuation Method Work?
The weighted-average costing method is a weighted averageof the costs in inventory. The weighted average of all unitsin stock is determined, at which point all of the units instock are accorded that weighted-average value. Whenparts are used from stock, they are all issued at the same
In year 4, the index will be the extended year-endprice of $271,875 divided by the extended beginning-of-year price of $261,000, or 104.2%. We then derivethe new cumulative index by multiplying the preced-ing year’s cumulative index of 112.4% by the year 4index of 104.2%, resulting in a new cumulative indexof 117.1%. By dividing year 4’s extended year-end in-ventory of $271,875 by this cumulative index, we ar-rive at inventory priced at base-year costs of $232,173.We then subtract the preexisting base-year inventoryvaluation for all previous layers of $176,157 from thisamount to arrive at the base-year valuation of the year4 inventory layer, which is $56,016. Finally, we multi-ply the $56,016 by the cumulative index in year 4 of117.1% to arrive at an inventory valuation for the year4 layer of $62,575. At this point, the inventory layersand associated cumulative indexes are:
LayerType
Base-YearValuation
LIFO LayerValuation
CumulativeIndex
Baselayer
$112,000 $112,000 0.0%
Year 2layer
64,157 69,161 107.8%
Year 3layer
— — 112.4%
Year 4layer
56,016 62,575 117.1%
Total $232,173 $243,736 —
Compare the results of this calculation to thosefrom the double-extension method. The indexes arenearly identical, as are the final LIFO layer valuations.The primary differences between the two methods isthe avoidance of a base-year cost determination forany new items subsequently added to inventory, forwhich a current cost is used instead.
Weighted-Average Valuation Method 49
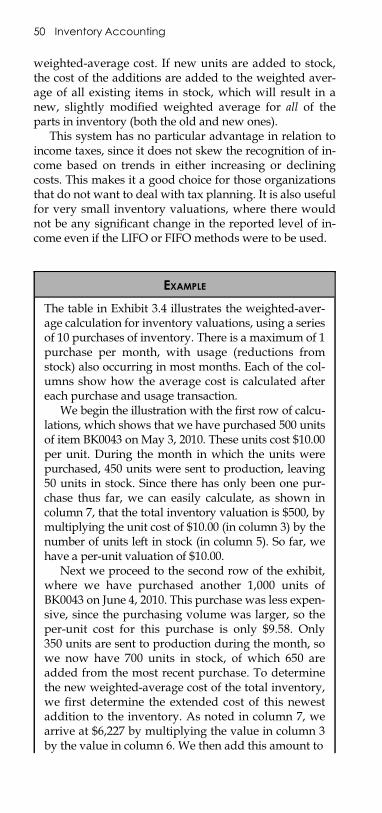
E1C03 03/04/2010 Page 50
weighted-average cost. If new units are added to stock,the cost of the additions are added to the weighted aver-age of all existing items in stock, which will result in anew, slightly modified weighted average for all of theparts in inventory (both the old and new ones).
This system has no particular advantage in relation toincome taxes, since it does not skew the recognition of in-come based on trends in either increasing or decliningcosts. This makes it a good choice for those organizationsthat do not want to deal with tax planning. It is also usefulfor very small inventory valuations, where there wouldnot be any significant change in the reported level of in-come even if the LIFO or FIFO methods were to be used.
EXAMPLE
The table in Exhibit 3.4 illustrates the weighted-aver-age calculation for inventory valuations, using a seriesof 10 purchases of inventory. There is a maximum of 1purchase per month, with usage (reductions fromstock) also occurring in most months. Each of the col-umns show how the average cost is calculated aftereach purchase and usage transaction.
We begin the illustration with the first row of calcu-lations, which shows that we have purchased 500 unitsof item BK0043 on May 3, 2010. These units cost $10.00per unit. During the month in which the units werepurchased, 450 units were sent to production, leaving50 units in stock. Since there has only been one pur-chase thus far, we can easily calculate, as shown incolumn 7, that the total inventory valuation is $500, bymultiplying the unit cost of $10.00 (in column 3) by thenumber of units left in stock (in column 5). So far, wehave a per-unit valuation of $10.00.
Next we proceed to the second row of the exhibit,where we have purchased another 1,000 units ofBK0043 on June 4, 2010. This purchase was less expen-sive, since the purchasing volume was larger, so theper-unit cost for this purchase is only $9.58. Only350 units are sent to production during the month, sowe now have 700 units in stock, of which 650 areadded from the most recent purchase. To determinethe new weighted-average cost of the total inventory,we first determine the extended cost of this newestaddition to the inventory. As noted in column 7, wearrive at $6,227 by multiplying the value in column 3by the value in column 6. We then add this amount to
50 Inventory Accounting
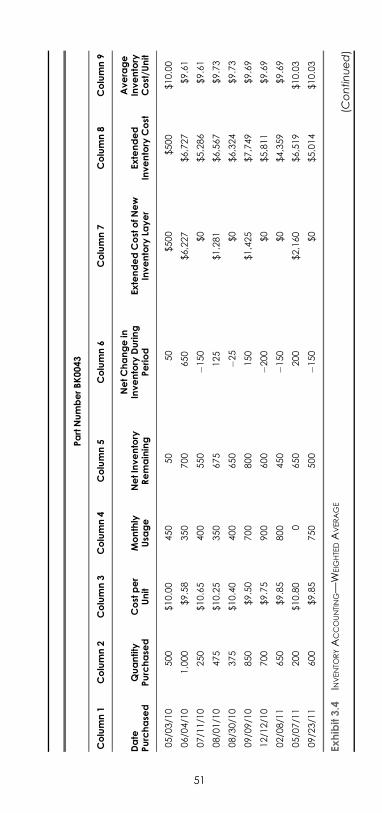
E1C03 03/04/2010 Page 51
PartNumberBK0043
Column1
Column2
Column3
Column4
Column5
Column6
Column7
Column8
Column9
Date
Purchase
dQuantity
Purchase
dCostper
Unit
Monthly
Usa
ge
NetInventory
Remaining
NetChangein
Inventory
During
Period
ExtendedCostofN
ew
Inventory
Layer
Extended
Inventory
Cost
Average
Inventory
Cost/U
nit
05/03/10
500
$10.00
450
50
50
$500
$500
$10.00
06/04/10
1,000
$9.58
350
700
650
$6,227
$6,727
$9.61
07/11/10
250
$10.65
400
550
�150
$0
$5,286
$9.61
08/01/10
475
$10.25
350
675
125
$1,281
$6,567
$9.73
08/30/10
375
$10.40
400
650
�25
$0
$6,324
$9.73
09/09/10
850
$9.50
700
800
150
$1,425
$7,749
$9.69
12/12/10
700
$9.75
900
600
�200
$0
$5,811
$9.69
02/08/11
650
$9.85
800
450
�150
$0
$4,359
$9.69
05/07/11
200
$10.80
0650
200
$2,160
$6,519
$10.03
09/23/11
600
$9.85
750
500
�150
$0
$5,014
$10.03
Exhibit3.4
INVENTO
RYA
CCOUNTING—
WEIG
HTEDA
VERAGE
(Continued)
51
E1C03 03/04/2010 Page 52
(Continued)the existing total inventory valuation ($6,227 plus$500) to arrive at the new extended inventory cost of$6,727, as noted in column 8. Finally, we divide thisnew extended cost in column 8 by the total number ofunits now in stock, as shown in column 5, to arrive atour new per-unit cost of $9.61.
The third row reveals an additional inventory pur-chase of 250 units on July 11, 2010, but more units aresent to production during that month than werebought, so the total number of units in inventorydrops to 550 (column 5). This inventory reduction re-quires no review of inventory layers, as was the casefor the LIFO and FIFO calculations. Instead, we sim-ply charge off the 150 unit reduction at the averageper-unit cost of $9.61. As a result, the ending inven-tory valuation drops to $5,286, with the same per-unitcost of $9.61. Thus, reductions in inventory quantitiesunder the average costing method require little calcu-lation—just charge off the requisite number of units atthe current average cost.
52 Inventory Accounting
E1C04 03/04/2010 Page 53
CHAPTER 4
FIXED ASSET ACCOUNTING
What Is Included in the CapitalizedCost of a Fixed Asset?
When a company purchases a fixed asset, it can includeseveral associated expenses in the capitalized cost of theasset. These costs include the sales tax and ownership reg-istration fees (if any). Also, the cost of all freight, insur-ance, and duties required to bring the asset to thecompany can be included in the capitalized cost. Further,the cost required to install the asset can be included. In-stallation costs include the cost to test and break in theasset, which can include the cost of test materials.
What Is the Price of a PurchasedFixed Asset?
If a fixed asset is acquired for nothing but cash, its re-corded cost is the amount of cash paid. However, if theasset is acquired by taking on a payable, such as a streamof debt payments (or taking over the payments that wereinitially to be made by the seller of the asset), the presentvalue of all future payments yet to be made must also berolled into the recorded asset cost. If the stream of futurepayments contains no stated interest rate, one must be im-puted based on market rates when making the presentvalue calculation. If the amount of the payable is notclearly evident at the time of purchase, it is also admissi-ble to record the asset at its fair market value.
If an asset is purchased with company stock, assign avalue to the assets acquired based on the fair market valueof either the stock or the assets, whichever is more easilydeterminable.
53
E1C04 03/04/2010 Page 54
What Is the Price of a Fixed AssetObtained through anExchange?
If a company obtains an asset through an exchange in-volving a dissimilar asset, it should record the incomingasset at the fair market value of the asset for which it wasexchanged. However, if this fair value is not readily ap-parent, the fair value of the incoming asset can be usedinstead. If no fair market value is readily obtainable foreither asset, the net book value of the relinquished assetcan be used.
EXAMPLE
The St. Louis Motor Car Company issues 500 sharesof its stock to acquire a sheet metal bender. This is apublicly held company, and on the day of the acquisi-tion, its shares were trading for $13.25 each. Since thisis an easily determinable value, the cost assigned tothe equipment is $6,625 (500 shares times $13.25/share). A year later, the company has taken itself pri-vate and chooses to issue another 750 shares of itsstock to acquire a router. In this case, the value of theshares is no longer so easily determined, so the com-pany asks an appraiser to determine the router’s fairvalue, which she sets at $12,000. In the first transac-tion, the journal entry was a debit of $6,625 to thefixed asset equipment account and a credit of $6,625to the common stock account, while the second trans-action was to the same accounts, but for $12,000instead.
EXAMPLE
The Dakota Motor Company swaps a file server for anoverhead crane. Its file server has a book value of$12,000 (net of accumulated depreciation of $4,000),while the overhead crane has a fair value of $9,500.The company has no information about the fair valueof its file server, so Dakota uses its net book valueinstead to establish a value for the swap. Dakota rec-ognizes a loss of $2,500 on the transaction, as noted inthe next entry.
54 Fixed Asset Accounting
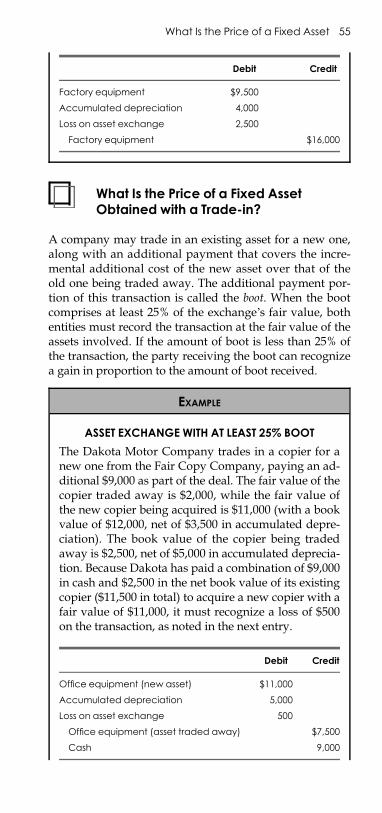
E1C04 03/04/2010 Page 55
What Is the Price of a Fixed AssetObtained with a Trade-in?
A company may trade in an existing asset for a new one,along with an additional payment that covers the incre-mental additional cost of the new asset over that of theold one being traded away. The additional payment por-tion of this transaction is called the boot. When the bootcomprises at least 25% of the exchange’s fair value, bothentities must record the transaction at the fair value of theassets involved. If the amount of boot is less than 25% ofthe transaction, the party receiving the boot can recognizea gain in proportion to the amount of boot received.
Debit Credit
Factory equipment $9,500
Accumulated depreciation 4,000
Loss on asset exchange 2,500
Factory equipment $16,000
EXAMPLE
ASSET EXCHANGE WITH AT LEAST 25% BOOT
The Dakota Motor Company trades in a copier for anew one from the Fair Copy Company, paying an ad-ditional $9,000 as part of the deal. The fair value of thecopier traded away is $2,000, while the fair value ofthe new copier being acquired is $11,000 (with a bookvalue of $12,000, net of $3,500 in accumulated depre-ciation). The book value of the copier being tradedaway is $2,500, net of $5,000 in accumulated deprecia-tion. Because Dakota has paid a combination of $9,000in cash and $2,500 in the net book value of its existingcopier ($11,500 in total) to acquire a new copier with afair value of $11,000, it must recognize a loss of $500on the transaction, as noted in the next entry.
Debit Credit
Office equipment (new asset) $11,000
Accumulated depreciation 5,000
Loss on asset exchange 500
Office equipment (asset traded away) $7,500
Cash 9,000
What Is the Price of a Fixed Asset 55
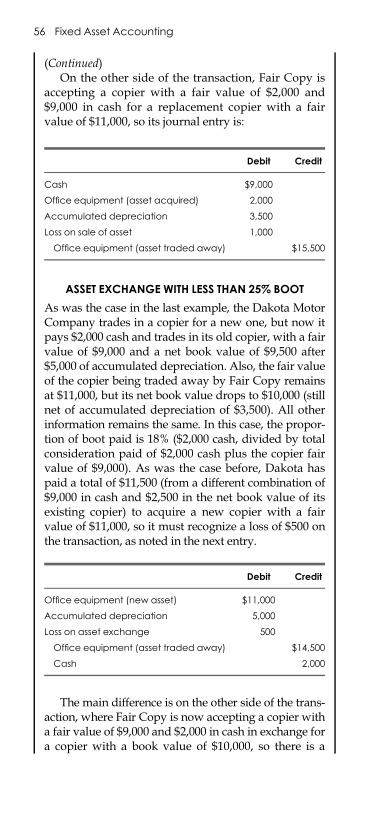
E1C04 03/04/2010 Page 56
(Continued)On the other side of the transaction, Fair Copy is
accepting a copier with a fair value of $2,000 and$9,000 in cash for a replacement copier with a fairvalue of $11,000, so its journal entry is:
Debit Credit
Cash $9,000
Office equipment (asset acquired) 2,000
Accumulated depreciation 3,500
Loss on sale of asset 1,000
Office equipment (asset traded away) $15,500
ASSET EXCHANGE WITH LESS THAN 25% BOOT
As was the case in the last example, the Dakota MotorCompany trades in a copier for a new one, but now itpays $2,000 cash and trades in its old copier, with a fairvalue of $9,000 and a net book value of $9,500 after$5,000 of accumulated depreciation. Also, the fair valueof the copier being traded away by Fair Copy remainsat $11,000, but its net book value drops to $10,000 (stillnet of accumulated depreciation of $3,500). All otherinformation remains the same. In this case, the propor-tion of boot paid is 18% ($2,000 cash, divided by totalconsideration paid of $2,000 cash plus the copier fairvalue of $9,000). As was the case before, Dakota haspaid a total of $11,500 (from a different combination of$9,000 in cash and $2,500 in the net book value of itsexisting copier) to acquire a new copier with a fairvalue of $11,000, so it must recognize a loss of $500 onthe transaction, as noted in the next entry.
Debit Credit
Office equipment (new asset) $11,000
Accumulated depreciation 5,000
Loss on asset exchange 500
Office equipment (asset traded away) $14,500
Cash 2,000
The main difference is on the other side of the trans-action, where Fair Copy is now accepting a copier witha fair value of $9,000 and $2,000 in cash in exchange fora copier with a book value of $10,000, so there is a
56 Fixed Asset Accounting
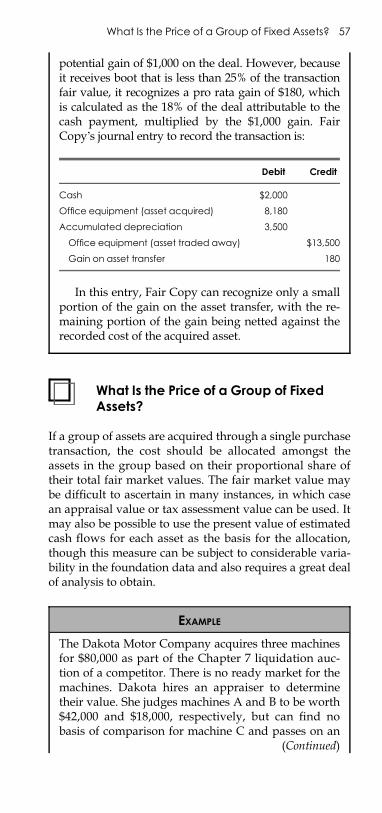
E1C04 03/04/2010 Page 57
What Is the Price of a Group of FixedAssets?
If a group of assets are acquired through a single purchasetransaction, the cost should be allocated amongst theassets in the group based on their proportional share oftheir total fair market values. The fair market value maybe difficult to ascertain in many instances, in which casean appraisal value or tax assessment value can be used. Itmay also be possible to use the present value of estimatedcash flows for each asset as the basis for the allocation,though this measure can be subject to considerable varia-bility in the foundation data and also requires a great dealof analysis to obtain.
potential gain of $1,000 on the deal. However, becauseit receives boot that is less than 25% of the transactionfair value, it recognizes a pro rata gain of $180, whichis calculated as the 18% of the deal attributable to thecash payment, multiplied by the $1,000 gain. FairCopy’s journal entry to record the transaction is:
Debit Credit
Cash $2,000
Office equipment (asset acquired) 8,180
Accumulated depreciation 3,500
Office equipment (asset traded away) $13,500
Gain on asset transfer 180
In this entry, Fair Copy can recognize only a smallportion of the gain on the asset transfer, with the re-maining portion of the gain being netted against therecorded cost of the acquired asset.
EXAMPLE
The Dakota Motor Company acquires three machinesfor $80,000 as part of the Chapter 7 liquidation auc-tion of a competitor. There is no ready market for themachines. Dakota hires an appraiser to determinetheir value. She judges machines A and B to be worth$42,000 and $18,000, respectively, but can find nobasis of comparison for machine C and passes on an
(Continued)
What Is the Price of a Group of Fixed Assets? 57
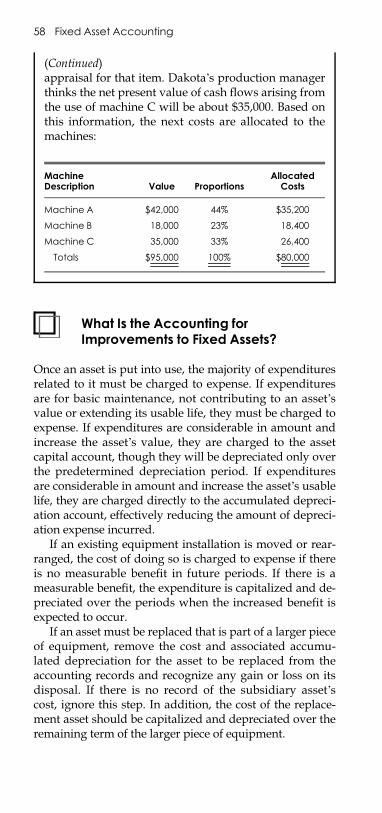
E1C04 03/04/2010 Page 58
What Is the Accounting forImprovements to Fixed Assets?
Once an asset is put into use, the majority of expendituresrelated to it must be charged to expense. If expendituresare for basic maintenance, not contributing to an asset’svalue or extending its usable life, they must be charged toexpense. If expenditures are considerable in amount andincrease the asset’s value, they are charged to the assetcapital account, though they will be depreciated only overthe predetermined depreciation period. If expendituresare considerable in amount and increase the asset’s usablelife, they are charged directly to the accumulated depreci-ation account, effectively reducing the amount of depreci-ation expense incurred.
If an existing equipment installation is moved or rear-ranged, the cost of doing so is charged to expense if thereis no measurable benefit in future periods. If there is ameasurable benefit, the expenditure is capitalized and de-preciated over the periods when the increased benefit isexpected to occur.
If an asset must be replaced that is part of a larger pieceof equipment, remove the cost and associated accumu-lated depreciation for the asset to be replaced from theaccounting records and recognize any gain or loss on itsdisposal. If there is no record of the subsidiary asset’scost, ignore this step. In addition, the cost of the replace-ment asset should be capitalized and depreciated over theremaining term of the larger piece of equipment.
(Continued)appraisal for that item. Dakota’s production managerthinks the net present value of cash flows arising fromthe use of machine C will be about $35,000. Based onthis information, the next costs are allocated to themachines:
MachineDescription Value Proportions
AllocatedCosts
Machine A $42,000 44% $35,200
Machine B 18,000 23% 18,400
Machine C 35,000 33% 26,400
Totals $95,000 100% $80,000
58 Fixed Asset Accounting
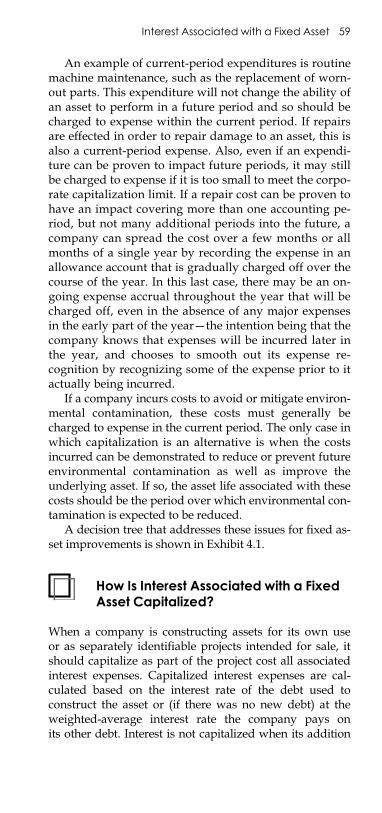
E1C04 03/04/2010 Page 59
An example of current-period expenditures is routinemachine maintenance, such as the replacement of worn-out parts. This expenditure will not change the ability ofan asset to perform in a future period and so should becharged to expense within the current period. If repairsare effected in order to repair damage to an asset, this isalso a current-period expense. Also, even if an expendi-ture can be proven to impact future periods, it may stillbe charged to expense if it is too small to meet the corpo-rate capitalization limit. If a repair cost can be proven tohave an impact covering more than one accounting pe-riod, but not many additional periods into the future, acompany can spread the cost over a few months or allmonths of a single year by recording the expense in anallowance account that is gradually charged off over thecourse of the year. In this last case, there may be an on-going expense accrual throughout the year that will becharged off, even in the absence of any major expensesin the early part of the year—the intention being that thecompany knows that expenses will be incurred later inthe year, and chooses to smooth out its expense re-cognition by recognizing some of the expense prior to itactually being incurred.
If a company incurs costs to avoid or mitigate environ-mental contamination, these costs must generally becharged to expense in the current period. The only case inwhich capitalization is an alternative is when the costsincurred can be demonstrated to reduce or prevent futureenvironmental contamination as well as improve theunderlying asset. If so, the asset life associated with thesecosts should be the period over which environmental con-tamination is expected to be reduced.
A decision tree that addresses these issues for fixed as-set improvements is shown in Exhibit 4.1.
How Is Interest Associated with a FixedAsset Capitalized?
When a company is constructing assets for its own useor as separately identifiable projects intended for sale, itshould capitalize as part of the project cost all associatedinterest expenses. Capitalized interest expenses are cal-culated based on the interest rate of the debt used toconstruct the asset or (if there was no new debt) at theweighted-average interest rate the company pays onits other debt. Interest is not capitalized when its addition
Interest Associated with a Fixed Asset 59
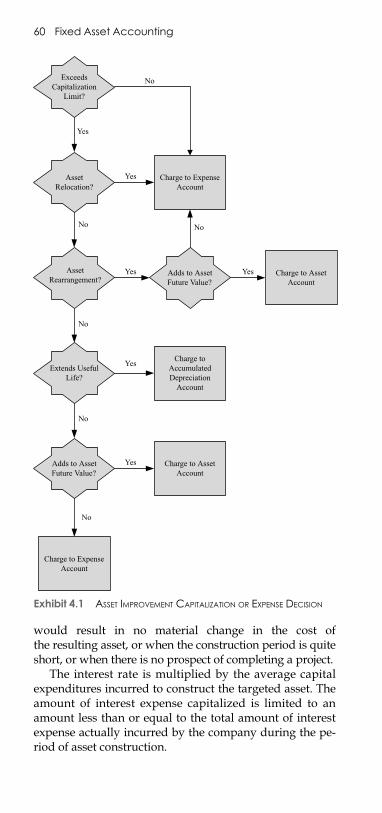
E1C04 03/04/2010 Page 60
would result in no material change in the cost ofthe resulting asset, or when the construction period is quiteshort, or when there is no prospect of completing a project.
The interest rate is multiplied by the average capitalexpenditures incurred to construct the targeted asset. Theamount of interest expense capitalized is limited to anamount less than or equal to the total amount of interestexpense actually incurred by the company during the pe-riod of asset construction.
Exceeds Capitalization
Limit?
AssetRelocation?
AssetRearrangement?
Extends Useful Life?
Adds to Asset Future Value?
Charge to Expense Account
Adds to Asset Future Value?
Charge to Asset Account
Charge to Expense Account
Charge to Asset Account
Charge to Accumulated Depreciation
Account
No
Yes
YesYes
Yes
Yes
No
No
No
No
Yes
No
Exhibit 4.1 ASSET IMPROVEMENT CAPITALIZATION OR EXPENSE DECISION
60 Fixed Asset Accounting
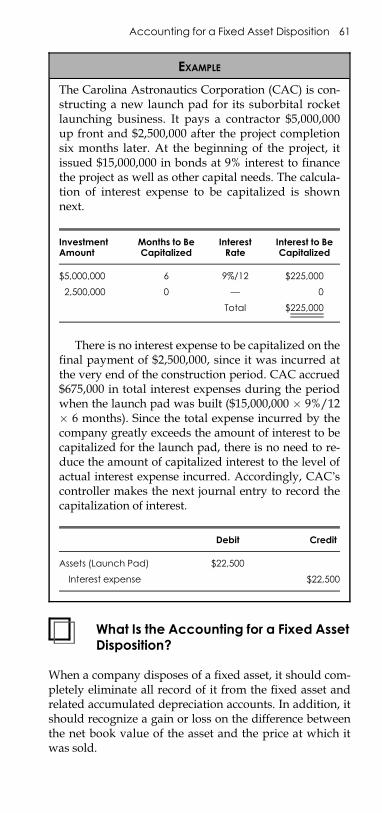
E1C04 03/04/2010 Page 61
What Is the Accounting for a Fixed AssetDisposition?
When a company disposes of a fixed asset, it should com-pletely eliminate all record of it from the fixed asset andrelated accumulated depreciation accounts. In addition, itshould recognize a gain or loss on the difference betweenthe net book value of the asset and the price at which itwas sold.
EXAMPLE
The Carolina Astronautics Corporation (CAC) is con-structing a new launch pad for its suborbital rocketlaunching business. It pays a contractor $5,000,000up front and $2,500,000 after the project completionsix months later. At the beginning of the project, itissued $15,000,000 in bonds at 9% interest to financethe project as well as other capital needs. The calcula-tion of interest expense to be capitalized is shownnext.
InvestmentAmount
Months to BeCapitalized
InterestRate
Interest to BeCapitalized
$5,000,000 6 9%/12 $225,000
2,500,000 0 — 0
Total $225,000
There is no interest expense to be capitalized on thefinal payment of $2,500,000, since it was incurred atthe very end of the construction period. CAC accrued$675,000 in total interest expenses during the periodwhen the launch pad was built ($15,000,000 � 9%/12� 6 months). Since the total expense incurred by thecompany greatly exceeds the amount of interest to becapitalized for the launch pad, there is no need to re-duce the amount of capitalized interest to the level ofactual interest expense incurred. Accordingly, CAC’scontroller makes the next journal entry to record thecapitalization of interest.
Debit Credit
Assets (Launch Pad) $22,500
Interest expense $22,500
Accounting for a Fixed Asset Disposition 61
E1C04 03/04/2010 Page 62
What Is the Accounting for an AssetRetirement Obligation?
There may be identifiable costs associated with an assetdisposition that are required by a legal agreement,known as an asset retirement obligation (ARO). For exam-ple, a building lease may require the lessee to removeall equipment by the termination date of the lease; thecost of this obligation should be recognized at the timethe lease is signed. As another example, the passage oflegislation requiring the cleanup of hazardous wastesites would require the recognition of these costs assoon as the legislation is passed.
The amount of ARO recorded is the range of cashflows associated with asset disposition that would becharged by a third party, summarized by their probabilityweightings. This amount is then discounted at the com-pany’s credit-adjusted risk-free interest rate. The risk-freeinterest rate can be obtained from the rates at which zero-coupon United States Treasury instruments are selling.
If there are upward adjustments to the amount ofthe ARO in subsequent periods, these adjustments areaccounted for in the same manner, with the present valuefor each one being derived from the credit-adjusted risk-free rate at the time of the transaction. These incrementaltransactions are recorded separately in the fixed asset reg-ister, though their depreciation periods and methods willall match that of the underlying asset. If a reduction of theARO occurs in any period, this amount should be recog-nized as a gain in the current period, with the amountbeing offset pro rata against all layers of ARO recorded inthe fixed asset register.
EXAMPLE
Company ABC is selling a machine that was origi-nally purchased for $10,000 and against which $9,000of depreciation has been recorded. The sale price ofthe used machine is $1,500. The proper journal entryis to credit the fixed asset account for $10,000 (therebyremoving the machine from the fixed asset journal),debit the accumulated depreciation account for $9,000(thereby removing all related depreciation from theaccumulated depreciation account), debit the cashaccount for $1,500 (to reflect the receipt of cash fromthe asset sale), and credit the Gain on Sale of Assetsaccount for $500.
62 Fixed Asset Accounting
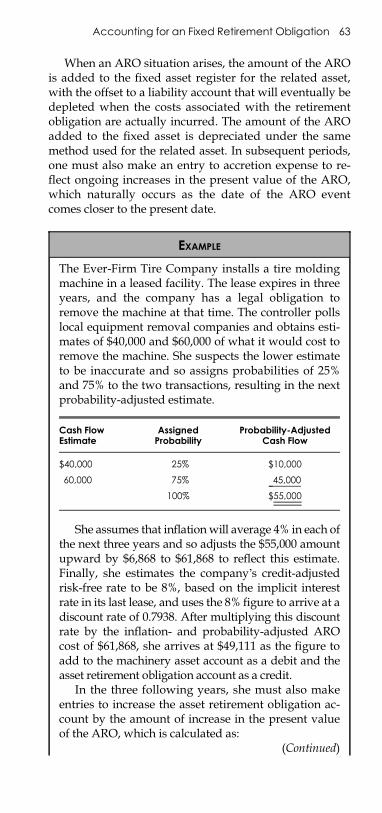
E1C04 03/04/2010 Page 63
When an ARO situation arises, the amount of the AROis added to the fixed asset register for the related asset,with the offset to a liability account that will eventually bedepleted when the costs associated with the retirementobligation are actually incurred. The amount of the AROadded to the fixed asset is depreciated under the samemethod used for the related asset. In subsequent periods,one must also make an entry to accretion expense to re-flect ongoing increases in the present value of the ARO,which naturally occurs as the date of the ARO eventcomes closer to the present date.
EXAMPLE
The Ever-Firm Tire Company installs a tire moldingmachine in a leased facility. The lease expires in threeyears, and the company has a legal obligation toremove the machine at that time. The controller pollslocal equipment removal companies and obtains esti-mates of $40,000 and $60,000 of what it would cost toremove the machine. She suspects the lower estimateto be inaccurate and so assigns probabilities of 25%and 75% to the two transactions, resulting in the nextprobability-adjusted estimate.
Cash FlowEstimate
AssignedProbability
Probability-AdjustedCash Flow
$40,000 25% $10,000
60,000 75% 45,000
100% $55,000
She assumes that inflationwill average 4% in each ofthe next three years and so adjusts the $55,000 amountupward by $6,868 to $61,868 to reflect this estimate.Finally, she estimates the company’s credit-adjustedrisk-free rate to be 8%, based on the implicit interestrate in its last lease, and uses the 8% figure to arrive at adiscount rate of 0.7938. After multiplying this discountrate by the inflation- and probability-adjusted AROcost of $61,868, she arrives at $49,111 as the figure toadd to the machinery asset account as a debit and theasset retirement obligation account as a credit.
In the three following years, she must also makeentries to increase the asset retirement obligation ac-count by the amount of increase in the present valueof the ARO, which is calculated as:
(Continued)
Accounting for an Fixed Retirement Obligation 63
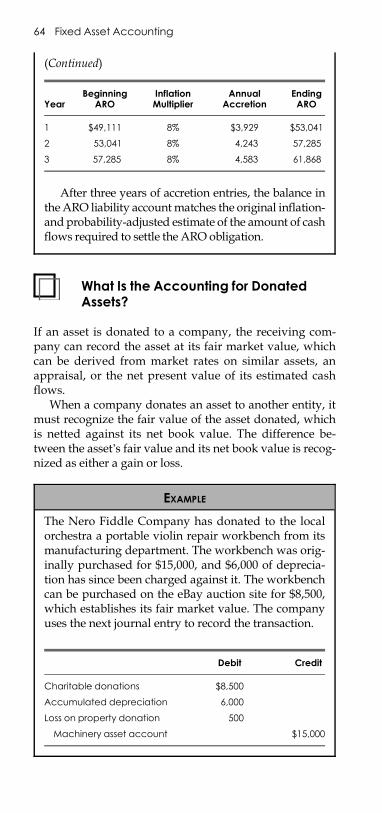
E1C04 03/04/2010 Page 64
What Is the Accounting for DonatedAssets?
If an asset is donated to a company, the receiving com-pany can record the asset at its fair market value, whichcan be derived from market rates on similar assets, anappraisal, or the net present value of its estimated cashflows.
When a company donates an asset to another entity, itmust recognize the fair value of the asset donated, whichis netted against its net book value. The difference be-tween the asset’s fair value and its net book value is recog-nized as either a gain or loss.
(Continued)
YearBeginning
AROInflationMultiplier
AnnualAccretion
EndingARO
1 $49,111 8% $3,929 $53,041
2 53,041 8% 4,243 57,285
3 57,285 8% 4,583 61,868
After three years of accretion entries, the balance intheARO liability accountmatches the original inflation-and probability-adjusted estimate of the amount of cashflows required to settle the ARO obligation.
EXAMPLE
The Nero Fiddle Company has donated to the localorchestra a portable violin repair workbench from itsmanufacturing department. The workbench was orig-inally purchased for $15,000, and $6,000 of deprecia-tion has since been charged against it. The workbenchcan be purchased on the eBay auction site for $8,500,which establishes its fair market value. The companyuses the next journal entry to record the transaction.
Debit Credit
Charitable donations $8,500
Accumulated depreciation 6,000
Loss on property donation 500
Machinery asset account $15,000
64 Fixed Asset Accounting
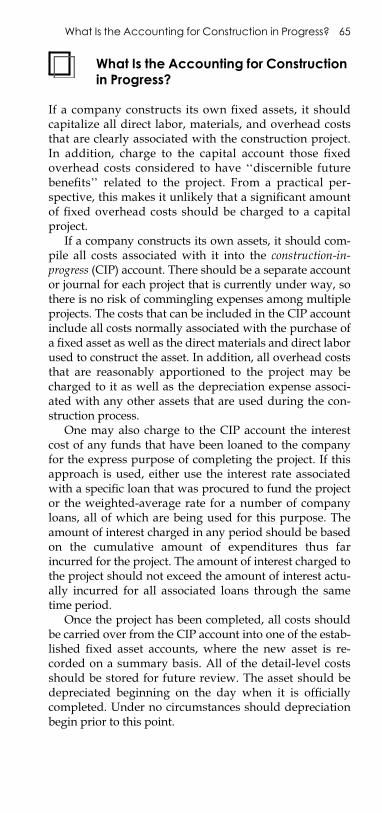
E1C04 03/04/2010 Page 65
What Is the Accounting for Constructionin Progress?
If a company constructs its own fixed assets, it shouldcapitalize all direct labor, materials, and overhead coststhat are clearly associated with the construction project.In addition, charge to the capital account those fixedoverhead costs considered to have ‘‘discernible futurebenefits’’ related to the project. From a practical per-spective, this makes it unlikely that a significant amountof fixed overhead costs should be charged to a capitalproject.
If a company constructs its own assets, it should com-pile all costs associated with it into the construction-in-progress (CIP) account. There should be a separate accountor journal for each project that is currently under way, sothere is no risk of commingling expenses among multipleprojects. The costs that can be included in the CIP accountinclude all costs normally associated with the purchase ofa fixed asset as well as the direct materials and direct laborused to construct the asset. In addition, all overhead coststhat are reasonably apportioned to the project may becharged to it as well as the depreciation expense associ-ated with any other assets that are used during the con-struction process.
One may also charge to the CIP account the interestcost of any funds that have been loaned to the companyfor the express purpose of completing the project. If thisapproach is used, either use the interest rate associatedwith a specific loan that was procured to fund the projector the weighted-average rate for a number of companyloans, all of which are being used for this purpose. Theamount of interest charged in any period should be basedon the cumulative amount of expenditures thus farincurred for the project. The amount of interest charged tothe project should not exceed the amount of interest actu-ally incurred for all associated loans through the sametime period.
Once the project has been completed, all costs shouldbe carried over from the CIP account into one of the estab-lished fixed asset accounts, where the new asset is re-corded on a summary basis. All of the detail-level costsshould be stored for future review. The asset should bedepreciated beginning on the day when it is officiallycompleted. Under no circumstances should depreciationbegin prior to this point.
What Is the Accounting for Construction in Progress? 65
E1C04 03/04/2010 Page 66
What Is the Accounting for Land?
Land cannot be depreciated, so companies tend to avoidcharging expenses to this account on the grounds thatthey cannot recognize taxable depreciation expenses.Nonetheless, those costs reasonably associated with theprocurement of land, such as real estate commissions, titleexamination fees, escrow fees, and accrued property taxespaid by the purchaser, should all be charged to the fixedasset account for land. This should also include the cost ofan option to purchase land. In addition, all subsequentcosts associated with the improvement of the land, suchas draining, clearing, and grading, should be added to theland account. The cost of interest that is associated withthe development of land should also be capitalized. Prop-erty taxes incurred during the land development processshould also be charged to the asset account but should becharged to current expenses once the development pro-cess has been completed.
What Is the Accounting for LeaseholdImprovements?
When a lessee makes improvements to a property thatis being leased from another entity, it can still capital-ize the cost of the improvements, but the time periodover which these costs can be amortized must be lim-ited to the lesser of the useful life of the improvementsor the length of the lease.
If the lease has an extension option that would allowthe lessee to increase the time period over which it canpotentially lease the property, the total period over whichthe leasehold improvements can be depreciated must stillbe limited to the initial lease term, on the grounds thatthere is no certainty that the lessee will accept the leaseextension option. This limitation is waived for depreciationpurposes only if there is either a bargain renewal option orextensive penalties in the lease contract that would make ithighly likely that the lessee would renew the lease.
How Is an Asset’s Depreciation BasisCalculated?
The basis used for an asset when conducting a deprecia-tion calculation should be its capitalized cost less any sal-vage value that the company expects to receive at the timewhen the asset is expected to be taken out of active use.
66 Fixed Asset Accounting
E1C04 03/04/2010 Page 67
The salvage value can be difficult to determine, for severalreasons.
m Removal costs. There may be a removal cost associ-ated with the asset, which will reduce the net sal-vage value that will be realized. If the equipment isespecially large or involves environmental hazards,the removal cost may exceed the salvage value. Inthis latter instance, the salvage value may be nega-tive, in which case it should be ignored for deprecia-tion purposes.
m Obsolescence. Asset obsolescence is so rapid in someindustries that a reasonable appraisal of salvagevalue at the time an asset is put into service may re-quire drastic revision shortly thereafter.
m No market. There may be no ready market for the saleof used assets.
m Appraisal cost. The cost of conducting an appraisal inorder to determine a net salvage value may be exces-sive in relation to the cost of the equipment beingappraised.
Consequently, it may be necessary to make regular re-visions to a salvage value estimate in order to reflect theongoing realities of asset resale values.
In the case of low-cost assets, it is rarely worth the ef-fort to derive salvage values for depreciation purposes; asa result, these items are typically fully depreciated on theassumption that they have no salvage value.
What Are the General DepreciationConcepts?
Depreciation is designed to spread an asset’s cost over itsentire useful service life. Its service life is the period overwhich it is worn out for any reason, at the end of which itis no longer usable, or not usable without extensive over-haul. Its useful life can also be considered terminated atthe point when it no longer has a sufficient productive ca-pacity for ongoing company production needs, renderingit essentially obsolete.
Anything can be depreciated that has a business pur-pose, has a productive life of more than one year, gradu-ally wears out over time, and whose cost exceeds thecorporate capitalization limit. Since land does not wearout, it cannot be depreciated.
If an asset is present but is temporarily idle, its depreci-ation should be continued using the existing assumptions
What Are the General Depreciation Concepts? 67
E1C04 03/04/2010 Page 68
for the usable life of the asset. Only if it is permanentlyidled should the accountant review the need to recognizeimpairment of the asset.
An asset is rarely purchased or sold precisely on thefirst or last day of the fiscal year, which brings up the is-sue of how depreciation is to be calculated in these firstand last partial years of use. One option is to record a fullyear of depreciation in the year of acquisition and no de-preciation in the year of sale. Another option is to record ahalf-year of depreciation in the first year and a half-year ofdepreciation in the last year. One can also prorate the de-preciation more precisely, making it accurate to within thenearest month (or even the nearest day) of when an acqui-sition or sale transaction occurs.
How Is Straight-Line DepreciationCalculated?
The straight-line depreciation method is the simplest methodavailable and is the most popular one when a companyhas no need to recognize depreciation costs at an acceler-ated rate. It is also used for all amortization calculations.
The straight-line method is calculated by subtractingan asset’s expected salvage value from its capitalized costand then dividing this amount by the estimated life ofthe asset.
How Is Double-Declining BalanceDepreciation Calculated?
The double-declining balance (DDB) method is the mostaggressive depreciation method for recognizing the bulkof the expense toward the beginning of an asset’s useful
EXAMPLE
A candy wrapper machine has a cost of $40,000 andan expected salvage value of $8,000. It is expected tobe in service for eight years. Given these assumptions,its annual depreciation expense is:
¼ ðCost� salvage valueÞ=number of years in service¼ ð$40; 000� $8; 000Þ=8 years¼ $32; 000=8 years¼ $4; 000 depreciation per year
68 Fixed Asset Accounting
E1C04 03/04/2010 Page 69
life. To calculate it, determine the straight-line deprecia-tion for an asset for its first year. Then double this amount,which yields the depreciation for the first year. Then sub-tract the first-year depreciation from the asset cost (usingno salvage value deduction), and run the same calculationagain for the next year. Continue to use this methodologyfor the useful life of the asset.
Note in the example that there is still some cost left atthe end of the sixth year that has not been depreciated.This is usually handled by converting over from the DDBmethod to the straight-line method in the year in whichthe straight-line method would result in a higher amountof depreciation; the straight-line method is used until allof the available depreciation has been recognized.
How Is Sum-of-the-Years’ DigitsDepreciation Calculated?
This depreciation method recognizes the bulk of all depre-ciation within the first few years of an asset’s depreciableperiod but does not do so quite as rapidly as the double-declining balance method. Its calculation can be surmisedfrom its name. For the first year of depreciation, add upthe number of years over which an asset is scheduled to
EXAMPLE
A dry cleaning machine costing $20,000 is estimatedto have a useful life of six years. Under the straight-line method, it would have depreciation of $3,333 peryear. Consequently, the first year of depreciation un-der the 200% DDB method would be double thatamount, or $6,667. The calculation for all six years ofdepreciation is noted in the next table.
YearBeginningCost Basis
Straight-LineDepreciation
200% DDBDepreciation
EndingCost Basis
1 $24,000 $3,333 $6,667 $17,333
2 17,333 2,889 5,778 11,555
3 11,555 1,926 3,852 7,703
4 7,703 1,284 2,568 5,135
5 5,135 856 1,712 3,423
6 3,423 571 1,142 2,281
Sum-of-the-Years’ Digits Depreciation 69
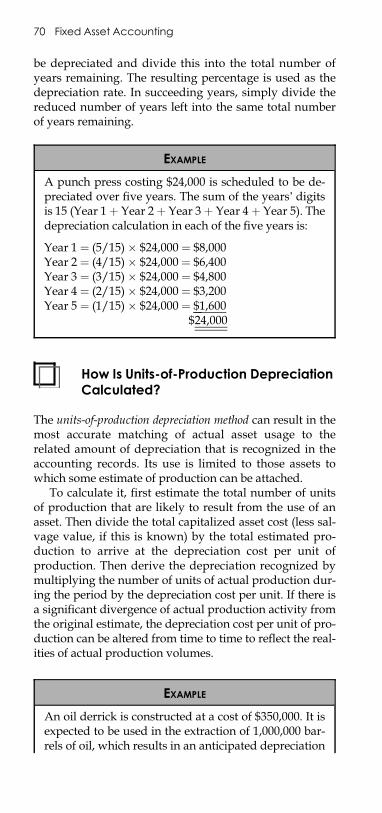
E1C04 03/04/2010 Page 70
be depreciated and divide this into the total number ofyears remaining. The resulting percentage is used as thedepreciation rate. In succeeding years, simply divide thereduced number of years left into the same total numberof years remaining.
How Is Units-of-Production DepreciationCalculated?
The units-of-production depreciation method can result in themost accurate matching of actual asset usage to therelated amount of depreciation that is recognized in theaccounting records. Its use is limited to those assets towhich some estimate of production can be attached.
To calculate it, first estimate the total number of unitsof production that are likely to result from the use of anasset. Then divide the total capitalized asset cost (less sal-vage value, if this is known) by the total estimated pro-duction to arrive at the depreciation cost per unit ofproduction. Then derive the depreciation recognized bymultiplying the number of units of actual production dur-ing the period by the depreciation cost per unit. If there isa significant divergence of actual production activity fromthe original estimate, the depreciation cost per unit of pro-duction can be altered from time to time to reflect the real-ities of actual production volumes.
EXAMPLE
A punch press costing $24,000 is scheduled to be de-preciated over five years. The sum of the years’ digitsis 15 (Year 1þ Year 2þ Year 3þ Year 4þ Year 5). Thedepreciation calculation in each of the five years is:
Year 1 ¼ (5/15) � $24,000 ¼ $8,000Year 2 ¼ (4/15) � $24,000 ¼ $6,400Year 3 ¼ (3/15) � $24,000 ¼ $4,800Year 4 ¼ (2/15) � $24,000 ¼ $3,200Year 5 ¼ (1/15) � $24,000 ¼ $1,600
$24,000
EXAMPLE
An oil derrick is constructed at a cost of $350,000. It isexpected to be used in the extraction of 1,000,000 bar-rels of oil, which results in an anticipated depreciation
70 Fixed Asset Accounting
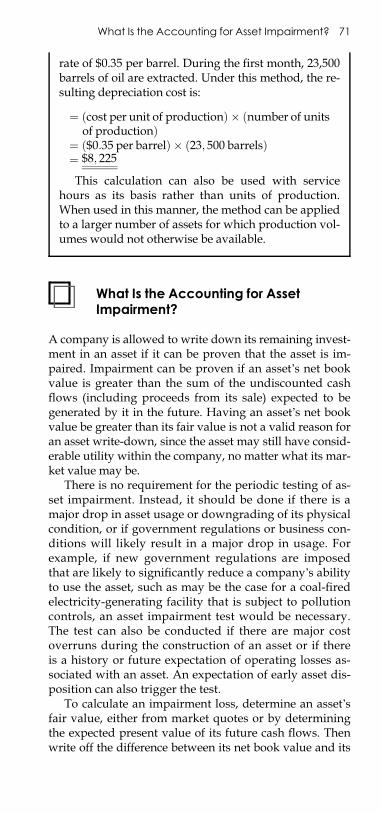
E1C04 03/04/2010 Page 71
What Is the Accounting for AssetImpairment?
A company is allowed to write down its remaining invest-ment in an asset if it can be proven that the asset is im-paired. Impairment can be proven if an asset’s net bookvalue is greater than the sum of the undiscounted cashflows (including proceeds from its sale) expected to begenerated by it in the future. Having an asset’s net bookvalue be greater than its fair value is not a valid reason foran asset write-down, since the asset may still have consid-erable utility within the company, no matter what its mar-ket value may be.
There is no requirement for the periodic testing of as-set impairment. Instead, it should be done if there is amajor drop in asset usage or downgrading of its physicalcondition, or if government regulations or business con-ditions will likely result in a major drop in usage. Forexample, if new government regulations are imposedthat are likely to significantly reduce a company’s abilityto use the asset, such as may be the case for a coal-firedelectricity-generating facility that is subject to pollutioncontrols, an asset impairment test would be necessary.The test can also be conducted if there are major costoverruns during the construction of an asset or if thereis a history or future expectation of operating losses as-sociated with an asset. An expectation of early asset dis-position can also trigger the test.
To calculate an impairment loss, determine an asset’sfair value, either from market quotes or by determiningthe expected present value of its future cash flows. Thenwrite off the difference between its net book value and its
rate of $0.35 per barrel. During the first month, 23,500barrels of oil are extracted. Under this method, the re-sulting depreciation cost is:
¼ ðcost per unit of productionÞ � ðnumber of unitsof productionÞ
¼ ð$0:35 per barrelÞ � ð23; 500 barrelsÞ¼ $8; 225
This calculation can also be used with servicehours as its basis rather than units of production.When used in this manner, the method can be appliedto a larger number of assets for which production vol-umes would not otherwise be available.
What Is the Accounting for Asset Impairment? 71
E1C04 03/04/2010 Page 72
fair value. This action may also result in a change in themethod or duration of depreciation. For example, if anasset impairment write-down is made because an asset’slife is expected to be shortened by five years, the periodover which its associated depreciation will be calculatedshould also be reduced by five years. If asset impairmentis being calculated for a group of assets (such as an entireassembly line or production facility), the amount of theasset impairment is allocated to the assets within thegroup based on their proportional net book values(though not below the separately identifiable fair value ofany asset within the group).
If an asset is no longer in use and there is no prospectfor it to be used at any point in the future, it must be writ-ten down to its expected salvage value. Since there willthen be no remaining asset value to depreciate, all depre-ciation stops at the time of the write-down.
What Is the Accounting for IntangibleAssets?
When an intangible asset is purchased, it should be capi-talized on the company books at the amount of cash forwhich it was paid. If some other asset was used inexchange for the intangible, the cost should be set at thefair market value of the asset given up. A third alternativefor costing is the present value of any liability that is as-sumed in exchange for the intangible asset. It is also possi-ble to create an intangible asset internally (such as thecreation of a customer list), as long as the detail for allcosts incurred in the creation of the intangible asset is ade-quately tracked and summarized.
If an intangible asset has an indefinite life, as demon-strated by clearly traceable cash flows well into the future,it is not amortized. Instead, it is subject to an annualimpairment test, resulting in the recognition of an impair-ment loss if its net book value exceeds its fair value. If anintangible asset in this category were to no longer have ademonstrably indefinite life, it would convert to a normalamortization schedule based on its newly defined eco-nomic life.
If any intangible asset’s usefulness is declining or evi-dently impaired, its remaining value should be writtendown to no lower than the present value of its remainingfuture cash flows.
When a company acquires another company or itsassets, any excess of the purchase price over the fair value
72 Fixed Asset Accounting
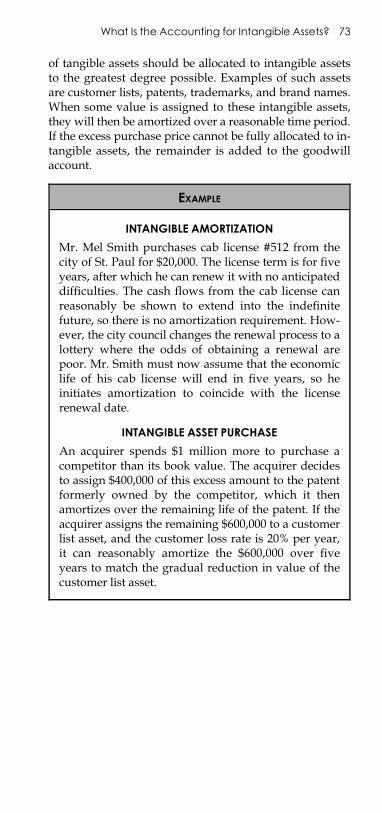
E1C04 03/04/2010 Page 73
of tangible assets should be allocated to intangible assetsto the greatest degree possible. Examples of such assetsare customer lists, patents, trademarks, and brand names.When some value is assigned to these intangible assets,they will then be amortized over a reasonable time period.If the excess purchase price cannot be fully allocated to in-tangible assets, the remainder is added to the goodwillaccount.
EXAMPLE
INTANGIBLE AMORTIZATION
Mr. Mel Smith purchases cab license #512 from thecity of St. Paul for $20,000. The license term is for fiveyears, after which he can renew it with no anticipateddifficulties. The cash flows from the cab license canreasonably be shown to extend into the indefinitefuture, so there is no amortization requirement. How-ever, the city council changes the renewal process to alottery where the odds of obtaining a renewal arepoor. Mr. Smith must now assume that the economiclife of his cab license will end in five years, so heinitiates amortization to coincide with the licenserenewal date.
INTANGIBLE ASSET PURCHASE
An acquirer spends $1 million more to purchase acompetitor than its book value. The acquirer decidesto assign $400,000 of this excess amount to the patentformerly owned by the competitor, which it thenamortizes over the remaining life of the patent. If theacquirer assigns the remaining $600,000 to a customerlist asset, and the customer loss rate is 20% per year,it can reasonably amortize the $600,000 over fiveyears to match the gradual reduction in value of thecustomer list asset.
What Is the Accounting for Intangible Assets? 73

E1C04 03/04/2010 Page 74
E1C05 03/04/2010 Page 75
CHAPTER 5
DEBT ACCOUNTING
When Is Debt Categorized as Short Termor Long Term?
It is generally not allowable to reclassify a debt that iscoming due in the short term as a long-term liability onthe grounds that it is about to be refinanced as a long-term debt. This treatment is allowable only if a companyhas the intention to refinance the debt on a long-term basisrather than simply rolling over the debt into anothershort-term debt instrument that will, in turn, become dueand payable in the next accounting year. Also, there mustbe firm evidence of this rollover into a long-term debt in-strument, such as the presence of a debt agreement or anactual conversion to long-term debt subsequent to the bal-ance sheet date.
If a debt can be called by the creditor, it must be classi-fied as a current liability. However, if the period duringwhich the creditor can call the debt is at some point sub-sequent to one year, it may still be classified as a long-term debt. Also, if the call option applies only if thecompany defaults on some performance measure relatedto the debt, the debt needs to be classified as a current lia-bility only if the company cannot cure the performancemeasure within whatever period is specified under theterms of the debt. Further, if a debt agreement containsa call provision that is likely to be activated under the cir-cumstances present as of the balance sheet date, the debtshould be classified as a current liability; conversely, if theprobability of the call provision being invoked is remote,the debt does not have to be so classified. Finally, if only aportion of the debt can be called, only that portion need beclassified as a current liability.
75
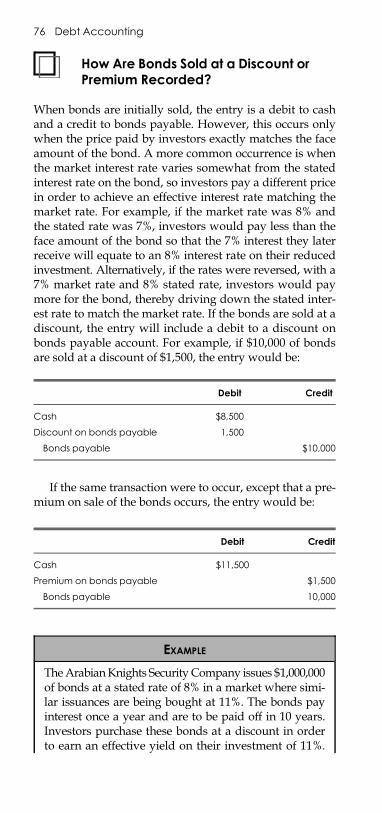
E1C05 03/04/2010 Page 76
How Are Bonds Sold at a Discount orPremium Recorded?
When bonds are initially sold, the entry is a debit to cashand a credit to bonds payable. However, this occurs onlywhen the price paid by investors exactly matches the faceamount of the bond. A more common occurrence is whenthe market interest rate varies somewhat from the statedinterest rate on the bond, so investors pay a different pricein order to achieve an effective interest rate matching themarket rate. For example, if the market rate was 8% andthe stated rate was 7%, investors would pay less than theface amount of the bond so that the 7% interest they laterreceive will equate to an 8% interest rate on their reducedinvestment. Alternatively, if the rates were reversed, with a7% market rate and 8% stated rate, investors would paymore for the bond, thereby driving down the stated inter-est rate to match the market rate. If the bonds are sold at adiscount, the entry will include a debit to a discount onbonds payable account. For example, if $10,000 of bondsare sold at a discount of $1,500, the entry would be:
Debit Credit
Cash $8,500
Discount on bonds payable 1,500
Bonds payable $10,000
If the same transaction were to occur, except that a pre-mium on sale of the bonds occurs, the entry would be:
Debit Credit
Cash $11,500
Premium on bonds payable $1,500
Bonds payable 10,000
EXAMPLE
TheArabianKnights SecurityCompany issues $1,000,000of bonds at a stated rate of 8% in a market where simi-lar issuances are being bought at 11%. The bonds payinterest once a year and are to be paid off in 10 years.Investors purchase these bonds at a discount in orderto earn an effective yield on their investment of 11%.
76 Debt Accounting
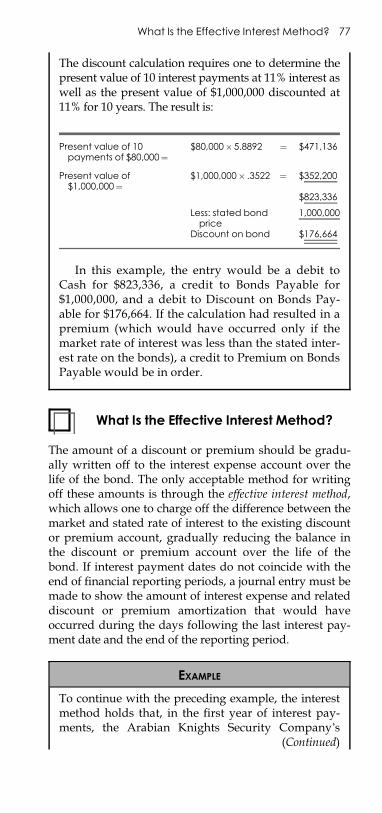
E1C05 03/04/2010 Page 77
What Is the Effective Interest Method?
The amount of a discount or premium should be gradu-ally written off to the interest expense account over thelife of the bond. The only acceptable method for writingoff these amounts is through the effective interest method,which allows one to charge off the difference between themarket and stated rate of interest to the existing discountor premium account, gradually reducing the balance inthe discount or premium account over the life of thebond. If interest payment dates do not coincide with theend of financial reporting periods, a journal entry must bemade to show the amount of interest expense and relateddiscount or premium amortization that would haveoccurred during the days following the last interest pay-ment date and the end of the reporting period.
The discount calculation requires one to determine thepresent value of 10 interest payments at 11% interest aswell as the present value of $1,000,000 discounted at11% for 10 years. The result is:
Present value of 10payments of $80,000¼
$80,000�5.8892 ¼ $471,136
Present value of$1,000,000¼
$1,000,000� .3522 ¼ $352,200
$823,336
Less: stated bondprice
1,000,000
Discount on bond $176,664
In this example, the entry would be a debit toCash for $823,336, a credit to Bonds Payable for$1,000,000, and a debit to Discount on Bonds Pay-able for $176,664. If the calculation had resulted in apremium (which would have occurred only if themarket rate of interest was less than the stated inter-est rate on the bonds), a credit to Premium on BondsPayable would be in order.
EXAMPLE
To continue with the preceding example, the interestmethod holds that, in the first year of interest pay-ments, the Arabian Knights Security Company’s
(Continued)
What Is the Effective Interest Method? 77
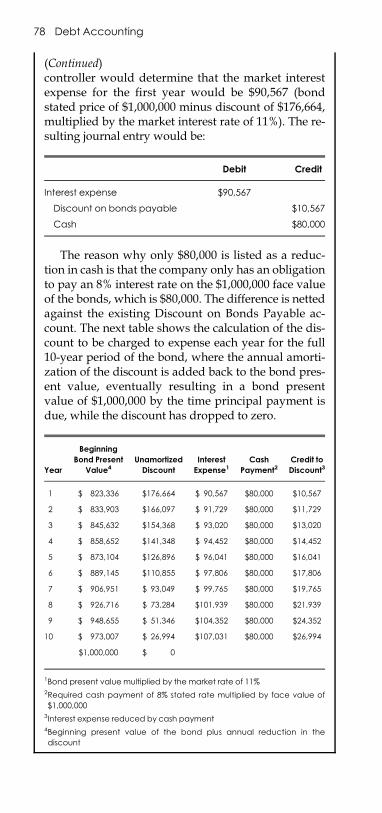
E1C05 03/04/2010 Page 78
(Continued)controller would determine that the market interestexpense for the first year would be $90,567 (bondstated price of $1,000,000 minus discount of $176,664,multiplied by the market interest rate of 11%). The re-sulting journal entry would be:
Debit Credit
Interest expense $90,567
Discount on bonds payable $10,567
Cash $80,000
The reason why only $80,000 is listed as a reduc-tion in cash is that the company only has an obligationto pay an 8% interest rate on the $1,000,000 face valueof the bonds, which is $80,000. The difference is nettedagainst the existing Discount on Bonds Payable ac-count. The next table shows the calculation of the dis-count to be charged to expense each year for the full10-year period of the bond, where the annual amorti-zation of the discount is added back to the bond pres-ent value, eventually resulting in a bond presentvalue of $1,000,000 by the time principal payment isdue, while the discount has dropped to zero.
Year
Beginning
Bond Present
Value4Unamortized
Discount
Interest
Expense1Cash
Payment2Credit to
Discount3
1 $ 823,336 $176,664 $ 90,567 $80,000 $10,567
2 $ 833,903 $166,097 $ 91,729 $80,000 $11,729
3 $ 845,632 $154,368 $ 93,020 $80,000 $13,020
4 $ 858,652 $141,348 $ 94,452 $80,000 $14,452
5 $ 873,104 $126,896 $ 96,041 $80,000 $16,041
6 $ 889,145 $110,855 $ 97,806 $80,000 $17,806
7 $ 906,951 $ 93,049 $ 99,765 $80,000 $19,765
8 $ 926,716 $ 73,284 $101,939 $80,000 $21,939
9 $ 948,655 $ 51,346 $104,352 $80,000 $24,352
10 $ 973,007 $ 26,994 $107,031 $80,000 $26,994
$1,000,000 $ 0
1Bond present value multiplied by the market rate of 11%2Required cash payment of 8% stated rate multiplied by face value of
$1,000,0003Interest expense reduced by cash payment4Beginning present value of the bond plus annual reduction in the
discount
78 Debt Accounting
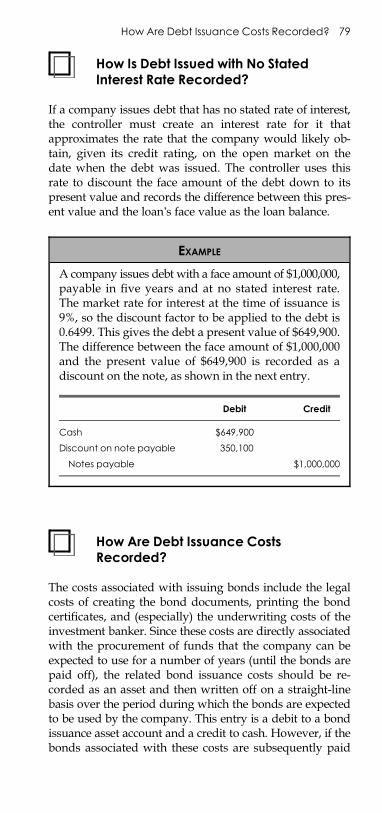
E1C05 03/04/2010 Page 79
How Is Debt Issued with No StatedInterest Rate Recorded?
If a company issues debt that has no stated rate of interest,the controller must create an interest rate for it thatapproximates the rate that the company would likely ob-tain, given its credit rating, on the open market on thedate when the debt was issued. The controller uses thisrate to discount the face amount of the debt down to itspresent value and records the difference between this pres-ent value and the loan’s face value as the loan balance.
How Are Debt Issuance CostsRecorded?
The costs associated with issuing bonds include the legalcosts of creating the bond documents, printing the bondcertificates, and (especially) the underwriting costs of theinvestment banker. Since these costs are directly associatedwith the procurement of funds that the company can beexpected to use for a number of years (until the bonds arepaid off), the related bond issuance costs should be re-corded as an asset and then written off on a straight-linebasis over the period during which the bonds are expectedto be used by the company. This entry is a debit to a bondissuance asset account and a credit to cash. However, if thebonds associated with these costs are subsequently paid
EXAMPLE
A company issues debt with a face amount of $1,000,000,payable in five years and at no stated interest rate.The market rate for interest at the time of issuance is9%, so the discount factor to be applied to the debt is0.6499. This gives the debt a present value of $649,900.The difference between the face amount of $1,000,000and the present value of $649,900 is recorded as adiscount on the note, as shown in the next entry.
Debit Credit
Cash $649,900
Discount on note payable 350,100
Notes payable $1,000,000
How Are Debt Issuance Costs Recorded? 79
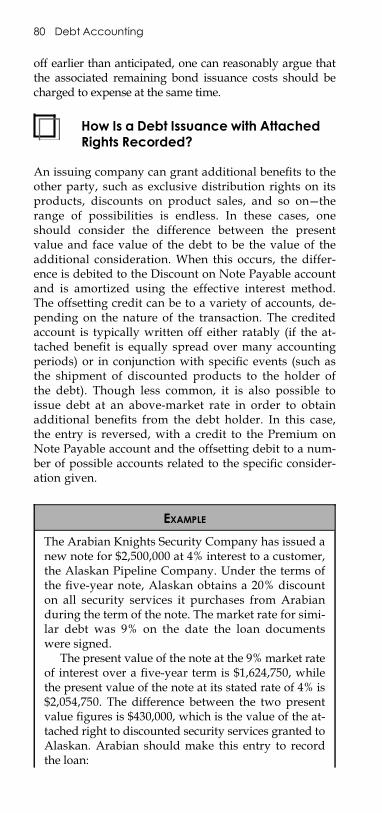
E1C05 03/04/2010 Page 80
off earlier than anticipated, one can reasonably argue thatthe associated remaining bond issuance costs should becharged to expense at the same time.
How Is a Debt Issuance with AttachedRights Recorded?
An issuing company can grant additional benefits to theother party, such as exclusive distribution rights on itsproducts, discounts on product sales, and so on—therange of possibilities is endless. In these cases, oneshould consider the difference between the presentvalue and face value of the debt to be the value of theadditional consideration. When this occurs, the differ-ence is debited to the Discount on Note Payable accountand is amortized using the effective interest method.The offsetting credit can be to a variety of accounts, de-pending on the nature of the transaction. The creditedaccount is typically written off either ratably (if the at-tached benefit is equally spread over many accountingperiods) or in conjunction with specific events (such asthe shipment of discounted products to the holder ofthe debt). Though less common, it is also possible toissue debt at an above-market rate in order to obtainadditional benefits from the debt holder. In this case,the entry is reversed, with a credit to the Premium onNote Payable account and the offsetting debit to a num-ber of possible accounts related to the specific consider-ation given.
EXAMPLE
The Arabian Knights Security Company has issued anew note for $2,500,000 at 4% interest to a customer,the Alaskan Pipeline Company. Under the terms ofthe five-year note, Alaskan obtains a 20% discounton all security services it purchases from Arabianduring the term of the note. The market rate for simi-lar debt was 9% on the date the loan documentswere signed.
The present value of the note at the 9% market rateof interest over a five-year term is $1,624,750, whilethe present value of the note at its stated rate of 4% is$2,054,750. The difference between the two presentvalue figures is $430,000, which is the value of the at-tached right to discounted security services granted toAlaskan. Arabian should make this entry to recordthe loan:
80 Debt Accounting
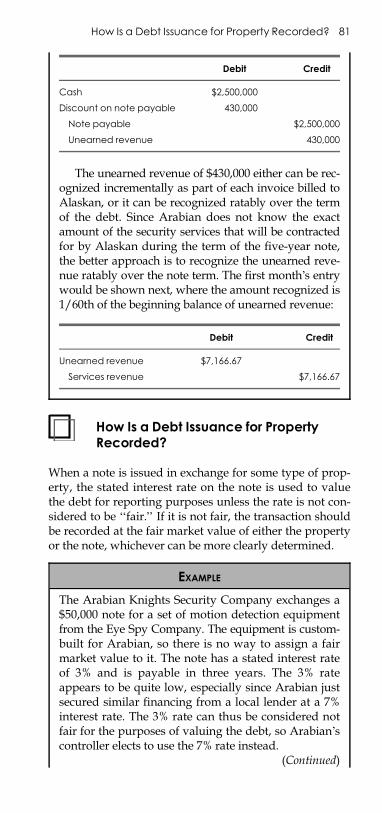
E1C05 03/04/2010 Page 81
How Is a Debt Issuance for PropertyRecorded?
When a note is issued in exchange for some type of prop-erty, the stated interest rate on the note is used to valuethe debt for reporting purposes unless the rate is not con-sidered to be ‘‘fair.’’ If it is not fair, the transaction shouldbe recorded at the fair market value of either the propertyor the note, whichever can be more clearly determined.
Debit Credit
Cash $2,500,000
Discount on note payable 430,000
Note payable $2,500,000
Unearned revenue 430,000
The unearned revenue of $430,000 either can be rec-ognized incrementally as part of each invoice billed toAlaskan, or it can be recognized ratably over the termof the debt. Since Arabian does not know the exactamount of the security services that will be contractedfor by Alaskan during the term of the five-year note,the better approach is to recognize the unearned reve-nue ratably over the note term. The first month’s entrywould be shown next, where the amount recognized is1/60th of the beginning balance of unearned revenue:
Debit Credit
Unearned revenue $7,166.67
Services revenue $7,166.67
EXAMPLE
The Arabian Knights Security Company exchanges a$50,000 note for a set of motion detection equipmentfrom the Eye Spy Company. The equipment is custom-built for Arabian, so there is no way to assign a fairmarket value to it. The note has a stated interest rateof 3% and is payable in three years. The 3% rateappears to be quite low, especially since Arabian justsecured similar financing from a local lender at a 7%interest rate. The 3% rate can thus be considered notfair for the purposes of valuing the debt, so Arabian’scontroller elects to use the 7% rate instead.
(Continued)
How Is a Debt Issuance for Property Recorded? 81
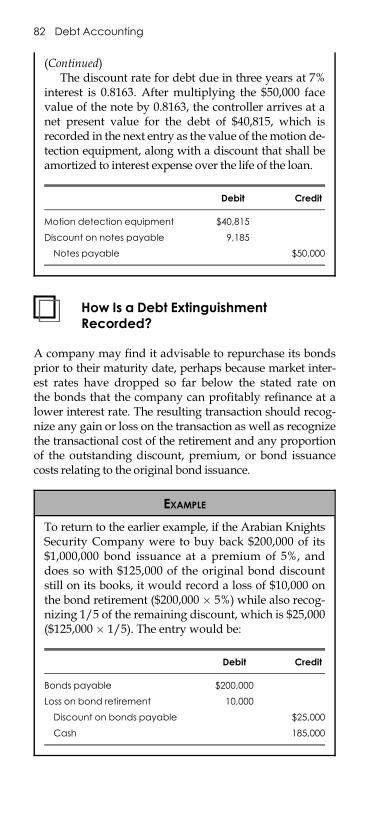
E1C05 03/04/2010 Page 82
How Is a Debt ExtinguishmentRecorded?
A company may find it advisable to repurchase its bondsprior to their maturity date, perhaps because market inter-est rates have dropped so far below the stated rate onthe bonds that the company can profitably refinance at alower interest rate. The resulting transaction should recog-nize any gain or loss on the transaction as well as recognizethe transactional cost of the retirement and any proportionof the outstanding discount, premium, or bond issuancecosts relating to the original bond issuance.
(Continued)The discount rate for debt due in three years at 7%
interest is 0.8163. After multiplying the $50,000 facevalue of the note by 0.8163, the controller arrives at anet present value for the debt of $40,815, which isrecorded in the next entry as the value of themotion de-tection equipment, along with a discount that shall beamortized to interest expense over the life of the loan.
Debit Credit
Motion detection equipment $40,815
Discount on notes payable 9,185
Notes payable $50,000
EXAMPLE
To return to the earlier example, if the Arabian KnightsSecurity Company were to buy back $200,000 of its$1,000,000 bond issuance at a premium of 5%, anddoes so with $125,000 of the original bond discountstill on its books, it would record a loss of $10,000 onthe bond retirement ($200,000 � 5%) while also recog-nizing 1/5 of the remaining discount, which is $25,000($125,000 � 1/5). The entry would be:
Debit Credit
Bonds payable $200,000
Loss on bond retirement 10,000
Discount on bonds payable $25,000
Cash 185,000
82 Debt Accounting
E1C05 03/04/2010 Page 83
How Is a Temporary or Permanent BondDefault Recorded?
If the issuing company finds itself in the position of beingunable to pay either interest or principal to its bond hold-ers, there are two directions the controller can take in re-flecting the problem in the accounting records. In the firstcase, the company may be in default only temporarily andis attempting to work out a payment solution with thebond holders. Under this scenario, the amortization of dis-counts or premiums, as well as of bond issuance costs andinterest expense, should continue as they have in the past.However, if there is no chance of payment, the amortiza-tion of discounts or premiums, as well as of bond issuancecosts, should be accelerated, being recognized in full inthe current period. This action is taken on the groundsthat the underlying accounting transaction that specifiedthe period over which the amortizations occurred hasnow disappeared, requiring the controller to recognize allremaining expenses.
How Is a Restructured Bond ObligationRecorded?
If the issuing company has not defaulted on a debt butrather has restructured its terms, the controller must deter-mine the present value of the new stream of cash flows andcompare it to the original carrying value of the debt ar-rangement. In the likely event that the new present valueof the debt is less than the original present value, the differ-ence should be recognized in the current period as a gain.
Alternatively, if the present value of the restructureddebt agreement is more than the carrying value of the orig-inal agreement, a loss is not recognized on the difference;instead, the effective interest rate on the new stream ofdebt payments is reduced to the point where the resultingpresent value of the restructured debt matches the carry-ing value of the original agreement. This will result in areduced amount of interest expense being accrued for allfuture periods during which the debt is outstanding.
How Is an Asset Transfer to EliminateDebt Recorded?
A company may be unable to pay its bond holders and sogives them other company assets in exchange for theinterest or principal payments owed to them. When this
How Is an Asset Transfer to Eliminate Debt Recorded? 83
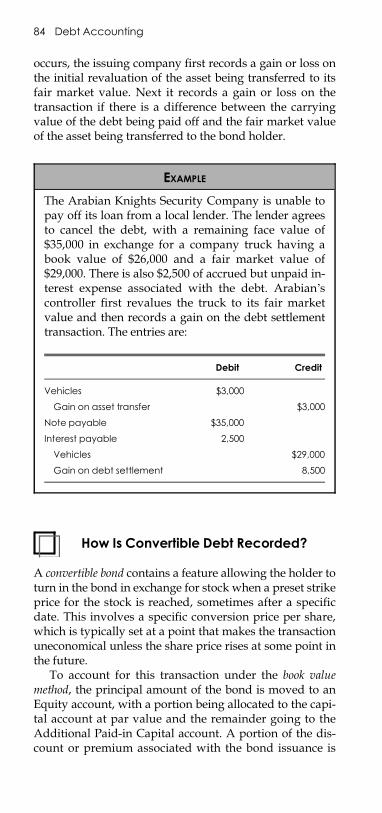
E1C05 03/04/2010 Page 84
occurs, the issuing company first records a gain or loss onthe initial revaluation of the asset being transferred to itsfair market value. Next it records a gain or loss on thetransaction if there is a difference between the carryingvalue of the debt being paid off and the fair market valueof the asset being transferred to the bond holder.
How Is Convertible Debt Recorded?
A convertible bond contains a feature allowing the holder toturn in the bond in exchange for stock when a preset strikeprice for the stock is reached, sometimes after a specificdate. This involves a specific conversion price per share,which is typically set at a point that makes the transactionuneconomical unless the share price rises at some point inthe future.
To account for this transaction under the book valuemethod, the principal amount of the bond is moved to anEquity account, with a portion being allocated to the capi-tal account at par value and the remainder going to theAdditional Paid-in Capital account. A portion of the dis-count or premium associated with the bond issuance is
EXAMPLE
The Arabian Knights Security Company is unable topay off its loan from a local lender. The lender agreesto cancel the debt, with a remaining face value of$35,000 in exchange for a company truck having abook value of $26,000 and a fair market value of$29,000. There is also $2,500 of accrued but unpaid in-terest expense associated with the debt. Arabian’scontroller first revalues the truck to its fair marketvalue and then records a gain on the debt settlementtransaction. The entries are:
Debit Credit
Vehicles $3,000
Gain on asset transfer $3,000
Note payable $35,000
Interest payable 2,500
Vehicles $29,000
Gain on debt settlement 8,500
84 Debt Accounting
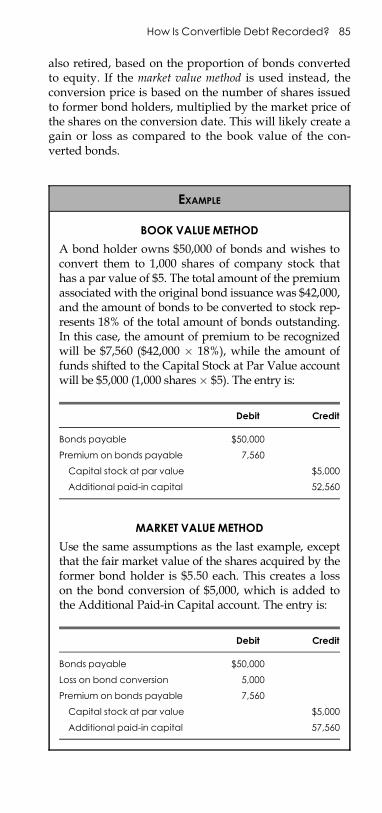
E1C05 03/04/2010 Page 85
also retired, based on the proportion of bonds convertedto equity. If the market value method is used instead, theconversion price is based on the number of shares issuedto former bond holders, multiplied by the market price ofthe shares on the conversion date. This will likely create again or loss as compared to the book value of the con-verted bonds.
EXAMPLE
BOOK VALUE METHOD
A bond holder owns $50,000 of bonds and wishes toconvert them to 1,000 shares of company stock thathas a par value of $5. The total amount of the premiumassociated with the original bond issuance was $42,000,and the amount of bonds to be converted to stock rep-resents 18% of the total amount of bonds outstanding.In this case, the amount of premium to be recognizedwill be $7,560 ($42,000 � 18%), while the amount offunds shifted to the Capital Stock at Par Value accountwill be $5,000 (1,000 shares� $5). The entry is:
Debit Credit
Bonds payable $50,000
Premium on bonds payable 7,560
Capital stock at par value $5,000
Additional paid-in capital 52,560
MARKET VALUE METHOD
Use the same assumptions as the last example, exceptthat the fair market value of the shares acquired by theformer bond holder is $5.50 each. This creates a losson the bond conversion of $5,000, which is added tothe Additional Paid-in Capital account. The entry is:
Debit Credit
Bonds payable $50,000
Loss on bond conversion 5,000
Premium on bonds payable 7,560
Capital stock at par value $5,000
Additional paid-in capital 57,560
How Is Convertible Debt Recorded? 85
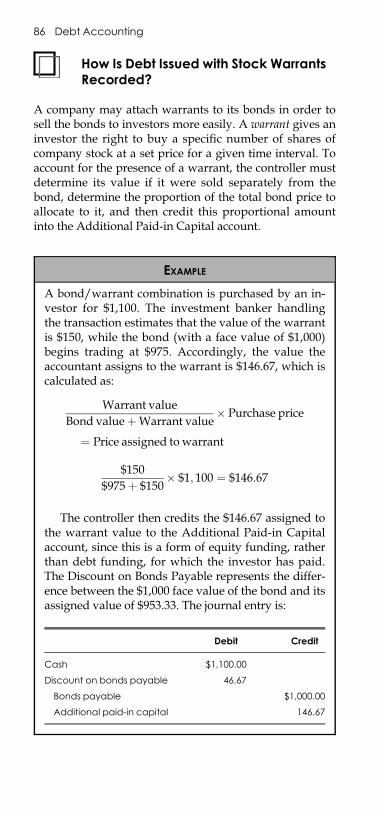
E1C05 03/04/2010 Page 86
How Is Debt Issued with Stock WarrantsRecorded?
A company may attach warrants to its bonds in order tosell the bonds to investors more easily. A warrant gives aninvestor the right to buy a specific number of shares ofcompany stock at a set price for a given time interval. Toaccount for the presence of a warrant, the controller mustdetermine its value if it were sold separately from thebond, determine the proportion of the total bond price toallocate to it, and then credit this proportional amountinto the Additional Paid-in Capital account.
EXAMPLE
A bond/warrant combination is purchased by an in-vestor for $1,100. The investment banker handlingthe transaction estimates that the value of the warrantis $150, while the bond (with a face value of $1,000)begins trading at $975. Accordingly, the value theaccountant assigns to the warrant is $146.67, which iscalculated as:
Warrant valueBond valueþWarrant value
� Purchase price
¼ Price assigned to warrant
$150$975þ $150
� $1; 100 ¼ $146:67
The controller then credits the $146.67 assigned tothe warrant value to the Additional Paid-in Capitalaccount, since this is a form of equity funding, ratherthan debt funding, for which the investor has paid.The Discount on Bonds Payable represents the differ-ence between the $1,000 face value of the bond and itsassigned value of $953.33. The journal entry is:
Debit Credit
Cash $1,100.00
Discount on bonds payable 46.67
Bonds payable $1,000.00
Additional paid-in capital 146.67
86 Debt Accounting
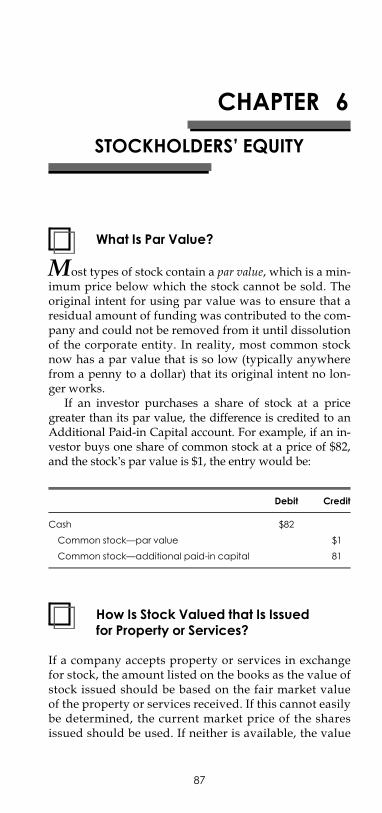
E1C06 03/04/2010 Page 87
CHAPTER 6
STOCKHOLDERS’ EQUITY
What Is Par Value?
Most types of stock contain a par value, which is a min-imum price below which the stock cannot be sold. Theoriginal intent for using par value was to ensure that aresidual amount of funding was contributed to the com-pany and could not be removed from it until dissolutionof the corporate entity. In reality, most common stocknow has a par value that is so low (typically anywherefrom a penny to a dollar) that its original intent no lon-ger works.
If an investor purchases a share of stock at a pricegreater than its par value, the difference is credited to anAdditional Paid-in Capital account. For example, if an in-vestor buys one share of common stock at a price of $82,and the stock’s par value is $1, the entry would be:
Debit Credit
Cash $82
Common stock—par value $1
Common stock—additional paid-in capital 81
How Is Stock Valued that Is Issuedfor Property or Services?
If a company accepts property or services in exchangefor stock, the amount listed on the books as the value ofstock issued should be based on the fair market valueof the property or services received. If this cannot easilybe determined, the current market price of the sharesissued should be used. If neither is available, the value
87
E1C06 03/04/2010 Page 88
assigned by the board of directors at the time of issu-ance is assumed to be the fair market value.
What Are the Characteristics ofPreferred Stock?
Preferred stock is stock that has few (or none) of the rightsconferred upon common stock but that offers a variety ofincentives, such as guaranteed dividend payments andpreferential distributions over common stock, to convinceinvestors to buy it. The dividends can also be preconfig-ured to increase to a higher level at a later date, which iscalled increasing rate preferred stock.
The dividends provided for in a preferred stock agree-ment can be distributed only after the approval of theboard of directors, and so may be withheld. If the pre-ferred stock has a cumulative provision, any dividendsnot paid to the holders of preferred shares in precedingyears must be paid prior to dividend payments for anyother types of shares. Also, some preferred stock will giveits owners voting rights in the event of one or moremissed dividend payments.
Many companies issue preferred stock with a call fea-ture stating the price at which the company will buy backthe shares.
What Is Convertible Preferred Stock?
Preferred stock may be converted by the shareholder intocommon stock at a preset ratio, if the preferred stockagreement specifies that this option is available. If thisconversion occurs, the controller must reduce the ParValue and Additional Paid-in Capital accounts for thepreferred stock by the amount at which the preferredstock was purchased and then shift these funds into thesame common stock funds.
EXAMPLE
If a shareholder of preferred stock was to convert oneshare of the Grinch Toy Removal Company’s pre-ferred stock into five shares of its common stock, thejournal entry would be as shown next, on the assump-tion that the preferred stock was bought for $145, thatthe par value of the preferred stock is $50, and the parvalue of the common stock is $1:
88 Stockholders’ Equity
E1C06 03/04/2010 Page 89
What Is a Stock Split?
A stock split involves the issuance of a multiple of the cur-rent number of shares outstanding to current sharehold-ers. For example, a one-for-two split of shares when thereare currently 125,000 shares outstanding will result in anew amount outstanding of 250,000. This is done to re-duce the market price on a per-share basis. In addition, bydropping the price into a lower range, it can have the ef-fect of making it more affordable to small investors, whomay then bid up the price to a point where the split stockis cumulatively more valuable than the unsplit stock.
A stock split is typically accompanied by a proportionalreduction in the par value of the stock. For example, if ashare with a par value of $20 were to be split on a two-for-one basis, the par value of the split stock would be $10 per
Debit Credit
Preferred stock—par value $50
Preferred stock—additional paid-in capital 95
Common stock—par value $5
Common stock—additional paid-in capital 140
In the journal entry, the par value account for thecommon stock reflects the purchase of five shares,since the par value of five individual shares (i.e., $5)has been recorded, with the remaining excess fundsfrom the preferred stock being recorded in the Addi-tional Paid-in Capital account. However, if the parvalue of the common stock were to be greater thanthe entire purchase price of the preferred stock, thejournal entry changes to bring in extra funds fromthe Retained Aarnings account in order to make upthe difference. If this were to occur with the previousassumptions, except with a common stock par valueof $40, the journal entry is:
Debit Credit
Preferred stock—par value $50
Preferred stock—additional paid-in capital 95
Retained earnings 55
Common stock—par value $200
What Is a Stock Split? 89
E1C06 03/04/2010 Page 90
share. This transaction requires no entry on a company’sbooks. However, if the split occurs without a change in thepar value, funds must be shifted from the Additional Paid-in Capital account to the Par Value account.
A reverse split is used if a company wishes to proportion-ally increase the market price of its stock. For example, if acompany’s common stock sells for $2.35 per share and man-agement wishes to see the price trade above the $20 pricepoint, it can conduct a 10-for-1 reverse split, which will raisethe market price to $23.50 per share while reducing thenumber of outstanding shares by 90%. In this case, the parvalue per share would be increased proportionally, so thatno funds were ever removed from the Par Value account.
What Is a Stock Subscription?
Stock subscriptions allow investors or employees to pay a com-pany a consistent amount over time and receive shares of thecompany’s stock in exchange. When such an arrangementoccurs, a receivable is set up for the full amount expected,with an offset to a Common Stock Subscription account andthe Additional Paid-in Capital account (for the par value ofthe subscribed shares). When the cash is collected and thestock is issued, the funds are deducted from these accountsand shifted to the Standard Common Stock account.
EXAMPLE
EXAMPLE OF A STOCK SUBSCRIPTION
If the Slo-Mo Molasses Company sets up a stock sub-scription system for its employees and they choose topurchase 10,000 shares of common stock with a parvalue of $1 for a total of $50,000, the entry would be:
EXAMPLE
If 250,000 shares were to be split on a one-for-threebasis, creating a new pool of 750,000 shares, and theexisting par value per share of $2 was not changed,the controller would have to transfer $1,000,000 (thenumber of newly created shares times the par valueof $2) from the Additional Paid-in Capital account tothe Par Value account to ensure that the legally man-dated amount of par value per share was stored there.
90 Stockholders’ Equity
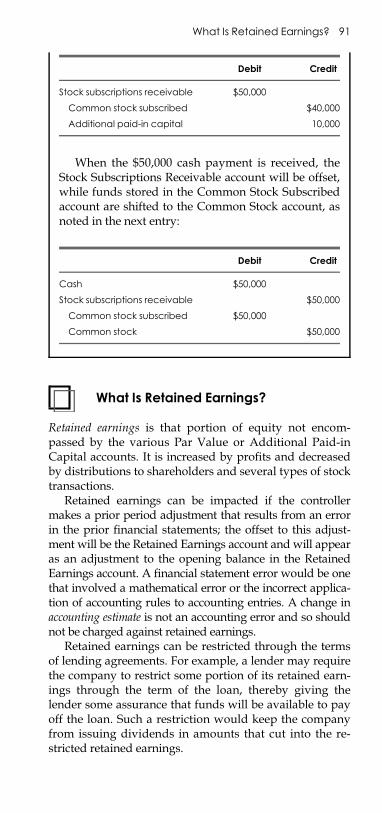
E1C06 03/04/2010 Page 91
What Is Retained Earnings?
Retained earnings is that portion of equity not encom-passed by the various Par Value or Additional Paid-inCapital accounts. It is increased by profits and decreasedby distributions to shareholders and several types of stocktransactions.
Retained earnings can be impacted if the controllermakes a prior period adjustment that results from an errorin the prior financial statements; the offset to this adjust-ment will be the Retained Earnings account and will appearas an adjustment to the opening balance in the RetainedEarnings account. A financial statement error would be onethat involved a mathematical error or the incorrect applica-tion of accounting rules to accounting entries. A change inaccounting estimate is not an accounting error and so shouldnot be charged against retained earnings.
Retained earnings can be restricted through the termsof lending agreements. For example, a lender may requirethe company to restrict some portion of its retained earn-ings through the term of the loan, thereby giving thelender some assurance that funds will be available to payoff the loan. Such a restriction would keep the companyfrom issuing dividends in amounts that cut into the re-stricted retained earnings.
Debit Credit
Stock subscriptions receivable $50,000
Common stock subscribed $40,000
Additional paid-in capital 10,000
When the $50,000 cash payment is received, theStock Subscriptions Receivable account will be offset,while funds stored in the Common Stock Subscribedaccount are shifted to the Common Stock account, asnoted in the next entry:
Debit Credit
Cash $50,000
Stock subscriptions receivable $50,000
Common stock subscribed $50,000
Common stock $50,000
What Is Retained Earnings? 91
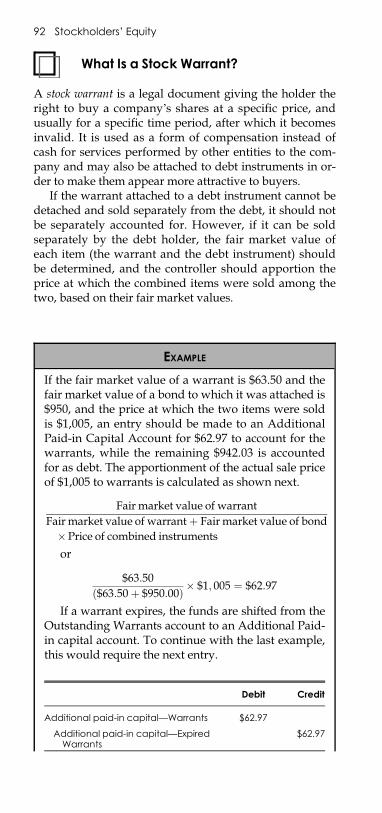
E1C06 03/04/2010 Page 92
What Is a Stock Warrant?
A stock warrant is a legal document giving the holder theright to buy a company’s shares at a specific price, andusually for a specific time period, after which it becomesinvalid. It is used as a form of compensation instead ofcash for services performed by other entities to the com-pany and may also be attached to debt instruments in or-der to make them appear more attractive to buyers.
If the warrant attached to a debt instrument cannot bedetached and sold separately from the debt, it should notbe separately accounted for. However, if it can be soldseparately by the debt holder, the fair market value ofeach item (the warrant and the debt instrument) shouldbe determined, and the controller should apportion theprice at which the combined items were sold among thetwo, based on their fair market values.
EXAMPLE
If the fair market value of a warrant is $63.50 and thefair market value of a bond to which it was attached is$950, and the price at which the two items were soldis $1,005, an entry should be made to an AdditionalPaid-in Capital Account for $62.97 to account for thewarrants, while the remaining $942.03 is accountedfor as debt. The apportionment of the actual sale priceof $1,005 to warrants is calculated as shown next.
Fair market value of warrantFair market value of warrantþ Fair market value of bond�Price of combined instruments
or
$63:50ð$63:50þ $950:00Þ � $1; 005 ¼ $62:97
If a warrant expires, the funds are shifted from theOutstanding Warrants account to an Additional Paid-in capital account. To continue with the last example,this would require the next entry.
Debit Credit
Additional paid-in capital—Warrants $62.97
Additional paid-in capital—ExpiredWarrants
$62.97
92 Stockholders’ Equity
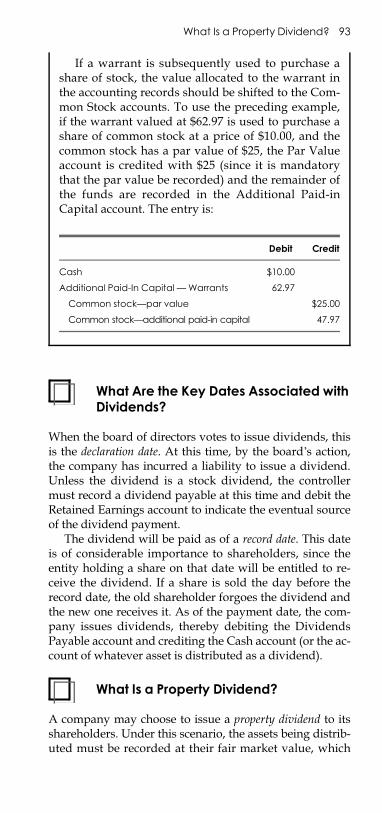
E1C06 03/04/2010 Page 93
What Are the Key Dates Associated withDividends?
When the board of directors votes to issue dividends, thisis the declaration date. At this time, by the board’s action,the company has incurred a liability to issue a dividend.Unless the dividend is a stock dividend, the controllermust record a dividend payable at this time and debit theRetained Earnings account to indicate the eventual sourceof the dividend payment.
The dividend will be paid as of a record date. This dateis of considerable importance to shareholders, since theentity holding a share on that date will be entitled to re-ceive the dividend. If a share is sold the day before therecord date, the old shareholder forgoes the dividend andthe new one receives it. As of the payment date, the com-pany issues dividends, thereby debiting the DividendsPayable account and crediting the Cash account (or the ac-count of whatever asset is distributed as a dividend).
What Is a Property Dividend?
A company may choose to issue a property dividend to itsshareholders. Under this scenario, the assets being distrib-uted must be recorded at their fair market value, which
If a warrant is subsequently used to purchase ashare of stock, the value allocated to the warrant inthe accounting records should be shifted to the Com-mon Stock accounts. To use the preceding example,if the warrant valued at $62.97 is used to purchase ashare of common stock at a price of $10.00, and thecommon stock has a par value of $25, the Par Valueaccount is credited with $25 (since it is mandatorythat the par value be recorded) and the remainder ofthe funds are recorded in the Additional Paid-inCapital account. The entry is:
Debit Credit
Cash $10.00
Additional Paid-In Capital —Warrants 62.97
Common stock—par value $25.00
Common stock—additional paid-in capital 47.97
What Is a Property Dividend? 93
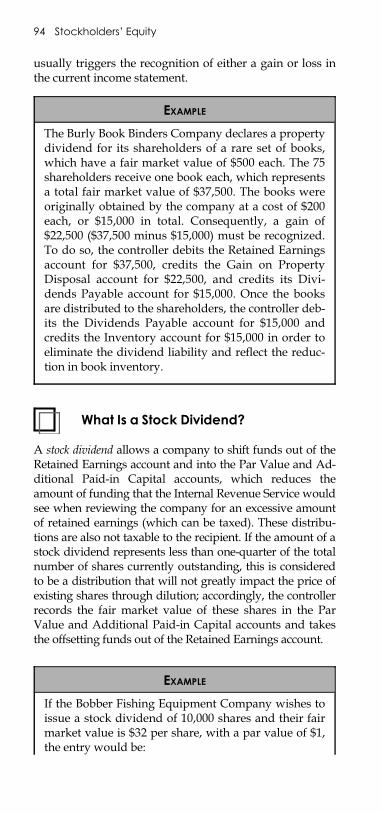
E1C06 03/04/2010 Page 94
usually triggers the recognition of either a gain or loss inthe current income statement.
What Is a Stock Dividend?
A stock dividend allows a company to shift funds out of theRetained Earnings account and into the Par Value and Ad-ditional Paid-in Capital accounts, which reduces theamount of funding that the Internal Revenue Service wouldsee when reviewing the company for an excessive amountof retained earnings (which can be taxed). These distribu-tions are also not taxable to the recipient. If the amount of astock dividend represents less than one-quarter of the totalnumber of shares currently outstanding, this is consideredto be a distribution that will not greatly impact the price ofexisting shares through dilution; accordingly, the controllerrecords the fair market value of these shares in the ParValue and Additional Paid-in Capital accounts and takesthe offsetting funds out of the Retained Earnings account.
EXAMPLE
If the Bobber Fishing Equipment Company wishes toissue a stock dividend of 10,000 shares and their fairmarket value is $32 per share, with a par value of $1,the entry would be:
EXAMPLE
The Burly Book Binders Company declares a propertydividend for its shareholders of a rare set of books,which have a fair market value of $500 each. The 75shareholders receive one book each, which representsa total fair market value of $37,500. The books wereoriginally obtained by the company at a cost of $200each, or $15,000 in total. Consequently, a gain of$22,500 ($37,500 minus $15,000) must be recognized.To do so, the controller debits the Retained Earningsaccount for $37,500, credits the Gain on PropertyDisposal account for $22,500, and credits its Divi-dends Payable account for $15,000. Once the booksare distributed to the shareholders, the controller deb-its the Dividends Payable account for $15,000 andcredits the Inventory account for $15,000 in order toeliminate the dividend liability and reflect the reduc-tion in book inventory.
94 Stockholders’ Equity
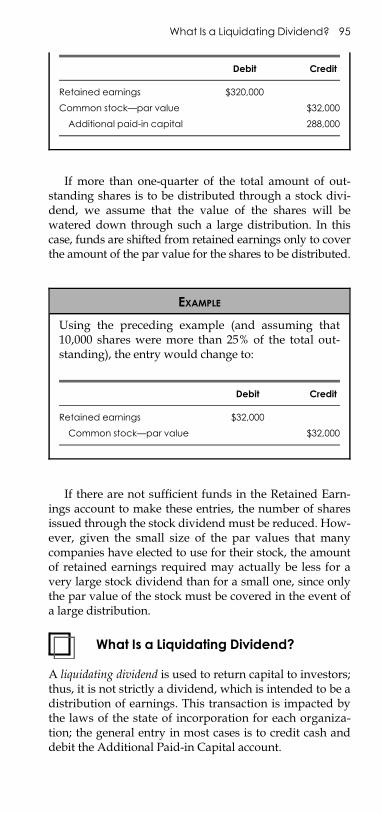
E1C06 03/04/2010 Page 95
If more than one-quarter of the total amount of out-standing shares is to be distributed through a stock divi-dend, we assume that the value of the shares will bewatered down through such a large distribution. In thiscase, funds are shifted from retained earnings only to coverthe amount of the par value for the shares to be distributed.
If there are not sufficient funds in the Retained Earn-ings account to make these entries, the number of sharesissued through the stock dividend must be reduced. How-ever, given the small size of the par values that manycompanies have elected to use for their stock, the amountof retained earnings required may actually be less for avery large stock dividend than for a small one, since onlythe par value of the stock must be covered in the event ofa large distribution.
What Is a Liquidating Dividend?
A liquidating dividend is used to return capital to investors;thus, it is not strictly a dividend, which is intended to be adistribution of earnings. This transaction is impacted bythe laws of the state of incorporation for each organiza-tion; the general entry in most cases is to credit cash anddebit the Additional Paid-in Capital account.
EXAMPLE
Using the preceding example (and assuming that10,000 shares were more than 25% of the total out-standing), the entry would change to:
Debit Credit
Retained earnings $32,000
Common stock—par value $32,000
Debit Credit
Retained earnings $320,000
Common stock—par value $32,000
Additional paid-in capital 288,000
What Is a Liquidating Dividend? 95
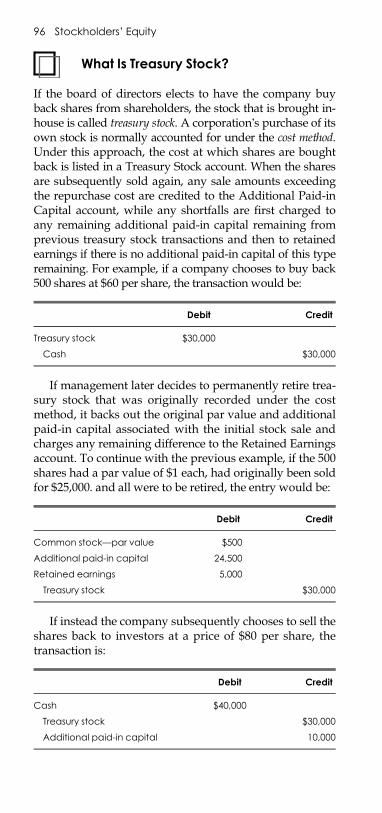
E1C06 03/04/2010 Page 96
What Is Treasury Stock?
If the board of directors elects to have the company buyback shares from shareholders, the stock that is brought in-house is called treasury stock. A corporation’s purchase of itsown stock is normally accounted for under the cost method.Under this approach, the cost at which shares are boughtback is listed in a Treasury Stock account. When the sharesare subsequently sold again, any sale amounts exceedingthe repurchase cost are credited to the Additional Paid-inCapital account, while any shortfalls are first charged toany remaining additional paid-in capital remaining fromprevious treasury stock transactions and then to retainedearnings if there is no additional paid-in capital of this typeremaining. For example, if a company chooses to buy back500 shares at $60 per share, the transaction would be:
Debit Credit
Treasury stock $30,000
Cash $30,000
If management later decides to permanently retire trea-sury stock that was originally recorded under the costmethod, it backs out the original par value and additionalpaid-in capital associated with the initial stock sale andcharges any remaining difference to the Retained Earningsaccount. To continue with the previous example, if the 500shares had a par value of $1 each, had originally been soldfor $25,000. and all were to be retired, the entry would be:
Debit Credit
Common stock—par value $500
Additional paid-in capital 24,500
Retained earnings 5,000
Treasury stock $30,000
If instead the company subsequently chooses to sell theshares back to investors at a price of $80 per share, thetransaction is:
Debit Credit
Cash $40,000
Treasury stock $30,000
Additional paid-in capital 10,000
96 Stockholders’ Equity
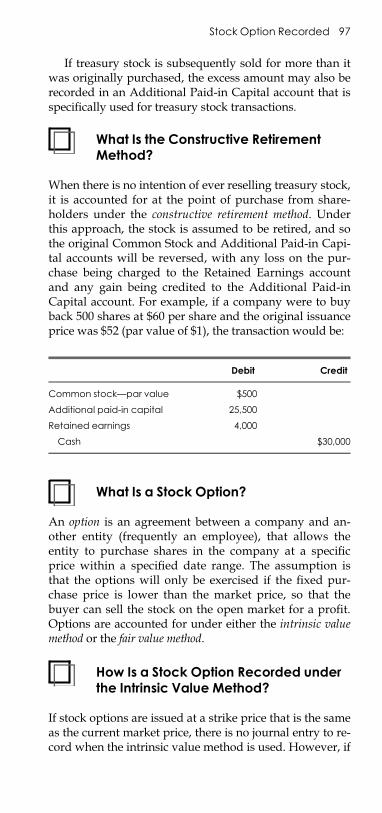
E1C06 03/04/2010 Page 97
If treasury stock is subsequently sold for more than itwas originally purchased, the excess amount may also berecorded in an Additional Paid-in Capital account that isspecifically used for treasury stock transactions.
What Is the Constructive RetirementMethod?
When there is no intention of ever reselling treasury stock,it is accounted for at the point of purchase from share-holders under the constructive retirement method. Underthis approach, the stock is assumed to be retired, and sothe original Common Stock and Additional Paid-in Capi-tal accounts will be reversed, with any loss on the pur-chase being charged to the Retained Earnings accountand any gain being credited to the Additional Paid-inCapital account. For example, if a company were to buyback 500 shares at $60 per share and the original issuanceprice was $52 (par value of $1), the transaction would be:
Debit Credit
Common stock—par value $500
Additional paid-in capital 25,500
Retained earnings 4,000
Cash $30,000
What Is a Stock Option?
An option is an agreement between a company and an-other entity (frequently an employee), that allows theentity to purchase shares in the company at a specificprice within a specified date range. The assumption isthat the options will only be exercised if the fixed pur-chase price is lower than the market price, so that thebuyer can sell the stock on the open market for a profit.Options are accounted for under either the intrinsic valuemethod or the fair value method.
How Is a Stock Option Recorded underthe Intrinsic Value Method?
If stock options are issued at a strike price that is the sameas the current market price, there is no journal entry to re-cord when the intrinsic value method is used. However, if
Stock Option Recorded 97
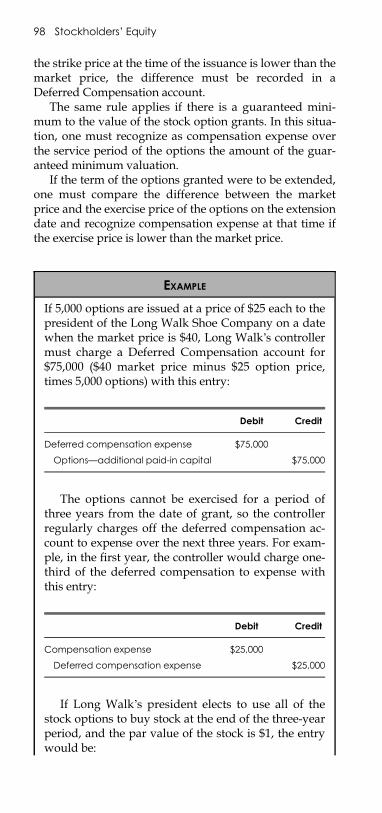
E1C06 03/04/2010 Page 98
the strike price at the time of the issuance is lower than themarket price, the difference must be recorded in aDeferred Compensation account.
The same rule applies if there is a guaranteed mini-mum to the value of the stock option grants. In this situa-tion, one must recognize as compensation expense overthe service period of the options the amount of the guar-anteed minimum valuation.
If the term of the options granted were to be extended,one must compare the difference between the marketprice and the exercise price of the options on the extensiondate and recognize compensation expense at that time ifthe exercise price is lower than the market price.
EXAMPLE
If 5,000 options are issued at a price of $25 each to thepresident of the Long Walk Shoe Company on a datewhen the market price is $40, Long Walk’s controllermust charge a Deferred Compensation account for$75,000 ($40 market price minus $25 option price,times 5,000 options) with this entry:
Debit Credit
Deferred compensation expense $75,000
Options—additional paid-in capital $75,000
The options cannot be exercised for a period ofthree years from the date of grant, so the controllerregularly charges off the deferred compensation ac-count to expense over the next three years. For exam-ple, in the first year, the controller would charge one-third of the deferred compensation to expense withthis entry:
Debit Credit
Compensation expense $25,000
Deferred compensation expense $25,000
If Long Walk’s president elects to use all of thestock options to buy stock at the end of the three-yearperiod, and the par value of the stock is $1, the entrywould be:
98 Stockholders’ Equity
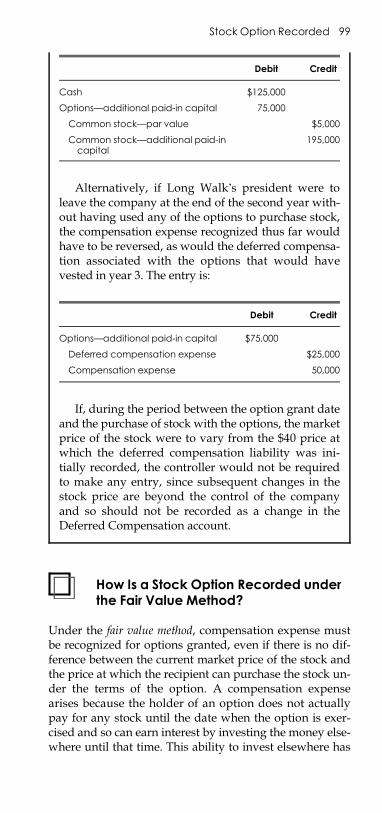
E1C06 03/04/2010 Page 99
How Is a Stock Option Recorded underthe Fair Value Method?
Under the fair value method, compensation expense mustbe recognized for options granted, even if there is no dif-ference between the current market price of the stock andthe price at which the recipient can purchase the stock un-der the terms of the option. A compensation expensearises because the holder of an option does not actuallypay for any stock until the date when the option is exer-cised and so can earn interest by investing the money else-where until that time. This ability to invest elsewhere has
Debit Credit
Cash $125,000
Options—additional paid-in capital 75,000
Common stock—par value $5,000
Common stock—additional paid-incapital
195,000
Alternatively, if Long Walk’s president were toleave the company at the end of the second year with-out having used any of the options to purchase stock,the compensation expense recognized thus far wouldhave to be reversed, as would the deferred compensa-tion associated with the options that would havevested in year 3. The entry is:
Debit Credit
Options—additional paid-in capital $75,000
Deferred compensation expense $25,000
Compensation expense 50,000
If, during the period between the option grant dateand the purchase of stock with the options, the marketprice of the stock were to vary from the $40 price atwhich the deferred compensation liability was ini-tially recorded, the controller would not be requiredto make any entry, since subsequent changes in thestock price are beyond the control of the companyand so should not be recorded as a change in theDeferred Compensation account.
Stock Option Recorded 99
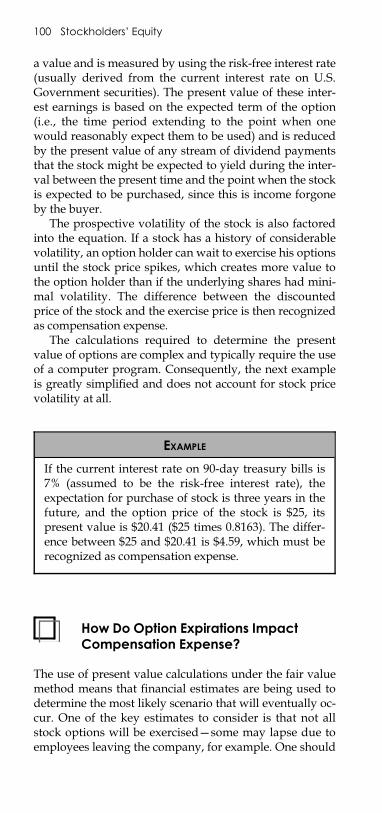
E1C06 03/04/2010 Page 100
a value and is measured by using the risk-free interest rate(usually derived from the current interest rate on U.S.Government securities). The present value of these inter-est earnings is based on the expected term of the option(i.e., the time period extending to the point when onewould reasonably expect them to be used) and is reducedby the present value of any stream of dividend paymentsthat the stock might be expected to yield during the inter-val between the present time and the point when the stockis expected to be purchased, since this is income forgoneby the buyer.
The prospective volatility of the stock is also factoredinto the equation. If a stock has a history of considerablevolatility, an option holder can wait to exercise his optionsuntil the stock price spikes, which creates more value tothe option holder than if the underlying shares had mini-mal volatility. The difference between the discountedprice of the stock and the exercise price is then recognizedas compensation expense.
The calculations required to determine the presentvalue of options are complex and typically require the useof a computer program. Consequently, the next exampleis greatly simplified and does not account for stock pricevolatility at all.
How Do Option Expirations ImpactCompensation Expense?
The use of present value calculations under the fair valuemethod means that financial estimates are being used todetermine the most likely scenario that will eventually oc-cur. One of the key estimates to consider is that not allstock options will be exercised—some may lapse due toemployees leaving the company, for example. One should
EXAMPLE
If the current interest rate on 90-day treasury bills is7% (assumed to be the risk-free interest rate), theexpectation for purchase of stock is three years in thefuture, and the option price of the stock is $25, itspresent value is $20.41 ($25 times 0.8163). The differ-ence between $25 and $20.41 is $4.59, which must berecognized as compensation expense.
100 Stockholders’ Equity
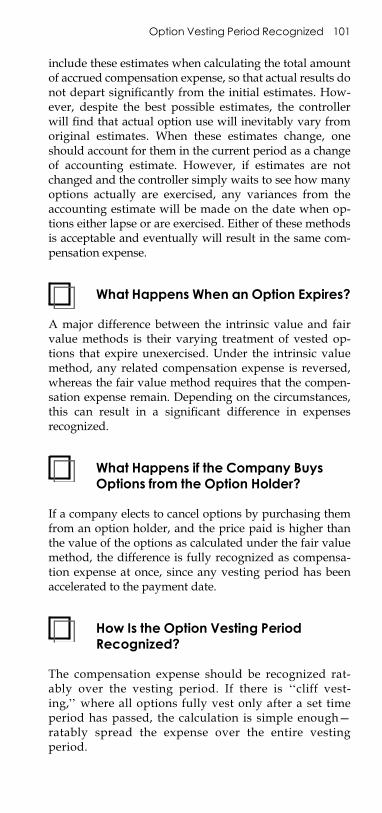
E1C06 03/04/2010 Page 101
include these estimates when calculating the total amountof accrued compensation expense, so that actual results donot depart significantly from the initial estimates. How-ever, despite the best possible estimates, the controllerwill find that actual option use will inevitably vary fromoriginal estimates. When these estimates change, oneshould account for them in the current period as a changeof accounting estimate. However, if estimates are notchanged and the controller simply waits to see how manyoptions actually are exercised, any variances from theaccounting estimate will be made on the date when op-tions either lapse or are exercised. Either of these methodsis acceptable and eventually will result in the same com-pensation expense.
What Happens When an Option Expires?
A major difference between the intrinsic value and fairvalue methods is their varying treatment of vested op-tions that expire unexercised. Under the intrinsic valuemethod, any related compensation expense is reversed,whereas the fair value method requires that the compen-sation expense remain. Depending on the circumstances,this can result in a significant difference in expensesrecognized.
What Happens if the Company BuysOptions from the Option Holder?
If a company elects to cancel options by purchasing themfrom an option holder, and the price paid is higher thanthe value of the options as calculated under the fair valuemethod, the difference is fully recognized as compensa-tion expense at once, since any vesting period has beenaccelerated to the payment date.
How Is the Option Vesting PeriodRecognized?
The compensation expense should be recognized rat-ably over the vesting period. If there is ‘‘cliff vest-ing,’’ where all options fully vest only after a set timeperiod has passed, the calculation is simple enough—ratably spread the expense over the entire vestingperiod.
Option Vesting Period Recognized 101
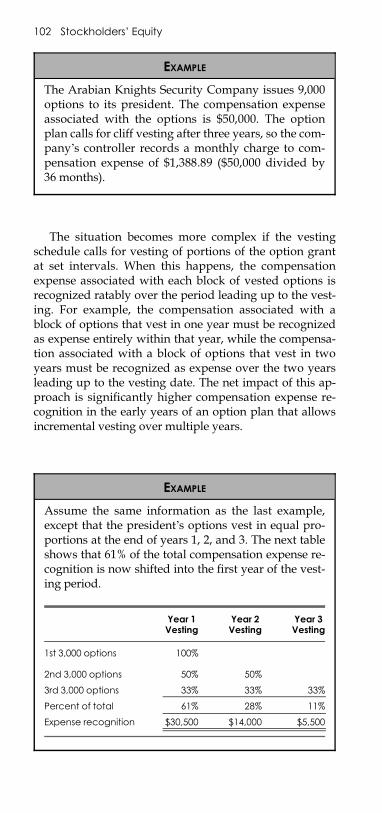
E1C06 03/04/2010 Page 102
The situation becomes more complex if the vestingschedule calls for vesting of portions of the option grantat set intervals. When this happens, the compensationexpense associated with each block of vested options isrecognized ratably over the period leading up to the vest-ing. For example, the compensation associated with ablock of options that vest in one year must be recognizedas expense entirely within that year, while the compensa-tion associated with a block of options that vest in twoyears must be recognized as expense over the two yearsleading up to the vesting date. The net impact of this ap-proach is significantly higher compensation expense re-cognition in the early years of an option plan that allowsincremental vesting over multiple years.
EXAMPLE
Assume the same information as the last example,except that the president’s options vest in equal pro-portions at the end of years 1, 2, and 3. The next tableshows that 61% of the total compensation expense re-cognition is now shifted into the first year of the vest-ing period.
Year 1 Year 2 Year 3Vesting Vesting Vesting
1st 3,000 options 100%
2nd 3,000 options 50% 50%
3rd 3,000 options 33% 33% 33%
Percent of total 61% 28% 11%
Expense recognition $30,500 $14,000 $5,500
EXAMPLE
The Arabian Knights Security Company issues 9,000options to its president. The compensation expenseassociated with the options is $50,000. The optionplan calls for cliff vesting after three years, so the com-pany’s controller records a monthly charge to com-pensation expense of $1,388.89 ($50,000 divided by36 months).
102 Stockholders’ Equity
E1C06 03/04/2010 Page 103
What Are Stock Appreciation Rights?
Sometimes the management team chooses not to issuestock options to employees, perhaps because employeesdo not have the funds to purchase shares or because nostock is available for an option plan. If so, an alternative isthe stock appreciation right (SAR). Under this approach, thecompany essentially grants an employee a fake stock op-tion and issues compensation to the employee at afuture date if the price of company stock has risen fromthe date of grant to the date at which the compensationis calculated. The amount of compensation paid is the dif-ference between the two stock prices.
How Do I Account for StockAppreciation Rights?
To account for stock appreciation rights, the controllermust determine the amount of any change in companystock during the reporting period and charge the amountto an accrued compensation expense account. If there is adecline in the stock price, the accrued expense account canbe reduced. If an employee cancels the SAR agreement(perhaps by leaving the company), the entire amount ofaccrued compensation expense related to that individualshould be reversed in the current period.
If the company pays the recipients of SAR compensa-tion in stock, it usually grants shares on the payment datebased on the number of shares at their fair market valuethat will eliminate the amount of the accrued compensa-tion expense. The journal entry required is a debit to theAccrued Compensation Liability account and a credit tothe Stock Rights Outstanding account.
If a service period is required before a SAR can be exer-cised, the amount of the compensation expense should berecognized ratably over the service period.
EXAMPLE
The Big Fat Pen Company decides to grant 2,500SARs to its chief pen designer. The stock price at thegrant date is $10. After one year, the stock price hasincreased to $12. After the second year, the stock pricehas dropped to $11. After the third year, the price in-creases to $15, at which point the chief pen designerchooses to cash in his SARs and receive payment. Therelated transactions would be:
(Continued)
How Do I Account for Stock Appreciation Rights? 103
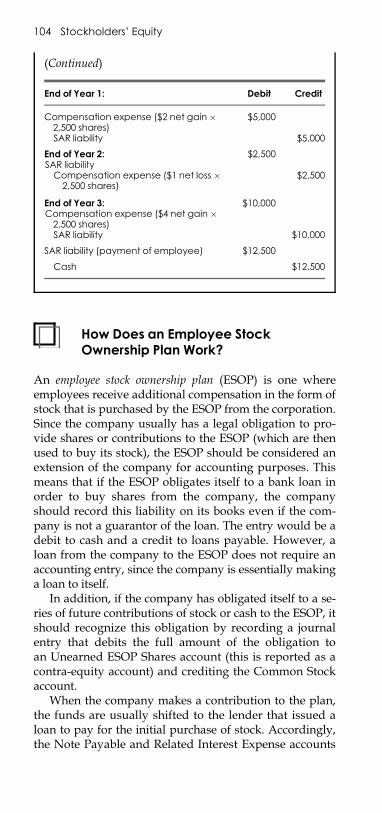
E1C06 03/04/2010 Page 104
How Does an Employee StockOwnership Plan Work?
An employee stock ownership plan (ESOP) is one whereemployees receive additional compensation in the form ofstock that is purchased by the ESOP from the corporation.Since the company usually has a legal obligation to pro-vide shares or contributions to the ESOP (which are thenused to buy its stock), the ESOP should be considered anextension of the company for accounting purposes. Thismeans that if the ESOP obligates itself to a bank loan inorder to buy shares from the company, the companyshould record this liability on its books even if the com-pany is not a guarantor of the loan. The entry would be adebit to cash and a credit to loans payable. However, aloan from the company to the ESOP does not require anaccounting entry, since the company is essentially makinga loan to itself.
In addition, if the company has obligated itself to a se-ries of future contributions of stock or cash to the ESOP, itshould recognize this obligation by recording a journalentry that debits the full amount of the obligation toan Unearned ESOP Shares account (this is reported as acontra-equity account) and crediting the Common Stockaccount.
When the company makes a contribution to the plan,the funds are usually shifted to the lender that issued aloan to pay for the initial purchase of stock. Accordingly,the Note Payable and Related Interest Expense accounts
(Continued)
End of Year 1: Debit Credit
Compensation expense ($2 net gain �2,500 shares)
$5,000
SAR liability $5,000
End of Year 2:SAR liability
$2,500
Compensation expense ($1 net loss �2,500 shares)
$2,500
End of Year 3:Compensation expense ($4 net gain �2,500 shares)
$10,000
SAR liability $10,000
SAR liability (payment of employee) $12,500
Cash $12,500
104 Stockholders’ Equity
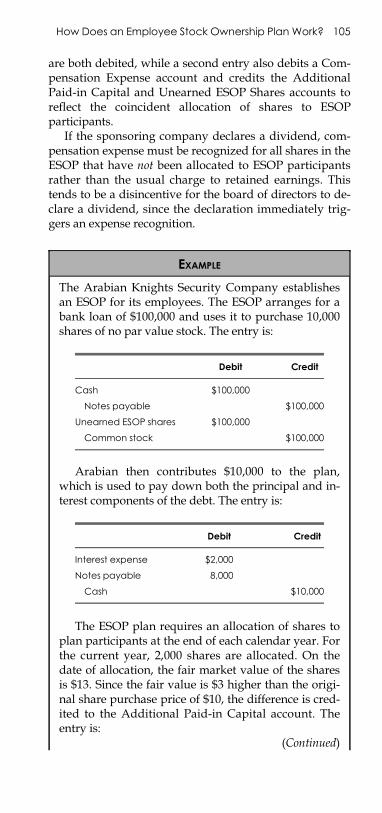
E1C06 03/04/2010 Page 105
are both debited, while a second entry also debits a Com-pensation Expense account and credits the AdditionalPaid-in Capital and Unearned ESOP Shares accounts toreflect the coincident allocation of shares to ESOPparticipants.
If the sponsoring company declares a dividend, com-pensation expense must be recognized for all shares in theESOP that have not been allocated to ESOP participantsrather than the usual charge to retained earnings. Thistends to be a disincentive for the board of directors to de-clare a dividend, since the declaration immediately trig-gers an expense recognition.
EXAMPLE
The Arabian Knights Security Company establishesan ESOP for its employees. The ESOP arranges for abank loan of $100,000 and uses it to purchase 10,000shares of no par value stock. The entry is:
Debit Credit
Cash $100,000
Notes payable $100,000
Unearned ESOP shares $100,000
Common stock $100,000
Arabian then contributes $10,000 to the plan,which is used to pay down both the principal and in-terest components of the debt. The entry is:
Debit Credit
Interest expense $2,000
Notes payable 8,000
Cash $10,000
The ESOP plan requires an allocation of shares toplan participants at the end of each calendar year. Forthe current year, 2,000 shares are allocated. On thedate of allocation, the fair market value of the sharesis $13. Since the fair value is $3 higher than the origi-nal share purchase price of $10, the difference is cred-ited to the Additional Paid-in Capital account. Theentry is:
(Continued)
How Does an Employee Stock Ownership Plan Work? 105
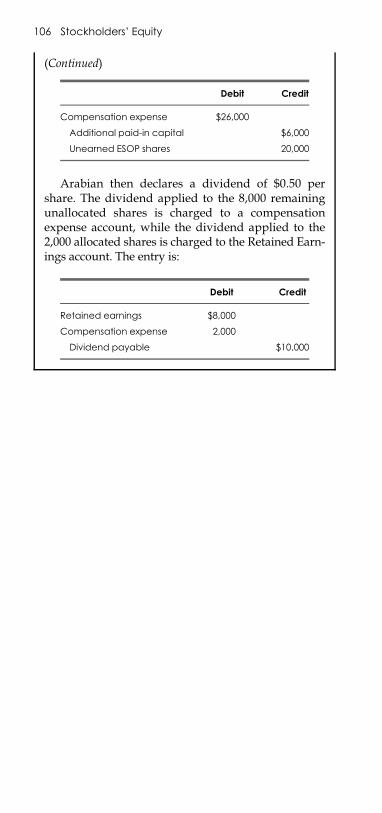
E1C06 03/04/2010 Page 106
(Continued)
Debit Credit
Compensation expense $26,000
Additional paid-in capital $6,000
Unearned ESOP shares 20,000
Arabian then declares a dividend of $0.50 pershare. The dividend applied to the 8,000 remainingunallocated shares is charged to a compensationexpense account, while the dividend applied to the2,000 allocated shares is charged to the Retained Earn-ings account. The entry is:
Debit Credit
Retained earnings $8,000
Compensation expense 2,000
Dividend payable $10,000
106 Stockholders’ Equity
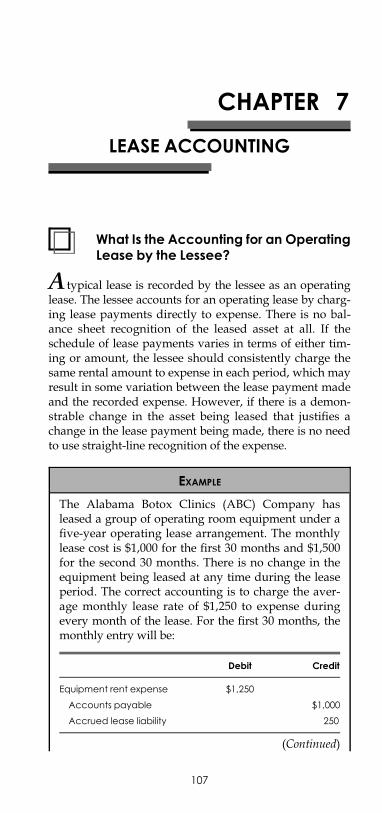
E1C07 03/04/2010 Page 107
CHAPTER 7
LEASE ACCOUNTING
What Is the Accounting for an OperatingLease by the Lessee?
A typical lease is recorded by the lessee as an operatinglease. The lessee accounts for an operating lease by charg-ing lease payments directly to expense. There is no bal-ance sheet recognition of the leased asset at all. If theschedule of lease payments varies in terms of either tim-ing or amount, the lessee should consistently charge thesame rental amount to expense in each period, which mayresult in some variation between the lease payment madeand the recorded expense. However, if there is a demon-strable change in the asset being leased that justifies achange in the lease payment being made, there is no needto use straight-line recognition of the expense.
EXAMPLE
The Alabama Botox Clinics (ABC) Company hasleased a group of operating room equipment under afive-year operating lease arrangement. The monthlylease cost is $1,000 for the first 30 months and $1,500for the second 30 months. There is no change in theequipment being leased at any time during the leaseperiod. The correct accounting is to charge the aver-age monthly lease rate of $1,250 to expense duringevery month of the lease. For the first 30 months, themonthly entry will be:
Debit Credit
Equipment rent expense $1,250
Accounts payable $1,000
Accrued lease liability 250
(Continued)
107
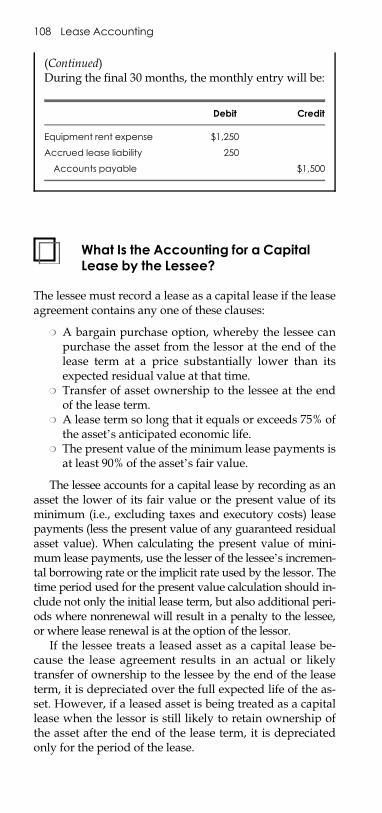
E1C07 03/04/2010 Page 108
What Is the Accounting for a CapitalLease by the Lessee?
The lessee must record a lease as a capital lease if the leaseagreement contains any one of these clauses:
m A bargain purchase option, whereby the lessee canpurchase the asset from the lessor at the end of thelease term at a price substantially lower than itsexpected residual value at that time.
m Transfer of asset ownership to the lessee at the endof the lease term.
m A lease term so long that it equals or exceeds 75% ofthe asset’s anticipated economic life.
m The present value of the minimum lease payments isat least 90% of the asset’s fair value.
The lessee accounts for a capital lease by recording as anasset the lower of its fair value or the present value of itsminimum (i.e., excluding taxes and executory costs) leasepayments (less the present value of any guaranteed residualasset value). When calculating the present value of mini-mum lease payments, use the lesser of the lessee’s incremen-tal borrowing rate or the implicit rate used by the lessor. Thetime period used for the present value calculation should in-clude not only the initial lease term, but also additional peri-ods where nonrenewal will result in a penalty to the lessee,or where lease renewal is at the option of the lessor.
If the lessee treats a leased asset as a capital lease be-cause the lease agreement results in an actual or likelytransfer of ownership to the lessee by the end of the leaseterm, it is depreciated over the full expected life of the as-set. However, if a leased asset is being treated as a capitallease when the lessor is still likely to retain ownership ofthe asset after the end of the lease term, it is depreciatedonly for the period of the lease.
(Continued)During the final 30 months, the monthly entry will be:
Debit Credit
Equipment rent expense $1,250
Accrued lease liability 250
Accounts payable $1,500
108 Lease Accounting
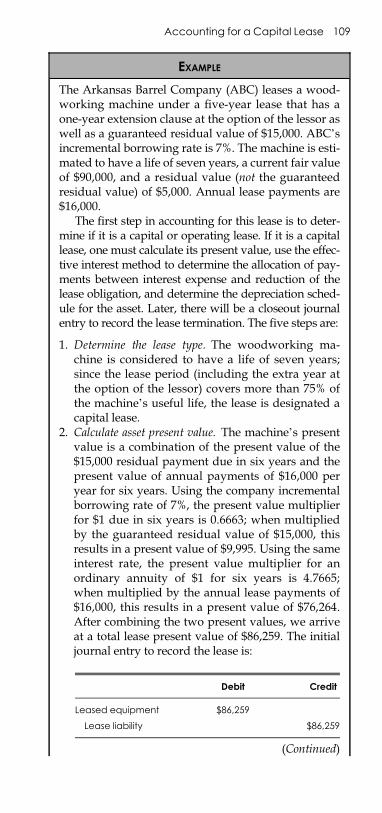
E1C07 03/04/2010 Page 109
EXAMPLE
The Arkansas Barrel Company (ABC) leases a wood-working machine under a five-year lease that has aone-year extension clause at the option of the lessor aswell as a guaranteed residual value of $15,000. ABC’sincremental borrowing rate is 7%. The machine is esti-mated to have a life of seven years, a current fair valueof $90,000, and a residual value (not the guaranteedresidual value) of $5,000. Annual lease payments are$16,000.
The first step in accounting for this lease is to deter-mine if it is a capital or operating lease. If it is a capitallease, one must calculate its present value, use the effec-tive interest method to determine the allocation of pay-ments between interest expense and reduction of thelease obligation, and determine the depreciation sched-ule for the asset. Later, there will be a closeout journalentry to record the lease termination. The five steps are:
1. Determine the lease type. The woodworking ma-chine is considered to have a life of seven years;since the lease period (including the extra year atthe option of the lessor) covers more than 75% ofthe machine’s useful life, the lease is designated acapital lease.
2. Calculate asset present value. The machine’s presentvalue is a combination of the present value of the$15,000 residual payment due in six years and thepresent value of annual payments of $16,000 peryear for six years. Using the company incrementalborrowing rate of 7%, the present value multiplierfor $1 due in six years is 0.6663; when multipliedby the guaranteed residual value of $15,000, thisresults in a present value of $9,995. Using the sameinterest rate, the present value multiplier for anordinary annuity of $1 for six years is 4.7665;when multiplied by the annual lease payments of$16,000, this results in a present value of $76,264.After combining the two present values, we arriveat a total lease present value of $86,259. The initialjournal entry to record the lease is:
Debit Credit
Leased equipment $86,259
Lease liability $86,259
(Continued)
Accounting for a Capital Lease 109
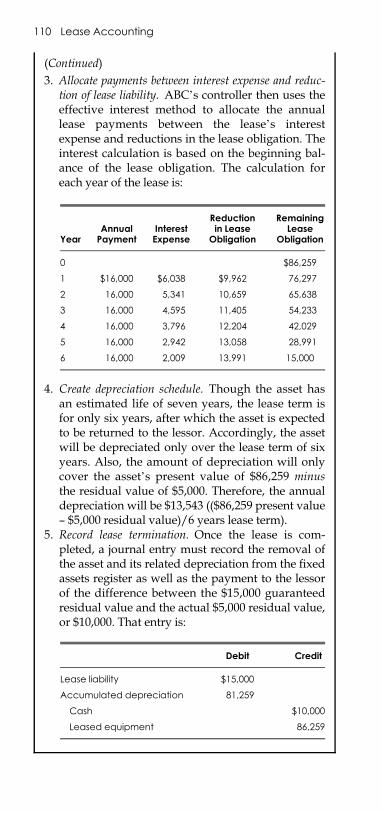
E1C07 03/04/2010 Page 110
(Continued)3. Allocate payments between interest expense and reduc-
tion of lease liability. ABC’s controller then uses theeffective interest method to allocate the annuallease payments between the lease’s interestexpense and reductions in the lease obligation. Theinterest calculation is based on the beginning bal-ance of the lease obligation. The calculation foreach year of the lease is:
YearAnnualPayment
InterestExpense
Reductionin Lease
Obligation
RemainingLease
Obligation
0 $86,259
1 $16,000 $6,038 $9,962 76,297
2 16,000 5,341 10,659 65,638
3 16,000 4,595 11,405 54,233
4 16,000 3,796 12,204 42,029
5 16,000 2,942 13,058 28,991
6 16,000 2,009 13,991 15,000
4. Create depreciation schedule. Though the asset hasan estimated life of seven years, the lease term isfor only six years, after which the asset is expectedto be returned to the lessor. Accordingly, the assetwill be depreciated only over the lease term of sixyears. Also, the amount of depreciation will onlycover the asset’s present value of $86,259 minusthe residual value of $5,000. Therefore, the annualdepreciation will be $13,543 (($86,259 present value– $5,000 residual value)/6 years lease term).
5. Record lease termination. Once the lease is com-pleted, a journal entry must record the removal ofthe asset and its related depreciation from the fixedassets register as well as the payment to the lessorof the difference between the $15,000 guaranteedresidual value and the actual $5,000 residual value,or $10,000. That entry is:
Debit Credit
Lease liability $15,000
Accumulated depreciation 81,259
Cash $10,000
Leased equipment 86,259
110 Lease Accounting
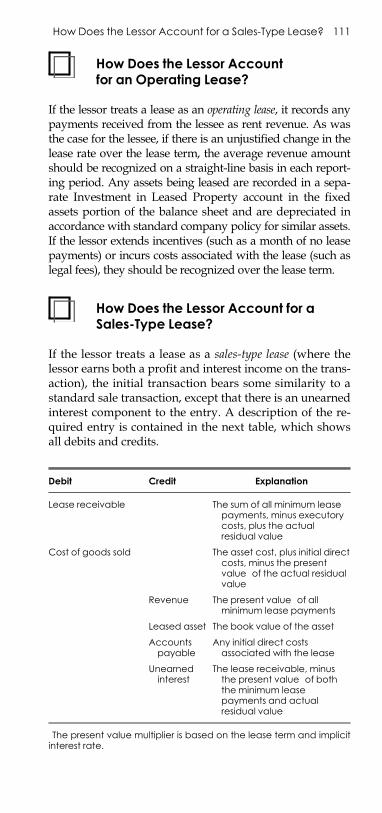
E1C07 03/04/2010 Page 111
How Does the Lessor Accountfor an Operating Lease?
If the lessor treats a lease as an operating lease, it records anypayments received from the lessee as rent revenue. As wasthe case for the lessee, if there is an unjustified change in thelease rate over the lease term, the average revenue amountshould be recognized on a straight-line basis in each report-ing period. Any assets being leased are recorded in a sepa-rate Investment in Leased Property account in the fixedassets portion of the balance sheet and are depreciated inaccordance with standard company policy for similar assets.If the lessor extends incentives (such as a month of no leasepayments) or incurs costs associated with the lease (such aslegal fees), they should be recognized over the lease term.
How Does the Lessor Account for aSales-Type Lease?
If the lessor treats a lease as a sales-type lease (where thelessor earns both a profit and interest income on the trans-action), the initial transaction bears some similarity to astandard sale transaction, except that there is an unearnedinterest component to the entry. A description of the re-quired entry is contained in the next table, which showsall debits and credits.
Debit Credit Explanation
Lease receivable The sum of all minimum leasepayments, minus executorycosts, plus the actualresidual value
Cost of goods sold The asset cost, plus initial directcosts, minus the presentvalue� of the actual residualvalue
Revenue The present value� of allminimum lease payments
Leased asset The book value of the asset
Accountspayable
Any initial direct costsassociated with the lease
Unearnedinterest
The lease receivable, minusthe present value� of boththe minimum leasepayments and actualresidual value
�The present value multiplier is based on the lease term and implicitinterest rate.
How Does the Lessor Account for a Sales-Type Lease? 111
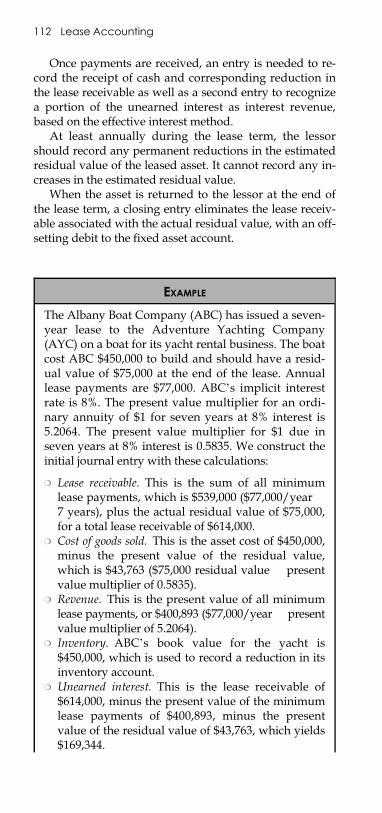
E1C07 03/04/2010 Page 112
Once payments are received, an entry is needed to re-cord the receipt of cash and corresponding reduction inthe lease receivable as well as a second entry to recognizea portion of the unearned interest as interest revenue,based on the effective interest method.
At least annually during the lease term, the lessorshould record any permanent reductions in the estimatedresidual value of the leased asset. It cannot record any in-creases in the estimated residual value.
When the asset is returned to the lessor at the end ofthe lease term, a closing entry eliminates the lease receiv-able associated with the actual residual value, with an off-setting debit to the fixed asset account.
EXAMPLE
The Albany Boat Company (ABC) has issued a seven-year lease to the Adventure Yachting Company(AYC) on a boat for its yacht rental business. The boatcost ABC $450,000 to build and should have a resid-ual value of $75,000 at the end of the lease. Annuallease payments are $77,000. ABC’s implicit interestrate is 8%. The present value multiplier for an ordi-nary annuity of $1 for seven years at 8% interest is5.2064. The present value multiplier for $1 due inseven years at 8% interest is 0.5835. We construct theinitial journal entry with these calculations:
m Lease receivable. This is the sum of all minimumlease payments, which is $539,000 ($77,000/year �7 years), plus the actual residual value of $75,000,for a total lease receivable of $614,000.
m Cost of goods sold. This is the asset cost of $450,000,minus the present value of the residual value,which is $43,763 ($75,000 residual value � presentvalue multiplier of 0.5835).
m Revenue. This is the present value of all minimumlease payments, or $400,893 ($77,000/year � presentvalue multiplier of 5.2064).
m Inventory. ABC’s book value for the yacht is$450,000, which is used to record a reduction in itsinventory account.
m Unearned interest. This is the lease receivable of$614,000, minus the present value of the minimumlease payments of $400,893, minus the presentvalue of the residual value of $43,763, which yields$169,344.
112 Lease Accounting
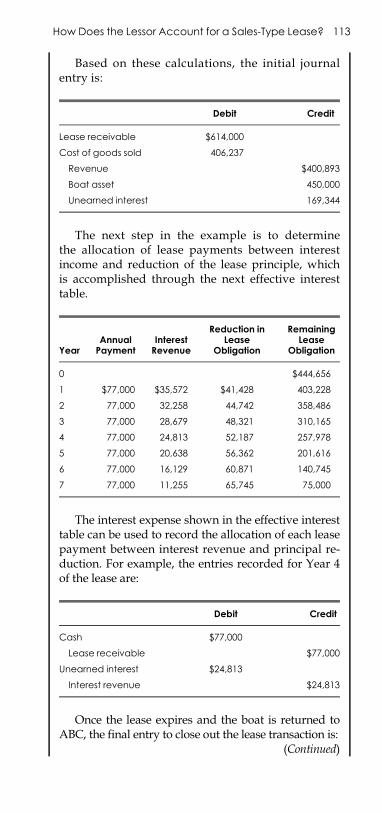
E1C07 03/04/2010 Page 113
Based on these calculations, the initial journalentry is:
Debit Credit
Lease receivable $614,000
Cost of goods sold 406,237
Revenue $400,893
Boat asset 450,000
Unearned interest 169,344
The next step in the example is to determinethe allocation of lease payments between interestincome and reduction of the lease principle, whichis accomplished through the next effective interesttable.
YearAnnualPayment
InterestRevenue
Reduction inLease
Obligation
RemainingLease
Obligation
0 $444,656
1 $77,000 $35,572 $41,428 403,228
2 77,000 32,258 44,742 358,486
3 77,000 28,679 48,321 310,165
4 77,000 24,813 52,187 257,978
5 77,000 20,638 56,362 201,616
6 77,000 16,129 60,871 140,745
7 77,000 11,255 65,745 75,000
The interest expense shown in the effective interesttable can be used to record the allocation of each leasepayment between interest revenue and principal re-duction. For example, the entries recorded for Year 4of the lease are:
Debit Credit
Cash $77,000
Lease receivable $77,000
Unearned interest $24,813
Interest revenue $24,813
Once the lease expires and the boat is returned toABC, the final entry to close out the lease transaction is:
(Continued)
How Does the Lessor Account for a Sales-Type Lease? 113
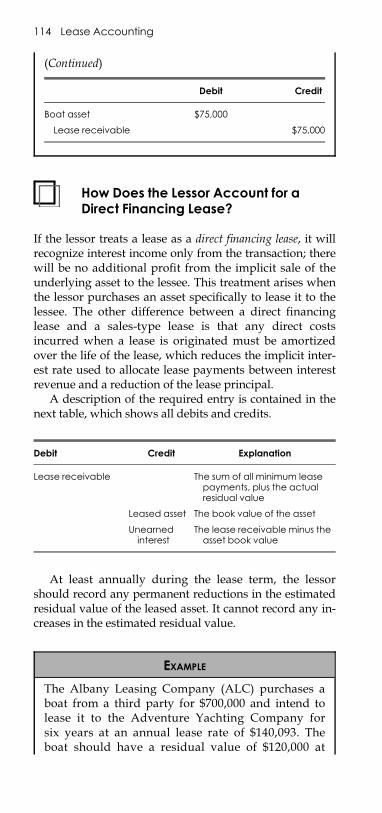
E1C07 03/04/2010 Page 114
How Does the Lessor Account for aDirect Financing Lease?
If the lessor treats a lease as a direct financing lease, it willrecognize interest income only from the transaction; therewill be no additional profit from the implicit sale of theunderlying asset to the lessee. This treatment arises whenthe lessor purchases an asset specifically to lease it to thelessee. The other difference between a direct financinglease and a sales-type lease is that any direct costsincurred when a lease is originated must be amortizedover the life of the lease, which reduces the implicit inter-est rate used to allocate lease payments between interestrevenue and a reduction of the lease principal.
A description of the required entry is contained in thenext table, which shows all debits and credits.
Debit Credit Explanation
Lease receivable The sum of all minimum leasepayments, plus the actualresidual value
Leased asset The book value of the asset
Unearnedinterest
The lease receivable minus theasset book value
At least annually during the lease term, the lessorshould record any permanent reductions in the estimatedresidual value of the leased asset. It cannot record any in-creases in the estimated residual value.
EXAMPLE
The Albany Leasing Company (ALC) purchases aboat from a third party for $700,000 and intend tolease it to the Adventure Yachting Company forsix years at an annual lease rate of $140,093. Theboat should have a residual value of $120,000 at
(Continued)
Debit Credit
Boat asset $75,000
Lease receivable $75,000
114 Lease Accounting
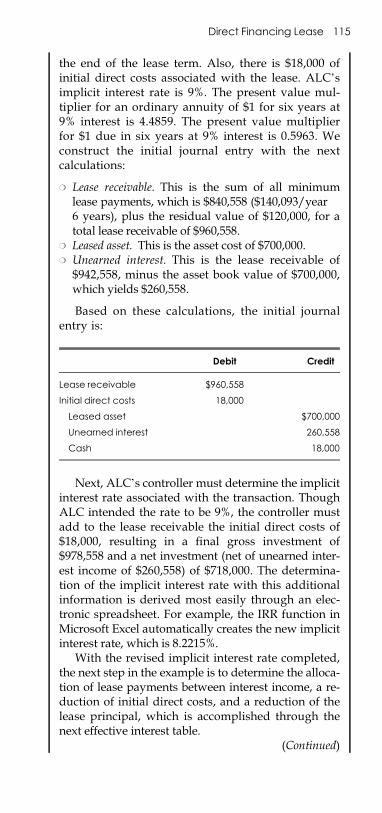
E1C07 03/04/2010 Page 115
the end of the lease term. Also, there is $18,000 ofinitial direct costs associated with the lease. ALC’simplicit interest rate is 9%. The present value mul-tiplier for an ordinary annuity of $1 for six years at9% interest is 4.4859. The present value multiplierfor $1 due in six years at 9% interest is 0.5963. Weconstruct the initial journal entry with the nextcalculations:
m Lease receivable. This is the sum of all minimumlease payments, which is $840,558 ($140,093/year �6 years), plus the residual value of $120,000, for atotal lease receivable of $960,558.
m Leased asset. This is the asset cost of $700,000.m Unearned interest. This is the lease receivable of
$942,558, minus the asset book value of $700,000,which yields $260,558.
Based on these calculations, the initial journalentry is:
Debit Credit
Lease receivable $960,558
Initial direct costs 18,000
Leased asset $700,000
Unearned interest 260,558
Cash 18,000
Next, ALC’s controller must determine the implicitinterest rate associated with the transaction. ThoughALC intended the rate to be 9%, the controller mustadd to the lease receivable the initial direct costs of$18,000, resulting in a final gross investment of$978,558 and a net investment (net of unearned inter-est income of $260,558) of $718,000. The determina-tion of the implicit interest rate with this additionalinformation is derived most easily through an elec-tronic spreadsheet. For example, the IRR function inMicrosoft Excel automatically creates the new implicitinterest rate, which is 8.2215%.
With the revised implicit interest rate completed,the next step in the example is to determine the alloca-tion of lease payments between interest income, a re-duction of initial direct costs, and a reduction of thelease principal, which is accomplished through thenext effective interest table.
(Continued)
Direct Financing Lease 115
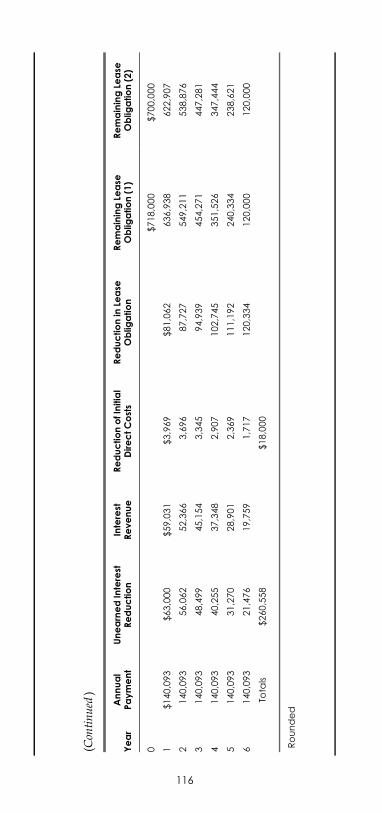
E1C07 03/04/2010 Page 116
Year
Annual
Payment
UnearnedInterest
Reduction
Interest
Revenue
ReductionofInitial
DirectCosts
Reductionin
Lease
Oblig
ation
RemainingLe
ase
Oblig
ation(1)
RemainingLe
ase
Oblig
ation(2)
0$718,000
$700,000
1$140,093
$63,000
$59,031
$3,969
$81,062
636,938
622,907
2140,093
56,062
52,366
3,696
87,727
549,211
538,876
3140,093
48,499
45,154
3,345
94,939
454,271
447,281
4140,093
40,255
37,348
2,907
102,745
351,526
347,444
5140,093
31,270
28,901
2,369
111,192
240,334
238,621
6140,093
21,476
19,759
1,717
120,334
120,000
120,000�
Tota
ls$260,558�
$18,000�
� Rounded
(Contin
ued)
116
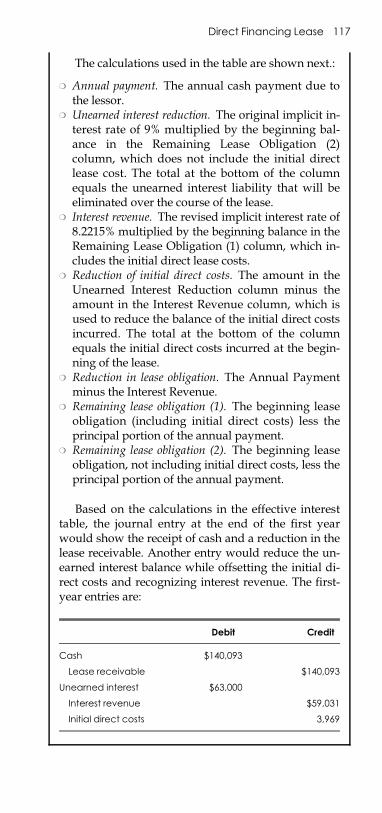
E1C07 03/04/2010 Page 117
The calculations used in the table are shown next.:
m Annual payment. The annual cash payment due tothe lessor.
m Unearned interest reduction. The original implicit in-terest rate of 9% multiplied by the beginning bal-ance in the Remaining Lease Obligation (2)column, which does not include the initial directlease cost. The total at the bottom of the columnequals the unearned interest liability that will beeliminated over the course of the lease.
m Interest revenue. The revised implicit interest rate of8.2215% multiplied by the beginning balance in theRemaining Lease Obligation (1) column, which in-cludes the initial direct lease costs.
m Reduction of initial direct costs. The amount in theUnearned Interest Reduction column minus theamount in the Interest Revenue column, which isused to reduce the balance of the initial direct costsincurred. The total at the bottom of the columnequals the initial direct costs incurred at the begin-ning of the lease.
m Reduction in lease obligation. The Annual Paymentminus the Interest Revenue.
m Remaining lease obligation (1). The beginning leaseobligation (including initial direct costs) less theprincipal portion of the annual payment.
m Remaining lease obligation (2). The beginning leaseobligation, not including initial direct costs, less theprincipal portion of the annual payment.
Based on the calculations in the effective interesttable, the journal entry at the end of the first yearwould show the receipt of cash and a reduction in thelease receivable. Another entry would reduce the un-earned interest balance while offsetting the initial di-rect costs and recognizing interest revenue. The first-year entries are:
Debit Credit
Cash $140,093
Lease receivable $140,093
Unearned interest $63,000
Interest revenue $59,031
Initial direct costs 3,969
Direct Financing Lease 117
E1C07 03/04/2010 Page 118
What Is the Accounting for a LeaseTermination?
On the date that a lessee notifies the lessor that it intendsto terminate a lease, the lessee must recognize a liabilityfor the fair value of the termination costs, which includeany continuing lease payments, less prepaid rent, plusdeferred rent, minus the amount of any sublease pay-ments. Changes in these estimates are recorded immedi-ately in the income statement.
If the lessor has recorded a lease as a sales-type or di-rect financing lease, it records the underlying leased assetat the lower of its current net book value, present value, ororiginal cost, with any resulting adjustment being re-corded in current earnings. At the time of termination no-tice, the lessor records a receivable in the amount of anytermination payments yet to be made, with an offsettingcredit to a deferred rent liability account. The lessor thenrecognizes any remaining rental payments on a straight-line basis over the revised period during which the pay-ments are to be received.
What Is the Accounting for a LeaseExtension by the Lessee?
If a lessee extends an operating lease and the extension isalso classified as an operating lease, the lessee continues totreat the extension in the same manner it has used for theexisting lease. If the lease extension requires paymentamounts differing from those required under the initialagreement but the asset received does not change, the les-see should consistently charge the same rental amount toexpense in each period, which may result in some varia-tion between the lease payment made and the recordedexpense.
If a lessee extends an existing capital lease but the leasestructure now requires the extension to be recorded as anoperating lease, the lessee writes off the existing asset aswell as all associated accumulated depreciation and rec-ognizes either a gain or loss on the transaction. Paymentsmade under the lease extension are handled in accordancewith the rules of a standard operating lease.
If a lessee extends an existing capital lease and thestructure of the extension agreement requires the lease tocontinue to be recorded as a capital lease, the lesseechanges the asset valuation and related lease liability bythe difference between the present value of the new series
118 Lease Accounting
E1C07 03/04/2010 Page 119
of future minimum lease payments and the existing bal-ance. The present value calculation must use the interestrate used for the same calculation at the inception of theoriginal lease.
What Is the Accounting for a LeaseExtension by the Lessor?
When a lease extension occurs and the lessor classifies theextension as a direct financing lease, the lease receivableand estimated residual value (downward only) are ad-justed to match the new lease terms, with any adjustmentgoing to unearned income. When a lease extension occursand the lessor classifies an existing direct financing orsales-type lease as an operating lease, the lessor writes offthe remaining lease investment and instead records theasset at the lower of its current net book value, originalcost, or present value. The change in value from the origi-nal net investment is recorded against income in the pe-riod when the lease extension date occurs.
What Is the Accounting for a Sublease?
A sublease arises when leased property is leased by the orig-inal lessee to a third party. When this happens, the originallessee accounts for the sublease as if it were the original les-sor. This means that it can account for the lease as an oper-ating, a direct sales, or a sales-type lease. The original lesseecontinues to account for its ongoing lease payments to theoriginal lessor as though the sublease did not exist.
What Is the Accounting for a Sale-Leaseback Transaction?
A sale-leaseback transaction arises when a propertyowner sells the property to another entity, which leasesthe property back to the original owner. If the transactionresults in a loss, the lessee recognizes it fully in the currentperiod.
If the present value of the rental payments is at least90% of the property’s fair value, the lessee is consideredto have retained substantially all rights to use the prop-erty. Under this scenario, there are two ways to accountfor the transaction:
1. If the lease qualifies as a capital lease, the lesseeaccounts for it as such and recognizes any profits on
Accounting for a Sale-Leaseback Transaction 119
E1C07 03/04/2010 Page 120
the initial property sale over the lease term in pro-portion to the asset amortization schedule.
2. If the lease qualifies as an operating lease, the lesseeaccounts for it as such and recognizes any profits onthe initial property sale over the lease term in pro-portion to the lease payments.
If the present value of the rental payments is less than10% of the property’s fair value, the lessee should recog-nize all gains from the transaction fully in the currentperiod. If the rental payments under the transaction ap-pear unreasonable based on market prices at the time oflease inception, the payments are adjusted to make them‘‘reasonable.’’ The difference between the adjusted andexisting lease rates is amortized over the life of the asset(if a capital lease) or the life of the lease (if an operatinglease).
If the present value of the rental payments is more than10% but less than 90% of the property’s fair value, anyexcess profit on the asset sale can be recognized by the les-see on the sale date. If the lease is treated as a capital lease,excess profit is calculated as the difference between theasset sale price and the recorded value of the leased asset.If the lease is treated as an operating lease, excess profit iscalculated as the difference between the asset sale priceand the present value of the minimum lease payments,using the lower of the lessor’s implicit lease rate or thelessee’s incremental borrowing rate.
120 Lease Accounting
E1C08 03/04/2010 Page 121
CHAPTER 8
FOREIGN CURRENCYACCOUNTING
What Is the Goal of Foreign CurrencyAccounting?
The key consideration when making foreign currencytranslations is that when the conversion is complete, wehave an accurate translation of accounting performance ina foreign currency into precisely the same performance inU.S. dollars. In other words, a foreign subsidiary whose fi-nancial statements have specific current ratios, gross mar-gins, and net profits will see the same results whentranslated into a report presentation in U.S. dollars.
The current rate method and the remeasurementmethod are the two techniques used to translate the finan-cial results of a foreign entity’s operations into the cur-rency of its corporate parent.
How Does the Current Rate MethodConvert Foreign CurrencyTransactions into U.S. Dollars?
The current rate translation method is used when a cur-rency besides the U.S. dollar is determined to be theprimary currency used by a subsidiary. This approach isusually selected when a subsidiary’s operations are not in-tegrated into those of its U.S.-based parent, if its financingis primarily in that of the local currency, or if the subsidi-ary conducts most of its transactions in the local currency.
However, one cannot use this method if the countryin which the subsidiary is located suffers from a high rateof inflation, which is defined as a cumulative rate of 100%or more over the most recent three years. In this case,the remeasurement method must be used. If the localeconomy is considered to no longer be inflationary, the
121
E1C08 03/04/2010 Page 122
reporting method may be changed back to the current ratemethod; when this happens, the accounting staff mustconvert the financial statements of the impacted subsidi-ary back into the local currency using the exchange rateon the date when the determination is made.
To complete the current rate translation method, thefirst step is to determine the functional currency of thesubsidiary. This should be the currency in which the bulkof its transactions and financing is used. Next, convert allof the subsidiary’s transactions to this functional currency.Then convert all assets and liabilities of the subsidiary toU.S. dollars at the current rate of exchange as of the dateof the financial statements. These conversion rules apply:
m Revenues and expenses that have occurred through-out the current fiscal year are converted at aweighted-average rate of exchange for the entireyear. A preferable approach is to convert them at theexchange rates in effect on the dates when theyoccurred, but this is considered too labor-intensiveto be practical in most situations.
m Stockholder’s equity is converted at the historicalrate of exchange. However, changes to retainedearnings within the current reporting period are re-corded at the weighted-average rate of exchange forthe year, since they are derived from revenues andexpenses that were also recorded at the weighted-average rate of exchange.
m Dividends declared during the year are recorded atthe exchange rate on the date of declaration.
m Any resulting translation adjustments should bestored in the equity section of the corporate parent’sconsolidated balance sheet. This account is cumula-tive, so separately report in the footnotes to the fi-nancial statements the change in the translationadjustments account as a result of activities in thereporting period.
EXAMPLE
A division of the Oregon Clock Company is located inMexico. This division maintains its books in pesos,borrows pesos from a local bank, and conducts themajority of its operations within Mexico. Accordingly,its functional currency is the peso, which requires theparent’s accounting staff to record the division’s re-sults using the current rate method.
122 Foreign Currency Accounting
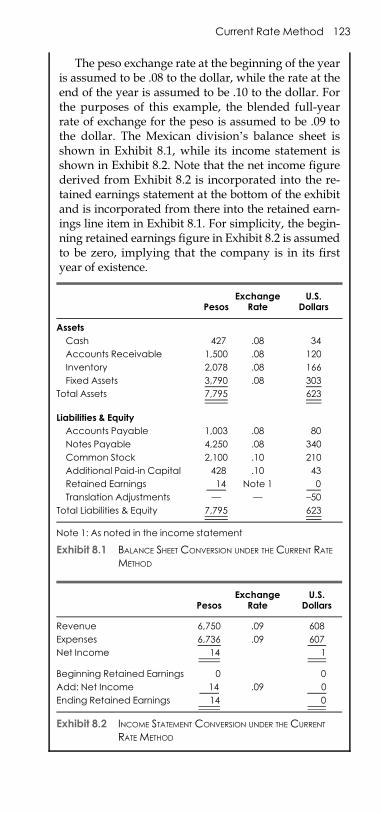
E1C08 03/04/2010 Page 123
The peso exchange rate at the beginning of the yearis assumed to be .08 to the dollar, while the rate at theend of the year is assumed to be .10 to the dollar. Forthe purposes of this example, the blended full-yearrate of exchange for the peso is assumed to be .09 tothe dollar. The Mexican division’s balance sheet isshown in Exhibit 8.1, while its income statement isshown in Exhibit 8.2. Note that the net income figurederived from Exhibit 8.2 is incorporated into the re-tained earnings statement at the bottom of the exhibitand is incorporated from there into the retained earn-ings line item in Exhibit 8.1. For simplicity, the begin-ning retained earnings figure in Exhibit 8.2 is assumedto be zero, implying that the company is in its firstyear of existence.
PesosExchange
RateU.S.
Dollars
Assets
Cash 427 .08 34
Accounts Receivable 1,500 .08 120
Inventory 2,078 .08 166
Fixed Assets 3,790 .08 303
Total Assets 7,795 623
Liabilities & Equity
Accounts Payable 1,003 .08 80
Notes Payable 4,250 .08 340
Common Stock 2,100 .10 210
Additional Paid-in Capital 428 .10 43
Retained Earnings 14 Note 1 0
Translation Adjustments — — –50
Total Liabilities & Equity 7,795 623
Note 1: As noted in the income statement
Exhibit 8.1 BALANCE SHEET CONVERSION UNDER THE CURRENT RATE
METHOD
PesosExchange
RateU.S.
Dollars
Revenue 6,750 .09 608
Expenses 6,736 .09 607
Net Income 14 1
Beginning Retained Earnings 0 0
Add: Net Income 14 .09 0
Ending Retained Earnings 14 0
Exhibit 8.2 INCOME STATEMENT CONVERSION UNDER THE CURRENT
RATE METHOD
Current Rate Method 123
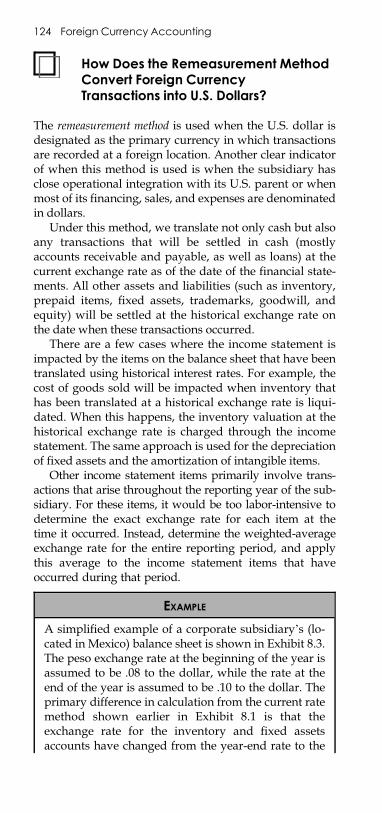
E1C08 03/04/2010 Page 124
How Does the Remeasurement MethodConvert Foreign CurrencyTransactions into U.S. Dollars?
The remeasurement method is used when the U.S. dollar isdesignated as the primary currency in which transactionsare recorded at a foreign location. Another clear indicatorof when this method is used is when the subsidiary hasclose operational integration with its U.S. parent or whenmost of its financing, sales, and expenses are denominatedin dollars.
Under this method, we translate not only cash but alsoany transactions that will be settled in cash (mostlyaccounts receivable and payable, as well as loans) at thecurrent exchange rate as of the date of the financial state-ments. All other assets and liabilities (such as inventory,prepaid items, fixed assets, trademarks, goodwill, andequity) will be settled at the historical exchange rate onthe date when these transactions occurred.
There are a few cases where the income statement isimpacted by the items on the balance sheet that have beentranslated using historical interest rates. For example, thecost of goods sold will be impacted when inventory thathas been translated at a historical exchange rate is liqui-dated. When this happens, the inventory valuation at thehistorical exchange rate is charged through the incomestatement. The same approach is used for the depreciationof fixed assets and the amortization of intangible items.
Other income statement items primarily involve trans-actions that arise throughout the reporting year of the sub-sidiary. For these items, it would be too labor-intensive todetermine the exact exchange rate for each item at thetime it occurred. Instead, determine the weighted-averageexchange rate for the entire reporting period, and applythis average to the income statement items that haveoccurred during that period.
EXAMPLE
A simplified example of a corporate subsidiary’s (lo-cated in Mexico) balance sheet is shown in Exhibit 8.3.The peso exchange rate at the beginning of the year isassumed to be .08 to the dollar, while the rate at theend of the year is assumed to be .10 to the dollar. Theprimary difference in calculation from the current ratemethod shown earlier in Exhibit 8.1 is that theexchange rate for the inventory and fixed assetsaccounts have changed from the year-end rate to the
124 Foreign Currency Accounting
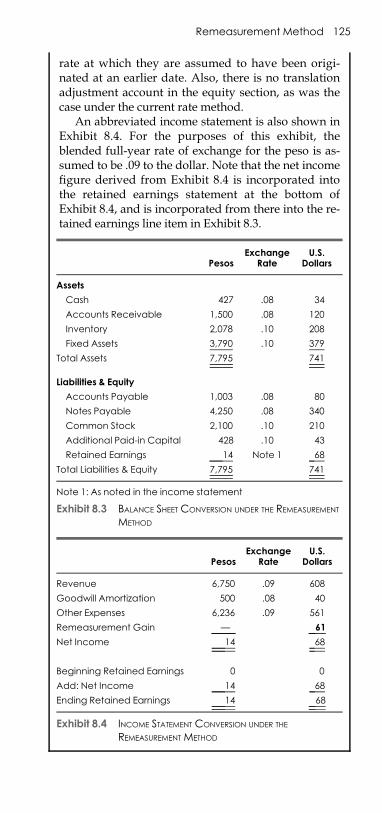
E1C08 03/04/2010 Page 125
rate at which they are assumed to have been origi-nated at an earlier date. Also, there is no translationadjustment account in the equity section, as was thecase under the current rate method.
An abbreviated income statement is also shown inExhibit 8.4. For the purposes of this exhibit, theblended full-year rate of exchange for the peso is as-sumed to be .09 to the dollar. Note that the net incomefigure derived from Exhibit 8.4 is incorporated intothe retained earnings statement at the bottom ofExhibit 8.4, and is incorporated from there into the re-tained earnings line item in Exhibit 8.3.
PesosExchange
RateU.S.
Dollars
Assets
Cash 427 .08 34
Accounts Receivable 1,500 .08 120
Inventory 2,078 .10 208
Fixed Assets 3,790 .10 379
Total Assets 7,795 741
Liabilities & Equity
Accounts Payable 1,003 .08 80
Notes Payable 4,250 .08 340
Common Stock 2,100 .10 210
Additional Paid-in Capital 428 .10 43
Retained Earnings 14 Note 1 68
Total Liabilities & Equity 7,795 741
Note 1: As noted in the income statement
Exhibit 8.3 BALANCE SHEET CONVERSION UNDER THE REMEASUREMENT
METHOD
PesosExchange
RateU.S.
Dollars
Revenue 6,750 .09 608
Goodwill Amortization 500 .08 40
Other Expenses 6,236 .09 561
Remeasurement Gain — 61
Net Income 14 68
Beginning Retained Earnings 0 0
Add: Net Income 14 68
Ending Retained Earnings 14 68
Exhibit 8.4 INCOME STATEMENT CONVERSION UNDER THE
REMEASUREMENT METHOD
Remeasurement Method 125
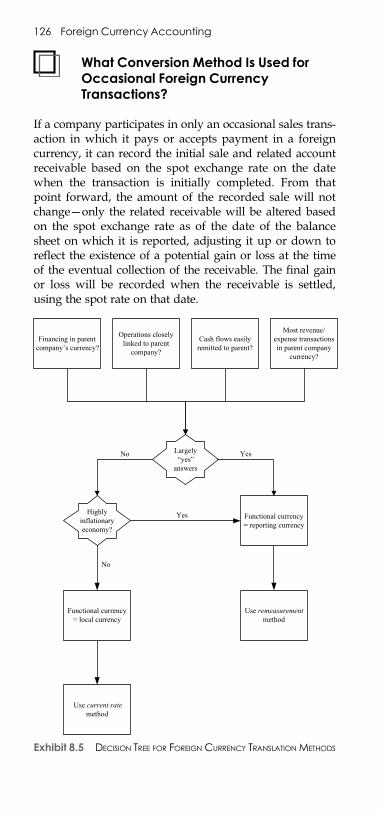
E1C08 03/04/2010 Page 126
What Conversion Method Is Used forOccasional Foreign CurrencyTransactions?
If a company participates in only an occasional sales trans-action in which it pays or accepts payment in a foreigncurrency, it can record the initial sale and related accountreceivable based on the spot exchange rate on the datewhen the transaction is initially completed. From thatpoint forward, the amount of the recorded sale will notchange—only the related receivable will be altered basedon the spot exchange rate as of the date of the balancesheet on which it is reported, adjusting it up or down toreflect the existence of a potential gain or loss at the timeof the eventual collection of the receivable. The final gainor loss will be recorded when the receivable is settled,using the spot rate on that date.
Financing in parent company’s currency?
Operations closely linked to parent
company?
Cash flows easily remitted to parent?
Most revenue/expense transactions in parent company
currency?
Largely “yes”
answers
Functional currency = local currency
Functional currency = reporting currency
Use current ratemethod
Use remeasurementmethod
YesNo
Highly inflationaryeconomy?
Yes
No
Exhibit 8.5 DECISION TREE FOR FOREIGN CURRENCY TRANSLATION METHODS
126 Foreign Currency Accounting
E1C08 03/04/2010 Page 127
How Do I Decide Which ConversionMethod to Use?
The decision tree shown in Exhibit 8.5 can be used todetermine whether to use the current rate method orremeasurement method when translating the financialstatements of a foreign subsidiary into the currency of thecorporate parent.
What Is the Accounting for ForeignCurrency TranslationAdjustments?
The gains and losses resulting from various translationadjustments are treated in different ways, with some ini-tially being stored in the balance sheet and others beingrecorded at once in the income statement. Here are thekey rules to remember:
m If a company is directly engaged in foreign exchangetransactions that are denominated in foreign curren-cies, any translation adjustments to U.S. dollars thatresult in gains or losses should be immediately recog-nized in the income statement. The company can con-tinue to make these adjustments for changes betweenthe last reporting date and the date of the currentfinancial statements, and may continue to do so untilthe underlying transactions have been concluded.
EXAMPLE
The Louisiana Backhoe Company (LBC) sells back-hoes to a variety of countries in the European Union,all of which are paid for in euros. It sold $200,000 ofbackhoes to Germany on March 15. The receivablewas still outstanding on March 31, which was thedate of the quarterly financial statements. As of thatdate, the exchange rate of the euro has dropped by1%, so LBC has an unrecognized loss of $2,000. Itrecords this as a loss on foreign currency transactionsand credits its accounts receivable account to reducethe amount of its receivable asset. When paymenton the receivable is made to LBC on April 15, theexchange rate has returned to its level on the sale dateof March 15. LBC must now record a gain on its booksof $2,000 to offset the loss it had previously recorded.
Accounting for Foreign Currency 127
E1C08 03/04/2010 Page 128
m Do not report gains or losses on transactions of along-term nature when accounted for by the equitymethod. These transactions are defined as those withno settlement date planned in the foreseeable future.Instead, include these transactions in the standardtranslation procedure used to translate the financialstatements of a subsidiary into the currency of itscorporate parent.
m If a foreign entity has multiple distinct operations, itis possible that some have different functional cur-rencies. If so, regularly review their operations todetermine the correct functional currency to use,and translate their financial results accordingly.However, if the results of a selected operation on thefinancial reports of a foreign entity are insignificant,there is no requirement to break out its financialstatements using a different functional currency.
m If there has been a material change in an exchangerate in which a company’s obligations or subsidiaryresults are enumerated, and the change has occurredsubsequent to the date of financial statements thatare being included in a company’s audited results,the change and its impact on the financial statementsshould be itemized in a footnote that accompaniesthe audited results.
What Exchange Rates Are Used forConversion Calculations?
There can be some confusion regarding the preciseexchange rate to be used when conducting foreign cur-rency translations. Here are some guidelines.
m If there is no published foreign exchange rate availa-ble on the specific date when a transaction occurredthat requires translation, use the rate for the datethat most immediately follows the date of thetransaction.
m If the date of a financial statement that is to be con-verted from a foreign currency is different from thedate of the financial statements into which they areto be converted into U.S. dollars, use the date of theforeign currency financial statements as the date forwhich the proper exchange rate shall be used as thebasis for translation.
m If there is more than one published exchange rateavailable that can be used as the basis for a transla-tion, use the rate that could have been used as the
128 Foreign Currency Accounting
E1C08 03/04/2010 Page 129
basis for the exchange of funds which could then beused to remit dividends to shareholders. Alterna-tively, use the rate at which a settlement of the entirerelated transaction could have been completed.
How Is Foreign Exchange Handled inIntercompany Transactions?
When the results of a parent company and its subsidiariesare combined for financial statement reporting purposes,the gains or losses resulting from intercompany foreignexchange transactions must be reported in the consoli-dated statements. This happens when the parent has a re-ceivable denominated in the currency of the subsidiary, orvice versa, and a change in the exchange rate results in again or loss. Thus, even though the intercompany transac-tion is purged from the consolidated financial statement,the associated gain or loss must still be reported.
EXAMPLE
The Seely Furniture Company owns a sawmill inCanada that supplies all of its wood raw materials.The subsidiary holds receivables from the corporateparent that is denominated in U.S. dollars. Duringthe year, there has been a steady increase in thevalue of the dollar, resulting in a conversion intomore Canadian dollars than was the case when eachreceivable was originally created. By the end of theyear, the subsidiary has recorded a gain on currencytransactions of $42,000 Canadian dollars. Accord-ingly, the Seely corporate parent records the gain onits books, denominated in U.S. dollars. Because theyear-end exchange rate between the two currencieswas $0.73 Canadian per U.S. dollar, the subsidiary’sgain is recorded as a gain in U.S. dollars of $30,660($42,000 Canadian � 0.73 exchange rate) on thebooks of the parent.
Foreign Exchange 129

E1C08 03/04/2010 Page 130

E1C09 03/04/2010 Page 131
PART II
ACCOUNTINGMANAGEMENT

E1C09 03/04/2010 Page 132
E1C09 03/04/2010 Page 133
CHAPTER 9
CLOSING THE BOOKS
What Types of Closes Are There?
The standard close is the typical closing process, involvingextended wait times to ensure that all transactions arefully complete before financial statements are produced.The fast close is an acceleration of the standard closing pro-cess, resulting in approximately the same financial report-ing package being issued (possibly somewhat reduced insize). The focus of this approach is a careful examinationof the closing process to strip out wait times, consolidatetasks, eliminate unnecessary functions, add transactionbest practices, and selectively apply automation wherenecessary.
The soft close is less labor-intensive than a standardclose, because it does not generate as much information. Itis designed solely for internal corporate use, so its endproduct is only those management reports needed to runoperations. It typically does not include overhead alloca-tions and many accruals. The virtual close involves the useof a largely automated accounting system, one that canproduce required financial information at any time, on de-mand. It requires essentially error-free transactions.
What Problems Contribute to aDelayed Close?
Some or a combination of these issues can prolong theclosing process:
m Management perfectionism. The controller waits for allaccounting situations to resolve themselves, so thatthe reported results are more likely to be perfectlycorrect.
m Lack of procedures. There is no checklist for ensuringthat all closing steps are completed.
133
E1C09 03/04/2010 Page 134
m Multiple accounting software packages. Each subsidiarycompiles accounting information in a different sys-tem, which is manually transferred to the corporatesystem.
m Excessive decentralization. Subsidiary-level resultsmust be completed before being forwarded to thecorporate staff for consolidation.
m Low-quality data. Transactional errors must be cor-rected before the financial statements are issued.
m Varying charts of accounts. Subsidiaries use differentcharts of accounts, so their results must be remap-ped into the corporate system.
m Multiple report formats. Different managers receivedifferent financial statement formats, which requireadditional report assembly work.
m Public reporting. If financials must be converted intoannual Form 10-K or quarterly Form 10-Q reports,auditors, attorneys, and the audit committee will bealso involved.
How Does Activity AccelerationImprove the Close?
A large number of closing activities should be shifted intothe month prior to the closing date. The listed itemsshould be considered for this treatment.
m Review subledger accounts. A continuing review willuncover transactional errors that can be fixed wellbefore the end of the month.
m Reconcile bank accounts. Reconciling cash records tobank balances every day leaves very little bank rec-onciliation work to complete at month-end.
m Update reserves. The reserves for inventory obsoles-cence, bad debts, and sales returns can usually beupdated prior to the end of the month.
m Review lower of cost or market (LCM). Schedule LCMreviews prior to month-end, in order to process anynecessary write-downs in advance of the close.
m Bill recurring invoices. Print any recurring invoicesfor the following month in advance, assuming thatbillable amounts can be predicted.
m Review rebillable expenses. Some employee expensesare rebilled to customers; if so, review the expensesearly, to see if they are appropriate for rebilling.
m Review preliminary billable hours. There are usuallysome errors in the employee records for billable
134 Closing the Books
E1C09 03/04/2010 Page 135
hours, so review the time records in advance andcorrect them as necessary.
m Accrue interest expense. Unless significant changesin debt levels are expected near the month-end, pre-dict debt balances and accrue the related interestexpense.
m Accrue unpaid wages. Use a centralized timekeepingsystem and an estimate of overtime hours worked toaccrue hourly wages payable just prior to the closingdate.
m Reconcile asset and liability accounts. Review the detailfor all asset and liability accounts just prior to theclose, when there is more time for a thoughtful re-view of these accounts. Any last-minute changes tothese accounts can be reviewed in the followingmonth.
m Calculate depreciation. Calculate and record depreca-tion just prior to the close; for late asset changes, re-cord a catch-up entry in the following month.
m Review financial statements for errors. Print the finan-cial statements a day or two in advance, looking forobvious errors, and correct them before the closebegins.
m Complete supporting reports in advance. If there are re-ports that accompany the financial statements, com-plete them to the extent possible before period-end.
How Do Reporting ChangesImprove the Close?
The next possibilities can reduce the effort required to cre-ate and deliver the financial statements.
m Post the financial statements. It can take time to physi-cally print the financial reporting package and de-liver it to recipients, so consider posting it in PDFformat on a company intranet site and notifyingrecipients of the post.
m Standardize reports. Some managers want differentcontents to their financial reporting packages. Instead,issue the same core package to all recipients, and fol-low up later with additional reports, as needed.
m Eliminate cost reporting. Cost reports take a long timeto complete, so issue them separately from the finan-cial statements.
m Eliminate metrics. Metrics calculations require addi-tional time to complete, so issue them after the finan-cial statements have been delivered.
How Do Reporting Changes Improve the Close? 135
E1C09 03/04/2010 Page 136
How Can Journal Entry OptimizationImprove the Close?
Proper management of journal entries and the chart ofaccounts can lead to significant improvements in the clos-ing process. Here are the key factors to consider.
m Eliminate immaterial entries.Many entries have an im-material impact on the results shown in the financialstatements, so do not waste time recording them.
m Standardize journal entries. If journal entries are re-peated in the same format every month, create a jour-nal entry template and use it every month, therebyreducing labor and avoiding data entry errors.
m Use recurring entries. If an entry is in the exact sameamount every month and is recorded against thesame accounts, set it up in the accounting system to berecurring, so that no additional entry labor is required.
m Restrict data entry. Only one person who is expert atdata entry should record journal entries. This re-duces errors and also prevents duplicate entriesfrom being made.
m Standardize the chart of accounts. All subsidiariesshould use the same version of the chart of accounts,with no exceptions. This prevents the need for map-ping to the corporate chart of accounts.
How Can I Improve the InventoryClose?
The next factors are of great assistance in completingthe inventory portion of the close, since they are instru-mental in creating inventory records with a high degreeof accuracy.
m Create inventory tracking system. Create an inventorydatabase in which the quantity of each item isshown as well as the location where it is located.
m Implement cycle counting. The warehouse staff shouldcount a small portion of the inventory every day, ona rolling basis, and reconcile the results to the inven-tory database.
m Reduce the inventory. Use the techniques listed inChapter 12, Inventory Management, to reduce the totalnumber of stock-keeping units in the warehouse.
m Eliminate obsolete inventory. Use the dispositioningmethods noted in Chapter 12 to flush out all inven-tory designated as obsolete.
136 Closing the Books
E1C09 03/04/2010 Page 137
The first two points are needed to improve inventoryrecord accuracy, while the last two points are needed toreduce the total number of records that must bemaintained.
How Can I Improve the Payroll Close?
The central issue in improving the closing speed of thepayroll function is to automate the entire function to thegreatest extent possible. Here are specific areas that canbenefit the most from automation.
m Computerize timekeeping. Install computerized timeclocks that summarize time postings into a centraldatabase and flag possibly incorrect information forfurther review.
m Grant system access to managers and employees.Manag-ers and employees can directly update informationin the payroll system, thereby reducing the risk ofdata entry errors by the payroll staff.
m Automate pay calculations. Either use an off-the-shelfaccounting system that calculates pay, or outsourcethis task.
m Automate commission calculations. Streamline themethodology for calculating commissions to thepoint where the computer system can generate thecommissions with a simple report.
m Automate payments. Use direct deposit or pay cards,so that the pay system automatically issues pay-ments to employees.
These steps essentially automate the payroll processfrom beginning to end, so that the payroll staff only has tomonitor the system for errors. It greatly expedites the pay-roll close.
How Can I Improve the Payables Close?
The essential parts of the payables function that impactthe closing process are the sheer volume of transactionsand the risk of delayed supplier invoices. The next pointscan improve the process.
m Record invoices upon receipt. Do not route invoicesoutside the payables department for approvals andthen record them, which increases the risk of lostinvoices. Do the reverse, so that all invoices arerecorded promptly upon receipt.
How Can I Improve the Payables Close? 137
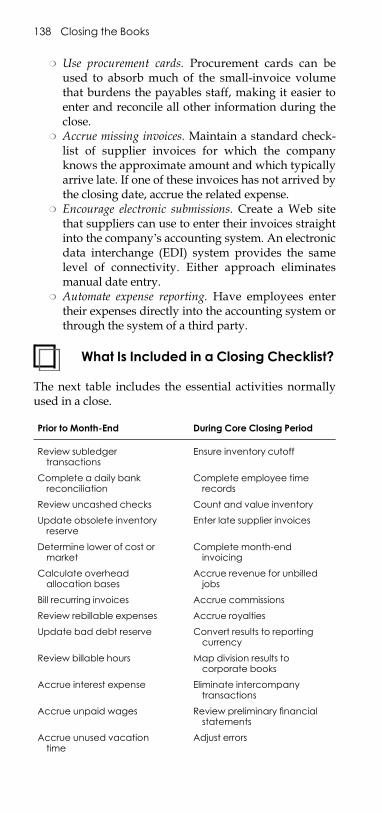
E1C09 03/04/2010 Page 138
m Use procurement cards. Procurement cards can beused to absorb much of the small-invoice volumethat burdens the payables staff, making it easier toenter and reconcile all other information during theclose.
m Accrue missing invoices. Maintain a standard check-list of supplier invoices for which the companyknows the approximate amount and which typicallyarrive late. If one of these invoices has not arrived bythe closing date, accrue the related expense.
m Encourage electronic submissions. Create a Web sitethat suppliers can use to enter their invoices straightinto the company’s accounting system. An electronicdata interchange (EDI) system provides the samelevel of connectivity. Either approach eliminatesmanual date entry.
m Automate expense reporting. Have employees entertheir expenses directly into the accounting system orthrough the system of a third party.
What Is Included in a Closing Checklist?
The next table includes the essential activities normallyused in a close.
Prior to Month-End During Core Closing Period
Review subledgertransactions
Ensure inventory cutoff
Complete a daily bankreconciliation
Complete employee timerecords
Review uncashed checks Count and value inventory
Update obsolete inventoryreserve
Enter late supplier invoices
Determine lower of cost ormarket
Complete month-endinvoicing
Calculate overheadallocation bases
Accrue revenue for unbilledjobs
Bill recurring invoices Accrue commissions
Review rebillable expenses Accrue royalties
Update bad debt reserve Convert results to reportingcurrency
Review billable hours Map division results tocorporate books
Accrue interest expense Eliminate intercompanytransactions
Accrue unpaid wages Review preliminary financialstatements
Accrue unused vacationtime
Adjust errors
138 Closing the Books
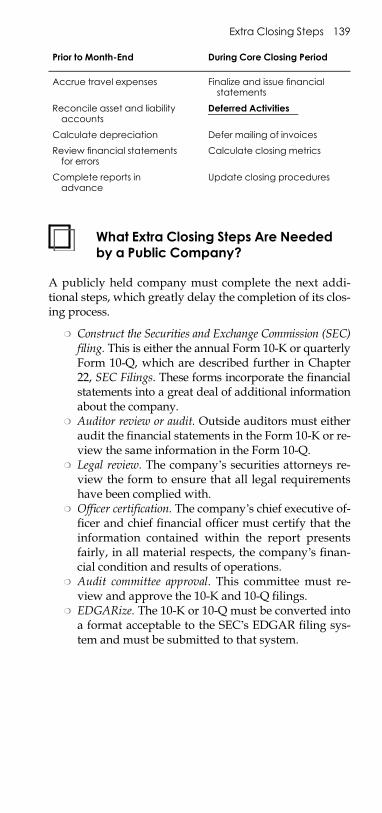
E1C09 03/04/2010 Page 139
Accrue travel expenses Finalize and issue financialstatements
Reconcile asset and liabilityaccounts
Deferred Activities
Calculate depreciation Defer mailing of invoices
Review financial statementsfor errors
Calculate closing metrics
Complete reports inadvance
Update closing procedures
What Extra Closing Steps Are Neededby a Public Company?
A publicly held company must complete the next addi-tional steps, which greatly delay the completion of its clos-ing process.
m Construct the Securities and Exchange Commission (SEC)filing. This is either the annual Form 10-K or quarterlyForm 10-Q, which are described further in Chapter22, SEC Filings. These forms incorporate the financialstatements into a great deal of additional informationabout the company.
m Auditor review or audit. Outside auditors must eitheraudit the financial statements in the Form 10-K or re-view the same information in the Form 10-Q.
m Legal review. The company’s securities attorneys re-view the form to ensure that all legal requirementshave been complied with.
m Officer certification. The company’s chief executive of-ficer and chief financial officer must certify that theinformation contained within the report presentsfairly, in all material respects, the company’s finan-cial condition and results of operations.
m Audit committee approval. This committee must re-view and approve the 10-K and 10-Q filings.
m EDGARize. The 10-K or 10-Q must be converted intoa format acceptable to the SEC’s EDGAR filing sys-tem and must be submitted to that system.
Prior to Month-End During Core Closing Period
Extra Closing Steps 139

E1C09 03/04/2010 Page 140
E1C10 03/04/2010 Page 141
CHAPTER 10
CASH MANAGEMENT
What Types of Float Are Associated witha Check Payment?
When a company issues a check, its bank balance willremain unchanged for several days, due to four differentkinds of float.
1. There is a delay while the payment is deliveredthrough the postal service, which is the mail float.
2. The supplier must deposit the check at its bank; thetime between when the supplier receives the checkand deposits it is the processing float.
3. The time between when the check is deposited andwhen it is available to the recipient is the availabilityfloat. Availability float is generally no longer thantwo days.
4. The time between when the check is deposited andwhen it is charged to the payer’s account is the pre-sentation float.
The same process works in reverse when a companyreceives a payment from a customer. In this case, the com-pany receives a payment and records the receipt in itsown records but must wait multiple days before the cashis credited to its bank account. This availability float worksagainst the company, because it does not immediatelyhave use of the funds noted on the check.
The combination of the floats associated with theseinbound and outbound check payments is the net float.
The check process flow, with float periods included, isshown in Exhibit 10.1.
141
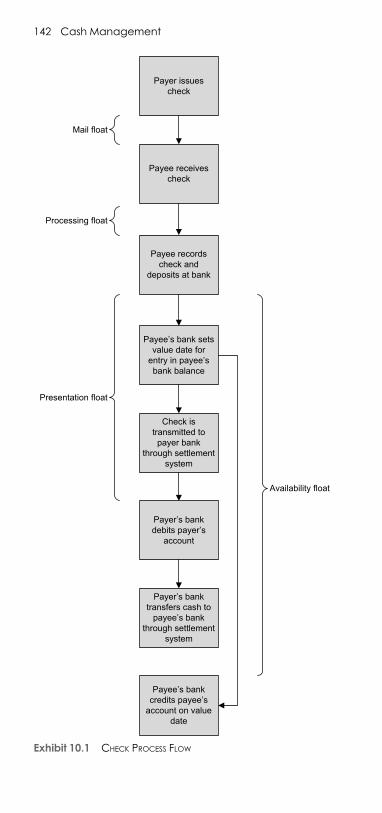
E1C10 03/04/2010 Page 142
Payer issues check
Payee receives check
Payee’s bank sets value date for
entry in payee’s bank balance
Check is transmitted to payer bank
through settlement system
Payer’s bank debits payer’s
account
Payer’s bank transfers cash to
payee’s bank through settlement
system
Payee’s bank credits payee’s
account on value date
Mail float
Payee records check and
deposits at bank
Processing float
Presentation float
Availability float
Exhibit 10.1 CHECK PROCESS FLOW
142 Cash Management
E1C10 03/04/2010 Page 143
What Is Value Dating?
When a bank receives a deposit of checks from a payee, itwill credit the payee’s account with the funds representedby the checks. However, the bank has not really receivedthe cash yet, since it must still collect the funds from thebank of the paying party. Until the bank collects thefunds, it is at risk of having a negative cash flow situationif the payee uses the cash it has just received.
To avoid this risk, the bank posts the amount of the de-posit with a value date that is one or more days later thanthe book date. This value date is the presumed date of re-ceipt of the cash by the bank. Once the value date isreached, the payee has use of the funds. The value datemay also be categorized by a bank as one-day float, two-plus-day float, or some similar term.
Some banks take advantage of their customers andextend the value dating out beyond the point when theyhave actually received the cash. This gives a bank use ofthe funds for an additional period of time, at the expenseof its customers.
What Is a Lockbox?
A company can have its bank receive and process checkson its behalf, which is termed a lockbox service. The bankassigns a mailbox address to the company, which for-wards this information to its customers. The customersmail their checks to the lockbox, where the bank opensthe envelopes, scans all checks and accompanying docu-ments, deposits the checks, and makes the scans availableto the company through a Web site. By using a lockbox, acompany can eliminate some of the float involved incheck processing and eliminate some check-processing la-bor. This also means that checks are no longer processedthrough the company’s location, which greatly reducesthe amount of cash controls that it needs.
What Is Remote Deposit Capture?
Remote deposit capture allows a company to avoid thephysical movement of received checks to its bank. Instead,the company uses a special scanner and scanning soft-ware to create an electronic image of each check, which itthen transmits to the bank. The bank accepts the onlineimage, posts it to the company’s account, and assignsfunds availability based on a predetermined schedule.
What Is Remote Deposit Capture? 143
E1C10 03/04/2010 Page 144
The key benefit of remote deposit capture is the com-plete elimination of the transportation float that ariseswhen shifting checks from the company to the bank. An-other benefit is that a company no longer needs a bankthat is physically located near the company location. In-stead, it can consolidate its banking relationships and usejust a single provider that may be located anywhere in thecountry.
Why Is Cash Concentration Useful?
Aggregating cash from multiple accounts into a single oneis useful for these reasons:
m Elimination of idle cash. Cash idling in a multitude ofaccounts can be aggregated into interest-earninginvestments.
m Improved investment returns. If cash can be aggre-gated, it is easier to allocate the cash into short-term,low-yield investments and higher-yield, longer-terminvestments. The overall results should be an im-proved return on investment.
m More cost-effective oversight of accounts.When an auto-mated sweeping arrangement is used to concentratecash, there is no need to manually review subsidiaryaccount balances. This can yield a significant reduc-tion in labor costs.
m Internal funding of debit balances. Where a company isgrappling with ongoing debit balance problems inmultiple accounts, the avoidance of high-cost bankoverdraft charges alone may be a sufficient incentiveto use cash concentration.
What Strategies Are Available for CashConcentration?
A company having multiple locations can pursue a vari-ety of cash concentration strategies, which tend to bringlarger benefits with greater centralization. The four strate-gies are presented in increasing order of centralization.
1. Complete decentralization. Every subsidiary or branchoffice with its own bank account manages its owncash position. This is fine if balances are small, sothat there is little synergy to be gained by concen-trating cash in a single account.
2. Centralized payments, decentralized liquidity manage-ment. A company can implement a centralized
144 Cash Management
E1C10 03/04/2010 Page 145
payment factory that handles all payables for allcompany subsidiaries but issues payments from lo-cal accounts. This improves the overall planning forcash outflows but does not improve the manage-ment of excess cash balances, for which local manag-ers are still responsible.
3. Centralized liquidity management, decentralized pay-ments. The corporate staff centralizes cash into a con-centration account and has responsibility forinvestments. However, local managers are still re-sponsible for disbursements.
4. All functions centralized. The corporate staff pools allcash into a concentration account, invests it, andmanages disbursements. This is an excellent struc-ture for optimizing investment income and alsogives corporate headquarters considerable controlover the accounts payable portion of the company’sworking capital. Larger companies usually followthis strategy.
What Is Physical Sweeping?
When a company sets up a zero-balance account, its bankautomatically moves (sweeps) cash from that account intoa concentration account, usually within the same bank.The cash balance in the zero-balance account (as the nameimplies) is reduced to zero whenever a sweep occurs. Ifthe account has a debit balance at the time of the sweep,money is shifted from the concentration account back intothe account having the debit balance. An example isshown in Exhibit 10.2.
In the example, two of three subsidiary accounts ini-tially contain credit (positive) balances, and Account Ccontains a debit (negative) balance. In the first stage ofthe sweep transaction, the cash in the two accounts hav-ing credit balances are swept into the concentration ac-count. In the next stage of the sweep, sufficient fundsare transferred from the concentration account to offsetthe debit balance in Account C. At the end of thesweep, there are no credit or debit balances in the zero-balance accounts.
It is also possible to use constant balancing to maintain apredetermined minimum balance in a subsidiary account,which involves sweeping only those cash levels above theminimum balance and reverse sweeping cash into thesubsidiary account if the balance drops below the mini-mum balance.
What Is Physical Sweeping? 145
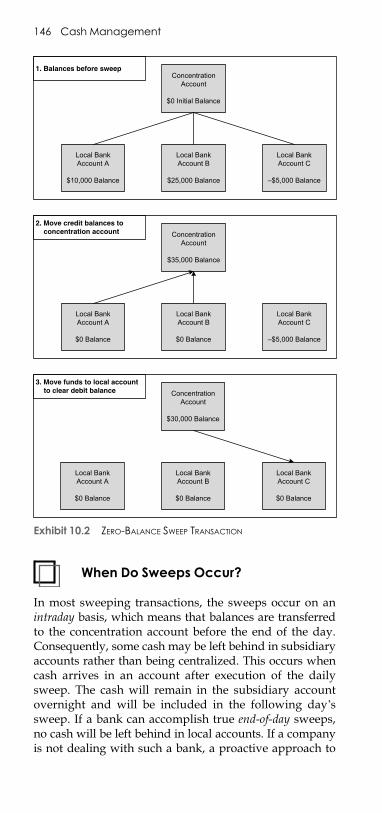
E1C10 03/04/2010 Page 146
When Do Sweeps Occur?
In most sweeping transactions, the sweeps occur on anintraday basis, which means that balances are transferredto the concentration account before the end of the day.Consequently, some cash may be left behind in subsidiaryaccounts rather than being centralized. This occurs whencash arrives in an account after execution of the dailysweep. The cash will remain in the subsidiary accountovernight and will be included in the following day’ssweep. If a bank can accomplish true end-of-day sweeps,no cash will be left behind in local accounts. If a companyis not dealing with such a bank, a proactive approach to
Concentration Account
$0 Initial Balance
Local Bank Account B
$25,000 Balance
Local Bank Account A
$10,000 Balance
Local Bank Account C
–$5,000 Balance
Concentration Account
$35,000 Balance
Local Bank Account B
$0 Balance
Local Bank Account A
$0 Balance
Local Bank Account C
–$5,000 Balance
Concentration Account
$30,000 Balance
Local Bank Account B
$0 Balance
Local Bank Account A
$0 Balance
Local BankAccount C
$0 Balance
1. Balances before sweep
2. Move credit balances to concentration account
3. Move funds to local account to clear debit balance
Exhibit 10.2 ZERO-BALANCE SWEEP TRANSACTION
146 Cash Management
E1C10 03/04/2010 Page 147
depositing checks before cut-off times is the best way toavoid unused cash.
When Are Intercompany Loans Linkedto Cash Sweeps?
A company may need to record an intercompany loanfrom the subsidiary to the corporate parent in the amountof the cash transferred through the cash concentrationprocess. Here are several reasons for doing so:
m Subsidiary-level financial reporting requirements. A sub-sidiary may have an outstanding loan, for which abank requires the periodic production of a balancesheet. Since account sweeping shifts cash away froma subsidiary’s balance sheet, detailed sweep trackingis needed to put the cash back on the subsidiary’sbalance sheet for reporting purposes. This can bedone by recording an intercompany loan from thesubsidiary to the corporate parent in exchange forany swept cash.
m Interest income allocation. A company may elect toallocate the interest earned at the concentration ac-count level back to the subsidiaries whose accountscontributed cash to the concentration account. Somecountries require that this interest allocation bedone, to keep a company from locating the concen-tration account in a low-tax jurisdiction, where thetax on interest income is minimized.
m Interest expense allocation. Some tax jurisdictions mayrequire the parent company to record interestexpense on intercompany loans associated with thetransfer of cash in a physical sweeping arrangement.If so, the company must track the intercompany loanbalances outstanding per day; these balances arethen used as the principal for the calculation of inter-est expense.
What Is Notional Pooling?
Notional pooling is a mechanism for calculating interest onthe combined credit and debit balances of accounts that acorporate parent chooses to cluster together, without actu-ally transferring any funds. Once a company earns inter-est on the funds in a notional account, interest income isusually allocated back to each of the accounts comprisingthe pool.
What Is Notional Pooling? 147
E1C10 03/04/2010 Page 148
This approach allows each subsidiary company to takeadvantage of a single, centralized liquidity position whilestill retaining daily cash management privileges. Also,since the approach avoids the use of cash transfers to acentral pooling account, there is no need to create or mon-itor intercompany loans.
Where global notional pooling is offered (usuallywhere all participating accounts are held within a singlebank), the pool offsets credit and debit balances on amulticurrency basis without the need to engage in anyforeign exchange transactions. An additional benefit ofglobal notional pooling lies in the area of intercompanycash flows; for example, if there are charges for admin-istrative services, the transaction can be accomplishedwith no net movement of cash.
What Is a Bank Overlay Structure?
Companies operating on an international scale fre-quently have trouble reconciling the need for efficientcash concentration operations with the use of local bank-ing partners with which they may have long-standingrelationships and valuable business contacts. The solu-tion is the bank overlay structure.
A bank overlay structure consists of two layers. Thelower layer is comprised of all in-country banks that areused for local cash transaction requirements. The higherlayer is a group of networked regional banks, or even asingle global bank, that maintains a separate bank accountfor each country or legal entity of the corporate structure.Cash balances in the lower layer of banks are zero-balanced into the corresponding accounts in the higherlayer of banks on a daily basis (where possible, subject tocash flow restrictions). These sweeps are accomplishedwith manual transfers, SWIFT messages from the net-worked banks to the local banks, or standing authoriza-tions to the local banks. The concept is shown inExhibit 10.3. This approach allows funds to be consoli-dated on either a regional or global basis for centralizedcash management.
What Short-Term Investment OptionsAre Available?
There are a number of short-term investment optionsavailable. Here are the most common ones that have low
148 Cash Management
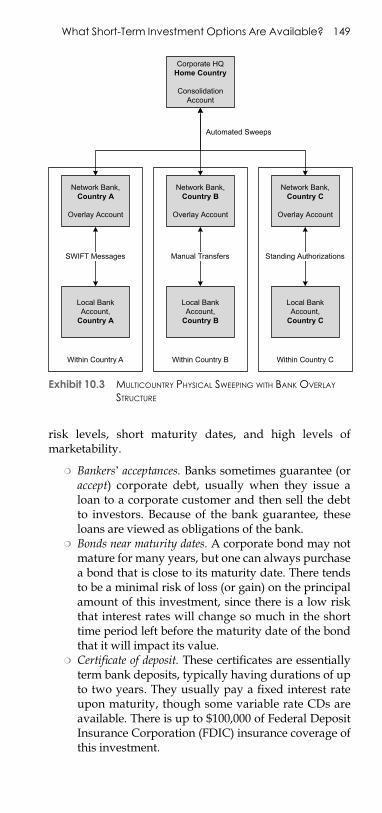
E1C10 03/04/2010 Page 149
risk levels, short maturity dates, and high levels ofmarketability.
m Bankers’ acceptances. Banks sometimes guarantee (oraccept) corporate debt, usually when they issue aloan to a corporate customer and then sell the debtto investors. Because of the bank guarantee, theseloans are viewed as obligations of the bank.
m Bonds near maturity dates. A corporate bond may notmature for many years, but one can always purchasea bond that is close to its maturity date. There tendsto be a minimal risk of loss (or gain) on the principalamount of this investment, since there is a low riskthat interest rates will change so much in the shorttime period left before the maturity date of the bondthat it will impact its value.
m Certificate of deposit. These certificates are essentiallyterm bank deposits, typically having durations of upto two years. They usually pay a fixed interest rateupon maturity, though some variable rate CDs areavailable. There is up to $100,000 of Federal DepositInsurance Corporation (FDIC) insurance coverage ofthis investment.
Local Bank Account,
Country A
Local Bank Account,
Country B
Local Bank Account,
Country C
Network Bank, Country A
Overlay Account
Network Bank,Country B
Overlay Account
Network Bank, Country C
Overlay Account
Corporate HQ Home Country
Consolidation Account
Within Country CWithin Country BWithin Country A
SWIFT Messages Manual Transfers Standing Authorizations
Automated Sweeps
Exhibit 10.3 MULTICOUNTRY PHYSICAL SWEEPING WITH BANK OVERLAY
STRUCTURE
What Short-Term Investment Options Are Available? 149
E1C10 03/04/2010 Page 150
m Commercial paper. Larger corporations issue short-term notes that carry higher yields than governmentdebt issuances offer. There is also an active second-ary market for them, so there is usually no problemwith liquidity. Commercial paper is generally notsecured; however, staying with the commercialpaper issued by blue-chip organizations minimizesthe risk of default. Most commercial paper maturesin 30 days or less; it rarely matures in greater than270 days. Commercial paper is issued at a discount,with the face value being paid at maturity.
m Money market fund. This is a package of governmentinstruments, usually comprised of Treasury bills,notes, and bonds, that is assembled by a fund man-agement company. The investment is highly liquid,with many investors putting in funds for as littleas a day.
m Repurchase agreement. This is a package of securities(frequently government debt) that an investor buysfrom a financial institution, under the agreementthat the institution will buy it back at a specific priceon a specific date. It is most commonly used for theovernight investment of excess cash from a com-pany’s cash concentration account, which can behandled automatically by the company’s primarybank. The typical interest rate earned on this invest-ment is equal to or less than the money market rate.
m U.S. Treasury issuances. The United States govern-ment issues a variety of notes with maturity datesthat range from less than a year (U.S. Treasury certif-icates) through several years (notes) to more thanfive years (bonds). There is a strong secondary mar-ket for these issuances, so they can be liquidated inshort order. U.S. government debts of all types areconsidered to be risk-free and so have lower yieldsthan other forms of investment.
What Investment Strategies Are Usedfor Short-Term Investments?
The next strategies can be used to invest excess cash, pre-sented in order from the most passive to the most activestrategies.
m Earnings credit strategy. Do nothing and leave idlebalances in the corporate bank accounts. As a result,the bank uses the earnings from these idle balancesto offset its service fees. If a company has minimal
150 Cash Management
E1C10 03/04/2010 Page 151
cash balances, leaving the cash alone is a reasonableinvestment approach.
m Matching strategy. Match the maturity date of an in-vestment to the cash flow availability dates listed onthe cash forecast. For example, ABC Company’scash forecast indicates that $80,000 will be availablefor investment immediately but must be used in twomonths for a capital project. The controller can in-vest the funds in a two-month instrument, such thatits maturity date is just prior to when the funds willbe needed. This approach is more concerned withshort-term liquidity than return on investment.
m Laddering strategy. Create a set of investments thathave a series of consecutive maturity dates. Forexample, ABC Company’s cash forecast indicatesthat $150,000 of excess cash will be available for theforeseeable future, and its investment policy forbidsany investments having a duration of greater thanthree months. In order to keep the investment liquidwhile still taking advantage of the higher interestrates available through longer-term investments, thecontroller breaks the available cash into thirds andinvests $50,000 in a one-month instrument, another$50,000 in a two-month instrument, and the final$50,000 in a three-month instrument. As each invest-ment matures, the controller reinvests it into a three-month instrument. By doing so, ABC always has$50,000 of the invested amount coming due withinone month or less. This method offers improvesliquidity while still taking advantage of longer-terminterest rates.
m Tranched cash flow strategy. Determine what cash isavailable for short-, medium-, and long-term invest-ment and then adopt different investment criteriafor each of these investment tranches. The short-term tranche has low returns but high liquidity. Themedium-term tranche includes cash that may be re-quired for use within the next 3 to 12 months, andusually only for highly predictable events. Given themore predictable nature of these cash flows, longer-term maturities with somewhat higher returns canbe used. The long-term tranche includes cash forwhich there is no planned operational use andwhich can be safely invested for at least a year athigher rates of return.
Investment Strategies 151

E1C10 03/04/2010 Page 152
E1C11 03/04/2010 Page 153
CHAPTER 11
RECEIVABLES MANAGEMENT
How Do I Create and Maintaina Credit Policy?
A cause of confusion not only within the credit depart-ment but also between the credit and sales departments isthe lack of consistency in dealing with customer creditissues. Establishment of a credit policy helps resolve theseissues. The policy should clearly state the mission andgoals of the credit department, exactly which positionsare responsible for the most critical credit and collectiontasks, what formula shall be used for assigning creditlevels, and what steps shall be followed in the collectionprocess. Further comments are:
m Mission. The mission statement should outline thegeneral concept of how the credit department doesbusiness: Does it provide a loose credit policy tomaximize sales, or work toward high-quality receiv-ables (implying reduced sales), or manage credit atsome point in between? A loose credit policy mightresult in this mission: ‘‘The credit department shalloffer credit to all customers except those where therisk of loss is probable.’’
m Goals. Goals describe the performance measure-ments against which the credit staff will be judged.For example: ‘‘The department goals are to operatewith no more than one collections person per 1,000customers while attaining a bad debt percentage nohigher than 2% of sales and annual days sales out-standing of no higher than 42 days.’’
m Responsibilities. This is the most critical part of thepolicy. It should state who has final authority overthe granting of credit and the assignment of credithold status. Normally the credit manager has thisauthority, but the policy can also state the order vol-ume level at which someone else, such as the chief
153
E1C11 03/04/2010 Page 154
financial officer (CFO) or treasurer, can be called onto render final judgment.
m Credit level assignment. The policy should state thesources of information to be used in the calculationof a credit limit, such as credit reports or financialstatements, and can also include the minimum creditlevel automatically extended to all customers as wellas the criteria used to grant larger limits.
m Collections methodology. The policy can itemize whatcollection steps shall be followed, such as initialcalls, customer visits, e-mails, notification of thesales staff, credit holds, and forwarding to a collec-tion agency.
m Terms of sale. If there are few product lines in a singleindustry, it is useful to clearly state a standard pay-ment term, such as a 1% discount if paid in 10 days;otherwise full payment is expected in 30 days. Anoverride policy can be included, noting a sign-off bythe controller or CFO. By doing so, the sales staffwill be less inclined to attempt to gain better termson behalf of customers.
The credit policy should change to meet economic con-ditions. To do so, schedule a periodic review of the creditpolicy. To prepare for the meeting, assemble a list of lead-ing indicators for the industry, tracked on a trend line,that show where the business cycle is most likely to beheading. This information is most relevant for the com-pany’s industry rather than the economy as a whole, sincethe conditions within some industries can vary substan-tially from the general economy.
How Do I Obtain Financial Informationabout Customers?
A credit report is a good source of information about pro-spective customers. The largest purveyor of these reportsis Dun & Bradstreet (www.dnb.com), followed by Equifax(www.equifax.com). Report prices range from $40 to $125for reports with varying amounts of information, withreduced pricing if one agrees to purchase a monthly sub-scription. Low-cost reports include only basic customerinformation, such as corporate names, locations, owner-ship, and corporate history, while the more expensivereports include a variety of financial and payment infor-mation. Equifax reports present information more graphi-cally, but the two report providers issue essentially the
154 Receivables Management
E1C11 03/04/2010 Page 155
same information. Both companies provide credit reportsover the Internet.
It is substantially easier to obtain financial informationabout publicly held customers. By going to the www.sec.gov Web site, one can easily call up all of the most recentfinancial filings submitted by these entities. The bestsource of information is the 10-Q report, which detailsand discusses a company’s quarterly results. Though ashorter report than the annual 10-K report, it containsmuch more current information and so is of more use tothe credit department.
How Does a Credit-Granting SystemWork?
Credit-granting systems are customized by company anddepend greatly on industry conditions, product margins,and the willingness of management to extend credit.An example of a credit-granting system follows, using asimple yes/no decision matrix that is based on a few keycredit issues.
1. Is the initial order less than $1,000? If so, grant creditwithout review.
2. Is the initial order more than $1,000 but less than$10,000? Require a completed credit application.Grant a credit limit of 10% of the customer’s networth.
3. Is the initial order more than $10,000? Require acompleted credit application and financial state-ments. If a profitable customer, grant a credit limitof 10% of the customer’s net worth. Reduce thecredit limit by 10% for every percent of customerloss reported.
4. Does an existing customer’s order exceed its creditlimit by less than 20% and there is no history ofpayment problems? If so, grant the increase.
5. Does an existing customer order exceed its creditlimit by more than 20% or is there a history of pay-ment problems? If so, forward to the credit managerfor review. Use the same credit granting processlisted in step 3.
6. Does an existing customer have any invoices at least60 days past due? If so, freeze all orders.
While this approach does not completely eliminatevariability from the credit-granting process, it sets upclear decision points governing what actions to take for
How Does a Credit-Granting SystemWork? 155
E1C11 03/04/2010 Page 156
the majority of situations, leaving only the more difficultcustomer accounts for additional review.
What Payment Terms Should I Offerto Customers?
The baseline payment terms that a company should con-sider offering to its customers are the standard termsoffered in the industry, which may range from immediatepayment to 60-day terms. The key issue is to give theappearance of offering competitive terms, so that prospec-tive customers will not be turned away. However, it isquite acceptable to modify these baseline terms considera-bly if a customer appears to present a credit risk. Here aresome alternatives.
m Shorten the terms of sale. For example, a customermay plan to place 10 orders for $3,000 each withinthe company’s standard 30-day terms period, result-ing in a required credit line of $30,000. Reducingpayment terms to 15 days would mean that the cus-tomer should be able to purchase the same quantityof goods from the company on a credit line of just$15,000. This approach works only if a customer isplacing many small orders rather than one largeone, the orders are evenly spaced out, and the cus-tomer’s own cash receipts cycle allows it to pay onsuch short terms.
m Offer a lease. A lease allows customers to make a se-ries of smaller payments over time. Though the com-pany could offer this service itself and earn extrainterest income on the sale, this still leaves the riskof collection with the company. An alternative is toengage the services of an outside leasing firm, so thecompany receives payment from the lessor as soonas payment is authorized by the customer, therebyeliminating the collection risk in the shortest possi-ble time frame. Of course, a lease is a viable alterna-tive only when the company is selling a fixed assetthat the customer intends to retain.
m Obtain a personal guarantee. The personal guaranteemakes collection easier, since the signer knows thathe or she is responsible for the amount of the receiv-able and will make sure that this invoice is paid be-fore other unsecured invoices.
m Obtain credit insurance. This is a guarantee by an in-surance company against customer nonpayment.Credit insurance is available for domestic credit,
156 Receivables Management
E1C11 03/04/2010 Page 157
export credit, and coverage of custom products priorto delivery, in case customers cancel orders. If the in-surance company considers a customer to be highrisk, it will likely grant no insurance at all.
When Should I Review Customer CreditLevels?
If a customer only places small orders, there may be noneed for a credit application. However, there should be aminimum order level above which a credit application isrequired. If a customer has not placed an order recently,its financial situation may have changed considerably,rendering its previously assigned credit level no longervalid. A solution is to require customers to complete anew credit application after a preset interval has passed,such as two years. However, if there are so many custom-ers that this would be a burden for the credit staff, stratifythe customer list by order volume over the past year, andreview the credit of only that 20% of the list comprising80% of the order volume. This approach drastically re-duces the amount of credit analysis work while still ensur-ing a high level of review on those accounts that couldhave a serious bad debt impact on the company.
If a customer misses a payment due date by a predeter-mined number of days, skips payments, stops takingearly-payment discounts, or issues a ‘‘not sufficientfunds’’ check, these actions should also trigger a requestto fill out a new credit application. Finally, a new applica-tion should be required if a customer consistently placesorders above its original order limit.
How Can I Adjust the Invoice Contentand Layout to ImproveCollections?
Most invoices contain nearly all of the information cus-tomers need to make a payment, but the layout may be sopoor that they must hunt for the information. In othercases, adding information will reduce payment problems.Here are some invoice layout changes that can help im-prove collections.
m Clearly state contact information. Contact informationshould be delineated by a box and possibly noted inbold or colored print, so customers know whom tocall if they have an issue. If the billing staff is large,
Adjust the Invoice Content and Layout 157
E1C11 03/04/2010 Page 158
it may not be practical to put a specific contact nameon the invoice, but at least list a central contactphone number.
m Clearly state credit card contact information. This infor-mation should be for the person who is specificallytrained to handle credit card payments. Also, list onthe invoice the types of credit cards accepted by thecompany, which may prevent customers from mak-ing unnecessary calls if they do not have the righttypes of cards.
m State the discount cutoff date. Customers tend to mis-interpret discount payment terms in their favor. Toavoid this, clearly state the invoice payment date onthe invoice, preferably in bold and located in a box.
m Reduce clutter. Strip out information that is notneeded by the customer, and clarify the labeling ofthe remaining items.
m Include proof of receipt. If customers demand proof ofreceipt, extract receipt information from the Web siteof an overnight delivery service and paste it directlyinto the invoice.
How Can I Adjust Billing Delivery toImprove Collections?
Ensuring that the correct person receives a company’s in-voice may be the key to timely payment. Here are severalmethods for improving invoice delivery.
m Issue invoices in PDF format. Consider printing in-voices in Adobe PDF format, which creates an elec-tronic version of the invoice. Then e-mail theresulting invoice to the customer. The PDF format isbuilt into many accounting systems, or can bebought separately from Adobe Corporation.
m Bill early. If the company knows the exact amount ofa customer billing prior to the date when it is nor-mally sent, send it early. By doing so, the invoice hasmore time to be routed through the receiving organi-zation, passing through the mail room, accountingstaff, authorized signatory, and back to the accountspayable staff for payment. This makes it much morelikely that the invoice will be paid on time.
m Split large invoices. When an accounting departmentissues an invoice containing a large number of lineitems, it is more likely that the recipient will have anissue with one or more of the line items and will holdpayment on the entire invoice while those line items
158 Receivables Management
E1C11 03/04/2010 Page 159
are resolved. To avoid this problem, split apart largeinvoices into separate ones, with each invoice contain-ing just one line item. By doing so, it is more likelythat some invoices will be paid at once while otherones over which there are issues will be delayed.
m Match invoice delivery to payment dates. Some custom-ers with extremely large payment volumes createpayments only on certain days of the month in orderto yield the greatest level of efficiency in processingwhat may be thousands of checks. If a companydoes not send an invoice early enough to be in-cluded in the next check-processing run, it may haveto wait a number of additional weeks before the nextcheck run occurs, resulting in a late payment. Thesolution is to ask customers when they processchecks and make sure that the company issues in-voices well in advance of these dates in order to bepaid as early as possible.
Should I Offer Early Payment Discounts?
Only a company having severe cash flow problems shouldoffer early payment discounts to its customers. The prob-lem is that the effective interest rate the company is offeringto its customers is extremely high. For example, allowingcustomers to take a 2% discount if they pay in 10 days, ver-sus the usual 30, means that the company is offering a 2%discount in order to obtain cash 20 days earlier than nor-mal. The annualized interest rate of 2% for 20 days is about36%. All but the most debt-burdened companies can bor-row funds at rates far lower than that.
Furthermore, many customers will not pay within the10-day discount period but will still take the discount.This can lead to a great deal of difficulty in obtaining pay-ment of the withheld discount. In addition, the collectionstaff may have difficulty in applying the cash to open re-ceivables if it is not clear on which invoice a customer ispaying a discounted amount.
How Do I Optimize Customer Contacts?
The prime calling hours for most business customers are inthe early to midmorning hours, before they have beencalled away for meetings or other activities. If customersare concentrated in a single time zone, this can mean thatthe time period available for calls is extremely short. Also, ifthe customer base spans multiple time zones, a collections
How Do I Optimize Customer Contacts? 159
E1C11 03/04/2010 Page 160
staff based in one time zone may bemaking calls to custom-ers that are outside the customers’ prime calling hours, re-sulting in few completed calls. Consequently, set up acollections workday that is built around prime callinghours. For example, if the collections staff is based on theWest Coast but most of its customer contacts are on theEast Coast, its workday should begin very early in order tomake up for the three-hour time difference.
The typical list of overdue invoices is so long that theexisting collections staff cannot contact all customersabout all invoices on a sufficiently frequent basis. A solu-tion is to utilize collection call stratification. The conceptbehind this approach is to split up, or stratify, the overduereceivables and concentrate the bulk of the collectionstaff’s time on the largest invoices. By doing so, a com-pany can realize improved cash flow by collecting thelargest dollar amounts sooner. The downside is thatsmaller invoices will receive less attention and thereforetake longer to collect. For example, a collections staff canbe required to contact customers about all high-dollar in-voices once every three days, whereas low-dollar contactscan be limited to once every two weeks.
If customers are assigned to the collection staff basedon their names or geographic locations, it is likely that dif-ficult collection problems will be given to junior or in-effective collection staff, resulting in late payments. Asolution is to assign the best collection staff to the mostdifficult customers. By doing so, the company orients itscollection resources in the most targeted manner toachieve the highest possible collection percentage.
How Do I Manage CollectionInformation?
A poorly organized collections group is one that does notknow which customers to call, what customers said dur-ing previous calls, and how frequently contacts shouldbe made in the future. These problems can be overcomeby using a collection call database. The basic concept ofsuch a database is to keep a record of all contacts with thecustomer as well as when to contact the customer nextand what other actions to take.
Several commercially available collection call databasesare available. The typical database product is linked to acompany’s legacy accounting system by customized inter-faces. A key feature it offers is the assignment of each cus-tomer to a specific collections person, so that each person
160 Receivables Management
E1C11 03/04/2010 Page 161
can call up a subset of the overdue invoices for which heor she is responsible. Within this subset, the software willalso categorize accounts in different sort sequences, suchas placing those at the top that have missed their prom-ised payment dates. Also, the software will present all ofthe contact information related to each customer, includ-ing the promises made by customers, open issues, andcontact information. The system will also allow the userto enter information for a fax and then route it directly tothe recipient without requiring the collections person toever leave his or her chair. It can also be linked to anauto-dialer, so the collections staff spends less time at-tempting to establish connections with overdue customers.To further increase the efficiency of the collections staff, itwill even determine the time zone in which each customeris located and prioritize the recommended list of calls, sothat only those customers in time zones that are currentlyin the midst of standard business hours will be called.
How Do I Handle Payment Deductions?
An aggravating problem with deductions is how they arepassed from person to person within the company with-out ever reaching resolution. Here are several possiblesolutions.
m Assign responsibility. Make a single person responsi-ble for the deductions of a small group of customersand monitor the status of each open deduction on adaily basis, no matter which person within the com-pany is currently handling resolution issues.
m Implement a handling procedure. A deduction-handlingprocedure reduces the risk that open issues will belost in the system. This follows a tiered approach,where very small deductions are not worth the effortof even a single customer contact and are immediatelywritten off. For larger deductions, a company may re-quire immediate follow-up or follow-up only after thesecond deduction, or an immediate rebilling—thechoice is up to the individual company. The proce-dure should include such basic steps as:
1. Ensuring that the customer has provided ade-quate documentation of the problem.
2. Collection of data needed to substantiate or refutethe claim.
3. Contacting the customer to obtain missinginformation.
How Do I Handle Payment Deductions? 161
E1C11 03/04/2010 Page 162
4. Once collected, reviewing all information to de-termine a recommended course of action.
5. Depending on the size of the deduction, obtain-ing necessary approvals.
6. Contacting the customer with resolution infor-mation.
7. If approved, entering credit information into theaccounting system to clear debit balances repre-senting valid deductions.
The collections staff must be drilled in theuse of this procedure, so there is absolutely noquestion about how to handle a deduction. Thiswill favorably increase departmental efficiencyand require less management time to pass judg-ment on individual deduction problems.
m Stratify deductions. If there are a multitude of opendeductions, resolve deductions for the largest-dollaritems first and work down through the deductionslist in declining dollar order. This approach is ini-tially designed to take out of the accounts receivablelist the largest deductions; but more important, itallows the collections staff to research the reasonswhy the largest deductions are occurring and to puta stop to them. As the staff gradually fixes theseissues and moves down to small deductions, it canaddress relatively smaller underlying deductionissues.
m Report on deduction problems. Have the collectionsstaff summarize all deductions on a regular basisand forward this information to management. Themanagement team can review the data to see whatproblems are causing the deductions. It may be bestto issue the report sorted in several formats, sinceproblems hidden within one reporting format aremore visible in others. This approach calls for theuse of a central deductions database.
How Do I Collect Overdue Payments?
There are a multitude of methods for collecting paymentsfrom customers. The next list progresses from severalmilder contact methods into significantly more aggressivecollection techniques.
1. Call sooner. Begin calling immediately after the in-voice due date has passed. By taking this approach,the company instills in its customers the idea that
162 Receivables Management
E1C11 03/04/2010 Page 163
payment terms are to be taken seriously, and the com-pany absolutely expects payment on the stated date.
2. Issue dunning letters for small balances. This is the leastexpensive way to contact customers and is to bepreferred over more labor-intensive activities suchas direct personal contacts. Consider mixing up themethod and timing of delivery in order to gain thecustomer’s attention. For example, send the letter byfax or e-mail, and distribute it to different peoplewithin the customer’s organization in hopes of jar-ring loose a response.
3. Issue an attorney letter. This is a letter issued on anattorney’s letterhead, threatening legal action ifpayment is not made. The implication is that thecustomer is now much closer to a lawsuit, whichsometimes brings about a rapid settlement of theoutstanding balance. Attorney letters are expensiveif custom-written by the attorney. To reduce thecost, write the letter for the attorney and just askhim or her to print it on letterhead.
4. Insist on payment of undisputed balances. This keepscustomers from using a dispute on a single line itemto not pay a larger invoice.
5. Send a summary of the last discussion. Document a cus-tomer’s latest promised payment information in aletter or e-mail and send it to the customer. Thisconfirmation approach tells the customer that thecompany is monitoring the situation closely. If a cus-tomer has agreed to a repetitive series of payments,use this approach to both thank the company for themost recent payment and remind it of the amountand due date of the next payment.
6. Take product back. In few cases where a shippedproduct is still on hand and untouched by the cus-tomer, it is possible to accept a merchandise return.
7. Use cash on delivery terms. For extremely late-payingcustomers, consider shifting them to cash-on-deliv-ery (COD) payment terms. If the customer has noother source for goods and so must buy from thecompany, add the entire open balance or a portionof it to the COD amount, thereby enforcing paymentif the customer ever wants to see any additionalgoods delivered.
8. Send to a collection agency. When no other in-houseapproach works, send the invoice to a collectionagency for more aggressive follow-up. Their servicesare expensive but are usually success-based, so thereis no downside in doing so.
How Do I Collect Overdue Payments? 163
E1C11 03/04/2010 Page 164
When Should I Take Legal Action toCollect from a Customer?
Initiating legal action against a customer is an enormouslyexpensive and prolonged undertaking that is almostnever worth the effort. Even if the court awards a substan-tial settlement, the customer may go to great lengths tohide its assets, so the company never collects a dime. Hereare three ways to obtain cash in these situations:
1. Prescreen customer debts. Always prescreen a cus-tomer’s debts prior to initiating a legal action. Thisshould at least involve purchasing a credit report onthe customer to determine the number of judgmentsand tax liens already filed against it as well as othertypes of outstanding debt. This type of investigationmay very well reveal that the customer has so manycalls on its assets already that an investment in legalaction is completely uneconomical.
2. Threaten a small claims court filing. This is a low-costlegal technique that may rattle an intransigent cus-tomer into paying. Simply obtain the complaintdocumentation from the appropriate court, fill itout, and send a copy to the customer, with a noteattached stating when the cash has to be in the com-pany’s hands or else the paperwork will be filedwith the court.
3. File with a small claims court. This is usually in thecounty where the customer resides but can also bewhere the action over which a complaint is filedtook place. In either case, check with the court toverify the maximum amount of money it will ad-dress. If the amount being claimed is higher, waivethe difference in order to fit under the court’s maxi-mum cap. Also, pull a credit report on the customerto verify its official legal name and corporate status,so this information can be correctly listed on thecomplaint form. Finally, locate a collection attorneylocated near the small claims court and request rep-resentation at the court for a modest fee and percent-age of any proceeds. These steps are not difficult,and the cost is minimal.
164 Receivables Management
E1C12 03/04/2010 Page 165
CHAPTER 12
INVENTORY MANAGEMENT
How Do I Increase the Accuracy ofInventory Records?
Increasing the accuracy of inventory records involvesimplementing all of the next 17 steps, and in the order pre-sented. This is a difficult implementation to shortcut, formissing any of the steps will have a negative impact onrecord accuracy. The steps are:
1. Select and install inventory tracking software. The pri-mary requirements for this software are:
� Track transactions. The software should list the fre-quency of product usage, which shows inventoryquantities that should be changed and which itemsmay be obsolete.
� Update records immediately. The inventory data mustalways be up-to-date, because production plannersmust know what is in stock, while cycle countersrequire access to accurate data. Batch updating ofthe system is not acceptable.
� Report inventory records by location. Cycle countersneed inventory records that are sorted by locationin order to more efficiently locate and count theinventory.
2. Test inventory tracking software. Create a set of typicalrecords in the new software, and perform a series oftransactions to ensure that the software functionsproperly. In addition, create a large number of re-cords and perform the transactions again, to see if theresponse time of the system drops significantly.
3. Revise the rack layout. Create aisles that are wideenough for forklift operation if this is needed forlarger storage items, and cluster small parts rackstogether for easier parts picking.
165
E1C12 03/04/2010 Page 166
4. Create rack locations. A typical rack location is, forexample, A-01-B-01. This means that this location codeis located in Aisle A, Rack 1. Within Rack 1, it islocated on Level B (numbered from the bottom to thetop). Within Level B, it is located in Partition 1. As onemoves down an aisle, the rack numbers should prog-ress in ascending sequence, with the odd rack numberson the left and the even numbers on the right. Thus,the first rack on the left side of aisle D is D-01, the firstrack on the right is D-02, the second rack on the left isD-03, and so on. This layout allows a stock picker tomove down the center of the aisle, efficiently pullingitems from stock based on sequential location codes.
5. Lock the warehouse. One of the main causes of recordinaccuracy is removal of items from the warehouseby outside staff. To stop this removal, all entrancesto the warehouse must be locked. Only warehousepersonnel should be allowed access to it. All otherpersonnel entering the warehouse should be accom-panied by a member of the warehouse staff to preventthe removal of inventory.
6. Consolidate parts. To reduce the work of counting thesame item in multiple locations, group common partsinto one place. This step requires multiple iterations,for it is difficult to combine parts when thousands ofthem are scattered throughout the warehouse.
7. Assign part numbers. Have several experienced per-sonnel verify all part numbers. A mislabeled part is asuseless as a missing part, since the computer databasewill not show that it exists.
8. Verify units of measure. Have several experienced peo-ple verify all units of measure. Unless the softwareallows multiple units of measure to be used, the entireorganization must adhere to one unit of measure foreach item.
9. Pack the parts. Pack parts into containers, seal the con-tainers, and label them with the part number, unit ofmeasure, and total quantity stored inside. Leave a fewparts free for ready use. Open containers only whenadditional stock is needed. This method allows cyclecounters to verify inventory balances rapidly.
10. Count items. Count items when there is no significantactivity in the warehouse, such as during a weekend.Elaborate cross-checking of the counts, as would bedone during a year-end physical inventory count, isnot necessary. It is more important to have the per-petual inventory system operational before the ware-house activity increases again; any errors in the data
166 Inventory Management
E1C12 03/04/2010 Page 167
will be detected quickly during cycle counts andflushed out of the database. The initial counts mustinclude a review of the part number, location, andquantity.
11. Train the warehouse staff. Warehouse staff membersshould receive software training immediately beforeusing the system, so that they do not forget how tooperate the software. Enter a set of test records intothe software, and have the staff simulate all commoninventory transactions, such as receipts, picks, and cy-cle count adjustments.
12. Enter data into the computer. Have an experienced dataentry person input the location, part number, andquantity into the computer. Once the data has beeninput, another person should cross-check the entereddata against the original data for errors.
13. Quick-check the data. Scan the data for errors. If all partnumbers have the same number of digits, look foritems that are too long or short. Review location codesto see if inventory is stored in nonexistent racks. Lookfor units of measure that do not match the part beingdescribed. For example, is it logical to have a pint ofsteel in stock? Also, if item costs are available, print alist of extended costs. Excessive costs typically pointto incorrect units of measure. All of these steps helpto spot the most obvious inventory errors.
14. Initiate cycle counts. Print out a portion of the inven-tory list, sorted by location. Using this report, havethe warehouse staff count blocks of the inventory ona continuous basis. They should look for accuratepart numbers, units of measure, locations, and quanti-ties. The counts should concentrate on high-value orhigh-use items, though the entire stock should bereviewed regularly. The most important part of thisstep is to examine why mistakes occur. If a cyclecounter finds an error, its cause must be investigatedand then corrected, so that the mistake will not occuragain. It is also useful to assign specific aisles to cyclecounters, which tends to make them more familiarwith their assigned inventory and the problems caus-ing specific transactional errors.
15. Initiate inventory audits. The inventory should be aud-ited frequently, perhaps once a week. This allows thecompany to monitor changes in the inventory accu-racy level and initiate changes if the accuracy dropsbelow acceptable levels. The minimum acceptable ac-curacy level is 95%, with an error being a mistakenpart number, unit of measure, quantity, or location.
Accuracy of Inventory Records 167
E1C12 03/04/2010 Page 168
This accuracy level is needed to ensure accurate in-ventory costing as well as to assist the materialsdepartment in planning future inventory purchases.In addition, establish a tolerance level when calculat-ing the inventory accuracy. For example, if the com-puter record of a box of screws yields a quantity of100 and the actual count results in 105 screws, thenthe record is accurate if the tolerance is at least 5% butinaccurate if the tolerance is reduced to 1%. The maxi-mum allowable tolerance should be no higher than5%, with tighter tolerances being used for high-valueor high-use items.
16. Post results. Inventory accuracy is a team project, andthe warehouse staff feels more involved if the audit re-sults are posted against the results of previous audits.Accuracy percentages should be broken out for thecounting area assigned to each cycle counter, so thateveryone can see who is doing the best job of review-ing and correcting inventory counts.
17. Reward the staff. Accurate inventories save a companythousands of dollars in many ways. This makes itcost-effective to encourage the staff to maintain andimprove the accuracy level with periodic bonusesthat are based on the attainment of higher levels ofaccuracy with tighter tolerances.
How Do I Reduce the Number of Stock-Keeping Units in Inventory?
Most companies store an inordinate number of inventorystock-keeping units (SKUs), most of which do not sellfrequently. Here are some possibilities for proactivelyshrinking the investment in SKUs.
m Include materials staff in the design stage. A materialsmanager on a product design team can push for thereuse of existing parts in new products, so that thetotal number of SKUs is reduced.
m Reduce the number of product options. A product witha broad array of options requires additional SKUsfor each of the options, so narrowing the number ofoptions offered reduces the SKU investment.
m Reduce the number of products. Each product requiresits own set of SKUs, not only for the product optionsjust noted but also for any special parts that are onlyused for that product. If a product is not generatingmuch profit and has a large number of unique SKUs,this is a good target for elimination.
168 Inventory Management
E1C12 03/04/2010 Page 169
m Review engineering change orders. The engineering de-partment may issue change orders to modify exist-ing products. If so, the materials management staffshould time the introduction of all change ordersto coincide with an appropriate drawdown of allraw materials that will be eliminated as part of thechange order.
How Do I Reduce Inventory Purchases?
The bulk of a company’s inventory problems arise at thepoint of purchase. The next points are useful ways to keepfrom making the wrong purchasing decisions.
m Access customer buying information. Gain direct accessto the inventory planning systems of key customers.This gives the purchasing staff perfect informationaboutwhat it, in turn, needs to order from its suppliers.
m Reduce supplier distance. Distant sourcing lengthenslead times and therefore the amount of safety stock.By sourcing inventory requirements from supplierslocated very close, there is a much lower need forsafety stock.
m Adjust open purchase orders. Compare the amount ofoutstanding balances on open purchase orders tocurrent needs, and modify open purchase orderamounts to more closely match current requirements.
m Use risk pooling. Safety stock levels can be reducedfor parts that are used in a large number of products,because fluctuations in the demand levels of parentproducts will offset each other, resulting in a loweroverall safety stock level.
m Use layered replenishment. In a distributor environ-ment, maintain significant inventory levels for anyitems that are constantly sold, and do not stock anyitems at all for low-order items; customers must waitfor the company to procure these later items fromsuppliers.
m Shift inventory ownership. Shift raw material owner-ship to suppliers, so that they own the inventorylocated on the company’s premises. The companythen pays suppliers when it removes inventory fromits warehouse. This arrangement usually requiressole sourcing.
m Use phased deliveries. If a supplier imposes a mini-mum order quantity, it may be possible to negotiatefor a smaller delivery quantity, so that smaller quan-tities are delivered more frequently.
How Do I Reduce Inventory Purchases? 169
E1C12 03/04/2010 Page 170
How Do I Compress InventoryStorage Space?
The next methods can be used to compress inventory intothe smallest possible warehouse space, which reduces acompany’s facility costs.
m Drop shipping. A company receives an order from acustomer and contacts its supplier with the shippinginformation, which in turn ships the product directlyto the customer.
m Cross docking. When an item arrives at the receivingdock, it is immediately moved to a shipping dock fordelivery to the customer in a different truck.
m Use temporary storage for peak storage requirements.Offload some storage into less-expensive overflowlocations, such as rented trailers. By doing so, a com-pany can shift inventory back into its primary ware-house facilities as soon as the peak period is over,thereby paying much less for storage space over thecourse of the year.
m Match storage to cubic space. A great deal of space in awarehouse is unused, because the cubic volumes instorage racks greatly exceed the volume of the itemsstored in them. These points can be followed to fillthis excess space:
� Case height adjustment. Alter the height of storagecases so the optimal pallet height can be achievedto fill all available rack space. Conversely, it maybe less expensive to adjust the height of the exist-ing storage racks rather than to modify the casesto match the racks.
� Modular storage cabinets. For items with small stor-age volumes, use modular storage cabinets. Thesecabinets have multiple drawers with varyingdrawer heights, the contents of which can bereconfigured with dividers to achieve the optimalamount of storage space.
� Movable racking systems. These racks are mountedon wheels and pushed together, thereby eliminat-ing all but one aisle. They are expensive.
� Double-deep racking. Set up two rows of racks adja-cent to each other, with only one rack exposed toan aisle. This configuration allows for the storageof two pallets of the same item in a single storagelocation, one behind the other, thereby eliminatingone aisle.
170 Inventory Management
E1C12 03/04/2010 Page 171
� Stacking lanes. For many pallets containing thesame item, use stacking lanes in an open ware-house area where multiple pallets are stacked ontop of each other without any bracing system,many pallets deep.
� Narrow aisles. Use narrow aisles where manualputaways and picking are the norm rather thanusing forklifts.
� Extended racks. Extend racks heights up to theceiling.
How Do I Avoid Inventory Losses onShort Shelf Life Items?
Install gravity-flow racking. This system requires put-away from the rear, where items slide down a slight anglein the rack, assisted by rollers, pushing any items in frontto the front of the rack. As soon as a picker removes itemsfrom the front of the rack, the weight of items in the rearpush the next-oldest item to the front.
For larger case sizes, pallet-flow racking can be used. Apallet-flow rack uses standard racks that are set at an evenheight, on which are built dynamic flow rails at a slightdownward angle from the loading end to the unloadingend. The flow rails incorporate rollers and a series of auto-matic brakes to slow the movement of pallets. A forkliftoperator places a pallet at the receiving end of the pallet-flow rack, and it slides along the rails, being slowed by thebrakes, until it comes to a halt behind the next pallet inline. When someone removes a pallet from the other endof the rack, the whole line of pallets automatically slidesforward to fill the void.
How Do I Improve Picking Efficiency?
The next techniques can be used to reduce the laborneeded to pick inventory in the warehouse or to increasethe efficiency of this operation.
m Pick in order by location. Sort all single-line orders inbin location sequence, so a small number of pickerscan quickly move through the warehouse and pickall the orders at once. This reduces picker time butrequires extra back-end labor to break the pickeditems into individual orders.
m Forward picking. Summarize pick lists over a shorttime period, so that only a small number of passesthrough the warehouse will remove all required
How Do I Improve Picking Efficiency? 171
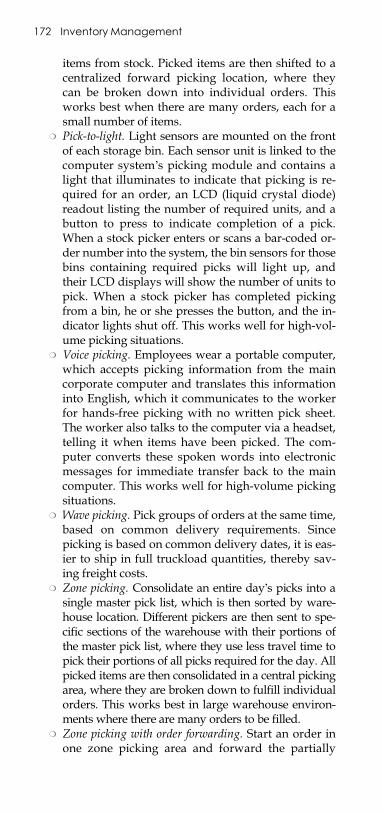
E1C12 03/04/2010 Page 172
items from stock. Picked items are then shifted to acentralized forward picking location, where theycan be broken down into individual orders. Thisworks best when there are many orders, each for asmall number of items.
m Pick-to-light. Light sensors are mounted on the frontof each storage bin. Each sensor unit is linked to thecomputer system’s picking module and contains alight that illuminates to indicate that picking is re-quired for an order, an LCD (liquid crystal diode)readout listing the number of required units, and abutton to press to indicate completion of a pick.When a stock picker enters or scans a bar-coded or-der number into the system, the bin sensors for thosebins containing required picks will light up, andtheir LCD displays will show the number of units topick. When a stock picker has completed pickingfrom a bin, he or she presses the button, and the in-dicator lights shut off. This works well for high-vol-ume picking situations.
m Voice picking. Employees wear a portable computer,which accepts picking information from the maincorporate computer and translates this informationinto English, which it communicates to the workerfor hands-free picking with no written pick sheet.The worker also talks to the computer via a headset,telling it when items have been picked. The com-puter converts these spoken words into electronicmessages for immediate transfer back to the maincomputer. This works well for high-volume pickingsituations.
m Wave picking. Pick groups of orders at the same time,based on common delivery requirements. Sincepicking is based on common delivery dates, it is eas-ier to ship in full truckload quantities, thereby sav-ing freight costs.
m Zone picking. Consolidate an entire day’s picks into asingle master pick list, which is then sorted by ware-house location. Different pickers are then sent to spe-cific sections of the warehouse with their portions ofthe master pick list, where they use less travel time topick their portions of all picks required for the day. Allpicked items are then consolidated in a central pickingarea, where they are broken down to fulfill individualorders. This works best in large warehouse environ-ments where there are many orders to be filled.
m Zone picking with order forwarding. Start an order inone zone picking area and forward the partially
172 Inventory Management
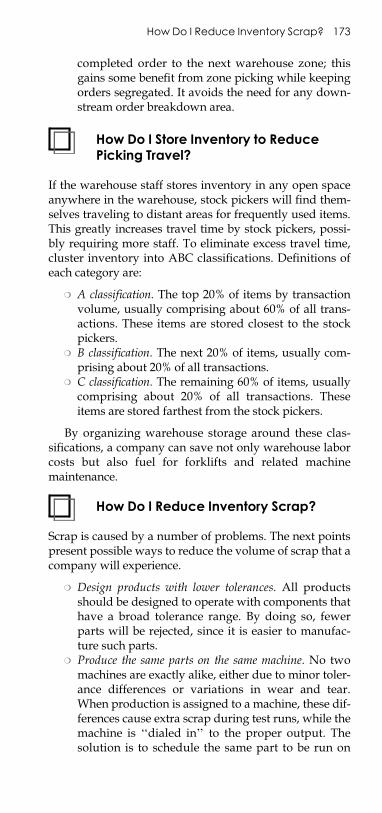
E1C12 03/04/2010 Page 173
completed order to the next warehouse zone; thisgains some benefit from zone picking while keepingorders segregated. It avoids the need for any down-stream order breakdown area.
How Do I Store Inventory to ReducePicking Travel?
If the warehouse staff stores inventory in any open spaceanywhere in the warehouse, stock pickers will find them-selves traveling to distant areas for frequently used items.This greatly increases travel time by stock pickers, possi-bly requiring more staff. To eliminate excess travel time,cluster inventory into ABC classifications. Definitions ofeach category are:
m A classification. The top 20% of items by transactionvolume, usually comprising about 60% of all trans-actions. These items are stored closest to the stockpickers.
m B classification. The next 20% of items, usually com-prising about 20% of all transactions.
m C classification. The remaining 60% of items, usuallycomprising about 20% of all transactions. Theseitems are stored farthest from the stock pickers.
By organizing warehouse storage around these clas-sifications, a company can save not only warehouse laborcosts but also fuel for forklifts and related machinemaintenance.
How Do I Reduce Inventory Scrap?
Scrap is caused by a number of problems. The next pointspresent possible ways to reduce the volume of scrap that acompany will experience.
m Design products with lower tolerances. All productsshould be designed to operate with components thathave a broad tolerance range. By doing so, fewerparts will be rejected, since it is easier to manufac-ture such parts.
m Produce the same parts on the same machine. No twomachines are exactly alike, either due to minor toler-ance differences or variations in wear and tear.When production is assigned to a machine, these dif-ferences cause extra scrap during test runs, while themachine is ‘‘dialed in’’ to the proper output. Thesolution is to schedule the same part to be run on
How Do I Reduce Inventory Scrap? 173
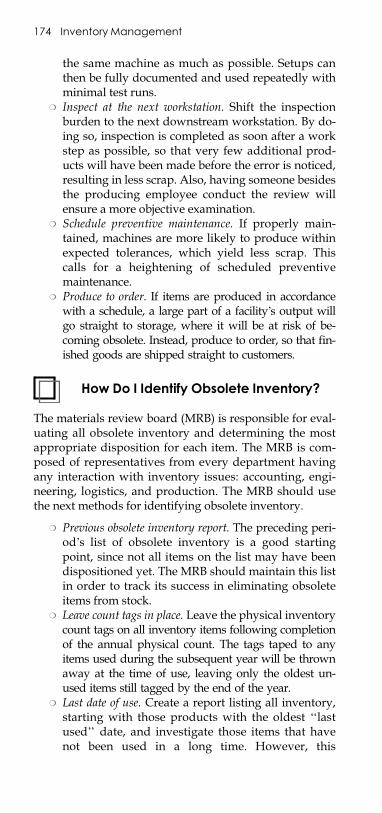
E1C12 03/04/2010 Page 174
the same machine as much as possible. Setups canthen be fully documented and used repeatedly withminimal test runs.
m Inspect at the next workstation. Shift the inspectionburden to the next downstream workstation. By do-ing so, inspection is completed as soon after a workstep as possible, so that very few additional prod-ucts will have been made before the error is noticed,resulting in less scrap. Also, having someone besidesthe producing employee conduct the review willensure a more objective examination.
m Schedule preventive maintenance. If properly main-tained, machines are more likely to produce withinexpected tolerances, which yield less scrap. Thiscalls for a heightening of scheduled preventivemaintenance.
m Produce to order. If items are produced in accordancewith a schedule, a large part of a facility’s output willgo straight to storage, where it will be at risk of be-coming obsolete. Instead, produce to order, so that fin-ished goods are shipped straight to customers.
How Do I Identify Obsolete Inventory?
The materials review board (MRB) is responsible for eval-uating all obsolete inventory and determining the mostappropriate disposition for each item. The MRB is com-posed of representatives from every department havingany interaction with inventory issues: accounting, engi-neering, logistics, and production. The MRB should usethe next methods for identifying obsolete inventory.
m Previous obsolete inventory report. The preceding peri-od’s list of obsolete inventory is a good startingpoint, since not all items on the list may have beendispositioned yet. The MRB should maintain this listin order to track its success in eliminating obsoleteitems from stock.
m Leave count tags in place. Leave the physical inventorycount tags on all inventory items following completionof the annual physical count. The tags taped to anyitems used during the subsequent year will be thrownaway at the time of use, leaving only the oldest un-used items still tagged by the end of the year.
m Last date of use. Create a report listing all inventory,starting with those products with the oldest ‘‘lastused’’ date, and investigate those items that havenot been used in a long time. However, this
174 Inventory Management
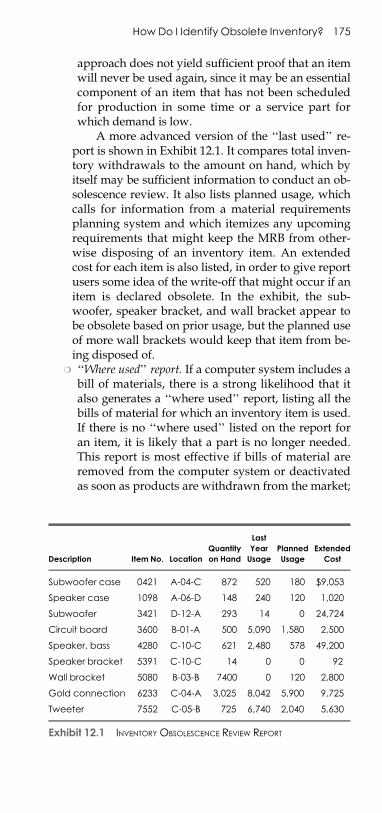
E1C12 03/04/2010 Page 175
approach does not yield sufficient proof that an itemwill never be used again, since it may be an essentialcomponent of an item that has not been scheduledfor production in some time or a service part forwhich demand is low.
A more advanced version of the ‘‘last used’’ re-port is shown in Exhibit 12.1. It compares total inven-tory withdrawals to the amount on hand, which byitself may be sufficient information to conduct an ob-solescence review. It also lists planned usage, whichcalls for information from a material requirementsplanning system and which itemizes any upcomingrequirements that might keep the MRB from other-wise disposing of an inventory item. An extendedcost for each item is also listed, in order to give reportusers some idea of the write-off that might occur if anitem is declared obsolete. In the exhibit, the sub-woofer, speaker bracket, and wall bracket appear tobe obsolete based on prior usage, but the planned useof more wall brackets would keep that item from be-ing disposed of.
m ‘‘Where used’’ report. If a computer system includes abill of materials, there is a strong likelihood that italso generates a ‘‘where used’’ report, listing all thebills of material for which an inventory item is used.If there is no ‘‘where used’’ listed on the report foran item, it is likely that a part is no longer needed.This report is most effective if bills of material areremoved from the computer system or deactivatedas soon as products are withdrawn from the market;
Description Item No. Location
Quantity
on Hand
Last
Year
Usage
Planned
Usage
Extended
Cost
Subwoofer case 0421 A-04-C 872 520 180 $9,053
Speaker case 1098 A-06-D 148 240 120 1,020
Subwoofer 3421 D-12-A 293 14 0 24,724
Circuit board 3600 B-01-A 500 5,090 1,580 2,500
Speaker, bass 4280 C-10-C 621 2,480 578 49,200
Speaker bracket 5391 C-10-C 14 0 0 92
Wall bracket 5080 B-03-B 7400 0 120 2,800
Gold connection 6233 C-04-A 3,025 8,042 5,900 9,725
Tweeter 7552 C-05-B 725 6,740 2,040 5,630
Exhibit 12.1 INVENTORY OBSOLESCENCE REVIEW REPORT
How Do I Identify Obsolete Inventory? 175
E1C12 03/04/2010 Page 176
this more clearly reveals those inventory items thatare no longer needed.
How Do I Sell Obsolete Inventory?
Here are some methods for realizing some cash flow fromthe disposition of obsolete inventory that a company can-not use internally.
m Return to the supplier. Many suppliers will acceptproduct returns, though it may be in exchange for asubstantial restocking fee. Also, they may issue onlya credit for the return rather than a cash payment.
m Sell as service parts. Some parts may be needed forwarranty replacements or can be sold at a premiumas service parts for a number of years to come. How-ever, this method usually disposes of only a smallproportion of all obsolete parts.
m Sell to salvage contractors. Third parties will buy in-ventory at steep discounts. If this approach is tobe used, force the contractors to bid on batches ofobsolete inventory, so they cannot pick throughthe inventory for the choicest items.
m Donate for a tax deduction. Some nonprofit organi-zations will accept inventory, which they typicallyredistribute to other nonprofit organizations. A com-pany can then recognize a tax credit for the value ofthe donated inventory.
176 Inventory Management
E1C13 03/04/2010 Page 177
CHAPTER 13
DEBT MANAGEMENT
What Is Commercial Paper?
Commercial paper is unsecured debt that is issued by acompany and that has a fixed maturity ranging from 1 to270 days. A company uses commercial paper to meet itsshort-term working capital obligations. It is commonlysold at a discount from face value with the discount (andtherefore the interest rate) being higher if the term is lon-ger. A company can sell its commercial paper directly toinvestors, such as money market funds, or through adealer in exchange for a small commission.
Because there is no collateral on the debt, commercialpaper is an option only for large companies having high-level credit ratings from a recognized credit rating agency.For those companies capable of issuing it, the interest rateon commercial paper is extremely low.
What Is Factoring?
Under a factoring arrangement, a finance company agreesto take over a company’s accounts receivable collectionsand keep the money from those collections in exchangefor an immediate cash payment to the company. Thisprocess typically involves having customers mail theirpayments to a lockbox that appears to be operated bythe company, but which is actually controlled by the fi-nance company. Under a true factoring arrangement, thefinance company takes over the risk of loss on any baddebts, though it will have the right to pick which types ofreceivables it will accept in order to reduce its risk of loss.A finance company is more interested in this type of dealwhen the size of each receivable is fairly large, since thisreduces its per-transaction cost of collection. If each re-ceivable is quite small, the finance company may still beinterested in a factoring arrangement, but it will charge
177
E1C13 03/04/2010 Page 178
the company extra for its increased processing work. Thelender will charge an interest rate (at least 2% higher thanthe prime rate) as well as a transaction fee for processingeach invoice as it is received. There may also be a mini-mum total fee charged, in order to cover the originationfee for the factoring arrangement in the event that fewreceivables are actually handed to the lender. A companyworking under this arrangement can be paid by the factorat once or can wait until the invoice due date before pay-ment is sent. The latter arrangement reduces the interestexpense that a company would have to pay the factor buttends to go against the reason why the factoring arrange-ment was established, which is to get money back to thecompany as rapidly as possible. An added advantage isthat no collections staff is required, since the lender han-dles this chore.
What Is Accounts ReceivableFinancing?
Under an accounts receivable financing arrangement, alender uses the accounts receivable as collateral for a loanand takes direct receipt of payments from customersrather than waiting for periodic loan payments from thecompany. A lender typically will loan only a maximum of80% of the accounts receivable balance to a company andonly against those accounts that are less than 90 days old.Also, if an invoice against which a loan has been made isnot paid within the required 90-day time period, thelender will require the company to pay back the loan asso-ciated with that invoice.
What Is Field Warehouse Financing?
Under a field warehousing arrangement, a finance companysegregates a portion of a company’s warehouse area witha fence. All inventory within it is collateral for a loan fromthe finance company to the company. The finance com-pany will pay for more raw materials as they are needed,and receives payment on its loan directly from accountsreceivable as soon as customer payments are received. If astrict inventory control system is in place, the financecompany will also employ someone who will record alladditions to and withdrawals from the secured ware-house. If not, the company will be required to count allitems within the secure area frequently and report this in-formation back to the finance company. If the level of
178 Debt Management
E1C13 03/04/2010 Page 179
inventory drops below the amount of the loan, the com-pany must pay back the finance company the differencebetween the outstanding loan amount and the total inven-tory valuation. The company is also required under statelien laws to post signs around the secured area, statingthat a lien is in place on its contents.
Field warehousing is highly transaction intensive,especially when the finance company employs an on-site warehouse clerk, and so is a very expensive wayto obtain funds. This approach is recommended onlyfor those companies that have exhausted all other lessexpensive forms of financing. However, lenders typi-cally do not require any covenants in association withthese loans, giving corporate management more controlover company operations.
What Is Floor Planning?
Some lenders will directly pay for large assets that are be-ing procured by a distributor or retailer (such as kitchenappliances or automobiles) and be paid back when theassets are sold to a consumer. In order to protect itself, thelender may require that the price of all assets sold be nolower than the price the lender originally paid for it on be-half of the distributor or retailer. Since the lender’s basisfor lending is strictly on the underlying collateral (as op-posed to its faith in a business plan or general corporatecash flows), it will undertake frequent recounts of theassets and compare them to its list of assets originally pur-chased for the distributor or retailer. If there is a shortfallin the expected number of assets, the lender will requirepayment for the missing items. The lender may also re-quire liquidation of the loan after a specific time period,especially if the underlying assets run the risk of becom-ing outdated in the near term.
This financing option is a good one for smaller orunderfunded distributors or retailers, since the interestrate is not excessive (due to the presence of collateral).
What Is an Operating Lease?
Under the terms of an operating lease, the lessor carries theasset on its books and records a depreciation expense,while the lessee records the lease payments as an expenseon its books. This type of lease typically does not cover thefull life of the asset, nor does the buyer have a small-dollarbuyout option at the end of the lease.
What Is an Operating Lease? 179
E1C13 03/04/2010 Page 180
What Is a Capital Lease?
Under the terms of a capital lease, the lessee records it as anasset and is entitled to record all related depreciation as anexpense. In this latter case, the lease payments are splitinto their interest and principal portions and are recordedon the lessee’s books as such.
What Is a Line of Credit?
A line of credit is a commitment from a lender to pay acompany whenever it needs cash, up to a preset maxi-mum level. It is generally secured by company assets andfor that reason bears an interest rate not far above theprime rate. The bank typically will charge an annualmaintenance fee, irrespective of the amount of fundsdrawn down on the loan, on the grounds that it has in-vested in the completion of paperwork for the loan. Thebank will also likely require an annual audit of keyaccounts and asset balances to verify that the company’sfinancial situation is in line with the bank’s assumptions.One problem with a line of credit is that the bank can can-cel the line or refuse to allow extra funds to be drawndown from it if the bank feels that the company is no lon-ger a good credit risk. Another issue is that the bank mayrequire a company to maintain a compensating balance inan account at the bank; this increases the effective interestrate on the line of credit, since the company earns little orno interest on the funds stored at the bank.
A line of credit is most useful for situations where theremay be only short-term cash shortfalls or seasonal needsthat result in the line being drawn down to zero at somepoint during the year.
What Is a Bond?
A bond is a fixed obligation to pay, usually at a stated rateof $1,000 per bond, which is issued by a corporation to in-vestors. It may be a registered bond, under which a com-pany maintains a list of owners of each bond. Thecompany then periodically sends interest payments, aswell as the final principal payment, to the investor of re-cord. It may also be a coupon bond, for which the companydoes not maintain a standard list of bond holders. Instead,each bond contains interest coupons that the bond holderssend to the company on the dates when interest paymentsare due. The coupon bond is more easily transferable
180 Debt Management
E1C13 03/04/2010 Page 181
between investors, but this ease of transferability makes itmore susceptible to loss.
A bond is generally issued with a fixed interest rate.However, if the rate is excessively low in the current mar-ket, investors will pay less for the face value of the bond,thereby driving up the net interest rate paid by the com-pany. Similarly, if the rate is too high, investors will payextra for the bond, thereby driving down the net interestrate paid.
There may be a bond indenture document that item-izes all features of the bond issue. It contains restrictionsthat the company is imposing on itself, such as limitationson capital expenditures or dividends, in order to make thebond issuance as palatable as possible to investors. If thecompany does not follow these restrictions, the bonds willbe in default.
What Types of Bonds Can Be Issued?
The next list describes the more common types of bondsthat a company can issue.
m Collateral trust bond. A bond that uses as collateral acompany’s security investments.
m Convertible bond. A bond that can be converted tostock using a predetermined conversion ratio. Thepresence of conversion rights typically reduces theinterest cost of these bonds, since investors assignsome value to the conversion privilege.
m Debenture. A bond issued with no collateral. A sub-ordinated debenture is one that specifies debt that issenior to it.
m Deferred interest bond. A bond that provides for eitherreduced or no interest in the beginning years of thebond term and compensates for it with increased in-terest later in the bond term.
m Floorless bond. A bond whose terms allow purchasersto convert them as well as any accrued interest tocommon stock. The reason for the name is that bondholders can convert some shares and sell them onthe open market, thereby supposedly driving downthe price and allowing them to buy more shares, andso on.
m Guaranteed bond. A bond whose payments are guar-anteed by another party. Corporate parents willsometimes issue this guarantee for bonds issuedby subsidiaries in order to obtain a lower effectiveinterest rate.
What Types of Bonds Can Be Issued? 181
E1C13 03/04/2010 Page 182
m Income bond. A bond that pays interest only if incomehas been earned. The income can be tied to total cor-porate earnings or to specific projects. If the bondterms indicate that interest is cumulative, interest willaccumulate during nonpayment periods and be paidat a later date when income is available for doing so.
m Mortgage bond. A bond offering can be backed byany real estate owned by the company (called a realproperty mortgage bond), or by company-ownedequipment (called an equipment bond), or by all assets(called a general mortgage bond).
m Serial bond. A bond issuance where a portion of thetotal number of bonds are paid off each year, result-ing in a gradual decline in the total amount of debtoutstanding.
m Variable rate bond. A bond whose stated interest ratevaries as a percentage of a baseline indicator, such asthe prime rate.
m Zero-coupon bond. A bond with no stated interestrate. Investors purchase these bonds at a considera-ble discount to their face value in order to earn aneffective interest rate.
m Zero-coupon convertible bond. A bond that offers nointerest rate on its face but that allows investors toconvert to stock if the stock price reaches a levelhigher than its current price on the open market.The attraction to investors is that, even if the conver-sion price to stock is marked up to a substantial pre-mium over the current market price of the stock, ahigh level of volatility in the stock price gives inves-tors some hope of a profitable conversion to equity.
What Is a Bridge Loan?
A bridge loan is a form of short-term loan that is granted by alending institution on the understanding that the companywill obtain longer-term financing shortly that will pay offthe bridge loan. This option is commonly used when a com-pany is seeking to replace a construction loan with a long-term note that it expects to pay down gradually over manyyears. This type of loan is usually secured by facilities orfixtures in order to obtain a lower interest rate.
What Is Receivables Securitization?
A large company can securitize its accounts receivable,thereby achieving one of the lowest interest rates available
182 Debt Management
E1C13 03/04/2010 Page 183
for debt. To do so, it creates a special purpose entity (SPE)and transfers a selection of its receivables into the SPE.The SPE then sells the receivables to a bank conduit,which in turn pools the receivables that it has boughtfrom multiple companies and uses the cash flows fromthe receivables to back the issuance of commercial paperto investors, who in turn are repaid with the cash flowsfrom the receivables.
Receivables securitization is initially a complex processto create; the primary benefit of doing so is that a com-pany’s receivables are isolated from the company’s otherrisks, so that the SPE has a higher credit rating than thecompany, with an attendant decline in borrowing costs.To achieve the AAA credit rating typically needed for re-ceivables securitization, a credit rating agency will reviewthe performance record of receivables previously includedin the pool, debtor concentrations in the pool, and thecompany’s credit and collection policies.
A key factor in preserving the stellar credit rating ofthe SPE is to maintain an adequate degree of separationbetween the company and the SPE. To do so, the transferof receivables is supposed to be a nonrecourse sale, so thatthe company’s creditors cannot claim the assets of the SPEif the company goes bankrupt. This means that thereshould be no mechanism by which the company can re-gain control of any receivables shifted to the SPE.
What Is a Sale and LeasebackArrangement?
Under a sale and leaseback arrangement, a company sells oneof its assets to a lender and then immediately leases itback for a guaranteed minimum time period. By doing so,the company obtains cash from the sale of the asset that itmay be able to more profitably use elsewhere, while theleasing company handling the deal obtains a guaranteedlessee for a time period that will allow it to turn a profiton the financing arrangement. A sale and leaseback ismost commonly used for the sale of a corporate buildingbut can also be arranged for other large assets, such asproduction machinery.
A sale and leaseback is useful for companies in anytype of financial condition. A financially healthy organiza-tion can use the resulting cash to buy back shares andprop up its stock price while a faltering organization canuse the cash to fund operations. It has the added advan-tage of not burdening a company’s balance sheet with
What Is a Sale and Leaseback Arrangement? 183
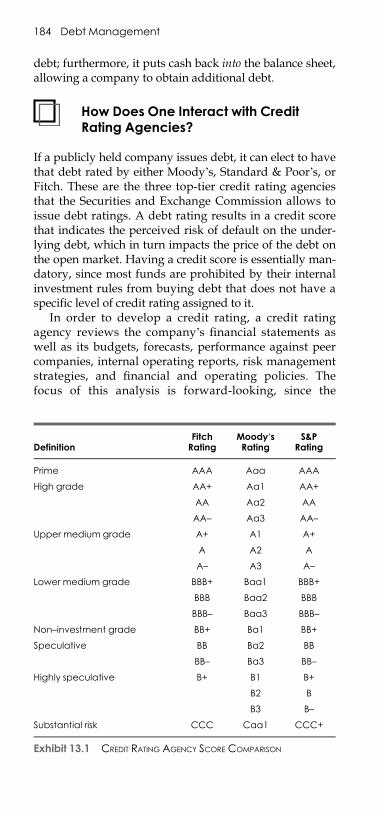
E1C13 03/04/2010 Page 184
debt; furthermore, it puts cash back into the balance sheet,allowing a company to obtain additional debt.
How Does One Interact with CreditRating Agencies?
If a publicly held company issues debt, it can elect to havethat debt rated by either Moody’s, Standard & Poor’s, orFitch. These are the three top-tier credit rating agenciesthat the Securities and Exchange Commission allows toissue debt ratings. A debt rating results in a credit scorethat indicates the perceived risk of default on the under-lying debt, which in turn impacts the price of the debt onthe open market. Having a credit score is essentially man-datory, since most funds are prohibited by their internalinvestment rules from buying debt that does not have aspecific level of credit rating assigned to it.
In order to develop a credit rating, a credit ratingagency reviews the company’s financial statements aswell as its budgets, forecasts, performance against peercompanies, internal operating reports, risk managementstrategies, and financial and operating policies. Thefocus of this analysis is forward-looking, since the
DefinitionFitchRating
Moody’sRating
S&PRating
Prime AAA Aaa AAA
High grade AA+ Aa1 AA+
AA Aa2 AA
AA– Aa3 AA–
Upper medium grade A+ A1 A+
A A2 A
A– A3 A–
Lower medium grade BBB+ Baa1 BBB+
BBB Baa2 BBB
BBB– Baa3 BBB–
Non–investment grade BB+ Ba1 BB+
Speculative BB Ba2 BB
BB– Ba3 BB–
Highly speculative B+ B1 B+
B2 B
B3 B–
Substantial risk CCC Caa1 CCC+
Exhibit 13.1 CREDIT RATING AGENCY SCORE COMPARISON
184 Debt Management

E1C13 03/04/2010 Page 185
credit score reflects the company’s future ability to meetits obligations.
If a company wants to improve its credit rating, then itmust take specific steps to make its financial structuremore conservative, such as by issuing more stock andusing the proceeds to pay down debt. This requires thedevelopment of a plan to achieve the higher credit ratingand communication of this information to the credit ratingagency.
How Do the Credit Rating AgencyScores Compare to Each Other?
The table in Exhibit 13.1 shows how the scores of eachagency compare at various levels of credit quality.
Credit Rating Agency Scores 185

E1C13 03/04/2010 Page 186
E1C14 03/04/2010 Page 187
CHAPTER 14
EQUITY REGISTRATION
What Methods Are Used to RegisterStock for Sale?
A key goal of both a company and its investors is tohave its securities registered, so that it can more easily sellthe securities and so that investors can freely trade them.The registration process is very time-consuming and expen-sive, so companies attempt to circumvent it througha variety of exemptions. As noted later in this chapter,the Securities and Exchange Commission’s Regulation Aprovides a reduced filing requirement for small-dollarissuances, while Regulation D allows for the completeabsence of registration for security sales to accreditedinvestors, though those investors cannot resell their securi-ties without taking additional steps. If none of these simplermethods is available, a company must use the Form S-1,S-3, or S-8. Form S-3 is an abbreviated registration that isavailable only to seasoned public companies, while FormS-1 is the ‘‘full’’ version that the remaining public compa-nies must use. The Form S-8 is a highly abbreviated regis-tration that is applicable only to stock issued to employees.
What Are the Contents of a Form S-1?
The Form S-1 is the default registration form to be used ifno other registration forms or exemptions from registra-tion (such as would be applicable under Regulations A orD) are available. A key factor in the preparation of a FormS-1 is whether the company can incorporate a number ofrequired items by referencing them in the form, which cansave a great deal of work. Incorporation by reference isavailable only if the company has not been for the pastthree years a blank check company, a shell company, or aregistrant for an offering of penny stock. The company
187
E1C14 03/04/2010 Page 188
must also be current with its various filings of financialinformation.
The 17 main informational contents of the Form S-1are:
1. Forepart of the registration statement. Include the com-pany name, the title and amount of securities to beregistered, and their offering price. Also describe themarket for the securities.
2. Summary information. Provide a summary of the pro-spectus contents that contains a brief overview of thekey aspects of the offering as well as contact informa-tion for the company’s principal executive offices.
3. Risk factors. Discuss the most significant factors thatmake the offering speculative or risky, and explainhow the risk affects the company or the securitiesbeing offered.
4. Ratio of earnings to fixed charges. If the registration is fordebt securities, show a ratio of earnings to fixedcharges. If the registration is for preferred equitysecurities, show the ratio of combined fixed chargesand preference dividends to earnings.
5. Use of proceeds. State the principal purpose for whichproceeds from the offering are intended.
6. Determination of offering price. Describe the factors con-sidered in determining the offering price, both forcommon equity and for warrants, rights, and convert-ible securities.
7. Dilution. Disclose the net tangible book value pershare before and after the distribution, and theamount of shareholder dilution.
8. Selling security holders. For those securities being soldfor the account of another security holder, name eachsecurity holder as well as each person’s relationshipwith the company within the past three years.
9. Plan of distribution. Describe the involvement ofunderwriters and stock exchanges in the distribution,any other form of distribution, and the compensationpaid to all parties as part of the distribution.
10. Description of securities to be registered. State the titleand rights associated with each type of security beingoffered for sale.
11. Interests of named experts and counsel. Identify anyexperts and counsel who are certifying or preparingthe registration document or providing a supportingvaluation, and the nature of their compensation relat-ing to the registration.
188 Equity Registration
E1C14 03/04/2010 Page 189
12. Information with respect to the registrant. This sectioncomprises the bulk of the document and includesa description of the business and its property, anylegal proceedings, the market price of the company’sstock, financial statements, selected financial data,and management’s discussion and analysis of thecompany’s financial condition and its results ofoperations. It also requires disclosure of any disagree-ments with the company’s auditors.
13. Material changes. Describe material changes that haveoccurred since the company’s last-filed annual or quar-terly report.
14. Other expenses of issuance and distribution. Itemize theexpenses incurred in connection with the issuance anddistribution of the securities to be registered, other thanunderwriting discounts and commissions.
15. Indemnification of directors and officers. Note the effectof any arrangements under which the company’sdirectors and officers are insured or indemnifiedagainst liability.
16. Recent sales of unregistered securities. Identify all un-registered securities sold by the company within thepast three years, including the names of the principalunderwriters, consideration received, and the type ofexemption from registration claimed.
17. Exhibits and financial statement schedules. Provideexhibits, with a related index, for such items as theunderwriting agreement, consents, and powers ofattorney.
The complete details of these reporting requirementsare located in Regulation S-K.
When Is a Form S-3 Used?
The Form S-3 allows a company to incorporate a largeamount of information into the form by reference,which is generally not allowed in a Form S-1. Specifi-cally, the company can incorporate the informationalready filed in its latest Form 10-K, subsequent quar-terly 10-Q reports, and 8-K reports, thereby essentiallyeliminating the ‘‘information with respect to the regis-tration’’ that is required for the Form S-1. This repre-sents a considerable time savings, so companies file aForm S-3 whenever possible. However, the Form S-3 isrestricted to those companies that meet these four eligi-bility requirements:
When Is a Form S-3 Used? 189
E1C14 03/04/2010 Page 190
1. It is organized within and has principal business op-erations within the United States; and
2. It already has a class of registered securities, or hasbeen meeting its periodic reporting requirements tothe Securities and Exchange Commission (SEC) forat least the past 12 months; and
3. It cannot have failed to pay dividends, sinking fundinstallments, or defaulted on scheduled debt or leasepayments since the end of the last fiscal year; and
4. The aggregate market value of the common equityheld by nonaffiliates of the company is at least$75 million.
If a company has an aggregate market value of com-mon equity held by nonaffiliates of less than $75 million,it can still use the Form S-3, provided that:
1. The aggregate market value of securities sold by thecompany during the 12 months prior to the Form S-3filing is no more than one-third of the aggregatemarket value of the voting and nonvoting commonequity held by its nonaffiliated investors; and
2. It is not a shell company, and has not been one forthe past 12 months; and
3. It has at least one class of common equity securitieslisted on a national securities exchange.
The eligibility requirements of the Form S-3 restrict itsuse to larger public companies. Smaller ‘‘nano-cap’’ firmsmust search for a registration exemption, such as is pro-vided by Regulation A and Regulation D.
When Is a Form S-8 Used?
The Form S-8 allows a company to register securities thatit offers to its employees and consultants under anemployee benefit plan. Such a plan can involve a broadarray of securities-related issuances, such as commonstock, stock options, restricted stock units, and purchasesunder an employee stock purchase plan. People coveredby this type of registration include employees, officers,directors, general partners, and consultants. Securitiesissued to consultants can be registered only through aForm S-8 if they provide bona fide services to the com-pany, and those services are not related to the sale of itssecurities or making a market in them. Family membersare also covered, if they received company securitiesthrough an employee gift.
190 Equity Registration
E1C14 03/04/2010 Page 191
There are two significant advantages to using a FormS-8.
1. The form is effective immediately upon filing.2. It is extremely simple to complete. The company
must merely state that its regular periodic filings areincorporated by reference and note the manner inwhich the company indemnifies its officers and di-rectors. The principal accompanying document isthe employee benefit plan.
This form of registration is available only if a publiccompany has been current with its filing requirements forat least the past 12 months and has not been a shell com-pany for at least the preceding 60 days.
In short, the Form S-8 presents significant advantagesover the normal securities registration process. However,since it is applicable only to employee benefit plans, itusually applies to only a small proportion of a company’soutstanding securities.
What Is a Shelf Registration?
Shelf registration is the registration of a new issue of securi-ties that can be filed with the SEC up to three years in ad-vance of the actual distribution of such securities. Thisallows a company to obtain funds quickly when neededrather than compiling a registration document and wait-ing for the SEC to declare the registration effective.
A shelf registration can be accomplished through aForm S-3 filing, which in turn is restricted to certain com-panies that meet the SEC’s eligibility rules. It is also possi-ble to use a Form S-1 to initiate a shelf registration, butonly if the intent is to sell the securities ‘‘on an immediate,continuous, or delayed basis,’’ with all sales being com-pleted within the next two years.
A shelf registration must be declared effective by theSEC before any securities sales related to it can be initiated.However, the SEC allows for some registration statementsto be declared effective immediately upon their dates offiling. This automatic shelf registration is available only towell-known seasoned issuers (WKSI). A WKSI is a companywhose common stock belonging to nonaffiliates has a mar-ket value of at least $700 million or which has issued atleast $1 billion of nonconvertible securities within the pastthree years and will register only nonconvertible securitiesother than common equity. In addition, such filings havereduced information filing requirements.
What Is a Shelf Registration? 191
E1C14 03/04/2010 Page 192
Why Must a Registration Statement BeDeclared Effective?
A registration statement is reviewed by SEC staff mem-bers. If they find that it conforms to SEC regulations andclearly states key information about the company, theydeclare it effective. Once the registration statement is de-clared effective, either the company or those investors onwhose behalf it is registering the securities can initiate sell-ing activities.
The SEC normally spends 30 days reviewing the regis-tration document and issues a comment letter, detailing itssuggestions for improving the document. The companythen responds with its defense of the existing presentationor issues a revised registration document, for which theSEC again has 30 days to conduct a review. Several itera-tions of this process may occur before the SEC is satisfiedwith the registration document and declares the documentto be effective.
When Can the Regulation A ExemptionBe Used?
Regulation A provides an exemption from the securitiesregistration requirements of the Securities Act of 1933, onthe grounds that a smaller securities issuance does notwarrant registration. Regulation A allows exemptionfrom registration if the offering is no larger than $5 millionin aggregate per year. Of this amount, no more than$1.5 million can be attributed to the secondary offering ofsecurities currently held by existing shareholders; the sec-ondary offering cannot include resales by company affili-ates if the company has not generated net income fromcontinuing operations in at least one of the past two fiscalyears. The exemption is restricted to American and Cana-dian companies, and it is not available to investment anddevelopment-stage companies. Anyone using this exemp-tion must also create an offering circular, similar to theone that would be required for a registered offering.
The regulation has provisions that can disqualify acompany from using it. It is not available if a companyhas had a variety of disclosure problems with the SEC inthe past five years, or if the company currently has a regis-tration statement being reviewed by the SEC, or if anyaffiliates or the company’s underwriter have been con-victed within the past 10 years of a crime related to a secu-rity transaction.
192 Equity Registration
E1C14 03/04/2010 Page 193
What Are the Advantages of Using aRegulation A Exemption?
There are three advantages to the exemption provided un-der Regulation A.
1. There is no limit on the number of investors, normust they pass any kind of qualification test.
2. There are no restrictions on the resale of any securi-ties sold under the regulation.
3. The key difference between a Regulation A offeringand a registered offering is the absence of any peri-odic reporting requirements. This is a major reduc-tion in costs to the company and is the mostattractive aspect of the exemption.
In addition, and unlike a registered offering, the regu-lation allows a company to test the waters with investorsin advance of the offering, in order to determine the levelof investor interest. To take advantage of this feature, thecompany must submit the materials used for this initialtesting of the waters to the SEC on or before their firstdate of use. The materials must state that no money is be-ing solicited or will be accepted, that no sales will be madeuntil the company issues an offering circular, that any in-dication of interest by an investor does not constitute apurchase commitment, and also identify the company’schief executive officer as well as briefly describe the busi-ness. The company can test the waters only until it hasfiled an offering circular with the SEC and can commencesecurities sales only once at least 20 days have passedsince the last document delivery or broadcast.
What Is the Process for Using theRegulation A Exemption?
When a company is ready to notify the SEC of securitiessales under this exemption, it does so using Form 1-A.Once the form is filed, the company can conduct a generalsolicitation, which can include advertising the offering, aslong as the solicitation states that sales cannot be com-pleted until the SEC qualifies the company’s preliminaryoffering circular. This preliminary document does nothave to include the final security price, though it shouldcontain an estimate of the range of the maximum offeringprice and the maximum number of shares or debt securi-ties to be offered. Advertising can state only where theoffering circular can be obtained, the name of the
Regulation A Exemption 193
E1C14 03/04/2010 Page 194
company, the price and type of security being offered, andthe company’s general type of business.
While a company is permitted to advertise its offeringas soon as the Form 1-A is filed, it must follow a specificprocedure to conduct actual security sales. Once the Form1-A has been qualified by the SEC, the company must fur-nish an offering circular to each prospective purchaser atleast 48 hours prior to mailing a confirmation of sale. If abroker/dealer is involved with the sale, this entity mustprovide a copy of the offering circular either with or priorto the confirmation of sale.
If the information in an offering circular becomes falseor misleading due to changed circumstances or there havebeen material developments during the course of an offer-ing, the company must revise the offering circular.
Once securities sales are under way, the company mustfile Form 2-A with the SEC every six months following thequalification of the offering statement, describing ongoingsales from the offering and use of proceeds. In addition, itmust file a final Form 2-A within 30 calendar days follow-ing the later of the termination of the offering or the appli-cation of proceeds from the offering.
What Are the Restrictions on Using theRegulation D Exemption?
Under Regulation D, securities can be sold only to anaccredited investor. An accredited investor is one whom theissuing company reasonably believes falls within any ofthese five categories at the time of the securities sale:
1. A bank, broker-dealer, insurance company, invest-ment company, or employee benefit plan
2. A director, executive officer, or general partner ofthe issuing company
3. A person whose individual net worth (or joint networth with a spouse) exceeds $1 million
4. A person having individual income exceeding$200,000 or joint income with a spouse exceeding$300,000 in each of the last two years, with a reason-able expectation for reaching the same income levelin the current year
5. Any trust with total assets exceeding $5 million
The issuing company is not allowed any form of gen-eral solicitation for the sale of securities under the regula-tion. This prohibits the use of advertisements and articlesvia any medium of publication. It also prohibits the sale of
194 Equity Registration
E1C14 03/04/2010 Page 195
securities through seminars to which attendees were in-vited through any form of general solicitation. In order toavoid having a general solicitation, a company must pre-screen any investor to whom an inquiry is sent, usually byusing an underwriter or promoter who already has a listof qualified potential investors.
Securities sold under a Regulation D offering cannot beresold without registration. For this reason, the issuingcompany is required under Rule 502 of the regulation to‘‘exercise reasonable care to assure that the purchasers ofthe securities are not underwriters.’’ To do so, the com-pany must take these three steps:
1. Inquire of purchasers if they are acquiring the secu-rities for themselves or for other parties.
2. Disclose to each purchaser that the securities havenot been registered and therefore cannot be resolduntil they are registered.
3. Add a legend to each securities certificate, statingthat the securities have not been registered and stat-ing the restrictions on their sale or transfer.
When Can Rule 144 Be Used toRegister Stock?
When an investor acquires restricted securities, the securi-ties bear a restrictive legend, stating that the securitiesmay not be resold unless they are registered with the SECor exempt from its registration requirements. Rule 144allows for the resale of restricted securities if five condi-tions are met, which primarily involve the passage oftime. They are:
1. Holding period. If the securities issuer is subject to theperiodic reporting requirements of the SecuritiesExchange Act of 1934 (e.g., issues 10-Q, 10-K, andother periodic reports), the securities holder musthold the securities for at least six months. If the secu-rities issuer is not reporting under the Exchange Act,the holding period is one year.
2. Adequate current information. The securities issuermust be current in its reporting under the ExchangeAct.
3. Trading volume formula. If the securities holder is anaffiliate of the company (i.e., one who is in a controlposition), the number of securities available for saleduring any three-month period cannot exceed thegreater of 1% of the outstanding shares of the same
When Can Rule 144 Be Used to Register Stock? 195
E1C14 03/04/2010 Page 196
class being sold, or if the class is listed on a stockexchange, the greater of 1% of the average reportedweekly trading volume during the four weeks pre-ceding the investor’s filing of a notice of sale using aForm 144. If the securities issuer’s stock is tradedover the counter only, just the 1% rule applies.
4. Ordinary brokerage transactions. If the securitiesholder is an affiliate, the securities sale must behandled as a routine trading transaction, where thebroker cannot receive more than a normal commis-sion. The seller and broker cannot solicit orders tobuy the securities, other than to respond to varioustypes of unsolicited inquiries.
5. File a notice of proposed sale. If the securities holder isan affiliate, the proposed sale must be filed with theSEC on a Form 144 if the sale involves more than5,000 shares or if the aggregate dollar amount isgreater than $50,000 in any three-month period. Thecompleted form shall be filed concurrently witheither the placing with a broker of a sale order or theexecution with a market maker of such a sale. Thesale must take place within three months of filingthe form, or else an amended notice must be filed.
If a securities holder has held the restricted securities forat least one year, and has not been a company affiliate forat least the past three months, the securities can be resoldwithout regard to the preceding conditions. If the companyis fulfilling its reporting requirements under the ExchangeAct, the holding period is reduced to six months.
Once these conditions are met, the securities holdermust have the restrictive legend removed before the secu-rities can be sold. Legend removal must be done by thecompany’s stock transfer agent, which will do so onlywith the written approval of the issuing company’s coun-sel. This written approval is in the form of an opinionletter.
196 Equity Registration

E1C15 03/04/2010 Page 197
PART III
FINANCIAL ANALYSIS

E1C15 03/04/2010 Page 198
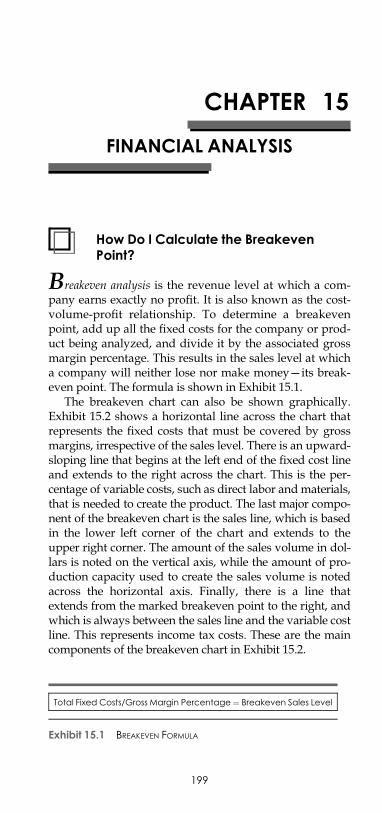
E1C15 03/04/2010 Page 199
CHAPTER 15
FINANCIAL ANALYSIS
How Do I Calculate the BreakevenPoint?
Breakeven analysis is the revenue level at which a com-pany earns exactly no profit. It is also known as the cost-volume-profit relationship. To determine a breakevenpoint, add up all the fixed costs for the company or prod-uct being analyzed, and divide it by the associated grossmargin percentage. This results in the sales level at whicha company will neither lose nor make money—its break-even point. The formula is shown in Exhibit 15.1.
The breakeven chart can also be shown graphically.Exhibit 15.2 shows a horizontal line across the chart thatrepresents the fixed costs that must be covered by grossmargins, irrespective of the sales level. There is an upward-sloping line that begins at the left end of the fixed cost lineand extends to the right across the chart. This is the per-centage of variable costs, such as direct labor andmaterials,that is needed to create the product. The last major compo-nent of the breakeven chart is the sales line, which is basedin the lower left corner of the chart and extends to theupper right corner. The amount of the sales volume in dol-lars is noted on the vertical axis, while the amount of pro-duction capacity used to create the sales volume is notedacross the horizontal axis. Finally, there is a line thatextends from the marked breakeven point to the right, andwhich is always between the sales line and the variable costline. This represents income tax costs. These are the maincomponents of the breakeven chart in Exhibit 15.2.
Total Fixed Costs/Gross Margin Percentage¼ Breakeven Sales Level
Exhibit 15.1 BREAKEVEN FORMULA
199
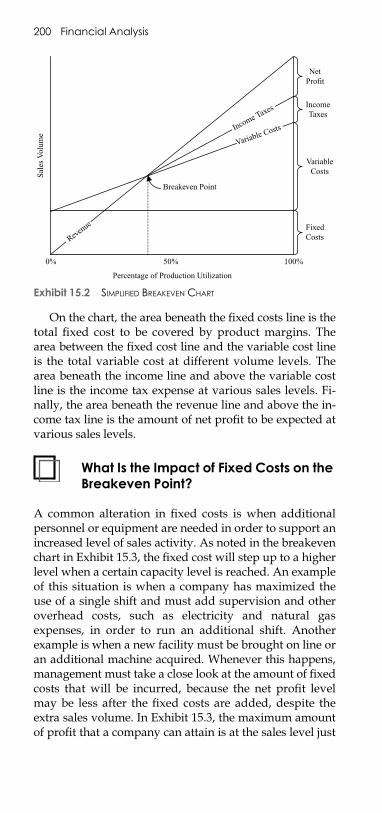
E1C15 03/04/2010 Page 200
On the chart, the area beneath the fixed costs line is thetotal fixed cost to be covered by product margins. Thearea between the fixed cost line and the variable cost lineis the total variable cost at different volume levels. Thearea beneath the income line and above the variable costline is the income tax expense at various sales levels. Fi-nally, the area beneath the revenue line and above the in-come tax line is the amount of net profit to be expected atvarious sales levels.
What Is the Impact of Fixed Costs on theBreakeven Point?
A common alteration in fixed costs is when additionalpersonnel or equipment are needed in order to support anincreased level of sales activity. As noted in the breakevenchart in Exhibit 15.3, the fixed cost will step up to a higherlevel when a certain capacity level is reached. An exampleof this situation is when a company has maximized theuse of a single shift and must add supervision and otheroverhead costs, such as electricity and natural gasexpenses, in order to run an additional shift. Anotherexample is when a new facility must be brought on line oran additional machine acquired. Whenever this happens,management must take a close look at the amount of fixedcosts that will be incurred, because the net profit levelmay be less after the fixed costs are added, despite theextra sales volume. In Exhibit 15.3, the maximum amountof profit that a company can attain is at the sales level just
50%0% 100%
Percentage of Production Utilization
Variable Costs
Breakeven Point
Sale
s V
olum
e
FixedCosts
VariableCosts
IncomeTaxes
NetProfit
Income Taxes
Revenue
Exhibit 15.2 SIMPLIFIED BREAKEVEN CHART
200 Financial Analysis
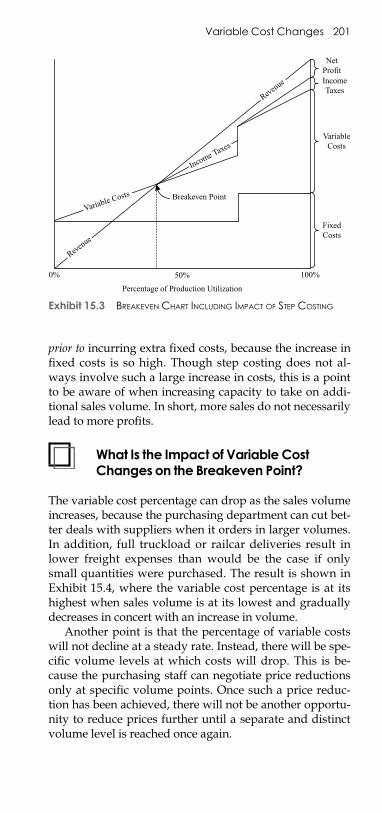
E1C15 03/04/2010 Page 201
prior to incurring extra fixed costs, because the increase infixed costs is so high. Though step costing does not al-ways involve such a large increase in costs, this is a pointto be aware of when increasing capacity to take on addi-tional sales volume. In short, more sales do not necessarilylead to more profits.
What Is the Impact of Variable CostChanges on the Breakeven Point?
The variable cost percentage can drop as the sales volumeincreases, because the purchasing department can cut bet-ter deals with suppliers when it orders in larger volumes.In addition, full truckload or railcar deliveries result inlower freight expenses than would be the case if onlysmall quantities were purchased. The result is shown inExhibit 15.4, where the variable cost percentage is at itshighest when sales volume is at its lowest and graduallydecreases in concert with an increase in volume.
Another point is that the percentage of variable costswill not decline at a steady rate. Instead, there will be spe-cific volume levels at which costs will drop. This is be-cause the purchasing staff can negotiate price reductionsonly at specific volume points. Once such a price reduc-tion has been achieved, there will not be another opportu-nity to reduce prices further until a separate and distinctvolume level is reached once again.
Revenue
50%0% 100%
Percentage of Production Utilization
Breakeven Point
Income Taxes
FixedCosts
VariableCosts
IncomeTaxes
NetProfit
Variable Costs
Revenue
Exhibit 15.3 BREAKEVEN CHART INCLUDING IMPACT OF STEP COSTING
Variable Cost Changes 201
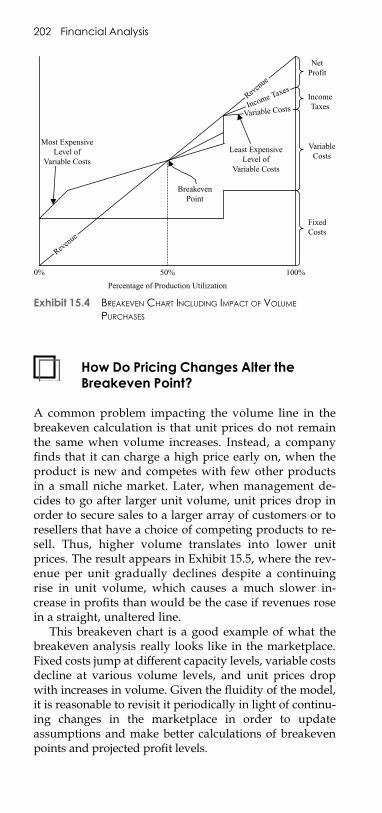
E1C15 03/04/2010 Page 202
How Do Pricing Changes Alter theBreakeven Point?
A common problem impacting the volume line in thebreakeven calculation is that unit prices do not remainthe same when volume increases. Instead, a companyfinds that it can charge a high price early on, when theproduct is new and competes with few other productsin a small niche market. Later, when management de-cides to go after larger unit volume, unit prices drop inorder to secure sales to a larger array of customers or toresellers that have a choice of competing products to re-sell. Thus, higher volume translates into lower unitprices. The result appears in Exhibit 15.5, where the rev-enue per unit gradually declines despite a continuingrise in unit volume, which causes a much slower in-crease in profits than would be the case if revenues rosein a straight, unaltered line.
This breakeven chart is a good example of what thebreakeven analysis really looks like in the marketplace.Fixed costs jump at different capacity levels, variable costsdecline at various volume levels, and unit prices dropwith increases in volume. Given the fluidity of the model,it is reasonable to revisit it periodically in light of continu-ing changes in the marketplace in order to updateassumptions and make better calculations of breakevenpoints and projected profit levels.
Reven
ue
50%0% 100%
Percentage of Production Utilization
BreakevenPoint
FixedCosts
VariableCosts
IncomeTaxes
NetProfit
Reven
ue
Variable CostsIncome Taxes
Most ExpensiveLevel of
Variable Costs
Least ExpensiveLevel of
Variable Costs
Exhibit 15.4 BREAKEVEN CHART INCLUDING IMPACT OF VOLUME
PURCHASES
202 Financial Analysis
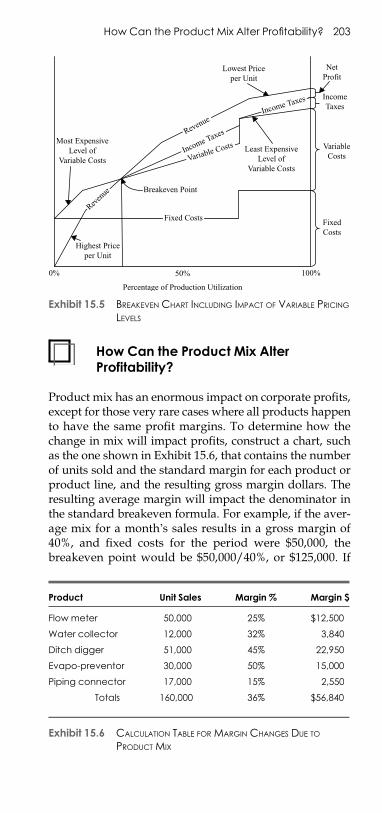
E1C15 03/04/2010 Page 203
How Can the Product Mix AlterProfitability?
Product mix has an enormous impact on corporate profits,except for those very rare cases where all products happento have the same profit margins. To determine how thechange in mix will impact profits, construct a chart, suchas the one shown in Exhibit 15.6, that contains the numberof units sold and the standard margin for each product orproduct line, and the resulting gross margin dollars. Theresulting average margin will impact the denominator inthe standard breakeven formula. For example, if the aver-age mix for a month’s sales results in a gross margin of40%, and fixed costs for the period were $50,000, thebreakeven point would be $50,000/40%, or $125,000. If
50%0% 100%
Percentage of Production Utilization
Breakeven Point
FixedCosts
VariableCosts
IncomeTaxes
NetProfit
Most ExpensiveLevel of
Variable CostsLeast Expensive
Level ofVariable Costs
Highest Priceper Unit
Lowest Priceper Unit
Reven
ue
Variable CostsIncome TaxesRevenue
Fixed Costs
Income Taxes
Exhibit 15.5 BREAKEVEN CHART INCLUDING IMPACT OF VARIABLE PRICING
LEVELS
Product Unit Sales Margin % Margin $
Flow meter 50,000 25% $12,500
Water collector 12,000 32% 3,840
Ditch digger 51,000 45% 22,950
Evapo-preventor 30,000 50% 15,000
Piping connector 17,000 15% 2,550
Totals 160,000 36% $56,840
Exhibit 15.6 CALCULATION TABLE FOR MARGIN CHANGES DUE TO
PRODUCT MIX
How Can the Product Mix Alter Profitability? 203
E1C15 03/04/2010 Page 204
the product mix for the following month were to result ina gross margin of 42%, the breakeven point would shiftdownward to $50,000/42%, or $119,048. Thus, changes inproduct mix will alter the breakeven point by changingthe gross margin number that is part of the breakevenformula.
How Do I Calculate Price Variances?
The price variance is the difference between the standardand actual price paid for anything, multiplied by the num-ber of units of each item purchased. The derivation ofprice variances for materials, wages, variable overhead,and fixed overhead are presented next.
m Material price variance. This is based on the actualprice paid for materials used in the production pro-cess, minus their standard cost, multiplied by thenumber of units used. It is typically reported to thepurchasing manager. This calculation is a bit morecomplicated than it at first seems, since the ‘‘actual’’cost is probably either the last in, first out; first in,first out; or average cost of an item. Here are fouradditional areas to investigate if there is a materialprice variance:
1. The standard price is based on a different pur-chase volume.
2. The standard price is incorrectly derived from adifferent component.
3. The material was purchased on a rush basis.4. The material was purchased at a premium, due to
a supply shortage.
m Labor price variance. This is based on the actual pricepaid for the direct labor used in the production pro-cess, minus its standard cost, multiplied by the num-ber of units used. It is typically reported to themanagers of both production and human resources;the production manager, because this person is re-sponsible for manning jobs with personnel of thecorrect wage rates; and the human resources man-ager, because this person is responsible for settingthe allowable wage rates that employees are paid.This tends to be a relatively small variance, as longas the standard labor rate is regularly revised tomatch actual labor rates in the production facility.Since most job categories tend to be clustered intorelatively small pay ranges, there is not much chance
204 Financial Analysis
E1C15 03/04/2010 Page 205
that a labor price variance will become excessive.Here are three areas to investigate if there is a laborprice variance:
1. The standard labor rate has not been adjusted re-cently to reflect actual pay changes.
2. The actual labor rate includes overtime or shiftdifferentials that were not included in thestandard.
3. The manning of jobs is with employees whosepay levels are different from those used to de-velop standards for those jobs.
m Variable overhead spending variance. To calculate thisvariance, subtract the standard variable overheadcost per unit from the actual cost incurred, and mul-tiply the remainder by the total unit quantity of out-put. This is very similar to the material and laborprice variances, since there are some overhead coststhat are directly related to the volume of production,as is the case for materials and labor. The detailedreport on this variance is usually sent to the produc-tion manager, who is responsible for all overheadincurred in the production area. Here are three areasto investigate if there is a variable overhead spend-ing variance:
1. The cost of activities in any of the variable over-head accounts has been altered by the supplier.
2. The company has altered its purchasing methodsfor the variable overhead costs to or from the useof blanket purchase orders (which tend to resultin lower prices due to higher purchase volumes).
3. Costs are beingmisclassified between the accounts,so that the spending variance appears too low inone account and too high in another.
m Fixed overhead spending variance. This is the totalamount by which fixed overhead costs exceed theirtotal standard cost for the reporting period. Thereis no way to relate this price variance to volume,since it is not directly tied to any sort of activityvolume. The detailed variance report on this topicmay be distributed to many people, depending onwho is responsible for each general ledger accountnumber that it contains. Investigation of variancesin this area generally centers on a period-to-periodcomparison of prices charged to suppliers, withparticular attention to those experiencing recentprice increases.
How Do I Calculate Price Variances? 205
E1C15 03/04/2010 Page 206
How Do I Calculate EfficiencyVariances?
The efficiency variance is the difference between the actualand standard usage of a resource, multiplied by the stan-dard price of that resource. The efficiency variance appliesto materials, labor, and variable overhead. It does not ap-ply to fixed overhead costs, since these costs are incurredindependently from any resource usage. Here is a closerexamination of the efficiency variance, as applied to eachof these areas:
m Material yield variance. This measures the ability of acompany to manufacture a product using the exactamount of materials allowed by the standard. A vari-ance will arise if the quantity of materials used differsfrom the preset standard. It is calculated by subtract-ing the total standard quantity of materials that aresupposed to be used from the actual level of usage,and multiplying the remainder by the standard priceper unit. This information is usually issued to theproduction manager. Here are some of the areas toinvestigate to correct the material yield variance:
1. Excessive machine-related scrap rates.2. Poor material quality levels.3. Excessively tight tolerance for product rejections.4. Improper machine setup.5. Substitute materials that cause high reject rates.
m Labor efficiency variance. This measures the ability of acompany’s direct labor staff to create products withthe exact amount of labor set forth in the standard. Avariance will arise if the quantity of labor used is dif-ferent from the standard; note that this variance hasnothing to do with the cost per unit of labor (whichis the price variance), only the quantity of it that isconsumed. It is calculated by subtracting the stan-dard quantity of labor consumed from the actualamount, and multiplying the remainder times thestandard labor rate per hour. As was the case for thematerial yield variance, it is most commonlyreported to the production manager. Here are thelikely causes of the labor efficiency variance:
1. Employees have poor work instructions.2. Employees are not adequately trained.3. Too many employees are manning a work
station.
206 Financial Analysis
E1C15 03/04/2010 Page 207
4. The wrong mix of employees is manning a workstation.
5. The labor standard used as a comparison isincorrect.
m Variable overhead efficiency variance. This measuresthe quantity of variable overhead required to pro-duce a unit of production. For example, if the ma-chine used to run a batch of product requires extratime to produce each product, there will be an addi-tional charge to the product’s cost that is based onthe price of the machine, multiplied by its cost perminute. This variance is not concerned with the ma-chine’s cost per minute (which would be examinedthrough a price variance analysis) but with the num-ber of minutes required for the production of eachunit. It is calculated by subtracting the budgetedunits of activity upon which the variable overheadis charged from the actual units of activity, times thestandard variable overhead cost per unit. Depend-ing on the nature of the costs that make up the poolof variable overhead costs, this variance may bereported to several managers, particularly the pro-duction manager. The causes of this variance will betied to the unit of activity on which it is based. Forexample, if the variable overhead rate varies directlywith the quantity of machine time used, the maincauses will be any action that changes the rate of ma-chine usage. If the basis is the amount of materialsused, the causes will be those just noted for thematerials yield variance.
How Do I Conduct a ProfitabilityAnalysis for Services?
In the services industry, employee billable hours consti-tute the prime criterion for overall corporate profitability.Financial analysis should encompass the next three fac-tors, which encompass the primary determinants of prof-itability in the services sector:
1. Percentage of time billed2. Full labor cost per hour3. Billing price per hour
The percentage of time billed can be easily trackedwith a spreadsheet, such as the one shown in Exhibit 15.7,where billable employee time is listed by week, with amonth-to-date billable percentage listed not only by
How Do I Conduct a Profitability Analysis for Services? 207
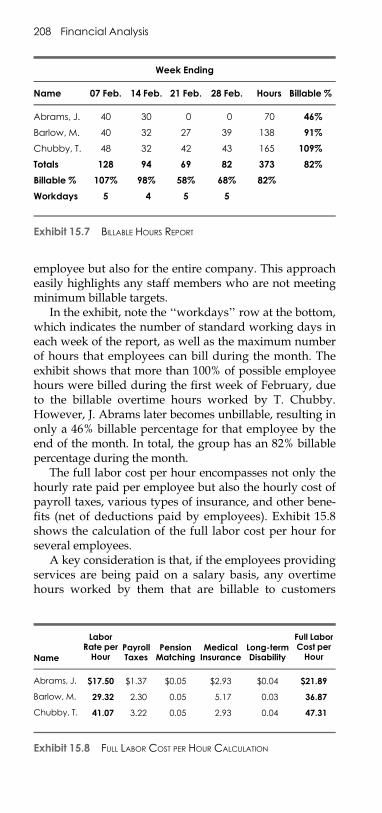
E1C15 03/04/2010 Page 208
employee but also for the entire company. This approacheasily highlights any staff members who are not meetingminimum billable targets.
In the exhibit, note the ‘‘workdays’’ row at the bottom,which indicates the number of standard working days ineach week of the report, as well as the maximum numberof hours that employees can bill during the month. Theexhibit shows that more than 100% of possible employeehours were billed during the first week of February, dueto the billable overtime hours worked by T. Chubby.However, J. Abrams later becomes unbillable, resulting inonly a 46% billable percentage for that employee by theend of the month. In total, the group has an 82% billablepercentage during the month.
The full labor cost per hour encompasses not only thehourly rate paid per employee but also the hourly cost ofpayroll taxes, various types of insurance, and other bene-fits (net of deductions paid by employees). Exhibit 15.8shows the calculation of the full labor cost per hour forseveral employees.
A key consideration is that, if the employees providingservices are being paid on a salary basis, any overtimehours worked by them that are billable to customers
Week Ending
Name 07 Feb. 14 Feb. 21 Feb. 28 Feb. Hours Billable %
Abrams, J. 40 30 0 0 70 46%
Barlow, M. 40 32 27 39 138 91%
Chubby, T. 48 32 42 43 165 109%
Totals 128 94 69 82 373 82%
Billable % 107% 98% 58% 68% 82%
Workdays 5 4 5 5
Exhibit 15.7 BILLABLE HOURS REPORT
Name
LaborRate perHour
PayrollTaxes
PensionMatching
MedicalInsurance
Long-termDisability
Full LaborCost perHour
Abrams, J. $17.50 $1.37 $0.05 $2.93 $0.04 $21.89
Barlow, M. 29.32 2.30 0.05 5.17 0.03 36.87
Chubby, T. 41.07 3.22 0.05 2.93 0.04 47.31
Exhibit 15.8 FULL LABOR COST PER HOUR CALCULATION
208 Financial Analysis
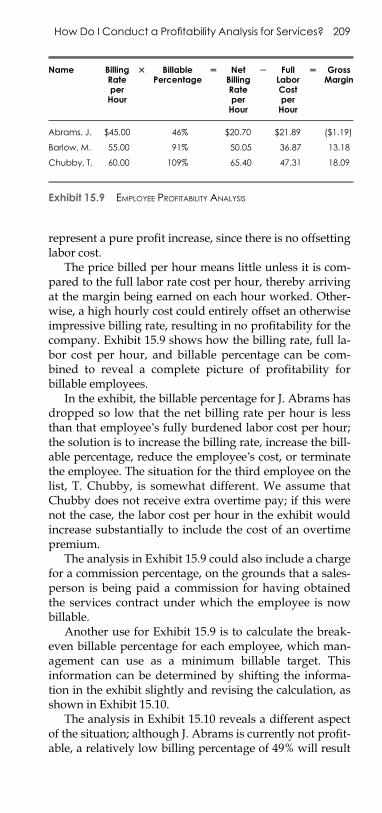
E1C15 03/04/2010 Page 209
represent a pure profit increase, since there is no offsettinglabor cost.
The price billed per hour means little unless it is com-pared to the full labor rate cost per hour, thereby arrivingat the margin being earned on each hour worked. Other-wise, a high hourly cost could entirely offset an otherwiseimpressive billing rate, resulting in no profitability for thecompany. Exhibit 15.9 shows how the billing rate, full la-bor cost per hour, and billable percentage can be com-bined to reveal a complete picture of profitability forbillable employees.
In the exhibit, the billable percentage for J. Abrams hasdropped so low that the net billing rate per hour is lessthan that employee’s fully burdened labor cost per hour;the solution is to increase the billing rate, increase the bill-able percentage, reduce the employee’s cost, or terminatethe employee. The situation for the third employee on thelist, T. Chubby, is somewhat different. We assume thatChubby does not receive extra overtime pay; if this werenot the case, the labor cost per hour in the exhibit wouldincrease substantially to include the cost of an overtimepremium.
The analysis in Exhibit 15.9 could also include a chargefor a commission percentage, on the grounds that a sales-person is being paid a commission for having obtainedthe services contract under which the employee is nowbillable.
Another use for Exhibit 15.9 is to calculate the break-even billable percentage for each employee, which man-agement can use as a minimum billable target. Thisinformation can be determined by shifting the informa-tion in the exhibit slightly and revising the calculation, asshown in Exhibit 15.10.
The analysis in Exhibit 15.10 reveals a different aspectof the situation; although J. Abrams is currently not profit-able, a relatively low billing percentage of 49% will result
Name BillingRateperHour
T BillablePercentage
U NetBillingRateperHour
S FullLaborCostperHour
U GrossMargin
Abrams, J. $45.00 46% $20.70 $21.89 ($1.19)
Barlow, M. 55.00 91% 50.05 36.87 13.18
Chubby, T. 60.00 109% 65.40 47.31 18.09
Exhibit 15.9 EMPLOYEE PROFITABILITY ANALYSIS
How Do I Conduct a Profitability Analysis for Services? 209
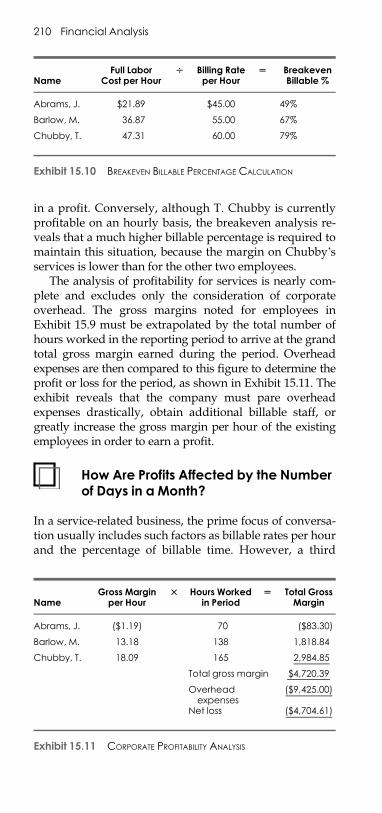
E1C15 03/04/2010 Page 210
in a profit. Conversely, although T. Chubby is currentlyprofitable on an hourly basis, the breakeven analysis re-veals that a much higher billable percentage is required tomaintain this situation, because the margin on Chubby’sservices is lower than for the other two employees.
The analysis of profitability for services is nearly com-plete and excludes only the consideration of corporateoverhead. The gross margins noted for employees inExhibit 15.9 must be extrapolated by the total number ofhours worked in the reporting period to arrive at the grandtotal gross margin earned during the period. Overheadexpenses are then compared to this figure to determine theprofit or loss for the period, as shown in Exhibit 15.11. Theexhibit reveals that the company must pare overheadexpenses drastically, obtain additional billable staff, orgreatly increase the gross margin per hour of the existingemployees in order to earn a profit.
How Are Profits Affected by the Numberof Days in a Month?
In a service-related business, the prime focus of conversa-tion usually includes such factors as billable rates per hourand the percentage of billable time. However, a third
NameFull Labor
Cost per HourV Billing Rate
per HourU Breakeven
Billable %
Abrams, J. $21.89 $45.00 49%
Barlow, M. 36.87 55.00 67%
Chubby, T. 47.31 60.00 79%
Exhibit 15.10 BREAKEVEN BILLABLE PERCENTAGE CALCULATION
NameGross Margin
per HourT Hours Worked
in PeriodU Total Gross
Margin
Abrams, J. ($1.19) 70 ($83.30)
Barlow, M. 13.18 138 1,818.84
Chubby, T. 18.09 165 2,984.85
Total gross margin $4,720.39
Overheadexpenses
($9,425.00)
Net loss ($4,704.61)
Exhibit 15.11 CORPORATE PROFITABILITY ANALYSIS
210 Financial Analysis
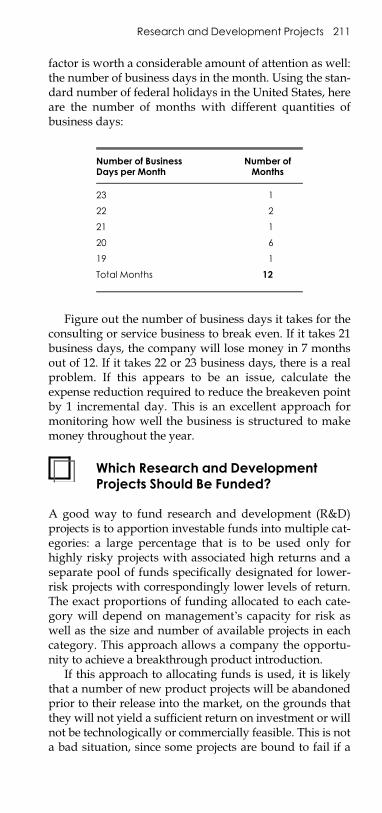
E1C15 03/04/2010 Page 211
factor is worth a considerable amount of attention as well:the number of business days in the month. Using the stan-dard number of federal holidays in the United States, hereare the number of months with different quantities ofbusiness days:
Number of BusinessDays per Month
Number ofMonths
23 1
22 2
21 1
20 6
19 1
Total Months 12
Figure out the number of business days it takes for theconsulting or service business to break even. If it takes 21business days, the company will lose money in 7 monthsout of 12. If it takes 22 or 23 business days, there is a realproblem. If this appears to be an issue, calculate theexpense reduction required to reduce the breakeven pointby 1 incremental day. This is an excellent approach formonitoring how well the business is structured to makemoney throughout the year.
Which Research and DevelopmentProjects Should Be Funded?
A good way to fund research and development (R&D)projects is to apportion investable funds into multiple cat-egories: a large percentage that is to be used only forhighly risky projects with associated high returns and aseparate pool of funds specifically designated for lower-risk projects with correspondingly lower levels of return.The exact proportions of funding allocated to each cate-gory will depend on management’s capacity for risk aswell as the size and number of available projects in eachcategory. This approach allows a company the opportu-nity to achieve a breakthrough product introduction.
If this approach to allocating funds is used, it is likelythat a number of new product projects will be abandonedprior to their release into the market, on the grounds thatthey will not yield a sufficient return on investment or willnot be technologically or commercially feasible. This is nota bad situation, since some projects are bound to fail if a
Research and Development Projects 211
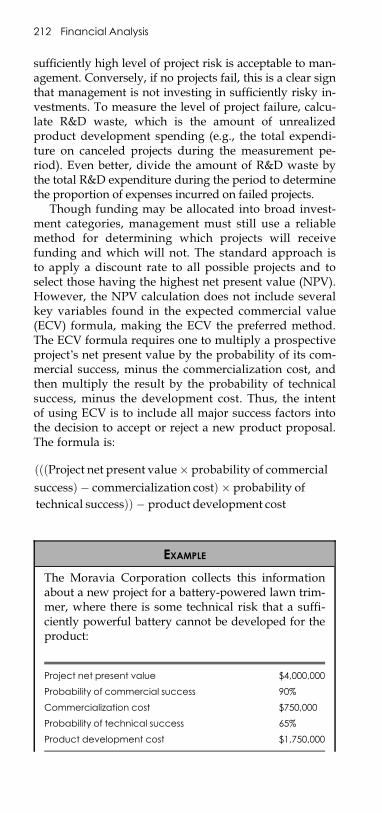
E1C15 03/04/2010 Page 212
sufficiently high level of project risk is acceptable to man-agement. Conversely, if no projects fail, this is a clear signthat management is not investing in sufficiently risky in-vestments. To measure the level of project failure, calcu-late R&D waste, which is the amount of unrealizedproduct development spending (e.g., the total expendi-ture on canceled projects during the measurement pe-riod). Even better, divide the amount of R&D waste bythe total R&D expenditure during the period to determinethe proportion of expenses incurred on failed projects.
Though funding may be allocated into broad invest-ment categories, management must still use a reliablemethod for determining which projects will receivefunding and which will not. The standard approach isto apply a discount rate to all possible projects and toselect those having the highest net present value (NPV).However, the NPV calculation does not include severalkey variables found in the expected commercial value(ECV) formula, making the ECV the preferred method.The ECV formula requires one to multiply a prospectiveproject’s net present value by the probability of its com-mercial success, minus the commercialization cost, andthen multiply the result by the probability of technicalsuccess, minus the development cost. Thus, the intentof using ECV is to include all major success factors intothe decision to accept or reject a new product proposal.The formula is:
ðððProject net present value� probability of commercialsuccessÞ � commercialization costÞ � probability oftechnical successÞÞ � product development cost
EXAMPLE
The Moravia Corporation collects this informationabout a new project for a battery-powered lawn trim-mer, where there is some technical risk that a suffi-ciently powerful battery cannot be developed for theproduct:
Project net present value $4,000,000
Probability of commercial success 90%
Commercialization cost $750,000
Probability of technical success 65%
Product development cost $1,750,000
212 Financial Analysis
E1C15 03/04/2010 Page 213
How Do I Create a Throughput AnalysisModel?
The primary focus of throughput analysis is on how toforce as much throughput dollars (sales minus totally var-iable expenses) as possible through the capacity constraint(i.e., the bottleneck operation). It does this by first deter-mining the throughput dollars per minute of every pro-duction job scheduled to run through the capacityconstraint and then rearranging the order of productionpriority so that the products with the highest throughputdollars per minute are completed first. The system isbased on the supposition that only a certain amount ofproduction can be squeezed through a bottleneck opera-tion, so the production that yields the highest marginmust come first in order of production scheduling prior-ity, to ensure that profits are maximized. The concept ismost easily demonstrated in the example shown inExhibit 15.12.
In the example, we have four types of products that acompany can sell. Each requires some machining time onthe company’s capacity constraint, which is the circuitboard manufacturing process (CBMP). The first item is a19-inch color television, which requires four minutes ofthe CBMP’s time. The television sells for $100.00 and hasassociated direct materials of $67.56, which gives it athroughput of $32.44. (The price and direct materials costare not shown in the exhibit; they are inferred from it.) Wethen divide the throughput of $32.44 by the four minutesof processing time per unit on the capacity constraint toarrive at the throughput dollars per minute of $8.11 that isshown in the second column of the exhibit. We then calcu-late the throughput per minute for the other three prod-ucts and sort them in high-low order, based on which
Based on this information, Moravia computes theECV for the lawn trimmer project:
ððð$4; 000; 000 project net present value� 90% probability of commercial successÞ� $750; 000 commercialization costÞ� 65% probability of technical successÞÞ� $1; 750; 000 product development cost
Expected commercial value ¼ $102; 500
How Do I Create a Throughput Analysis Model? 213
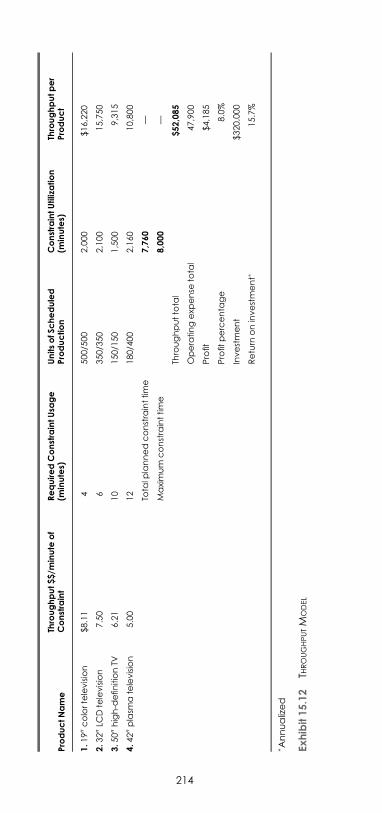
E1C15 03/04/2010 Page 214
ProductName
Throughput$$/m
inute
of
Constraint
RequiredConstraintUsa
ge
(minutes)
UnitsofS
cheduled
Production
ConstraintUtilization
(minutes)
Throughputper
Product
1.1
900colortelevision
$8.11
4500/500
2,000
$16,220
2.3
200LC
Dtelevision
7.50
6350/350
2,100
15,750
3.5
000high-d
efin
itionTV
6.21
10
150/150
1,500
9,315
4.4
200plasm
atelevision
5.00
12
180/400
2,160
10,800
Tota
lplannedconstrainttime
7,760
—
Maximum
constrainttime
8,000
—
Throughputtota
l$52,085
Operatingexp
ense
tota
l47,900
Profit
$4,185
Profit
percenta
ge
8.0%
Investment
$320,000
Return
oninvestment�
15.7%
� Annualized
Exhibit15.12
THROUGHPUTM
ODEL
214
E1C15 03/04/2010 Page 215
ones contribute the most throughput per minute. Thisleaves the 19-inch color television at the top of the list.Next, we multiply the scheduled production for each itemby the time required to move it through the constrainedresource. We do this for all four products, and verify thatthe total planned time required for the constraint opera-tion is equal to or less than the actual time available at theconstraint, as shown in the ‘‘Total planned constrainttime’’ row. In the exhibit, the maximum available con-straint time is listed in bold as 8,000 minutes, which is theapproximate usage level for an eight-hour day in a 21-daymonth of business days, assuming 80% efficiency. Thisnumber will vary dramatically, depending on the numberof shifts used, scrap levels, and the efficiency of operationof the constrained resource.
A key concept is that the maximum number of units ofthe highest throughput-per-minute item (in this case, the19-inch color television) are to be sold as well as the maxi-mum volume for each product listed below it. Only theproduction volume of the product listed at the bottom ofthe table (in this case, the 42-inch plasma television) willbe reduced in order to meet the limitations of the con-strained resource. The amount of planned production aswell as the amount of potential sales are shown in the‘‘Units of Scheduled Production’’ column of the through-put model. For example, ‘‘500/500’’ is shown in this col-umn for the 19-inch color television, which means thatthere are 500 units of potential sales for this product andthe company plans to produce all 500 units. Only for thelast product in the table, the 42-inch plasma television,do the units of production not match the potential sales(180 units are being produced instead of the 400 units ofpotential sales). By matching units of production withpotential sales, a company can maximize throughput.
Then, by multiplying the throughput per minute by thenumber of minutes for each product, and then multiplyingthe result by the total number of units produced, we ar-rive at the total throughput for each product, as shown inthe final column, as well as for the entire production pro-cess for the one-month period, which is $52,085. We muststill subtract from the total throughput the sum of all oper-ating expenses for the facility, which is $47,900 in theexhibit. After they are subtracted from the total through-put, we find that we have achieved a profit of 8.0% and areturn on investment (annualized, since the results of themodel are only for a one-month period) of 15.7%.
When reviewing a proposal with this model, one mustreview the impact of the decision on the incremental
How Do I Create a Throughput Analysis Model? 215
E1C15 03/04/2010 Page 216
change in net profit caused by a change in throughput mi-nus operating expenses, divided by the change in invest-ment. If there is an incremental improvement in themodel, the proposed decision should be accepted. Themodel makes it easy to determine the exact amount of sys-tem improvement (or degradation) occurring by incre-mentally changing one element of the production system.
How Do I Determine if More Volume at aLower Price Creates More Profit?
What happens when a customer indicates that a verylarge order is about to be issued, but only if the companygrants a significant price reduction? The typical analysis isfor the controller to determine the fully burdened cost ofthe product in question, compare it to the low requestedprice, and reject the proposal out of hand because thecompany cannot cover its overhead costs at such a lowprice point. Conversely, the sales manager will ramthrough approval of the proposal, on the grounds that‘‘We will make up the loss with higher volume.’’Which isright? Based on their logic, neither one, because they arenot considering the net impact of this proposal on totalsystem throughput. The next example will clarify thesituation.
EXAMPLE
The sales manager of the electronics company in theprevious example runs into the corporate headquar-ters, flush from a meeting with the company’s largestaccount, Electro-Geek Stores (EGS). He has justagreed to a deal that drops the price of the 32-inchLCD television by 20% but that guarantees a doublingin the quantity of EGS orders for this product for theupcoming year. The sales manager points out thatthe company may have to hold off on a few of thesmaller-volume production runs of other products,but no problem—the company is bound to earn moremoney on the extra volume. To test this assumption,the controller pulls up the throughput model on hiscomputer, shifts the LCD TV to the top of the prioritylist, adjusts the throughput to reflect the lower price,and obtains the results shown in the next table.
216 Financial Analysis
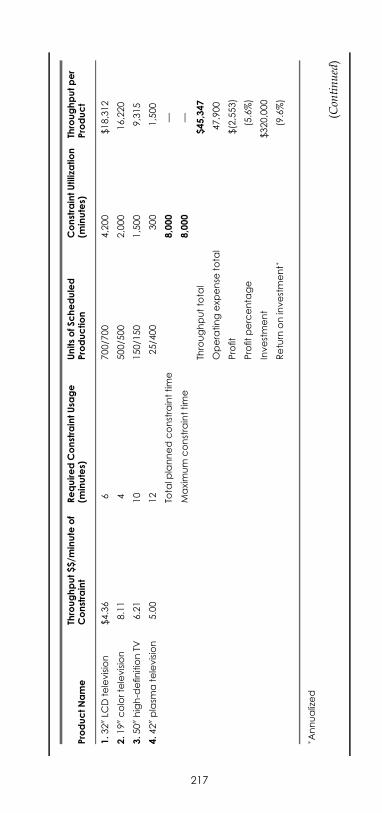
E1C15 03/04/2010 Page 217
ProductName
Throughput$$/m
inute
of
Constraint
RequiredConstraintUsa
ge
(minutes)
UnitsofS
cheduled
Production
ConstraintUtilization
(minutes)
Throughputper
Product
1.3
200LC
Dtelevision
$4.36
6700/700
4,200
$18,312
2.1
900colortelevision
8.11
4500/500
2,000
16,220
3.5
000high-d
efin
itionTV
6.21
10
150/150
1,500
9,315
4.4
200plasm
atelevision
5.00
12
25/400
300
1,500
Tota
lplannedconstrainttime
8,000
—
Maximum
constrainttime
8,000
—
Throughputtota
l$45,347
Operatingexp
ense
tota
l47,900
Profit
$(2,553)
Profit
percenta
ge
(5.6%)
Investment
$320,000
Return
oninvestment�
(9.6%)
� Annualized
(Contin
ued)
217
E1C15 03/04/2010 Page 218
This example clearly shows that one must carefullyconsider the impact on the capacity constraint whendebating whether to accept a high-volume sales deal. Thisis a particularly dangerous area in which to ignorethroughput analysis, for the acceptance of a really large-volume deal can demand all of the time of the capacityconstraint, eliminating any chance for the company tomanufacture other products and thereby eliminating anychance of offering a wide product mix to the generalmarketplace.
Should I Outsource Production?
The proper analysis of this question surrounds whether acompany can earn more throughput on a combination ofthe outsourced production and the additional new pro-duction that will now be available through the con-strained resource.
(Continued)In short, the sales manager just skewered the com-
pany. By dropping the price of the LCD television by20%, much of the product’s throughput was elimi-nated while so much of the capacity constraint wasused up that there was little room for the productionof any other products that might generate enoughadded throughput to save the company. Specifically,because of its low level of throughput dollars per min-ute, the planned production of the 42-inch plasma tel-evision had to be dropped from 180 units to just 25,nearly eliminating the throughput of this product.
EXAMPLE
To continue with the information in the originalthroughput example, one of the company’s key sup-pliers has offered to take over the entire production ofthe 50-inch high-definition television, package it in thecompany’s boxes, and drop ship the completed goodsdirectly to the company’s customers. The catch is thatthe company’s throughput per unit will decrease fromits current $62.10 to $30.00. The cost accounting staffwould likely reject this deal, on the grounds that prof-its would be reduced. To see if this is a good deal, weturn once again to the throughput model, which isreproduced in the next table. In this exhibit, we have
218 Financial Analysis
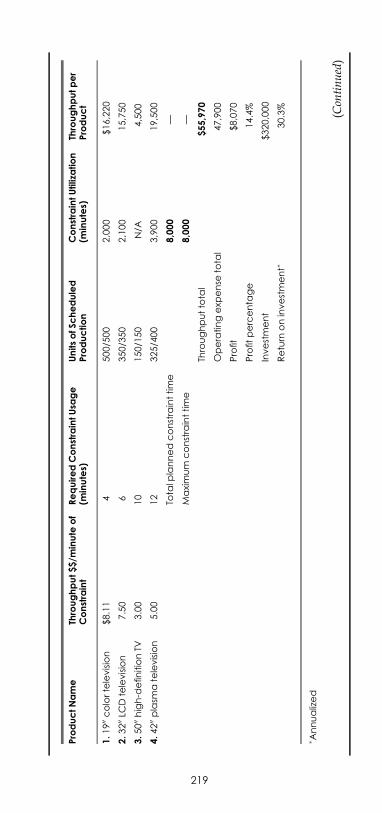
E1C15 03/04/2010 Page 219
ProductName
Throughput$$/m
inute
of
Constraint
RequiredConstraintUsa
ge
(minutes)
UnitsofS
cheduled
Production
ConstraintUtilization
(minutes)
Throughputper
Product
1.1
900colortelevision
$8.11
4500/500
2,000
$16,220
2.3
200LC
Dtelevision
7.50
6350/350
2,100
15,750
3.5
000high-d
efin
itionTV
3.00
10
150/150
N/A
4,500
4.4
200plasm
atelevision
5.00
12
325/400
3,900
19,500
Tota
lplannedconstrainttime
8,000
—
Maximum
constrainttime
8,000
—
Throughputtota
l$55,970
Operatingexp
ense
tota
l47,900
Profit
$8,070
Profit
percenta
ge
14.4%
Investment
$320,000
Return
oninvestment�
30.3%
� Annualized
(Contin
ued)
219
E1C15 03/04/2010 Page 220
The traditional cost accounting approach would havestated that profits would be lowered by accepting an out-sourcing deal that clearly cost more than the product’s in-ternal cost. However, by using this deal to release somecapacity at the bottleneck, the company is able to earnmore money on the production of other products.
Should I Add Staff to the BottleneckOperation?
When a company starts using constraint management asits guiding principle in managing throughput, an earlyarea of decision making will be how to increase the outputof the constrained resource. An obvious first step is to addstaff to it, with the intent of achieving faster equipmentsetup time, less equipment downtime, more operationalefficiency per machine, and so on. As long as the incre-mental increase in throughput exceeds the cost of eachstaff person added to the constraint, this should be a logi-cal step to take. However, traditional accounting analysiswill likely find that the additional labor assigned to theconstrained resource will not be needed at all times andthat it would therefore have a low level of efficiency. Suchan analysis would reject the proposal.
(Continued)removed the number from the Units of ScheduledProduction column for the high-definition television,since it can now be produced without the use of thecapacity constraint. However, we are still able to puta cumulative throughput dollar figure into the finalcolumn for this product, since there is some margin tobe made by outsourcing it through the supplier. Byremoving the high-definition television’s usage of thecapacity constraint, we are now able to produce moreof the next product in line, which is the plasma televi-sion set. This additional production allows the com-pany to increase the amount of throughput dollars,thereby creating $3,885 more profits than was the casebefore the outsourcing deal.
EXAMPLE
The same company from the previous examples real-izes that it can vastly reduce job setup time by addingan employee to the constrained resource, thereby
220 Financial Analysis

E1C15 03/04/2010 Page 221
ProductName
Throughput$$/m
inute
of
Constraint
RequiredConstraintUsa
ge
(minutes)
UnitsofS
cheduled
Production
ConstraintUtilization
(minutes)
Throughputper
Product
1.1
900colortelevision
$8.11
4500/500
2,000
$16,220
2.3
200LC
Dtelevision
7.50
6350/350
2,100
15,750
3.5
000high-d
efin
itionTV
6.21
10
150/150
1,500
9,315
4.4
200plasm
atelevision
5.00
12
266/400
3,192
15,960
Tota
lplannedconstrainttime
8,792
—
Maximum
constrainttime
8,800
—
Throughputtota
l$57,245
Operatingexp
ense
tota
l52,100
Profit
$5,145
Profit
percenta
ge
9.0%
Investment
$320,000
Return
oninvestment�
19.3%
� Annualized
(Contin
ued)
221
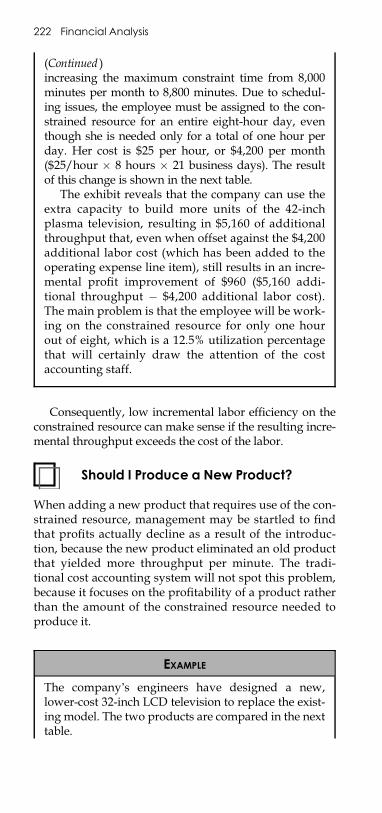
E1C15 03/04/2010 Page 222
Consequently, low incremental labor efficiency on theconstrained resource can make sense if the resulting incre-mental throughput exceeds the cost of the labor.
Should I Produce a New Product?
When adding a new product that requires use of the con-strained resource, management may be startled to findthat profits actually decline as a result of the introduc-tion, because the new product eliminated an old productthat yielded more throughput per minute. The tradi-tional cost accounting system will not spot this problem,because it focuses on the profitability of a product ratherthan the amount of the constrained resource needed toproduce it.
(Continued )increasing the maximum constraint time from 8,000minutes per month to 8,800 minutes. Due to schedul-ing issues, the employee must be assigned to the con-strained resource for an entire eight-hour day, eventhough she is needed only for a total of one hour perday. Her cost is $25 per hour, or $4,200 per month($25/hour � 8 hours � 21 business days). The resultof this change is shown in the next table.
The exhibit reveals that the company can use theextra capacity to build more units of the 42-inchplasma television, resulting in $5,160 of additionalthroughput that, even when offset against the $4,200additional labor cost (which has been added to theoperating expense line item), still results in an incre-mental profit improvement of $960 ($5,160 addi-tional throughput � $4,200 additional labor cost).The main problem is that the employee will be work-ing on the constrained resource for only one hourout of eight, which is a 12.5% utilization percentagethat will certainly draw the attention of the costaccounting staff.
EXAMPLE
The company’s engineers have designed a new,lower-cost 32-inch LCD television to replace the exist-ing model. The two products are compared in the nexttable.
222 Financial Analysis
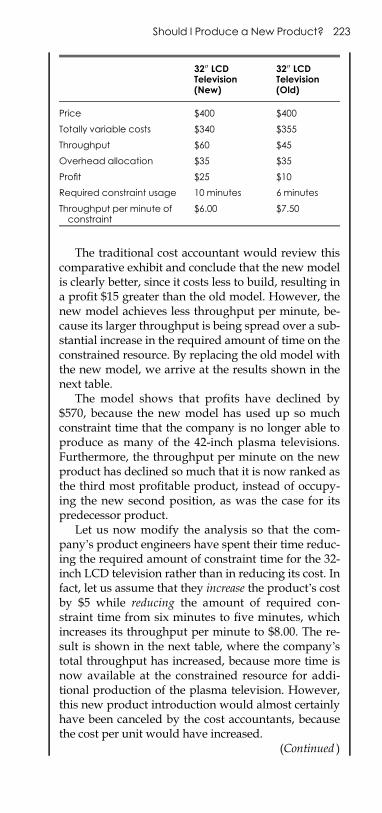
E1C15 03/04/2010 Page 223
3200 LCDTelevision(New)
3200 LCDTelevision(Old)
Price $400 $400
Totally variable costs $340 $355
Throughput $60 $45
Overhead allocation $35 $35
Profit $25 $10
Required constraint usage 10 minutes 6 minutes
Throughput per minute ofconstraint
$6.00 $7.50
The traditional cost accountant would review thiscomparative exhibit and conclude that the new modelis clearly better, since it costs less to build, resulting ina profit $15 greater than the old model. However, thenew model achieves less throughput per minute, be-cause its larger throughput is being spread over a sub-stantial increase in the required amount of time on theconstrained resource. By replacing the old model withthe new model, we arrive at the results shown in thenext table.
The model shows that profits have declined by$570, because the new model has used up so muchconstraint time that the company is no longer able toproduce as many of the 42-inch plasma televisions.Furthermore, the throughput per minute on the newproduct has declined so much that it is now ranked asthe third most profitable product, instead of occupy-ing the new second position, as was the case for itspredecessor product.
Let us now modify the analysis so that the com-pany’s product engineers have spent their time reduc-ing the required amount of constraint time for the 32-inch LCD television rather than in reducing its cost. Infact, let us assume that they increase the product’s costby $5 while reducing the amount of required con-straint time from six minutes to five minutes, whichincreases its throughput per minute to $8.00. The re-sult is shown in the next table, where the company’stotal throughput has increased, because more time isnow available at the constrained resource for addi-tional production of the plasma television. However,this new product introduction would almost certainlyhave been canceled by the cost accountants, becausethe cost per unit would have increased.
(Continued )
Should I Produce a New Product? 223
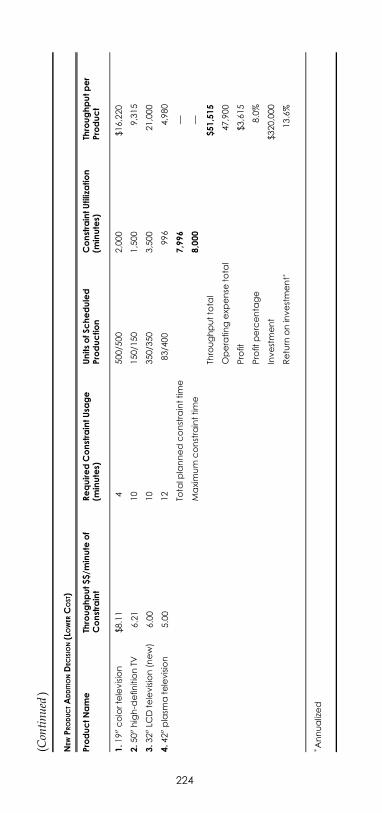
E1C15 03/04/2010 Page 224
NEW
PRODUCTA
DDITIO
ND
ECISIO
N(L
OWER
COST)
ProductName
Throughput$$/m
inute
of
Constraint
RequiredConstraintUsa
ge
(minutes)
UnitsofS
cheduled
Production
ConstraintUtilization
(minutes)
Throughputper
Product
1.1
900colortelevision
$8.11
4500/500
2,000
$16,220
2.5
000high-d
efin
itionTV
6.21
10
150/150
1,500
9,315
3.3
200LC
Dtelevision(new)
6.00
10
350/350
3,500
21,000
4.4
200plasm
atelevision
5.00
12
83/400
996
4,980
Tota
lplannedconstrainttime
7,996
—
Maximum
constrainttime
8,000
—
Throughputtota
l$51,515
Operatingexp
ense
tota
l47,900
Profit
$3,615
Profit
percenta
ge
8.0%
Investment
$320,000
Return
oninvestment�
13.6%
� Annualized
(Contin
ued)
224
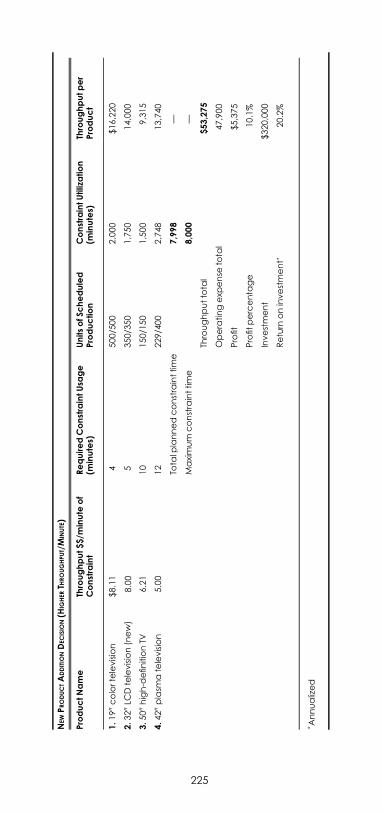
E1C15 03/04/2010 Page 225
NEW
PRODUCTA
DDITIO
NDEC
ISIO
N(H
IGHER
THROUGHPUT/M
INUTE)
ProductName
Throughput$$/m
inute
of
Constraint
RequiredConstraintUsa
ge
(minutes)
UnitsofS
cheduled
Production
ConstraintUtilization
(minutes)
Throughputper
Product
1.1
900colortelevision
$8.11
4500/500
2,000
$16,220
2.3
200LC
Dtelevision(new)
8.00
5350/350
1,750
14,000
3.5
000high-d
efin
itionTV
6.21
10
150/150
1,500
9,315
4.4
200plasm
atelevision
5.00
12
229/400
2,748
13,740
Tota
lplannedconstrainttime
7,998
—
Maximum
constrainttime
8,000
—
Throughputtota
l$53,275
Operatingexp
ense
tota
l47,900
Profit
$5,375
Profit
percenta
ge
10.1%
Investment
$320,000
Return
oninvestment�
20.2%
� Annualized
225

E1C15 03/04/2010 Page 226
E1C16 03/04/2010 Page 227
CHAPTER 16
PRICING ANALYSIS
What Is the Lowest Price that I ShouldAccept?
A customer offers to buy product at a low price. Shoulda company accept the deal? The basic rule is that the low-est price is the one that at least covers all variable costs ofproduction, plus a small profit. Anything lower wouldcost a company money to produce and therefore wouldmake no economic sense. The main issue becomes the de-termination of what variable costs to include in the varia-ble cost calculation. Variable costs may include:
m Direct laborm Direct machine costsm Inventory carrying costsm Materialsm Ordering costsm Quality costs (testing, inspection, and rework)m Receiving costsm Scrap costs
The costs in this list are those that may vary directlywith production volume. Not every item will be consid-ered a variable cost at some companies; for example, if thepurchasing staff is unlikely to be laid off as a result of nottaking the customer order, the purchasing cost is probablynot a variable one; the same reasoning can be used to as-sume that the receiving costs and even the direct laborcosts are not really variable. Also, the direct machinecosts, such as for utilities and any volume-related mainte-nance or machine labor, still may be be incurred even ifthe order is not accepted, and so will not be called varia-ble. Given all these exceptions, it is apparent that theproduct’s list of variable costs may be quite small (possi-bly only the cost of materials), resulting in an equallysmall cost that must be covered by the customer’s price.
227
E1C16 03/04/2010 Page 228
There are two objections to the exclusion of overheadcosts from the pricing formula.
1. It may result in extremely low price points that willnot allow a company to cover all of its expenses,which results in a loss.
Over the long term, this is an accurate assess-ment. However, in the short term, if a company hasexcess production capacity available and can use it tosell additional product that generates throughput(sale minus totally variable costs), it should do so inorder to increase profits. If its production capacity isalready maximized, proposed sales having lowerthroughput levels than items already being manufac-tured should be rejected.
2. Traditional accounting holds that a small pro-posed order that requires a lengthy machinesetup should have the cost of that setup assignedto the product; if the additional cost results in aloss on the proposed transaction, the sale shouldbe rejected.
However, it is quite likely that a company’sexisting production capacity can absorb the costof the incremental setup without incurring anyadditional cost. Under this logic, if there is excessproduction capacity, setups are free. This ap-proach tends to result in a company offering amuch richer mix of order sizes and products to itscustomers, which can yield a greater marketshare. However, this concept must be used withcaution, for at some point the ability of the com-pany to continually set up small production jobswill maximize its capacity, at which point therewill be an incremental cost to adding more pro-duction jobs.
EXAMPLE
A customer of the Low-Ride Bicycle Company wantsto buy 1,000 bicycles from it, which it will sell in an-other country where it has recently opened a salesbranch. The customer wants Low-Ride to offer its bestpossible price for this deal. The manager of Low-Rideknows that the same offer is being made to the com-pany’s chief competitor, Easy-Glide Bicycles. Thecompany’s cost to create a bicycle in a lot size of 1,000units is shown next.
228 Pricing Analysis
E1C16 03/04/2010 Page 229
How Do I Set Long-Range Prices?
The pricing decisions just outlined for short-range situ-ations are ones that will bring a company to the brinkof bankruptcy if it uses them at all times, for they donot allow for a sufficient profit margin to pay for acompany’s overhead, not to mention the profit it needsin order to provide some return to investors on theircapital. Proper long-range pricing requires the consid-eration of several additional costs, which are listednext.
m Product-specific overhead costs. This is the overheadassociated with the production of a single unit ofproduction. This tends to be a very small cost cate-gory, for if a cost can be accurately identified down
Cost per Unit
Direct labor $13.50
Direct machine cost 20.17
Inventory carrying cost None
Materials 72.15
Ordering costs Fixed
Quality costs 3.02
Receiving costs Fixed
Scrap costs 7.22
Total Cost $116.06
The owner of Low-Ride has received the requestfor pricing at the slowest time of the production year,when he normally lays off several staff members. Hesees this as a golden opportunity to retain employees,which is more important to him than earning a profiton this order. Consequently, he can charge a price ofas little as $116.06 per bike, as derived in the preced-ing table, though this will leave him with no profit.He has recently hired the production manager awayfrom Easy-Glide Bicycles and knows that Easy-Glidehas a similar cost structure, except for 20% higherscrap costs. Accordingly, he knows that Easy-Glide’sminimum variable cost will be higher by $1.44. Thismeans that he can add $1.43 to his price and still belower than the competing price. Therefore, he quotes$117.49 per unit to the customer.
How Do I Set Long-Range Prices? 229
E1C16 03/04/2010 Page 230
to this level, it is considered to be a variable cost in-stead of a fixed one.
m Batch-specific overhead costs. A number of overheadcosts are accumulated at this level, such as the costof labor required to set up or break down a ma-chine for a batch of production, the utility cost re-quired to run machines for the duration of thebatch, the cost of materials handlers needed tomove components to the production area as wellas remove finished products from it, and an alloca-tion of the depreciation on all machinery used inthe process.
m Product line—specific overhead costs. A product linemay have associated with it the salary of a productmanager, a design team, a production supervisor,quality control personnel, customer service, distri-bution, advertising costs, and an ongoing invest-ment in inventory. All of these overhead costs canbe allocated to the products that are the end result ofthe overhead costs incurred.
m Facility-specific overhead costs. Production must takeplace somewhere, and the cost of that ‘‘some-where’’ should be allocated to the production lineshoused within it, usually based on the square foot-age taken up by the machines used in each produc-tion process. The costs of overhead in this categorycan include building depreciation, taxes, insur-ance, maintenance, and the cost of any mainte-nance staff.
The size of the markup added to the variable andfixed costs of a product should at least equal the targetrate of return. This rate is founded on a firm’s cost ofcapital, which is the blended cost of all debt and equitycurrently held. If the markup margin used is lower thanthis amount, a company will not be able to pay off debtor equity holders over the long term, thereby reducingthe value of the company and driving it towardbankruptcy.
EXAMPLE
To continue with the preceding example, if the Low-Ride Bicycle Company wants to determine its long-range bicycle price, it should include the additionalfactors noted in the next table, which covers all possi-ble fixed costs, plus a markup to cover its cost ofcapital.
230 Pricing Analysis
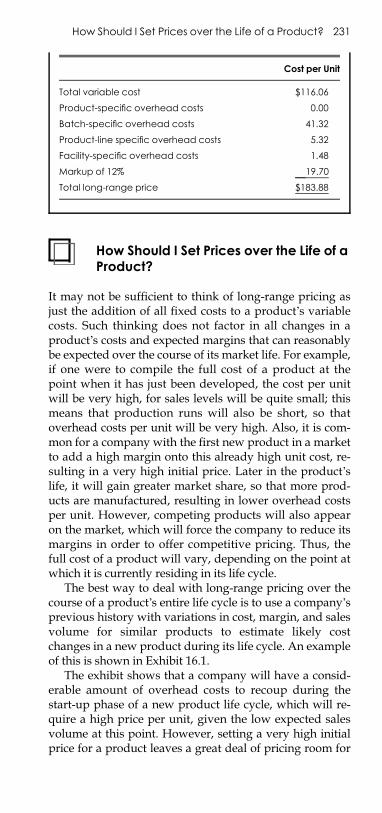
E1C16 03/04/2010 Page 231
How Should I Set Prices over the Life of aProduct?
It may not be sufficient to think of long-range pricing asjust the addition of all fixed costs to a product’s variablecosts. Such thinking does not factor in all changes in aproduct’s costs and expected margins that can reasonablybe expected over the course of its market life. For example,if one were to compile the full cost of a product at thepoint when it has just been developed, the cost per unitwill be very high, for sales levels will be quite small; thismeans that production runs will also be short, so thatoverhead costs per unit will be very high. Also, it is com-mon for a company with the first new product in a marketto add a high margin onto this already high unit cost, re-sulting in a very high initial price. Later in the product’slife, it will gain greater market share, so that more prod-ucts are manufactured, resulting in lower overhead costsper unit. However, competing products will also appearon the market, which will force the company to reduce itsmargins in order to offer competitive pricing. Thus, thefull cost of a product will vary, depending on the point atwhich it is currently residing in its life cycle.
The best way to deal with long-range pricing over thecourse of a product’s entire life cycle is to use a company’sprevious history with variations in cost, margin, and salesvolume for similar products to estimate likely costchanges in a new product during its life cycle. An exampleof this is shown in Exhibit 16.1.
The exhibit shows that a company will have a consid-erable amount of overhead costs to recoup during thestart-up phase of a new product life cycle, which will re-quire a high price per unit, given the low expected salesvolume at this point. However, setting a very high initialprice for a product leaves a great deal of pricing room for
Cost per Unit
Total variable cost $116.06
Product-specific overhead costs 0.00
Batch-specific overhead costs 41.32
Product-line specific overhead costs 5.32
Facility-specific overhead costs 1.48
Markup of 12% 19.70
Total long-range price $183.88
How Should I Set Prices over the Life of a Product? 231
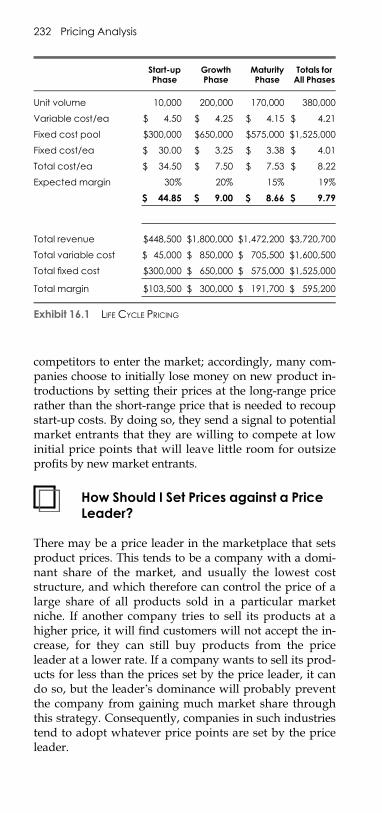
E1C16 03/04/2010 Page 232
competitors to enter the market; accordingly, many com-panies choose to initially lose money on new product in-troductions by setting their prices at the long-range pricerather than the short-range price that is needed to recoupstart-up costs. By doing so, they send a signal to potentialmarket entrants that they are willing to compete at lowinitial price points that will leave little room for outsizeprofits by new market entrants.
How Should I Set Prices against a PriceLeader?
There may be a price leader in the marketplace that setsproduct prices. This tends to be a company with a domi-nant share of the market, and usually the lowest coststructure, and which therefore can control the price of alarge share of all products sold in a particular marketniche. If another company tries to sell its products at ahigher price, it will find customers will not accept the in-crease, for they can still buy products from the priceleader at a lower rate. If a company wants to sell its prod-ucts for less than the prices set by the price leader, it cando so, but the leader’s dominance will probably preventthe company from gaining much market share throughthis strategy. Consequently, companies in such industriestend to adopt whatever price points are set by the priceleader.
Start-upPhase
GrowthPhase
MaturityPhase
Totals forAll Phases
Unit volume 10,000 200,000 170,000 380,000
Variable cost/ea $ 4.50 $ 4.25 $ 4.15 $ 4.21
Fixed cost pool $300,000 $650,000 $575,000 $1,525,000
Fixed cost/ea $ 30.00 $ 3.25 $ 3.38 $ 4.01
Total cost/ea $ 34.50 $ 7.50 $ 7.53 $ 8.22
Expected margin 30% 20% 15% 19%
$ 44.85 $ 9.00 $ 8.66 $ 9.79
Total revenue $448,500 $1,800,000 $1,472,200 $3,720,700
Total variable cost $ 45,000 $ 850,000 $ 705,500 $1,600,500
Total fixed cost $300,000 $ 650,000 $ 575,000 $1,525,000
Total margin $103,500 $ 300,000 $ 191,700 $ 595,200
Exhibit 16.1 LIFE CYCLE PRICING
232 Pricing Analysis
E1C16 03/04/2010 Page 233
How Do I Handle a Price War?
When there is too much production capacity in an indus-try and not enough available customer sales to use up thatcapacity, a common outcome is a price war, where onecompany lowers its prices in order to steal customersaway from a competitor, which in turn matches or re-duces these prices in order to retain its customers. Duringa price war, the only winner is the customer, who experi-ences greatly reduced prices; however, it is ruinous forcompanies that are slashing prices.
One way to avoid a price war is to analyze the per-ceived value of each feature of a company’s products inrelation to similar products produced by competitors. If acompany can clearly identify selected product featuresthat a competitor’s offerings do not contain, these featurescan be heavily promoted in order to raise the perceivedoverall value of the products in the eyes of customers,which allows a company to avoid a price war. A discern-ing competitor will be able to see this differentiation andmay realize that a price war will not work.
Another option is to conduct a competitive analysis ofthe company that is initiating a price war, to see if its coststructure will not allow it to cut prices to sustainable levelsthat are lower than what the company can support. If not,a rational pricing move is to briefly cut prices to levels be-low the variable cost of the competitor, thereby sending it aclear message that further price competition will put it outof business. This is a particularly effective approach if thecompetitor is outsourcing its production. If so, the entirecost of the outsourced product is variable, as opposed to amix of fixed and variable costs when production is kept inhouse. This gives an in-house manufacturer an advantageover an outsourced manufacturer, because the in-housemanufacturer has the option of not including fixed costs inits pricing calculations in the short run, whereas the out-sourced manufacturer has no fixed costs to exclude.
EXAMPLE
Companies A and B produce exactly the same product.Company A manufactures it in house and incurs a $10cost that is half fixed and half variable cost. Company B,however, outsources its production and must pay $10to its supplier for each unit it buys. This manufactur-ing scenario gives Company A a clear advantage over
(Continued)
How Do I Handle a Price War? 233
E1C16 03/04/2010 Page 234
Another strategy is to contact key customers and offerthem special long-term deals, which locks them into setpricing levels for what will presumably be the duration ofthe price war.
Another option is to create a new product or productline, with new features and market positioning, while let-ting the old product gradually be eliminated by a pricewar. By doing so, a company allows competitors to re-duce their margins to dangerous levels while it neatlysidesteps the entire problem by concentrating on a slightlydifferent market. The approach can also be reversed byleaving the price point of the old product alone and in-stead designing a new and much lower-cost product thatcan compete more effectively in a price war. Yet anothervariation is to design a new product that is sufficiently dif-ferent that customers are faced with an apples-to-orangescomparison of competing products; they cannot judgewhich competing product is the better value, and so theprice war never gets started.
If all of these options fail, the only alternative left is toparticipate in a price war. If this becomes necessary, thebest way to do so is to cut prices at the first hint of a pricewar, to set deeply discounted prices, and to do so withgreat fanfare. By taking this aggressive approach, compet-itors will know that a company is serious about its partici-pation in a price war and that it intends to pursue the waruntil all other competitors back off.
How Do I Handle Dumping by a ForeignCompetitor?
A U.S. industry can experience a severe drop in sales ifa competitor located in a foreign country imports com-peting goods into the United States at extremely lowprices. This is known as dumping. When this occurs, aninjured U.S. company can sue the competitor directly orcan bring the issue to the attention of the Federal TradeCommission, which is empowered under the Federal
(Continued)Company B in the event of a price war, for CompanyA can slash its price down to its variable cost of $5,whereas B can only drop prices to its variable cost of$10. Thus, the type of manufacturing system used hasa direct bearing on the competitive positioning ofcompanies that are locked in a price war.
234 Pricing Analysis
E1C16 03/04/2010 Page 235
Trade Commission Act to investigate and increase importduties to a sufficient level to erase the pricing advantage.A company can recover three times its proven damages ifit wins such a lawsuit.
To prove a dumping allegation, the litigant must provethat the foreign competitor is selling at a lower price in theUnited States than it is selling in its other markets, afterfactoring in the cost of transporting the goods to theUnited States. The litigant must also prove that the pricingactivity is intended to destroy or injure competition.
When Is Transfer Pricing Important?
Many organizations sell their own products internally—from one division to another. Each division sells its prod-ucts to a downstream division that includes those prod-ucts in its own production processes. When this happens,management must determine the prices at which compo-nents will be sold between divisions. This is known astransfer pricing. It is most common in vertically integratedcompanies, where each division in succession produces acomponent that is a necessary part of the product beingcreated by the next division in line. Any incorrect transferpricing can cause considerable dysfunctional purchasingbehavior.
How Do Transfer Prices Alter CorporateDecision Making?
A company must set its transfer prices at levels that willresult in the highest possible levels of profits, not for indi-vidual divisions but rather for the entire organization. Forexample, if a transfer price is set at a product’s cost, theselling division would rather not sell the product at all,even though the buying division can sell it externally for aprofit that more than makes up for the lack of profit expe-rienced by the division that originally sold it the product.The typical division manager will select the product salesthat result in the highest level of profit only for his or herdivision, since the manager has no insight (or interest) inthe financial results of the rest of the organization. Onlyby finding some way for the selling division to also realizea profit will a company have an incentive to sell its prod-ucts internally, thereby resulting in greater overall profits.
An example of such a solution is when a selling divisioncreates a by-product that it cannot sell but that another di-vision can use as an input for the products it manufactures.
Transfer Prices 235
E1C16 03/04/2010 Page 236
The selling division scraps the by-product, because it hasno incentive to do anything else with it. However, by as-signing the selling division a small profit on sale of the by-product, it now has an incentive to ship it to the buyingdivision. Such a pricing strategy assists a company in de-riving the greatest possible profit from all of its activities.
Another factor is that the amount of profit allocated toa division through the transfer pricing method used willimpact its reported level of profitability and therefore theperformance review for that division and its managementteam. If the management team is compensated in largepart through performance-based bonuses, its actions willbe heavily influenced by the profit it can earn on inter-company transfers. For example, an excessively low trans-fer price will result in low production priority for thatitem, as long as the selling division has some other prod-uct available that it can sell for a greater profit.
Finally, altering the transfer price used can have a dra-matic impact on the amount of income taxes a companypays, if it has divisions located in different countries thatuse different tax rates.
Companies that are frequent users of transfer pricingmust create prices that are based on a proper balance ofthe goals of overall company profitability, divisional per-formance evaluation, and (in some cases) the reduction ofincome taxes. The attainment of all these goals by using asingle transfer pricing method should not be expected.Instead, focus on the attainment of the most critical goals,while keeping the adverse affects of not meeting othergoals at a minimum. This process may result in the useof several transfer pricing methods, depending on the cir-cumstances surrounding each interdivisional transfer.
How Does the External Market PriceWork as a Transfer PricingMethod?
The most commonly used transfer pricing technique isbased on the existing external market price. Under this ap-proach, the selling division matches its transfer price tothe current market rate. By doing so, a company canachieve four goals:
1. Maximize profits. A company can achieve the highestpossible corporate-wide profit. This happens becausethe selling division can earn just as much profit byselling all of its production outside of the company as
236 Pricing Analysis
E1C16 03/04/2010 Page 237
it can by doing so internally—there is no reason forusing a transfer price that results in incorrect behaviorof either selling externally at an excessively low priceor selling internally when a better deal could havebeen obtained by selling externally.
2. Profit center structure. Using the market price allowsa division to earn a profit on its sales, no matterwhether it sells internally or externally. By avoidingall transfers at cost, the senior management groupcan structure its divisions as profit centers, therebyallowing it to determine the performance of each di-vision manager.
3. Simplified information sources. The market price is sim-ple to obtain—it can be taken from regulated pricesheets, posted prices, or quoted prices, and applied di-rectly to all sales. No complicated calculations are re-quired, and arguments over the correct price to chargebetween divisions are kept to a minimum.
4. Outside shopping. A market-based transfer priceallows both buying and selling divisions to shopanywhere they want to buy or sell their products.For example, a buying division will be indifferent asto where it obtains its supplies, for it can buy them atthe same price, whether that source is a fellow com-pany division or not. This leads to a minimum of in-correct buying and selling behavior that wouldotherwise be driven by transfer prices that do not re-flect market conditions.
However, market prices are not always available. Thishappens when the products being transferred do notexactly match those sold on the market, or if they are inter-mediate-level products that have not yet been convertedinto final products, so there is no market price available forthem. Another problem with market-based pricing is thatthere must truly be an alternative for a selling division tosell its entire production externally. This is a common prob-lem for specialty products, where the number of potentialbuyers is small, and their annual buying needs are limitedin size. A final issue is that market-based pricing can drivedivisions to sell their production outside of the company.
How Does Adjusted Market Pricing Workas a Transfer Pricing Method?
Adjusted market pricing involves price setting in order tosimplify transfer prices and adjust for the absence ofsales-related costs. For example, if market prices vary
Adjusted Market Pricing 237
E1C16 03/04/2010 Page 238
considerably by the unit volume ordered, there may be abroad range of transfer prices in use, which can be verycomplicated to track. A single adjusted market price canbe used instead, which is based on the average shipmentor order size. If a buying division turns out to have pur-chased in significantly different quantities from the onesthat were assumed at the time prices were set, a com-pany can retroactively adjust transfer prices at the end ofthe year; or it can leave the pricing alone and let the divi-sions do a better job of planning their interdivisionaltransfer volumes in the next year. As another example,there should be no bad debts when selling between divi-sions, as opposed to the occasional losses incurred whendealing with outside firms; accordingly, this cost can bededucted from the transfer price. The same argumentcan be made for the sales staff, whose services are pre-sumably not required for interdepartmental sales. How-ever, these price adjustments are subject to negotiation,so more aggressive division managers are more likely toresist reductions from their market-based prices whilethose managing the buying divisions will push hard forexcessively large price deductions. The result may bepricing anomalies that do not yield the optimum profitfor the company as a whole.
How Do Negotiated Transfer Prices Workas a Transfer Pricing Method?
The managers of buying and selling divisions can negoti-ate a transfer price between themselves, using a product’svariable cost as the lower boundary of an acceptable nego-tiated price and the market price (if one is available) as theupper boundary. The price that is agreed on, as long as itfalls between these two boundaries, should give someprofit to each division, with more profit going to the divi-sion with better negotiating skills. The method has the ad-vantage of allowing division managers to operate theirbusinesses in a more independent manner, not relying onpreset pricing. It also results in better performance evalua-tions for those managers with greater negotiation skills.However, it also suffers from these flaws:
m Suboptimal behavior. If the negotiated price exces-sively favors one division over another, the losingdivision will search outside the company for a betterdeal on the open market and will direct its sales andpurchases in that direction; this may result in sub-optimal company-wide profitability levels.
238 Pricing Analysis
E1C16 03/04/2010 Page 239
m Negotiation time. The negotiation process can take upa substantial proportion of a manager’s time, notleaving enough for other management activities.This is a particular problem if prices require constantrenegotiation.
m Brokered deals. Interdivisional conflicts over negoti-ated prices can become so severe that the problem iskicked up corporate headquarters, which must stepin and set prices that the divisions are incapable ofdetermining by themselves.
For all these reasons, the negotiated transfer price isa method that is generally relegated to special or low-volume pricing situations.
How Does the Contribution Margin Workas a Transfer Pricing Method?
What if there is no market price at all for a product? Acompany then has no basis for creating a transfer pricefrom any external source of information, so it must use in-ternal information instead. One approach is to createtransfer prices based on a product’s contribution margin.Under this pricing system, a company determines the to-tal contribution margin earned after a product is soldexternally and allocates this margin back to each division,based on their respective proportions of the total productcost. There are several good reasons for using this ap-proach, which:
m Converts a cost center into a profit center. By using thismethod to assign profits to internal product sales,divisional managers are forced to pay stricter atten-tion to their profitability, which helps the overallprofitability of the organization.
m Encourages divisions to work together. When everysupplying division shares in the margin when aproduct is sold, it stands to reason that it will bemuch more eager to work together to achieve profit-able sales rather than bickering over the transferprices to be charged internally. Also, any profit im-provements that can be brought about only bychanges that span several divisions are much morelikely to receive general approval and cooperationunder this pricing method, since the changes will in-crease profits for all divisions.
These arguments make the contribution marginapproach popular as a secondary transfer pricing
Contribution Margin Work 239
E1C16 03/04/2010 Page 240
method, after the market price approach. Despite itsuseful attributes, there are a number of issues with itthat a company must guard against in order to avoidbehavior by divisions that will lead to less-than-optimal overall levels of profitability. The contribu-tion margin approach:
m Can increase assigned profits by increasing costs. Whenthe contribution margin is assigned based on a divi-sion’s relative proportion of total product costs, thedivisions will realize that they will receive a greatershare of the profits if they can increase their overallproportion of costs.
m Must share cost reductions. If a division finds a way toreduce its costs, it will receive an increased share ofthe resulting profits that is in proportion to its shareof the total contribution margin distributed. Forexample, if Division A’s costs are 20% of a product’stotal costs and Division B’s share is 80%, then 80%of a $1 cost reduction achieved by Division A willbe allocated to Division B, even though it has donenothing to deserve the increase in margin.
m Requires the involvement of the corporate headquartersstaff. The contribution margin allocation must be cal-culated by somebody, and since the divisions allhave a profit motive to skew the allocation in theirfavor, the only party left that can make the allocationis the headquarters staff. This may increase the costof corporate overhead.
m Results in arguments. When costs and profits can beskewed by the system, there will inevitably be argu-ments between the buying and selling divisions,which the corporate headquarters team may have tomediate. These issues detract from an organization’sfocus on profitability.
The contribution margin approach is not a perfect one,but it does give companies a reasonably understandableand workable method for determining transfer prices. It hasmore problems than market-based pricing but can be usedas an alternative or as the primary approach if there is noway to obtain market pricing for transferred products.
How Does the Cost-Plus Method Work asa Transfer Pricing Method?
The cost-plus approach is an alternative when there is nomarket from which to determine a transfer price. Thismethod is based on its name—just accumulate a product’s
240 Pricing Analysis
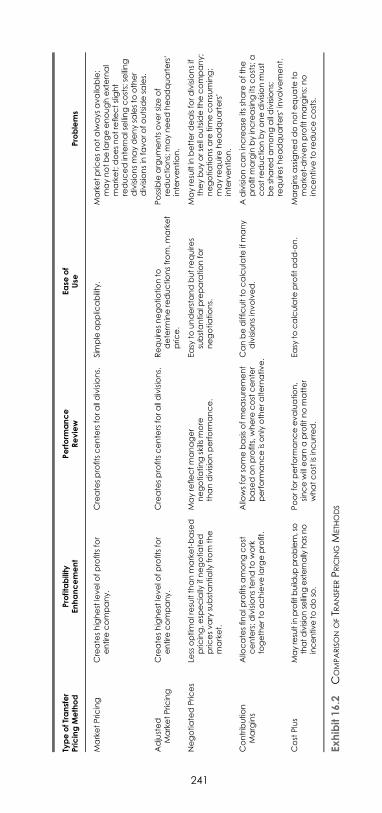
E1C16 03/04/2010 Page 241
TypeofTransfer
PricingMethod
Profitability
Enhancement
Perform
ance
Review
Ease
of
Use
Problems
MarketPric
ing
Createshighestlevelo
fprofitsfor
entire
company.
Createsprofitscentersforalldivisions.
Simple
applic
ability.
Marketpric
esnotalw
aysavaila
ble;
maynotbelargeenoughexternal
market;doesnotrefle
ctslight
reducedinternalsellingcosts;se
lling
divisionsmaydenysa
lesto
other
divisionsin
favorofoutsidesa
les.
Adjusted
MarketPric
ing
Createshighestlevelo
fprofitsfor
entire
company.
Createsprofitscentersforalldivisions.
Require
snegotiationto
determ
inereductionsfrom,m
arket
pric
e.
Possible
argumentsoversize
of
reductions;mayneedheadquarters’
intervention.
NegotiatedPric
es
Less
optimalresultthanmarket-base
dpric
ing,e
specially
ifnegotiated
pric
esvary
substantially
from
the
market.
Mayrefle
ctmanager
negotiatingskillsmore
thandivisionperform
ance.
Easy
toundersta
ndbutrequire
ssubstantialp
reparationfor
negotiations.
Mayresultin
betterdealsfordivisionsif
theybuyorse
lloutsidethecompany;
negotiationsare
timeconsuming;
mayrequire
headquarters’
intervention.
Contribution
Margins
Allo
catesfin
alp
rofitsamongcost
centers;d
ivisionstendto
work
togetherto
achievelargeprofit.
Allo
wsforso
mebasisofmeasurement
base
donprofits,where
costcenter
perform
anceisonlyotheralternative.C
anbedifficultto
calculate
ifmany
divisionsinvolved.
Adivisioncanincrease
itsshare
ofthe
profit
margin
byincreasingitscosts;a
costreductionbyonedivisionmust
besharedamongalldivisions;
require
sheadquarters’involvement.
CostPlus
Mayresultinprofit
build
upproblem,so
thatdivisionsellin
gexternally
hasno
incentiv
eto
doso.
Poorforperform
anceevaluation,
sincewillearn
aprofit
nomatter
whatcostisincurred.
Easy
tocalculate
profit
add-on.
Marginsassigneddonotequate
tomarket-driv
enprofit
margins;no
incentiveto
reducecosts.
Exhibit16.2
COMPARISON
OFTR
ANSFERPRIC
INGM
ETH
ODS
241
E1C16 03/04/2010 Page 242
full cost and add a standard margin percentage to thecost; this is the transfer price. This approach has the singu-lar advantage of being very easy to understand and calcu-late, and can convert a cost center into a profit center,which may be useful for evaluating the performance of adivision manager.
This method’s flaw is that the margin percentageadded to a product’s full cost may have no relationship tothe margin that would actually be used if the productwere to be sold externally. If a number of successive divi-sions were to add a standard margin to their products, theprice paid by the final division in line—the one that mustsell the completed product externally—may be so highthat there is no room for its own margin, which gives it noincentive to sell the product. Because of this issue, thecost-plus method is not recommended in most situations.
How Do the Transfer Pricing MethodsCompare to Each Other?
A comparison of all the transfer pricing methods just dis-cussed is noted in Exhibit 16.2, which notes each approach’sproblems, ease of use, and applicability to profitabilityenhancement and divisional performance reviews.
242 Pricing Analysis
E1C17 03/04/2010 Page 243
CHAPTER 17
COST REDUCTION ANALYSIS
What Reports Are Used for CostReduction Projects?
A cost reduction analysis project should start with a gen-eral overview of the target area that results in a graphicalpresentation of potential cost reductions. The format inExhibit 17.1 shows the potential cost reduction impact ofnumerous projects across the bottom axis and implemen-tation difficulty on the vertical axis. Cost reductions in thelower right corner are low-hanging fruit that generatesignificant returns in exchange for a modest effort. Con-versely, items in the upper left corner require a great dealof effort and produce minimal returns. This format is agood guideline for deciding which projects to address firstand which can safely be delayed.
In the exhibit, the commission restructuring in the up-per left corner is projected to have such a low paybackand high difficulty of implementation that it is not worthdoing, whereas the procurement card program is highlyworthwhile, since it has the reverse characteristics.
A variation on the cost reduction payoff matrix is onethat itemizes a number of additional factors, such as therisk of project failure, implementation duration, and levelof support. If any prospective project has a high risk scorein any category, the project manager should either con-sider alternative projects or work on risk mitigation strate-gies. A sample risk matrix is shown in Exhibit 17.2. In theexhibit, the riskiest project appears to be the office merger,which contains three high-risk scores, while the singleMRO (maintenance, repair, and operations) distributoroption is the safest, with four low-risk scores.
Exhibits 17.1 and 17.2 provide only an overview ofpotential cost reduction projects. The next step in an orga-nized cost reduction system is to generate greater detailregarding potential reductions. The format is shown in
243
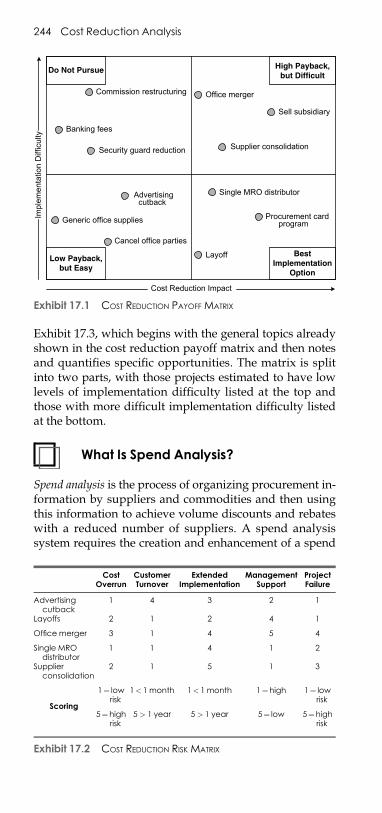
E1C17 03/04/2010 Page 244
Exhibit 17.3, which begins with the general topics alreadyshown in the cost reduction payoff matrix and then notesand quantifies specific opportunities. The matrix is splitinto two parts, with those projects estimated to have lowlevels of implementation difficulty listed at the top andthose with more difficult implementation difficulty listedat the bottom.
What Is Spend Analysis?
Spend analysis is the process of organizing procurement in-formation by suppliers and commodities and then usingthis information to achieve volume discounts and rebateswith a reduced number of suppliers. A spend analysissystem requires the creation and enhancement of a spend
Cost Reduction Impact
Impl
emen
tatio
n D
iffic
ulty
BestImplementation
Option
Do Not Pursue
Low Payback,but Easy
High Payback,but Difficult
Banking fees
Commission restructuring
Layoff
Office merger
Sell subsidiary
Advertising cutback
Supplier consolidation
Single MRO distributor
Generic office supplies Procurement card program
Security guard reduction
Cancel office parties
Exhibit 17.1 COST REDUCTION PAYOFF MATRIX
CostOverrun
CustomerTurnover
ExtendedImplementation
ManagementSupport
ProjectFailure
Advertisingcutback
1 4 3 2 1
Layoffs 2 1 2 4 1
Office merger 3 1 4 5 4
Single MROdistributor
1 1 4 1 2
Supplierconsolidation
2 1 5 1 3
Scoring
1¼ lowrisk
1< 1 month 1< 1 month 1¼high 1¼ lowrisk
5¼highrisk
5 > 1 year 5 > 1 year 5¼ low 5¼highrisk
Exhibit 17.2 COST REDUCTION RISK MATRIX
244 Cost Reduction Analysis
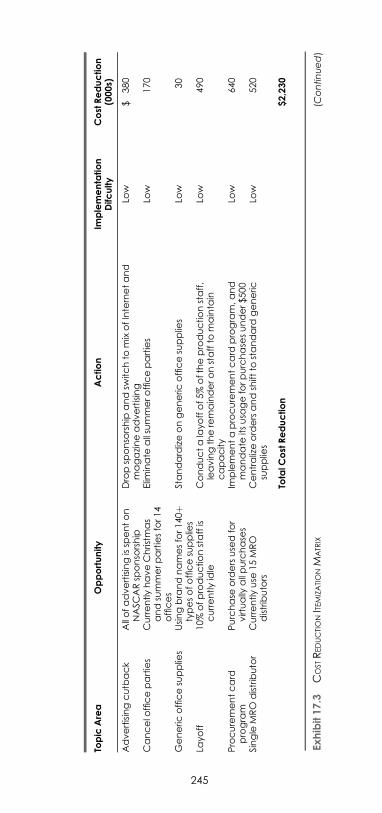
E1C17 03/04/2010 Page 245
Topic
Area
Opportunity
Action
Implementation
Difc
ulty
CostReduction
(000s)
Advertisingcutb
ack
Allofadvertisingissp
enton
NASC
ARsp
onso
rship
Dropsp
onso
rship
andsw
itchto
mixofInternetand
magazineadvertising
Low
$380
Cancelo
fficeparties
CurrentlyhaveChristm
as
andsummerpartiesfor14
offices
Elim
inate
allsummerofficeparties
Low
170
Generic
officesupplie
sUsingbrandnamesfor140þ
typesofofficesupplie
sStandardizeongeneric
officesupplie
sLo
w30
Layoff
10%
ofproductionstaffis
currentlyidle
Conductalayoffof5%
oftheproductionstaff,
leavingtheremainderonstaffto
mainta
incapacity
Low
490
Procurementcard
program
Purchase
ordersuse
dfor
virtually
allpurchase
sIm
plementaprocurementcard
program,and
mandate
itsusa
geforpurchase
sunder$500
Low
640
Single
MRO
distributor
Currentlyuse
15MRO
distributors
Centralizeordersandshift
tostandard
generic
supplie
sLo
w520
TotalC
ostReduction
$2,230
(Continued)
Exhibit17.3
COSTREDUCTIONITEMIZATIONM
ATR
IX
245
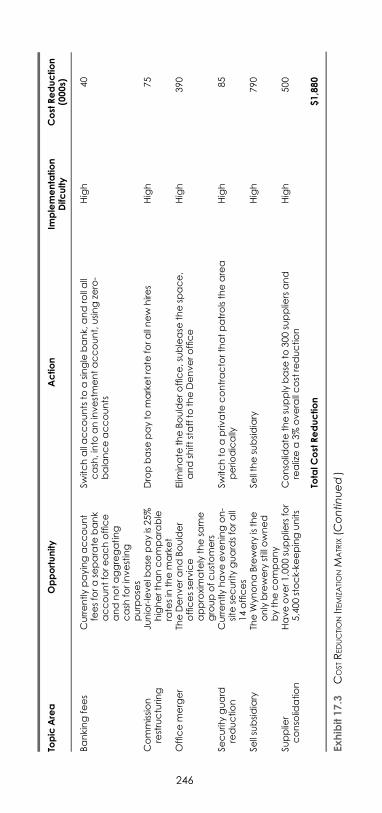
E1C17 03/04/2010 Page 246
Bankingfees
Currentlypayingaccount
feesforase
parate
bank
accountforeachoffice
andnotaggregating
cash
forinvesting
purpose
s
Switchallaccountsto
asingle
bank,
androllall
cash,into
aninvestmentaccount,usingze
ro-
balanceaccounts
High
40
Commission
restructurin
gJu
nior-levelb
ase
payis25%
higherthancomparable
ratesin
themarket
Dropbase
payto
marketrate
forallnew
hire
sHigh
75
Officemerger
TheDenverandBoulder
officesse
rvice
approximatelythesa
me
groupofcustomers
Elim
inate
theBoulderoffice,sublease
thesp
ace,
andshift
staffto
theDenveroffice
High
390
Securityguard
reduction
Currentlyhaveeveningon-
site
securityguardsforall
14offices
Switchto
apriv
ate
contractorthatpatrolsthearea
perio
dically
High
85
Sellsubsidiary
TheWynonaBrewery
isthe
onlybrewery
stillowned
bythecompany
Sellthesubsidiary
High
790
Supplie
rconso
lidation
Haveover1,000supplie
rsfor
5,400stock-ke
epingunits
Conso
lidate
thesupplybase
to300supplie
rsand
realizea3%
overallcostreduction
High
500
TotalC
ostReduction
$1,880
Exhibit17.3
COSTREDUCTIONITEMIZATIONM
ATR
IX(C
ontinued)
Topic
Area
Opportunity
Action
Implementation
Difc
ulty
CostReduction
(000s)
246
E1C17 03/04/2010 Page 247
database as the source of a spend analysis, followed bythe gradual concentration of ordering volume with aselect group of suppliers; this is followed by continualefforts to monitor the company’s compliance with thenew system. This lengthy process can result in major costreductions.
How Is the Spend DatabaseConstructed?
The spend database is a highly organized cluster of filescontaining key information about what a company buys,how much it spends, and who it buys from. The databaseneeds input feeds from the procurement systems of everycompany subsidiary, which should be updated on at leasta quarterly basis. By aggregating all of this purchasing in-formation, a company can see cost-saving opportunities atthe corporate level that would not have been present atthe subsidiary level.
Next, the information must be cleansed and enriched.Cleansing is improving on and correcting the informationalready contained within a database, while enrichment isadding new information to the database. As an exampleof cleansing, the same supplier may be recorded under aslightly different name in the feeds coming from differentsubsidiaries, such as International Business Machines,IBM, and I.B.M. When this happens, it is difficult to deter-mine the amount of a company’s total spend with a spe-cific supplier. To fix the problem, the spend databaseshould link all of the name variations for a single supplierto a single parent-level supplier name. For example, IBMcould be used as the parent supplier name, and I.B.M.and International Business Machines are linked to it.
A considerable amount of cleansing may be requiredfor item descriptions. An identical item listed in the itemmaster records of five subsidiaries can easily have fivewildly different descriptions, and it can be very difficultto match them. One way to correct the situation is to loadsupplier part numbers and part descriptions into thespend database, so that a part number arriving through afeed from a subsidiary will automatically pull in the cor-rect part description.
Part of the database enrichment process includes add-ing commodity codes to each purchase. A commoditycode assigns a general spend category to a supplier. Thecompany can then aggregate purchase dollars for eachcommodity code to see where it is spending the bulk of its
How Is the Spend Database Constructed? 247
E1C17 03/04/2010 Page 248
money and use this information to negotiate volume pur-chase discounts with suppliers.
It may also be useful to enrich the spend database witha supplier credit rating. This information is periodicallyupdated through an input feed from a third-party creditrating agency. The spend analysis system then issues re-ports containing just those suppliers whose credit ratingsindicate that they are in financial difficulty, which thecompany uses to resource with different suppliers.
Another possible enrichment is to periodically updatethe spend database with the company’s in-house supplierratings. These ratings are useful for steering more worktoward those suppliers that consistently have high ratingson such issues as quality and on-time performance.
A fully loaded spend database is not usable unless ithas an excellent report writing package, since the abilityto drill down through the data is of paramount impor-tance to spend management. Consequently, the databaseshould be equipped with a report writer that can reporton information at multiple levels, including by subsidiary,commodity code, and geographic region.
How Does Supplier Consolidation Work?
The primary spend analysis strategy is to consolidatepurchases in order to increase buying volume with asmaller number of preferred suppliers. These consolida-tion activities should be based on the number of availablesuppliers and the dollar volume of goods purchased. Ifthere are few suppliers available, single sourcing inexchange for a cooperative approach to cost reductionmay be the only cost reduction strategy. However, ifthere are many suppliers available and the dollar volumeof purchased quantities is high, a company can engage ina global search for the lowest-cost provider or reverseauctions to bid down prices. If there are many suppliersbut dollar volumes are low, global sourcing is probablynot cost-effective, but sourcing through a single distribu-tor may yield the lowest overall cost. These options areshown in Exhibit 17.4.
If a company elects to follow a global sourcing strat-egy, this will yield the greatest cost reductions if productshave a very high labor content; international supplierstypically have access to labor rates far below those in thedomestic market. Global sourcing does not work as wellfor raw materials, since international suppliers probablyhave no better access to low-cost raw materials than do
248 Cost Reduction Analysis
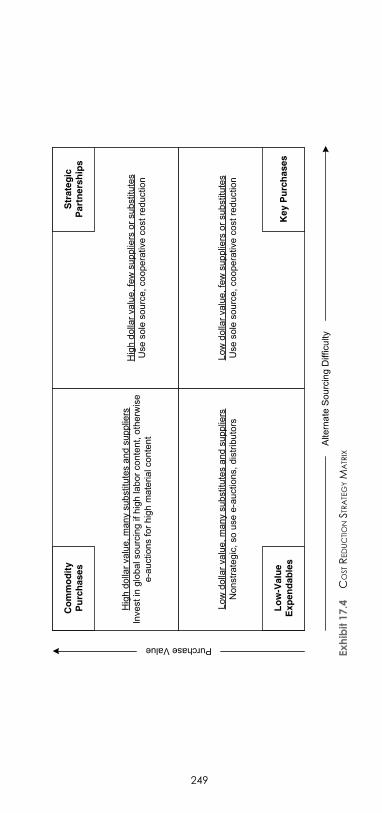
E1C17 03/04/2010 Page 249
Alte
rnat
e S
ourc
ing
Diff
icul
ty
Purchase Value
Key
Pu
rch
ases
Co
mm
od
ity
Pu
rch
ases
Lo
w-V
alu
eE
xpen
dab
les
Str
ateg
icP
artn
ersh
ips
Hig
h do
llar v
alue
, man
y su
bstit
utes
and
sup
plie
rsIn
vest
in g
loba
l sou
rcin
g if
high
labo
r con
tent
, oth
erw
ise
e-au
ctio
ns fo
r hig
h m
ater
ial c
onte
nt
Low
dol
lar v
alue
, man
y su
bstit
utes
and
sup
plie
rsN
onst
rate
gic,
so
use
e-au
ctio
ns, d
istri
buto
rs
Hig
h do
llar v
alue
, few
sup
plie
rs o
r sub
stitu
tes
Use
sol
e so
urce
, coo
pera
tive
cost
redu
ctio
n
Low
dol
lar v
alue
, few
sup
plie
rs o
r sub
stitu
tes
Use
sol
e so
urce
, coo
pera
tive
cost
redu
ctio
n
Exhibit17.4
COSTREDUCTIONST
RATEGYM
ATR
IX
249
E1C17 03/04/2010 Page 250
domestic suppliers (and must incur higher freight costs todeliver to the company).
As a company gradually shifts its business toward itspreferred suppliers, its spend analysis will focus on theremaining nonpreferred suppliers. This will be a sub-stantial list but one toward which an ever-shrinkingproportion of the company’s spend is directed. Themost cost-effective approach is to continually reviewthe highest-dollar commodities that have not yet beenaddressed, pick a preferred supplier within each one,and direct the bulk of the business in that commodity tothat supplier.
How Does Parts Consolidation Work?
Spend analysis highlights problems with parts duplica-tion. This issue arises when different subsidiaries useslightly different versions of the same parts. If the partsdescription fields in the spend database have been nor-malized so that descriptions are comparable, the spendanalysis team can spot opportunities for standardizing ona smaller number of parts. If essentially the same part iscoming from different suppliers, immediate consolidationof parts with a single supplier is possible. However, thisanalysis may also call for a longer-term solution, which isdesigning parts standardization into new versions of thecompany’s products. In the latter case, cost savings maytake years to realize.
Parts duplication analysis tends to be a distant secondeffort behind supplier consolidation, but it can providesignificant savings. For example, if a smaller firm canstandardize its parts, it can order the remaining parts ingreater volumes; its cost per unit may therefore decline tothe point where it can effectively compete on price againsta much larger competitor that has not taken advantage ofparts standardization. This effect comes from buying largequantities of a smaller number of items.
Can Spend Analysis Work for MROItems?
Maintenance, repair, and operations (MRO) items are typ-ically bought in great variety and very small quantities,which makes them difficult to consolidate for volume pur-chases. Instead, enroll the services of a distributor inexamining the company’s MRO purchases. The distribu-tor can recommend replacing stock-keeping units with
250 Cost Reduction Analysis
E1C17 03/04/2010 Page 251
less expensive ones, or which can be shipped at lowerfreight expense, or have lower support costs. The distribu-tor deals with these MRO items every day in much greatervolumes than the company does and so has greaterknowledge of cost effectiveness. Distributors will performthis service if the company consolidates its MRO pur-chases with them.
This is the single most important MRO cost reductioninitiative, because a company can essentially shift a largepart of its investigative labor to a third party.
What Is Spend Compliance?
The end result of spend analysis is a much greater concen-tration of a company’s spend with a much smaller num-ber of preferred suppliers. However, given the multitudeof locations from which a large corporation can initiatepurchases, and its ever-changing needs, it can be quite dif-ficult to keep this small and select supplier base from rap-idly expanding again, thereby diluting the effort of theoriginal spend analysis. There are a number of ways toimprove compliance with a completed spend analysisproject, which are:
m Contracts database. The foundation for spend compli-ance is to construct a database containing all con-tracts that the company has entered into with itsapproved suppliers. This database is used to matchsubsequent purchasing information against whatshould have been purchased through these key sup-pliers and the terms at which items were purchasedfrom them. As an example of how the contractsdatabase can be used, Contractor ABC has agreed toissue Smith Company a 2% rebate once Smith pur-chases 30,000 widgets from ABC. The companymatches its purchases against the contracts databaseand finds that Contractor ABC did not issue toSmith the rebate once the 30,000-unit threshold wassurpassed. Smith contacts ABC and extracts not onlythe rebate but also interest income for the delayedpayment.
m Incumbent rebates and discounts. The contracts data-base can be loaded immediately with any existingsupplier contracts; by doing so, and by matching itagainst the spend database, a company may realizean immediate benefit, which is that suppliers maynot have issued rebates and discounts based onexisting contracts and purchase volumes.
What Is Spend Compliance? 251
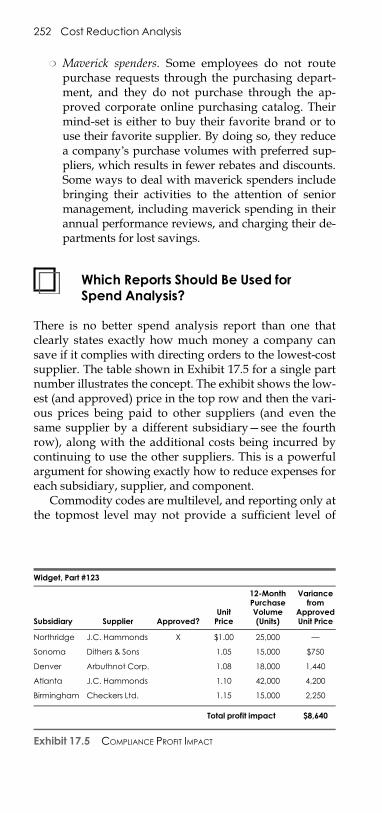
E1C17 03/04/2010 Page 252
m Maverick spenders. Some employees do not routepurchase requests through the purchasing depart-ment, and they do not purchase through the ap-proved corporate online purchasing catalog. Theirmind-set is either to buy their favorite brand or touse their favorite supplier. By doing so, they reducea company’s purchase volumes with preferred sup-pliers, which results in fewer rebates and discounts.Some ways to deal with maverick spenders includebringing their activities to the attention of seniormanagement, including maverick spending in theirannual performance reviews, and charging their de-partments for lost savings.
Which Reports Should Be Used forSpend Analysis?
There is no better spend analysis report than one thatclearly states exactly how much money a company cansave if it complies with directing orders to the lowest-costsupplier. The table shown in Exhibit 17.5 for a single partnumber illustrates the concept. The exhibit shows the low-est (and approved) price in the top row and then the vari-ous prices being paid to other suppliers (and even thesame supplier by a different subsidiary—see the fourthrow), along with the additional costs being incurred bycontinuing to use the other suppliers. This is a powerfulargument for showing exactly how to reduce expenses foreach subsidiary, supplier, and component.
Commodity codes are multilevel, and reporting only atthe topmost level may not provide a sufficient level of
Widget, Part #123
Subsidiary Supplier Approved?UnitPrice
12-MonthPurchaseVolume(Units)
Variancefrom
ApprovedUnit Price
Northridge J.C. Hammonds X $1.00 25,000 —
Sonoma Dithers & Sons 1.05 15,000 $750
Denver Arbuthnot Corp. 1.08 18,000 1,440
Atlanta J.C. Hammonds 1.10 42,000 4,200
Birmingham Checkers Ltd. 1.15 15,000 2,250
Total profit impact $8,640
Exhibit 17.5 COMPLIANCE PROFIT IMPACT
252 Cost Reduction Analysis
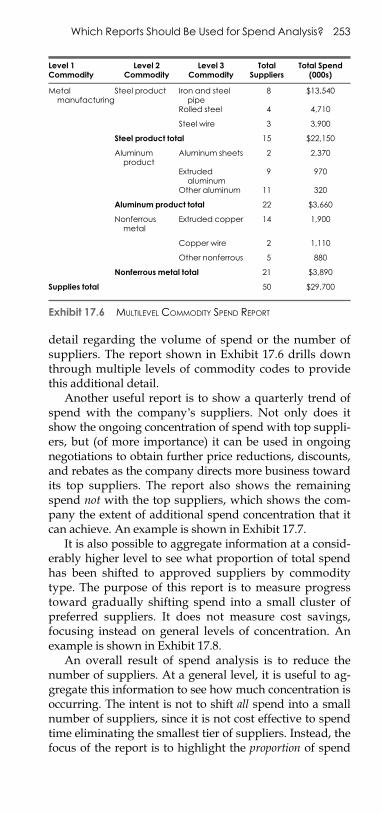
E1C17 03/04/2010 Page 253
detail regarding the volume of spend or the number ofsuppliers. The report shown in Exhibit 17.6 drills downthrough multiple levels of commodity codes to providethis additional detail.
Another useful report is to show a quarterly trend ofspend with the company’s suppliers. Not only does itshow the ongoing concentration of spend with top suppli-ers, but (of more importance) it can be used in ongoingnegotiations to obtain further price reductions, discounts,and rebates as the company directs more business towardits top suppliers. The report also shows the remainingspend not with the top suppliers, which shows the com-pany the extent of additional spend concentration that itcan achieve. An example is shown in Exhibit 17.7.
It is also possible to aggregate information at a consid-erably higher level to see what proportion of total spendhas been shifted to approved suppliers by commoditytype. The purpose of this report is to measure progresstoward gradually shifting spend into a small cluster ofpreferred suppliers. It does not measure cost savings,focusing instead on general levels of concentration. Anexample is shown in Exhibit 17.8.
An overall result of spend analysis is to reduce thenumber of suppliers. At a general level, it is useful to ag-gregate this information to see how much concentration isoccurring. The intent is not to shift all spend into a smallnumber of suppliers, since it is not cost effective to spendtime eliminating the smallest tier of suppliers. Instead, thefocus of the report is to highlight the proportion of spend
Level 1Commodity
Level 2Commodity
Level 3Commodity
TotalSuppliers
Total Spend(000s)
Metalmanufacturing
Steel product Iron and steelpipe
8 $13,540
Rolled steel 4 4,710
Steel wire 3 3,900
Steel product total 15 $22,150
Aluminumproduct
Aluminum sheets 2 2,370
Extrudedaluminum
9 970
Other aluminum 11 320
Aluminum product total 22 $3,660
Nonferrousmetal
Extruded copper 14 1,900
Copper wire 2 1,110
Other nonferrous 5 880
Nonferrous metal total 21 $3,890
Supplies total 50 $29,700
Exhibit 17.6 MULTILEVEL COMMODITY SPEND REPORT
Which Reports Should Be Used for Spend Analysis? 253
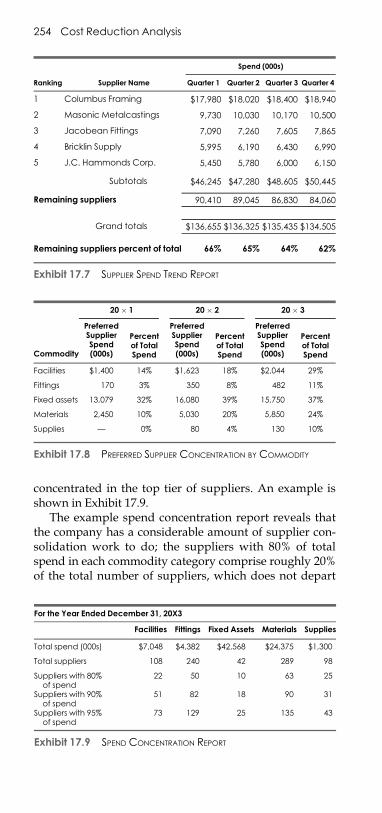
E1C17 03/04/2010 Page 254
concentrated in the top tier of suppliers. An example isshown in Exhibit 17.9.
The example spend concentration report reveals thatthe company has a considerable amount of supplier con-solidation work to do; the suppliers with 80% of totalspend in each commodity category comprise roughly 20%of the total number of suppliers, which does not depart
Spend (000s)
Ranking Supplier Name Quarter 1 Quarter 2 Quarter 3 Quarter 4
1 Columbus Framing $17,980 $18,020 $18,400 $18,940
2 Masonic Metalcastings 9,730 10,030 10,170 10,500
3 Jacobean Fittings 7,090 7,260 7,605 7,865
4 Bricklin Supply 5,995 6,190 6,430 6,990
5 J.C. Hammonds Corp. 5,450 5,780 6,000 6,150
Subtotals $46,245 $47,280 $48,605 $50,445
Remaining suppliers 90,410 89,045 86,830 84,060
Grand totals $136,655 $136,325 $135,435 $134,505
Remaining suppliers percent of total 66% 65% 64% 62%
Exhibit 17.7 SUPPLIER SPEND TREND REPORT
20 � 1 20 � 2 20 � 3
Commodity
PreferredSupplierSpend(000s)
Percentof TotalSpend
PreferredSupplierSpend(000s)
Percentof TotalSpend
PreferredSupplierSpend(000s)
Percentof TotalSpend
Facilities $1,400 14% $1,623 18% $2,044 29%
Fittings 170 3% 350 8% 482 11%
Fixed assets 13,079 32% 16,080 39% 15,750 37%
Materials 2,450 10% 5,030 20% 5,850 24%
Supplies — 0% 80 4% 130 10%
Exhibit 17.8 PREFERRED SUPPLIER CONCENTRATION BY COMMODITY
For the Year Ended December 31, 20X3
Facilities Fittings Fixed Assets Materials Supplies
Total spend (000s) $7,048 $4,382 $42,568 $24,375 $1,300
Total suppliers 108 240 42 289 98
Suppliers with 80%of spend
22 50 10 63 25
Suppliers with 90%of spend
51 82 18 90 31
Suppliers with 95%of spend
73 129 25 135 43
Exhibit 17.9 SPEND CONCENTRATION REPORT
254 Cost Reduction Analysis
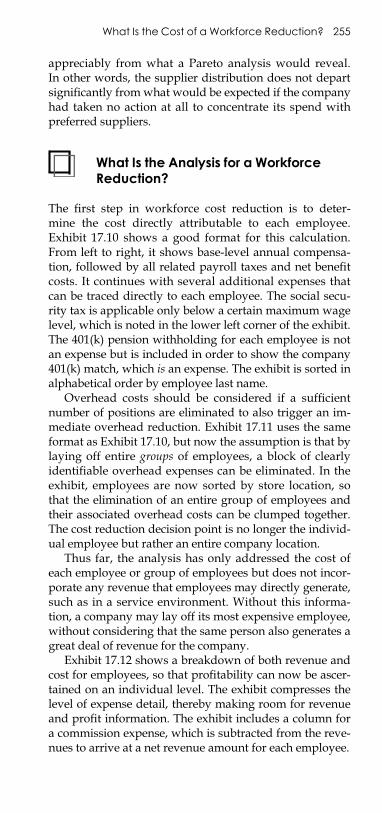
E1C17 03/04/2010 Page 255
appreciably from what a Pareto analysis would reveal.In other words, the supplier distribution does not departsignificantly from what would be expected if the companyhad taken no action at all to concentrate its spend withpreferred suppliers.
What Is the Analysis for a WorkforceReduction?
The first step in workforce cost reduction is to deter-mine the cost directly attributable to each employee.Exhibit 17.10 shows a good format for this calculation.From left to right, it shows base-level annual compensa-tion, followed by all related payroll taxes and net benefitcosts. It continues with several additional expenses thatcan be traced directly to each employee. The social secu-rity tax is applicable only below a certain maximum wagelevel, which is noted in the lower left corner of the exhibit.The 401(k) pension withholding for each employee is notan expense but is included in order to show the company401(k) match, which is an expense. The exhibit is sorted inalphabetical order by employee last name.
Overhead costs should be considered if a sufficientnumber of positions are eliminated to also trigger an im-mediate overhead reduction. Exhibit 17.11 uses the sameformat as Exhibit 17.10, but now the assumption is that bylaying off entire groups of employees, a block of clearlyidentifiable overhead expenses can be eliminated. In theexhibit, employees are now sorted by store location, sothat the elimination of an entire group of employees andtheir associated overhead costs can be clumped together.The cost reduction decision point is no longer the individ-ual employee but rather an entire company location.
Thus far, the analysis has only addressed the cost ofeach employee or group of employees but does not incor-porate any revenue that employees may directly generate,such as in a service environment. Without this informa-tion, a company may lay off its most expensive employee,without considering that the same person also generates agreat deal of revenue for the company.
Exhibit 17.12 shows a breakdown of both revenue andcost for employees, so that profitability can now be ascer-tained on an individual level. The exhibit compresses thelevel of expense detail, thereby making room for revenueand profit information. The exhibit includes a column fora commission expense, which is subtracted from the reve-nues to arrive at a net revenue amount for each employee.
What Is the Cost of a Workforce Reduction? 255
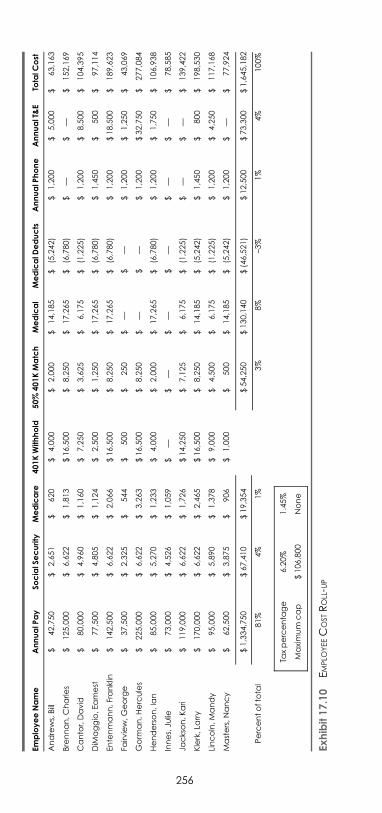
E1C17 03/04/2010 Page 256
EmployeeName
AnnualP
ay
SocialSecurity
Medicare
401KWithhold
50%
401KMatch
Medical
MedicalD
educts
AnnualP
hone
AnnualT&E
TotalC
ost
Andrews,Bill
$42,750
$2,651
$620
$4,000
$2,000
$14,185
$(5,242)
$1,200
$5,000
$63,163
Brennan,Charle
s$
125,000
$6,622
$1,813
$16,500
$8,250
$17,265
$(6,780)
$—
$—
$152,169
Cantor,David
$80,000
$4,960
$1,160
$7,250
$3,625
$6,175
$(1,225)
$1,200
$8,500
$104,395
DiM
aggio,E
amest
$77,500
$4,805
$1,124
$2,500
$1,250
$17,265
$(6,780)
$1,450
$500
$97,114
Entenmann,Franklin
$142,500
$6,622
$2,066
$16,500
$8,250
$17,265
$(6,780)
$1,200
$18,500
$189,623
Fairv
iew,George
$37,500
$2,325
$544
$500
$250
$—
$—
$1,200
$1,250
$43,069
Gorm
an,H
ercules
$225,000
$6,622
$3,263
$16,500
$8,250
$—
$—
$1,200
$32,750
$277,084
Henderson,Ian
$85,000
$5,270
$1,233
$4,000
$2,000
$17,265
$(6,780)
$1,200
$1,750
$106,938
Innes,Ju
lie$
73,000
$4,526
$1,059
$—
$—
$—
$—
$—
$—
$78,585
Jackson,K
ari
$119,000
$6,622
$1,726
$14,250
$7,125
$6,175
$(1,225)
$—
$—
$139,422
Klerk,La
rry
$170,000
$6,622
$2,465
$16,500
$8,250
$14,185
$(5,242)
$1,450
$800
$198,530
Lincoln,M
andy
$95,000
$5,890
$1,378
$9,000
$4,500
$6,175
$(1,225)
$1,200
$4,250
$117,168
Masters,N
ancy
$62,500
$3,875
$906
$1,000
$500
$14,185
$(5,242)
$1,200
$—
$77,924
$1,334,750
$67,410
$19,354
$54,250
$130,140
$(46,521)
$12,500
$73,300
$1,645,182
Percentoftota
l81%
4%
1%
3%
8%
–3%
1%
4%
100%
Taxpercenta
ge
6.20%
1.45%
Maximum
cap
$106,800
None
Exhibit17.10
EMPLO
YEEC
OSTROLL-U
P
256
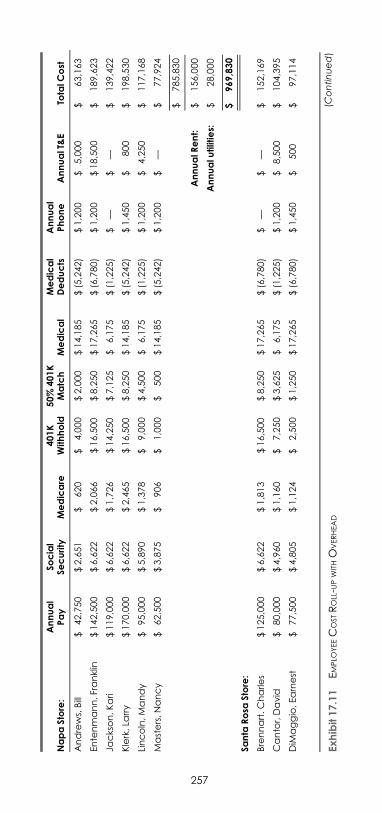
E1C17 03/04/2010 Page 257
NapaStore:
Annual
Pay
Social
Security
Medicare
401K
Withhold
50%
401K
Match
Medical
Medical
Deducts
Annual
Phone
AnnualT&E
TotalC
ost
Andrews,Bill
$42,750
$2,651
$620
$4,000
$2,000
$14,185
$(5,242)
$1,200
$5,000
$63,163
Entenmann,Franklin
$142,500
$6,622
$2,066
$16,500
$8,250
$17,265
$(6,780)
$1,200
$18,500
$189,623
Jackson,Kari
$119,000
$6,622
$1,726
$14,250
$7,125
$6,175
$(1,225)
$—
$—
$139,422
Klerk,La
rry
$170,000
$6,622
$2,465
$16,500
$8,250
$14,185
$(5,242)
$1,450
$800
$198,530
Lincoln,Mandy
$95,000
$5,890
$1,378
$9,000
$4,500
$6,175
$(1,225)
$1,200
$4,250
$117,168
Masters,Nancy
$62,500
$3,875
$906
$1,000
$500
$14,185
$(5,242)
$1,200
$—
$77,924
$785,830
AnnualR
ent:
$156,000
Annualu
tilities:
$28,000
$969,830
Santa
Rosa
Store:
Brennart.Charle
s$125,000
$6,622
$1,813
$16,500
$8,250
$17,265
$(6,780)
$—
$—
$152,169
Cantor,David
$80,000
$4,960
$1,160
$7,250
$3,625
$6,175
$(1,225)
$1,200
$8,500
$104,395
DiM
aggio,Earnest
$77,500
$4,805
$1,124
$2,500
$1,250
$17,265
$(6,780)
$1,450
$500
$97,114
(Continued)
Exhibit17.11
EMPLO
YEEC
OSTROLL-U
PWITHO
VERHEAD
257
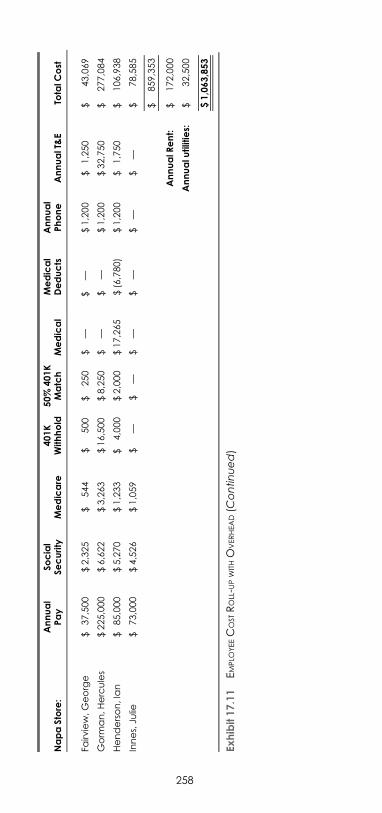
E1C17 03/04/2010 Page 258
Fairv
iew,George
$37,500
$2,325
$544
$500
$250
$—
$—
$1,200
$1,250
$43,069
Gorm
an,Hercules
$225,000
$6,622
$3,263
$16,500
$8,250
$—
$—
$1,200
$32,750
$277,084
Henderson,Ian
$85,000
$5,270
$1,233
$4,000
$2,000
$17,265
$(6,780)
$1,200
$1,750
$106,938
Innes,Ju
lie$
73,000
$4,526
$1,059
$—
$—
$—
$—
$—
$—
$78,585
$859,353
AnnualR
ent:
$172,000
Annualu
tilities:
$32,500
$1,063,853
Exhibit17.11
EMPLO
YEEC
OSTROLL-U
PWITHO
VERHEAD(C
ontinued)
NapaStore:
Annual
Pay
Social
Security
Medicare
401K
Withhold
50%
401K
Match
Medical
Medical
Deducts
Annual
Phone
AnnualT&E
TotalC
ost
258
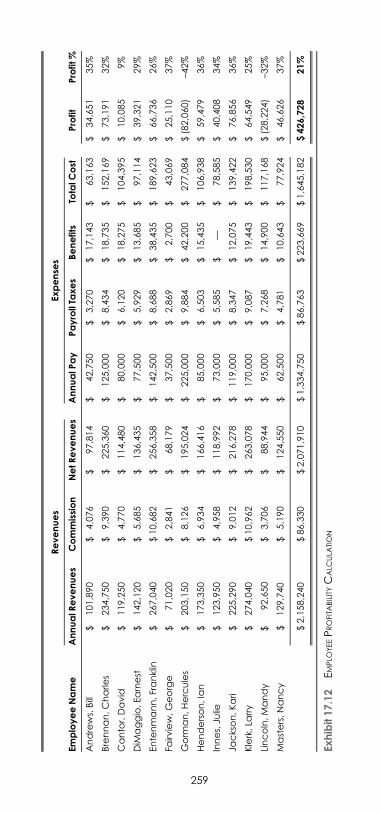
E1C17 03/04/2010 Page 259
Revenues
Expense
s
EmployeeName
AnnualR
evenues
Commission
NetRevenues
AnnualP
ay
PayrollTa
xes
Benefits
TotalC
ost
Profit
Profit
%
Andrews,Bill
$101,890
$4,076
$97,814
$42,750
$3,270
$17,143
$63,163
$34,651
35%
Brennan,Charle
s$
234,750
$9,390
$225,360
$125,000
$8,434
$18,735
$152,169
$73,191
32%
Cantor,David
$119,250
$4,770
$114,480
$80,000
$6,120
$18,275
$104,395
$10,085
9%
DiM
aggio,Earnest
$142,120
$5,685
$136,435
$77,500
$5,929
$13,685
$97,114
$39,321
29%
Entenmann,Franklin
$267,040
$10,682
$256,358
$142,500
$8,688
$38,435
$189,623
$66,736
26%
Fairv
iew,George
$71,020
$2,841
$68,179
$37,500
$2,869
$2,700
$43,069
$25,110
37%
Gorm
an,Hercules
$203,150
$8,126
$195,024
$225,000
$9,884
$42,200
$277,084
$(82,060)
–42%
Henderson,Ian
$173,350
$6,934
$166,416
$85,000
$6,503
$15,435
$106,938
$59,479
36%
Innes,Ju
lie$
123,950
$4,958
$118,992
$73,000
$5,585
$—
$78,585
$40,408
34%
Jackson,Kari
$225,290
$9,012
$216,278
$119,000
$8,347
$12,075
$139,422
$76,856
36%
Klerk,La
rry
$274,040
$10,962
$263,078
$170,000
$9,087
$19,443
$198,530
$64,549
25%
Lincoln,Mandy
$92,650
$3,706
$88,944
$95,000
$7,268
$14,900
$117,168
$(28,224)
–32%
Masters,Nancy
$129,740
$5,190
$124,550
$62,500
$4,781
$10,643
$77,924
$46,626
37%
$2,158,240
$86,330
$2,071,910
$1,334,750
$86,763
$223,669
$1,645,182
$426,728
21%
Exhibit17.12
EMPLO
YEEPROFITA
BILITYC
ALC
ULA
TION
259
E1C17 03/04/2010 Page 260
What Is the Cost of a WorkforceReduction?
A workforce reduction is designed to save money, but itmay do the reverse in the short term, since there are anumber of expenses associated with it. Here are severalexpenses to consider, followed by several ways to miti-gate them.
m Severance package. The most minimal severance pack-age is simply severance pay, but it can also include anumber of other costs, such as benefits continuation,the use of a company phone or computer, and out-placement services. Severance pay is typically linkedto the number of years of employee service, so thepayout can be severe if the workforce reduction in-cludes personnel with high seniority.
m Accrued vacation. If an employee has not used any por-tion of earned vacation, the company must pay it tothe employee at the time of the workforce reduction.
m Stock grant acceleration. If an employee is part of astock grant program, the program will likely havean award acceleration clause, where vesting in theshares is accelerated in the event of a change in con-trol of the company. If the employee is being laid offbecause of the change in control, it is likely that he orshe will receive the stock grant at termination. If so,the company must record a noncash expense at thetime of vesting to reflect the recognition of all re-maining expense associated with the stock grant.
m Unemployment insurance. If a company continuallylays off its employees, they in turn will draw down thestate’s unemployment fund, which the state govern-ment must replenish by increasing the company’s un-employment contribution rate in the following year.
m Potential lawsuits. There is always a risk that someemployees will sue the company for wrongful termi-nation. Even if there is no likelihood of a payout, thecompany must still pay legal fees to defend its posi-tion. To avoid this issue, make any severance pay-ment conditional upon employee agreement not filea claim against the company.
The severance and vacation expenses just describedcan be mitigated to some extent by paying them out basedon an average of an employee’s pay for the past few yearsrather than on the final pay level (which is presumablyhigher). This pay calculation should be fully documentedin the employee manual.
260 Cost Reduction Analysis
E1C17 03/04/2010 Page 261
What Are the Alternatives to aWorkforce Reduction?
Many companies try to avoid a workforce reduction.However, there are still prospects for reducing payrollcosts. The next techniques are still available.
m Review overtime pay. There should be a formal super-visory review of all overtime hours claimed, whichcan be triggered by an automated timekeeping sys-tem. Better yet, an analyst should review the reasonswhy the bulk of the overtime hours were incurredand see if there are any alternatives that can avoidthe future incurrence of this cost.
m Use vacation time. By encouraging its staff to takeunused vacation time, a company still incurs a cashoutflow to pay for the vacations, but this may alsosoak up a considerable amount of unused vacationtime, so that employees will be more available later,when they may be needed for revenue-generatingactivities.
m Delay new hires. If there is a reasonable expectationthat business will improve shortly, hold off on mak-ing offers to new hire candidates. If offers havealready been extended, consider delaying their startdates while paying them a stipend and movingexpenses.
m Attrition. The most noninvasive form of workforcereduction is simply to not replace employees whenthey retire or leave the company for other reasons.This is a long-term solution, since employee depar-tures may occur over quite a few years before a com-pany has reduced its headcount to its targeted level.
m Delay or reduce scheduled pay raises. If a medium-termbusiness downturn is expected, management canauthorize a significant delay in scheduled pay raisesor reduce the amount of raises that will be granted.This approach should be shared by all, to gainacceptance.
m Require unpaid days off. There may be cases where oc-casional unpaid days off for the entire workforcewill resolve financial difficulties. If so, reduce thesting for employees by allowing them to pick whichdays to take off. For example, the days off may co-incide with school vacations or be adjacent to federalholidays.
m Shorten the workweek. If there is not enough work fora large part of the company, the company can elect
What Are the Alternatives to a Workforce Reduction? 261
E1C17 03/04/2010 Page 262
to shorten the workweek for some period of time,with reduced pay to match the shorter work period.This alternative works best for a single-day reduc-tion from a five-day to a four-day work week, sincethe result is a 20% pay cut for everyone in thecompany.
m Shorten working hours. In a retail environment, it maymake sense to determine when the bulk of custom-ers are shopping and contract store hours to match.
m Use unpaid leaves of absence. An unpaid leave ofabsence only encourages employees to look for newjobs and so will likely result in a very high turnoverlevel in the near term. However, if the companyoffers to continue paying benefits to employees dur-ing their leaves of absence, they may be more in-clined to stay out of work longer and still return tothe company at the end of their leaves.
m Offer paid sabbaticals. If the business downturn isexpected to be extensive, management can offer asabbatical with a moderate rate of pay to thoseemployees judged to have sufficient seniority. Theamount paid can be viewed as a retainer for consult-ing services, which the company can exercise byoccasionally calling in employees on sabbatical toassist during high-volume periods.
m Freeze pay. The workforce may accept a completepay freeze for a limited period of time, if employeesunderstand that the situation is caused by economicconditions that put the company at risk. This ap-proach works best if everyone is included in the payfreeze.
m Implement a pay cut. A more drastic alternative is tomandate a pay cut. If implemented, this should beuniversal, so that no charges of favoritism can belevied. Further, the pay cut should be even greaterfor the management team, which creates a solid rea-son for the management group to work the com-pany back into profitability.
If the company enacts either a shorter workweek orfewer working hours during the business day, this willalso reduce the amount of vacation and sick hoursaccrued, so there is a cumulative cost reduction effect.
How Does 5S Analysis Reduce Costs?
The 5S system is about organizing the workplace in orderto eliminate waste. From a cost reduction perspective, it
262 Cost Reduction Analysis
E1C17 03/04/2010 Page 263
promotes workplace efficiency. As the name of this toolimplies, there are five steps, and their names all beginwith the letter s. They are:
1. Sort. Review all of the items within a work area; re-tain those needed for daily operations, and disposeof all other items.
2. Straighten. Reposition furniture and equipment tobest serve the process flow, and move all other itemsout of the way.
3. Scrub. Clean the area completely.4. Systematize. Establish schedules for repetitively
cleaning the area.5. Standardize. Incorporate the 5S system into standard
company operations, so that it is performed on anongoing basis. This should include a formal systemfor monitoring the results of the program.
A company should not embark on a total 5S cleansweep of an entire company all at the same time, sincethat would create a great deal of disruption. Instead, thisis a methodical process that is used to gradually addressall locations, after which it starts over again in a continu-ous cycle.
How Are Check Sheets Used?
The check sheet is a structured form used for the collectionand analysis of data. Its most common application is forthe collection of data about the frequency or patterns ofevents. Data entry on the form is designed to be as simpleas possible, with check marks or similar symbols. Thecheck sheet is used most frequently in a production set-ting but can be easily applied anywhere in a company.
For example, what if the controller is trying to increasethe efficiency of the cash application process? Her firststep is to determine the frequency of various issues im-pacting the process, so that she can focus her efforts onefficiency improvement. She discusses the project withthe cash application staff and uses their input to constructthe check sheet shown in Exhibit 17.13. The cash applica-tion staff fills it in during a one-week period, resulting inthe determination that unauthorized payment deductionsare the most frequent problem encountered during cashapplication, followed by missing remittance detail infor-mation. This information can be used to prioritize effi-ciency improvement (and the resulting cost reduction)activities.
How Are Check Sheets Used? 263
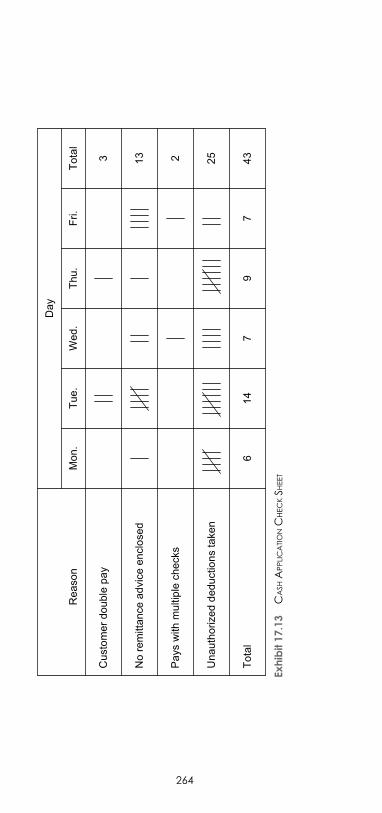
E1C17 03/04/2010 Page 264
Rea
son
Day
Mon
.Tu
e.W
ed.
Thu.
Fri.
Tota
l
Cus
tom
er d
oubl
e pa
y
No
rem
ittan
ce a
dvic
e en
clos
ed
Pay
s w
ith m
ultip
le c
heck
s
Una
utho
rized
ded
uctio
ns ta
ken
Tota
l
3 13 2 25 437
97
146
Exhibit17.13
CASH
APPLICATIONC
HECKSH
EET
264
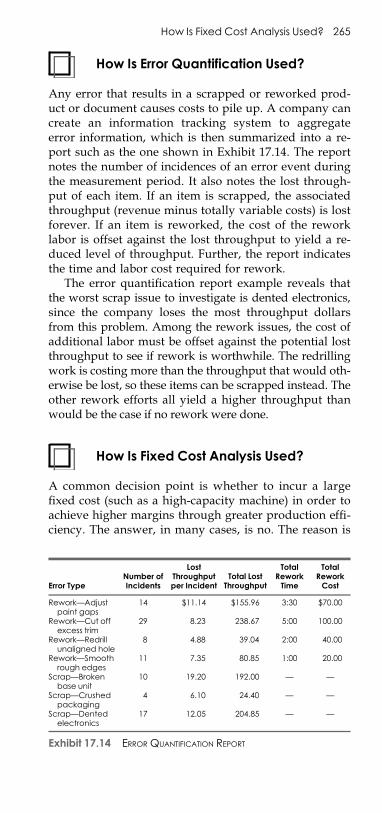
E1C17 03/04/2010 Page 265
How Is Error Quantification Used?
Any error that results in a scrapped or reworked prod-uct or document causes costs to pile up. A company cancreate an information tracking system to aggregateerror information, which is then summarized into a re-port such as the one shown in Exhibit 17.14. The reportnotes the number of incidences of an error event duringthe measurement period. It also notes the lost through-put of each item. If an item is scrapped, the associatedthroughput (revenue minus totally variable costs) is lostforever. If an item is reworked, the cost of the reworklabor is offset against the lost throughput to yield a re-duced level of throughput. Further, the report indicatesthe time and labor cost required for rework.
The error quantification report example reveals thatthe worst scrap issue to investigate is dented electronics,since the company loses the most throughput dollarsfrom this problem. Among the rework issues, the cost ofadditional labor must be offset against the potential lostthroughput to see if rework is worthwhile. The redrillingwork is costing more than the throughput that would oth-erwise be lost, so these items can be scrapped instead. Theother rework efforts all yield a higher throughput thanwould be the case if no rework were done.
How Is Fixed Cost Analysis Used?
A common decision point is whether to incur a largefixed cost (such as a high-capacity machine) in order toachieve higher margins through greater production effi-ciency. The answer, in many cases, is no. The reason is
Error TypeNumber ofIncidents
LostThroughputper Incident
Total LostThroughput
TotalReworkTime
TotalReworkCost
Rework—Adjustpaint gaps
14 $11.14 $155.96 3:30 $70.00
Rework—Cut offexcess trim
29 8.23 238.67 5:00 100.00
Rework—Redrillunaligned hole
8 4.88 39.04 2:00 40.00
Rework—Smoothrough edges
11 7.35 80.85 1:00 20.00
Scrap—Brokenbase unit
10 19.20 192.00 — —
Scrap—Crushedpackaging
4 6.10 24.40 — —
Scrap—Dentedelectronics
17 12.05 204.85 — —
Exhibit 17.14 ERROR QUANTIFICATION REPORT
How Is Fixed Cost Analysis Used? 265
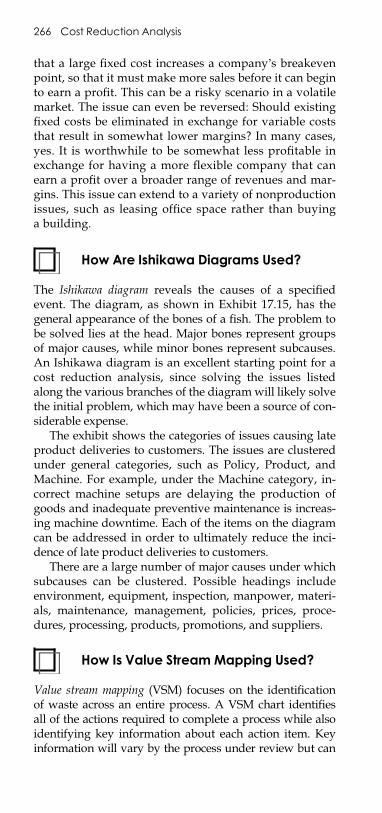
E1C17 03/04/2010 Page 266
that a large fixed cost increases a company’s breakevenpoint, so that it must make more sales before it can beginto earn a profit. This can be a risky scenario in a volatilemarket. The issue can even be reversed: Should existingfixed costs be eliminated in exchange for variable coststhat result in somewhat lower margins? In many cases,yes. It is worthwhile to be somewhat less profitable inexchange for having a more flexible company that canearn a profit over a broader range of revenues and mar-gins. This issue can extend to a variety of nonproductionissues, such as leasing office space rather than buyinga building.
How Are Ishikawa Diagrams Used?
The Ishikawa diagram reveals the causes of a specifiedevent. The diagram, as shown in Exhibit 17.15, has thegeneral appearance of the bones of a fish. The problem tobe solved lies at the head. Major bones represent groupsof major causes, while minor bones represent subcauses.An Ishikawa diagram is an excellent starting point for acost reduction analysis, since solving the issues listedalong the various branches of the diagram will likely solvethe initial problem, which may have been a source of con-siderable expense.
The exhibit shows the categories of issues causing lateproduct deliveries to customers. The issues are clusteredunder general categories, such as Policy, Product, andMachine. For example, under the Machine category, in-correct machine setups are delaying the production ofgoods and inadequate preventive maintenance is increas-ing machine downtime. Each of the items on the diagramcan be addressed in order to ultimately reduce the inci-dence of late product deliveries to customers.
There are a large number of major causes under whichsubcauses can be clustered. Possible headings includeenvironment, equipment, inspection, manpower, materi-als, maintenance, management, policies, prices, proce-dures, processing, products, promotions, and suppliers.
How Is Value Stream Mapping Used?
Value stream mapping (VSM) focuses on the identificationof waste across an entire process. A VSM chart identifiesall of the actions required to complete a process while alsoidentifying key information about each action item. Keyinformation will vary by the process under review but can
266 Cost Reduction Analysis
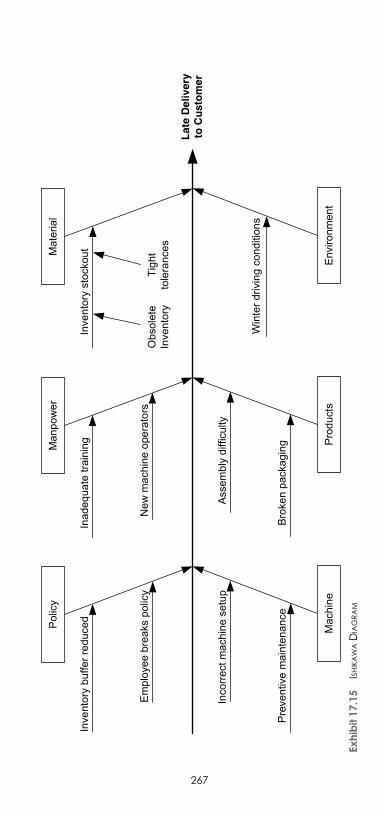
E1C17 03/04/2010 Page 267
Lat
e D
eliv
ery
to C
ust
om
er
Mat
eria
lM
anpo
wer
Pol
icy
Env
ironm
ent
Pro
duct
sM
achi
ne
Inve
ntor
y st
ocko
utIn
adeq
uate
trai
ning
New
mac
hine
ope
rato
rsTi
ght
tole
ranc
esO
bsol
ete
Inve
ntor
y
Pre
vent
ive
mai
nten
ance
Inco
rrec
t mac
hine
set
up
Win
ter d
rivin
g co
nditi
ons
Inve
ntor
y bu
ffer r
educ
ed
Em
ploy
ee b
reak
s po
licy
Ass
embl
y di
fficu
lty
Bro
ken
pack
agin
g
Exhibit17.15
ISHIKAWAD
IAGRAM
267
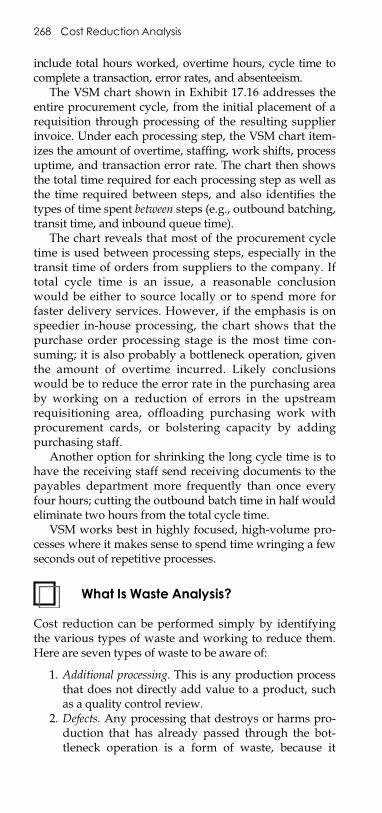
E1C17 03/04/2010 Page 268
include total hours worked, overtime hours, cycle time tocomplete a transaction, error rates, and absenteeism.
The VSM chart shown in Exhibit 17.16 addresses theentire procurement cycle, from the initial placement of arequisition through processing of the resulting supplierinvoice. Under each processing step, the VSM chart item-izes the amount of overtime, staffing, work shifts, processuptime, and transaction error rate. The chart then showsthe total time required for each processing step as well asthe time required between steps, and also identifies thetypes of time spent between steps (e.g., outbound batching,transit time, and inbound queue time).
The chart reveals that most of the procurement cycletime is used between processing steps, especially in thetransit time of orders from suppliers to the company. Iftotal cycle time is an issue, a reasonable conclusionwould be either to source locally or to spend more forfaster delivery services. However, if the emphasis is onspeedier in-house processing, the chart shows that thepurchase order processing stage is the most time con-suming; it is also probably a bottleneck operation, giventhe amount of overtime incurred. Likely conclusionswould be to reduce the error rate in the purchasing areaby working on a reduction of errors in the upstreamrequisitioning area, offloading purchasing work withprocurement cards, or bolstering capacity by addingpurchasing staff.
Another option for shrinking the long cycle time is tohave the receiving staff send receiving documents to thepayables department more frequently than once everyfour hours; cutting the outbound batch time in half wouldeliminate two hours from the total cycle time.
VSM works best in highly focused, high-volume pro-cesses where it makes sense to spend time wringing a fewseconds out of repetitive processes.
What Is Waste Analysis?
Cost reduction can be performed simply by identifyingthe various types of waste and working to reduce them.Here are seven types of waste to be aware of:
1. Additional processing. This is any production processthat does not directly add value to a product, suchas a quality control review.
2. Defects. Any processing that destroys or harms pro-duction that has already passed through the bot-tleneck operation is a form of waste, because it
268 Cost Reduction Analysis
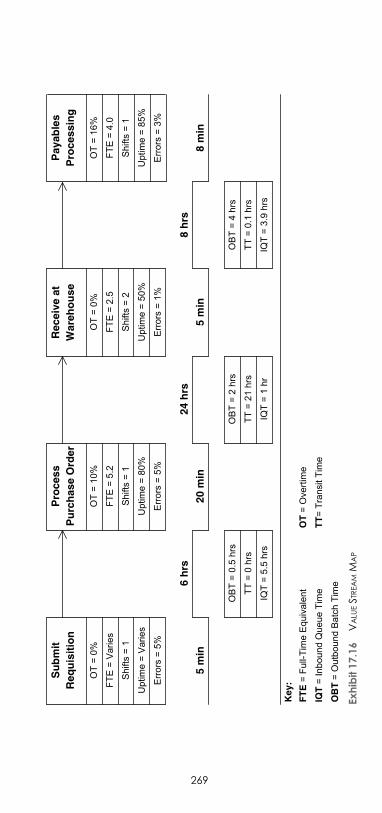
E1C17 03/04/2010 Page 269
OT
= 0%
OT
= 10
%O
T =
0%O
T =
16%
FTE
= V
arie
sFT
E =
5.2
FTE
= 2
.5FT
E =
4.0
Shi
fts =
1S
hifts
= 1
Shi
fts =
2S
hifts
= 1
Upt
ime
= V
arie
sU
ptim
e =
80%
Upt
ime
= 50
%U
ptim
e =
85%
Err
ors
= 5%
Err
ors
= 5%
Err
ors
= 1%
Err
ors
= 3%
6 h
rs24
hrs
8 h
rs
5 m
in20
min
5 m
in8
min
OB
T =
0.5
hrs
OB
T =
2 hr
sO
BT
= 4
hrs
TT =
0 h
rsTT
= 2
1 hr
sTT
= 0
.1 h
rs
IQT
= 5.
5 hr
sIQ
T =
1 hr
IQT
= 3.
9 hr
s
Key
:
FT
E =
Ful
l-Tim
e E
quiv
alen
tO
T =
Ove
rtim
e
IQT
= In
boun
d Q
ueue
Tim
eT
T=
Tran
sit T
ime
OB
T =
Out
boun
d B
atch
Tim
e
Su
bm
itR
equ
isit
ion
Pro
cess
Pu
rch
ase
Ord
erR
ecei
ve a
tW
areh
ou
seP
ayab
les
Pro
cess
ing
Exhibit17.16
VALU
EST
REAMM
AP
269
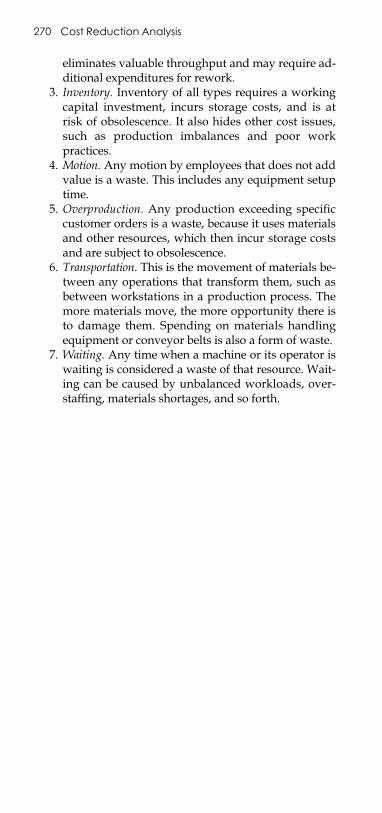
E1C17 03/04/2010 Page 270
eliminates valuable throughput and may require ad-ditional expenditures for rework.
3. Inventory. Inventory of all types requires a workingcapital investment, incurs storage costs, and is atrisk of obsolescence. It also hides other cost issues,such as production imbalances and poor workpractices.
4. Motion. Any motion by employees that does not addvalue is a waste. This includes any equipment setuptime.
5. Overproduction. Any production exceeding specificcustomer orders is a waste, because it uses materialsand other resources, which then incur storage costsand are subject to obsolescence.
6. Transportation. This is the movement of materials be-tween any operations that transform them, such asbetween workstations in a production process. Themore materials move, the more opportunity there isto damage them. Spending on materials handlingequipment or conveyor belts is also a form of waste.
7. Waiting. Any time when a machine or its operator iswaiting is considered a waste of that resource. Wait-ing can be caused by unbalanced workloads, over-staffing, materials shortages, and so forth.
270 Cost Reduction Analysis
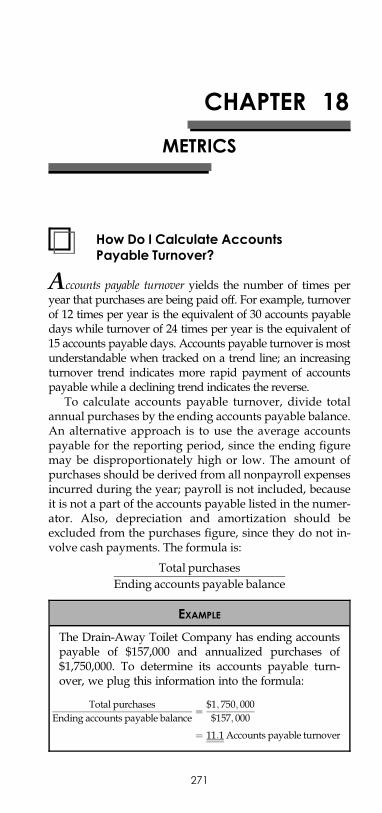
E1C18 03/04/2010 Page 271
CHAPTER 18
METRICS
How Do I Calculate AccountsPayable Turnover?
Accounts payable turnover yields the number of times peryear that purchases are being paid off. For example, turnoverof 12 times per year is the equivalent of 30 accounts payabledays while turnover of 24 times per year is the equivalent of15 accounts payable days. Accounts payable turnover is mostunderstandable when tracked on a trend line; an increasingturnover trend indicates more rapid payment of accountspayable while a declining trend indicates the reverse.
To calculate accounts payable turnover, divide totalannual purchases by the ending accounts payable balance.An alternative approach is to use the average accountspayable for the reporting period, since the ending figuremay be disproportionately high or low. The amount ofpurchases should be derived from all nonpayroll expensesincurred during the year; payroll is not included, becauseit is not a part of the accounts payable listed in the numer-ator. Also, depreciation and amortization should beexcluded from the purchases figure, since they do not in-volve cash payments. The formula is:
Total purchasesEnding accounts payable balance
EXAMPLE
The Drain-Away Toilet Company has ending accountspayable of $157,000 and annualized purchases of$1,750,000. To determine its accounts payable turn-over, we plug this information into the formula:
Total purchasesEnding accounts payable balance
¼ $1; 750; 000$157; 000
¼ 11:1 Accounts payable turnover
271
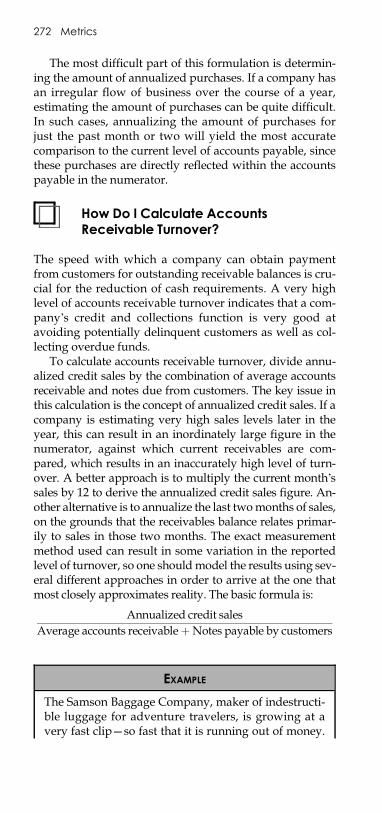
E1C18 03/04/2010 Page 272
The most difficult part of this formulation is determin-ing the amount of annualized purchases. If a company hasan irregular flow of business over the course of a year,estimating the amount of purchases can be quite difficult.In such cases, annualizing the amount of purchases forjust the past month or two will yield the most accuratecomparison to the current level of accounts payable, sincethese purchases are directly reflected within the accountspayable in the numerator.
How Do I Calculate AccountsReceivable Turnover?
The speed with which a company can obtain paymentfrom customers for outstanding receivable balances is cru-cial for the reduction of cash requirements. A very highlevel of accounts receivable turnover indicates that a com-pany’s credit and collections function is very good atavoiding potentially delinquent customers as well as col-lecting overdue funds.
To calculate accounts receivable turnover, divide annu-alized credit sales by the combination of average accountsreceivable and notes due from customers. The key issue inthis calculation is the concept of annualized credit sales. If acompany is estimating very high sales levels later in theyear, this can result in an inordinately large figure in thenumerator, against which current receivables are com-pared, which results in an inaccurately high level of turn-over. A better approach is to multiply the current month’ssales by 12 to derive the annualized credit sales figure. An-other alternative is to annualize the last twomonths of sales,on the grounds that the receivables balance relates primar-ily to sales in those two months. The exact measurementmethod used can result in some variation in the reportedlevel of turnover, so one shouldmodel the results using sev-eral different approaches in order to arrive at the one thatmost closely approximates reality. The basic formula is:
Annualized credit salesAverage accounts receivableþNotes payable by customers
EXAMPLE
The Samson Baggage Company, maker of indestructi-ble luggage for adventure travelers, is growing at avery fast clip—so fast that it is running out of money.
272 Metrics
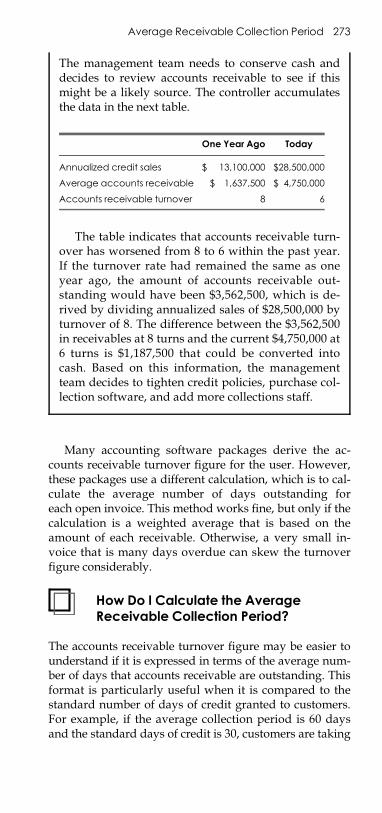
E1C18 03/04/2010 Page 273
Many accounting software packages derive the ac-counts receivable turnover figure for the user. However,these packages use a different calculation, which is to cal-culate the average number of days outstanding foreach open invoice. This method works fine, but only if thecalculation is a weighted average that is based on theamount of each receivable. Otherwise, a very small in-voice that is many days overdue can skew the turnoverfigure considerably.
How Do I Calculate the AverageReceivable Collection Period?
The accounts receivable turnover figure may be easier tounderstand if it is expressed in terms of the average num-ber of days that accounts receivable are outstanding. Thisformat is particularly useful when it is compared to thestandard number of days of credit granted to customers.For example, if the average collection period is 60 daysand the standard days of credit is 30, customers are taking
The management team needs to conserve cash anddecides to review accounts receivable to see if thismight be a likely source. The controller accumulatesthe data in the next table.
One Year Ago Today
Annualized credit sales $ 13,100,000 $28,500,000
Average accounts receivable $ 1,637,500 $ 4,750,000
Accounts receivable turnover 8 6
The table indicates that accounts receivable turn-over has worsened from 8 to 6 within the past year.If the turnover rate had remained the same as oneyear ago, the amount of accounts receivable out-standing would have been $3,562,500, which is de-rived by dividing annualized sales of $28,500,000 byturnover of 8. The difference between the $3,562,500in receivables at 8 turns and the current $4,750,000 at6 turns is $1,187,500 that could be converted intocash. Based on this information, the managementteam decides to tighten credit policies, purchase col-lection software, and add more collections staff.
Average Receivable Collection Period 273
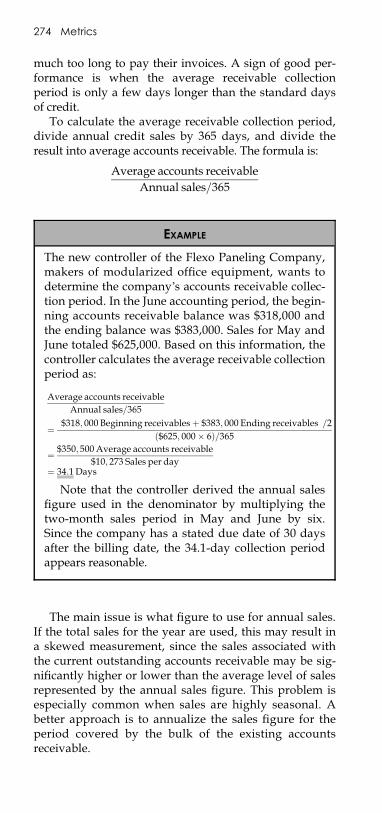
E1C18 03/04/2010 Page 274
much too long to pay their invoices. A sign of good per-formance is when the average receivable collectionperiod is only a few days longer than the standard daysof credit.
To calculate the average receivable collection period,divide annual credit sales by 365 days, and divide theresult into average accounts receivable. The formula is:
Average accounts receivableAnnual sales=365
The main issue is what figure to use for annual sales.If the total sales for the year are used, this may result ina skewed measurement, since the sales associated withthe current outstanding accounts receivable may be sig-nificantly higher or lower than the average level of salesrepresented by the annual sales figure. This problem isespecially common when sales are highly seasonal. Abetter approach is to annualize the sales figure for theperiod covered by the bulk of the existing accountsreceivable.
EXAMPLE
The new controller of the Flexo Paneling Company,makers of modularized office equipment, wants todetermine the company’s accounts receivable collec-tion period. In the June accounting period, the begin-ning accounts receivable balance was $318,000 andthe ending balance was $383,000. Sales for May andJune totaled $625,000. Based on this information, thecontroller calculates the average receivable collectionperiod as:
Average accounts receivableAnnual sales=365
¼ $318; 000 Beginning receivablesþ $383; 000 Ending receivables� �
=2ð$625; 000� 6Þ=365
¼ $350; 500 Average accounts receivable$10; 273 Sales per day
¼ 34:1 Days
Note that the controller derived the annual salesfigure used in the denominator by multiplying thetwo-month sales period in May and June by six.Since the company has a stated due date of 30 daysafter the billing date, the 34.1-day collection periodappears reasonable.
274 Metrics
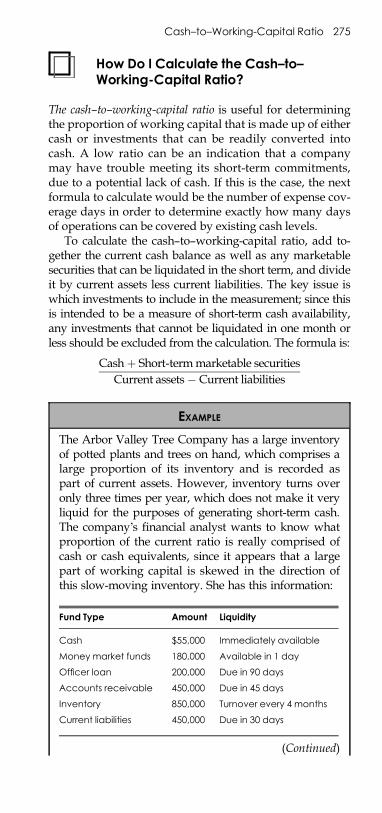
E1C18 03/04/2010 Page 275
How Do I Calculate the Cash–to–Working-Capital Ratio?
The cash–to–working-capital ratio is useful for determiningthe proportion of working capital that is made up of eithercash or investments that can be readily converted intocash. A low ratio can be an indication that a companymay have trouble meeting its short-term commitments,due to a potential lack of cash. If this is the case, the nextformula to calculate would be the number of expense cov-erage days in order to determine exactly how many daysof operations can be covered by existing cash levels.
To calculate the cash–to–working-capital ratio, add to-gether the current cash balance as well as any marketablesecurities that can be liquidated in the short term, and divideit by current assets less current liabilities. The key issue iswhich investments to include in the measurement; since thisis intended to be a measure of short-term cash availability,any investments that cannot be liquidated in one month orless should be excluded from the calculation. The formula is:
Cashþ Short-termmarketable securitiesCurrent assets� Current liabilities
EXAMPLE
The Arbor Valley Tree Company has a large inventoryof potted plants and trees on hand, which comprises alarge proportion of its inventory and is recorded aspart of current assets. However, inventory turns overonly three times per year, which does not make it veryliquid for the purposes of generating short-term cash.The company’s financial analyst wants to know whatproportion of the current ratio is really comprised ofcash or cash equivalents, since it appears that a largepart of working capital is skewed in the direction ofthis slow-moving inventory. She has this information:
Fund Type Amount Liquidity
Cash $55,000 Immediately available
Money market funds 180,000 Available in 1 day
Officer loan 200,000 Due in 90 days
Accounts receivable 450,000 Due in 45 days
Inventory 850,000 Turnover every 4 months
Current liabilities 450,000 Due in 30 days
(Continued)
Cash–to–Working-Capital Ratio 275
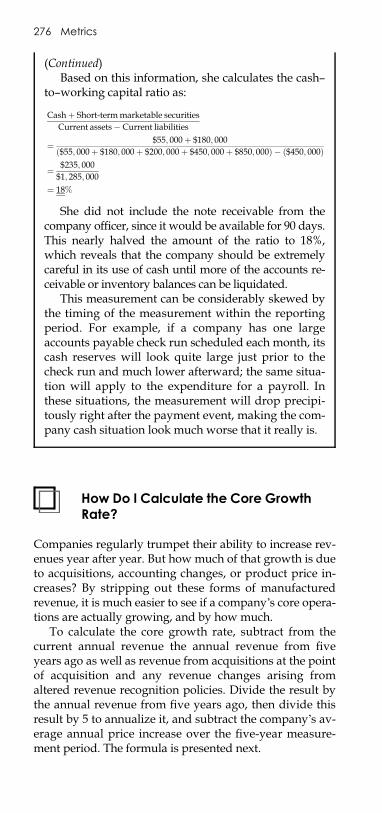
E1C18 03/04/2010 Page 276
How Do I Calculate the Core GrowthRate?
Companies regularly trumpet their ability to increase rev-enues year after year. But how much of that growth is dueto acquisitions, accounting changes, or product price in-creases? By stripping out these forms of manufacturedrevenue, it is much easier to see if a company’s core opera-tions are actually growing, and by how much.
To calculate the core growth rate, subtract from thecurrent annual revenue the annual revenue from fiveyears ago as well as revenue from acquisitions at the pointof acquisition and any revenue changes arising fromaltered revenue recognition policies. Divide the result bythe annual revenue from five years ago, then divide thisresult by 5 to annualize it, and subtract the company’s av-erage annual price increase over the five-year measure-ment period. The formula is presented next.
(Continued)Based on this information, she calculates the cash–
to–working capital ratio as:
Cashþ Short-termmarketable securitiesCurrent assets� Current liabilities
¼ $55; 000þ $180; 000ð$55; 000þ $180; 000þ $200; 000þ $450; 000þ $850; 000Þ � ð$450; 000Þ
¼ $235; 000$1; 285; 000
¼ 18%
She did not include the note receivable from thecompany officer, since it would be available for 90 days.This nearly halved the amount of the ratio to 18%,which reveals that the company should be extremelycareful in its use of cash until more of the accounts re-ceivable or inventory balances can be liquidated.
This measurement can be considerably skewed bythe timing of the measurement within the reportingperiod. For example, if a company has one largeaccounts payable check run scheduled each month, itscash reserves will look quite large just prior to thecheck run and much lower afterward; the same situa-tion will apply to the expenditure for a payroll. Inthese situations, the measurement will drop precipi-tously right after the payment event, making the com-pany cash situation look much worse that it really is.
276 Metrics
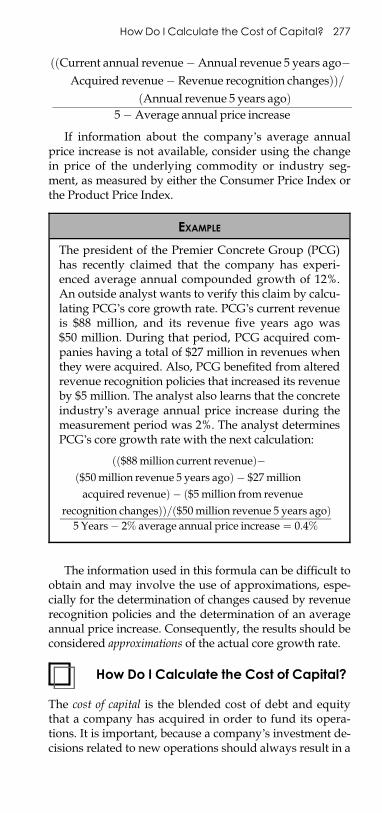
E1C18 03/04/2010 Page 277
ððCurrent annual revenue�Annual revenue 5 years ago�Acquired revenue� Revenue recognition changesÞÞ=
ðAnnual revenue 5 years agoÞ5�Average annual price increase
If information about the company’s average annualprice increase is not available, consider using the changein price of the underlying commodity or industry seg-ment, as measured by either the Consumer Price Index orthe Product Price Index.
The information used in this formula can be difficult toobtain and may involve the use of approximations, espe-cially for the determination of changes caused by revenuerecognition policies and the determination of an averageannual price increase. Consequently, the results should beconsidered approximations of the actual core growth rate.
How Do I Calculate the Cost of Capital?
The cost of capital is the blended cost of debt and equitythat a company has acquired in order to fund its opera-tions. It is important, because a company’s investment de-cisions related to new operations should always result in a
EXAMPLE
The president of the Premier Concrete Group (PCG)has recently claimed that the company has experi-enced average annual compounded growth of 12%.An outside analyst wants to verify this claim by calcu-lating PCG’s core growth rate. PCG’s current revenueis $88 million, and its revenue five years ago was$50 million. During that period, PCG acquired com-panies having a total of $27 million in revenues whenthey were acquired. Also, PCG benefited from alteredrevenue recognition policies that increased its revenueby $5 million. The analyst also learns that the concreteindustry’s average annual price increase during themeasurement period was 2%. The analyst determinesPCG’s core growth rate with the next calculation:
ðð$88million current revenueÞ�ð$50million revenue 5 years agoÞ � $27millionacquired revenueÞ � ð$5million from revenue
recognition changesÞÞ=ð$50million revenue 5 years agoÞ5 Years� 2% average annual price increase ¼ 0:4%
How Do I Calculate the Cost of Capital? 277
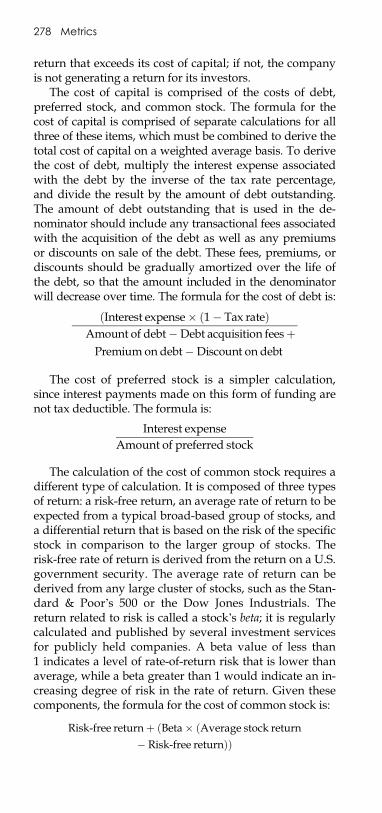
E1C18 03/04/2010 Page 278
return that exceeds its cost of capital; if not, the companyis not generating a return for its investors.
The cost of capital is comprised of the costs of debt,preferred stock, and common stock. The formula for thecost of capital is comprised of separate calculations for allthree of these items, which must be combined to derive thetotal cost of capital on a weighted average basis. To derivethe cost of debt, multiply the interest expense associatedwith the debt by the inverse of the tax rate percentage,and divide the result by the amount of debt outstanding.The amount of debt outstanding that is used in the de-nominator should include any transactional fees associatedwith the acquisition of the debt as well as any premiumsor discounts on sale of the debt. These fees, premiums, ordiscounts should be gradually amortized over the life ofthe debt, so that the amount included in the denominatorwill decrease over time. The formula for the cost of debt is:
ðInterest expense� ð1� Tax rateÞAmount of debt�Debt acquisition feesþPremium on debt�Discount on debt
The cost of preferred stock is a simpler calculation,since interest payments made on this form of funding arenot tax deductible. The formula is:
Interest expenseAmount of preferred stock
The calculation of the cost of common stock requires adifferent type of calculation. It is composed of three typesof return: a risk-free return, an average rate of return to beexpected from a typical broad-based group of stocks, anda differential return that is based on the risk of the specificstock in comparison to the larger group of stocks. Therisk-free rate of return is derived from the return on a U.S.government security. The average rate of return can bederived from any large cluster of stocks, such as the Stan-dard & Poor’s 500 or the Dow Jones Industrials. Thereturn related to risk is called a stock’s beta; it is regularlycalculated and published by several investment servicesfor publicly held companies. A beta value of less than1 indicates a level of rate-of-return risk that is lower thanaverage, while a beta greater than 1 would indicate an in-creasing degree of risk in the rate of return. Given thesecomponents, the formula for the cost of common stock is:
Risk-free returnþ ðBeta� ðAverage stock return� Risk-free returnÞÞ
278 Metrics
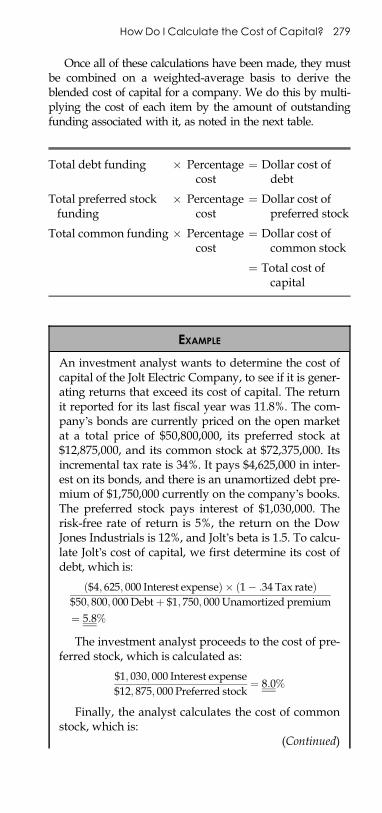
E1C18 03/04/2010 Page 279
Once all of these calculations have been made, they mustbe combined on a weighted-average basis to derive theblended cost of capital for a company. We do this by multi-plying the cost of each item by the amount of outstandingfunding associated with it, as noted in the next table.
Total debt funding � Percentagecost
¼ Dollar cost ofdebt
Total preferred stockfunding
� Percentagecost
¼ Dollar cost ofpreferred stock
Total common funding � Percentagecost
¼ Dollar cost ofcommon stock
¼ Total cost ofcapital
EXAMPLE
An investment analyst wants to determine the cost ofcapital of the Jolt Electric Company, to see if it is gener-ating returns that exceed its cost of capital. The returnit reported for its last fiscal year was 11.8%. The com-pany’s bonds are currently priced on the open marketat a total price of $50,800,000, its preferred stock at$12,875,000, and its common stock at $72,375,000. Itsincremental tax rate is 34%. It pays $4,625,000 in inter-est on its bonds, and there is an unamortized debt pre-mium of $1,750,000 currently on the company’s books.The preferred stock pays interest of $1,030,000. Therisk-free rate of return is 5%, the return on the DowJones Industrials is 12%, and Jolt’s beta is 1.5. To calcu-late Jolt’s cost of capital, we first determine its cost ofdebt, which is:
ð$4; 625; 000 Interest expenseÞ � ð1� :34 Tax rateÞ$50; 800; 000 Debtþ $1; 750; 000 Unamortized premium¼ 5:8%
The investment analyst proceeds to the cost of pre-ferred stock, which is calculated as:
$1; 030; 000 Interest expense$12; 875; 000 Preferred stock
¼ 8:0%
Finally, the analyst calculates the cost of commonstock, which is:
(Continued)
How Do I Calculate the Cost of Capital? 279
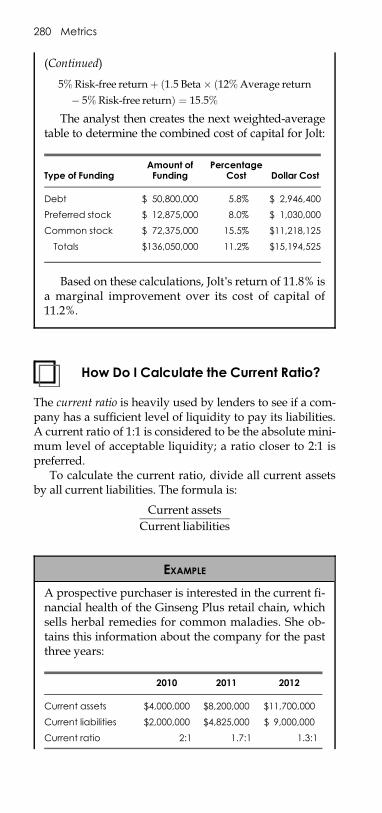
E1C18 03/04/2010 Page 280
How Do I Calculate the Current Ratio?
The current ratio is heavily used by lenders to see if a com-pany has a sufficient level of liquidity to pay its liabilities.A current ratio of 1:1 is considered to be the absolute mini-mum level of acceptable liquidity; a ratio closer to 2:1 ispreferred.
To calculate the current ratio, divide all current assetsby all current liabilities. The formula is:
Current assetsCurrent liabilities
(Continued)
5% Risk-free returnþ ð1:5 Beta� ð12%Average return� 5% Risk-free returnÞ ¼ 15:5%
The analyst then creates the next weighted-averagetable to determine the combined cost of capital for Jolt:
Type of FundingAmount ofFunding
PercentageCost Dollar Cost
Debt $ 50,800,000 5.8% $ 2,946,400
Preferred stock $ 12,875,000 8.0% $ 1,030,000
Common stock $ 72,375,000 15.5% $11,218,125
Totals $136,050,000 11.2% $15,194,525
Based on these calculations, Jolt’s return of 11.8% isa marginal improvement over its cost of capital of11.2%.
EXAMPLE
A prospective purchaser is interested in the current fi-nancial health of the Ginseng Plus retail chain, whichsells herbal remedies for common maladies. She ob-tains this information about the company for the pastthree years:
2010 2011 2012
Current assets $4,000,000 $8,200,000 $11,700,000
Current liabilities $2,000,000 $4,825,000 $ 9,000,000
Current ratio 2:1 1.7:1 1.3:1
280 Metrics
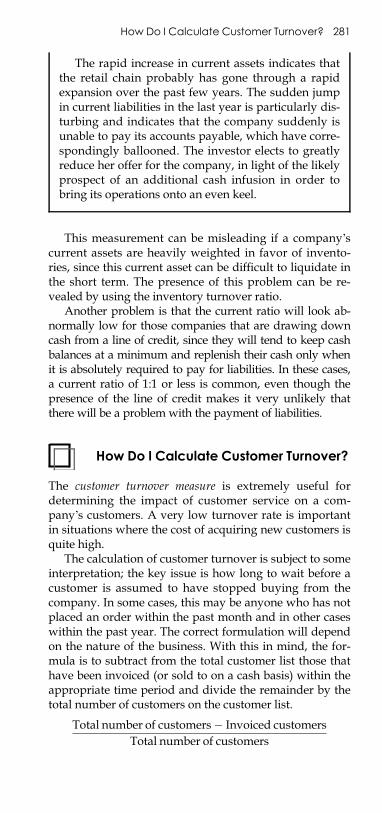
E1C18 03/04/2010 Page 281
This measurement can be misleading if a company’scurrent assets are heavily weighted in favor of invento-ries, since this current asset can be difficult to liquidate inthe short term. The presence of this problem can be re-vealed by using the inventory turnover ratio.
Another problem is that the current ratio will look ab-normally low for those companies that are drawing downcash from a line of credit, since they will tend to keep cashbalances at a minimum and replenish their cash only whenit is absolutely required to pay for liabilities. In these cases,a current ratio of 1:1 or less is common, even though thepresence of the line of credit makes it very unlikely thatthere will be a problem with the payment of liabilities.
How Do I Calculate Customer Turnover?
The customer turnover measure is extremely useful fordetermining the impact of customer service on a com-pany’s customers. A very low turnover rate is importantin situations where the cost of acquiring new customers isquite high.
The calculation of customer turnover is subject to someinterpretation; the key issue is how long to wait before acustomer is assumed to have stopped buying from thecompany. In some cases, this may be anyone who has notplaced an order within the past month and in other caseswithin the past year. The correct formulation will dependon the nature of the business. With this in mind, the for-mula is to subtract from the total customer list those thathave been invoiced (or sold to on a cash basis) within theappropriate time period and divide the remainder by thetotal number of customers on the customer list.
Total number of customers� Invoiced customersTotal number of customers
The rapid increase in current assets indicates thatthe retail chain probably has gone through a rapidexpansion over the past few years. The sudden jumpin current liabilities in the last year is particularly dis-turbing and indicates that the company suddenly isunable to pay its accounts payable, which have corre-spondingly ballooned. The investor elects to greatlyreduce her offer for the company, in light of the likelyprospect of an additional cash infusion in order tobring its operations onto an even keel.
How Do I Calculate Customer Turnover? 281
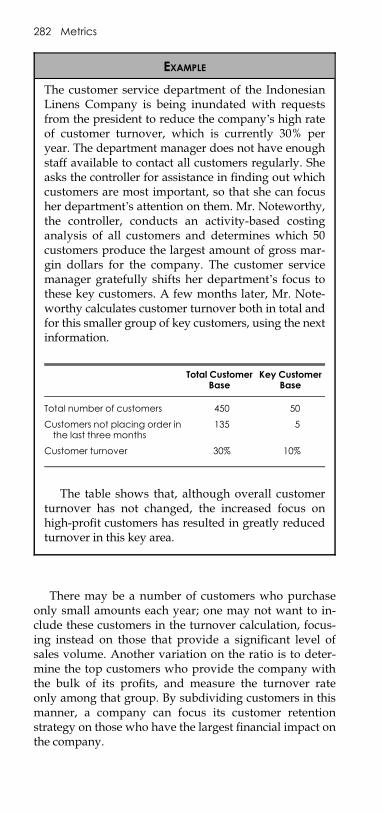
E1C18 03/04/2010 Page 282
There may be a number of customers who purchaseonly small amounts each year; one may not want to in-clude these customers in the turnover calculation, focus-ing instead on those that provide a significant level ofsales volume. Another variation on the ratio is to deter-mine the top customers who provide the company withthe bulk of its profits, and measure the turnover rateonly among that group. By subdividing customers in thismanner, a company can focus its customer retentionstrategy on those who have the largest financial impact onthe company.
EXAMPLE
The customer service department of the IndonesianLinens Company is being inundated with requestsfrom the president to reduce the company’s high rateof customer turnover, which is currently 30% peryear. The department manager does not have enoughstaff available to contact all customers regularly. Sheasks the controller for assistance in finding out whichcustomers are most important, so that she can focusher department’s attention on them. Mr. Noteworthy,the controller, conducts an activity-based costinganalysis of all customers and determines which 50customers produce the largest amount of gross mar-gin dollars for the company. The customer servicemanager gratefully shifts her department’s focus tothese key customers. A few months later, Mr. Note-worthy calculates customer turnover both in total andfor this smaller group of key customers, using the nextinformation.
Total CustomerBase
Key CustomerBase
Total number of customers 450 50
Customers not placing order inthe last three months
135 5
Customer turnover 30% 10%
The table shows that, although overall customerturnover has not changed, the increased focus onhigh-profit customers has resulted in greatly reducedturnover in this key area.
282 Metrics
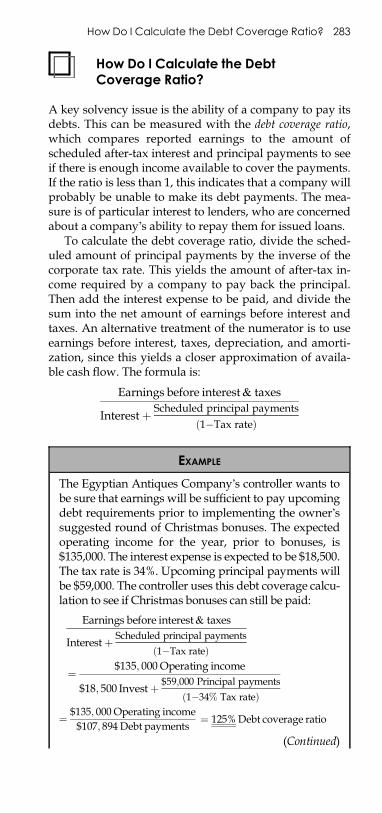
E1C18 03/04/2010 Page 283
How Do I Calculate the DebtCoverage Ratio?
A key solvency issue is the ability of a company to pay itsdebts. This can be measured with the debt coverage ratio,which compares reported earnings to the amount ofscheduled after-tax interest and principal payments to seeif there is enough income available to cover the payments.If the ratio is less than 1, this indicates that a company willprobably be unable to make its debt payments. The mea-sure is of particular interest to lenders, who are concernedabout a company’s ability to repay them for issued loans.
To calculate the debt coverage ratio, divide the sched-uled amount of principal payments by the inverse of thecorporate tax rate. This yields the amount of after-tax in-come required by a company to pay back the principal.Then add the interest expense to be paid, and divide thesum into the net amount of earnings before interest andtaxes. An alternative treatment of the numerator is to useearnings before interest, taxes, depreciation, and amorti-zation, since this yields a closer approximation of availa-ble cash flow. The formula is:
Earnings before interest& taxes
Interestþ Scheduled principal paymentsð1�Tax rateÞ
EXAMPLE
The Egyptian Antiques Company’s controller wants tobe sure that earnings will be sufficient to pay upcomingdebt requirements prior to implementing the owner’ssuggested round of Christmas bonuses. The expectedoperating income for the year, prior to bonuses, is$135,000. The interest expense is expected to be $18,500.The tax rate is 34%. Upcoming principal payments willbe $59,000. The controller uses this debt coverage calcu-lation to see if Christmas bonuses can still be paid:
Earnings before interest& taxes
Interestþ Scheduled principal paymentsð1�Tax rateÞ
¼ $135; 000 Operating income
$18; 500 Investþ $59;000 Principal paymentsð1�34% Tax rateÞ
¼ $135; 000 Operating income$107; 894 Debt payments
¼ 125%Debt coverage ratio
(Continued)
How Do I Calculate the Debt Coverage Ratio? 283
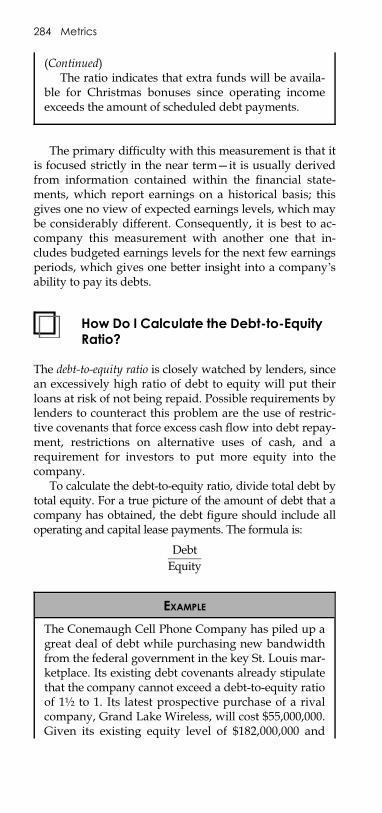
E1C18 03/04/2010 Page 284
The primary difficulty with this measurement is that itis focused strictly in the near term—it is usually derivedfrom information contained within the financial state-ments, which report earnings on a historical basis; thisgives one no view of expected earnings levels, which maybe considerably different. Consequently, it is best to ac-company this measurement with another one that in-cludes budgeted earnings levels for the next few earningsperiods, which gives one better insight into a company’sability to pay its debts.
How Do I Calculate the Debt-to-EquityRatio?
The debt-to-equity ratio is closely watched by lenders, sincean excessively high ratio of debt to equity will put theirloans at risk of not being repaid. Possible requirements bylenders to counteract this problem are the use of restric-tive covenants that force excess cash flow into debt repay-ment, restrictions on alternative uses of cash, and arequirement for investors to put more equity into thecompany.
To calculate the debt-to-equity ratio, divide total debt bytotal equity. For a true picture of the amount of debt that acompany has obtained, the debt figure should include alloperating and capital lease payments. The formula is:
DebtEquity
(Continued)The ratio indicates that extra funds will be availa-
ble for Christmas bonuses since operating incomeexceeds the amount of scheduled debt payments.
EXAMPLE
The Conemaugh Cell Phone Company has piled up agreat deal of debt while purchasing new bandwidthfrom the federal government in the key St. Louis mar-ketplace. Its existing debt covenants already stipulatethat the company cannot exceed a debt-to-equity ratioof 1½ to 1. Its latest prospective purchase of a rivalcompany, Grand Lake Wireless, will cost $55,000,000.Given its existing equity level of $182,000,000 and
284 Metrics
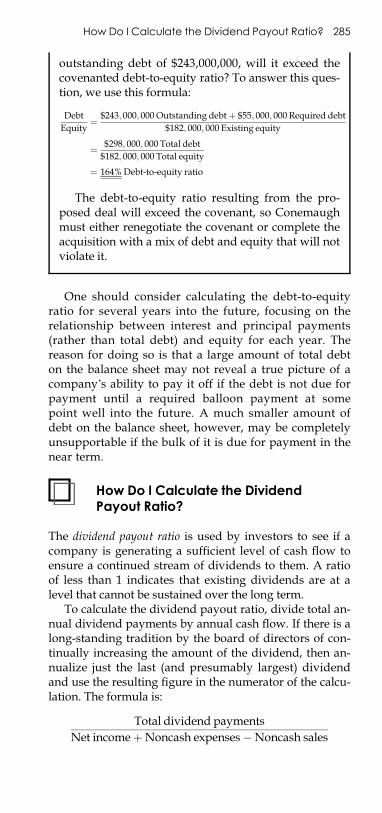
E1C18 03/04/2010 Page 285
One should consider calculating the debt-to-equityratio for several years into the future, focusing on therelationship between interest and principal payments(rather than total debt) and equity for each year. Thereason for doing so is that a large amount of total debton the balance sheet may not reveal a true picture of acompany’s ability to pay it off if the debt is not due forpayment until a required balloon payment at somepoint well into the future. A much smaller amount ofdebt on the balance sheet, however, may be completelyunsupportable if the bulk of it is due for payment in thenear term.
How Do I Calculate the DividendPayout Ratio?
The dividend payout ratio is used by investors to see if acompany is generating a sufficient level of cash flow toensure a continued stream of dividends to them. A ratioof less than 1 indicates that existing dividends are at alevel that cannot be sustained over the long term.
To calculate the dividend payout ratio, divide total an-nual dividend payments by annual cash flow. If there is along-standing tradition by the board of directors of con-tinually increasing the amount of the dividend, then an-nualize just the last (and presumably largest) dividendand use the resulting figure in the numerator of the calcu-lation. The formula is:
Total dividend paymentsNet incomeþNoncash expenses�Noncash sales
outstanding debt of $243,000,000, will it exceed thecovenanted debt-to-equity ratio? To answer this ques-tion, we use this formula:
DebtEquity
¼ $243; 000; 000 Outstanding debtþ $55; 000; 000 Required debt$182; 000; 000 Existing equity
¼ $298; 000; 000 Total debt$182; 000; 000 Total equity
¼ 164%Debt-to-equity ratio
The debt-to-equity ratio resulting from the pro-posed deal will exceed the covenant, so Conemaughmust either renegotiate the covenant or complete theacquisition with a mix of debt and equity that will notviolate it.
How Do I Calculate the Dividend Payout Ratio? 285
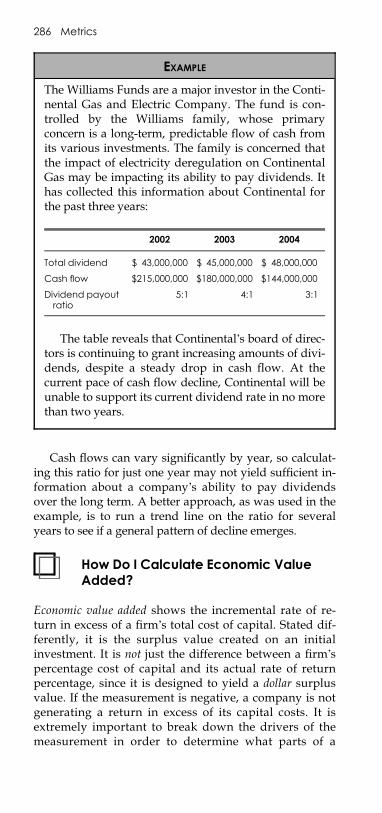
E1C18 03/04/2010 Page 286
Cash flows can vary significantly by year, so calculat-ing this ratio for just one year may not yield sufficient in-formation about a company’s ability to pay dividendsover the long term. A better approach, as was used in theexample, is to run a trend line on the ratio for severalyears to see if a general pattern of decline emerges.
How Do I Calculate Economic ValueAdded?
Economic value added shows the incremental rate of re-turn in excess of a firm’s total cost of capital. Stated dif-ferently, it is the surplus value created on an initialinvestment. It is not just the difference between a firm’spercentage cost of capital and its actual rate of returnpercentage, since it is designed to yield a dollar surplusvalue. If the measurement is negative, a company is notgenerating a return in excess of its capital costs. It isextremely important to break down the drivers of themeasurement in order to determine what parts of a
EXAMPLE
The Williams Funds are a major investor in the Conti-nental Gas and Electric Company. The fund is con-trolled by the Williams family, whose primaryconcern is a long-term, predictable flow of cash fromits various investments. The family is concerned thatthe impact of electricity deregulation on ContinentalGas may be impacting its ability to pay dividends. Ithas collected this information about Continental forthe past three years:
2002 2003 2004
Total dividend $ 43,000,000 $ 45,000,000 $ 48,000,000
Cash flow $215,000,000 $180,000,000 $144,000,000
Dividend payoutratio
5:1 4:1 3:1
The table reveals that Continental’s board of direc-tors is continuing to grant increasing amounts of divi-dends, despite a steady drop in cash flow. At thecurrent pace of cash flow decline, Continental will beunable to support its current dividend rate in no morethan two years.
286 Metrics
E1C18 03/04/2010 Page 287
company are keeping the measure from reaching itsmaximum potential.
To calculate economic value added, multiply the netinvestment by the difference between the actual rate of re-turn on assets and the percentage cost of capital. The threeelements of the calculation are:
1. Net investment. The net investment figure used in theformula is subject to a great deal of variation. In itsmost limited form, one can use the net valuation forall fixed assets. However, some assets may be sub-ject to accelerated depreciation calculations, whichgreatly reduce the amount of investment used in thecalculation; a better approach is to use the straight-line depreciation methodology for all assets, withonly the depreciation period varying by type of as-set. A variation on this approach is to also add re-search and development as well as training costsback into the net investment, on the grounds thatthese expenditures are made to enhance the com-pany’s value over the long term. Also, if assets areleased rather than owned, they should be itemizedas assets at their fair market value and included inthe net investment figure.
2. Actual return on Investment. When calculating the re-turn on investment, research and development aswell as training expenses should be shifted out ofoperating expenses and into net investment (asnoted in point 1). In addition, any unusual adjust-ments to net income that do not involve ongoing op-erations should be eliminated. This results in anincome figure that is related to just those costs thatcan be legitimately expensed within the currentperiod.
3. Cost of capital. The formulation of the cost of capitalwas noted earlier in this chapter.
The economic value added formula is:
ðNet investmentÞ � ðActual return on investment� Percentage cost of capitalÞ
EXAMPLE
The controller of the Miraflores Manufacturing Com-pany wants to see if the company has a positive eco-nomic value added. Based on her calculation of
(Continued)
How Do I Calculate Economic Value Added? 287
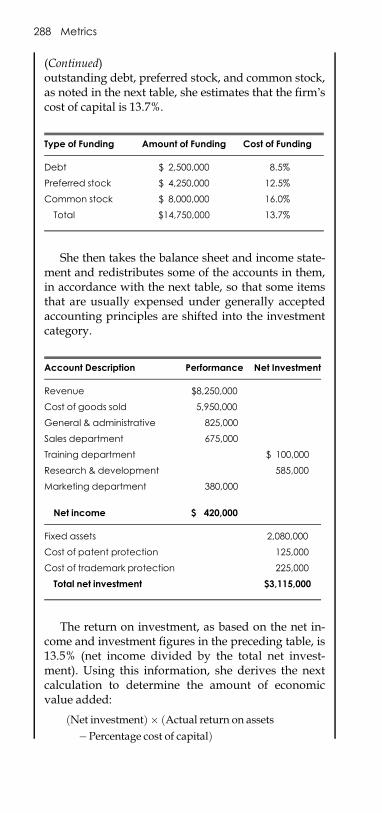
E1C18 03/04/2010 Page 288
(Continued)outstanding debt, preferred stock, and common stock,as noted in the next table, she estimates that the firm’scost of capital is 13.7%.
Type of Funding Amount of Funding Cost of Funding
Debt $ 2,500,000 8.5%
Preferred stock $ 4,250,000 12.5%
Common stock $ 8,000,000 16.0%
Total $14,750,000 13.7%
She then takes the balance sheet and income state-ment and redistributes some of the accounts in them,in accordance with the next table, so that some itemsthat are usually expensed under generally acceptedaccounting principles are shifted into the investmentcategory.
Account Description Performance Net Investment
Revenue $8,250,000
Cost of goods sold 5,950,000
General & administrative 825,000
Sales department 675,000
Training department $ 100,000
Research & development 585,000
Marketing department 380,000
Net income $ 420,000
Fixed assets 2,080,000
Cost of patent protection 125,000
Cost of trademark protection 225,000
Total net investment $3,115,000
The return on investment, as based on the net in-come and investment figures in the preceding table, is13.5% (net income divided by the total net invest-ment). Using this information, she derives the nextcalculation to determine the amount of economicvalue added:
ðNet investmentÞ � ðActual return on assets�Percentage cost of capitalÞ
288 Metrics
E1C18 03/04/2010 Page 289
The focus of this measure is to increase the return oncapital employed. However, this measure may keep man-agers from investing in assets that have problematic re-turns but that may yield excellent returns if the companyis willing to wait a few years to see if the market or theproduct matures.
How Do I Calculate Expense CoverageDays?
The expense coverage days calculation yields the number ofdays that a company can cover its ongoing expenditureswith existing liquid assets. This is a most useful calcula-tion in situations where the further inflow of liquid assetsmay be cut off, so the management team needs to knowhow long the company will last without an extra cash in-fusion. The calculation is also useful for seeing if there isan excessive amount of liquid assets on hand, which couldlead to a decision to pay down debt or buy back stockrather than keep the assets on hand.
To calculate expense coverage days, summarize all an-nual cash expenditures and divide by 360. Then divide theresult into the summary of all assets that can be easily con-verted into cash. The largest problem with the formulationof this ratio is the amount of the annual cash expenditures,for there are always unusual expenses, such as fees associ-ated with lawsuits, warranty claims, and severance pay-ments that may not be likely to occur again. However, if allof these additional expenses were to be stripped out of thecalculation, the ratio would always be incorrect, for therewill inevitably be some unusual expenditures. To correct forthis problem, a company with steady long-term expenditurelevels could average its expenditures over multiple years.Companies experiencing rapid changes in expenditurelevels will not have this option and so will have to makejudgment calls regarding the most appropriate expenditures
¼ ð$3; 115; 000 Net investmentÞ�ð13:5%Actual return� 13:7%Cost of capitalÞ
¼ $3; 115; 000 Net investment��:2%¼ � $6; 230 Economic value added
In short, the company is destroying its capital baseby creating actual returns that are slightly less than itscost of capital.
How Do I Calculate Expense Coverage Days? 289
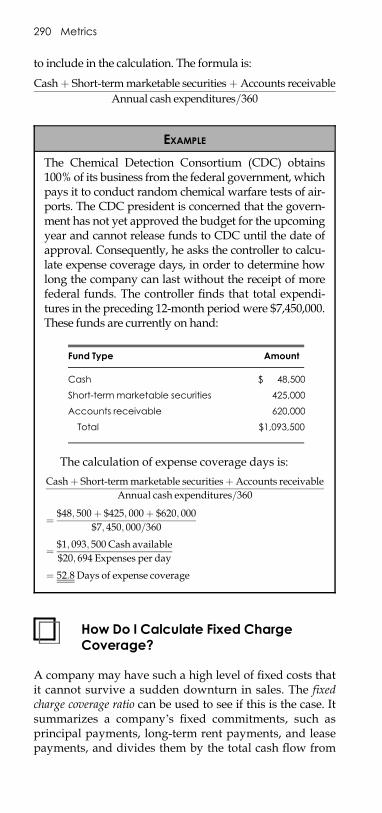
E1C18 03/04/2010 Page 290
to include in the calculation. The formula is:
Cashþ Short-termmarketable securitiesþAccounts receivableAnnual cash expenditures=360
How Do I Calculate Fixed ChargeCoverage?
A company may have such a high level of fixed costs thatit cannot survive a sudden downturn in sales. The fixedcharge coverage ratio can be used to see if this is the case. Itsummarizes a company’s fixed commitments, such asprincipal payments, long-term rent payments, and leasepayments, and divides them by the total cash flow from
EXAMPLE
The Chemical Detection Consortium (CDC) obtains100% of its business from the federal government, whichpays it to conduct random chemical warfare tests of air-ports. The CDC president is concerned that the govern-ment has not yet approved the budget for the upcomingyear and cannot release funds to CDC until the date ofapproval. Consequently, he asks the controller to calcu-late expense coverage days, in order to determine howlong the company can last without the receipt of morefederal funds. The controller finds that total expendi-tures in the preceding 12-month period were $7,450,000.These funds are currently on hand:
Fund Type Amount
Cash $ 48,500
Short-term marketable securities 425,000
Accounts receivable 620,000
Total $1,093,500
The calculation of expense coverage days is:
Cashþ Short-termmarketable securitiesþAccounts receivableAnnual cash expenditures=360
¼ $48; 500þ $425; 000þ $620; 000$7; 450; 000=360
¼ $1; 093; 500 Cash available$20; 694 Expenses per day
¼ 52:8 Days of expense coverage
290 Metrics
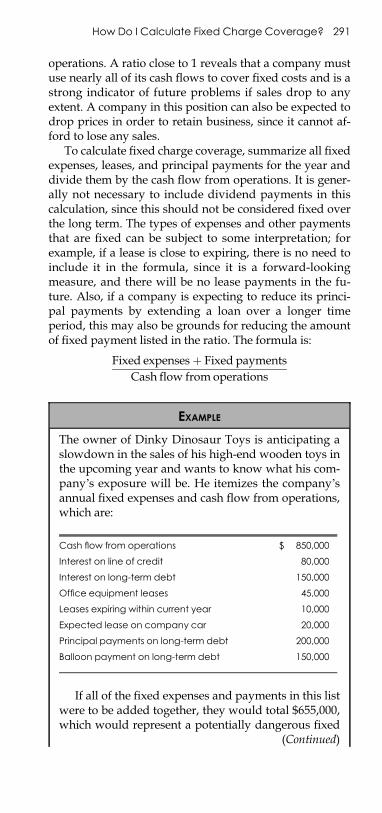
E1C18 03/04/2010 Page 291
operations. A ratio close to 1 reveals that a company mustuse nearly all of its cash flows to cover fixed costs and is astrong indicator of future problems if sales drop to anyextent. A company in this position can also be expected todrop prices in order to retain business, since it cannot af-ford to lose any sales.
To calculate fixed charge coverage, summarize all fixedexpenses, leases, and principal payments for the year anddivide them by the cash flow from operations. It is gener-ally not necessary to include dividend payments in thiscalculation, since this should not be considered fixed overthe long term. The types of expenses and other paymentsthat are fixed can be subject to some interpretation; forexample, if a lease is close to expiring, there is no need toinclude it in the formula, since it is a forward-lookingmeasure, and there will be no lease payments in the fu-ture. Also, if a company is expecting to reduce its princi-pal payments by extending a loan over a longer timeperiod, this may also be grounds for reducing the amountof fixed payment listed in the ratio. The formula is:
Fixed expensesþ Fixed paymentsCash flow from operations
EXAMPLE
The owner of Dinky Dinosaur Toys is anticipating aslowdown in the sales of his high-end wooden toys inthe upcoming year and wants to know what his com-pany’s exposure will be. He itemizes the company’sannual fixed expenses and cash flow from operations,which are:
Cash flow from operations $ 850,000
Interest on line of credit 80,000
Interest on long-term debt 150,000
Office equipment leases 45,000
Leases expiring within current year 10,000
Expected lease on company car 20,000
Principal payments on long-term debt 200,000
Balloon payment on long-term debt 150,000
If all of the fixed expenses and payments in this listwere to be added together, they would total $655,000,which would represent a potentially dangerous fixed
(Continued)
How Do I Calculate Fixed Charge Coverage? 291
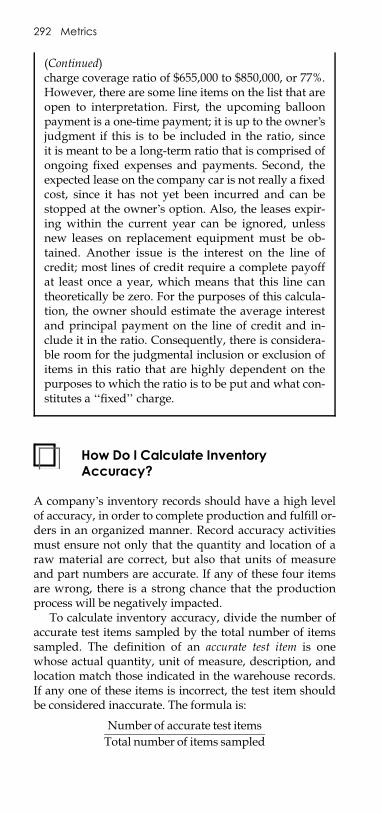
E1C18 03/04/2010 Page 292
How Do I Calculate InventoryAccuracy?
A company’s inventory records should have a high levelof accuracy, in order to complete production and fulfill or-ders in an organized manner. Record accuracy activitiesmust ensure not only that the quantity and location of araw material are correct, but also that units of measureand part numbers are accurate. If any of these four itemsare wrong, there is a strong chance that the productionprocess will be negatively impacted.
To calculate inventory accuracy, divide the number ofaccurate test items sampled by the total number of itemssampled. The definition of an accurate test item is onewhose actual quantity, unit of measure, description, andlocation match those indicated in the warehouse records.If any one of these items is incorrect, the test item shouldbe considered inaccurate. The formula is:
Number of accurate test itemsTotal number of items sampled
(Continued)charge coverage ratio of $655,000 to $850,000, or 77%.However, there are some line items on the list that areopen to interpretation. First, the upcoming balloonpayment is a one-time payment; it is up to the owner’sjudgment if this is to be included in the ratio, sinceit is meant to be a long-term ratio that is comprised ofongoing fixed expenses and payments. Second, theexpected lease on the company car is not really a fixedcost, since it has not yet been incurred and can bestopped at the owner’s option. Also, the leases expir-ing within the current year can be ignored, unlessnew leases on replacement equipment must be ob-tained. Another issue is the interest on the line ofcredit; most lines of credit require a complete payoffat least once a year, which means that this line cantheoretically be zero. For the purposes of this calcula-tion, the owner should estimate the average interestand principal payment on the line of credit and in-clude it in the ratio. Consequently, there is considera-ble room for the judgmental inclusion or exclusion ofitems in this ratio that are highly dependent on thepurposes to which the ratio is to be put and what con-stitutes a ‘‘fixed’’ charge.
292 Metrics
E1C18 03/04/2010 Page 293
It is extremely important to conduct this measurementusing all four of the criteria noted in the formula deriva-tion. The quantity, unit of measure, description, and loca-tion must match the inventory record. If this is not thecase, the reason for using it—to ensure that the correctamount of inventory is on hand for production needs—will be invalidated. For example, even if the inventory isavailable in the correct quantity, if its location code iswrong, no one can find it in order to use it in the produc-tion process. Similarly, the quantity recorded may exactlymatch the amount located in the warehouse, but this willstill lead to an incorrect quantity if the unit of measure inthe inventory record is something different, such as doz-ens instead of eaches.
EXAMPLE
An internal auditor for the Meridian and BaselineCompany, maker of surveying instruments, is con-ducting an inventory accuracy review in the com-pany’s warehouse. She records the next incorrectinformation for a sample count of eight items:
AuditedDescription
AuditedLocation
AuditedQuantity
Audited Unitof Measure
Aneroidbarometer
No No
Batterypack
No
Connectionjack
No
GPS casing No No
GPS circuitboard
No
Heavy-dutytripod
No No
Plumb line No
Sextantframe
No
The warehouse manager has spent a great deal oftime ensuring that the inventory record accuracy inhis warehouse is perfect. He is astounded when theauditor’s measurement reveals an accuracy level ofzero, despite perfect quantity accuracy; he has com-pletely ignored the record accuracy of part descrip-tions, locations, and units of measure and as a resulthas had multiple incorrect components of the mea-surement for some inventory items.
How Do I Calculate Inventory Accuracy? 293
E1C18 03/04/2010 Page 294
How Do I Calculate Inventory Turnover?
Keeping close track of the rate of inventory turnover isa significant function of management. There are severalvariations on the inventory turnover measurement, whichmay be combined to yield the most complete turnoverreporting for management to peruse. In all cases, thesemeasurements should be tracked on a trend line in order tosee if there are gradual reductions in the rate of turnover,which can indicate to management that corrective action isrequired in order to eliminate excess inventory stocks.
The most simple turnover calculation is to divide theperiod-end inventory into the annualized cost of sales.One can also use an average inventory figure in the de-nominator, which avoids sudden changes in the inventorylevel that are likely to occur on any specific period-enddate. The formula is:
Cost of goods soldInventory
A variation on the preceding formula is to divide it into365 days, which yields the number of days of inventoryon hand. This may be more understandable to the lay-man; for example, 43 days of inventory is clearer than8.5 inventory turns, even though they represent the samesituation. The formula is:
365=Cost of goods sold
Inventory
The preceding two formulas use the entire cost of goodssold in the numerator, which includes direct labor, directmaterials, and overhead. However, only direct materialscosts relate directly to the level of raw materials inventory.Consequently, a cleaner relationship is to compare the valueof direct materials expense to rawmaterials inventory, yield-ing a raw materials turnover figure. This measurement canalso be divided into 365 days in order to yield the number ofdays of raw materials on hand. The formula is:
Direct materials expenseRawmaterials inventory
The preceding formula does not yield as clean a rela-tionship between direct materials expense and work inprocess or finished goods, since these two categories of in-ventory also include cost allocations for direct labor andoverhead. However, if these added costs can be strippedout of the work in process and finished goods valuations,there are reasonable grounds for comparing them to thedirect materials expense as a valid ratio.
294 Metrics
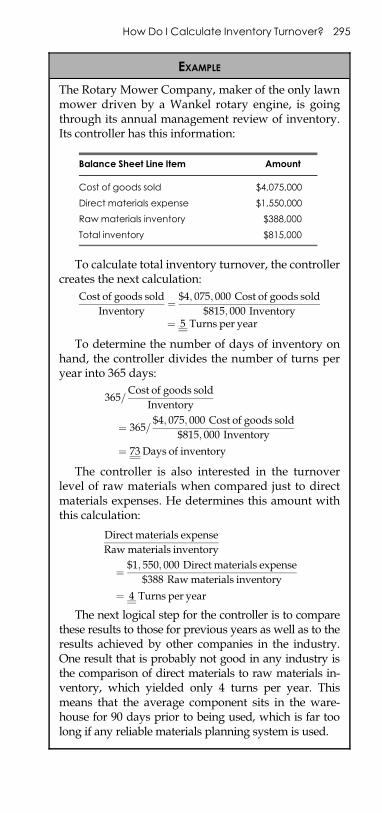
E1C18 03/04/2010 Page 295
EXAMPLE
The Rotary Mower Company, maker of the only lawnmower driven by a Wankel rotary engine, is goingthrough its annual management review of inventory.Its controller has this information:
Balance Sheet Line Item Amount
Cost of goods sold $4,075,000
Direct materials expense $1,550,000
Raw materials inventory $388,000
Total inventory $815,000
To calculate total inventory turnover, the controllercreates the next calculation:
Cost of goods soldInventory
¼ $4; 075; 000 Cost of goods sold$815; 000 Inventory
¼ 5 Turns per year
To determine the number of days of inventory onhand, the controller divides the number of turns peryear into 365 days:
365=Cost of goods sold
Inventory
¼ 365=$4; 075; 000 Cost of goods sold
$815; 000 Inventory¼ 73 Days of inventory
The controller is also interested in the turnoverlevel of raw materials when compared just to directmaterials expenses. He determines this amount withthis calculation:
Direct materials expenseRawmaterials inventory
¼ $1; 550; 000 Direct materials expense$388 Rawmaterials inventory
¼ 4 Turns per year
The next logical step for the controller is to comparethese results to those for previous years as well as to theresults achieved by other companies in the industry.One result that is probably not good in any industry isthe comparison of direct materials to raw materials in-ventory, which yielded only 4 turns per year. Thismeans that the average component sits in the ware-house for 90 days prior to being used, which is far toolong if any reliable materials planning system is used.
How Do I Calculate Inventory Turnover? 295
E1C18 03/04/2010 Page 296
The turnover ratio can be skewed by changes in theunderlying costing methods used to allocate direct laborand especially overhead cost pools to the inventory. Forexample, if additional categories of costs are added to theoverhead cost pool, the allocation to inventory will in-crease, which will reduce the reported level of inventoryturnover—even though the turnover level under the origi-nal calculation method has not changed at all. The problemcan also arise if the method of allocating costs is changed;for example, it may be shifted from an allocation based onlabor hours worked to one based on machine hoursworked, which can alter the total amount of overhead costsassigned to inventory. The problem can also arise if the in-ventory valuation is based on standard costs and the under-lying standards are altered. In all three cases, the amount ofinventory on hand has not changed, but the costing systemsused have altered the reported level of inventory costs,which impacts the reported level of turnover.
How Do I Calculate the Margin ofSafety?
The margin of safety is the amount by which sales can dropbefore a company’s breakeven point is reached. It is par-ticularly useful in situations where large portions of acompany’s sales are at risk, such as when they are tied upin a single customer contract that can be canceled. Know-ing the margin of safety gives an analyst a good idea ofthe probability that a company may find itself in difficultfinancial circumstances caused by sales fluctuations.
To calculate the margin of safety, subtract the break-even point from the current sales level and divide theresult by the current sales level. To calculate the break-even point, divide the gross margin percentage into totalfixed costs. This formula can be broken down into indi-vidual product lines for a better view of risk levels withinbusiness units. The formula is:
Current sales level� Breakeven pointCurrent sales level
EXAMPLE
The Fat Tire Publishing House, Inc. is contemplatingthe purchase of several delivery trucks to assist in thedelivery of its Fat Tire Weekly mountain biking maga-zine to a new sales region. The addition of these
296 Metrics
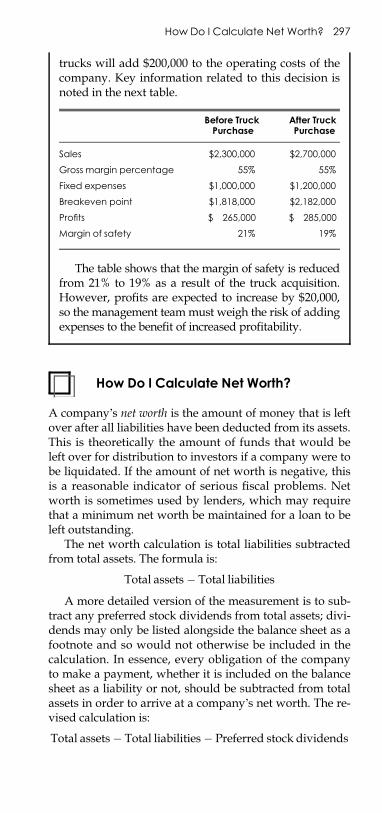
E1C18 03/04/2010 Page 297
How Do I Calculate Net Worth?
A company’s net worth is the amount of money that is leftover after all liabilities have been deducted from its assets.This is theoretically the amount of funds that would beleft over for distribution to investors if a company were tobe liquidated. If the amount of net worth is negative, thisis a reasonable indicator of serious fiscal problems. Networth is sometimes used by lenders, which may requirethat a minimum net worth be maintained for a loan to beleft outstanding.
The net worth calculation is total liabilities subtractedfrom total assets. The formula is:
Total assets� Total liabilities
A more detailed version of the measurement is to sub-tract any preferred stock dividends from total assets; divi-dends may only be listed alongside the balance sheet as afootnote and so would not otherwise be included in thecalculation. In essence, every obligation of the companyto make a payment, whether it is included on the balancesheet as a liability or not, should be subtracted from totalassets in order to arrive at a company’s net worth. The re-vised calculation is:
Total assets � Total liabilities� Preferred stock dividends
trucks will add $200,000 to the operating costs of thecompany. Key information related to this decision isnoted in the next table.
Before TruckPurchase
After TruckPurchase
Sales $2,300,000 $2,700,000
Gross margin percentage 55% 55%
Fixed expenses $1,000,000 $1,200,000
Breakeven point $1,818,000 $2,182,000
Profits $ 265,000 $ 285,000
Margin of safety 21% 19%
The table shows that the margin of safety is reducedfrom 21% to 19% as a result of the truck acquisition.However, profits are expected to increase by $20,000,so the management teammust weigh the risk of addingexpenses to the benefit of increased profitability.
How Do I Calculate Net Worth? 297
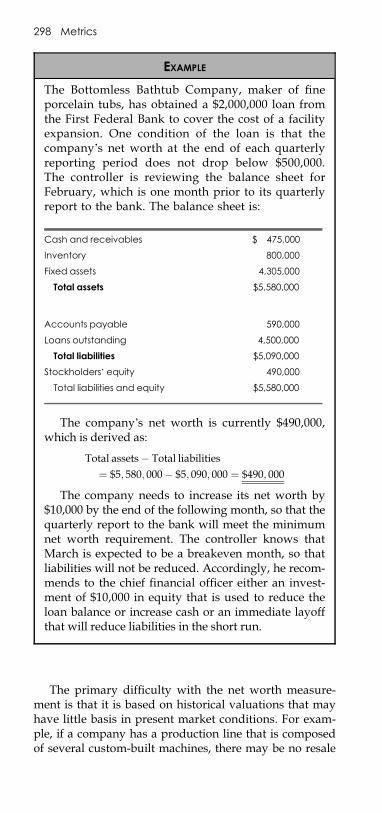
E1C18 03/04/2010 Page 298
The primary difficulty with the net worth measure-ment is that it is based on historical valuations that mayhave little basis in present market conditions. For exam-ple, if a company has a production line that is composedof several custom-built machines, there may be no resale
EXAMPLE
The Bottomless Bathtub Company, maker of fineporcelain tubs, has obtained a $2,000,000 loan fromthe First Federal Bank to cover the cost of a facilityexpansion. One condition of the loan is that thecompany’s net worth at the end of each quarterlyreporting period does not drop below $500,000.The controller is reviewing the balance sheet forFebruary, which is one month prior to its quarterlyreport to the bank. The balance sheet is:
Cash and receivables $ 475,000
Inventory 800,000
Fixed assets 4,305,000
Total assets $5,580,000
Accounts payable 590,000
Loans outstanding 4,500,000
Total liabilities $5,090,000
Stockholders’ equity 490,000
Total liabilities and equity $5,580,000
The company’s net worth is currently $490,000,which is derived as:
Total assets� Total liabilities¼ $5; 580; 000� $5; 090; 000 ¼ $490; 000
The company needs to increase its net worth by$10,000 by the end of the following month, so that thequarterly report to the bank will meet the minimumnet worth requirement. The controller knows thatMarch is expected to be a breakeven month, so thatliabilities will not be reduced. Accordingly, he recom-mends to the chief financial officer either an invest-ment of $10,000 in equity that is used to reduce theloan balance or increase cash or an immediate layoffthat will reduce liabilities in the short run.
298 Metrics
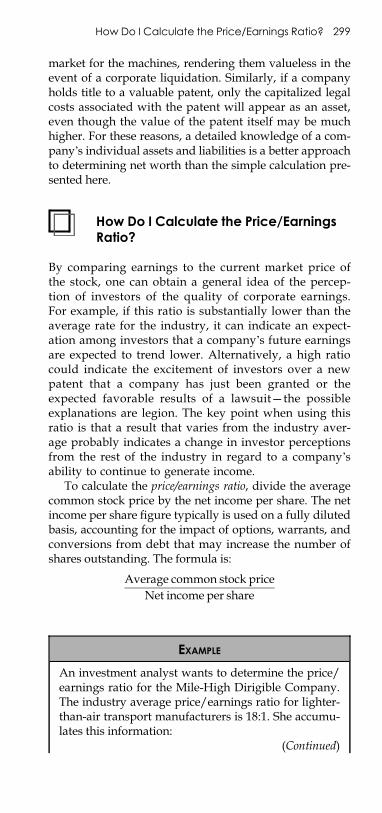
E1C18 03/04/2010 Page 299
market for the machines, rendering them valueless in theevent of a corporate liquidation. Similarly, if a companyholds title to a valuable patent, only the capitalized legalcosts associated with the patent will appear as an asset,even though the value of the patent itself may be muchhigher. For these reasons, a detailed knowledge of a com-pany’s individual assets and liabilities is a better approachto determining net worth than the simple calculation pre-sented here.
How Do I Calculate the Price/EarningsRatio?
By comparing earnings to the current market price ofthe stock, one can obtain a general idea of the percep-tion of investors of the quality of corporate earnings.For example, if this ratio is substantially lower than theaverage rate for the industry, it can indicate an expect-ation among investors that a company’s future earningsare expected to trend lower. Alternatively, a high ratiocould indicate the excitement of investors over a newpatent that a company has just been granted or theexpected favorable results of a lawsuit—the possibleexplanations are legion. The key point when using thisratio is that a result that varies from the industry aver-age probably indicates a change in investor perceptionsfrom the rest of the industry in regard to a company’sability to continue to generate income.
To calculate the price/earnings ratio, divide the averagecommon stock price by the net income per share. The netincome per share figure typically is used on a fully dilutedbasis, accounting for the impact of options, warrants, andconversions from debt that may increase the number ofshares outstanding. The formula is:
Average common stock priceNet income per share
EXAMPLE
An investment analyst wants to determine the price/earnings ratio for the Mile-High Dirigible Company.The industry average price/earnings ratio for lighter-than-air transport manufacturers is 18:1. She accumu-lates this information:
(Continued)
How Do I Calculate the Price/Earnings Ratio? 299
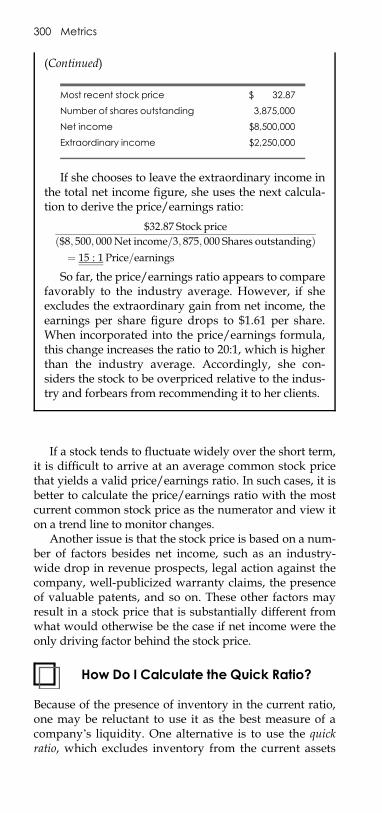
E1C18 03/04/2010 Page 300
If a stock tends to fluctuate widely over the short term,it is difficult to arrive at an average common stock pricethat yields a valid price/earnings ratio. In such cases, it isbetter to calculate the price/earnings ratio with the mostcurrent common stock price as the numerator and view iton a trend line to monitor changes.
Another issue is that the stock price is based on a num-ber of factors besides net income, such as an industry-wide drop in revenue prospects, legal action against thecompany, well-publicized warranty claims, the presenceof valuable patents, and so on. These other factors mayresult in a stock price that is substantially different fromwhat would otherwise be the case if net income were theonly driving factor behind the stock price.
How Do I Calculate the Quick Ratio?
Because of the presence of inventory in the current ratio,one may be reluctant to use it as the best measure of acompany’s liquidity. One alternative is to use the quickratio, which excludes inventory from the current assets
(Continued)
Most recent stock price $ 32.87
Number of shares outstanding 3,875,000
Net income $8,500,000
Extraordinary income $2,250,000
If she chooses to leave the extraordinary income inthe total net income figure, she uses the next calcula-tion to derive the price/earnings ratio:
$32:87 Stock priceð$8; 500; 000 Net income=3; 875; 000 Shares outstandingÞ
¼ 15 : 1 Price=earnings
So far, the price/earnings ratio appears to comparefavorably to the industry average. However, if sheexcludes the extraordinary gain from net income, theearnings per share figure drops to $1.61 per share.When incorporated into the price/earnings formula,this change increases the ratio to 20:1, which is higherthan the industry average. Accordingly, she con-siders the stock to be overpriced relative to the indus-try and forbears from recommending it to her clients.
300 Metrics
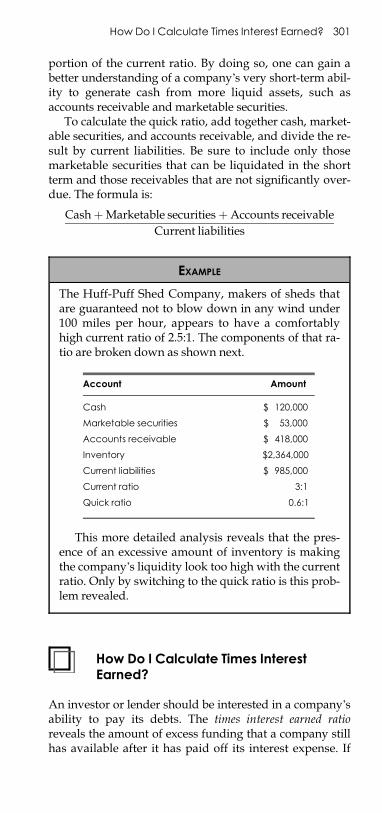
E1C18 03/04/2010 Page 301
portion of the current ratio. By doing so, one can gain abetter understanding of a company’s very short-term abil-ity to generate cash from more liquid assets, such asaccounts receivable and marketable securities.
To calculate the quick ratio, add together cash, market-able securities, and accounts receivable, and divide the re-sult by current liabilities. Be sure to include only thosemarketable securities that can be liquidated in the shortterm and those receivables that are not significantly over-due. The formula is:
CashþMarketable securitiesþAccounts receivableCurrent liabilities
How Do I Calculate Times InterestEarned?
An investor or lender should be interested in a company’sability to pay its debts. The times interest earned ratioreveals the amount of excess funding that a company stillhas available after it has paid off its interest expense. If
EXAMPLE
The Huff-Puff Shed Company, makers of sheds thatare guaranteed not to blow down in any wind under100 miles per hour, appears to have a comfortablyhigh current ratio of 2.5:1. The components of that ra-tio are broken down as shown next.
Account Amount
Cash $ 120,000
Marketable securities $ 53,000
Accounts receivable $ 418,000
Inventory $2,364,000
Current liabilities $ 985,000
Current ratio 3:1
Quick ratio 0.6:1
This more detailed analysis reveals that the pres-ence of an excessive amount of inventory is makingthe company’s liquidity look too high with the currentratio. Only by switching to the quick ratio is this prob-lem revealed.
How Do I Calculate Times Interest Earned? 301
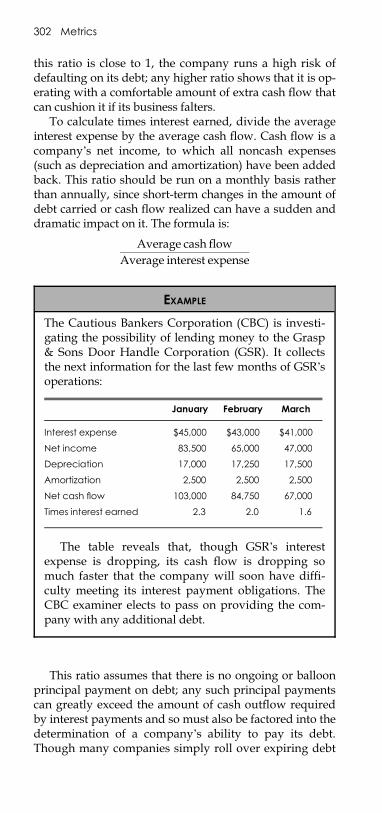
E1C18 03/04/2010 Page 302
this ratio is close to 1, the company runs a high risk ofdefaulting on its debt; any higher ratio shows that it is op-erating with a comfortable amount of extra cash flow thatcan cushion it if its business falters.
To calculate times interest earned, divide the averageinterest expense by the average cash flow. Cash flow is acompany’s net income, to which all noncash expenses(such as depreciation and amortization) have been addedback. This ratio should be run on a monthly basis ratherthan annually, since short-term changes in the amount ofdebt carried or cash flow realized can have a sudden anddramatic impact on it. The formula is:
Average cash flowAverage interest expense
This ratio assumes that there is no ongoing or balloonprincipal payment on debt; any such principal paymentscan greatly exceed the amount of cash outflow requiredby interest payments and so must also be factored into thedetermination of a company’s ability to pay its debt.Though many companies simply roll over expiring debt
EXAMPLE
The Cautious Bankers Corporation (CBC) is investi-gating the possibility of lending money to the Grasp& Sons Door Handle Corporation (GSR). It collectsthe next information for the last few months of GSR’soperations:
January February March
Interest expense $45,000 $43,000 $41,000
Net income 83,500 65,000 47,000
Depreciation 17,000 17,250 17,500
Amortization 2,500 2,500 2,500
Net cash flow 103,000 84,750 67,000
Times interest earned 2.3 2.0 1.6
The table reveals that, though GSR’s interestexpense is dropping, its cash flow is dropping somuch faster that the company will soon have diffi-culty meeting its interest payment obligations. TheCBC examiner elects to pass on providing the com-pany with any additional debt.
302 Metrics
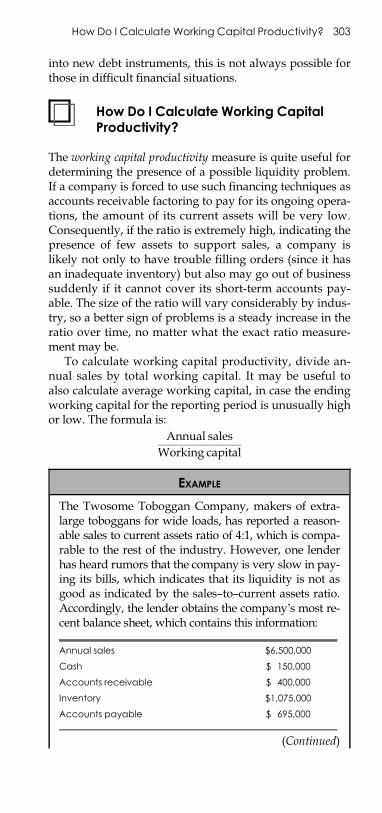
E1C18 03/04/2010 Page 303
into new debt instruments, this is not always possible forthose in difficult financial situations.
How Do I Calculate Working CapitalProductivity?
The working capital productivity measure is quite useful fordetermining the presence of a possible liquidity problem.If a company is forced to use such financing techniques asaccounts receivable factoring to pay for its ongoing opera-tions, the amount of its current assets will be very low.Consequently, if the ratio is extremely high, indicating thepresence of few assets to support sales, a company islikely not only to have trouble filling orders (since it hasan inadequate inventory) but also may go out of businesssuddenly if it cannot cover its short-term accounts pay-able. The size of the ratio will vary considerably by indus-try, so a better sign of problems is a steady increase in theratio over time, no matter what the exact ratio measure-ment may be.
To calculate working capital productivity, divide an-nual sales by total working capital. It may be useful toalso calculate average working capital, in case the endingworking capital for the reporting period is unusually highor low. The formula is:
Annual salesWorking capital
EXAMPLE
The Twosome Toboggan Company, makers of extra-large toboggans for wide loads, has reported a reason-able sales to current assets ratio of 4:1, which is compa-rable to the rest of the industry. However, one lenderhas heard rumors that the company is very slow in pay-ing its bills, which indicates that its liquidity is not asgood as indicated by the sales–to–current assets ratio.Accordingly, the lender obtains the company’s most re-cent balance sheet, which contains this information:
Annual sales $6,500,000
Cash $ 150,000
Accounts receivable $ 400,000
Inventory $1,075,000
Accounts payable $ 695,000
(Continued)
How Do I Calculate Working Capital Productivity? 303
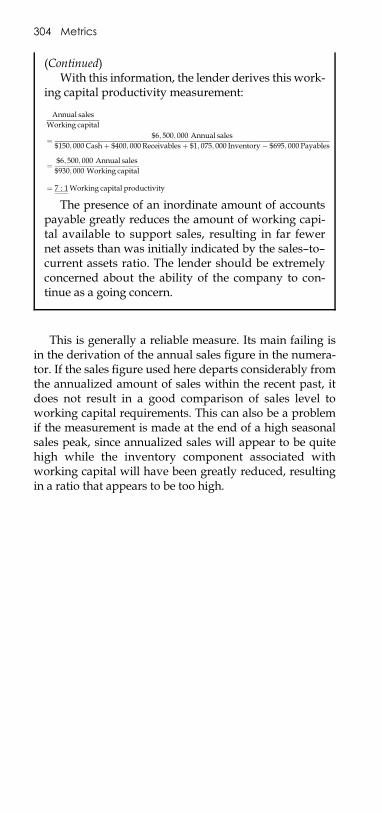
E1C18 03/04/2010 Page 304
This is generally a reliable measure. Its main failing isin the derivation of the annual sales figure in the numera-tor. If the sales figure used here departs considerably fromthe annualized amount of sales within the recent past, itdoes not result in a good comparison of sales level toworking capital requirements. This can also be a problemif the measurement is made at the end of a high seasonalsales peak, since annualized sales will appear to be quitehigh while the inventory component associated withworking capital will have been greatly reduced, resultingin a ratio that appears to be too high.
(Continued)With this information, the lender derives this work-
ing capital productivity measurement:
Annual salesWorking capital
¼ $6; 500; 000 Annual sales$150; 000 Cashþ $400; 000 Receivablesþ $1; 075; 000 Inventory� $695; 000 Payables
¼ $6; 500; 000 Annual sales$930; 000 Working capital
¼ 7 : 1Working capital productivity
The presence of an inordinate amount of accountspayable greatly reduces the amount of working capi-tal available to support sales, resulting in far fewernet assets than was initially indicated by the sales–to–current assets ratio. The lender should be extremelyconcerned about the ability of the company to con-tinue as a going concern.
304 Metrics

E1C19 03/04/2010 Page 305
PART IV
CONTROL SYSTEMS

E1C19 03/04/2010 Page 306
E1C19 03/04/2010 Page 307
CHAPTER 19
BUDGETING
Why Is Budgeting Important?
Budgeting provides the basis for the orderly manage-ment of activities within a company. A properly createdbudget will funnel funding into those activities that acompany has determined to be most essential, as definedin its strategic plan. Furthermore, it provides a bridge be-tween strategy and tactics by itemizing the precise tacti-cal events that will be funded, such as the hiring ofpersonnel or acquisition of equipment in a key depart-ment. Once the budget has been approved, it also acts asthe primary control point over expenditures, since itshould be compared to purchase requisitions prior topurchases being made, so that the level of allowed fund-ing can be ascertained. In addition, the results of specificdepartments can be compared to their budgets, provid-ing an excellent tool for determining the performance ofdepartment managers.
How Do the Various Budgets FitTogether?
A properly designed budget is a web of subsidiary-levelbudgets that account for the activities of virtually all areaswithin a company. As noted in Exhibit 19.1, the budgetbegins in two places, with both the revenue budget andresearch and development budget. The revenue budgetcontains the revenue figures that the company believes itcan achieve for each upcoming reporting period.
Another budget that initiates other activities within thesystem of budgets is the research and development bud-get. This is not related to the sales level at all but insteadis a discretionary budget that is based on the company’sstrategy to derive new or improved products. The deci-sion to fund a certain amount of project-related activity in
307
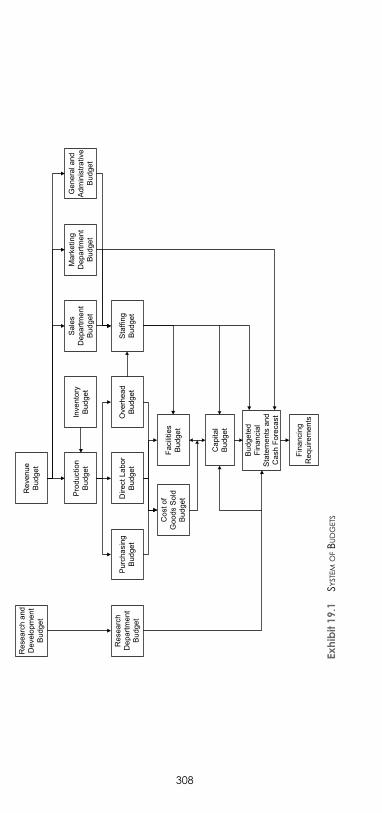
E1C19 03/04/2010 Page 308
Rev
enue
Bud
get
Res
earc
h an
dD
evel
opm
ent
Bud
get
Pro
duct
ion
Bud
get
Inve
ntor
yB
udge
t
Sal
esD
epar
tmen
tB
udge
t
Mar
ketin
gD
epar
tmen
tB
udge
t
Gen
eral
and
Adm
inis
trativ
eB
udge
t
Sta
ffing
Bud
get
Faci
litie
sB
udge
t
Dire
ct L
abor
Budg
etP
urch
asin
gB
udge
tO
verh
ead
Bud
get
Res
earc
hD
epar
tmen
tB
udge
t
Cos
t of
Goo
ds S
old
Bud
get
Bud
gete
dFi
nanc
ial
Sta
tem
ents
and
Cas
h Fo
reca
st
Fina
ncin
gR
equi
rem
ents
Cap
ital
Bud
get
Exhibit19.1
SYSTEM
OFBUDGETS
308
E1C19 03/04/2010 Page 309
this area will drive a departmental staffing and capitalbudget that is, for the most part, completely unrelated tothe activity conducted by the rest of the company.
These additional budgets are positioned beneath therevenue budget and the research and developmentbudget:
m Production budget. This budget is largely driven bythe sales estimates contained within the revenuebudget. However, it is also driven by the inventory-level assumptions in the inventory budget. The pro-duction budget is used to derive the unit quantity ofrequired products that must be manufactured in or-der to meet revenue targets for each budget period.
m Inventory budget. This budget contains estimates bythe materials management supervisor regarding theinventory levels that will be required for the upcom-ing budget period.
m Purchasing budget. This budget is driven by severalfactors, such as cost reduction initiatives, plannedsupplier consolidation, planned scrap levels, andlong-term contracts.
m Direct labor budget. This budget is based on such fac-tors as crewing rates by machine center, plannedefficiency levels, contracted union rates, and laborrates by seniority or experience level.
m Overhead budget. This budget includes such items asmachine maintenance, utilities, supervisory salaries,wages for the materials management, productionscheduling, and quality assurance personnel, facili-ties maintenance, and depreciation expenses.
m Cost of goods sold. The purchasing, direct labor, andoverhead budgets are summarized into a cost ofgoods sold budget. Since it is a summary-level bud-get for the production side of the budgeting process,this is a good place to itemize any production-related metrics.
m Sales department budget. This budget includes theexpenses that the sales staff must incur in order toachieve the revenue budget, such as travel andentertainment, as well as sales training.
m Marketing budget. This budget is closely tied to therevenue budget, for it contains all of the funding re-quired to roll out new products, merchandise themproperly, advertise for them, test new products, andso on.
m General and administrative budget. This budget con-tains the cost of the corporate management staff
How Do the Various Budgets Fit Together? 309
E1C19 03/04/2010 Page 310
plus all accounting, finance, and human resourcespersonnel.
m Staffing budget. This budget involves a feedback loopwith the direct labor budget, the general and admin-istrative budget, and the revenue budget.
m Facilities budget. This budget is based on the level ofactivity that is estimated in many of the budgetedalready described. It typically contains expense lineitems for building insurance, maintenance, repairs,janitorial services, utilities, and the salaries of themaintenance personnel employed in this function.
m Capital budget. This budget comprises either a sum-mary listing of all main fixed asset categories forwhich purchases are anticipated or a detailed listingof the same information.
m Financial statements. All of the preceding budgets aresummarized in a set of financial statements, whichshould at least include the income statement andcash flow statement.
m Financing alternatives. This category itemizes fundingneeds during each period itemized in the budget.Problems with required funding as noted in thisdocument will lead to iterations of the rest of thebudget, in order to make financing availabilitymatch the company’s operational considerations.
How Is the Revenue BudgetConstructed?
A sample revenue budget is shown in Exhibit 19.2. Theexhibit contains revenue estimates for three different prod-uct lines that are designated as Alpha, Beta, and Charlie.
The Alpha product line uses a budgeting format thatidentifies the specific quantities that are expected to besold in each quarter as well as the average price per unitsold. This format is most useful when there are not somany products that such a detailed delineation would cre-ate an excessively lengthy budget. It is a very useful for-mat, for the sales staff can go into the budget model andalter unit volumes and prices quite easily. An alternativeformat is to reveal this level of detail only for the mostimportant products and to lump the revenue from otherproducts into a single line item, as is the case for the Betaproduct line.
The most common budgeting format is used for theBeta product line, which avoids the use of detailed unitvolumes and prices in favor of a single lump-sum revenue
310 Budgeting
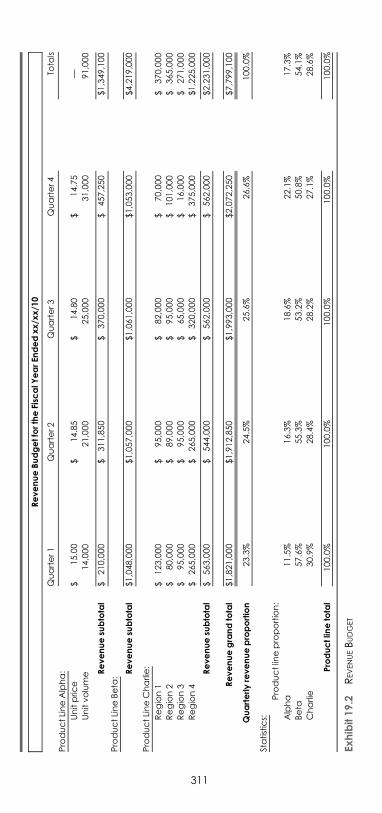
E1C19 03/04/2010 Page 311
RevenueBudgetfortheFisc
alY
earEn
dedxx/x
x/1
0
Quarter1
Quarter2
Quarter3
Quarter4
Tota
ls
ProductLineAlpha:
Unitpric
e$
15.00
$14.85
$14.80
$14.75
—
Unitvolume
14,000
21,000
25,000
31,000
91,000
Revenuesu
btotal
$210,000
$311,850
$370,000
$457,250
$1,349,100
ProductLineBeta
:
Revenuesu
btotal
$1,048,000
$1,057,000
$1,061,000
$1,053,000
$4,219,000
ProductLineCharlie:
Region1
$123,000
$95,000
$82,000
$70,000
$370,000
Region2
$80,000
$89,000
$95,000
$101,000
$365,000
Region3
$95,000
$95,000
$65,000
$16,000
$271,000
Region4
$265,000
$265,000
$320,000
$375,000
$1,225,000
Revenuesu
btotal
$563,000
$544,000
$562,000
$562,000
$2,231,000
Revenuegrandtotal
$1,821,000
$1,912,850
$1,993,000
$2,072,250
$7,799,100
Quarterlyrevenueproportion
23.3%
24.5%
25.6%
26.6%
100.0%
Statistics:
Productlin
eproportion:
Alpha
11.5%
16.3%
18.6%
22.1%
17.3%
Beta
57.6%
55.3%
53.2%
50.8%
54.1%
Charlie
30.9%
28.4%
28.2%
27.1%
28.6%
Productlin
etotal
100.0%
100.0%
100.0%
100.0%
100.0%
Exhibit19.2
REVENUEBUDGET
311
E1C19 03/04/2010 Page 312
total for each reporting period. This format is used whenthere are multiple products within each product line,making it cumbersome to create a detailed list of individ-ual products. However, this format is the least informa-tive and gives no easy way to update the supportinginformation.
Yet another budgeting format is shown for the Charlieproduct line, where projected sales are grouped by region.This format is most useful when there are many sales per-sonnel, each of whom has been assigned a specific terri-tory in which to operate. This budget can be used to judgethe ongoing performance of each salesperson.
There is also a metrics section at the bottom of the reve-nue budget that itemizes the proportion of total sales thatoccurs in each quarter, plus the proportion of product linesales within each quarter. Though it is not necessary touse these exact measurements, it is useful to include sometype of measure that informs the reader of any variationsin sales from period to period.
How Are the Production and InventoryBudgets Constructed?
Both the production and inventory budgets are shown inExhibit 19.3. The inventory budget is itemized at the topof the exhibit, where we itemize the amount of plannedinventory turnover in all three inventory categories. Thereis a considerable ramp-up in work-in-process (WIP) in-ventory turnover, indicating the planned installation of amanufacturing planning system that will control the flowof materials through the facility.
The production budget for just the Alpha product lineis shown directly below the inventory goals. This budgetis not concerned with the cost of production but with thenumber of units that will be produced. In this instance, webegin with an on-hand inventory of 15,000 units and try tokeep enough units on hand through the remainder of thebudget year to meet both the finished goods inventorygoal at the top of the exhibit and the number of requiredunits to be sold, which is referenced from the revenuebudget. The main problem is that the maximum capacityof the bottleneck operation is 20,000 units per quarter. Inorder to meet the revenue target, we must run that opera-tion at full bore through the first three quarters, irrespec-tive of the inventory turnover target. This is especiallyimportant because the budget indicates a jump in bottle-neck capacity in the fourth quarter from 20,000 to 40,000
312 Budgeting
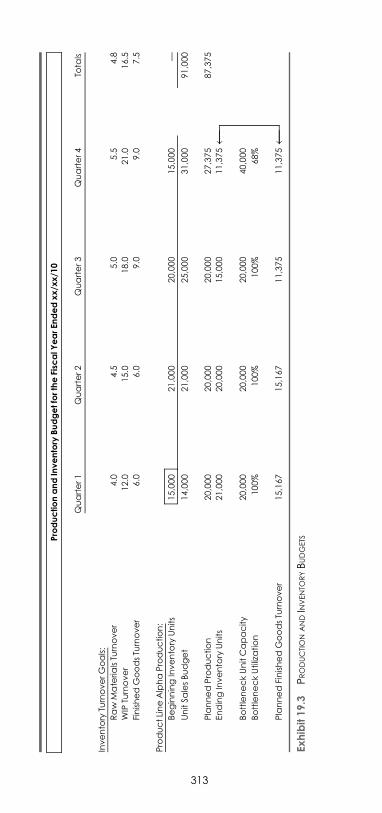
E1C19 03/04/2010 Page 313
ProductionandInventory
BudgetfortheFisc
alY
earEn
dedxx/x
x/1
0
Quarter1
Quarter2
Quarter3
Quarter4
Tota
ls
Inventory
TurnoverGoals:
Raw
Materia
lsTu
rnover
4.0
4.5
5.0
5.5
4.8
WIP
Turnover
12.0
15.0
18.0
21.0
16.5
FinishedGoodsTu
rnover
6.0
6.0
9.0
9.0
7.5
ProductLineAlphaProduction:
BeginningInventory
Units
15,000
21,000
20,000
15,000
—
UnitSa
lesBudget
14,000
21,000
25,000
31,000
91,000
PlannedProduction
20,000
20,000
20,000
27,375
87,375
EndingInventory
Units
21,000
20,000
15,000
11,375
BottleneckUnitCapacity
20,000
20,000
20,000
40,000
BottleneckUtilization
100%
100%
100%
68%
PlannedFinishedGoodsTu
rnover
15,167
15,167
11,375
11,375
Exhibit19.3
PRODUCTION
ANDIN
VENTO
RYBUDGETS
# #
313
E1C19 03/04/2010 Page 314
units—this will occur when the bottleneck operation isstopped for a short time while additional equipment isadded to it. During this stoppage, there must be enoughexcess inventory on hand to cover any sales that will arise.Consequently, production is planned for 20,000 units perquarter for the first three quarters, followed by a moreprecisely derived figure in the fourth quarter that will re-sult in inventory turns of 9.0 at the end of the year, exactlyas planned.
How Is the Purchasing BudgetConstructed?
The purchasing budget is shown in Exhibit 19.4. This con-tains several different formats for planning budgeted pur-chases for the Alpha product line. The first optionsummarizes the planned production for each quarter; thisinformation is brought forward from the production bud-get. We then multiply this by the standard unit cost ofmaterials to arrive at the total amount of purchases thatmust be made in order to adequately support sales. Thesecond option identifies the specific cost of each compo-nent of the product, so that management can see wherecost increases are expected to occur. Although this versionprovides more information, it occupies a great deal ofspace on the budget if there are many components in eachproduct, or many products. A third option is shown at thebottom of the exhibit that summarizes all purchases bycommodity type. This format is most useful for the com-pany’s buyers, who usually specialize in certain commod-ity types.
How Is the Direct Labor BudgetConstructed?
The direct labor budget is shown in Exhibit 19.5. This bud-get assumes that only one labor category will vary directlywith revenue volume—that category is the final assemblydepartment, where a percentage in the far right columnindicates that the cost in this area will be budgeted at afixed 3.5% of total revenues. In all other cases, there areassumptions for a fixed number of personnel in each posi-tion within each production department. All of the wagefigures for each department (except for final assembly)are derived from the planned hourly rates and headcountfigures noted at the bottom of the page. This budget canbe enhanced with the addition of separate line items for
314 Budgeting
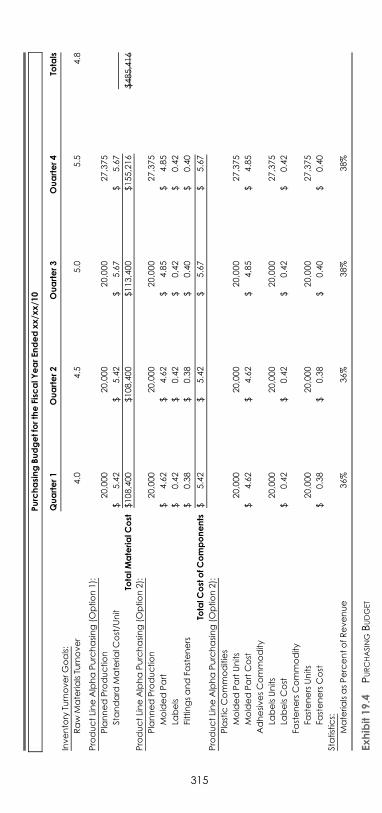
E1C19 03/04/2010 Page 315
PurchasingBudgetfortheFisc
alY
earEn
dedxx/x
x/1
0
Quarter1
Ouarter2
Ouarter3
Ouarter4
Totals
Inventory
TurnoverGoals:
Raw
Materia
lsTu
rnover
4.0
4.5
5.0
5.5
4.8
ProductLineAlphaPurchasing(O
ption1):
PlannedProduction
20,000
20,000
20,000
27,375
Standard
Materia
lCost/U
nit
$5.42
$5.42
$5.67
$5.67
TotalM
aterialC
ost
$108,400
$108,400
$113,400
$155,216
$485,416
ProductLineAlphaPurchasing(O
ption2):
PlannedProduction
20,000
20,000
20,000
27,375
MoldedPart
$4.62
$4.62
$4.85
$4.85
Labels
$0.42
$0.42
$0,42
$0.42
FittingsandFa
steners
$0.38
$0.38
$0.40
$0.40
TotalC
ostofC
omponents
$5.42
$5.42
$5.67
$5.67
ProductLineAlphaPurchasing(O
ption2):
Plastic
Commodities
MoldedPartUnits
20,000
20,000
20,000
27,375
MoldedPartCost
$4.62
$4.62
$4,85
$4.85
AdhesivesCommodity
LabelsUnits
20,000
20,000
20,000
27,375
LabelsCost
$0.42
$0.42
$0.42
$0.42
FastenersCommodity
FastenersUnits
20,000
20,000
20,000
27,375
FastenersCost
$0.38
$0.38
$0.40
$0.40
Statistics:
Materia
lsasPercentofRevenue
36%
36%
38%
38%
Exhibit19.4
PURCHASINGBUDGET
315
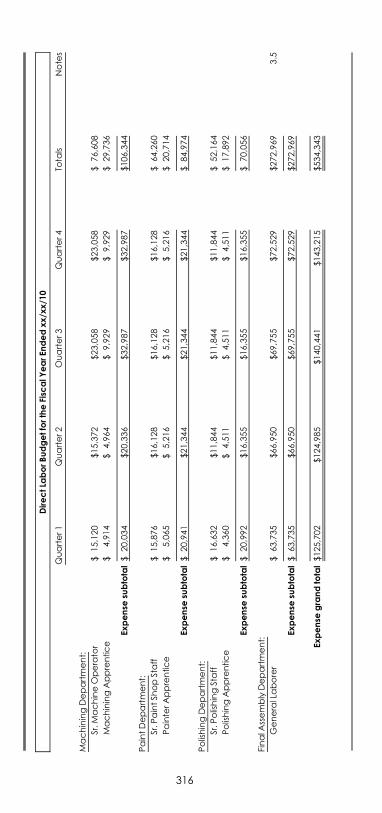
E1C19 03/04/2010 Page 316
DirectLa
borBudgetfortheFisc
alY
earEn
dedxx/x
x/1
0
Quarter1
Quarter2
Ouarter3
Quarter4
Tota
lsNotes
MachiningDepartment:
Sr.M
achineOperator
$15,120
$15,372
$23,058
$23,058
$76,608
MachiningApprentice
$4,914
$4,964
$9,929
$9,929
$29,736
Expense
subtotal$
20,034
$20,336
$32,987
$32,987
$106,344
PaintDepartment:
Sr.P
aintSh
opStaff
$15,876
$16,128
$16,128
$16,128
$64,260
PainterApprentice
$5,065
$5,216
$5,216
$5,216
$20,714
Expense
subtotal$
20,941
$21,344
$21,344
$21,344
$84,974
PolishingDepartment:
Sr.P
olishingStaff
$16,632
$11,844
$11,844
$11,844
$52,164
PolishingApprentice
$4,360
$4,511
$4,511
$4,511
$17,892
Expense
subtotal$
20,992
$16,355
$16,355
$16,355
$70,056
FinalA
ssemblyDepartment:
GeneralLaborer
$63,735
$66,950
$69,755
$72,529
$272,969
3.5
Expense
subtotal$
63,735
$66,950
$69,755
$72,529
$272,969
Expense
grandtotal$125,702
$124,985
$140,441
$143,215
$534,343
316
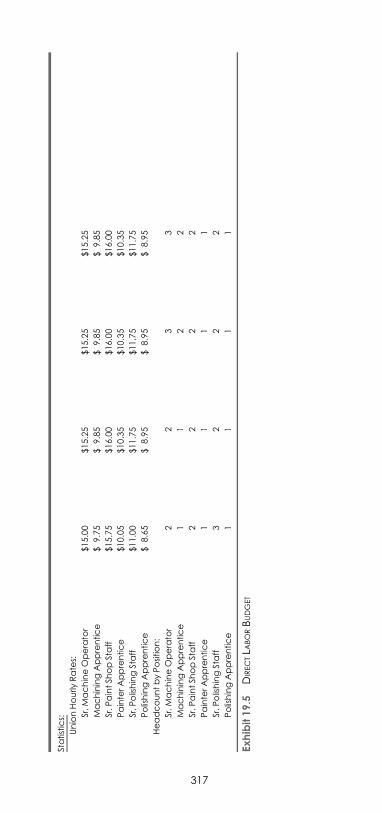
E1C19 03/04/2010 Page 317
Statistics:
UnionHourly
Rates:
Sr,M
achineOperator
$15.00
$15.25
$15.25
$15.25
MachiningApprentice
$9.75
$9.85
$9.85
$9.85
Sr.P
aintSh
opStaff
$15.75
$16.00
$16.00
$16.00
PainterApprentice
$10.05
$10.35
$10.35
$10.35
Sr,P
olishingStaff
$11.00
$11.75
$11,75
$11.75
PolishingApprentice
$8.65
$8.95
$8.95
$8.95
HeadcountbyPosition:
Sr.M
achineOperator
22
33
MachiningApprentice
11
22
Sr.P
aintSh
opStaff
22
22
PainterApprentice
11
11
Sr.P
olishingStaff
32
22
PolishingApprentice
11
11
Exhibit19.5
DIRECTLA
BORBUDGET
317
E1C19 03/04/2010 Page 318
payroll tax percentages, benefits, shift differential pay-ments, and overtime expenses.
How Is the Overhead BudgetConstructed?
A sample overhead budget is shown in Exhibit 19.6. Inthis exhibit, we see that the overhead budget is reallymade up of a number of subsidiary departments, suchas maintenance, materials management, and quality as-surance. If the budgets of any of these departments arelarge enough, it makes sense to split them off into aseparate budget, so that the managers of those depart-ments can see their budgeted expectations more clearly.Of particular interest is the valid capacity range notedon the far right side of the exhibit. This signifies theproduction activity level within which the budgetedoverhead costs are accurate. If the actual capacity utili-zation were to fall outside of this range, either high orlow, a separate overhead budget should be constructedwith costs that are expected to be incurred within thoseranges.
How Is the Cost of Goods Sold BudgetConstructed?
A sample cost of goods sold budget is shown in Exhibit19.7. This format splits out each of the product linesnoted in the revenue budget for reporting purposesand subtracts from each one the materials costs that arenoted in the purchases budget. This results in a contri-bution margin for each product line that is the clearestrepresentation of the impact of direct costs (i.e., mate-rial costs) on each one. We summarize these individualcontribution margins into a summary-level contributionmargin and subtract the total direct labor and overheadcosts (as referenced from the direct labor and overheadbudgets) to arrive at a total gross margin. The statisticssection also notes the number of production personnelbudgeted for each quarterly reporting period, plus theaverage annual revenue per production employee—these statistics can be replaced with any operational in-formation that management wants to see at a summarylevel for the production function, such as efficiency lev-els, capacity utilization, or inventory turnover.
318 Budgeting
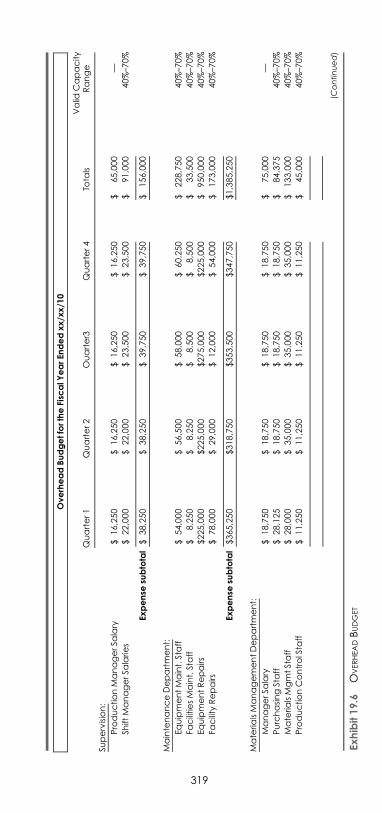
E1C19 03/04/2010 Page 319
OverheadBudgetfortheFisc
alY
earEn
dedxx/x
x/1
0
Quarter1
Quarter2
Ouarter3
Quarter4
Tota
lsValid
Capacity
Range
Supervision:
ProductionManagerSa
lary
$16,250
$16,250
$16,250
$16,250
$65,000
—
Shift
ManagerSa
larie
s$
22,000
$22,000
$23,500
$23,500
$91,000
40%–7
0%
Expense
subtotal$
38,250
$38,250
$39,750
$39,750
$156,000
MaintenanceDepartment:
EquipmentMaint.Staff
$54,000
$56,500
$58,000
$60,250
$228,750
40%–7
0%
FacilitiesMaint.Staff
$8,250
$8,250
$8,500
$8,500
$33,500
40%–7
0%
EquipmentRepairs
$225,000
$225,000
$275,000
$225,000
$950,000
40%–7
0%
Facility
Repairs
$78,000
$29,000
$12,000
$54,000
$173,000
40%–7
0%
Expense
subtotal$365,250
$318,750
$353,500
$347,750
$1,385,250
Materia
lsManagementDepartment:
ManagerSa
lary
$18,750
$18,750
$18,750
$18,750
$75,000
—
PurchasingStaff
$28,125
$18,750
$18,750
$18,750
$84,375
40%–7
0%
Materia
lsMgmtStaff
$28,000
$35,000
$35,000
$35,000
$133,000
40%–7
0%
ProductionControlSta
ff$
11,250
$11,250
$11,250
$11,250
$45,000
40%–7
0%
(Continued)
Exhibit19.6
OVERHEADBUDGET
319
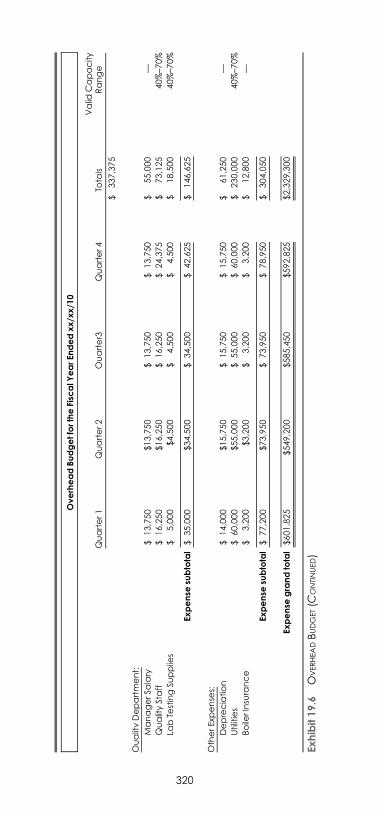
E1C19 03/04/2010 Page 320
$337,375
OualitvDepartment:
ManagerSa
lary
$13,750
$13,750
$13,750
$13,750
$55,000
—
QualityStaff
$16,250
$16,250
$16,250
$24,375
$73,125
40%–7
0%
LabTe
stingSu
pplie
s$
5,000
$4,500
$4,500
$4,500
$18,500
40%–7
0%
Expense
subtotal$
35,000
$34,500
$34,500
$42,625
$146,625
OtherExp
ense
s:
Depreciation
$14,000
$15,750
$15,750
$15,750
$61,250
—
Utilities
$60,000
$55,000
$55,000
$60,000
$230,000
40%–7
0%
Boile
rInsurance
$3,200
$3,200
$3,200
$3,200
$12,800
—
Expense
subtotal$
77,200
$73,950
$73,950
$78,950
$304,050
Expense
grandtotal$601,825
$549,200
$585,450
$592,825
$2,329,300
Exhibit19.6
OVERHEADBUDGET(C
ONTINUED)
OverheadBudgetfortheFisc
alY
earEn
dedxx/x
x/1
0
Quarter1
Quarter2
Ouarter3
Quarter4
Tota
lsValid
Capacity
Range
320
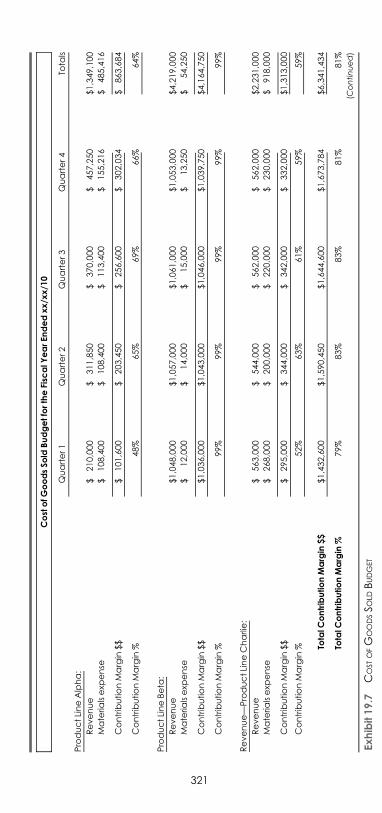
E1C19 03/04/2010 Page 321
CostofG
oodsSo
ldBudgetfortheFisc
alY
earEn
dedxx/x
x/1
0
Quarter1
Quarter2
Quarter3
Quarter4
Tota
ls
ProductLineAlpha:
Revenue
$210,000
$311,850
$370,000
$457,250
$1,349,100
Materia
lsexp
ense
$108,400
$108,400
$113,400
$155,216
$485,416
ContributionMargin
$$
$101,600
$203,450
$256,600
$302,034
$863,684
ContributionMargin
%48%
65%
69%
66%
64%
ProductLineBeta
:
Revenue
$1,048,000
$1,057,000
$1,061,000
$1,053,000
$4,219,000
Materia
lsexp
ense
$12,000
$14,000
$15,000
$13,250
$54,250
ContributionMargin
$$
$1,036,000
$1,043,000
$1,046,000
$1,039,750
$4,164,750
ContributionMargin
%99%
99%
99%
99%
99%
Revenue—ProductLineCharlie:
Revenue
$563,000
$544,000
$562,000
$562,000
$2,231,000
Materia
lsexp
ense
$268,000
$200,000
$220,000
$230,000
$918,000
ContributionMargin
$$
$295,000
$344,000
$342,000
$332,000
$1,313,000
ContributionMargin
%52%
63%
61%
59%
59%
TotalC
ontributionMargin
$$
$1,432,600
$1,590,450
$1,644,600
$1,673,784
$6,341,434
TotalC
ontributionMargin
%79%
83%
83%
81%
81%
(Continued)
Exhibit19.7
COST
OFG
OODSSO
LDBUDGET
321
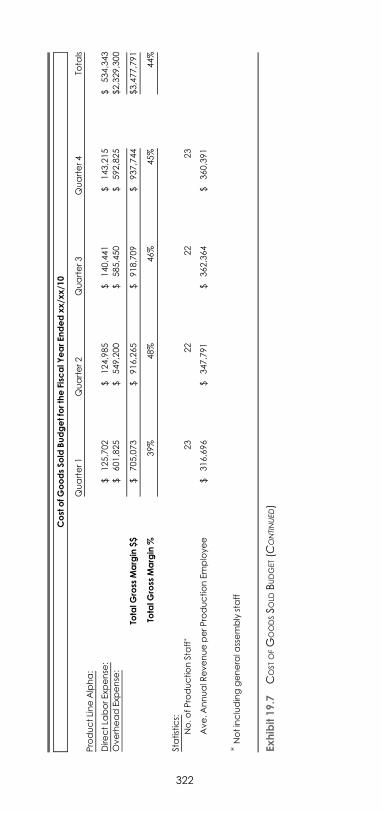
E1C19 03/04/2010 Page 322
Dire
ctLa
borExp
ense
:$
125,702
$124,985
$140,441
$143,215
$534,343
OverheadExp
ense
:$
601,825
$549,200
$585,450
$592,825
$2,329,300
TotalG
ross
Margin
$$
$705,073
$916,265
$918,709
$937,744
$3,477,791
TotalG
ross
Margin
%39%
48%
46%
45%
44%
Statistics:
No.o
fProductionStaff�
23
22
22
23
Ave.A
nnualR
evenueperProductionEmployee
$316,696
$347,791
$362,364
$360,391
�Notincludinggenerala
ssemblystaff
Exhibit19.7
COST
OFG
OODSSO
LDBUDGET(C
ONTINUED)
CostofG
oodsSo
ldBudgetfortheFisc
alY
earEn
dedxx/x
x/1
0
Quarter1
Quarter2
Quarter3
Quarter4
Tota
ls
ProductLineAlpha:
322
E1C19 03/04/2010 Page 323
How Is the Sales Department BudgetConstructed?
The sales department budget is shown in Exhibit 19.8.This budget shows several ways in which to organizebudget information. At the top of the budget is a block ofline items that lists the expenses for those overhead costswithin the department that cannot be specifically linked toa salesperson or region. In cases where the number ofsales staff is quite small, all of the department’s costs maybe listed in this area.
An alternative is shown in the second block of expenseline items in the middle of the sales department budget,where all of the sales costs for an entire product line arelumped together into a single line item. If each person onthe sales staff is exclusively assigned to a single productline, it may make sense to break down the budget intoseparate budget pages for each product line and list all ofthe expenses associated with each product line on a sepa-rate page.
Another alternative is shown next in the exhibit, wherewe list a summary of expenses for each salesperson. Thisformat works well when combined with the departmentaloverhead expenses at the top of the budget, since thisaccounts for all of the departmental costs.
A final option listed at the bottom of the exhibit is toitemize expenses by sales region. This format works bestwhen many sales personnel within the department areclustered into a number of clearly identifiable regions. Ifthere were no obvious regions or if there was only onesalesperson per region, the better format would be to listexpenses by salesperson.
How Is the Marketing BudgetConstructed?
Exhibit 19.9 shows a sample marketing budget. This bud-get itemizes departmental overhead costs at the top,which leaves space in the middle for the itemization ofcampaign-specific costs. The campaign-specific costs canbe lumped together for individual product lines, as is thecase for product lines Alpha and Beta in the exhibit, orwith subsidiary line items, as is shown for product lineCharlie. A third possible format, which is to itemize mar-keting costs by marketing tool (e.g., advertising, promo-tional tour, coupon redemption, etc.) is generally notrecommended if there is more than one product line, since
How Is the Marketing Budget Constructed? 323
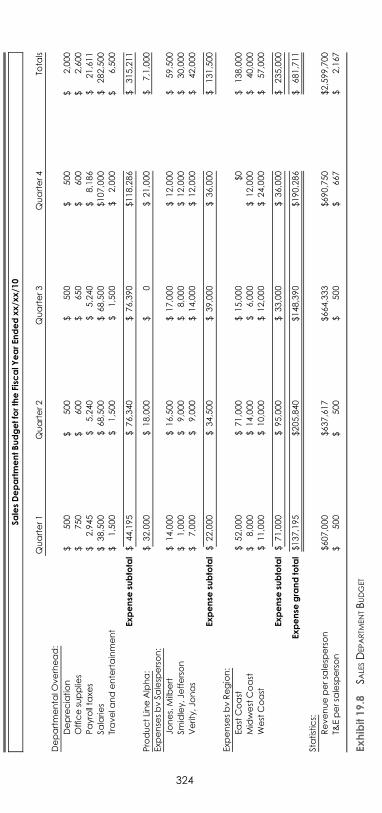
E1C19 03/04/2010 Page 324
SalesDepartmentBudgetfortheFisc
alY
earEn
dedxx/x
x/1
0
Quarter1
Quarter2
Quarter3
Quarter4
Tota
ls
Departmenta
lOverhead:
Depreciation
$500
$500
$500
$500
$2,000
Officesupplie
s$
750
$600
$650
$600
$2,600
Payrollta
xes
$2,945
$5,240
$5,240
$8,186
$21,611
Salarie
s$
38,500
$68,500
$68,500
$107,000
$282,500
Travela
ndentertainment
$1,500
$1,500
$1,500
$2,000
$6,500
Expense
subtotal$
44,195
$76,340
$76,390
$118,286
$315,211
ProductLineAlpha:
$32,000
$18,000
$0
$21,000
$7,1,000
Exp
ense
sbvSa
lesp
erson:
Jones,Milb
ert
$14,000
$16,500
$17,000
$12,000
$59,500
Smidley,Je
fferson
$1,000
$9,000
$8,000
$12,000
$30,000
Verity,Jonas
$7,000
$9,000
$14,000
$12,000
$42,000
Expense
subtotal$
22,000
$34,500
$39,000
$36,000
$131,500
Exp
ense
sbvRegion:
EastCoast
$52,000
$71,000
$15,000
$0
$138,000
MidwestCoast
$8,000
$14,000
$6,000
$12,000
$40,000
WestCoast
$11,000
$10,000
$12,000
$24,000
$57,000
Expense
subtotal$
71,000
$95,000
$33,000
$36,000
$235,000
Expense
grandtotal$137,195
$205,840
$148,390
$190,286
$681,711
Statistics:
Revenuepersa
lesp
erson
$607,000
$637,617
$664,333
$690,750
$2,599,700
T&Epersa
lesp
erson
$500
$500
$500
$667
$2,167
Exhibit19.8
SALESD
EPARTM
ENTBUDGET
324
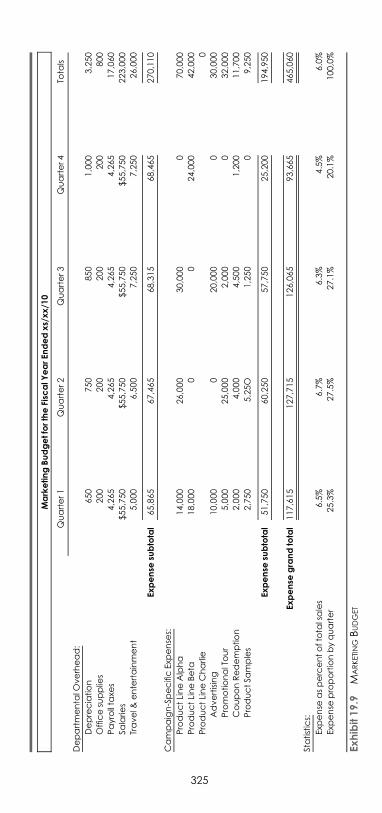
E1C19 03/04/2010 Page 325
MarketingBudgetfortheFisc
alY
earEn
dedxs/xx/1
0
Quarter1
Quarter2
Quarter3
Quarter4
Tota
ls
Departmenta
lOverhead:
Depreciation
650
750
850
1,000
3,250
Officesupplie
s200
200
200
200
800
Payrollta
xes
4,265
4,265
4,265
4,265
17,060
Salarie
s$55,750
$55,750
$55,750
$55,750
223,000
Travel&
entertainment
5,000
6,500
7,250
7,250
26,000
Expense
subtotal
65,865
67,465
68,315
68,465
270,110
Campaign-SpecificExp
ense
s:
ProductLineAlpha
14,000
26,000
30,000
070,000
ProductLineBeta
18,000
00
24,000
42,000
ProductLineCharlie
0
Advertising
10,000
020,000
030,000
PromotionalTour
5,000
25,000
2,000
032,000
CouponRedemption
2,000
4,000
4,500
1,200
11,700
ProductSa
mples
2,750
5,25O
1,250
09,250
Expense
subtotal
51,750
60,250
57,750
25,200
194,950
Expense
grandtotal
117,615
127,715
126,065
93,665
465,060
Statistics:
Exp
ense
aspercentoftota
lsales
6.5%
6.7%
6.3%
4.5%
6.0%
Exp
ense
proportionbyquarter
25.3%
27.5%
27.1%
20.1%
100,0%
Exhibit19.9
MARKETINGBUDGET
325
E1C19 03/04/2010 Page 326
there is no way to determine the impact of individualmarketing costs on specific product lines.
How Is the General and AdministrativeBudget Constructed?
A sample general and administrative budget is shown inExhibit 19.10. This budget can be quite lengthy, includingsuch additional line items as postage, copier leases, andoffice repair. Many of these extra expenses have beenpruned from the exhibit in order to provide a compressedview of the general format to be used. The exhibit doesnot lump together the costs of the various departmentsthat are typically included in this budget but rather identi-fies each one in separate blocks; this format is most usefulwhen there are separate managers for the accounting andhuman resources functions, so that they will have a betterunderstanding of their budgets. The statistics section atthe bottom of the page itemizes a benchmark target of thetotal general and administrative cost as a proportion ofrevenue. This is a particularly useful statistic to track,since the general and administrative function is a cost cen-ter and requires such a comparison to inform manage-ment that these costs are being held in check.
How Is the Staffing Budget Constructed?
A staffing budget is shown in Exhibit 19.11. This budgetitemizes the expected headcount in every department bymajor job category. It does not attempt to identify individ-ual positions, since that can lead to an excessively lengthylist. Also, because there may be multiple positions identi-fied within each job category, the average salary for eachcluster of jobs is identified. If a position is subject to over-time pay, its expected overtime percentage is identified onthe right side of the budget.
How Is the Facilities BudgetConstructed?
The facilities budget tends to have the largest number ofexpense line items. A sample of this format is shown inExhibit 19.12. A statistics section at the bottom of this bud-get refers to the total amount of square feet occupied bythe facility. A very effective statistic is the amount of un-used square footage, which can be used to conduct an
326 Budgeting
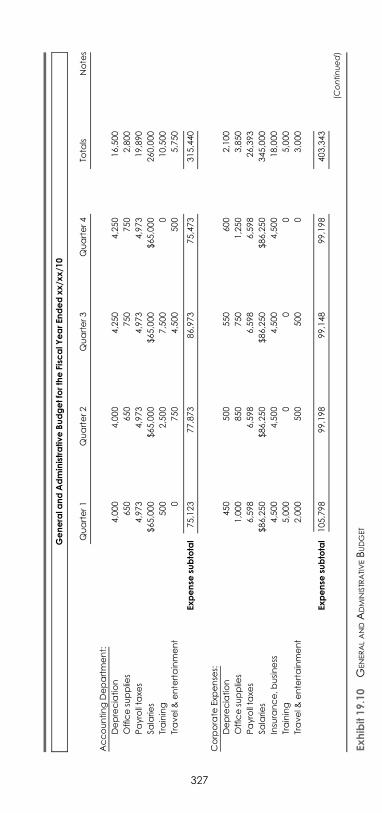
E1C19 03/04/2010 Page 327
Generala
ndAdministrativeBudgetfortheFisc
alY
earEn
dedxx/x
x/1
0
Quarter1
Quarter2
Quarter3
Quarter4
Tota
lsNotes
AccountingDepartment:
Depreciation
4,000
4,000
4,250
4,250
16,500
Officesupplie
s650
650
750
750
2,800
Payrollta
xes
4,973
4,973
4,973
4,973
19,890
Salarie
s$65,000
$65,000
$65,000
$65,000
260,000
Training
500
2,500
7,500
010,500
Travel&
entertainment
0750
4,500
500
5,750
Expense
subtotal
75,123
77,873
86,973
75,473
315,440
Corporate
Exp
ense
s:
Depreciation
450
500
550
600
2,100
Officesupplie
s1,000
850
750
1,250
3,850
Payrollta
xes
6,598
6,598
6,598
6,598
26,393
Salarie
s$86,250
$86,250
$86,250
$86,250
345,000
Insurance,business
4,500
4,500
4,500
4,500
18,000
Training
5,000
00
05,000
Travel&
entertainment
2,000
500
500
03,000
Expense
subtotal
105,798
99,198
99,148
99,198
403,343
(Continued)
Exhibit19.10
GENERALANDA
DMINISTR
ATIVEBUDGET
327
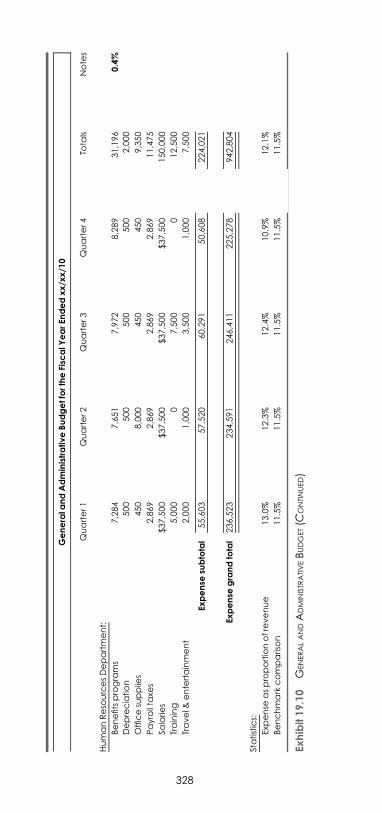
E1C19 03/04/2010 Page 328
HumanReso
urcesDepartment:
Benefitsprograms
7,284
7,651
7,972
8,289
31,196
0.4%
Depreciation
500
500
500
500
2,000
Officesupplie
s450
8,000
450
450
9,350
Payrollta
xes
2,869
2,869
2,869
2,869
11,475
Salarie
s$37,500
$37,500
$37,500
$37,500
150,000
Training
5,000
07,500
012,500
Travel&
entertainment
2,000
1,000
3,500
1,000
7,500
Expense
subtotal
55,603
57,520
60,291
50,608
224,021
Expense
grandtotal
236,523
234,591
246,411
225,278
942,804
Statistics:
Exp
ense
asproportionofrevenue
13.0%
12.3%
12.4%
10.9%
12.1%
Benchmark
comparison
11.5%
11.5%
11.5%
11.5%
11.5%
Exhibit19.10
GENERALANDA
DMINISTR
ATIVEBUDGET(C
ONTINUED)
Generala
ndAdministrativeBudgetfortheFisc
alY
earEn
dedxx/x
x/1
0
Quarter1
Quarter2
Quarter3
Quarter4
Tota
lsNotes
328
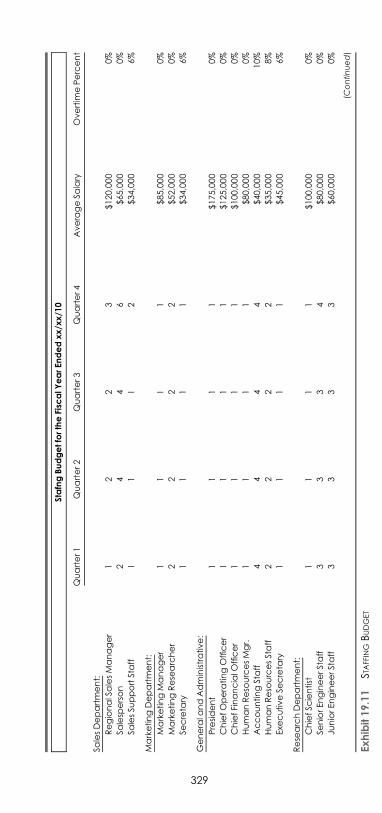
E1C19 03/04/2010 Page 329
StafngBudgetfortheFisc
alY
earEn
dedxx/x
x/1
0
Quarter1
Quarter2
Quarter3
Quarter4
AverageSa
lary
Overtim
ePercent
SalesDepartment:
RegionalSalesManager
12
23
$120,000
0%
Salesp
erson
24
46
$65,000
0%
SalesSu
pportStaff
I1
I2
$34,000
6%
MarketingDepartment:
MarketingManager
11
I1
$85,000
0%
MarketingRese
archer
22
22
$52,000
0%
Secreta
ry1
11
1$34,000
6%
Generala
ndAdministrative:
President
11
11
$175,000
0%
ChiefOperatingOfficer
I1
11
$125,000
0%
ChiefFinancialO
fficer
11
11
$100,000
0%
HumanReso
urcesMgr.
11
11
$80,000
0%
AccountingStaff
44
44
$40,000
10%
HumanReso
urcesStaff
22
22
$35,000
8%
Exe
cutiveSe
creta
ry1
11
1$45,000
6%
Rese
archDepartment:
ChiefSc
ientist
11
11
$100,000
0%
SeniorEngineerStaff
33
34
$80,000
0%
JuniorEngineerStaff
33
33
$60,000
0%
(Continued)
Exhibit19.11
STAFFINGBUDGET
329
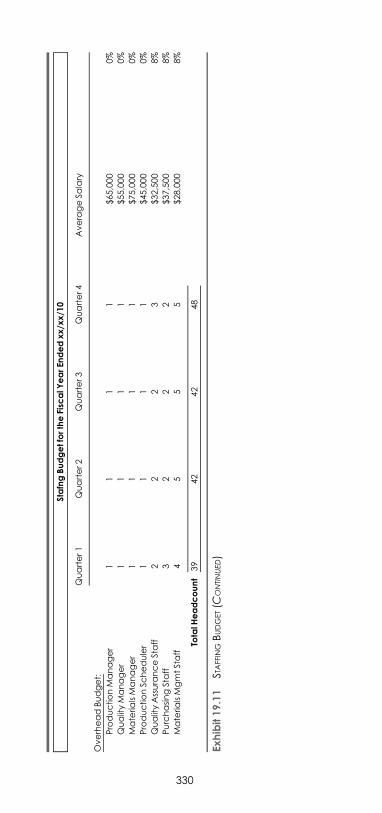
E1C19 03/04/2010 Page 330
OverheadBudget:
ProductionManager
11
11
$65,000
0%
QualityManager
11
11
$55,000
0%
Materia
lsManager
11
11
$75,000
0%
ProductionSc
heduler
11
11
$45,000
0%
QualityAssuranceStaff
22
23
$32,500
8%
PurchasingStaff
32
22
$37,500
8%
Materia
lsMgmtStaff
45
55
$28,000
8%
TotalH
eadcount
39
42
42
48
Exhibit19.11
STAFFINGBUDGET(C
ONTINUED)
StafngBudgetfortheFisc
alY
earEn
dedxx/x
x/1
0
Quarter1
Quarter2
Quarter3
Quarter4
AverageSa
lary
330
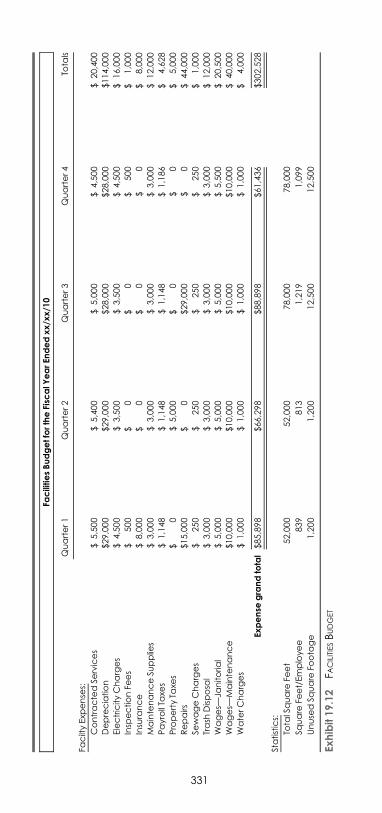
E1C19 03/04/2010 Page 331
FacilitiesBudgetfortheFisc
alY
earEn
dedxx/x
x/1
0
Quarter1
Quarter2
Quarter3
Quarter4
Tota
ls
FaciltyExp
ense
s:
ContractedSe
rvices
$5,500
$5,400
$5,000
$4,500
$20,400
Depreciation
$29,000
$29,000
$28,000
$28,000
$114,000
ElectricityCharges
$4,500
$3,500
$3,500
$4,500
$16,000
Insp
ectionFe
es
$500
$0
$0
$500
$1,000
Insurance
$8,000
$0
$0
$0
$8,000
MaintenanceSu
pplie
s$
3,000
$3,000
$3,000
$3,000
$12,000
PayrollTa
xes
$1,148
$1,148
$1,148
$1,186
$4,628
PropertyTa
xes
$0
$5,000
$0
$0
$5,000
Repairs
$15,000
$0
$29,000
$0
$44,000
SewageCharges
$250
$250
$250
$250
$1,000
Trash
Disposa
l$
3,000
$3,000
$3,000
$3,000
$12,000
Wages—
Janitoria
l$
5,000
$5,000
$5,000
$5,500
$20,500
Wages—
Maintenance
$10,000
$10,000
$10,000
$10,000
$40,000
WaterCharges
$1,000
$1,000
$1,000
$1,000
$4,000
Expense
grandtotal
$85,898
$66,298
$88,898
$61,436
$302,528
Statistics:
Tota
lSquare
Feet
52,000
52,000
78,000
78,000
Square
Feet/Employee
839
813
1,219
1,099
Unuse
dSq
uare
Foota
ge
1,200
1,200
12,500
12,500
Exhibit19.12
FACILITIESBUDGET
331
E1C19 03/04/2010 Page 332
ongoing program of selling off, renting, or consolidatingcompany facilities.
How Is the Research DepartmentBudget Constructed?
The research department’s budget is shown in Exhibit19.13. It is most common to segregate the department-spe-cific overhead that cannot be attributed to a specific proj-ect at the top of the budget and then cluster costs byproject below that. By doing so, the management teamcan see precisely how much money is being allocated toeach project. This may be of use in determining whichprojects must be canceled or delayed as part of the budgetreview process. The statistics section at the bottom of thebudget notes the proportion of planned expenses betweenthe categories of overhead, research, and development.These proportions can be examined to see if the companyis allocating funds to the right balance of projects thatmost effectively meets it product development goals.
How Is the Capital Budget Constructed?
The capital budget is shown in Exhibit 19.14. This formatclusters capital expenditures by a number of categories.For example, the first category, ‘‘bottleneck-related expen-ditures,’’ clearly focuses attention on those outgoing pay-ments that will increase the company’s key productioncapacity. The payments in the third quarter under thisheading are directly related to the increase in bottleneckcapacity that were shown the production budget for thefourth quarter. The budget also contains an automatic as-sumption of $7,000 in capital expenditures for any net in-crease in non–direct labor headcount, which encompassesthe cost of computer equipment and office furniture foreach person. If the company’s capitalization limit is settoo high to list these expenditures on the capital budget, asimilar line item should be inserted into the general andadministrative budget, so that the expense can be recog-nized under the office supplies or some similar account.
An alternative to this grouping system is to list onlythe sum total of all capital expenditures in each category,which is used most frequently when there are far toomany separate purchases to list on the budget. Anothervariation is to list only the largest expenditures on sepa-rate budget lines and cluster together all smaller ones. The
332 Budgeting
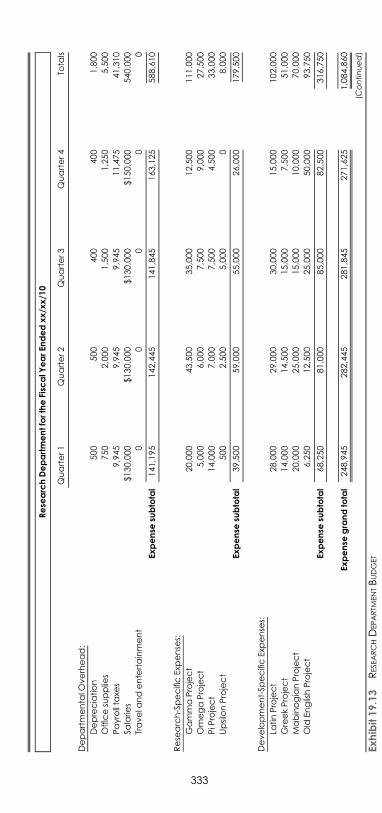
E1C19 03/04/2010 Page 333
Rese
archDepartmentfortheFisc
alY
earEn
dedxx/x
x/1
0
Quarter1
Quarter2
Quarter3
Quarter4
Tota
ls
Departmenta
lOverhead:
Depreciation
500
500
400
400
1,800
Officesupplie
s750
2,000
1,500
1,250
5,500
Payrollta
xes
9,945
9,945
9,945
11,475
41,310
Salarie
s$130,000
$130,000
$130,000
$150,000
540,000
Travela
ndentertainment
00
00
0
Expense
subtotal
141,195
142,445
141,845
163,125
588,610
Rese
arch-SpecificExp
ense
s:
GammaProject
20,000
43,500
35,000
12,500
111.000
OmegaProject
5,000
6,000
7,500
9,000
27,500
PiP
roject
14,000
7,000
7,500
4.500
33,000
UpsilonProject
500
2,500
5,000
08,000
Expense
subtotal
39,500
59,000
55,000
26,000
179,500
Development-Sp
ecificExp
ense
s:
LatinProject
28,000
29,000
30,000
15,000
102,000
GreekProject
14,000
14,500
15,000
7,500
51,000
MabinogianProject
20,000
25,000
15,000
10,000
70,000
Old
EnglishProject
6,250
12,500
25,000
50,000
93,750
Expense
subtotal
68,250
81,000
85,000
82,500
316,750
Expense
grandtotal
248,945
282,445
281,845
271,625
1,084,860
(Continued)
Exhibit19.13
RESE
ARCHD
EPARTM
ENTBUDGET
333
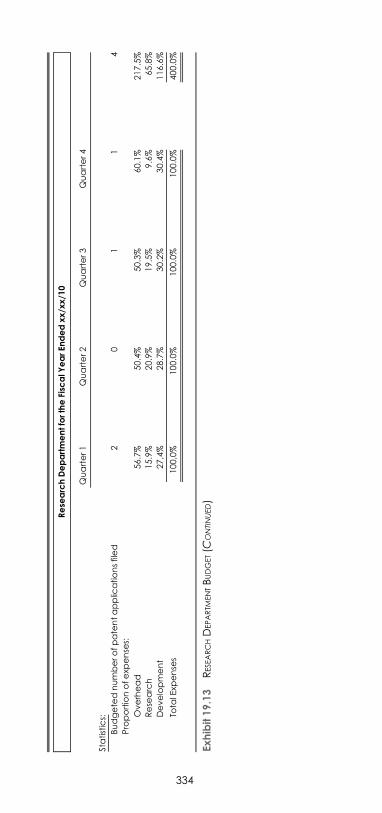
E1C19 03/04/2010 Page 334
Statistics:
Budgetednumberofpatentapplic
ationsfiled
20
11
4
Proportionofexp
ense
s:
Overhead
56.7%
50.4%
50.3%
60.1%
217.5%
Rese
arch
15.9%
20.9%
19.5%
9.6%
65.8%
Development
27,4%
28.7%
30.2%
30.4%
116.6%
Tota
lExp
ense
s100,0%
100.0%
100.0%
100.0%
400.0%
Exhibit19.13
RESE
ARCHD
EPARTM
ENTBUDGET(C
ONTINUED)
Rese
archDepartmentfortheFisc
alY
earEn
dedxx/x
x/1
0
Quarter1
Quarter2
Quarter3
Quarter4
334
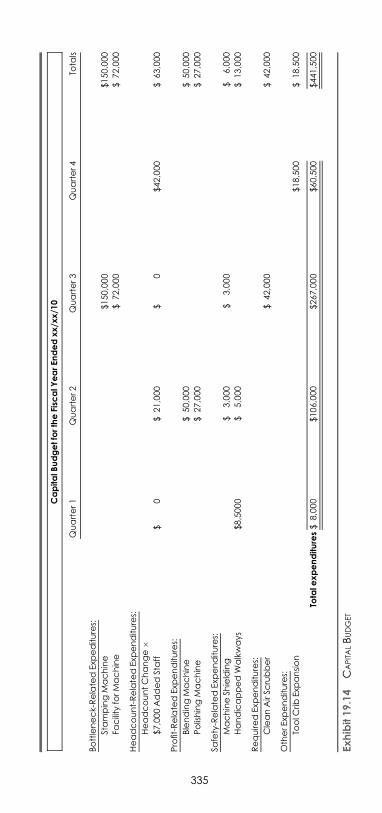
E1C19 03/04/2010 Page 335
CapitalB
udgetfortheFisc
alY
earEn
dedxx/x
x/1
0
Quarter1
Quarter2
Quarter3
Quarter4
Tota
ls
Bottleneck-RelatedExp
editures:
StampingMachine
$150,000
$150,000
Facility
forMachine
$72,000
$72,000
Headcount-RelatedExp
enditures:
HeadcountChange�
$7,000AddedStaff
$0
$21,000
$0
$42,000
$63,000
Profit-RelatedExp
enditures:
BlendingMachine
$50,000
$50,000
PolishingMachine
$27,000
$27,000
Safety-RelatedExp
enditures:
MachineSh
ielding
$3,000
$3,000
$6,000
HandicappedWalkways
$8,5000
$5,000
$13,000
Require
dExp
enditures:
CleanAirSc
rubber
$42,000
$42,000
OtherExp
enditures:
ToolC
ribExp
ansion
$18,500
$18,500
Totale
xpenditures$
8,000
$106,000
$267,000
$60,500
$441,500
Exhibit19.14
CAPITALBUDGET
335
E1C19 03/04/2010 Page 336
level of capital purchasing activity will determine the typeof format used.
How Are the Budgeted FinancialStatements Constructed?
All of the preceding budgets roll up into the budgetedincome and cash flow statement, which appears inExhibit 19.15. This format lists the grand totals fromeach preceding page of the budget in order to arrive ata profit or loss for each budget quarter. In the example,we see that a large initial loss in the first quarter is grad-ually offset by smaller gains in later quarters to arrive ata small profit for the year. However, the presentationcontinues with a cash flow statement that has less posi-tive results. It begins with the net profit figure for eachquarter, adds back the depreciation expense for all de-partments, and subtracts out all planned capital expen-ditures from the capital budget to arrive at cash flowneeds for the year. This tells us that the company willexperience a maximum cash shortfall in the third quar-ter. This format can be made more precise by adding intime lag factors for the payment of accounts payableand the collection of accounts receivable.
How Is the Financing BudgetConstructed?
The final document in the budget is an itemization of thefinances needed to ensure that the rest of the budget canbe achieved. An example is shown in Exhibit 19.16, whichcarries forward the final cash position at the end of eachquarter that was the product of the cash flow statement.This line shows that there will be a maximum shortfallof $223,727 by the end of the third quarter. The next sec-tion of the budget outlines several possible options forobtaining the required funds (which are rounded up to$225,000): debt, preferred stock, or common stock. Thefinancing cost of each one is noted in the far right column,where we see that the interest cost on debt is 9.5%, thedividend on preferred stock is 8%, and the expected re-turn by common stockholders is 18%.
The third section on of exhibit lists the existing capitalstructure, its cost, and the net cost of capital. The final sec-tion of the exhibit calculates any changes in the cost ofcapital that will arise if any of the three financing optionsare selected. In the exhibit, selecting additional debt as the
336 Budgeting
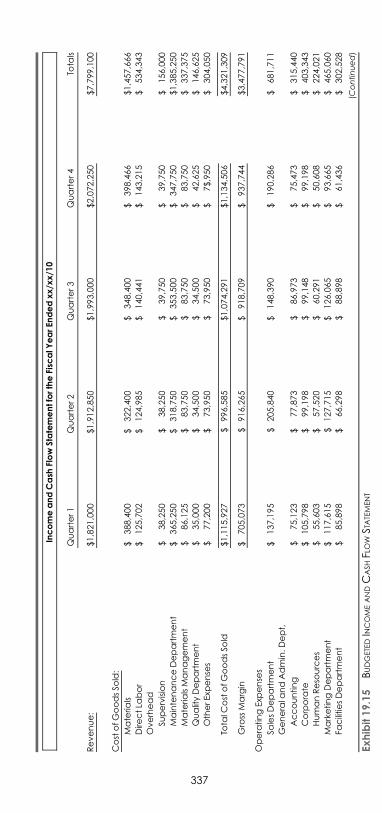
E1C19 03/04/2010 Page 337
IncomeandCash
Flow
StatementfortheFisc
alY
earEn
dedxx/x
x/1
0
Quarter1
Quarter2
Quarter3
Quarter4
Tota
ls
Revenue:
$1,821,000
$1,912,850
$1,993,000
$2,072,250
$7,799,100
CostofGoodsSo
ld:
Materia
ls$
388,400
$322,400
$348,400
$398,466
$1,457,666
Dire
ctLa
bor
$125,702
$124,985
$140,441
$143,215
$534,343
Overhead
Supervision
$38,250
$38,250
$39,750
$39,750
$156,000
MaintenanceDepartment
$365,250
$318,750
$353,500
$347,750
$1,385,250
Materia
lsManagement
$86,125
$83,750
$83,750
$83,750
$337,375
QualityDepartment
$35,000
$34,500
$34,500
$42,625
$146,625
OtherExp
ense
s$
77,200
$73,950
$73,950
$7$,950
$304,050
Tota
lCostofGoodsSo
ld$1,115,927
$996,585
$1,074,291
$1,134,506
$4,321,309
Gross
Margin
$705,073
$916,265
$918,709
$937,744
$3,477,791
OperatingExp
ense
s
SalesDepartment
$137,195
$205,840
$148,390
$190,286
$681,711
Generala
ndAdmin.D
ept,
Accounting
$75,123
$77,873
$86,973
$75,473
$315,440
Corporate
$105,798
$99,198
$99,148
$99,198
$403,343
HumanReso
urces
$55,603
$57,520
$60,291
$50,608
$224,021
MarketingDepartment
$117,615
$127,715
$126,065
$93,665
$465,060
FacilitiesDepartment
$85,898
$66,298
$88,898
$61,436
$302,528
(Continued)
Exhibit19.15
BUDGETEDIN
COMEANDC
ASH
FLOWST
ATEMENT
337
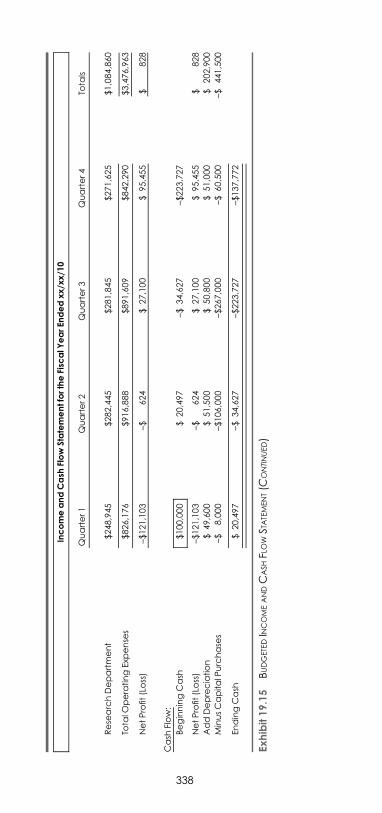
E1C19 03/04/2010 Page 338
Rese
archDepartment
$248,945
$282,445
$281,845
$271,625
$1,084,860
Tota
lOperatingExp
ense
s$826,176
$916,888
$891,609
$842,290
$3,476,963
NetProfit
(Loss)
–$121,103
–$624
$27,100
$95,455
$828
Cash
Flow:
BeginningCash
$100,000
$20,497
–$34,627
–$223,727
NetProfit
(Loss)
–$121,103
–$624
$27,100
$95,455
$828
AddDepreciation
$49,600
$51,500
$50,800
$51,000
$202,900
MinusCapitalP
urchase
s–$
8,000
–$106,000
–$267,000
–$60,500
–$441,500
EndingCash
$20,497
–$34,627
–$223,727
–$137,772
Exhibit19.15
BUDGETEDIN
COMEANDC
ASH
FLOWST
ATEMENT(C
ONTINUED)
IncomeandCash
Flow
StatementfortheFisc
alY
earEn
dedxx/x
x/1
0
Quarter1
Quarter2
Quarter3
Quarter4
Tota
ls
338
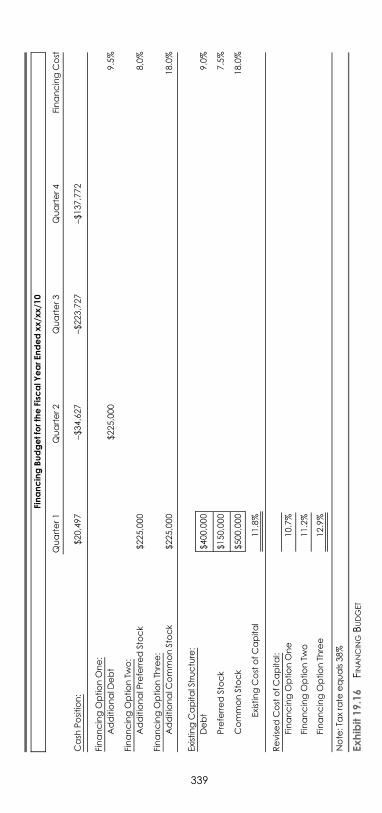
E1C19 03/04/2010 Page 339
FinancingBudgetfortheFisc
alY
earEn
dedxx/x
x/1
0
Quarter1
Quarter2
Quarter3
Quarter4
FinancingCost
Cash
Position:
$20,497
–$34,627
–$223,727
–$137,772
FinancingOptionOne:
AdditionalD
ebt
$225,000
9.5%
FinancingOptionTw
o:
AdditionalP
referredStock
$225,000
8,0%
FinancingOptionTh
ree:
AdditionalC
ommonStock
$225,000
18.0%
ExistingCapitalStructure:
Debt
$400,000
9.0%
PreferredStock
$150,000
7.5%
CommonStock
$500,000
18.0%
ExistingCostofCapital
11.8%
RevisedCostofCapital:
FinancingOptionOne
10.7%
FinancingOptionTw
o11.2%
FinancingOptionTh
ree
12.9%
Note:Taxrate
equals38%
Exhibit19.16
FINANCINGBUDGET
339
E1C19 03/04/2010 Page 340
preferred form of financing will result in a reduction inthe cost of capital to 10.7%, whereas a selection of high-cost common stock will result in an increase in the cost ofcapital, to 12.9%.
What Is a Flex Budget?
A flex budget itemizes different expense levels dependingon changes in the amount of actual revenue. In its sim-plest form, the flex budget uses percentages of revenuefor certain expenses rather than the usual fixed numbers.This allows for an infinite series of changes in budgetedexpenses that are directly tied to revenue volume. How-ever, this approach ignores changes to other costs that donot alter in accordance with small revenue variations.Consequently, a more sophisticated format will also incor-porate changes to many additional expenses when certainlarger revenue changes occur, thereby accounting for stepcosts. By making these changes to the budget, a companywill have a tool for comparing actual to budgeted per-formance at many levels of activity.
The flex budget can be difficult to formulate and ad-minister. One problem is that many costs are not fully var-iable, instead having a fixed cost component that must beincluded in the flex budget formula. Another issue is thata great deal of time can be spent developing step costs,which is more time than the typical controller has availa-ble, especially when in the midst of creating the standardbudget. Consequently, the flex budget tends to includeonly a small number of step costs as well as variable costswhose fixed cost components are not fully recognized.
340 Budgeting
E1C20 03/04/2010 Page 341
CHAPTER 20
CAPITAL BUDGETING
What Is Capital Budgeting?
Capital budgeting is the process of choosing which fixedassets to acquire. There are typically many possible invest-ments, so managers need a methodology for making in-vestments that include such factors as productionbottlenecks, capacity levels above and below the bottle-neck, safety, legal requirements, and risk.
What Are the Problems with CapitalBudgeting Analysis?
The traditional capital budgeting approach involvesreviewing a series of unrelated requests from throughoutthe company, each one asking for funding for variousprojects. Management decides whether to fund each re-quest based on the discounted cash flows projected foreach one. If there are not sufficient funds available for allrequests having positive discounted cash flows, thosewith the largest cash flows or highest percentage returnsare usually accepted first, until the funds run out.
There are three problems with this type of capitalbudgeting.
1. There is no consideration of how each requestedproject fits into the entire system of production. In-stead, most requests involve the local optimizationof specific work centers that may not contribute tothe total profitability of the company.
2. There is no consideration of the bottleneck opera-tion, so managers cannot tell which funding requestswill result in an improvement to the efficiency ofthat operation.
3. Managers tend to inflate the forecasted cash flows intheir requests, yielding inaccurate discounted cash
341
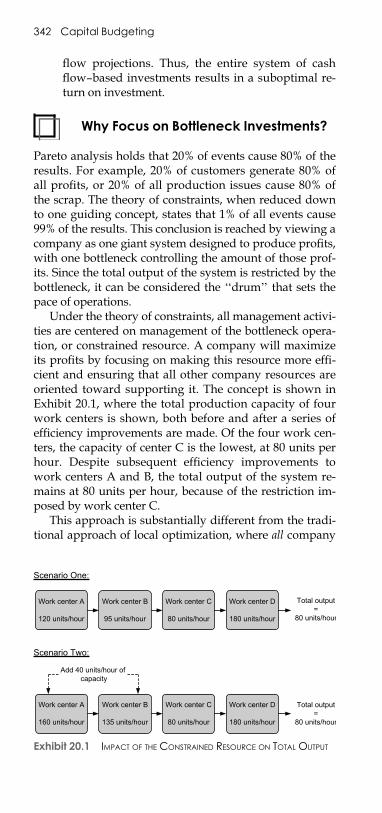
E1C20 03/04/2010 Page 342
flow projections. Thus, the entire system of cashflow–based investments results in a suboptimal re-turn on investment.
Why Focus on Bottleneck Investments?
Pareto analysis holds that 20% of events cause 80% of theresults. For example, 20% of customers generate 80% ofall profits, or 20% of all production issues cause 80% ofthe scrap. The theory of constraints, when reduced downto one guiding concept, states that 1% of all events cause99% of the results. This conclusion is reached by viewing acompany as one giant system designed to produce profits,with one bottleneck controlling the amount of those prof-its. Since the total output of the system is restricted by thebottleneck, it can be considered the ‘‘drum’’ that sets thepace of operations.
Under the theory of constraints, all management activi-ties are centered on management of the bottleneck opera-tion, or constrained resource. A company will maximizeits profits by focusing on making this resource more effi-cient and ensuring that all other company resources areoriented toward supporting it. The concept is shown inExhibit 20.1, where the total production capacity of fourwork centers is shown, both before and after a series ofefficiency improvements are made. Of the four work cen-ters, the capacity of center C is the lowest, at 80 units perhour. Despite subsequent efficiency improvements towork centers A and B, the total output of the system re-mains at 80 units per hour, because of the restriction im-posed by work center C.
This approach is substantially different from the tradi-tional approach of local optimization, where all company
Work center A
120 units/hour
Work center C
80 units/hour
Work center D
180 units/hour
Work center B
95 units/hour
Total output=
80 units/hour
Work center A
160 units/hour
Work center C
80 units/hour
Work center D
180 units/hour
Work center B
135 units/hour
Total output=
80 units/hour
Add 40 units/hour of capacity
Scenario One:
Scenario Two:
Exhibit 20.1 IMPACT OF THE CONSTRAINED RESOURCE ON TOTAL OUTPUT
342 Capital Budgeting
E1C20 03/04/2010 Page 343
operations are to be made as efficient as possible, withmachines and employees maximizing their work effortsat all times. The key difference between the two method-ologies is the view of efficiency: Should it be maximizedeverywhere, or just at the constrained resource? Theconstraints-based approach holds that any local optimiza-tion of a nonconstraint resource will simply allow it toproduce more than the constrained operation can handle,which results in excess inventory.
The preceding example shows that not only should ef-ficiency improvements not be made in areas other than theconstrained operation but that it is quite acceptable to noteven be efficient in these other areas. It is better to stopwork in a nonconstraint operation and idle its staff thanto have it churn out more inventory than can be used bythe constrained operation.
When Should I Invest in a BottleneckOperation?
In many cases, a company has specifically designated aresource to be its constraint, because it is so expensive toadd additional capacity. Given the cost of additional in-vestment, this decision is not to be taken lightly. The deci-sion process is to review the impact on the incrementalchange in throughput caused by the added investment,less any changes in operating expenses. Because this typeof investment represents a considerable step cost (wherecosts and/or the investment will jump considerably as aresult of the decision), management usually must makeits decision based on the perceived level of long-term
EXAMPLE
A furniture company discovers that its bottleneck op-eration is its paint shop. The company cannot producemore than 300 tables per day, because that maximizesthe capacity of the paint shop. If the company adds alathe to produce more table legs, this will only resultin the accumulation of an excessive quantity of tablelegs rather than the production of a larger number ofpainted tables. Thus, the investment in efficiencieselsewhere than the constrained operation will only in-crease costs without improving sales or profits.
When Should I Invest in a Bottleneck Operation? 343
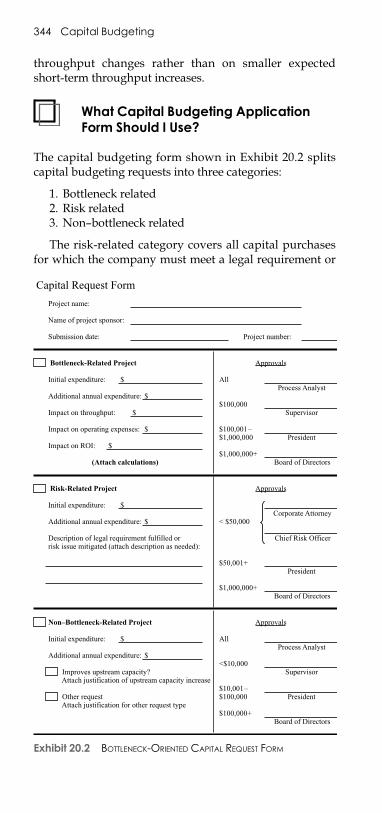
E1C20 03/04/2010 Page 344
throughput changes rather than on smaller expectedshort-term throughput increases.
What Capital Budgeting ApplicationForm Should I Use?
The capital budgeting form shown in Exhibit 20.2 splitscapital budgeting requests into three categories:
1. Bottleneck related2. Risk related3. Non–bottleneck related
The risk-related category covers all capital purchasesfor which the company must meet a legal requirement or
Capital Request Form
Project name:
Name of project sponsor:
Submission date: Project number:
Bottleneck-Related Project Approvals
Initial expenditure: $ All
Additional annual expenditure: $$100,000
Impact on throughput: $
Impact on operating expenses: $ $100,001–$1,000,000
Impact on ROI: $$1,000,000+
Risk-Related Project Approvals
Initial expenditure: $
Additional annual expenditure: $ < $50,000
Description of legal requirement fulfilled orrisk issue mitigated (attach description as needed):
$50,001+
$1,000,000+
Non–Bottleneck-Related Project Approvals
Initial expenditure: $ All
Additional annual expenditure: $<$10,000
Improves upstream capacity?Attach justification of upstream capacity increase
$10,001– Other request $100,000Attach justification for other request type
$100,000+
President
Chief Risk Officer
Corporate Attorney
Board of Directors
Process Analyst
Supervisor
President
Board of Directors
(Attach calculations)
Process Analyst
Supervisor
President
Board of Directors
Exhibit 20.2 BOTTLENECK-ORIENTED CAPITAL REQUEST FORM
344 Capital Budgeting
E1C20 03/04/2010 Page 345
for which there is a perception that the company is subjectto an undue amount of risk if it does not invest in an asset.All remaining requests that do not clearly fall into the bot-tleneck-related or risk-related categories drop into a catch-all category at the bottom of the form. The intent of thisformat is to clearly differentiate between different types ofapproval requests, with each one requiring different typesof analysis and management approval.
The approval levels vary significantly in this capital re-quest form. Approvals for bottleneck-related investmentsinclude a process analyst (who verifies that the requestwill actually impact the bottleneck) as well as generallyhigher-dollar approval levels by lower-level managers—the intent is to make it easier to approve capital requeststhat will improve the bottleneck operation. Approvals forrisk-related projects first require the joint approval of thecorporate attorney and chief risk officer, with added ap-provals for large expenditures. Finally, the approvals fornon–bottleneck-related purchases involve lower-dollarapproval levels, so the approval process is intentionallymade more difficult.
Should I Invest in UpstreamWorkstations?
The bottleneck operation should always have an adequateinventory buffer directly in front of it, so that it can maxi-mize its production rate, irrespective of any upstreamman-ufacturing problems. If there are severe upstreamproblems, the inventory buffer could be eliminated, lead-ing to the shutdown of the bottleneck operation, whichin turn directly reduces a company’s profitability. Conse-quently, it is extremely important to have a sufficientamount of upstream production capacity to rapidly refillthe inventory buffer in the event of a manufacturing prob-lem. This production capacity is called sprint capacity.
To guard against a drop in sprint capacity, the man-agement team should regularly monitor the capacity us-age levels of upstream workstations and make selectiveinvestments in those workstations whose sprint capacityhas dropped sufficiently to present a risk of imperiling thebottleneck operation’s inventory buffer.
The inventory buffer trend report shown in Exhibit20.3. The report shows an upper and lower boundary line,which represent tolerable boundaries for the percentageof all jobs where production problems caused the bufferto be eliminated. The small circles represent the daily
Should I Invest in UpstreamWorkstations? 345
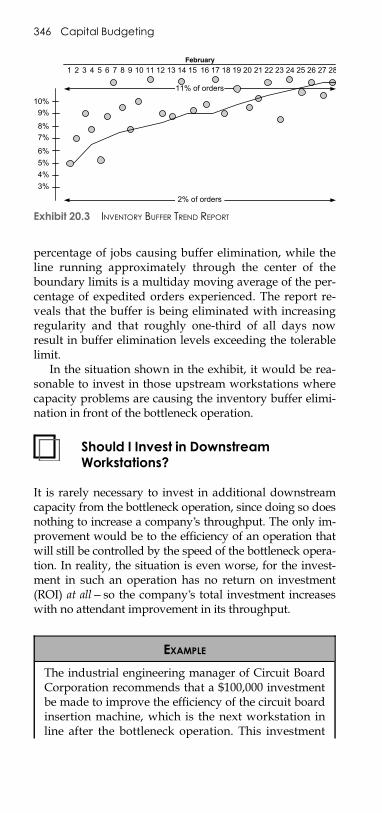
E1C20 03/04/2010 Page 346
percentage of jobs causing buffer elimination, while theline running approximately through the center of theboundary limits is a multiday moving average of the per-centage of expedited orders experienced. The report re-veals that the buffer is being eliminated with increasingregularity and that roughly one-third of all days nowresult in buffer elimination levels exceeding the tolerablelimit.
In the situation shown in the exhibit, it would be rea-sonable to invest in those upstream workstations wherecapacity problems are causing the inventory buffer elimi-nation in front of the bottleneck operation.
Should I Invest in DownstreamWorkstations?
It is rarely necessary to invest in additional downstreamcapacity from the bottleneck operation, since doing so doesnothing to increase a company’s throughput. The only im-provement would be to the efficiency of an operation thatwill still be controlled by the speed of the bottleneck opera-tion. In reality, the situation is even worse, for the invest-ment in such an operation has no return on investment(ROI) at all—so the company’s total investment increaseswith no attendant improvement in its throughput.
2% of orders
3%4%5%6%
7%8%
9%10%
February
11% of orders
Exhibit 20.3 INVENTORY BUFFER TREND REPORT
EXAMPLE
The industrial engineering manager of Circuit BoardCorporation recommends that a $100,000 investmentbe made to improve the efficiency of the circuit boardinsertion machine, which is the next workstation inline after the bottleneck operation. This investment
346 Capital Budgeting
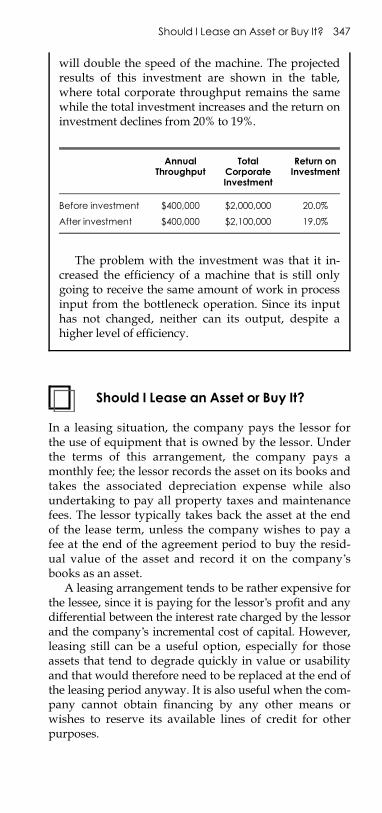
E1C20 03/04/2010 Page 347
Should I Lease an Asset or Buy It?
In a leasing situation, the company pays the lessor forthe use of equipment that is owned by the lessor. Underthe terms of this arrangement, the company pays amonthly fee; the lessor records the asset on its books andtakes the associated depreciation expense while alsoundertaking to pay all property taxes and maintenancefees. The lessor typically takes back the asset at the endof the lease term, unless the company wishes to pay afee at the end of the agreement period to buy the resid-ual value of the asset and record it on the company’sbooks as an asset.
A leasing arrangement tends to be rather expensive forthe lessee, since it is paying for the lessor’s profit and anydifferential between the interest rate charged by the lessorand the company’s incremental cost of capital. However,leasing still can be a useful option, especially for thoseassets that tend to degrade quickly in value or usabilityand that would therefore need to be replaced at the end ofthe leasing period anyway. It is also useful when the com-pany cannot obtain financing by any other means orwishes to reserve its available lines of credit for otherpurposes.
will double the speed of the machine. The projectedresults of this investment are shown in the table,where total corporate throughput remains the samewhile the total investment increases and the return oninvestment declines from 20% to 19%.
AnnualThroughput
TotalCorporateInvestment
Return onInvestment
Before investment $400,000 $2,000,000 20.0%
After investment $400,000 $2,100,000 19.0%
The problem with the investment was that it in-creased the efficiency of a machine that is still onlygoing to receive the same amount of work in processinput from the bottleneck operation. Since its inputhas not changed, neither can its output, despite ahigher level of efficiency.
Should I Lease an Asset or Buy It? 347
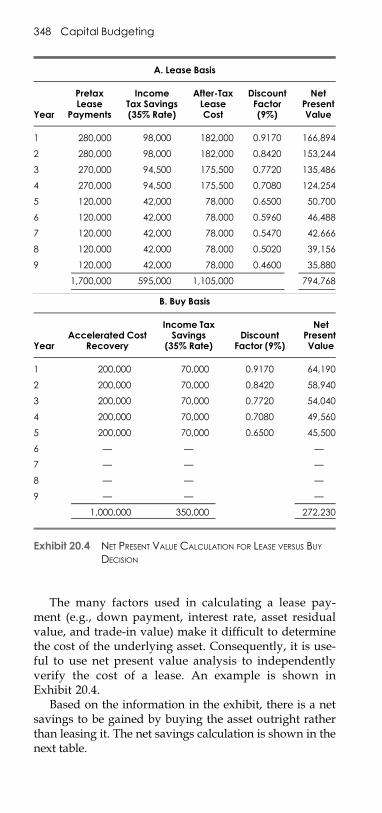
E1C20 03/04/2010 Page 348
The many factors used in calculating a lease pay-ment (e.g., down payment, interest rate, asset residualvalue, and trade-in value) make it difficult to determinethe cost of the underlying asset. Consequently, it is use-ful to use net present value analysis to independentlyverify the cost of a lease. An example is shown inExhibit 20.4.
Based on the information in the exhibit, there is a netsavings to be gained by buying the asset outright ratherthan leasing it. The net savings calculation is shown in thenext table.
A. Lease Basis
Year
PretaxLease
Payments
IncomeTax Savings(35% Rate)
After-TaxLeaseCost
DiscountFactor(9%)
NetPresentValue
1 280,000 98,000 182,000 0.9170 166,894
2 280,000 98,000 182,000 0.8420 153,244
3 270,000 94,500 175,500 0.7720 135,486
4 270,000 94,500 175,500 0.7080 124,254
5 120,000 42,000 78,000 0.6500 50,700
6 120,000 42,000 78,000 0.5960 46,488
7 120,000 42,000 78,000 0.5470 42,666
8 120,000 42,000 78,000 0.5020 39,156
9 120,000 42,000 78,000 0.4600 35,880
1,700,000 595,000 1,105,000 794,768
B. Buy Basis
YearAccelerated Cost
Recovery
Income TaxSavings
(35% Rate)Discount
Factor (9%)
NetPresentValue
1 200,000 70,000 0.9170 64,190
2 200,000 70,000 0.8420 58,940
3 200,000 70,000 0.7720 54,040
4 200,000 70,000 0.7080 49,560
5 200,000 70,000 0.6500 45,500
6 — — —
7 — — —
8 — — —
9 — — —
1,000,000 350,000 272,230
Exhibit 20.4 NET PRESENT VALUE CALCULATION FOR LEASE VERSUS BUY
DECISION
348 Capital Budgeting
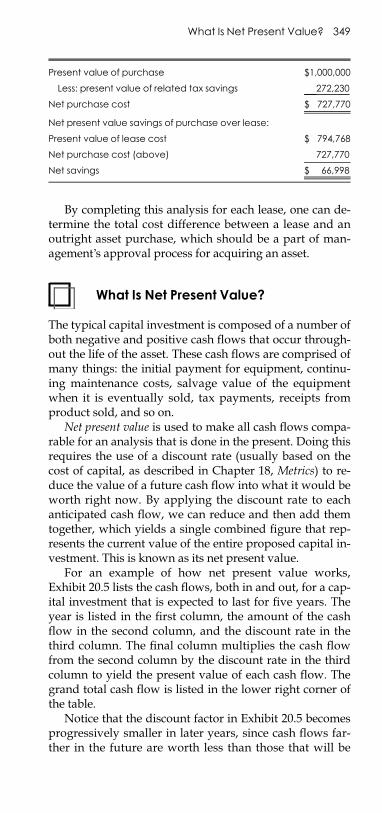
E1C20 03/04/2010 Page 349
Present value of purchase $1,000,000
Less: present value of related tax savings 272,230
Net purchase cost $ 727,770
Net present value savings of purchase over lease:
Present value of lease cost $ 794,768
Net purchase cost (above) 727,770
Net savings $ 66,998
By completing this analysis for each lease, one can de-termine the total cost difference between a lease and anoutright asset purchase, which should be a part of man-agement’s approval process for acquiring an asset.
What Is Net Present Value?
The typical capital investment is composed of a number ofboth negative and positive cash flows that occur through-out the life of the asset. These cash flows are comprised ofmany things: the initial payment for equipment, continu-ing maintenance costs, salvage value of the equipmentwhen it is eventually sold, tax payments, receipts fromproduct sold, and so on.
Net present value is used to make all cash flows compa-rable for an analysis that is done in the present. Doing thisrequires the use of a discount rate (usually based on thecost of capital, as described in Chapter 18, Metrics) to re-duce the value of a future cash flow into what it would beworth right now. By applying the discount rate to eachanticipated cash flow, we can reduce and then add themtogether, which yields a single combined figure that rep-resents the current value of the entire proposed capital in-vestment. This is known as its net present value.
For an example of how net present value works,Exhibit 20.5 lists the cash flows, both in and out, for a cap-ital investment that is expected to last for five years. Theyear is listed in the first column, the amount of the cashflow in the second column, and the discount rate in thethird column. The final column multiplies the cash flowfrom the second column by the discount rate in the thirdcolumn to yield the present value of each cash flow. Thegrand total cash flow is listed in the lower right corner ofthe table.
Notice that the discount factor in Exhibit 20.5 becomesprogressively smaller in later years, since cash flows far-ther in the future are worth less than those that will be
What Is Net Present Value? 349
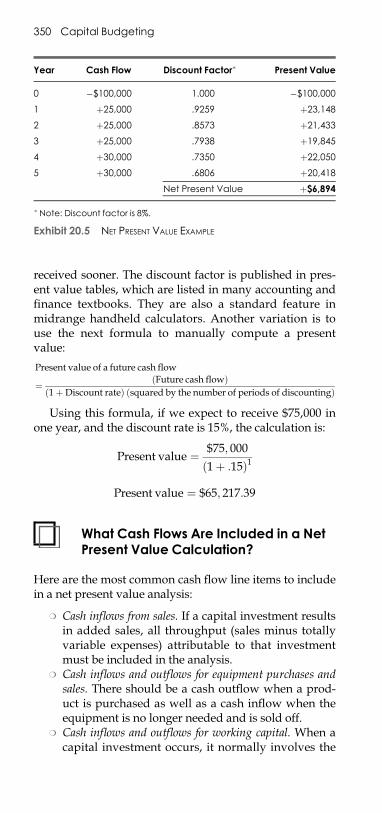
E1C20 03/04/2010 Page 350
received sooner. The discount factor is published in pres-ent value tables, which are listed in many accounting andfinance textbooks. They are also a standard feature inmidrange handheld calculators. Another variation is touse the next formula to manually compute a presentvalue:
Present value of a future cash flow
¼ ðFuture cash flowÞð1þDiscount rateÞ ðsquared by the number of periods of discountingÞ
Using this formula, if we expect to receive $75,000 inone year, and the discount rate is 15%, the calculation is:
Present value ¼ $75; 000ð1þ :15Þ1
Present value ¼ $65; 217:39
What Cash Flows Are Included in a NetPresent Value Calculation?
Here are the most common cash flow line items to includein a net present value analysis:
m Cash inflows from sales. If a capital investment resultsin added sales, all throughput (sales minus totallyvariable expenses) attributable to that investmentmust be included in the analysis.
m Cash inflows and outflows for equipment purchases andsales. There should be a cash outflow when a prod-uct is purchased as well as a cash inflow when theequipment is no longer needed and is sold off.
m Cash inflows and outflows for working capital. When acapital investment occurs, it normally involves the
Year Cash Flow Discount Factor� Present Value
0 �$100,000 1.000 �$100,000
1 þ25,000 .9259 þ23,148
2 þ25,000 .8573 þ21,433
3 þ25,000 .7938 þ19,845
4 þ30,000 .7350 þ22,050
5 þ30,000 .6806 þ20,418
Net Present Value þ$6,894
� Note: Discount factor is 8%.
Exhibit 20.5 NET PRESENT VALUE EXAMPLE
350 Capital Budgeting
E1C20 03/04/2010 Page 351
use of some additional inventory. If there are addedsales, there will probably be additional accounts re-ceivable. In either case, these are additional invest-ments that must be included in the analysis as cashoutflows. Also, if the investment is ever terminated,the inventory will presumably be sold off and theaccounts receivable collected, so there should be lineitems in the analysis, located at the end of the projecttime line, showing the cash inflows from the liquida-tion of working capital.
m Cash outflows for maintenance. If there is productionequipment involved, there will be periodic mainte-nance needed to ensure that it runs properly.
m Cash outflows for taxes. If there is a profit from newsales that are attributable to the capital investment,the incremental income tax that can be traced tothose incremental sales must be included in the anal-ysis. Also, if there is a significant quantity of produc-tion equipment involved, the annual personalproperty taxes that can be traced to that equipmentshould also be included.
m Cash inflows for the tax effect of depreciation. Deprecia-tion is an allowable tax deduction. Accordingly, thedepreciation created by the purchase of capital equip-ment should be offset against the cash outflow causedby income taxes. Although depreciation is really justan accrual, it does have a net cash flow impact causedby a reduction in taxes and so should be included inthe net present value calculation.
What Is Investment Payback?
Investment payback is the period of time required to re-coup the amount of the original investment. The net pres-ent value method does not fully explain investment risk,which is the chance that the initial investment will not beearned back or that the rate of return target will not bemet. Discounting can be used to identify or weed out suchprojects, simply by increasing the hurdle rate. For exam-ple, if a project is perceived to be risky, an increase in thehurdle rate will reduce its net present value, which makesthe investment less likely to be approved by management.However, management may not be comfortable dealingwith discounted cash flow methods when looking at arisky investment—it just wants to know how long it willtake until the company gets its invested funds back; thepayback method is the solution.
What Is Investment Payback? 351
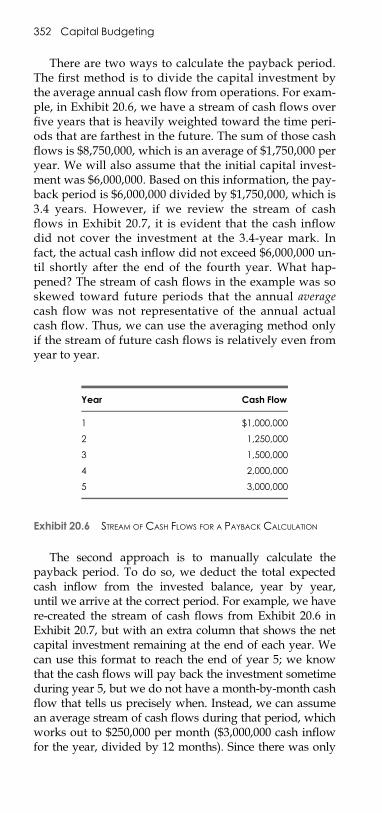
E1C20 03/04/2010 Page 352
There are two ways to calculate the payback period.The first method is to divide the capital investment bythe average annual cash flow from operations. For exam-ple, in Exhibit 20.6, we have a stream of cash flows overfive years that is heavily weighted toward the time peri-ods that are farthest in the future. The sum of those cashflows is $8,750,000, which is an average of $1,750,000 peryear. We will also assume that the initial capital invest-ment was $6,000,000. Based on this information, the pay-back period is $6,000,000 divided by $1,750,000, which is3.4 years. However, if we review the stream of cashflows in Exhibit 20.7, it is evident that the cash inflowdid not cover the investment at the 3.4-year mark. Infact, the actual cash inflow did not exceed $6,000,000 un-til shortly after the end of the fourth year. What hap-pened? The stream of cash flows in the example was soskewed toward future periods that the annual averagecash flow was not representative of the annual actualcash flow. Thus, we can use the averaging method onlyif the stream of future cash flows is relatively even fromyear to year.
The second approach is to manually calculate thepayback period. To do so, we deduct the total expectedcash inflow from the invested balance, year by year,until we arrive at the correct period. For example, we havere-created the stream of cash flows from Exhibit 20.6 inExhibit 20.7, but with an extra column that shows the netcapital investment remaining at the end of each year. Wecan use this format to reach the end of year 5; we knowthat the cash flows will pay back the investment sometimeduring year 5, but we do not have a month-by-month cashflow that tells us precisely when. Instead, we can assumean average stream of cash flows during that period, whichworks out to $250,000 per month ($3,000,000 cash inflowfor the year, divided by 12 months). Since there was only
Year Cash Flow
1 $1,000,000
2 1,250,000
3 1,500,000
4 2,000,000
5 3,000,000
Exhibit 20.6 STREAM OF CASH FLOWS FOR A PAYBACK CALCULATION
352 Capital Budgeting
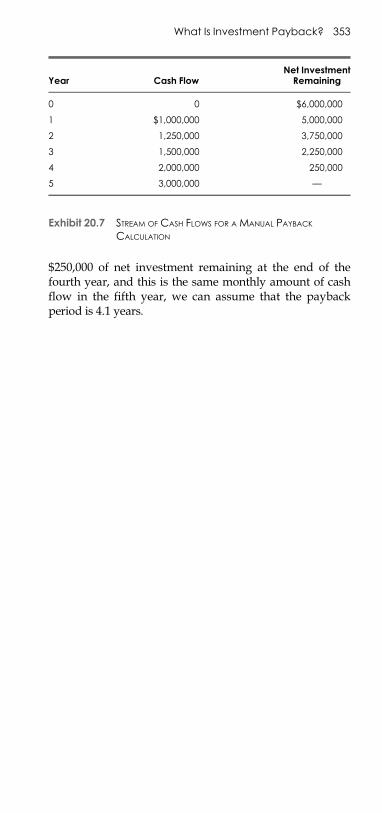
E1C20 03/04/2010 Page 353
$250,000 of net investment remaining at the end of thefourth year, and this is the same monthly amount of cashflow in the fifth year, we can assume that the paybackperiod is 4.1 years.
Year Cash FlowNet Investment
Remaining
0 0 $6,000,000
1 $1,000,000 5,000,000
2 1,250,000 3,750,000
3 1,500,000 2,250,000
4 2,000,000 250,000
5 3,000,000 —
Exhibit 20.7 STREAM OF CASH FLOWS FOR A MANUAL PAYBACK
CALCULATION
What Is Investment Payback? 353

E1C20 03/04/2010 Page 354
E1C21 03/10/2010 Page 355
CHAPTER 21
CONTROL SYSTEMS
What Are the Controls for aComputerized AccountsPayable System?
The accounts payable process flow is shown inExhibit 21.1. This process takes advantage of the basicfeatures of a computerized accounting system, includingthe minimum set of controls needed to ensure that it oper-ates properly.
The controls noted in the flowchart are described in thenext bullet points, in sequence from the top of the flow-chart to the bottom.
m Automatic duplicate invoice number search. The account-ing software automatically checks to see if a supplier’sinvoice number has already been entered, and warnsthe user if this is the case, thereby avoiding the needfor manual investigation of potentially duplicateinvoices.
m Conduct 3-way match. The payables staff comparesthe pricing and quantities listed on the supplier in-voice to the quantities actually received, as per re-ceiving documents, and the price originally agreedto, as noted in the company’s purchase order.
m Print report showing payables by due date. Since thecomputer system stores the invoice date and num-ber of days allowed until payment, it can report tothe user the exact date on which payment must bemade for each invoice, thereby eliminating the needto manually monitor this information.
m Check stock from locked storage. Unused check stockshould always be kept in a locked storage cabinet.In addition, the range of check numbers used shouldbe stored in a separate location and cross-checkedagainst the check numbers on the stored checks, to
355
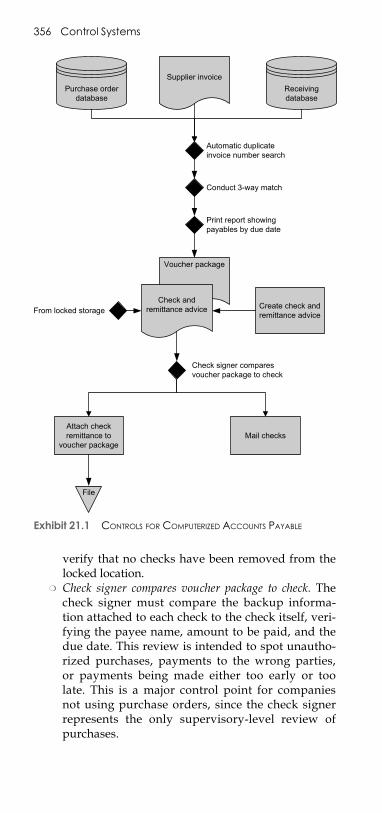
E1C21 03/10/2010 Page 356
verify that no checks have been removed from thelocked location.
m Check signer compares voucher package to check. Thecheck signer must compare the backup informa-tion attached to each check to the check itself, veri-fying the payee name, amount to be paid, and thedue date. This review is intended to spot unautho-rized purchases, payments to the wrong parties,or payments being made either too early or toolate. This is a major control point for companiesnot using purchase orders, since the check signerrepresents the only supervisory-level review ofpurchases.
Create check and remittance advice
Voucher package
Check and remittance advice
Automatic duplicate invoice number search
Conduct 3-way match
Print report showing payables by due date
Supplier invoicePurchase order
databaseReceiving database
From locked storage
Check signer compares voucher package to check
Attach check remittance to
voucher packageMail checks
File
Exhibit 21.1 CONTROLS FOR COMPUTERIZED ACCOUNTS PAYABLE
356 Control Systems
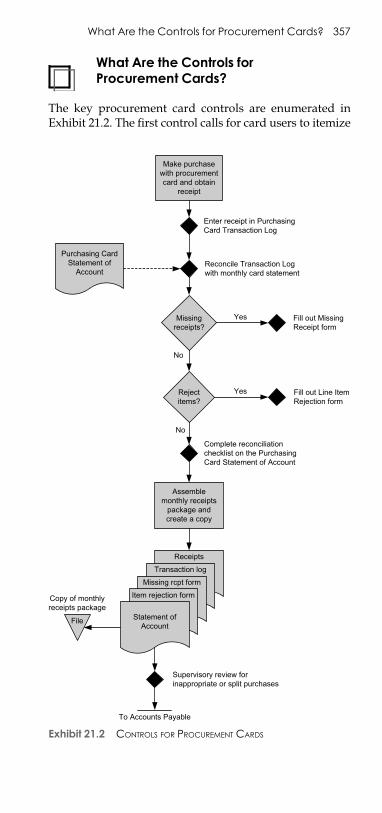
E1C21 03/10/2010 Page 357
What Are the Controls forProcurement Cards?
The key procurement card controls are enumerated inExhibit 21.2. The first control calls for card users to itemize
Receipts
Transaction log
Missing rcpt form
File
Make purchase with procurement card and obtain
receipt
Purchasing Card Statement of
Account
Assemblemonthly receipts
package and create a copy
Enter receipt in Purchasing Card Transaction Log
Reconcile Transaction Log with monthly card statement
Missingreceipts?
Fill out Missing Receipt form
Rejectitems?
Fill out Line Item Rejection form
Complete reconciliation checklist on the Purchasing Card Statement of Account
Supervisory review for inappropriate or split purchases
Item rejection form
Statement of Account
Copy of monthly receipts package
To Accounts Payable
Yes
Yes
No
No
Exhibit 21.2 CONTROLS FOR PROCUREMENT CARDS
What Are the Controls for Procurement Cards? 357
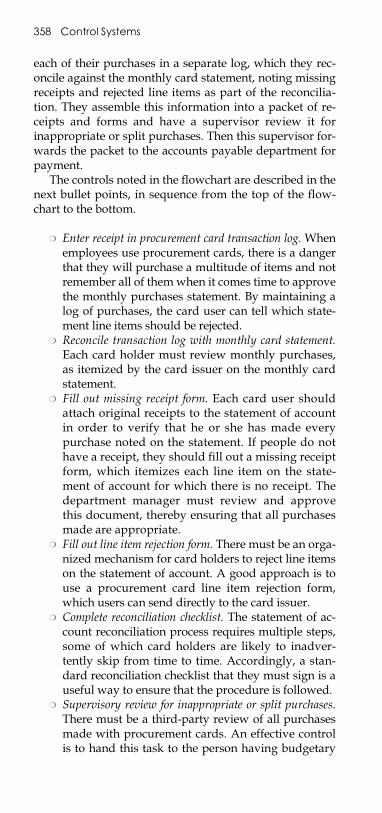
E1C21 03/10/2010 Page 358
each of their purchases in a separate log, which they rec-oncile against the monthly card statement, noting missingreceipts and rejected line items as part of the reconcilia-tion. They assemble this information into a packet of re-ceipts and forms and have a supervisor review it forinappropriate or split purchases. Then this supervisor for-wards the packet to the accounts payable department forpayment.
The controls noted in the flowchart are described in thenext bullet points, in sequence from the top of the flow-chart to the bottom.
m Enter receipt in procurement card transaction log. Whenemployees use procurement cards, there is a dangerthat they will purchase a multitude of items and notremember all of them when it comes time to approvethe monthly purchases statement. By maintaining alog of purchases, the card user can tell which state-ment line items should be rejected.
m Reconcile transaction log with monthly card statement.Each card holder must review monthly purchases,as itemized by the card issuer on the monthly cardstatement.
m Fill out missing receipt form. Each card user shouldattach original receipts to the statement of accountin order to verify that he or she has made everypurchase noted on the statement. If people do nothave a receipt, they should fill out a missing receiptform, which itemizes each line item on the state-ment of account for which there is no receipt. Thedepartment manager must review and approvethis document, thereby ensuring that all purchasesmade are appropriate.
m Fill out line item rejection form. There must be an orga-nized mechanism for card holders to reject line itemson the statement of account. A good approach is touse a procurement card line item rejection form,which users can send directly to the card issuer.
m Complete reconciliation checklist. The statement of ac-count reconciliation process requires multiple steps,some of which card holders are likely to inadver-tently skip from time to time. Accordingly, a stan-dard reconciliation checklist that they must sign is auseful way to ensure that the procedure is followed.
m Supervisory review for inappropriate or split purchases.There must be a third-party review of all purchasesmade with procurement cards. An effective controlis to hand this task to the person having budgetary
358 Control Systems
E1C21 03/10/2010 Page 359
responsibility for the department in which the cardholder works. By doing so, the reviewer is morelikely to conduct a detailed review of purchases thatwill be charged against his or her budget.
What Are the Controls for Order Entry,Credit, and Shipping?
The order entry, credit, and shipment process flow isshown in Exhibit 21.3. The process flow includes controlsthat take advantage of the ability of the computer systemto automatically verify such information as on-hand in-ventory balances and product pricing. The only paper-work generated by this process is the bill of lading, whichis required for shipment.
The controls noted in the flowchart are described atgreater length in the next bullet points, in sequence fromthe top of the flowchart to the bottom.
m Verify approved buyer. Even if the order entry staff re-ceives an ostensibly complete purchase order docu-ment from a customer, it is possible that the personwho completed and signed the purchase order is notauthorized to do so by the customer’s managementteam.
m Check on-hand inventory status. If the order entrycomputer system is linked to the current inventorybalance, the system should warn the order entrystaff if there is not a sufficient quantity in stock tofulfill an order and will predict the standard leadtime required to obtain additional inventory. This isa control over the company’s ability to ship withinits standard shipping period.
m Automatic price matching. The computer automati-cally compares the entered price against the stan-dard corporate price book. If the information in theprice book varies from the price listed on the pur-chase order, the order entry staff must either obtaina supervisory override to use the alternative price ordiscuss the situation with the customer.
m Set up complex billing terms. If a sale requires un-usually complex billing and payment terms, the bestplace to set up this information is during the initialorder entry point, so the information will be availa-ble to all users of the order entry database.
m Online review by credit department. If the order entrysystem has workflow management, any ordersentered by the order entry staff will be routed to the
Controls for Order Entry, Credit, and Shipping 359
E1C21 03/10/2010 Page 360
credit department as soon as the orders are entered.This control not only speeds up the credit reviewprocess but also ensures that every order enteredwill be routed to the credit department. This control
Customer purchase order
Enter order in computer system
Goods released for shipment,
enter bill of lading
Bill of lading (2)
Bill of lading (1)
To customer
FileBill of lading (1)
Verify approved buyer
Online review by credit department
Flag order as approved for shipment
Set up complex billing terms
Automatic price matching
File
Customer purchase order
In stock?
Check on-hand inventory status
Arrange for backorder or alternative purchase
Yes
No
Exhibit 21.3 CONTROLS FOR ORDER ENTRY, CREDIT, AND SHIPPING
360 Control Systems
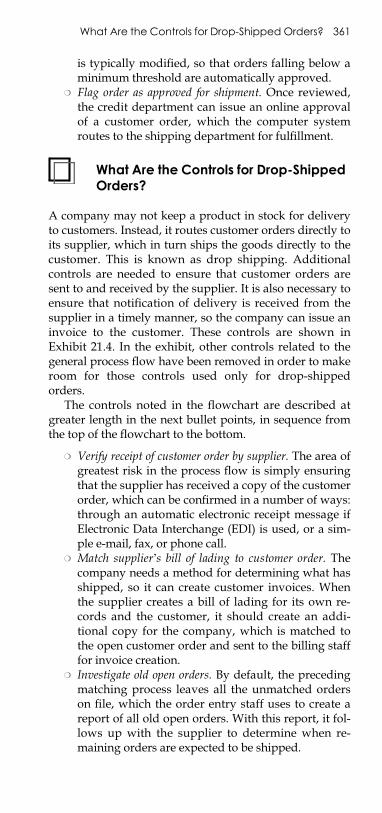
E1C21 03/10/2010 Page 361
is typically modified, so that orders falling below aminimum threshold are automatically approved.
m Flag order as approved for shipment. Once reviewed,the credit department can issue an online approvalof a customer order, which the computer systemroutes to the shipping department for fulfillment.
What Are the Controls for Drop-ShippedOrders?
A company may not keep a product in stock for deliveryto customers. Instead, it routes customer orders directly toits supplier, which in turn ships the goods directly to thecustomer. This is known as drop shipping. Additionalcontrols are needed to ensure that customer orders aresent to and received by the supplier. It is also necessary toensure that notification of delivery is received from thesupplier in a timely manner, so the company can issue aninvoice to the customer. These controls are shown inExhibit 21.4. In the exhibit, other controls related to thegeneral process flow have been removed in order to makeroom for those controls used only for drop-shippedorders.
The controls noted in the flowchart are described atgreater length in the next bullet points, in sequence fromthe top of the flowchart to the bottom.
m Verify receipt of customer order by supplier. The area ofgreatest risk in the process flow is simply ensuringthat the supplier has received a copy of the customerorder, which can be confirmed in a number of ways:through an automatic electronic receipt message ifElectronic Data Interchange (EDI) is used, or a sim-ple e-mail, fax, or phone call.
m Match supplier’s bill of lading to customer order. Thecompany needs a method for determining what hasshipped, so it can create customer invoices. Whenthe supplier creates a bill of lading for its own re-cords and the customer, it should create an addi-tional copy for the company, which is matched tothe open customer order and sent to the billing stafffor invoice creation.
m Investigate old open orders. By default, the precedingmatching process leaves all the unmatched orderson file, which the order entry staff uses to create areport of all old open orders. With this report, it fol-lows up with the supplier to determine when re-maining orders are expected to be shipped.
What Are the Controls for Drop-Shipped Orders? 361
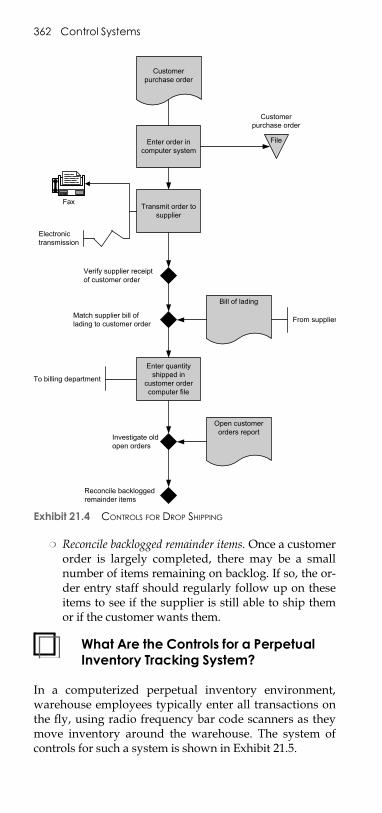
E1C21 03/10/2010 Page 362
m Reconcile backlogged remainder items. Once a customerorder is largely completed, there may be a smallnumber of items remaining on backlog. If so, the or-der entry staff should regularly follow up on theseitems to see if the supplier is still able to ship themor if the customer wants them.
What Are the Controls for a PerpetualInventory Tracking System?
In a computerized perpetual inventory environment,warehouse employees typically enter all transactions onthe fly, using radio frequency bar code scanners as theymove inventory around the warehouse. The system ofcontrols for such a system is shown in Exhibit 21.5.
Customer purchase order
Enter order in computer system
Bill of lading
File
Customer purchase order
Transmit order to supplier
Verify supplier receipt of customer order
Match supplier bill of lading to customer order From supplier
Open customer orders report
Investigate old open orders
Enter quantity shipped in
customer order computer file
To billing department
Fax
Electronictransmission
Reconcile backlogged remainder items
Exhibit 21.4 CONTROLS FOR DROP SHIPPING
362 Control Systems
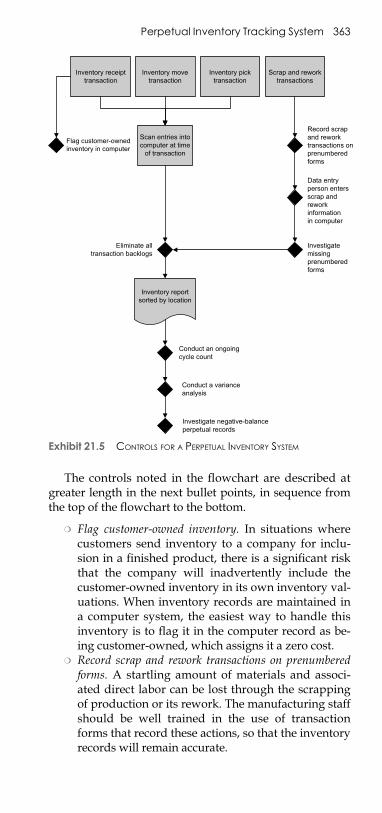
E1C21 03/10/2010 Page 363
The controls noted in the flowchart are described atgreater length in the next bullet points, in sequence fromthe top of the flowchart to the bottom.
m Flag customer-owned inventory. In situations wherecustomers send inventory to a company for inclu-sion in a finished product, there is a significant riskthat the company will inadvertently include thecustomer-owned inventory in its own inventory val-uations. When inventory records are maintained ina computer system, the easiest way to handle thisinventory is to flag it in the computer record as be-ing customer-owned, which assigns it a zero cost.
m Record scrap and rework transactions on prenumberedforms. A startling amount of materials and associ-ated direct labor can be lost through the scrappingof production or its rework. The manufacturing staffshould be well trained in the use of transactionforms that record these actions, so that the inventoryrecords will remain accurate.
Inventory receipt transaction
Inventory move transaction
Inventory pick transaction
Conduct an ongoingcycle count
Conduct a varianceanalysis
Investigate negative-balanceperpetual records
Flag customer-ownedinventory in computer
Inventory report sorted by location
Scan entries into computer at time
of transaction
Scrap and rework transactions
Eliminate all transaction backlogs
Record scrapand reworktransactions onprenumberedforms
Data entryperson entersscrap andreworkinformationin computer
Investigatemissingprenumberedforms
Exhibit 21.5 CONTROLS FOR A PERPETUAL INVENTORY SYSTEM
Perpetual Inventory Tracking System 363
E1C21 03/10/2010 Page 364
m Data entry person enters scrap and rework information incomputer. Since the production staff typically has noexperience with data entry, it is better to send allcompleted scrap and rework forms to the warehouseclerk, who enters the information. This tends to re-sult in significantly lower data entry errors.
m Investigate missing prenumbered forms. Any missingscrap or rework form could represent a valid trans-action that has not been included in the computerdatabase. Accordingly, the data entry person shoulduse the computer to print a list of missing form num-bers and conduct a search for the documents.
m Eliminate all transaction backlogs. A major ongoingdifficulty for any inventory handling operation iswhen inventory-related transactions (e.g., receipts, put-aways, picks, etc.) are not recorded as soon as theyoccur. When this happens, anyone counting the inven-tory will arrive at a total inventory quantity that variesfrom what the current record states and will post anadjusting entry to alter the supposedly incorrect recordbalance to match what was just counted. Then, whenthe late transaction entry is made, the record balancewill differ from the physical quantity on hand. Onecontrol over this problem is to ensure that there isnever a backlog of unrecorded transactions.
m Conduct an ongoing cycle count. Because the materialshandlers not only move inventory but also recordtheir own transactions, it is mandatory to conductan ongoing cycle counting program to ensure thatthey have correctly entered transactions.
m Conduct a variance analysis. Whenever either a physi-cal or cycle count uncovers a variance between theactual and book quantity, it is mandatory that thevariance be fully investigated and the underlyingcause be corrected. Otherwise, the reason for theerror will continue to cause errors in the future.
m Investigate negative-balance perpetual records. A recordin the perpetual inventory card file contains a runningbalance of the current on-hand inventory quantity, usu-ally in the far-right column. If this number ever reachesa negative balance, always investigate to determinewhat transaction or counting error caused the problem,and take steps to ensure that it does not happen again.
What Are the Controls for Billing?
When creating invoices, the level of control needed overthe process varies based on the use of paper-based or
364 Control Systems
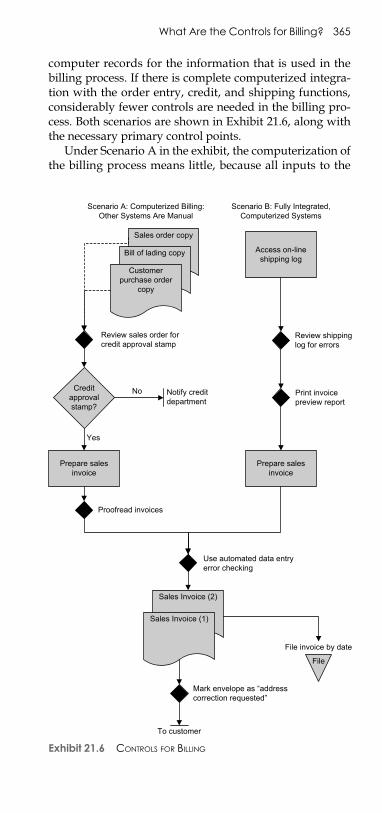
E1C21 03/10/2010 Page 365
computer records for the information that is used in thebilling process. If there is complete computerized integra-tion with the order entry, credit, and shipping functions,considerably fewer controls are needed in the billing pro-cess. Both scenarios are shown in Exhibit 21.6, along withthe necessary primary control points.
Under Scenario A in the exhibit, the computerization ofthe billing process means little, because all inputs to the
Prepare sales invoice
File
Mark envelope as “address correction requested”
Sales Invoice (2)
Sales Invoice (1)
File invoice by date
To customer
Access on-line shipping log
Prepare sales invoice
Sales order copy
Bill of lading copy
Credit approval stamp?
Review sales order for credit approval stamp
Customer purchase order
copy
Notify credit department
No
Yes
Review shippinglog for errors
Scenario A: Computerized Billing:Other Systems Are Manual
Scenario B: Fully Integrated,Computerized Systems
Use automated data entry error checking
Proofread invoices
Print invoicepreview report
Exhibit 21.6 CONTROLS FOR BILLING
What Are the Controls for Billing? 365
E1C21 03/10/2010 Page 366
process are still on paper, requiring complete reentry of allinformation from the source documents and subsequentproofreading of the resulting invoice. The only advantageof using the computer is that it automatically creates asequential invoice number on each invoice, so there is noneed for prenumbered invoice forms. Scenario B takesmuch greater advantage of complete system integration,since all information previously entered in the computersystem by the order entry staff can be copied directly intothe invoice.
The controls noted in the flowchart are described atgreater length in the next bullet points, in sequence fromthe top of the flowchart to the bottom.
m Review sales order for credit approval stamp. All cus-tomer orders should have been reviewed by thecredit department and received an approval stampprior to being forwarded to the billing department.Thus, this control should spot few missing credit ap-proval stamps. Any such instances represent a con-trol breach, so the credit department should benotified of the problem at once.
m Review shipping log for errors. In a fully integratedsystem, the billing clerk accesses the online shippinglog each day to see what has been shipped and auto-matically prints invoices in a single batch for allshipped items. A reasonable control is to have thebilling person conduct a cursory review of the ship-ping log to ensure that all items noted should beinvoiced.
m Print invoice preview report. Though the precedingcontrol may be sufficient for verifying the quantityof goods shipped, it does not reveal pricing informa-tion. To access that information, print a preview re-port of all invoices and review it for accuracy priorto printing the actual invoices.
m Proofread invoices. Some invoices are so complex, in-volving the entry of purchase order numbers, manyline items, price discounts, and other credits, that itis difficult to create an error-free invoice. If so, cus-tomers reject the invoices, thereby delaying the pay-ment process. To correct this problem, assign asecond person to be the invoice proofreader. Thisperson has not created the invoice and so has an in-dependent view of the situation and can provide amore objective view of invoice accuracy.
m Use automated data entry error checking. The billingstaff may make a number of common errors on
366 Control Systems
E1C21 03/10/2010 Page 367
an invoice, such as the wrong price, product orservice description, and customer name. In a com-puterized system, automated data checking meth-ods can be used to reduce the frequency of theseproblems. There can also be required fields thatmust have a valid entry or else the invoice cannotbe completed, such as the customer purchaseorder number field.
m Mark envelope as ‘‘address correction requested. ’’ Cus-tomers regularly move to new locations, and thecompany needs a simple mechanism to track them.One such approach is to mark the words ‘‘AddressCorrection Requested’’ on each envelope mailed. Ifthe customer has moved and filed a forwarding ad-dress with the U.S. Postal Service, the Postal Servicewill forward the mail to the new address and alsonotify the company of the new address, which canbe used to update the customer address file.
What Are the Controls for Collections?
The flowchart in Exhibit 21.7 shows a basic process flowfor collections, including the controls needed to ensurethat the process operates correctly. The most commontype of control is a supervisory review to take the next col-lection step, such as approving a special payment plan,sending a receivable to a collection agency, suing a cus-tomer, or writing off an account balance.
The controls noted in the flowchart are described atgreater length in the next bullet points, in sequence fromthe top of the flowchart to the bottom.
m Assign account ownership. Clearly define responsibilityfor who collects every customer account. Otherwise,collections activity may not occur at all, resulting ingreatly delayed payments.
m Periodically reassign account responsibility. Collectionspersonnel can become too familiar with a long-standing set of customers, resulting in such ahigh degree of identification with customer prob-lems that they allow more slack in making pay-ments. Long-term relationships can also increasethe risk of collusion between customers and thecollections staff. To avoid these problems, period-ically reassign account responsibility to differentcollections personnel.
m Segregate the cash recordation and write-off functions. Ifthe same person is able to record cash receipts and
What Are the Controls for Collections? 367
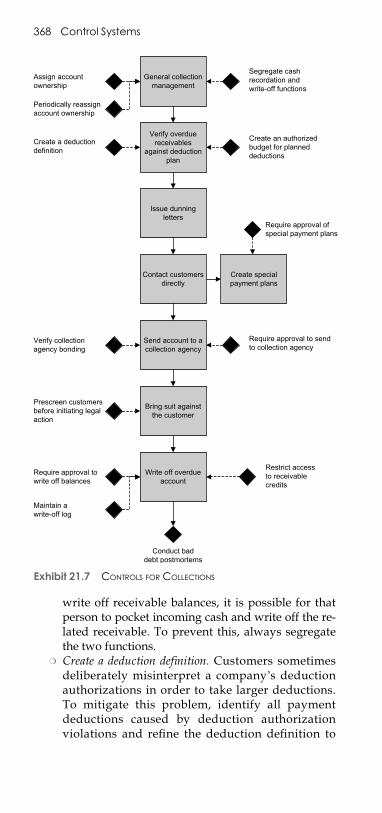
E1C21 03/10/2010 Page 368
write off receivable balances, it is possible for thatperson to pocket incoming cash and write off the re-lated receivable. To prevent this, always segregatethe two functions.
m Create a deduction definition. Customers sometimesdeliberately misinterpret a company’s deductionauthorizations in order to take larger deductions.To mitigate this problem, identify all paymentdeductions caused by deduction authorizationviolations and refine the deduction definition to
Issue dunning letters
Contact customers directly
Create special payment plans
Send account to a collection agency
Bring suit against the customer
Write off overdue account
Verify overdue receivables
against deduction plan
General collection management
Periodically reassign account ownership
Assign account ownership
Segregate cash recordation and write-off functions
Create a deduction definition
Create an authorized budget for planned deductions
Require approval ofspecial payment plans
Require approval to send to collection agency
Verify collection agency bonding
Prescreen customers before initiating legal action
Require approval to write off balances
Maintain a write-off log
Restrict access to receivable credits
Conduct baddebt postmortems
Exhibit 21.7 CONTROLS FOR COLLECTIONS
368 Control Systems
E1C21 03/10/2010 Page 369
exclude the problem deductions. Then meet withthe offending customers to discuss the enhanceddeduction definition.
m Create an authorized budget for planned deductions. Aportion of collection issues arise from deductionstaken by customers, some of which are authorizedunder special marketing plans, such as cooperativeadvertising, rebates, and mark-down allowances.When created, these plans should be budgeted, ap-proved by both the marketing director and control-ler, and distributed to the collections staff. Ideally,the plans should identify the approximate amountof deductions expected from each customer, whichthe collections staff can use as evidence to verify de-ductions taken.
m Require approval of special payment plans. It is possiblethat the collections staff may allow delinquent cus-tomers to use alternative payment plans, such asextended payments or the return of merchandise.Some of these solutions may be unexpectedly oner-ous for the company, so a supervisor should autho-rize these plans.
m Require approval to send to collection agency. Collectionagencies are usually paid about one-third of all col-lected amounts, so the cost of referring accountsto them is considerable. To keep an excessive pro-portion of receivables from being sent to collection,have a supervisor approve them in advance. Thiscontrol can be avoided for smaller balances.
m Verify collection agency bonding. A collection agencyusually requires a customer to send payment to theagency, which extracts its fee from the paymentand forwards the remaining funds to the company.This arrangement puts the company at risk of notbeing paid by the collection agency. To mitigatethis risk, verify each year that the collection agencyis fully bonded.
m Prescreen customers before initiating legal action. Initiat-ing legal action against a customer is an enormouslyexpensive and prolonged undertaking. In addition,even if the court awards a substantial settlement,there may not be enough assets to collect. To im-prove the cost/benefit situation, always prescreen acustomer’s financial circumstances before initiatinga legal action. This can include a review of all judg-ments and tax liens already filed against it as well asoutstanding debt.
What Are the Controls for Collections? 369
E1C21 03/10/2010 Page 370
m Require approval to write off balances. A lazy collec-tions person could write off a large amount of re-ceivables rather than attempt to collect them.
m Maintain a write-off log. The collections staff couldforge a supervisor’s signature on write-off approvalforms. To prevent this, the authorizing supervisorshould maintain a log of all write-offs approved andkeep it in a secure location. There should also be amonthly or quarterly review process that comparesthe contents of the log to actual recorded credits.
m Restrict access to receivable credits. Employees couldrecord unauthorized credits in the accounts receiv-able subledger, thereby eliminating open receivables.To prevent this, lock down access to the screen in theaccounts receivable subledger that allows access tothe creation of credits.
m Conduct bad debt postmortems. It is possible that largereceivable write-offs could have been preventedthrough an adjustment of the underlying credit-granting policies and procedures. It is useful to con-duct a formal postmortem analysis on larger write-offs to discuss what systemic changes or new con-trols can be implemented to reduce the likelihood oftheir reoccurrence.
What Are the Controls for CheckReceipts?
The control system for the processing of check receipts isshown in Exhibit 21.8. Despite the presumed use of a com-puterized accounting system, this is still a very labor-intensive process.
The controls noted in the flowchart are described atgreater length in the next bullet points, in sequence fromthe top of the flowchart to the bottom.
m Mailroom prepares check prelist. As soon as the mailarrives, the mailroom staff should open all enve-lopes and prepare a list of checks that itemizes fromwhom checks were received and the dollar totalon each check. Then the staff copies this check pre-list, sending the original to the cashier and thecopy to the accounts receivable clerk. A slight im-provement in the control is to make an additionalcopy of the check prelist and retain it in a lockedcabinet in the mailroom, thereby providing evid-ence of initial receipt in case both the cashier and
370 Control Systems
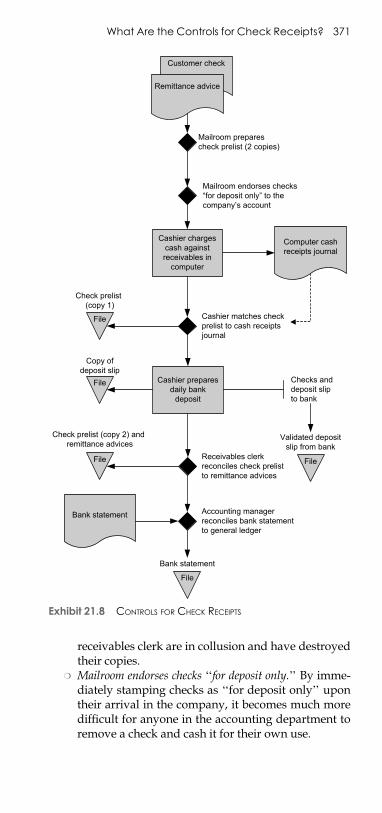
E1C21 03/10/2010 Page 371
receivables clerk are in collusion and have destroyedtheir copies.
m Mailroom endorses checks ‘‘for deposit only.’’ By imme-diately stamping checks as ‘‘for deposit only’’ upontheir arrival in the company, it becomes much moredifficult for anyone in the accounting department toremove a check and cash it for their own use.
File
Customer check
Cashier charges cash against receivables in
computer
Remittance advice
Mailroom prepares check prelist (2 copies)
Cashier matches check prelist to cash receipts journal
Cashier prepares daily bank
deposit
File
Check prelist (copy 1)
Checks anddeposit slipto bank
Receivables clerkreconciles check prelist to remittance advices
Check prelist (copy 2) and remittance advices
File
Copy of deposit slip
Bank statement Accounting manager reconciles bank statement to general ledger
File
Bank statement
File
Validated deposit slip from bank
Mailroom endorses checks “for deposit only” to the company’s account
Computer cash receipts journal
Exhibit 21.8 CONTROLS FOR CHECK RECEIPTS
What Are the Controls for Check Receipts? 371
E1C21 03/10/2010 Page 372
m Cashier matches check prelist to cash receipts journal.Once the cashier has recorded the amounts of all re-ceived checks in the cash receipts journal, this per-son should compare entries to the check prelist. Bydoing so, she can locate any errors in her entries.
m Receivables clerk reconciles check prelist to remittance ad-vices and cash receipts journal. This control is frequentlyexcluded in a computerized environment, because thereceivables clerk is no longer involved in data entry—this person’s role has devolved into a cross-examinationof work done by the cashier. Nonetheless, it is still auseful control, since the cashier will realize that the re-ceivables clerk is conducting an independent review ofall steps in the cash receipts process.
m Accounting manager reconciles bank statement to generalledger. Upon receipt of the monthly bank statement,the accounting manager should reconcile it to thegeneral ledger cash account, using the computerizedbank reconciliation module in the accounting soft-ware. This control provides an independent reviewof both cash receipts and payable checks processedand detects the removal of cash after it has beenentered in the accounting system (i.e., larceny). Thistask should be performed by the accounting man-ager rather than anyone in the cash-handling orrecording processes.
What Are the Controls for Investments?
The process of issuing funds for an investment is uniquein that every step in the process is a control point. Withoutregard to controls, the only step required to make an in-vestment is for an authorized person to create and sign aninvestment authorization form (itself a control point) anddeliver it to the bank, which invests the company’s fundsin the designated investment. However, as shown in theflowchart in Exhibit 21.9, there are a number of additionalsteps, all designed to ensure that there is an appropriatelevel of control over the size and duration of the invest-ment and that the earnings from the investment vehicleare maximized.
The controls noted in the flowchart are described atgreater length in the next bullet points, in sequence fromthe top of the flowchart to the bottom.
m Create and approve a cash forecast. There must be somebasis for both the size and duration of an invest-ment. Otherwise, a mismatch can develop between
372 Control Systems
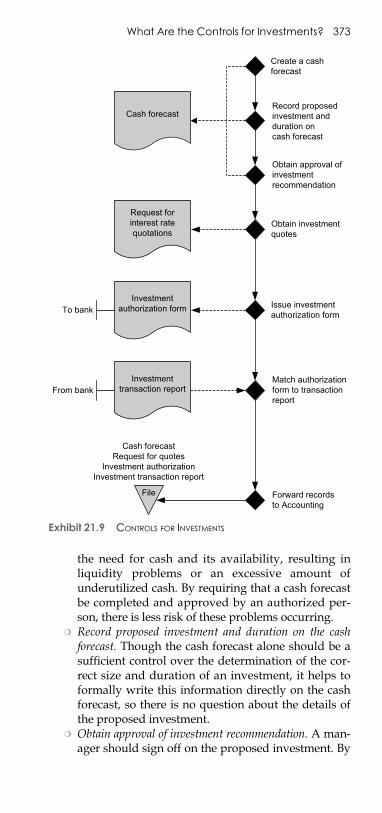
E1C21 03/10/2010 Page 373
the need for cash and its availability, resulting inliquidity problems or an excessive amount ofunderutilized cash. By requiring that a cash forecastbe completed and approved by an authorized per-son, there is less risk of these problems occurring.
m Record proposed investment and duration on the cashforecast. Though the cash forecast alone should be asufficient control over the determination of the cor-rect size and duration of an investment, it helps toformally write this information directly on the cashforecast, so there is no question about the details ofthe proposed investment.
m Obtain approval of investment recommendation. A man-ager should sign off on the proposed investment. By
Cash forecast
File
Create a cashforecast
Record proposedinvestment andduration oncash forecast
Obtain approval ofinvestmentrecommendation
Obtain investmentquotes
Issue investmentauthorization form
Forward recordsto Accounting
Cash forecastRequest for quotes
Investment authorizationInvestment transaction report
Request for interest rate quotations
Investmentauthorization form
Investmenttransaction report
To bank
From bankMatch authorizationform to transactionreport
Exhibit 21.9 CONTROLS FOR INVESTMENTS
What Are the Controls for Investments? 373
E1C21 03/10/2010 Page 374
placing the approval signature line directly on thecash forecast, the approver can review the accuracyof the forecast as well as the resulting investmentrecommendation, giving sufficient information forthe approver to determine if the recommendation iscorrect.
m Obtain and document quotes for each investment. An in-vestment officer may have a favorite bank and maycontinue to invest with it, even if its rates are notcompetitive. It is also common for the investmentstaff to not want to go to the effort of obtaining mul-tiple quotes on a regular basis. By requiring them tocomplete a quotation sheet, this control ensures thatthe best investment rate is obtained.
m Issue a signed investment authorization form to the is-suer. Banks will not invest funds without a signedinvestment authorization form from the company.From the company’s perspective, a signed authori-zation also ensures that the appropriate level ofmanagement has approved the investment.
m Match authorization form to transaction report. Thebank may unintentionally invest funds incorrectlyor neglect to invest at all. By matching the signedauthorization form to any investment transactionreport issued by the bank, the company can verifywhat action the bank took as a result of theauthorization.
m Forward records to accounting for storage. There issome risk that a person in the investment depart-ment will alter investment authorization documentsafter the fact to hide evidence of inappropriateinvestments. To reduce this risk, require people inthe investment department to immediately forwarda set of supporting documents to the accountingdepartment for storage in a locked location. Theaccounting staff should stamp the receipt date oneach set of documents received, which the internalauditors can use to determine if any documentswere inappropriately delayed.
What Are the Controls for Payroll?
The basic process flow for payroll processing is shown inExhibit 21.10. It assumes that a computerized timekeepingsystem is linked to the payroll processing software, so thata great deal of time card review and compilation isavoided.
374 Control Systems
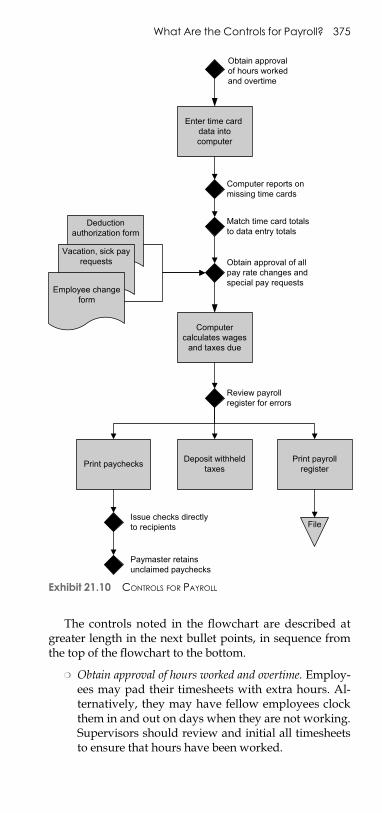
E1C21 03/10/2010 Page 375
The controls noted in the flowchart are described atgreater length in the next bullet points, in sequence fromthe top of the flowchart to the bottom.
m Obtain approval of hours worked and overtime. Employ-ees may pad their timesheets with extra hours. Al-ternatively, they may have fellow employees clockthem in and out on days when they are not working.Supervisors should review and initial all timesheetsto ensure that hours have been worked.
Enter time card data into computer
Deduction authorization form
Computer calculates wages
and taxes due
Vacation, sick pay requests
Print paychecks Deposit withheld taxes
Issue checks directly to recipients
Obtain approval of allpay rate changes andspecial pay requests
Obtain approvalof hours workedand overtime
Employee change form
Computer reports on missing time cards
Review payroll register for errors
Paymaster retains unclaimed paychecks
Match time card totalsto data entry totals
Print payroll register
File
Exhibit 21.10 CONTROLS FOR PAYROLL
What Are the Controls for Payroll? 375
E1C21 03/10/2010 Page 376
m Computer reports on missing time cards. It is not neces-sary to manually determine which current employ-ees have not submitted time cards, since thisinformation can be provided by the computer sys-tem itself. However, it may still be necessary to con-duct a periodic audit of the employee master file toensure that all employees listed as active have notactually been terminated (possibly indicating thepresence of ghost employees).
m Match time card totals to data entry totals. It is quitepossible to incorrectly keypunch the time reportedon time cards into the payroll software. To detectthese errors, have someone besides the data entryperson compare the employee hours loaded into thepayroll software to the amounts listed on employeetimesheets.
m Obtain approval of all pay rate changes and special payrequests. Pay changes can be made quite easilythrough the payroll system if there is collusion be-tween a payroll clerk and any other employee. Thiscan be spotted through regular comparisons of payrates paid to the approved pay rates documented inemployee records.
m Review payroll register for errors. The computer sys-tem will print a payroll register once it has com-pleted all payroll processing, which makes this anideal source document for comparison to authoriz-ing wage and deduction documents as well as thetotal hours listed on timecards.
m Issue checks directly to recipients. A common type offraud is for the payroll staff either to create employ-ees in the payroll system (ghost employees) or tocarry on the pay of employees who have left thecompany and pocket the resulting paychecks. Thispractice can be stopped by ensuring that every pay-check is handed to an employee who can prove hisor her identity. The person handing out checks cancompare the payroll register to the checks to ensurethat all checks are being given to the employees.
In cases where there are outlying locations forwhich it is impossible to physically hand a paycheckto an employee, a reasonable alternative is to havethe internal audit staff periodically travel to theselocations with the checks on an unannounced basisand require physical identification of each recipientbefore handing over a check.
m Paymaster retains unclaimed paychecks. The personwho physically hands out paychecks to employees
376 Control Systems
E1C21 03/10/2010 Page 377
is sometimes called the paymaster. This person doesnot prepare the paychecks or sign them, and his orher sole responsibility in the payroll area is to handout paychecks. If an employee is not available to ac-cept a paycheck, the paymaster retains that person’scheck in a secure location until the employee is per-sonally available to receive it. This approach avoidsthe risk of giving the paycheck to a friend of theemployee who might cash it and also keeps the pay-roll staff from preparing a check and cashing itthemselves.
What Are the Controls for Payroll? 377

E1C21 03/10/2010 Page 378

E1C22 03/10/2010 Page 379
PART V
PUBLIC COMPANYACCOUNTING

E1C22 03/10/2010 Page 380
E1C22 03/10/2010 Page 381
CHAPTER 22
SEC FILINGS
What Is the Form 8-K?
A public company is required to file a Form 8-K to re-port a material, undisclosed event. The form must be filedwithin four business days of the event. If the event occurson a weekend or holiday, the four-day rule shall begin onthe next business day thereafter. A moderately activecompany will find itself filing this form quite frequently,possibly more than all other forms combined.
The Securities and Exchange Commission (SEC) de-fines a number of types of material events that must bereported in a Form 8-K; they are described in the next ta-ble. For the more common Form 8-K disclosures, an exam-ple is also provided.
Section 1—Company’s Business and Operations
Item 1.01 Entry into a material definitive agreement. This is for amaterial definitive agreement not made in theordinary course of business. Disclose the date of theagreement, the parties involved, and a briefdescription of the agreement.Example:On [date] we entered into an amendmentto our senior secured credit facility with ABC Bank.which amends the borrowing base definition. Underthe terms of the amendment, the percentage ofreceivables to be included in the borrowing base ischanged from 70% to 80%.
Item 1.02 Termination of a material definitive agreement. This isfor the termination of a material definitiveagreement not made in the ordinary course ofbusiness. Disclose the termination date, the partiesinvolved, and a brief description of the agreementas well as the circumstances surrounding thetermination and any material early terminationpenalties incurred by the company.Example:On [date] the Company terminated itspreviously announcement Agreement and Plan ofMerger, dated as of [date], with XYZ Company. TheCompany’s board of directors did not believe thatthe merger could be finalized.
(Continued )
381
E1C22 03/10/2010 Page 382
Item 1.03 Bankruptcy or receivership. This is for a company’sentry into bankruptcy or receivership. Identify theproceeding, the identity of the court, the date thatjurisdiction was assumed, and the identity of thereceiver. If a plan of reorganization or liquidation hasbeen entered, disclose the court, confirmation date,and the material features of the plan.Example:On [date], ABC Company filed a voluntarypetition for relief under Chapter 11 of the UnitedStates bankruptcy code in the United StatesBankruptcy Court, Southern District of New York(case number 01234). The Debtors will continue tooperate the business as ‘‘debtors-in-possession’’under the jurisdiction of the Court and inaccordance with applicable provisions of theBankruptcy Code and orders of the Court. The filing isattached hereto.
Section 2—Financial Information
Item 2.01 Completion of acquisition or disposition of assets. Forthe purchase or sale of a significant amount ofassets, disclose the transaction date, the other party,the amount of consideration involved, and thesource of funds used for an acquisition.Example:On [date], stockholders of ABC Company(‘‘ABC’’) approved and adopted the Agreementand Plan of Merger, dated as of [date] by andamong XYZ Company (‘‘XYZ’’) and ABC, whichcontemplated that XYZ will merge with and into ABC,with ABC surviving the Merger as a wholly ownedsubsidiary of XYZ. On [date], the Merger wasconsummated. Pursuant to the terms of the MergerAgreement, former ABC common stockholders areentitled to receive $1.15 in cash in exchange foreach share of ABC common stock, outstandingimmediately prior to the effective time of the Merger.
Item 2.02 Results of operations and financial condition. Note thedate of the release of any material, nonpublicinformation regarding the company’s results ofoperations or financial condition and attach the textof the release.Example:On [date], the Company announced itsfinancial results for the quarter ended September 30,20XX. The full text of the press release issued inconnection with the announcement is furnished asan exhibit to this Form 8-K.
Item 2.03 Creation of a direct financial obligation or anobligation under an off–balance sheet arrangementof a company. When the company enters into amaterial obligation, disclose the transaction dateand the amount and terms of the obligation.Example: ABC Company (‘‘ABC’’) will becomeobligated on material direct financial obligationspursuant to the Credit Agreement dated as of[date], among ABC and Big Bank (‘‘Big’’). Under theterms of the Credit Agreement, Big will makeavailable to ABC up to a $100,000,000 term loancommitment and up to a $50,000,000 revolving loancommitment. Proceeds of the credit agreementmay be used for general corporate purposes. Theprincipal amount outstanding of all term loans andrevolving loans is due and payable on [date]. Loanswill bear interest at Big’s base rate plus an applicablemargin ranging from 0% to .2%, based upon ABC’s
(Continued)
382 SEC Filings
E1C22 03/10/2010 Page 383
credit rating. Interest on base rate loans is payableon a quarterly basis on the last day of March, June,September and December, and interest is payableat the end of the applicable interest period.
Item 2.04 Triggering events that accelerate or increase a directfinancial obligation or an obligation under an off–balance sheet arrangement. If a triggering eventoccurs, note the date of the event and provide abrief description of it, as well as the amount of theobligation.Example:On [date], the Company received noticesfrom ABC Advisors, holder of the Company’sconvertible debentures, claiming that the Companywas in default of the terms of the debentures forfailure to maintain current financial statements in theregistration statement relating to the sale of theCompany’s common stock issuable upon conversionof one of those debentures, and as a result that ABCAdvisors was exercising its right to acceleratepayment of the full principal amount of thedebentures. Approximately $25 million, includinginterest, is currently outstanding on the debentures.
Item 2.05 Costs associated with exit or disposal activities. If thecompany commits to an exit or disposal plan, notethe date of the commitment, the course of action tobe taken, and the expected completion date. Foreach major type of cost, also estimate the range ofamounts expected to be incurred.Example:On [date], the Company committed to arestructuring plan that includes a reduction in forceof approximately 500 positions. The restructuring planis intended to improve operational efficiencies. TheCompany anticipates that it will complete therestructuring by [date]. In connection with therestructuring, the Company expects to incur totalexpenses relating to termination benefits of $21million to $24 million, all of which represent cashexpenditures. The Company expects to record themajority of these restructuring charges in the quarterending December 31, 20XX.
Item 2.06 Material impairments. If the company concludes thatone or more of its assets are impaired, disclose thedate of the decision, describe the asset, and notethe circumstances leading to the conclusion. Alsonote the amount of the impairment.Example: During the quarter ended September 30,20XX, as part of the Company’s ongoing strategicreview of the business, an impairment analysis wasperformed on the Aerospace segment goodwill andintangible assets. On [date] the Companyconcluded that noncash goodwill and intangibleasset impairment charges of $10 million wererequired and such charges were recorded in thequarter ended September 30, 20XX.
Section 3—Securities and Trading Markets
Item 3.01 Notice of delisting or failure to satisfy a continuedlisting rule or standard; transfer of listing. Disclose thedate when the company received notice from anational exchange that a class of its common equitydoes not satisfy its continued listing or that theexchange expects to delist it. Also note the rulebeing violated that led to the notification and theaction the company expects to take in response. If
(Continued )
What Is the Form 8-K? 383
E1C22 03/10/2010 Page 384
the company has caused an exchange listing to bewithdrawn, describe the action taken and thedate of the action.Example: ABC Company today announced it hasreceived notice from Nasdaq that its common stockis subject to potential delisting from the NasdaqCapital Market because the bid price of theCompany’s common stock closed below theminimum $1.00 per share requirement for30 consecutive business days prior to [date]. TheCompany has been granted an initial 180 calendardays, or until [date], to regain compliance.
Item 3.02 Unregistered sales of equity securities. In the event ofan unregistered security sale, state the date of sale,the type and amount of securities sold, theconsideration paid, the type of exemption fromregistration being claimed, and any convertibilityterms. This report needs to be filed only if the sharesissued are more than 1% of the shares outstanding.For a smaller reporting company, the reportingthreshold is 5% of the shares outstanding.Example:On [date], accredited investors purchasedan aggregate of 25,000,000 shares of common stockat $2.00 per share for an aggregate purchase priceof $50,000,000 from ABC Company (‘‘ABC’’). Thefunds raised will be utilized by ABC for workingcapital and research purposes. The shares wereoffered and sold to the accredited investors in aprivate placement transaction made in relianceupon exemptions from registration pursuant toSection 4(2) under the Securities Act of 1933. Each ofthe Investors are accredited investors as defined inRule 501 of Regulation D promulgated under theSecurities Act of 1933.
Item 3.03 Material modification to rights of security holders.Disclose the date of modification, the type ofsecurity involved, and the effect of the modificationon the rights of the security holders.Example:On [date], ABC Company entered into anamendment to its Preferred Stock Rights Agreementdated [date] with XYZ Trust Company to amend theexercise price of a right to purchase one share of itsSeries A Preferred Stock to $25.00 per share and tomake certain conforming changes related to thechange in exercise price.
Section 4—Matters Related to Accountants and FinancialStatements
Item 4.01 Changes in the company’s certifying accountant. Ifthe company’s auditor resigns or is dismissed,disclose whether the change was a resignation ordismissal, and whether the auditor’s report for eitherof the past two years contained an adverse opinionor disclaimer of opinion, or was qualified. Also statewhether the change was recommended orapproved by the company’s board of directors or itsaudit committee and whether there were anydisagreements with the auditor during the two mostrecent fiscal years that were not resolved to thesatisfaction of the auditor.Example:On [date], our client-auditor relationshipwith XYZ Auditor (‘‘XYZ’’) ceased. As of that date,ABC Company (the ‘‘ABC’’) had no disagreementswith XYZ on any matter of accounting principles orpractices, financial statement disclosure, or auditing
(Continued)
384 SEC Filings
E1C22 03/10/2010 Page 385
scope or procedure. We have provided XYZ with acopy of the disclosures we are making in response tothis Item 4.01. XYZ has furnished us with a letter dated[date], addressed to the Commission, and statingthat it agrees with the statements made herein.
Item 4.02 Nonreliance on previously issued financial statementsor a related audit report or completed interimreview. If the company concludes that anypreviously issued financial statements cannot berelied on because of an error, disclose the date ofthis decision and describe the facts underlying thedecision. There are multiple additional steps to betaken besides filing this Form 8-K.Example:On [date], management of the Company,with concurrence of the Audit Committee of theCompany’s Board of Directors (the ‘‘AuditCommittee’’), concluded that the Company’spreviously issued financial statements for the threemonths ended March 31, 20XX (the ‘‘Financials’’)incorrectly valued an allowance against deferredtax assets. As a result, the Financials should no longerbe relied upon. The Company intends to fileamended financial statements in a Form 10-Q/A forthe three month period ended March 31, 20XX nolater than May 31, 20XX. During the first quarterof 20XX, in accordance with Statement ofFinancial Accounting Standards No. 109,‘‘Accounting for Income Taxes’’ (‘‘FAS 109’’), theCompany recorded a valuation allowance of $125million to reduce certain net deferred tax assets totheir anticipated realizable value. The Companylater realized it had incorrectly determined thevaluation allowance against deferred tax assets. TheCompany and its auditors have reached apreliminary conclusion that an additional valuationallowance of $45 million should have been recordedat March 31, 20XX.
Section 5—Corporate Governance and Management
Item 5.01 Changes in control of the company. Identify theperson acquiring control of the company and thedate of the change, and describe the transactionresulting in the change of control. Also note theamount of consideration used to effect the changeand the source of the person’s funds to do so.Example:On [date], Current Investor, the controllingshareholder of ABC Company (‘‘ABC’’), entered intoa Securities Purchase and Sale Agreement with XYZCompany (‘‘XYZ’’). Pursuant to the SecuritiesPurchase and Sale Agreement, Current Investoragreed to sell all of his shares of the Company’scommon stock to XYZ. Upon the closing of theSecurities Purchase and Sale Agreement on [date](the ‘‘Closing’’), a change in control of theCompany occurred. Pursuant to the SecuritiesPurchase and Sale Agreement, XYZ has acquired5,000,000 shares of the Company’s common stockfrom Current Investor. XYZ paid $15,000,000 toacquire such shares. Funds for the acquisition werefrom the working capital of XYZ. XYZ now owns 80%of ABC’s issued and outstanding shares.
Item 5.02 Departure of directors or certain officers; election ofdirectors; appointment of certain officers. If adirector resigns, is removed, or refuses to stand forreelection because of a disagreement with the
(Continued )
What Is the Form 8-K? 385
E1C22 03/10/2010 Page 386
company, note the date of the event and thedirector’s committee positions held and describe thedisagreement. If the director has provided anywritten correspondence related to thedisagreement, this must be attached as an exhibit.Example:Mr. Alfred Director resigned as a director ofABC Company (‘‘ABC’’), effective on [date]. Mr.Director was a member of ABC’s audit committeeand governance committee. He gave no reason forhis resignation.
Item 5.03 Amendments to articles of incorporation or bylaws;change in fiscal year. For such amendments thatwere not previously disclosed in a proxy statement,disclose the amendment date and describe thechange.Example:On [date], ABC Company filed with theSecretary of State of the State of New York aCertificate of Amendment to its Certificate ofIncorporation establishing the terms of a new class ofSeries A Preferred Stock.
Item 5.04 Temporary suspension of trading under the company’semployee benefit plans. For such a suspension, notethe reason for the blackout period, the plantransactions to be suspended, the class of equitysecurities affected, and the duration of the blackoutperiod.Example:On [date], the Audit Committee of theBoard of Directors of ABC Company (‘‘ABC’’)concluded that the Company’s financialstatements for one or more prior periods will likelyneed to be restated in conjunction with revisingits sales return reserve calculations. Because ofthe potential restatement of this information andin order to ensure compliance with applicablesecurities laws, participants in the ABC Company401(k) Plan (the ‘‘Plan’’) will be temporarilysubject to a blackout period during which theywill be precluded from acquiring beneficialownership of additional interests in the Company’scommon stock fund under the 401(k) plan. Duringthe blackout period, Plan participants will beunable to direct investments into the Company’sstock fund under the Plan. The blackout periodbegan at 7:00 a.m. Eastern time on [date] and iscurrently anticipated to end at 7:00 a.m. Easterntime on the day immediately following the day onwhich the restated financial statements are filedwith the Securities and Exchange Commission.
Item 5.05 Amendment to company’s code of ethics, or waiverof a provision of the code of ethics. Note the date ofany change that applies to the company’s chiefexecutive officer, chief financial officer, or principalaccounting officer and the name of the person towhom it was granted; and describe the nature ofthe waiver.Example:On [date], the Board of Directors of theCompany approved a Code of Business Conductand Ethics, which covers all employees and directorsof the Company. The new Code of Business Conductand Ethics encompasses and supersedes the Codeof Business Conduct and Ethics for the Company’sSenior Officers, which has been posted on theCompany’s Web site.
(Continued)
386 SEC Filings
E1C22 03/10/2010 Page 387
Item 5.06 Change in shell company status. If a company is nolonger a shell company, disclose the material termsof the transaction.Example: The disclosure regarding the reversemerger in Item 2.01 above is hereby incorporated byreference. Prior to the effective time of the reversemerger, ABC Company was a shell company.
Section 6—Asset-Backed Securities (ABS)
Item 6.01 ABS informational and computational materials.Report any information and computational materialfiled in, or as an exhibit to, this report.
Item 6.02 Change of servicer or trustee. If a servicer or trusteehas resigned or been removed, or if a new servicerhas been appointed, state the event date and thecircumstances of the change.
Item 6.03 Change in credit enhancement or other externalsupport. If the company becomes aware of anymaterial enhancement or support regarding one ormore classes of asset-backed securities, identify theparties to the agreement causing the change, anddescribe its date, terms, and conditions.
Item 6.04 Failure to make a required distribution. If a requireddistribution to holders of asset-based securities is notmade, identify the failure and state the nature of thefailure.
Item 6.05 Securities Act updating disclosure. If any material poolcharacteristic of the actual asset pool at the time ofissuance differs by 5% or more from the description ofthe asset pool in the prospectus, disclose thecharacteristics of the actual asset pool.
Section 7—Regulation FD
Item 7.01 Regulation FD disclosure. Disclose under this item onlyinformation that the company elects to disclosepursuant to Regulation FD.Example:On [date], ABC Company (‘‘ABC’’) willmake a presentation to potential lenders. A copy ofthe slides to be used in the presentation is furnishedherewith as an Exhibit.
Section 8—Other Events
Item 8.01 Other events. Disclose under this category any eventsthat the company considers to be of importance toits securities holders.Example:On [date], ABC Company (‘‘ABC’’)entered into a Settlement Agreement with theUnited States Department of Justice to settle alloutstanding federal suits against ABC in connectionwith claims related to the Company’s alleged off-label marketing and promotion of its ABC Product1
to pediatricians (the ‘‘Settlement Agreement’’). Thesettlement is neither an admission of liability by ABCnor a concession by the United States that its claimsare not well founded. Pursuant to the SettlementAgreement, the Company will pay approximately$10 million to settle the matter between the parties.The Settlement Agreement provides that, upon fullpayment of the settlement fees, the United Statesreleases ABC from the claims asserted by the UnitedStates. As of [date], ABC accrued a loss contingencyof $10 million for this matter.
What Is the Form 8-K? 387
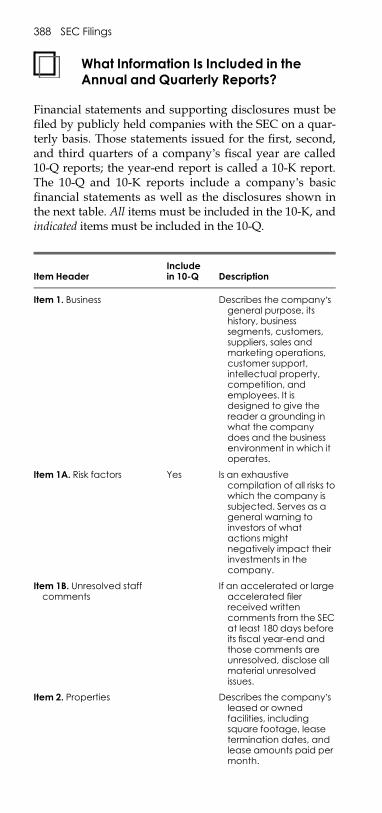
E1C22 03/10/2010 Page 388
What Information Is Included in theAnnual and Quarterly Reports?
Financial statements and supporting disclosures must befiled by publicly held companies with the SEC on a quar-terly basis. Those statements issued for the first, second,and third quarters of a company’s fiscal year are called10-Q reports; the year-end report is called a 10-K report.The 10-Q and 10-K reports include a company’s basicfinancial statements as well as the disclosures shown inthe next table. All items must be included in the 10-K, andindicated items must be included in the 10-Q.
Item HeaderIncludein 10-Q Description
Item 1. Business Describes the company’sgeneral purpose, itshistory, businesssegments, customers,suppliers, sales andmarketing operations,customer support,intellectual property,competition, andemployees. It isdesigned to give thereader a grounding inwhat the companydoes and the businessenvironment in which itoperates.
Item 1A. Risk factors Yes Is an exhaustivecompilation of all risks towhich the company issubjected. Serves as ageneral warning toinvestors of whatactions mightnegatively impact theirinvestments in thecompany.
Item 1B. Unresolved staffcomments
If an accelerated or largeaccelerated filerreceived writtencomments from the SECat least 180 days beforeits fiscal year-end andthose comments areunresolved, disclose allmaterial unresolvedissues.
Item 2. Properties Describes the company’sleased or ownedfacilities, includingsquare footage, leasetermination dates, andlease amounts paid permonth.
388 SEC Filings
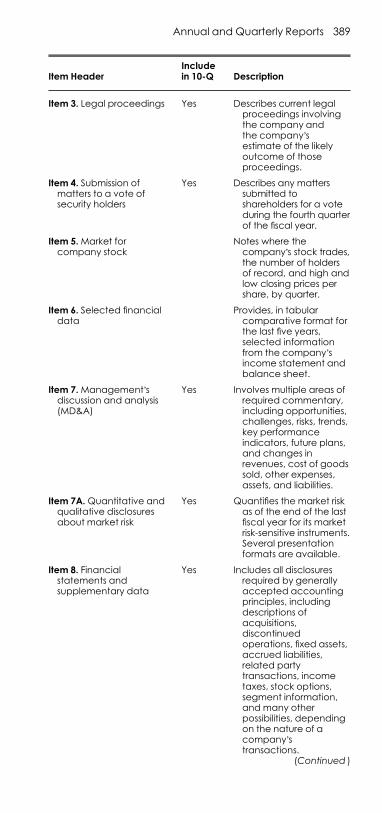
E1C22 03/10/2010 Page 389
Item 3. Legal proceedings Yes Describes current legalproceedings involvingthe company andthe company’sestimate of the likelyoutcome of thoseproceedings.
Item 4. Submission ofmatters to a vote ofsecurity holders
Yes Describes any matterssubmitted toshareholders for a voteduring the fourth quarterof the fiscal year.
Item 5.Market forcompany stock
Notes where thecompany’s stock trades,the number of holdersof record, and high andlow closing prices pershare, by quarter.
Item 6. Selected financialdata
Provides, in tabularcomparative format forthe last five years,selected informationfrom the company’sincome statement andbalance sheet.
Item 7.Management’sdiscussion and analysis(MD&A)
Yes Involves multiple areas ofrequired commentary,including opportunities,challenges, risks, trends,key performanceindicators, future plans,and changes inrevenues, cost of goodssold, other expenses,assets, and liabilities.
Item 7A.Quantitative andqualitative disclosuresabout market risk
Yes Quantifies the market riskas of the end of the lastfiscal year for its marketrisk-sensitive instruments.Several presentationformats are available.
Item 8. Financialstatements andsupplementary data
Yes Includes all disclosuresrequired by generallyaccepted accountingprinciples, includingdescriptions ofacquisitions,discontinuedoperations, fixed assets,accrued liabilities,related partytransactions, incometaxes, stock options,segment information,and many otherpossibilities, dependingon the nature of acompany’stransactions.
(Continued )
Item HeaderIncludein 10-Q Description
Annual and Quarterly Reports 389
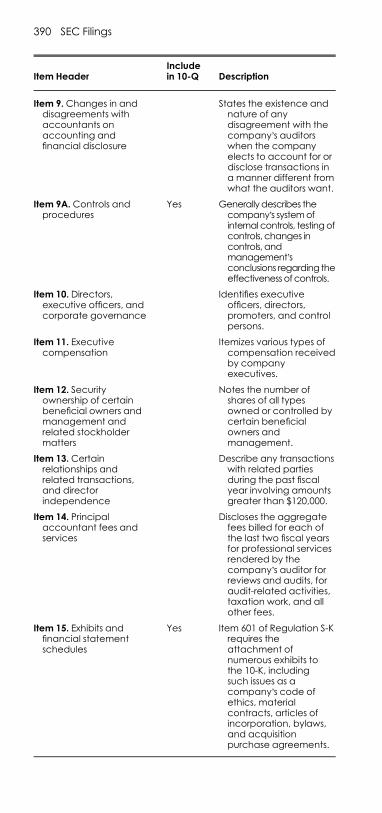
E1C22 03/10/2010 Page 390
Item 9.Changes in anddisagreements withaccountants onaccounting andfinancial disclosure
States the existence andnature of anydisagreement with thecompany’s auditorswhen the companyelects to account for ordisclose transactions ina manner different fromwhat the auditors want.
Item 9A.Controls andprocedures
Yes Generallydescribes thecompany’s systemofinternal controls, testingofcontrols, changes incontrols, andmanagement’sconclusions regarding theeffectiveness ofcontrols.
Item 10. Directors,executive officers, andcorporate governance
Identifies executiveofficers, directors,promoters, and controlpersons.
Item 11. Executivecompensation
Itemizes various types ofcompensation receivedby companyexecutives.
Item 12. Securityownership of certainbeneficial owners andmanagement andrelated stockholdermatters
Notes the number ofshares of all typesowned or controlled bycertain beneficialowners andmanagement.
Item 13.Certainrelationships andrelated transactions,and directorindependence
Describe any transactionswith related partiesduring the past fiscalyear involving amountsgreater than $120,000.
Item 14. Principalaccountant fees andservices
Discloses the aggregatefees billed for each ofthe last two fiscal yearsfor professional servicesrendered by thecompany’s auditor forreviews and audits, foraudit-related activities,taxation work, and allother fees.
Item 15. Exhibits andfinancial statementschedules
Yes Item 601 of Regulation S-Krequires theattachment ofnumerous exhibits tothe 10-K, includingsuch issues as acompany’s code ofethics, materialcontracts, articles ofincorporation, bylaws,and acquisitionpurchase agreements.
Item HeaderIncludein 10-Q Description
390 SEC Filings
E1C22 03/10/2010 Page 391
When Must Annual and QuarterlyReports Be Filed?
The 10-K filing deadline depends on the size of the com-pany, as noted next:
m File within 60 days of the end of the fiscal year if thecompany is a large accelerated filer. This type of com-pany must have an aggregate market value ownedby nonaffiliated investors of at least $700 million asof the last business day of the company’s most re-cent second fiscal quarter.
m File within 75 days of the end of the fiscal year if thecompany is an accelerated filer. This type of companymust have an aggregate market value owned bynonaffiliated investors of at least $75 million, butless than $700 million, as of the last business day ofthe company’s most recent second fiscal quarter.
m File within 90 days of the end of the fiscal year for allother companies.
The 10-Q filing deadline uses the same definitions todetermine when the report must be filed.
m Large accelerated filers and accelerated filers filewithin 40 days of the end of the fiscal quarter.
m All other companies file within 45 days of the end ofthe fiscal quarter.
What Is the Form S-1?
The Form S-1 is the default stock registration form to beused if no other registration forms or exemptions fromregistration are applicable. The 17 main informationalcontents of the Form S-1 are described next.
1. Forepart of the registration statement. Includes the com-pany name, the title and amount of securities to beregistered, and their offering price. Also describes themarket for the securities and a cross-reference to therisk factors section.
2. Summary information. Provides a summary of the pro-spectus contents that contains a brief overview of thekey aspects of the offering as well as contact informa-tion for the company’s principal executive offices.
3. Risk factors. Discusses the most significant factors thatmake the offering speculative or risky, and explainshow the risk affects the company or the securities be-ing offered.
What Is the Form S-1? 391
E1C22 03/10/2010 Page 392
4. Ratio of earnings to fixed charges.5. Use of proceeds. States the principal purpose for which
proceeds from the offering are intended.6. Determination of offering price. Describes the factors
considered in determining the offering price, both forcommon equity and for warrants, rights, and convert-ible securities.
7. Dilution. Discloses book value per share informationbefore and after the distribution.
8. Selling security holders. For those securities beingsold for the account of another security holder, nameseach security holder as well as each person’s relation-ship with the company within the past three years.
9. Plan of distribution. Describes information aboutunderwriters, how securities are to be distributed,compensation paid to the sellers of securities, and sta-bilization transactions.
10. Description of securities to be registered. Describes suchissues as the voting, liquidation, dividend, and con-version rights associated with the securities.
11. Interests of named experts and counsel. Identifies anyexperts and counsel who are certifying or preparingthe registration document or providing a supportingvaluation, and the nature of their compensation relat-ing to the registration.
12. Information with respect to the registrant. This sectioncomprises the bulk of the document and includes adescription of the business and its property, any le-gal proceedings, the market price of the company’sstock, financial statements, selected financial data,and management’s discussion and analysis of thecompany’s financial condition and its results of oper-ations. It also requires disclosure of any disagree-ments with the company’s auditors, market riskanalysis, and several ownership and governanceissues.
13. Material changes. Describes material changes that haveoccurred since the company’s last-filed annual orquarterly report.
14. Other expenses of issuance and distribution. Itemizes theexpenses incurred in connection with the issuance anddistribution of the securities to be registered.
15. Indemnification of directors and officers. Notes the effectof any arrangements under which the company’s di-rectors and officers are insured or indemnified againstliability.
392 SEC Filings
E1C22 03/10/2010 Page 393
16. Recent sales of unregistered securities. Identifies un-registered securities sold by the company within thepast three years and the use of proceeds.
17. Exhibits and financial statement schedules. Providesexhibits for such items as the underwriting agree-ment, consents, and powers of attorney.
What Is the Form S-3?
The Form S-3 allows a company to incorporate a largeamount of information into the form by reference, whichis generally not allowed in a Form S-1. Specifically, thecompany can incorporate the information already filed inits latest Form 10-K, subsequent quarterly 10-Q reports,and 8-K reports, thereby essentially eliminating the ‘‘in-formation with respect to the registration’’ that is neededfor the Form S-1. The Form S-3 is restricted to those com-panies meeting these four eligibility requirements:
1. It is organized within and has principal business op-erations within the United States; and
2. It already has a class of registered securities, or hasbeen meeting its periodic reporting requirements tothe SEC for at least the past 12 months; and
3. It cannot have failed to pay dividends, sinking fundinstallments, or defaulted on scheduled debt or leasepayments since the end of the last fiscal year; and
4. The aggregate market value of the common equityheld by nonaffiliates of the company is at least$75 million.
If a company has an aggregate market value of com-mon equity held by nonaffiliates of less than $75 million,it can still use Form S-3, provided that:
1. The aggregate market value of securities sold by thecompany during the 12 months prior to the Form S-3filing is no more than one-third of the aggregatemarket value of the voting and nonvoting commonequity held by its nonaffiliated investors; and
2. It is not a shell company, and has not been one forthe past 12 months; and
3. It has at least one class of common equity securitieslisted on a national securities exchange.
In addition, if the form is to be used to register non-convertible securities, they must be rated ‘‘investment-grade securities’’ by one of the nationally recognized sta-tistical rating organizations.
What Is the Form S-3? 393
E1C22 03/10/2010 Page 394
What Is the Form S-8?
The Form S-8 allows a company to register securities thatit offers to its employees and consultants under anemployee benefit plan. Such a plan can involve a broadarray of securities-related issuances, such as commonstock, stock options, restricted stock units, and purchasesunder an employee stock purchase plan. People coveredby this type of registration include employees, officers,directors, general partners, and consultants. Securitiesissued to consultants can be registered through a FormS-8 only if the consultants provide bona fide services tothe company, and those services are not related to the saleof its securities or making a market in them. Family mem-bers are also covered, if they received company securitiesthrough an employee gift.
The form has the dual advantages of being effectiveimmediately upon filing and of being extremely simple tocomplete. The company must merely state that its regularperiodic filings are incorporated by reference and note themanner in which the company indemnifies its officers anddirectors. There are a few other requirements that are gen-erally not applicable. The principle accompanying docu-ment is the employee benefit plan.
This form of registration is available only if a publiccompany has been current with its filing requirements forat least the past 12 months and has not been a shell com-pany for at least the preceding 60 days.
What Forms Require a Payment tothe SEC?
Most ongoing informational reports filed with the SEC,such as the Forms 10-Q, 10-K, and 8-K, require no fee.However, stock registration forms, such as the Forms S-1and S-3, require a payment to the SEC. The SEC will notaccept such filings if payment has not yet been received.Payments are made through the Fedwire system.
To calculate the fee to be paid to the SEC, the form in-structions for every form requiring a payment begins witha table with calculation information, entitled ‘‘Calculationof Registration Fee.’’ In it, the company itemizes theamount of securities to be offered, the proposed maxi-mum aggregate offering price, and the amount of the reg-istration fee. A sample table is presented next.
394 SEC Filings
E1C22 03/10/2010 Page 395
Title of EachClass ofSecurities toBe Registered
Amountto Be
Registered
ProposedMaximumOfferingPrice per
Unit
ProposedMaximumAggregateOfferingPrice
Amount ofRegistration
Fee
Common stock,no par valueunder the ABCCompany:20XX EmployeeStock PurchasePlan
1,000,000 $2.50 $2,500,000 $100
To ensure that a company has paid in enough funds toprocess a filing, it should submit a test filing; the test willreturn whether there are sufficient funds on hand to com-plete the filing.
How Do I Make a Fedwire Payment?
To issue a wire transfer to the SEC, include in the wire in-structions the American Bankers Association number forU.S. Bank, which is 081000210. Then include the SEC’s ac-count number at U.S. Bank, which is 152307768324, aswell as the company’s central index key (CIK). The SECassigns a CIK to every company when it initially beginsfiling activities. The ‘‘CIK’’ designation should precedethe CIK number; for example, the wiring instructionscould read CIK0123456789. An example of the wiring in-structions to the SEC is shown next.
Amount: $10,000Receiving bank ABA number: 081000210Receiving bank name: U.S. BankReceiving account number: 152307768324Receiving account name: Securities and Exchange
CommissionOriginator to beneficiary information: CIK0123456789
It is also possible to pay the SEC by check. To do so,make the check payable to the Securities and ExchangeCommission. On the front of the check, include the SEC’saccount number (152307768324) and the company’s CIKnumber. To send checks by overnight delivery service,mail to this address:
U.S. BankGovernment Lockbox 9790811005 Convention PlazaSL-MO-C2-GLSt. Louis, MO 63101
How Do I Make a Fedwire Payment? 395

E1C22 03/10/2010 Page 396
To send checks by regular mail delivery, mail to thisaddress:
Securities and Exchange CommissionP.O. Box 979081St. Louis, MO 63197-9000
The SEC occasionally changes these payment instruc-tions, so be sure to verify the most recent information onthe SEC Web site, at www.sec.gov/info/edgar/fedwire.htm.
396 SEC Filings
E1C23 03/04/2010 Page 397
CHAPTER 23
PUBLIC COMPANY ACCOUNTINGTOPICS
When Is Interim Reporting Required?
Interim reporting refers to a requirement by the Securi-ties and Exchange Commission (SEC) for all publicly heldcompanies to file quarterly information on the Form 10-Q.The intent of this requirement is to provide users of thefinancial statements with more current information.
What Is the Integral View of InterimReporting?
Under the integral view view, each interim period is con-sidered to be an integral part of the annual accounting pe-riod. As such, annual expenses that may not specificallyarise during an interim period are nonetheless accruedwithin all interim periods, based on management’s bestestimates. This heightened level of accrual usage willlikely result in numerous accrual corrections in subse-quent periods to adjust for any earlier estimation errors. Italso calls for the use of the estimated annual tax rate for allinterim periods, since the annual tax rate may vary con-siderably from the rate in effect during the interim periodif the company is subject to graduated tax rates
A number of expenses can be assigned to multiple in-terim reporting periods, even if they are incurred only inone interim period. The key justification is that the costsmust clearly benefit all periods in which the expense is re-corded. Examples of such expenses are:
m Advertising expensem Bonuses (if they can be reasonably estimated)m Contingencies (that are probable and subject to rea-
sonable estimation)
397
E1C23 03/04/2010 Page 398
m Contingent rental expense (if the contingent expenseappears probable)
m Income taxes (based on the estimated annual effec-tive tax rate)
m Profit sharing (if it can be reasonably estimated)m Property taxes
What Is the Discrete View of InterimReporting?
Under this view, each interim period is considered to be adiscrete reporting period and as such is not associatedwith expenses that may arise during other interim periodsof the reporting year. A result of this type of reporting isthat an expense benefiting more than one interim periodwill be fully recognized in the period incurred rather thanbeing recognized over multiple periods.
How Are Changes in AccountingPrinciple and EstimateAccounted for in InterimPeriods?
Any change in accounting principle must be applied to allinterim periods presented in the financial statements,which may call for retrospective application. However, achange in accounting estimate is to be accounted for onlyon a go-forward basis, so no retrospective application isallowed.
When Is Segment Information Required?
Segment information is required only for public compa-nies. It is reported in order to provide the users of finan-cial information with a better knowledge of the differenttypes of business activities in which a company is in-volved. The general requirement for segment reporting isthat the revenue, profit or loss, and assets of each segmentbe reported, as well as a reconciliation of this informationto the company’s consolidated results. In addition, thecompany must report the revenues for each product andservice, and by customer, as well as revenues and assetsfor domestic and foreign sales and operations. This infor-mation is to be accompanied by disclosure of the methodsused to determine the composition of the reportedsegments.
398 Public Company Accounting Topics
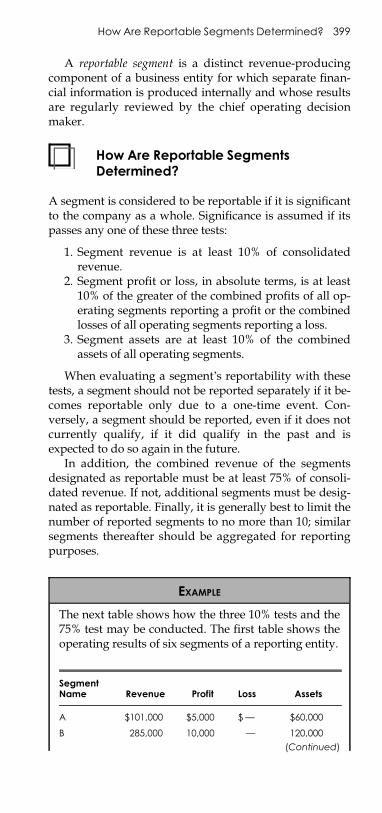
E1C23 03/04/2010 Page 399
A reportable segment is a distinct revenue-producingcomponent of a business entity for which separate finan-cial information is produced internally and whose resultsare regularly reviewed by the chief operating decisionmaker.
How Are Reportable SegmentsDetermined?
A segment is considered to be reportable if it is significantto the company as a whole. Significance is assumed if itspasses any one of these three tests:
1. Segment revenue is at least 10% of consolidatedrevenue.
2. Segment profit or loss, in absolute terms, is at least10% of the greater of the combined profits of all op-erating segments reporting a profit or the combinedlosses of all operating segments reporting a loss.
3. Segment assets are at least 10% of the combinedassets of all operating segments.
When evaluating a segment’s reportability with thesetests, a segment should not be reported separately if it be-comes reportable only due to a one-time event. Con-versely, a segment should be reported, even if it does notcurrently qualify, if it did qualify in the past and isexpected to do so again in the future.
In addition, the combined revenue of the segmentsdesignated as reportable must be at least 75% of consoli-dated revenue. If not, additional segments must be desig-nated as reportable. Finally, it is generally best to limit thenumber of reported segments to no more than 10; similarsegments thereafter should be aggregated for reportingpurposes.
EXAMPLE
The next table shows how the three 10% tests and the75% test may be conducted. The first table shows theoperating results of six segments of a reporting entity.
SegmentName Revenue Profit Loss Assets
A $101,000 $5,000 $ — $60,000
B 285,000 10,000 — 120,000
(Continued)
How Are Reportable Segments Determined? 399
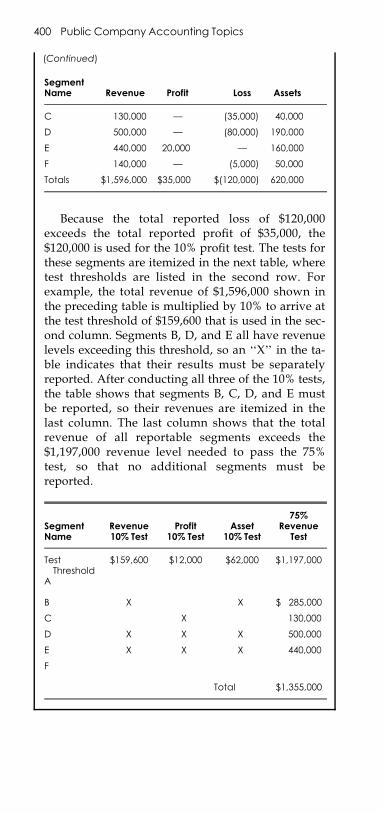
E1C23 03/04/2010 Page 400
SegmentName Revenue Profit Loss Assets
C 130,000 — (35,000) 40,000
D 500,000 — (80,000) 190,000
E 440,000 20,000 — 160,000
F 140,000 — (5,000) 50,000
Totals $1,596,000 $35,000 $(120,000) 620,000
Because the total reported loss of $120,000exceeds the total reported profit of $35,000, the$120,000 is used for the 10% profit test. The tests forthese segments are itemized in the next table, wheretest thresholds are listed in the second row. Forexample, the total revenue of $1,596,000 shown inthe preceding table is multiplied by 10% to arrive atthe test threshold of $159,600 that is used in the sec-ond column. Segments B, D, and E all have revenuelevels exceeding this threshold, so an ‘‘X’’ in the ta-ble indicates that their results must be separatelyreported. After conducting all three of the 10% tests,the table shows that segments B, C, D, and E mustbe reported, so their revenues are itemized in thelast column. The last column shows that the totalrevenue of all reportable segments exceeds the$1,197,000 revenue level needed to pass the 75%test, so that no additional segments must bereported.
SegmentName
Revenue10% Test
Profit10% Test
Asset10% Test
75%Revenue
Test
TestThreshold
$159,600 $12,000 $62,000 $1,197,000
A
B X X $ 285,000
C X 130,000
D X X X 500,000
E X X X 440,000
F
Total $1,355,000
(Continued)
400 Public Company Accounting Topics
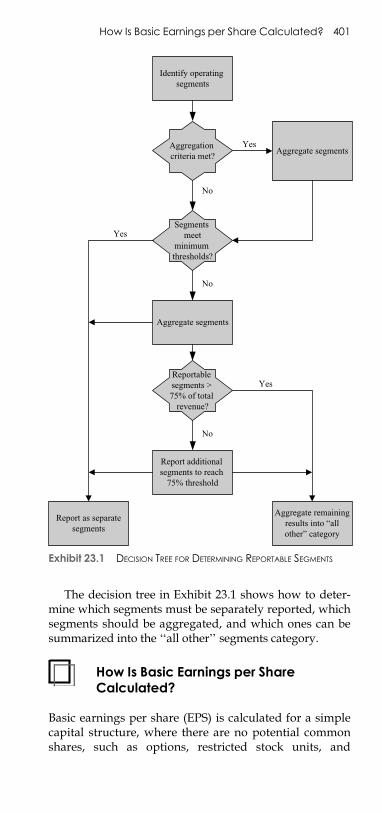
E1C23 03/04/2010 Page 401
The decision tree in Exhibit 23.1 shows how to deter-mine which segments must be separately reported, whichsegments should be aggregated, and which ones can besummarized into the ‘‘all other’’ segments category.
How Is Basic Earnings per ShareCalculated?
Basic earnings per share (EPS) is calculated for a simplecapital structure, where there are no potential commonshares, such as options, restricted stock units, and
Identify operating segments
Aggregation criteria met?
Segments meet
minimum thresholds?
Reportable segments > 75% of total
revenue?
Aggregate segments
Aggregate segments
No
No
Yes
Yes
Report additional segments to reach
75% threshold
Report as separate segments
Aggregate remaining results into “all other” category
Yes
No
Exhibit 23.1 DECISION TREE FOR DETERMINING REPORTABLE SEGMENTS
How Is Basic Earnings per Share Calculated? 401
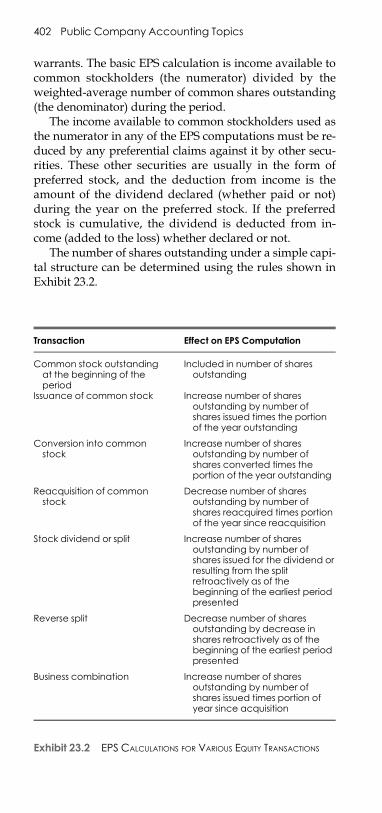
E1C23 03/04/2010 Page 402
warrants. The basic EPS calculation is income available tocommon stockholders (the numerator) divided by theweighted-average number of common shares outstanding(the denominator) during the period.
The income available to common stockholders used asthe numerator in any of the EPS computations must be re-duced by any preferential claims against it by other secu-rities. These other securities are usually in the form ofpreferred stock, and the deduction from income is theamount of the dividend declared (whether paid or not)during the year on the preferred stock. If the preferredstock is cumulative, the dividend is deducted from in-come (added to the loss) whether declared or not.
The number of shares outstanding under a simple capi-tal structure can be determined using the rules shown inExhibit 23.2.
Transaction Effect on EPS Computation
Common stock outstandingat the beginning of theperiod
Included in number of sharesoutstanding
Issuance of common stock Increase number of sharesoutstanding by number ofshares issued times the portionof the year outstanding
Conversion into commonstock
Increase number of sharesoutstanding by number ofshares converted times theportion of the year outstanding
Reacquisition of commonstock
Decrease number of sharesoutstanding by number ofshares reacquired times portionof the year since reacquisition
Stock dividend or split Increase number of sharesoutstanding by number ofshares issued for the dividend orresulting from the splitretroactively as of thebeginning of the earliest periodpresented
Reverse split Decrease number of sharesoutstanding by decrease inshares retroactively as of thebeginning of the earliest periodpresented
Business combination Increase number of sharesoutstanding by number ofshares issued times portion ofyear since acquisition
Exhibit 23.2 EPS CALCULATIONS FOR VARIOUS EQUITY TRANSACTIONS
402 Public Company Accounting Topics
E1C23 03/04/2010 Page 403
How Is Diluted Earnings per ShareCalculated?
A complex capital structure is one that includes securitiesgranting rights with the potential to be exercised and re-duce earnings per share (dilutive securities). Examples ofdilutive securities are convertible debt, convertible pre-ferred stock, options, warrants, participating securities,two-class common stocks, and contingent shares. Thecommon stock outstanding and all other dilutive securi-ties are used to compute diluted earnings per share(DEPS). DEPS represents the earnings attributable to eachshare of common stock after giving effect to all potentiallydilutive securities that were outstanding during theperiod. The computation of DEPS requires that these twosteps be performed:
1. Identify all potentially dilutive securities.2. Compute dilution, the effects that the other dilutive
securities have on net income and common sharesoutstanding.
Any antidilutive securities (those that increase EPS) arenot included in the computation of EPS.
What Methods Are Used for CalculatingDiluted Earnings per Share?
The treasury stock method, which is used for the exercise ofmost warrants or options, requires that diluted earningsper share (DEPS) be computed as if the options or war-rants were exercised at the beginning of the period (or ac-tual date of issuance, if later) and that the funds obtainedfrom the exercise were used to purchase (reacquire) thecompany’s common stock at the average market price forthe period.
The if-converted method is used for those securities thatare currently sharing in the earnings of the companythrough the receipt of interest or dividends as preferentialsecurities but that have the potential for sharing in theearnings as common stock (e.g., convertible bonds or con-vertible preferred stock). The if-converted method recog-nizes that the convertible security can share in theearnings of the company only as one or the other, notboth. Thus, the dividends or interest less income taxeffects applicable to the convertible security as a preferen-tial security are not recognized in income available tocommon stockholders used to compute DEPS, and the
Calculating Diluted Earnings per Share 403

E1C23 03/04/2010 Page 404
weighted-average number of shares is adjusted to reflectthe assumed conversion as of the beginning of the year(or actual date of issuance, if later).
How Should Non-GAAP Information BeDisclosed?
The SEC requires that a company issuing informationabout a non–generally accepted accounting principles(GAAP) financial measure accompany that presentationwith this information:
m A presentation of the most directly comparablefinancial measure, calculated and presented in ac-cordance with GAAP
m A reconciliation of the differences between the non-GAAP financial measure with the most comparablefinancial measure as calculated and presented inaccordance with GAAP
The SEC defines a non-GAAP financial measure as onethat excludes amounts that are included in the mostdirectly comparable GAAP measure or that includesamounts excluded from the most directly comparableGAAP measure.
404 Public Company Accounting Topics
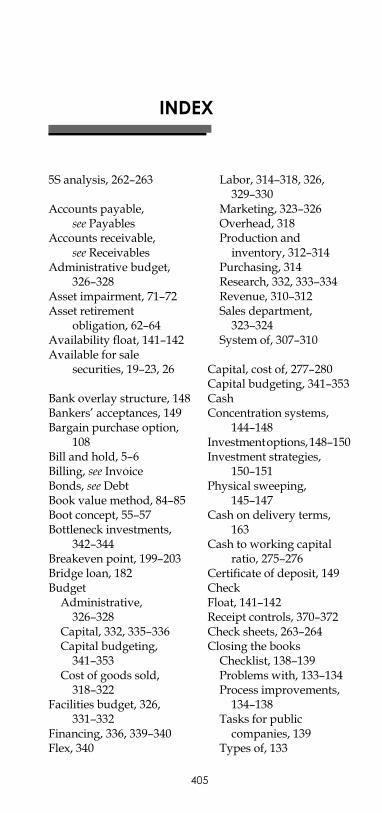
E1BINDEX 03/10/2010 Page 405
INDEX
5S analysis, 262–263
Accounts payable,see Payables
Accounts receivable,see Receivables
Administrative budget,326–328
Asset impairment, 71–72Asset retirement
obligation, 62–64Availability float, 141–142Available for sale
securities, 19–23, 26
Bank overlay structure, 148Bankers’ acceptances, 149Bargain purchase option,
108Bill and hold, 5–6Billing, see InvoiceBonds, see DebtBook value method, 84–85Boot concept, 55–57Bottleneck investments,
342–344Breakeven point, 199–203Bridge loan, 182BudgetAdministrative,326–328
Capital, 332, 335–336Capital budgeting,341–353
Cost of goods sold,318–322
Facilities budget, 326,331–332
Financing, 336, 339–340Flex, 340
Labor, 314–318, 326,329–330
Marketing, 323–326Overhead, 318Production andinventory, 312–314
Purchasing, 314Research, 332, 333–334Revenue, 310–312Sales department,323–324
System of, 307–310
Capital, cost of, 277–280Capital budgeting, 341–353CashConcentration systems,
144–148Investmentoptions,148–150Investment strategies,
150–151Physical sweeping,
145–147Cash on delivery terms,
163Cash to working capital
ratio, 275–276Certificate of deposit, 149CheckFloat, 141–142Receipt controls, 370–372Check sheets, 263–264Closing the booksChecklist, 138–139Problems with, 133–134Process improvements,134–138
Tasks for publiccompanies, 139
Types of, 133
405
E1BINDEX 03/10/2010 Page 406
Collateral trust bond, 181Collection
Agency, 163Call database, 160–161Controls, 367–370Legal action, 164Techniques, 162–163Collection method, 17Commercial paper, 150,
177Completed contract
method, 6–7Completed performance
method, 17Consigned inventory,
34–35Construction in progress,
accounting for, 65Constructive retirement
method, 97Contracts
Additional claims under,11
Losses on, 10–11Types of, 7–9Controls
Check receipt, 370–372Collection, 367–370Drop shipping, 361–362Inventory, 362–364Investment, 372–374
Invoicing, 364–367Order entry, credit, andshipping, 359–361
Payable 355–356Payroll, 374–377Procurement card,357–359
Convertible bond, 84–85,181
Convertible preferredstock, 88–89
Core growth rate,276–277
Cost of capital, 277–280Cost goods sold budget,
318–322Cost reduction
Itemization matrix,245–246
Payoff matrix, 244Risk matrix, 244Cost–type contracts, 7–9Cost, insurance, and freight
contract, 33Coupon bond, 180–181CreditControls, 359–361Granting system,155–156
Insurance, 156–157Policy, 153–154Rating agencies,184–185
Reports, 154–155Reviews, timing of, 157Terms, 156–157
Cross docking, 170Current rate method,
121–123Current ratio, 280–281CustomerContact information,159–160
Payment deductions,161–162
Turnover, 281–282
Debenture, 181DebtAttached rights, 80–81Bond types, 180–182Convertible, 84–85Coverage ratio, 283–284Default, 83Discounts andpremiums, 76–77
Effective interestmethod, 77–78
Elimination, 83–84Extinguishment, 82Issuance costs, 79–80Restructuring, 83Term designation, 75To Equity ratio, 284–285Zero interest, 79
406 Index
E1BINDEX 03/10/2010 Page 407
Debt securities, seeSecurities, debt
Deduction management,161–162
Deferred interest bond, 181Deposit method, 11–13DepreciationBasis, 66–67Concepts, 67–68Double–decliningbalance, 68–69
Straight–line, 68Sum of the years’ digits,69–70
Units of production,70–71
Diluted earnings per share,403–404
Direct financing lease,114–117
DividendDates, 93Liquidating, 95Payout ratio, 285–286Property, 93–94Stock, 94–95
Dollar–value LIFO, 44–46Donated assets, accounting
for, 64Double–declining balance
depreciation, 68–69Double–extension method,
44Downstream workstations,
346–347Drop shipping, 170,
361–362Dumping, 234–235Dunning letters, 163
Early payment discounts,159
Earnings credit strategy,150–151
Earnings per share,calculation of, 401–404
Economic value added,286–289
Efficiency variances,206–207
Effective interest method,77–78
EmployeeCost roll–up, 256–258Profitability analysis, 259Employee stock ownership
plan, 104–106EquityInvestments, 26–28Method, 26–30Registration methods,187–191
Error quantification, 265Ex–ship delivery, 34Expected commercial
value, 212–213Expense coverage days,
289–290
Facilities budget, 326,331–332
Factoring, 177–178Fair value method, 99–100Fast close, 133Fedwire payments,
395–396Fixed cost analysis,
265–266Flex budgeting, 340Floorless bond, 181Field warehouse financing,
178–179First–in, first–out method,
38–41Fixed assetsBasis, 66–67Capitalizationinclusions, 53
Depreciation, seeDepreciation
Disposition, 61–62Donation of, 64Group of, 57–58Improvements to,58–59
Intangible, 72–73
Index 407
E1BINDEX 03/10/2010 Page 408
Fixed assets (continued )Interest capitalization,59–61
Obtained throughexchange, 54–55
Trade–in, 55–57Fixed charge coverage,
290–292Fixed overhead spending
variance, 205Fixed–price contracts, 7–9Float, types of, 141–142Floor planning, 179FOB shipping point, 34Form 10–K and 10–Q,
388–391Form 8–K, 382–387Form S–1, 391–393Form S–3, 393Form S–8, 394Foreign currency
Conversion decision tree,126
Current rate method,121–123
Exchange rates, 128–129Intercompany usage of,129
Remeasurement method,124–125
Translation adjustments,127–128
Forward picking, 171–172Franchise sales recognition,
17–18Free alongside, 33–34Free on board, 34
Goods in transit, 33Gross revenue recognition,
3–4Guaranteed bond, 181
Held to maturity securities,19, 20, 26
If–converted method,403–404
Income bond, 182ImpairmentAsset, 71–72
Installation fees, 13–14Installment method, 4–5Intangible assets,
accounting for, 72–73Interest capitalization,
59–61Interim reporting, 397–398Intrinsic value method,
97–99InventoryAccuracy measurement,292–293
Budget, 312–314Buffer trend report, 346Closing process, 136–137Consigned, 34–35Controls, 362–364Dispositioning, 176Dollar–value LIFO,44–46
Goods in transit, 33First–in, first–out
method, 38–41Last–in, first–outmethod, 41–43
Link–chain valuationmethod, 46–49
Lower of cost or marketrule, 36–38
Obsolescence, 171,174–176
Overhead allocation,35–36
Picking efficiency,171–173
Record accuracy,165–168
Reduction strategies,168–169
Scrap reduction, 173–174Storage compression,170–171
Turnover, 294–296Weighted–averagevaluation, 49–52
408 Index
E1BINDEX 03/10/2010 Page 409
InvestmentControls, 372–374
Payback, 351–353Investments, see Securities,
MarketableInvoiceControls, 364–367Delivery 158–159Layout of, 157–158
Ishikawa diagrams,266–267
Journal entry optimization,136
Labor budget, 314–318,326, 329–330
Labor efficiency variance,206–207
Labor price variance,204–205
Laddering strategy, 151Land, accounting for, 66Last–in, first–out method,
41–43Lease or buy decision,
347–349Leasehold improvements,
accounting for, 66LeasesBargain purchase option,108
Capital, 108–110, 180Direct finance, 114–117Extension of, 118–119Operating, 107–108, 111,179
Sale–leaseback, 119–120,183–184
Sales–type, 111–114Sublease, 119Termination of, 118
Life cycle pricing, 232Line of credit, 180Link–chain valuation
method, 46–49Liquidating dividend, 95Loan, bridge, 182
Lockbox, 143Lower of cost or market
rule, 36–38
Mail float, 141–142Maintenance, repair, and
operationsSpend analysis, 250–251
Margin of safety, 296–297Market value method,
84–85Marketable securities, see
Securities, MarketableMarketing budget, 323–326Matching strategy, 151Material price variance, 204Material yield variance, 206Materials review board,
174Maverick spenders, 252Money market fund, 150Mortgage bond, 182
Net present value, 349–350Net revenue recognition,
3–4Net worth calculation,
297–299Notional pooling, 147–148
Obsolete inventory, seeInventory, obsolete
Option, see Stock optionOrder entry controls,
359–361Outsourcing decision,
218–220OverheadAllocation to inventory,35–36
Budget, 318
Par value, 87Parts consolidation, 250PayablesClosing process, 137–138Controls, 355–356Turnover, 271
Index 409
E1BINDEX 03/10/2010 Page 410
Payment deductionmanagement, 161–162
PayrollClosing process, 137Controls, 374–377
Percentage of completionmethod, 6
Phased deliveries, 169Physical sweeping,
145–146Pick–to–light, 172Picking systems, 171–173Policy, credit, 153–154Preferred stock, 88Presentation float, 141–142Price/earnings ratio,
299–300Price reduction analysis,
216–218, 227–229Price setting
Against a price leader,232
Long–term, 229–232Price variances, 204–205Price war strategies,
233–234Processing float, 141–142Procurement card controls,
357–359Product addition analysis,
222–226Product mix analysis,
203–204Production budget,
312–314Property dividend, 93–94Proportional performance
method, 15Purchasing budget, 314
Quick ratio, 300–301
ReceivableAverage collectionperiod, 273–274
Financing, 178Securitization, 182–183Turnover, 272–273
Registered bond, 180RegistrationExemptions from,192–196
Statement, 192Remeasurement method,
124–125Remote deposit capture,
143–144Repurchase agreement, 150Research and developmentBudget, 332, 333–334Funding decision,211–213
Retained earnings, 91Reverse split, 90Revenue budget, 310–312Revenue RecognitionBill and hold, 5–6Collection method, 17Completed contractmethod, 6–7
Completed performancemethod, 17
Deposit method, 11–13Franchise, 17–18Gross reporting, 3–4Installation fees, 13–14Installment method,3–4
Net reporting, 3–4Percentage ofcompletion, 6
Proportionalperformance method,15
Right of return, 5Specific performance
method, 15Right of return, 5Risk pooling, 169Rule 144 security sales,
195–196
Sale–leaseback transaction,119–120, 183–184
Sales, see RevenueRecognition
410 Index
E1BINDEX 03/10/2010 Page 411
Sales department budget,323–324
Sales–type lease, 111–114Scrap reduction, 173–174SEC filings, 381–394SEC payments, 394–396Securities gains or losses,
30–31Securities, debtAccounting for, 24–25
Securities, marketableAccounting for, 19–23,
26Amortization of, 29Tax effects, 26Types of, 19
Segment reporting,398–401
Serial bond, 182ServicesBillings, 15–17Profit analysis, 207–210Service life, 67Shelf registration, 191Shipping controls, 359–361Small claims court filing,
164Soft close, 133Specific performance
method, 15SpendAnalysis, 244–247Compliance, 251–252Database, 247–248Reports, 252–255Staffing decision, 220–222StockAppreciation rights,103–104
Convertible preferred,88–89
Dividend, 94–95Option, 97–102Par value, 87Preferred, 88Split, 89–90Subscription, 90–91Treasury, 96–97
Valuation, 87–88Warrant, see Warrants
Straight–line depreciation,68
Sublease accounting, 119Sum of the years’ digits
depreciation, 69–70Supplier consolidation,
248–250
Throughput analysismodel, 213–226
Time and materialscontracts, 7–9
Times interest earned,301–303
Trading securities, 19,20–23, 26
Trading volume formula,195
Tranched cash flowstrategy, 151
Transfer pricing, 235–242Treasury stock, 96–97Treasury stock method,
403–404
Unit price contracts, 7–9Units of production
depreciation, 70–71Upstream workstations,
345–346
Value dating, 143Value stream mapping,
266–269Variable overhead
efficiency variance,207
Variable overheadspending variance, 205
Variable rate bond, 182Virtual close, 133Voice picking, 172
Warrants, 86, 92–93Waste analysis, 268–270Wave picking, 172
Index 411
E1BINDEX 03/10/2010 Page 412
Weighted–averagevaluation method,49–52
Well-known seasonedissuer, 191
Where used report, 175Workforce reduction
Alternatives to, 261–262
Analysis, 255–262Working capital
productivity, 303–304
Zero-balance account, 145Zero-coupon bond, 182Zero interest debt, 79Zone picking, 172–173
412 Index
The all-new fast-reference problem solver
Accounting
T he Vest Pocket Controller is the handy pocket pr oblem solver that gives today’s busy executives and accountants the helpful
information they need in a quick-r eference format.
Whether in public practice or priv ate industr y, professionals will always have this reliable reference tool at their fingertips because it easily goes anywhere—to a client ’s office, on a business trip , or to an important lunch meeting.
Providing concise answ ers to the questions y ou ar e most likely to encounter during a typical business day , The V est Pocket Controller covers:
• The most heavily used GAAP accounting standar ds• The management areas a controller is likely to encounter• A variety of financial analysis topics with a par ticular focus on bottleneck analysis
• Metrics a controller is most likely to need, along with helpful examples
• The primary control systems you need to ensure your transactions are as error-free as possible
• How to analyze capital budgeting proposals so that only truly necessary assets are acquired
Packed with practical techniques and rules of thumb for analyzing, evaluating, and solving the day-to-day pr oblems ev ery contr oller faces, The Vest Pocket Controller helps y ou quickly pinpoint what to look for, what to watch out for , what to do, and ho w to do it. Its easy-to-use Q & A format offers hundr eds of explanations sup-ported by a multitude of examples, tables, char ts, and ratios.
Convenient and compr ehensive, The Vest P ocket Contr oller is a powerful companion for the ever-changing world of the controller.
STEVEN M. BRA GG, CPA, has been the chief financial officer or controller of four companies, as w ell as a consulting manager at E rnst & Young and auditor at D eloitte. H e is the author of over thir ty books primarily targeted to ward controllers and their needs. B ragg r eceived a master ’s degr ee in finance fr om Bentley College, an MBA from Babson College, and a bachelor ’s degree in economics from the University of Maine.
The FAST-REFERENCE PROBLEM SOLVER for EXECUTIVES and ACCOUNTANTS
Steven M. Bragg
Includes:■ Capital budgeting techniques■ Foreign exchange risk management■ Essential GAAP■ Working capital management techniques■ Stock registration alternatives■ Key performance metrics
THEVESTPOCKET
Controller
PMS 279 PMS 2623 GLOSSY
THE VEST POCKET Controller
Bragg
$29.95 USA/$35.95 CAN
Related Documents