The versatile use of exhaled volatile organic compounds in human health and disease This article has been downloaded from IOPscience. Please scroll down to see the full text article. 2012 J. Breath Res. 6 027108 (http://iopscience.iop.org/1752-7163/6/2/027108) Download details: IP Address: 137.120.156.7 The article was downloaded on 08/06/2012 at 11:30 Please note that terms and conditions apply. View the table of contents for this issue, or go to the journal homepage for more Home Search Collections Journals About Contact us My IOPscience

Welcome message from author
This document is posted to help you gain knowledge. Please leave a comment to let me know what you think about it! Share it to your friends and learn new things together.
Transcript

The versatile use of exhaled volatile organic compounds in human health and disease
This article has been downloaded from IOPscience. Please scroll down to see the full text article.
2012 J. Breath Res. 6 027108
(http://iopscience.iop.org/1752-7163/6/2/027108)
Download details:
IP Address: 137.120.156.7
The article was downloaded on 08/06/2012 at 11:30
Please note that terms and conditions apply.
View the table of contents for this issue, or go to the journal homepage for more
Home Search Collections Journals About Contact us My IOPscience
IOP PUBLISHING JOURNAL OF BREATH RESEARCH
J. Breath Res. 6 (2012) 027108 (21pp) doi:10.1088/1752-7155/6/2/027108
The versatile use of exhaled volatileorganic compounds in human health anddiseaseAgnes W Boots1, Joep J B N van Berkel1, Jan W Dallinga1,Agnieszka Smolinska1, Emile F Wouters2 and Frederik J van Schooten1,3
1 Department of Toxicology, Maastricht University, The Netherlands2 Department of Respiratory Medicine, University Hospital Maastricht, The Netherlands
E-mail: [email protected]
Received 3 February 2012Accepted for publication 1 May 2012Published 23 May 2012Online at stacks.iop.org/JBR/6/027108
AbstractExhaled breath contains thousands of volatile organic compounds (VOCs) of which thecomposition varies depending on health status. Various metabolic processes within the bodyproduce volatile products that are released into the blood and will be passed on to the airwayonce the blood reaches the lungs. Moreover, the occurrence of chronic inflammation and/oroxidative stress can result in the excretion of volatile compounds that generate unique VOCpatterns. Consequently, measuring the total amount of VOCs in exhaled air, a kind ofmetabolomics also referred to as breathomics, for clinical diagnosis and monitoring purposesgained increased interest over the last years. This paper describes the currently availablemethodologies regarding sampling, sample analysis and data processing as well as theiradvantages and potential drawbacks. Additionally, different application possibilities of VOCprofiling are discussed. Until now, breathomics has merely been applied for diagnosticpurposes. Exhaled air analysis can, however, also be applied as an analytical or monitoringtool. Within the analytic perspective, the use of VOCs as biomarkers of oxidative stress,inflammation or carcinogenesis is described. As monitoring tool, breathomics can be appliedto elucidate the heterogeneity observed in chronic diseases, to study the pathogen(s)responsible for occurring infections and to monitor treatment efficacy.
(Some figures may appear in colour only in the online journal)
1. Introduction
1.1. The history of VOC recognition
If you were asked to smell the armpit of an unknown person,you probably would not do this, whereas you would say yeswhen asked to smell a baby. In other words, we are able tosense the different chemicals spread by an armpit or baby andcan label them as either unpleasant or pleasant. The ability ofhumans to differentiate between these two smells is due to therecognition of a combination of specific volatile chemicalsby a unique set of olfactory receptors [1]. This results in
3 Author to whom any correspondence should be addressed.
a multidimensional pattern that is integrated in our brain,enabling us to train ourselves in recognizing and memorizingsmells. Indeed, even without knowing the chemicals, we areable to know how a bakery or a wet street or bad breath smellsdue to the presence of such algorithms in our head that arecapable of identifying 4000 to 10 000 different smells [1].
Smelling can be seen as a chemical sense as we sample ourenvironment for information and recognition. It has been toldthat in the medical setting nurses can recognize the conditionof their patients by smell. In ancient times, Greek physicianswere already aware of the relationship between the odor ofa subjects’ breath and possible diseases associated with it.Indeed, they realized it could provide insight into physiologicaland pathophysiological processes in the body [2]. For example,
1752-7155/12/027108+21$33.00 1 © 2012 IOP Publishing Ltd Printed in the UK & the USA

J. Breath Res. 6 (2012) 027108 A W Boots et al
the sweet acetonic smell of breath might indicate uncontrolleddiabetes whereas a fishy musty reek of breath relates to liverdisease and a urine-like smell is associated with kidney failure[3]. Apparently, there is something present in breath that mightenable diagnosing certain diseases or providing the means tomonitor metabolic processes in the body. Due to the greatpotential of applications in clinical diagnostics and its non-invasive nature, exhaled air analysis has become of increasedinterest in recent years. Over the last few decades, the technicaladvances in analytical analysis have been responsible forlarge developmental improvements both in diagnostics andunderstanding underlying metabolic and biological pathways.Together, these developments have led to the promise of newbiomarkers in exhaled air that might characterize and identifydiseases.
1.2. The best-studied volatile markers thus far
Exhaled air is a mixture of nitrogen, oxygen, carbon dioxide,inert gases, water vapor (up to saturation) and traces of volatileorganic compounds (VOCs) [4]. Current analytical methodsenable the detection of several hundreds of compounds inone single breath sample. Interestingly, several thousands ofdifferent compounds have already been identified in exhaledair overall, demonstrating the vast diversity of compoundsavailable in breath. However, up till now only a few compoundsdetected in breath have demonstrated their value as biomarkers.One of the generally accepted exhaled biomarkers is nitricoxide (NO), of which increased levels are associated withthe occurrence of pulmonary inflammation and oxidativestress in various chronic lung diseases including asthmaand chronic obstructive pulmonary disease (COPD) [5–7].Another well-studied volatile biomarker is carbon monoxide(CO), although its study results are rather ambivalent. Forinstance, Yamaya et al reported a significant relationshipbetween exhaled CO concentrations and certain lung functionmarkers as well as a clear correlation between exhaled COand eosinophil count in sputum [8]. In contrast, other studiesincluding that of Montuschi et al did not find any correlationbetween exhaled CO and lung function [9]. Besides theambiguous results, the application of CO as a diagnosticmarker is also limited due to the fact that exhaled COlevels are seriously affected by environmental CO. As thelatter might fluctuate considerably and is easily influencedby active and passive smoking, using exhaled CO levels asa biomarker can be considered questionable at least [10].Besides these small volatile biomarkers, research has also beenperformed regarding the use of organic compounds derivedfrom biological processes such as lipid peroxidation includingethane and pentane (see also section 3.1.1). Already thepossibility to analyze ethane and pentane levels in exhaled airas markers of in vivo lipid peroxidation has been demonstratedin the early 80s [11]. Additionally, elevated levels of exhaledethane and pentane are reported in patients suffering fromseveral chronic lung diseases including COPD, asthma andcystic fibrosis (CF) [12–15].
1.3. The development of breathomics
The use of individual VOCs as biomarkers of exposure ordisease is seriously hampered by the fact that using a singlecompound is generally insufficient to monitor complex andheterogeneous situations including environmental exposuresor chronic diseases. Consequently, exploring the total amountof exhaled VOCs, called the volatome, is expected togenerate more adequate information regarding the complexityof processes underlying the pathophysiologies of interest.Certainly, analyzing the volatome implies a more sensitive andspecific discrimination between various conditions as it reflectschanges in both exogenous and endogenous compounds.The approach of measuring exogenous compounds comprisesproducts derived from environmental noxes, bacteria andviruses whereas endogenously formed compounds are relatedto physiologic or pathologic biochemical processes. Such asystemic study of unique chemical fingerprints that specificcellular processes leave behind, thereby mapping the entireprofile of metabolites in a single cell, tissue or organism, iscalled metabolomics [16]. The concept that individuals mightpossess a ‘metabolic profile’ reflecting the composition of theirbiological fluids and gases was first introduced in the late 1940s[17]. While the first disease-specific metabolic patterns werediscovered in urine and saliva using paper chromatography,advanced technologies became rapidly available and furtherincreased the interest in qualitative analysis of metabolicprofiles in the late 1960s and 1970s. Indeed, new technologiesled to the characterization of unique metabolic profiles,consisting of hundreds or thousands of chemical constituents,not only in biological fluids including blood and urine butalso in the headspace of such fluids and in breath [18, 19].Consequently, identifying discriminating compounds in breathwith regard to exposure or disease is currently regarded as away of delivering non-invasive biomarker profiles to monitorsuch conditions. The general concept of metabolomics onexhaled air, also called breathomics, follows steps startingfrom clinical and biological questions, supporting in vitrostudies, measurements of volatile compounds by analyticalplatforms, data handling including statistical analyses, untilidentification of biomarker profiles that subsequently needto be clinically validated in independent patient studies(figure 1). In this paper we discuss issues around airsampling, the currently applied mass spectrometry (MS)-based methodologies, data (pre)processing and analysis, andexamples of clinical applications.
2. Analytical techniques
Ever since breathomics first gained interest, the appliedmethodologies regarding breath analysis have evolvedtremendously. In order to distinguish endogenous biomarkersof exposure or disease from contaminants originating from thesampling environment, reliable methods for sampling, analysisand data processing are obligatory [20–24]. However, to dateno consensus has been established regarding a standardizedand integrated operating procedure. Different research groupsapply different methodologies regarding sampling, sample
2

J. Breath Res. 6 (2012) 027108 A W Boots et al
Figure 1. Flowchart demonstrating the usual steps followed in breathomic biomarker discovery.
analysis and data processing. All approaches comprise severaladvantages as well as potential drawbacks, of which the mostimportant issues are briefly discussed in this paper.
2.1. Issues around the sampling of breath
Exhaled air comprises a mixture of dead-space air and alveolarair. The dead-space air consists of roughly 150 ml air fromthe upper airway where no gaseous exchange between bloodand breath air is facilitated [4, 21]. Consequently, this partof the exhaled air displays a high resemblance with thepreviously inspired air. In contrast, alveolar air originatesfrom the lower airways where gaseous exchange betweenblood and breath air results in concentrations of endogenouscompounds that are two to three times higher comparedto those observed in dead-space air. In short, there arethree ways to sample exhaled air: (a) upper airway collectionby sampling dead-space air only, (b) lower airway collectionby sampling alveolar air only and (c) mixed air collection bysampling whole breath, i.e. a mixture of dead-space air andalveolar air [22]. In some breath tests, including exhaled nitricoxide (FeNO) measurements, different airway sites can be usedto analyze the increased fraction of FeNO, since NO is directlyreleased into both dead-space and alveolar air. In asthma,increased FeNO in both central as well as in peripheral airwaysites reflects eosinophilic-mediated inflammatory pathwaysreasonably well and relates to increased inhaled and systemiccorticosteroid responsiveness [5–7]. In contrast to FeNO,most VOCs are ideally not measured in the dead-space air.Systemically generated VOCs are known to be only present inbreath due to their release from the blood and are therefore bestanalyzed in alveolar air or a mixed air collection. Additionally,VOCs generated during pulmonary physiologic and pathologicprocesses, including inflammation and lipid peroxidation, arebest measured in the alveolar air as they will directly betransferred from the target organ. In general, it can be statedthat endogenous VOCs display a higher concentration inalveolar air than in mixed air [4], although this largely dependson the fraction of dead-space air present in the latter.
In practice, measuring VOCs in alveolar air is oftenhampered by dilution of the required sample with dead-space
air. Consequently, various solutions have been developed overthe years to minimize the occurrence of such a dilution. Themost efficient one samples the alveolar air by a CO2-controlledvalve that uses the end-tidal CO2 concentration as a markerof the transition of dead-space into alveolar air [22]. A lesssubtle but more simple solution involves the breath-collectingapparatus that transports the alveolar air to a desorption tubeusing a reservoir filled with every exhalation [23]. In short,this reservoir enables the selective sampling of alveolar air byleaving behind the dead-space air provided that it is applied inan ideal situation where no diffusion is possible [23].
Measuring VOCs in mixed air implies sampling wholebreath that consists of both dead-space air and alveolar air.Our group has adapted a whole breath collection methodbased on inflating a Tedlar bag of 5 l. Using this approach,it can be estimated that dead-space air comprises only 150 mlof the total 2.5–4 l of exhaled air in adults per exhalation.We have proven that the contribution of dead-space air tothe total volume of whole breath does not lead to sensitivityissues in measuring VOCs by gas chromatography time-of-flight mass spectrometry (GC-TOF-MS) [24]. Additionally,an advantage of sampling 5 l instead of one single breath is ahigher reproducibility and lower variability as it is still difficultto ensure that a single breath is representative for all subsequentbreaths [4]. Finally, sampling whole breath instead of onlyalveolar air adds to the simplicity of exhaled air metabolomicsas it increases the ease of use for the physician while decreasingthe degree of discomfort for the patient.
2.2. Sample analysis techniques
In order to either quantitatively or qualitatively determinethe compounds present in exhaled air, several advancedtechnologies are available. The next paragraphs are dedicatedto the most important sampling analysis and data processingtechniques currently employed with respect to breathomics.Additionally, the main characteristics of the various sampleanalysis techniques are summarized in table 1.
2.2.1. Gas chromatography mass spectrometry. A commonlyapplied methodology to accurately measure trace gases in
3

J. Breath Res. 6 (2012) 027108 A W Boots et al
Table 1. Characteristics of the various sample analysis techniques currently used in breathomics.
Sample analysis technique Strengths Weaknesses
Gas chromatography combined (1) Complete profile recognition (1) Time-consumingwith mass spectrometry
(2) Single VOC identification, thus linkage (2) No real-time measurements possibleto underlying processes possible(3) High sensitivity(4) Sample time and place independent of measurement
Ion mobility spectrometry (1) High sensitivity (1) No complete profile recognition(2) Fast (compared to GC-MS) (2) Time-consuming
(3) No real-time measurements possibleProton transfer reaction (1) No need for pre-concentration (1) No complete profile recognitionmass spectroscopy (2) Real-time measurement possible (2) No single VOC identification
(3) High sensitivity (3) Total VOC concentration measurable<10 ppmv(4) Limited number of components detectable,no differentiation of isomeric and isobaric ions
Selected ion flow tube (1) Real-time measurement possible (1) No complete profile recognitionmass spectrometry
(2) High sensitivity (<ppb) (2) No single VOC identification(3) Water vapor quantification possible
Gas chromatograph (separation
Sample entry
+
+ ++++
+ ++++
++
Ionization and acceleration part
Acceleration grids Electron gun
++++++++ +
Field free drift partFlight tube
Detector
+
+
Mass spectrometer
Figure 2. Schematic diagram of GC-TOF-MS (based on [25]). Breath sample is first injected into the separation column of the gaschromatograph. Separated molecules inlet to the TOF-MS where first ionization occurs. The time necessary to travel from an ion source to adetector is measured. Ions in the flight tube separate into groups or packets according to velocity.
complex mixtures such as exhaled air is based on gaschromatography mass spectrometry (GC-MS) [25]. In thismethod, schematically depicted in figure 2, the sample isintroduced in a GC that separates the different compoundsin the mixture based on differential specific interactions ofthe compounds with the mobile phase and the lining of thecapillary column material. After their transport through thecolumn, the compounds are introduced into the MS to detectand also to identify the separated VOCs. Within the ion sourceof the MS, the compounds are ionized leading to molecularions and characteristic fragment ions. Different detectors areused of which the time-of-flight (TOF) spectrometer is themost widely applied [22, 25, 26].
In general, the GC-MS technique is proven to be highlysensitive and robust, two characteristics known to add to ahigh degree of reproducibility [22, 25]. It has been shown thatGC-MS analyses result in highly accurate chromatograms,which are called breathograms when measuring exhaled airsamples with this technique [22, 24, 27]. Figure 3 shows atypical example of such a breathogram containing all exhaledVOCs. In contrast to the previously described detector–GC–MS combinations, GC-TOF-MS is capable of delivering fullmass spectral information of all compounds [23, 25, 45]. Inother words, the GC-TOF-MS is equipped to detect specific
VOCs linked to exposure or disease status and at the sametime is also able to identify these unique VOCs. Therefore, ithas been suggested that GC-TOF-MS is to be preferred as anexcellent screening tool for new biomarkers in the monitoringof exposures and diseases [22, 24, 28].
This major advantage outweighs the drawbacks of thismethod, including the fact that it is rather time-consuming,needs sample pre-concentration and cannot take placein situ [29]. The latter implies that real-time measurementscannot be performed, which makes this technique moreuseful for analyzing stable physiological parameters than formonitoring rapid changes in VOC concentrations due to, forinstance, changes in heart rate or ventilation [29]. However,if fast and continuous on-line monitoring is not required, thedisadvantages of not measuring in situ and pre-concentratingthe samples can easily be overcome by transporting the exhaledsamples onto stainless steel two-bed sorption tubes, as theyare shown to trap, concentrate and stabilize VOCs for at least1 year [24]. Moreover, these disadvantages can turn into anadvantage: in this case, the off-line sampling and storage onthermal desorption tubes means that samples from variouslocations and collected during a longer period of time can bemeasured on one instrument in a short period of time, therebyeliminating a good deal of instrumental variation.
4

J. Breath Res. 6 (2012) 027108 A W Boots et al
Figure 3. Schematic representation of VOC technology, resulting in a breathogram. The area-under-peak is related to the concentration ofthe compound presented by this peak.
shutter
Sample entry
Buffer gas transporter
Pulse ion source
Ionization source
Drift partFlight tube Detector
+ + +
Electric field gradient
Drift gas
Detector plate
abc
Figure 4. Schematic diagram of an ion mobility spectrometer (based on [25]). Sample containing molecules is carried into the ionizationpart, which is next drifted under the influence of the electric field. Small ions (a) travel faster than heavier ions (b and c). Next they reach adetector plate and the signal is obtained.
2.2.2. Ion mobility spectrometry. Ion mobility spectrometry,or IMS, is an instrumental analytical method that is similarto TOF-MS. The IMS technique, schematically depicted infigure 4, separates (molecular) ions according to their mobilityas they move through a so-called drift tube filled with a purifiedgas such as air or nitrogen [25, 30].
As the different ions present in the sample are forcedthrough the tube by means of an applied electric field, theywill display different velocities based on their characteristics.Separating the ions can further be optimized by changing thedrift length, drift gas, electric field strength, temperature andpressure [25, 30]. Combining this technique with GC improvesits applicability.
2.2.3. Proton transfer reaction mass spectroscopy. Determi-nation of the content of complex gas mixtures such as breathwith proton transfer reaction mass spectrometry (PTR-MS) isbased on chemical ionization of the target molecules by protontransfer reactions (figure 5) [31, 32]. Upon their chemical ion-ization by proton transfer reactions with H3O+ primary ions,the protonated molecules are accelerated followed by detectionusing an inline MS [33].
Advantages of this technique include the fact that samplescan be readily analyzed as there is no pre-concentrating stepor separation processes involved as is often the case for otheranalysis techniques [22]. Moreover, combining this ready-to-use sample analysis with very fast response times (in the orderof 100 ms) even enables real-time measurement of samples
with PTR-MS, which is of special importance in situationswhere rapid and sudden changes of VOC concentrations areexpected [29]. Additionally, this method may display a slightlyenhanced sensitivity due to a minimal fragmentation degreeof the molecular ions compared to that observed in otheranalytical techniques [22, 32]. Unfortunately, PTR-MS is alsoa very selective technique that measures only a limited numberof volatile compounds, as it can only detect compounds witha proton affinity higher than that of water [33, 34]. Moreover,PTR-MS cannot differentiate isomeric and isobaric ions sincethey are all detected at the same nominal mass. Consequently,it can only be used to analyze a relatively small fraction of thetotal VOC profile present in breath and thus not to define a totalbreath-print. Moreover, chemical identification of the detectedions, required to pin down specific VOCs and/or underlyingmetabolic processes to exposure or disease status, remainsvery difficult since no fragmentation is detected. Finally, thismethod is also not applicable for rather concentrated samplesas the total VOC concentration that can be analyzed shouldnot exceed 10 parts per million per volume (ppmv).
2.2.4. Selected ion flow tube mass spectrometry. Selectedion flow tube mass spectrometry (SIFT-MS) is an analyticaltechnique for the simultaneous real-time quantification ofseveral gases (figure 6). This method is based on theformation of reactant ions (precursors) by electron impact ormicrowave discharge in a carrier gas in a separate ionizationregion. In short, the exhaled gases are led through a flow
5

J. Breath Res. 6 (2012) 027108 A W Boots et al
H3O+
water vaporion source
H3O+ + N NH+ + H2O
sample entry
pump
High vacuum pump
SEM
Drift tube Mass spectrometer (detector)Cathodedischarge
Figure 5. Schematic representation of the PTR-MS (based on [31]). Reagent ions (H3O+) are created by the hollow cathode using watervapor. Next in the drift tube the proton trace reactions in moist air occur between H3O+ and any molecule whose proton affinity exceeds thatof water. The ions then reach the detector. Abbreviations: N stands for neutral gas species while SEM for secondary electron multiplier.
Figure 6. Schematic diagram of the selected ion flow MS (based on [25]). Reagent ions (e.g. H3O+ or NO+) are produced by moistatmospheric air and corona discharge (microwave gas discharge ion source). The reagent ions are selectively separated from other ions bythe first MS. The selected ions react with molecules coming from the breath sample. The second MS is used as a detector.
tube where they react with a precursor ion, usually H3O+,NO+ or O2
+ [22]. The ions produced during this reactioncan subsequently be mass analyzed by a quadrupole MS anddetected [35]. The main advantage of this technology is thevery short response time of 20 ms, which enables real-timemeasurements [35]. Additionally, SIFT-MS presents a highsensitivity with detection lower than parts per billion (ppb).Finally, this method allows quantification of water vapor inbreath samples and thus determination of the end-tidal phaseduring breathing. Consequently, high moisture samples caneasily be analyzed without requiring additional separationsteps. However, in analogy with PTR-MS, SIFT-MS does alsonot allow identification of the whole breath-print as it can onlydetect gases for which positive precursor ions are selected[36]. Moreover, using only mass-to-charge ratios of chemicallyionized molecular ions to identify specific VOCs present in
breath remains very difficult. Therefore, this method is notsuitable for pinpointing specific VOCs and/or underlyingmetabolic processes to exposure or disease status.
2.2.5. Our preferred analysis technique: GC-TOF-MS. Inour group, we have chosen to work with GC-TOF-MSbecause of its instrumental sensitivity of parts per trillion,its large dynamic range and the possibility of chemicalidentification of the compounds. We have developed a platformto analyze the entire range of VOCs present in breathbased on GC-TOF-MS analysis [24], thereby focusing on thedetermination of VOC profiles related to disease instead ofsingle biomarker evaluation. In short, our approach includesasking subjects to deeply inhale and subsequently exhale intoresistance free Tedlar bags (5 l). The contents of the bags aretransported under standardized conditions onto sorption tubesthat trap and hold the VOCs. The VOC tubes are thermally
6

J. Breath Res. 6 (2012) 027108 A W Boots et al
740 750 760 770 780 790 800
0
1
2
3
4
5
6
7
x 106
retention time [s]
inte
nsity
740 750 760 770 780 790 8000
1
2
3
4
5
6
7x 10
6
retention time [s]
inte
nsity
(a) (b)
Figure 7. Example of chromatograms obtained by GC-MS-TOF before (a) and after (b) denoising via wavelets, baseline correction viaP-splines and alignment via COW (see the text for explanation).
desorbed, separated by GC (ThermoFisher Scientific, Austin,Texas, USA) employing an RTX-5ms capillary column(30 m × 0.25 mm, 5% diphenyl, 95% dimethylsiloxanecapillary, film thickness 1.0 μm) and detected by TOF-MS (Thermo Electron Tempus Plus time-of-flight massspectrometer, ThermoFisher Scientific, Austin, Texas, USA).
We have validated our approach regarding samplingreproducibility and intra- and inter-individual variation inexhaled VOCs [24]. Additionally, we have validated theinstrumental reproducibility by analyzing two identicalsamples and determining the degree of similarity betweenthe two measurements. A global chromatographic comparisoncorrelation factor was applied presenting scores ranging from0.96 to 0.99. A value of ‘1’ denotes identical samples and thelower the value the lesser the degree of similarity, implicatingthat our instrumental reproducibility was of high degree. Theintra-individual variability, as determined by sampling thesame subjects over a 1 week period, demonstrated largervariations (ranging from 0.80 to 0.99) and, as expected, thevariability between different subjects appeared to be higher(ranging from 0.16–0.98). Usually four to five exhalationsprove sufficient to inflate the bag. To explore the effect ofdifferent exhalation patterns on VOC profiles, volunteers wereasked to inflate one bag by superficial exhalation and anotherbag through deep inspiration, i.e. a 5 s breath hold andsubsequent total exhalation into the bag [24]. None of thedetected compounds proved to be significantly affected bythe exhalation characteristics (corrected for multiple testingusing Bonferroni correction). Moreover, the intra-individualsimilarity between chromatograms was very high (degree ofsimilarity above 0.95) proving that differences in exhalationpatterns did not lead to different VOC profiles within anindividual [24].
2.3. Data (pre)processing and analysis of GC-MS raw output
As an example, we will discuss how data generated by GC-MS have to be preprocessed properly in order to obtainmore comparable data that can subsequently be used for dataanalysis. Similar to other analytical platforms, breathomic datatypically involve a number of preprocessing steps includingnoise reduction, background (baseline) correction, alignmentand normalization [4, 21]. If the preprocessing steps onraw GC-MS are done correctly, the chromatograms obtainedfrom different measurements are transformed into such aformat that they can be compared with each other. This isvisually exemplified in chromatograms obtained by GC-TOF-MS before and after preprocessing (namely denoising, baselinecorrection and alignment) (figure 7).
2.3.1. Background corrections. Within breathomics, acorrection for background VOC concentrations in inspiratoryair should be made if absolute VOC concentrations or VOCsdisplaying inspired concentrations that are higher than 5% ofexpired ones are the endpoints. Such a background correctioncan be applied by correcting exhaled VOC concentrationsfor the inspiratory levels of these compounds or bycalculating the so-called alveolar gradients in which negativeand positive values are generated [4, 15, 24]. However,these correction methods do not include the complexity ofpulmonary adsorption and exhalation of VOCs, which displaya large inter-individual variability due to, for instance, theventilation/perfusion rate of the lung that may be altered inmany pulmonary pathologies [4, 57, 58]. Consequently, suchsubtraction methods are difficult to interpret and even leadto artificially generated statistical significance. The overalleffect of one-dimensionally subtracted chemical backgroundcorrection will be hampered due to introduction of moreconfounding factors, expressing presumable effects on breath,without being corrected for. In contrast to this backgroundcorrection, the variation in the composition of background
7

J. Breath Res. 6 (2012) 027108 A W Boots et al
air is expected to be randomly distributed between samplesfrom various subject groups, implying that it will not exertany discriminatory power or interfere with the outcome ofthe analyses [24]. Additionally, one can argue that otherpossible confounding factors such as diet, exercise, smoking,age and whereabouts all comprise a certain influence on theVOC composition of breath for which it is difficult, if notimpossible, to correct. Also in those cases, in analogy withthe background air, potential confounding factors such as dietwill be randomly distributed in the population. We believe thatthere is no reason to expect a different diet for people withor without a certain illness (except when the diet is adaptedto the disease) and, as a result, putative confounding factorswill not be selected in classification models. Consequently,although there is still no consensus regarding this issue in theliterature, it is our opinion that in most set-ups there is no needto apply corrections for influencing variables such as diet,smoking behavior or background air. Indeed, we believe thatthe current advantages of the easy and non-invasive natureof sampling will be minimized if patients were to be sober,smoke free or resting for a certain period of time before themeasurement or inhale through a VOC-filter in order to avoidor minimize the influence of these confounding factors.
2.3.2. Data (pre)processing. In order to minimize the degreeof high frequency noise generated by the detector or otherinstrumental noise introducers, data need to be filtered prior tostatistical analysis.
Consequently, the first step of data (pre)processing usuallyconcerns denoising. Techniques for denoising and filteringare applied in order to reduce the influence of the randomvariation. The application of transform functions, e.g. waveletsor Fourier transformations, allows reduction of data noiseby an alternative representation of data. The original dataare represented as a combination of a set of basis functionsmultiplied by transform coefficients. An overview of differentdenoising methods is given by Trygg et al [37].
The second step of data (pre)processing involvesbackground correction. Proper background removal isimportant, since deformation in background may affect notonly data analysis but also alignment and quantification.Different methods are available, e.g. asymmetric leastsquares (ALS) [38], B-splines, B-splines with penalization(i.e. P-splines) [39] or the use of orthogonal basis of thebackground spectra [40]. ALS uses the penalties least-squaresapproach to estimate baseline. B-splines are local basisfunctions, consisting of a number of polynomial pieces ofa low degree connected in a special way, which are next usedfor baseline correction.
The third and last step of (pre)processing includesalignment, i.e. aligning the peaks across all samples in orderto be able to perform a robust data analysis. The variationsin peak position are mostly caused by column ageing,temperature differences and different sample composition.Misalignments may influence both the data analysis and thecompound identification. Currently there are many methodsand packages that are commercially or freely available forspectral alignment, namely dynamic time warping (the oldest
warping technique), parametric time warping [41], correlationoptimized warping (COW) [42], MetAlign [43, 44] andMZmine [45]. The most commonly used alignment techniquesand methods are summarized by Jellema [46].
After data (pre)processing, the identification (orassignment) of VOC compounds can be performed. Upondecreasing the signals due to background and increasing thevisibility of the signals of interest, the peak position and theoccurrence of each compound have to be determined. Thiscan best be done by analyzing the area under the curve(AUC) for each peak, as every peak represents—at least—one compound with an AUC that is related to the compoundquantity(ies). Parameters such as retention time (RT) and massspectrum are used to identify the compounds of interest and tobuild a database in which all compounds from all subjectsare combined [24]. In order to find the specific patterns,these compounds can subsequently be analyzed by means ofdifferent statistical techniques.
2.3.3. Statistical analysis. Nowadays, the hunt forclinically relevant biomarkers is driven by the fast-pacedtechnological advancements in high quality sensors and highthroughput analyses combined with the current advancesin bio-informatics and biostatistics. Additionally, the recentevolvement of data mining strategies and powerful computersenables researchers to handle the very large data sets acquiredwith for example breathomics. Indeed, as breathomics impliesa relatively high number of interesting compounds comparedto the number of subjects studied, advanced data miningroutines are crucial in extracting only that information thatis relevant to study possible biomarkers in the exhaled air.
In general, multivariate analysis or different data miningstrategies can be applied to extract relevant information frombreathomic data. It is important to mention that a success toproper statistical analysis is to have a good statistical validationas well as trustworthy biological interpretation of the results.The validation issue will be discussed later in this section.Typically, most of the statistical methods used in other omics-related investigations can also be utilized with respect tobreathomic data.
As the first step in data analysis, unsupervised methodsincluding principal component analysis (PCA) [47, 48] andhierarchical cluster analysis (HCA) [48] are performed.The main objective of these unsupervised methods isdata exploration by visualization, outliers’ detection andidentification of grouping trends.
PCA provides a reduced representation of the breathomicdata by creating new factors, the so-called principalcomponents (PCs), which are linear combination of originalvariables. PCs are constructed in such a way to express mostof the variance within a data set and more importantly eachconsecutive PC explains the maximum amount of variance,but which was not described by the previous PCs. PCs areorthogonal and therefore independent of each other. PCA isalso used for outliers’ detection. One has to keep in mind thatPCA can detect only certain type of outliers, i.e. the so-calledgood leverage objects, while orthogonal outliers cannot be
8

J. Breath Res. 6 (2012) 027108 A W Boots et al
detected. Therefore for outliers’ detection robust version ofPCA should be preferably used [49].
Another popular unsupervised method to analyzemultivariate data is HCA [50]. In HCA, samples (i.e. individualchromatograms) are grouped according to their multivariatesimilarity. The measure of multivariate similarity is basedon different types of distances (e.g. Euclidian, Minkowskior Mahalanobis distance) [50]. The calculated multivariatesimilarity can be represented as a tree called dendrogram. Bydeciding the similarity cut-off, which divides the dendrograminto separate clusters, HCA can be used for classification.However, the main disadvantage of HCA is that it doesnot deliver the information about the variables which areresponsible for the certain clustering. Several applications ofPCA and HCA to study VOC profiles can be found. RecentlyPCA was employed to analyze the VOC profile of patientswith malignant pleural mesothelioma [51] and patients withlung cancer [52], while HCA was applied to validate the resultsobtained from discriminant analysis performed on expired airsamples from healthy humans, fasting people, headspace airof urban waste disposal bins, air of bags with decaying humanbodies and urban air samples [53].
PCA and HCA are very popular and powerful methods fordata exploration; however since they belong to unsupervisedtechniques they do not use additional information, such asclass information. Therefore they are unable to define aspecific pattern capable of identifying a given class e.g.the disease patients. Moreover, due to highly complex data,unsupervised data are very often not sufficient enough forextracting class-related information (e.g. disease related).Therefore unsupervised analysis is very often followed bysupervised analysis, where different classification techniquescan be used. In the field of pattern recognition several linear andnonlinear techniques for data classification are available, forinstance linear discriminant analysis (LDA) [50, 54], partialleast-squares discriminant analysis (PLS-DA) [55], randomforests and kernel-based methods [56, 57]. The first method,namely LDA, is fast, powerful and does not require anyparameter tuning. However, it needs special adaptation beforeapplying it to breathomic data, since it can only be directly usedwhen the number of samples is much bigger than the numberof variables. A possible solution is to use data compressionby means of PCA (PCDA) beforehand. Then the number ofPCs has to be optimized. The disadvantage of using PCA isthe possibility of missing some class-related information. Theuse of LDA and several of its adaptations for breathomic dataare described earlier [58–61]. PLS-DA similarly to PCA isa latent variable technique, but it uses a different set of newcomponents calculated in order to maximize the covariancebetween spectra and the class information. Its ability to copewith collinear data explains the success of PLS-DA in manyscientific fields [62]. However, a very important aspect ofusing PLS-DA is proper model optimization (i.e. numberof latent variables) to avoid overfitting [63]. In the field ofbreathomics, Caldeira et al demonstrated the study where PLS-DA discriminated with a classification rate of 88% healthyfrom allergic asthmatic children [64].
The above described approaches belong to linear methodsand make the assumption of a linear response. However,
very often breathomic data display nonlinear parameterdependences. In such a situation the linear methods are boundto fail. Among many nonlinear techniques that have beendeveloped in machine learning and pattern recognition area,we will discuss random forests and two kernel-based models,i.e. support vector machines (SVMs) and kernel-PLS-DA(K-PLS-DA).
The random forest method is an extension of decision trees[65]. In this technique bootstrap samples [66] are drawn withreplacement from the training data, and trees using randomlyselected subset of variables at each node are obtained for eachbootstrap sample. Two tuning parameters, namely the numberof trees and the number of random variables being used ateach node, are crucial for proper accuracy and computationalcosts. Breiman has shown that using default values for thenumber of trees and the number of random variables givesan overall good outcome [65]. The random forest techniqueprovides not only the predicted value for each sample but alsovariable ranking by computing a variable importance score foreach input variable. Because of the averaging across differentindependent bootstrap samples and the low-bias nature of thetrees, random forests tend to have the property to give low-bias predictions. Mazzone et al presented the application ofrandom forests as a classification technique to VOC profilesof patients with different stages of lung cancer [67].
As their names indicate, kernel-based models (hereK-PLS-DA and SVMs) involve a kernel transformation whichmaps objects into feature space. This results in obtaining akernel matrix of size n × n, where n is the number ofobjects, i.e. measured samples. Kernel transformation has to beselected by a user. The obtained kernel matrix must be positivesemi-definite (i.e. eigenvalues are positive) and nowadaysthere are many kernel functions that complete this assumption[68]. Unfortunately, the kernel transformation causes that theinformation about the original variables is lost. This meansthat direct interpretation of the kernel-based models is notpossible. It is, however, possible to obtain variable rankingby applying recursive feature elimination [69]. This approachis implemented with SVM and ranks variables on the basisof the smallest change in a cost function minimized in theSVM algorithm. It is worthwhile to note that a recent proposalfrom Krooshof et al permits to trace back the influence ofthe original variables on the model even after the kerneltransformation [70]. SVM and K-PLS-DA are both verypowerful and popular binary classifiers [56, 71]. K-PLS-DAis beneficial in comparison to SVM in terms of simplicity andspeed calculation. Moreover, K-PLS-DA has the possibilityof visualization in the latent variable space. Nevertheless,K-PLS-DA and SVM perform similarly in terms of predictionand can thus be utilized interchangeably. While SVM has beenemployed to breathomic data [61, 72], a direct application ofK-PLS-DA as a classification technique to VOC profiles hasnot been yet performed. However, Moorhead et al have showna method utilizing kernel density estimate as a classificationtechnique [73].
Breathomic analysis generates large numbers of variables(compounds) and such data do not fit to the assumptionof having more samples ‘n’ than variables ‘p’. This bears
9

J. Breath Res. 6 (2012) 027108 A W Boots et al
consequences during the statistical analysis as it involves therisk of ‘overfitting’. This phenomenon describes the risk ofdeveloping VOC profiles that are not generally applicablefor the investigated exposure or disease but are instead atoo detailed description of the test data set, not suitableto be generalized to independent samples of the same kind[24, 74]. Fortunately, there are several relatively simple testsavailable to ensure that the selected VOCs of interest areindeed truly descriptive for the underlying exposure or diseasestudied including cross-validation, double cross-validation andpermutation tests. Nevertheless the most optimal and reliablevalidation is based on the use of training set, validation set andtest set [63].
2.3.4. Customized data-acquisition and analysis. In ourapproach, we have automated the data-acquisition, and theanalysis of the data output files from the GC-TOF-MS isperformed in successive steps. In short, the first step is toperform peak detection and baseline corrections on all analysisoutput files. Normalization of the calculated peak areas isperformed using an area scaling factor based on the cumulativearea under the detected peaks; since all chromatogramsdisplay rather similar profiles this method of normalizationproved most robust. RT of all samples are corrected forchromatographic drifting. Applying the correction for RT isvery effective and easy to perform. We do not use an addedinternal standard; instead already available compounds thatdemonstrate availability in a large number of samples areused, adding to the straight-forwardness and robustness ofthe methodology. Finally, the output files are merged bycombining corresponding compounds based on RT and onsimilarity of the corresponding mass spectra. The degree ofmass spectra similarity is calculated using a match factor(MF) based on the similarity index as described by Steinet al [75]. These MFs are only determined for compoundswithin a selectable RT-window. MF-threshold values aredetermined based on a variety of complementary compoundsmanually combined. To determine which compounds in thedatabase are of interest regarding the classification of diseasedversus controls, we have applied SVMs because of their abilityto select those compounds that provide the best performanceas implemented into a classifier and to construct predictivemodels with large generalization power even in the caseof large dimensionality of the data or when the number ofobservations available for training is low [76].
3. Application possibilities
3.1. In vitro mechanistic applications
Until now, the utility of breathomics to examine ongoingphysiologic and/or pathologic processes in vitro has hardlybeen explored. However, analyzing VOCs excreted by in vitrosystems mimicking these processes might provide interestingand useful information that can be extrapolated to variousin vivo clinical settings. There are already a few reportsavailable demonstrating the usefulness of breathomics withregard to studying specific processes including oxidativestress, bacterial inflammation and carcinogenesis [12, 26, 77].
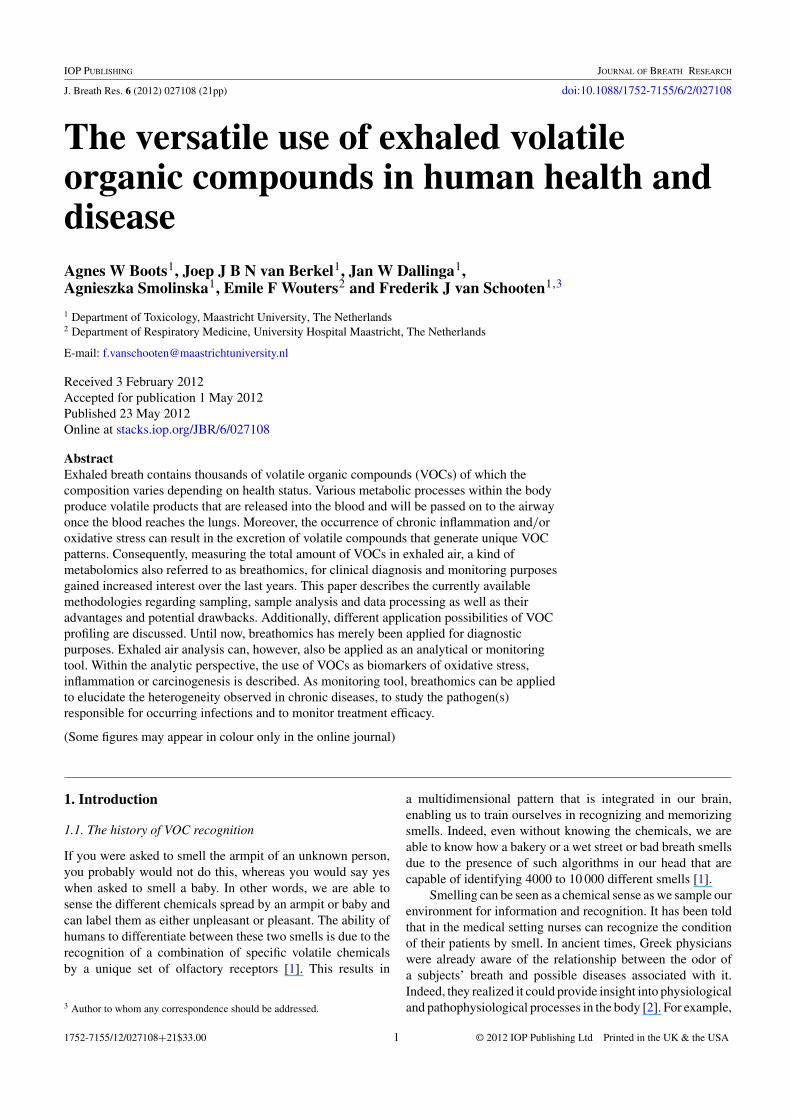
Figure 8. Imbalance between the production of ROS and protectionagainst ROS by antioxidants (AOX) results in the occurrence ofoxidative stress. Reprinted with permission from [86]. Copyright2008 Elsevier.
3.1.1. VOCs and oxidative stress. Aerobic life forms areassociated with the formation of so-called free radicals orreactive species that can respectively oxidize other compoundsor easily form radicals [78]. These partly reduced forms ofoxygen, collectively referred to as reactive oxygen species(ROS), are produced throughout the human body and displayseveral crucial physiological functions including smoothmuscle relaxation and the respiratory burst that kills invadingmicro-organisms [78]. However, due to their high reactivitywith practically all bio-molecules, ROS can also cause severedamage to important structures within the human body[79]. Fortunately, protection against ROS can be offeredby an elaborate defense system comprising the so-calledantioxidants, i.e. ‘substances which, when present in lowconcentrations compared to that of an oxidizable substrate,significantly delay or inhibit the oxidation of that substrate’[80]. In normal situations, this endogenous antioxidantnetwork provides sufficient protection against ROS [93, 94].However, in some cases an imbalance between the productionof and the protection against ROS in favor of the former canoccur. This imbalance is also referred to as oxidative stress(figure 8).
Oxidative stress may result in increased oxidative damageand can be caused by either an overproduction of ROS oran impairment of the endogenous antioxidant defense system[86]. It has been shown that oxidative stress is associated withthe pathophysiology of various chronic diseases includingsarcoidosis [81], idiopathic pulmonary fibrosis [96], COPD[82], inflamatory bowel diseases (IBD) [83] and cardiovasculardiseases such as atherosclerosis [84, 85].
An important process occurring as a result of oxidativestress is the oxidation of fatty acids present in for examplecell membranes, a process also known as lipid peroxidation[87]. Polyunsaturated fatty acids (PUFAs) are the main targetof lipid peroxidation as they contain multiple double bondsenclosing methylene –CH2- groups that possess especiallyreactive hydrogens. In general, lipid peroxidation proceedsby a free radical chain reaction mechanism as schematicallydepicted in figure 9. It starts with an initiation step in which
10

J. Breath Res. 6 (2012) 027108 A W Boots et al
Figure 9. Process of lipid peroxidation, started by the radical R.. Reprinted with permission from [86]. Copyright 2008 Elsevier.
a ROS abstracts a hydrogen atom from the lipid, therebyproducing a fatty acid radical. This phase is followed by aprocess called propagation in which the previously generatedfatty acid radical almost instantly reacts with molecularoxygen. This reaction creates a peroxyl radical that is capableof forming a lipid hydroperoxide as well as a new lipidradical by subtracting a hydrogen atom from a second PUFA.In this way, a propagating chain reaction will be generatedthat continuously passes an unpaired electron from onePUFA to another one, thereby giving rise to more and morefatty acid radicals. This cycle continues until a terminationreaction occurs that will lower the overall reactivity of themechanism. Examples of such a termination reaction are(i) the consumption of one of the two reactants, (ii) theformation of a relatively unreactive radical or (iii) the reactionbetween two reactive radicals that produces a non-radical[86, 87].
Volatile products formed during lipid peroxidation includeethane, pentane, hexanal, octanal, nonanal, propanol andbutanol [88, 89]. Ethane was one of the first VOCsdemonstrated not only to be measurable in exhaled air butalso to be elevated in the breath of COPD patients comparedto controls [13, 104]. Moreover, a correlation between ethanelevels and the degree of airway obstruction, smoking habitsand FEV1 could be observed [12]. However, the analysis ofsingle compounds deriving from lipid peroxidation in exhaledair is currently still hampered by a relatively low sensitivity andspecificity. Consequently, it might be of interest to investigatethe availability and importance of these compounds as markersof oxidative stress by measuring them in the headspaceof in vitro systems mimicking this process. Unfortunately,this exciting new field of applying breathomics has, to ourknowledge, not been addressed thus far.
3.1.2. VOCs and inflammation. An important feature ofmost chronic diseases is the occurrence of inflammation, aprocess designed to recognize, attack and kill invading micro-organisms [90]. Interestingly, inflammation and ROS aretightly intertwined: on the one hand, inflammatory mediators
and activated inflammatory cells released into the circulationcan induce ROS generation whereas on the other hand ROScan stimulate pro-inflammatory signaling via activation of forexample the nuclear factor kappa B (NF-κB) pathway [86, 90].Consequently, it is not surprising that VOCs characteristicof inflammatory processes are often compounds generatedduring processes induced by excessive ROS production suchas lipid peroxidation (see section 3.1.1). Indeed, it hasbeen shown that among the variety of VOCs produced bymicro-organisms various fatty acids and their derivativesincluding hydrocarbons, alcohols and ketones are found [77].Additionally, inflammation has also been associated withtypical inflammatory markers such as nitric oxide, nitrate andnitrogen- and sulfur-containing VOCs [77].
Aside from detecting VOCs characteristic of theunderlying damaging processes of oxidative stress andinflammation, breathomics can also be applied to examinevolatile compounds produced by specific species orstrains of bacteria. Indeed, VOCs found in infectionsare not only host-derived but are also often related tometabolic processes occurring in the infectious organism.It is known that all organisms generate VOCs as partof their normal metabolism and certain infections arelongtime known to be accompanied by a distinct smellin vivo as well as in vitro [89, 106]. Recent studies haveshown the usefulness of VOC analysis instead of the currentautomated blood culture system with regard to evaluatingbacterial growth in human samples or in vitro cultures[91, 92]. To this end, blood samples from healthy donors werein vitro infected with five bacterial strains commonly involvedin bacteremia, i.e. Pseudomonas aeruginosa, Staphylococcusaureus, Streptococcus pneumoniae, Escherichia coli andNeisseria meningitides. Next, the headspace air of thesesamples was collected and analyzed for growth and speciesidentification by means of SIFT-MS. Positive results wererecorded for 88.3% and 96.6% of the cultures at respectively8 and 24 h, indicating that VOC profiling is indeed asensitive method for bacterial detection [92]. The presenceof significant distinctions between both the presence andrelative concentrations of individual VOCs for each of the
11

J. Breath Res. 6 (2012) 027108 A W Boots et al
test species allowed bacterial identification as well. Moreover,as co-incubating E. coli and S. aureus with antibiotics resultedin a decreased VOC production, VOC analysis might also beuseful for the determination of antibiotic susceptibility [91].
Ultimately, applying VOC profiling in vitro to quicklyidentify micro-organisms encloses the potential of developinga marker of the presence or absence of specific microbialgrowth in both environmental and clinical settings [93].Additionally, based on the reports that VOCs can accuratelyidentify bacterial species within a shorter timeframe than theexisting traditional culture methods, VOC analysis might alsobe used as a diagnostic tool [91, 93]. Characterization ofdifferent microbial infections by means of VOC productioncan be performed by analyzing either individual VOCs orunique VOC profiles. Until now, various individual VOCshave already been identified for specific bacterial species.For instance, indole production is reported to be elevated inE. coli cultures [93] whereas dimethyl sulfide and ammonia areincreasingly produced by S. aureus [91]. Moreover, headspaceair analysis of P. aeruginosa cultures revealed high levelsof hydrogen cyanide gas (HCN) [109]. Indeed, the HCNconcentration was significantly higher above P. aeruginosacultures than above other bacterial growth and was provento be a sensitive (68%) and very specific (100%) biomarkerof this micro-organism [94]. Interestingly, HCN was alsoshown to be elevated in the headspace of another gram-negative bacteria, namely the Helicobacter pylori referencestrain NCTC 11637 [95], suggesting that single VOCs do notpossess enough discriminative power to distinguish betweenspecific species and/or strains of micro-organisms. Indeed, theproduction of specific single VOCs is not necessarily limitedto one bacterium and therefore it can be anticipated that VOCprofiling will be a more effective approach to discriminatebetween a wide range of microbial species. The usefulness ofthis approach has recently been shown by Thorn et al as theirstudy revealed that significant differences can be measuredin VOC profiles obtained from various bacterial culturesin vitro [93].
3.1.3. VOCs and carcinogenesis. An intriguing applicationof breathomics comprises the analysis of VOCs for cancerscreening and disease monitoring. Although it is generallyknown that cancer survival rates largely depend on earlydetection, preferably in a stage where no metastasis has yetoccurred, such early diagnosis is often not the case in clinicalpractice [96]. For instance, diagnosing lung cancer in an earlystage is still relatively difficult, occurring in approximately25% of all cases [111, 112]. Consequently, there is an urgentneed for innovative, early biomarkers that can be used fordetecting the presence and observing the course of variousforms of cancer, including lung cancer. In this context, breathanalysis has already been suggested and tested as a potentialmethod.
Until now, most research regarding VOCs andcarcinogenesis has focused on their possible relationshipin vivo in lung cancer patients. As described in moredetail in section 3.2, several groups have demonstrated thata combination of different VOCs can differentiate lung
cancer patients from healthy controls [26, 97–101]. Besidesdiscrimination based on profiles, the usefulness of single VOCsas possible biomarkers has also been shown in lung cancer[118–121]). Interestingly, most of these studies have revealedthat VOC concentrations can be increased or decreaseddepending on the specific compound and clinical status inquestion, which makes it rather difficult to extrapolate thesefindings to biomarkers suitable for general use. Indeed, itcan be anticipated that the VOC profile excreted by a giventumor will change due to various factors including staging,the ratio between untransformed and malignant cells andthe presence of immune cells or even pathogens [102, 103].Therefore, validation of appropriate biomarkers should ideallybe performed in vitro on cellular and molecular origin [103].However, to our knowledge only one study has examined thecorrelation between in vivo exhaled and in vitro excreted VOCsthus far. The group of Chen et al has studied the VOCs excretedby lung cancer patients and compared them with those emittedby four different types of lung cancer cells (i.e. squamouscell, bronchioloalveolar, non-small cell and adenocarcinoma)isolated from lung tissue from cancer patients [122]. TheVOC profiles of the in vitro samples were not only markedlydifferent from those excreted by medium controls but alsodisplayed four universal VOCs, which could be regarded asmetabolic products of lung cancer cells and thus as biomarkersof lung cancer at cellular level. Interestingly, two of thesegeneral VOCs (isoprene and undecane) could also be detectedin the in vivo samples as well, underlining the usefulness ofin vitro VOC analysis in the search for new early biomarkers[122]. However, the fact that the in vivo exhaled VOCs alsorevealed multiple differences with those excreted by the lungcancer cells in vitro indicates that more research regardingthe correlation and possible extrapolation between these twoapproaches is mandatory.
Over the last few years, a handful of studies havebeen performed to detect and identify tumor-derived VOCsin vitro. To our knowledge, these studies were merelyfocused on volatile compounds excreted by various lung-tumor-derived cell lines. Overall, it can be stated that thein vitro VOC studies have revealed the same pattern astheir in vivo counterparts, i.e. increases or decreases inVOC levels depending on the studied compound and cellline [102, 104–108]. For instance, in the headspace ofthe human non-small cell lung cancer cell-line CALU-1,increased concentrations of 2,3,3-trimethylpentane, 2,3,5-trimethylhexane, 2,4-dimethylheptane and 4-methyloctanewere observed, whereas other compounds includingacetaldehyde, acrolein, 2-butanone and hexanal showeddecreased levels [106]. Employing VOC profiling to anothernon-small lung cancer cell line, i.e. NCI-H1666 derivedfrom a broncho-alveolar carcinoma, also revealed theconsumption of several aldehydes as well as of two ethers andn-butyl acetate. Interestingly, no unequivocal release of VOCswas observed [103]. Yet another cell line, the NCI-H2087derived from a metastatic lung adenocarcinoma, showedlower levels of acetaldehyde as well as of 2-methylpropanal,2- and 3-methylbutanal and butyl acetate [108]. This celltype also revealed a significantly increased concentration
12

J. Breath Res. 6 (2012) 027108 A W Boots et al
Table 2. Testing the usefulness of VOCs as biomarker on the basisof important biomarker characteristics.
Biomarker characteristic Applying to VOCs
High sensitivity and specificity ++Fast and accurate +Methodological simplicity ++Interpretive simplicity +/−Thorough validation ++(Patho)physiological link to either +/−disease or exposure
of 2-ethyl-1-hexanol and 2-methylpentane. When comparingVOC concentrations in the headspace of another lung cancercell line, i.e. the adenocarcinomic human alveolar basalepithelial cell line A549, with those excreted by untransformedprimary bronchial epithelial cells, different VOC groups wereobserved to be preferentially associated with the transformedcells [105]. Perhaps the most striking observation was thatbranched hydrocarbons and alcohols were seen increasedmore frequently in the untransformed than in the cancercells, suggesting a lower production and/or consumption ofthese compounds by the latter. Additionally, more differentaldehydes were decreased in the control lung cells comparedto the A549 cells whereas 2-butenal was only metabolized bythe first [105].
Overall, these in vitro cell-culture experiments indicatethat, while the consumption of several VOCs appears to bea rather general characteristic of lung cells, the generation ofspecific VOCs is cell-line and thus source restricted. Therefore,additional research is required to investigate the underlyingmechanisms responsible for these differences in order todevelop unique biomarkers for lung cancer in general andvarious stages and origins of this disease in particular.
3.2. In vivo diagnostic applications
Over the last few decades, the analysis of exhaled air asnon-invasive and fast diagnostic application for a varietyof diseases has gained mounting interest. As various VOCspresent in exhaled air are derived from physiological as well aspathological processes, they can be used as potential predictivebiomarkers of both exposure and disease. However, beforethey can actually be used as such, diagnostic VOC profileshave to be proven to exhibit relevant distinctive characteristics(table 2).
At first, in order to ensure a fast and accuratemethodology as is required within diagnostics, biomarkersshould demonstrate a high sensitivity and specificity combinedwith a short processing time. Additionally, the actual analyzingprocedure should be cost effective and ideally display lowappliance and operating costs [109]. With regard to volatilebiomarkers, current advances in both sampling and analyzingtechniques have enabled fast breath sampling, althoughthe translation from the existing procedures to a ready-to-use clinical device has not taken place yet. Moreover,recent studies have proven that distinct VOC profiles candiscriminate healthy controls from patients suffering fromvarious diseases with a high sensitivity and specificity (a.o.
[4, 27, 110–114]). Indeed, we have shown that a profile ofonly eight VOCs can distinguish asthmatic children fromhealthy controls with a sensitivity of 89% and a specificityof 95% [110]. The compounds of interest were identified as:(branched) hydrocarbon (C13H28), carbon disulfide, 1-penten-2-one, butanoic acid, 3-(1-methylethyl)-benzene, unsaturatedhydrocarbon (C15H26), benzoic acid [110]. For COPD, wewere able to achieve a correct classification of 91% with100% sensitivity and 81% specificity using a profile of onlysix distinct VOCs [24]. The compounds of interest wereidentified as: isoprene; an unidentified C16-hydrocarbon; 4,7-dimethyl-undecane; 2,6-dimethyl-heptane; 4-methyl-octaneand hexadecane. Additionally, the group of Basanta et al alsodemonstrated that a specific VOC profile could differentiateCOPD smokers from asymptomatic smokers with 88%sensitivity and 81% specificity [112]. With regard to CF, wecould correctly classify 92% of healthy and diseased subjectswith high sensitivity and specificity using only ten VOCs[130]. Several other groups have revealed that a combinationof VOCs can differentiate patients with lung cancer from thecontrol group (consisting of either healthy controls, diseasecontrols or subjects at risk) with a sensitivity and specificityranging from respectively 71–100% and 80–100% [113, 116,117, 119, 121, 133, 134]. Moreover, it has recently beenobserved that exhaled VOC markers are sensitive enough todistinguish patients with pulmonary tuberculosis from healthycontrols with 95.7% sensitivity and 78.9% specificity [114].Interestingly, pilot studies have revealed that breathomics canalso be used to diagnose non-pulmonary diseases, includingbreast, ovarian and hepatocellular cancer and coronary heartdiseases, with relatively good sensitivity and specificity[115–121]. Moreover, breathomics has recently been shownto be useful in assessing occupational or environmentalexposures [122, 123].
Additionally, a biomarker should excel in simplicityin both a methodological and an interpretive way.Methodologically, breathomics already fits the biomarkerprerequisite of displaying a rather non-invasive character thatcombines a low degree of discomfort for the patient with a highclinical accessibility [124, 125]. Furthermore, most appliedmethodologies already combine a high reproducibility with alow instrumental variability. However, at the interpretive level,useful biomarkers are expected to generate easy-to-interpretresults that leave little room for interpretation. As describedin section 2.3.3, the current lack of consensus regardingbreath sampling, analyzing and normalizing still hamperscorrect validation and thus clinical usefulness of volatilebiomarkers [125].
Biomarkers should be thoroughly validated before beingclinically applied to determine the real value of their predictiveand/or discriminatory capacities. By performing such avalidation test in one or more separate validation set(s), the realvalue of specific biomarkers can be evaluated outside the testset in which they were initially selected [126]. This approachhas already been successfully applied within breathomics,demonstrating the usefulness of specific VOC patterns asselective biomarkers for various diseases including COPD andasthma [45, 129].
13

J. Breath Res. 6 (2012) 027108 A W Boots et al
Finally, a good biomarker displays a clear relationshipwith either the exposure or the disease it was designedfor. Until now, this relationship has merely been the focusin studies exploring the use of individual VOCs to predictor classify various diseases. Indeed, especially productsof lipid peroxidation, a damaging process described insection 3.1 that is highly associated with various chronicdiseases, have been widely studied as possible volatilebiomarkers. For instance, higher exhaled pentane levels arereported in patients with acute asthma [15], CF [13], acuterespiratory distress syndrome [127], ventilator-associatedpneumonia [128], obstructive sleep apnea [15] or lungcancer [120, 145]). Other volatile lipid peroxidation productsstudied as possible biomarker include ethane, hexanal,octanal, nonanal, propanol and butanol [14, 15, 118, 145].Interestingly, more than half of the VOCs included in thediscriminating profiles designed for asthma, CF and COPDby our group was identified as hydrocarbons and/or possiblelipid peroxidation products as well. Moreover, due to theirlow solubility in blood, lipid peroxidation products such asethane and pentane are exhaled within a few lung passagesand can therefore serve not only as a pulmonary but alsoas a systemic marker of inflammation and oxidative stress[4, 146]. For instance, pentane and/or ethane are enhancedexcreted in the breath of patients with sepsis, systemicinflammatory response syndrome, ischemic heart disease,myocard infarction, cardiopulmonary bypass and allograftrejection following organ transplantation [147–151].
Ideally, a biomarker should not only be linked toexposure or disease in general, but also to different stagesof disease including development, severity and progression.Interestingly, this has already been shown for exhaled ethaneas this VOC is higher not only in asthmatics compared tohealthy controls but also in severe compared to mild asthma[13]. Moreover, a recent study by Philips et al suggests thatVOC patterns can be used to distinguish between active andnon-active pulmonary tuberculosis albeit with a relativelylow accuracy ranging from 65% to 85% [129]. However,associating volatile biomarkers with the physiology of eitherexposure or disease is still in its infancy due to the fact thatthe (patho)physiological meaning of specific VOCs is oftennot known. Consequently, more research regarding the exactidentity and biological role of individual VOCs is urgentlyneeded. Unfortunately, this area of research is hampered bythe fact that compounds originating in breath can very wellbe biochemically altered before their excretion, implying thattheir volatile appearance does not necessarily display a directrelation to exposure or disease. Consequently, more studies inclinical as well as in vitro settings are necessary to elucidatethe biochemical origin, physiological meaning and exhalationkinetics of selected VOCs. Nevertheless, even without thisknowledge, volatile compounds can already be valuable as apredictive tool in a clinical setting.
3.3. Potential future applications
Until now, breathomics has merely been applied for diagnosticpurposes and it is therefore not surprising that the current focus
within this exciting field of research mainly lies at developingeasy-to-use devices for clinical use that can detect volatilebiomarkers specific for various diseases. Interestingly, recentdevelopments have been made regarding the screening forlung cancer as it was shown that low-dose CT scanning couldsignificantly reduce lung cancer mortality [130, 131]. Sincethere are some difficulties in generalizing these results to thecommunity, it has once again been suggested to combinethis screening method with other new testing techniquesincluding VOC measurement to develop a successful screeningalgorithm for lung cancer [130].
The analysis of exhaled air, however, encloses farmore intriguing promises such as elucidating the (clinicaland pathological) heterogeneity observed in several chronicdiseases, studying the exact pathogen responsible for occurring(respiratory) infections or monitoring treatment efficacy.
3.3.1. Heterogeneity in diseases. Various chronic diseaseshave already been recognized as rather heterogeneousconditions, displaying different phenotypes based on variancesin disease development and progression. These heterogeneouspathologies comprise pulmonary diseases, including COPDand asthma, as well as non-pulmonary conditions such as IBD,Crohn’s disease (CD) and ulcerative colitis (UC).
In COPD, significant heterogeneity of clinical presen-tation and disease progression leads to different phenotypes[153, 154]. Moreover, various pathologic conditions includingchronic airway inflammation, bronchitis, emphysema and air-way wall thickening have been reported in COPD with intra-patient differences [155, 156]. Although part of this hetero-geneity might be explained by misdiagnosis, it most likelyalso reflects reversibility occurring in these patients. Conse-quently, phenotyping of COPD patients is needed to identifypatient groups with unique prognostic or therapeutic charac-teristics, as this will provide information regarding underlyingmechanisms, risk factors, natural history, monitoring and clin-ical outcome [132]. To this extent, the following new definitionof a COPD phenotype has been introduced by Han et al: ‘asingle or combination of disease attributes that describe differ-ences between individuals with COPD as they relate to clini-cally meaningful outcomes’ [133]. Up till now, defining suchCOPD phenotypes, by means of either radiography, physiol-ogy or (cellular or molecular) fingerprinting, represents one ofthe biggest challenges with respect to the management of thisdisease. Ultimately, this information could lead to treatmentsspecifically targeted for defined phenotypic groups rather thanfor COPD in general as is currently the therapy standard [134].
Asthma can roughly be divided into mild, moderate andsevere asthma. Interestingly, only the latter variant displays anurgent need for phenotyping as the other two forms respond tosimple treatments and therefore do not require great subtlety[135]. Severe asthma, also known as refractory asthma,comprises less than 5% of the total asthma population butaccounts for up to 50% of asthma-related health care costs as itis the only variant with poor medical control [136, 137]. Withinthe subgroup refractory asthma, a considerable inflammatoryheterogeneity occurs as people suffering from this severe typeof asthma display large differences in their eosinophil and
14

J. Breath Res. 6 (2012) 027108 A W Boots et al
neutrophil population [138–140]. Interestingly, the differentinflammatory phenotypes of refractory asthma presentdifferent clinical outcomes as eosinophilic inflammation favorssevere exacerbations whereas increased neutrophil counts arecorrelated with fixed airway obstruction [136]. Moreover,these phenotypes also influence treatment efficacy as theeosinophilic variant can still effectively be treated by increasedcorticoid doses while its neutrophilic counterpart is rathercorticoid-insensitive. Determining the appropriate phenotypeof refractory asthma may contribute to earlier treatmentwith steroid alternatives such as macrolide antibiotics, tumornecrosis factor-α inhibitors, cytokine receptor antagonists andbronchial thermoplasty [141].
The two most important IBD are CD and UC, twochronic diseases of the gastrointestinal tract that are bothcharacterized by flairs and remissions due to a global immunedefect [142, 143]. The golden standard for diagnosing IBDin general and for differentiating between CD and UCin particular comprises histological evaluation performedduring endoscopic procedures. As this approach is very time-consuming and highly invasive, alternative diagnostic markersthat can be measured in the blood or stool are currently beingdeveloped [142, 144]. The development of such discriminatingmarkers is of special importance as both UC and CD are highlyheterogeneous and display a disease history and progressionthat are strikingly variable per patient [145, 146]. Indeed, thereis an urgent need for non-invasive markers that can adequately(1) differentiate between CD and UC, (2) determine whetherand when a relapse may occur once the disease is officially inremission state and (3) distinguish between the various IBDphenotypes that display different progression as well as diverseresponses to treatment [145, 146].
Most heterogeneous chronic diseases, including the onesdescribed above, are defined by damaging processes suchas excessive inflammation and oxidative stress (described insection 3.2). Consequently, it is not surprising that specificVOC patterns characteristic of these processes are suggestedto be useful non-invasive markers to discriminate betweenthe various phenotypes of these diseases. Although it appearsobvious to analyze these components in breath for pulmonaryconditions, exhaled air analysis has also been used beforeto determine damage to intestinal organs, as occurs in IBD.Actually, in the 1990s it was already shown that tissue damagein UC could be detected by ROS-induced lipid peroxidationproducts measurable in breath [147]. Additionally, active IBDhas already been shown to be correlated with increased levelsof breath alkanes [148]. Due to the lack in specificity andsensitivity in breathomics back in the 1990s, these initialstudies were never followed up in larger, clinical studies toexamine whether the different IBD phenotypes can indeedbe successfully diagnosed using VOC profiling. Interestinglyenough, breathomics has also not been utilized yet indiscriminating between various phenotypes of pulmonarydiseases such as COPD and asthma, even though the literaturesuggests that differentiation could be performed based ondifferent levels of inflammatory or oxidant-derived products.
In summary, heterogeneous diseases are characterized bypathological and clinical characteristics, ultimately leading
to various phenotypes that display different reactions towardtherapy and thus variation in clinical outcome. Consequently,accurately differentiating the various phenotypes underlyingthe heterogeneous pathology of interest by means of VOCprofiling will largely contribute to optimizing treatment basedon personalized medicine.
3.3.2. Respiratory infections. The occurrence of detrimentalrespiratory tract infections embodies a great burden not onlyfor patients and our health care system but also for oureconomy [149, 150]. In particular the sudden worsening ofsymptoms, also referred to as acute exacerbations (AE), invarious chronic lung diseases including COPD and CF isknown to largely depend on such microbial infections. Ingeneral, AE are associated with poor quality of life as wellas with increased morbidity, mortality and health care costs[149–152]. Among the factors influencing the occurrenceof AE are age, gender, lung function, history of previousexacerbations and the use of inhaled corticoids. Additionally,although the exact cause of AE is still unknown, they areassociated with pulmonary and systemic inflammation due toa change of the pulmonary microbial balance [153, 154].
AE require hospital admission where treatment oftenconsists of intravenous antibiotics [151, 155]. In general,broad-spectrum antibiotics are used since the exact microbialcause of an exacerbation is often not detectable. Moreover,accurate and fast treatment of exacerbations is also hamperedby a poor standardization of both the definition and detectionof AE in most lung diseases [156, 157]. RecognizingAE appears to be difficult for both the patients and caretakers as exacerbation profiles vary enormously betweenindividuals. Current diagnostics include clinical criteria suchas changes in symptoms and lung function but they oftenoccur when an exacerbation is already manifest. Additionally,sputum induction or bronchoscopy accompanied by samplingbroncho-alveolar lavage fluid can be applied for quantitativelaboratory microbiological analysis in order to detect the exactmicrobial cause [158–160]. However, the usefulness of thesetechniques is seriously hampered by their invasiveness butmostly by their long duration of more than 48 h before resultsbecome available. In other words, to date it is still not possibleto predict or quickly diagnose the occurrence and microbialcause of an exacerbation and thus prevent severe lung damageand deterioration on the long term. Therefore, there is an urgentneed for non-invasive fast diagnostic tools that will contributeto a rapid diagnosis of AE in general and of the underlyingmicro-organism(s) in particular, thereby leading to an earlierstart of appropriate antibiotic therapy and a more favorablehealth outcome. The analysis of exhaled air, combined withthe adequate interpretation of selected VOC levels, mightprovide such a new and promising diagnostic tool for earlyidentification and closer monitoring of patients with high riskprofiles for AE. Indeed, monitoring high risk patients andearly identifying the worsening of pulmonary symptoms mightallow adequate therapeutic interventions with oral antibioticsand/or physiotherapy to prevent AE and thus improve thequality of life in these patients [161, 162].
15

J. Breath Res. 6 (2012) 027108 A W Boots et al
3.3.3. Treatment efficacy. Once VOC profiling has beenproven to be a successful diagnostic tool for specificchronic diseases, their various phenotypes and/or underlyingpathogens, it can be anticipated that VOC patterns canalso be used to monitor disease progression and therapyefficacy. Until now, treatment effects in several chroniclung diseases including asthma and COPD have only beenmonitored using clinical symptoms such as lung function[163, 164]. However, these symptoms only partially correlatewith, and are thus not completely representative for, theunderlying damaging processes including oxidative stressand inflammation. Consequently, within the fields of guidingtreatment strategies and predicting therapy outcome, noveland more accurate biomarkers are needed [164]. Until now,the development of these new biomarkers has mainly beenfocused on inflammatory markers such as the presence ofspecific inflammatory cell-types [165, 166], the identificationof inflammatory mediators [167, 168] or the detectionof the fraction of nitric oxide in exhaled breath (FeNO)[169, 170]. However, none of these novel inflammatorybiomarkers has been proven adequate to use in routine clinicalpractice due to several pitfalls and shortcomings (extensivelyreviewed in [164]). Therefore, VOC profiling has recentlybeen suggested as a new and more successful approach tomonitor disease management and treatment efficacy. It can beanticipated that the detection of disease-specific VOCs in largestudy populations will ultimately enable monitoring therapyeffectiveness by measuring breathograms.
4. Summary and perspective
Whether novel biomarkers provide useful information fordisease diagnosing, monitoring or risk prediction has beenthe focus of intense study over the last years [171, 172].Proving the usefulness of such new biomarkers, however, hasbeen hampered by a variety of factors including inadequatestatistical power, the lack of measures such as calibrationand reclassification and the lack of external validation [173,174]. It can, on the other hand, also be argued that the provensuccessful application of such new biomarkers in some studieshas been overestimated due to the use of homogeneous samplepopulations or inappropriate endpoints.
An intriguing point of discussion regarding the usefulnessof novel biomarkers is the importance given to their statisticalsignificance. In other words, statistically significant changesin predicted probabilities might not be relevant to clinical care,whereas reclassification of individuals into new, clinicallyrelevant risk categories based on the application of newbiomarkers is. Therefore, breathomics might be the new toolthat provides the means to differentiate on a physiologicalbasis between clinically related disease profiles or sub-stages.Interestingly, it has already been suggested that exhaled airanalysis might be extra valuable in clinical practice due toits superior accuracy compared to the reported sensitivity andspecificity of current methodologies [4].
In conclusion, it can be stated that breath analysis holdsthe promise to be of huge interest in clinical practice. It hasalready been proven that in some disease profiles, breathomics
can generate quality biomarkers and thus serve as a sensitiveand non-invasive methodology. However large (prospective)cohort studies are necessary in order to validate such selectedbiomarkers linked to different disease profiles. Future researchregarding more specific and highly sensitive sensors willprovide the means for these biomarkers to be highly costeffective and very simple to use [175, 176].
At present, a wide range of sensors is under researchincluding metal-oxide sensors and polymer-based sensors.Both sensors are capable of registering the absorption ofspecific VOCs by means of either resistance or acousticvariations. At present, such sensors are already capable ofaccurately detecting low concentrations of volatiles as wellas other techniques and are under development to be usedas bedside tests. At the same time, parallel approachescomprise the detection of disease-related VOCs by means ofminiaturized GCs in line with highly sensitive and specificsensors such as the MS. Improved sensitivity and specificityfollowed by implementation of these technologies into small‘fool-proof’ handheld devices, combined with advanced signalprocessing modules and an easy-to-apply breath collectionprocedure, will lift breathomics right into clinical practice.
References
[1] Hopfield J J 1999 Odor space and olfactory processing:collective algorithms and neural implementation Proc.Natl Acad. Sci. USA 96 12506–11
[2] Ma W, Liu X and Pawliszyn J 2006 Analysis of humanbreath with micro extraction techniques and continuousmonitoring of carbon dioxide concentration Anal. Bioanal.Chem. 385 1398–408
[3] Libardoni M, Stevens P T, Waite J H and Sacks R 2006Analysis of human breath samples with a multi-bedsorption trap and comprehensive two-dimensional gaschromatography (GCxGC) J. Chromatogr. B 842 13–21
[4] Miekisch W, Schubert J K and Noeldge-Schomburg G F2004 Diagnostic potential of breath analysis—focus onvolatile organic compounds Clin. Chim. Acta 347 25–39
[5] Barnes P J et al 2010 Exhaled nitric oxide in pulmonarydiseases: a comprehensive review Chest 138 682–92
[6] Keen C, Olin A C, Wennergren G and Gustafsson P 2011Small airway function, exhaled NO and airwayhyper-responsiveness in paediatric asthma Respir. Med.105 1476–84
[7] Pedrosa M, Barranco P, Lopez-Carrasco V and Quirce S2012 Changes in exhaled nitric oxide levels after bronchialallergen challenge Lung 190 209–14
[8] Yamaya M, Sekizawa K, Ishizuka S, Monma M and Sasaki H1999 Exhaled carbon monoxide levels during treatment ofacute asthma Eur. Respir. J. 13 757–60
[9] Montuschi P, Kharitonov S A and Barnes P J 2001 Exhaledcarbon monoxide and nitric oxide in COPD Chest120 496–501
[10] Horvath I et al 2001 ‘Haemoxygenase-1 induction andexhaled markers of oxidative stress in lung diseases’,summary of the ERS Research Seminar in Budapest,Hungary, September, 1999 Eur. Respir. J. 18 420–30
[11] Wade C R and van Rij A M 1985 In vivo lipid peroxidation inman as measured by the respiratory excretion of ethane,pentane, and other low-molecular-weight hydrocarbonsAnal. Biochem. 150 1–7
[12] Kanoh S, Kobayashi H and Motoyoshi K 2005 Exhaledethane: an in vivo biomarker of lipid peroxidation ininterstitial lung diseases Chest 128 2387–92
16

J. Breath Res. 6 (2012) 027108 A W Boots et al
[13] Paredi P, Kharitonov S A, Leak D, Ward S, Cramer Dand Barnes P J 2000 Exhaled ethane, a marker of lipidperoxidation, is elevated in chronic obstructive pulmonarydisease Am. J. Respir. Crit. Care Med. 162 369–73
[14] Barker M, Hengst M, Schmid J, Buers H J, Mittermaier B,Klemp D and Koppmann R 2006 Volatile organiccompounds in the exhaled breath of young patients withcystic fibrosis Eur. Respir. J. 27 929–36
[15] Olopade C O, Zakkar M, Swedler W I and Rubinstein I 1997Exhaled pentane levels in acute asthma Chest 111 862–5
[16] Dettmer K and Hammock B D 2004 Metabolomics—a newexciting field within the ‘omics’ sciences Environ. HealthPerspect. 112 A396–7
[17] Gates S C and Sweeley C C 1978 Quantitative metabolicprofiling based on gas chromatography Clin. Chem.24 1663–73
[18] Pauling L, Robinson A B, Teranishi R and Cary P 1971Quantitative analysis of urine vapor and breath bygas–liquid partition chromatography Proc. Natl Acad. Sci.USA 68 2374–6
[19] Robinson A B and Robinson N E 2011 Origins of metabolicprofiling Methods Mol. Biol. 708 1–23
[20] Cope K A, Watson M T, Foster W M, Sehnert S Sand Risby T H 2004 Effects of ventilation on the collectionof exhaled breath in humans J. Appl. Physiol. 96 1371–9
[21] Schubert J K, Miekisch W, Geiger Kand Noldge-Schomburg G F 2004 Breath analysis incritically ill patients: potential and limitations Expert Rev.Mol. Diagn. 4 619–29
[22] Buszewski B, Kesy M, Ligor T and Amann A 2007 Humanexhaled air analytics: biomarkers of diseases Biomed.Chromatogr. 21 553–66
[23] Phillips M 1997 Method for the collection and assay ofvolatile organic compounds in breath Anal. Biochem.247 272–8
[24] Van Berkel J J, Dallinga J W, Moller G M, Godschalk R W,Moonen E, Wouters E F and Van Schooten F J 2008Development of accurate classification method based onthe analysis of volatile organic compounds from humanexhaled air J. Chromatogr. B 861 101–7
[25] Watson J T and Sparkman O D 2007 Introduction to MassSpectrometry: Instrumentation, Applications andStrategies for Data Interpretation (West Sussex: Wiley)
[26] Schwarz K, Filipiak W and Amann A 2009 Determiningconcentration patterns of volatile compounds in exhaledbreath by PTR-MS J. Breath Res. 3 027002
[27] Van Berkel J J, Dallinga J W, Moller G M, Godschalk R W,Moonen E J, Wouters E F and Van Schooten F J 2010 Aprofile of volatile organic compounds in breathdiscriminates COPD patients from controls Respir. Med.104 557–63
[28] Mieth M, Schubert J K, Groger T, Sabel B, Kischkel S,Fuchs P, Hein D, Zimmermann R and Miekisch W 2010Automated needle trap heart-cut GC/MS and needle trapcomprehensive two-dimensional GC/TOF-MS for breathgas analysis in the clinical environment Anal. Chem.82 2541–51
[29] Schwoebel H, Schubert R, Sklorz M, Kischkel S,Zimmermann R, Schubert J K and Miekisch W 2011Phase-resolved real-time breath analysis during exerciseby means of smart processing of PTR-MS data Anal.Bioanal. Chem. 401 2079–91
[30] Westhoff M, Litterst P, Freitag L, Urfer W, Bader Sand Baumbach J I 2009 Ion mobility spectrometry for thedetection of volatile organic compounds in exhaled breathof patients with lung cancer: results of a pilot study Thorax64 744–8
[31] Taucher J, Hansel A, Jordan A, Fall R, Futrell J Hand Lindinger W 1997 Detection of isoprene in expired air
from human subjects using proton-transfer-reaction massspectrometry Rapid Commun. Mass Spectrom. 11 1230–4
[32] Amann A, Tratnig R and Unterkofler K 2007 Detectingventricular fibrillation by time-delay methods IEEE Trans.Biomed. Eng. 54 174–7
[33] Blake R S, Whyte C, Hughes C O, Ellis A M and Monks P S2004 Demonstration of proton-transfer reactiontime-of-flight mass spectrometry for real-time analysis oftrace volatile organic compounds Anal. Chem. 76 3841–5
[34] Hewitt C N, Hayward S and Tani A 2003 The application ofproton transfer reaction-mass spectrometry (PTR-MS) tothe monitoring and analysis of volatile organic compoundsin the atmosphere J. Environ. Monit. 5 1–7
[35] Wilson H K and Monster A C 1999 New technologies in theuse of exhaled breath analysis for biological monitoringOccup. Environ. Med. 56 753–7
[36] Spanel P and Smith D 2007 Selected ion flow tube massspectrometry for on-line trace gas analysis in biology andmedicine Eur. J. Mass Spectrom. 13 77–82
[37] Trygg J, Gabrielsson J and Lundstedt T 2009 BackgroundEstimation, Denoising, and Preprocessing (Amsterdam:Elsevier)
[38] Eilers P H C 2003 A perfect smoother Anal. Chem.75 3631–6
[39] Eilers P H C and Marx B D 1996 Flexible smoothing withB-splines and penalties Stat. Sci. 11 89–102
[40] Xu Z F, Sun X B and Harrington P D 2011 Baselinecorrection method using an orthogonal basis for gaschromatography/mass spectrometry data Anal. Chem.83 7464–71
[41] Bloemberg T G, Gerretzen J, Wouters H J P, Gloerich J,van Dael M, Wessels H J C T, van den Heuvel L P,Eilers P H C, Buydens L M C and Wehrens R 2010Improved parametric time warping for proteomicsChemometr. Intell. Lab. Syst. 104 65–74
[42] Nielsen N P V, Carstensen J M and Smedsgaard J 1998Aligning of single and multiple wavelengthchromatographic profiles for chemometric data analysisusing correlation optimised warping J. Chromatogr. A805 17–35
[43] Peters S, van Velzen E and Janssen H G 2009 Parameterselection for peak alignment in chromatographic sampleprofiling: objective quality indicators and use of controlsamples Anal. Bioanal. Chem. 394 1273–81
[44] Lommen A 2009 MetAlign: interface-driven, versatilemetabolomics tool for hyphenated full-scan massspectrometry data preprocessing Anal. Chem. 81 3079–86
[45] Pluskal T, Castillo S, Villar-Briones A and Oresic M 2010MZmine 2: modular framework for processing,visualizing, and analyzing mass spectrometry-basedmolecular profile data BMC Bioinform. 11 395–406
[46] Jellema R H 2009 Variable Shift and Alignment (Amsterdam:Elsevier)
[47] Pearson K 1901 On lines and planes of closest fit to systemsof points in space Phil. Mag. A 2 559–72
[48] Vandeginste B G M, Massart D L, Buydens L M C,Jong S D, Lewi P J and Smeyers-Verbeke J 1998Handbook of Chemometrics and Qualimerics: Part A(Amsterdam: Elsevier)
[49] Daszykowski M, Kaczmarek K, Heyden Y V and Walczak B2007 Robust statistics in data analysis—a review. Basicconcepts Chemometr. Intell. Lab. Syst. 85 203–19
[50] Webb A 2002 Statistical Pattern Recognition (New York:Wiley)
[51] de Gennaro G, Dragonieri S, Longobardi F, Musti M,Stallone G, Trizio L and Tutino M 2010 Chemicalcharacterization of exhaled breath to differentiate betweenpatients with malignant plueral mesothelioma from
17

J. Breath Res. 6 (2012) 027108 A W Boots et al
subjects with similar professional asbestos exposure Anal.Bioanal. Chem. 398 3043–50
[52] Kischkel S, Miekisch W, Sawacki A, Straker E M, Trefz P,Amann A and Schubert J K 2010 Breath biomarkers forlung cancer detection and assessment of smoking relatedeffects—confounding variables, influence of normalizationand statistical algorithms Clin. Chim. Acta 411 1637–44
[53] Statheropoulos M, Mikedi K, Agapiou A, Georgiadou Aand Karma S 2006 Discriminant analysis of volatileorganic compounds data related to a new location methodof entrapped people in collapsed buildings of anearthquake Anal. Chim. Acta 566 207–16
[54] Krzanowski W J 2000 Principles of Multivariate AnalysisRevised edn (New York: Oxford University Press)
[55] Wold S, Sjostrom M and Eriksson L 2001 PLS-regression: abasic tool of chemometrics Chemometr. Intell. Lab. Syst.58 109–30
[56] Walczak B and Massart D L 1996 Application of radial basisfunctions—partial least squares to non-linear patternrecognition problems: diagnosis of process faults Anal.Chim. Acta 331 187–93
[57] Vapnik V 1998 Statistical Learning Theory (New York:Wiley)
[58] Van den Velde S, Nevens F, Van Hee P, van Steenberghe Dand Quirynen M 2008 GC-MS analysis of breath odorcompounds in liver patients J. Chromatogr. B 875 344–8
[59] Ulanowska A, Kowalkowski T, Trawinska Eand Buszewski B 2011 The application of statisticalmethods using VOCs to identify patients with lung cancerJ. Breath Res. 5 046008
[60] Ulanowska A, Kowalkowski T, Hrynkiewicz K, Jackowski Mand Buszewski B 2011 Determination of volatile organiccompounds in human breath for helicobacter pyloridetection by SPME-GC/MS Biomed. Chromatogr.25 391–7
[61] Cristescu S M, Gietema H A, Blanchet L, Kruitwagen C L,Munnik P, van Klaveren R J, Lammers J W, Buydens L,Harren F J and Zanen P 2011 Screening for emphysemavia exhaled volatile organic compounds J. Breath Res.5 046009
[62] Vandeginste B G M, Massart D L, Buydens L M C, DeJong S, Lewi P J and Smeyers-Verbeke J 1998 Handbookof Chemometrics and Qualimetrics: Part B (Amsterdam:Elsevier)
[63] Westerhuis J A, Hoefsloot H C J, Smit S, Vis D J,Smilde A K, van Velzen E J J, van Duijnhoven J P Mand van Dorsten F A 2008 Assessment of PLSDA crossvalidation Metabolomics 4 81–9
[64] Caldeira M, Barros A S, Bilelo M J, Parada A, Camara J Sand Rocha S 2011 Profiling allergic asthma volatilemetabolic patterns using a headspace-solid phasemicroextraction/gas chromatography based methodologyJ. Chromatogr. A 1218 3771–80
[65] Breiman L 2001 Random forests Mach. Learn. 45 5–32[66] Efron B 1979 1977 Rietz lecture—Bootstrap
methods—another look at the jackknife Ann. Stat. 7 1–26[67] Mazzone P J, Hammel J, Dweik R, Na J, Czich C,
Laskowski D and Mekhail T 2007 Diagnosis of lungcancer by the analysis of exhaled breath with acolorimetric sensor array Thorax 62 565–8
[68] Shawe-Taylor J and Cristianini N 2004 Kernel Methods forPattern Analysis (Cambridge: Cambridge University Press)
[69] Guyon I, Weston J and Barnhill S 2002 Gene selection forcancer classification using support vector machine Mach.Learn. 46 389–422
[70] Krooshof P W T, Ustun B, Postma G J and Buydens L M C2010 Visualization and recovery of the (bio)chemicalinteresting variables in data analysis with support vectormachine classification Anal. Chem. 82 7000–7
[71] Czekaj T, Wu W and Walczak B 2005 About kernel latentvariable approach and SVM J. Chemometr. 19 341–54
[72] Van Berkel J, Dallinga J W, Moeller G M, Godschalk R W L,Moonen E, Wouters E F M and Van Schooten F J 2008Development of accurate classification method based onthe analysis of volatile organic compounds from humanexhaled air J. Chromatogr. B 861 101–7
[73] Moorhead K T, Lee D, Chase J G, Moot A R,Ledingham K M, Scotter J, Allardyce R A,Senthilmohan S T and Endre Z 2008 Classifyingalgorithms for SIFT-MS technology and medical diagnosisComput. Methods Programs Biomed. 89 226–38
[74] Barla A, Jurman G, Riccadonna S, Merler S, Chierici Mand Furlanello C 2008 Machine learning methods forpredictive proteomics Brief. Bioinform. 9 119–28
[75] Stein S E and Scott D R 1994 Optimization and testing ofmass-spectral library search algorithms for compoundidentification J. Am. Soc. Mass Spectrom. 5 859–66
[76] Guyon I, Weston J, Barnhill S and Vapnik V 2002 Geneselection for cancer classification using support vectormachines Mach. Learn. 46 389–422
[77] Schulz S and Dickschat J S 2007 Bacterial volatiles: thesmell of small organisms Nat. Prod. Rep. 24 814–42
[78] Magder S 2006 Reactive oxygen species: toxic molecules orspark of life? Crit. Care 10 208
[79] Kohen R and Nyska A 2002 Oxidation of biological systems:oxidative stress phenomena, antioxidants, redox reactions,and methods for their quantification Toxicol. Pathol.30 620–50
[80] Sies H 1997 Oxidative stress: oxidants and antioxidants Exp.Physiol. 82 291–5
[81] Rothkrantz-Kos S, Drent M, Vuil H, De Boer M, Bast A,Wouters E F, Roos D and van Dieijen-Visser M P 2002Decreased redox state in red blood cells from patients withsarcoidosis Sarcoidosis Vasc. Diffuse Lung Dis. 19 114–20
[82] Boots A W, Haenen G R and Bast A 2003 Oxidantmetabolism in chronic obstructive pulmonary disease Eur.Respir. J. Suppl. 46 14s–27s
[83] Rezaie A, Parker R D and Abdollahi M 2007 Oxidative stressand pathogenesis of inflammatory bowel disease: anepiphenomenon or the cause? Dig. Dis. Sci. 52 2015–21
[84] Otani H 2011 Oxidative stress as pathogenesis ofcardiovascular risk associated with metabolic syndromeAntioxid. Redox Signal. 15 1911–26
[85] Rezvan A, Ni C W, Alberts-Grill N and Jo H 2011 Animal,in vitro, and ex vivo models of flow-dependentatherosclerosis: role of oxidative stress Antioxid. RedoxSignal. 15 1433–48
[86] Boots A W, Haenen G R and Bast A 2008 Health effects ofquercetin: from antioxidant to nutraceutical Eur. J.Pharmacol. 585 325–37
[87] Halliwell B and Chirico S 1993 Lipid peroxidation: itsmechanism, measurement, and significance Am. J. Clin.Nutr. 57 715S–24S discussion 724S–5S
[88] Dillard C J and Tappel A L 1989 Lipid peroxidation productsin biological tissues Free Radic. Biol. Med. 7 193–6
[89] Orhan H 2007 Analyses of representative biomarkers ofexposure and effect by chromatographic, massspectrometric, and nuclear magnetic resonance techniques:method development and application in life sciencesJ. Sep. Sci. 30 149–74
[90] Parkin J and Cohen B 2001 An overview of the immunesystem Lancet 357 1777–89
[91] Allardyce R A, Hill A L and Murdoch D R 2006 The rapidevaluation of bacterial growth and antibiotic susceptibilityin blood cultures by selected ion flow tube massspectrometry Diagn. Microbiol. Infect. Dis. 55 255–61
[92] Scotter J M, Allardyce R A, Langford V S, Hill Aand Murdoch D R 2006 The rapid evaluation of bacterial
18

J. Breath Res. 6 (2012) 027108 A W Boots et al
growth in blood cultures by selected ion flow tube-massspectrometry (SIFT-MS) and comparison with theBacT/ALERT automated blood culture systemJ. Microbiol. Methods 65 628–31
[93] Thorn R M, Reynolds D M and Greenman J 2011Multivariate analysis of bacterial volatile compoundprofiles for discrimination between selected species andstrains in vitro J. Microbiol. Methods 84 258–64
[94] Carroll W, Lenney W, Wang T, Spanel P, Alcock Aand Smith D 2005 Detection of volatile compoundsemitted by Pseudomonas aeruginosa using selected ionflow tube mass spectrometry Pediatr. Pulmonol. 39 452–6
[95] Lechner M, Tilg H and Rieder J 2006 Analysis of volatilecompounds emitted by the helicobacter pylori referencestrain NCTC 11637 in vitro Helicobacter 11 66
[96] Parkin D M, Bray F, Ferlay J and Pisani P 2005 Globalcancer statistics, 2002 CA Cancer J. Clin. 55 74–108
[97] Bajtarevic A et al 2009 Noninvasive detection of lung cancerby analysis of exhaled breath BMC Cancer 9 348
[98] Phillips M et al 2007 Prediction of lung cancer using volatilebiomarkers in breath Cancer Biomarkers 3 95–109
[99] Ligor M et al 2009 Determination of volatile organiccompounds in exhaled breath of patients with lung cancerusing solid phase microextraction and gas chromatographymass spectrometry Clin. Chem. Lab. Med. 47 550–60
[100] Gaspar E M, Lucena A F, Duro da Costa J and Chaves dasNeves H 2009 Organic metabolites in exhaled humanbreath—a multivariate approach for identification ofbiomarkers in lung disorders J. Chromatogr. A1216 2749–56
[101] Peng G, Tisch U, Adams O, Hakim M, Shehada N,Broza Y Y, Billan S, Abdah-Bortnyak R, Kuten Aand Haick H 2009 Diagnosing lung cancer in exhaledbreath using gold nanoparticles Nature Nanotechnol.4 669–73
[102] Chen X, Xu F, Wang Y, Pan Y, Lu D, Wang P, Ying K,Chen E and Zhang W 2007 A study of the volatile organiccompounds exhaled by lung cancer cells in vitro for breathdiagnosis Cancer 110 835–44
[103] Sponring A, Filipiak W, Ager C, Schubert J, Miekisch W,Amann A and Troppmair J 2010 Analysis of volatileorganic compounds (VOCs) in the headspace ofNCI-H1666 lung cancer cells Cancer Biomarkers 7153–61
[104] Bartolazzi A, Santionico M, Pennazza G, Martinelli E,Paolesse R, D’Amico A and Di Natale C 2010 A sensorarray and GC study about VOCs and cancer cells SensorsActuators B 146 483–8
[105] Filipiak W, Sponring A, Filipiak A, Ager C, Schubert J,Miekisch W, Amann A and Troppmair J 2010 TD-GC-MSanalysis of volatile metabolites of human lung cancer andnormal cells in vitro Cancer Epidemiol. Biomarkers Prev.19 182–95
[106] Filipiak W, Sponring A, Mikoviny T, Ager C, Schubert J,Miekisch W, Amann A and Troppmair J 2008 Release ofvolatile organic compounds (VOCs) from the lung cancercell line CALU-1 in vitro Cancer Cell Int. 8 17
[107] Smith D, Wang T, Sule-Suso J, Spanel P and El Haj A 2003Quantification of acetaldehyde released by lung cancercells in vitro using selected ion flow tube massspectrometry Rapid Commun. Mass Spectrom. 17 845–50
[108] Sponring A, Filipiak W, Mikoviny T, Ager C, Schubert J,Miekisch W, Amann A and Troppmair J 2009 Release ofvolatile organic compounds from the lung cancer cell lineNCI-H2087 in vitro Anticancer Res. 29 419–26
[109] Taylor D R 2011 Using biomarkers in the assessment ofairways disease J. Allergy Clin. Immunol. 128 927–34quiz 935–26
[110] Dallinga J W, Robroeks C M, van Berkel J J, Moonen E J,Godschalk R W, Jobsis Q, Dompeling E, Wouters E Fand van Schooten F J 2010 Volatile organic compounds inexhaled breath as a diagnostic tool for asthma in childrenClin. Exp. Allergy 40 68–76
[111] Robroeks C M et al 2010 Metabolomics of volatile organiccompounds in cystic fibrosis patients and controls Pediatr.Res. 68 75–80
[112] Basanta M, Jarvis R M, Xu Y, Blackburn G, Tal-Singer R,Woodcock A, Singh D, Goodacre R, Thomas C Land Fowler S J 2010 Non-invasive metabolomic analysisof breath using differential mobility spectrometry inpatients with chronic obstructive pulmonary disease andhealthy smokers Analyst 135 315–20
[113] Montuschi P et al 2010 Diagnostic performance of anelectronic nose, fractional exhaled nitric oxide, and lungfunction testing in asthma Chest 137 790–6
[114] Phillips M, Cataneo R N, Condos R, Ring Erickson G A,Greenberg J, La Bombardi V, Munawar M I and Tietje O2007 Volatile biomarkers of pulmonary tuberculosis in thebreath Tuberculosis 87 44–52
[115] Phillips M, Cataneo R N, Greenberg J, Grodman Rand Salazar M 2003 Breath markers of oxidative stress inpatients with unstable angina Heart Dis. 5 95–9
[116] Phillips M, Cataneo R N, Ditkoff B A, Fisher P, Greenberg J,Gunawardena R, Kwon C S, Tietje O and Wong C 2006Prediction of breast cancer using volatile biomarkers in thebreath Breast Cancer Res. Treat. 99 19–21
[117] Patterson S G, Bayer C W, Hendry R J, Sellers N, Lee K S,Vidakovic B, Mizaikoff B and Gabram-Mendola S G 2011Breath analysis by mass spectrometry: a new tool forbreast cancer detection? Am. Surg. 77 747–51
[118] Horvath G, Chilo J and Lindblad T 2010 Different volatilesignals emitted by human ovarian carcinoma and healthytissue Future Oncol. 6 1043–9
[119] Qin T, Liu H, Song Q, Song G, Wang H Z, Pan Y Y,Xiong F X, Gu K S, Sun G P and Chen Z D 2010 Thescreening of volatile markers for hepatocellular carcinomaCancer Epidemiol. Biomarkers Prev. 19 2247–53
[120] Phillips M 1992 Detection of carbon disulfide in breath andair: a possible new risk factor for coronary artery diseaseInt. Arch. Occup. Environ. Health 64 119–23
[121] Phillips M, Cataneo R N, Greenberg J, Grodman Rand Salazar M 2003 Breath markers of oxidative stress inpatients with unstable angina Heart Dis. 5 95–9
[122] Woolfenden E 2010 Sorbent-based sampling methods forvolatile and semi-volatile organic compounds in air: part 2.Sorbent selection and other aspects of optimizing airmonitoring methods J. Chromatogr. A 1217 2685–94
[123] Chang E E, Wei-Chi W, Li-Xuan Z and Hung-Lung C 2010Health risk assessment of exposure to selected volatileorganic compounds emitted from an integrated iron andsteel plant Inhal. Toxicol. 22 117–25
[124] Modak A S 2011 Barriers to overcome for transition ofbreath tests from research to routine clinical practiceJ. Breath Res. 5 030202
[125] Smith T 2011 Breath analysis: clinical research to theend-user market J. Breath Res. 5 032001
[126] Pleil J D and Amann A 2011 The 2011 InternationalAssociation of Breath Research (IABR) Meeting in Parma,Italy: a collection of comments from attendees J. BreathRes. 5 049001
[127] Scholpp J, Schubert J K, Miekisch W and Geiger K 2002Breath markers and soluble lipid peroxidation markers incritically ill patients Clin. Chem. Lab. Med. 40 587–94
[128] Schubert J K, Muller W P, Benzing A and Geiger K 1998Application of a new method for analysis of exhaled gas incritically ill patients Intensive Care Med. 24 415–21
19

J. Breath Res. 6 (2012) 027108 A W Boots et al
[129] Phillips M, Basa-Dalay V, Bothamley G, Cataneo R N,Lam P K, Natividad M P, Schmitt P and Wai J 2010Breath biomarkers of active pulmonary tuberculosisTuberculosis 90 145–51
[130] Tanner N T, Mehta H and Silvestri G A 2012 New testing forlung cancer screening Oncology 26 176–82
[131] Bowman R V et al 2012 The Queensland Lung CancerScreening Study—rationale, design and methods Intern.Med. J. in press
[132] Anderson D and Macnee W 2009 Targeted treatment inCOPD: a multi-system approach for a multi-systemdisease Int. J. Chronic Obstruct. Pulmon. Dis.4 321–35
[133] Han M K et al 2010 Chronic obstructive pulmonary diseasephenotypes: the future of COPD Am. J. Respir. Crit. CareMed. 182 598–604
[134] Shirtcliffe P, Weatherall M, Travers J and Beasley R 2011The multiple dimensions of airways disease: targetingtreatment to clinical phenotypes Curr. Opin. Pulm. Med.17 72–8
[135] Bush A and Fleming L 2011 Phenotypes of refractory/severeasthma Paediatr. Respir. Rev. 12 177–81
[136] Louis R 2009 Severe asthma: how can we differentiatephenotypes? Swiss Med. Wkly 139 274–7
[137] Wenzel S E, Fahy J V, Irvin C, Peters S P, Spector Sand Szefler S J 2000 Proceedings of the ATS workshop onrefractory asthma Am. J. Respir. Crit. Care Med.162 2341–51
[138] Manise M, Schleich F, Gusbin N, Godinas L, Henket M,Antoine N, Corhay J L and Louis R 2010 Cytokineproduction from sputum cells and blood leukocytes inasthmatics according to disease severity Allergy65 889–96
[139] Nakagome K and Nagata M 2011 Pathogenesis of airwayinflammation in bronchial asthma Auris Nasus Larynx38 555–63
[140] Wenzel S E, Schwartz L B, Langmack E L, Halliday J L,Trudeau J B, Gibbs R L and Chu H W 1999 Evidence thatsevere asthma can be divided pathologically into twoinflammatory subtypes with distinct physiologic andclinical characteristics Am. J. Respir. Crit. Care Med.160 1001–8
[141] Firszt R and Kraft M 2010 Pharmacotherapy of severeasthma Curr. Opin. Pharmacol. 10 266–71
[142] Arai R 2010 Serologic markers: impact on early diagnosisand disease stratification in inflammatory bowel diseasePostgrad. Med. 122 177–85
[143] Roda G, Caponi A, Benevento M, Nanni P, Mezzanotte L,Belluzzi A, Mayer L and Roda A 2010 New proteomicapproaches for biomarker discovery in inflammatorybowel disease Inflamm. Bowel Dis. 16 1239–46
[144] Vermeire S, Van Assche G and Rutgeerts P 2006 Laboratorymarkers in IBD: useful, magic, or unnecessary toys? Gut55 426–31
[145] Lakatos P L, Papp M and Rieder F 2011 Serologic antiglycanantibodies in inflammatory bowel disease Am. J.Gastroenterol. 106 406–12
[146] Actis G C, Rosina F and Mackay I R 2011 Inflammatorybowel disease: beyond the boundaries of the bowel ExpertRev. Gastroenterol. Hepatol. 5 401–10
[147] Sedghi S, Keshavarzian A, Klamut M, Eiznhamer Dand Zarling E J 1994 Elevated breath ethane levelsin active ulcerative colitis: evidence for excessivelipid peroxidation Am. J. Gastroenterol.89 2217–21
[148] Pelli M A, Trovarelli G, Capodicasa E, De Medio G Eand Bassotti G 1999 Breath alkanes determination inulcerative colitis and Crohn’s disease Dis. Colon Rectum42 71–6
[149] Anzueto A 2010 Impact of exacerbations on COPD Eur.Respir. Rev. 19 113–8
[150] Joseph N M, Sistla S, Dutta T K, Badhe A S and Parija S C2010 Ventilator-associated pneumonia: a review Eur. J.Intern. Med. 21 360–8
[151] Emerson J, Rosenfeld M, McNamara S, Ramsey Band Gibson R L 2002 Pseudomonas aeruginosa andother predictors of mortality and morbidity in youngchildren with cystic fibrosis Pediatr. Pulmonol.34 91–100
[152] Patel I S, Seemungal T A, Wilks M, Lloyd-Owen S J,Donaldson G C and Wedzicha J A 2002 Relationshipbetween bacterial colonisation and the frequency,character, and severity of COPD exacerbations Thorax57 759–64
[153] Gibson R L, Burns J L and Ramsey B W 2003Pathophysiology and management of pulmonaryinfections in cystic fibrosis Am. J. Respir. Crit. Care Med.168 918–51
[154] Sethi S and Murphy T F 2008 Infection in the pathogenesisand course of chronic obstructive pulmonary diseaseN. Engl. J. Med. 359 2355–65
[155] Stolz D and Tamm M 2009 Discriminate use of antibioticsfor exacerbation of COPD Curr. Opin. Pulm. Med.15 126–132
[156] Dakin C, Henry R L, Field P and Morton J 2001 Defining anexacerbation of pulmonary disease in cystic fibrosisPediatr. Pulmonol. 31 436–42
[157] Kessler R, Stahl E, Vogelmeier C, Haughney J, Trudeau E,Lofdahl C G and Partridge M R 2006 Patientunderstanding, detection, and experience of COPDexacerbations: an observational, interview-based studyChest 130 133–42
[158] Nicholas B and Djukanovic R 2009 Induced sputum: awindow to lung pathology Biochem. Soc. Trans.37 868–72
[159] Ramirez P, Valencia M and Torres A 2007 Broncoalveolarlavage to diagnose respiratory infections Semin. Respir.Crit. Care Med. 28 525–33
[160] Sykes A, Mallia P and Johnston S L 2007 Diagnosis ofpathogens in exacerbations of chronic obstructivepulmonary disease Proc. Am. Thorac. Soc.4 642–6
[161] Block J K et al 2006 Predictors of pulmonary exacerbationsin patients with cystic fibrosis infected with multi-resistantbacteria Thorax 61 969–74
[162] Vestbo J 2006 Clinical assessment, staging, andepidemiology of chronic obstructive pulmonary diseaseexacerbations Proc. Am. Thorac. Soc. 3 252–6
[163] Soriano J B, Zielinski J and Price D 2009 Screening for andearly detection of chronic obstructive pulmonary diseaseLancet 374 721–32
[164] Vijverberg S J, Koenderman L, Koster E S, van der Ent C K,Raaijmakers J A and Maitland-van der Zee A H 2011Biomarkers of therapy responsiveness in asthma: pitfallsand promises Clin. Exp. Allergy 41 615–29
[165] Bacci E, Cianchetti S, Bartoli M, Dente F L, Di Franco A,Vagaggini B and Paggiaro P 2006 Low sputum eosinophilspredict the lack of response to beclomethasone insymptomatic asthmatic patients Chest 129 565–72
[166] Szefler S J et al 2002 Significant variability in response toinhaled corticosteroids for persistent asthma J. AllergyClin. Immunol. 109 410–8
[167] Fitzpatrick A M, Higgins M, Holguin F, Brown L Aand Teague W G 2010 The molecular phenotype of severeasthma in children J. Allergy Clin. Immunol.125 851–7 e818
[168] Kato M, Yamada Y, Maruyama K and Hayashi Y 2010Serum eosinophil cationic protein and 27
20

J. Breath Res. 6 (2012) 027108 A W Boots et al
cytokines/chemokines in acute exacerbation of childhoodasthma Int. Arch. Allergy Immunol. 152 (Suppl 1) 62–6
[169] Pijnenburg M W and De Jongste J C 2008 Exhaled nitricoxide in childhood asthma: a review Clin. Exp. Allergy38 246–59
[170] Rodway G W, Choi J, Hoffman L A and Sethi J M 2009Exhaled nitric oxide in the diagnosis and management ofasthma: clinical implications Chronic Respir. Dis.6 19–29
[171] Wang T J et al 2007 Multiple biomarkers and the risk ofincident hypertension Hypertension 49 432–8
[172] Zethelius B, Berglund L, Sundstrom J, Ingelsson E,Basu S, Larsson A, Venge P and Arnlov J 2008 Use ofmultiple biomarkers to improve the prediction of deathfrom cardiovascular causes N. Engl. J. Med.358 2107–16
[173] Pepe M S, Janes H, Longton G, Leisenring Wand Newcomb P 2004 Limitations of the odds ratio ingauging the performance of a diagnostic, prognostic, orscreening marker Am. J. Epidemiol. 159 882–90
[174] Ridker P M, Buring J E, Rifai N and Cook N R 2007Development and validation of improved algorithms forthe assessment of global cardiovascular risk in women: theReynolds risk score JAMA 297 611–9
[175] Dragonieri S et al 2009 An electronic nose in thediscrimination of patients with asthma and controlsJ. Allergy Clin. Immunol. 120 856–62
[176] Fens N, Zwinderman A H, van der Schee M P, de Nijs S B,Dijkers E, Roldaan A C, Cheung D, Bel E H and Sterk P J2009 Exhaled breath profiling enables discrimination ofchronic obstructive pulmonary disease and asthma Am. J.Respir. Crit. Care Med. 180 1076–82
21
Related Documents