The utility of auxiliary data for survey response modeling: Evidence from the German Internet Panel Carina Cornesse, University of Mannheim and GESIS – Leibniz Institute for the Social Sciences, Germany How to cite this article : How to cite this article : Cornesse, C. (2020), The utility of auxiliary data for survey response modeling: Evidence from the German Internet Panel in Survey Methods: Insights from the Field, Special issue: ‘Fieldword Monitoring Strategies for Interviewer-Administered Surveys’. Retrieved from https://surveyinsights.org/?p=11849. DOI : DOI : 10.13094/SMIF-2020-00008 Copyright : Copyright : © the authors 2020. This work is licensed under a Creative Commons Attribution 4.0 International License (CC BY 4.0) Abstract : Abstract : Auxiliary data are becoming more important as nonresponse rates increase and new fieldwork monitoring and respondent targeting strategies develop. In many cases, auxiliary data are collected or linked to the gross sample to predict survey response. If the auxiliary data have high predictive power, the response models can meaningfully inform survey operations as well as post-survey adjustment procedures. In this paper, I examine the utility of different sources of auxiliary data (sampling frame data, interviewer observations, and micro-geographic area data) for modeling survey response in a probability- based online panel in Germany. I find that the utility of each of these data sources is challenged by a number of concerns (scarcity, missing data, transparency issues, and high levels of aggregation) and that none of the auxiliary data are associated with survey response to any substantial degree. 1. Introduction In light of decreasing survey response rates and rising concerns about nonresponse bias and cost efficiency, auxiliary data have become popular in survey methodological research in recent years. Auxiliary data are typically external to the survey data collected and, for most operational purposes, need to be available for both respondents and nonrespondents (Sinibaldi et al., 2014). Generally, auxiliary data can be used for a number of survey operational tasks, such as eligibility screening and fieldwork monitoring, as well as post-survey nonresponse adjustments, such as weighting and imputations. Because of the current high demand for auxiliary data, there is progress in collecting more of such data and making them available to secondary data users (e.g., in the European Social Survey (ESS, 2012) and in the Health and Retirement Study (HRS, 2014)). In addition, some official institutions and commercial vendors provide aggregated auxiliary data that can be linked to survey data. Most approaches to using auxiliary data for nonresponse research rely on the assumption that the data are of high quality (i.e., error-free) and predictive of survey response (and, for many purposes, key survey variables; Olson, 2013). This stands in contrast to the literature on auxiliary data that indicates potential errors in the auxiliary data as well as low predictive power. This paper contributes to the survey methodological literature on auxiliary data by exploring the utility of

Welcome message from author
This document is posted to help you gain knowledge. Please leave a comment to let me know what you think about it! Share it to your friends and learn new things together.
Transcript

The utility of auxiliary data for survey responsemodeling: Evidence from the German Internet Panel
Carina Cornesse, University of Mannheim and GESIS – Leibniz Institute for the Social Sciences,Germany
How to cite this article : How to cite this article : Cornesse, C. (2020), The utility of auxiliary data for survey responsemodeling: Evidence from the German Internet Panel in Survey Methods: Insights from the Field, Specialissue: ‘Fieldword Monitoring Strategies for Interviewer-Administered Surveys’. Retrieved fromhttps://surveyinsights.org/?p=11849.
DOI : DOI : 10.13094/SMIF-2020-00008
Copyright : Copyright : © the authors 2020. This work is licensed under a Creative Commons Attribution 4.0International License (CC BY 4.0)
Abstract : Abstract : Auxiliary data are becoming more important as nonresponse rates increase and new fieldworkmonitoring and respondent targeting strategies develop. In many cases, auxiliary data are collected orlinked to the gross sample to predict survey response. If the auxiliary data have high predictive power,the response models can meaningfully inform survey operations as well as post-survey adjustmentprocedures. In this paper, I examine the utility of different sources of auxiliary data (sampling frame data,interviewer observations, and micro-geographic area data) for modeling survey response in a probability-based online panel in Germany. I find that the utility of each of these data sources is challenged by anumber of concerns (scarcity, missing data, transparency issues, and high levels of aggregation) and thatnone of the auxiliary data are associated with survey response to any substantial degree.
1. Introduction
In light of decreasing survey response rates and rising concerns about nonresponse bias and costefficiency, auxiliary data have become popular in survey methodological research in recent years.Auxiliary data are typically external to the survey data collected and, for most operational purposes, needto be available for both respondents and nonrespondents (Sinibaldi et al., 2014). Generally, auxiliary datacan be used for a number of survey operational tasks, such as eligibility screening and fieldworkmonitoring, as well as post-survey nonresponse adjustments, such as weighting and imputations.
Because of the current high demand for auxiliary data, there is progress in collecting more of such dataand making them available to secondary data users (e.g., in the European Social Survey (ESS, 2012) andin the Health and Retirement Study (HRS, 2014)). In addition, some official institutions and commercialvendors provide aggregated auxiliary data that can be linked to survey data.
Most approaches to using auxiliary data for nonresponse research rely on the assumption that the dataare of high quality (i.e., error-free) and predictive of survey response (and, for many purposes, key surveyvariables; Olson, 2013). This stands in contrast to the literature on auxiliary data that indicates potentialerrors in the auxiliary data as well as low predictive power.
This paper contributes to the survey methodological literature on auxiliary data by exploring the utility of

different sources of such data in the context of the recruitment of a probability-based online panel inGermany. First, I provide an overview of the existing literature on auxiliary data and discuss theadvantages and disadvantages of the data sources that were available for my study. Then, I explorewhether auxiliary variables are systematically missing by survey response, whether they are significantlyassociated with survey response, and what their predictive power is in survey response models.
2. Uses and usefulness of auxiliary data2. Uses and usefulness of auxiliary data
Auxiliary data are used for multiple purposes, many of which involve predicting survey response. Oneapplication that has been developed in recent years is model-based representativeness measures such asR-Indicators (Schouten et al., 2009), balance indicators (Särndal, 2011), or the Fraction of MissingInformation (Wagner, 2010). These representativeness measures can be reported and compared acrosssurveys or experimental fieldwork conditions after data collection to provide data users with backgroundinformation on survey data quality (Schouten et al., 2012).
In addition to measuring representativeness after data collection, auxiliary data can be used for fieldworkmonitoring during data collection. The National Survey of Family Growth, for instance, has integratedauxiliary data into their fieldwork monitoring dashboard (Kirgis and Lepkowski, 2010). This allows them todetect potential problems (e.g., high numbers of locked buildings in certain areas) on a daily basis and tointervene quickly if necessary. Auxiliary data can also be used to monitor whether the samplerepresentativeness is compromised during fieldwork, so that steps can be taken to rebalance the sample(e.g., by case-prioritization) before the fieldwork phase ends (Schouten, Shlomo, and Skinner, 2011).
A related form of auxiliary data usage occurs in responsive or adaptive survey designs (Groves andHeeringa, 2006; Wagner, 2008). The idea behind these approaches is that subgroups of the gross samplereceive different survey designs depending – at least to some extent – on their response propensity asmodeled using auxiliary data. Usually, the most important goal is to reduce variation in responsepropensities across subgroups of the gross sample. Many survey design features can be varied to reachthis goal, including the survey mode or the timing of contact attempts (Schouten et al., 2013).
In a large-scale study on multiple surveys, Schouten et al. (2016) find that responsive design approachescan reduce nonresponse bias as measured by model-based representativeness measures. Similarly,Wagner et al. (2012) find that responsive design approaches based on the auxiliary data from the NSFGincrease response rates among the formerly underrepresented subgroups of the sample, leading, asintended, to lower variation in response propensities across subgroups.
Another prominent application of auxiliary data is nonresponse adjustment weights (Olson, 2013), wherecases are weighted by their inverse response propensity as calculated from a logistic regression model.Olson (2013) defines a useful auxiliary variable for nonresponse weighting as a variable that is associatedwith survey response as well as substantive survey variables of interest. This is in line with research byLittle and Vartivarian (2005), who, in a simulation study, confirmed the importance of the associationsbetween auxiliary variables and both survey response and substantive variables for creating successfulnonresponse adjustments.
In an observational study on the added value of auxiliary data for the development of nonresponseadjustment weights, Kreuter et al. (2010) find that some of the available auxiliary data were useful fornonresponse adjustments while others were not. In line with Olson (2013) and Little and Vartivarian(2005), Kreuter et al. (2010) find that the auxiliary variables that were useful for nonresponse
adjustments were the ones that were associated with both survey response and substantive surveyvariables while the auxiliary variables that were not useful showed no such associations.
3. Types of auxiliary data and their quality3. Types of auxiliary data and their quality
Several types of auxiliary data are used in survey research and practice. The most commonly used typesare sampling frame data, interviewer observations, and linked micro-geographic area data. In thefollowing, I describe these types of auxiliary data and discuss findings from the literature about theirquality.
Sampling frame data are typically available in probability-based surveys, where they describe all units inthe gross survey sample. In theory, sampling frame data exist for all units on a frame. However, inpractice, researchers only have access to information on the units that were actually drawn into the grosssample. Sometimes sampling frames contain a lot of information, e.g., when the sample is drawn from aregister. In some countries, population registers may include detailed individual information, like age,gender, ethnic background, household composition, employment history, education history, and income.In other countries, however, the sampling frame data may be limited to broad regional information. In theliterature, sampling frame data are commonly used for measuring representativeness (Schouten et al.,2009), as well as fieldwork monitoring (Schouten, Shlomo, and Skinner, 2011) and nonresponseadjustment (Kreuter et al., 2010). However, there is very little research on the quality of sampling framedata (Hall, 2008).
Interviewer observations contain information about all sample units in the gross sample. This informationis recorded by interviewers during fieldwork (Olson, 2013). Commonly collected interviewer observationsinclude reports about access impediments to the sample unit’s house (e.g., closed gates) and the type ofhousing unit in which the sample unit lives (e.g., single house, terraced house, apartment block, or farm;West & Kreuter, 2013). Depending on the survey, collected interviewer observations may also includeinterviewer assessments about the volume of traffic and public transportation stops near the housing unit(e.g., in the HRS; HRS, 2014) or interviewers’ guesses about the presence of children in a sampledhousehold or whether the sample units are sexually active (e.g., in the NSFG; West, 2010).
Some studies evaluate the quality of interviewer observations. One finding from this research is thatmissing data rates can vary greatly across surveys and are often rather high. Matsuo et al. (2010), forexample, find that in the ESS, the missing data rates for the interviewer observations range from 0.00% inRussia to 40.01% in Germany. Other researchers find that interviewer observations are prone tointerviewer effects (see Olson, 2013). This is especially the case when the measures collected leave roomfor interpretation because interviewers can perceive the objects that they observe differently(Raudenbush & Sampson, 1999). West and Kreuter (2013), for example, show that in the NSFG, theaccuracy of the interviewer observations about the presence of children in the household varies byinterviewer experience.
The contribution of interviewer observations to nonresponse adjustments is unclear. West, Kreuter, andTrappmann (2014), for example, find that using interviewer observations in nonresponse adjustmentweights hardly has any impact on substantive survey estimates. The authors suspect that this is due tothe low predictive power of the interviewer observations in modeling survey response. However, Sinibaldiet al. (2014) find that interviewer observations were more successful than linked commercial micro-geographic area data in predicting primary substantive survey outcomes and were, therefore, bettersuited to inform nonresponse adjustment weighting.

Micro-geographic area data are linked to the survey data from external (official or commercial) sourcesand contain aggregated information that describe all sample units’ environments. Typical data from suchsources include aggregate measures of income or purchasing power in each area, household compositionin terms of socio-demographics, and the ethnic or religious composition of the neighborhood (West et al.,2015). These data can often be purchased from commercial marketing vendors, such as Microm(www.microm.de) in Germany, Experian (www.experian.co.uk) and TransUnion (www.transunion.co.uk) inthe UK, and MSG (www.m-s-g.com) and Aristotle International Inc. (www.aristotle.com) in the US. Micro-geographic area data are also provided by some official institutions, such as the Federal Institute forResearch on Building, Urban Affairs and Spatial Development (BBSR) in Germany, the Office for NationalStatistics (ONS) in the UK, and the Census Bureau in the US.
Micro-geographic area data are most commonly used in nonresponse adjustment weighting. Theliterature, however, shows that micro-geographic area data usually correlate little with survey response(West et al., 2015) and are, therefore, not useful in nonresponse adjustment procedures (Biemer &Peytchev, 2013). However, some studies show that the inclusion of micro-geographic area data innonresponse adjustment weights can lead to shifts in survey estimates, especially when there is at least amoderate association with substantive survey variables (Kreuter et al., 2010).
A potential disadvantage of the commercial micro-geographic area data is that they have been found tobe prone to errors. In a study on the quality of commercial marketing data, Pasek et al. (2014), find thatthese data were often inaccurate and systematically incomplete. The authors also point to transparencyproblems with commercial data: “Because these data are of considerable value to the private companiesthat aggregate them […] social scientists seem unlikely to gain a full picture” (p. 912). In addition, Westet al. (2015) find only a weak agreement between identical variables in the data purchased from twodifferent commercial data vendors. However, the authors conclude that buying micro-geographic areadata might be a good investment for some survey operational tasks, such as eligibility screening, but lessso when it comes to nonresponse weighting.
4. Data and methods4. Data and methods
In my analyses, I explore the potential of sampling frame data, interviewer observations, and micro-geographic area data for modeling survey response across the recruitment stages of the GIP. In thissection, I describe the survey data, auxiliary data, and analysis methods used in the study.
4.1 The German Internet Panel (GIP)4.1 The German Internet Panel (GIP)
The GIP is a probability-based online panel of the general population with bi-monthly panel waves onmultiple topics in the social sciences (Blom, Gathmann, Krieger, 2015). It is based on a three-stagestratified probability area sample, where areas in Germany are first sampled, then all addresses are listedwithin the sampled areas, and, finally, a sample of households is drawn from the address lists.
The GIP recruitment was conducted in two phases: a face-to-face recruitment interview and a subsequentonline profile survey. All age-eligible household members in a household that participated in therecruitment interview were invited to participate in the subsequent online panel waves. Households thatdid not have access to the Internet or Internet-enabled devices were provided with the necessaryequipment (Blom et al., 2017). A person was considered an online panel member from the moment thatthey filled out the first online survey, which contained questions on the participants’ personal profile,

including socio-demographic characteristics and key substantive survey variables.
The GIP sampling and recruitment design have consequences for the availability of auxiliary data. Forexample, since the GIP samples from address lists, the sample members’ addresses can be linked tomicro-geographic area data, an advantage that would be lacking if, for example, the sampling framecontained telephone numbers instead of addresses. In addition, the GIP face-to-face recruitmentinterviews make it possible to collect interviewer observations, which would not have been available if, forexample, the survey recruitment had been done by postal mail.
The GIP recruited new panel members in 2012 and 2014. Because the samples were drawn independentlyof each other and the sampling and recruitment procedures were almost identical, I pool the two samplesin my analyses. I conduct all analyses separately for the face-to-face recruitment interview and the onlineprofile survey in order to investigate whether auxiliary data are associated with survey response in one,both or neither of the two recruitment steps. The pooled gross sample consists of 13,893 eligiblehouseholds. 50.16% of the gross sample participated in the recruitment interview and 21.23% of thegross sample participated in the profile survey.
4.2 The auxiliary data
The auxiliary data used in the analyses stem from various sources. Table 1 provides an overview of theauxiliary variables, a brief description of the data, and the percentage of missing data in each variable.
Table 1: Overview of the auxiliary data, including a brief description of the data and theTable 1: Overview of the auxiliary data, including a brief description of the data and thepercentage of missing data in each variablepercentage of missing data in each variable

4.2.1 Sampling frame data
The sampling frame data in my analyses are official data from the area database from which the GIPprimary sampling units are drawn. I use all the data that were available in the sampling frame. Thesampling frame data include the geographic region (East versus West), the degree of urbanityoperationalized as administrative districts [1] (less than 50,000 inhabitants, 50,000 to 500,000inhabitants, more than 500,000 inhabitants), and the degree of urbanity operationalized as politicalgovernmental districts [2] (less than 20,000 inhabitants, 20,000 to 100,000 inhabitants, more than100,000 inhabitants). The two urbanity variables measure population density in differently defined

geographic areas. The sampling frame variables have no missing data.
4.2.2 Interviewer observations
The interviewers recorded fieldwork observations during the face-to-face recruitment interview. Theinterviewers were instructed to record observations in the contact forms for all households in the grosssample, so that the data are available for the respondents and nonrespondents. I use all the interviewerobservations available from the panel recruitment process. The data include the presence of an intercom(yes, no), the type of building (single housing unit, apartment building), the building condition (bad,moderate, good), and the social class of the sampled household (low, middle, high).
These interviewer characteristics vary in the degree with which the interviewer can judge themobjectively. While the presence of an intercom can usually be assessed objectively, it is unclear howinterviewers can objectively determine the social class of sample units, especially in cases where theinterviewer might never have seen the inhabitants of a house (i.e., for part of the nonrespondents). Thereis a substantial amount of missing data on all of the interviewer observations in the GIP, ranging from5.12% on the type of building to 9.23% on social class.
4.2.3 Microm data
Microm data are micro-geographic area data provided by Microm Consumer Marketing, a commercial datavendor. The Microm data were linked to the sampled addresses of the GIP and are based on a variety ofcommercial and official sources, such as telecommunication providers and the German FederalEmployment Agency. In the documentation of the data provided by Microm, there is little information onthe data sources and aggregation procedures [3]. I use all the Microm data that were available and forwhich the data documentation provided, at the minimum, some hints about where the data might comefrom and how they might have been collected. For example, the data on the unemployment rate arereported to be provided by the German Federal Employment Agency while an “exclusive livingenvironment” is reported to be determined by whether there are people in economic leadership positionsin the neighborhood, although it is not specified how these economic leadership positions are defined andmeasured [3].
The variables I use in the analyses are the unemployment rate (continuous), exclusive living environment(yes, no), percentage of academics (continuous), number of households in the street (continuous),percentage of home ownership (continuous), percentage of Roman Catholics (continuous), andpercentage of Protestants (continuous). Two of the variables are aggregated to up to four buildings(exclusive living environment and percentage of academics), two variables are aggregated to the streetlevel (number of households and percentage of homeownership), two variables are aggregated to themunicipality-level (percentage of Roman Catholics and percentage of Protestants), and one variable isaggregated to the postal-code-level (unemployment rate).
While it would have been desirable to include more micro-geographic area data (e.g., the percentage ofMuslims in an area [i.e., not only the percentage of Roman Catholics and Protestants]), such data werenot available in the dataset from the data vendor.
There is a small to moderate amount of missing data on the Microm data, ranging between 0.01% on thepercentage of Roman Catholics as well as the percentage of Protestants and 3.22% on exclusive livingenvironment as well as the percentage of academics. Unfortunately, the data vendor did not provide anydocumentation on why item missingness occurs in the data.
4.2.4 INKAR data
INKAR (Indicators and Maps for City and Spatial Research; Bundesinstitut für Bau-, Stadt- undRaumforschung, 2015) data are official micro-geographic area data aggregated to the municipality-level.They are predominantly based on the German Census and German Mikrozensus and can be downloadedfree of charge from an Internet platform (see www.inkar.de) that is run by the German Federal Institutefor Research on Building, Urban Affairs, and Spatial Development (BBSR) of the German Federal Office forBuilding and Regional Planning (BBR). The documentation of the data provides rich information on thedata sources and adjustments. I use a selection of the INKAR data that were available on the municipalitylevel, concerned people (rather than, for example, businesses or real estate), and that can generally beexpected to be associated with survey response. The variables I used are the percentage of small childrenaged 0 to 5 (continuous), the total balance of people that move to or from the district (continuous), thepercentage of immigrants (continuous), and the aggregate household income (continuous). Respectively,these variables operationalize the presence of small children, geographic mobility, immigration, andincome, all of which have commonly been found to be associated with survey response at the individuallevel (e.g. Groves et al., 2011). There is no missing data on any of the INKAR data.
4.3 Methods4.3 Methods
The analyses start with an examination of the quality of the auxiliary data in terms of item missingness.For each auxiliary variable, I examine whether there are significant differences between GIP respondentsand nonrespondents regarding the proportion of missing values using Chi2-statistics.
After assessing missingness on the auxiliary data, I evaluate the utility of the different types of auxiliarydata for predicting survey response: I explore the extent to which each auxiliary variable is associatedwith survey response using Pearson’s correlation as calculated from bivariate logistic regression models. Ithen estimate multivariate logistic survey response models. In these survey response models, I onlyinclude those auxiliary variables as independent variables that were statistically significantly associatedwith survey response in the bivariate analyses. Before including the auxiliary variables in the multivariatesurvey response models, I checked that there was no multicollinearity (i.e. that associations between theauxiliary variables as measured using Pearson’s correlation were all below 0.8).
To differentiate between the utility of the auxiliary variables in each panel recruitment step, I conductseparate analyses for the face-to-face recruitment interview and the subsequent online profile survey.
5. Results5. Results
5.1 Missing data5.1 Missing data
Table 2 displays, for each GIP recruitment step, the proportion of missing values among respondents andnonrespondents on each of the variables that has at least some missing values. In addition, Table 2provides Chi2-statistics for the differences in the proportion of missing values among respondents andnonrespondents.
Table 2: Proportion of missing values and Chi2-statistics for the difference in proportion ofTable 2: Proportion of missing values and Chi2-statistics for the difference in proportion ofmissing values between respondents (R) and nonrespondents (NR), by auxiliary variable andmissing values between respondents (R) and nonrespondents (NR), by auxiliary variable andGIP recruitment step (degrees of freedom (df) and p-values in parentheses; sampling frameGIP recruitment step (degrees of freedom (df) and p-values in parentheses; sampling frame

data and INKAR data do not have any missing values)data and INKAR data do not have any missing values)
Overall, I find moderately large proportions of missing values on the interviewer observations as well asthe Microm data. In the recruitment interview, the proportion of missing values is significantly higher fornonrespondents than for respondents with regard to social class. In the profile survey, the proportion ofmissing values is significantly higher for nonrespondents than for respondents with regard to allinterviewer observations. The increase in significant differences across recruitment steps shows thatsample units for which interviewer observations are missing are more likely to drop out of the panel afterthe recruitment interview.
5.2 Associations with survey response5.2 Associations with survey response
Table 3 shows the association between each auxiliary variable and survey response at each GIPrecruitment step.

Table 3: Association of auxiliary variables with survey response, by auxiliary variable and GIPTable 3: Association of auxiliary variables with survey response, by auxiliary variable and GIPrecruitment step (Pearson’s correlation coefficients as calculated from bivariate logisticrecruitment step (Pearson’s correlation coefficients as calculated from bivariate logisticregression models)regression models)
Generally, I find that bivariate associations are small, ranging from 0.00 to 0.18. At the recruitmentinterview stage, no auxiliary variable is associated with survey response to any substantial degree (i.e.the correlation coefficients are smaller than 0.10). At the profile survey stage, only social class isassociated with survey response, although only weakly. Despite the fact that the bivariate associationsare small, a number of correlation coefficients are statistically different from 0 at a 95%-confidence level.
5.3 Predictive power in survey response models5.3 Predictive power in survey response models
Table 4 shows the results from the multivariate logistic regression models.
Table 4: Logistic regression models of auxiliary data on the propensity to respond in theTable 4: Logistic regression models of auxiliary data on the propensity to respond in the

recruitment interview and the profile survey of the GIP (models only include auxiliaryrecruitment interview and the profile survey of the GIP (models only include auxiliaryvariables that have been found to be significantly associated with survey response in thevariables that have been found to be significantly associated with survey response in thebivariate analyses reported in Table 3; coefficients are reported as logits, standard errors inbivariate analyses reported in Table 3; coefficients are reported as logits, standard errors inparentheses; reference categories in parentheses)parentheses; reference categories in parentheses)


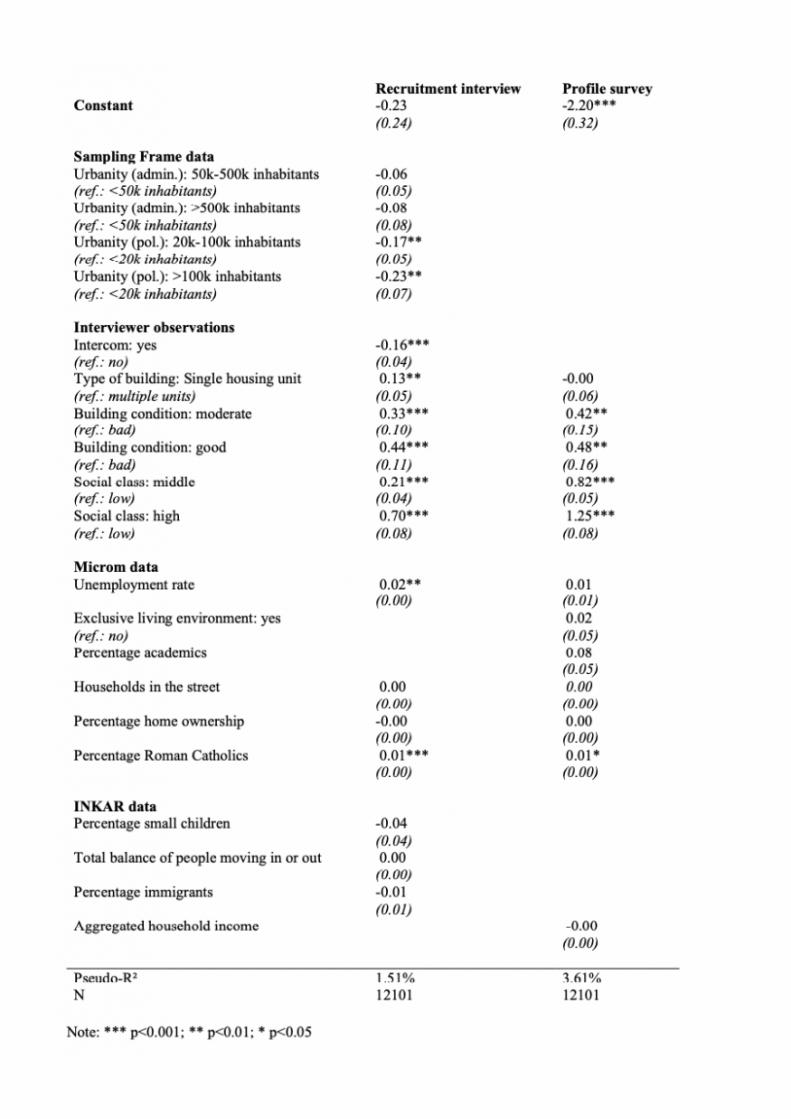
As Table 4 shows, the predictive power of the auxiliary data in the survey response models is low(Pseudo-R² of 1.51% at the recruitment interview and 3.61% at the profile survey). This is despite the factthat some of the regression coefficients are statistically significant at one or both of the recruitmentstages.
6. Discussion6. Discussion
This study assessed the utility of auxiliary data for survey response modeling in the recruitment of theGIP, a probability-based online panel in Germany. The auxiliary data I examined were sampling framedata, interviewer observations, and commercial as well as official micro-geographic area data. Generally, Ifound that all of the examined auxiliary data have problems. The sampling frame data are limited to a fewgeographic characteristics, the interviewer observations contain relatively high proportions of missingvalues and the missingness is systematically related to survey response, the Microm data areinsufficiently transparent, and both the Microm data and the INKAR data are aggregated to a high level.Nearly none of the auxiliary variables is substantially associated with survey response. The potential ofthe auxiliary data examined in this study for survey response modeling can therefore be considered to belimited.
There are a number of potential explanations for the lack of association between the auxiliary data andsurvey response in the GIP recruitment. One reason might be a lack in auxiliary data quality. If the datahad been available on a less aggregated level and without systematically missing data, for example, theymight have been able to meaningfully contribute to survey response modeling. A second explanationmight be that the available auxiliary data are indeed not associated with survey response and that othertypes of auxiliary data would be necessary to model survey response in the GIP recruitment (e.g. votingbehavior or crime rates in the neighborhood). A third potential explanation might be that the samplingand recruitment processes of the GIP are so successful in generating a balanced panel sample that thereis no systematic difference between respondents and nonrespondents worth modeling. However, whilethe GIP is indeed successful in generating a balanced panel sample on a variety of populationcharacteristics (e.g., age and gender), there is some evidence of systematic misrepresentation on otherpopulation characteristics (e.g., education; see Cornesse, 2018).
Overall, the results from my analyses lead to the conclusion that the currently available auxiliary datashould be used with caution, because they are prone to data quality problems and might not be predictiveof survey response. These problems with the auxiliary data can compromise their utility in surveyoperational tasks and adjustment procedures. My study shows that concerns about quality and predictivepower of auxiliary data are justified and that the problems apply to a variety of commonly used types ofauxiliary data. I, therefore, conclude from this research that the search for high-quality auxiliary data thatis useful for survey response modeling needs to continue.
[1] BIK; see https://www.bik-gmbh.de/cms/basisdaten/bik-regionen for more information
[2] GKPOL; seehttps://www.bbsr.bund.de/BBSR/DE/Raumbeobachtung/Raumabgrenzungen/deutschland/gemeinden/StadtGemeindetyp/StadtGemeindetyp_node.html for more information
Related Documents


