The Pennsylvania State University The Graduate School College of Agricultural Sciences THE USE OF SORGHUM, OAT, WHEAT, TRITICALE, AND PEARL MILLET SILAGES IN LACTATING DAIRY COW DIETS A Dissertation in Animal Science by Michael Thomas Harper 2018 Michael Thomas Harper Submitted in Partial Fulfillment of the Requirements for the Degree of Doctor of Philosophy May 2018

Welcome message from author
This document is posted to help you gain knowledge. Please leave a comment to let me know what you think about it! Share it to your friends and learn new things together.
Transcript

The Pennsylvania State University
The Graduate School
College of Agricultural Sciences
THE USE OF SORGHUM, OAT, WHEAT, TRITICALE, AND PEARL MILLET
SILAGES IN LACTATING DAIRY COW DIETS
A Dissertation in
Animal Science
by
Michael Thomas Harper
2018 Michael Thomas Harper
Submitted in Partial Fulfillment
of the Requirements
for the Degree of
Doctor of Philosophy
May 2018

The dissertation of Michael Thomas Harper was reviewed and approved* by the following:
Alexander N. Hristov
Professor of Dairy Nutrition
Dissertation Advisor
Chair of Committee
Gregory W. Roth
Professor of Agronomy
Associate Department Head of Agronomy
Kevin J. Harvatine
Associate Professor of Nutritional Physiology
Marvin H. Hall
Professor of Forage Management
Terry Etherton
Distinguished Professor of Animal Nutrition
Head of the Department of Animal Science
*Signatures are on file in the Graduate School

iii
ABSTRACT
Cropping decisions are important to the economic and environmental
sustainability of dairy farms. Being able to feed alternative forage silages in addition to
corn silage and alfalfa haylage to lactating dairy cows may increase the resilience of dairy
farms.
A series of 3 experiments were conducted to investigate the effects of partially
replacing corn silage with the following alternative forage silages (AFS): brown midrib
dwarf forage sorghum (Sorghum bicolor L. Moench)) or fall grown oat (Avena sativa L.)
silages (Exp. 1), winter wheat (Triticum aestivum L.) or triticale (X Triticosecale) silages
(Exp. 2), or brown midrib dwarf pearl millet (Pennisetum glaucum L.) silage (Exp. 3)
The AFS were included at 10% of the diet dry matter of lactating dairy cows. The
experiments investigated the effect on dry matter intake, milk yield, milk components and
fatty acid profile, apparent total-tract nutrient digestibility, N utilization, and enteric
methane emissions. Additionally, we analyzed the in situ dry matter and neutral detergent
fiber disappearance of the AFS vs corn silage and alfalfa haylage. Sorghum was grown
in the summer and harvested in the milk stage. Oat was grown in the fall and harvested in
the boot stage. Wheat and triticale were planted in the fall as cover crops and harvested in
the spring at the boot stage. Pearl millet was harvested at the flag leaf visible stage. Corn
was harvested at one half milkline. All forages were ensiled. Neutral detergent fiber and
acid detergent fiber concentrations were higher in all AFS than in corn silage. Lignin
concentrations were less consistent with sorghum, wheat, and triticale silages having
higher lignin content than the corn silage, while the oat and pearl millet silages had lignin

iv
concentrations similar to that of corn silage. All AFS had < 1% starch compared with ≥
35% starch in corn silage.
Experiments 1 and 2 were replicated 3 × 3 Latin square design experiments with
3, 28-d periods and 12 lactating Holstein cows. The control diets contained 44% (DM
basis) corn silage for both experiments. Experiment 3 was a crossover design experiment
with 2 periods of 28 d each and 17 lactating Holstein cows. The control diet for
experiment 3 contained 50% (DM basis) corn silage.
In experiment 1, sorghum silage inclusion decreased dry matter intake, milk yield,
and milk protein content, but increased milk fat and maintained energy corrected milk
yield similar to the control. Oat silage had no effect on dry matter intake, milk yield or
components compared with the control. The oat silage diet increased apparent total-tract
digestibility of dietary nutrients, except starch, whereas the sorghum diet slightly
decreased digestibility. Cows consuming the oat silage diet had higher milk urea N and
urinary urea N concentrations. Milk N efficiency was decreased by the sorghum diet.
Diet did not affect enteric methane emissions. This study showed that oat silage can
partially replace corn silage at 10% of the diet DM with no effect on milk yield, but BMR
sorghum silage harvested at the milk stage with < 1% starch will decrease dry matter
intake and milk yield in dairy cows.
In experiment 2, dry matter intake was not affected by diet, but both wheat and
triticale silage decreased yields of milk (41.4 and 41.2 vs 42.7 kg/d) and milk
components, compared with corn silage. Milk fat from cows fed the wheat and triticale
diets contained higher concentrations of 4:0, 6:0, and 18:0 and tended to have lower

v
concentrations of total trans fatty acids. Apparent total-tract digestibility of DM and
organic matter was decreased in the wheat silage diet, and digestibility of neutral-and
acid-detergent fiber was increased in the triticale silage diet. The wheat and triticale
silage diets resulted in higher excretion of urinary urea, higher milk urea N, and lower
milk N efficiency, compared with the corn silage diet. Enteric CH4 emission per kg of
energy corrected milk was highest in the triticale silage diet. This study showed that, at
milk production of around 42 kg/d, wheat silage and triticale silage can partially replace
corn silage DM and not affect dry matter intake, but milk yield may decrease slightly.
In experiment 3, diet did not affect dry matter intake or energy corrected milk
yield, which averaged 46.7 kg/d. The pearl millet silage diet tended to increase milk fat
concentration, had no effect on milk fat yield, and increased milk urea N. Concentrations
and yields of milk protein and lactose were not affected by diet. Apparent total-tract
digestibility of DM decreased from 66.5% in the control diet to 64.5% in the pearl millet
silage diet. Similarly, organic matter and crude protein digestibility was decreased by
pearl millet silage, whereas neutral- and acid-detergent fiber digestibility was increased.
Total milk trans fatty acid concentration was decreased by pearl millet silage with a
particular decrease in trans-10 18:1. Urinary urea and fecal N excretion increased with
pearl millet silage compared with corn silage. Milk N efficiency decreased with pearl
millet silage. Pearl millet silage increased enteric methane emission from 396 to 454
g/cow/d and increased methane yield and intensity. Substituting corn silage with brown
midrib dwarf pearl millet silage at 10% of the diet dry matter supported high milk
production in dairy cows.
vi
Overall, the alternative forages fed in these experiments had fiber of greater
digestibility than the corn silage they replaced. However, AFS dry matter was less
digestible than corn silage due to the lower starch content and milk yields were
decreased. Alternative forages have the potential to increase dairy farm resilience in part
because of their varied use of water and nutrients and their positive effects on soil health,
including reducing soil erosion and increasing soil organic matter. Alternative forages
can be excellent forages for farms that need more forage fiber to feed more cows or
desire more highly digestible forage fiber for higher producing cows.
Keywords: forage, brown midrib, dairy cow, sorghum silage, oat silage, wheat
silage, triticale silage, pearl millet silage

vii
TABLE OF CONTENTS
List of Figures .......................................................................................................................... x
List of Tables ........................................................................................................................... xi
Abbreviations ........................................................................................................................... xiii
Acknowledgements .................................................................................................................. xiv
Chapter 1 Introduction ............................................................................................................. 1
References ........................................................................................................................ 6
Chapter 2 Literature Review .................................................................................................... 10
Role of forages in a dairy cow ration ............................................................................... 10 Importance of highly digestible fiber from forages ......................................................... 10 Warm Season Annual Forages ......................................................................................... 12
Sorghum ................................................................................................................... 12 Pearl Millet ............................................................................................................... 18
Cool Season Annual Forages ........................................................................................... 21 Oats .......................................................................................................................... 21 Wheat and Triticale .................................................................................................. 24 Other Alternative Forages ........................................................................................ 27
References ........................................................................................................................ 29
Chapter 3 Using brown midrib 6 dwarf forage sorghum silage and fall grown oat silage in
lactating dairy cow rations. .............................................................................................. 35
ABSTRACT ..................................................................................................................... 35 INTRODUCTION ........................................................................................................... 37 MATERIALS AND METHODS ..................................................................................... 39
Crops and Silages ..................................................................................................... 39 Animals and Diets .................................................................................................... 41 Sampling and Analyses ............................................................................................ 42 In Situ ....................................................................................................................... 45 Income Over Feed Costs .......................................................................................... 47 Statistical Analysis ................................................................................................... 48
RESULTS AND DISCUSSION ...................................................................................... 49 CONCLUSIONS .............................................................................................................. 63 ACKNOWLEDGEMENT ............................................................................................... 64 REFERENCES................................................................................................................. 64
Chapter 4 Inclusion of wheat and triticale silage in the diet of lactating dairy cows ............... 81
ABSTRACT ..................................................................................................................... 81

viii
INTRODUCTION ........................................................................................................... 83 MATERIALS AND METHODS ..................................................................................... 85
Crops and Silages ..................................................................................................... 85 Animals and Diets .................................................................................................... 86 Sampling and Analyses ............................................................................................ 87 In Situ ....................................................................................................................... 91 Income Over Feed Costs .......................................................................................... 92 Statistical Analysis ................................................................................................... 93
RESULTS AND DISCUSSION ...................................................................................... 94 Forages ..................................................................................................................... 94 Dry Matter Intake and Milk Yield ............................................................................ 95 Milk Composition and Yield .................................................................................... 97 Milk Fatty Acid ........................................................................................................ 97 Nutrient Intake and Digestibility .............................................................................. 98 In Situ ....................................................................................................................... 99 N Utilization ............................................................................................................. 100 Enteric CH4 and CO2 Emissions............................................................................... 101 Income Over Feed Cost ............................................................................................ 102
CONCLUSIONS .............................................................................................................. 103 ACKNOWLEDGEMENT ............................................................................................... 104 REFERENCES................................................................................................................. 104
Chapter 5 Inclusion of brown midrib dwarf pearl millet silage in the diet of lactating
dairy cows. ....................................................................................................................... 120
ABSTRACT ..................................................................................................................... 120 INTRODUCTION ........................................................................................................... 122 MATERIALS AND METHODS ..................................................................................... 124
Crops and Silages ..................................................................................................... 124 Animals and Diets .................................................................................................... 125 Sampling and Analyses ............................................................................................ 126 In Situ DM and NDF Degradation ........................................................................... 130 Statistical Analysis ................................................................................................... 131
RESULTS AND DISCUSSION ...................................................................................... 132 Forages ..................................................................................................................... 132 Dry Matter Intake, Body Weight, and Milk Yield ................................................... 133 Milk Composition and Yield .................................................................................... 134 Nutrient Intake and Digestibility .............................................................................. 135 Milk Fatty Acid ........................................................................................................ 136 In Situ DM and NDF Degradation ........................................................................... 137 N Utilization ............................................................................................................. 139 Enteric Methane and Carbon Dioxide Emissions ..................................................... 140
CONCLUSIONS .............................................................................................................. 141 ACKNOWLEDGEMENT ............................................................................................... 141 REFERENCES................................................................................................................. 142
Chapter 6 Conclusions and Future Research ........................................................................... 159
Conclusions ...................................................................................................................... 159

ix
Future Research ................................................................................................................ 161 Appendix Indigestible NDF1 of various ensiled forages ................................................. 163

x
LIST OF FIGURES
Figure 3-1. Ruminal in situ DM disappearance of forage sources. .......................................... 79
Figure 3-2. Ruminal in situ NDF disappearance of forage sources. ........................................ 80
Figure 4-1. Ruminal in situ DM disappearance of forage sources. .......................................... 118
Figure 4-2. Ruminal in situ NDF disappearance of forage sources. ........................................ 119
Figure 5-1. Ruminal in situ DM disappearance of forage sources. .......................................... 157
Figure 5-2. Ruminal in situ NDF disappearance of forage sources. ........................................ 158

xi
LIST OF TABLES
Table 3-1. Ingredient and chemical composition of the diets fed in the experiment ............... 70
Table 3-2. Nutrient composition and fermentation profile of oat and sorghum silages (%
of DM or as indicated)1 .................................................................................................... 72
Table 3-3. Ruminal in situ DM and NDF degradability of ensiled forages1 ............................ 73
Table 3-4. Effect of oat and sorghum silage on DMI, milk production, and feed efficiency
in lactating dairy cows ..................................................................................................... 74
Table 3-5. Effect of oat and sorghum silage on milk fatty acid composition (g/100 g of
total fatty acids) in lactating dairy cows .......................................................................... 75
Table 3-6. Effect of oat and sorghum silage on nutrient intake and apparent total-tract
digestibility in lactating dairy cows ................................................................................. 77
Table 3-7. Effect of oat and sorghum silage on nitrogen utilization, urinary purine
derivatives and carbon dioxide (CO2) and methane (CH4) emissions1 in lactating
dairy cows ........................................................................................................................ 78
Table 4-1. Ingredient and chemical composition of the diets fed in the experiment ............... 109
Table 4-2. Nutrient composition and fermentation profile of triticale and wheat silages (%
of DM or as indicated)1 .................................................................................................... 111
Table 4-3. Effect of triticale and wheat silage on DMI, milk production, and feed
efficiency in lactating dairy cows .................................................................................... 112
Table 4-4. Effect of triticale and wheat silage on milk fatty acid composition (g/100 g of
total fatty acids) in lactating dairy cows .......................................................................... 113
Table 4-5. Effect of triticale and wheat silage on nutrient intake and apparent total-tract
digestibility in lactating dairy cows ................................................................................. 115
Table 4-6. Effect of triticale and wheat silage on nitrogen utilization and urinary purine
derivatives in lactating dairy cows ................................................................................... 116
Table 4-7. Effect of triticale and wheat silage on carbon dioxide (CO2) and methane
(CH4) emissions1 in lactating dairy cows ......................................................................... 117
Table 5-1. Ingredient and chemical composition of the diets fed in the experiment ............... 148
Table 5-2. Nutrient composition and fermentation profile of pearl millet and corn silages
(% of DM or as indicated)1 .............................................................................................. 150
Table 5-3. Effect of pearl millet silage on DMI, milk production, and feed efficiency in
lactating dairy cows ......................................................................................................... 151

xii
Table 5-4. Effect of pearl millet silage on nutrient intake and apparent total-tract
digestibility in lactating dairy cows ................................................................................. 152
Table 5-5. Effect of pearl millet silage on milk fatty acid composition (g/100 g of total
fatty acids) in lactating dairy cows ................................................................................... 153
Table 5-6. Effect of pearl millet silage on nitrogen utilization and urinary purine
derivatives in lactating dairy cows ................................................................................... 155
Table 5-7. Effect of pearl millet silage on carbon dioxide (CO2) and methane (CH4)
emissions1 in lactating dairy cows ................................................................................... 156

xiii
ABBREVIATIONS
ADF Acid Detergent Fiber
ADG Average Daily Gain
BMR Brown Midrib
BW Body Weight
CP Crude Protein
DIM Days in Milk
DM Dry Matter
DMD Dry Matter Digestibility
DMI Dry Matter Intake
ECM Energy Corrected Milk
ESC Ethanol Soluble Carbohydrates
FA Fatty Acid
FCM Fat Corrected Milk
FPCM Fat and Protein Corrected Milk
MUFA Mono-unsaturated Fatty Acid
NDF Neutral Detergent Fiber
NDFD Neutral Detergent Fiber Digestibility
NEL Net Energy for Lactation
OM Organic Matter
PUFA Poly-unsaturated Fatty Acid
peNDF Physically Effective Neutral Detergent Fiber
VFA Volatile Fatty Acid
WSC Water Soluble Carbohydrates
xiv
ACKNOWLEDGEMENTS
I am extremely grateful for the opportunity to learn and conduct research here in the
Department of Animal Science at The Pennsylvania State University. Divine providence brought
me to Dr. Alexander Hristov in the central parklet of State College on New Year’s Eve 2013. He
offered me a job as his lab tech and later decided to offer me a position as a PhD student. I am
very grateful for his ability to see potential in me that I did not even see in myself. He continued
to work with me over the past few years to develop me into the dairy nutritionist I am today. I
thank Dr. Greg Roth for his guidance from the agronomic side of working with alternative
forages. I thank Drs. Kevin Harvatine and Marvin Hall for their input into my research and
speaking with me on multiple occasions.
Many others have helped me in my work, thought, and character. Among them is Dr.
Joonpyo Oh. He has been an example to me of perseverance that is required for the unique
hardships that we face. Audino Melgar has always been a smiling face of encouragement. Dr.
Krum Nedelkov always kept safety first and showed me what a young animal scientist can be
like. Tyler Frederick was instrumental in training me in the ways of the lab. Dr. Xianjiang Chen
was a great office mate to finish out my studies with and taught me my first Chinese characters.
Fabio Giallongo helped me formulate my early dairy cattle diets. Susanna Räisänen, Sergio,
Christian Martins, Katieli, Gilberto, Laiz Flores, Juliana Lopes, and many undergraduates were
very important in helping me conduct my research. Many other people and labs have made my
academic pursuits possible. Foremost among them are Dr. Harvatine’s lab (Dr. Michel Baldin,
Isaac Salfer, Elaine Barnoff, and others) and the milk fatty acid analysis that they helped me
perform. I greatly appreciate the hard work of the dairy barn crew under the leadership of Nadine
Houck and Travis Edwards. I would have had nothing to feed were it not for farm services that
grew, harvested, and ensiled the forages.

xv
Most importantly, I am extremely appreciative for the support of my beautiful wife,
Stacie Ann Harper, and my Creator, Jesus Christ, who have encouraged and strengthened me.
They believed in me when I lost hope. They were faithful to see me to the end of my PhD, which
is only the beginning.
xvi
EPIGRAPH
“All things were made by Him; and without Him was not any thing made that was made.”
John 1:3

Chapter 1
Introduction
Dairy cattle are ruminants designed to digest forages in a symbiotic relationship with
rumen microbes. Forages are a critical component of dairy cow diets around the world and
homegrown forages form the foundation of dairy rations in the northeastern U.S. (Wolf, 2003).
The amount and quality of the harvested forage positively affects the economic sustainability of
dairy farms and particularly of smaller farms (< 200 cows) which may be less specialized in milk
production and have less capital to purchase additional cropland than larger farms (Gillespie et
al., 2010). Many factors affect farmers decisions on which forage to grow including: yield,
palatability, digestibility, persistence, cost, and nutrient composition (high protein, high energy,
or high fiber).
Currently, in the northeastern U.S., the 2 principal dairy cattle forages are corn silage and
alfalfa haylage (Thoma et al., 2013). Since the late 1980s, corn silage production in the U.S. has
been increasing due to increasing yields per hectare while alfalfa and grass forage production has
decreased dramatically primarily due to reduced planted hectares of those crops (Martin et al.,
2017). According to a survey by Thoma et al. (2013), which generated a theoretical composite
diet based on the amounts fed daily in various farms, lactating cows in the northeast consumed
7.94 kg DM of corn silage, 3.15 kg DM of alfalfa silage and 1.29 kg DM of alfalfa hay, grass hay,
wheat silage, grass silage, and ryegrass silage combined. There are several reasons for the shift
towards more corn silage production and less legume and grass forages. Corn silage has a high
DM yield (over 21 t/ha), requires just one harvest per year which is simpler and leads to a more
nutritionally uniform forage supply, and is highly digestible and palatable containing over 30%
starch. The increase in corn silage utilization in dairy cow diets has followed the increased energy
2
demand of the modern dairy cow due to genetic advances that have had a dramatic 4-fold increase
in milk production per cow from 1944 to 2007 (Capper et al., 2009).
Although corn silage is high yielding, increased reliance on corn silage as a feedstuff
promotes crop rotations with more years of corn-after-corn. Continuous corn cropping is known
to result in yield declines following the first year (Bennett et al., 2012) and rotation to another
crop, such as soybeans, raises corn yields the following year (Thomison et al., 2011). Indeed,
more diverse systems may be more productive and resilient. Grassland that was planted with
greater diversity produced 2.7 times greater biomass than monocultures in a study by Tilman et
al. (2001). More complex pasture mixes were more productive and more stable in their yield from
year to year than monocultures as reported by Deak (2007). Growing alfalfa (Medicago sativa L.)
with berseem clover (Trifolium alexandrinum L.) at an 80:20 mixture was shown to improve
yields compared with the crops in monoculture by over 10% in an irrigated field trial (Al-
Suhaibani, 2010) and growing annual grasses as cover crops with crimson clover (Trifolium
incarnatum) increased DM yields by 18% compared with annual grasses alone (Brown et al.,
2018). Duffy et al. (2017) showed that increased biodiversity increased biomass production for
multiple ecosystems around the globe. Biologically diverse ecosystems are more productive but
monocultures are easier to manage and can also be high yielding (e.g., corn silage) at least in the
short term.
One practice that adds some diversity into a corn silage cropping system that can be
practically managed is double cropping. The agronomic practice of double cropping has been
increasing on dairy farms in the U.S. and future climate change is projected to increase the area
suitable for this practice (Seifert and Lobell, 2015). The northeast U. S. in particular is projected
to have the growing season increased by 12-17 more frost-free days in the spring and an
additional 11-20 frost-free days in the fall (Hristov et al., 2018). This change would greatly
increase the viability of double cropping. A common double cropping rotation includes a winter

3
annual successively paired with a summer annual. For dairy farms, this is commonly cereal rye or
triticale planted in the fall to be harvested in the spring at the flag leaf stage followed by planting
of corn for silage and subsequent harvest in the fall before the cycle repeats. Perhaps the clearest
motivation for dairy farmers to plant winter cover crops is to prevent soil erosion (Kasper et al.,
2001). It is often necessary to plant a winter cover crop after corn silage to protect the bare soil
during the winter and maintain long-term productivity of their cropland. However, other potential
benefits of double cropping include higher annual forage yields, healthier soils (Fae et al., 2009),
and increased nutrient utilization (Di and Cameron, 2002; Carey et al., 2016; Coblentz et al.,
2016). Managing manure nutrients for environmentally sound crop utilization can be challenging
for dairies that rely primarily on corn silage and alfalfa haylage forage. A survey conducted in
Minnesota showed that manure was applied to corn, after alfalfa, in excess of the N crop
requirement by more than 50% of dairy farmers (Yost et al., 2014). Double cropping with small
grains immobilizes manure N applied in the fall by incorporating it into plant tissue. This
decreases N leaching and subsequent water quality impairment.
Double cropping with cereal grains does not come without challenges. To ensure high
yields, cereal grains should be planted by mid-September on average in the Northeast U.S. which
is during or immediately after a demanding corn silage harvest. Likewise, the spring harvest
window for boot stage cereal grains is just before or during busy spring corn planting.
Additionally, much of the available manure should be spread at those times in the spring and fall
for efficient nutrient utilization, particularly N. This can result in labor shortages for a dairy farm.
To overcome this challenge, custom operators might be utilized for some of the field operations
so that delays in harvesting or planting are avoided.
Labor shortages exacerbate the risk of missing the narrow (5-7 d) harvest window for
good yield and quality of cereal crops at the flag leaf to boot stage. This presents a great
challenge particularly because these crops must be cut and wilted from 20-25% DM to around 30-
4
35% DM while this season of the year tends to have frequent rain events. A potential strategy to
offset this risk is to plant several species of cover crop with different maturity dates in separate
fields. For instance, winter barley matures 10-14 d earlier than triticale or winter wheat (Jemison
et al., 2012). It would also be beneficial to practice what has been termed ‘haylage in day’ which
is cutting, wilting and ensiling haylage crops all in one day as the name implies to fit haylage
harvest into narrow (1-2 d) spring dry periods. This is accomplished primarily by cutting into a
wide swath of 70-80% of the cutter bar width for rapid drying. Conditioning is not useful as it
does not affect crop dry down until 40% DM has been reached and foregoing conditioning has the
benefits of using less fuel, a smaller tractor, and simpler, less expensive mowing equipment
(Undersander and Saxe, 2013). The wilted crop of 30-35% DM is then raked into windrows,
chopped, and ensiled. Research from the University of Wisconsin actually reported higher non-
fiber carbohydrate concentrations in rapidly dried wide swath alfalfa haylage versus a narrow
swathed treatment (Undersander and Saxe, 2013).
The effect of these risks on cereal grain silage quality can be illustrated using the
Integrated Farm System Model (IFSM v. 4.3) running yearly iterations for 25 years of simulated
weather data. For instance, a 100 lactating cow dairy located in State College, Pennsylvania with
32 ha of alfalfa and 48 ha of corn for silage with 12 of those corn hectares double cropped with
wheat for silage is modeled by IFSM to yield a wheat silage with an average CP% of 14.9 ± 2.7
and an NDF% of 53.1 ± 2.5. When that same farm is modeled with twice the area (24 hectares)
of double cropped wheat silage, quality is decreased to 14.2 ± 2.8% CP and 54.2 ± 2.8% NDF
because the harvest timeframe is longer on average. But, when the model, with twice the area of
wheat, includes double the amount of available labor to represent custom harvesting, wheat silage
quality is equal to the first scenario for NDF (53.1 ± 2.7%) and slightly better in CP (15.2 ±
2.5%). Each scenario showed similar large amounts of variation from year to year with CP

5
ranging from 8.9-23.6% and NDF ranging from 49.0-57.0% showing the difficulty in harvesting
at the targeted maturity stage from year to year. Feeding plans will need to account for the
unpredictability in forage quality of cereal grain silage from year to year; though this issue is not
unique to cereal grain silage, it is generally more variable than corn silage.
Even with the aforementioned strategies of custom harvesting, planting multiple cereal
grains, and rapid wilting, there is a risk that boot stage harvest of cereal grains may be missed;
however, farmers have another good harvest opportunity at the soft dough stage. Numerous
studies indicate that a soft dough stage harvest is the next best maturity stage to boot stage harvest
(Acosta et al., 1991; Ashbell et al., 1997). Soft dough stage harvest of cereal grains typically
yields about 50% more DM per hectare than boot stage and, although NDF digestibility
decreases, starch concentration increases to provide a rapidly available energy source (Jemison et
al., 2012). This type of forage could be used as a physically effective NDF source, but the
negative effects on DMI would limit its use in peak and mid-lactation dairy cows. A potentially
better nutritional fit would be in late lactation diets to aid in preventing cows from gaining too
much body condition or in dry cow and heifer diets which have lower energy requirements.
Another challenge that dairy farmers relying on corn silage may face is more
unpredictable rainfall patterns as a result of potential climate change; though, exactly how the
weather patterns will change remains uncertain (IPCC, 2014). Specific to the northeast U. S.,
climate change models over the next 80+ yrs forecast higher summer temperatures with lower
summer rainfall, even though annual precipitation is anticipated to increase (Hristov et al., 2018).
Sorghum and pearl millet are two summer annual forage crops that have a higher water use
efficiency than corn silage and could also breakup continuous corn cropping (Aydin et al., 1999;
Zegada-Lizarazu and Iijima, 2005). Even without climate change, more water efficient crops may
have a greater yield than corn silage in certain areas because rainfall and water availability are
very spatially specific and differ even within watershed (Matlock et al., 2013).

6
Because of the popularity of corn silage and alfalfa haylage as dairy cow forages in the
U. S., other forage options are termed alternative forages. Common alternative forages include
the winter annual cereal grains (e.g. wheat, oats, rye, barley, and triticale) and warm season
annuals (e.g. sorghum, sudangrass, and pearl millet). Less common alternatives include other
legumes (e.g. soybeans, peas, and red clover) and cool season grasses (e.g. tall fescue, reed
canary grass).
Relatively little research has looked at alternative forages for inclusion in the diets of
high producing lactating cows. Lactating cows consume the most feed on a dairy and must be
considered in any forage program. Additionally, there is a need for crop diversity on dairy farms
to produce sustainably resilient yields from year to year that promote soil health and efficient
utilization of soil nutrients and water under changing weather conditions.
Therefore, the effect of partial replacement of corn silage with alternative forage silages
in diets of high producing lactating dairy cows was investigated. The following chapters of this
dissertation encompass a literature review on the use of alternative forages to feed lactating dairy
cows (Chapter 2), my published research that was conducted with BMR sorghum and oat silage
(Chapter 3), wheat and triticale silage (Chapter 4), and pearl millet silage (Chapter 5), and finally,
a conclusion (Chapter 6) with thoughts on the future use and research of alternative forages in
lactating dairy cow rations.
References
Acosta, Y. M., C. C. Stallings, C. E. Polan, and C. N. Miller. 1991. Evaluation of barley
silage harvested at boot and soft dough stages. J. Dairy Sci. 74:167-176.

7
Al-Suhaibani, N. A. 2010. Estimation Yield and Quality of Alfalfa and Clover for
Mixture Cropping Pattern at Different Seeding Rates. American-Eurasian J. Agric. & Environ.
Sci. 8:189-196.
Ashbell, G., Z. G. Weinberg, I. Bruckental, K. Tabori, and N. Sharet. 1997. Wheat silage:
Effect of cultivar and stage of maturity on yield and degradability in situ. J. Agric. Food Chem.
45:709–712.
Aydin, G., R. J. Grant, and J. O’Rear. 1999. Brown midrib sorghum in diets for lactating
dairy cows. J. Dairy Sci. 82:2127–2135.
Brown, A. N., G. Ferreira, C. L. Teets, W. E. Thomason, and C. D. Teutsch. 2018.
Nutritional composition and in vitro digestibility of grass and legume winter (cover) crops. J.
Dairy Sci. 101:2037-2047.
Carey, P. L., K. C. Cameron, H. J. Di, G. R. Edwards, and D. F. Chapman. 2016. Sowing
a winter catch crop can reduce nitrate leaching losses from winter-applied urine under simulated
forage grazing: a lysimeter study. Soil Use Manag. 32:329-337. doi:10.1111/sum.12276
Coblentz, W., W. Jokela, and J. S. Cavadin. 2016. Production and nitrogen use efficiency
of oat forages receiving slurry or urea. Agron. J. 108:1390–1404.
doi:10.2134/agronj2016.01.0009
Deak, A. 2007. Benefits of forage species diversity in grazing systems in Pennsylvania.
PhD Dissertation. Pennsylvania State Univ., University Park.
Di, H. J., and K. C. Cameron. 2002. Nitrate leaching in temperate agroecosystems:
sources, factors and mitigating strategies. Nutrient Cycling in Agroecosystems. 64:237–256.
Duffy, J. E., C. M. Godwin, and B. J. Cardinale. 2017. Biodiversity effects in the wild are
common and as strong as key drivers of productivity. Nature. 549:261-264.
Faé, G. S., R. M. Sulc, D. J. Barker, R. P. Dick, M. L. Eastridge, and N. Lorenz. 2009.
Integrating winter annual forages into a no-till corn silage system. Agron. J. 101:1286–1296.

8
Gillespie, J., R. Nehring, C. Sandretto, and C. Hallahan. 2010. Forage outsourcing in the
dairy sector: The extent of use and impact on farm profitability. Agric. Resour. Econ. Rev.
39(3):399-414.
Hristov, A. N., A. T. Degaetano, C. A. Rotz, E. Hoberg, R. H. Skinner, T. Felix, H. Li, P.
H. Patterson, G. Roth, M. Hall, T. L. Ott, L. Baumgard, W. Staniar, R. M. Hulet, C. Dell, A. F.
Brito, and D. Y. Hollinger. 2018. Climate change effects on livestock in the northeast U.S. and
strategies for adaptation. Climatic Change 146:33-45.
IFSM v 4.3. 2016. The integrated farm system model. C. A. Rotz, M. S. Corson, D. S.
Chianese, F. Montes, S. D. Hafner, H. F. Bonifacio, and C. U. Coiner. Pasture systems and
watershed management research unit. Agricultural Research Service. United States Department of
Agriculture.
IPCC, 2014: Climate Change 2014: Synthesis Report. Contribution of Working Groups I,
II and III to the Fifth Assessment Report of the Intergovernmental Panel on Climate Change
[Core Writing Team, R.K. Pachauri and L.A. Meyer (eds.)]. IPCC, Geneva, Switzerland, 151 pp
Jemison, J. M., H. M. Darby, and S. C. Reberg-Horton. 2012. Winter grain-short season
corn double crop forage production for New England. Agron. J. 104:256-264.
Kasper, T. C., J. K. Radke, and J. M. Laflen. 2001. Small grain cover crops and wheel
traffic effects on infiltration, runoff, and erosion. J. Soil and Water Conservation 56(2):160-164.
Martin, N. P., M. P. Russelle, J. M. Powell, C. J. Sniffen, S. I. Smith, J. M. Tricarico, and
R. J. Grant. 2017. Invited review: Sustainable forage and grain crop production for the US dairy
industry. J. Dairy Sci. 100:9479-9494.
Matlock, M., G. Thoma, E. Cummings, J. Cothren, M. Leh, and J. Wilson. 2013.
Geospatial analysis of potential water use, waterstress, and eutrophication impacts from dairy
production. Int. Dairy J. 31(Suppl.1):S78–S90.

9
Seifert, C. A., and D. B. Lobel. 2015. Response of double cropping suitability to climate
change in the United States. Environ. Res. Lett. 10:024002.
Tilman, D., P. B. Reich, J. Knops, D. Wedin, T. Mielke, and C. Lehman. 2001. Diversity
and productivity in a long-term grassland experiment. Science 294:843-845.
Thoma, G., J. Popp, D. Shonnard, D. Nutter, M. Matlock, R. Ulrich, W. Kellogg, D. Soo
Kim, Z. Heiderman, N. Kemper, F. Adom, and C. East. 2013. Regional analysis of greenhouse
gas emissions from USA dairy farms: A cradle to farm-gate assessment of the American dairy
industry circa 2008. Int. Dairy J. 21:S29–S40.
Thomison, P., P. Raul, R. Hammond, and R. Mullen. 2011. Managing risks in continuous
corn. C.O.R.N. Newsl. 2011-02. https://agcrops.osu.edu/newsletters/2011/02 (accessed 28 Dec.
2017).
Undersander, D. and C. Saxe. 2013. Field drying forage for hay and haylage. Focus on
Forage. Vol.12: No. 5. University of Wisconsin.
Wolf, C. A. 2003. The economics of dairy production. Vet. Clin. Food Anim. 19:271–
293.
Yost, M. A., J. A. Coulter, M. P. Russelle, and M. A. Davenport. 2014. Opportunities
exist to improve alfalfa and manure nitrogen crediting in corn following alfalfa. Agron. J.
106:2098–2106.
Zegada-Lizarazu, W., and M. Iijima. 2005. Deep root water uptake ability and water use
efficiency of pearl millet in comparison to other millet species. Plant Prod. Sci. 8:454-460.

10
Chapter 2
Literature Review
Role of forages in a dairy cow ration
Forages are the major source of peNDF, and that is arguably their most important
contribution to a dairy cow ration (Mertens, 1997). Forages can also be a significant source of
rapidly degradable energy in the form of starch or sugar (e.g. corn silage and oat silage,
respectively) and/or protein (e.g. alfalfa haylage, triticale silage) depending on the crop and time
of harvest. All forages grown on a dairy farm must provide value through a combination of the
yield of nutrients produced and the ecosystem services provided (e.g. soil cover). High yielding
forages are generally preferred due to the positive effect on short-term profitability. However,
forage cropping choices must be made from a whole farm system (soils, water, rations, manure,
etc.) perspective including both short-term (1-5 yr) and long-term (10-20+ yr) time frames. For
example, the need to plant a triticale cover crop to reduce soil erosion (a long-term issue) and
utilize manure nutrients in the fall and spring season (whole farm system thinking) with a slightly
shorter season corn silage may be a better choice than planting only a longer season (i.e. higher
yielding) corn silage crop. Farmers should identify the ration components (e.g. peNDF, starch,
CP) that the forage should supply to determine which crops to plant and in what rotation. The
value of alternative forages is usually in their ability to provide highly digestible peNDF.
Importance of highly digestible fiber from forages
Long fiber (8 mm) in forages is necessary for proper health and function of the rumen,
primarily through the physical effects of the fiber to promote rumination and rumen mat
11
formation (Mertens, 1997; Zebeli et al., 2012). Forages are essential for the maintenance of an
adequate rumen pH level, which in turn allows for normal fiber digestion and animal health
(Yang and Beauchemin, 2009). Kmicikewycz and Heinrichs (2014) demonstrated that
supplemental long hay helped maintain DMI in lactating dairy cows during a subacute ruminal
acidosis challenge. The rumen mat of long fiber particles helps retain smaller feed particles for
fermentation and enhances rumen motility to move VFA to the rumen wall for absorption (Zebeli
et al., 2012).
However, NDF is a bulky feed component with a relatively slow rate of digestion, 2-
4%/h (Mertens, 1987). Additionally, the rumen selectively retains (prevents passage of) buoyant
large fiber particles for continued fermentation. Together, the slow rates of NDF digestion and
passage create an upper limit to DMI due to rumen fill sensed by rumen stretch receptors as the
combination of ruminal digesta weight and volume (Allen, 1996). The effect of NDF content in
the diet on DMI is influenced by particle size and fragility, iNDF content, and fermentation rate
of the potentially digestible NDF fraction. Neutral detergent fiber that has a faster rate of
digestion and/or passage allows for increased DMI due to a decrease in rumen fill. Oba and Allen
(1999a) statistically evaluated the results of 13 forage comparisons with differing NDFD values
and found that for every unit increase in NDFD (measured in vitro or in situ) there was a 0.17 kg
increase in DMI and a 0.25 kg increase in 4% fat-corrected milk. Ivan et al. (2005) compared
high and low NDFD corn silage in dairy cow diets with substitution of the corn silage on a DM
and NDF basis. In both cases, milk and milk fat yield increased for the high NDFD corn silage
treatment. Of particular interest is the fact that when the low NDFD corn silage was substituted
with high NDFD corn silage on an NDF basis, there was a greater milk response for higher
producing cows. Therefore, it may be advisable to feed high NDFD forages to peak lactation
cows because those cows are more likely to have DMI limited by rumen fill than other cows in
the herd, as suggested by Oba and Allen (1999b).

12
Warm Season Annual Forages
Sorghum
Sorghum (Sorghum bicolor L. Moench) is a tall growing warm season annual grass. The
crop can yield more DM and grain per hectare than corn under certain environmental conditions
(e.g. low rainfall and low soil fertility) but the reverse is often true under irrigation or high
rainfall. The northeast U. S. usually receives enough rainfall for good corn silage yields, but some
soils are shallow with poor water-holding capacity and may be more suitable to growing
sorghum. Abdelhadi and Santini (2006) in Argentina, for instance, reported a whole-plant yield of
15.5 vs 7.0 t DM/ha and a grain yield of 6.5 vs 2.5 t DM/ha for grain sorghum vs corn,
respectively. Aydin et al. (1999) in Nebraska reported DM yields of 15.0 t/ha for standard
sorghum, 12.6 t/ha for BMR sorghum, 13.6 t/ha for corn, and 12.1 t/ha for alfalfa. In contrast,
under irrigation in Israel, DM yields were highest for corn (17.8 t/ha), intermediate for standard
sorghum (13.0 t/ha), and lowest for BMR sorghum (10.8 t/ha) where corn received more
irrigation water and N fertilizer than either sorghum crop (Miron et al., 2007). A sorghum
sudangrass cross (Sorghum bicolor x Sorghum vulgare var. sudangrass) grown in the Po valley of
northern Italy yielded 7.2 t DM/ha under a single cut system with irrigation vs corn silage that
yielded 15.4 t DM/ha, though the corn did receive an extra irrigation application and more
fertilizer (Colombini et al., 2010).
Sorghum silage digestibility (DMD and NDFD) has typically been poorer than corn
silage but BMR sorghum varieties have increased NDF digestibility comparable to corn silage.
Dry matter digestibility, measured by total fecal collection, of standard sorghum silage was
decreased compared with corn silage in a diet fed to heifers by Lusk et al. (1984) whereas a BMR
sorghum silage (a BMR 12 mutant, specifically) had similar DMD. The authors reported similar
13
ADF, NDF, and lignin for the BMR sorghum silage and corn silage but higher lignin in the
standard sorghum silage. Likewise, Grant et al. (1995), in a study with mid-lactation dairy cows,
reported lower ADF and NDF total-tract digestibility, estimated with acid insoluble ash, for a
normal sorghum silage-based diet vs either a corn silage or a BMR sorghum silage-based diet.
Standard sorghum silage had a lower total-tract NDF and ADF digestibility than corn silage in
dairy cows, whereas BMR sorghum silage had only a numerically lower NDF digestibility but a
significantly lower ADF digestibility in a study by Aydin et al. (1999). Oliver et al. (2004)
reported similar in situ NDFD at 48 h for BMR 6 sorghum (62.4%), BMR 18 sorghum (61.0%),
and corn (59.1%) silages but a lower NDFD for normal sorghum silage (56.4%). Colombini et
al. (2010) reported lower in situ DM degradability (72.4%) of a BMR sorghum sudangrass hybrid
silage compared with corn silage (79.4%). Colombini et al. (2010) also found a similar decrease
for the in situ NDF degradability between BMR sorghum sudangrass silage (66.6%) and corn
silage (70.9%). Though, the rate of NDF degradation was higher in the BMR sorghum sudangrass
silage and the end result was that calculated effective degradability of NDF was similar.
Abdelhadi and Santini (2006) reported a lower in vitro DMD for grain sorghum silage than corn
silage. In vitro DMD of corn and BMR sorghum silages were similar (67%) and that of standard
sorghum silage (64%) was lower in a study by Miron et al. (2007). The same authors reported
higher in vitro NDFD in BMR sorghum silage (60%) than in either standard sorghum silage or
corn silage (56%). In a total fecal collection study with Corriedale lambs, Di Marco et al. (2009)
compared the digestibility of grain, sweet and BMR sorghum silages harvested at the start of
grain filling with little starch accumulation. Starch was slightly higher in the grain sorghum silage
while lignin was slightly lower in the sweet sorghum silage. No statistical differences were found
among the forages for DM or OM though the sweet sorghum silage had numerically higher
values. Neutral detergent fiber digestibility was significantly higher in the lower lignin sweet

14
sorghum silage. Pino and Heinrichs (2017) measured higher in situ DMD of corn silage vs a
BMR sorghum silage.
In animal experiments feeding corn silage vs normal sorghum silage or BMR sorghum
silage, normal sorghum silage often decreases and BMR sorghum silage maintains animal
performance similar to corn silage. Lusk et al. (1984) found no difference in milk yield, averaging
24.6 kg/d, or milk components in two lactation trials comparing BMR sorghum silage (a mutant
of gene locus 12) vs corn silage in dairy cows.
Brown midrib sorghum silage was compared with normal sorghum, alfalfa, and corn
silages fed at 65% of the diet DM to mid-lactation Holstein cows in a 4 × 4 Latin square
experiment (Grant et al., 1995). Dry matter intake was higher for BMR sorghum silage (25.3
kg/d) than normal sorghum (20.4 kg/d) or alfalfa (19.6 kg/d) silages whereas corn silage DMI
(23.1 kg/d) was not different from any of the treatments. Milk fat concentration was similar for
BMR sorghum silage and corn silage but decreased in the normal sorghum silage diet. Fat
corrected milk yield was similar among BMR sorghum, alfalfa, and corn silages (25.8 kg/d) and
lower for the normal sorghum silage (17.9 kg/d). Compared with corn silage, milk protein
concentration was decreased significantly for the normal sorghum silage but only numerically for
the BMR sorghum silage. Milk lactose concentration was also decreased for the normal sorghum
silage compared with the corn silage but not for the BMR sorghum silage.
Aydin et al. (1999) compared standard sorghum, BMR sorghum, and corn silages at
35.3% of the diet DM in a 10-wk lactation study using Holstein cows. These authors kept all the
diets identical except for the target forage. Treatment silage nutrient composition was similar in
NDF and CP. Dry matter intake averaged 24.5 kg/d and was not affected by treatment. Milk yield
was increased by BMR sorghum (36.0 kg/d) over standard sorghum (33.8 kg/d) and was similar
to corn silage (34.6 kg/d). Milk composition was not affected by diet but feed efficiency was

15
higher for BMR sorghum than the other treatments likely due to a greater extent of NDF
digestion.
In a short-term Latin square experiment, Aydin et al. (1999) found a diet based on corn
silage, at 65% of diet DM, produced more milk (29.5 kg/d) than other silages; alfalfa (25.2 kg/d),
BMR sorghum (24.3 kg/d), or standard sorghum (21.5 kg/d). Milk protein percentage was highest
for corn silage (3.36%) vs the sorghum silages (3.23%). Dry matter intake, averaging 23.4 kg/d,
was similar among treatments. Neutral detergent fiber content of the sorghum silage treatments
were at least 5% units higher than the corn silage treatment; starch content was not reported.
Oliver et al. (2004) compared a normal sorghum silage, 2 BMR sorghum silages (a BMR
mutant of gene locus 6 and a mutant of locus 18), and a corn silage at 40% of the diet DM in
lactating Holstein cows. They found no difference in DMI (24 kg/d) but a decrease in milk yield
in the normal sorghum silage (31.0 kg/d) compared with the other treatments (33.4 kg/d).
Interestingly, milk fat concentration and yield were decreased in the normal sorghum silage
treatment despite a higher diet NDF content, which might be due to a lower NDFD in that diet
compared with the other treatments. The authors found no difference in milk protein or lactose
concentrations or yields among the treatments.
Grain sorghum silage was compared with corn silage as a pasture supplement for
growing steers and did not affect ADG, though it must be noted that the starch content of the
grain sorghum (22.9%) was higher than that of the corn silage (13.7%) (Abdelhadi and Santini,
2006). When the animal production data were combined with the crop production data it was seen
that the grain sorghum silage treatment had the highest carrying capacity.
A 3 x 3 Latin square design lactation study with 7 wk periods was conducted with
Holstein cows in Israel to compare a BMR sorghum silage, a standard sorghum silage, and a corn
silage (Miron et al., 2007). The authors replaced the corn silage, 41% of the diet DM, with
sorghum silage and ground corn at 35% and 6% of the diet DM, respectively. The highest milk

16
yield was with corn silage (42.1 kg/d), a similar yield with BMR sorghum silage (41.4 kg/d), and
the lowest yield was with standard sorghum silage (40.7 kg/d). Yield and concentration of milk
fat increased and milk protein decreased in the sorghum silage treatments vs the corn silage. Body
weight loss was increased in the sorghum silage treatments compared with the corn silage.
Colombini et al. (2010) fed mid-lactation cows either corn silage or BMR sorghum
sudangrass silage with corn meal in a change-over design with 35d periods. The authors
measured similar DMI (24.9 kg/d), milk yield (32.9 kg/d), milk component percentages and
yields as well as FCM yield.
Amer et al. (2012) replaced alfalfa silage with sweet sorghum silage at 35% of the diet
DM in early lactation dairy cows. The authors reported no change in DMI, averaging 25 kg/d, but
a reduction in milk yield from 36.8 to 33.0 kg/d with an increase in milk fat yield from 1.36 to
1.43 kg/d but decreases in milk crude protein (1.18 to 1.06 kg/d) and lactose (1.69 to 1.52 kg/d).
Energy corrected milk yield was not different. Probably the most interesting result is the decrease
in milk lactose concentration from 4.61 to 4.55%, though the mechanism for this outcome was
not described. The exact reasons for the milk production changes are difficult to elucidate
because the concentrate ingredient proportions were altered along with the forage change and the
resulting diets did not have similar NDF, CP, or starch contents. However, the authors comment
that the lower starch and higher NDF contents of the sorghum silage diet is likely the cause of the
lower milk yield and higher milk fat concentration.
Colombini et al. (2015) looked at the methane production of corn, grain sorghum, and
forage sorghum silages in diets fed to lactating Italian Friesian cows. Diets were balanced for
starch and NDF with supplemental ground corn and resulted in 41.5, 36.7, and 28.0% of target
forage diet DM for corn, grain sorghum, and forage sorghum silages, respectively. Forage
sorghum silage DMI and FPCM yield (18.2 and 24.1 kg/d) tended to be lower than either corn or
grain sorghum silages (20.0 and 25.8 kg/d, respectively). Milk component concentrations,

17
reported in a separate paper, (Colombini et al., 2012), were not different among the treatments.
Enteric methane emission was not different among the treatments (339 g/cow/d) but methane
yield (g CH4/kg DMI) tended to be higher for forage sorghum silage (18.7) than for grain
sorghum silage (17.3) or corn silage (16.9). The authors explained the higher methane yield in the
forage sorghum silage diet as the result of greater NDFD due to a slower passage rate in that diet.
Mid-lactation Holstein cows in Georgia were used in a randomized complete block
design by Bernard and Tao (2015) to compare diets based on 38.7% diet DM of corn silage or
dwarf BMR sorghum silage. Corn silage crops were either the first planting harvested in the
summer or the second planting which was then harvested in the fall. Similarly, the BMR sorghum
silage crops were either from the first summer harvest or a regrowth harvested in the fall. No
difference in DMI (22.0 kg/d) or milk yield (33.0 kg/d) was found among treatments but milk fat
concentration was increased in the BMR sorghum silage diets (3.47%) compared with the corn
silage diets (3.06%). This trial was balanced for diet nutrient composition, so again, specific
effects of the BMR sorghum silage cannot be identified; however, the study does show the ability
of dairy cows to produce comparable amounts of milk on a diet including BMR sorghum silage
similar to a diet based on corn silage.
Cattani et al. (2017) replaced corn silage with forage sorghum silage and corn meal in the
diet of Holstein cows in a study conducted in northern Italy. Diets were similar in nutrient
composition. Dry matter intake (24.7 kg/d) was the same between treatments, but milk yield (31.6
vs 29.8 kg/d) was decreased by the sorghum silage. However, milk fat concentration was
increased for sorghum silage (4.26%) vs corn silage (3.98%) which resulted in no difference for
ECM yield between the treatments. The sorghum silage diet did have a higher NDF content than
the corn silage diet (39.7 vs 36.5%, respectively), which the authors suggested may explain the
higher milk fat concentration in the sorghum silage diet. Milk FA profile showed lower PUFA
concentrations in milk from the sorghum silage treatment.

18
A meta-analysis by Sanchez-Duarte et al. (2017) looked at lactating dairy cow studies
comparing conventional sorghum silage, corn silage, and BMR sorghum silage, including many
of the aforementioned studies. Brown midrib sorghum vs conventional sorghum silage tended to
increase DMI and increased milk yield, milk fat concentration, and milk component yields. In
comparing BMR sorghum silage with conventional corn silage, it was found that milk fat
concentration increased but milk protein concentration decreased while having no change in
DMI, milk yield, or yields of milk components.
Results of studies comparing sorghum and BMR sorghum with corn silage have been
inconsistent though in general BMR sorghum silage yields similar animal performance as corn
silage. Many of the previous studies altered ingredient concentrations in the diets in addition to
the target silages which prevents a clear cause and effect relationship with the silage.
Furthermore, BMR sorghum silage grown in the northeast has not been compared to corn silage
in high producing cows but appears to be a viable option from research published to date.
Pearl Millet
Pearl millet (Pennisetum glaucum L.) is a warm season annual C4 grass. Its shorter
growing season than full season corn (65 d vs. 130 d) may make it more practical for double
cropping strategies in certain geographies with shorter growing seasons and in specific years (e.g.
abnormally wet spring seasons which delay corn planting). Additionally, pearl millet is drought
tolerant with a high water use efficiency which is a particularly important trait for crops planted
after cover crops that may decrease the available soil moisture (Maman et al., 2003; Zegada-
Lizarazu and Iijima, 2005). Pearl millet is traditionally harvested 2 or more times at around the
boot stage (Cherney et al., 1990; Mustafa et al., 2004), but a non-BMR variety of pearl millet
reportedly yielded 19.9 t DM/ha of silage in a single cut system in a 2016 New York field trial

19
(Kilcer, June 2017). There are BMR varieties of pearl millet that have reduced lignin and
increased digestibility but also decreased yield (Cherney et al., 1990; Mustafa et al., 2004;
Hassanat et al., 2007). This BMR gene has been paired with a brachytic dwarfing trait in some
hybrids for highly digestible forage that has reduced lodging. Cherney et al. (1990) demonstrated
that BMR pearl millet was preferred to normal pearl millet in grazing lambs. They also reported
that wethers, on an all forage diet, showed no difference in DMI for BMR and normal pearl millet
hay of first cutting pearl millet, but DMI was decreased to a greater extent in the second cutting
for normal pearl millet hay vs BMR pearl millet hay.
Mid-20th century research reported decreases in milk fat content of dairy cows grazing
pearl millet (Miller et al., 1965; Bucholtz et al., 1969) and consuming pearl millet greenchop vs
sudangrass (Harner et al., 1969; Schneider et al., 1970). More recent studies with pearl millet
silage, however, do not show decreases in milk fat concentration.
Ward et al. (2001) compared the in vivo digestibility of pearl millet, forage sorghum, and
tropical corn silages grown as the summer annual portion of an annual ryegrass-based double
cropping system in the southeastern U.S. Pearl millet and forage sorghum were harvested in the
vegetative stage and tropical corn was harvested at one-half milkline. Holstein heifers ate more of
the pearl millet silage than the other 2 treatments, but the pearl millet silage was less digestible.
Therefore, the authors recommended feeding either forage sorghum or tropical corn which had
similar DMI and digestibilities.
Amer and Mustafa (2010) investigated pearl millet silage in comparison to corn silage on
milk production of mid-lactation Holstein cows; the crops were grown in Quebec, Canada. The
pearl millet silage had higher NDF (66.9 vs 40.7%), 48h in situ NDFD (52.0 vs 39.1%), and CP
(13.0 vs 9.4%) than the corn silage. The diets contained 35% of the target forage and were
balanced to be isonitrogenous. There was no effect on DMI (23.9 kg/d) or milk yield (38.0 kg/d);
however, milk fat concentration was increased from 3.78% in the corn silage diet to 4.35% in the

20
pearl millet diet. Consequently, ECM and 4% FCM yields were both higher in the pearl millet
silage diet. The pearl millet silage diet was uniquely supplemented with a Ca salt of palm fatty
acids which may have contributed to the difference in milk fat concentration.
A regular pearl millet silage and a sweet pearl millet silage were compared with corn
silage in a study by Brunette et al. (2014) in Quebec, Canada. Early lactation Holstein cows in a 3
x 3 Latin square design experiment were fed the treatment forages at approximately 37% of diet
DM with additional high-moisture corn and less soybean meal in the pearl millet silage diets
along with being uniquely supplemented with a Ca salt of palm fatty acids. Even after these diet
modifications, starch remained lower, and NDF content higher, in both pearl millet silage diets.
Dry matter intake decreased in the pearl millet diets (22.8 vs 24.4 kg/d); milk yield was highest in
the corn silage diet (35.2 kg/d) and lowest in the regular pearl millet silage diet (32.7 kg/d)
whereas sweet pearl millet had intermediate milk yield (34.0 kg/d) and did not differ from either
diet. In situ effective degradability of DM was higher for the corn silage (65.3 vs 53.8%) than the
pearl millet silages with the opposite occurring for in situ effective degradability of NDFD. Pearl
millet silage had higher values (32.1 vs 18.9%) than corn silage. Total-tract digestibilities of the
diets, on the other hand, did not show any differences.
Brown midrib pearl millet silage has not yet been fed to high producing dairy cows in a
publish research trial, but the forage shows signs of being suitable due to the high digestibility of
its fiber portion in particular. Its shorter growing season also make it a possibly attractive double
cropping pairing with winter cereals (e.g. triticale).

21
Cool Season Annual Forages
Oats
Oat (Avena sativa L.) is a quick growing cool season annual cereal grain that can be used
as a whole crop silage. It can be planted either in the spring or late summer for harvest in early
summer or late autumn, respectively, but will not overwinter in the northern U.S. Studies using
spring grown oat forage have typically ranked the crop’s feeding value below corn, alfalfa,
barley, and wheat. More recent lactating cow studies with fall grown oats have reported high milk
yields.
In eastern Canada, Burgess et al. (1973) compared the milk producing ability of corn,
barley, wheat, and oat silages in Holstein cows. Corn was harvested in the dent stage and small
cereals were harvested in the soft dough stage. Diets consisted of one of the silages and a
concentrate mix. The corn silage-based diet resulted in the lowest DMI but the highest 4% FCM
yield (22.6 kg/d). The small cereal silages as a group performed similarly but had higher DMI and
lower milk yields than the corn silage.
Oltjen and Bolsen (1980) looked at the effects of corn, winter barley, winter wheat, and
spring oat silages on DMI and ADG of growing steers. Corn was harvested at the hard-dent stage
and small cereals were harvested at the dough stage. The authors reported the lowest DMI (6.67
kg/d) and ADG (0.48 kg/d) for the oat silage and regression analysis determined that increased
silage ADF content decreased ADG.
Barley, oat, triticale, and corn silages were compared by Khorasani et al. (1993) in an
experiment with lactating Holstein dairy cow TMR consisting of 50% target forage and 50%
concentrate mix. The cereal crops were planted in the spring in Alberta, Canada and harvested at
the early to mid-dough stage. The alfalfa was harvested at mid-bloom from the second cutting.

22
Alfalfa had a higher protein content and a lower NDF content (21.3% and 32.2%, respectively) vs
the cereals (17.6% and 36.6%, respectively). The study had a 3 wk covariate period followed by a
12 wk treatment period. Dry matter intake was lower in the oat (17.0 kg/d) and triticale (17.6
kg/d) diets than the barley (18.9 kg/d) and alfalfa diets (18.9 kg/d). Milk yield (26.7 kg/d) and 4%
FCM yield (25.0 kg/d) were only numerically decreased in the cereal silage diets compared with
the alfalfa diet. Total-tract diet OM and NDF digestibility was higher in the alfalfa and barley
diets than the oat and triticale diets.
Leonardi et al. (2005) evaluated the effect of chop length of oat silage on the DMI and
milk production of Holstein cows. Diets contained 25% corn silage, 25% oat silage, and 50%
concentrate (DM basis). Overall, DMI averaged 21.5 kg/d and milk yield averaged 39.1 kg/d;
however, both parameters decreased linearly with increased oat silage chop length.
A diet of 24% oat silage, 24% alfalfa silage, 42% barley grain-based energy supplement,
and a 10% protein supplement (DM basis) fed to Holstein dairy cows supported milk yield of
36.1 kg/d (Bhandari et al., 2008). Treatments were forage chop lengths of 19 and 6 mm. Dry
matter intake increased from 19.4 to 21.2 kg/d when the oat silage chop length was shortened. No
differences in concentrations of milk fat (3.00%) or milk protein (3.16%) were measured.
Contreras-Govea and Albrecht (2006) compared early summer (July) vs autumn
harvested (October) oat for forage. There was a 1 t DM/ha decrease in yield for the autumn oat
forage (6.7 t DM/ha) compared with the early summer oat (7.7 t DM/ha). However, when the
treatments were harvested 77 d after sowing, the autumn harvested oat was less mature in the
mid-boot stage vs the mid-milk stage for the early summer harvested oat. This resulted in lower
NDF (52.1%) and ADF (29.7%) in the autumn oat forage vs the early summer oat forage, NDF
(59.6%) and ADF (35.0%). Furthermore, leaf WSC (10.3%), stem WSC (22.1%), CP (18.0%),
and NDFD (61.2%) were higher in the autumn oat forage compared with the early summer
treatment containing 6.4% leaf WSC, 6.7% stem WSC, 13.5% CP, and 44.5% NDFD.
23
Coblentz et al. (2014) measured acceptable ADG of 0.85 kg/d in gravid Holstein heifers
grazing fall-grown oat for 6h each day and fed a supplemental TMR of alfalfa and rye silages.
The study was conducted in Wisconsin and pastures were planted in mid-August. Levels of WSC
in the Forage Plus variety of oat forage increased from 4.8 to 18.2 % DM from September to
November, respectively. Neutral detergent fiber concentrations (% of DM) of the same cultivar
increased quadratically from 44.1%, in September, to a peak of 53.7%, in October, and down to
47.2%, in November. Crude protein (% of DM) decreased from a high of 24.7% to a low of
12.6%.
Nitrogen fertilization of fall grown oat forage (Forage Plus), with rates ranging from 0 to
100 kg of N/ha, was found to increase DM yield along with NDF and CP content (Coblentz et al.,
2017). These changes also resulted in lower WSC concentrations and in vitro DMD but no
statistical changes for in vitro NDFD.
Hall and Coblentz (2017) partially replaced BMR corn silage in the diet of high
producing lactating Holstein cows with fall grown oat silage in an 8 wk randomized block design
experiment. The control diet contained 20% alfalfa silage, 35% BMR corn silage and 45%
concentrates (% of diet DM); the experimental diets partially replaced BMR corn silage to
contain 8 or 16% oat silage. Dry matter intake (29.4 kg/d) was high but not affected by treatment;
however, 3.5% FPCM decreased from 50.5 kg/d (control) to 48.5 kg/d (8% oat silage) to 46.2
kg/d (16% oat silage). Total-tract NDFD had a quadratic response: 56.3%, 54.9%, and 58.0% for
control, 8% oat silage, and 16% oat silage treatments, respectively.
The nutritional profile of fall grown oat silage indicate that it would be an ideal high
digestible fiber source for lactating dairy cows. Few animal studies have been conducted with fall
grown oat silage and the author is no aware of any studies comparing fall grown oat silage to
conventional corn silage in high producing dairy cows.

24
Wheat and Triticale
Wheat (triticum aestivum L.) and triticale (X Triticosecale) are cereal grains that can be
planted in the fall, after corn is harvested for silage, and harvested the following spring. These
winter crops, along with cereal rye (Secale cereale), have been popular for a number of years to
use as cover crops to reduce soil erosion, increase soil organic matter, and capture available soil
nutrients, but more recently dairy farmers have started to harvest these crops for forage as well.
The fiber of these crops can be highly digestible with in vitro NDFD values of 73-78% (% of
NDF) reported by Brown et al. (2018).
Jemison et al. (2012) compared crop yields and nutrient characteristics of winter grains
(harvested at the boot or soft dough stage) double cropped with short season corn vs full season
corn in Maine and Vermont. Winter grains were winter barley, triticale, and winter wheat. The
cold winters of northern New England caused around 40% of the winter barley to winter kill
which decreased yields compared with triticale or winter wheat. Waiting the 18 to 24 d from boot
stage to soft dough stage in the winter cereals increased DM yields by about 50%. Total DM
yields from double cropping with winter grain harvest at the boot or soft dough stage were 20 and
33% higher, respectively, than the 13.6 t/ha yield of full season corn single cropping.
A survey of winter cereals (cereal rye and triticale) double cropped with corn silage on
New York dairy farms reported DM yields of 3.62 and 4.88 t/ha for cereal rye and triticale,
respectively (Ketterings et al., 2015). Yields commonly ranged from 2-5 t/ha for the winter cereal
production.
Many studies have looked at the effect of harvest timing on the feeding value of cereal
grains. Sutton et al. (2001) summarized 3 experiments aimed to increase the efficiency of milk
production from urea treated whole-crop wheat silage in the UK by using molasses, concentrates,
or sodium hydroxide. They concluded that whole-crop wheat harvested at DM levels of 55-60%
25
(mature dough stage) was a relatively low energy feed and suggested that future work be focused
on harvesting the wheat at earlier stages of maturity.
Arieli and Adin (1994) compared early (mid-flowering) and late (end of milk stage)
harvest of wheat for silage on milk production in lactating Israeli-Friesian cows on a commercial
dairy. Wheat silage contributed 30.5 and 33.2% of the diet DM for the early and late harvest
treatments, respectively. Treatments were balanced to 33% NDF, 16.5% CP, and 1.73 NEL/kg.
Milk and milk protein yield were higher for the early treatment cows but with similar milk fat
yields between treatments due to a higher milk fat % in the late treatment. The authors attributed
these differences to a higher wheat silage NDFD for the early harvest wheat silage as measured in
situ. The DM yield/ha was 30% lower for the early harvest wheat but the resulting economics of
the early treatment diet were more profitable despite being a more expensive diet.
In Israel, wheat silage is a major crop for dairy cattle and roughages are relatively
expensive. Ashbell et al. (1997) compared 2 wheat cultivars (an early maturing and late maturing
variety) and 4 maturity stages at harvest (shooting, flowering, milk and dough) to assess the
optimum cultivar and harvest timing for use in dairy cattle diets. Whole plant DM yields
increased from 7.4 t/ha to 15.8 t/ha from shooting to dough stages, respectively. In situ DM
degradability decreased from shooting to flowering and milk stages but increased to similar levels
as the shooting stage for the dough stage whereas NDFD generally decreased with each
advancing maturity stage. The early maturing variety had higher DM degradability values
(72.6%) and similar NDFD values (38.6%) as the late maturing wheat for the shooting stage
sample. Including DM yields, the authors calculated the highest degradable DM yields for the
early maturing crop at the dough stage but the highest degradable NDF yields for the late
maturing variety.
Wheat silage grown in northern Italy was studied by Crovetto et al. (1998) to determine
optimum maturity stage for harvest. The authors investigated boot, mid-bloom, milk, and dough

26
maturity stages fed to Bergamasca wethers as the sole feed source. In vivo DM digestibility was
high for boot (73.4%) and mid-bloom (67.1%) stages and significantly lower for milk (59.2%)
and dough (59.6%) stages. Neutral detergent fiber digestibility decreased similarly (71.8, 65.5,
52.9, and 34.5% from boot through dough stages). The authors concluded that, although yield is
lower for earlier stage harvests, in a double cropping system with corn silage, targeting harvest
for mid-bloom would give the best balance of yield, digestibility, and corn planting timing.
Fonseca et al. (2005) tested dough stage wheat silage against a late cute ryegrass silage in
diets of lactating Holstein cows in a Latin square design experiment conducted in Portugal. Diets
were 55% concentrate and 45% test forage, fed separately. In situ DM and NDF degradabilities
were lower for the wheat silages compared with the ryegrass silage. Dry matter intake (20.2 kg/d)
milk yield (28.7 kg/d) and milk components were not affected.
Cosentino et al. (2015) compared diets of 50% corn silage or triticale silage for 105d in
lactating Holstein cows to identify which forage feeding strategy would have a smaller ‘water
footprint’. Diet did not affect DMI (21.7), milk yield (38.1 kg/d), milk fat (3.50%), or milk
protein (3.32%). The authors concluded that the triticale silage diet had the smaller water
footprint due to the similar production effects but a smaller water footprint for triticale silage
production.
Many studies have focused on the effects of harvest timing on the nutrients and
digestibility of wheat silage. A number of animal experiments feeding wheat silage to lactating
dairy cows have also been published. Few animal studies have fed winter wheat that was
harvested at the high digestible boot stage. Winter triticale has received even less attention than
winter wheat though its yield can be higher with comparable quality parameters.
27
Other Alternative Forages
There are some other alternative forages that have received less research attention. Tall
fescue silage (Festuca arundinacea Schreb.) was compared with orchardgrass (Dactylis
glomerata L.) and alfalfa (Medicago sativa L.) silages in lactating cows by Cherney et al. (2004).
Dry matter intake (26.4 kg/d) and milk yield (40.4 kg/d) for first cutting tall fescue, orchardgrass,
and alfalfa silages were similar, but for the higher NDF second cuttings of tall fescue and
orchardgrass silages, DMI (22.5 kg/d) and milk yield (35.7 kg/d) decreased. It should be noted
that the grass silage treatments had increased levels of concentrate in the ration. Bender et al.
(2016) investigated tall fescue hay as a replacement for either corn silage or alfalfa silage in dairy
cows milking an average of 40.4 kg/d. Dry matter intake was reduced slightly but milk yield only
numerically decreased. While corn silage was replaced, corn grain was increased to maintain
starch levels among diets. Total-tract NDF digestibility in vivo was increased when tall fescue
hay replaced corn silage.
A 40:60 mixture of kura clover (Trifolium ambiguum M. Bieb.) and reed canarygrass
(Phalaris arundinacea L.) silage was compared with alfalfa silage for feeding lactating cows due
to better persistence of the crop in the northern U.S. and greater adaptability to poorly drained
soils (Kammes et al. 2008). Diets contained 57% of the target forages. Neutral detergent fiber,
33.1 vs 25.6% was high for the kura clover/reed canarygrass silage based diet compared with the
alfalfa silage based diet. Dry matter intake (24.2 vs 22.8 kg/d) and 4% FCM yield (32.8 vs 30.9
kg/d) were higher for alfalfa silage vs kura clover/reed canarygrass silage, respectively.
Barley (Hordeum vulgare) silage, often fed in western Canada, was compared with corn
silage in lactating cow diets, at 54.4% of the diet DM, by researchers in Quebec (Benchaar et al.,
2014). The barley silage used in the experiment was higher in NDF (52.3 vs 36.7%) and lower in
starch (13.9 vs 32.2%) than the corn silage. In situ OM degradability was lower for barley silage

28
than corn silage. Total-tract DM digestibility was decreased in the barley silage diet from 69.3 to
63.2%. The barley silage diet had a lower DMI (22.0 kg/d) and milk yield (31.9 kg/d) than the
corn silage diet (27.2 and 37.0 kg/d, respectively). Milk fat concentration was higher in the barley
silage diet but milk fat yield was not increased. Furthermore, milk protein concentration and yield
increased in the corn silage diet. Enteric methane emissions increased with the increased milk
yield of the corn silage diet, but methane intensity (13.8 g CH4/kg ECM) was not different. The
higher NDF content and lower OM digestibility of the barley silage limited DMI and decreased
milk yield.
In the U. K., Moorby et al. (2003) evaluated a whole-crop barley (Hordeum vulgare)/kale
(Brassica oleracea) bi-crop silage (80:20 ratio) in comparison with a first-cut perennial ryegrass
silage as feed for lactating dairy cows. Dry matter intake (18.2 vs 16.3 kg/d) and milk yield (24.0
vs 22.6 kg/d) was higher for cows fed the bi-crop silage than the ryegrass silage. Milk fat yield
was higher for the ryegrass silage diet but milk protein and lactose yields were higher for the bi-
crop silage diet. The bi-crop silage diet had a more efficient use of N which the authors suggest
was the result of the higher starch content in the bi-crop silage.
Forage soybean (Glycine max L. Merr.) silage was compared with alfalfa haylage as a
forage for lactating dairy cows in Quebec, Canada (Vargas-Bello-Pérez et al., 2008). The
treatment silages were fed at 36% of the ration DM along with 12% corn silage. Soybean silage
decreased DMI (23.5 vs 25.1 kg/d) and milk yield (35.5 vs 37.2 kg/d) compared with alfalfa
haylage but did not affect milk fat yield (1.34 kg/d). Total-tract diet digestibilities of DM, OM,
CP, and NDF were not different between the treatments. Contrastingly, in situ degradability of
the silages showed that alfalfa haylage had higher effective degradabilities of DM, CP, and NDF
than soybean silage.

29
Many alternative forages could be fed to lactating cows. Additional forage species
options and feeding strategies should be investigated to reduce reliance on any one crop and,
thereby, make dairy farm forage production more consistent and robust.
References
Abdelhadia, L. O., and F. J. Santini. 2006. Corn silage versus grain sorghum silage as a
supplement to growing steers grazing high quality pastures: Effects on performance and ruminal
fermentation. Anim. Feed Sci. Technol. 127:33–43.
Allen, M. S. 1996. Physical constraints on voluntary intake of forages by ruminants. J.
Anim. Sci. 74:3063-3075.
Amer, S., P. Seguin, and A. F. Mustafa. 2012. Short communication: Effects of feeding
sweet sorghum silage on milk production of lactating dairy cows. J. Dairy Sci. 95:859–863.
Arieli, A., and G. Adin. 1994. Effect of wheat silage maturity on digestion and milk yield
in dairy cows. J. Dairy Sci. 77:237–243.
Ashbell, G., Z. G. Weinberg, I. Bruckental, K. Tabori, and N. Sharet. 1997. Wheat silage:
Effect of cultivar and stage of maturity on yield and degradability in situ. J. Agric. Food Chem.
45:709–712.
Aydin, G., R. J. Grant, and J. O’Rear. 1999. Brown midrib sorghum in diets for lactating
dairy cows. J. Dairy Sci. 82:2127–2135.
Benchaar, C., F. Hassanat, R. Gervais, P. Y. Chouinard, H. V. Petit, and D. I. Massé
2014. Methane production, digestion, ruminal fermentation, nitrogen balance, and milk
production of cows fed corn silage- or barley silage-based diets. J. Dairy Sci. 97:961-974.

30
Bender, R. W., F. Lopes, D. E. Cook, and D. K. Combs. 2016. Effects of partial
replacement of corn and alfalfa silage with tall fescue hay on total-tract digestibility and lactation
performance in dairy cows J. Dairy Sci. 99:5436–5444.
Bernard, J. K., and S. Tao. 2015. Short communication: Production response of lactating
dairy cows to brachytic forage sorghum silage compared with corn silage from first or second
harvest. J. Dairy Sci. 98:8994–9000.
Bhandari, S. K., S. Li, K. H. Ominski, K. M. Wittenberg, and J. C. Plaizier. 2008. Effects
of the chop lengths of alfalfa silage and oat silage on feed intake, milk production, feeding
behavior, and rumen fermentation of dairy cows. J. Dairy Sci. 91:1942–1958.
Brown, A. N., G. Ferreira, C. L. Teets, W. E. Thomason, and C. D. Teutsch. 2018.
Nutritional composition and in vitro digestibility of grass and legume winter (cover) crops. J.
Dairy Sci. 101:2037-2047.
Bucholtz, H. F., C. L. Davis, D. L. Palmquist, and K. A. Kendall. 1969. Study of the low-
fat milk phenomenon in cows grazing pearl millet pastures. J. Dairy Sci. 52:1388-1394.
Burgess, P. L., J. W. G. Nicholson, and E. A. Grant. 1973. Yield and nutritive value of
corn, barley, wheat and forage oats as silage for lactating dairy cows. Can. J. Anim. Sci. 53:245-
250.
Cattani, M., N. Guzzo, R. Mantovani and L. Bailoni. 2017. Effects of total replacement
of corn silage with sorghum silage on milk yield, composition, and quality. J. of Anim. Sci. and
Biotech. 8:15
Cherney, D. J. R., J. H. Cherney, and L. E. Chase. 2004. Lactation performance of
Holstein cows fed fescue, orchardgrass, or alfalfa Silage. J. Dairy Sci. 87:2268-2276.
Coblentz, W.K., G. E. Brink, P. C. Hoffman, N. M. Esser, and M. G. Bertram. 2014. Fall-
grown oat to extend the fall grazing season for replacement dairy heifers. J. Dairy Sci. 97:1645–
1660.
31
Coblentz, W. K., M. S. Akins, J. S. Cavadini, and W. E. Jokela. Net effects of nitrogen
fertilization on the nutritive value and digestibility of oat forages. 2017. J. Dairy Sci. 100:1739-
1750.
Colombini, S., L. Rapetti, D. Colombo, G. Galassi, and G. M. Crovetto. 2010. Brown
midrib forage sorghum silage for the dairy cow: nutritive value and comparison with corn silage
in the diet. Ital. J. of Anim. Sci. 9:273-277.
Colombini, S., G. Galassi, G. M. Crovetto and L. Rapetti. 2012. Milk production,
nitrogen balance, and fiber digestibility prediction of corn, whole plant grain sorghum, and foarge
sorghum silages in the dairy cow. J. Dairy Sci. 95:4457-4467.
Colombini, S., M. Zucali, L. Rapetti, G. M. Crovetto, A. Sandrucci, and L. Bava. 2015.
Substitution of corn silage with sorghum silages in lactating cow diets: In vivo methane emission
and global warming potential of milk production. Agricultural Systems 136:106-113.
Contreras-Govea, F. E., and K. A. Albrecht. 2006. Forage production and nutritive value
of oat in autumn and early summer. Crop Sci. 46:2382-2386.
Cosentino, C., F. Adduci, M. Musto, R. Paolino, P. Freschi, G. Pecora, C. D’Adamo, and
V. Valentini. 2015. Low vs high “water footprint assessment” diet in milk production: A
comparison between triticale and corn silage based diets. Emir. J. Food Agric. 27:312-317.
Crovetto, G. M., G. Galassi, L. Rapetti, A. Sandrucci, and A. Tamburini. 1998. Effect of
the stage of maturity on the nutritive value of whole crop wheat silage. Livest. Prod. Sci. 55:21–
32.
Di Marco, O. N., M. A. Ressia, S. Arias, M. S. Aello, and M. Arzadun. 2009.
Digestibility of forage silage from grain, sweet and bmr sorghum types: Comparison of in vivo, in
situ and in vitro data. Anim. Feed Sci. and Technol. 153:161-168.

32
Fonseca, A. J. M., A. R. J. Cabrita, C. S. S. Nogueira, D. S. P. Melo, Z. M. C. Lopes, and
J. M. F. Abreu. 2005. Lactation responses of dairy cows to whole-crop wheat or ryegrass silages.
Anim. Feed Sci. Technol. 118:153-160.
Hall, M. B. and W. K. Coblentz. 2017. Substitution of fall-grown oat forage for corn
silage affects lactating dairy cow performance. J. Dairy Sci. 100(Suppl. 2):397. (Abstr.)
Harner, J. P., R. W. Hemken, J. H. Vandersall, N. A. Clark, and B. A. Schneider. 1969.
Relationship of pearl millet to milk fat depression in dairy cows. I. Cation fertilization. J. Dairy
Sci. 52:1244-1248.
Ivan, S. K., R. J. Grant, D. Weakley, and J. Beck. 2005. Comparison of a corn silage
hybrid with high cell-wall content and digestibility with a hybrid of lower cell-wall content on
performance of Holstein cows. J. Dairy Sci. 88:244–254.
Jemison, J. M., H. M. Darby, and S. C. Reberg-Horton. 2012. Winter grain-short season
corn double crop forage production for New England. Agron. J. 104:256-264.
Kammes, K. L., G. B. H. Heemink, K. A. Albrecht, and D. K. Combs. 2008. Utilization
of kura clover-reed canarygrass silage versus alfalfa silage by lactating dairy cows. J. Dairy Sci.
91:3138–3144.
Ketterings, Q. M., S. Ort, S. N. Swink, G. Godwin, T. Kilcer, J. Miller, and W. Verbeten.
2015. Winter cereals as double crops in corn rotations on New York dairy farms. J. of Ag. Sci.
7:18-24.
Khorasani, G. R., E. K. Okine, J. J. Kennelly, and J. H. Helm. 1993. Effect of whole crop
cereal grain silage substituted for alfalfa silage on performance of lactating dairy cows. J. Dairy
Sci. 76:3536–3546.
Kilcer, T. 2017. Crop Soil News. June 2017. advancedagsys.com/wp-
content/uploads/2017/06/wet-conditions.pdf (accessed Jan. 7, 2018).

33
Kmicikewycz, A. D. and A. J. Heinrichs. 2014. Feeding lactating dairy cattle long hay
separate from the total mixed ration can maintain dry matter intake during incidents of low rumen
pH. J. Dairy Sci. 97:7175-7184.
Leonardi, C., K. J. Shinners, and L. E. Armentano. 2005. Effect of different dietary
geometric mean particle length and particle size distribution of oat silage on feeding behavior and
productive performance of dairy cattle. J. Dairy Sci. 88:698–710.
Mertens, D. R. 1987. Predicting intake and digestibility using mathematical models of
ruminal function. J. Dairy Sci. 64:1548– 1558.
Mertens, D. R. 1997. Creating a system for meeting the fiber requirements of dairy cows.
J. Dairy Sci. 80:1463-1481.
Miller, R. W., R. W. Hemken, J.H. Vandersall, D. R. Waldo, M. Okamato, and L. A.
Moore. 1965. Effect of feeding buffers to dairy cows grazing pearl millet or sudan grass. J. Dairy
Sci. 48:1319-1323.
Moorby, J. M., P. R. Evans and N. E. Young. 2003. Nutritive value of barley/kale bi-crop
silage for lactating dairy cows. Grass and Forage Sci. 58:184-191.
Oba, M., and M. S. Allen. 1999a. Evaluation of the importance of the digestibility of
neutral detergent fiber from forge: Effects on dry matter intake and milk yield of dairy cows. J.
Dairy Sci. 82:589–596.
Oba, M., and M. S. Allen. 1999b. Effects of brown midrib 3 mutation in corn silage on
dry matter intake and productivity of high yielding dairy cows. J. Dairy Sci. 82:135-142.
Oltjen, J. W., and Bolsen K. K. 1980. Wheat, barley, oat and corn silages for growing
steers. J. Anim. Sci. 51:958-965.
Pino, F. and A. J. Heinrichs. 2017. Sorghum forages in precision-fed dairy heifer diets. J.
Dairy Sci. 100:224-235.

34
Sanchez-Duarte, J. I., K. F. Kalscheur, A. D. Garcia, and F. E. Contreras-Govea. 2017.
Performance of dairy cows fed conventional sorghum or corn silages compared to brown midrib
sorghum silage: A meta-analysis. J. Dairy Sci. 100(Suppl. 2):109-110. (Abstr.)
Schneider, B. A., N. A. Clark, R. W. Hemken, and J. H. Vandersall. 1970. Relationship
of pearl millet to milk fat depression in dairy cows. II. Forage organic acids as influenced by soil
nutrients. J. Dairy Sci. 53:305-310.
Sutton, J. D., R. H. Phipps, S. B. Cammell, and D. J. Humphries. 2001. Attempts to
improve the utilization of urea-treated whole-crop wheat by lactating dairy cows. Anim. Sci.
73:137-147.
Vargas-Bello-Pérez, E., A. F. Mustafa, and P. Seguin. 2008. Effects of feeding forage
soybean silage on milk production, nutrient digestion, and ruminal fermentation of lactating Dairy
Cows. J. Dairy Sci. 91:229-235.
Yang, W. Z., and K. A. Beauchemin. 2009. Increasing physically effective fiber content
of dairy cow diets through forage proportion versus forage chop length: Chewing and ruminal
pH. J. Dairy Sci. 92:1603-1615.
Zebeli, Q., J. R. Aschenbach, M. Tafaj, J. Boguhn, B. N. Ametaj, and W. Drochner 2012.
Invited review: Role of physically effective fiber and estimation of dietary fiber adequacy in high-
producing dairy cattle. J. Dairy Sci. 95:1041-1056.

Chapter 3
Using brown midrib 6 dwarf forage sorghum silage and fall grown oat silage
in lactating dairy cow rations.
Journal of Dairy Science Vol. 100, 7, 5250-5265, 2017
https://doi.org/10.3168/jds.2017-12552
M. T. Harper, J. Oh, F. Giallongo, J. C. Lopes, G. W. Roth, and A. N. Hristov
ABSTRACT
Double cropping and increasing crop diversity could improve dairy farm
economic and environmental sustainability. In this experiment, corn silage was partially
replaced with 2 alternative forages, brown midrib-6 brachytic dwarf forage sorghum
(Sorghum bicolor) or fall-grown oat (Avena sativa) silage in the diet of lactating dairy
cows. We investigated the effect on dry matter (DM) intake, milk yield (MY), milk
components and fatty acid profile, apparent total tract nutrient digestibility, N utilization,
enteric methane emissions, and income over feed cost. We analyzed the in situ DM and
neutral detergent fiber disappearance of the alternative forages versus corn silage and
alfalfa haylage. Sorghum was grown in the summer and harvested in the milk stage. Oats
were grown in the fall and harvested in the boot stage. Compared with corn silage,
neutral detergent fiber and acid detergent fiber concentrations were higher in the
alternative forages. Lignin content was highest for sorghum silage and similar for corn
silage and oat silage. The alternative forages had less than 1% starch compared to the

36
approximately 35% starch in the corn silage. Ruminal in situ DM effective degradability
was similar, though statistically different, for corn silage and oat silage, but lower for
sorghum silage. Diets with the alternative forages were fed in a replicated 3 × 3 Latin
square design experiment with 3, 28-d periods and 12 Holstein cows. The control diet
contained 44% (DM basis) corn silage. In the other 2 diets, sorghum or oat silages were
included at 10% of dietary DM, replacing corn silage. Sorghum silage inclusion
decreased DM intake, MY, and milk protein content, but increased milk fat and
maintained energy corrected MY similar to the control. Oat silage had no effect on DM
intake, MY or components compared with the control. The oat silage diet increased
apparent total tract digestibility of dietary nutrients, except starch, whereas the sorghum
diet slightly decreased DM, organic matter, crude protein, and starch digestibility. Cows
consuming the oat silage diet had higher milk urea N and urinary urea N concentrations.
Milk N efficiency was decreased by the sorghum diet. Diet did not affect enteric methane
or carbon dioxide emissions. This study shows that oat silage can partially replace corn
silage at 10% of the diet DM with no effect on MY. Brown midrib sorghum silage
harvested at the milk stage with < 1% starch will decrease DM intake and MY in dairy
cows.
Keywords: dairy cow, forage, oat silage, sorghum silage

37
INTRODUCTION
Forage is the most important feed component on dairy farms and forage shortages
can restrict the number of cows that can profitably be milked on a dairy. A fixed land
base and annual variation in climatic conditions (i.e., rainfall) are often the reason for a
limited amount of forage on farms in the northeastern U.S. Additionally, reliance on a
few forage crop species, such as corn silage, grown continuously may reduce yields
through weeds, pests, and diseases (Vencill et al., 2012; Gentry et al., 2013). Increasing
forage yield by double cropping and improving year-to-year yield stability through crop
rotation strategies using a variety of plant species that reduce pest, disease, and climatic
risk may increase farm sustainability (Faé et al., 2009; Sindelar et al., 2016). Due to its
high concentration of starch, it is difficult to match the energy content of corn silage;
therefore, variety selection (e.g., brown midrib; BMR) and harvest timing (e.g., boot or
soft dough stage) are critical for alternative forage quality as plant OM digestibility can
change rapidly. To be adopted on a large scale, alternative forages must be suitable for
inclusion not only in heifer and dry cow diets, but also in diets for lactating cows because
they consume over 50% of the feed on a dairy farm. Therefore, forages must be highly
digestible to meet the nutrient needs of the modern, high-producing dairy cow.
Sorghum and oat silages are 2 forages that have shown potential as alternative
forages for lactating dairy cows. Sorghum (Sorghum bicolor) is a C4 warm season annual
grass similar to corn silage except that it has a panicle type seed head with smaller grain
kernels, a higher lignin content and greater yields in low moisture conditions (Miron et
al., 2007). Sorghum roots are toxic to western corn root worm (Diabrotica virgifera

38
virgifera) which can reduce pest pressure on corn if used in a crop rotation (Branson et
al., 1969). Brown midrib varieties of sorghum have been developed that have decreased
lignin content and increased NDF digestibility (NDFD) over traditional varieties (Grant
et al., 1995; Oliver et al., 2004). The use of brachytic dwarfing decreases lodging in the
low lignin BMR varieties while increasing the leaf-to-stem ratio. The BMR-6 variant of
forage sorghum has shown NDFD values higher than the BMR-12 variety and equal to
corn silage (Oliver et al., 2004). Yields of sorghum are usually lower than corn, in good
soil with available moisture, but can match or exceed corn yields on marginal ground
particularly in water stressed conditions (Aydin et al., 1999; Abdelhadi and Santini,
2006).
Oats (Avena sativa) are a C3 cool season annual grass that grows well in the
cooler temperatures of the spring and fall as part of a double cropping strategy to increase
annual forage yield per unit area. Earlier studies have not found spring grown oat silage
to be as high quality as corn silage (Burgess et al., 1973; Oltjen and Bolsen, 1980).
However, fall grown oats grow quickly and can be harvested in a highly digestible state
with relatively high CP content of around 18% (Contreras-Govea and Albrecht, 2006).
Oats do not typically survive northeastern winters and must be harvested in the fall if the
goal is inclusion in animal diets. Additionally, oats have the potential to efficiently utilize
fall-applied manure and reduce nitrate leaching (Shephard, 1999; Di and Cameron, 2002;
Carey et al., 2016).
A resilient cropping strategy would include a diverse variety of alternative forages
though corn silage might still yield over 50% of the annual forage harvest. Therefore, the

39
hypothesis of this study was that both BMR-6 brachytic dwarf forage sorghum and fall-
grown oats could serve as alternative forages to feed in addition to corn silage in lactating
dairy cow rations in the northeastern U.S. The objective of the experiment was to
partially replace corn silage with either BMR-6 brachytic dwarf sorghum silage or oat
silage at 10% of the diet DM, to reflect a theoretical proportion of whole farm alternative
forage crop yield, and investigate the effects on DMI, MY, milk components and fatty
acid (FA) profile, nutrient digestibility, N utilization, enteric methane emissions, and
income over feed costs (IOFC) in lactating dairy cows.
MATERIALS AND METHODS
Crops and Silages
Brown midrib-6 brachytic dwarf forage sorghum (Alta AF 7202; King’s
Agriseeds, Ronks, PA) and oats (ForagePlus; Seedway, Hall, NY) were grown in Centre
County, PA at approximately 40° N latitude on Hagerstown and Hublersburg soils during
the summer and fall of 2014. Both crops were planted with a no-till drill (John Deere
1590; Moline, IL) into fields fertilized with 44.8 t/ha of dairy manure prior to planting,
contributing 42 kg/ha of ammonium N. Sorghum was planted with 38 cm row spacing
and oats were planted with 19 cm row spacing. A John Deere 946 mower with a roll
conditioner was used to mow both crops and, after wilting to around 30% DM, the
forages were gathered and chopped using a John Deere 6750 harvester. Both crops were
ensiled without inoculant in 3-m diameter plastic silage bags (Up North Plastics, Cottage

40
Grove, MN). Sorghum was planted on June 30th, 2014 after barley and triticale harvested
for forage, at a seeding rate of 7.3 kg/ha and fertilized with 67 kg of N/ha from a 30%
urea and ammonium nitrate liquid fertilizer on August 18th, 2014. It was mowed on
November 10th, 2014 at the milk stage of grain development after being partially frost-
killed and harvested on November 11th, 2014 with a 16 mm theoretical chop length. Oats
were planted at a seeding rate of 108 kg/ha on August 16th, 2014 after wheat harvested
for grain. The oats were mowed in the boot stage on November 8th, 2014 and harvested
on November 14th, 2014 with a 12 mm theoretical chop length. The corn silage, which
was the control in this experiment, was a mixture of the following hybrids: Mycogen
TMF2R737 (112 d relative maturity), Dekalb DKC 52-61 (102 d relative maturity), and
NK N60F-3111 (107 d relative maturity). Corn silage was grown in Centre County, PA at
approximately 40° N latitude on Hagerstown and Hublersburg soils and planted between
May 1st and May 10th, 2014 at a rate of 79,000 seeds/ha. It was planted with a no-till drill
(John Deere 1590; Moline, IL) into fields fertilized with 44.8 t/ha of dairy manure prior
to planting, contributing 42 kg/ha of ammonium N. An additional 43 kg/ha of N was
applied as 30% urea and ammonium nitrate liquid prior to planting and 100 kg/ha of N in
the same form as a sidedress application. Corn silage harvest was conducted between
September 15th and September 30th at a target DM of 38% with a 19 mm chop length and
ensiled in an upright concrete silo.

41
Animals and Diets
All animals were cared for according to procedures approved by The
Pennsylvania State University’s Institutional Animal Care and Use Committee. Twelve
mid-lactation Holstein dairy cows, 6 primiparous (MY 37 ± 2.6 kg; DIM 100 ± 6 d; BW
592 ± 51 kg) and 6 multiparous (MY 47 ± 5.8 kg; 2.3 ± 0.5 lactations; DIM 61 ± 16 d;
BW 639 ± 39 kg at the beginning of the experiment) were used in a replicated 3 × 3 Latin
square design balanced for residual effects. Each 28 d period consisted of 18 d of
adaptation and 10 d of data and sample collection. Cows were placed in 4 groups of 3
cows each based on DIM, MY, and parity. Cows within a group were randomly assigned
to 1 of 3 diets, as described below. All cows were housed in the tie stall barn of The
Pennsylvania State University’s Dairy Research and Teaching Center. Diets were mixed
and fed from a Rissler model 1050 TMR mixer (I.H. Rissler Mfg. LLC, Mohnton, PA).
Cows were fed once daily around 8 a.m. to yield approximately 5-10% refusals. Feed was
pushed up 3 times throughout the day. The cows were milked twice daily at 7 a.m. and 6
p.m.
Three different diets, as in Table 1, were fed to the cows during the experiment as
follows: a control diet (CS), based on corn silage and alfalfa haylage; an oat silage diet
(OS), oat silage included at 10% of dietary DM, replacing 22.7% of the control diet corn
silage DM; and a sorghum silage diet (SS), sorghum silage included at 10% of dietary
DM, replacing 22.7% of the control diet corn silage DM. The CS diet was formulated to
meet or exceed the NRC (2001) requirements for NEL and MP of a cow with 650 kg BW,
44 kg/d MY, 3.8% fat, 3.2% true protein, and at 27 kg/d DMI.
42
Sampling and Analyses
Refusals were collected and weighed individually for each cow just prior to the
morning feeding to measure daily as-fed intake. Total mixed ration, refusals, and forage
(sorghum, oat, alfalfa, and corn silages) samples were collected twice weekly,
composited by week and diet (i.e., silage type), stored at -20°C, and then oven dried at
55°C for 72 h. At least 2 separate TMR samples were collected during each period and
processed individually for particle size analysis using the Penn State Particle Separator
with 19, 8 and 4 mm sieves. The procedure described in the extension publication by
Heinrichs (2013) was used for analysis. All TMR samples were collected within 1 h of
feeding. The weekly DM content of the TMR and refusals was used to calculate the
individual daily DMI. Concentrate feeds were sampled weekly and stored at -20°C until
analysis. Sorghum and oat silages were first ground through a 4-mm screen (for in situ
disappearance measurements), then, along with alfalfa haylage, corn silage, and TMR
samples, were ground through a 1-mm screen in a Wiley mill (Thomas Scientific,
Swedesboro, NJ) and further composited by period on an equal weight basis. Dried
composite samples of sorghum, oat, and corn silages were sent to Cumberland Valley
Analytical Services Inc. (Maugansville, MD) to be analyzed by wet chemistry methods
for amylase-treated NDF (Van Soest et al., 1991), ADF (973.18; AOAC International,
2000), lignin (Goering, H.K. and P.J. Van Soest., 1970), fat (2003.05; AOAC
International, 2006), CP (990.03; AOAC International, 2000), soluble protein
(Krishnamoorthy et al., 1982), starch (Hall, 2009), ethanol soluble carbohydrates (Dubois
et al., 1956), ash (942.05; AOAC International, 2000), and minerals (985.01; AOAC

43
International, 2000). Fermentation profiles of the corn, oat and sorghum silages were
analyzed by Cumberland Valley Analytical Services Inc. using near infrared reflectance
spectroscopy for lactic, acetic and butyric acids, titratable acidity, and pH. Concentrate
feed samples were ground and composited once for the entire experiment. Dried
composite concentrate ingredients were analyzed by Cumberland Valley Analytical
Services Inc. by wet chemistry methods for CP, amylase-treated NDF, ADF, fat, CP,
starch, ash, and minerals, (procedures as referenced above) and calculated NFC using the
equation, NFC = 1 – CP – fat – NDF – ash and NEL using the equation, NEL = 0.0245 ×
TDN - 0.12. Concentrations of CP, NDF, ADF, NFC, NEL, starch, fat, ash, Ca and P in
the TMR were calculated based on the individual feed ingredient values and their
inclusion levels in the TMR. The diet values of RDP, RUP and NEL balance were
calculated based on NRC (2001) at actual DMI, MY, BW, and milk composition of the
cows.
Milk weights were automatically recorded at each milking using the Afimilk
system (Kibbutz Afikim, Israel). Milk samples for components and FA analysis were
collected on 2 consecutive days (4 consecutive milkings) during wk 4 of each period
from the p.m. and a.m. milkings. Milk component samples were collected into tubes
containing 2-bromo-2-nitropropane-1,3-diol and analyzed individually by Dairy One
Laboratory (Ithaca, NY) for fat, true protein, MUN, and lactose content using infrared
spectroscopy (Milkoscan 4000; Foss Electric, Hillerød, Denmark). Milk samples for FA
analysis from the 4 milkings for each period and cow were collected without preservative
and frozen at -20°C until composited based on MY so that a single composited sample

44
was analyzed per cow and per period following the procedure described by Rico and
Harvatine (2013). Body weight was recorded daily upon exiting the milking parlor using
an AfiFarm 3.04E scale system (S.A.E. Afikim, Rehovot, Israel) for periods 1 and 2.
During period 3, BW was not measured due to a scale system malfunction.
During wk 4 of each period, urine and fecal samples were collected for
digestibility and N utilization estimates. Spot urine and fecal samples (approximately 300
mL and 500 g per sample, respectively) were collected 8 times over 3 d at (d 1) 5 a.m., 12
p.m., 6 p.m., (d 2) 12 a.m., 9 a.m., 3 p.m., 9 p.m., and (d 3) 3 a.m. to obtain a
representative sample of a 24 h period. A full description of the urine and fecal sample
processing and analyzing can be found in Lee et al. (2012). Briefly, raw urine from each
sampling was acidified, diluted, composited by cow and period and frozen at -20°C for
later analysis of allantoin, uric acid, creatinine, urea N and total N. Allantoin was
analyzed following the procedure by Chen et al. (1992). Stanbio Laboratory (Boerne,
TX) kits were used to analyze uric acid (Uric Acid Kit 1045), creatinine (Creatinine Kit
420), and urea N (Urea Nitrogen Kit 580). Total N was analyzed in freeze dried urine
samples of 1:10 diluted and acidified urine using a Costech ECS 4010 C/N/S elemental
analyzer (Costech Analytical Technologies Inc., Valencia, CA). Fecal samples were oven
dried at 65°C, ground through 1-mm screen in a Wiley mill and analyzed for DM, OM,
CP, starch, NDF and ADF. A Mixer Mill MM 200 (Retsch GmbH, Haan, Germany) was
used to pulverize a 0.5 g aliquot of fecal sample for CP analysis (N × 6.25) using the
Costech ECS 4010 C/N/S elemental analyzer. Starch analysis of fecal DM for apparent
total tract digestibility was performed using a procedure based on the method which

45
included acetate buffer described by Hall (2009). Briefly, starch was gelatinized with
50% NaOH, incubated for 16 h at 55°C with acetate buffer and amylase, centrifuged,
plated on a 96-well plate, and then reacted with a PGO (Glucose Oxidase/Peroxidase)
enzyme solution (P7119; Sigma-Aldrich, Saint Louis, MO) for 45 min before being read
at 450 nm. Neutral detergent fiber and ADF were analyzed with an Ankom 200 fiber
analyzer (Ankom Technology Corp., Macedon, NY) based on the procedures of Van
Soest et al. (1991) with α-amylase and sodium sulfite in the NDF analysis. A 10-d
ruminal incubation was used to determine the indigestible NDF (iNDF; Huhtanen et al.,
1994 as modified by Lee et al., 2012) of both feces and TMR, which was used as a
marker to estimate apparent total-tract digestibilities of dietary nutrients.
Enteric CH4 and CO2 emissions were measured during wk 4 of each period with
the GreenFeed system (C-Lock Inc., Rapid City, SD). Measurements were collected 8
times over 3 d at 9 a.m., 3 p.m., 9 p.m., 3 a.m., 12 p.m., 6 p.m., 12 a.m. and 5 a.m. to
obtain a representative sample of a 24 h period. Gas sampling procedures followed those
recommended by Hristov et al. (2015). Gas measurements of at least 2 minutes in length
per sampling were used in the final statistical analysis which occurred for 81.3% of the
measurements. Gas emission data were averaged by cow and period for the statistical
analysis.
In Situ
Ruminal disappearance of DM and NDF from the sorghum and oat silages, and
separate alfalfa haylage and corn silage samples, was determined in situ. The sorghum

46
and oat silage samples were from the current experiment whereas the corn silage and
alfalfa haylage forage samples were from a similar experiment conducted 4 mo after the
current experiment (Harper et al., 2017, companion study). Corn silage was 38.5% DM
and contained (DM basis) 6.4% CP, 46.6% NFC, 34.5% starch, and 41.0% NDF. Alfalfa
haylage was 46.0% DM and contained (DM basis) 21.0% CP, 24.0% NFC, and 44.2%
NDF. The nutrient composition of the sorghum and oat silages is in Table 2. Six
ruminally cannulated lactating Holstein cows averaging: DMI 24.4 ± 2.4 kg; MY 36.8 ±
2.9 kg; 2.2 ± 0.4 lactations; DIM 148 ± 10 d; BW 616 ± 40.7 kg were used for the in situ
incubations. Cows were fed (% DM basis): corn silage 38.33, alfalfa haylage 13.83, grass
hay and straw mixture 4.17, ground corn 9.58, canola meal 9.58, cookie meal 5.33,
roasted soybeans 5.00, molasses 5.00, whole cotton seed 4.58, cracked corn 2.50, and
mineral mix 2.10. Oven dried forages were ground through a 4-mm sieve in a Wiley mill.
Approximately 7 g of sample were weighed into 10 × 20 cm nylon bags with 50-µm
porosity (Ankom Technology Corp., Macedonia, NY) and closed with a ziptie after
folding. Triplicate bags were sequentially incubated in each cow for 12, 24, 48, 72, and
96 h and simultaneously removed. Two bags per forage were made for the 0 h time point
and processed as the incubated samples except the rumen incubation step. Upon removal
from the rumen, bags were rinsed 3 times with cold water in a washing machine set to
agitate for 6 min each rinse. The zipties were cut off and any remaining particles rinsed
off with cold tap water. Rinsed bags were then oven dried for 72 h at 55° C before
weighing for DM determination. Samples were composited by silage, time point, and
cow before NDF analysis as previously described. Ruminal disappearance was calculated
based on initial dry weight of the incubated sample, residue dry weight, and NDF

47
concentration of initial sample and bag residue. Degradation curves were fit to the
equation p = a + b (1 - e-ct) where p is the degraded fraction (of DM or NDF) at time t,
constant a is the soluble fraction, b is the potentially degradable fraction and c is the rate
of degradation of the b fraction (Ørskov and McDonald, 1979). The effective
degradability (ED) was determined with the following equation (Ørskov and McDonald,
1979): ED = a + b {c ÷ (c + k)}, where k is the rate of passage assumed to be 0.03/h.
Corn silage NDF degradability did not fit the Ørskov and McDonald model and so was fit
with a linear model. Therefore, corn silage NDF degradability was not statistically
compared to the other forages.
Income Over Feed Costs
Income over feed costs for the 3 diets was calculated using the Pennsylvania State
Extension Dairy Team IOFC Tool (Penn State Extension, 2015). The cash flow
spreadsheet from the Pennsylvania State Extension Dairy Team (Penn State Extension,
2016) was used to calculate forage monetary values for the IOFC tool. The model dairy
included 34.4 ha cropland, 65 lactating cows, 10 dry cows, 52 heifers, and 12 calves. It
was assumed that only the forages were grown on the farm whereas concentrates were
purchased. The lactating cow ration was changed in the scenarios to reflect the treatment
diet whereas diets for other cow groups (e.g., dry cows, heifers, and calves) were kept the
same among scenarios. First, the total amount of the different forages required for each
scenario was calculated. Next, the hectares needed to produce that amount was found by
dividing the total amount of each crop needed by the per hectare crop yields obtained for

48
the forages used in the trial. The corn silage yield when double cropped with oats was
decreased by 4.9 t DM/ha to account for the lower yield of short season corn, which
would have to be planted before oats. An additional scenario was run where a sorghum
yield of 13.4 t DM/ha was used to show a more typical yield based on timely planting.
Then, the variable costs of seed, fertilizer, and herbicide per acre for each crop during
2015 was entered into the spreadsheet. Along with the input costs and the yield
information for each crop, the fixed costs were allocated among the forages based on the
labor used to produce them to determine price per ton. Milk and components yield from
the current study was used with the average milk pricing in PA for 2015 to generate the
income side of the IOFC equation.
Statistical Analysis
Statistical analyses for all but the in situ data were run using the MIXED
procedure of SAS v9.4 (SAS Institute Inc., Cary, NC). Cow was the experimental unit.
Milk yield and DMI from the last 10 d of the experiment were analyzed with day as a
repeated measure. The statistical model included cow, block, day, period, diet, and period
× diet and diet × day interactions. Block and cow within block were random effects with
all others fixed. Milk composition and FA, nutrient intake, digestibility, N utilization,
methane and CO2 emissions data used the same model without day and diet × day
interaction. Milk composition data were weighted averages based on the MY at each
milking. Particle size distribution of the 3 TMR was analyzed by sieve size with the
MIXED procedure including diet, period, and diet × period interaction in the model.

49
Silage nutrient composition was compared using the MIXED procedure with silage type
as the model. Significance was declared at P ≤ 0.05 and tendency was declared at 0.05 <
P ≤ 0.10. If not indicated otherwise, data are presented as least squares means.
Ruminal in situ degradation of DM and NDF was analyzed using the NLMIXED
procedure of SAS. The overall regression curve and the individual parameters (a, b, c,
and ED) were contrasted among forages and significance was declared at P ≤ 0.05.
RESULTS AND DISCUSSION
Differences among diets (Table 1) resulted from compositional differences in oat,
sorghum, and corn silages (Table 2). As corn silage was replaced on a weight basis, the
diets were not isonitrogenous or isocaloric. As indicated earlier, the control, CS diet was
formulated before the study to meet or exceed NRC (2001) requirements of the cows at
the beginning of the experiment. Cows, however, produced less milk with a lower true
protein content during the experiment. Therefore, MP supply exceeded requirements for
all diets. Crude protein concentration was, numerically, highest for OS, intermediate for
SS, and lowest for CS, following the statistical ranking of CP concentration in oat,
sorghum, and corn silages. Soluble CP was also higher (P < 0.001) in the oat and
sorghum silages than the corn silage. Neutral detergent fiber and ADF content
numerically increased from CS to OS to SS. Starch was numerically lower in OS and SS
compared with CS, but NEL balance was similar and positive for all diets.
50
In the current study, the intention was to harvest the sorghum silage at the soft
dough stage after starch was deposited in the grain. However, a late planting prevented
adequate crop development before a killing frost, which forced a harvest at the milk stage
before starch deposition. This resulted in a lower than expected yield of 8.13 t DM/ha and
almost nonexistent starch concentrations in the sorghum silage. In contrast, Oliver et al.
(2004) reported a yield of 9.7 t DM/ha with 16.8% starch for BMR-6 sorghum harvested
at a late dough stage. This highlights the importance of management, particularly prompt
planting, in the use of alternative forages. Oats yielded 4.79 t DM/ha and corn silage
varieties had an average yield of 18 t DM/ha. The DM content of all silages was between
30 and 40%. Oat and sorghum silages had pH of around 4.5, which is typical of grass
silages. Titratable acidity matched the levels of total acid in both silages. Lactic acid was
low in the sorghum silage. Lactic and acetic acids in the oat silage fell within normal
values according to the Dairy One Interactive Feed Composition Library
(http://dairyone.com/analytical-services/feed-and-forage/feed-composition-
library/interactive-feed-composition-library/; accessed February 28, 2017). Butyric acid
was detected above 0.5% in the oat silage possibly indicating an extended fermentation
process partly due to wetter harvested material. Drying oats is a challenge in cool fall
weather. Both sorghum and oat silages contained starch concentrations below 1%. Oat
silage had higher (P < 0.001) K and sorghum silage had a higher concentration (P = 0.02)
of ethanol soluble carbohydrates (i.e., sugars) than the other silages.
Dry matter intake was not different between CS and OS diets; however, DMI was
decreased (P = 0.02) in the SS diet. In this experiment, we substituted part of the ration

51
corn silage with 1 of 2 low-starch forages which did not contain developed grain. Corn
silage routinely contains starch concentrations above 30% and could be considered part
concentrate and part forage (Boivin et al., 2013). Dry matter intake of high producing
dairy cows can be limited by rumen fill, which may present a challenge in meeting
energy demands (Allen, 2000). Rumen fill is also positively related to NDF content of
the diet (Allen, 2000). Nichols et al. (1998) demonstrated that increasing dietary NDF
concentrations for dairy cows decreased DMI. Oltjen and Bolsen (1980) showed that
increasing diet ADF content in growing steers decreased DMI. Diets with lower
concentrations of digestible fiber cause rumen fill at lower DMI than diets with higher
concentrations of digestible fiber (Allen, 2000; Mertens, 2009).
The sorghum silage in this experiment had greater NDF, ADF, and lignin content
than the corn silage which was also observed in other studies comparing BMR sorghum
with corn silage (Oliver et al., 2004; Bernard and Tao, 2005). The higher concentration of
less digestible fiber in the sorghum silage likely explains the lower DMI of the SS diet,
resulting from slower digestion and passage rate and increased ruminal fill. The OS diet,
likewise, was higher in NDF and ADF than the CS diet, but contained less lignin and had
more digestible NDF. The increased digestibility of the oat silage NDF versus corn silage
NDF potentially limited the effects of ruminal fill in OS. This resulted in similar DMI
between OS and CS. However, OS resulted only in a slight numerical increase in intake
NDF as a percent of BW over SS. Furthermore, OS and SS had the same intake of forage
NDF as a percent of BW (1.08%) at different DMI. This agrees with Mertens (2009),
who proposed that NDF content was the major intake limiting factor at high DMI with
52
NDFD altering intake regulation to a lesser extent. Therefore, the difference in NDF
concentration between oat silage and sorghum silage may have contributed more to the
change in DMI than the difference in NDFD.
The ruminal in situ results (Table 3) compare the alternative forages of this study
with corn silage and alfalfa haylage from another study, thus direct conclusions cannot be
made regarding the corn silage and alfalfa haylage from the current experiment.
However, the nutrient profiles of the 2 sets of conventional forages were similar, and the
results seem to support the argument that sorghum silage caused rumen fill limitation of
DMI at lower intakes partly because of its lower degradability. In contrast, oat silage
intake may have been regulated by energy demand since its greater degradability should
have allowed a higher NDF intake, though as discussed above, the NDF intakes for OS
and SS were not different. Dry matter in situ disappearance regression curves for alfalfa
haylage, corn silage, oat silage, and sorghum silage are in Figure 1. The DM
disappearance (i.e., degradability) curve differed (P < 0.001) among forages (Fig. 1).
Corn silage had the highest (P < 0.01) percent soluble DM, caused by its high starch
content, followed by oat silage, alfalfa haylage, and sorghum silage (Table 3). The
potentially degradable fraction of DM (b) was higher (P ≤ 0.002) for oat and sorghum
silage than for alfalfa haylage (Table 3). Alfalfa haylage had the highest (P < 0.001) rate
of degradation of the b fraction followed by oat silage, sorghum silage, and corn silage
(Table 3). Corn silage also had the highest (P = 0.002) ED for DM followed closely by
oat silage, then alfalfa haylage, and lastly, sorghum silage (Table 3). The oat silage had a
more rapid rate of DM degradation than corn silage and similar ED, which may have

53
caused similar rumen fill and DMI. The lower rumen disappearance of sorghum silage
DM, may have led more rapidly to rumen fill and lower DMI.
Neutral detergent fiber in situ disappearance curves for alfalfa haylage, oat silage,
sorghum silage, and corn silage is shown in Figure 2. Alfalfa had the highest (P < 0.001)
soluble NDF fraction, compared with oat and sorghum silages (Table 3). The highest (P <
0.001) potentially degradable NDF fraction was in the oat silage followed by sorghum
silage, and was lowest in the alfalfa haylage (Table 3). There was a tendency (P = 0.06)
for alfalfa haylage to have a higher degradation rate than sorghum silage (Table 3).
Effective degradability of NDF was higher (P < 0.001) in oat silage than either alfalfa
haylage or sorghum silage (Table 3). The higher disappearance of oat silage NDF
resulted in higher ED of NDF compared with the sorghum silage, which was reflected in
higher DMI for OS compared with SS.
The increased degradability of the oat silage may have come from the delayed
maturity related to their fall growth which has been shown to have 38% greater NDFD
than spring-grown oats (Contreras-Govea and Albrecht, 2006). Additionally, the fall
weather provided cooler growing temperatures than temperatures during a spring growing
season. Forage grown at cooler temperatures deposit less lignin and have increased in
vitro NDFD compared with the same forages grown at higher temperatures (Buxton,
1996).
Ration particle size can also affect DMI intake, but responses are not always
consistent (Allen, 2000; Bhandari et al., 2008). Diets only had a slightly, but significantly
(P = 0.02) different particle size distribution on the top, 19 cm, sieve as measured by the
54
Penn State particle separator. Reported on an as-fed basis, OS had more long particles
(10.6%) than CS (7.8%). The SS diet (9.1%) did not differ from the other 2 diets. The
other screens averaged 43.6, 17.5, and 29.7% (8 mm, 4 mm, and bottom pan,
respectively) of the sample. The particle distribution data are in general agreement with
the recommendations of Heinrichs (2013). Forage particle buoyancy and specific gravity
can affect rumen fill and DMI (Allen, 2000), but this did not appear to be the case in the
current study.
Complete MY data are in Table 4. Milk yield was similar for CS and OS, but
decreased (P = 0.006) for SS. Feed efficiency was not affected by diet. Dry matter intake
directly affects MY and is the likely reason for the observed MY differences in the
current study. Lusk et al. (1984) reported no difference in MY in 2 experiments when
BMR-12 sorghum silage completely replaced corn silage in the ration. Milk yield was
lower (around 25 kg/d) in that study and, in contrast to the current study, they did not see
a decrease in DMI. Additionally, the sorghum silage used by Lusk et al. (1984) had lignin
and NDF concentrations similar to the corn silage, whereas in the current study, the
sorghum silage had considerably higher lignin and NDF content than the corn silage.
Aydin et al. (1999) reported decreased DMI and MY when comparing corn silage versus
BMR sorghum diets that were 6%-units different in NDF. This agrees with our finding
comparing corn silage to BMR sorghum diets with 2%-units difference. Contrastingly,
Aydin et al. (1999), in a second experiment, reported no decrease in DMI or MY when
comparing corn silage versus BMR sorghum diets with equal NDF concentration. Grant
et al. (1995) and Oliver et al. (2004) both found no difference in DMI or MY between

55
BMR sorghum silage and corn silage diets. Their BMR sorghum silages, however, were
harvested in the dough stage and contained significant amounts of starch whereas ours
had less than 1% starch. Miron et al. (2007) reported similar DMI and MY between diets
containing BMR sorghum silage or corn silage but, unlike the current study, corn grain
was added to the sorghum silage diet to increase dietary starch. Colombini et al. (2015)
replaced corn silage with sorghum sudangrass silage plus corn grain and, similar to our
results, reported a tendency for a reduction in DMI along with a significant decrease in
MY. They added grain to the sorghum diet to match the starch concentrations in the corn
silage diet, but the sorghum was not a BMR variety. In general, differences in MY
responses to sorghum silage between the current and previous studies can largely be
explained by the relatively high MY in the current study and the replacement of corn
silage by low starch sorghum silage without additional energy supplementation.
The OS diet had no effect on DMI or MY in the current experiment. Earlier
studies reported poor results of feeding oat silage to cattle (Christensen et al., 1977;
Khorasani et al., 1993; McCartney and Vaage, 1994). Oat silage harvested in the early
dough stage was compared with corn silage and barley silage by Burgess et al. (1973) in
dairy cows. These authors reported an increased DMI per unit of BW of the oat silage
over the other treatments. However, total DMI (grain supplement plus silage) was not
different in that experiment and MY was lowest for the oat silage diet. Oltjen and Bolsen
(1980) found decreased DMI when comparing oat to corn silage in an 84% silage, 16%
supplement diet fed to growing steers. Both of those studies used dough stage spring
grown oats which have more ADF than the boot stage fall grown oats used in the current

56
experiment. More recently, TMR containing oat silage has been shown to successfully
support MY above 35 kg/d (Leonardi et al., 2005; Bhandari et al., 2008). Milk yield of
around 39 kg/d was reported when oat silage replaced alfalfa haylage at a 25% inclusion
rate in a corn silage-based diet (Leonardi et al., 2005). Their oat silage had similar
nutrient composition to the oat silage used in the current trial. Bhandari et al. (2008),
investigating the effect of silage particle length, used milk stage oat silage at 24% of the
diet DM along with 24% alfalfa haylage and reported MY of 36 kg/d. Milk yield and
intake data from the current study for OS agree with these more recent reports.
Compared with CS, milk fat concentration was not altered by OS but was
increased (P = 0.02) by SS. Milk fat yield did not differ among diets. Milk true protein
concentration was decreased (P = 0.03) by SS compared with OS or CS. Yield of milk
true protein followed the same pattern. Oliver et al. (2004) did not report a change in
either milk fat or protein concentration between BMR-6 sorghum and corn silage-based
diets likely due to the similarly high NDF (> 38% DM) and moderate starch (≤ 21% DM)
concentrations in their diets. The effect of SS on milk components is in agreement with
Miron et al. (2007) who reported an increase in milk fat content and a decrease in protein
content for both traditional hybrid sorghum and BMR sorghum when replacing corn
silage. Their sorghum diets had higher NDF concentrations than the corn silage diet as
was the case in the current study. Bernard and Tao (2015) also observed an increase in
milk fat concentration of a forage sorghum silage based diet versus corn silage, but there
was no change in milk protein. Once again there was a difference in the fiber contents of
the diet, which explained the increased milk fat content (Bernard and Tao, 2015). In that

57
study, additional ground corn and soybean meal added to the sorghum diets may have
removed differences in milk protein content whereas in our experiment no additional
concentrates were fed.
The increase in milk fat concentration in SS is likely multifactorial. Miron et al.
(2007) suggested that body fat mobilization could help explain the high milk fat content
observed in their sorghum treatments. Our milk FA data (Table 5) suggest that body fat
mobilization may have played a role in the increased milk fat content of SS in the current
study. We observed a decrease (P = 0.03) in 12:0, a de novo synthesized FA, for OS and
SS and an increase (P = 0.01) in 18:0, a preformed FA that originates either from the diet
or from lipolysis of body fat reserves (Palmquist et al., 1993). Supplemental sugar has
been shown to quadratically increase milk fat concentration with optimums of 4.8 and
6.3% total sugar in the diet in 2 studies by Broderick and Radloff (2004). The higher
ethanol soluble carbohydrate concentration in the sorghum silage versus corn silage in the
current study may have contributed to the increased milk fat, though the increase in sugar
was only around 0.25% of the diet DM due to the sorghum silage, so the effect may have
been small. Razzaghi et al. (2016) reported higher fat content and lower total milk trans-
18:1 FA with a sucrose treatment. It is known that increases in trans-10 18:1 milk FA are
positively related to milk fat depression for cows fed a low-fiber high-oil diet (Rico and
Harvatine, 2013). The SS diet had lower trans-9 18:1 and trans-10 18:1 FA (P ≤ 0.01)
which would seem to indicate a rumen environment that was more supportive of milk fat
production, but the same FA effect was observed for OS, which resulted in no change in
milk fat concentration. Along with these factors, lower milk fat concentration in CS and

58
OS may have been partially a result of the so-called dilution effect due to higher MY for
these 2 treatments compared with SS. Based on this line of thought, protein should also
have been concentrated, but we did not observe this effect for SS. Milk protein content is
elevated by increased energy intake (Emery, 1978) and milk protein concentration may
have been decreased by SS because of lower dietary digestible energy intake resulting
from lower DMI with less starch and higher lignin in the sorghum silage. This would also
explain why numerically less lactose was produced in SS. Less available energy for
ruminal microbes decreases microbial protein synthesis. Though there is only a tendency
(P = 0.06) for decreased urinary uric acid excretion and numerically lower allantoin
excretion in SS to provide support for this hypothesis. The high digestibility of the oat
silage may have provided similar amounts of energy as the corn silage to support
microbial protein and milk protein synthesis. Lactose concentration and yield, MUN, and
ECM yield were not statistically affected by diet.
Several individual milk FA were statistically affected by diet but when grouped as
saturated, mono-unsaturated, poly-unsaturated, total trans FA or odd- and branch-
chained FA no effects were observed. Odd- and branch- chained milk FA are positively
related to microbial flow to the duodenum (Vlaeminck et al., 2006) and no differences
among diets for this parameter matches the lack of effect observed for purine derivatives.
There was an increase (P <0.001) in iso 15:0 for OS and SS which has been positively
related with rumen acetate concentrations (Fievez et al., 2012). Milk FA 15:0 was
decreased (P = 0.005) in SS indicating increased proportions of rumen butyrate and
acetate and decreased propionate based on the relationships put forth by Fievez et al.

59
(2012). These rumen VFA changes are expected with increased dietary NDF and
decreased starch such as in OS and SS.
Nutrient intake and digestibility data are in Table 6. The intake data are a
reflection of the differences in DMI and nutrient content of the oat, sorghum and corn
silages. Crude protein intake was greater (P = 0.04) for OS compared with CS or SS.
Intakes of NDF and ADF were higher (P ≤ 0.02) for both OS and SS versus CS.
Conversely, starch intake was highest (P < 0.001) for CS, intermediate for OS and lowest
for SS. Digestibility of DM, OM, CP, NDF, and ADF were all increased (P < 0.001) by
OS compared with CS and SS. The largest increases were observed in NDF and ADF
digestibilities. The SS diet resulted in lower (P < 0.001) DM, OM, and CP digestibilities
than the other 2 diets, but fiber digestibility equal to CS. Higher lignin concentration in
SS from the sorghum silage and lower lignin concentration in OS from the oat silage
compared with CS can partially explain these effects as lignin concentration is negatively
correlated to forage digestibility (Mertens, 1985). This is supported by results from 2
experiments by Aydin et al. (1999) reporting on digestibility of BMR sorghum,
traditional sorghum and corn silage in lactating dairy cows. In their first experiment,
sorghum silages had higher lignin content and decreased total tract ADF digestibility. In
their second experiment, lignin content was similar between BMR sorghum and corn
silage and the 2 forages had similar in vitro potentially digestible NDF and 30 h NDFD.
It is known that fiber digestion is negatively affected by higher starch
concentrations causing a reduction in rumen pH (Firkins, 1997; Lechartier and Peyraud,
2011). In the current study, both OS and SS had lower starch concentrations, compared

60
with CS. This may have promoted fiber degradation in the rumen because the decrease in
NFC (2.5 to 2.8%-units) was in the range reported to have a large digestibility response
(Sarwar et al., 1992). Increased fiber digestion from lower dietary starch concentration
and lower DMI with slower passage rate in SS may have been counter-balanced by
decreased DM digestibility due to higher lignin content from the sorghum silage. For the
OS diet, lower starch and lower lignin concentrations supported higher fiber digestion.
Starch is more digestible than NDF, which may explain the decrease in DM and OM
apparent digestibility for the SS diet, but does not explain the increase in DM and OM
apparent digestibility for the OS diet. It should be noted that total tract apparent
digestibility was estimated using iNDF as an internal marker. Though significant, DM,
OM, and CP apparent digestibilities are less than 2%-units different from CS and reflect
differences in the TMR iNDF (iNDF, % ± SD: CS, 12.0 ± 0.45; OS 11.2 ± 0.37; SS 12.8
± 0.54). The higher CP apparent digestibility in the OS diet could have resulted from
increased protein solubility (and perhaps ammonia concentration, which was not
analyzed in this study) in the oat silage. The CS diet had the highest (P < 0.001) starch
digestibility followed by OS and SS. It is possible that starch in the corn silage was more
digestible than starch in the ground corn which was the other major starch source in the
diets. Indeed, Lanzas et al. (2007) reported a higher ruminal starch degradation rate for
processed corn silage (0.32/h) compared to finely ground corn (0.15/h). The CS diet in
the current experiment contained proportionately more starch from corn silage than OS or
SS.

61
Nitrogen utilization data is in Table 7. The OS diet resulted in higher (P = 0.04)
intake of N than either SS or CS because of the higher CP content of the oat silage. There
was a tendency for higher (P = 0.08) total excreta N for OS compared with CS, which
reflects the higher N intake and similar milk N secretion. Compared with CS, OS
increased (P = 0.03) urinary urea N excretion. The higher N intake and higher soluble
protein in the oat silage was the likely reason for increased urinary urea N excretion with
OS compared with the other diets (Van Soest, 1994; Broderick, 2003). The sorghum
silage had a higher CP content than corn silage, but, with the decrease in DMI, N intake
for SS was not different from CS. There was a tendency (P = 0.07) for increased urinary
urea N in SS versus CS, which may be explained with lower energy availability in the
rumen with the former diet. Milk N secretion and use efficiency were decreased (P =
0.05) by SS compared with CS due to the decreased milk and milk protein yields with SS
discussed earlier. As a percent of intake, urine N and total excreta N were unaffected by
diet, however, fecal N excretion was highest (P < 0.001) for SS, intermediate for CS, and
lowest for OS. This agrees with the lower and higher total tract apparent CP digestibility
of these diets, respectively.
Enteric emissions of CO2 and CH4 in Table 7 were not different among diets.
Methane emissions were not affected when presented as yield (i.e., per kg of DMI) or
intensity (i.e., per kg of MY). It has been suggested by Hristov et al. (2013) that
increasing forage digestibility is expected to decrease enteric CH4 emission intensity and
is 1 of the promising mitigation strategies. Hart et al. (2009) fed low and high digestible
grass to cows and measured CH4 emissions. They reported higher CH4 emissions in cows
62
fed higher digestible grass but emission intensity was lower. We did not observe an effect
on CO2 or CH4 emissions by diet despite the differences in apparent digestibility. The
likely explanation for this lack of effect is the small magnitude of differences in OM
digestibility, DMI, and MY. Dry matter intake is by far the greatest driver of enteric CH4
emission in ruminants and only differed by 5% in this study. Colombini et al. (2015)
similarly reported only tendencies of higher CH4 emissions when feeding sorghum silage
in place of corn silage to lactating dairy cows. In their study, DMI differed by 9%. Higher
DMI in the current study explains why daily CH4 emissions results were higher than
those reported by Colombini et al. (2015; 523 versus 342 g/d, respectively), yet emission
intensity was lower, likely due to higher MY in the current experiment.
The economic outcome of the use of alternative forages is critical for their
adoption. The IOFC of CS and OS were comparable at $9.49 and $9.43/cow/d,
respectively (data not in tables). The SS diet resulted in slightly lower IOFC,
$9.32/cow/d. A disadvantage in double cropping fall oats in central Pennsylvania is that
they must be planted in mid-August to yield well. To plant at that time, a short season
corn (< 85 d relative maturity) must be used. Short season corn usually has a decreased
yield compared with longer season varieties and this raises corn crop production costs.
The SS diet had the lowest IOFC due to a lower MY and a lower BMR sorghum crop
yield even though input costs were lower. When we ran the IOFC analysis with a 65
milking cow dairy, we had to account for rental costs of additional arable land to produce
the necessary forage due to the low yield from a late planting date. Sorghum would have
an advantage of using less irrigation water, but irrigation is not very common in the

63
northeastern U.S and, therefore, was not included in the IOFC analysis. Sorghum can
perform better than corn silage on soils with low water holding capacity which would
positively affect the IOFC of SS. Using a scenario of a higher yield of 13.4 t/ha that
would be more typical with a proper planting, we found the IOFC of SS to increase to
$9.43/cow/d. This is equal to the OS scenario and only $0.06/cow/d lower than the CS
scenario. The reported results are only a model and individual farm results would vary,
but they do demonstrate that, financially, these forages deserve consideration in dairy
farm crop rotations and lactating cow feeding programs.
CONCLUSIONS
In this study, we demonstrated that fall grown oat and BMR-6 dwarf sorghum
silages can support MY above 38 kg/d when included at 10% of the diet DM replacing
corn silage. The OS diet gave similar DMI, milk, and milk component yields as the
control corn silage diet. The higher milk and urinary urea N excretion with OS reveals a
potential for reducing dietary RDP from other feed sources when replacing corn silage
for oat silage. The SS diet decreased DMI, milk, and milk protein yields, which indicates
a need for additional rumen digestible energy sources when feeding low-starch sorghum
silage in place of corn silage. Production data from this experiment provide useful
information but should be interpreted with caution due to the lower number of
experimental units. The alternative forages tested in this study have potential in an
integrated cropping strategy and nutritional program for high-producing dairy cows.

64
ACKNOWLEDGEMENT
This project was supported by the Northeast Sustainable Agriculture Research and
Education (SARE) program. SARE is a program of the National Institute of Food and
Agriculture, U.S. Department of Agriculture. The authors thank the staff of Farm
Operations and Services of the Pennsylvania State University for growing and harvesting
the crops fed in our experiment. We also thank the staff of the Pennsylvania State
University’s Dairy Teaching and Research Center for their conscientious care of the
experimental cows. Additionally, we thank Virginia Ishler for her help with the IOFC
analysis.
REFERENCES
AOAC International. 2000. Official Methods of Analysis. 17th ed. AOAC International,
Arlington, VA.
AOAC International. 2006. Official Methods of Analysis. 18th ed. AOAC International,
Arlington, VA.
Abdelhadia, L. O., and F. J. Santini. 2006. Corn silage versus grain sorghum silage as a
supplement to growing steers grazing high quality pastures: Effects on performance
and ruminal fermentation. Anim. Feed Sci. Technol. 127:33–43.
Allen, M. S. 2000. Effects of diet on short-term regulation of feed intake by lactating
dairy cattle. J. Dairy Sci. 83:1598-1624.
Aydin, G., R. J. Grant, and J. O’Rear. 1999. Brown midrib sorghum in diets for lactating
dairy cows. J. Dairy Sci. 82:2127–2135.
Bernard, J. K., and S. Tao. 2015. Short communication: Production response of lactating
dairy cows to brachytic forage sorghum silage compared with corn silage from first
or second harvest. J. Dairy Sci. 98:8994–9000.
Boivin, M., R. Gervais, and P. Y. Chouinard. 2013. Effect of grain and forage fractions of
corn silage on milk productions and composition in dairy cows. Animal. 7:245-254.
65
Bhandari, S. K., S. Li, K. H. Ominski, K. M. Wittenberg, and J. C. Plaizier. 2008. Effects
of the chop lengths of alfalfa silage and oat silage on feed intake, milk production,
feeding behavior, and rumen fermentation of dairy cows. J. Dairy Sci. 91:1942–
1958.
Branson, T. F., P. L. Guss and E. E. Ortman. 1969. Toxicity of sorghum roots to larvae of
the western corn rootworm. J. Econ. Entom. 62:1375-1378.
Broderick, G. A. 2003. Effects of varying dietary protein and energy levels on the
production of lactating dairy cows. J. Dairy Sci. 86:1370–1381.
Broderick, G. A., and W. J. Radloff. 2004. Effect of molasses supplementation on the
production of lactating dairy cows fed diets based on alfalfa and corn silage. J. Dairy
Sci. 87:2997-3009.
Buxton, D. R. 1996. Quality-related characteristics of forages as influenced by plant
environment and agronomic factors. Anim. Feed Sci. Technol. 59:37-49.
Carey, P. L., K. C. Cameron, H. J. Di, G. R. Edwards, and D. F. Chapman. 2016. Sowing
a winter catch crop can reduce nitrate leaching losses from winter-applied urine
under simulated forage grazing: a lysimeter study. Soil Use Manag. 32:329-337.
Chen, X. B., Y. K. Chen, M. F. Franklin, E. R. Ørskov, and W. J. Shand. 1992. The effect
of feed intake and body weight on purine derivative excretion and microbial protein
supply in sheep. J. Anim. Sci. 70:1534–1542.
Christensen, D. A., B. D. Owen, G. Steacy, J. P. Mtimuni, and W. L. Crowlen. 1977.
Nutritive value of whole crop silage made from seven cereal cultivars. Can. J. Anim.
Sci. 57:537-542.
Colombini, S., M. Zucali, L. Rapetti, G. M. Crovetto, A. Sandrucci, and L. Bava. 2015.
Substitution of corn silage with sorghum silages in lactating cow diets: In vivo
methane emission and global warming potential of milk production. Agric. Syst.
136:106–113.
Contreras-Govea, F. E., and K. A. Albrecht. 2006. Forage production and nutritive value
of oat in autumn and early summer. Crop Sci. 46:2382–2386.
Di, H. J. and K. C. Cameron. 2002. Nitrate leaching in temperate agroecosystems:
sources, factors and mitigating strategies. Nutrient Cycling in Agroecosystems.
64:237–256
Dubois, M., K. A. Gilles, J. K. Hamilton, P. A. Rebers, and F. Smith. 1956. Colorimetric
method for determination of sugars and related substances. Anal. Chem. 28:350.
Emery, R. S. 1978. Feeding for increased milk protein content. J. Dairy Sci. 61:825-828.
Faé, G. S., R. M. Sulc, D. J. Barker, R. P. Dick, M. L. Eastridge, and N. Lorenz. 2009.
Integrating winter annual forages into a no-till corn silage system. Agron. J.
101:1286–1296.
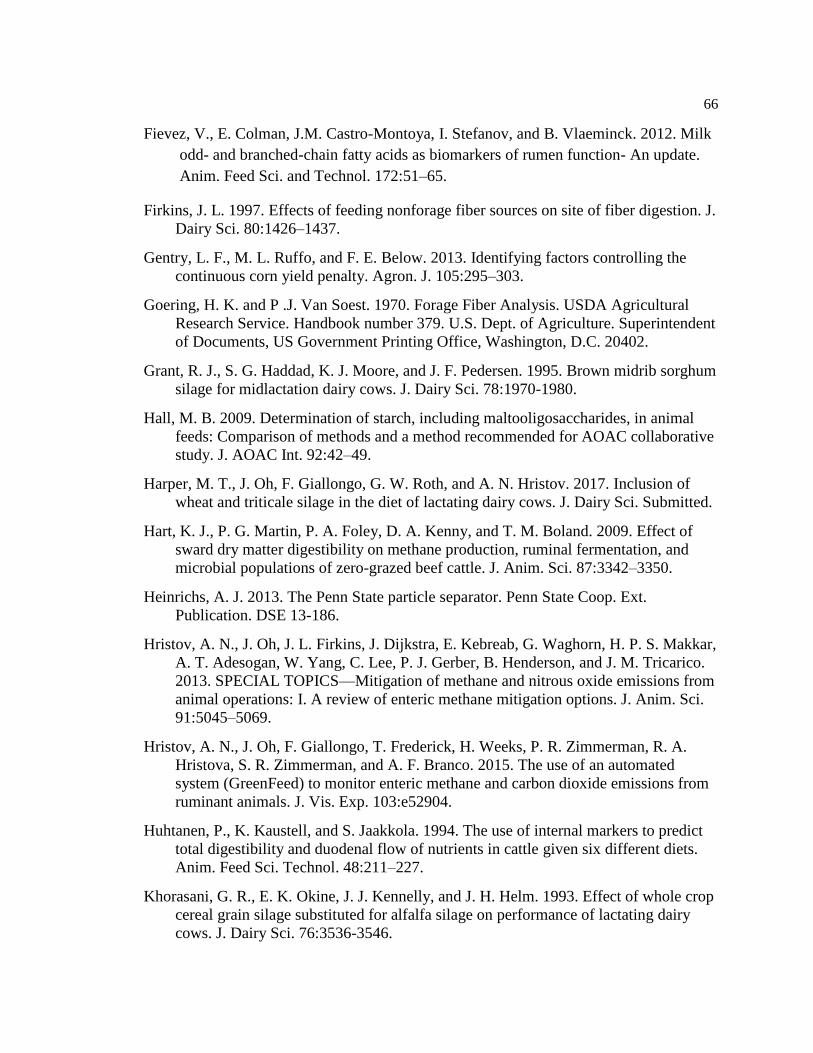
66
Fievez, V., E. Colman, J.M. Castro-Montoya, I. Stefanov, and B. Vlaeminck. 2012. Milk
odd- and branched-chain fatty acids as biomarkers of rumen function- An update.
Anim. Feed Sci. and Technol. 172:51–65.
Firkins, J. L. 1997. Effects of feeding nonforage fiber sources on site of fiber digestion. J.
Dairy Sci. 80:1426–1437.
Gentry, L. F., M. L. Ruffo, and F. E. Below. 2013. Identifying factors controlling the
continuous corn yield penalty. Agron. J. 105:295–303.
Goering, H. K. and P .J. Van Soest. 1970. Forage Fiber Analysis. USDA Agricultural
Research Service. Handbook number 379. U.S. Dept. of Agriculture. Superintendent
of Documents, US Government Printing Office, Washington, D.C. 20402.
Grant, R. J., S. G. Haddad, K. J. Moore, and J. F. Pedersen. 1995. Brown midrib sorghum
silage for midlactation dairy cows. J. Dairy Sci. 78:1970-1980.
Hall, M. B. 2009. Determination of starch, including maltooligosaccharides, in animal
feeds: Comparison of methods and a method recommended for AOAC collaborative
study. J. AOAC Int. 92:42–49.
Harper, M. T., J. Oh, F. Giallongo, G. W. Roth, and A. N. Hristov. 2017. Inclusion of
wheat and triticale silage in the diet of lactating dairy cows. J. Dairy Sci. Submitted.
Hart, K. J., P. G. Martin, P. A. Foley, D. A. Kenny, and T. M. Boland. 2009. Effect of
sward dry matter digestibility on methane production, ruminal fermentation, and
microbial populations of zero-grazed beef cattle. J. Anim. Sci. 87:3342–3350.
Heinrichs, A. J. 2013. The Penn State particle separator. Penn State Coop. Ext.
Publication. DSE 13-186.
Hristov, A. N., J. Oh, J. L. Firkins, J. Dijkstra, E. Kebreab, G. Waghorn, H. P. S. Makkar,
A. T. Adesogan, W. Yang, C. Lee, P. J. Gerber, B. Henderson, and J. M. Tricarico.
2013. SPECIAL TOPICS—Mitigation of methane and nitrous oxide emissions from
animal operations: I. A review of enteric methane mitigation options. J. Anim. Sci.
91:5045–5069.
Hristov, A. N., J. Oh, F. Giallongo, T. Frederick, H. Weeks, P. R. Zimmerman, R. A.
Hristova, S. R. Zimmerman, and A. F. Branco. 2015. The use of an automated
system (GreenFeed) to monitor enteric methane and carbon dioxide emissions from
ruminant animals. J. Vis. Exp. 103:e52904.
Huhtanen, P., K. Kaustell, and S. Jaakkola. 1994. The use of internal markers to predict
total digestibility and duodenal flow of nutrients in cattle given six different diets.
Anim. Feed Sci. Technol. 48:211–227.
Khorasani, G. R., E. K. Okine, J. J. Kennelly, and J. H. Helm. 1993. Effect of whole crop
cereal grain silage substituted for alfalfa silage on performance of lactating dairy
cows. J. Dairy Sci. 76:3536-3546.
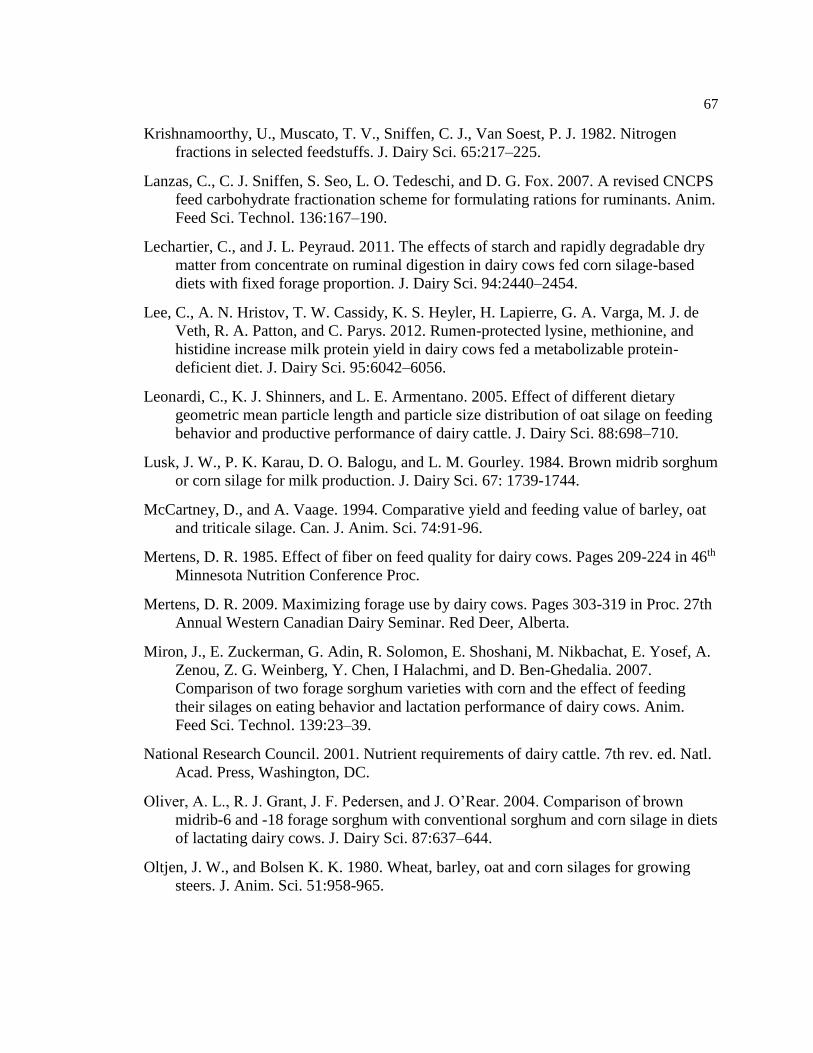
67
Krishnamoorthy, U., Muscato, T. V., Sniffen, C. J., Van Soest, P. J. 1982. Nitrogen
fractions in selected feedstuffs. J. Dairy Sci. 65:217–225.
Lanzas, C., C. J. Sniffen, S. Seo, L. O. Tedeschi, and D. G. Fox. 2007. A revised CNCPS
feed carbohydrate fractionation scheme for formulating rations for ruminants. Anim.
Feed Sci. Technol. 136:167–190.
Lechartier, C., and J. L. Peyraud. 2011. The effects of starch and rapidly degradable dry
matter from concentrate on ruminal digestion in dairy cows fed corn silage-based
diets with fixed forage proportion. J. Dairy Sci. 94:2440–2454.
Lee, C., A. N. Hristov, T. W. Cassidy, K. S. Heyler, H. Lapierre, G. A. Varga, M. J. de
Veth, R. A. Patton, and C. Parys. 2012. Rumen-protected lysine, methionine, and
histidine increase milk protein yield in dairy cows fed a metabolizable protein-
deficient diet. J. Dairy Sci. 95:6042–6056.
Leonardi, C., K. J. Shinners, and L. E. Armentano. 2005. Effect of different dietary
geometric mean particle length and particle size distribution of oat silage on feeding
behavior and productive performance of dairy cattle. J. Dairy Sci. 88:698–710.
Lusk, J. W., P. K. Karau, D. O. Balogu, and L. M. Gourley. 1984. Brown midrib sorghum
or corn silage for milk production. J. Dairy Sci. 67: 1739-1744.
McCartney, D., and A. Vaage. 1994. Comparative yield and feeding value of barley, oat
and triticale silage. Can. J. Anim. Sci. 74:91-96.
Mertens, D. R. 1985. Effect of fiber on feed quality for dairy cows. Pages 209-224 in 46th
Minnesota Nutrition Conference Proc.
Mertens, D. R. 2009. Maximizing forage use by dairy cows. Pages 303-319 in Proc. 27th
Annual Western Canadian Dairy Seminar. Red Deer, Alberta.
Miron, J., E. Zuckerman, G. Adin, R. Solomon, E. Shoshani, M. Nikbachat, E. Yosef, A.
Zenou, Z. G. Weinberg, Y. Chen, I Halachmi, and D. Ben-Ghedalia. 2007.
Comparison of two forage sorghum varieties with corn and the effect of feeding
their silages on eating behavior and lactation performance of dairy cows. Anim.
Feed Sci. Technol. 139:23–39.
National Research Council. 2001. Nutrient requirements of dairy cattle. 7th rev. ed. Natl.
Acad. Press, Washington, DC.
Oliver, A. L., R. J. Grant, J. F. Pedersen, and J. O’Rear. 2004. Comparison of brown
midrib-6 and -18 forage sorghum with conventional sorghum and corn silage in diets
of lactating dairy cows. J. Dairy Sci. 87:637–644.
Oltjen, J. W., and Bolsen K. K. 1980. Wheat, barley, oat and corn silages for growing
steers. J. Anim. Sci. 51:958-965.

68
Ørskov, E. R., and I. McDonald. 1979. The estimation of protein degradability in the
rumen from incubation measurements weighted according to rate of passage. J.
Agric. Sci. (Camb.) 92:499–503.
Palmquist, D. L., A. D. Beaulieu, and D. M. Barbano. 1993. Feed and animal factors
influencing milk fat composition. J. Dairy Sci. 76:1753-1771.
Penn State Extension. 2015. Income over feed cost. Accessed October 10, 2016.
http://extension.psu.edu/animals/dairy/business-management/financial-tools/income-
over-feed-cost
Penn State Extension. 2016. Cash flow spreadsheet. Accessed October 10, 2016.
http://extension.psu.edu/animals/dairy/business-management/financial-tools/cash-
flow-planning
Razzaghi, A., R. Valizadeh, A. A. Naserian, M. Danesh Mesgaran, A. J. Carpenter, and
M. H. Ghaffari. 2016. Effect of dietary sugar concentration and sunflower seed
supplementation on lactation performance, ruminal fermentation, milk fatty acid
profile, and blood metabolites of dairy cows. J. Dairy Sci. 99:3539–3548.
Rico, D. E., and K. J. Harvatine. 2013. Induction of and recovery from milk fat
depression occurs progressively in dairy cows switched between diets that differ in
fiber and oil concentration. J. Dairy Sci. 96:6621–6630.
Sarwar, M., J. L. Firkins, and M. L. Eastridge. 1992. Effects of varying forage and
concentrate carbohydrates on nutrient digestibilities and milk production by dairy
cows. J. Dairy Sci. 75:1533-1542.
Shepherd, M. A. 1999. The effectiveness of cover crops during eight years of a UK
sandland rotation. Soil Use Manag. 15:41–48.
Sindelar, A. J., M. R. Schmer, V. L. Jin, B. J. Wienhold, and G. E. Varvel. 2016. Crop
rotation affect corn, grain sorghum, and soybean yields and nitrogen recovery.
Agron. J. 108:1592-1602.
Sjaunja, L. O., L. Baevre, L. Junkkarinen, J. Pedersen, and J. Setälä. 1990. A Nordic
proposal for an energy corrected milk (ECM) formula. Proc. 27th Session Int.
Comm. Breeding Product. Milk Anim., Paris, France. Wageningen Acad. Publ.,
Wageningen, the Netherlands.
Van Soest, P. J., J. B. Robertson, and B. A. Lewis. 1991. Methods for dietary fiber,
neutral detergent fiber, and nonstarch polysaccharides in relation to animal nutrition.
J. Dairy Sci. 74:3583–3597.
Van Soest, P. J. 1994. Nutritional ecology of the ruminant. 2nd Ed. Cornell University
Press, Ithaca, NY.
Vencill, W.K., R. L. Nichols, T. M. Webster, J. K. Soteres, C. Mallory-Smith, N. R.
Burgos, W. G. Johnson, and M. R. McClelland. 2012. Herbicide resistance: Toward

69
an understanding of resistance development and the impact of herbicide-resistant
crops. Weed Science. 60:Sp1. 2-30.
Vlaeminck, B., V. Fievez, A. R. J. Cabrita, A. J. M. Fonseca, and R. J. Dewhurst. 2006.
Factors affecting odd- and branched-chain fatty acids in milk: A review. Anim. Feed
Sci. Technol. 131:389–417.

70
Table 3-1. Ingredient and chemical composition of the diets fed in the experiment
1CS = Corn silage control diet; OS = Oat silage diet; SS = Sorghum silage diet. 2Alfalfa haylage was 36.0% DM and contained (DM basis) 22.1% CP, 23.4% NFC, and
41.4% NDF. 3SoyPLUS (West Central Cooperative, Ralston, IA). 4Molasses (Westway Feed Products, Tomball, TX). 5The mineral/vitamin premix (Cargill Animal Nutrition, Cargill Inc., Roaring Spring, PA)
contained (%, as-is basis) trace mineral mix, 0.86; MgO (56% Mg), 8.0; NaCl, 6.4;
vitamin ADE premix (Cargill Animal Nutrition, Cargill Inc.), 0.48; limestone, 37.2;
selenium premix (Cargill Animal Nutrition, Cargill Inc.), 0.07; and dry corn distillers
grains with solubles, 46.7. Ca, 14.1%; P, 0.39%; Mg, 4.60%; K, 0.45%; S, 0.38%; Se,
Diet1
Item CS OS SS
Ingredient, % of DM
Corn silage 44 34 34
Alfalfa haylage2 7.5 7.5 7.5
Oat silage - 10 -
Sorghum silage - - 10
Hay/straw mixture 4 4 4
Cottonseed hulls 4 4 4
Ground corn 11 11 11
Heat-treated whole soybeans 7.5 7.5 7.5
Solvent-extracted canola meal 7 7 7
SoyPLUS3 7.5 7.5 7.5
Molasses4 4.5 4.5 4.5
Mineral/vitamin premix5 3 3 3
Composition, % of DM
CP6 16.3 16.8 16.6
RDP8 9.7 9.7 9.5
RUP8 6.6 7.1 7.0
NDF6 32.0 33.4 34.2
ADF6 22.2 23.3 23.7
NFC7 44.3 41.5 41.8
Starch6 24.3 20.8 20.9
Fat6 4.7 4.8 4.6
NEL,7 Mcal/kg 1.56 1.55 1.55
NEL intake,7 Mcal/d 41.6 42.1 40.2
NEL balance,7 Mcal/d 4.0 4.1 3.2
MP balance,7 g/d 406 512 486
Ash6 6.7 7.5 7.0
Ca6 0.8 0.8 0.8
P6 0.4 0.4 0.4

71
6.67 mg/kg; Cu, 358 mg/kg; Zn, 1,085 mg/kg; Fe, 188 mg/kg, vitamin A, 262,656 IU/kg;
vitamin D, 65,559 IU/kg; and vitamin E, 1,974 IU/kg. 6Values calculated using the chemical analysis (Cumberland Valley Analytical Services
Inc., Maugansville, MD) of individual feed ingredients of the diet. 7Estimated based on NRC (2001).

72
Table 3-2. Nutrient composition and fermentation profile of oat and sorghum silages (%
of DM or as indicated)1
1Three composite samples per silage, one for each experimental period were analyzed
(Cumberland Valley Analytical Services Inc., Maugansville, MD). 2Largest SEM published in table; n = 9 (n represents the number of observations used in
the statistical analysis). 3Analyzed by NIR. 4NA = Not analyzed.
Silage P-Value
Item Corn Oat Sorghum SEM2 Silage
DM, % 39.1 31.6 31.4 - -
NDF 40.2c 54.7b 62.7a 2.25 0.001
ADF 25.9b 36.3a 40.8a 1.49 0.001
Lignin 3.70b 2.86b 4.89a 0.319 0.01
Fat 3.38a 3.86a 1.70b 0.172 <0.001
CP 6.83c 11.7a 9.50b 0.199 <0.001
Soluble protein 4.10c 8.07a 5.40b 0.332 <0.001
Starch 34.7a 0.27b 0.80b 0.863 <0.001
Ethanol soluble
carbohydrates 1.17b 1.77b 3.70a 0.455 0.02
Ash 3.47c 11.2a 5.70b 0.600 <0.001
Ca 0.20c 0.60a 0.41b 0.005 <0.001
P 0.24b 0.39a 0.24b 0.014 <0.001
K 1.21b 4.73a 1.62b 0.337 <0.001
pH3 3.83c 4.71a 4.31b 0.054 <0.001
Fermentation acids
Lactic3 5.43b 7.27a 2.28c 0.347 <0.001
Acetic3 0.98 2.10 1.57 0.526 0.38
Butyric3 0.0b 0.88a NA4 0.144 0.01
Titratable acidity3,
meq/100g 5.32 5.96 3.66 0.455 0.06

73
Table 3-3. Ruminal in situ DM and NDF degradability of ensiled forages1
Forage
Item Alfalfa
Haylage Corn Silage Oat Silage
Sorghum
Silage
DM
Soluble, % 36.4 ± 1.04c 54.0 ± 0.91a 41.0 ± 1.03b 32.0 ± 0.95d
Potentially degradable
(fraction b), % 32.0 ± 1.26b
46.0 ±
11.80ab 54.0 ± 3.05a 48.0 ± 4.82a
Rate of degradation of b, %/h 4.54 ± 0.46a 0.86 ± 0.34c 1.94 ± 0.27b 1.40 ± 0.27bc
Effective degradability2 55.7 ± 0.48c 64.3 ± 0.46a 62.2 ± 0.47b 47.3 ± 0.46c
NDF
Soluble, % 10.4 ± 1.47a - 3.15 ± 1.44b 3.16 ± 1.42b
Potentially degradable
(fraction b), % 38.4 ± 2.3c - 84.3 ± 3.3a 65.0 ± 4.5b
Rate of degradation of b, %/h 2.83 ± 0.46x 0.57 ± 0.023 2.15 ± 0.21xy 1.78 ± 0.28y
Effective degradability2 29.0 ± 0.69b - 38.3 ± 0.69a 27.4 ± 0.68b a,b,c Means within the same row without a common superscript differ (P < 0.05). x,y Means within the same row without a common superscript differ (P < 0.10). 1Values are model estimates ± SE of disappearance curves fit using SigmaPlot 10.0
(Systat Software, Chicago, IL) to the equation p = a + b (1 - e-ct), where p is the degraded
fraction (of DM or NDF) at time t, a is the soluble fraction, b is the potentially
degradable fraction, and c is the rate of degradation of the b fraction (Ørskov and
McDonald, 1979); DM disappearance, n = 144; NDF disappearance, n = 108 (n
represents the number of observations used in the statistical analysis). 2Effective degradability (ED) was estimated as: ED = a + b {c ÷ (c + k)}, where a, b, and
p are as above and k is the rate of passage (Ørskov and McDonald, 1979) assumed to be
0.03/h in this study. 3Corn silage NDF degradation data were fit to a linear model with an R2 = 0.94.

74
Table 3-4. Effect of oat and sorghum silage on DMI, milk production, and feed efficiency
in lactating dairy cows
Diet1 P-Value
CS OS SS SEM2 Diet
DMI, kg/d 26.7a 27.1a 26.0b 1.69 0.02
Milk yield, kg/d 39.6a 40.2a 38.7b 3.58 0.006
Milk ÷ DMI, kg/kg 1.48 1.49 1.49 0.05 0.86
Milk fat, % 3.58b 3.60b 3.74a 0.12 0.02
Milk fat,3 kg/d 1.42 1.42 1.39 0.07 0.78
Milk true protein, % 2.85a 2.83a 2.77b 0.06 0.03
Milk true protein,3 kg/d 1.13a 1.13a 1.04b 0.06 0.05
Lactose, % 5.01 4.98 4.98 0.05 0.58
Lactose,3 kg/d 2.00 2.00 1.88 0.12 0.17
MUN, mg/dL 13.5 13.8 13.9 0.63 0.73
ECM,3,4 kg/d 36.9 36.9 35.1 1.95 0.32
BW, kg 617 618 596 - - a,bMeans within the same row without a common superscript differ (P ≤ 0.05). 1CS = Corn silage control diet; OS = Oat silage diet; SS = Sorghum silage diet. 2Largest SEM published in table; DMI, n = 348; milk yield, n = 351; milk yield ÷ DMI, n
= 339; BW, n = 36; milk composition data, n = 36 (n represents the number of
observations used in the statistical analysis). 3Calculated using the milk yield of the 2 consecutive milk sampling days. 4Energy-corrected milk (kg/d) = kg of milk × [(38.3 × % fat × 10 + 24.2 × % true protein
× 10 + 16.54 × % lactose × 10 + 20.7) ÷ 3,140] (Sjaunja et al., 1990).

75
Table 3-5. Effect of oat and sorghum silage on milk fatty acid composition (g/100 g of
total fatty acids) in lactating dairy cows
Diet1 P-Value
Fatty Acid CS OS SS SEM2 Diet
4:0 2.59 2.58 2.74 0.088 0.22
6:0 2.12 2.14 2.12 0.041 0.88
8:0 1.25 1.25 1.24 0.023 0.76
10:0 2.99 2.93 2.85 0.072 0.11
10:1 0.25 0.24 0.24 0.012 0.22
11:0 0.05a 0.05a 0.04b 0.004 <0.001
12:0 3.41a 3.29ab 3.20b 0.087 0.03
13:0 iso 0.03 0.03 0.03 0.001 0.07
13:0 anteiso 0.06a 0.06b 0.05b 0.003 0.04
13:0 0.10a 0.10a 0.09b 0.004 0.001
14:0 iso 0.11 0.11 0.11 0.011 0.88
14:0 11.0 10.8 10.6 0.171 0.16
14:1 0.72a 0.66b 0.66b 0.044 0.03
15:0 iso 0.20b 0.22a 0.22a 0.006 <0.001
15:0 anteiso 0.41 0.40 0.40 0.009 0.90
15:0 0.94a 0.93a 0.88b 0.026 0.005
16:0 iso 0.23 0.24 0.24 0.021 0.42
16:0 26.6 25.7 25.8 0.418 0.07
16:1 0.92 0.85 0.89 0.046 0.12
17:0 iso 0.28 0.29 0.29 0.011 0.09
17:0 anteiso 0.38 0.38 0.38 0.007 0.41
17:0 0.49 0.50 0.52 0.008 0.06
17:1 0.14 0.14 0.15 0.007 0.31
18:0 13.3b 14.2a 14.6a 0.450 0.01
trans-4 18:1 0.03 0.02 0.03 0.001 0.19
trans-5 18:1 0.02 0.02 0.02 0.001 0.29
trans-6,8 18:1 0.33 0.32 0.32 0.010 0.54
trans-9 18:1 0.26a 0.25b 0.25b 0.007 0.01
trans-10 18:1 0.49a 0.45b 0.45b 0.019 <0.001
trans-11 18:1 1.21 1.24 1.24 0.042 0.68
trans-12 18:1 0.50 0.46 0.48 0.032 0.52
cis-9 18:1 18.9 19.3 19.5 0.480 0.28
trans-15 18:1 0.38 0.38 0.37 0.015 0.35
cis-11 18:1 0.70 0.66 0.67 0.028 0.50
cis-12 18:1 0.51a 0.49b 0.47c 0.020 <0.001
Linoleic acid 3.70 3.66 3.57 0.072 0.36
α-Linolenic acid 0.62b 0.67a 0.63b 0.014 0.005
20:0 0.16b 0.17a 0.17a 0.005 0.005
20:1 0.04 0.04 0.04 0.002 0.13
cis-9,trans-11 0.52 0.51 0.51 0.028 0.69

76
CLA
20:2 0.04 0.04 0.03 0.004 0.41
20:3 0.15 0.14 0.15 0.010 0.80
20:4 0.17 0.16 0.16 0.010 0.05
20:5 0.04 0.04 0.04 0.002 0.68
22:0 0.06b 0.06a 0.06a 0.002 <0.001
24:0 0.03b 0.03a 0.03a 0.002 0.001
24:1 <0.01 <0.01 <0.01 <0.001 0.39
22:4 0.03 0.03 0.03 0.004 0.18
22:5 0.07 0.07 0.07 0.005 0.86
Σ SFA 66.7 66.5 66.6 0.641 0.86
Σ MUFA 25.4 25.5 25.8 0.566 0.67
Σ PUFA 5.35 5.33 5.18 0.093 0.32
Σ trans FA 3.21 3.16 3.17 0.100 0.62
Σ OBCFA4 3.36 3.39 3.37 0.056 0.76
Unknown 2.52 2.64 2.46 0.080 0.16 a,bMeans within the same row without a common superscript differ (P < 0.05). 1CS = Corn silage control diet; OS = Oat silage diet; SS = Sorghum silage diet. 2Largest SEM shown; n = 36 for all variables (n represents number of observations used
in the statistical analysis). Data are presented as LSM. 3ND = Not detected. 4Sum of odd and branched chain fatty acids (iso13:0, anteiso13:0, 13:0, iso14:0, iso15:0,
anteiso15:0, 15:0, iso16:0, iso17:0, 17:0, 17:1).

77
Table 3-6. Effect of oat and sorghum silage on nutrient intake and apparent total-tract
digestibility in lactating dairy cows
Diet1 P-Value
Item CS OS SS SEM2 Diet
Intake, kg/d
DM3 26.1 26.9 25.9 1.15 0.23
OM 24.3 24.9 24.1 1.06 0.37
CP 4.25b 4.52a 4.30b 0.19 0.04
Starch 6.22a 5.45b 5.06c 0.24 <0.001
NDF 8.34b 9.00a 8.87a 0.38 0.02
NDF, % of
BW 1.43 1.51 1.50 0.05 0.17
Forage NDF,
% of BW 0.99b 1.08a 1.08a 0.04 <0.01
ADF 5.79b 6.28a 6.15a 0.27 0.01
Apparent digestibility, %
DM 68.1b 69.8a 66.2c 0.29 <0.001
OM 69.1b 70.8a 67.3c 0.28 <0.001
CP 66.0b 67.6a 64.6c 0.52 <0.001
Starch 98.3a 98.0b 97.7c 0.08 <0.001
NDF 43.8b 50.8a 44.8b 0.56 <0.001
ADF 41.6b 49.6a 42.1b 0.64 <0.001 a,b,c Means within the same row without a common superscript differ (P < 0.05). 1CS = Corn silage control diet; OS = Oat silage diet; SS = Sorghum silage diet. 2Largest SEM published in table; n = 36 (n represents the number of observations used in
the statistical analysis). 3DM intake reported is during the collection period for digestibility.

78
Table 3-7. Effect of oat and sorghum silage on nitrogen utilization, urinary purine
derivatives and carbon dioxide (CO2) and methane (CH4) emissions1 in lactating dairy
cows
Diet2 P-Value
CS OS SS SEM3 Diet
N intake, g/d 680b 724a 689b 30.4 0.04
N excretion or secretion, g/d 644 677 649 25.9 0.09
Urine N, g/d 218 245 221 12.0 0.17
Urinary Urea-N, g/d 139b 162a 154ab 7.8 0.03
Fecal N, g/d 248 255 265 11.3 0.11
Total excreta N, g/d 466 500 486 19.0 0.08
Milk N, g/d 178a 177a 163b 9.4 0.05
N excretion or secretion, as % of N intake
Urine N 32.3 34.1 32.7 1.80 0.76
Fecal N 36.6b 35.2c 38.6a 0.56 <0.001
Total excreta N 68.9 69.2 71.2 1.99 0.63
Milk N 26.1a 24.4ab 23.6b 0.75 0.05
Urine output3, kg/d 26.1b 33.0a 25.9b 2.20 0.002
Urinary PD4 excretion, mmol/d
Allantoin 567 585 531 38.2 0.28
Uric acid 66.2 68.3 60.9 4.83 0.06
Total PD 633 654 592 41.7 0.23
Rumen gas emissions
CO2, kg/d 12.6 12.3 12.3 0.42 0.28
CH4, g/d 495 488 523 25.7 0.15
CH4, g/kg DMI5 18.9 18.4 20.8 1.29 0.32
CH4, g/kg milk5 12.4 12.4 13.4 1.06 0.64 a,bMeans within the same row without a common superscript differ (P < 0.05). 1Rumen gas emissions were measured using GreenFeed (C-Lock Technology Inc., Rapid
City, SD). Data were derived from 8 individual measurements staggered over a 3-d
period. 2CS = Corn silage control diet; OS = Oat silage diet; SS = Sorghum silage diet. 3Largest SEM published in table; n = 36 (n represents the number of observations used in
the statistical analysis). 3Estimated from urine creatinine concentration, assumed to be excreted at 29 mg/kg of
BW. 4Purine derivatives. 5Based on milk yield and DMI data during the sampling periods.

79
Oat and Sorghum DM Disappearance
In situ incubation length, h
0 20 40 60 80 100
DM
dis
app
eara
nce
, %
30
40
50
60
70
80
90
Alfalfa Haylage
Corn Silage
Oat Silage
Sorghum Silage
Figure 3-1. Ruminal in situ DM disappearance of forage sources.
Data are means ± SE (n = 6). Disappearance curves were fit using SigmaPlot 10.0 (Systat
Software, Chicago, IL) to the equation p = a + b (1 - e-ct), where p is the degraded
fraction (of DM) at time t, a is the soluble fraction, b is the potentially degradable
fraction, and c is the rate of degradation of the b fraction (Ørskov and McDonald, 1979).
80
Oat and Sorghum NDF Disappearance
In situ incubation length, h
0 20 40 60 80 100
ND
F d
isap
pea
ran
ce,
% o
f N
DF
0
10
20
30
40
50
60
70
80
Alfalfa Haylage
Corn Silage
Oat Silage
Sorghum Silage
Figure 3-2. Ruminal in situ NDF disappearance of forage sources.
Data are means ± SE (n = 6). Disappearance curves of alfalfa haylage, triticle silage, and
wheat silage were fit using SigmaPlot 10.0 (Systat Software, Chicago, IL) to the equation
p = a + b (1 - e-ct), where p is the degraded fraction (of NDF) at time t, a is the soluble
fraction, b is the potentially degradable fraction, and c is the rate of degradation of the b
fraction (Ørskov and McDonald, 1979). Corn silage NDF disappearance data were fit to a
linear model.

Chapter 4
Inclusion of wheat and triticale silage in the diet of lactating dairy cows
Journal of Dairy Science Vol. 100, 8, 6151-6163, 2017
https://doi.org/10.3168/jds.2017-12553
M. T. Harper, J. Oh, F. Giallongo, G. W. Roth, and A. N. Hristov
ABSTRACT
The objective of this experiment was to partially replace corn silage with 2
alternative forages, wheat (Triticum aestivum) or triticale (X Triticosecale) silages, at
10% of the diet dry matter (DM) and investigate the effects on dairy cow productivity,
nutrient utilization, enteric CH4 emissions, and farm income over feed costs. Wheat and
triticale were planted in the fall as cover crops and harvested in the spring at the boot
stage. Neutral- and acid-detergent fiber and lignin concentrations were higher in the
wheat and triticale silages compared with corn silage. The forages had similar ruminal in
situ effective degradability of DM. Both alternative forages had 1% starch or less
compared with the approximately 35% starch in corn silage. Diets with the alternative
forages were fed in a replicated 3 × 3 Latin square design experiment with 3, 28-d,
periods and 12 Holstein cows. The control diet contained 44% (DM basis) corn silage. In
the other 2 diets, wheat or triticale silages were included at 10% of dietary DM, replacing
corn silage. Dry matter intake was not affected by diet, but both wheat and triticale silage
decreased yield of milk (41.4 and 41.2 versus 42.7 ± 5.18 kg/d) and milk components,

82
compared with corn silage. Milk fat from cows fed the alternative forage diets contained
higher concentrations of 4:0, 6:0, and 18:0 and tended to have lower concentrations of
total trans fatty acids. Apparent total tract digestibility of DM and organic matter was
decreased in the wheat silage diet, and digestibility of neutral-and acid-detergent fiber
was increased in the triticale silage diet. The wheat and triticale silage diets resulted in
higher excretion of urinary urea, higher MUN, and lower milk N efficiency, compared
with the corn silage diet. Enteric CH4 emission per kg of energy corrected milk was
highest in the triticale silage diet, whereas CO2 emission was decreased by both wheat
and triticale silage. This study showed that, at milk production of around 42 kg/d, wheat
silage and triticale silage can partially replace corn silage DM and not affect DM intake,
but milk yield may decrease slightly. For dairy farms in need of more forage, triticale or
wheat double cropped with corn silage may be an appropriate cropping strategy.
Keywords: dairy cow, forage, triticale silage, wheat silage

83
INTRODUCTION
Dairies in the northeastern United States typically grow their own forages. The
most utilized forage, corn silage, leaves bare soil after fall harvesting until spring
planting. Cover crops, such as small grains and clovers, have been used to prevent soil
erosion during bare soil periods. Preserving the soil is critically important for continued
crop productivity and therefore has long-term benefits. Cover crops have the potential to
efficiently utilize fall applied manure and reduce nitrate leaching (Shephard, 1999; Di
and Cameron, 2002; Carey et al., 2016). However, planting a cover crop requires a short-
term investment of labor, equipment, and other inputs. The use of cover crops as an
alternative forage has increased in popularity as a way to offset planting costs, increase
the annual forage yield per acre, and thereby harvest more forage from the same land
base. Recent plot studies conducted at The Pennsylvania State University showed a 4.5-
6.5 t DM/ha average annual forage yield increase when double cropping corn silage with
rye or triticale cover crop harvested as silage in the flag leaf stage (G. W. Roth, The
Pennsylvania State University, University Park, PA, personal communication). However,
the corn silage portion of annual forage yields typically decrease between 10-20%,
depending on planting date, under double cropping management due to delayed planting
(The Penn State Agronomy Guide, 2015). Less corn silage inventory leads to the
question: Can cover crop silages replace a portion of corn silage in dairy cattle diets? A
number of studies in the U.K. have reported similar milk yield (MY) responses to corn or
wheat silages harvested after kernel development (Hameleers, 1998; Sinclair et al., 2005).
In those studies, however, the wheat silage contained higher starch concentrations than
84
the corn silage. In Canada, Khorasani et al. (1993) compared cereal grain silages,
including triticale, to alfalfa haylage. They reported a decrease in DMI for triticale silage
but no significant difference in MY and suggested that triticale silage could be used in
dairy cow rations. The dough stage harvest schedule increases starch content but delays
harvest past the planting window for corn in the northeast U.S. and as such cannot be
used with corn silage double cropping. Harvesting cereal crops at the boot stage yields
similar NDF content to the dough stage (Khorasani et al., 1997), but with increased NDF
digestibility (NDFD) (Arieli and Adin, 1994). Additionally, at the flag leaf or boot
stages, cereal crops can have CP concentrations above 12% (Crovetto et al., 1998; Fearon
et al., 1990). Wheat and triticale are two cereal grain cover crops suited to the northeast
U.S. that are used as lactating dairy cow forage in other areas of the world. Furthermore,
both forages grow well in cool weather and survive cold winters.
Therefore, we hypothesized that both wheat and triticale, when harvested in the
boot stage, could serve as alternative forages to augment corn silage use in lactating dairy
cow rations in the northeastern U.S. The objective of the experiment was to replace corn
silage with either triticale silage or wheat silage at 10% of the diet DM and investigate
the effects on DMI, MY, milk components and fatty acid (FA) profile, nutrient
digestibility, N utilization, enteric CH4 emissions, and income over feed costs (IOFC) in
lactating dairy cows.

85
MATERIALS AND METHODS
Crops and Silages
Wheat (Triticum aestivum ‘Malabar’; King’s Agriseeds, Ronks, PA) and triticale
(X Triticosecale ‘Hyoctane’; Seedway, Hall, NY) were grown in Centre County, PA at
approximately 40° N latitude on Hagerstown and Hublersburg soils during the fall of
2014. Both crops were planted with a no-till drill (John Deere 1590; Moline, IL) into
fields fertilized with 44.8 t/ha of dairy manure prior to planting contributing 42 kg/ha of
ammonium N. Forages were planted next to each other in the same field with 19 cm row
spacing on October 10th, 2014 after wheat harvested for grain. Seeding rate was 151
kg/ha for triticale and wheat. On April 4th, 2015, both wheat and triticale were fertilized
with 67 kg of N/ha from a 30% urea and ammonium nitrate liquid fertilizer. A John
Deere 946 mower with a roll conditioner was used to mow both crops and, after wilting
to target 30% DM, the forages were gathered and chopped using a John Deere 6750
harvester. Mowing was conducted on May 13th and 19th, 2015 at the boot stage for
triticale and wheat, respectively, and chopping occurred on May 15th and 20th,
respectively. Chop length was set to 12 mm. Both crops were ensiled without inoculant
in 3-m diameter plastic silage bags (Up North Plastics, Cottage Grove, MN). The corn
silage, which was the control in this experiment, was from the forage source normally fed
to the tie stall cows on an experiment. The corn silage was a mixture of the following
hybrids: Mycogen TMF2R737 (112 d relative maturity), Dekalb DKC 52-61 (102 d
relative maturity), and NK N60F-3111 (107 d relative maturity). Corn silage was grown
in Centre County, PA at approximately 40° N latitude on Hagerstown and Hublersburg

86
soils and planted between May 1st and May 10th, 2014 at a rate of 79,000 seeds/ha. It was
planted with a no-till drill (John Deere 1590; Moline, IL) into fields fertilized with 45 t/ha
of dairy manure prior to planting contributing 42 kg/ha of ammonium N. An additional
43 kg/ha of N was applied as 30% urea and ammonium nitrate liquid prior to planting and
67 kg/ha of N in the same form as a sidedress application. Corn silage harvest was
conducted between September 15th and September 30th at a target DM of 38% with a 19
mm chop length and ensiled in an upright concrete silo.
Animals and Diets
All animals were cared for according to procedures approved by The
Pennsylvania State University’s Institutional Animal Care and Use Committee. Twelve
mid-lactation Holstein dairy cows (MY, 42 ± 10.1 kg; 2.5 ± 1.38 lactations; DIM 38 ± 5.7
d; BW 632 ± 101.6 kg at the beginning of the experiment) were used in a replicated 3 × 3
Latin square design balanced for residual effects. The experiment had 3 periods and each
period was 28 d with 18 d for adaptation to the diet and 10 d for data and sample
collection. Cows were allocated to 4 groups of 3 cows each based on DIM, MY, and
parity. Cows within a group were randomly assigned to one of 3 diets, as described
below. All cows were housed in the tie stall barn of The Pennsylvania State University’s
Dairy Research and Teaching Center. Diets were mixed and fed from a Rissler model
1050 TMR mixer (I.H. Rissler Mfg. LLC, Mohnton, PA). Cows were fed once daily
around 8 a.m. to yield approximately 5-10% refusals. Feed was pushed up 3 times
throughout the day. The cows were milked twice daily at 7 a.m. and 6 p.m.

87
Three different diets (Table 1), were fed to the cows during the experiment as
follows: a control diet (CS), based on corn silage and alfalfa haylage; a triticale silage
diet (TS), triticale silage included at 10% of dietary DM, replacing 22.7% of the control
diet corn silage DM; and a wheat silage diet (WS), wheat silage included at 10% of
dietary DM, replacing 22.7% of the control diet corn silage DM. The only difference
between the control and alternative forage diets was the replacement of 22.7% corn silage
DM with either wheat or triticale silage. The CS diet was formulated to meet or exceed
the NRC (2001) NEL and MP requirements of a Holstein cow with 680 kg BW, 41.7 kg
MY, 3.8% fat, 3.2% true protein, and at 26.3 kg DMI.
Sampling and Analyses
Refusals were collected and weighed individually for each cow prior to the
morning feeding to measure daily as-fed intake. Total mixed ration, refusal and forage
(triticale, wheat, alfalfa, and corn silage) samples were collected twice weekly,
composited by wk and diet (i.e., silage type), stored at -20°C and then oven dried at 55°C
for 72 h. The TMR was sampled within 1 h of feeding. The weekly DM content of the
TMR and refusals was used to calculate the individual daily DMI. Concentrate feeds
were sampled weekly and stored at -20°C until analysis. Wheat, triticale, corn and alfalfa
silages were ground through a 4 mm screen (for in situ degradability measurements),
then, along with TMR samples, were ground through a 1 mm screen in a Wiley mill
(Thomas Scientific, Swedesboro, NJ) and composited by period on an equal weight basis.
Dried composite samples of sorghum, oat and corn silages were sent to Cumberland

88
Valley Analytical Services Inc. (CVAS; Maugansville, MD) to be analyzed by wet
chemistry methods for CP, amylase-treated NDF, ADF, lignin, fat, soluble protein,
starch, ethanol soluble carbohydrates, ash, and minerals. Fermentation profiles of fresh
frozen samples of the corn, wheat and triticale silages from each period were analyzed by
CVAS by wet chemistry for pH, titratable acidity, and lactic, acetic, propionic, butyric,
and isobutyric acid concentrations. Concentrate feed samples were ground through a 1-
mm screen and composited for the entire experiment. Dried composite concentrate
ingredients were analyzed by wet chemistry methods by CVAS for CP, amylase-treated
NDF, ADF, fat, starch, ash, and minerals, and estimated NFC and NEL. Analytical
methods for all analyses conducted by CVAS are available at:
http://www.foragelab.com/Resources/Lab-Procedures (accessed September 14, 2016).
Concentrations of CP, NDF, ADF, NFC, NEL, starch, fat, ash, Ca and P in the TMR were
calculated based on the individual feed ingredient values and their percent inclusion in
the TMR. The diet values for RDP, RUP and NEL balance were calculated based on NRC
(2001).
Milk weights were automatically recorded at each milking using the Afimilk
system (Kibbutz Afikim, Israel). Milk samples for components and FA analysis were
collected on two consecutive days (4 consecutive milkings) during wk 4 of each period
from the p.m. and a.m. milkings. Milk component samples were collected into tubes
containing 2-bromo-2-nitropropane-1,3-diol and analyzed individually by Dairy One
Laboratory (Ithaca, NY) for fat, true protein, MUN, and lactose content using infrared
spectroscopy (Milkoscan 4000; Foss Electric, Hillerød, Denmark). Milk samples for FA

89
analysis from the 4 milkings for each period and cow were collected without
preservative, stored chilled at 4°C until composited based on milk production. The
composited milk samples were centrifuged, the milk fat was skimmed off and then stored
frozen at -20°C until analyzed using the procedure described by Rico and Harvatine
(2013). Cows were weighed 2 days at the beginning and end of the 1st and 2nd periods
with a Tru-test Eziweigh 2 scale (Mineral Wells, TX). During the 3rd experimental
period, BW was recorded daily upon exiting the milking parlor using an AfiFarm 3.04E
scale system (S.A.E. Afikim, Rehovot, Israel).
During wk 4 of each period, urine and fecal samples were collected for
digestibility and N utilization analyses. Spot urine and fecal samples (approximately 300
ml and 500 g per sample, respectively) were collected 8 times over 3 d at (d 1) 5 a.m., 12
p.m., 6 p.m., (d 2) 12 a.m., 9 a.m., 3 p.m., 9 p.m., and (d 3) 3 a.m. to obtain a
representative sample of a 24 h period. A full description of the urine and fecal sample
processing and analyzing can be found in Lee et al. (2012). Briefly, raw urine from each
sampling was acidified, diluted, composited by cow and period, and frozen at -20°C for
later analysis of allantoin, uric acid, creatinine, urea N and total N. Allantoin was
analyzed following the procedure by Chen et al. (1992). Stanbio Laboratory (Boerne,
TX) kits were used to analyze uric acid (Uric Acid Kit 1045), creatinine (Creatinine Kit
420), and urea N (Urea Nitrogen Kit 580). Total N was analyzed in freeze dried urine
samples of approximately 60 µl of 1:10 diluted and acidified urine using a Costech ECS
4010 C/N/S elemental analyzer (Costech Analytical Technologies Inc., Valencia, CA).
Fecal samples were oven dried at 65°C, ground through a 1-mm screen in a Wiley mill
90
and analyzed for DM, OM, CP, starch, NDF and ADF. A Mixer Mill MM 200 (Retsch
GmbH, Haan, Germany) was used to pulverize a 0.5 g aliquot of fecal sample for CP
analysis (N × 6.25) using a Costech ECS 4010 C/N/S elemental analyzer. Starch analysis
of fecal DM for apparent total tract digestibility was performed using a procedure similar
to the method including acetate buffer described by Hall (2009). Briefly, starch was
gelatinized with 50% NaOH, incubated for 16 h at 55°C with acetate buffer and amylase,
centrifuged, plated on a 96-well plate and then reacted with a PGO (Glucose
Oxidase/Peroxidase) enzyme solution (P7119; Sigma-Aldrich, Saint Louis, MO) for 45
min before being read at 450 nm. Neutral- and acid-detergent fiber were analyzed with an
Ankom 200 fiber analyzer (Ankom Technology Corp., Macedon, NY) based on the
procedures of Van Soest et al. (1991) with alpha amylase and sodium sulfite in the NDF
analysis. A 10-d ruminal incubation was used to analyze indigestible NDF (iNDF;
Huhtanen et al., 1994 as modified by Lee et al., 2012) in both feces and TMR, which was
used as a marker to estimate apparent digestibilities of dietary nutrients.
Enteric CH4 and CO2 emissions were analyzed during wk 4 of each period with
the GreenFeed system (C-Lock Inc., Rapid City, SD). Measurements were collected 8
times over 3 d at 9 a.m., 3 p.m., 9 p.m., 3 a.m., 12 p.m., 6 p.m., 12 a.m. and 5 a.m. to
obtain a representative sample of a 24-h period. Gas sampling procedures followed those
recommended by Hristov et al. (2015). Gas emission data were averaged by cow and
period for the statistical analysis.

91
In Situ
Ruminal disappearance of DM (alfalfa haylage, wheat, triticale, and corn silages)
and NDF (wheat and triticale silages and alfalfa haylage) was determined in situ. Six
ruminally cannulated lactating Holstein cows averaging: DMI 24.4 ± 2.4 kg; MY 36.8 ±
2.9 kg; 2.2 ± 0.4 lactations; DIM 148 ± 10 d; and BW 616 ± 40.7 kg were used for in situ
incubations. Cows were fed (% DM basis) corn silage 38.3, alfalfa haylage 13.8, grass
hay and straw mixture 4.2, ground corn 9.6, canola meal 9.6, cookie meal 5.3, roasted
soybeans 5.0, molasses 5.0, whole cotton seed 4.6, cracked corn 2.5, and mineral mix 2.1.
Oven dried forages were ground through a 4-mm screen in a Wiley mill. Approximately
7 g of sample were weighed into 10 × 20 cm nylon bags with 50-µm porosity (Ankom
Technology Corp.) and closed with a ziptie after folding. Triplicate bags were
sequentially incubated in each cow for 12, 24, 48, 72, and 96 h and simultaneously
removed. Two bags per forage were made for the 0 h time point and processed as the
incubated samples except the rumen incubation step. Upon removal from the rumen, the
bags were rinsed 3 times with cold water in a washer machine set to agitate for 6 min
each rinse. The zipties were cutoff and any remaining particles rinsed with cold tap water.
Rinsed bags were then oven dried for 72 h at 55°C before weighing for DM
determination. Samples were composited by silage, time point, and cow before NDF
analysis as previously described. Ruminal disappearance was calculated based on initial
dry weight of the incubated sample, residue dry weight, and NDF concentration of initial
sample and bag residue. Degradation curves were fit to the equation p = a + b (1 - e-ct)
where p is the degraded fraction (of DM or NDF) at time t, constant a is the soluble

92
fraction, b is the potentially degradable fraction and c is the rate of degradation of the b
fraction (Ørskov and McDonald, 1979). The effective degradability (ED) was determined
with the following equation (Ørskov and McDonald, 1979): ED = a + b {c ÷ (c + k)},
where k is the rate of passage assumed to be 0.03/h. Corn silage NDF degradability did
not fit the Ørskov and McDonald model and so was fit with a linear model. Therefore,
corn silage NDF degradability was not statistically compared to the other forages.
Income Over Feed Costs
Income over feed costs (IOFC) for the 3 diets was calculated using
the Pennsylvania State Extension Dairy Team IOFC Tool (Penn State Extension, 2015).
The cash flow spreadsheet from the Pennsylvania State Extension Dairy Team (Penn
State Extension, 2016) was used to calculate forage monetary values for the IOFC tool.
We used a 34.4 ha model dairy farm with 65 lactating cows, 10 dry cows, 52 heifers, and
12 calves. It was assumed that only the forages were grown on the farm whereas
concentrates were purchased. The lactating cow ration was changed in the scenarios to
reflect the treatment diet whereas diets for other cow groups (e.g., dry cows, heifers, and
calves) were kept the same among scenarios. First, the total amount of the different
forages required for each scenario was calculated. Next, the acres needed to produce that
amount was found by dividing the total amount of each crop needed by the per acre crop
yields typical for central PA. The corn yield for the double cropped scenarios was
decreased by 2.35 t DM/ha to account for the lower yield due to delayed corn planting.
Then, the variable costs of seed, fertilizer, and herbicide per acre for each crop during

93
2015 was entered into the spreadsheet. Along with the input costs and the yield
information for each crop, the fixed costs were allocated among the forages based on the
labor used to produce them to determine price per ton. Milk and components yield from
the current study was used with the average milk pricing in PA for 2015 to generate the
income side of the IOFC equation.
Statistical Analysis
Statistical analyses for all but the in situ data were run using the MIXED
procedure of SAS v9.4 (SAS Institute Inc., Cary, NC). Cow was the experimental unit.
Milk yield and DMI from the last 10 d of the experiment were analyzed with day as a
repeated measure. The statistical model included cow, block, day, period, diet, and period
× diet and diet × day interactions. Block and cow within block were random effects with
all others fixed. Milk composition and FA, nutrient intake, digestibility, N utilization,
CH4 and CO2 emissions data used the same model without day and diet × day interaction.
Milk composition data were weighted averages based on the milk production at each
milking. Forage nutrient composition was compared using the MIXED procedure with
forage type as the model. Significance was declared at P ≤ 0.05 and tendency was
declared at 0.05 < P ≤ 0.10. If not indicated otherwise, data are presented as least squares
means.
Ruminal in situ degradation of DM and NDF was analyzed using the NLMIXED
procedure of SAS. The overall regression curve and the individual parameters (a, b, c,

94
and ED; see above) were contrasted among forages and significance was declared at P ≤
0.05.
RESULTS AND DISCUSSION
Forages
Triticale yielded 2.79 t DM/ha and wheat yielded 2.57 t DM/ha. A survey of
triticale double cropped with corn in New York reported an average yield of 4.9 t DM/ha
from 2012-2014 (Ketterings et al., 2015). Yields could potentially have been increased in
the current study by earlier planting in late September and an extra 43 kg/ha of N
fertilizer in the spring. The cover crops were harvested at the same growth stage but, due
to different maturation patterns, wheat was harvested 5 d after triticale. From a practical
standpoint, different harvest windows can reduce risk and decrease the daily workload
during harvest which can be used to a farmer’s advantage. Triticale normally has greater
yields than wheat (Giunta et al., 1993; Estrada-Campuzano et al., 2012) as was the case
in this study. Corn silage varieties had an average yield of 18 t DM/ha. Nutrient
composition and fermentation data of the 3 silages are presented in Table 2. The triticale
silage fermentation may have benefited from a higher target ensiling DM because there
were elevated total VFA and lactic acid concentrations along with some butyric acid
production. Both silages did reach a final pH level below 4.5 but were higher (P <0.001)
than the pH of 3.68 in the corn silage. Titratable acidity followed the pattern of total
fermentation acid production. Overall, the alternative silages had higher (P ≤ 0.01) NDF,

95
ADF, lignin, CP, and soluble CP as a percent of CP content than corn silage whereas
having starch concentrations at or below 1%. The lignin content of wheat was slightly
higher (P < 0.01) than triticale while CP was higher (P < 0.001) in triticale than wheat.
Wheat silage had higher (P < 0.001) ethanol soluble carbohydrates than triticale or corn
silage.
The simple by-weight replacement of corn silage in our study was chosen to
clearly demonstrate, without confounding effects, how inclusion of wheat or triticale
cover crops used as forages in a double cropping strategy might affect cow productivity
without other changes on the farm such as increased corn grain purchases. Previous
research with cereal silages have focused on more mature crops in the dough stage when
yield and starch content are high (Sutton et al., 2001). However, wheat and triticale must
be harvested at the boot stage or earlier to produce highly digestible forage and allow
growing season for double cropping. At this stage, however, these plants accumulate little
to no starch (Fearon et al., 1990; Crovetto et al., 1998).
Dry Matter Intake and Milk Yield
Dry matter intake is known to have a large influence on milk production. In the
current study, DMI was not different between diets (Table 3); however, MY was
decreased (P = 0.01) in TS and WS compared with CS. Arieli and Adin (1994) reported
equal DMI but different MY for diets containing wheat silages harvested at flower versus
milk stage maturities. The authors explained the difference in MY by differences in
NDFD of the two silages but this would not describe the results of the current study.
96
Sinclair et al. (2005) found an increase in DMI but similar MY comparing urea-treated
wheat silage harvested in the dough stage versus corn silage. Hameleers (1998) reported
an increase in DMI with corn silage or wheat silage replacing grass silage, but no effect
on MY of around 27 kg/d.
Milk yield in the current study was high for all diets but decreased to a similar
extent for TS and WS compared with CS. A decrease in feed efficiency has been
observed in other experiments utilizing wheat silage (Sutton et al., 1998) but a significant
period by diet interaction for feed efficiency in the current study prevents conclusive
agreement with their results. The most likely cause of the decreased MY is the
replacement of starch with fiber in the alternative forage diets. When these alternative
forage cover crops partially replace corn silage in a ration, starch content is decreased
and, with it, dietary available energy (Mertens, 2009). Even though when the rations
where entered into NRC (2001), the NEL concentrations were very similar. Ground corn
or other starch sources could be added into the ration to compensate for the decreased
starch supply from corn silage, but that would likely have to be purchased on most farms.
Bernard et al. (2002) replaced corn silage with annual ryegrass silage in lactating cows
along with increased ground corn and reported no effect on DMI but an increase in MY.
Even at the early harvest date of this study, alternative forages had higher NDF, ADF,
and lignin concentrations compared with corn silage possibly causing increased rumen
fill. This may have prevented an increase in DMI for the alternative forage diets to
maintain milk production.

97
Milk Composition and Yield
Milk composition was unaffected by diet which agrees with results from
Hameleers (1998) and Sutton et al. (1998) who compared wheat silage to corn and grass
silages, respectively. However, those studies were with a high starch, dough stage wheat
silage. O’Mara et al. (1998) likewise found no effect of grass silage versus corn silage
though, again starch content was kept similar across diets. We did observe higher milk
protein yield in CS even with higher RUP levels in TS and WS, which suggests that there
was less available energy for microbial protein synthesis in the rumen with the alternative
forage diets. The tendency (P = 0.07) for a decrease in the sum of odd and branched
chain milk FA in TS and WS, compared with corn silage (see below), would also support
the expectation of lower milk true protein in those diets; Vlaeminck et al. (2006) showed
a positive correlation between odd and branched chain milk FA and bacterial N flow to
the duodenum. Despite lower starch and higher fiber intake with the alternative silage
diets, compared with the control corn silage diet, milk fat concentration or yield were
unaffected.
Milk Fatty Acid
Milk FA analysis (Table 4) revealed increased (P ≤ 0.004) concentrations of de
novo synthesized FA 4:0, and 6:0 for TS and WS, compared with CS. Stearic acid (18:0)
was also increased (P = 0.008) in TS and WS whereas trans-10 18:1 was increased (P <
0.001) in CS with a tendency (P =0.10) for greater total trans FA. Increases in trans-10
18:1 in milk fat have been associated with milk fat depression albeit at greater
98
concentrations than in the current study (Rico and Harvatine, 2013). Trans-10 18:1 is a
ruminal biohydrogenation intermediate from an alternate pathway responsible for
decreased de novo milk FA synthesis (Harvatine et al., 2009). The higher (P ≤ 0.04) odd
chain FA 15:0, 17:0, and 17:1 in CS along with the lower iso 14:0 (P = 0.04) suggests a
lower rumen pH, based on the relationship with SARA reported by Fievez et al. (2012),
though we have no direct rumen pH measurements to confirm this data. The higher fiber
and lower starch contents of TS and WS, compared with CS, may have caused
differences in ruminal biohydrogenation.
Nutrient Intake and Digestibility
Intakes of CP and ADF were higher (P ≤ 0.01) for both TS and WS, compared
with CS (Table 5). Starch intake was higher (P < 0.001) for CS, compared with either of
the alternative silage diets. These results are an outcome of the higher CP and ADF and
lower starch contents in the triticale and wheat silages than in the corn silage and the
equal DMI among diets. Apparent total tract digestibility of DM and OM was decreased
(P < 0.01) in WS, compared with CS, but not in TS. Meanwhile, NDF and ADF
digestibility was increased (P ≤ 0.005) in TS but not WS. The decreased DM and OM
digestibility of WS was likely a result of the lower starch, and higher fiber and lignin
content in the wheat silage compared with corn silage. The TS diet had lower starch and
higher fiber as WS did, but somewhat surprisingly did not decrease DM or OM
digestibility. Likely the lower lignin level in the triticale silage over the wheat silage
improved TS digestibility. It has been shown that DM and NDF digestibility are

99
negatively correlated with lignin content (Jung et al., 1997). O’Mara et al. (1998)
reported higher diet digestibilities of DM, OM, and NDF but not N when grass silage
replaced corn silage in lactiating cow diets which match the results of TS in the current
experiment. Less starch in TS and WS probably resulted in higher rumen pH (though it
was not measured directly in this experiment) which improves fiber digestibility (Firkins,
1997) although the high lignin in the wheat silage may have counteracted that effect.
Starch digestibility was high for all diets but highest (P < 0.001) for CS followed by TS
and then WS. The rate of starch digestibility in corn silage is usually high and can be
faster than that of fine ground corn (Lanzas et al., 2007). The CS diet had the highest
proportion of starch from corn silage and this was likely the reason for the increased
starch digestibility in CS.
In Situ
In situ DM disappearance curves are shown in Figure 1. Numerical ranking of in
situ ED of DM among triticale, wheat, and corn silages matches apparent total tract DM
and OM digestibility of TS, WS, and CS. Because of its high starch content and despite
its low NDF degradation rate, corn silage still had one of the highest ED of DM along
with triticale silage. Wheat silage ED of DM was slightly lower (P < 0.001) than triticale
and corn silage, but higher (P < 0.001) than alfalfa haylage. Although ED of DM was not
drastically different among triticale, wheat, and corn silages, the differences in the
nutrient composition of the silage DM may have affected cow performance among the
experimental diets. The wheat and triticale silage contained higher ash and CP content
100
whereas corn silage had higher starch content, potentially resulting in more digestible
energy for supporting higher milk production in CS.
Ruminal in situ NDF degradability data (Figure 2) revealed that triticale silage
had the highest (P < 0.001) ED of NDF followed by wheat silage and alfalfa haylage.
Triticale is a cross between wheat and rye, therefore, it was expected that the NDF
degradability pattern would be similar to wheat. Triticale and wheat silages had nearly
identical NDF and ADF contents but wheat silage had higher lignin concentrations. This
appeared to have negatively affected its in situ ED of NDF and the DM and OM apparent
total tract digestibilities of WS. It may be that the wheat was actually more
physiologically mature than the triticale, since we harvested the wheat a few days after
the triticale even though we targeted the same maturity at harvest. Corn silage NDF
degradability data did not fit the Orskov and McDonald model, but it did fit to a linear
model with a rate of 0.57%/h and an R2 = 0.94. Filya (2003) reported corn silage in situ
NDF degradability values at 48 h of approximately 22.4%, which is similar to our 28.6%
value. For triticale or wheat silage at the boot stage to successfully replace part of the
corn silage in a lactating cow diet, NDF degradability has to be high since it is the main
source of energy in these silages.
N Utilization
Both TS and WS had a similar effect on N utilization (Table 6) with higher (P =
0.006) N intake than CS. Cows fed TS and WS excreted more urinary urea N (P = 0.001)
and total excreta N (P = 0.006) while having a tendency (P = 0.08) for less N secreted in

101
milk than CS. Together, this led to a lower (P = 0.005) milk N efficiency for TS and WS,
compared with CS. Hameleers (1998) also reported a decrease in milk N efficiency when
grass silage was replaced with urea-treated wheat silage. Similar to that experiment, we
formulated our CS diet to meet MP requirements for the level of production of the cows
and did not adjust protein content of the alternative forage diets. Therefore, TS and WS
supplied excess CP, as a result of the higher CP content of the wheat and triticale silages,
which was not utilized but mainly excreted in urine as urea. This presents an opportunity
to reduce purchased protein feeds and thereby reduce feed costs in the TS and WS diets
(Bernard et al., 2002; O’Mara et al., 1998). Purine derivatives excretion in urine, which is
positively correlated with microbial protein flow to the intestine (Chen, 1989), was not
different among treatments. Although this did not result in equal milk true protein yields
among diets.
Enteric CH4 and CO2 Emissions
Enteric CH4 production was not different among diets (Table 7). Methane yield
(i.e., per kg of DMI) or intensity (i.e., per kg of MY) were also not different among diets.
However, when calculating CH4 intensity per kg of ECM, CS yielded significantly less
(P = 0.04) CH4 than TS. Increasing starch in a diet favors propionate production and
thereby usually reduces CH4 production (Moe and Tyrrell, 1979; Moss et al., 2000)
though there have been reports of increased CH4 production with increased dietary starch
(Beever et al., 1988). Decreased CH4 yield in beef cattle was clearly demonstrated by
McGeogh et al. (2010) when whole crop wheat silage diets of increasing grain (i.e.

102
starch) contents were fed. Higher starch in CS was likely the cause of the lower expected
CH4 emission intensity per kg of ECM. The enteric CH4 yield and intensity values we
report, of around 17.5 g/kg DMI and 12 g/kg MY, are similar to data from our Penn State
dairy herd (Hristov et al., 2015) and others (Colombini et al., 2015). Carbon dioxide
emissions were decreased (P = 0.006) by WS and TS. Kirchgessner et al. (1991) reported
a relationship of CO2 emissions to MY of 0.14 kg CO2/d for every kg of milk produced.
Using this relationship, a decrease of around 0.2 kg CO2/d would have been expected for
the current study, yet a 0.6 kg CO2/d decrease in emissions was measured. However, the
direction of the effect was in agreement with the findings of Kirchgessner et al. (1991).
Kinsman et al. (1995) also reported a strong correlation between CO2 emissions and milk
production (r = 0.74; P < 0.001). They noted that CO2 production is primarily from
cellular respiration of the cow and only secondarily from ruminal fermentation. There is
some interest in using the ratio of enteric CH4 emission to CO2 emission as a way to
measure feed efficiency (Madsen et al., 2010). Lower values would indicate less CH4
production and more complete metabolization of the C to CO2 (Madsen et al., 2010).
Ratios reported for this study are lowest (P <0.01) for CS and not different between TS
and WS indicating CS may have been a more completely metabolizable diet in the
rumen.
Income Over Feed Cost
The IOFC of CS was $11.05 and decreased to $10.39 and $10.26 for WS and TS,
respectively. Decreased per acre corn silage yield due to later corn planting and decreased
103
MY caused the decrease in IOFC for WS and TS. The higher IOFC for WS over TS was
due to the numerically higher milk and milk fat yield resulting in higher calculated
income. The WS and TS diets were not least cost formulations and did not fully utilize
the protein value of the alternative forages as indicated by the higher MUN and urinary
urea nitrogen losses. Likely, the supplemental protein content of WS and TS could be
decreased to lower costs of on-farm rations.
CONCLUSIONS
In this study, we demonstrated that triticale and wheat cover crops harvested as
silage at the boot stage can support MY above 41 kg/d when included at 10% of the diet
DM replacing corn silage. Triticale and wheat silage inclusion did not affect DMI but
decreased MY likely due to replacing starch with fiber. Higher CP content in the
alternative forages along with lower starch resulted in higher urinary urea excretion,
higher MUN concentration and lower milk N efficiency. Enteric CH4 emission per kg of
ECM was increased by TS. Triticale silage had higher in situ effective degradability of
NDF and a slightly higher crop yield than wheat silage, although IOFC was slightly more
favorable for wheat silage due to numerically higher MY and true milk protein content.
Both alternative forages provide a highly digestible source of fiber that can successfully
replace corn silage at low inclusion rates. For dairy farms in need of more forage, triticale
or wheat double cropped with corn silage may be an appropriate cropping strategy.

104
ACKNOWLEDGEMENT
This project supported by the Northeast Sustainable Agriculture Research and
Education (SARE) program. SARE is a program of the National Institute of Food and
Agriculture, U.S. Department of Agriculture. The authors thank the staff of Farm
Operations and Services of the Pennsylvania State University for growing and harvesting
the crops fed in our experiment. We also thank the staff of the Pennsylvania State
University’s Dairy Teaching and Research Center for their conscientious care of the
experimental cows. Additionally, we thank Virginia Ishler for her help with the IOFC
analysis.
REFERENCES
Arieli A., and G. Adin. 1994. Effect of wheat silage maturity on digestion and milk yield
in dairy cows. J. Dairy Sci. 77:237-243.
Ashbell, G., Z. G. Weinberg, I. Bruckental, K. Tabori, and N. Sharet. 1997. Wheat silage:
Effect of cultivar and stage of maturity on yield and degradability in situ. J. Agric.
Food Chem. 45:709-712.
Beever, D. E., S. B. Cammell, C. Thomas, M. C. Spooner, M. J. Haines, and D. L. Gale.
1988. The effect of date of cut and barley substitution on gain and on the efficiency
of utilization of grass silage by growing cattle 2. Nutrient supply and energy
partition. Br. J. Nutr. 60:307-319.
Bernard, J. K., J. W. West, and D. S. Trammell. 2002. Effect of replacing corn silage
with annual ryegrass silage on nutrient digestibility, intake, and milk yield for
lactating dairy cows. J. Dairy Sci. 85:2277-2282.
Carey, P. L., K. C. Cameron, H. J. Di, G. R. Edwards, and D. F. Chapman. Sowing a
winter catch crop can reduce nitrate leaching losses from winter-applied urine under
simulated forage grazing: a lysimeter study. Soil Use Manag. 32:329-337.
105
Colombini, S., M. Zucali, L. Rapetti, G. M. Crovetto, A. Sandrucci, and L. Bava. 2015.
Substitution of corn silage with sorghum silages in lactating cow diets: In vivo
methane emission and global warming potential of milk production. Agric. Syst.
136:106–113.
Chen, X. B. 1989. Excretion of purine derivatives by cattle and sheep and its use for the
estimation of absorbed microbial protein. Ph.D. Dissertation. Aberdeen Univ.. UK.
Chen, X. B., Y. K. Chen, M. F. Franklin, E. R. Ørskov, and W. J. Shand. 1992. The effect
of feed intake and body weight on purine derivative excretion and microbial protein
supply in sheep. J. Anim. Sci. 70:1534–1542.
Crovetto, G. M., G. Galassi, L. Rapetti, A. Sandrucci, and A. Tamburini. 1998. Effect of
the stage of maturity on the nutritive value of whole crop wheat silage. Livest. Prod.
Sci. 55:21-32.
Di, H. J., and K. C. Cameron. 2002. Nitrate leaching in temperate agroecosystems:
sources, factors and mitigating strategies. Nutrient Cycling in Agroecosystems.
64:237–256.
Estrada-Campuzano, G., G. A. Salfer, and D. J. Miralles. 2012. Differences in yield,
biomass and their components between triticale and wheat grown under contrasting
water and nitrogen environments. Field Crops Res. 128:167-179.
Fearon, A. L., A. Felix, and V. T. Sapra. 1990. Chemical composition and in vitro dry
matter and organic matter digestibility of triticale forage. J. Agron. Crop Sci.
164:262-270.
Fievez V., E. Colman, J.M. Castro-Montoya, I. Stefanov, and B. Vlaeminck. 2012. Milk
odd- and branched-chain fatty acids as biomarkers of rumen function- An update.
Anim. Feed Sci. and Technol. 172:51–65.
Filya, I. 2003. The effect of Lactobacillus buchneri, with or without homofermentative
lactic acid bacteria, on the fermentation, aerobic stability and ruminal degradability
of wheat, sorghum and maize silage. J. Appl. Microbiol. 95:1080-1086.
Firkins, J. L. 1997. Effects of feeding nonforage fiber sources on site of fiber digestion. J.
Dairy Sci. 80:1426–1437.
Giunta, F., R. Motzo, and M. Deidda. 1993. Effect of drought on yield and yield
components of durum wheat and triticale in a Mediterranean environment. Field
Crops Res. 33:399-409.

106
Hall, M. B. 2009. Determination of starch, including maltooligosaccharides, in animal
feeds: comparison of methods and a method recommended for AOAC collaborative
study. J. AOAC Int. 92:42-49.
Harvatine, K. J., Y. R. Boisclair, and D. E. Bauman. 2009. Recent advances in the
regulation of milk fat synthesis. Animal. 3:40–54.
Hameleers, A. 1998. The effects of the inclusion of either maize silage, fermented whole
crop wheat or urea-treated whole crop wheat in a diet based on a high-quality grass
silage on the performance of dairy cows. Grass Forage Sci. 53:157-163.
Hristov, A. N., J. Oh, F. Giallongo, T. W. Frederick, M. T. Harper, H. L. Weeks, A. F.
Branco, P. J. Moate, M. H. Deighton, S. Richard, O. Williams, M. Kindermann, and
S. Duval. 2015. An inhibitor persistently decreased enteric methane emission from
dairy cows with no negative effect on milk production. Proc. Natl. Acad. Sci. USA.
112:10663–10668.
Huhtanen, P., K. Kaustell, and S. Jaakkola. 1994. The use of internal markers to predict
total digestibility and duodenal flow of nutrients in cattle given six different diets.
Anim. Feed Sci. Technol. 48:211–227.
Jung, H. G., D. R. Mertens, and A. J. Payne. 1997. Correlation of acid detergent lignin
and klason lignin with digestibility of forage dry matter and neutral detergent fiber.
J. Dairy Sci. 80:1622–1628.
Ketterings, Q. M., S. Ort, S. N. Swink, G. Godwin, T. Kilcer, J. Miller, and W. Verbeten.
2015. Winter cereals as double crops in corn rotations on New York dairy farms. J.
Agric. Sci. 7:18-25.
Khorasani, G. R., E. K. Okine, J. J. Kennelly, and J. H. Helm. 1993. Effect of whole crop
cereal grain silage substituted for alfalfa silage on performance of lactating dairy
cows. J. Dairy Sci. 76:3536-3546.
Khorasani, G. R., P. E. Jedel, J. H. Helm, and J. J. Kennelly. 1997. Influence of stage of
maturity on yield components and chemical composition of cereal grain silages.
Can. J. Anim. Sci. 77:259-267.
Kinsman, R., F. D. Sauer, H. A. Jackson, and M. S. Wolynetz. 1995. Methane and carbon
dioxide emissions from dairy cows in full lactation monitored over a six-month
period. J. Dairy Sci. 78:2760-2766.
Kirchgessner, M., W. Windisch, H. L. Muller, and M. Kreuzer. 1991. Release of methane
and of carbon dioxide by dairy cattle. Agribiol. Res. 44:91-102.

107
Lanzas, C., C. J. Sniffen, S. Seo, L. O. Tedeschi, and D. G. Fox. 2007. A revised CNCPS
feed carbohydrate fractionation scheme for formulating rations for ruminants.
Anim. Feed Sci. Technol. 136:167–190.
Lee, C., A. N. Hristov, T. W. Cassidy, K. S. Heyler, H. Lapierre, G. A. Varga, M. J. de
Veth, R. A. Patton, and C. Parys. 2012. Rumen-protected lysine, methionine, and
histidine increase milk protein yield in dairy cows fed a metabolizable protein-
deficient diet. J. Dairy Sci. 95:6042–6056.
Madsen, J., B. S. Bjerg, T. Hvelplund, M. R. Weisbjerg, and P. Lund. 2010. Short
communication: Methane and carbon dioxide ratio in excreted air for quantification
of the methane production from ruminants. Livest. Sci. 129:223-227.
McGeough, E. J., P. O’Kiely, K. J. Hart, A. P. Moloney, T. M. Boland, and D. A. Kenny.
2010. Methane emissions, feed intake, performance, digestibility, and rumen
fermentation of finishing beef cattle offered whole-crop wheat silages differing in
grain content. J. Anim. Sci. 88:2703–2716.
Mertens, D. R. 2009. Impact of NDF content and digestibility on dairy cow performance.
Pages 191-201 in Proc. 27th Annual Western Canadian Dairy Seminar. Red Deer,
Alberta.
Moe, P. W., and H. F. Tyrrell. 1979. Methane production in dairy cows. J. Dairy Sci.
62:1583-1586.
Moss, A. R., J. Jouany, and J. Newbold. 2000. Methane production by ruminants: its
contribution to global warming. Ann. Zootech. 49:231-253.
National Research Council. 2001. Nutrient requirements of dairy cattle. 7th rev. ed. Natl.
Acad. Press, Washington, DC.
O’Mara, F. P., J. J. Fitzgerald, J. J. Murphy, and M. Rath. 1998. The effect on milk
production of replacing grass silage with maize silage in the diet of dairy cows.
Livest. Prod. Sci. 55:79-87.
Ørskov, E. R., and I. McDonald. 1979. The estimation of protein degradability in the
rumen from incubation measurements weighted according to rate of passage. J.
Agric. Sci. (Camb.) 92:499–503.
The Pennsylvania State University. 2015. The Penn State Agronomy Guide. University
Park, PA.
Rico, D. E., and K. J. Harvatine. 2013. Induction of and recovery from milk fat
depression occurs progressively in dairy cows switched between diets that differ in
fiber and oil concentration. J. Dairy Sci. 96:6621–6630.

108
Shepherd, M. A. 1999. The effectiveness of cover crops during eight years of a UK
sandland rotation. Soil Use Manag. 15:41-48.
Sinclair, L. A., M. A. Jackson, J. A. Huntington, and R. J. Readman. 2005. The effects of
processed, urea-treated whole-crop wheat or maize silage and supplementation of
whole-crop wheat on the performance of dairy cows. Livest. Prod. Sci. 95:1 –10.
Sjaunja, L. O., L. Baevre, L. Junkkarinen, J. Pedersen, and J. Setälä. 1990. A Nordic
proposal for an energy corrected milk (ECM) formula. Proc. 27th Session Int.
Comm. Breeding Product. Milk Anim., Paris, France. Wageningen Acad. Publ.,
Wageningen, the Netherlands.
Sutton, J. D., S. B. Cammell, D. E. Beever, D. J. Humphries, and R. H. Phipps. 1998.
Energy and nitrogen balance of lactating dairy cows given mixtures of urea-treated
whole-crop wheat and grass silage. Animal Science. 67:203-212.
Sutton, J. D., R. H. Phipps, S. B. Cammell, and D. J. Humphries. 2001. Attempts to
improve the utilization of urea-treated whole-crop wheat by lactating dairy cows.
Animal Science. 73:137-147.
Van Soest, P. J., J. B. Robertson, and B. A. Lewis. 1991. Methods for dietary fiber,
neutral detergent fiber, and nonstarch polysaccharides in relation to animal nutrition.
J. Dairy Sci. 74:3583–3597.
Vlaeminck, B., V. Fievez, A. R. J. Cabrita, A. J. M. Fonseca, and R. J. Dewhurst. 2006.
Factors affecting odd- and branched-chain fatty acids in milk: A review. Anim.
Feed Sci. Technol. 131:389–417.
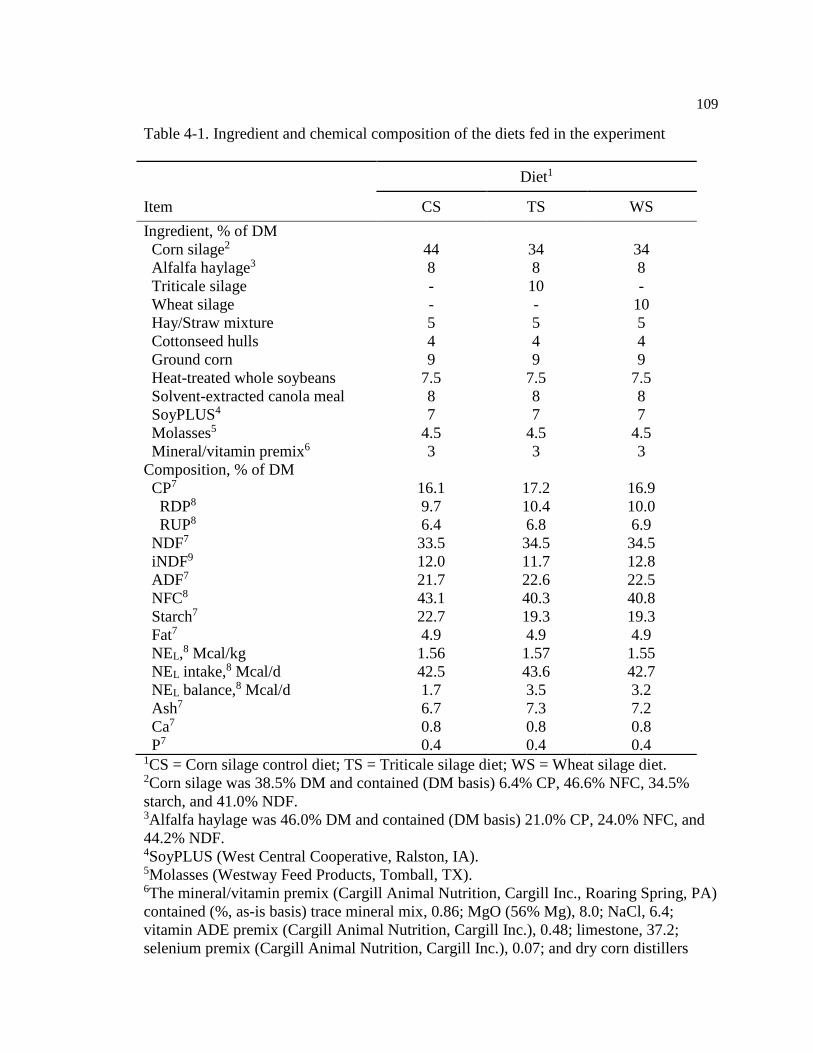
109
Table 4-1. Ingredient and chemical composition of the diets fed in the experiment
1CS = Corn silage control diet; TS = Triticale silage diet; WS = Wheat silage diet. 2Corn silage was 38.5% DM and contained (DM basis) 6.4% CP, 46.6% NFC, 34.5%
starch, and 41.0% NDF. 3Alfalfa haylage was 46.0% DM and contained (DM basis) 21.0% CP, 24.0% NFC, and
44.2% NDF. 4SoyPLUS (West Central Cooperative, Ralston, IA). 5Molasses (Westway Feed Products, Tomball, TX). 6The mineral/vitamin premix (Cargill Animal Nutrition, Cargill Inc., Roaring Spring, PA)
contained (%, as-is basis) trace mineral mix, 0.86; MgO (56% Mg), 8.0; NaCl, 6.4;
vitamin ADE premix (Cargill Animal Nutrition, Cargill Inc.), 0.48; limestone, 37.2;
selenium premix (Cargill Animal Nutrition, Cargill Inc.), 0.07; and dry corn distillers
Diet1
Item CS TS WS
Ingredient, % of DM
Corn silage2 44 34 34
Alfalfa haylage3 8 8 8
Triticale silage - 10 -
Wheat silage - - 10
Hay/Straw mixture 5 5 5
Cottonseed hulls 4 4 4
Ground corn 9 9 9
Heat-treated whole soybeans 7.5 7.5 7.5
Solvent-extracted canola meal 8 8 8
SoyPLUS4 7 7 7
Molasses5 4.5 4.5 4.5
Mineral/vitamin premix6 3 3 3
Composition, % of DM
CP7 16.1 17.2 16.9
RDP8 9.7 10.4 10.0
RUP8 6.4 6.8 6.9
NDF7 33.5 34.5 34.5
iNDF9 12.0 11.7 12.8
ADF7 21.7 22.6 22.5
NFC8 43.1 40.3 40.8
Starch7 22.7 19.3 19.3
Fat7 4.9 4.9 4.9
NEL,8 Mcal/kg 1.56 1.57 1.55
NEL intake,8 Mcal/d 42.5 43.6 42.7
NEL balance,8 Mcal/d 1.7 3.5 3.2
Ash7 6.7 7.3 7.2
Ca7 0.8 0.8 0.8
P7 0.4 0.4 0.4
110
grains with solubles, 46.7. Ca, 14.1%; P, 0.39%; Mg, 4.60%; K, 0.45%; S, 0.38%; Se,
6.67 mg/kg; Cu, 358 mg/kg; Zn, 1,085 mg/kg; Fe, 188 mg/kg, vitamin A, 262,656 IU/kg;
vitamin D, 65,559 IU/kg; and vitamin E, 1,974 IU/kg. 7Values calculated using the chemical analysis (Cumberland Valley Analytical Services
Inc., Maugansville, MD) of individual feed ingredients of the diet. 8Estimated based on NRC (2001). 9Determined by 10d ruminal incubation.

111
Table 4-2. Nutrient composition and fermentation profile of triticale and wheat silages (%
of DM or as indicated)1
1Three composite samples per silage, one for each experimental period were analyzed by
wet chemistry (Cumberland Valley Analytical Services Inc., Maugansville, MD). Mean ±
SE is reported. 2Largest SEM published in table; n = 9 (n represents the number of observations used in
the statistical analysis). 3ND = Not detected.
Forages P-Value
Item Corn Triticale Wheat SEM2 Forage
DM, % 38.5a 30.7b 40.7a 1.42 <0.01
NDF 41.0b 51.1a 51.0a 0.96 <0.001
ADF 23.7b 32.9a 32.5a 0.55 <0.001
Lignin 2.82c 3.47b 3.83a 0.103 <0.01
Fat 3.38 3.89 3.57 0.281 0.48
CP 6.4c 17.3a 14.6b 0.32 <0.001
Soluble CP, % of CP 61.8c 80.8a 74.6b 1.07 <0.001
Starch 34.5a 0.3b 1.0b 0.96 <0.001
Ethanol soluble
carbohydrates 1.0b 2.1b 4.6a 0.32 <0.001
Ash 3.76c 9.85a 8.35b 0.277 <0.001
Ca 0.18c 0.43a 0.28b 0.016 <0.001
P 0.24c 0.42a 0.33b 0.013 <0.001
K 1.06c 4.34a 2.99b 0.077 <0.001
pH 3.68b 4.48a 4.46a 0.026 <0.001
Fermentation acids
Lactic 4.17b 7.03a 6.43a 0.309 <0.01
Acetic 1.20b 3.34a 2.29ab 0.435 0.04
Propionic 0.02b 0.49a 0.09b 0.043 <0.001
Butyric ND3 0.85 ND - -
Isobutyric ND 0.53 ND - -
Titratable acidity,
meq/100g 5.82b 8.26a 5.00b 0.486 <0.01
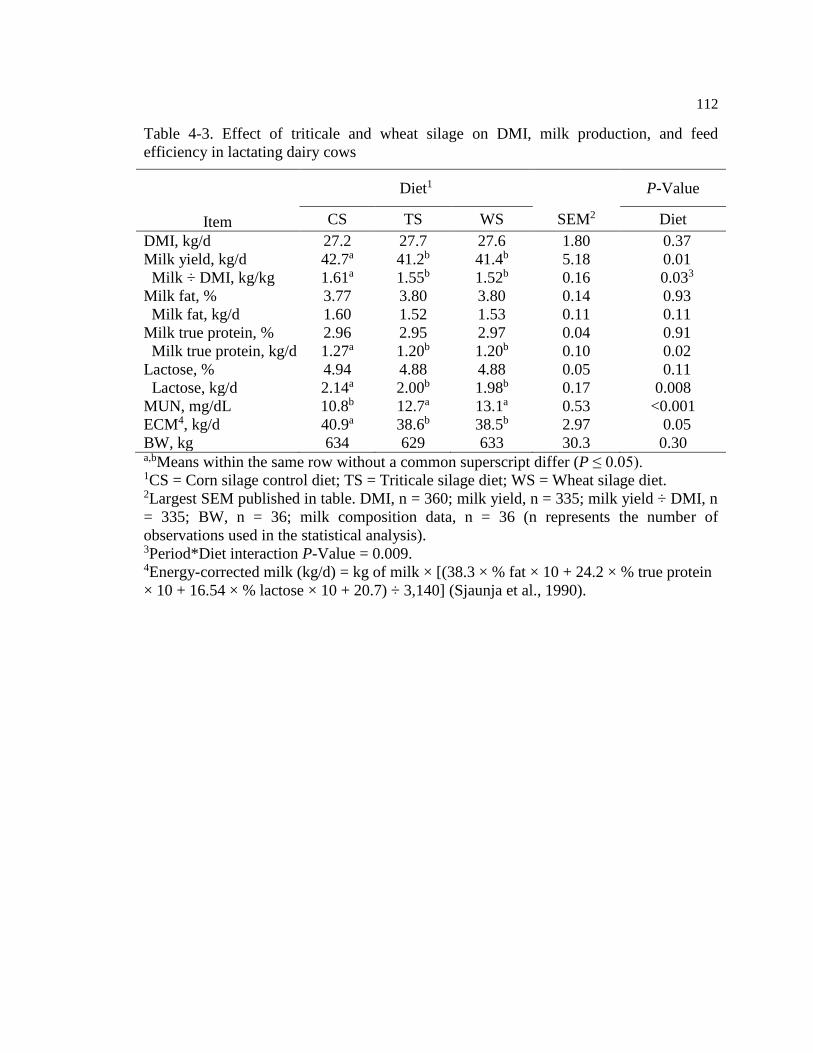
112
Table 4-3. Effect of triticale and wheat silage on DMI, milk production, and feed
efficiency in lactating dairy cows
Diet1 P-Value
Item CS TS WS SEM2 Diet
DMI, kg/d 27.2 27.7 27.6 1.80 0.37
Milk yield, kg/d 42.7a 41.2b 41.4b 5.18 0.01
Milk ÷ DMI, kg/kg 1.61a 1.55b 1.52b 0.16 0.033
Milk fat, % 3.77 3.80 3.80 0.14 0.93
Milk fat, kg/d 1.60 1.52 1.53 0.11 0.11
Milk true protein, % 2.96 2.95 2.97 0.04 0.91
Milk true protein, kg/d 1.27a 1.20b 1.20b 0.10 0.02
Lactose, % 4.94 4.88 4.88 0.05 0.11
Lactose, kg/d 2.14a 2.00b 1.98b 0.17 0.008
MUN, mg/dL 10.8b 12.7a 13.1a 0.53 <0.001
ECM4, kg/d 40.9a 38.6b 38.5b 2.97 0.05
BW, kg 634 629 633 30.3 0.30 a,bMeans within the same row without a common superscript differ (P ≤ 0.05). 1CS = Corn silage control diet; TS = Triticale silage diet; WS = Wheat silage diet. 2Largest SEM published in table. DMI, n = 360; milk yield, n = 335; milk yield ÷ DMI, n
= 335; BW, n = 36; milk composition data, n = 36 (n represents the number of
observations used in the statistical analysis). 3Period*Diet interaction P-Value = 0.009. 4Energy-corrected milk (kg/d) = kg of milk × [(38.3 × % fat × 10 + 24.2 × % true protein
× 10 + 16.54 × % lactose × 10 + 20.7) ÷ 3,140] (Sjaunja et al., 1990).

113
Table 4-4. Effect of triticale and wheat silage on milk fatty acid composition (g/100 g of
total fatty acids) in lactating dairy cows
Diet1 P-Value
Fatty Acid CS TS WS SEM2 Diet
4:0 4.02b 4.44a 4.52a 0.102 0.008
6:0 2.24b 2.41a 2.42a 0.051 0.004
8:0 1.26b 1.33a 1.34a 0.036 0.033
10:0 2.86 2.90 2.87 0.101 0.83
10:1 0.26 0.28 0.27 0.013 0.08
11:0 0.07a 0.06b 0.05b 0.006 0.001
12:0 3.21 3.20 3.14 0.112 0.65
13:0 iso 0.03 0.03 0.03 0.001 0.48
13:0 anteiso 0.07 0.07 0.07 0.004 0.45
13:0 0.12a 0.10b 0.09b 0.008 0.001
14:0 iso 0.08b 0.10a 0.09ab 0.007 0.04
14:0 10.3 10.3 10.1 0.200 0.44
14:1 0.84 0.83 0.79 0.054 0.13
15:0 iso 0.19b 0.21a 0.20a 0.006 <0.001
15:0 anteiso 0.38 0.40 0.39 0.009 0.06
15:0 1.06a 0.96b 0.90b 0.046 0.003
16:0 iso 0.18b 0.21a 0.21a 0.015 <0.001
16:0 27.0a 26.5a 25.7b 0.458 0.02
16:1 1.19 1.09 1.10 0.068 0.09
17:0 iso 0.28 0.28 0.29 0.007 0.35
17:0 anteiso 0.38 0.38 0.39 0.007 0.28
17:0 0.54a 0.50b 0.50b 0.011 0.03
17:1 0.18a 0.16b 0.17ab 0.010 0.043
18:0 11.7b 12.5a 12.6a 0.416 0.008
trans-4 18:1 0.03 0.03 0.03 0.001 0.94
trans-5 18:1 0.02 0.02 0.02 0.001 0.79
trans-6,8 18:1 0.34a 0.31b 0.31b 0.009 0.003
trans-9 18:1 0.24 0.23 0.23 0.006 0.80
trans-10 18:1 0.68a 0.45b 0.44b 0.051 <0.001
trans-11 18:1 1.07 1.12 1.16 0.052 0.27
trans-12 18:1 0.28 0.32 0.27 0.024 0.31
cis-9 18:1 19.2 18.9 19.7 0.493 0.09
trans-15 18:1 0.27 0.28 0.26 0.012 0.17
cis-11 18:1 0.81a 0.69b 0.71b 0.036 <0.0013
cis-12 18:1 0.45a 0.42b 0.42b 0.011 <0.001
trans-16 18:1 0.40 0.41 0.39 0.010 0.18
Linoleic acid 3.42b 3.39b 3.55a 0.145 0.01
α-Linolenic acid 0.54c 0.60b 0.62a 0.021 <0.001
20:0 0.13b 0.15a 0.15a 0.004 <0.001

114
20:1 0.090b 0.094a 0.095a 0.003 0.013
cis-9,trans-11
CLA 0.54 0.52 0.52 0.024 0.69
trans-10,cis-12
CLA 0.002 0.001 0.000 0.001 0.21
20:2 0.04 0.05 0.04 0.002 0.13
20:3 0.14 0.14 0.14 0.008 0.69
20:4 0.17 0.16 0.16 0.005 0.22
20:5 0.03b 0.04a 0.04a 0.001 <0.001
22:0 0.05b 0.06a 0.06a 0.002 <0.001
24:0 0.026b 0.032a 0.033a 0.002 <0.001
24:1 0.001 0.001 0.001 0.001 0.64
22:4 0.04 0.03 0.04 0.002 0.38
22:5 0.10 0.09 0.09 0.007 0.57
Σ 16 28.3a 27.8a 27.0b 0.474 0.02
Σ SFA 66.1 67.0 66.1 0.642 0.09
Σ MUFA 26.4 25.6 26.3 0.543 0.11
Σ PUFA 5.01b 5.02b 5.20a 0.178 0.03
Σ trans FA 3.86 3.68 3.62 0.125 0.10
Σ OBCFA4 3.53 3.45 3.39 0.051 0.07
Unknown 2.50 2.43 2.37 0.108 0.63 a,bMeans within the same row without a common superscript differ (P < 0.05). 1CS = Corn silage control diet; TS = Triticale silage diet; WS = Wheat silage diet. 2Largest SEM shown; n = 36 (n represents number of observations used in the statistical
analysis). Data are presented as LSM. 3Period*Diet interactions: 8:0 = 0.05; 17:1 = 0.03; cis-11 18:1 = 0.04; 20:1 = 0.02. 4Sum of the odd and branched chain fatty acids (iso13:0, anteiso13:0, 13:0, iso14:0,
iso15:0, anteiso15:0, 15:0, iso16:0, iso17:0, 17:0, 17:1).

115
Table 4-5. Effect of triticale and wheat silage on nutrient intake and apparent total-tract
digestibility in lactating dairy cows
Diet1 P-Value
Item CS TS WS SEM2 Diet
Intake, kg/d
DM3 26.6 27.0 27.2 1.53 0.62
OM 24.8 25.0 25.2 1.42 0.76
CP 4.28b 4.65a 4.60a 0.26 0.006
Starch 7.33a 5.77b 5.62b 0.36 <0.001
NDF 8.85 9.18 9.25 0.52 0.17
ADF 5.61b 5.99a 6.01a 0.33 0.01
Apparent digestibility, %
DM 66.9a 67.0a 65.1b 0.75 0.01
OM 67.9a 68.2a 66.3b 0.73 0.01
CP 64.4 65.0 63.0 1.04 0.14
Starch 99.5a 99.3b 99.1c 0.05 <0.001
NDF 44.2b 47.0a 42.9b 1.07 0.005
ADF 37.1b 41.9a 36.8b 1.27 0.003 a,b,c Means within the same row without a common superscript differ (P < 0.05). 1CS = Corn silage control diet; TS = Triticale silage diet; WS = Wheat silage diet. 2Largest SEM published in table; n = 36 (n represents the number of observations used in
the statistical analysis). 3DM intake reported is during the fecal collection periods.

116
Table 4-6. Effect of triticale and wheat silage on nitrogen utilization and urinary purine
derivatives in lactating dairy cows
Diet1 P-Value
Item CS TS WS SEM2 Diet
N intake, g/d 685b 743a 736a 40.9 0.006
N excretion or secretion, g/d 594b 639a 633a 38.2 0.03
Urine N, g/d 157b 191a 173ab 12.7 0.009
UUN, g/d 121b 157a 155a 11.0 0.001
Fecal N, g/d 241b 261ab 275a 15.7 0.013
Total excreta N, g/d 398b 452a 447a 25.2 0.006
Milk N, g/d 196 188 186 15.7 0.08
N excretion or secretion, as % of N intake
Urine N 23.8 26.6 24.4 1.7 0.15
Fecal N 35.6 34.9 37.3 1.05 0.08
Total excreta N 59.4 61.5 61.7 2.51 .49
Milk N 29.4a 26.4b 26.2b 2.21 0.005
Urine output4, kg/d 17.9b 23.5a 22.4a 2.13 0.03
Urinary PD5 excretion, mmol/d
Allantion 452 502 493 48.0 0.61
Uric acid 65.4 68.4 67.7 6.72 0.87
Total PD 517 571 561 53.3 0.62 a,bMeans within the same row without a common superscript differ (P < 0.05). 1CS = Corn silage control diet; TS = Triticale silage diet; WS = Wheat silage diet. 2Largest SEM published in table; n = 36 (n represents the number of observations used in
the statistical analysis). 3Period*Diet interaction P-Value = 0.04. 4Estimated from urine creatinine concentration, assumed to be excreted at 29 mg/kg of
BW. 5Purine derivatives.

117
Table 4-7. Effect of triticale and wheat silage on carbon dioxide (CO2) and methane
(CH4) emissions1 in lactating dairy cows
Diet2 P-Value
Item CS TS WS SEM3 Diet
CO2 kg/d 13.5a 12.9b 12.8b 0.57 0.006
CH4, g/d 455 491 463 23.4 0.16
CH4, g/kg of DMI4 16.7 18.0 17.2 0.91 0.21
CH4, g/kg of MY4 11.6 12.3 12.0 1.03 0.61
CH4, g/kg of ECM4 11.7b 13.0a 12.5ab 0.74 0.04
CH4/CO2, g/kg 33.8b 38.1a 36.2a 0.88 0.005 a,bMeans within the same row without a common superscript differ (P < 0.05). 1Rumen gas emissions were measured using GreenFeed (C-Lock Technology Inc., Rapid
City, SD). Data were derived from 8 individual measurements staggered over a 3-d
period. 2CS = Corn silage control diet; TS = Triticale silage diet; WS = Wheat silage diet. 3Largest SEM published in table; n = 36 (n represents the number of observations used in
the statistical analysis). 4Based on milk yield and DMI data during the sampling periods.

118
Triticale and Wheat DM Disappearance
In situ incubation length, h
0 20 40 60 80 100
DM
dis
app
eara
nce
, %
30
40
50
60
70
80
90
Alfalfa Haylage
Corn Silage
Triticale Silage
Wheat Silage
Figure 4-1. Ruminal in situ DM disappearance of forage sources.
Data are means ± SE (n = 6). Disappearance curves were fit using SigmaPlot 10.0 (Systat
Software, Chicago, IL) to the equation p = a + b (1 - e-ct), where p is the degraded
fraction (of DM) at time t where a is the soluble fraction, b is the potentially degradable
fraction, and c is the rate of degradation of the b fraction (Ørskov and McDonald, 1979).
Effective degradability (ED) was estimated as: ED = a + b {c ÷ (c + k)}, where a, b, and
p are as above and k is the rate of passage (Ørskov and McDonald, 1979) assumed to be
0.03/h in this study: ED (model estimates ± SE) = alfalfa haylage 55.7 ± 0.48c; corn
silage 64.3 ± 0.46a; triticale silage 65.3 ± 0.49a; wheat silage 62.0 ± 0.48b. a,b,c Means
within the same row without a common superscript differ (P < 0.05).

119
Triticale and Wheat NDF Disappearance
In situ incubation length, h
0 20 40 60 80 100
ND
F d
isap
pea
ran
ce,
% o
f N
DF
0
10
20
30
40
50
60
70
80
Alfalfa Haylage
Corn silage
Triticale Silage
Wheat Silage
Figure 4-2. Ruminal in situ NDF disappearance of forage sources.
Data are means ± SE (n = 6). Disappearance curves of alfalfa haylage, triticle silage, and
wheat silage were fit using SigmaPlot 10.0 (Systat Software, Chicago, IL) to the equation
p = a + b (1 - e-ct), where p is the degraded fraction (of NDF) at time t where a is the
soluble fraction, b is the potentially degradable fraction, and c is the rate of degradation
of the b fraction (Ørskov and McDonald, 1979). Corn silage degradation data were fit to
a linear model with an R2 = 0.94. Effective degradability (ED) was estimated as: ED = a
+ b {c ÷ (c + k)}, where a, b, and p are as above and k is the rate of passage (Ørskov and
McDonald, 1979) assumed to be 0.03/h in this study: ED (model estimates ± SE) =
alfalfa haylage 29.0 ± 0.78c; triticale silage 40.8 ± 0.78a; wheat silage 36.1 ± 0.78b. a,b,c
Means within the same row without a common superscript differ (P < 0.05).

Chapter 5
Inclusion of brown midrib dwarf pearl millet silage in the diet of lactating
dairy cows.
Journal of Dairy Science Vol. 101, 2018
https://doi.org/10.3168/jds.2017-14036
M. T. Harper, A. Melgar, J. Oh, K. Nedelkov, G. Sanchez, G. W. Roth, and A. N. Hristov
ABSTRACT
Brown midrib brachytic dwarf pearl millet, Pennisetum glaucum, forage
harvested at the flag leaf visible stage and subsequentially ensiled, was investigated as a
partial replacement of corn silage in the diet of high producing dairy cows. Seventeen
lactating Holstein cows were fed 2 diets in a crossover design experiment with 2 periods
of 28 d each. Both diets had forage to concentrate ratios of 60:40. The control diet (CSD)
was based on corn silage and alfalfa haylage and in the treatment diet, 20% of the corn
silage dry matter (corresponding to 10% of the dietary dry matter) was replaced with
pearl millet silage (PMD). The effects of partial substitution of corn silage with pearl
millet silage on dry matter intake, milk yield, milk components, and fatty acid profile,
apparent total-tract digestibility of nutrients, N utilization, and enteric methane emissions
were analyzed. The pearl millet silage was higher in crude protein and neutral detergent
fiber and lower in lignin and starch than the corn silage. Diet did not affect dry matter

121
intake or energy corrected milk yield which averaged 46.7 ± 1.92 kg/d. The PMD
treatment tended to increase milk fat concentration, had no effect on milk fat yield, and
increased milk urea N. Concentrations and yields of milk protein and lactose were not
affected by diet. Apparent total-tract digestibility of dry matter decreased from 66.5% in
CSD to 64.5% in PMD. Similarly, organic matter and crude protein digestibility was
decreased by PMD, whereas neutral- and acid-detergent fiber digestibility was increased.
Total milk trans fatty acid concentration was decreased by PMD with a particular
decrease in trans-10 18:1. Urinary urea and fecal N excretion increased with PMD
compared with CSD. Milk N efficiency decreased with PMD. Carbon dioxide emission
was not different between the diets, but PMD increased enteric methane emission from
396 to 454 g/d and increased methane yield and intensity.
Substituting corn silage with brown midrib dwarf pearl millet silage at 10% of the
diet dry matter supported high milk production in dairy cows. When planning on farm
forage production strategies, brown midrib dwarf pearl millet should be considered as a
viable fiber source.
Keywords: dairy cow, methane, milk fat, pearl millet silage

122
INTRODUCTION
Dairy farms in the northeast U.S. rely on homegrown forages for the foundation
of their rations (Wolf, 2003). The amount and quality of the harvested forage affects
profitability and hence viability of dairy farms and particularly of smaller farms (< 200
cows) which may have fewer economies of scale or opportunity to purchase additional
hectares (Gillespie et al., 2010). Corn silage has qualities (e.g., high yield, simplicity of
harvest, high energy content) that make it a popular forage for dairy cows in the U.S.
However, the long growing season of corn may prevent double cropping with a winter
annual such as triticale in some areas that have shorter growing seasons.
Pearl millet is a warm season annual grass that has a shorter growing season than
corn (65 d vs. 130 d, respectively) and may be more practical for double cropping
strategies in certain northern geographic regions and years (e.g. abnormally wet spring
seasons which delay corn planting). Additionally, pearl millet is drought-tolerant with a
high water use efficiency which is a particularly important trait for crops planted after
winter annual cereals (cover crops) that may decrease the available soil moisture (Maman
et al., 2003; Zegada-Lizarazu and Iijima, 2005). Furthermore, inclusion of pearl millet
into a cropping plan may reduce corn disease pressure by rotating away from continuous
corn every few years (Thomison et al., 2011). To support high milk production of
lactating dairy cows, the harvested forage must be highly digestible (Van Soest, 1994).
There is a brown midrib (BMR) phenotype with lower lignin content and increased
digestibility in certain pearl millet varieties (Cherney et al., 1990; Mustafa et al., 2004;
Hassanat et al., 2007).

123
Messman et al. (1992) reported that milk yield (MY) of mid-lactation dairy cows
was maintained when pearl millet replaced corn silage in the diet. In another study with
lactating cows, MY was unaffected but yield of ECM was increased by feeding pearl
millet silage at 35% of the diet DM instead of corn silage (Amer and Mustafa, 2010). On
the other hand, in an experiment by Brunette et al. (2014) MY responses to 2 pearl millet
cultivars were inconsistent; feeding regular pearl millet silage decreased MY but feeding
sweet pearl millet silage did not affect MY when both were compared with corn silage. A
more recent study by Brunette et al. (2016) compared grass silage to either pearl millet
silage harvested in either the vegetative or mature stage. They reported no differences in
MY between the grass and pearl millet silage harvested in the vegetative stage, but they
did see a decrease in MY by the pearl millet harvested at the mature stage. To the
authors’ knowledge, there have been no studies investigating feeding BMR pearl millet to
lactating cows.
Therefore, the hypothesis of this study was that BMR brachytic dwarf pearl millet
silage could serve as alternative forage to partially substitute corn silage in lactating dairy
cow rations in the northeastern U.S. The objective of the experiment was to partially
replace corn silage with BMR dwarf pearl millet silage at 10% of the diet DM, and
investigate the effects on DMI, MY, milk components and fatty acid (FA) profile,
nutrient digestibility, N utilization, and enteric methane (CH4) emissions in lactating
dairy cows.
124
MATERIALS AND METHODS
Crops and Silages
The forages were grown in Centre County, PA at approximately 40° N latitude on
Hagerstown soil. Brown midrib dwarf pearl millet (Pennisetum glaucum ‘Exceed’;
King’s Agriseeds, Ronks, PA) was planted on June 15th, 2016 with a no-till drill (John
Deere 1590; Moline, IL) at a seeding rate of 22.4 kg/ha and a 19 cm row spacing. The
field was sprayed with glyphosate and fertilized with 44.8 t/ha of dairy manure
contributing 42 kg/ha of ammonium N and 177 kg/ha of organic N. An additional 73 kg
of N/ha from a 30% urea and ammonium nitrate liquid fertilizer was applied prior to
planting. Soybeans were grown in the field the previous year. A John Deere 945 mower
with a flail conditioner was used to mow the crop on August 3rd, 2016 at the flag leaf
visible stage at a height of 11.5 cm. After wilting to a target 30% DM, the forage was
gathered and chopped using a John Deere 6750 harvester on August 5th, 2016. Chop
length was set to 25 mm. The millet was ensiled without inoculant in a 2.4 m diameter
plastic silage bag (Up North Plastics, Cottage Grove, MN).
The silage corn (DKC 52-61; 102 d relative maturity; DeKalb, St. Louis, MO)
was not specifically grown for the current experiment but was from the forage source
normally fed to The Pennsylvania State University dairy herd. The corn for silage was
planted between May 1st and May 10th, 2015 at a rate of 79,000 seeds/ha. It was planted
with a no-till drill (John Deere 1590; Moline, IL) into fields fertilized with dairy manure
as stated above. An additional 43 kg/ha of N was applied as 30% urea and ammonium

125
nitrate liquid prior to planting and 67 kg/ha of N in the same form as a sidedress
application. Corn silage harvest was conducted between September 24th and September
28th, 2015 at a target DM of 38% with a 19 mm chop length and ensiled in an upright
concrete silo.
Animals and Diets
All animals were cared for according to procedures approved by The
Pennsylvania State University’s Institutional Animal Care and Use Committee.
Seventeen mid-lactation Holstein dairy cows (MY, 50 ± 4.2 kg; 2.5 ± 0.62 lactations;
DIM 66 ± 20 d; and BW 630 ± 71 kg at the beginning of the experiment) were used in the
feeding experiment and an additional 4 cows were used in the in situ analysis. The
experiment was a crossover design with 2 periods of 28 d each; 21 d were allowed for
adaptation to the diet and the last 7 d of each period were for data and sample collection.
Cows were allocated to 8 groups of 2 cows each, plus 1 spare cow, based on DIM, MY,
and parity. One cow got mastitis at the end of the first sampling period. Therefore, it was
decided to also collect samples from the spare cow for the second period. Cows within a
group were randomly assigned to one of 2 diets, as described below. All cows were
housed in the tie stall barn of The Pennsylvania State University’s Dairy Research and
Teaching Center. Diets were mixed and fed from a Rissler model 1050 TMR mixer (I.H.
Rissler Mfg. LLC, Mohnton, PA). Cows were fed once daily around 8 a.m. to yield
approximately 5-10% refusals. Feed was pushed up 3 times throughout the day. The cows
were milked twice daily at 7 a.m. and 6 p.m.

126
Two different diets (Table 1) were fed to the cows during the experiment as
follows: a control diet (CSD), based on corn silage and alfalfa haylage or a pearl millet
silage diet (PMD), in which pearl millet silage was included at 10% of dietary DM,
replacing 20% of the control diet corn silage DM. Thus, the only difference between CSD
and PMD was the replacement of 20% of the corn silage DM with pearl millet silage to
mimic a possible proportion of whole farm pearl millet crop yield. The CSD diet was
formulated to meet or exceed the NRC (2001) NEL and MP requirements of a Holstein
cow with 630 kg BW, 48 kg MY, 3.8% fat, 2.95% true protein, and at 28 kg DMI.
Sampling and Analyses
Refusals, TMR, and Feed Ingredients.
Refusals were collected into a Ranger Mate mobile tub scale (American Calan,
Northwood, NH) and weighed individually for each cow prior to the morning feeding to
measure daily as-fed intake. Total mixed ration, refusal and forage (pearl millet, alfalfa,
and corn silage) samples were collected twice weekly, composited by wk and diet (i.e.,
silage type), and stored at -20°C. The TMR was sampled within 1 h of feeding. The
weekly DM content of the TMR and refusals oven dried at 55°C for 72 h was used to
calculate the individual daily DMI. Fermentation profiles of fresh frozen samples of the
pearl millet, alfalfa and corn silages from each period were analyzed by Cumberland
Valley Analytical Services Inc. by wet chemistry for pH, and lactic, acetic, propionic,
butyric, and isobutyric acid concentrations. Pearl millet, corn and alfalfa silages were

127
oven dried at 55°C for 72 h, ground through a 4 mm screen (for in situ degradability
measurements), then ground through a 1 mm screen in a Wiley mill (Thomas Scientific,
Swedesboro, NJ) and composited by period on an equal weight basis. Dried composite
samples of pearl millet, alfalfa and corn silages were sent to Cumberland Valley
Analytical Services Inc. (Maugansville, MD) to be analyzed by wet chemistry methods
for amylase-treated NDF (Van Soest et al., 1991), ADF (method 973.18; AOAC
International, 2000), lignin (Goering and Van Soest, 1970), fat (method 2003.05; AOAC
International, 2006), CP (method 990.03; AOAC International, 2000), soluble protein
(Krishnamoorthy et al., 1982), starch (Hall, 2009), ethanol-soluble carbohydrates, which
measures mono-, di-, and oligosaccharides (DuBois et al., 1956), ash (method 942.05;
AOAC International, 2000), and minerals (method 985.01; AOAC International, 2000).
Concentrate feeds were sampled weekly and stored at -20°C until analysis.
Concentrate feed samples were ground and composited once for the entire experiment.
Dried composite concentrate ingredients were analyzed by Cumberland Valley Analytical
Services Inc. by wet chemistry methods for CP, amylase-treated NDF, ADF, fat, CP,
starch, ash, and minerals (procedures as referenced above). The percent NFC was
calculated using the equation NFC% = 100 – CP% − fat% − NDF% − ash% and NEL
using the equation NEL = 0.0245 × TDN − 0.12. Concentrations of CP, NDF, ADF, NFC,
NEL, starch, fat, ash, Ca, and P in the TMR were calculated based on the individual feed
ingredient values and their percent inclusion in the TMR. The diet values for RDP, RUP,
and NEL balance were calculated based on NRC (2001) at actual DMI, MY, BW, and
milk composition of the cows.

128
Milk.
Milk weights were automatically recorded at each milking using the Afimilk
system (Kibbutz Afikim, Israel). Milk samples for components and FA analysis were
collected on two consecutive days (4 consecutive milkings) during wk 4 of each
experimental period from the p.m. and a.m. milkings. Milk component samples were
collected into tubes containing 2-bromo-2-nitropropane-1,3-diol and analyzed
individually by Dairy One Laboratory (Ithaca, NY) for fat, true protein, MUN, and
lactose content using infrared spectroscopy (Milkoscan 4000; Foss Electric, Hillerød,
Denmark). Milk samples for FA analysis from the 4 milkings for each period were
collected without preservative, stored chilled at 4°C and later composited by cow
weighted for the milk production of each milking. The composited milk samples were
centrifuged, the milk fat was skimmed off and then stored frozen at -20°C until analyzed
for FA using the procedure described by Rico and Harvatine (2013). Cow BW was
recorded twice daily upon exiting the milking parlor using an AfiFarm 3.04E scale
system (S.A.E. Afikim, Rehovot, Israel).
Estimation of Digestibility and Gas Emissions.
During wk 4 of each period, urine and fecal samples were collected for estimation
of apparent digestibility and N utilization. Spot urine and fecal samples (approximately
300 ml and 500 g per sample, respectively) were collected 8 times over 3 d at (d 1) 0500,
1100, 1700, and 2300 h; (d 2) 0800, 1400, and 2000 h; and (d 3) 0200 to obtain a
representative sample of a 24 h period. A full description of the urine and fecal sample

129
processing and analyses can be found in Lee et al. (2012). Briefly, raw urine from each
sampling was acidified, diluted, composited by cow and period, and stored frozen at -
20°C for later analysis of allantoin, uric acid, creatinine, urea N and total N. Allantoin
was analyzed following the procedure by Chen et al. (1992). Stanbio Laboratory (Boerne,
TX) kits were used to analyze uric acid (Uric Acid Kit 1045), creatinine (Creatinine Kit
420), and urea N (Urea Nitrogen Kit 580). Total N was analyzed in freeze dried urine
samples of approximately 60 µl of 1:10 diluted and acidified urine using a Costech ECS
4010 C/N/S elemental analyzer (Costech Analytical Technologies Inc., Valencia, CA).
Fecal samples were oven dried at 65°C, ground through a 1-mm screen in a Wiley mill
and analyzed for DM, OM, CP, starch, NDF and ADF. A Mixer Mill MM 200 (Retsch
GmbH, Haan, Germany) was used to pulverize a 0.5 g aliquot of fecal sample for CP
analysis (N × 6.25) using a Costech ECS 4010 C/N/S elemental analyzer. Starch analysis
of fecal DM for apparent total tract digestibility was performed using a procedure similar
to the method including acetate buffer described by Hall (2009). Briefly, starch was
gelatinized with 50% NaOH, incubated for 16 h at 55°C with acetate buffer and amylase,
centrifuged, plated on a 96-well plate and then reacted with a PGO (Glucose
Oxidase/Peroxidase) enzyme solution (P7119; Sigma-Aldrich, Saint Louis, MO) for 45
min before being read at 450 nm. Neutral- and acid-detergent fiber were analyzed with an
Ankom 200 fiber analyzer (Ankom Technology Corp., Macedon, NY) based on the
procedures of Van Soest et al. (1991) with α-amylase and sodium sulfite in the NDF
analysis. A 12-d ruminal incubation was used to analyze indigestible NDF (iNDF;
Huhtanen et al., 1994 as modified by Lee et al., 2012) in both feces and TMR, which was
used as a marker to estimate apparent total-tract digestibilities of dietary nutrients.

130
Enteric CH4 and carbon dioxide (CO2) emissions were measured during wk 4 of
each experimental period with the GreenFeed system (C-Lock Inc., Rapid City, SD). The
GreenFeed system measures gas mass fluxes and is one of the established techniques for
measuring enteric CH4 emissions from ruminant animals (Hristov et al., 2015b;
Hammond et al., 2016). One GreenFeed unit was used to measure gas emissions from all
cows individually in a sequential manner for 5 min of breath gas sampling and 2 min of
background gas sampling at every collection time point. There were 8 collection time-
points for each cow during each experimental period. The unit was positioned in the feed
bunk in front of each cow starting at (d1) 0800, 1400, and 2000 h; (d2) 0200, 1100, 1700,
and 2300 h; and (d3) 0500 to obtain a representative sample of a 24-h period. A detailed
and visual explanation of the gas sampling procedures can be viewed in Hristov et al.
(2015a). Gas emission data were averaged by cow and period for the statistical analysis.
In Situ DM and NDF Degradation
Ruminal disappearance of DM and NDF was determined in situ for pearl millet,
alfalfa and corn silages that were fed during the experiment. Four ruminally cannulated
lactating Holstein cows averaging: DMI 28.3 ± 4.9 kg; MY 37.8 ± 9.2 kg; 2.8 ± 0.5
lactations; DIM 208 ± 26 d; and BW 639 ± 94.4 kg were used for in situ incubations.
Cows were fed (% DM basis) corn silage 51.3, alfalfa haylage 7.4, straw 3.5, canola meal
8.9, SoyPLUS (West Central Cooperative, Ralston, IA) 8.0, ground corn 7.0, roasted
soybeans 5.0, molasses 5.0, whole cotton seed 2, and mineral mix 1.9. The in situ
procedure was performed as described in Harper et al. (2017b). Briefly, triplicate samples

131
of 7 g each of dried 4-mm ground silages were weighed into Ankom nylon bags (10cm x
20cm Forage Bag; Ankom Technology Corp., Macedon, NY) which were sequentially
incubated in the ventral rumen for 96, 72, 48, 24, 12, and 0 h and simultaneously
removed. All bags were washed under cold water and then oven-dried for 72 h at 55°C.
Ruminal disappearance was calculated based on initial dry weight of the incubated
sample, residue dry weight, and NDF concentration of initial sample and bag residue.
Degradation data were fitted to a line rising exponentially to a maximum value with the
equation p = a + b (1 - e-ct), using SigmaPlot v10.0 (Systat Software Inc., San Jose, CA)
where p is the degraded fraction (of DM or NDF) at time t, constant a is the soluble
fraction (or intercept), b is the potentially degradable fraction (i.e., predicted fraction of
DM or NDF that is potentially degradable in the rumen), and c is the rate of degradation
of the b fraction (Ørskov and McDonald, 1979). The effective degradability (ED; an
estimate of the percentage of DM or NDF that would be degraded in the rumen at
specified passage rate) was determined with the following equation (Ørskov and
McDonald, 1979): ED = a + b {c ÷ (c + k)}, where k is the rate of passage assumed to be
3%/h.
Statistical Analysis
Statistical analyses were run using the MIXED procedure of SAS v9.4 (SAS
Institute Inc., Cary, NC). Cow was the experimental unit. Milk yield, BW, and DMI from
the last 7 d of the experiment and the 2 d of milk composition samples were analyzed
with day as a repeated measure using an AR(1) covariance structure. The statistical

132
model included diet, day, period, and period × diet and diet × day interactions. Group and
cow within group were random effects with all others fixed. Milk FA, nutrient intake,
apparent digestibility, N utilization, and CH4 and CO2 emissions data were analyzed
using the same model without day and diet × day interaction. Body weight change was
calculated as the average BW of the last 3 d of the experimental period less the average
BW of the first 3 d of the experimental period. Milk composition data were weighted
averages per day based on the MY of the evening and morning milkings. Individual
ruminal in situ degradation parameters (a, b, c, and ED) of DM and NDF were contrasted
among forages. For all data, significance was declared at P ≤ 0.05 and tendency was
declared at 0.05 < P ≤ 0.10. If not indicated otherwise, data are presented as least squares
means.
RESULTS AND DISCUSSION
Forages
Brown midrib dwarf pearl millet yielded 2.8 t DM/ha in the first cutting and was
used to conduct the animal experiment. Nutrient composition and fermentation profiles of
pearl millet and corn silages are shown in Table 2. The corn silage had a high starch
content of 40% DM in contrast to the <1% starch in the pearl millet silage. The pearl
millet was harvested at the flag leaf visible stage and, therefore, low starch concentrations
were expected. Pearl millet silage had a higher concentration of NDF compared with corn
silage which was similar to results of Hassanat et al. (2007) and Mustafa et al. (2004)

133
who reported 59 and 61% NDF, respectively, in BMR pearl millet forage. Lignin
concentration was similar between pearl millet silage and corn silage. Lignin is found in
the plant cell wall and its association with cellulose and hemicellulose decreases NDF
digestibility (Van Soest, 1994). Therefore, a better way to compare lignin concentrations
between the corn and pearl millet silages may be on an NDF basis. Looking at lignin this
way shows a larger difference between the forages at 7.42 vs. 4.28% lignin, as a % of
NDF, for corn silage and pearl millet silage, respectively. Crude protein content was
greater in the pearl millet silage, compared with the corn silage. Potassium concentration
was greater in the pearl millet silage which would be a disadvantage when trying to lower
diet DCAD in prepartum cows to decrease the risk of hypocalcemia (Charbonneau et al.,
2006).
Fermentation acid concentrations were numerically similar between the forages.
Butyric acid was not detected in either silage indicating that Clostridial fermentation was
likely not taking place. Silage pH was considerably lower for corn silage compared with
the pearl millet silage, which had a pH typical for grass silages. Ward et al. (2001)
reported a similar pH of 4.50 for pearl millet silage in their study.
Dry Matter Intake, Body Weight, and Milk Yield
Dry matter intake, BW, and milk production results are shown in Table 3. Diet
had no effect on DMI. Dry matter intake is driven by nutrient demand (e.g. ECM yield)
and constrained by rumen capacity (Mertens, 2009). Messman et al. (1992) reported a
decrease in DMI for a diet containing 50% non-BMR pearl millet containing 46.5% NDF

134
compared with an alfalfa and corn silage control diet containing 35.0% NDF. The current
study PMD treatment contained 32.4% NDF and does not seem to have restricted DMI.
Body weight change was not statistically different but the short term (28 d) design of this
study did not enable us to statistically perceive small differences in BW change. Yield of
ECM and ECM feed efficiency were similar between CSD and PMD. Amer and Mustafa
(2010) likewise reported no change in DMI for lactating cows fed pearl millet silage or
corn silage at approximately 35% of the diet. Neither did they see a reduction in milk
yield (averaging 38 kg/d) or feed efficiency (1.60 kg milk/ kg DMI). Unfortunately,
specific effects of pearl millet on milk production are difficult to elucidate in that study
because Megalac, a calcium salt product of palm oil fatty acids, was supplemented
uniquely to the pearl millet diet and likely influenced the results. The design of the
current study only altered the amount of corn silage and pearl millet in the diet and
therefore differences in the data between treatments can be directly attributed to the
forage change. Milk yield of the current study was decreased (P < 0.001) by PMD along
with a decrease in feed efficiency per unit of milk (P < 0.01). However, as the next
section details, milk yield differences were largely based on a lower concentration of
milk components in CSD milk which does not add value to milk producers and therefore
should not be emphasized.
Milk Composition and Yield
Milk fat content tended to increase (P = 0.06) from 3.47% with CSD to 3.71%
with PMD but milk fat yield was not different between diets. Milk true protein content
135
and yield were similar between diets. Lactose content and yield were also not different
between diets. Early research reported decreases in milk fat content of dairy cows grazing
pearl millet (Miller et al., 1965; Bucholtz et al. 1969) and consuming pearl millet
greenchop (Harner et al., 1969; Schneider et al. 1970) vs sudan grass. More recent
research from Messman et al. (1992) and Brunette et al. (2014) observed numerically
increased milk fat content when comparing corn silage with pearl millet silage.
Furthermore, increases in milk fat concentration are often reported when total dietary
fiber and fiber digestibility increases due to a shift in VFA production increasing the
acetate:propionate ratio (Oba and Allen, 1999; Ivan et al. 2005). The PMD treatment had
a higher NDF concentration, as stated earlier, and increased NDF digestibility which is
mentioned in the following section.
Nutrient Intake and Digestibility
Many of the production results discussed above relate to nutrient intake and
apparent digestibility effects, presented in Table 4. Higher intakes of OM (P = 0.03) and
starch (P < 0.001) for CSD reflect the lower ash and higher starch concentrations,
respectively, in the corn silage compared with pearl millet silage. The higher NDF (P =
0.001) and ADF (P = 0.004) intakes for PMD are a result of greater concentrations of
those components in the pearl millet silage. Amer and Mustafa (2010) likewise reported
higher NDF intake for lactating cows fed pearl millet silage vs. corn silage. Greater (P <
0.001) DM and OM apparent digestibility in CSD was a result of the over 1 kg/d higher
starch intake and lower NDF intake in that diet compared with PMD. Apparent starch

136
digestibility in this experiment was around 99% whereas NDF digestibility was
approximately 40%. There was a > 6% increase in NDF (P < 0.001) and ADF (P = 0.02)
apparent digestibility for the PMD treatment. This is likely caused by 2 factors. First,
cellulose digestion is decreased with lower rumen pH (Ørskov and Fraser, 1975) and,
even though we did not measure rumen pH directly, it is likely that rumen pH was lower
in cows fed CSD due to the higher starch content of CSD (Lechartier and Peyraud, 2011).
Second, the pearl millet silage fiber components were likely more easily digestible due to
less lignin per unit of NDF indicating the potential for fewer lignin crosslinks with
cellulose and hemicellulose in that early harvested forage as supported by the in situ data
below (Mertens, 1985; Cherney et al., 1991; Grabber et al., 2009).
Milk Fatty Acid
Milk FA data are shown in Table 5. The PMD treatment had higher (P = 0.04)
concentrations of 4:0 and 6:0 but there were no differences in total de novo FA or SFA.
There was a higher (P = 0.002) concentration of 18:0 in PMD and lower (P ≤ 0.02)
concentration of total trans FA. Increased 18:0 in PMD indicates a more complete
ruminal biohydrogenation of linoleic and linolenic unsaturated fatty acids. This is
supported by the decrease (P = 0.03) in total PUFA concentration (primarily 18 carbons)
in PMD. Although total MUFA concentrations were not different between the treatments,
trans-10 18:1 was higher (P = 0.008) in CSD. Increases in trans-10 18:1 have been
negatively related to milk fat production primarily through its association with production
of biohydrogenation intermediate trans-10, cis-12 CLA which is its precursor (Harvatine

137
et al., 2009; Rico and Harvatine, 2013). Diets high in unsaturated fats, high in rapidly
fermentable carbohydrates, and low in NDF tend to lower rumen pH and increase trans-
10 18:1 production (Rico and Harvatine, 2013; Zened et al., 2013). Other studies have
reported similar shifts in milk trans FA when comparing corn silage to grass silage diets
(Nielsen et al., 2004; Shingfield et al., 2005).
The concentrations of branched chain FA iso 14:0 and iso 15:0 were increased (P
< 0.001) in PMD. Experiments replacing grass silage with corn silage, which is similar to
the current study, have likewise reported a decrease in iso 14:0 and iso 15:0 in milk FA
(Vlaeminck et al., 2006a). Cellulolytic bacteria Ruminococcus albus and Ruminococcus
flavefaciens have higher concentrations of iso 14:0 and iso 15:0, respectively, than other
rumen bacteria particularly amylolytic species (Vlaeminck et al., 2006a). The PMD
treatment in the current study would have promoted more favorable rumen conditions for
cellulolytic bacteria than CSD. Additionally, Vlaeminck et al. (2006b) reported a positive
correlation between iso 14:0 and iso 15:0 and rumen proportions of acetate and a negative
correlation to rumen proportions of propionate indicating potentially less propionate
production by PMD.
In Situ DM and NDF Degradation
In situ DM (Figure 1) and NDF (Figure 2) disappearance data for the 3 silages fed
in the experiment help characterize pearl millet silage. Dry matter solubility (i.e., fraction
a) of pearl millet silage was lower (P < 0.001) than corn silage and alfalfa haylage, 21.5
vs. 49.7 and 39.4%, respectively (data not shown in tables). Potentially degradable DM, b

138
fraction, was highest (P < 0.001) in the pearl millet silage, 60.9%, and similar for corn
silage and alfalfa haylage, 30.7 and 29.2%, respectively. Fractional rate of disappearance
of the potentially degradable DM, c, was highest (P < 0.001) for alfalfa haylage, 5.7 %/h,
lowest for corn silage, 2.1%/h, and intermediate for pearl millet silage, 3.1%/h. Effective
degradability of DM, calculated with an estimated 3%/h passage rate, was highest for
corn silage, 62.2%, intermediate for alfalfa haylage, 58.6%, and lowest for pearl millet
silage, 52.2% (Figure 1).
Soluble NDF was highest (P <0.001) in alfalfa haylage, 8.5%, lower for corn
silage (2.3%), and 0% for pearl millet silage. Potentially degradable NDF was similarly
high for corn silage and pearl millet silage, 83.7 and 82.2% respectively, and lower (P <
0.001) for alfalfa haylage, 35.1%. Fractional disappearance rates of NDF were similar for
alfalfa haylage and pearl millet silage, 3.4 and 2.9%/h respectively, and lower (P < 0.001)
for corn silage, 1%/h. Pearl millet silage had the highest (P < 0.001) ED of NDF, 37.3%,
followed by alfalfa haylage and corn silage at 27.0 and 21.9%, respectively.
In situ DM solubility reflected differences in the NFC content of the silages, 49.9,
24.4, and 13.3% for corn silage, alfalfa haylage and pearl millet silage, respectively, and
affected ED of forage DM. The higher DM ED of corn silage vs. pearl millet silage is
consistent with the higher DM apparent digestibility of CSD vs. PMD. The higher ED of
NDF for the pearl millet silage was likely due to its lower lignin content, as a % of NDF,
compared with corn silage and agrees with the increased NDF apparent digestibility of
the PMD treatment. Mustafa et al. (2004) observed similar in situ NDF degradability
measurements for first cutting BMR pearl millet forage with a, b, and c values of 2.2,

139
77.2, and 3.6%, respectively. Diet of the cow in which in situ bags are incubated has an
effect on degradation results (Vanzant et al., 1998) which may explain why NDF ED of
BMR pearl millet silage from the current study was lower than the NDF ED of BMR
pearl millet forage reported by Mustafa et al. (2004) which averaged 44.2% calculated
using a 3%/h passage rate.
N Utilization
Nitrogen intake (Table 6) was not significantly affected by diet but N excretion
both in urine and feces appeared to be higher (P ≤ 0.01) for PMD. Milk N secretion was
higher (P = 0.02) in CSD, compared with PMD. Excretion of urinary purine derivatives,
allantoin and uric acid, was not different between diets. These urinary compounds have
been used as an indirect indicator of ruminal microbial protein synthesis (Chen, 1989).
Urinary urea N excretion was higher (P ≤ 0.001) with PMD probably due to the higher
concentrations of ammonia in the pearl millet silage not being incorporated into microbial
protein before being absorbed by the rumen wall. It is also plausible that the CP of the
pearl millet silage was truly less digestible than the corn silage CP because the neutral
detergent insoluble CP was 1.17% in the pearl millet silage vs 0.50% in the corn silage.
The PMD treatment had lower (P < 0.001) milk N use efficiency and higher (P ≤ 0.02)
total N excretion as a percent of N intake. This can be detrimental to the environment and
N use efficiency might be improved by reducing supplemental CP sources when
incorporating a higher CP forage, such as pearl millet silage, in dairy diets (O’Mara et al.,
1998; Bernard et al., 2002).

140
Enteric Methane and Carbon Dioxide Emissions
Enteric CH4 and CO2 emission results are shown in Table 7. No differences were
observed in CO2 emissions, which predominantly originate from bovine cellular
respiration and to a much lesser degree from enteric fermentation (Hammond et al.,
2016). Dairy cattle CO2 emissions have been correlated to DMI, milk production and
metabolic body weight which were similar in this study (Kirchgessner et al., 1991;
Kinsman et al., 1995). Daily enteric CH4 production, yield (i.e., per kg of DMI), and
intensity (i.e., per kg of ECM) were all increased (P < 0.01) by PMD, compared with
CSD. Total daily enteric CH4 production of the cows in the current study was high
because of their high DMI (Knapp et al., 2014) but within the range of values reported by
Hristov et al. (2015b) for high producing Holstein cows. Both diets had lower CH4 yield
and intensity than previous work conducted by the authors (Harper et al., 2017a; Harper
et al., 2017b) due to the high milk yield and early stage of lactation of the cows.
The increase in enteric CH4 production with PMD is not beneficial to the
environment and it has to be accounted for in the context of whole-farm greenhouse gas
emissions balance. Decreased diet digestibility and increased fiber content have been
shown to increase enteric CH4 emission intensity (McGeough et al., 2010). Interestingly,
O’Neill et al. (2011) reported a decrease in enteric CH4 production, yield, and intensity
from dairy cattle grazing high quality perennial ryegrass compared with a TMR. In that
study, the perennial ryegrass had a higher NDF content but also a higher OM digestibility
suggesting that diet digestibility might have a stronger influence then total diet NDF
content on enteric CH4 emissions. In the current study, PMD decreased apparent OM

141
digestibility and had a higher fiber content which explains the increase in enteric CH4
emissions. The higher enteric CH4 emissions for PMD may have decreased the available
energy for milk production in that diet (Johnson and Johnson, 1995), which may help
explain the decrease in milk yield with PMD.
CONCLUSIONS
Pearl millet silage included at 10% of dietary DM supported a high level of milk
production in peak lactation dairy cows, did not decrease DMI, and maintained ECM
yield compared to a corn silage-based control diet. The pearl millet diet tended to
increase milk fat content and increased NDF digestibility but decreased OM digestibility.
The fiber of pearl millet silage is highly digestible and replaces corn silage fiber well.
However, pearl millet silage cut early, as in this experiment, lacks the starch that is
removed from the diet when replacing corn silage. In practical rations, a diet containing
pearl millet silage would likely have to be balanced for NFC and CP to maintain milk
production and better utilize N in high producing cows. Pearl millet shows promise as
forage that could help diversify crop rotations particularly on dairy farms in the
Northeastern U.S.
ACKNOWLEDGEMENT
This project supported by the Northeast Sustainable Agriculture Research and
Education (SARE) program. SARE is a program of the National Institute of Food and

142
Agriculture, U.S. Department of Agriculture. The authors thank the staff of Farm
Operations and Services of the Pennsylvania State University for growing and harvesting
the crops fed in our experiment. We also thank the staff of the Pennsylvania State
University’s Dairy Teaching and Research Center for their conscientious care of the
experimental cows.
REFERENCES
Amer, S. and A. F. Mustafa. 2010. Short communication: Effects of feeding pearl millet
silage on milk production of lactating dairy cows. J. Dairy Sci. 93:5921–5925.
doi:10.3168/jds.2010-3279
AOAC International. 2000. Official Methods of Analysis. 17th ed. AOAC International,
Arlington, VA.
AOAC International. 2006. Official Methods of Analysis. 18th ed. AOAC International,
Arlington, VA.
Bernard, J. K., J. W. West, and D. S. Trammell. 2002. Effect of replacing corn silage
with annual ryegrass silage on nutrient digestibility, intake, and milk yield for
lactating dairy cows. J. Dairy Sci. 85:2277–2282.
Brunette, T., B. Baurhoo, and A. F. Mustafa. 2014. Replacing corn silage with different
forage millet silage cultivars: Effects on milk yield, nutrient digestion, and ruminal
fermentation of lactating dairy cows. J. Dairy Sci. 97:6440-6449.
doi:10.3168/jds.2014-7998
Brunette, T., B. Baurhoo, and A. F. Mustafa. 2016. Effects of replacing grass silage with
forage pearl millet silage on milk yield, nutrient digestion, and ruminal fermentation
of lactating dairy cows. J. Dairy Sci. 99:269-279. doi:10.3168/jds.2015-9619
Bucholtz, H. F., C. L. Davis, D. L. Palmquist, and K. A. Kendall. 1969. Study of the low-
fat milk phenomenon in cows grazing pearl millet pastures. J. Dairy Sci. 52:1388-
1394.
Charbonneau, E., D. Pellerin, and G. R. Oetzel. 2006. Impact of lowering dietary cation-
anion difference in nonlactating dairy cows: A meta-analysis. J. Dairy Sci. 89:537–
548.

143
Chen, X. B. 1989. Excretion of purine derivatives by cattle and sheep and its use for the
estimation of absorbed microbial protein. Ph.D. Dissertation. Aberdeen Univ. UK.
Chen, X. B., Y. K. Chen, M. F. Franklin, E. R. Ørskov, and W. J. Shand. 1992. The effect
of feed intake and body weight on purine derivative excretion and microbial protein
supply in sheep. J. Anim. Sci. 70:1534-1542.
Cherney, D. J. R., J. A. Patterson, and K. D. Johnson. 1990. Digestibility and feeding
value of pearl millet as influenced by the brown-midrib, low-lignin trait. J. Anim.
Sci. 68:4345-4351.
Cherney, J. H., D. J. R. Cherney, D. E. Akin, and J. D. Axtell. 1991. Potential of brown-
midrib, low-lignin mutants for improving forage quality. Advances in Agronomy
46:157-198. doi:10.1016/S0065-2113(08)60580-5
Dubois, M., K. A. Gilles, J. K. Hamilton, P. A. Rebers, and F. Smith. 1956. Colorimetric
method for determination of sugars and related substances. Anal. Chem. 28:350.
Gillespie, J., R. Nehring, C. Sandretto, and C. Hallahan. 2010. Forage outsourcing in the
dairy sector: The extent of use and impact on farm profitability. Agric. Resour.
Econ. Rev. 39:399-414.
Goering, H. K. and P. J. Van Soest. 1970. Forage Fiber Analysis. USDA Agricultural
Research Service. Handbook number 379. U.S. Dept. of Agriculture. Superintendent
of Documents, US Government Printing Office, Washington, D.C. 20402.
Grabber, J. H., D. R. Mertens, H. Kim, C. Funk, F. Lua, and J. Ralpha. 2009. Cell wall
fermentation kinetics are impacted more by lignin content and ferulate cross-linking
than by lignin composition. J. Sci. Food Agric. 89:122-129.
Hall, M. B. 2009. Determination of starch, including maltooligosaccharides, in animal
feeds: Comparison of methods and a method recommended for AOAC collaborative
study. J. AOAC Int. 92:42-49.
Hammond, K. J., L. A. Crompton, A. Bannink, J. Dijkstra, D. R. Yanez-Ruiz, P. O’Kiely,
E. Kebreab, M. A. Eugene, Z. Yu, K. J. Shingfield, A. Schwarm, A. N. Hristov, and
C. K. Reynolds. 2016. Review of current in vivo measurement techniques for
quantifying enteric methane emission from ruminants. Anim. Feed Sci. Technol.
219:13-30. doi:10.1016/j.anifeedsci.2016.05.018
Harner, J. P., R. W. Hemken, J. H. Vandersall, N. A. Clark, and B. A. Schneider. 1969.
Relationship of pearl millet to milk fat depression in dairy cows. I. Cation
fertilization. J. Dairy Sci. 52:1244-1248.
Harper, M. T., J. Oh, F. Giallongo, J. C. Lopes, G. W. Roth, and A. N. Hristov. 2017a.
Using brown midrib 6 dwarf forage sorghum silage and fall-grown oat silage in
lactating dairy cow rations J. Dairy Sci. 100:5250-5265. doi:10.3168/jds.2017-
12552
144
Harper, M. T., J. Oh, F. Giallongo, G. W. Roth, and A. N. Hristov. 2017b. Inclusion of
wheat and triticale silage in the diet of lactating dairy cows. J. Dairy Sci. 100:6151-
6163. doi:10.3168/jds.2017-12553.
Harvatine, K. J., Y. R. Boisclair, and D. E. Bauman. 2009. Recent advances in the
regulation of milk fat synthesis. Animal 3:40–54.
Hassanat, F., A. F. Mustafa, and P. Seguin. 2007. Effects of inoculation on ensiling
characteristics, chemical composition and aerobic stability of regular and brown
midrib millet silages. Anim. Feed Sci. Technol. 139:125-140.
doi:10.1016/j.anifeedsci.2007.01.005
Hristov, A. N., J. Oh, F. Giallongo, T. Frederick, H. Weeks, P. R. Zimmerman, R. A.
Hristova, S. R. Zimmerman, and A. F. Branco. 2015a. The use of an automated
system (GreenFeed) to monitor enteric methane and carbon dioxide emissions from
ruminant animals. J. Vis. Exp. 103:e52904.
Hristov, A. N., J. Oh, F. Giallongo, T. W. Frederick, M. T. Harper, H. L. Weeks, A. F.
Branco, P. J. Moate, M. H. Deighton, S. R. O. Williams, M. Kindermann, and S.
Duval. 2015b. An inhibitor persistently decreased enteric methane emission from
dairy cows with no negative effect on milk production. Proc. Natl. Acad. Sci.
112:10663-10668. doi:10.1073/pnas.1515515112
Huhtanen, P., K. Kaustell, and S. Jaakkola. 1994. The use of internal markers to predict
total digestibility and duodenal flow of nutrients in cattle given six different diets.
Anim. Feed Sci. Technol. 48:211-227.
Ivan, S. K., R. J. Grant, D. Weakley, and J. Beck. 2005. Comparison of a corn silage
hybrid with high cell-wall content and digestibility with a hybrid of lower cell-wall
content on performance of Holstein cows. J. Dairy Sci. 88:244-254.
Johnson, K. A., and D. E. Johnson. 1995. Methane emissions from cattle. J. Anim. Sci.
73:2483-2492.
Kinsman, R., F. D. Sauer, H. A. Jackson, and M. S. Wolynetz. 1995. Methane and carbon
dioxide emissions from dairy cows in full lactation monitored over a six-month
period. J. Dairy Sci. 78:2760-2766.
Kirchgessner, M., W. Windisch, H. L. Muller, and M. Kreuzer. 1991. Release of methane
and of carbon dioxide by dairy cattle. Agribiol. Res. 44:91-102.
Knapp, J. R.,G. L. Laur, P. A. Vadas, W. P. Weiss, and J. M. Tricarico. 2014. Invited
review: Enteric methane in dairy cattle production: Quantifying the opportunities
and impact of reducing emissions. J. Dairy Sci. 97:3231–3261. doi:
10.3168/jds.2013-7234
Krishnamoorthy, U., T. V. Muscato, C. J. Sniffen, and P. J. Van Soest. 1982. Nitrogen
fractions in selected feedstuffs. J. Dairy Sci. 65:217-225.
145
Lechartier, C., and J. L. Peyraud. 2011. The effects of starch and rapidly degradable dry
matter from concentrate on ruminal digestion in dairy cows fed corn silage-based
diets with fixed forage proportion. J. Dairy Sci. 94:2440-2454.
Lee, C., A. N. Hristov, T. W. Cassidy, K. S. Heyler, H. Lapierre, G. A. Varga, M. J. de
Veth, R. A. Patton, and C. Parys. 2012. Rumen-protected lysine, methionine, and
histidine increase milk protein yield in dairy cows fed a metabolizable protein-
deficient diet. J. Dairy Sci. 95:6042-6056.
Maman, N., D. J. Lyon, S. C. Mason, T. D. Galusha, and R. Higgins. 2003. Agron. J.
95:1618-1624.
McGeough, E. J., P. O’Kiely, K. J. Hart, A. P. Moloney, T. M. Boland, and D. A. Kenny.
2010. Methane emissions, feed intake, performance, digestibility, and rumen
fermentation of finishing beef cattle offered whole-crop wheat silages differing in
grain content. J. Anim. Sci. 88:2703-2716.
Messman, M. A., W. P. Weiss, P. R. Henderlong, and W. L. Shockey. 1992. Evaluation
of pearl millet and field peas plus triticale silages for midlactation dairy cows. J.
Dairy Sci. 75:2769-2775.
Mertens, D. R. 1985. Effect of fiber on feed quality for dairy cows. Pages 209-224 in 46th
Minnesota Nutrition Conference Proc.
Mertens, D. R. 2009. Maximizing forage use by dairy cows. Pages 303-319 in Proc. 27th
Annual Western Canadian Dairy Seminar. Red Deer, Alberta.
Miller, R. W., R. W. Hemken, J.H. Vandersall, D. R. Waldo, M. Okamato, and L. A.
Moore. 1965. Effect of feeding buffers to dairy cows grazing pearl millet or sudan
grass. J. Dairy Sci. 48:1319-1323.
Mustafa, A. F., F. Hassanat, and P. Seguin. 2004. Chemical composition and in situ
ruminal nutrient degradability of normal and brown midrib forage pearl millet grown
in southwestern Québec. Can. J. Anim. Sci. 84:737-740.
National Research Council. 2001. Nutrient requirements of dairy cattle. 7th rev. ed. Natl.
Acad. Press, Washington, DC.
Nielsen, T.S., K. Sejrsen, H. R. Andersen, P. Lund, and E. M. Straarup. 2004. Effect of
silage type and energy concentration on conjugated linoleic acid (CLA) in milk fat
from dairy cows. J. Anim. Feed Sci. 13(Suppl.1):697-700.
Oba, M., and M. S. Allen. 1999. Evaluation of the importance of the digestibility of
neutral detergent fiber from forage: Effects on dry matter intake and milk yield of
dairy cows. J. Dairy Sci. 82:589-596.
O’Mara, F. P., J. J. Fitzgerald, J. J. Murphy, and M. Rath. 1998. The effect on milk
production of replacing grass silage with maize silage in the diet of dairy cows.
Livest. Prod. Sci. 55:79–87.
146
O’Neill, B. F., M. H. Deighton, B. M. O’Loughlin, F. J. Mulligan, T. M. Boland, M.
O’Donovan, and E. Lewis. 2011. Effects of a perennial ryegrass diet or total mixed
ration diet offered to spring-calving Holstein-Friesian dairy cows on methane
emissions, dry matter intake, and milk production. J. Dairy Sci. 94:1941–1951.
doi:10.3168/jds.2010-3361
Ørskov, E. R., and C. Fraser. 1975. The effects of processing of barley-based
supplements on rumen pH, rate of digestion and voluntary intake of dried grass in
sheep. Br. J. Nutr. 34:493-500.
Ørskov, E. R., and I. McDonald. 1979. The estimation of protein degradability in the
rumen from incubation measurements weighted according to rate of passage. J.
Agric. Sci. (Camb.) 92:499-503.
Rico, D. E., and K. J. Harvatine. 2013. Induction of and recovery from milk fat
depression occurs progressively in dairy cows switched between diets that differ in
fiber and oil concentration. J. Dairy Sci. 96:6621-6630.
Schneider, B. A., N. A. Clark, R. W. Hemken, and J. H. Vandersall. .1970. Relationship
of pearl millet to milk fat depression in dairy cows. II. Forage organic acids as
influenced by soil nutrients. J. Dairy Sci. 53:305-310.
Shingfield, K.J., C. K. Reynolds, B. Lupoli, V. Toivonen, M. P. Yurawecz, P. Delmonte,
J. M. Griinari, A. S. Grandison, and D. E. Beever. 2005. Effect of forage type and
proportion of concentrate in the diet on milk fatty acid composition in cows given
sunflower and fish oil. Anim. Sci. 80:225-238. doi:10.1079/ASC41820225
Sjaunja, L. O., L. Baevre, L. Junkkarinen, J. Pedersen, and J. Setälä. 1990. A Nordic
proposal for an energy corrected milk (ECM) formula. Proc. 27th Session Int.
Comm. Breeding Product. Milk Anim., Paris, France. Wageningen Acad. Publ.,
Wageningen, the Netherlands.
Thomison, P., P. Raul, R. Hammond, and R. Mullen. 2011. Managing risks in continuous
corn. C.O.R.N. Newsl. 2011-02. https://agcrops.osu.edu/newsletters/2011/02
(accessed 28 Dec. 2017).
Van Soest, P. J., J. B. Robertson, and B. A. Lewis. 1991. Methods for dietary fiber,
neutral detergent fiber, and nonstarch polysaccharides in relation to animal nutrition.
J. Dairy Sci. 74:3583-3597.
Van Soest, P. J. 1994. Nutritional ecology of the ruminant. 2nd Ed. Cornell University
Press, Ithaca, NY.
Vanzant, E. S., R. C. Cochran, and E. C. Titgemeyer. 1998. Standardization of in situ
techniques for ruminant feedstuff evaluation. J. Anim. Sci. 76:2717-2729.
Vlaeminck, B., V. Fievez, A. R. J. Cabrita, A. J. M. Fonseca, and R. J. Dewhurst. 2006a.
Factors affecting odd and branched-chain fatty acids in milk: A review. Anim. Feed
Sci. Technol. 131:389-417.

147
Vlaeminck, B., V. Fievez, S. Tamminga, R. J. Dewhurst, A. van Vuuren, D. De
Brabander, and D. Demeyer. 2006b. Milk odd- and branched-chain fatty acids in
relation to the rumen fermentation pattern. J. Dairy Sci. 89:3954–3964.
Ward, J. D., D. D. Redfearn, M. E. McCormick, and G. J. Cuomo. 2001 Chemical
Composition, Ensiling Characteristics, and Apparent Digestibility of Summer
Annual Forages in a Subtropical Double-Cropping System with Annual Ryegrass. J.
Dairy Sci. 84:177–182.
Wolf, C. A. 2003. The economics of dairy production. Vet. Clin. Food Anim. 19:271-
293.
Zegada-Lizarazu, W., and M. Iijima. 2005. Deep root water uptake ability and water use
efficiency of pearl millet in comparison to other millet species. Plant Prod. Sci.
8:454-460.
Zened, A., F. Enjalbert, M. C. Nicot, and A. Troegeler-Meynadier. 2013. Starch plus
sunflower oil addition to the diet of dry dairy cows results in a trans-11 to trans-10
shift of biohydrogenation. J. Dairy Sci. 96:451-459.

148
Table 5-1. Ingredient and chemical composition of the diets fed in the experiment
1CSD = Corn silage control diet; PMD = Pearl millet silage diet. 2Alfalfa haylage was 34.8% DM and contained (DM basis) 22.1% CP, 24.4% NFC, and
42.2% NDF. 3SoyPLUS (West Central Cooperative, Ralston, IA). 4Molasses (Westway Feed Products, Tomball, TX). 5The mineral/vitamin premix (Cargill Animal Nutrition, Cargill Inc., Roaring Spring, PA)
contained (%, as-is basis) limestone, 36.75; dry corn distillers grains with solubles, 29.00;
NaCl, 24.85; MgO (54% Mg), 4.15; Bio-Phos, 2.45; zinc sulfate, 0.96; mineral oil, 0.5;
vitamin E, 0.37; manganese sulfate, 0.37; copper sulfate, 0.26; ferrous sulfate, 0.16;
Diet1
Item CSD PMD
Ingredient, % of DM
Corn silage 50 40
Pearl millet silage - 10
Alfalfa haylage2 6 6
Hay/straw mixture 4 4
Cottonseed hulls 2 2
Ground corn 10 10
Heat-treated whole soybeans 5.5 5.5
Solvent-extracted canola meal 9 9
SoyPLUS3 7.5 7.5
Molasses4 4 4
Mineral/vitamin premix5 2 2
Composition, % of DM
CP6 16.6 17.2
RDP8 9.1 9.2
RUP8 7.5 7.9
NDF6 30.3 32.4
ADF6 19.3 20.5
NFC7 43.9 40.2
Starch6 28.0 24.1
Fat6 4.6 4.6
NEL,7 Mcal/kg 1.53 1.54
NEL intake,7 Mcal/d 44.6 44.6
NEL balance,7 Mcal/d -0.7 -0.5
MP balance,7 g/d 163 322
Ash6 6.77 7.67
Ca6 0.8 0.8
P6 0.4 0.4
DCAD, mEQ/kg 204 288

149
Selenium, .13; vitamin A, 0.03; vitamin D3, 0.013; calcium iodate, 0.008; cobalt
carbonate, 0.005. 6Values calculated using the chemical analysis (Cumberland Valley Analytical Services
Inc., Maugansville, MD) of individual feed ingredients of the diet. 7Estimated based on NRC (2001).

150
Table 5-2. Nutrient composition and fermentation profile of pearl millet and corn silages
(% of DM or as indicated)1
1Two composite samples per silage, one for each experimental period were analyzed by
wet chemistry (Cumberland Valley Analytical Services Inc., Maugansville, MD). Mean ±
SE is reported. 2CPE = Crude protein equivalent. 3Butyric and Isobutyric acids were not detected in either silage. 4ND = Not detected.
Forages
Item Corn Pearl Millet
DM, % 42.2 ± 1.6 30.5 ± 0.8
NDF 36.8 ± 0.4 58.4 ± 0.1
ADF 22.3 ± 0.6 34.4 ± 0.8
Lignin 2.73 ± 0.2 2.50 ± 0.1
Lignin, % of NDF 7.42 ± 0.4 4.28 ± 0.1
Fat (ether extract) 2.58 ± 0.2 3.31 ± 0.0
CP 7.45 ± 0.6 13.2 ± 0.2
Soluble CP, % of CP 61.2 ± 0.4 63.7 ± 0.1
NH3 CPE2 0.88 ± 0.1 1.94 ± 0.2
NH3 CPE, % of CP 11.8 ± 0.2 14.6 ± 1.6
Starch 40 ± 1.9 0.9 ± 0.3
Ethanol soluble carbohydrates 1.3 ± 0.2 1.95 ± 0.8
Ash 3.8 ± 0.1 12.9 ± 0.1
Ca 0.29 ± 0.0 0.96 ± 0.2
P 0.23 ± 0.0 0.32 ± 0.0
K 1.05 ± 0.1 5.13 ± 0.1
pH 3.79 ± 0.1 4.48 ± 0.1
Fermentation acids3
Lactic 5.90 ± 0.6 6.25 ± 0.2
Acetic 1.82 ± 0.3 1.28 ± 0.4
Propionic 0.13 ± 0.1 ND4

151
Table 5-3. Effect of pearl millet silage on DMI, milk production, and feed efficiency in
lactating dairy cows
Diet1 P-Value
Item CSD PMD SEM2 Diet
DMI, kg/d 29.1 29.0 0.65 0.78
Milk yield, kg/d 51.3 49.6 2.02 <0.001
Milk ÷ DMI, kg/kg 1.77 1.72 0.053 0.01
Milk fat, % 3.47 3.71 0.118 0.06
Milk fat, kg/d 1.79 1.82 0.087 0.65
Milk true protein, % 2.86 2.85 0.050 0.64
Milk true protein, kg/d 1.46 1.43 0.055 0.44
Lactose, % 5.00 4.96 0.035 0.28
Lactose, kg/d 2.55 2.47 0.116 0.23
MUN, mg/dL 11.6 13.3 0.410 <0.001
ECM3, kg/d 46.8 46.6 1.92 0.86
ECM ÷ DMI, kg/kg 1.59 1.56 0.050 0.50
BW, kg 632 628 16.8 0.01
BW change, kg 7.23 5.27 3.335 0.72 1CSD = Corn silage control diet; PMD = Pearl millet silage diet. 2Largest SEM published in table. DMI, n = 235; milk yield, n = 231; milk yield ÷ DMI, n
= 230; BW, n = 238; BW change, n = 34; milk composition data, n = 65 (n represents the
number of observations used in the statistical analysis). 3Energy-corrected milk (kg/d) = kg of milk × [(38.3 × % fat × 10 + 24.2 × % true protein
× 10 + 16.54 × % lactose × 10 + 20.7) ÷ 3,140] (Sjaunja et al., 1990).

152
Table 5-4. Effect of pearl millet silage on nutrient intake and apparent total-tract
digestibility in lactating dairy cows
Diet1 P-Value
Item CSD PMD SEM2 Diet
Intake, kg/d
DM3 29.4 28.8 0.58 0.14
OM 27.4 26.6 0.54 0.03
CP 4.86 4.94 0.097 0.23
Starch 8.22 6.94 0.153 <0.001
NDF 8.89 9.33 0.181 0.001
NDF, % of BW 1.42 1.49 0.031 0.001
Forage NDF, % of
BW 1.11 1.19 0.025 <0.001
ADF 5.67 5.90 0.115 0.004
Apparent digestibility, %
DM 66.5 64.5 0.38 <0.001
OM 67.2 65.1 0.38 <0.001
CP 64.3 61.8 0.55 0.003
Starch 99.2 99.1 0.09 0.26
NDF 38.5 41.0 0.65 <0.001
ADF 24.9 27.5 1.15 0.02 1CSD = Corn silage control diet; PMD = Pearl millet silage diet. 2Largest SEM published in table; n = 33 (n represents the number of observations used in
the statistical analysis). 3DM intake reported is during the fecal collection periods.
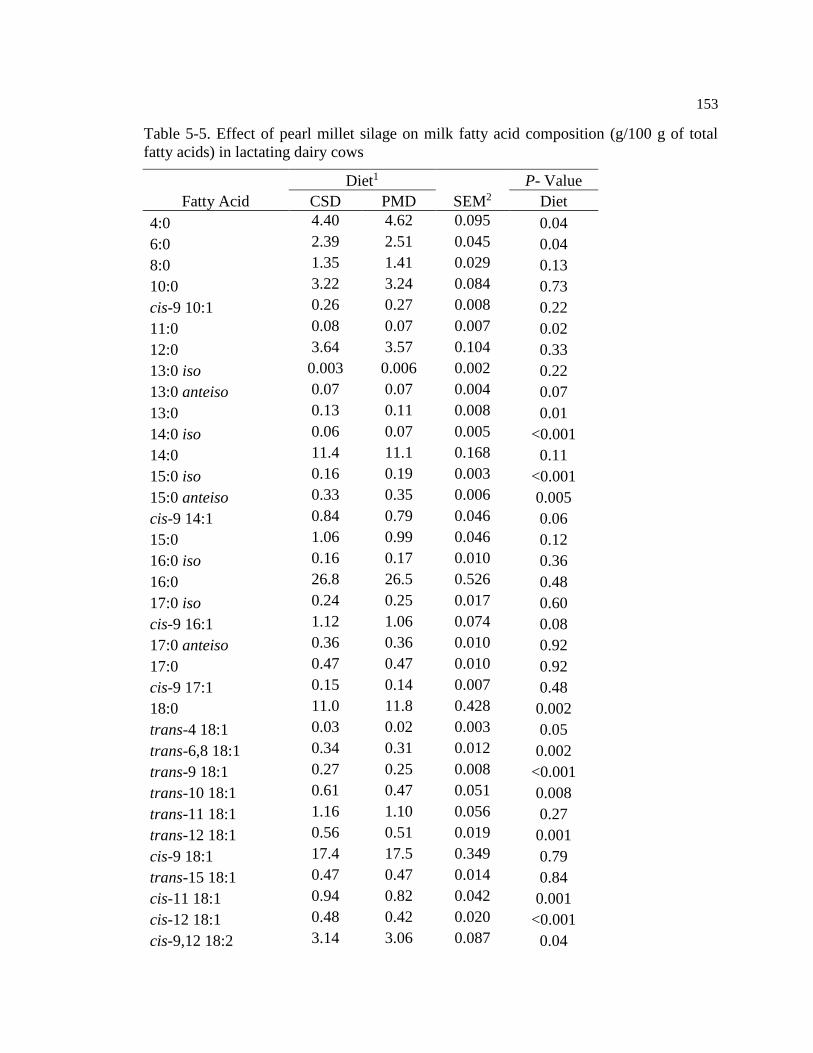
153
Table 5-5. Effect of pearl millet silage on milk fatty acid composition (g/100 g of total
fatty acids) in lactating dairy cows
Diet1
P- Value
Fatty Acid CSD PMD SEM2 Diet
4:0 4.40 4.62 0.095 0.04
6:0 2.39 2.51 0.045 0.04
8:0 1.35 1.41 0.029 0.13
10:0 3.22 3.24 0.084 0.73
cis-9 10:1 0.26 0.27 0.008 0.22
11:0 0.08 0.07 0.007 0.02
12:0 3.64 3.57 0.104 0.33
13:0 iso 0.003 0.006 0.002 0.22
13:0 anteiso 0.07 0.07 0.004 0.07
13:0 0.13 0.11 0.008 0.01
14:0 iso 0.06 0.07 0.005 <0.001
14:0 11.4 11.1 0.168 0.11
15:0 iso 0.16 0.19 0.003 <0.001
15:0 anteiso 0.33 0.35 0.006 0.005
cis-9 14:1 0.84 0.79 0.046 0.06
15:0 1.06 0.99 0.046 0.12
16:0 iso 0.16 0.17 0.010 0.36
16:0 26.8 26.5 0.526 0.48
17:0 iso 0.24 0.25 0.017 0.60
cis-9 16:1 1.12 1.06 0.074 0.08
17:0 anteiso 0.36 0.36 0.010 0.92
17:0 0.47 0.47 0.010 0.92
cis-9 17:1 0.15 0.14 0.007 0.48
18:0 11.0 11.8 0.428 0.002
trans-4 18:1 0.03 0.02 0.003 0.05
trans-6,8 18:1 0.34 0.31 0.012 0.002
trans-9 18:1 0.27 0.25 0.008 <0.001
trans-10 18:1 0.61 0.47 0.051 0.008
trans-11 18:1 1.16 1.10 0.056 0.27
trans-12 18:1 0.56 0.51 0.019 0.001
cis-9 18:1 17.4 17.5 0.349 0.79
trans-15 18:1 0.47 0.47 0.014 0.84
cis-11 18:1 0.94 0.82 0.042 0.001
cis-12 18:1 0.48 0.42 0.020 <0.001
cis-9,12 18:2 3.14 3.06 0.087 0.04

154
cis-9, trans-11 18:2 0.51 0.45 0.028 0.06
cis-6,9,12 18:3 0.08 0.08 0.004 0.45
20:0 0.12 0.13 0.003 <0.001
cis-11 20:1 0.40 0.43 0.013 0.007
22:0 0.04 0.05 0.003 0.006
20:3 0.12 0.12 0.004 0.65
20:4 0.15 0.15 0.006 0.18
Σ De novo FA3 27.2 27.2 0.359 0.92
Σ C164 27.9 27.6 0.560 0.37
Σ Preformed FA5 37.8 38.1 0.678 0.62
Σ SFA 67.4 68.1 0.605 0.25
Σ MUFA 25.0 24.5 0.480 0.32
Σ PUFA 4.00 3.86 0.112 0.03
Σ trans FA6 3.95 3.57 0.153 0.02
Σ OBCFA7 3.26 3.25 0.072 0.77
Unknown 3.58 3.58 0.064 0.95 1CSD = Corn silage control diet; PMD = Pearl millet silage diet. 2Largest SEM shown; n = 33 (n represents number of observations used in the statistical
analysis). Data are presented as LSM. 3Sum of fatty acids synthesized in the mammary gland (4:0, 6:0, 8:0, 10:0, 12:0, 14:0,
14:1). 4Sum of 16 C fatty acids (16:0, and 16:1). 5Sum of ≥ 18 C fatty acids. 6Sum of trans unsaturated fatty acids. 7Sum of the odd and branched chain fatty acids (11:0, iso13:0, anteiso13:0, 13:0, iso14:0,
iso15:0, anteiso15:0, 15:0, iso16:0, iso17:0, anteiso17:0, 17:0, cis-9 17:1).

155
Table 5-6. Effect of pearl millet silage on nitrogen utilization and urinary purine
derivatives in lactating dairy cows
Diet1 P-Value
Item CSD PMD SEM2 Diet
N intake, g/d 778 790 15.6 0.23
N excretion or secretion, g/d 738 778 18.0 0.01
Urine N, g/d 229 254 8.7 0.01
UUN3, g/d 161 187 6.0 <0.001
Fecal N, g/d 278 302 7.5 0.006
Total excreta N, g/d 507 555 13.8 0.001
Milk N, g/d 231 222 5.9 0.02
N excretion or secretion, as % of N intake
Urine N 29.4 32.2 0.88 0.02
Fecal N 35.7 38.2 0.55 0.003
Total excreta N 65.1 70.5 0.96 <0.001
Milk N 29.8 28.2 0.62 0.001
Urine output4, kg/d 21.4 26.6 0.70 <0.001
Urinary PD5 excretion, mmol/d
Allantion 667 698 21.0 0.15
Uric acid 86 88 4.2 0.51
Total PD 753 786 24.3 0.17
1CSD = Corn silage control diet; PMD = Pearl millet silage diet. 2Largest SEM published in table; n = 33 (n represents the number of observations used in
the statistical analysis). 3UUN = Urinary Urea Nitrogen. 4Estimated from urine creatinine concentration, assumed to be excreted at 29 mg/kg of
BW. 5PD = Purine derivatives.

156
Table 5-7. Effect of pearl millet silage on carbon dioxide (CO2) and methane (CH4)
emissions1 in lactating dairy cows
Diet2 P-Value
Item CSD PMD SEM3 Diet
CO2 kg/d 13.6 14.0 0.42 0.24
CH4, g/d 396 454 18.4 <0.001
CH4, g/kg of DMI4 13.8 15.7 0.54 <0.01
CH4, g/kg of ECM4 8.28 9.58 0.386 <0.01 1Rumen gas emissions were measured using GreenFeed (C-Lock Technology Inc., Rapid
City, SD). Data were derived from 8 individual measurements staggered over a 3-d
period. 2CSD = Corn silage control diet; PMD = Pearl millet silage diet. 3Largest SEM published in table; n = 30 (n represents the number of observations used in
the statistical analysis). 4Based on DMI and energy corrected milk yield data during the 3-d sampling periods.

157
Figure 5-1. Ruminal in situ DM disappearance of forage sources.
Data are means ± SE (n = 4). Disappearance curves were fit using SigmaPlot 10.0 (Systat
Software, Chicago, IL) to the equation p = a + b (1 - e-ct), where p is the degraded
fraction (of DM) at time t where a is the soluble fraction, b is the potentially degradable
fraction, and c is the rate of degradation of the b fraction (Ørskov and McDonald, 1979).
Effective degradability (ED) was estimated as: ED = a + b {c ÷ (c + k)}, where a, b, and
c are as above and k is the rate of passage (Ørskov and McDonald, 1979) assumed to be
3%/h in this study: ED (model estimates ± SE) = pearl millet silage 52.2 ± 2.23c; alfalfa
haylage 58.6 ± 0.78b; corn silage 62.3 ± 0.50a. a,b,c Means without a common superscript
differ (P < 0.05)

158
In situ incubation length, h
0 20 40 60 80 100
ND
F d
issa
pp
eara
nce
, %
of
ND
F
0
20
40
60
80
Pearl Millet Silage
Alfalfa Haylage
Corn Silage
Figure 5-2. Ruminal in situ NDF disappearance of forage sources.
Data are means ± SE (n = 4). Disappearance curves of pearl millet silage, alfalfa haylage,
and corn silage were fit using SigmaPlot 10.0 (Systat Software, Chicago, IL) to the
equation p = a + b (1 - e-ct), where p is the degraded fraction (of NDF) at time t where a is
the soluble fraction, b is the potentially degradable fraction, and c is the rate of
degradation of the b fraction (Ørskov and McDonald, 1979). Effective degradability (ED)
was estimated as: ED = a + b {c ÷ (c + k)}, where a, b, and c are as above and k is the
rate of passage (Ørskov and McDonald, 1979) assumed to be 3%/h in this study: ED
(model estimates ± SE) = pearl millet silage 37.3 ± 3.17a; alfalfa haylage 27.0 ± 1.15b;
corn silage 21.9 ± 1.40c. a,b,c Means within the same row without a common superscript
differ (P < 0.05).

159
Chapter 6
Conclusions and Future Research
Conclusions
Dairy cattle do not have a requirement for feed ingredients (e.g. corn silage); they have a
requirement for nutrients. Yet, this must be combined with the reality that feed ingredients, not
nutrients, are grown from the land and fed to the cows. Many different forages can be fed to dairy
cattle, but ideal forages grown for lactating dairy cattle should be palatable, highly digestible, and
contain a nutrient profile that profitably compliments the other feed ingredients in the ration.
Forages for lactating cows must be palatable because the cows must voluntarily consume their
feed. Additionally, forages for lactating cows must be highly digestible to allow for high dry
matter and digestible nutrient intakes to maintain high milk production with a limited period of
negative energy balance in early lactation. Finally, forages for lactating cows should aim to
provide more expensive nutrients (e.g. protein) instead of less expensive ones (e.g. starch) which
can be economically purchased off farm. The price and/or availability of feed nutrients varies
widely by farm, year, and geographic location; however, any particular farm should identify what
nutrients the forages (and specifically the forages for lactating cows) on the farm are targeted for.
Are they to provide: Physically Effective Fiber, Highly Digestible Fiber, Energy, or Protein? The
answers to those questions help guide the cropping decisions on farms. Large quantities of high
quality forage (e.g. high digestibility, high CP, low lignin) decrease the need for purchased feeds
and increase the profitability of a dairy farm.
In addition to the above discussion, factors aside from the cow influence cropping
decisions. These include disease pressure, water availability (irrigation and rainfall), slope and

160
soil erodibility of the fields, nutrient management, and stocking density on the farm. Some
alternative forages are beneficial because of high water use efficiency (e.g. sorghum and pearl
millet). Others are able to grow in the cooler ‘shoulders’ of the growing season in addition to
providing soil cover during the winter (e. g. rye, oats, wheat, and triticale). Utilizing alternative
forages increases the crop biodiversity on a given farm and can decrease pests and diseases that
affect corn and may accumulate during corn-after-corn rotations. A main challenge of alternative
forages on dairy farms is achieving high yields with acceptable digestibility for use in diets for
high producing cows. Where alternative forages are best used depends on the forage and its
strengths (e.g. sorghum for dry ground, triticale for rapidly available NDF in high DMI cows).
The experiments presented in this dissertation measured the effects of replacing 10% of
the diet DM of corn silage with alternative forage silages of sorghum, oat, wheat, triticale, or
pearl millet. In general, diet NDF and CP were increased, but starch was decreased. The silages
were tested in 3 different lactating cow trials consisting of cows with different levels of milk
production so direct comparison is not possible, but the basic production outcomes are
summarized. Only the sorghum silage diet decreased DMI compared with corn silage. The other
AFS had similar DMI to corn silage. Milk yield was decreased for all treatments except oat
silage, but ECM yield was only decreased for wheat and triticale silages. The warm season annual
(sorghum and pearl millet) silages increased milk fat concentration, whereas the cereal silages
had no effect on milk fat concentration compared with corn silage. In situ NDF degradability was
similar for oat, wheat, triticale and pearl millet silages. Sorghum silage had the lowest NDF
degradability curve of all the alternative forages but it was still higher than corn silage. Estimated
total-tract NDF digestibility of the diets was increased for oat, triticale and pearl millet silages,
similar for sorghum silage and decreased for wheat silage compared with corn silage control
diets. Whereas, the estimated total-tract DM digestibility was decreased for wheat, sorghum, and
pearl millet silage diets, similar for the triticale silage diet and increased for the oat silage diet.
161
The increased NDF degradability of the alternative forage silages did not fully counterbalance the
decrease in starch content compared with corn silage. If alternative forage silages are included in
lactating cow diets on an NDF basis, increases in production might be seen due to the higher
NDFD of alternative forage silages leading to more nutrients absorbed by the cow.
Future Research
Research needs to continue on developing alternative forage uses in lactating dairy cows
both from an agronomic and an animal nutrition perspective. Agronomically, future studies
should focus on increasing the DM yield and NFC content of alternative forages without
sacrificing NDF digestibility. This could potentially be realized in the future through gene editing
technology, such as that used to create low lignin HarvXtra® alfalfa, if society comes to accept
such a method of plant manipulation. Crop transformations that suspend or slow maturity at the
flag leaf stage would be useful by extending the currently narrow harvest window for small grain
silage harvest. Crop alterations or harvest/ensiling technologies should be developed that allow
for direct cut harvest, as in corn silage, as opposed to the need for multiple passes with the cut
and wilt harvest methods. Further refining of planting and harvesting dates and ways to overlap
growing seasons, such as with intercropping, could be useful. Additionally, finding ways to
practically row crop polycultures could be impactful, including the use of agroforestry such as
practiced in Brazil with eucalyptus and Brachiaria. Work should continue on increasing yields of
perennial grain crops such as Kernza®, a perennial wheat being developed by The Land Institute,
to decrease the need for annual planting. Touching on protein, crop alteration to create more
rumen undegradable protein that is simultaneously digestible in the abomasum should be
considered.

162
Future alternative forage animal nutrition studies should focus on replacing corn silage
DM with both a higher digestible alternative forage NDF and a NFC source, such as sugar or
starch, for cows in peak lactation when rumen fill often limits intake in high producing cows. It
would be interesting to look at feeding highly digestible NDF of cereal grain silage to fresh cows
with the thought of reducing hepatic oxidation and its negative impact on DMI. Alternative
forages with less digestible NDF, such as soft dough sorghum or barley silages, should be tested
as feeds in rations for late lactation and dry cows. The extent to which passage rate and rumen fill
is affected by alternative forages should also be investigated to determine forage chop length
recommendations for different diets containing various forages in combination. Another curious
research topic is to look at twice a day feeding and test if the higher digestible NDF alternative
forages would be better utilized by feeding more of that forage in the morning or afternoon based
on circadian patterns of behavior and metabolism. Potential benefits of new transgenic crops yet
to be developed will also have to be validated in animal trials.
Many opportunities for future research exist relating to alternative forages. I believe the
need for alternative forage research will only grow as the world population increases and
marginal land that is not suited to corn silage becomes of increasing importance in crop and
livestock production. Our future is bright and full of promise; let’s go see what it holds for us!

163
Appendix
Indigestible NDF1 of various ensiled forages
Forage iNDF2, % of DM iNDF, % of NDF NDF, % of DM
Corn Silage (Exp. 1) 11.2 27.9 40.2
Corn Silage (Exp. 3) 13.2 35.7 36.8
Alfalfa Haylage (Exp. 2) 27.0 61.0 44.2
Alfalfa Haylage (Exp. 3) 23.0 54.4 42.2
Sorghum Silage (Exp. 1) 22.0 35.1 62.7
Pearl Millet Silage (Exp. 3) 11.7 20.1 58.4
Wheat Silage (Exp. 2) 12.1 23.6 51.0
Triticale Silage (Exp. 2) 9.2 18.0 51.3
Oat Silage (Exp. 1) 9.3 17.1 54.7 1Determined on 4 mm dry ground forage sample incubated in the rumen of a lactating
dairy cow for a period of 288h. 2iNDF = indigestible neutral detergent fiber
VITA
Michael Thomas Harper
Education
The Pennsylvania State University, University Park, PA
Ph.D. Animal Science Spring 2018
M.S. Animal Science Summer 2010
B.S. Animal Science Fall 2006
o Minors: Equine Science, Spanish, and International Studies
Selected Publications
Harper, M. T., A. Melgar, J. Oh, K. Nedelkov, G. Sanchez, G.W. Roth, and A. N.
Hristov. 2018. Inclusion of brown midrib dwarf pearl millet silage in the diet of lactating
dairy cows. J. Dairy Sci. 101. Accepted.
Harper, M. T. 2017. BMR sorghum and oat silage as dairy cow feed. Progressive
Dairyman. May 2017. www.progressivedairy.com/topics/feed-nutrition/bmr-sorghum-and-
oat-silage-as-dairy-cow-feed
Harper, M. T., J. Oh, F. Giallongo, J. C. Lopes, G.W. Roth, and A. N. Hristov. 2017.
Using brown midrib 6 dwarf forage sorghum silage and fall-grown oat silage in
lactating dairy cow rations. J. of Dairy Sci. 100(7):5250 – 5265 doi: 10.3168/jds.2017-
12552
Harper, M. T., J. Oh, F. Giallongo, G. W. Roth, and A. N. Hristov. 2017. Inclusion
of wheat and triticale silage in the diet of lactating dairy cows. J. of Dairy Sci.
100(8):6151 – 6163 doi: 10.3168/jds.2017-12553
Harper, M. T., J. Oh, F. Giallongo, J. C. Lopes, H. L. Weeks, J. Faugeron, and A. N.
Hristov. 2016. Short communication: Preference for flavored concentrate premixes by
dairy cows. J. Dairy Sci. 99(8):6585-6589. doi: 10.3168/jds.2016-11001
Hristov, A. N., J. Oh, F. Giallongo, T. W. Frederick, M. T. Harper, H. L. Weeks, A.
F. Branco, P. J. Moate, M. H. Deighton, S. R. O. Williams, M. Kindermann, and S. Duval.
2015. An inhibitor persistently decreased enteric methane emission from dairy cows
with no negative effect on milk production. Proc. Natl. Acad. Sci. 112(34):10663-10668.
doi: 10.1073/pnas.1504124112
Related Documents