Edited by Markus Jäntti, Veli-Matti Törmälehto and Eric Marlier 2013 edition The use of registers in the context of EU–SILC: challenges and opportunities Statistical working papers ISSN 1681-4789 ISSN 2315-0807

Welcome message from author
This document is posted to help you gain knowledge. Please leave a comment to let me know what you think about it! Share it to your friends and learn new things together.
Transcript
Edited by Markus Jäntti, Veli-Matti Törmälehto and Eric Marlier
2013 edition
The use of registers in the context of EU–SILC: challenges and opportunities
Exer in vulla faci blamconse euis nibh el utat dip ex elestisim
Rilis augiati siscilit venis nim
Statistical working papers
ISSN 1681-4789
2013 editio
n
ISSN 2315-0807

d
2013 edition
The use of registers in the context of EU–SILC:challenges and opportunities
Statistical working papers
2013 edition
Edited by Markus Jäntti, Veli-Matti Törmälehto and Eric Marlier

Europe Direct is a service to help you find answersto your questions about the European Union.
Freephone number (*):
00 800 6 7 8 9 10 11(*) The information given is free, as are most calls (though some operators, phone
boxes or hotels may charge you).
More information on the European Union is available on the Internet (http://europa.eu).
Cataloguing data can be found at the end of this publication.
Luxembourg: Publications Office of the European Union, 2013
ISBN 978-92-79-33033--9ISSN 2315-0807doi:10.2785/45854Cat. No: KS-TC-13-004-EN-N
Theme 3: Population and social conditionsCollection: Statistical working papers
© European Union, 2013Reproduction is authorised provided the source is acknowledged.
3 The use of registers in the context of EU-SILC: challenges and opportunities
ForewordMost Member States have been moving or intend to move towards an increased use of administrative data for statistical purposes. This move is taking place in almost all areas of official statistics. It is driven mainly by the need to reduce the cost of data collection, to reduce the burden on respondents, and more generally to collect data only once and use them for multiple purposes afterwards. Administrative data consequently help statistical agencies to meet growing demands from policy makers for comprehensive sets of data and indicators. More generally, they are particularly well suited in those cases where the need for data is permanent, as the use of administrative data requires initial investments that then pay off in the continuous use of the data source.
In the specific context of social statistics, the re-use of existing data and in particular administrative data has been identified by the European Statistical System as a key area for development in the process of modernising and streamlining social surveys(1). The main administrative sources for social statistics are population registers, tax registers, social security data, and health and education records. However, the extent to which administrative data are used in practice varies considerably across countries and across statistical domains, according to the national legal, organisational and technical frameworks in place. Moreover, the use of administrative data is often hindered not only by legislative barriers or availability, but also by quality issues. In particular, two quality dimensions should be carefully looked at when considering a move towards an increased use of registers, namely those of timeliness and comparability.
The European Union Statistics on Income and Living Conditions (EU-SILC) instrument is the main data source on income, poverty, social exclusion and living conditions in Europe. It provides the data for the calculation of the Europe 2020 social inclusion target and further EU flagship indicators in the social field. In the current financial and economic crisis, the pressure for timelier and more comprehensive data on poverty and social exclusion has become very acute. In view of the flexibility of the EU-SILC instrument, which allows countries to combine survey and administrative data source(s), and given the advantages of administrative data in terms of burden, cost and survey error reduction, a broader use of registers, and in particular register income data, for EU-SILC is envisaged among Member States.
However, using registers can cause timeliness problems due to late data delivery by data owners and due to extensive practices intended to ensure internal consistency. Also, the transition from survey data to administrative can have an impact on data comparability across time within a country and across countries, which are major issues that need to be carefully assessed by countries envisaging an increased use of registers. It may, in particular, cause breaks in data series and it involves risks for policy monitoring and for the assessment of progress made towards the national and EU social inclusion targets.
In this context, an international Workshop on the Use of Registers in the Context of EU-SILC was organised in December 2012 in Vienna by the Second Network for the Analysis of EU-SILC(2), and more specifically its partners from Stockholm University (SOFI) and Statistics Finland; it was hosted by Statistics Austria. This publication is based on the main outcomes and contributions from the Workshop. It provides an important contribution to the on-going move towards a broader use of administrative data in EU-SILC and more generally in official statistics. It should help to set an approach that is sustainable in the long term, taking account of aspects of governance, flexibility of implementation and the necessary trade-offs with timeliness requirements. The use of registers should be part of a wider strategy where most probably the way forward will consist in making use of registers not as a substitute for data collected through surveys, but as a complement, often through the combination of multiple data sources and multi-mode data collection.
Eric Marlier and Jean-Louis Mercy(3)
(1) See Wiesbaden memorandum at http://epp.eurostat.ec.europa.eu/portal/page/portal/pgp_ess/0_DOCS/de/DGINS2011_memorandum.pdf.
(2) The EU-funded Second Network for the Analysis of EU-SILC (Net-SILC2) is bringing together National Statistical Institutes (NSIs) and academic expertise at international level in order to carry out in-depth methodological work and socio-economic analysis, to develop common production tools for the whole European Statistical System, and to ensure the overall scientific organisation of EU-SILC conferences.
(3) Eric Marlier (CEPS/INSTEAD Research Institute, Luxembourg) is the Net-SILC2 coordinator. Jean-Louis Mercy (European Commission, Eurostat , Directorate “Social Statistics”) is the Head of the “Quality of life” Unit.
The use of registers in the context of EU-SILC: challenges and opportunities 4
Eurostat is the Statistical Office of the European Union (EU). Its mission is to be the leading provider of high quality statistics on Europe. To that end, it gathers and analyses data from the National Statistical Institutes (NSIs) across Europe and provides comparable and harmonised data for the EU to use in the definition, implementation and analysis of EU policies. Its statistical products and services are also of great value to Europe’s business community, professional organisations, academics, librarians, NGOs, the media and citizens.
In the field of income, poverty, social exclusion and living conditions, the EU Statistics on Income and Living Conditions (EU-SILC) is the main source for statistical data at European level.
Over the last years, important progress has been achieved in EU-SILC as a result of the coordinated work of Eurostat and the NSIs.
In June 2010, EU Heads of State and Government adopted a social inclusion target as part of the Europe 2020 Strategy: to lift at least 20 million people in the EU from the risk of poverty and exclusion by 2020. To monitor progress towards this target, the ‘Employment, Social Policy, Health and Consumer Affairs’ (EPSCO) EU Council of Ministers agreed on an ‘at risk of poverty or social exclusion’ indicator. To reflect the multidimensional nature of poverty and social exclusion, this indicator consists of three sub-indicators: i) at-risk-of-poverty (i.e. low income); ii) severe material deprivation; and iii) living in very low work intensity households.
The present publication has been prepared as one of the outputs of the work of Net-SILC2 following the EU Workshop on the Use of Registers in the Context of EU-SILC that took place in Vienna in December 2012. It does not in any way represent the views of Eurostat, the European Commission or the European Union. This is academic research which the authors have contributed in a strictly personal capacity and not as representatives of any Government or official body. Thus they have been free to express their own views and to take full responsibility both for the judgments made about past and current policy and for the recommendations for future policy.
This document is part of Eurostat’s Methodologies and working papers collection, which are technical publications for statistical experts working in a particular field. All publications are downloadable free of charge in PDF format from the Eurostat website:
http://epp.eurostat.ec.europa.eu/portal/page/portal/publications/collections/statistical_working_papers.
Eurostat databases are also available at this address, as are tables with the most frequently used and requested short- and long-term indicators.
5 The use of registers in the context of EU-SILC: challenges and opportunities
Table of contentsForeword ...................................................................................................................................................................... 3I. Registers and EU-SILC — An overview 111. Combining sample surveys and registers - an overview in the context of EU-SILC Veli-Matti Törmälehto and Markus Jäntti ......................................................................................................... 13
1.1 Introduction ..................................................................................................................................................... 13
1.2 Challenges for combining survey and register data .......................................................................... 14 1.2.1 EU-SILC and data integration ....................................................................................................... 14 1.2.2 EU-SILC and register infrastructures ............................................................................................ 14 1.2.3 Legal basis, respondent consent and disclosure control ....................................................... 16 1.2.4 Timeliness and continuity ................................................................................................................. 17 1.2.5 Sources of error when registers are combined to surveys .................................................. 17
1.3 Registers and the design of EU-SILC .......................................................................................................... 23 1.3.1 The selected respondent design .................................................................................................... 23 1.3.2 Mode of collection and tracing ..................................................................................................... 26 1.3.3 Data collection and questionnaire design ................................................................................. 27 1.3.4 Further design and processing considerations ........................................................................ 29
1.4 Summary and conclusions ........................................................................................................................... 32
1.5 References ............................................................................................................................................................ 33
2. Translating register data into statistics: Challenges for quality management Bettina Knauth ............................................................................................................................................................ 35
2.1 Background ....................................................................................................................................................... 35
2.2 Inherent quality of registers .......................................................................................................................... 35
2.3 Quality issues relating to the translation of register data into statistics ....................................... 36
2.4 Possible approaches ....................................................................................................................................... 37
3. Registers, timeliness and comparability: Experiences from EU-SILC Emilio Di Meglio and Fabienne Montaigne ......................................................................................................... 39
3.1 Introduction ........................................................................................................................................................ 39
3.2 Flexibility in the use of registers ................................................................................................................. 39
3.3 Timeliness .......................................................................................................................................................... 42 3.3.1 Constraints of administrative data ................................................................................................ 42 3.3.2 Possible measures for speeding up the data transmission calendar ................................ 43
3.4 Comparability .................................................................................................................................................... 43 3.4.1. National experiences .......................................................................................................................... 44 3.4.2 What can be seen from the Eurostat production database ................................................. 46
3.5 Conclusions ....................................................................................................................................................... 51
3.6 Annexes .............................................................................................................................................................. 52
4. Survey- and register-based estimates of income distribution and poverty 57 Markus Jäntti and Veli-Matti Törmälehto ............................................................................................................ 57
4.1 Introduction ........................................................................................................................................................ 57
4.2 Measurement error models .......................................................................................................................... 58
4.3 Income distribution .......................................................................................................................................... 59 4.3.1 Earnings .................................................................................................................................................. 59 4.3.2 Disposable income .............................................................................................................................. 60 4.3.3 Income poverty ..................................................................................................................................... 64
The use of registers in the context of EU-SILC: challenges and opportunities 6
4.4 Wealth ............................................................................................................................................................... 64
4.5 Labour market variables .............................................................................................................................. 65
4.6 Household structure ...................................................................................................................................... 67
4.7 Comparisons to national accounts ........................................................................................................... 69
4.8 Conclusions ...................................................................................................................................................... 70
4.9 References .......................................................................................................................................................... 70
II. The EU-SILC ‘Register countries’ ..................................................................................................................... 735. EU-SILC and registers in the Nordic countries: How administrative data are used for EU-SILC in Denmark, Finland, Iceland, Norway and Sweden Thomas Helgeson .................................................................................................................................................... 75
5.1 Introduction ....................................................................................................................................................... 75
5.2 General register infra-structure in the Nordic countries .................................................................... 75 5.2.1 Basic registers ........................................................................................................................................ 76 5.2.2 System of registers .............................................................................................................................. 77 5.2.3 Record linkage ....................................................................................................................................... 78
5.3 Registers in EU-SILC ......................................................................................................................................... 78 5.3.1 Prerequisites for using registers in EU-SILC ................................................................................ 79 5.3.2 Population registers ........................................................................................................................... 79 5.3.3 Income registers .................................................................................................................................. 79 5.3.4 Other registers used in EU-SILC ....................................................................................................... 80
5.4 Impact of registers on the EU-SILC ............................................................................................................ 81 5.4.1 Design ...................................................................................................................................................... 81 5.4.2 Timing .................................................................................................................................................... 81 5.4.3 Sampling ................................................................................................................................................ 83 5.4.4 Processing ............................................................................................................................................. 83 5.4.5 Data processing and evaluation of the data ............................................................................. 83
5.5 Summary and conclusions ........................................................................................................................... 84
5.6 References .......................................................................................................................................................... 85
6. EU-SILC and registers in Slovenia 87 Rihard Tomaž Inglič .................................................................................................................................................. 87
6.1 Introduction ........................................................................................................................................................ 87
6.2 History of using registers and administrative sources in Slovenia and introducing them into EU-SILC ..................................................................................................................... 87
6.3 Data collection ................................................................................................................................................. 88
6.4 Legal basis for using registers in EU-SILC ................................................................................................. 89
6.5 Data sources for EU-SILC ................................................................................................................................ 89
6.6 Record linkage .................................................................................................................................................. 91 6.6.1 Data processing .................................................................................................................................. 91
6.7 Analysing the data from the questionnaire and the administrative source ................................. 92 6.7.1 Differences between self-declared status and status from administrative source ...... 92 6.7.2 The share of imputed income data according to the source .............................................. 93 6.7.3 Detailed analysis of the variable Employee cash or near cash income (PY010N) and net wage from administrative source ................................................................................. 95
6.8 Coherence between HBS and EU-SILC aggregates ............................................................................... 96
6.9 Conclusions ....................................................................................................................................................... 98
6.10 References .......................................................................................................................................................... 98
7 The use of registers in the context of EU-SILC: challenges and opportunities
7. EU-SILC and the use of registers in The Netherlands Bart Huynen, Ferdy Otten, Karolijne van der Houwen and Koos Arts ........................................................... 99
7.1 Introduction ....................................................................................................................................................... 99
7.2 The Social Statistical Database .................................................................................................................... 100 7.2.1 Statistical processes underlying the SSD .................................................................................... 100 7.2.2 Use of SSD data .................................................................................................................................... 101 7.2.3 The satellite on income and wealth ............................................................................................. 101
7.3 The integration of the EU-SILC in the LFS ................................................................................................ 101 7.3.1 The use of registers in the LFS ........................................................................................................ 102 7.3.2 The EU-SILC design in the Netherlands ........................................................................................ 102 7.3.3 Linking EU-SILC and the SSD ........................................................................................................... 103 7.3.4 Privacy and confidentiality concerns ........................................................................................... 104
7.4 The use of registers in EU-SILC .................................................................................................................... 104 7.4.1 Construction of target variables ................................................................................................... 104 7.4.2 Calibration ............................................................................................................................................ 105 7.4.3 Calendar of activities ......................................................................................................................... 105
7.5 Conclusion .......................................................................................................................................................... 107
7.6 References ........................................................................................................................................................... 107
III. Using register income data in EU-SILC .......................................................................................................... 1098. Transition from survey data to registers in the French SILC survey Carine Burricand .......................................................................................................................................................... 111
8.1 Introduction ....................................................................................................................................................... 111
8.2 The new data collection ................................................................................................................................. 112 8.2.1 Preparation of the 2008 data collection ...................................................................................... 112 8.2.2 Quality of record linkage with the income tax file .................................................................. 114 8.2.3 People we did not manage to find in the income tax returns .............................................. 115 8.2.4 Quality of record linkage with the social files ............................................................................ 117
8.3 Results of the methodological test: comparison of some income components distributions across sources ......................................................................................................................... 118 8.3.1 Comparison of the type of income observed in the survey and in the income tax file 118 8.3.2 Comparison of some income components distributions ....................................................... 118 8.3.3 Comparison of equivalised disposable income distributions and poverty rates ......... 120
8.4 Coverage and quality of income with the new data collection ....................................................... 122
8.5 Conclusions ........................................................................................................................................................ 124
8.6 References ........................................................................................................................................................... 124
9. Improvements of data quality through the combined use of survey and administrative sources and micro simulation model Paolo Consolini and Gabriella Donatiello ............................................................................................................. 125
9.1 Introduction ....................................................................................................................................................... 125
9.2 The record linkage of administrative and survey data for IT-SILC ................................................... 126 9.2.1 The measurement of income components ................................................................................. 126 9.2.2 The integration methodology ......................................................................................................... 127 9.2.3 Main results of the integration process ......................................................................................... 128
9.3 Microsimulation and administrative data: a mixed strategy ............................................................. 135 9.3.1 The gross income data production process ............................................................................. 136
9.4 Comparison with external sources ............................................................................................................. 137
9.5 Concluding remarks and future developments .................................................................................... 138
9.6 References ........................................................................................................................................................... 139

The use of registers in the context of EU-SILC: challenges and opportunities 8
10. The use of register data in the Austrian SILC survey Richard Heuberger, Thomas Glaser and Elisabeth Kafka ................................................................................. 141
10.1 Introduction ......................................................................................................................................................... 141
10.2 The link between register and survey data .............................................................................................. 142
10.3 Pilot evaluation with EU-SILC 2009 and 2010 ......................................................................................... 144
10.4 Results of the pilot ............................................................................................................................................ 146 10.4.1 Income from employment (PY010) in EU-SILC 2010 ............................................................... 146 10.4.2 Income from old-age benefits (PY100) in EU-SILC 2010 ......................................................... 148 10.4.3 Income from unemployment benefits (PY090) in EU-SILC 2010 ......................................... 149
10.5 Practical issues: register data in EU-SILC 2012 ....................................................................................... 150
10.6 First answers and open questions ............................................................................................................ 150
10.7 Conclusions ......................................................................................................................................................... 151
10.8 References .......................................................................................................................................................... 152
11. Reconciliation of income data from survey and from administrative sources José María Méndez Martín ...................................................................................................................................... 153
11.1 Introduction ...................................................................................................................................................... 153
11.2 Sources ................................................................................................................................................................ 154
11.3 Impact of the use of administrative records on indicators ................................................................ 156
11.4 Outline of the planned methodology of production of income variables ................................... 157
11.5 Concluding remarks ........................................................................................................................................ 159
11.6 Conclusions ......................................................................................................................................................... 160
11.7 References .......................................................................................................................................................... 160
IV. Challenges and quality assessments .............................................................................................................. 16112. Data linking the Family Resources Survey with social security benefits Simon Lunn and Stephen McKay ............................................................................................................................ 163
12.1 Introduction ....................................................................................................................................................... 163
12.2 The UK benefits system ................................................................................................................................. 163
12.3 Data ....................................................................................................................................................................... 165 12.3.1 The Family Resources Survey (FRS) ................................................................................................ 165 12.3.2 Consent question ................................................................................................................................. 165 12.3.3 The Work and Pensions Longitudinal Study ................................................................................ 165 12.3.4 Matching processes and match rates ........................................................................................... 165 12.3.5 Timeliness/processing delays and scope for use of register data in EU-SILC micro data provision ........................................................................................................................... 166
12.4 Extent of survey mis-measurement ........................................................................................................... 166 12.4.1 Benefit analysis ..................................................................................................................................... 169
12.5 Approaches to imputing non-linked data ............................................................................................... 170
12.6 Evaluation ............................................................................................................................................................. 171
12.7 Concluding remarks ........................................................................................................................................ 172
12.8 Some helpful sources ..................................................................................................................................... 173
9 The use of registers in the context of EU-SILC: challenges and opportunities
13. Asking income and consumption questions in the same survey: What are the risks? Giulia Cifaldi and Andrea Neri ................................................................................................................................. 175
13.1 Introduction ....................................................................................................................................................... 175
13.2 Data ....................................................................................................................................................................... 176
13.3 Methodology ..................................................................................................................................................... 178 13.3.1 Imputation of secondary sources of income ............................................................................. 179 13.3.2 Imputation of non-durable expenditure ..................................................................................... 180
13.4 Results .................................................................................................................................................................... 181
13.5 Discussion and conclusions .......................................................................................................................... 186
13.6 References ........................................................................................................................................................... 187
14. Cross-validating administrative and survey datasets through microsimulation in Luxembourg Philippe Liégeois, Frédéric Berger, Nizamul Islam and Raymond Wagener .............................................. 189
14.1 Introduction ........................................................................................................................................................ 189
14.2 Setting up the datasets for comparison ................................................................................................... 190 14.2.1 PSELL survey data ................................................................................................................................. 190 14.2.2 SSDW administrative data ................................................................................................................. 190 14.2.3 Improving comparability of the datasets .................................................................................... 191
14.3 Cross-validating survey and administrative data ................................................................................... 194 14.3.1 Non-monetary characteristics at the household and individual levels ............................ 194 14.3.2 Individual level: monetary characteristics (average) ............................................................... 194 14.3.3 Individual level: monetary characteristics (distributional) ..................................................... 197 14.3.4 Microsimulated responses to changes in the tax system ...................................................... 200
14.4 Conclusions ......................................................................................................................................................... 200
14.5 References ........................................................................................................................................................... 201
V. Workshop conclusions ......................................................................................................................................... 20315. Combining sample surveys and registers — an overview in the context of EU-SILC — Conclusions Veli-Matti Törmälehto and Markus Jäntti ............................................................................................................. 205
15.1 Introduction ........................................................................................................................................................ 205
15.2 Documentation challenges .......................................................................................................................... 205
15.3 Register and survey results on income distribution in EU-SILC ........................................................ 206
15.4 From the ECHP to EU-SILC: where do we stand now? .......................................................................... 207
15.5 Concluding remarks ......................................................................................................................................... 208

Registers and EU-SILC — An overview
I

Combining sample surveys and registers - an overwiew in the context of EU-SILC 1
13 The use of registers in the context of EU-SILC: challenges and opportunities
1. Combining sample surveys and registers - an overview in the context of EU-SILC
Veli-Matti Törmälehto and Markus Jäntti(1)
Abstract: We discuss the use of registers in combination with interviews in household sample surveys, with special reference to the EU Statistics on Income and Living Conditions (EU-SILC) instrument, a set of ex-ante output harmonised household surveys designed to measure household income and living conditions in the European countries. We discuss design, production, and quality aspects of register-based EU-SILC implementations and find that virtually all phases of the survey process are potentially affected. Despite some disadvantages, we conclude that for both cost and quality reasons, the way forward is to expand the use of registers in EU-SILC. In the short-run, the greatest potential gain may come from replacing survey questions on social benefits and employment income with valid register data in as many EU-SILC countries as possible.
1.1 IntroductionAccess to administrative and statistical registers can influence the design, production and quality of sample surveys in several ways. All phases of the survey process are potentially affected: sampling, survey data collection and questionnaires, processing, weighting, variance estimation, quality assessments, and dissemination. This chapter discusses the use of registers in combination with interviews in a household sample survey, with specific reference to the EU Statistics on Income and Living Conditions (EU-SILC) instrument. The primary purpose is to review issues related to EU-SILC, because its design explicitly takes the use of registers into account. Many of the issues are nevertheless general to all household surveys on income and related topics.
The general starting point in this chapter is that the errors that occur in surveys may also occur in registers, and the values available from surveys and registers both may differ from the ideal values, for various reasons (Bakker, 2011). While the sources of errors in registers can be discussed in a general framework, it is quite challenging to generalise about their quality in a cross-national context. There is variation within countries across different register sources, and possibly even across variables within a single register source in a country. Some register data may originate from survey-like data collections (self-administered questionnaires) or, at the other extreme, from entirely electronic exchanges of administrative data.
Beyond this introduction, the chapter is organised as follows. We begin by discussing some general issues and necessary pre-conditions that must be fulfilled before exploiting registers in EU-SILC, such as the legal basis and timeliness of micro data delivery to Eurostat. We then turn to general quality issues, by considering the potential error sources in the data integration approach. In section 1.3, we discuss the design and production of EU-SILC in the combined approach, and in particular, the features of the register-based selected respondent design. Section 1.4 provides a summary and conclusions.
(1) Veli-Matti Törmälehto is from Statistics Finland and Markus Jäntti from Swedish Institute for Social Research, Stockholm University. The authors would like to thank Anthony Atkinson, Eric Marlier, and Hannele Sauli for valuable comments and suggestions. All errors remain our own. This work has been supported by the second Network for the analysis of EU-SILC (Net-SILC2), funded by Eurostat. The European Commission bears no responsibility for the analyses and conclusions, which are solely those of the authors. Email address for correspondence: [email protected] and [email protected].
1 Combining sample surveys and registers - an overwiew in the context of EU-SILC
The use of registers in the context of EU-SILC: challenges and opportunities 14
1.2 Challenges for combining survey and register data
1.2.1 EU-SILC and data integration
EU-SILC is a framework, designed according to statistical principles, with a specific objective to measure income distribution and the level and composition of poverty and social exclusion among private households in the EU Member States. It is a sample-based statistical information system, wherein the contents are defined as ex-ante output harmonised statistical variables. A key feature is flexibility of implementation at national level and the ensuing variation in the data collection methods, coupled with systematic monitoring of data quality and the degree of comparability. The data for EU-SILC needs to be collected with a sample survey, because subjective questions on living conditions and their joint distributions with income and other domains are essential for the output of the whole instrument(2).
As a consequence of the flexibility principle, the countries implementing EU-SILC are split between the ‘register countries’ and the ‘survey countries’. In the ‘register countries’, the use of registers affects more profoundly the design and implementation of the survey. Broadly speaking, the ‘register countries’ in EU-SILC take income data mostly from registers, have short questionnaires with focus on qualitative questions, use computer assisted telephone interviewing (CATI) as the main mode of collection, and use the so-called ‘selected respondent’ design. In this design, a pre-defined set of personal variables are collected only for a representative sub-sample of adults (16+) instead of all adults, and the results are generalised to the cross-sectional target population with special weights. In the longitudinal part, only the initially selected respondent is followed in the subsequent waves. In the 2010 database, Denmark, Finland, Iceland, the Netherlands, Norway, Slovenia, and Sweden would comprise the set of such selected respondent register countries.
Progressing with the measurement of income data from registers is the area where many countries have significant potential both to improve data quality and to cut data collection costs. Quite a few countries either have started to use or are planning to use register data on incomes to replace interview-based target variables, to a varying extent. The group of EU-SILC countries that have started to use income data from registers includes countries such as France, Italy, Latvia, Switzerland, and Ireland, and the group will expand to at least Austria and Spain in the coming years.
The use of registers together with interview-based data in a sample survey falls under the scope of data integration using record linkage. Two or more sources are combined at the unit level, and the sources are at least partially overlapping and have the same base units. Record linkage is a procedure to determine whether the records from the different datasets belong to the same entity(3) The data to be record linked is collected originally for a purpose other than EU-SILC, i.e. the use of registers is re-use of existing data. The register data may have been collected for administrative purposes, or for statistical purposes other than EU-SILC. In the latter case, the data are combined from one or more administrative sources.
1.2.2 EU-SILC and register infrastructures
If statistics widely are compiled from registers within the National Statistical Institute (NSI), extensive amount of data already may have been integrated and processed to the NSI’s statistical register databases, e.g. a population database, statistical business register, register-based employment statistics, or education register. Administrative data sources require a great deal of work on harmonisation of populations and units, common identifiers and the record linkage process, and derivation of variables. In general, developing register-based statistics requires a system-based approach. Exploitation of registers in sample surveys
(2) In principle, variables in many other domains could be available in the registers (income, demographics, labour, housing...), and statistics could be based on entirely register-based sources. The acronym EU-SILC in fact stands for EU Statistics on Income and Living Conditions. Nevertheless, a survey is necessary, for instance to measure the current main indicator, the union of the population having low income, low work intensity or severe material deprivation (i.e. people at risk of poverty or social exclusion [AROPE]).
(3) Another example of data integration is statistical matching, wherein the sources are not overlapping but have the same statistical units and must share a certain set of covariates (see Leulescu and Agafitei, 2012). While we do not discuss statistical matching in this paper, it is worth noting that statistical matching benefits greatly from availability of record linkage from registers, because these provide a wider pool of shared and comparable covariates for the surveys. Such covariates are essential for successful statistical matching between surveys.
Combining sample surveys and registers - an overwiew in the context of EU-SILC 1
15 The use of registers in the context of EU-SILC: challenges and opportunities
benefits significantly from an established register infrastructure of the society and the NSI. An established register infrastructure within an NSI also implies less legal and technical hindrances for gaining access to registers for the EU-SILC process(4)
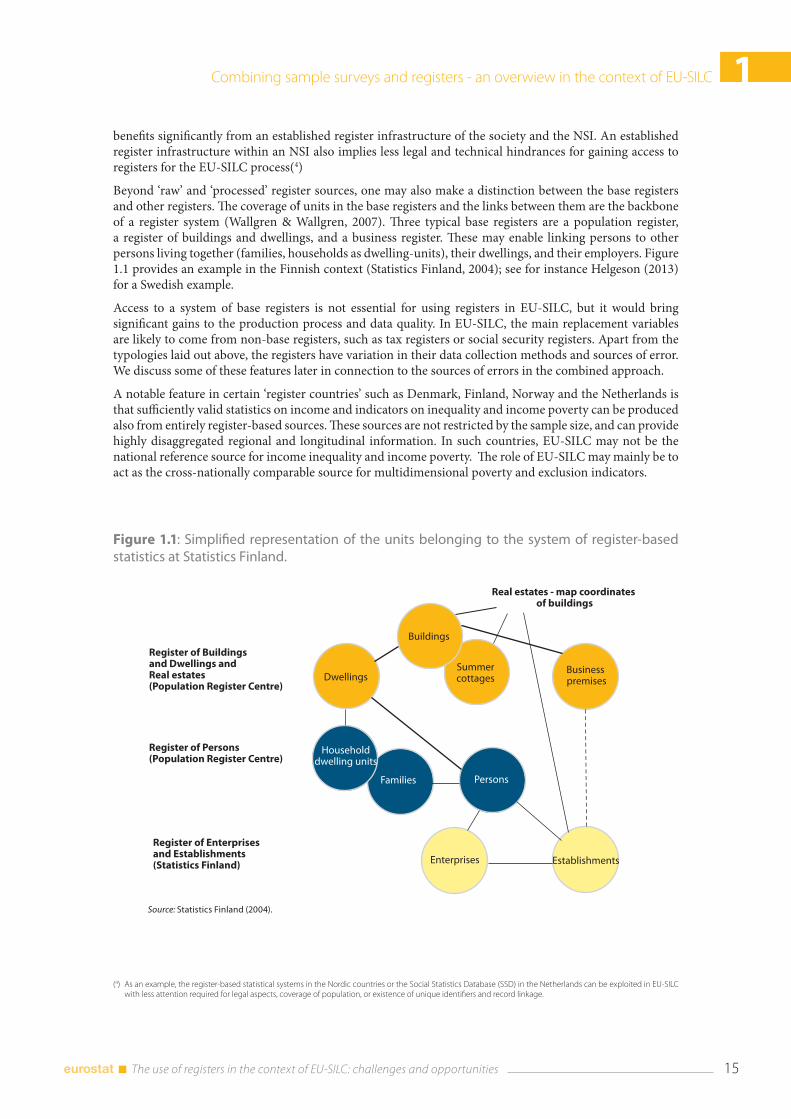
Beyond ‘raw’ and ‘processed’ register sources, one may also make a distinction between the base registers and other registers. The coverage of units in the base registers and the links between them are the backbone of a register system (Wallgren & Wallgren, 2007). Three typical base registers are a population register, a register of buildings and dwellings, and a business register. These may enable linking persons to other persons living together (families, households as dwelling-units), their dwellings, and their employers. Figure 1.1 provides an example in the Finnish context (Statistics Finland, 2004); see for instance Helgeson (2013) for a Swedish example.
Access to a system of base registers is not essential for using registers in EU-SILC, but it would bring significant gains to the production process and data quality. In EU-SILC, the main replacement variables are likely to come from non-base registers, such as tax registers or social security registers. Apart from the typologies laid out above, the registers have variation in their data collection methods and sources of error. We discuss some of these features later in connection to the sources of errors in the combined approach.
A notable feature in certain ‘register countries’ such as Denmark, Finland, Norway and the Netherlands is that sufficiently valid statistics on income and indicators on inequality and income poverty can be produced also from entirely register-based sources. These sources are not restricted by the sample size, and can provide highly disaggregated regional and longitudinal information. In such countries, EU-SILC may not be the national reference source for income inequality and income poverty. The role of EU-SILC may mainly be to act as the cross-nationally comparable source for multidimensional poverty and exclusion indicators.
(4) As an example, the register-based statistical systems in the Nordic countries or the Social Statistics Database (SSD) in the Netherlands can be exploited in EU-SILC with less attention required for legal aspects, coverage of population, or existence of unique identifiers and record linkage.
Figure 1.1: Simplified representation of the units belonging to the system of register-based statistics at Statistics Finland.
Source: Statistics Finland (2004).
1 Combining sample surveys and registers - an overwiew in the context of EU-SILC
The use of registers in the context of EU-SILC: challenges and opportunities 16
(5) Moreover, the potential future uses could be considered already when asking for consent or informing the respondents. There may be need later on to link (new) registers to the EU-SILC sample to respond to new user needs.
(6) Sampling provides significant protection against disclosure risk in the statistical tables derived from EU-SILC. In entirely register-based systems, the tables usually need strict disclosure control.
1.2.3 Legal basis, respondent consent and disclosure control
A critical precondition for using registers is that the existing legislation does not prevent their use for the intended purpose. As a related matter, in surveys respondent consent is usually required in order to link unit level data from registers to interview-based data. In the EU-SILC context, the legal infrastructure needs to allow the following:
1. Data collection from the registers and their linkage to the survey units (sample persons and co-residents in the EU-SILC sample) and
2. Dissemination of micro data to a statistical authority, i.e. Eurostat, and
3. Further dissemination to third parties (i.e. researchers) from Eurostat.
The delivery of EU-SILC micro data to Eurostat and dissemination to third parties are governed by EU legislation. The key issue is then whether the national legislation allows legal access to and working with administrative registers, including data linking and dissemination to third parties. There may also be practical hindrances, such as burdensome administrative procedures to get the actual access, or case-by-case granting of access instead of general entitlements. On the other hand, in some countries national legislation may enforce the use of administrative data in surveys by decreeing that existing data sources should be used if these are available. In this case, the NSI is obliged to examine whether the data exists in administrative registers before starting to collect it in a survey (UN, 2007).
Confidentiality and privacy protection is a related issue, and may be legislated e.g. through data protection laws or laws on processing of personal data, which have a wider scope than laws governing statistics. There may be variation across countries with public approval towards using registers for statistics, mainly because of concerns for privacy and the ‘Big Brother Syndrome’ (UN, 2007). A broad public approval towards using registers in administration and for statistical purposes is a precondition for using registers, in particular because in sample surveys the respondents should be informed about the use of registers.
Requesting respondent consent (informed consent) to record link register data may be a sensitive issue. Some households may not agree with record linkage of administrative data and refuse to participate, increasing non-response. Moreover, consent bias may occur if survey data are used for the non-consenting households and register data for the consenting ones (Sakshauge & Kreuter, 2012). Getting the consent needs to be carefully considered when designing the contact strategy and advance information sent or made accessible to the sampled households. Instead of asking for explicit consent, a softer version may be feasible, depending on the national legislation and NSI practises (for instance, informing the respondents in advance letter or brochures without asking for explicit consent)(5).
The EU-SILC implementations that use registers are likely to carry a higher disclosure risk than the purely survey-based implementations. The record linkage from registers implies that the survey data set and external registers share a set of key variables (e.g. location, age, income), which have identical values. Such variables can be used in linking a sample unit to the external source correctly, i.e. the probability of identification can be one. In particular, the level of accuracy of income data may be very high, and the information along with basic demographics publicly available at least to some extent (e.g. Norway, Finland). Longitudinal register data may further increase the possibilities for identification.
The use of register income data therefore implies paying more attention to disclosure risk in the micro data(6). In EU-SILC, the anonymisation procedure includes both centralised and de-centralised (‘specific rules’) elements. The centralised measures include recoding (e.g. age) and excluding (e.g. strata) variables from the database. The documentation of the country-specific rules does not point to register countries applying more disclosure control to their data. Nevertheless, we assume that such measures have been taken but significant risks have not been identified. There is also more scope for detecting disclosure risks, if exactly matched data from registers are used (see for instance Skinner, 2009). This allows for instance detection of whether a sample unique observation in the EU-SILC data also is a population unique.
Combining sample surveys and registers - an overwiew in the context of EU-SILC 1
17 The use of registers in the context of EU-SILC: challenges and opportunities
1.2.4 Timeliness and continuity
The EU-SILC framework regulation imposes a deadline for transmitting the micro data to Eurostat. Meeting this deadline is a necessary precondition for using registers in EU-SILC. The extreme deadline currently is October N+1 for most countries for cross-sectional data, with N being the fieldwork year and not the (income) reference year. As an example, the survey data collected in 2012, with income data usually from 2011, would have the deadline set at October 2013. All registers to be used need to be processed by the register authority, transmitted to the statistical institute, validated, transformed, record linked, and further processed into the SILC target variables within a timeframe of around 10-20 months, depending on the end of the survey fieldwork.
An important constraint is late availability of registers, which may result from administrative barriers and the lead-time needed by the register authorities themselves to process the data (e.g. to conduct taxation). Such delays are country and domain/register specific, but may restrict the use of registers or even prevent their use altogether. Administrative delay, in contrast should be a minor constraint in EU-SILC, unlike in monthly or quarterly sources. Administrative delay refers to the time lag between the event and its registration in the registers, and is an important source of measurement errors.
The processing delay related to using register data in the SILC production may also be a challenge. Data integration implies the additional task of record linkage. Moreover, consistency checks and editing, weighting and construction of the target variables become more time consuming. On the other hand, time devoted to imputations should reduce significantly if register income data are available.
The dependency on the register contents makes the register-based SILC implementations more vulnerable to breaks in time-series. Management of changes in the registers is a challenge. For instance, tax reforms do occur from time to time and are the most important source of potential discontinuity. A more positive form of discontinuity is increased availability of administrative data, if the need for efficient administration pushes the authorities to develop the administrative information systems.
To some extent, a statistical authority may have control over such changes through organised and systematic co-operation with the register authorities. While it may be difficult to have control over EU-SILC specific needs, the use of administrative sources can be improved by working as closely as possible with the authorities, in order to exercise a real impact on the data content of registers, and to disseminate a better understanding of the use of administrative data for statistical purposes (Statistics Finland, 2004). There can even be legal requirements for consultations between the NSIs and the register authorities.
1.2.5 Sources of error when registers are combined to surveys
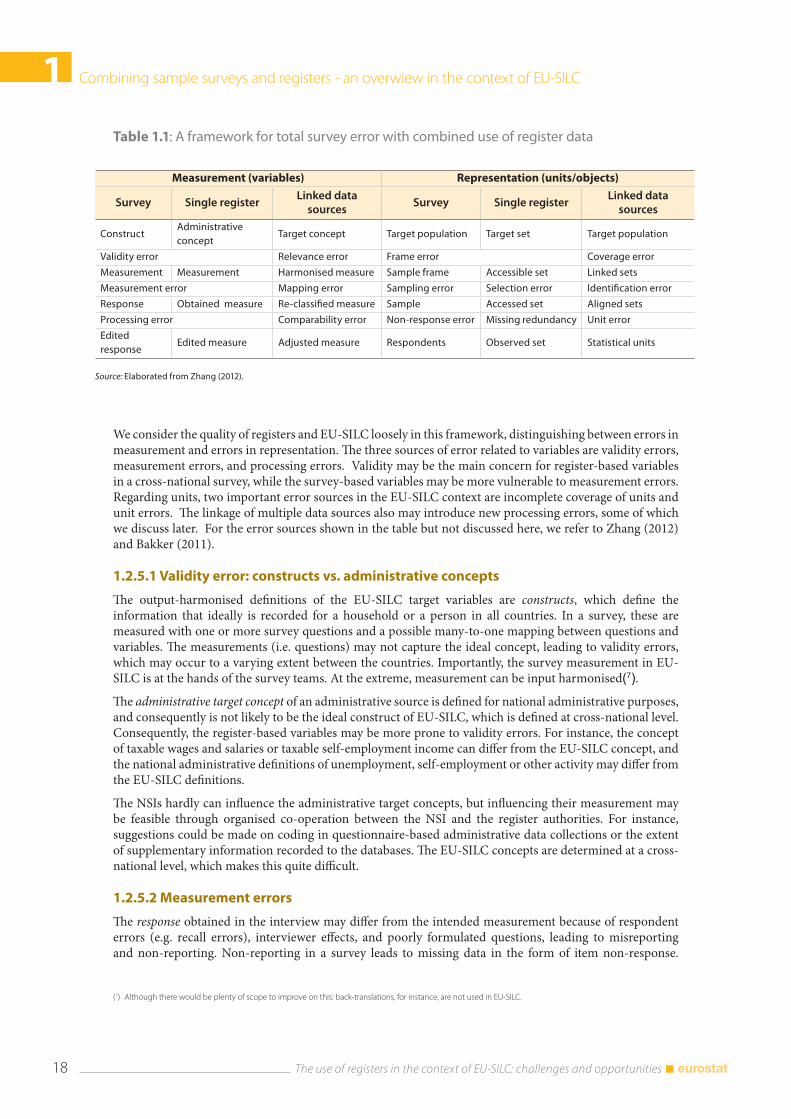
The combined use of survey and register data affects the total survey error (Groves, 2004), and effectively expands the traditional survey error sources to those related to registers (single sources) and data integration from multiple sources. The linkage and alignment of multiple sources introduces an additional 2nd phase source of errors, in addition to the sources of error in any single source (Zhang, 2012). Both surveys and registers have errors related to measurement (variables) and errors related to representation (units). Table 1.1 sketches a framework for thinking how the set of error sources would expand when combining indirectly collected register data with directly collected survey data. The table is adapted from existing frameworks: the concept of total survey error (Groves, 2004) and the frameworks for errors in register-based statistics (Zhang 2012; Bakker, 2011).
1 Combining sample surveys and registers - an overwiew in the context of EU-SILC
The use of registers in the context of EU-SILC: challenges and opportunities 18
Table 1.1: A framework for total survey error with combined use of register data
Measurement (variables) Representation (units/objects)
Survey Single registerLinked data
sourcesSurvey Single register
Linked data sources
ConstructAdministrative concept
Target concept Target population Target set Target population
Validity error Relevance error Frame error Coverage error
Measurement Measurement Harmonised measure Sample frame Accessible set Linked sets
Measurement error Mapping error Sampling error Selection error Identification error
Response Obtained measure Re-classified measure Sample Accessed set Aligned sets
Processing error Comparability error Non-response error Missing redundancy Unit error
Edited response
Edited measure Adjusted measure Respondents Observed set Statistical units
Source: Elaborated from Zhang (2012).
We consider the quality of registers and EU-SILC loosely in this framework, distinguishing between errors in measurement and errors in representation. The three sources of error related to variables are validity errors, measurement errors, and processing errors. Validity may be the main concern for register-based variables in a cross-national survey, while the survey-based variables may be more vulnerable to measurement errors. Regarding units, two important error sources in the EU-SILC context are incomplete coverage of units and unit errors. The linkage of multiple data sources also may introduce new processing errors, some of which we discuss later. For the error sources shown in the table but not discussed here, we refer to Zhang (2012) and Bakker (2011).
1.2.5.1 Validity error: constructs vs. administrative concepts
The output-harmonised definitions of the EU-SILC target variables are constructs, which define the information that ideally is recorded for a household or a person in all countries. In a survey, these are measured with one or more survey questions and a possible many-to-one mapping between questions and variables. The measurements (i.e. questions) may not capture the ideal concept, leading to validity errors, which may occur to a varying extent between the countries. Importantly, the survey measurement in EU-SILC is at the hands of the survey teams. At the extreme, measurement can be input harmonised(7).
The administrative target concept of an administrative source is defined for national administrative purposes, and consequently is not likely to be the ideal construct of EU-SILC, which is defined at cross-national level. Consequently, the register-based variables may be more prone to validity errors. For instance, the concept of taxable wages and salaries or taxable self-employment income can differ from the EU-SILC concept, and the national administrative definitions of unemployment, self-employment or other activity may differ from the EU-SILC definitions.
The NSIs hardly can influence the administrative target concepts, but influencing their measurement may be feasible through organised co-operation between the NSI and the register authorities. For instance, suggestions could be made on coding in questionnaire-based administrative data collections or the extent of supplementary information recorded to the databases. The EU-SILC concepts are determined at a cross-national level, which makes this quite difficult.
1.2.5.2 Measurement errors
The response obtained in the interview may differ from the intended measurement because of respondent errors (e.g. recall errors), interviewer effects, and poorly formulated questions, leading to misreporting and non-reporting. Non-reporting in a survey leads to missing data in the form of item non-response.
(7) Although there would be plenty of scope to improve on this: back-translations, for instance, are not used in EU-SILC.
Combining sample surveys and registers - an overwiew in the context of EU-SILC 1
19 The use of registers in the context of EU-SILC: challenges and opportunities
The obtained measures from registers (Zhang, 2012) also may contain measurement errors. Undeclared or unregistered information for instance due to tax evasion or administrative delay leads to missing data for the units, which is equivalent to non-reporting and item non-response in the surveys.
In general, measurement errors in the register sources depend on the administrative data collection process, and the involvement and the interest of the registered person or unit (Bakker, 2011). Some administrative register data are collected with survey-like techniques, through self-administered questionnaires (e.g. tax forms), which are processed into electronic format. The person may have interest to have very accurate data registered, but also could intentionally provide false data. A classic case of the latter is tax evasion; for instance, self-employment income self-declared in the tax forms can contain intentionally underreported data. Some administrative register data come directly from electronic administrative systems without the direct involvement of a person. As an example, wages and salaries based on electronic data transmission between employers and tax authorities can be very accurate. Different types of data may be included even in the same register, in particular in the tax register(s).
Regarding misreporting, the administrative data that are used to make decisions about persons, fiscal units, enterprises and so forth are typically verified in the administrative process (e.g. eligibility for unemployment allowance or payment of salary). Therefore, the specific variables that are used in the decision-making are expected to be more accurate, at unit level, than survey data or register data that play a more auxiliary role and are not directly used in decision-making(8). Comparisons between survey income data and register-based data tend to show under-reporting in the surveys (e.g. Méndez 2011; Neri, 2010; Nordberg 2003; Epland & Kirkeberg, 2002). To the extent that under-reporting feeds into the estimates of income inequality and poverty, this endangers cross-national comparability.
Survey variables are checked for logical inconsistencies, outliers, and missing data. This leads to an edited response, which here includes imputation of missing income data. Similar checks as with the survey data are necessary with register variables. Some corrections may be carried out, and the outcome can be labelled an edited obtained measure based on register data.
Importantly, the record linkage of multiple data sources usually reveals inconsistencies between the register sources or of survey responses to register data. Consequently, the 2nd phase measurement errors found after linking the various data sources may be quite prominent, and may lead to adjusted measures, which may require construction of complex decision rules to solve the conflicting information of responses and obtained measures, edited or not. The confrontation of the various data sources and correction of conflicting information may be referred to as micro-integration (Bakker, 2011). The result may be an adjusted variable, which can be a hybrid of multiple sources or an adjusted single-source variable. In general, combined use of registers and interview-based data increases the need for consistency checks and possibly micro-editing of the data.
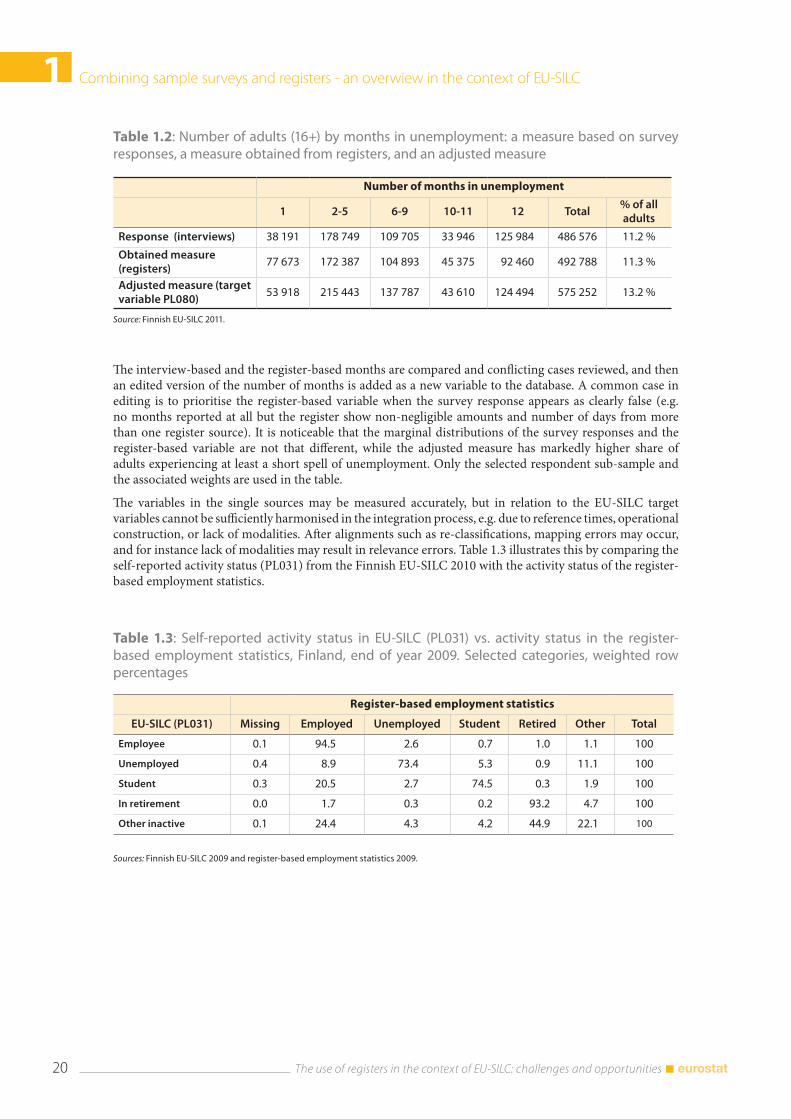
The case of the Italian hybrid measure of self-employment incomes (see section 1.3.3.2) is an example of an adjusted measure. Table 1.2 provides a non-income example of an adjusted measure based on the Finnish EU-SILC 2011. The target variable on number of months in unemployment (PL080) is constructed as a micro-edited combination of responses and measures obtained from registers. The survey responses are based on asking about the number of months unemployed in a telephone interview(9). The register-based variable (obtained measure) is constructed using the number of days in unemployment and the amount of benefit, record linked from two distinct register sources to the EU-SILC sample (one on basic allowances and one on earnings-related allowances).
(8) In statistical registers and statistical systems exploiting them (e.g. EU-SILC), the aim is not the correctness of the individual data at unit level per se, but on the accuracy of the estimates derived from the units for the population and population subgroups. There is some tolerance for measurement errors at unit level, inasmuch as they do not affect the conclusions drawn from estimates derived from the observations.
(9) The variable is not the sum of calendar activities.
1 Combining sample surveys and registers - an overwiew in the context of EU-SILC
The use of registers in the context of EU-SILC: challenges and opportunities 20
The interview-based and the register-based months are compared and conflicting cases reviewed, and then an edited version of the number of months is added as a new variable to the database. A common case in editing is to prioritise the register-based variable when the survey response appears as clearly false (e.g. no months reported at all but the register show non-negligible amounts and number of days from more than one register source). It is noticeable that the marginal distributions of the survey responses and the register-based variable are not that different, while the adjusted measure has markedly higher share of adults experiencing at least a short spell of unemployment. Only the selected respondent sub-sample and the associated weights are used in the table.
The variables in the single sources may be measured accurately, but in relation to the EU-SILC target variables cannot be sufficiently harmonised in the integration process, e.g. due to reference times, operational construction, or lack of modalities. After alignments such as re-classifications, mapping errors may occur, and for instance lack of modalities may result in relevance errors. Table 1.3 illustrates this by comparing the self-reported activity status (PL031) from the Finnish EU-SILC 2010 with the activity status of the register-based employment statistics.
Table 1.2: Number of adults (16+) by months in unemployment: a measure based on survey responses, a measure obtained from registers, and an adjusted measure
Number of months in unemployment
1 2-5 6-9 10-11 12 Total% of all adults
Response (interviews) 38 191 178 749 109 705 33 946 125 984 486 576 11.2 %
Obtained measure (registers)
77 673 172 387 104 893 45 375 92 460 492 788 11.3 %
Adjusted measure (target variable PL080)
53 918 215 443 137 787 43 610 124 494 575 252 13.2 %
Source: Finnish EU-SILC 2011.
Table 1.3: Self-reported activity status in EU-SILC (PL031) vs. activity status in the register-based employment statistics, Finland, end of year 2009. Selected categories, weighted row percentages
Register-based employment statistics
EU-SILC (PL031) Missing Employed Unemployed Student Retired Other Total
Employee 0.1 94.5 2.6 0.7 1.0 1.1 100
Unemployed 0.4 8.9 73.4 5.3 0.9 11.1 100
Student 0.3 20.5 2.7 74.5 0.3 1.9 100
In retirement 0.0 1.7 0.3 0.2 93.2 4.7 100
Other inactive 0.1 24.4 4.3 4.2 44.9 22.1 100
Sources: Finnish EU-SILC 2009 and register-based employment statistics 2009.
Combining sample surveys and registers - an overwiew in the context of EU-SILC 1
21 The use of registers in the context of EU-SILC: challenges and opportunities
The register-based variable relates to the activity in the last week of the year, and results from a very complex decision rule involving numerous registers. The EU-SILC variable is based on retrospective question on the activity in the month of December. As an example, 5.5 per cent of the employed in EU-SILC would be identified as not employed, if register-based data were used. This would not be feasible in any case, since the PL031 is an important filtering variable in the questionnaire, the register-based variable lacks many modalities (e.g. part-time work), and it is not timely enough.
1.2.5.3 Unit errors
Unit error refers to a case when the units in the secondary data sources do not match the target statistical units of EU-SILC, which are individuals and economic households. In general, the linked data sources may consist of base units (e.g. individuals, local units), composite units (e.g. families, households/dwelling-units, tax units, enterprises), or objects such as events ((birth, marriage, enrolling to education, start of unemployment etc.) and other objects (e.g. debts, ISIN security codes)(10). The unit errors occur in the record linkage process (see section 1.3.4.3), if the many-to-one linkage between the base and the composite units differ in the survey and in the register sources.
In particular, the register-based households or other composite units are not always composed of the same persons as the survey-based household. A typical register-based household concept is that of a household-dwelling unit, which defines a household based on co-residence, as all persons registered in the same dwelling(11). In surveys, a household commonly is defined as the ‘housekeeping’ household, using the criterion of common housekeeping (shared income/expenses). As such, this is not observed from registers, and the household members need to be enumerated in the interview to satisfy the EU-SILC definition(12).
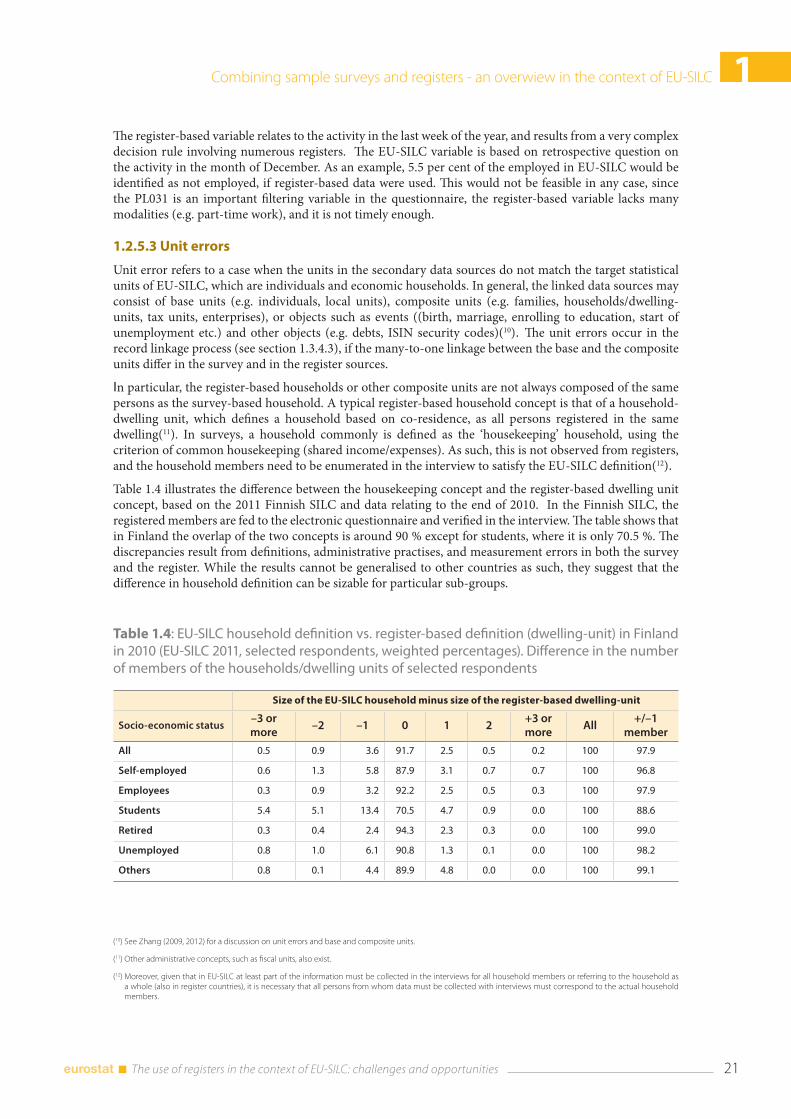
Table 1.4 illustrates the difference between the housekeeping concept and the register-based dwelling unit concept, based on the 2011 Finnish SILC and data relating to the end of 2010. In the Finnish SILC, the registered members are fed to the electronic questionnaire and verified in the interview. The table shows that in Finland the overlap of the two concepts is around 90 % except for students, where it is only 70.5 %. The discrepancies result from definitions, administrative practises, and measurement errors in both the survey and the register. While the results cannot be generalised to other countries as such, they suggest that the difference in household definition can be sizable for particular sub-groups.
(10) See Zhang (2009, 2012) for a discussion on unit errors and base and composite units.
(11) Other administrative concepts, such as fiscal units, also exist.
(12) Moreover, given that in EU-SILC at least part of the information must be collected in the interviews for all household members or referring to the household as a whole (also in register countries), it is necessary that all persons from whom data must be collected with interviews must correspond to the actual household members.
Table 1.4: EU-SILC household definition vs. register-based definition (dwelling-unit) in Finland in 2010 (EU-SILC 2011, selected respondents, weighted percentages). Difference in the number of members of the households/dwelling units of selected respondents
Size of the EU-SILC household minus size of the register-based dwelling-unit
Socio-economic status–3 or more
–2 –1 0 1 2+3 or more
All+/–1
member
All 0.5 0.9 3.6 91.7 2.5 0.5 0.2 100 97.9
Self-employed 0.6 1.3 5.8 87.9 3.1 0.7 0.7 100 96.8
Employees 0.3 0.9 3.2 92.2 2.5 0.5 0.3 100 97.9
Students 5.4 5.1 13.4 70.5 4.7 0.9 0.0 100 88.6
Retired 0.3 0.4 2.4 94.3 2.3 0.3 0.0 100 99.0
Unemployed 0.8 1.0 6.1 90.8 1.3 0.1 0.0 100 98.2
Others 0.8 0.1 4.4 89.9 4.8 0.0 0.0 100 99.1
1 Combining sample surveys and registers - an overwiew in the context of EU-SILC
The use of registers in the context of EU-SILC: challenges and opportunities 22
As an example of a pure unit error, suppose for instance that a register source is used to aggregate incomes over members living in the same address, and equivalent incomes then are assigned to each person. These are further linked to the EU-SILC sample. Even with the exactly same measurement of income, the equivalent income based on survey household members is likely to differ from the equivalent income based on register-based household members. In some countries, data indeed can be record linked from register-based household income statistics to enrich the sample data, but this warrants a consideration of potential unit error.
Alignment of units is a procedure to harmonise units in the available data sources prior to data linkage. In the EU-SILC context, the register-units would have to be aligned to the survey-units in case they differ. The survey-based household is also likely to be a more valid measure of a household at unit level. The alignment of register-based households and survey-based households, or enterprises and local units merely for EU-SILC may be quite burdensome. One option is to align only the most problematic sub-groups, e.g. students. As a form of alignment, transformations to individual level are often feasible. For instance, if income data are recorded in the registers for e.g. tax units, these could be allocated to individuals prior to record linkage. Event or object data also can be transformed to person-level data for record linkage. For instance, start and end dates of unemployment observed in the registers define unemployment spells. Based on that information, the variable on the number of months a person has been unemployed during a year can be constructed.
Identification errors also occur in the linkage process. A unit error leads to an identification error. For instance, a poverty status based on equivalent income derived from registers can be identified differently from the survey-based information, because the composite units are different. To resolve identification errors, variable-specific and possibly very complex alignment rules might be constructed. In the linkage of registers, such alignments of unit and identification errors lead to an aligned set of the various data sources (Zhang, 2012).
1.2.5.4 Coverage error of units
In sample surveys, the difference between the sampling frame and the target population results in over- or under-coverage. In a single register source, the equivalent term for a sampling frame could be accessible set (Zhang, 2012). It may have over— or under—coverage in relation to the target set. For instance, the accessible set of a tax register may include only those with taxable income but include non-resident individuals; the education register based on administrative data may not cover degrees completed abroad; or data originating from administrative data of municipalities may not have full geographical coverage. If multiple register sources are used, the linkage of the base units of the accessible sets them into a linked accessible set, which still may not cover the whole target population. Therefore, the linked register data may also have coverage error of units (or objects/events)(13).
In EU-SILC, the (linked) accessible sets are linked on the level of persons to the persons in the EU-SILC sample. The coverage error after the final linkage to the sample units may be a result of failed linkages between the registers, failed linkage to the sample units, in addition to the coverage of the units in each of the accessible sets of the register sources. The result is missing obtained measures for some units and valid obtained measures for some units, analogously to item non-response. This coverage error of units is potentially an important obstacle to using register data in EU-SILC, for instance if an entire sub-group of target population is known to be missing from a register source. On the other hand, if this register under-coverage is known before the fieldwork, survey questions can be targeted to just this group while for the other units data can be taken from registers (see e.g. Mendez, 2013).
(13) Furthermore, a selection error may occur with registers and the accessed set may be a subset of the accessible set (Zhang, 2012). For instance, the tax register accessed by an NSI may not contain all units with taxable incomes because of processing or reporting errors (e.g. mistakes made by the tax authorities when constructing the data, delays in event registration, legal obstacles).
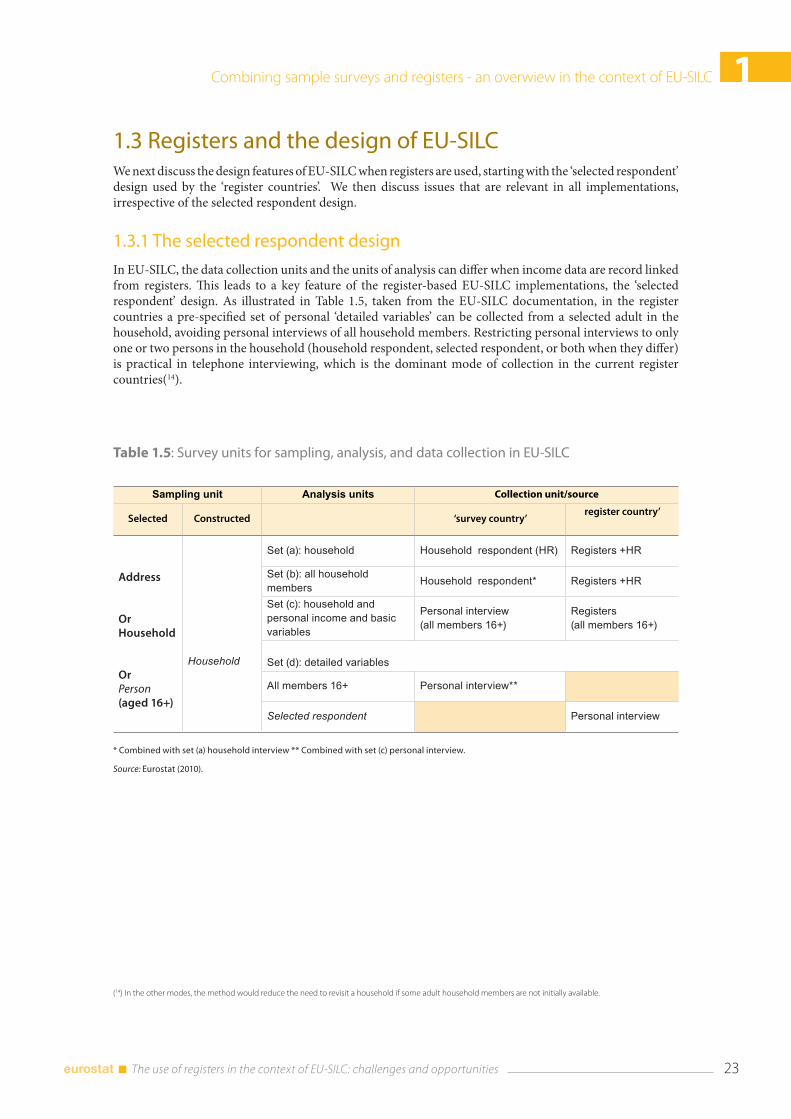
Combining sample surveys and registers - an overwiew in the context of EU-SILC 1
23 The use of registers in the context of EU-SILC: challenges and opportunities
1.3 Registers and the design of EU-SILCWe next discuss the design features of EU-SILC when registers are used, starting with the ‘selected respondent’ design used by the ‘register countries’. We then discuss issues that are relevant in all implementations, irrespective of the selected respondent design.
1.3.1 The selected respondent design
In EU-SILC, the data collection units and the units of analysis can differ when income data are record linked from registers. This leads to a key feature of the register-based EU-SILC implementations, the ‘selected respondent’ design. As illustrated in Table 1.5, taken from the EU-SILC documentation, in the register countries a pre-specified set of personal ‘detailed variables’ can be collected from a selected adult in the household, avoiding personal interviews of all household members. Restricting personal interviews to only one or two persons in the household (household respondent, selected respondent, or both when they differ) is practical in telephone interviewing, which is the dominant mode of collection in the current register countries(14).
(14) In the other modes, the method would reduce the need to revisit a household if some adult household members are not initially available.
Table 1.5: Survey units for sampling, analysis, and data collection in EU-SILC
Sampling unit Analysis units Collection unit/source
Selected Constructed ‘survey country’register country’
Address
OrHousehold
OrPerson(aged 16+)
Household
Set (a): household Household respondent (HR) Registers +HR
Set (b): all household members Household respondent* Registers +HR
Set (c): household and personal income and basic variables
Personal interview(all members 16+)
Registers(all members 16+)
Set (d): detailed variables
All members 16+ Personal interview**
Selected respondent Personal interview
* Combined with set (a) household interview ** Combined with set (c) personal interview.
Source: Eurostat (2010).
1 Combining sample surveys and registers - an overwiew in the context of EU-SILC
The use of registers in the context of EU-SILC: challenges and opportunities 24
1.3.1.1 Sampling of individuals
The ‘selected respondent’ design is applicable when personal income data can be taken from registers, and in practise is feasible when a sample of persons is drawn. This is common in countries where continuously updated population information systems provide a complete enumeration of persons in private households. The individuals 16+ drawn from the frame are ‘selected respondents’, and the household is defined around the selected person. Since individuals are randomly pre-selected from the sampling frame, the respondents constitute a representative sample of the population of individuals 16+.
In general, sampling unit can be the address, the dwelling, the household or the individual. Of the register countries in the EU-SILC 2009 operation, Nordic countries and Slovenia sampled individuals, while the Netherlands sampled dwellings/addresses (although the Dutch SILC is in fact a follow-up survey of the LFS). In the ‘survey countries’, a sample of addresses or households is common, and all current members aged 16 years and older are interviewed. In theory, a representative sample of persons could be feasible through a sample of households, if a randomised procedure (e.g. Kish selection tables) were used to select the sample of persons from a representative sample of households.
Countries using a sample of persons and the SR design have different minimum effective sample sizes. The minimum sample size is defined in the SR design to be 75 per cent of the number of 16+ adults required in a sampling of addresses (Eurostat, 2010). For instance, in Slovenia the minimum sample size in the non-SR design would be 3,750 households and 9,000 adults for the cross-sectional part. Because a sample of persons and the SR design is used, the minimum sample size in terms of households is increased to 6,750 households (0.75*9,000). This equals the number of selected respondents aged 16+ to be interviewed in detail.
In the longitudinal part, where individual is the unit of analysis, only the initially selected respondents are the sample persons to be traced. The split-off members, i.e. the initial co-residents, are not followed, which is an important practical simplification. The SR registers countries using the standard four-year design also must select an extra sample to cover population 14 and 15 years old.
When individuals are sampled, persons not included in the frame can only be included as co-residents (those added to the household of the selected respondent in the interview) and not as selected respondents(15). In order to avoid under-coverage(16), the sampling frame should be a continuously updated population register covering the whole target population of individuals. The use of continuously updated population registers also should result in fewer units ineligible for an interview found during the fieldwork, and lower costs due to less failed contact attempts. Frame over-coverage may result from the lag between drawing the sample and the start of the fieldwork. Optimally, the frame contains information, which allows quite accurate delineation of the target population before going to the field. An important example is exclusion of people in non-private households.
1.3.1.2 The ‘detailed’ personal variables
As noted, sampling of individuals and access to personal income data from registers allow countries to collect a set of variables only on the sub-sample of ‘selected adult respondents 16+’, instead of all adult members. These variables typically are not available in the registers, and by their nature cannot be collected from another household member (a proxy); for instance personal health, access to health care, and certain labour variables. A prerequisite is that it is not essential that from an analysis point of view that all persons are interviewed (Eurostat, 2010). The selected respondent variables are to be analysed at the level of persons only, using special selected respondent weights, without aggregation to household level. Some variables in EU-SILC are defined only for the longitudinal component. In the register countries, these pure panel variables are also ‘selected respondent’ variables.
(15) For record linkage, a link variable needs to be either found or created for all co-residents added in the interview. If this is not feasible and the number of such co-residents is negligible, implying a high quality of the sampling frame, they could also be dropped from the sample. In the Finnish EU-SILC, for instance a valid personal identification number (PN) is a necessary precondition for a respondent and his/her household to be selected into the sample.
(16) Units in the target population but not in the frame. Aside from technical issues, frame under-coverage may be related to persons residing in a country illegally, to administrative delay (e.g. immigrants waiting for residence permit), to wrongly classified individuals (e.g. incorrectly registered in non-private household), and misreporting (e.g. when registration is not mandated by a law).
Combining sample surveys and registers - an overwiew in the context of EU-SILC 1
25 The use of registers in the context of EU-SILC: challenges and opportunities
Both survey and register countries collect certain personal variables on all adult household members (16+). Such variables allow intra-household variation, and can be aggregated to household level. For instance, personal income variables must be recorded at a personal level for each adult (16+) household member. Some important EU-SILC labour variables are to be collected for all 16+ members of the households. If these variables have to be collected through the interviews, they may suffer from a high rate of proxy answers(17), and the responses given by one member on behalf of the other members contains more respondent measurement error.
Variables that may be difficult to collect from registers and yet should be provided for all adult household members include the number of hours (PL060, PL100), has person ever worked (PL015), is actively looking for a job (PL020), or is available for work (PL025). In addition, registered occupation (PL050/PL051) in the current or last main job may easily differ from the one collected in the interviews, due to measurement and identification issues. Moreover, key labour variables on current activity status (PL031) and activity months (PL73-PL090) have many modalities, which would require extremely good and timely register base on employment and other activities(18).
The objective selected respondent variables are somewhat problematic to define, since they might be available in some countries but not in others. As an example, at least Slovenia and the Netherlands are able to construct the monthly calendar of activities from registers (Huynen et al., 2013; Inglič, 2013) while for instance in Finland this is not feasible because of the required modalities. Retrospective questions on event histories, such as calendar of activities in EU-SILC, cannot be answered adequately by a proxy, and even with personal interviews of all household members can be measured with low accuracy (see Pyy-Martikainen & Rendtel, 2009).
A household respondent should answer the household-level questions. Household respondent is defined in the interview, usually as the person in a household who is best aware of the household’s economic situation(19). Selected respondent may differ from the household respondent, in which case two adults have to be interviewed, and re-contacts are needed if both are not present in the first interview. In particular, there should be differences in the tails of the age distribution: the youngest selected respondents who still live with their parents, or very old respondents, may not be aware of the household economy, childcare, housing items, or the other household members’ activities.
As an example, in the Finnish EU-SILC 2010, the selected respondent was not the household respondent in 16.3 % of the cases. Parents were commonly the household respondents in the younger age groups of selected respondents and spouses in the older age groups (Finnish intermediate quality report 2010, p. 18-19). In the Netherlands, in around 20 per cent of the households the selected respondent was different from the household respondent (Huynen et al., 2013). There may be different rules in determining when the interviewer should try interview a household respondent instead of the pre-selected respondent on household’s affairs. This could be done via interviewer instructions/training (Finland) or through more formal rules, e.g. if a selected respondent is under 25 years and has parents living in the address (Denmark).
For the users of cross-national data, the selected respondent design complicates the analysis somewhat, and register countries have to be analysed separately if the selected respondent variables are used. Joint analysis with household level variables or with personal variables collected for all adults is not straightforward. The user may have to restrict to the sub-sample of selected respondents with the appropriate weights in the analysis, when such variables are analysed separately or jointly with other types of variables. This leads to a loss in efficiency due to full clustering effect, which is partly compensated by the larger minimum effective sample sizes required from countries using the selected respondent design.
The selected respondent design is also an essential factor that needs to be considered when designing new target variables for EU-SILC. One needs to consider what is the eventual unit of analysis, whether there is need to aggregate to household level or to use in combination with other types of variables of variables (collected from a household respondent or all members), and whether a proxy could reasonably answer the question.(17) The available metadata does not exactly support this claim. Unfortunately, the EU-SILC flags do not allow monitoring this variable-by-variable. The information in
the comparative EU quality report suggests wide variation in proxy rates also between the register countries.
(18) Moreover, the variable in fact is labelled as self-defined current activity status.
(19) A reference person may also be different from a household respondent, and is often determined ex post e.g. on the basis of income or other personal information. There is no ex-post definition of reference person in EU-SILC.
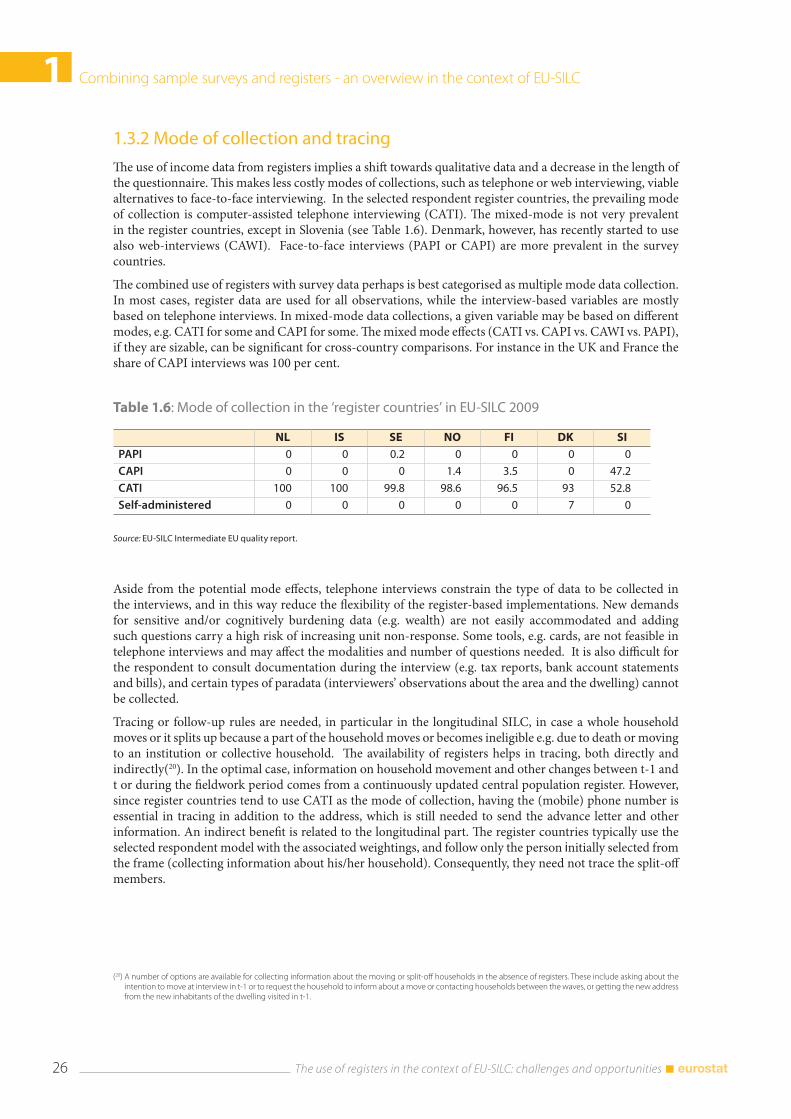
1 Combining sample surveys and registers - an overwiew in the context of EU-SILC
The use of registers in the context of EU-SILC: challenges and opportunities 26
1.3.2 Mode of collection and tracing
The use of income data from registers implies a shift towards qualitative data and a decrease in the length of the questionnaire. This makes less costly modes of collections, such as telephone or web interviewing, viable alternatives to face-to-face interviewing. In the selected respondent register countries, the prevailing mode of collection is computer-assisted telephone interviewing (CATI). The mixed-mode is not very prevalent in the register countries, except in Slovenia (see Table 1.6). Denmark, however, has recently started to use also web-interviews (CAWI). Face-to-face interviews (PAPI or CAPI) are more prevalent in the survey countries.
The combined use of registers with survey data perhaps is best categorised as multiple mode data collection. In most cases, register data are used for all observations, while the interview-based variables are mostly based on telephone interviews. In mixed-mode data collections, a given variable may be based on different modes, e.g. CATI for some and CAPI for some. The mixed mode effects (CATI vs. CAPI vs. CAWI vs. PAPI), if they are sizable, can be significant for cross-country comparisons. For instance in the UK and France the share of CAPI interviews was 100 per cent.
Table 1.6: Mode of collection in the ‘register countries’ in EU-SILC 2009
NL IS SE NO FI DK SIPAPI 0 0 0.2 0 0 0 0
CAPI 0 0 0 1.4 3.5 0 47.2
CATI 100 100 99.8 98.6 96.5 93 52.8
Self-administered 0 0 0 0 0 7 0
Source: EU-SILC Intermediate EU quality report.
Aside from the potential mode effects, telephone interviews constrain the type of data to be collected in the interviews, and in this way reduce the flexibility of the register-based implementations. New demands for sensitive and/or cognitively burdening data (e.g. wealth) are not easily accommodated and adding such questions carry a high risk of increasing unit non-response. Some tools, e.g. cards, are not feasible in telephone interviews and may affect the modalities and number of questions needed. It is also difficult for the respondent to consult documentation during the interview (e.g. tax reports, bank account statements and bills), and certain types of paradata (interviewers’ observations about the area and the dwelling) cannot be collected.
Tracing or follow-up rules are needed, in particular in the longitudinal SILC, in case a whole household moves or it splits up because a part of the household moves or becomes ineligible e.g. due to death or moving to an institution or collective household. The availability of registers helps in tracing, both directly and indirectly(20). In the optimal case, information on household movement and other changes between t-1 and t or during the fieldwork period comes from a continuously updated central population register. However, since register countries tend to use CATI as the mode of collection, having the (mobile) phone number is essential in tracing in addition to the address, which is still needed to send the advance letter and other information. An indirect benefit is related to the longitudinal part. The register countries typically use the selected respondent model with the associated weightings, and follow only the person initially selected from the frame (collecting information about his/her household). Consequently, they need not trace the split-off members.
(20) A number of options are available for collecting information about the moving or split-off households in the absence of registers. These include asking about the intention to move at interview in t-1 or to request the household to inform about a move or contacting households between the waves, or getting the new address from the new inhabitants of the dwelling visited in t-1.
Combining sample surveys and registers - an overwiew in the context of EU-SILC 1
27 The use of registers in the context of EU-SILC: challenges and opportunities
1.3.3 Data collection and questionnaire design
The EU-SILC always needs a questionnaire-based data collection, and the use of registers obviously has an impact on the questionnaire. Some survey questions may be completely replaced with register variables, with the obvious benefit of a shorter and possibly cognitively less burdening questionnaire. In addition, less costly modes of collection may become feasible. The gaps in the registers can be supplemented with interview-based variables, and some questions can be targeted for certain population sub-groups. As a variant of the latter, register data available before the fieldwork can be pre-filled to the electronic questionnaire.
All of the above require adaptation of the questionnaire to some extent. For instance, when Statistics Austria started to use income data from registers, it also adapted its questionnaire not only by deleting questions but also by changing the remaining questions because their context had changed, as well as adding new questions to fill in the gaps in the register incomes (Heuberger et al., 2013)
Cutting down on quantitative questions is important, but as a result the questionnaire may become fragmented if ‘only the holes are filled in’. For both the respondents and the interviewers, the questionnaire may appear as less comprehensible. The context effects and informing the respondents on the use of registers in advance, and possibly within the questionnaire, is therefore important for the interview process.
Generally, it is advisable to consider the use of register data at the level of topics/domains instead of individual variables. Attention should be paid to internal consistency of the data, within a topic area across the various sources of data. The selected respondent designs and extremely elaborated combined approaches may also introduce technical challenges to the questionnaire design and programming. The use of registers coupled with a concern for data integrity imply checks for unit and identification errors, alignments of units and variables, and hence more derived variables compared to a standard interview survey (where questions can just be asked according to a classification). This may imply increased workload and costs to the processing phase.
1.3.3.1 Replacing survey questions with register variables
Certain types of EU-SILC target variables can be replaced with register-based data, if timely, sufficiently valid and accurately measured register data are available without major gaps in population coverage. The replacement variables are to be defined in the design phase of a survey, and it is advisable to have at least one overlapping measurement from both interviews and registers before making ex-ante decision to replace questions with register variables. The register replacement variables should relate to persons, since register-based composite units may differ from the survey-based ones. They should have appropriate reference time, and cannot be subjective (e.g. personal health).
Replacing survey questions with register data on personal incomes(21) would bring immediate quality gains. Even then, some income data typically needs to be collected in the interview or estimated. Examples include inter household-transfers(22) tax-exempt income or other personal income data not found in registers; estimation is required for imputed rents and likely also for employers’ social contributions. Within different types of income, there seems to be more scope for directly using register data on regular items, such as pensions and wages and salaries, possibly because these may originate from electronic exchange of data to the register authority, for instance from employer to tax authority. In contrast, self-employment or property income may be more vulnerable to various types of validity, coverage and measurement errors.
The basic personal demographic variables (e.g. year of birth, country of birth, sex, citizenship, legal marital status) often are available from registers or from the sampling frame. Some of them nevertheless may have to be asked for record linkage purposes in the first wave interview. Education and labour variables also fall into this category, but validity of administrative concepts, coverage, timeliness, and the need to have them in the survey as filter questions may restrict their usability. Variables related to families, fiscal units, register-
(21) Some income types may be related to a household (e.g. housing benefits) or tax units, but available at personal level in the registers (registered to one of the household members or many of them). Depending on the case, one needs to consider potential unit errors and transformations. For instance, self-employment incomes may be registered for a tax unit or a household, but would need to be split to personal incomes for EU-SILC (target variable PY050G).
(22) Inter-household transfers usually are important for low-income households, e.g. elderly, students, and single parents. Partial data may be available for example on (compulsory) alimonies, but probably not on regular cash support from other households.
1 Combining sample surveys and registers - an overwiew in the context of EU-SILC
The use of registers in the context of EU-SILC: challenges and opportunities 28
based households or other composite units cannot directly substitute survey variables. They depend on the composition of the unit, and while the linkage may be feasible, direct substitution would lead to unit error that may need to be resolved. This would be most relevant for derived variables, such as the type of register-based households.
As a specific type of composite unit, various EU-SILC housing variables are attributes of a dwelling, which may be available from the registers (e.g. number of rooms). Such data could be used, but attention should be paid to potential identification and measurement errors and increased processing costs. Moreover, the basic attributes such as housing tenure status and dwelling type are likely to be needed as filter variables in the survey in any case (e.g. to ask about housing costs or problems with the dwelling). It also may occur that some members of a survey household are registered into different dwellings/addresses, with different attributes and with no guarantee that the registered dwelling is the correct one (e.g. due to administrative delay).
In general, electronic questionnaires have filter questions that are used to skip questions or questions blocks, or to route questions only to some sub-populations. In domains other than income, it may be more cost-effective to use the filter variables as statistical variables even when near-equivalent register variables would be available. Replacing essential filtering variables in the survey with register data potentially leads to internal consistency problems and generates costs in terms of further consistency checks and editing. This holds also for the personal variables and not only the housing and other composite unit variables. For instance, to ask about the reasons for part-time work (PL120), one first needs to ask questions on labour status for questionnaire routing. Likewise, while the target is to know about enforced lack of car, this implies asking about ownership of car (HS110), which in itself could be available from a register.
1.3.3.2 Combining survey questions and register variables
A common strategy is partial use of register data as a statistical variable, to overcome coverage or linkage problems or other shortcomings in register data quality. This may lead to using both register and interview data for a given variable. The result of combining both survey responses and obtained measures from registers is an adjusted measure, as discussed earlier. Some of the observed differences in an adjusted variable may reflect a mixed mode effect, if the register-based measurement differs significantly from the survey-based measurement.
One option, which is mainly useful in improving data quality, is to measure the variable both from interviews and from registers for all units. A decision rule is constructed to determine which source is more reliable for each observation in the sample. Either a more reliable source is used for each case, or the values from a single source are adjusted. Either by assumption or with the help of register data, it may be feasible to estimate the extent of measurement error for each unit in order to adjust for survey under -reporting (but not for non-reporting).
As an example of this kind of strategy, the Italian Statistical Office (ISTAT) has matched self-employment incomes, pensions and employment income to the EU-SILC sample (Donatiello et al., 2012). On self-employment income, both interviews and registers seem to miss substantial amount of information, so using information from both sources may reduce the amount of missing data due register under-coverage as well as item non-response in the survey (Di Marco, 2007). In the 2004 dataset, the combined strategy increased the number of recipients by 15.6 % and the average self-employment income by 11.9 % (Donatiello et al., 2012). In contrast, the administrative data on pensions is seen to be more accurate than survey data, and survey data on pensions are used only when the sample units cannot be matched to the registers. For employment income, the administrative data is seen as more accurate provided that the employee does not receive tax-exempt income or work in certain sectors prone to hidden economy. (Donatiello et al., 2012)
Another variant is to measure a variable either from interviews or from registers. If there is a priori knowledge about the coverage error of units in the registers, the questionnaire may be designed to collect data only from such units. This reduces respondent burden, and in this way may bring significant benefits. As an example, Méndez (2011) outlines the strategy in Spain wherein e.g. capital incomes questions are filtered to be only asked for the Basque Country households, because it is a priori known that these are not covered in the registers.
Combining sample surveys and registers - an overwiew in the context of EU-SILC 1
29 The use of registers in the context of EU-SILC: challenges and opportunities
One way to improve data quality and reduce respondent burden is to pre-feed register data to the electronic questionnaire. For instance, information from the sampling frame may be fed into the questionnaire, to be confirmed or corrected in the interview, or to be used for the routing of the questionnaire. This is similar to how data from previous waves are fed forward for dependent interviewing in rotating panel settings. The most common example is pre-filling the register-based household members from the sampling frame to the electronic questionnaire, and verifying household membership and personal details in the interview. This is the practise in EU-SILC for instance in Spain (Mendez, 2013) and Finland. As a less common example, register data can be pre-filled to correct for a priori known register under-coverage. For instance, up-to-date data on immigration status or highest education level could be pre-filled, and questions then asked only from the persons who have no data in the register. Such practise may also be useful for validation of register quality.
1.3.4 Further design and processing considerations
1.3.4.1 Reference times
A basic step in data integration of various data sources is harmonisation of reference times to ensure that the variables refer to the same period or the same time point. A complicating factor is that the EU-SILC target variables have many different reference periods: at selection, constant, current, previous week, four previous weeks, usual week around the interview, income reference period, last twelve months, since last year, and working life. The registers, in principle, can have information related to ‘at selection’ from the frame, ‘constant’ as a fixed point in time such as end-of year, and ‘income reference period’. Period data may be available in the registers (e.g. start and end dates of employment or unemployment) and allow construction of different reference periods, but this is could require much further processing and the registers may have inconsistencies with each other.
If strictly followed, the SILC target variables defined in the guidelines to have moving reference periods can only be collected in the interviews. Moving reference periods are related to the time of the interview, and include for instance ‘current’ and ‘previous week’. Extended reference times are likely to be difficult to construct from registers. An example of such a variable is PL200 number of years spent in paid work, which has a reference time ‘working life’.
An option is also to define current as end of the year situation, and set the fieldwork period early in the year(23)
to reduce the negative effect of retrospective questioning. For instance, if the fieldwork is in the early part of the year, the household composition can be inquired in the interview and possibly other demographic/labour/housing variables can be fixed to the end of the year situation, if information on these topics is also available from registers. In general, harmonizing the survey reference times in the questionnaire to the available register information would improve checking, editing, and finally internal consistency of the data(24).
1.3.4.2 Sampling
If sampling frame is a population register, accessible sets of register sources can be record linked to the frame before drawing the sample to enhance the design. For instance, tax income data can be record linked to population data to stratify the sample, or improve the selection of substitutes (although substitutes are not recommended for EU-SILC)(25). Moreover, the registers can be used to pre-test different sampling schemes: register-based proxies of the target variables can be constructed for the whole population, and repeated samples drawn to evaluate bias and variance of the estimates in alternative designs.
Depending on the available frames, costs and other considerations, sampling can be done in more than one stage. In the EU-SILC context, sampling of individuals and avoidance of personal interviews makes
(23) This would also improve timeliness of the survey.
(24) The lag between the current survey-based variables and the income reference period already has been recognised as a problem in EU-SILC, even when both data are collected in interviews. With the use of registers, the mixture of current (such as subjective well-being), other non-income and income variables may complicate the internal consistency problems of the data even further.
(25) Substitutions can be viewed as a form of imputation, and the results benefit depend on the availability of detailed register data in the sampling frame. Optimally, the replacement units can be selected so that they are very similar to originally selected units (e.g. from the same block of flats, income group and age class).
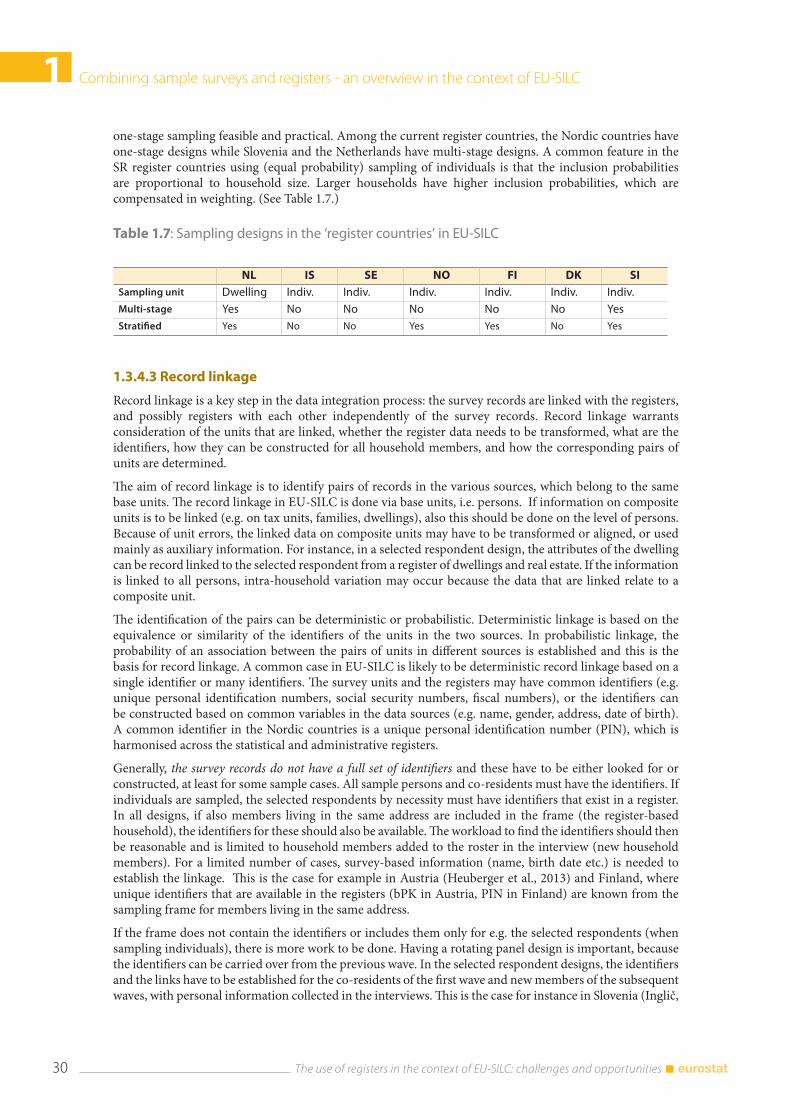
1 Combining sample surveys and registers - an overwiew in the context of EU-SILC
The use of registers in the context of EU-SILC: challenges and opportunities 30
one-stage sampling feasible and practical. Among the current register countries, the Nordic countries have one-stage designs while Slovenia and the Netherlands have multi-stage designs. A common feature in the SR register countries using (equal probability) sampling of individuals is that the inclusion probabilities are proportional to household size. Larger households have higher inclusion probabilities, which are compensated in weighting. (See Table 1.7.)
Table 1.7: Sampling designs in the ‘register countries’ in EU-SILC
NL IS SE NO FI DK SISampling unit Dwelling Indiv. Indiv. Indiv. Indiv. Indiv. Indiv.Multi-stage Yes No No No No No YesStratified Yes No No Yes Yes No Yes
1.3.4.3 Record linkage
Record linkage is a key step in the data integration process: the survey records are linked with the registers, and possibly registers with each other independently of the survey records. Record linkage warrants consideration of the units that are linked, whether the register data needs to be transformed, what are the identifiers, how they can be constructed for all household members, and how the corresponding pairs of units are determined.
The aim of record linkage is to identify pairs of records in the various sources, which belong to the same base units. The record linkage in EU-SILC is done via base units, i.e. persons. If information on composite units is to be linked (e.g. on tax units, families, dwellings), also this should be done on the level of persons. Because of unit errors, the linked data on composite units may have to be transformed or aligned, or used mainly as auxiliary information. For instance, in a selected respondent design, the attributes of the dwelling can be record linked to the selected respondent from a register of dwellings and real estate. If the information is linked to all persons, intra-household variation may occur because the data that are linked relate to a composite unit.
The identification of the pairs can be deterministic or probabilistic. Deterministic linkage is based on the equivalence or similarity of the identifiers of the units in the two sources. In probabilistic linkage, the probability of an association between the pairs of units in different sources is established and this is the basis for record linkage. A common case in EU-SILC is likely to be deterministic record linkage based on a single identifier or many identifiers. The survey units and the registers may have common identifiers (e.g. unique personal identification numbers, social security numbers, fiscal numbers), or the identifiers can be constructed based on common variables in the data sources (e.g. name, gender, address, date of birth). A common identifier in the Nordic countries is a unique personal identification number (PIN), which is harmonised across the statistical and administrative registers.
Generally, the survey records do not have a full set of identifiers and these have to be either looked for or constructed, at least for some sample cases. All sample persons and co-residents must have the identifiers. If individuals are sampled, the selected respondents by necessity must have identifiers that exist in a register. In all designs, if also members living in the same address are included in the frame (the register-based household), the identifiers for these should also be available. The workload to find the identifiers should then be reasonable and is limited to household members added to the roster in the interview (new household members). For a limited number of cases, survey-based information (name, birth date etc.) is needed to establish the linkage. This is the case for example in Austria (Heuberger et al., 2013) and Finland, where unique identifiers that are available in the registers (bPK in Austria, PIN in Finland) are known from the sampling frame for members living in the same address.
If the frame does not contain the identifiers or includes them only for e.g. the selected respondents (when sampling individuals), there is more work to be done. Having a rotating panel design is important, because the identifiers can be carried over from the previous wave. In the selected respondent designs, the identifiers and the links have to be established for the co-residents of the first wave and new members of the subsequent waves, with personal information collected in the interviews. This is the case for instance in Slovenia (Inglič,
Combining sample surveys and registers - an overwiew in the context of EU-SILC 1
31 The use of registers in the context of EU-SILC: challenges and opportunities
2013). If nothing is known about the household members prior to fieldwork, the identifiers and the links may have to be established for all the persons in the first wave and new members of the subsequent waves.
Ideally, for each employed person a business identity code or other unique identifier of the employer is established, for record linkage to a statistical business register. The linkage of employees to employers could be useful for instance for finding industry (NACE) or labour-related data from the register. The linkage of EU-SILC to enterprise data is prone to unit and identification errors; for instance, the NACE code should be that of a local unit and relate to the current main job held by a person or a selected respondent.
1.3.4.4 Non-response, estimation and quality assessments
Income is at the very core of EU-SILC, and interview-based income data typically suffer from item non-response. In EU-SILC, it needs to be dealt with single imputation to allow complete case analysis of the data. Countries with no or only limited access to register-based income data have to devote quite some effort to imputation of non-response(26). In the current register countries, income data have (supposedly) no such non-reporting or non-declaration issues, which would require imputations. Consequently, the great benefit of using register-based income data is the reduced need for imputations.
Moreover, the survey-based income data may be reported, partially or completely, net of taxes and social contributions. Since the income data should be recorded gross in EU-SILC even when collected net, a net-to-gross conversion of income data may be necessary. The register-based income data, at least in the current register countries, typically are recorded gross of taxes and social contributions. As a further benefit, the net-to-gross conversions are also avoided, along with the associated measurement errors and processing costs.
The survey results are generalised from the sample to the population using weights, which are adjusted inverses of inclusion probabilities. The countries that use the selected respondent design must construct special selected respondent weights to generalise the results to the population level. This selected respondent weighting only slightly increase the burden for the producers, since the selected respondent weights are typically a function of the original weight and the number of 16+ members in the household.
The availability of record linked register data improves quality of unit non-response analysis and the weight adjustments, but may require more emphasis on the methodological issues related to these as well as to variance estimation methods. The register data are very useful in non-response adjustments(27), because the register variables are available for both the respondents and the non-respondents to study non-response and the possible non-response bias. Otherwise, non-response analyses and adjustments would need to resort to information available prior to the interviews (frame, panel), paradata collected in the interviews, or meso-information such as micro-geographic data.
Registers also provide a wide pool of auxiliary information for further adjustments of the sampling weights, in order to improve accuracy of the estimates (bias and precision). The weights are usually modified to reproduce exactly certain population marginal distributions, i.e. they are post-stratified or calibrated to margins using auxiliary information (see e.g. Särndal, 2007). The calibration variables need to be highly correlated with the survey target variables and available for the responding sample base units. Moreover, they have to be strictly comparable to the distributions or totals available from the external sources. This is the case when calibration variables are record linked from a register-based weighting frame, and the corresponding population totals are computed from that frame (e.g. tax register). In order to avoid unit error, the calibration variables and the corresponding external distributions need to be defined at personal level.
Calibration to register data improves coherence and consistency of the estimates with other statistics, including surveys, register-based statistics and possibly National Accounts. Basic demographic distributions, e.g. distribution of population by age and sex, are commonly used as calibration variables in the surveys.
(26) Imputations are still likely to be needed in the register countries as well, for example for missing data in factual questions such as housing costs. A further benefit of registers is that the imputation models may be improved by using auxiliary information in real donor (hot deck) or model-based imputations (regression), and also in deductive imputations. For example, the unit or sub-unit (within household) non-response of occupations (typically resulting from uninformed and/or proxy answers) may be imputed with register variables on occupation, labour, education, and income.
(27) Corresponding to non-response, in the registers the accessed set may further reduce to observed set in the validation of registers, for instance due to implausible information, redundant information (e.g. duplicates) or missing information (e.g. identifiers are missing or incorrect). This magnitude of this error source is negligible compared to the level of survey non-response and the likely non-response bias.
1 Combining sample surveys and registers - an overwiew in the context of EU-SILC
The use of registers in the context of EU-SILC: challenges and opportunities 32
Within the current register-countries, some use elaborated calibration models with register-based proxies of the variables to be estimated, such as distributions of equivalised incomes in deciles or poverty rates (Netherlands, Denmark), or otherwise extensive sets of auxiliary information (Finland, Slovenia). Yet some countries do not seem to calibrate at all (Sweden) or only to a limited extent (Iceland), at least according to the quality reports. In a cross-national context, however, the variation in the amount of auxiliary information may not be very important (Perez-Duarte et al., 2010).
While depending on the indicator and the correlation between survey target variables and calibration variables, the expectation is that calibration reduces standard errors. This implies benefits in terms of improved accuracy of the estimates for given sample sizes, or through reduction in the required sample sizes for pre-specified levels of accuracy. The variance estimation method should therefore include the effect of calibration of the weights, in addition to clustering, stratification and unequal weighting.
At country level, record linked data provides much scope for quality assessment and validation studies. In a routine statistical production process, a useful approach is to compare the sample estimates with the corresponding population parameters, as these are known for the record linked variables. For instance, even in the absence of measurement errors, comparisons of e.g. recipient of social benefits to external data are worthwhile as they may reveal errors of estimation. Microsimulation may be a useful technique in validation of survey and administrative data as well; see for instance Donatiello et al. (2012), Liégeois et al. (2011) or Leventi et al. (2013)(28).
The EU-SILC flag variables, which provide metadata for each data variable, now do not carry information on the source or the mode of collection. It would be vital to have this fundamental information included in the EU-SILC flags. This is also important for the survey-based variables, since the proxy rates may vary by variable in the ‘selected respondent’ countries. In addition, the metadata should systematically collect data on how many record linkages failed and how this was dealt with (e.g. with imputations).
1.4 Summary and conclusionsWe have noted that access to registers influences the design and production of household sample surveys in several ways. The main benefits stem from replacing survey questions with register data. This implies shorter questionnaires and lower data collection costs, reduced response burden, and often better measurement of quantitative variables, in particular of income data. There is less need for imputations as well, and in EU-SILC, the net-to-gross conversion of income data can be avoided. Sampling designs, non-response analysis and weight adjustments using auxiliary data can be improved on. Moreover, there is much more scope for data validation and quality control. There are also more indirect benefits -- for instance, the lower response burden may lead to higher response rates.
There may also be challenges and negative influences. These include validity errors, reduced control and flexibility over data contents, problems in obtaining the respondent consent, a possible increase in proxy answers, constraints of telephone interviews, fragmentation of questionnaires, and possible mixed and multiple mode effects. Further errors and/or need to data editing may result from adaptation of the survey questionnaire, record linkage and especially record linkage failure. More production time also needs to be devoted to consolidating different data sources and resolving conflicts (micro-integration). The register-based datasets tend to carry a higher disclosure risk, which needs to be monitored. Timeliness may be one of the most important challenges, since registers imply some delays related to late availability and processing of administrative data.
The ‘selected respondent’ (SR) design of EU-SILC was tailored for the register countries in the transition from the European Community Household Panel (ECHP) to EU-SILC. Although the minimum effective sample size is defined to be larger in the SR design, it reduces respondent burden and cuts costs because not all household members need to be interviewed and cheaper modes of collection are quite feasible (telephone or web interviews). The limits of telephone interviews and data collection from a proxy, in particular, may
(28) Leventi et al. (2013) use microsimulation methods to examine the distributional implications of tax evasion in Greece. That paper was presented at the Net-SILC2 technical workshop in Vienna in December 2012 and is available as a Euromod working paper (see list of references).
Combining sample surveys and registers - an overwiew in the context of EU-SILC 1
33 The use of registers in the context of EU-SILC: challenges and opportunities
restrict the type of data to be collected. For instance, reliable data on cognitively burdening and/or sensitive issues (e.g. wealth, event history) are extremely difficult to collect in a telephone and/or from a proxy. Beyond the selected respondent design, the standard EU-SILC rotational panel design facilitates record linkage because a large fraction of the identifiers is available from the previous wave.
Many countries now have access at least to a sub-set of income data from registers. In the short-run, the greatest potential gains may stem from replacing survey questions on social benefits and employment income with valid register data in as many EU-SILC countries as possible. It should be noted that some of the ‘old’ register countries are increasingly producing income inequality and income poverty indicators from entirely register-based sources. This may limit, in such countries, the role of EU-SILC to be the source for multidimensional, cross-nationally comparable indicators, rather than being the national reference source for income-related indicators.
However, it is likely that many EU-SILC countries need for the foreseeable future to rely mostly on survey-based income data. The main obstacles to increasingly relying on register data are mostly related to national legal barriers, governance and register infrastructures, and timeliness, rather than the more technical issues, such as record linkage. Timely estimates of inequality and poverty are in high demand, and there is a trade-off between timeliness and the use of administrative data in EU-SILC.
The research findings suggest that the differential use of registers may affect comparability across countries, while country-case studies tend to show that the transition to register income data may affect within-country comparability across time. In spite of this, both for cost and quality reasons, the way forward is to increase utilisation of registers in EU-SILC rather than turning to input-harmonised survey implementations. Data integration should, in particular, pay attention to the internal consistency of the data, because EU-SILC is used both as a descriptive and analytical data source, with a focus on joint distributions and interdependencies across its many dimensions.
1.5 ReferencesBakker, Bart. F.M. (2011), Micro-Integration: State of the art. In Report on WP1 State of the art on statistical methodologies for data integration. ESSnet on Data Integration.
Di Marco, Marco (2007), ‘Self-employment Incomes in the Italian EU-SILC: Measurement and International Comparability’, in Proceedings of the EU-SILC Conference on Comparative EU Statistics on Income and Living Conditions: Issues and Challenges. Eurostat.
Donatiello, Gabriella, Betti, Gianni and Consolini, Paolo (2012), The Construction of Gross Income Variables of EU-SILC (EU Statistics on Income and Living Conditions) in Italy: A Mixed Strategy Using Microsimulation and Administrative Data. Quaderni Del Dipartimento Di Economia Politica e Statistica No. 652. Universita Degli Studi di Siena.
Epland, J. and Kirkeberg, M. I. (2002), Comparing Norwegian income data in administrative registers with income data in the Survey of Living Condition. Paper presented at the International Conference on Improving Surveys (ICIS), Copenhagen, Denmark.
Eurostat (2010), EU-SILC Document 065, Description of target variables: Cross-sectional and Longitudinal. 2010 operation. Dated February 2010.
Helgeson, Thomas (2013), EU-SILC and registers in the Nordic countries: how administrative data is used for EU-SILC in Denmark, Finland, Iceland, Norway and Sweden. Chapter 5 in this volume.
Heuberger, Richard, Glaser, Thomas and Kafka, Elisabeth (2013), The use of register data in the Austrian EU-SILC survey. Chapter 10 in this volume.
Huynen, Bart, Otten, Ferdy and van der Houwen, Karolijne (2013), EU-SILC and the use of registers in the Netherlands. Chapter 7 in this volume.
Inglič, Rihard (2013), EU-SILC and registers in Slovenia. Chapter 6 in this volume.
1 Combining sample surveys and registers - an overwiew in the context of EU-SILC
The use of registers in the context of EU-SILC: challenges and opportunities 34
Leulescu, A., and Agafitei, M. (2012), A quality framework for matching EU social surveys. Paper presented at the European Conference on Quality in Official Statistics - Q2012, Athens, Greece, 29 May - 1 June 2012.
Liégeois, Philippe, Berger, Frédéric, Islam, Nizamul and Wagener, Raymond (2011), ‘Cross-validating administrative and survey datasets through microsimulation’. International Journal of Microsimulation 2011 4(1) 54-71.
Leventi, Chrysa, Matsaganis, Manos and Flevotomou, Maria (2013), Distributional implications of tax evasion and the crisis in Greece, EUROMOD Working paper, EM 17/13, ISER, University of Essex available at: https://www.iser.essex.ac.uk/publications/working-papers/euromod/em17-13.pdf.
Méndez, José Maria (2013), Reconciliation of income data from survey and from administrative sources. Chapter 11 in this volume.
Méndez, José Maria and Martín Pilar Vega Vicente (2011), Linking data from administrative records and the Living Conditions Survey. INE Working Papers, 01/2011.
Neri, Andrea and Zizza, Roberta (2010), Income Reporting Behaviour in the SHIW. Paper prepared for the 31st General Conference of the International Association for Research in Income and Wealth, St. Gallen, Switzerland, August 22-28 2010.
Nordberg, L. (2003), An Analysis of the Effects of Using Interview versus Register Data in Income Distribution Analysis Based on the Finnish ECHP-surveys in 1996 and 2000, Chintex Working Paper 15, Work Package 5, December 22 2003.
Pérez-Duarte, Sébastien, Sánchez-Muñoz, Carlos, Törmälehto, Veli-Matti (2010), Re-weighting to reduce unit non-response bias in household wealth surveys: a cross-country comparative perspective illustrated by a case study. Paper presented at the European Conference on Quality in Official Statistics, Helsinki, Finland, May 2010.
Pyy-Martikainen, Marjo & Rendtel Ulrich (2009), Measurement Errors in Retrospective Reports of Event Histories: A Validation Study with Finnish Register Data. Survey Research Methods 3(3), 139-155.
Sakshaug, Joseph W. and Kreuter, Frauke (2012), Assessing the Magnitude of Non-Consent Biases in Linked Survey and Administrative Data. Survey Research Methods, Vol. 6, No 2.
Skinner, Chris (2009), Statistical disclosure control for survey data. University of Southampton, Southampton Statistical Sciences Research Institute Working Papers M09/03.
Statistics Finland (2004), Use of Registers and Administrative Data Sources for Statistical Purposes: Best Practises of Statistics Finland. Statistics Finland, Helsinki.
Särndal, Carl-Erik (2007), The calibration approach in survey theory and practice. Survey Methodology, Vol. 33, No. 2, pp. 99-199.
United Nations (2007), Register-based statistics in the Nordic countries. Review of best practises with focus on population and social statistics. United Nations Economic Commission for Europe. New York and Geneva.
Wallgren, Anders & Wallgren Brit (2007), Register-based Statistics: Administrative Data for Statistical Purposes. Wiley.
Zhang, Li-Chun (2009), A unit-error theory for register-based household statistics. Discussion Papers No. 598, Statistics Norway, Statistical Methods and Standards.
Zhang, Li-Chun (2012), Topics of statistical theory for register-based statistics and data integration. Statistica Neerlandica Vol. 66, nr. 1, pp. 41-63.
Translating register data into statistics: Challenges for quality management 2
35 The use of registers in the context of EU-SILC: challenges and opportunities
2. Translating register data into statistics: Challenges for quality management
Bettina Knauth(1)
Abstract: For a variety of reasons, register data are gaining in importance for the production of statistics. This use of these new data sources results in specific challenges for quality management with respect to almost all dimensions of quality. It is argued that tackling these challenges successfully does not only require technical solutions, but also that we develop a strategic approach to the use of registers, an approach that aims at sustainable solutions in the long term, encompassing aspects of governance, data integration and confidence in statistical science.
2.1 BackgroundAlmost all Member States have been moving or are intending to move towards an increased use of register data for statistical purposes both as a substitution and as a complement to information previously collected by surveys. This move is taking place in almost all areas of statistics and has even reached the hitherto untouched bastion of the population and housing censuses. It is driven mainly by the need to reduce the cost of data collection, to reduce the burden on respondents and more generally to collect data only once and use it for multiple purposes afterwards. Register data are particularly well suited in those cases where the need for data is permanent, as the usage of register data requires initial investments that then pay off in the continuous use of the data source.
As soon as work with register data is started, the what I would call naïve enthusiasm about the new opportunities is in general followed by a recognition of the multiple challenges posed for quality management. Some of these challenges have a clear counterpart in the challenges that exist as regards the use of surveys for statistical purposes. They can be addressed with the same toolbox we have at our disposal for social surveys. Others, however, are challenges of a new nature that require new ways of dealing with them.
2.2 Inherent quality of registersThe first challenge usually tackled relates to the inherent quality of registers. Translated into statistical terminology, this mainly means addressing the accuracy of register data.
In several respects, the accuracy of register data can actually be considered as being higher than the accuracy of respective survey data. First and foremost, as register data usually has the character of complete enumeration of the respective target population, the accuracy concerns resulting from the use of sampling do no longer exist. Therefore, small areas, small subpopulations or small changes over time can be reported upon more accurately on the basis of register data than on the basis of survey data.
Secondly, and this is particularly relevant for social statistics, the information from registers is often less impacted by memory effects, in particular in the large majority of cases, in which the recording is done at the same time at which the event takes place (e.g. participation in a training course recorded in a register of education and training). Similarly, register data can be less impacted by social desirability, particularly whenever the recording is an automatic consequence of an event.
This theoretical supremacy of register data relating to the accuracy of the information is challenged in
(1) Bettina Knauth is head of unit responsible for ‘Social statistics — modernisation and coordination’ at Eurostat, European Commission. The European Commission bears no responsibility for the analyses and conclusions, which are solely those of the authors. E-mail address for correspondence: [email protected].
The use of registers in the context of EU-SILC: challenges and opportunities 36
2 Translating register data into statistics: Challenges for quality management
practice due to a number of factors that can reduce substantially the accuracy of the information. The most important limitations stem from coverage errors as regards the statistical units and recording errors as regards the attributes contained in the register.
It is known that the quality of recording of information as far as the register owner is concerned depends highly on the link of the information to the purpose of the register. For example, death registers are likely to identify the deceased correctly and consequently record correctly the age and sex of the person. Whether similar care is taken in recording other attributes of the deceased person that are not central to the administrative purpose of the register (such as their socio-economic status) has been doubted. This might result in erroneous information being registered as well as in information being missing for several or even many statistical units.
Similarly, the quality of the reporting of information by the respondents depends highly on the incentives for correct reporting. For some registers, respondents might even have incentives to misreport information to the authorities (e.g. underreporting of income with the purpose of tax evasion).
Another important limitation on the derivation of accurate statistics results from coverage errors concerning the target population. Such coverage errors include both over-coverage (most notably linked to lack of deletion of records that should no longer belong to the target population) as well as under-coverage (thresholds for inclusion or missing records). Again, the quality of the coverage is linked to the incentives for registration and deregistration. E.g., while there might be a high incentive to record unemployment (in order to gain access to unemployment benefits), there might be no incentive to record emigration.
In order to tackle these (and other) accuracy problems, registers have to be evaluated as to their suitability in principle. This has to be done critically, taking into account the underlying incentive structure, possible alternative sources and other elements. Once a register has been approved in principle, data editing procedures can be put in place that are similar to data editing approaches for raw survey material (e.g. with respect to item non response). It is the aim of these interventions to improve the accuracy of the register data itself. They can thus be considered as improving the inherent quality of the respective register.
2.3 Quality issues relating to the translation of register data into statisticsThe challenges for quality management relating to the translation of register data into statistics go far beyond the improvement of the inherent quality of registers. What is at stake is the relevance, coherence, comparability and timeliness of the resulting statistics. While accuracy concerns can often be addressed with our existing toolbox, challenges created by these other quality dimensions often require innovative answers.
As the contents of registers by their very nature reflects the underlying administrative purpose, even concepts with the same name can often differ between registers for different administrative purposes, which leads to incoherence of the respective data. Even worse, it might be that none of the concepts measured coincides with the target concepts for the resulting statistics. Translated into statistical terminology, this possible incoherence between the administrative concepts and the statistical concepts can be considered as a lack of relevance.
Similarly, as the legislation underlying the administrative register usually differs between countries and often also over time, the concepts measured also differ, even for registers that basically fulfil the same administrative purpose. For example, the definition of unemployment in unemployment registers is closely linked to the legislation regarding unemployment benefits, which differs considerably between countries and even within countries over time. Translated into statistical terminology, this implies a lack of comparability across time and space.
In most cases, register data are available in a timelier manner than survey data, as the administrative recording of an event takes place in real time (or nearly in real time). A clear example is demographic information, e.g. vital events (births, deaths, marriages, divorces). This continuous recording of flows means that up-to-date information is available at any moment and statistics can in principle be produced at any frequency and almost in real time.
Translating register data into statistics: Challenges for quality management 2
37 The use of registers in the context of EU-SILC: challenges and opportunities
There are, however, some notable exceptions to this rule: They concern registers that are only updated infrequently and/or with a considerable time lag to the event. The most notable example for this case is the case of tax registers, which constitute a crucial register for several statistical purposes, but which unfortunately are only updated with annual declarations and after a considerable time lag to the underlying event of receiving income. In these cases, the timeliness of the information is clearly impacted.
2.4 Possible approachesFinding appropriate answers to these challenges for quality management is demanding and even more so in an international context, where some of the possible solutions on national level do no longer hold. Taking registers seriously as a data source might well mean having to change our perspective more profoundly than simply applying our existing approaches to new raw material. Solutions are more likely to be found, if we develop a strategic approach to the use of registers, an approach that aims at sustainable solutions in the long term, encompassing aspects of governance, data integration and confidence in statistical science.
Developing governance models consistent with an increased reliance on registers as a data source does not only mean that statistical offices are increasingly asked to reuse existing information, but also that other parts of governments are asked to provide information that lends itself to such reuse. In practice, this means developing cooperation agreements between the producers of statistics and the register holders. Such agreements, which already exist in some countries, recognise the multi-purpose demands on registers both for their original administrative purpose as well as for statistical purposes. In their most ideal form, they provide statistical offices with the power to influence the concepts used and/or the speed for data treatment.
Such an approach, which would greatly facilitate the production of high-quality statistics based on registers, is not likely to provide a complete solution to the quality challenges in the short term. In many countries, it will require a more profound rethinking of efficiency of government services regarding the collection of information. Consequently, solutions cannot be expected in the short term, but are extremely promising for the long term.
A stronger reliance on data from administrative sources is also likely to result in a shift from a paradigm of statistics being based on one single source to a paradigm of statistics being based on integration of data from multiple data sources. Traditionally, there has been a close correspondence between an area of statistics and a single data source. Employment statistics are closely associated with labour force surveys, demographic statistics are closely associated with registers of vital events.
Given that registers usually only provide partial information in comparison to the statistical needs (both as regards their target population and as regards the range of characteristics to be measured), combining information from a variety of registers or combining information from registers with other information including statistical surveys, commercial data and results of our digital footprint becomes a necessity. This need has resulted in a range of developments in the area of data integration.
Whenever unique common unit identifiers (such as PINs) exist, integration can proceed in the form of micro-integration by linking the records identified as relating to the same unit. In many cases, however, such common unit identifiers do not exist and are likely to remain inexistent due to data protection concerns. For these cases several approaches towards probabilistic data linking have been created and attention is devoted to devising algorithms that reduce processing time. Attention should also be devoted to developing standards on minimum information to be recorded that would greatly facilitate probabilistic data integration, such as geocoding of place of residence.
While data integration is often used with the mere purpose of increasing the amount of information available, its role in quality management can be substantial. Approaches in several countries have shown how the theoretical redundancy (but often practical inconsistency) of information across data sources can be used to improve the accuracy of the resulting statistics. Similarly, relevance can be greatly improved by integrating information that sheds light on different dimensions of a concept. Information from registers and from statistical surveys can complement each other beneficially and it is likely that the increased usage of registers will lead to a new role for statistical surveys.
The use of registers in the context of EU-SILC: challenges and opportunities 38
2 Translating register data into statistics: Challenges for quality management
Real progress with data integration will only be achieved, if the issues at stake are not only considered as being of a technical nature. Technical concerns are often put forward to hide more profound concerns of the identity of the statisticians. As long as statisticians define themselves via the data source under their responsibility progress will remain limited. Also here, a shift of paradigm is needed towards an identity as domain specialists who draw on all sources of data at their disposal.
As data from a single register can be considered purely as raw material to be integrated with other data in order to be translated into statistics, register data can also be considered as raw material to be transformed by the use of approaches developed in statistical science. While the application of statistical science has become increasingly sophisticated for the data source ‘surveys’ (in particular in the field of sampling theory), similar developments for the data source ‘register’ are still in their infancy.
It seems that as soon as the data source is a register, we have a tendency to limit our knowledge of statistical science to the basic necessities linked to improving the accuracy of the data. This attitude is surprising, as a number of areas of statistical science can lend themselves to a broader application aiming at improving the quality of register-based statistics.
• Nowcasting techniques seem to constitute a promising tool for improving the timeliness of information from administrative data sources, as partial information from some registers could be combined with additional information from other registers or statistical surveys.
• More generally, model-based estimation techniques could constitute promising tools for addressing issues related to the relevance and comparability of information from registers.
The application of such techniques could address successfully a wide range of quality considerations relating to the transformation of register data into statistics. While the application of statistical techniques to the production of statistics at aggregate level is more straightforward, there seem to be first examples available that show the application of such techniques to the production of microdata sets.
Statistical science might even provide solutions for issues usually considered as issues of governance. In many countries data protection concerns limit considerably the usability of register data. In these cases, it could be considered whether data protection concerns could be reduced or even eliminated, if statistical offices would not get access to the administrative data for the entire population, but simply drawing a sample of the universe included in the register. Alternatively, standard techniques for protecting confidentiality in the dissemination process of statistical offices by applying perturbation techniques could find their place within the production process itself.
Given the importance of the challenges for quality management resulting from the increased need to translate register data into statistics, Eurostat is preparing a major project in this area. It is the main aim of this project to support Member States to realise the known benefits of an increased use of registers as a data source by developing common approaches to tackle the known shortcoming inherent in such an increased usage. In addition to developing common approaches to evaluating and documenting register quality, the challenges and opportunities resulting from the need to integrate information from multiple sources will constitute key elements of the project. It is currently being evaluated to what extent the project might also address governance, organisational and legislative issues. It is hoped that by pooling expertise and experience from a range of statistical offices, common solutions can be developed for the benefit of all. Additionally, research could play an important role in addressing the so far underdeveloped potential for an increased application of statistical techniques to administrative data sources.
Registers, timeliness and comparability: Experiences from EU-SILC 3
39 The use of registers in the context of EU-SILC: challenges and opportunities
3. Registers, timeliness and comparability: Experiences from EU-SILC
Emilio Di Meglio and Fabienne Montaigne(1)
Abstract: The EU Statistics on Income and Living Conditions (EU-SILC) instrument allows for flexibility regarding the data source. Given its advantages in terms of burden, cost and survey errors reduction, a broader use of registers is envisaged among countries implementing EU-SILC. Nevertheless, two quality dimensions should be carefully looked at when considering a move towards an increased use of registers, namely timeliness and comparability. This chapter focuses on these two aspects by examining the different national practices. Consequences related to data comparability across time and across countries on the income measurement in the Eurostat production database are also studied.
3.1 IntroductionThe Wiesbaden memorandum(2), adopted by the DGINS conference in September 2011, identified as a key area for development in the frame of social statistics the re-use of existing data and in particular administrative data. The increased use of administrative data is also one of the main elements of the Vision for European Statistics adopted by the European Commission in August 2009, and a fundamental part of the Vision implementation document endorsed by the European Statistical System Committee (ESSC) in 2010.
Member States need to reduce the cost of data collection and the burden on respondents and face growing demands from policy makers for comprehensive sets of data and indicators. The way forward is to use data, collected once, for multiple purposes. Administrative and statistical registers are well suited to fit this goal.
A large range of administrative data sources could serve for statistical purposes, i.e. for computing indicators and performing evidence-based analysis. In the domain of social statistics, the main administrative sources are population registers, tax registers, social security data and health and education records. However, the extent to which administrative data are used in practice varies considerably across Member States and across statistical domains, according to the different national legal, organisational and technical frameworks in place. The use of administrative data is often hindered not only by legislative barriers or availability, but also by quality constraints like comparability of concepts, coverage, timeliness and accuracy.
This chapter focuses on the use of administrative and statistical registers in the framework of the EU Statistics on Income and Living Conditions (EU-SILC). It looks at the different national practices, with an emphasis on timeliness and comparability aspects. The comparability dimension is analysed both across time, for Member States which moved towards an increased use of registers, and across countries, comparing the situation in those making use of administrative data with the situation in the others.
3.2 Flexibility in the use of registersThe EU-SILC instrument has not been designed according to a common questionnaire for all participating countries, what can be called input harmonised, but according to common variables or, in other words, according to an ex-ante output harmonisation. A key feature of EU-SILC is therefore the flexibility of implementation at national level.(1) The authors are at the Statistical Office of the European Commission (Eurostat). The European Commission bears no responsibility for the analyses and conclusions,
which are solely those of the authors. Email addresses for correspondence: [email protected] and [email protected].
(2) http://epp.eurostat.ec.europa.eu/portal/page/portal/pgp_ess/0_DOCS/de/DGINS2011_memorandum.pdf.
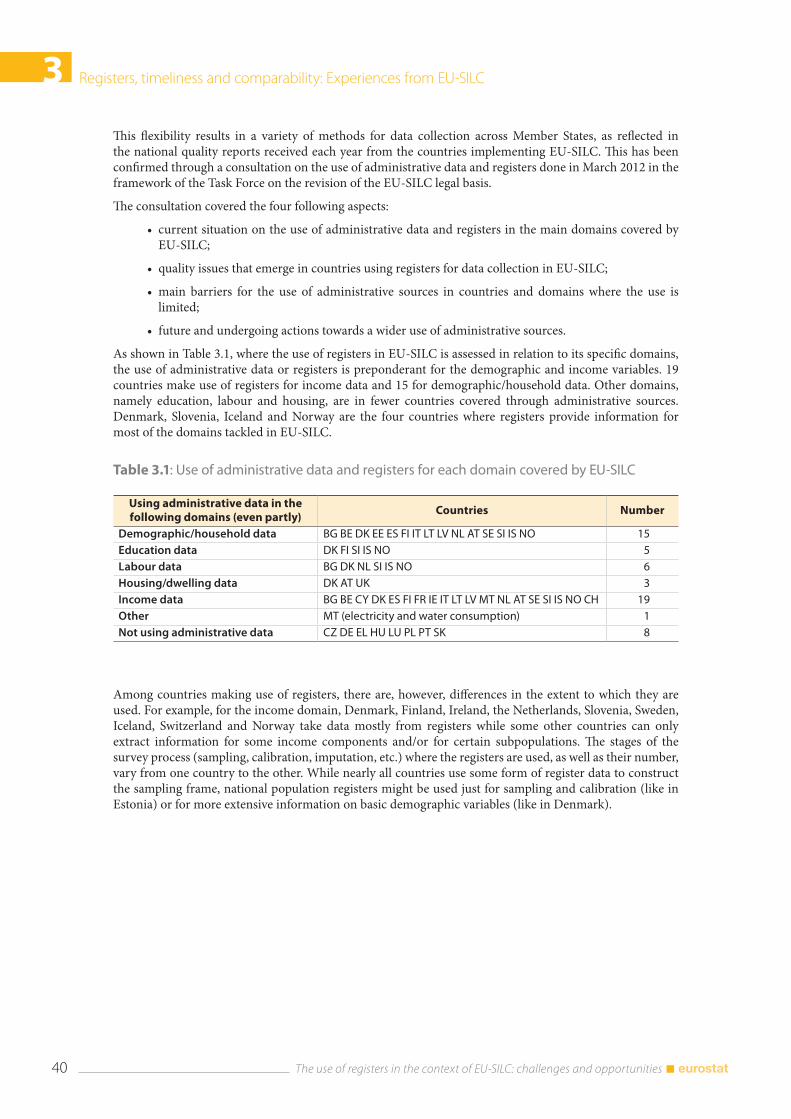
3 Registers, timeliness and comparability: Experiences from EU-SILC
The use of registers in the context of EU-SILC: challenges and opportunities 40
This flexibility results in a variety of methods for data collection across Member States, as reflected in the national quality reports received each year from the countries implementing EU-SILC. This has been confirmed through a consultation on the use of administrative data and registers done in March 2012 in the framework of the Task Force on the revision of the EU-SILC legal basis.
The consultation covered the four following aspects:
• current situation on the use of administrative data and registers in the main domains covered by EU-SILC;
• quality issues that emerge in countries using registers for data collection in EU-SILC;
• main barriers for the use of administrative sources in countries and domains where the use is limited;
• future and undergoing actions towards a wider use of administrative sources.
As shown in Table 3.1, where the use of registers in EU-SILC is assessed in relation to its specific domains, the use of administrative data or registers is preponderant for the demographic and income variables. 19 countries make use of registers for income data and 15 for demographic/household data. Other domains, namely education, labour and housing, are in fewer countries covered through administrative sources. Denmark, Slovenia, Iceland and Norway are the four countries where registers provide information for most of the domains tackled in EU-SILC.
Table 3.1: Use of administrative data and registers for each domain covered by EU-SILC
Using administrative data in the following domains (even partly)
Countries Number
Demographic/household data BG BE DK EE ES FI IT LT LV NL AT SE SI IS NO 15Education data DK FI SI IS NO 5Labour data BG DK NL SI IS NO 6Housing/dwelling data DK AT UK 3Income data BG BE CY DK ES FI FR IE IT LT LV MT NL AT SE SI IS NO CH 19Other MT (electricity and water consumption) 1Not using administrative data CZ DE EL HU LU PL PT SK 8
Among countries making use of registers, there are, however, differences in the extent to which they are used. For example, for the income domain, Denmark, Finland, Ireland, the Netherlands, Slovenia, Sweden, Iceland, Switzerland and Norway take data mostly from registers while some other countries can only extract information for some income components and/or for certain subpopulations. The stages of the survey process (sampling, calibration, imputation, etc.) where the registers are used, as well as their number, vary from one country to the other. While nearly all countries use some form of register data to construct the sampling frame, national population registers might be used just for sampling and calibration (like in Estonia) or for more extensive information on basic demographic variables (like in Denmark).
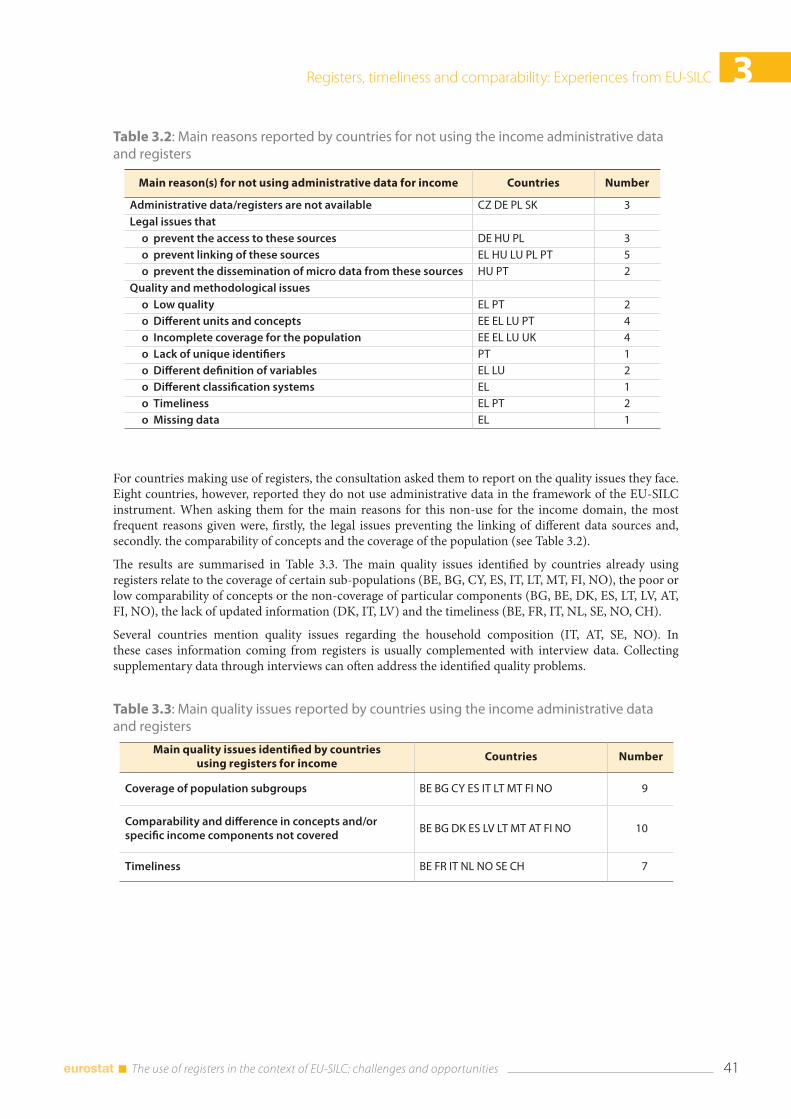
Registers, timeliness and comparability: Experiences from EU-SILC 3
41 The use of registers in the context of EU-SILC: challenges and opportunities
Table 3.2: Main reasons reported by countries for not using the income administrative data and registers
Main reason(s) for not using administrative data for income Countries Number
Administrative data/registers are not available CZ DE PL SK 3Legal issues that
o prevent the access to these sources DE HU PL 3o prevent linking of these sources EL HU LU PL PT 5o prevent the dissemination of micro data from these sources HU PT 2
Quality and methodological issues o Low quality EL PT 2o Different units and concepts EE EL LU PT 4o Incomplete coverage for the population EE EL LU UK 4o Lack of unique identifiers PT 1o Different definition of variables EL LU 2o Different classification systems EL 1o Timeliness EL PT 2o Missing data EL 1
For countries making use of registers, the consultation asked them to report on the quality issues they face. Eight countries, however, reported they do not use administrative data in the framework of the EU-SILC instrument. When asking them for the main reasons for this non-use for the income domain, the most frequent reasons given were, firstly, the legal issues preventing the linking of different data sources and, secondly. the comparability of concepts and the coverage of the population (see Table 3.2).
The results are summarised in Table 3.3. The main quality issues identified by countries already using registers relate to the coverage of certain sub-populations (BE, BG, CY, ES, IT, LT, MT, FI, NO), the poor or low comparability of concepts or the non-coverage of particular components (BG, BE, DK, ES, LT, LV, AT, FI, NO), the lack of updated information (DK, IT, LV) and the timeliness (BE, FR, IT, NL, SE, NO, CH).
Several countries mention quality issues regarding the household composition (IT, AT, SE, NO). In these cases information coming from registers is usually complemented with interview data. Collecting supplementary data through interviews can often address the identified quality problems.
Table 3.3: Main quality issues reported by countries using the income administrative data and registers
Main quality issues identified by countries using registers for income
Countries Number
Coverage of population subgroups BE BG CY ES IT LT MT FI NO 9
Comparability and difference in concepts and/or specific income components not covered
BE BG DK ES LV LT MT AT FI NO 10
Timeliness BE FR IT NL NO SE CH 7
3 Registers, timeliness and comparability: Experiences from EU-SILC
The use of registers in the context of EU-SILC: challenges and opportunities 42
The last part of the consultation concerns the areas where countries envisage a transition towards a wider use of administrative data. Some of the actions foreseen, mentioned in the consultation, address legal issues related to the access to register (EL, LV) or refer to the improvement of the quality like the use of registers in combination with interview data and micro-editing (FI for labour and education), and the use of census data (LV) or linkage procedures (PT, UK). In the case of timeliness, some countries mention on-going work to improve availability of register data (like NO).
Progressing with the measurement of income data from registers is the area where many countries have significant potential, both to improve data quality and to decrease data collection costs. The group of countries taking income information, nearly completely or partially, from registers is expanding. The situation is dynamic and twelve countries (BE, BG, EE, EL, ES, HU, IT, LV, MT, AT, PT, UK) are moving towards an increased use of registers for income measurement.
Indeed, the use of administrative sources increases data quality as allowing generally more complete, coherent and accurate measures, while decreasing the cost and the burden on respondents. Population registers ensure the correct identification and tracing of sample units and ease the tracking of household moves over the national territory. Tax registers helps to improve the quality of income components at the individual level via imputation of item non-response, as well as reduced under-reporting, memory and social desirability effects. The combined use of both kinds of registers (population and tax) eventually increases the quality of estimators and target income indicators.
Although there are undeniable advantages in terms of data and indicator quality from the use of registers and the combination of data from different sources, such uses are not without their problems. Some critical aspects mainly affect the timeliness and the comparability of released data. These two dimensions will be looked at in the two following sections.
3.3 TimelinessThe current economic crisis has generated a number of challenges for official statistics and particularly so for social statistics. Policy makers have turned to statistics to have the necessary toolbox to describe the current situation and patterns in a timely fashion in order to take informed, timely and effective policy measures. Timeliness has therefore become a key factor in the current debate in social statistics.
Currently, income data in EU-SILC are a few months out of date at the time when they are collected; by the time the data has been processed and indicators released, the income data is at least two years out of date. This has profound implications for the usefulness of the EU-SILC instrument for policy purposes, especially during times of rapid economic change.
On the other hand, there is a clear trade-off between accuracy and timeliness of income measures. Household incomes are difficult to measure with accuracy because income is a derived variable. Hence, it is important to identify and measure each component of income accurately to derive reliable estimates of income.
3.3.1 Constraints of administrative data
Administrative data and registers are a powerful source for collecting income data while keeping costs and response burden low. Several countries use these sources for some or all income components and for gathering other information. They have however two main drawbacks: timeliness and under-coverage of some income components (undeclared income is not registered).
The term “administrative data” refers to data that are primarily collected for the administration of a particular function, in our case usually tax and social security authorities. Their business process is therefore built around the primary function these data serve, in our case collecting taxes and paying social transfers. Statistics production is an ancillary function of these registers. Table 3.4 shows the availability of administrative data or registers in countries that use or plan to use such sources for income variables. Given the income reference year n-1, and the survey year n, the availability of administrative data / registers ranges from September n in Austria to August n+1 in the Netherlands.
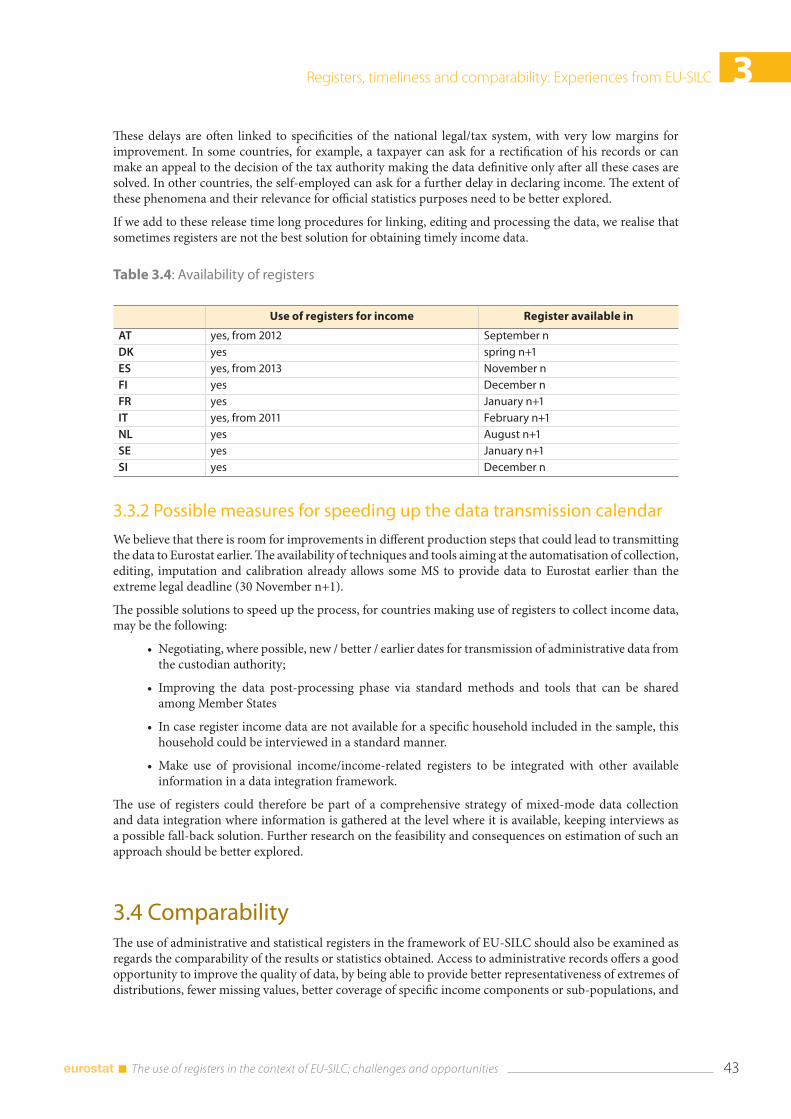
Registers, timeliness and comparability: Experiences from EU-SILC 3
43 The use of registers in the context of EU-SILC: challenges and opportunities
These delays are often linked to specificities of the national legal/tax system, with very low margins for improvement. In some countries, for example, a taxpayer can ask for a rectification of his records or can make an appeal to the decision of the tax authority making the data definitive only after all these cases are solved. In other countries, the self-employed can ask for a further delay in declaring income. The extent of these phenomena and their relevance for official statistics purposes need to be better explored.
If we add to these release time long procedures for linking, editing and processing the data, we realise that sometimes registers are not the best solution for obtaining timely income data.
Table 3.4: Availability of registers
Use of registers for income Register available in
AT yes, from 2012 September nDK yes spring n+1ES yes, from 2013 November nFI yes December nFR yes January n+1IT yes, from 2011 February n+1NL yes August n+1SE yes January n+1SI yes December n
3.3.2 Possible measures for speeding up the data transmission calendar
We believe that there is room for improvements in different production steps that could lead to transmitting the data to Eurostat earlier. The availability of techniques and tools aiming at the automatisation of collection, editing, imputation and calibration already allows some MS to provide data to Eurostat earlier than the extreme legal deadline (30 November n+1).
The possible solutions to speed up the process, for countries making use of registers to collect income data, may be the following:
• Negotiating, where possible, new / better / earlier dates for transmission of administrative data from the custodian authority;
• Improving the data post-processing phase via standard methods and tools that can be shared among Member States
• In case register income data are not available for a specific household included in the sample, this household could be interviewed in a standard manner.
• Make use of provisional income/income-related registers to be integrated with other available information in a data integration framework.
The use of registers could therefore be part of a comprehensive strategy of mixed-mode data collection and data integration where information is gathered at the level where it is available, keeping interviews as a possible fall-back solution. Further research on the feasibility and consequences on estimation of such an approach should be better explored.
3.4 ComparabilityThe use of administrative and statistical registers in the framework of EU-SILC should also be examined as regards the comparability of the results or statistics obtained. Access to administrative records offers a good opportunity to improve the quality of data, by being able to provide better representativeness of extremes of distributions, fewer missing values, better coverage of specific income components or sub-populations, and
3 Registers, timeliness and comparability: Experiences from EU-SILC
The use of registers in the context of EU-SILC: challenges and opportunities 44
greater coherence across sources. However, the comparability of statistics risks to be reduced considerably, whenever administrative concepts differ nationally among EU-SILC implementing countries. Comparability problems across time can also appear due to possible changes in administrative concepts. The process of combining surveys and registers is not straightforward, especially when a certain level of comparability across time and across countries is to be assured.
Several projects have focused on the provision of methodologies and best practices for the use of registers in the statistical production process in order to preserve comparability. Moreover, several studies documented the impact of the change of the source used (register versus survey) on the core indicators estimated using EU-SILC, namely on the level and distribution of income overall as well as for different sub-populations.
This section will first summarise the main conclusions of these studies and then present some additional findings at the European level coming from the analysis of the production database at Eurostat.
3.4.1. National experiences
As previously mentioned, the extent to which administrative data are used in the framework of EU-SILC varies considerably across countries and is broadening step by step. Nine countries currently collect income data mostly from registers: Denmark, Ireland, the Netherlands, Slovenia, Finland, Sweden, Iceland, Switzerland and Norway. Ten other countries use both interviews and registers for income measurement: Bulgaria, Belgium, Cyprus, Spain, France, Italy, Lithuania, Latvia, Malta and Austria. Some of these are only making a restrictive use of administrative data but most are moving towards a broader use. When envisaging an increased use of register data for the income domain, several countries issued a detailed study addressing important quality issues, in particular related to the differences between register and survey data for measuring income and their potential impact on the computation of EU-SILC poverty indicators.
The Italian Statistical Office (ISTAT) focused its work on the differences in the measurement of self-employment income, pensions and employment income. The results seem to indicate that on self-employment income both data sources (register and interviewing) miss a substantial amount of information. From a study(3) performed on the 2004 EU-SILC operation, it can been seen that 40.9 % of all percipients of self-employment incomes in the integrated dataset (combining both data sources) would have been ignored by using tax records exclusively, whilst 13.5 % do not reveal themselves as recipients of self-employment incomes in the survey. Combining information from registers and interviews may reduce the amount of missing data due both to under-coverage in the administrative data and to item non-response in the survey. With respect to the exclusive use of survey data, the linkage with tax records has increased the number of recipients by 15.6 % and average self-employment income by 11.9 %. A large number of elderly who report self-employment incomes in the tax data do not do so in the survey. The addition of the incomes of these elderly earners who are present solely in the tax data lowers the average self-employment income for this sub-group of individuals. The conclusion is that for self-employment income, both types of data sources should be combined in order to increase data quality.
Administrative data on pensions seem to be more accurate than survey data(4). As a consequence, survey data on pensions should only be used when the sample units cannot be matched or linked to the registers. For employment income, administrative data is seen as more accurate than survey data provided that the employee does not receive tax-exempt income or work in certain sectors prone to hidden economy.
In Spain, the Statistical Institute (INE) performed a comparative analysis of different income components between the administrative records and the EU-SILC variables obtained through interviews(5). Survey data are linked at micro-level using the Spanish Tax ID number (NIF) with data from the Tax Agency and from the Social Security system. Until the 2008 EU-SILC operation, the data collection process did not include
(3) http://www.iariw.org/papers/2006/Consolinidi.pdf Consolini P., Di Marco M., Ricci R. and Vitaletti S. (2006), ‘Administrative and Survey Microdata on Self-Employment: the Italian Experience with the EU-SILC project’, IARIW 29th General Conference, Joensuu, Finland, 20-26 August 2006.
(4) http://www.econ-pol.unisi.it/dipartimento/it/node/1699 Donatiello, Gabriella, Betti, Gianni and Consolini, Paolo (2012), “The Construction of Gross Income Variables of EU-SILC (EU Statistics on Income and Living Conditions) in Italy: A Mixed Strategy Using-Microsimulation and Administrative Data”,Quaderni Del Dipartimento Di Economia Politica e Statistica No. 652, Universita Degli Studi di Siena.
(5) http://www.ine.es/e/essnetdi_ws2011/ppts/Mendez.pdf.
Registers, timeliness and comparability: Experiences from EU-SILC 3
45 The use of registers in the context of EU-SILC: challenges and opportunities
the NIF. A list of households was used for data collection, to which a reference person was assigned. For this comparative analysis, data from the 2007 EU-SILC operation were used and the NIF was assigned afterwards. It was possible to obtain NIF for approximately 80 % of cases. These records were linked with Social Security data for social benefits and with data from the Tax Agency for different income components.
As for Italy, the results seem to indicate the need for a mixed methodology for measuring income, based on both survey and register information. Analysis showed indeed:
• An underreporting in the salary amounts from survey data for the formal economy and a slight underreporting in the salary amounts from the Tax Agency for the informal economy;
• A significant underreporting in the amounts of self-employment income from the Tax Agency;
• A significant underreporting in the amounts of investment income in the survey;
• Some underreporting in the amounts of social benefits recorded through interview.
Concerning EU-SILC target indicators, the use of administrative records does not appear to have a significant impact on indicators based on distribution of income. However, it does have an impact on indicators based on income level as it significantly increases their value.
In order to ease the record linkage at micro-level between survey and register information, the data collection has been adapted since the 2009 EU-SILC operation to make use of the municipal register of inhabitants, indicating the people registered in the household with their associated details, full name, date of birth and NIF. In this way, the NIF is available for approximately 98 % of adults. Starting from the 2013 operation, INE Spain plans to use registers in the production of income variables.
An impact study of the use of tax register for income data was also conducted by the Statistical Office in France (INSEE)(6). The conclusion is that the tax data are of satisfactory and homogeneous quality for the vast majority of the population. Tax registers can be used to correct errors in survey data, like confusion between euros and francs, confusion between annual and monthly income, errors in the number of zeros, reference documents not used, approximate answers, refusals, etc. However, some income components are not registered: those which are tax-exempted.
The use of tax register decreases interview time and burden on respondents. There is no need for interviewees to look for administrative documents. Administrative data give more reliable information on taxable income, especially on wages. For not totally taxable components, questions are still asked in the survey. Also the question on the type(s) of income received is kept in order to make the necessary adjustments, if needed.
The use of tax data has little impact on EU-SILC indicators at macro level. At the individual level, the impact can be very large but this occurs in only a few cases. The reason is generally survey error or a correct but extreme value. These cases can be followed with the longitudinal component. Smaller differences are more difficult to detect and to explain. 10 % of people are on the other side of the poverty line according to the used data source (survey or tax data). Those wash out at the aggregate level but a coherent follow-up needs to be done at individual level.
The Central Statistical Bureau of Latvia also analysed(7) the possibilities and the impact of the use of administrative data for EU-SILC income variables. In September 2007, according to the signed agreement, micro-data files were received for the first time from the State Social Insurance Agency (SSIA) regarding pensions and state social benefits paid (during 2005) to respondents of the EU-SILC 2006 operation. SSIA and EU-SILC micro-data were compared and discrepancies were discovered in both data sources. The main tendency is that in the EU-SILC survey, respondents overestimated the amount of pension received. The most realistic explanation could be that respondents indicated the current amount of old-age benefits which was higher at the time of interview instead of old-age benefits received in the income reference period (the previous calendar year). This tendency has an impact on the total disposable income (HY020) and the EU-SILC monetary indicators.
(6) http://jms.insee.fr/files/documents/2009/117_4-JMS2009_S19-4_DAUPHIN-ACTE.PDF.
(7) DonatiTechnical project report of Grant agreement No 36401.2006.007-2006.150 ‘EU-SILC: Net/gross/net conversion for income data in Latvia’.
3 Registers, timeliness and comparability: Experiences from EU-SILC
The use of registers in the context of EU-SILC: challenges and opportunities 46
Therefore, it was decided to substitute old-age benefit data collected in the EU-SILC survey with data from SSIA, even for earlier waves of the EU-SILC. Such a revision of the data was needed in order to provide comparable data across time for Latvia, given it was planned to use data from administrative registers (including data from SSIA) for the following EU-SILC operations. Almost all values of old-age benefits received by the respondents (except pensions not administrated by SSIA) were substituted backwards with records from SSIA, for 2005 to 2007 EU-SILC operations. For the 2008 operation onwards, only information about some minor benefits, which are administrated by local municipalities, or pensions paid by other countries and service pensions, which are not administrated by SSIA, is asked in questionnaires.
In addition to the SSIA register, CSB Latvia receives data on taxes from State Revenue Service (SRS). As SSIA delivers gross amounts, tax data are used for calculating the net amounts.
Based on the comparability study between the EU-SILC 2007 micro-data and the information coming from the SSIA and SRS registers, it was decided to take data on the net employee cash or near cash income (PY010N), which is available both from the SRS and the EU-SILC interviews. Gross employee cash or near cash income (PY010G) is obtained by counting up the net employee cash or near cash income (PY010N) obtained from questionnaires with taxes paid on income and social contributions from the SRS. Consequently, the decision was taken that some data from the SRS are used in EU-SILC. The net employee cash or near cash income (PY010N) is still asked in the questionnaire, from EU-SILC 2008 onwards. Information from SRS is used for the net/gross conversion. It is also taken for imputation purposes if the amount of the net employee cash or near cash income is missing in the questionnaire or in those cases when SRS information shows higher income than the one reported through interview.
As a concrete result, from the 2008 EU-SILC operation onwards, a big share of the income components is collected it was decided to use through administrative registers, and no longer through interviews.
3.4.2 What can be seen from the Eurostat production database
The previous subsection showed consistent evidence that flexible use of data sources may reduce intra-country overall measurement errors. Indeed, the Italian, Spanish, French and Latvian cases demonstrate the advantages of a mixed methodology for measuring income, based on both survey and register information.
When assessing the comparability of estimates based on both types of data sources, Italy, Spain and France concluded that administrative data give more reliable information on taxable income, especially on wages. Latvia, Spain and Italy reported more accurate data for pensions using administrative registers. Investment income is also seen as under-reported through interviews (Spain). But, there is significant underreporting in the amounts of self-employment income when using tax data. Italy combines for self-employment income both types of data sources in order to increase data quality.
For the monetary indicators, these Member States perceive only little impact at the macro level. There is an impact on income indicators, as the use in administrative data increases the value of these indicators. But, for the indicators based on the distribution of income, the impact does not appear to be large. Differences at the individual level compensate each other at aggregate level.
In addition to these national comparability studies, it will be interesting to analyse the transitions from survey to administrative data in a more global frame through cross-country and cross-time comparisons. Given that France and Latvia implemented their transition towards an extended use of administrative data between 2007 and 2009, the results obtained for these three EU-SILC operations using the Eurostat production database is looked at more in details.
First, the impact of the transition from interview to register data is analysed in terms of number of recipients, or more precisely in terms of weighted share of recipients (in order to take into account a varying sample size) for the main income components. Income recipients for a component are taken as those having a non-zero income, either positive or negative. What concerns employment income (PY010), an increasing share is observed in the two countries from 2007 to 2008 (see Table 3.5). For self-employment income (PY050) and pensions (PY100 and PY110), there is no major changes in one direction observed. France and Latvia record a slight decrease from 2007 to 2008, and then a slight increase from 2008 to 2009 for these two main income components. Changes in the property income (HY040 and HY090) are larger — the transition from interview to register data led to an increase in the share of recipients.
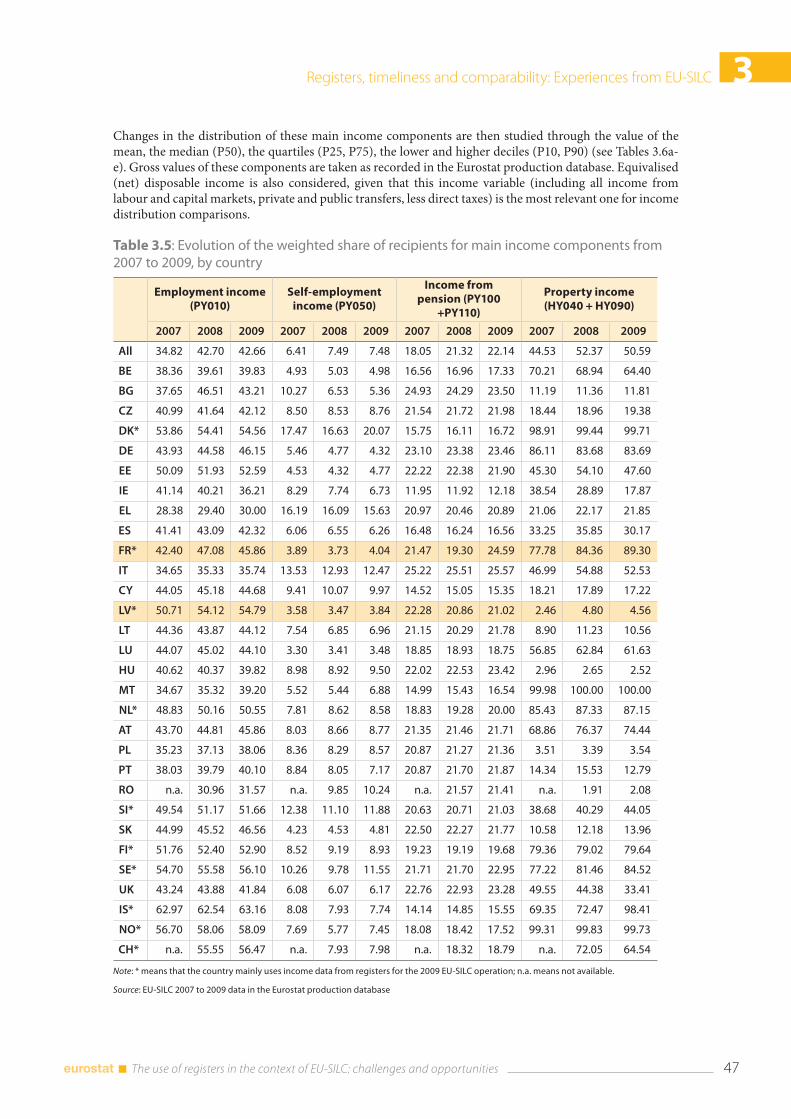
Registers, timeliness and comparability: Experiences from EU-SILC 3
47 The use of registers in the context of EU-SILC: challenges and opportunities
Changes in the distribution of these main income components are then studied through the value of the mean, the median (P50), the quartiles (P25, P75), the lower and higher deciles (P10, P90) (see Tables 3.6a-e). Gross values of these components are taken as recorded in the Eurostat production database. Equivalised (net) disposable income is also considered, given that this income variable (including all income from labour and capital markets, private and public transfers, less direct taxes) is the most relevant one for income distribution comparisons.
Table 3.5: Evolution of the weighted share of recipients for main income components from 2007 to 2009, by country
Employment income (PY010)
Self-employment income (PY050)
Income from pension (PY100
+PY110)
Property income (HY040 + HY090)
2007 2008 2009 2007 2008 2009 2007 2008 2009 2007 2008 2009
All 34.82 42.70 42.66 6.41 7.49 7.48 18.05 21.32 22.14 44.53 52.37 50.59
BE 38.36 39.61 39.83 4.93 5.03 4.98 16.56 16.96 17.33 70.21 68.94 64.40
BG 37.65 46.51 43.21 10.27 6.53 5.36 24.93 24.29 23.50 11.19 11.36 11.81
CZ 40.99 41.64 42.12 8.50 8.53 8.76 21.54 21.72 21.98 18.44 18.96 19.38
DK* 53.86 54.41 54.56 17.47 16.63 20.07 15.75 16.11 16.72 98.91 99.44 99.71
DE 43.93 44.58 46.15 5.46 4.77 4.32 23.10 23.38 23.46 86.11 83.68 83.69
EE 50.09 51.93 52.59 4.53 4.32 4.77 22.22 22.38 21.90 45.30 54.10 47.60
IE 41.14 40.21 36.21 8.29 7.74 6.73 11.95 11.92 12.18 38.54 28.89 17.87
EL 28.38 29.40 30.00 16.19 16.09 15.63 20.97 20.46 20.89 21.06 22.17 21.85
ES 41.41 43.09 42.32 6.06 6.55 6.26 16.48 16.24 16.56 33.25 35.85 30.17
FR* 42.40 47.08 45.86 3.89 3.73 4.04 21.47 19.30 24.59 77.78 84.36 89.30
IT 34.65 35.33 35.74 13.53 12.93 12.47 25.22 25.51 25.57 46.99 54.88 52.53
CY 44.05 45.18 44.68 9.41 10.07 9.97 14.52 15.05 15.35 18.21 17.89 17.22
LV* 50.71 54.12 54.79 3.58 3.47 3.84 22.28 20.86 21.02 2.46 4.80 4.56
LT 44.36 43.87 44.12 7.54 6.85 6.96 21.15 20.29 21.78 8.90 11.23 10.56
LU 44.07 45.02 44.10 3.30 3.41 3.48 18.85 18.93 18.75 56.85 62.84 61.63
HU 40.62 40.37 39.82 8.98 8.92 9.50 22.02 22.53 23.42 2.96 2.65 2.52
MT 34.67 35.32 39.20 5.52 5.44 6.88 14.99 15.43 16.54 99.98 100.00 100.00
NL* 48.83 50.16 50.55 7.81 8.62 8.58 18.83 19.28 20.00 85.43 87.33 87.15
AT 43.70 44.81 45.86 8.03 8.66 8.77 21.35 21.46 21.71 68.86 76.37 74.44
PL 35.23 37.13 38.06 8.36 8.29 8.57 20.87 21.27 21.36 3.51 3.39 3.54
PT 38.03 39.79 40.10 8.84 8.05 7.17 20.87 21.70 21.87 14.34 15.53 12.79
RO n.a. 30.96 31.57 n.a. 9.85 10.24 n.a. 21.57 21.41 n.a. 1.91 2.08
SI* 49.54 51.17 51.66 12.38 11.10 11.88 20.63 20.71 21.03 38.68 40.29 44.05
SK 44.99 45.52 46.56 4.23 4.53 4.81 22.50 22.27 21.77 10.58 12.18 13.96
FI* 51.76 52.40 52.90 8.52 9.19 8.93 19.23 19.19 19.68 79.36 79.02 79.64
SE* 54.70 55.58 56.10 10.26 9.78 11.55 21.71 21.70 22.95 77.22 81.46 84.52
UK 43.24 43.88 41.84 6.08 6.07 6.17 22.76 22.93 23.28 49.55 44.38 33.41
IS* 62.97 62.54 63.16 8.08 7.93 7.74 14.14 14.85 15.55 69.35 72.47 98.41
NO* 56.70 58.06 58.09 7.69 5.77 7.45 18.08 18.42 17.52 99.31 99.83 99.73
CH* n.a. 55.55 56.47 n.a. 7.93 7.98 n.a. 18.32 18.79 n.a. 72.05 64.54
Note: * means that the country mainly uses income data from registers for the 2009 EU-SILC operation; n.a. means not available.
Source: EU-SILC 2007 to 2009 data in the Eurostat production database
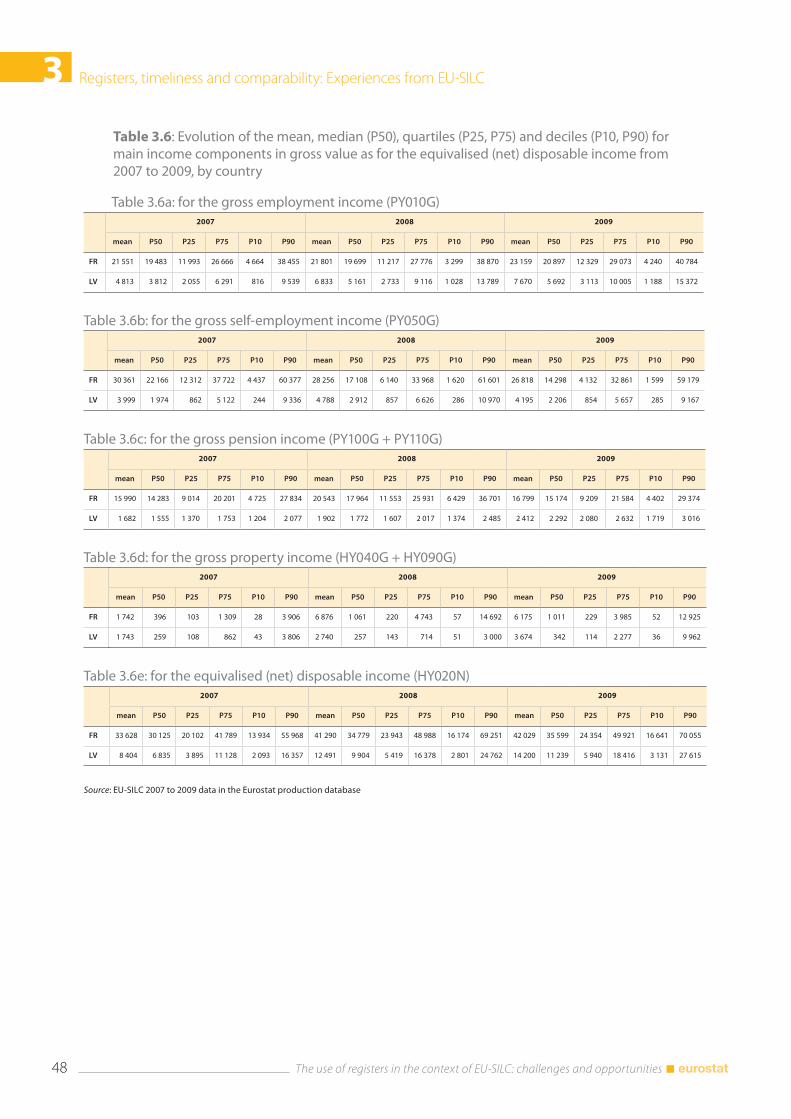
3 Registers, timeliness and comparability: Experiences from EU-SILC
The use of registers in the context of EU-SILC: challenges and opportunities 48
Table 3.6: Evolution of the mean, median (P50), quartiles (P25, P75) and deciles (P10, P90) for main income components in gross value as for the equivalised (net) disposable income from 2007 to 2009, by country
Table 3.6a: for the gross employment income (PY010G)2007 2008 2009
mean P50 P25 P75 P10 P90 mean P50 P25 P75 P10 P90 mean P50 P25 P75 P10 P90
FR 21 551 19 483 11 993 26 666 4 664 38 455 21 801 19 699 11 217 27 776 3 299 38 870 23 159 20 897 12 329 29 073 4 240 40 784
LV 4 813 3 812 2 055 6 291 816 9 539 6 833 5 161 2 733 9 116 1 028 13 789 7 670 5 692 3 113 10 005 1 188 15 372
Table 3.6b: for the gross self-employment income (PY050G)2007 2008 2009
mean P50 P25 P75 P10 P90 mean P50 P25 P75 P10 P90 mean P50 P25 P75 P10 P90
FR 30 361 22 166 12 312 37 722 4 437 60 377 28 256 17 108 6 140 33 968 1 620 61 601 26 818 14 298 4 132 32 861 1 599 59 179
LV 3 999 1 974 862 5 122 244 9 336 4 788 2 912 857 6 626 286 10 970 4 195 2 206 854 5 657 285 9 167
Table 3.6c: for the gross pension income (PY100G + PY110G)2007 2008 2009
mean P50 P25 P75 P10 P90 mean P50 P25 P75 P10 P90 mean P50 P25 P75 P10 P90
FR 15 990 14 283 9 014 20 201 4 725 27 834 20 543 17 964 11 553 25 931 6 429 36 701 16 799 15 174 9 209 21 584 4 402 29 374
LV 1 682 1 555 1 370 1 753 1 204 2 077 1 902 1 772 1 607 2 017 1 374 2 485 2 412 2 292 2 080 2 632 1 719 3 016
Table 3.6d: for the gross property income (HY040G + HY090G)2007 2008 2009
mean P50 P25 P75 P10 P90 mean P50 P25 P75 P10 P90 mean P50 P25 P75 P10 P90
FR 1 742 396 103 1 309 28 3 906 6 876 1 061 220 4 743 57 14 692 6 175 1 011 229 3 985 52 12 925
LV 1 743 259 108 862 43 3 806 2 740 257 143 714 51 3 000 3 674 342 114 2 277 36 9 962
Table 3.6e: for the equivalised (net) disposable income (HY020N)2007 2008 2009
mean P50 P25 P75 P10 P90 mean P50 P25 P75 P10 P90 mean P50 P25 P75 P10 P90
FR 33 628 30 125 20 102 41 789 13 934 55 968 41 290 34 779 23 943 48 988 16 174 69 251 42 029 35 599 24 354 49 921 16 641 70 055
LV 8 404 6 835 3 895 11 128 2 093 16 357 12 491 9 904 5 419 16 378 2 801 24 762 14 200 11 239 5 940 18 416 3 131 27 615
Source: EU-SILC 2007 to 2009 data in the Eurostat production database
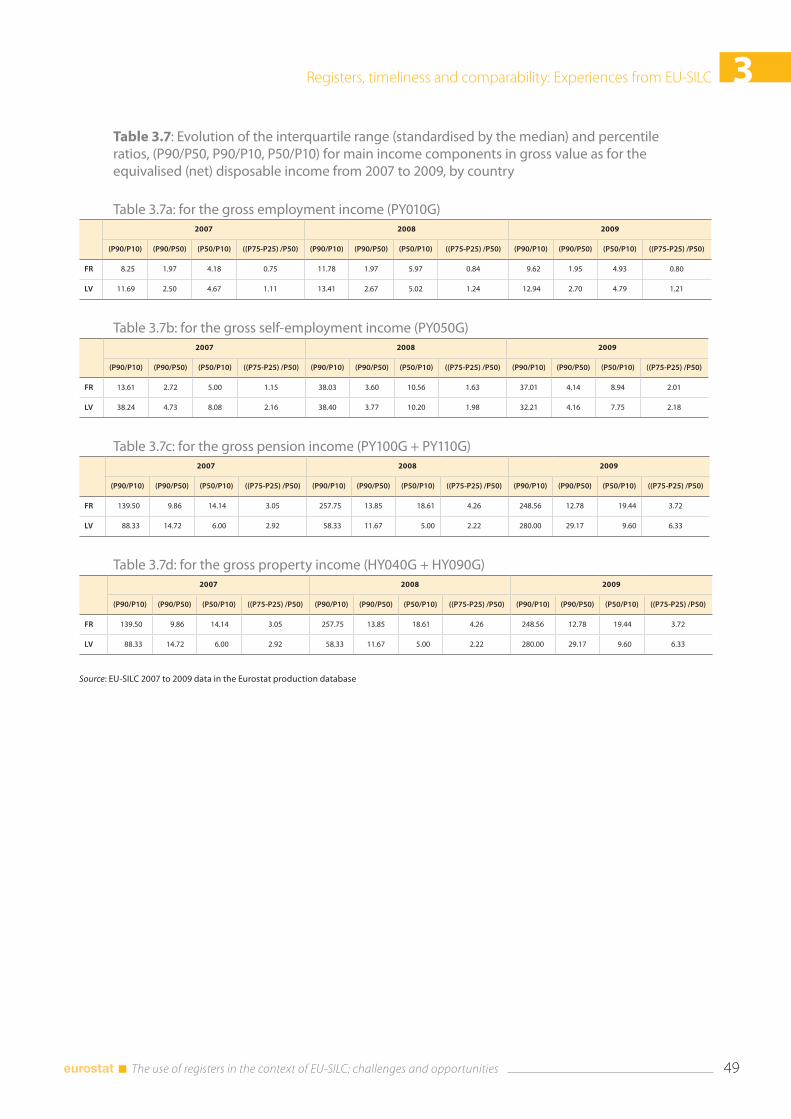
Registers, timeliness and comparability: Experiences from EU-SILC 3
49 The use of registers in the context of EU-SILC: challenges and opportunities
Table 3.7: Evolution of the interquartile range (standardised by the median) and percentile ratios, (P90/P50, P90/P10, P50/P10) for main income components in gross value as for the equivalised (net) disposable income from 2007 to 2009, by country
Table 3.7a: for the gross employment income (PY010G)2007 2008 2009
(P90/P10) (P90/P50) (P50/P10) ((P75-P25) /P50) (P90/P10) (P90/P50) (P50/P10) ((P75-P25) /P50) (P90/P10) (P90/P50) (P50/P10) ((P75-P25) /P50)
FR 8.25 1.97 4.18 0.75 11.78 1.97 5.97 0.84 9.62 1.95 4.93 0.80
LV 11.69 2.50 4.67 1.11 13.41 2.67 5.02 1.24 12.94 2.70 4.79 1.21
Table 3.7b: for the gross self-employment income (PY050G)2007 2008 2009
(P90/P10) (P90/P50) (P50/P10) ((P75-P25) /P50) (P90/P10) (P90/P50) (P50/P10) ((P75-P25) /P50) (P90/P10) (P90/P50) (P50/P10) ((P75-P25) /P50)
FR 13.61 2.72 5.00 1.15 38.03 3.60 10.56 1.63 37.01 4.14 8.94 2.01
LV 38.24 4.73 8.08 2.16 38.40 3.77 10.20 1.98 32.21 4.16 7.75 2.18
Table 3.7c: for the gross pension income (PY100G + PY110G)2007 2008 2009
(P90/P10) (P90/P50) (P50/P10) ((P75-P25) /P50) (P90/P10) (P90/P50) (P50/P10) ((P75-P25) /P50) (P90/P10) (P90/P50) (P50/P10) ((P75-P25) /P50)
FR 139.50 9.86 14.14 3.05 257.75 13.85 18.61 4.26 248.56 12.78 19.44 3.72
LV 88.33 14.72 6.00 2.92 58.33 11.67 5.00 2.22 280.00 29.17 9.60 6.33
Table 3.7d: for the gross property income (HY040G + HY090G)2007 2008 2009
(P90/P10) (P90/P50) (P50/P10) ((P75-P25) /P50) (P90/P10) (P90/P50) (P50/P10) ((P75-P25) /P50) (P90/P10) (P90/P50) (P50/P10) ((P75-P25) /P50)
FR 139.50 9.86 14.14 3.05 257.75 13.85 18.61 4.26 248.56 12.78 19.44 3.72
LV 88.33 14.72 6.00 2.92 58.33 11.67 5.00 2.22 280.00 29.17 9.60 6.33
Source: EU-SILC 2007 to 2009 data in the Eurostat production database
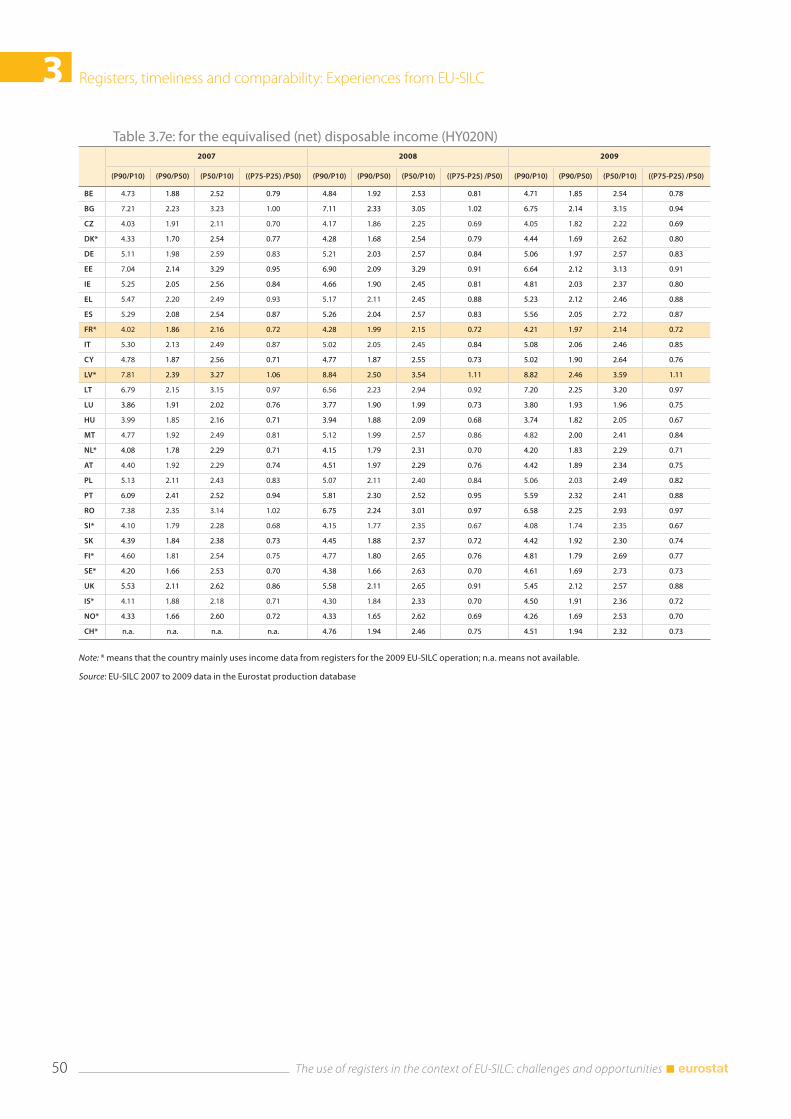
3 Registers, timeliness and comparability: Experiences from EU-SILC
The use of registers in the context of EU-SILC: challenges and opportunities 50
Table 3.7e: for the equivalised (net) disposable income (HY020N)2007 2008 2009
(P90/P10) (P90/P50) (P50/P10) ((P75-P25) /P50) (P90/P10) (P90/P50) (P50/P10) ((P75-P25) /P50) (P90/P10) (P90/P50) (P50/P10) ((P75-P25) /P50)
BE 4.73 1.88 2.52 0.79 4.84 1.92 2.53 0.81 4.71 1.85 2.54 0.78
BG 7.21 2.23 3.23 1.00 7.11 2.33 3.05 1.02 6.75 2.14 3.15 0.94
CZ 4.03 1.91 2.11 0.70 4.17 1.86 2.25 0.69 4.05 1.82 2.22 0.69
DK* 4.33 1.70 2.54 0.77 4.28 1.68 2.54 0.79 4.44 1.69 2.62 0.80
DE 5.11 1.98 2.59 0.83 5.21 2.03 2.57 0.84 5.06 1.97 2.57 0.83
EE 7.04 2.14 3.29 0.95 6.90 2.09 3.29 0.91 6.64 2.12 3.13 0.91
IE 5.25 2.05 2.56 0.84 4.66 1.90 2.45 0.81 4.81 2.03 2.37 0.80
EL 5.47 2.20 2.49 0.93 5.17 2.11 2.45 0.88 5.23 2.12 2.46 0.88
ES 5.29 2.08 2.54 0.87 5.26 2.04 2.57 0.83 5.56 2.05 2.72 0.87
FR* 4.02 1.86 2.16 0.72 4.28 1.99 2.15 0.72 4.21 1.97 2.14 0.72
IT 5.30 2.13 2.49 0.87 5.02 2.05 2.45 0.84 5.08 2.06 2.46 0.85
CY 4.78 1.87 2.56 0.71 4.77 1.87 2.55 0.73 5.02 1.90 2.64 0.76
LV* 7.81 2.39 3.27 1.06 8.84 2.50 3.54 1.11 8.82 2.46 3.59 1.11
LT 6.79 2.15 3.15 0.97 6.56 2.23 2.94 0.92 7.20 2.25 3.20 0.97
LU 3.86 1.91 2.02 0.76 3.77 1.90 1.99 0.73 3.80 1.93 1.96 0.75
HU 3.99 1.85 2.16 0.71 3.94 1.88 2.09 0.68 3.74 1.82 2.05 0.67
MT 4.77 1.92 2.49 0.81 5.12 1.99 2.57 0.86 4.82 2.00 2.41 0.84
NL* 4.08 1.78 2.29 0.71 4.15 1.79 2.31 0.70 4.20 1.83 2.29 0.71
AT 4.40 1.92 2.29 0.74 4.51 1.97 2.29 0.76 4.42 1.89 2.34 0.75
PL 5.13 2.11 2.43 0.83 5.07 2.11 2.40 0.84 5.06 2.03 2.49 0.82
PT 6.09 2.41 2.52 0.94 5.81 2.30 2.52 0.95 5.59 2.32 2.41 0.88
RO 7.38 2.35 3.14 1.02 6.75 2.24 3.01 0.97 6.58 2.25 2.93 0.97
SI* 4.10 1.79 2.28 0.68 4.15 1.77 2.35 0.67 4.08 1.74 2.35 0.67
SK 4.39 1.84 2.38 0.73 4.45 1.88 2.37 0.72 4.42 1.92 2.30 0.74
FI* 4.60 1.81 2.54 0.75 4.77 1.80 2.65 0.76 4.81 1.79 2.69 0.77
SE* 4.20 1.66 2.53 0.70 4.38 1.66 2.63 0.70 4.61 1.69 2.73 0.73
UK 5.53 2.11 2.62 0.86 5.58 2.11 2.65 0.91 5.45 2.12 2.57 0.88
IS* 4.11 1.88 2.18 0.71 4.30 1.84 2.33 0.70 4.50 1.91 2.36 0.72
NO* 4.33 1.66 2.60 0.72 4.33 1.65 2.62 0.69 4.26 1.69 2.53 0.70
CH* n.a. n.a. n.a. n.a. 4.76 1.94 2.46 0.75 4.51 1.94 2.32 0.73
Note: * means that the country mainly uses income data from registers for the 2009 EU-SILC operation; n.a. means not available.
Source: EU-SILC 2007 to 2009 data in the Eurostat production database
Registers, timeliness and comparability: Experiences from EU-SILC 3
51 The use of registers in the context of EU-SILC: challenges and opportunities
Tables 3.7a-e show the evolution of some derived statistics for these main income components, namely the interquartile range standardised by the median and the following percentile ratios: P90/P50, P90/P10, P50/P10. These statistics provide a broad view of the inequality. The three percentile ratios each compare two parts of the income distribution, with equality between these parts corresponding to a ratio of 1 and the greater the ratio, the more unequal the parts. The interquartile range also increases with inequality.
The figures obtained for gross employment income (see Tables 3.6a and 3.7a, also Annex Table A.3a) suggest that inequality measures are higher when the data come from administrative data than from interviews. France and Latvia see an increase in their P90/P10 from 2007 to 2008 (i.e. 8.25 to 11.78 in France and 11.69 to 13.41 for Latvia). The breakdown in P90/P50 and P50/P10 percentiles indicates that this change affects in France the part of the population below the median. Indeed, the French P90/P50 keeps the same value (1.97) while P50/P10 goes from 4.18 to 5.97. When comparing all EU-SILC participating countries, it can be seen that the register countries correspond to higher values of P90/P10 and P50/P10, with the Netherlands, Slovenia, Finland, Sweden and Norway having all a P90/P10 greater the 20 and a P50/P10 above 9.
For gross self-employment income (see Tables 3.6b and 3.7b, also Annex Table A.3b), a decrease in the amount is observed except for the upper tail of the distribution from 2007 to 2008 in France. Indeed, in this country, the mean (resp. median) passes from 30361€ (resp. 22166€) in 2007 to 28256€ (resp. 17108€) in 2008 and 26818€ (resp. 14298€) in 2009. The quartiles and the first decile also decrease substantially. Only P90 remains stable. Consequently, the percentile ratios for France significantly increase between 2007 and 2008, with most of the difference occurring below the median. i.e., the P90/P10 moves from 13.61 to 38.03 and the P50/P10 from 5.00 to 10.56. Register countries generally have higher percentile ratios for self-employment income due to the more frequent recording of negative amounts in administrative registers than in household surveys.
Results for gross pension income (see Tables 3.6c and 3.7c, also Annex Table A.3c) do not show any particular changes in inequality measures when passing from interview to administrative data.
On the other hand, the transition from interview to register data seems to impact the recorded amount of property income and the associated inequality measures (see Tables 3.6d and 3.7d, also Annex Table A.3d). The case of France is striking, with the mean (median) jumping from 1742€ (396€) in 2007 to 6876€ (1061€) in 2008. The upper tail of the distribution appears the most affected, with a value for P90 of 3906€ in 2007 and 14692€ in 2008.
Finally, the analysis of the overall household income in terms of equivalised (net) disposable income shows a very limited impact, almost non-existent, on inequality from the transition from interview to administrative data (see Tables 3.6e and 3.7e). This confirms the findings from the national experiences (discussed above).
3.5 ConclusionsThe use of registers allows for more efficient data collection with main benefits coming from the substitution of survey questions with administrative data, for example shorter questionnaire, less burden on respondents and reduced survey cost. Quantitative variables, in particular income data, are also often better measured (via smaller impact of item non-response, under-reporting, social desirability and memory effects). The majority of the countries implementing EU-SILC are already making use of registers in the framework of EU-SILC and/or are moving towards a wider use of them, especially for demography, income and education data. Nevertheless, the situation among them as regards the extent of use varies a lot.
A major obstacle to the use of administrative data concerns timeliness. Several countries mentioned a negative effect of using registers on timeliness due to late data delivery by the owners and due to extensive practices to ensure internal consistency. Tax registers are particularly at stake.
Comparability is also one important issue to consider. The impact of the transition on data comparability across time and across countries should be carefully assessed by countries envisaging an increased use of registers. There is consistent evidence that use of register data reduces intra-country survey errors, but may introduce additional bias to the across-countries comparison. Eurostat recommends having at least one overlapping measurement from both interviews and registers before deciding whether to replace survey with
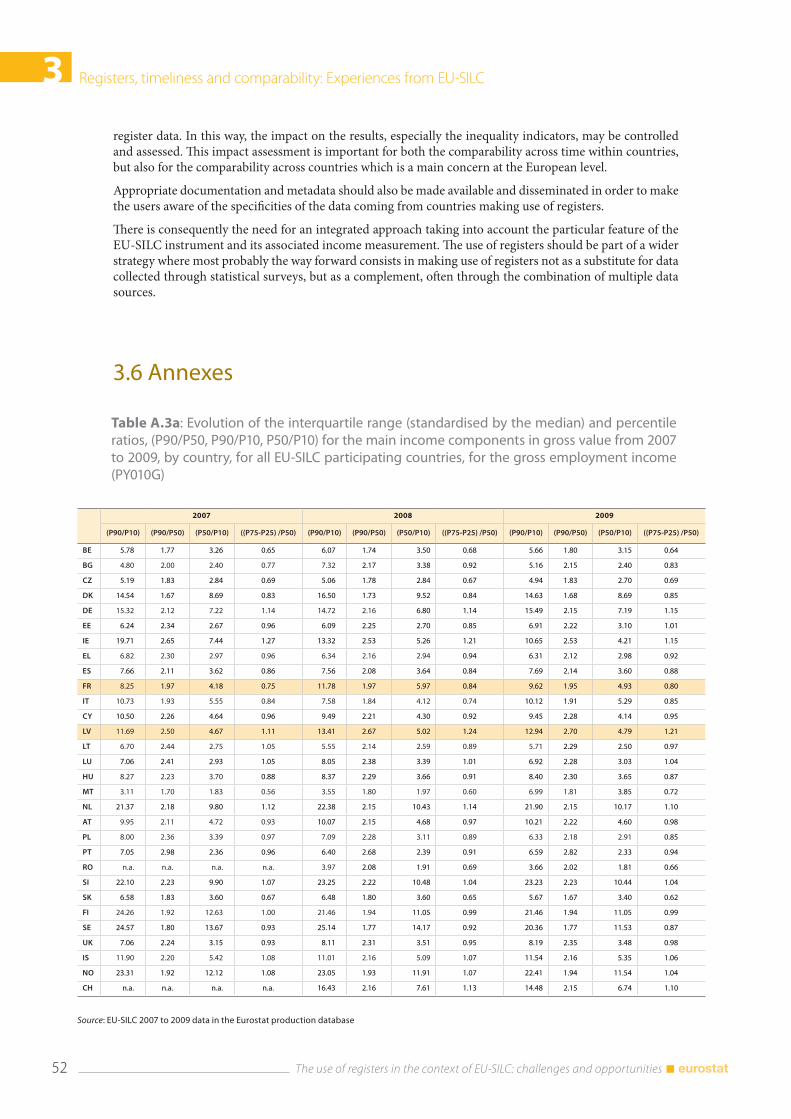
3 Registers, timeliness and comparability: Experiences from EU-SILC
The use of registers in the context of EU-SILC: challenges and opportunities 52
register data. In this way, the impact on the results, especially the inequality indicators, may be controlled and assessed. This impact assessment is important for both the comparability across time within countries, but also for the comparability across countries which is a main concern at the European level.
Appropriate documentation and metadata should also be made available and disseminated in order to make the users aware of the specificities of the data coming from countries making use of registers.
There is consequently the need for an integrated approach taking into account the particular feature of the EU-SILC instrument and its associated income measurement. The use of registers should be part of a wider strategy where most probably the way forward consists in making use of registers not as a substitute for data collected through statistical surveys, but as a complement, often through the combination of multiple data sources.
Table A.3a: Evolution of the interquartile range (standardised by the median) and percentile ratios, (P90/P50, P90/P10, P50/P10) for the main income components in gross value from 2007 to 2009, by country, for all EU-SILC participating countries, for the gross employment income (PY010G)
2007 2008 2009
(P90/P10) (P90/P50) (P50/P10) ((P75-P25) /P50) (P90/P10) (P90/P50) (P50/P10) ((P75-P25) /P50) (P90/P10) (P90/P50) (P50/P10) ((P75-P25) /P50)
BE 5.78 1.77 3.26 0.65 6.07 1.74 3.50 0.68 5.66 1.80 3.15 0.64
BG 4.80 2.00 2.40 0.77 7.32 2.17 3.38 0.92 5.16 2.15 2.40 0.83
CZ 5.19 1.83 2.84 0.69 5.06 1.78 2.84 0.67 4.94 1.83 2.70 0.69
DK 14.54 1.67 8.69 0.83 16.50 1.73 9.52 0.84 14.63 1.68 8.69 0.85
DE 15.32 2.12 7.22 1.14 14.72 2.16 6.80 1.14 15.49 2.15 7.19 1.15
EE 6.24 2.34 2.67 0.96 6.09 2.25 2.70 0.85 6.91 2.22 3.10 1.01
IE 19.71 2.65 7.44 1.27 13.32 2.53 5.26 1.21 10.65 2.53 4.21 1.15
EL 6.82 2.30 2.97 0.96 6.34 2.16 2.94 0.94 6.31 2.12 2.98 0.92
ES 7.66 2.11 3.62 0.86 7.56 2.08 3.64 0.84 7.69 2.14 3.60 0.88
FR 8.25 1.97 4.18 0.75 11.78 1.97 5.97 0.84 9.62 1.95 4.93 0.80
IT 10.73 1.93 5.55 0.84 7.58 1.84 4.12 0.74 10.12 1.91 5.29 0.85
CY 10.50 2.26 4.64 0.96 9.49 2.21 4.30 0.92 9.45 2.28 4.14 0.95
LV 11.69 2.50 4.67 1.11 13.41 2.67 5.02 1.24 12.94 2.70 4.79 1.21
LT 6.70 2.44 2.75 1.05 5.55 2.14 2.59 0.89 5.71 2.29 2.50 0.97
LU 7.06 2.41 2.93 1.05 8.05 2.38 3.39 1.01 6.92 2.28 3.03 1.04
HU 8.27 2.23 3.70 0.88 8.37 2.29 3.66 0.91 8.40 2.30 3.65 0.87
MT 3.11 1.70 1.83 0.56 3.55 1.80 1.97 0.60 6.99 1.81 3.85 0.72
NL 21.37 2.18 9.80 1.12 22.38 2.15 10.43 1.14 21.90 2.15 10.17 1.10
AT 9.95 2.11 4.72 0.93 10.07 2.15 4.68 0.97 10.21 2.22 4.60 0.98
PL 8.00 2.36 3.39 0.97 7.09 2.28 3.11 0.89 6.33 2.18 2.91 0.85
PT 7.05 2.98 2.36 0.96 6.40 2.68 2.39 0.91 6.59 2.82 2.33 0.94
RO n.a. n.a. n.a. n.a. 3.97 2.08 1.91 0.69 3.66 2.02 1.81 0.66
SI 22.10 2.23 9.90 1.07 23.25 2.22 10.48 1.04 23.23 2.23 10.44 1.04
SK 6.58 1.83 3.60 0.67 6.48 1.80 3.60 0.65 5.67 1.67 3.40 0.62
FI 24.26 1.92 12.63 1.00 21.46 1.94 11.05 0.99 21.46 1.94 11.05 0.99
SE 24.57 1.80 13.67 0.93 25.14 1.77 14.17 0.92 20.36 1.77 11.53 0.87
UK 7.06 2.24 3.15 0.93 8.11 2.31 3.51 0.95 8.19 2.35 3.48 0.98
IS 11.90 2.20 5.42 1.08 11.01 2.16 5.09 1.07 11.54 2.16 5.35 1.06
NO 23.31 1.92 12.12 1.08 23.05 1.93 11.91 1.07 22.41 1.94 11.54 1.04
CH n.a. n.a. n.a. n.a. 16.43 2.16 7.61 1.13 14.48 2.15 6.74 1.10
Source: EU-SILC 2007 to 2009 data in the Eurostat production database
3.6 Annexes
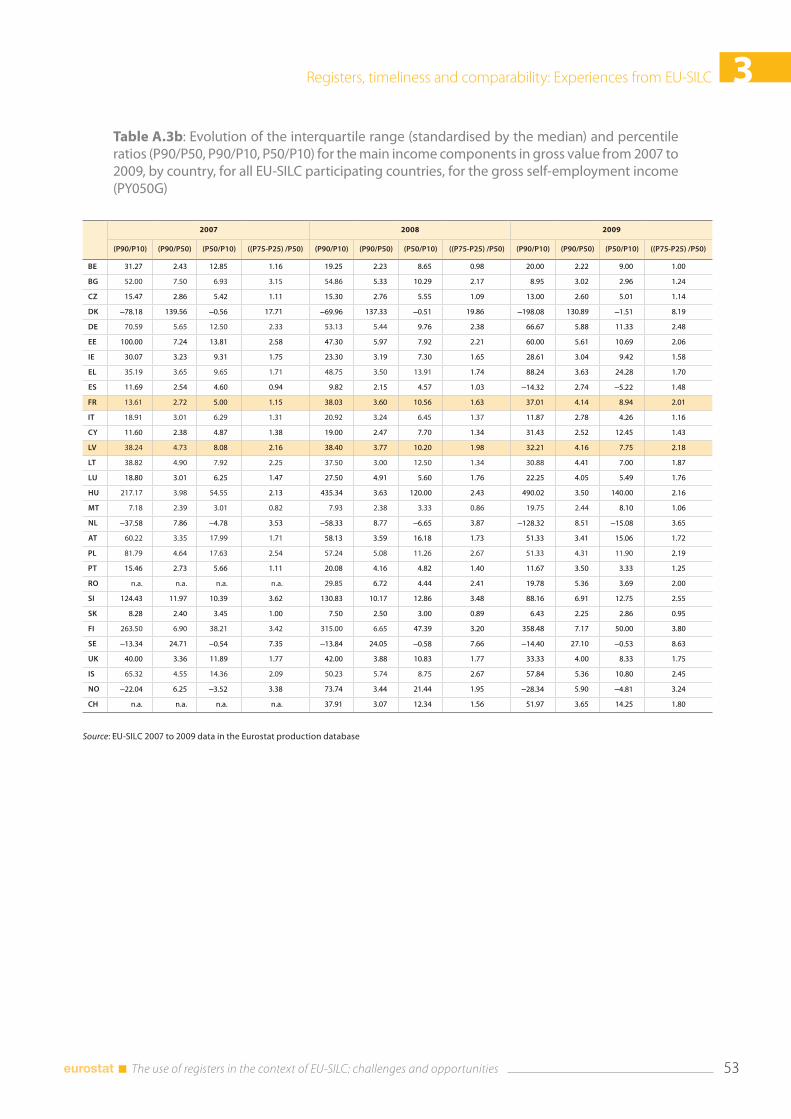
Registers, timeliness and comparability: Experiences from EU-SILC 3
53 The use of registers in the context of EU-SILC: challenges and opportunities
Table A.3b: Evolution of the interquartile range (standardised by the median) and percentile ratios (P90/P50, P90/P10, P50/P10) for the main income components in gross value from 2007 to 2009, by country, for all EU-SILC participating countries, for the gross self-employment income (PY050G)
2007 2008 2009
(P90/P10) (P90/P50) (P50/P10) ((P75-P25) /P50) (P90/P10) (P90/P50) (P50/P10) ((P75-P25) /P50) (P90/P10) (P90/P50) (P50/P10) ((P75-P25) /P50)
BE 31.27 2.43 12.85 1.16 19.25 2.23 8.65 0.98 20.00 2.22 9.00 1.00
BG 52.00 7.50 6.93 3.15 54.86 5.33 10.29 2.17 8.95 3.02 2.96 1.24
CZ 15.47 2.86 5.42 1.11 15.30 2.76 5.55 1.09 13.00 2.60 5.01 1.14
DK –78.18 139.56 –0.56 17.71 –69.96 137.33 –0.51 19.86 –198.08 130.89 –1.51 8.19
DE 70.59 5.65 12.50 2.33 53.13 5.44 9.76 2.38 66.67 5.88 11.33 2.48
EE 100.00 7.24 13.81 2.58 47.30 5.97 7.92 2.21 60.00 5.61 10.69 2.06
IE 30.07 3.23 9.31 1.75 23.30 3.19 7.30 1.65 28.61 3.04 9.42 1.58
EL 35.19 3.65 9.65 1.71 48.75 3.50 13.91 1.74 88.24 3.63 24.28 1.70
ES 11.69 2.54 4.60 0.94 9.82 2.15 4.57 1.03 –14.32 2.74 –5.22 1.48
FR 13.61 2.72 5.00 1.15 38.03 3.60 10.56 1.63 37.01 4.14 8.94 2.01
IT 18.91 3.01 6.29 1.31 20.92 3.24 6.45 1.37 11.87 2.78 4.26 1.16
CY 11.60 2.38 4.87 1.38 19.00 2.47 7.70 1.34 31.43 2.52 12.45 1.43
LV 38.24 4.73 8.08 2.16 38.40 3.77 10.20 1.98 32.21 4.16 7.75 2.18
LT 38.82 4.90 7.92 2.25 37.50 3.00 12.50 1.34 30.88 4.41 7.00 1.87
LU 18.80 3.01 6.25 1.47 27.50 4.91 5.60 1.76 22.25 4.05 5.49 1.76
HU 217.17 3.98 54.55 2.13 435.34 3.63 120.00 2.43 490.02 3.50 140.00 2.16
MT 7.18 2.39 3.01 0.82 7.93 2.38 3.33 0.86 19.75 2.44 8.10 1.06
NL –37.58 7.86 –4.78 3.53 –58.33 8.77 –6.65 3.87 –128.32 8.51 –15.08 3.65
AT 60.22 3.35 17.99 1.71 58.13 3.59 16.18 1.73 51.33 3.41 15.06 1.72
PL 81.79 4.64 17.63 2.54 57.24 5.08 11.26 2.67 51.33 4.31 11.90 2.19
PT 15.46 2.73 5.66 1.11 20.08 4.16 4.82 1.40 11.67 3.50 3.33 1.25
RO n.a. n.a. n.a. n.a. 29.85 6.72 4.44 2.41 19.78 5.36 3.69 2.00
SI 124.43 11.97 10.39 3.62 130.83 10.17 12.86 3.48 88.16 6.91 12.75 2.55
SK 8.28 2.40 3.45 1.00 7.50 2.50 3.00 0.89 6.43 2.25 2.86 0.95
FI 263.50 6.90 38.21 3.42 315.00 6.65 47.39 3.20 358.48 7.17 50.00 3.80
SE –13.34 24.71 –0.54 7.35 –13.84 24.05 –0.58 7.66 –14.40 27.10 –0.53 8.63
UK 40.00 3.36 11.89 1.77 42.00 3.88 10.83 1.77 33.33 4.00 8.33 1.75
IS 65.32 4.55 14.36 2.09 50.23 5.74 8.75 2.67 57.84 5.36 10.80 2.45
NO –22.04 6.25 –3.52 3.38 73.74 3.44 21.44 1.95 –28.34 5.90 –4.81 3.24
CH n.a. n.a. n.a. n.a. 37.91 3.07 12.34 1.56 51.97 3.65 14.25 1.80
Source: EU-SILC 2007 to 2009 data in the Eurostat production database
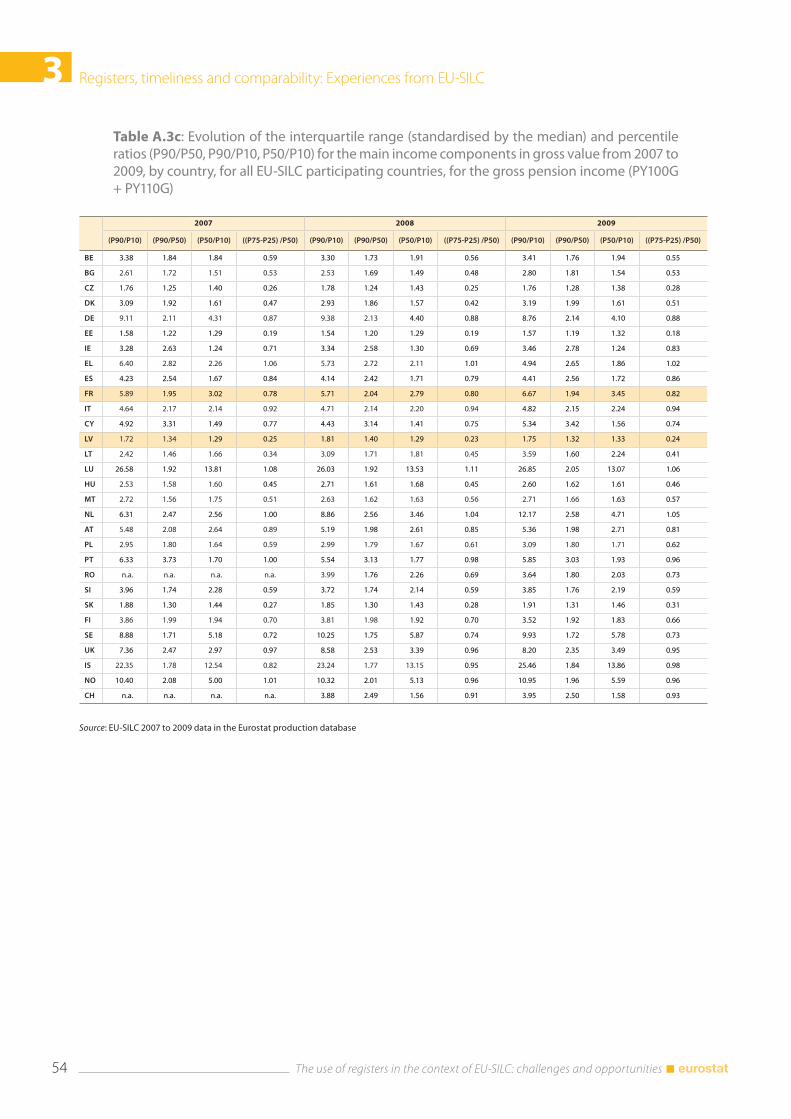
3 Registers, timeliness and comparability: Experiences from EU-SILC
The use of registers in the context of EU-SILC: challenges and opportunities 54
Table A.3c: Evolution of the interquartile range (standardised by the median) and percentile ratios (P90/P50, P90/P10, P50/P10) for the main income components in gross value from 2007 to 2009, by country, for all EU-SILC participating countries, for the gross pension income (PY100G + PY110G)
2007 2008 2009
(P90/P10) (P90/P50) (P50/P10) ((P75-P25) /P50) (P90/P10) (P90/P50) (P50/P10) ((P75-P25) /P50) (P90/P10) (P90/P50) (P50/P10) ((P75-P25) /P50)
BE 3.38 1.84 1.84 0.59 3.30 1.73 1.91 0.56 3.41 1.76 1.94 0.55
BG 2.61 1.72 1.51 0.53 2.53 1.69 1.49 0.48 2.80 1.81 1.54 0.53
CZ 1.76 1.25 1.40 0.26 1.78 1.24 1.43 0.25 1.76 1.28 1.38 0.28
DK 3.09 1.92 1.61 0.47 2.93 1.86 1.57 0.42 3.19 1.99 1.61 0.51
DE 9.11 2.11 4.31 0.87 9.38 2.13 4.40 0.88 8.76 2.14 4.10 0.88
EE 1.58 1.22 1.29 0.19 1.54 1.20 1.29 0.19 1.57 1.19 1.32 0.18
IE 3.28 2.63 1.24 0.71 3.34 2.58 1.30 0.69 3.46 2.78 1.24 0.83
EL 6.40 2.82 2.26 1.06 5.73 2.72 2.11 1.01 4.94 2.65 1.86 1.02
ES 4.23 2.54 1.67 0.84 4.14 2.42 1.71 0.79 4.41 2.56 1.72 0.86
FR 5.89 1.95 3.02 0.78 5.71 2.04 2.79 0.80 6.67 1.94 3.45 0.82
IT 4.64 2.17 2.14 0.92 4.71 2.14 2.20 0.94 4.82 2.15 2.24 0.94
CY 4.92 3.31 1.49 0.77 4.43 3.14 1.41 0.75 5.34 3.42 1.56 0.74
LV 1.72 1.34 1.29 0.25 1.81 1.40 1.29 0.23 1.75 1.32 1.33 0.24
LT 2.42 1.46 1.66 0.34 3.09 1.71 1.81 0.45 3.59 1.60 2.24 0.41
LU 26.58 1.92 13.81 1.08 26.03 1.92 13.53 1.11 26.85 2.05 13.07 1.06
HU 2.53 1.58 1.60 0.45 2.71 1.61 1.68 0.45 2.60 1.62 1.61 0.46
MT 2.72 1.56 1.75 0.51 2.63 1.62 1.63 0.56 2.71 1.66 1.63 0.57
NL 6.31 2.47 2.56 1.00 8.86 2.56 3.46 1.04 12.17 2.58 4.71 1.05
AT 5.48 2.08 2.64 0.89 5.19 1.98 2.61 0.85 5.36 1.98 2.71 0.81
PL 2.95 1.80 1.64 0.59 2.99 1.79 1.67 0.61 3.09 1.80 1.71 0.62
PT 6.33 3.73 1.70 1.00 5.54 3.13 1.77 0.98 5.85 3.03 1.93 0.96
RO n.a. n.a. n.a. n.a. 3.99 1.76 2.26 0.69 3.64 1.80 2.03 0.73
SI 3.96 1.74 2.28 0.59 3.72 1.74 2.14 0.59 3.85 1.76 2.19 0.59
SK 1.88 1.30 1.44 0.27 1.85 1.30 1.43 0.28 1.91 1.31 1.46 0.31
FI 3.86 1.99 1.94 0.70 3.81 1.98 1.92 0.70 3.52 1.92 1.83 0.66
SE 8.88 1.71 5.18 0.72 10.25 1.75 5.87 0.74 9.93 1.72 5.78 0.73
UK 7.36 2.47 2.97 0.97 8.58 2.53 3.39 0.96 8.20 2.35 3.49 0.95
IS 22.35 1.78 12.54 0.82 23.24 1.77 13.15 0.95 25.46 1.84 13.86 0.98
NO 10.40 2.08 5.00 1.01 10.32 2.01 5.13 0.96 10.95 1.96 5.59 0.96
CH n.a. n.a. n.a. n.a. 3.88 2.49 1.56 0.91 3.95 2.50 1.58 0.93
Source: EU-SILC 2007 to 2009 data in the Eurostat production database
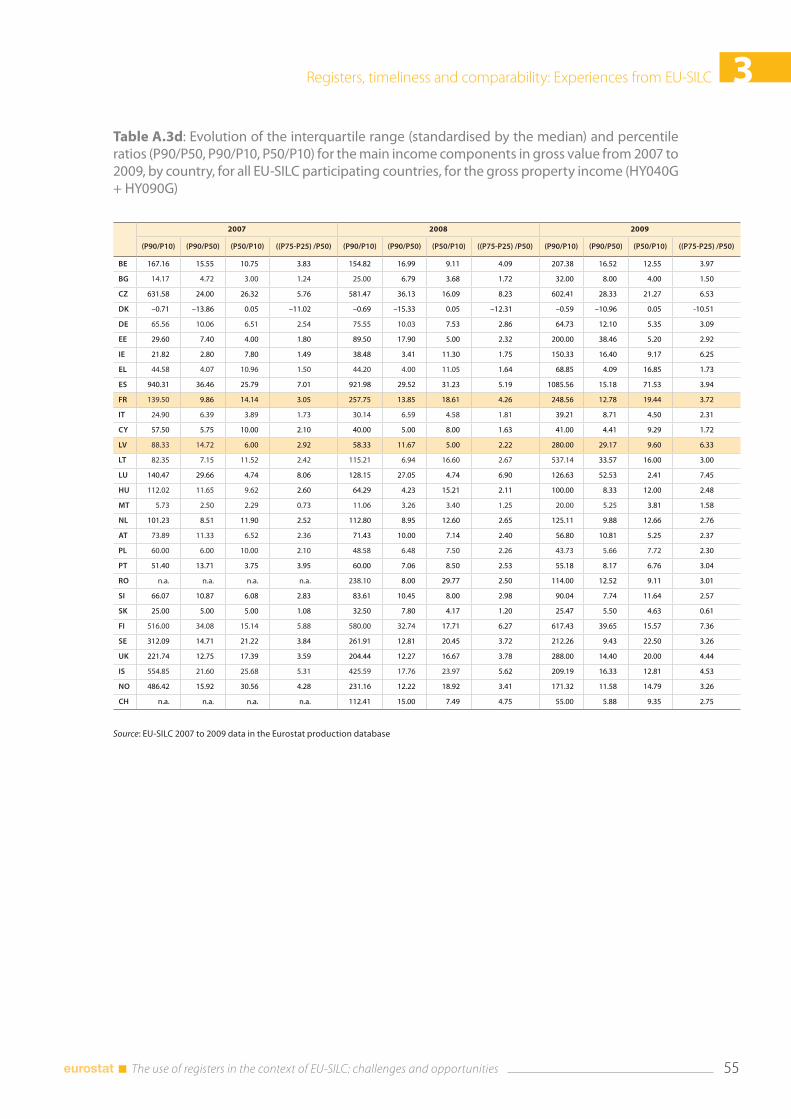
Registers, timeliness and comparability: Experiences from EU-SILC 3
55 The use of registers in the context of EU-SILC: challenges and opportunities
Table A.3d: Evolution of the interquartile range (standardised by the median) and percentile ratios (P90/P50, P90/P10, P50/P10) for the main income components in gross value from 2007 to 2009, by country, for all EU-SILC participating countries, for the gross property income (HY040G + HY090G)
2007 2008 2009
(P90/P10) (P90/P50) (P50/P10) ((P75-P25) /P50) (P90/P10) (P90/P50) (P50/P10) ((P75-P25) /P50) (P90/P10) (P90/P50) (P50/P10) ((P75-P25) /P50)
BE 167.16 15.55 10.75 3.83 154.82 16.99 9.11 4.09 207.38 16.52 12.55 3.97
BG 14.17 4.72 3.00 1.24 25.00 6.79 3.68 1.72 32.00 8.00 4.00 1.50
CZ 631.58 24.00 26.32 5.76 581.47 36.13 16.09 8.23 602.41 28.33 21.27 6.53
DK –0.71 –13.86 0.05 –11.02 –0.69 –15.33 0.05 –12.31 –0.59 –10.96 0.05 -10.51
DE 65.56 10.06 6.51 2.54 75.55 10.03 7.53 2.86 64.73 12.10 5.35 3.09
EE 29.60 7.40 4.00 1.80 89.50 17.90 5.00 2.32 200.00 38.46 5.20 2.92
IE 21.82 2.80 7.80 1.49 38.48 3.41 11.30 1.75 150.33 16.40 9.17 6.25
EL 44.58 4.07 10.96 1.50 44.20 4.00 11.05 1.64 68.85 4.09 16.85 1.73
ES 940.31 36.46 25.79 7.01 921.98 29.52 31.23 5.19 1085.56 15.18 71.53 3.94
FR 139.50 9.86 14.14 3.05 257.75 13.85 18.61 4.26 248.56 12.78 19.44 3.72
IT 24.90 6.39 3.89 1.73 30.14 6.59 4.58 1.81 39.21 8.71 4.50 2.31
CY 57.50 5.75 10.00 2.10 40.00 5.00 8.00 1.63 41.00 4.41 9.29 1.72
LV 88.33 14.72 6.00 2.92 58.33 11.67 5.00 2.22 280.00 29.17 9.60 6.33
LT 82.35 7.15 11.52 2.42 115.21 6.94 16.60 2.67 537.14 33.57 16.00 3.00
LU 140.47 29.66 4.74 8.06 128.15 27.05 4.74 6.90 126.63 52.53 2.41 7.45
HU 112.02 11.65 9.62 2.60 64.29 4.23 15.21 2.11 100.00 8.33 12.00 2.48
MT 5.73 2.50 2.29 0.73 11.06 3.26 3.40 1.25 20.00 5.25 3.81 1.58
NL 101.23 8.51 11.90 2.52 112.80 8.95 12.60 2.65 125.11 9.88 12.66 2.76
AT 73.89 11.33 6.52 2.36 71.43 10.00 7.14 2.40 56.80 10.81 5.25 2.37
PL 60.00 6.00 10.00 2.10 48.58 6.48 7.50 2.26 43.73 5.66 7.72 2.30
PT 51.40 13.71 3.75 3.95 60.00 7.06 8.50 2.53 55.18 8.17 6.76 3.04
RO n.a. n.a. n.a. n.a. 238.10 8.00 29.77 2.50 114.00 12.52 9.11 3.01
SI 66.07 10.87 6.08 2.83 83.61 10.45 8.00 2.98 90.04 7.74 11.64 2.57
SK 25.00 5.00 5.00 1.08 32.50 7.80 4.17 1.20 25.47 5.50 4.63 0.61
FI 516.00 34.08 15.14 5.88 580.00 32.74 17.71 6.27 617.43 39.65 15.57 7.36
SE 312.09 14.71 21.22 3.84 261.91 12.81 20.45 3.72 212.26 9.43 22.50 3.26
UK 221.74 12.75 17.39 3.59 204.44 12.27 16.67 3.78 288.00 14.40 20.00 4.44
IS 554.85 21.60 25.68 5.31 425.59 17.76 23.97 5.62 209.19 16.33 12.81 4.53
NO 486.42 15.92 30.56 4.28 231.16 12.22 18.92 3.41 171.32 11.58 14.79 3.26
CH n.a. n.a. n.a. n.a. 112.41 15.00 7.49 4.75 55.00 5.88 9.35 2.75
Source: EU-SILC 2007 to 2009 data in the Eurostat production database

Survey-and register-based estimates of income distribution and poverty 4
57 The use of registers in the context of EU-SILC: challenges and opportunities
4. Survey- and register-based estimates of income distribution and poverty
Markus Jäntti and Veli-Matti Törmälehto
Abstract: We discuss measurement errors in the context of observing, often for the same units, information based on both surveys and registers. Relying on comparisons of survey and register information on disposable income and its main components, we show evidence on both inequality and poverty. We also provide evidence on the distribution of wealth similarly based on a comparison of survey and register information, along with evidence on labour market outcomes and household structure, along with a comparison of income aggregates from EU-SILC and the national accounts.
4.1 IntroductionThis chapter reviews the research literature on the comparison of distributions based on register and survey data. Apart from reviews of earlier work, an important information source is work done in and as follow-up to the CHINTEX-project, financed by the EU, largely using a combination of ECHP and register data linked to it.
For those who analyse the cross-national data, the pertinent question is, to what extent the observed differences in the estimates could in fact be due to the data generating processes. In other words, to what extent the flexible use of data sources reduces the intra-country total survey errors but introduces additional bias to cross-country comparisons. Could it be, for instance, that the low relative poverty rates in the Nordic countries are related to better measurement of social benefits from registers and not purely to their welfare state regime? As a second example, to what extent the different longitudinal following rules in the register-based EU-SILC implementations affect the transition and mobility estimates derived from the data.
We selectively review findings from the research literature on differences between results based on survey and register information for some socio-economic outcomes. The focus is on income distribution and research closely related to that. We mostly focus on papers that examine European countries and rely heavily on findings from a research project using the European Household Community Panel that had as one of its main objectives to assess the comparability of estimates based on survey and register information. In this chapter, we review papers that pre-date the findings report in this volume – we return to findings in the present volume in the concluding chapter.
The chapter is organised as follows. In Section 4.2, we discuss measurement error models. In Section 4.3, we discuss evidence of the impact of measurement errors on the distribution of disposable income, including poverty and its main component, earnings, as assessed by comparing survey and register information for the same units. Section 4.4 reviews evidence for wealth using the same approach. Sections 4.5 and 4.6 discuss the measurement of labour market variables and household structure, while Section 4.7 compares EU-SILC income estimates with corresponding national accounts estimates. Section 4.8 concludes.
(1) Markus Jäntti is from the Swedish Institute for Social Research, Stockholm University and Veli-Matti Törmälehto is from Statistics Finland. The authors would like to thank Anthony Atkinson, Eric Marlier, and Hannele Sauli for valuable comments and suggestions. All errors remain our own. This work has been supported by the second Network for the analysis of EU-SILC (Net-SILC2), funded by Eurostat. The European Commission bears no responsibility for the analyses and conclusions, which are solely those of the authors. Email address for correspondence: [email protected] and [email protected].
4 Survey-and register-based estimates of income distribution and poverty
The use of registers in the context of EU-SILC: challenges and opportunities 58
4.2 Measurement error models The impact of measurement errors on parameters estimates of statistical models have long been a major concern in empirical social science. Standard econometrics textbooks include long sections on the effect of measurement errors on parameter estimates and how to statistically correct for those (see e.g. Greene, 2003). More complex measurement error models and corrections for resulting biases can be found (e.g. Gustafson, 2003). Data providers have used comparisons of survey information with corresponding register information to establish the extent of measurement error in their data (Rodgers et al., 1993; Ehling & Rendtel, 2004, e.g.). When available in a cross-national context, researchers have provided interesting comparisons of the effect on research results from register and survey information use (Kapteyn & Ypma, 2007; Johansson, 2007; Gottschalk & Huynh, 2010).
There are several reviews of measurement error (e.g. Bound et al., 2001). As Kapteyn & Ypma (2007) point out, a key distinction both in the case of register and survey information is if the register variable is taken to represent the true value or not. Clearly, the degree to which the register variable can be taken to represent the true value must depend on both what the underlying concept is that is being measured and the nature of the register(s) that are used capture the variable. It is, thus, in general not useful to think of registers as capturing truth, unless we define truth to be the value that the register records.
A simple example may serve to illustrate this point. Suppose, as in Rodgers et al. (1993), that survey responses about earnings and hours worked are compared to the records of the company employing the respondents. Clearly the register information – the company records – can be taken to represent ‘truth’, if variables that are trying to be captured by the survey are the earnings and hours worked in that firm. But if the variable that is the object of measurement is earnings from all current employment (including, say, informal employment), the records of a single employer or, in the case of informal employment, no set of records, provide the true number. In that case, the register information provides one variable that hopefully corresponds to the truth but with some error while survey responses contain another kind of error.
We also here focus on substantive research that utilises both register and survey information. An important use of registers to validate survey information is of course that which attempts to model non-response, attrition and/or item non-response. While such research can have substantive aims – to provide unbiased (or less biased) estimates of, e.g., income distribution quantiles by allowing for more accurate weights to be constructed, it tends to be methodological in scope.
Suppose we are interested in a continuous random variable X, such as disposable income, or wealth, and have access to two different measures of it, the register, giving XR and interview XI. In general, we may assume that for either measure, the measured variable is a function of the true value and an error єj, so we have Xj = f(X,єj). In the simple case that the errors are additive, we have
XR=X+εR and XI=X+ εI
One variant which is quite popular in the literature is to assume a multiplicative error term, in which case we have (assuming strictly positive X and є)
(2) lnXj=lnX+lnεj , j=R, I
Fixing the function for f() does not resolve much, however, as we need to establish both properties of єj, in particular if they are ‘classical’ in the sense of being independent of the true value of income or not. Moreover, even if they are independent of X, they may be correlated. (The case that assumes the register variable captures the true value of X has єR being identically equal to zero.)
In case of longitudinal data, we need to supply the variables with a time index:
(3) Xt,j=ft (Xt,εt,j)
The point of using longitudinal data is to try to deduce the joint distribution of true income in, say, two time periods, 1 and 2. In addition to deducing the functional form ft() in each time period, whether the errors are classical or not and if they are contemporaneously corrected, one needs to decide if the errors are intertemporally correlated. A full understanding of measurement errors in this case involves knowing the distribution of the four-dimensional error term, i.e., the errors to register and interview income in both time periods, both conditional on the true values and unconditionally. If we are interested in several
Survey-and register-based estimates of income distribution and poverty 4
59 The use of registers in the context of EU-SILC: challenges and opportunities
components of income, and have measures of them from both interviews and registers, we also need to understand the multivariate distribution of errors, i.e., the joint distribution of the errors to the different income components. In practice, it is very rare for analysts to specify the full conditional distribution of errors.
The simplest case to consider is the one where registers are assumed to capture true income, the error in interview income is additive and classical, i.e., independent of the true value of income. The effect of such measurement errors on several income distribution measures is studied by Chesher & Schluter (2002) and depends on properties of the density functions of the error and true income. For instance, the Gini coefficient is biased upward and the Lorenz curve is biased outward by such errors, indicating more inequality in the observed than in the true income distribution. Chesher & Schluter (2002) suggest ways to approach estimation with such contamination, but if registers capture true income, the measurement errors can be estimated by the difference between observed interview and register incomes.
By contrast, Kapteyn & Ypma (2007), allow for the possibility that both interview responses and register variables are measured with error. They model both kinds of incomes as being contaminated by measurement errors, but with ‘more’ errors affecting interview incomes. A consequence of their model is that the difference between interview and register incomes, which are often taken as observations of the measurement error in interview incomes, are negatively correlated with both observed types of income. That is, measurement errors are mean reverting. Using data from a combination of Swedish register and survey incomes (from a special subset of the LINDA database for which survey responses were sought), they find evidence for their model assumptions. Both survey and interview responses are characterised by mean-reverting errors, but the biases using survey incomes tend to be larger. Their conclusions suggest caution needs to be exercised in using administrative data and that they cannot, at least not in general, be considered to be error free.
Gottschalk & Huynh (2010) study the impact of non-classical measurement errors on estimates of earnings mobility, or, more precisely, estimates of the persistence of earnings across time. While classical measurement errors will lead to mobility being overstated (and persistence understated), the negative covariance of true income with measurement errors (the so-called mean-reversion property) work in the opposite direction. Thus, the real impact of measurement errors on mobility depends on the specific parameters.
4.3 Income distribution
4.3.1 Earnings
Rendtel et al. (2004) use data from the Finnish part of the European Community Household Panel in 1995 and 1999 to compare survey responses to different income questions with register information. Kapteyn and Ypma (2007) use a sample of Swedish respondents for whom Statistics Sweden collected both survey responses and register information for a number of income and wealth components. Table 4.1 below shows for both of these data sources how the presence of not of earnings for the same respondents line up in the two type of sources.
The results are quite similar, in that the vast majority of respondents correctly report that they either did or did not receive earnings during the calendar year. Respondents who did not in the administrative records receive any earnings are much more likely to report the same outcome in the interview – only 4.6 present in Sweden, and about 6 present in both year in Finland, report positive earnings in the interview even if the administrative records do not record any earnings. By contrast, between 13.7 (Finland, 1999) and 18.2 (Sweden) present of respondents for whom administrative records indicate at least some earnings report having none. This, of course, is problematic if zero earnings responses are used to, say, indicate joblessness – for many, then, this will be a false positive if based on interviews (see Lohman, 2011).
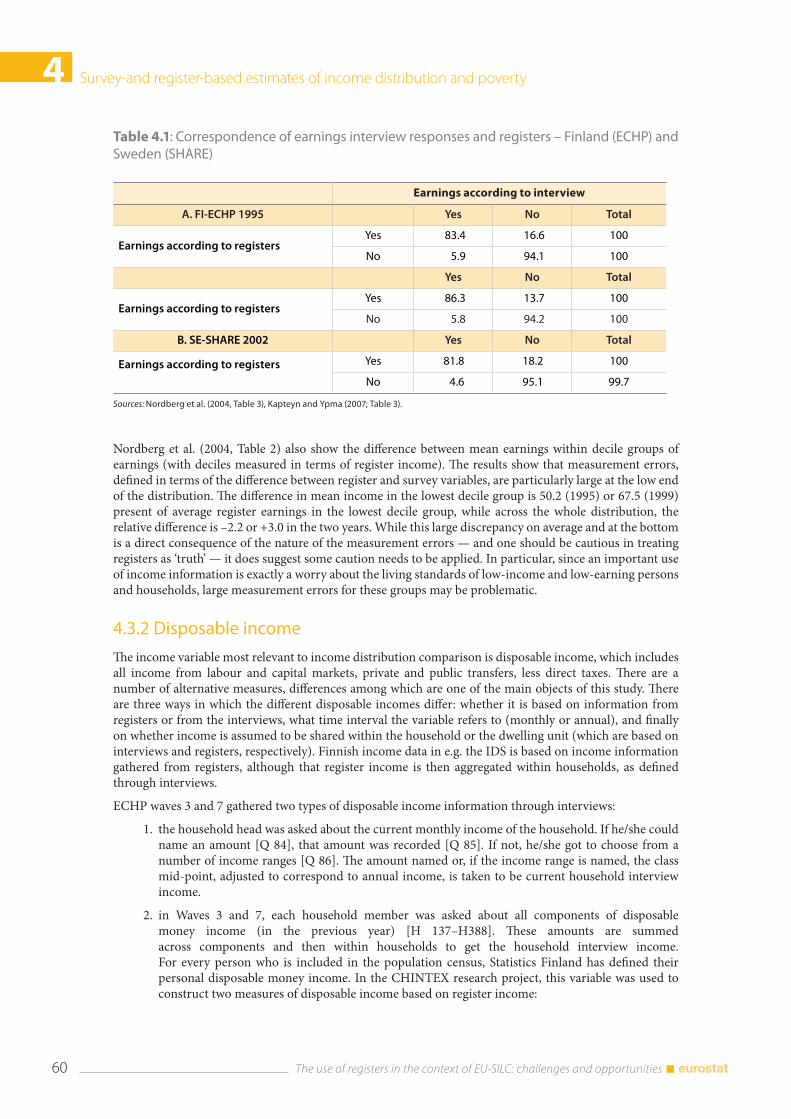
4 Survey-and register-based estimates of income distribution and poverty
The use of registers in the context of EU-SILC: challenges and opportunities 60
Nordberg et al. (2004, Table 2) also show the difference between mean earnings within decile groups of earnings (with deciles measured in terms of register income). The results show that measurement errors, defined in terms of the difference between register and survey variables, are particularly large at the low end of the distribution. The difference in mean income in the lowest decile group is 50.2 (1995) or 67.5 (1999) present of average register earnings in the lowest decile group, while across the whole distribution, the relative difference is –2.2 or +3.0 in the two years. While this large discrepancy on average and at the bottom is a direct consequence of the nature of the measurement errors — and one should be cautious in treating registers as ‘truth’ — it does suggest some caution needs to be applied. In particular, since an important use of income information is exactly a worry about the living standards of low-income and low-earning persons and households, large measurement errors for these groups may be problematic.
4.3.2 Disposable income
The income variable most relevant to income distribution comparison is disposable income, which includes all income from labour and capital markets, private and public transfers, less direct taxes. There are a number of alternative measures, differences among which are one of the main objects of this study. There are three ways in which the different disposable incomes differ: whether it is based on information from registers or from the interviews, what time interval the variable refers to (monthly or annual), and finally on whether income is assumed to be shared within the household or the dwelling unit (which are based on interviews and registers, respectively). Finnish income data in e.g. the IDS is based on income information gathered from registers, although that register income is then aggregated within households, as defined through interviews.
ECHP waves 3 and 7 gathered two types of disposable income information through interviews:
1. the household head was asked about the current monthly income of the household. If he/she could name an amount [Q 84], that amount was recorded [Q 85]. If not, he/she got to choose from a number of income ranges [Q 86]. The amount named or, if the income range is named, the class mid-point, adjusted to correspond to annual income, is taken to be current household interview income.
2. in Waves 3 and 7, each household member was asked about all components of disposable money income (in the previous year) [H 137–H388]. These amounts are summed across components and then within households to get the household interview income. For every person who is included in the population census, Statistics Finland has defined their personal disposable money income. In the CHINTEX research project, this variable was used to construct two measures of disposable income based on register income:
Table 4.1: Correspondence of earnings interview responses and registers – Finland (ECHP) and Sweden (SHARE)
Earnings according to interview
A. FI-ECHP 1995 Yes No Total
Earnings according to registersYes 83.4 16.6 100
No 5.9 94.1 100
Yes No Total
Earnings according to registersYes 86.3 13.7 100
No 5.8 94.2 100
B. SE-SHARE 2002 Yes No Total
Earnings according to registers
Yes 81.8 18.2 100
No 4.6 95.1 99.7
Sources: Nordberg et al. (2004, Table 3), Kapteyn and Ypma (2007; Table 3).
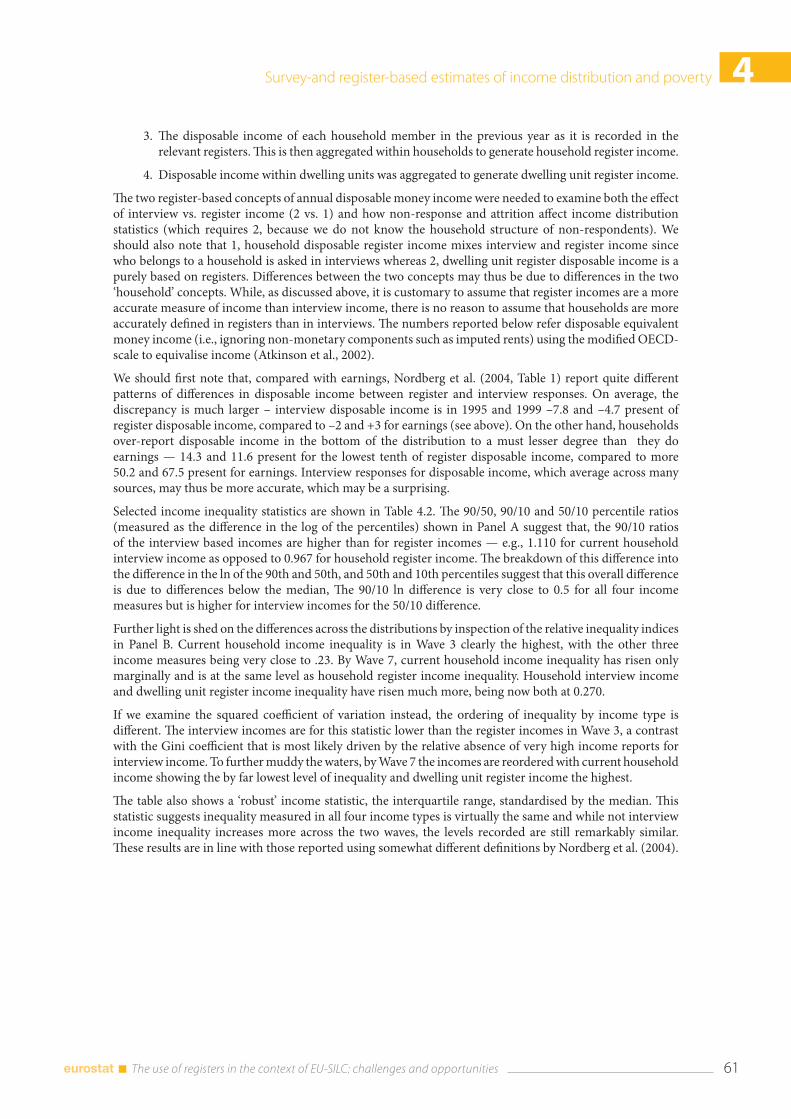
Survey-and register-based estimates of income distribution and poverty 4
61 The use of registers in the context of EU-SILC: challenges and opportunities
3. The disposable income of each household member in the previous year as it is recorded in the relevant registers. This is then aggregated within households to generate household register income.
4. Disposable income within dwelling units was aggregated to generate dwelling unit register income.
The two register-based concepts of annual disposable money income were needed to examine both the effect of interview vs. register income (2 vs. 1) and how non-response and attrition affect income distribution statistics (which requires 2, because we do not know the household structure of non-respondents). We should also note that 1, household disposable register income mixes interview and register income since who belongs to a household is asked in interviews whereas 2, dwelling unit register disposable income is a purely based on registers. Differences between the two concepts may thus be due to differences in the two ‘household’ concepts. While, as discussed above, it is customary to assume that register incomes are a more accurate measure of income than interview income, there is no reason to assume that households are more accurately defined in registers than in interviews. The numbers reported below refer disposable equivalent money income (i.e., ignoring non-monetary components such as imputed rents) using the modified OECD-scale to equivalise income (Atkinson et al., 2002).
We should first note that, compared with earnings, Nordberg et al. (2004, Table 1) report quite different patterns of differences in disposable income between register and interview responses. On average, the discrepancy is much larger – interview disposable income is in 1995 and 1999 –7.8 and –4.7 present of register disposable income, compared to –2 and +3 for earnings (see above). On the other hand, households over-report disposable income in the bottom of the distribution to a must lesser degree than they do earnings — 14.3 and 11.6 present for the lowest tenth of register disposable income, compared to more 50.2 and 67.5 present for earnings. Interview responses for disposable income, which average across many sources, may thus be more accurate, which may be a surprising.
Selected income inequality statistics are shown in Table 4.2. The 90/50, 90/10 and 50/10 percentile ratios (measured as the difference in the log of the percentiles) shown in Panel A suggest that, the 90/10 ratios of the interview based incomes are higher than for register incomes — e.g., 1.110 for current household interview income as opposed to 0.967 for household register income. The breakdown of this difference into the difference in the ln of the 90th and 50th, and 50th and 10th percentiles suggest that this overall difference is due to differences below the median, The 90/10 ln difference is very close to 0.5 for all four income measures but is higher for interview incomes for the 50/10 difference.
Further light is shed on the differences across the distributions by inspection of the relative inequality indices in Panel B. Current household income inequality is in Wave 3 clearly the highest, with the other three income measures being very close to .23. By Wave 7, current household income inequality has risen only marginally and is at the same level as household register income inequality. Household interview income and dwelling unit register income inequality have risen much more, being now both at 0.270.
If we examine the squared coefficient of variation instead, the ordering of inequality by income type is different. The interview incomes are for this statistic lower than the register incomes in Wave 3, a contrast with the Gini coefficient that is most likely driven by the relative absence of very high income reports for interview income. To further muddy the waters, by Wave 7 the incomes are reordered with current household income showing the by far lowest level of inequality and dwelling unit register income the highest.
The table also shows a ‘robust’ income statistic, the interquartile range, standardised by the median. This statistic suggests inequality measured in all four income types is virtually the same and while not interview income inequality increases more across the two waves, the levels recorded are still remarkably similar. These results are in line with those reported using somewhat different definitions by Nordberg et al. (2004).
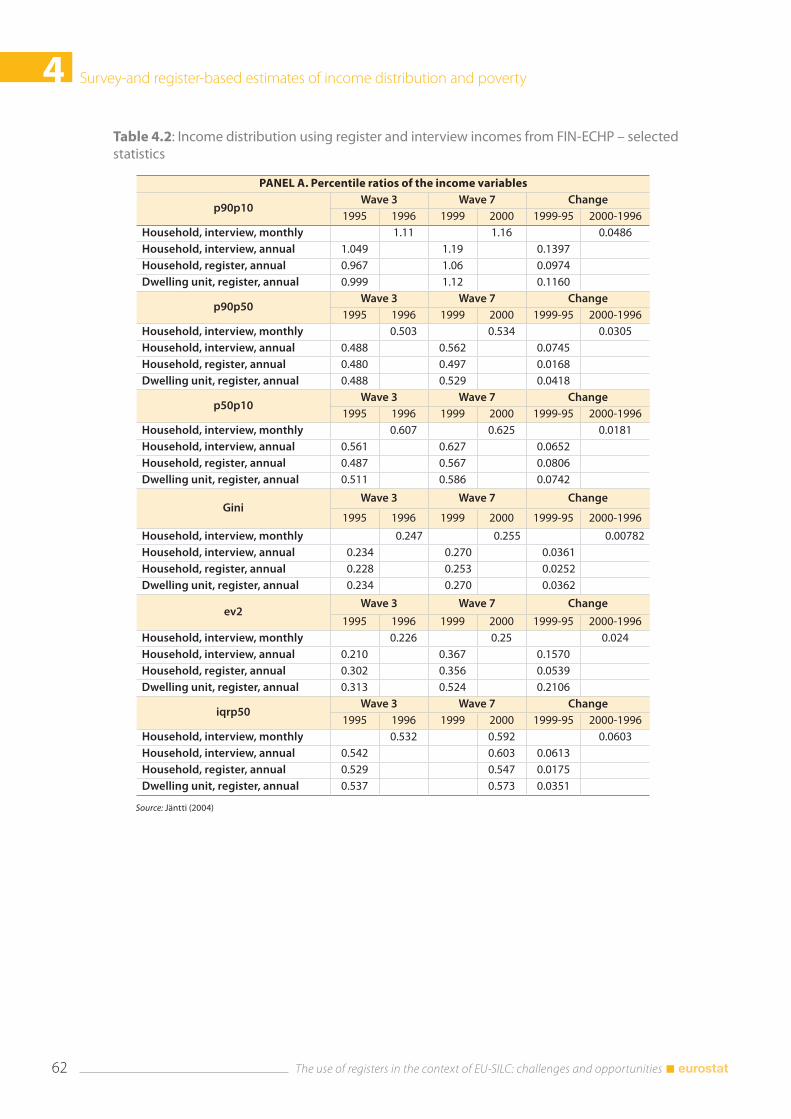
4 Survey-and register-based estimates of income distribution and poverty
The use of registers in the context of EU-SILC: challenges and opportunities 62
Table 4.2: Income distribution using register and interview incomes from FIN-ECHP – selected statistics
PANEL A. Percentile ratios of the income variables
p90p10Wave 3 Wave 7 Change
1995 1996 1999 2000 1999-95 2000-1996Household, interview, monthly 1.11 1.16 0.0486Household, interview, annual 1.049 1.19 0.1397Household, register, annual 0.967 1.06 0.0974Dwelling unit, register, annual 0.999 1.12 0.1160
p90p50Wave 3 Wave 7 Change
1995 1996 1999 2000 1999-95 2000-1996Household, interview, monthly 0.503 0.534 0.0305Household, interview, annual 0.488 0.562 0.0745Household, register, annual 0.480 0.497 0.0168Dwelling unit, register, annual 0.488 0.529 0.0418
p50p10Wave 3 Wave 7 Change
1995 1996 1999 2000 1999-95 2000-1996Household, interview, monthly 0.607 0.625 0.0181Household, interview, annual 0.561 0.627 0.0652Household, register, annual 0.487 0.567 0.0806Dwelling unit, register, annual 0.511 0.586 0.0742
GiniWave 3 Wave 7 Change
1995 1996 1999 2000 1999-95 2000-1996
Household, interview, monthly 0.247 0.255 0.00782Household, interview, annual 0.234 0.270 0.0361Household, register, annual 0.228 0.253 0.0252Dwelling unit, register, annual 0.234 0.270 0.0362
ev2Wave 3 Wave 7 Change
1995 1996 1999 2000 1999-95 2000-1996Household, interview, monthly 0.226 0.25 0.024Household, interview, annual 0.210 0.367 0.1570Household, register, annual 0.302 0.356 0.0539Dwelling unit, register, annual 0.313 0.524 0.2106
iqrp50Wave 3 Wave 7 Change
1995 1996 1999 2000 1999-95 2000-1996Household, interview, monthly 0.532 0.592 0.0603Household, interview, annual 0.542 0.603 0.0613Household, register, annual 0.529 0.547 0.0175Dwelling unit, register, annual 0.537 0.573 0.0351
Source: Jäntti (2004)
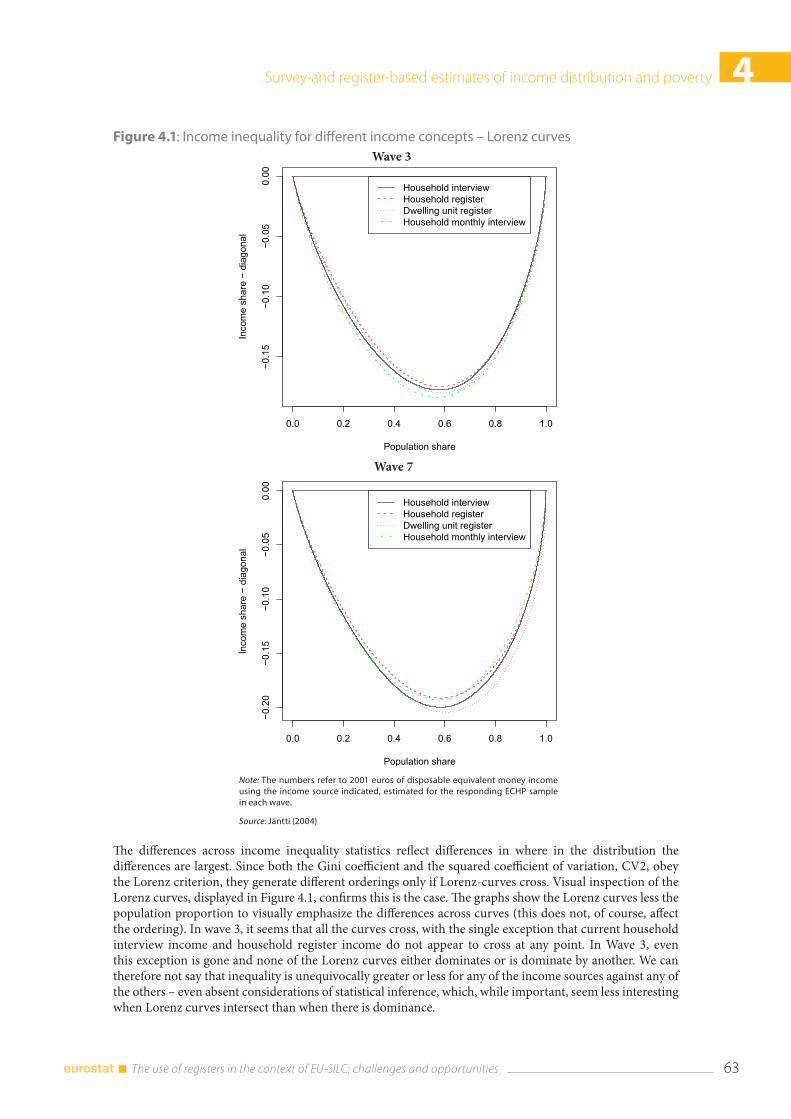
Survey-and register-based estimates of income distribution and poverty 4
63 The use of registers in the context of EU-SILC: challenges and opportunities
Figure 4.1: Income inequality for different income concepts – Lorenz curves
The differences across income inequality statistics reflect differences in where in the distribution the differences are largest. Since both the Gini coefficient and the squared coefficient of variation, CV2, obey the Lorenz criterion, they generate different orderings only if Lorenz-curves cross. Visual inspection of the Lorenz curves, displayed in Figure 4.1, confirms this is the case. The graphs show the Lorenz curves less the population proportion to visually emphasize the differences across curves (this does not, of course, affect the ordering). In wave 3, it seems that all the curves cross, with the single exception that current household interview income and household register income do not appear to cross at any point. In Wave 3, even this exception is gone and none of the Lorenz curves either dominates or is dominate by another. We can therefore not say that inequality is unequivocally greater or less for any of the income sources against any of the others – even absent considerations of statistical inference, which, while important, seem less interesting when Lorenz curves intersect than when there is dominance.
Wave 3
Wave 7
Note: The numbers refer to 2001 euros of disposable equivalent money income using the income source indicated, estimated for the responding ECHP sample in each wave.
Source: Jäntti (2004)
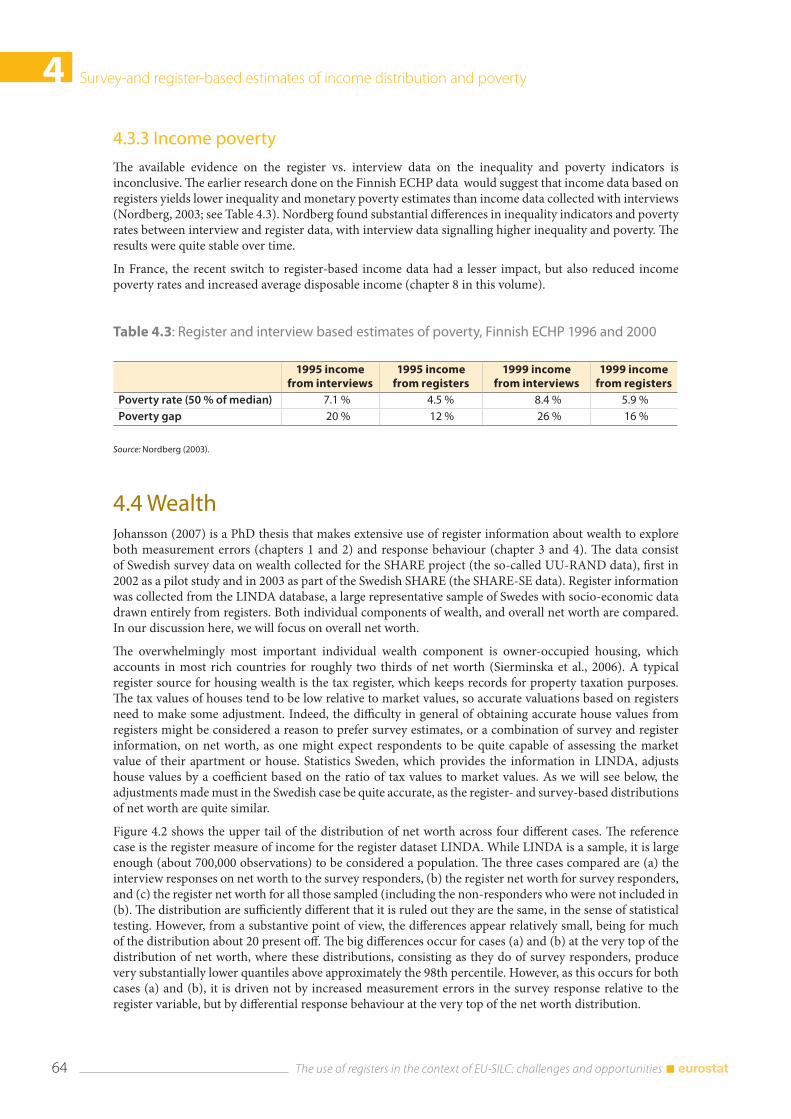
4 Survey-and register-based estimates of income distribution and poverty
The use of registers in the context of EU-SILC: challenges and opportunities 64
4.3.3 Income poverty
The available evidence on the register vs. interview data on the inequality and poverty indicators is inconclusive. The earlier research done on the Finnish ECHP data would suggest that income data based on registers yields lower inequality and monetary poverty estimates than income data collected with interviews (Nordberg, 2003; see Table 4.3). Nordberg found substantial differences in inequality indicators and poverty rates between interview and register data, with interview data signalling higher inequality and poverty. The results were quite stable over time.
In France, the recent switch to register-based income data had a lesser impact, but also reduced income poverty rates and increased average disposable income (chapter 8 in this volume).
Table 4.3: Register and interview based estimates of poverty, Finnish ECHP 1996 and 2000
1995 income from interviews
1995 income from registers
1999 income from interviews
1999 income from registers
Poverty rate (50 % of median) 7.1 % 4.5 % 8.4 % 5.9 %Poverty gap 20 % 12 % 26 % 16 %
Source: Nordberg (2003).
4.4 WealthJohansson (2007) is a PhD thesis that makes extensive use of register information about wealth to explore both measurement errors (chapters 1 and 2) and response behaviour (chapter 3 and 4). The data consist of Swedish survey data on wealth collected for the SHARE project (the so-called UU-RAND data), first in 2002 as a pilot study and in 2003 as part of the Swedish SHARE (the SHARE-SE data). Register information was collected from the LINDA database, a large representative sample of Swedes with socio-economic data drawn entirely from registers. Both individual components of wealth, and overall net worth are compared. In our discussion here, we will focus on overall net worth.
The overwhelmingly most important individual wealth component is owner-occupied housing, which accounts in most rich countries for roughly two thirds of net worth (Sierminska et al., 2006). A typical register source for housing wealth is the tax register, which keeps records for property taxation purposes. The tax values of houses tend to be low relative to market values, so accurate valuations based on registers need to make some adjustment. Indeed, the difficulty in general of obtaining accurate house values from registers might be considered a reason to prefer survey estimates, or a combination of survey and register information, on net worth, as one might expect respondents to be quite capable of assessing the market value of their apartment or house. Statistics Sweden, which provides the information in LINDA, adjusts house values by a coefficient based on the ratio of tax values to market values. As we will see below, the adjustments made must in the Swedish case be quite accurate, as the register- and survey-based distributions of net worth are quite similar.
Figure 4.2 shows the upper tail of the distribution of net worth across four different cases. The reference case is the register measure of income for the register dataset LINDA. While LINDA is a sample, it is large enough (about 700,000 observations) to be considered a population. The three cases compared are (a) the interview responses on net worth to the survey responders, (b) the register net worth for survey responders, and (c) the register net worth for all those sampled (including the non-responders who were not included in (b). The distribution are sufficiently different that it is ruled out they are the same, in the sense of statistical testing. However, from a substantive point of view, the differences appear relatively small, being for much of the distribution about 20 present off. The big differences occur for cases (a) and (b) at the very top of the distribution of net worth, where these distributions, consisting as they do of survey responders, produce very substantially lower quantiles above approximately the 98th percentile. However, as this occurs for both cases (a) and (b), it is driven not by increased measurement errors in the survey response relative to the register variable, but by differential response behaviour at the very top of the net worth distribution.
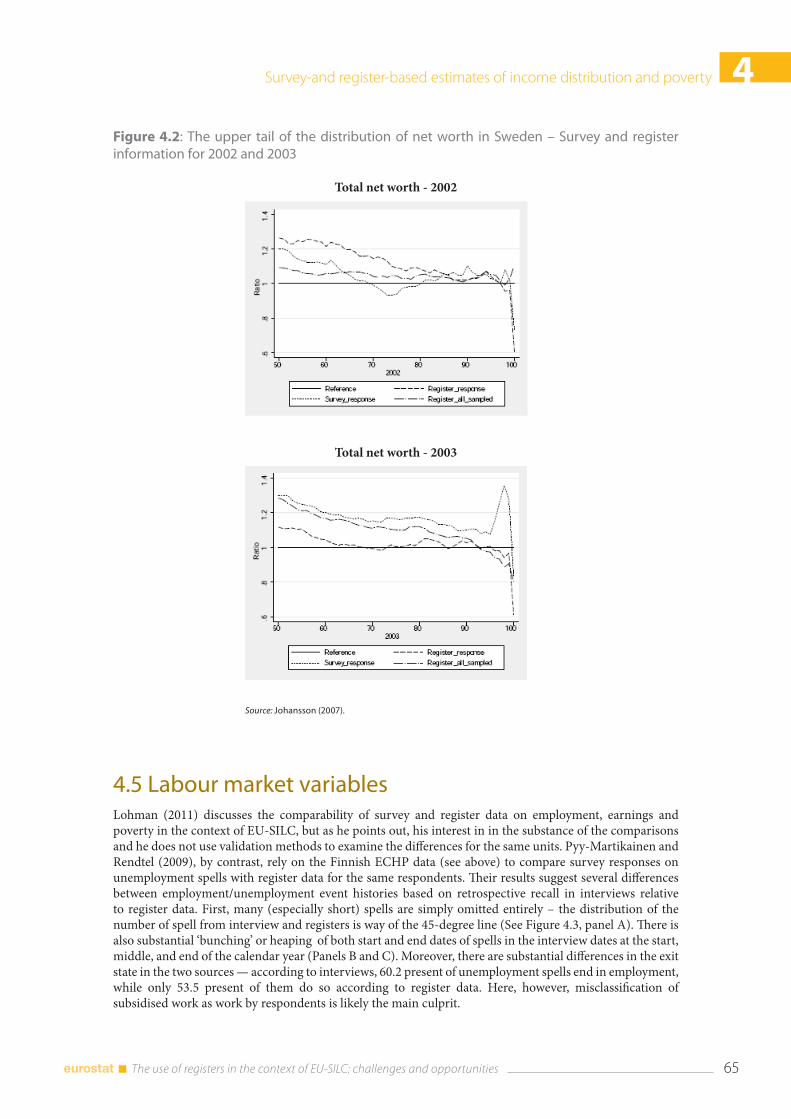
Survey-and register-based estimates of income distribution and poverty 4
65 The use of registers in the context of EU-SILC: challenges and opportunities
4.5 Labour market variablesLohman (2011) discusses the comparability of survey and register data on employment, earnings and poverty in the context of EU-SILC, but as he points out, his interest in in the substance of the comparisons and he does not use validation methods to examine the differences for the same units. Pyy-Martikainen and Rendtel (2009), by contrast, rely on the Finnish ECHP data (see above) to compare survey responses on unemployment spells with register data for the same respondents. Their results suggest several differences between employment/unemployment event histories based on retrospective recall in interviews relative to register data. First, many (especially short) spells are simply omitted entirely – the distribution of the number of spell from interview and registers is way of the 45-degree line (See Figure 4.3, panel A). There is also substantial ‘bunching’ or heaping of both start and end dates of spells in the interview dates at the start, middle, and end of the calendar year (Panels B and C). Moreover, there are substantial differences in the exit state in the two sources — according to interviews, 60.2 present of unemployment spells end in employment, while only 53.5 present of them do so according to register data. Here, however, misclassification of subsidised work as work by respondents is likely the main culprit.
Figure 4.2: The upper tail of the distribution of net worth in Sweden – Survey and register information for 2002 and 2003
Total net worth - 2002
Total net worth - 2003
Source: Johansson (2007).
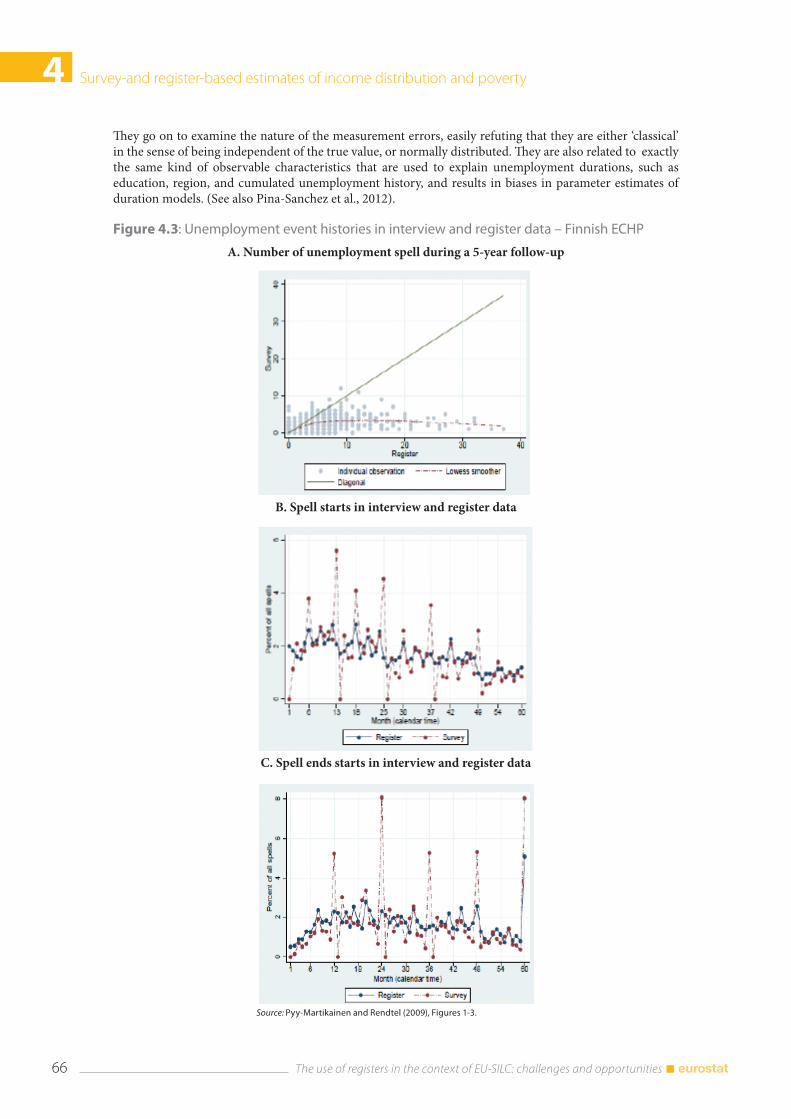
4 Survey-and register-based estimates of income distribution and poverty
The use of registers in the context of EU-SILC: challenges and opportunities 66
They go on to examine the nature of the measurement errors, easily refuting that they are either ‘classical’ in the sense of being independent of the true value, or normally distributed. They are also related to exactly the same kind of observable characteristics that are used to explain unemployment durations, such as education, region, and cumulated unemployment history, and results in biases in parameter estimates of duration models. (See also Pina-Sanchez et al., 2012).
Figure 4.3: Unemployment event histories in interview and register data – Finnish ECHP
A. Number of unemployment spell during a 5-year follow-up
B. Spell starts in interview and register data
C. Spell ends starts in interview and register data
Source: Pyy-Martikainen and Rendtel (2009), Figures 1-3.
Survey-and register-based estimates of income distribution and poverty 4
67 The use of registers in the context of EU-SILC: challenges and opportunities
4.6 Household structureRegister-based household definitions valid enough to allow a fully register-based Population and Housing Census have been available for a long-time in Denmark (Census 1980-) and Finland (Census 1990-). More recently, Norway and Sweden have constructed a register of households for statistical purposes (Census 2011). The unit error, which results from the different household definitions in the household registers and surveys, was already discussed in connection of unit errors in chapter 1. We now review some findings on the population-level distributions and implications for inequality and poverty measures.
Epland & Törmälehto (2007) compare register-based household distributions with the survey-based household distributions in Norway and Finland (see Table 4.4). The table below reproduces results for Norway relating to year 2004. The register-based ‘formal’ household is a household definition based on legal residence addresses, e. g. students are in most cases registered as part of their parents’ household. After several adjustments, the outcome is a ‘de facto’ adjusted measure of a household. The estimated survey household distribution is based on the EU-SILC compliant ‘housekeeping’ concept of a household. Epland (2012) concludes that there is in general good overlap between the register data and the survey estimates, and the transformation from the ‘formal’ to the ‘de facto’ household definition improves comparability to the survey estimates.
In general, the results from entirely register-based income statistics may differ from the sample surveys, which take the income data from registers, for three reasons. First, the statistical units may be different (persons, families, fiscal units, households) or measured differently (co-residence vs. shared essentials of living). Second, the income concepts may differ since not all income is captured in the entirely register-based concept. Third, the survey estimates have sampling error. Table 4.5 attempts to quantify the effects for Finland, based on Epland & Törmälehto (2007). In this specific case, both the register- based income and members of the dwelling unit were record linked to the selected respondents of the EU-SILC sample 2006 (data from 2005), and the sample estimates compared to the population distribution of the entirely register-based statistics.
The first column gives the sample estimates of low income and income inequality, i.e. the survey estimate of 12.8 present at risk of poverty rate and Gini-coefficient of 0.270. If, for the same persons in the sample, we would use the register-based income concept, the at-risk-of poverty rate would increase to 13.6 present and Gini to 0.275 (column two). These increases are almost completely due to the lack of inter-household transfers in the totally register-based income definition. In the third column, the register-based definitions are applied to the sample data . The change from the second column to the third column is taken to indicate the effect of different household concepts on indicators, implying a further increase in income poverty but a very slight decrease in inequality. Finally, the fourth column gives the indicators as population parameters from the total register-source. The difference between the third and the fourth column is here interpreted as sampling error, which seems to be negligible for at risk of poverty rate (this result is sensitive to the threshold, however). To summarise, of the 1.3 percentage point difference in at risk of poverty rates, about 0.8 percentage points would be due to different income definition, 0.4 percentage points due to different household definitions, and the definition-adjusted sample point estimate was quite close to true parameter values.
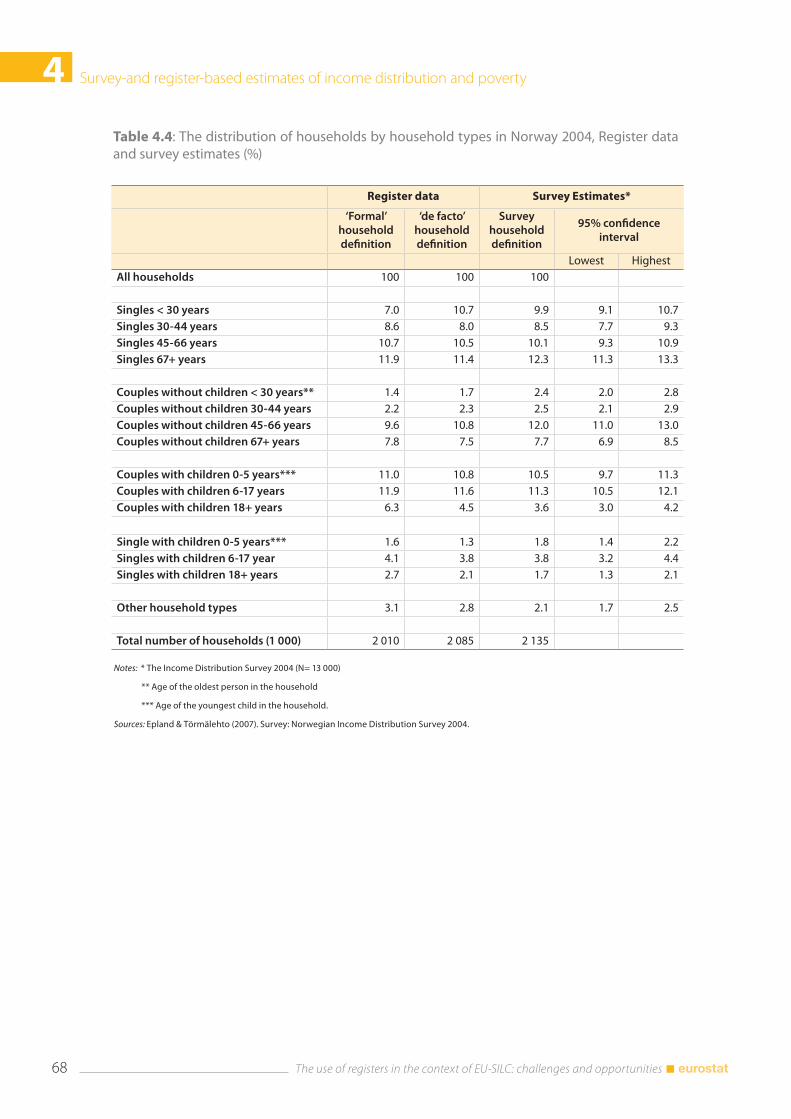
4 Survey-and register-based estimates of income distribution and poverty
The use of registers in the context of EU-SILC: challenges and opportunities 68
Table 4.4: The distribution of households by household types in Norway 2004, Register data and survey estimates (%)
Register data Survey Estimates*
‘Formal’ household definition
‘de facto’ household definition
Survey household definition
95% confidence interval
Lowest HighestAll households 100 100 100
Singles < 30 years 7.0 10.7 9.9 9.1 10.7Singles 30-44 years 8.6 8.0 8.5 7.7 9.3Singles 45-66 years 10.7 10.5 10.1 9.3 10.9Singles 67+ years 11.9 11.4 12.3 11.3 13.3
Couples without children < 30 years** 1.4 1.7 2.4 2.0 2.8Couples without children 30-44 years 2.2 2.3 2.5 2.1 2.9Couples without children 45-66 years 9.6 10.8 12.0 11.0 13.0Couples without children 67+ years 7.8 7.5 7.7 6.9 8.5
Couples with children 0-5 years*** 11.0 10.8 10.5 9.7 11.3Couples with children 6-17 years 11.9 11.6 11.3 10.5 12.1Couples with children 18+ years 6.3 4.5 3.6 3.0 4.2
Single with children 0-5 years*** 1.6 1.3 1.8 1.4 2.2Singles with children 6-17 year 4.1 3.8 3.8 3.2 4.4Singles with children 18+ years 2.7 2.1 1.7 1.3 2.1
Other household types 3.1 2.8 2.1 1.7 2.5
Total number of households (1 000) 2 010 2 085 2 135
Notes: * The Income Distribution Survey 2004 (N= 13 000)
** Age of the oldest person in the household
*** Age of the youngest child in the household.
Sources: Epland & Törmälehto (2007). Survey: Norwegian Income Distribution Survey 2004.
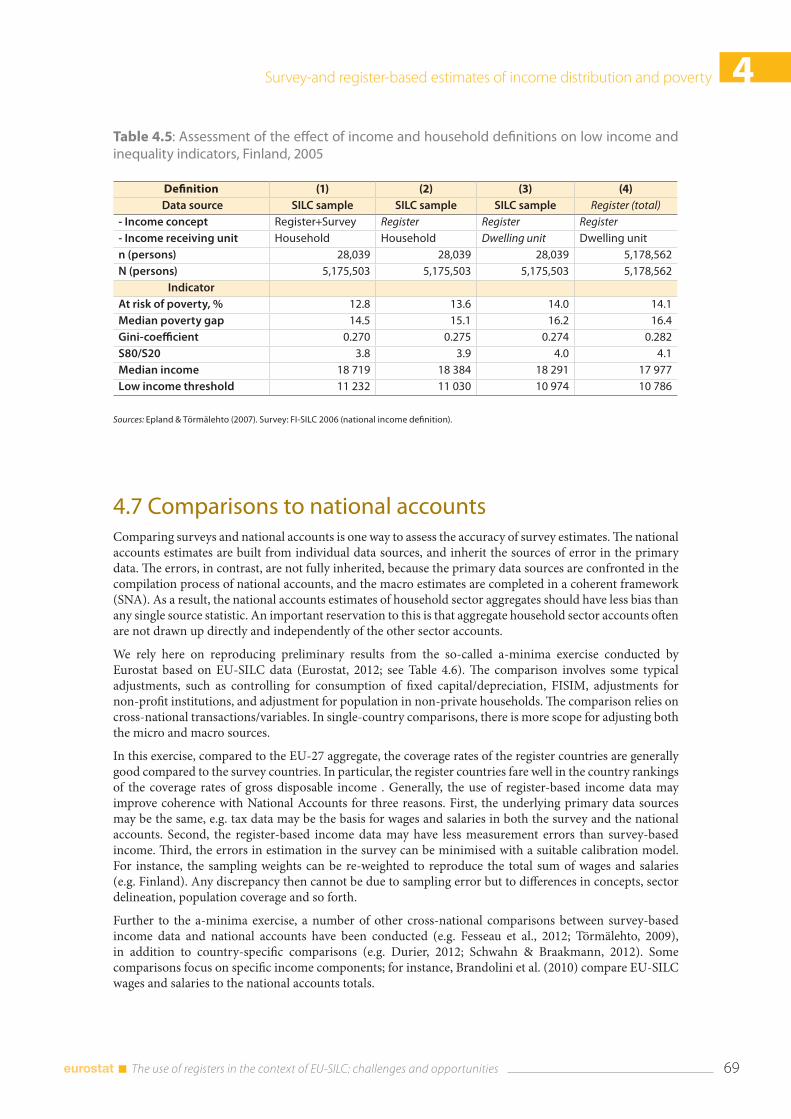
Survey-and register-based estimates of income distribution and poverty 4
69 The use of registers in the context of EU-SILC: challenges and opportunities
4.7 Comparisons to national accountsComparing surveys and national accounts is one way to assess the accuracy of survey estimates. The national accounts estimates are built from individual data sources, and inherit the sources of error in the primary data. The errors, in contrast, are not fully inherited, because the primary data sources are confronted in the compilation process of national accounts, and the macro estimates are completed in a coherent framework (SNA). As a result, the national accounts estimates of household sector aggregates should have less bias than any single source statistic. An important reservation to this is that aggregate household sector accounts often are not drawn up directly and independently of the other sector accounts.
We rely here on reproducing preliminary results from the so-called a-minima exercise conducted by Eurostat based on EU-SILC data (Eurostat, 2012; see Table 4.6). The comparison involves some typical adjustments, such as controlling for consumption of fixed capital/depreciation, FISIM, adjustments for non-profit institutions, and adjustment for population in non-private households. The comparison relies on cross-national transactions/variables. In single-country comparisons, there is more scope for adjusting both the micro and macro sources.
In this exercise, compared to the EU-27 aggregate, the coverage rates of the register countries are generally good compared to the survey countries. In particular, the register countries fare well in the country rankings of the coverage rates of gross disposable income . Generally, the use of register-based income data may improve coherence with National Accounts for three reasons. First, the underlying primary data sources may be the same, e.g. tax data may be the basis for wages and salaries in both the survey and the national accounts. Second, the register-based income data may have less measurement errors than survey-based income. Third, the errors in estimation in the survey can be minimised with a suitable calibration model. For instance, the sampling weights can be re-weighted to reproduce the total sum of wages and salaries (e.g. Finland). Any discrepancy then cannot be due to sampling error but to differences in concepts, sector delineation, population coverage and so forth.
Further to the a-minima exercise, a number of other cross-national comparisons between survey-based income data and national accounts have been conducted (e.g. Fesseau et al., 2012; Törmälehto, 2009), in addition to country-specific comparisons (e.g. Durier, 2012; Schwahn & Braakmann, 2012). Some comparisons focus on specific income components; for instance, Brandolini et al. (2010) compare EU-SILC wages and salaries to the national accounts totals.
Table 4.5: Assessment of the effect of income and household definitions on low income and inequality indicators, Finland, 2005
Definition (1) (2) (3) (4) Data source SILC sample SILC sample SILC sample Register (total)
- Income concept Register+Survey Register Register Register- Income receiving unit Household Household Dwelling unit Dwelling unitn (persons) 28,039 28,039 28,039 5,178,562N (persons) 5,175,503 5,175,503 5,175,503 5,178,562
IndicatorAt risk of poverty, % 12.8 13.6 14.0 14.1Median poverty gap 14.5 15.1 16.2 16.4Gini-coefficient 0.270 0.275 0.274 0.282S80/S20 3.8 3.9 4.0 4.1Median income 18 719 18 384 18 291 17 977Low income threshold 11 232 11 030 10 974 10 786
Sources: Epland & Törmälehto (2007). Survey: FI-SILC 2006 (national income definition).
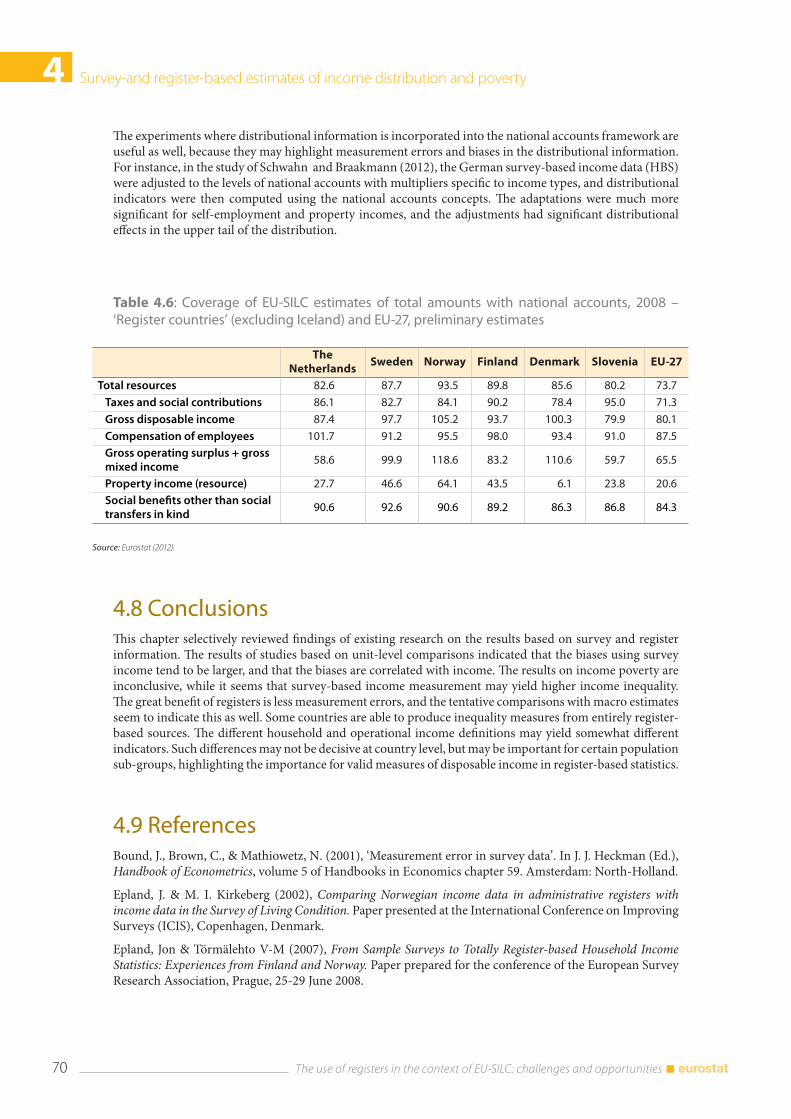
4 Survey-and register-based estimates of income distribution and poverty
The use of registers in the context of EU-SILC: challenges and opportunities 70
The experiments where distributional information is incorporated into the national accounts framework are useful as well, because they may highlight measurement errors and biases in the distributional information. For instance, in the study of Schwahn and Braakmann (2012), the German survey-based income data (HBS) were adjusted to the levels of national accounts with multipliers specific to income types, and distributional indicators were then computed using the national accounts concepts. The adaptations were much more significant for self-employment and property incomes, and the adjustments had significant distributional effects in the upper tail of the distribution.
Table 4.6: Coverage of EU-SILC estimates of total amounts with national accounts, 2008 – ‘Register countries’ (excluding Iceland) and EU-27, preliminary estimates
The Netherlands
Sweden Norway Finland Denmark Slovenia EU-27
Total resources 82.6 87.7 93.5 89.8 85.6 80.2 73.7
Taxes and social contributions 86.1 82.7 84.1 90.2 78.4 95.0 71.3
Gross disposable income 87.4 97.7 105.2 93.7 100.3 79.9 80.1
Compensation of employees 101.7 91.2 95.5 98.0 93.4 91.0 87.5 Gross operating surplus + gross mixed income
58.6 99.9 118.6 83.2 110.6 59.7 65.5
Property income (resource) 27.7 46.6 64.1 43.5 6.1 23.8 20.6 Social benefits other than social transfers in kind
90.6 92.6 90.6 89.2 86.3 86.8 84.3
Source: Eurostat (2012).
4.8 ConclusionsThis chapter selectively reviewed findings of existing research on the results based on survey and register information. The results of studies based on unit-level comparisons indicated that the biases using survey income tend to be larger, and that the biases are correlated with income. The results on income poverty are inconclusive, while it seems that survey-based income measurement may yield higher income inequality. The great benefit of registers is less measurement errors, and the tentative comparisons with macro estimates seem to indicate this as well. Some countries are able to produce inequality measures from entirely register-based sources. The different household and operational income definitions may yield somewhat different indicators. Such differences may not be decisive at country level, but may be important for certain population sub-groups, highlighting the importance for valid measures of disposable income in register-based statistics.
4.9 ReferencesBound, J., Brown, C., & Mathiowetz, N. (2001), ‘Measurement error in survey data’. In J. J. Heckman (Ed.), Handbook of Econometrics, volume 5 of Handbooks in Economics chapter 59. Amsterdam: North-Holland.
Epland, J. & M. I. Kirkeberg (2002), Comparing Norwegian income data in administrative registers with income data in the Survey of Living Condition. Paper presented at the International Conference on Improving Surveys (ICIS), Copenhagen, Denmark.
Epland, Jon & Törmälehto V-M (2007), From Sample Surveys to Totally Register-based Household Income Statistics: Experiences from Finland and Norway. Paper prepared for the conference of the European Survey Research Association, Prague, 25-29 June 2008.
Survey-and register-based estimates of income distribution and poverty 4
71 The use of registers in the context of EU-SILC: challenges and opportunities
Eurostat (2012), EU-SILC and households sector account. Document LC/71/12/EN presented at the Working Group meeting ‘Statistics on Living Conditions’, Luxembourg, 29-31 May 2012.
Fesseau, M., Wolff, F. & Mattonetti (2012), Micro and macro estimates of households economic resources: a cross-country data reconciliation. Paper prepared for the 32nd General Conference of the International Association for Research in Income and Wealth, Boston, USA, August 5-11, 2012.
Gottschalk, P. & Huynh, M. (2010), ‘Are earnings inequality and mobility overstated? The impact of non-classical measurement error’. The Review of Economics and Statistics, 92(2), 302–315.
Jäntti, M. (2004). ‘The Effect of Measurement Errors, Non-response and Attrition on Income Inequality, Poverty and Mobility’. In Ehling & Rendtel (2004), Harmonisation of Panel Surveys and Data Quality: CHINTEX: The Change from Input Harmonization to Ex-post Harmonization in National Samples of the European Community Household Panel – Implications on Data Quality’. Wiesbaden: Statistisches Bundesamt, pp. 89-116.
Johansson, F. (2007), Essays on Measurement Error and Nonresponse. PhD thesis, Uppsala University, Department of Economics.
Kapteyn, A. & Ypma, J. Y. (2007), ‘Measurement error and misclassification: A comparison of survey and administrative data’. Journal of Labor Economics, 25(3), 513–551.
Kavonius, I. & Törmälehto, V-M (2010), Integrating Micro and Macro Accounts – The Linkages between Euro Area Household Wealth Survey and Aggregate Balance Sheets for Households. Paper prepared for the 31st General Conference of the International Association for Research in Income and Wealth, St. Gallen, Switzerland, August 22-28 2010.
Lohman, H (2011), ‘Comparability of EU-SILC survey and register data: The relationship among employment, earnings and poverty’. Journal of European Social Policy, 21(1), 37-54.
Nordberg, L. (2003), An Analysis of the Effects of Using Interview versus Register Data in Income Distribution Analysis Based on the Finnish ECHP-surveys in 1996 and 2000, Chintex Working Paper #15, Work Package 5, December 22 2003.
Nordberg, L., Rendtel, U., and Basic, E. (2004), ‘Measurement error of survey and register income’. In Ehling and Rendtel (2004), Harmonisation of Panel Surveys and Data Quality: CHINTEX: The Change from Input Harmonization to Ex-post Harmonization in National Samples of the European Community Household Panel – Implications on Data Quality’. Wiesbaden: Statistisches Bundesamt, pp. 65–88.
Pina-Sánchez, J., Koskinen, J., & Plewis, I. (2012), Measurement error in retrospective reports of unemployment. CCSR Working Paper 2012-02, The Cathie March Centre for Census and Survey Research, University of Manchester.
Pyy-Martikainen, Marjo & Ulrich Rendtel (2009), ‘Measurement Errors in Retrospective Reports of Event Histories: A Validation Study with Finnish Register Data’. Survey Research Methods 3(3), 139-155.
Rodgers, W. L., Brown, C., & Duncan, G. J. (1993), ‘Errors in survey reports of earnings, hours worked, and hourly wages’. Journal of the American Statistical Association, 88(424), 1208–1218.
Schwahn, Florian and Albert Braakmann (2012), Income Distribution Results in National Accounts: Perspectives and Restrictions of the OECD Basic Approach in Micro-Macro-Integration. Paper prepared for the 32nd General Conference of the International Association for Research in Income and Wealth, Boston, USA, August 5-11, 2012.

The EU-SILC ‘Register countries’
II

EU-SILC and registers in the Nordic countries 5
75 The use of registers in the context of EU-SILC: challenges and opportunities
5. EU-SILC and registers in the Nordic countries: How administrative data are used for EU-SILC in Denmark, Finland, Iceland, Norway and Sweden
Thomas Helgeson(1)
Abstract: The European Union Statistics on Income and Living Conditions (EU-SILC) is the main source for statistics on income and living conditions in Europe. Most countries rely to a great extent on household surveys for producing the necessary data for EU-SILC. However some countries, including the Nordic countries, also use administrative or register data. This chapter presents how the use of register data affects EU-SILC in the Nordic countries. The main objective is to compare how the Nordic countries use register data with regards to EU-SILC and to try to find similarities and differences. Overall the structures of the administrative registers are very similar in the Nordic countries. There are some differences though; some of them affecting the design and implementation of the EU-SILC. Also, the countries have chosen slightly different methods when implementing the survey which in some cases could affect the survey results.
5.1 IntroductionThe EU Statistics on Income and Living Conditions (EU-SILC) started on the basis of a gentlemen’s agreement in 2003 at which time Denmark and Norway were the only Nordic countries participating in the survey. The rest of the Nordic countries, Finland, Iceland and Sweden, soon followed and since 2004 all Nordic countries perform the EU-SILC yearly.
The Nordic countries are, together with a few other European countries, rather unique in the sense that almost all social statistics are based on data from administrative registers. The main exceptions are the Labour Force Survey (LFS), the EU-SILC and a few other surveys where the information is based on a combination of administrative and survey data.
Using registers affects the whole survey process — from the design to the implementation of the survey. In the Nordic countries register data are used to a greater extent than most other European countries which means that register data has an even greater impact on the design of the study.
5.2 General register infra-structure in the Nordic countriesThe Nordic countries have been using administrative statistical registers since the middle of the 1960s. The first registers to be implemented were the Central Population Registers which were introduced at the same time as the Personal Identification Numbers (PIN). The PIN was soon used in other areas than CPRs such as taxation, national insurance, health care, driving license and education. After a while income statistics was being produced using administrative data as well and by the early 1970s register data was the main source for social statistics in the Nordic countries (Tønder, 2008).
During the middle of the1970s Business Identification Numbers (BIN) were introduced enabling the linkage of information to organizations. Personal identification numbers and Business identification numbers made
(1) Thomas Helgeson is from Statistics Sweden. I would like to thank Bo Møller at Statistics Denmark, Veli-Matti Törmälehto at Statistics Finland, Steinn Steinsson at Statistics Iceland, Jon Epland and Lotte Rustad Thorsen at Statistics Norway and Tommy Blomqvist at Statistics Sweden for kindly answering all questions. All errors remain my own. This work has been supported by the second Network for the analysis of EU-SILC (Net-SILC2), funded by Eurostat. The European Commission bears no responsibility for the analyses and conclusions, which are solely those of the author. Email address for correspondence: [email protected].
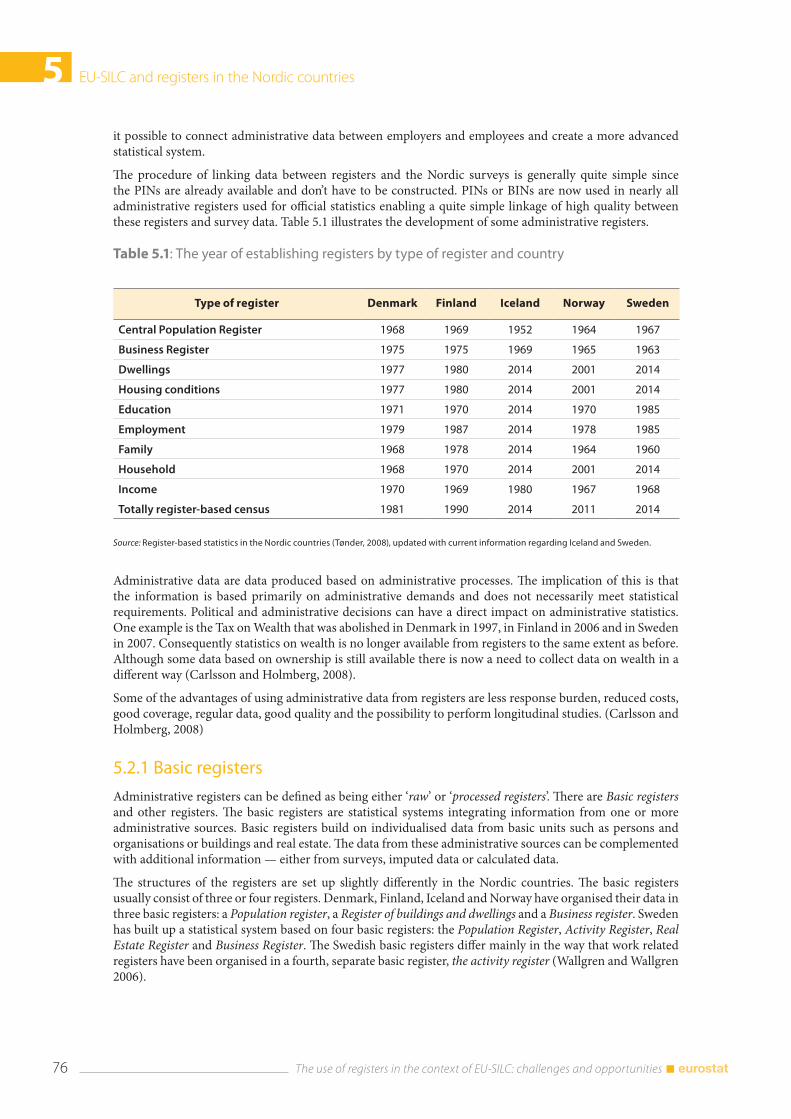
5 EU-SILC and registers in the Nordic countries
The use of registers in the context of EU-SILC: challenges and opportunities 76
it possible to connect administrative data between employers and employees and create a more advanced statistical system.
The procedure of linking data between registers and the Nordic surveys is generally quite simple since the PINs are already available and don’t have to be constructed. PINs or BINs are now used in nearly all administrative registers used for official statistics enabling a quite simple linkage of high quality between these registers and survey data. Table 5.1 illustrates the development of some administrative registers.
Table 5.1: The year of establishing registers by type of register and country
Type of register Denmark Finland Iceland Norway Sweden
Central Population Register 1968 1969 1952 1964 1967
Business Register 1975 1975 1969 1965 1963
Dwellings 1977 1980 2014 2001 2014
Housing conditions 1977 1980 2014 2001 2014
Education 1971 1970 2014 1970 1985
Employment 1979 1987 2014 1978 1985
Family 1968 1978 2014 1964 1960
Household 1968 1970 2014 2001 2014
Income 1970 1969 1980 1967 1968
Totally register-based census 1981 1990 2014 2011 2014
Source: Register-based statistics in the Nordic countries (Tønder, 2008), updated with current information regarding Iceland and Sweden.
Administrative data are data produced based on administrative processes. The implication of this is that the information is based primarily on administrative demands and does not necessarily meet statistical requirements. Political and administrative decisions can have a direct impact on administrative statistics. One example is the Tax on Wealth that was abolished in Denmark in 1997, in Finland in 2006 and in Sweden in 2007. Consequently statistics on wealth is no longer available from registers to the same extent as before. Although some data based on ownership is still available there is now a need to collect data on wealth in a different way (Carlsson and Holmberg, 2008).
Some of the advantages of using administrative data from registers are less response burden, reduced costs, good coverage, regular data, good quality and the possibility to perform longitudinal studies. (Carlsson and Holmberg, 2008)
5.2.1 Basic registers
Administrative registers can be defined as being either ‘raw’ or ‘processed registers’. There are Basic registers and other registers. The basic registers are statistical systems integrating information from one or more administrative sources. Basic registers build on individualised data from basic units such as persons and organisations or buildings and real estate. The data from these administrative sources can be complemented with additional information — either from surveys, imputed data or calculated data.
The structures of the registers are set up slightly differently in the Nordic countries. The basic registers usually consist of three or four registers. Denmark, Finland, Iceland and Norway have organised their data in three basic registers: a Population register, a Register of buildings and dwellings and a Business register. Sweden has built up a statistical system based on four basic registers: the Population Register, Activity Register, Real Estate Register and Business Register. The Swedish basic registers differ mainly in the way that work related registers have been organised in a fourth, separate basic register, the activity register (Wallgren and Wallgren 2006).
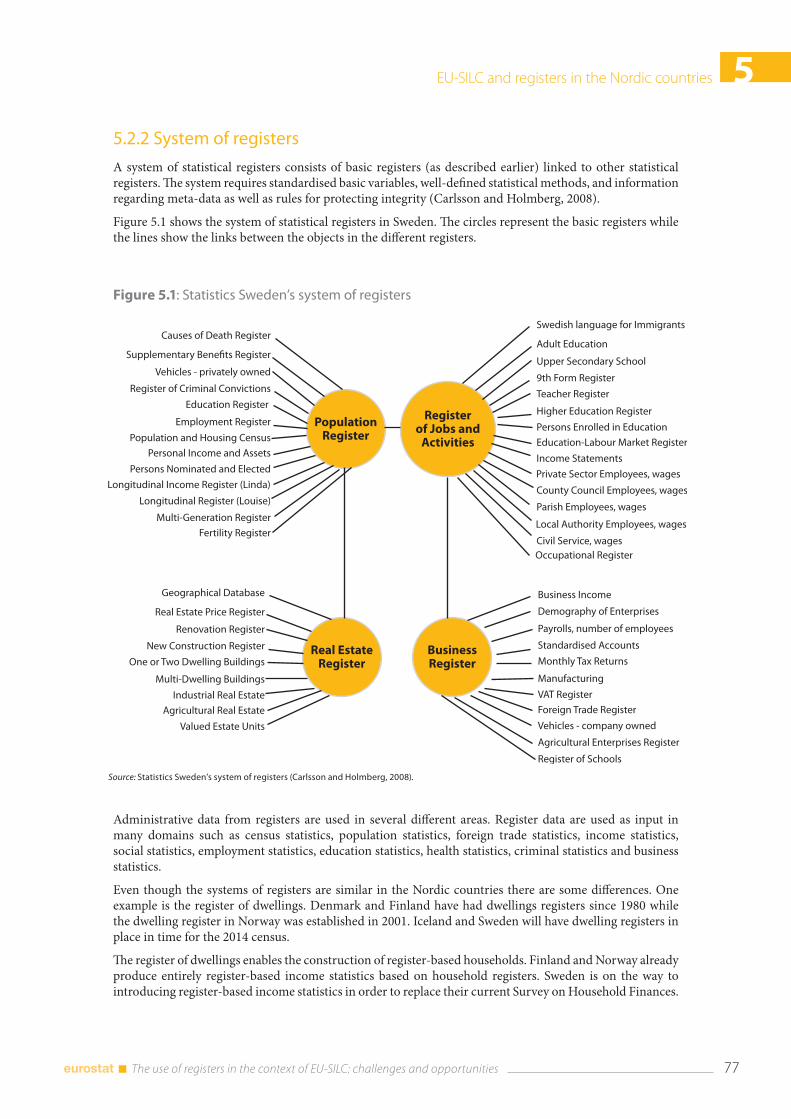
EU-SILC and registers in the Nordic countries 5
77 The use of registers in the context of EU-SILC: challenges and opportunities
5.2.2 System of registers
A system of statistical registers consists of basic registers (as described earlier) linked to other statistical registers. The system requires standardised basic variables, well-defined statistical methods, and information regarding meta-data as well as rules for protecting integrity (Carlsson and Holmberg, 2008).
Figure 5.1 shows the system of statistical registers in Sweden. The circles represent the basic registers while the lines show the links between the objects in the different registers.
Figure 5.1: Statistics Sweden’s system of registers
Source: Statistics Sweden’s system of registers (Carlsson and Holmberg, 2008).
Administrative data from registers are used in several different areas. Register data are used as input in many domains such as census statistics, population statistics, foreign trade statistics, income statistics, social statistics, employment statistics, education statistics, health statistics, criminal statistics and business statistics.
Even though the systems of registers are similar in the Nordic countries there are some differences. One example is the register of dwellings. Denmark and Finland have had dwellings registers since 1980 while the dwelling register in Norway was established in 2001. Iceland and Sweden will have dwelling registers in place in time for the 2014 census.
The register of dwellings enables the construction of register-based households. Finland and Norway already produce entirely register-based income statistics based on household registers. Sweden is on the way to introducing register-based income statistics in order to replace their current Survey on Household Finances.
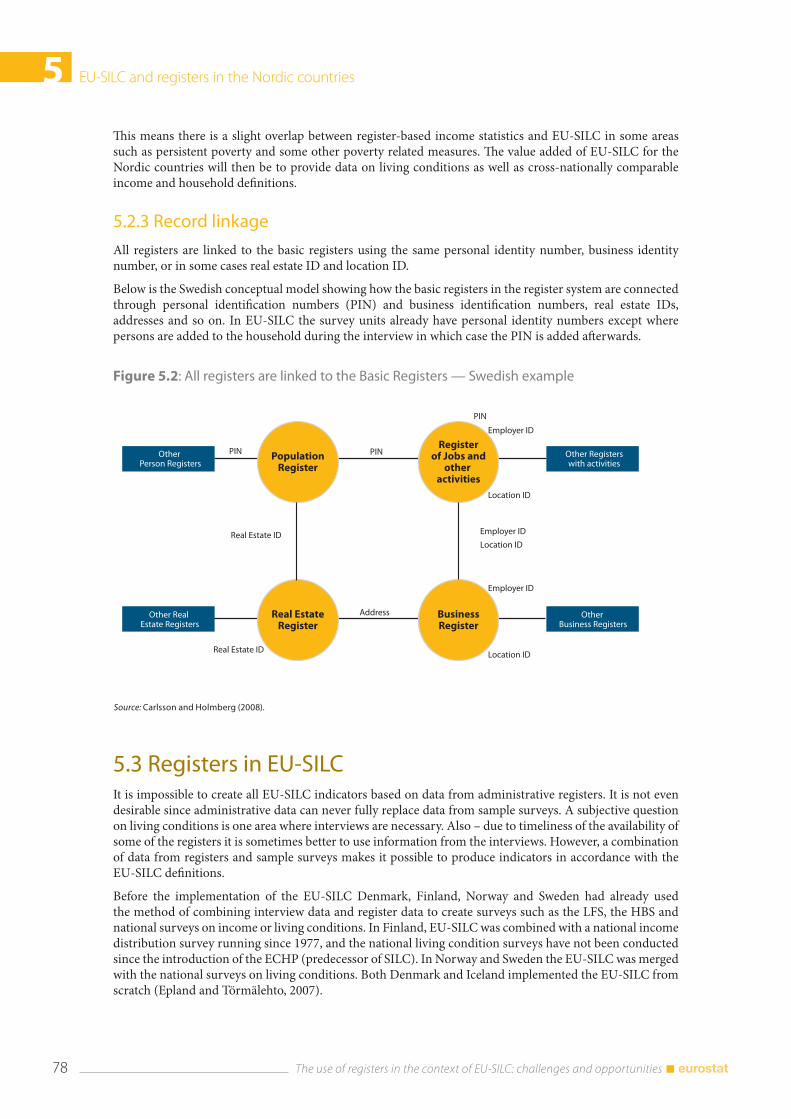
5 EU-SILC and registers in the Nordic countries
The use of registers in the context of EU-SILC: challenges and opportunities 78
Figure 5.2: All registers are linked to the Basic Registers — Swedish example
Source: Carlsson and Holmberg (2008).
This means there is a slight overlap between register-based income statistics and EU-SILC in some areas such as persistent poverty and some other poverty related measures. The value added of EU-SILC for the Nordic countries will then be to provide data on living conditions as well as cross-nationally comparable income and household definitions.
5.2.3 Record linkage
All registers are linked to the basic registers using the same personal identity number, business identity number, or in some cases real estate ID and location ID.
Below is the Swedish conceptual model showing how the basic registers in the register system are connected through personal identification numbers (PIN) and business identification numbers, real estate IDs, addresses and so on. In EU-SILC the survey units already have personal identity numbers except where persons are added to the household during the interview in which case the PIN is added afterwards.
5.3 Registers in EU-SILCIt is impossible to create all EU-SILC indicators based on data from administrative registers. It is not even desirable since administrative data can never fully replace data from sample surveys. A subjective question on living conditions is one area where interviews are necessary. Also – due to timeliness of the availability of some of the registers it is sometimes better to use information from the interviews. However, a combination of data from registers and sample surveys makes it possible to produce indicators in accordance with the EU-SILC definitions.
Before the implementation of the EU-SILC Denmark, Finland, Norway and Sweden had already used the method of combining interview data and register data to create surveys such as the LFS, the HBS and national surveys on income or living conditions. In Finland, EU-SILC was combined with a national income distribution survey running since 1977, and the national living condition surveys have not been conducted since the introduction of the ECHP (predecessor of SILC). In Norway and Sweden the EU-SILC was merged with the national surveys on living conditions. Both Denmark and Iceland implemented the EU-SILC from scratch (Epland and Törmälehto, 2007).
EU-SILC and registers in the Nordic countries 5
79 The use of registers in the context of EU-SILC: challenges and opportunities
Even though the Nordic countries are usually referred to as ‘register countries’ this doesn’t mean that register data fulfil all the needs in EU-SILC. Domains where registers are used for EU-SILC are personal basic variables, income, housing, education and occupation although to various extent. For example almost all income variables are collected from the national income registers. For housing, labour, education and occupation the use of registers vary even despite access of register data. In some cases the variable is based purely on register data, in some cases there is a mix of register and survey data and in other cases register data are used purely for checking information from the interviews.
Most other areas of EU-SILC depend on respondent information from interviews including health, living conditions, social activities, childcare and all variables based on a subjective perception of the respondent.
5.3.1 Prerequisites for using registers in EU-SILC
There are some requirements to be met before register data can be used for statistical purposes. There has to be reliable administrative registers that can be connected by using unified identification systems such as personal identification numbers. Also there is a need for legal requirements. In all Nordic countries the NSIs have the legal right to access and link administrative data on unit level for statistical purposes. There has to be a public acceptance of the use of register data and sometimes the respondent has to be informed about the use of registers in advance of the interview. The statistics has to provide guarantees of protecting confidentiality and privacy of the data (Tønder 2008).
5.3.2 Population registers
The basic demographic variables such as information on age, gender, date of birth, area of residence, marital status, country of birth, migration and citizenship, are collected from the national population registers. The registers are built up in similar ways in the Nordic and are updated daily. The population registers contain information on national citizens but also migrants permanently residing in each country. The sampling frame is the end of the year t-1.
5.3.3 Income registers
The income component is mainly based on data from the national income registers. There are many registers related to the income component including tax registers, social security registers and pension registers. Data from the income registers is usually available at the beginning of the year after the year of the interview (t+1). In the Swedish case all income related registers are fed into the register of income and taxation — a complete register containing all income information for individuals — from where data are fed to EU-SILC.
Income is recorded gross of taxes and social contributions. Net-to gross conversion is therefore not applicable for EU-SILC in the Nordic countries. Generally there is no need for imputations in the income component, as the quality of income data is regarded as being of high quality.
There are however some areas that aren’t fully covered by the income registers. The income registers lack information on undeclared work including work performed by irregular migrants. Also income from people working abroad is generally not covered by registers(2), which means that the income of cross border employees is underestimated if not taken care of during the interview(3). In Finland this problem is solved as wages and salaries as well as pensions for persons who have no taxable income or pension in Finland are collected through interviews.
There are also some specific income variables that are not available from registers or in some cases cannot be exactly deducted from registers. Regarding interest paid or received Denmark deducts interest paid from interest received since this is what’s available in the registers.
(2) Denmark is an exception. Income from abroad is collected by the Danish tax authorities. As the income is self-reported the quality is lower than the register-based domestic income.
(3) There is cross border commuting statistics produced by the Nordic statistical institutes (the Nordic statistical database StatNord: https://www.h2.scb.se/grs/Default.aspx ) in order to try to present figures over number of persons who live in one country and at the same time have a job in a neighbour country. However this data is aggregated and not available at individual level.
5 EU-SILC and registers in the Nordic countries
The use of registers in the context of EU-SILC: challenges and opportunities 80
In Iceland, inter-household transfers (HY080 and HY130) are based on interviews. Employee non-cash income (PY020 and PY021) is based both on interviews and registers. In Finland, inter-household transfers (HY080, HY130) are partially collected from interviews, as well as interest received (included in HY090G) because it is taxed at source. In Norway inter-household cash transfers (HY080G), alimonies received and paid (HY081G and HY131G) and interest repayments on mortgage (HY100G) are based on interviews. In Denmark and Sweden all income variables are based on registers. However regular inter-household cash transfers paid/received only refer to transactions between parents not living together. Other types of alimonies or cash transfers are not included.
Another exception is regular pensions from private plans as it is usually not possible to separate pensions from personal private schemes and employer-contributed pensions.
5.3.4 Other registers used in EU-SILC
The Building and Dwellings register can provide information on the dwelling such as the address, age of the building, number of flats, size and number of rooms and whether the flat has got bath and toilet. However, this is only used as auxiliary information and housing is mainly based on interview data(4).
Housing costs are generally based on interviews. However, for the construction of HH070, total housing cost, Denmark use information from a special register on the tax of the real estate, adding imputed values for other expenses from the household budget survey.
Information regarding the level of education is mostly collected from the national registers of education. Usually the information refers to the situation at the end of the year prior to the survey. In Denmark and Norway the reference period is October t-1. In Finland, current education is from September t-1, while other education variables are from the end of the year. In Sweden current education is collected during the interview while the level of education is taken from registers.
Data on occupation is generally collected through interviews since register data in most cases isn’t timely enough and also not fully comparable to survey data. Register data on occupation is sometimes used to check the data and sometimes (Finland) used for imputation of missing survey data. In Denmark data regarding occupation is collected from the occupational register. However the information is mainly used as preliminary information. During the interview this information is confirmed or changed depending on the answers from the respondent.
Denmark has created a new register, the E-income register, where the employer reports all wages monthly and which includes the ISCO-codes for occupation. For self-employed and persons where the ISCO code is not found in the register the coding is based on information from the interview.
Most of the other labour variables, such as activity status (PL031) and activity months (PL073) are collected from interviews. Number of months is in some cases (Finland) edited using register data.
Information regarding the industry of the workplace is constructed using both registers and interviews. Generally the information is based on survey data but coded using information from business registers. Usually the respondent is asked about the name and address of their workplace. The industry is then coded based on registers. In Finland data from the business registers are used as auxiliary data during the coding of the interviews. The main reason is that the information from registers is not always sufficiently valid to satisfy the requirements of the survey. In Denmark information regarding industry is solely constructed based on register data.
The household definition used in EU-SILC is common housekeeping, defined as sharing of income and expenses. In the register based statistics a household is defined according to the dwelling unit – the persons registered at the same address. However the dwelling-unit is not always identical to the household as defined in EU-SILC. The register household is therefore used as auxiliary information during the data collection and changed in order to agree with the household definition during the interview. (Törmälehto, 2008)
(4) Again Denmark is an exception where register data on dwellings to a greater extent are used as they are.
EU-SILC and registers in the Nordic countries 5
81 The use of registers in the context of EU-SILC: challenges and opportunities
5.4 Impact of registers on the EU-SILCUsing register data as the basis for the EU-SILC impacts the survey in several ways. It involves all processes from the design, sampling, processing and evaluation of the data. For the sampling the base registers are used as the sampling frame. In the countries that apply stratified sampling register variables are used to stratify the population. When designing the questionnaire the access to register data eliminates the need to ask for the data in existing records.
5.4.1 Design
Having access to register data affects the design of survey. Collecting income data mainly from registers has a lot of advantages. By using register data for some variables the questionnaires can be shorter compared to a full interview covering all variables. One of the main advantages of using register data is that it minimises the need to ask questions regarding issues that can be found in the administrative data. This helps saving both time and money. It also increases the quality of the survey data.
The Nordic countries use the sampled respondent design which means that the selected respondent is drawn from the register of individuals. This means that in most cases only one person in the household is interviewed — compared to all household members in the survey countries. The sampled respondent, that is the initially selected person, is the only person who is followed in the longitudinal part. Any other members or split-offs of the family are not followed.
When using the sampled respondent method the household is composed around the selected respondent. The CATI and (in Denmark) the CAWI questionnaire is pre-filled with register-based household information. In Finland, Iceland and Norway this information is corrected with the help of questions during the interview. In Sweden the pre-filled information is used as a kind of help for the interviewer. The household is primarily based on information from the respondent but the pre-filled register data makes it easier for the interviewer to arrive at the correct household composition.
All Nordic countries except Norway use the standard four-year rotational design. Until 2011 Norway followed the respondent during eight years in the longitudinal part. From 2012 Norway is replacing the eight-year design with the standard four-year design.
Before the start of the interviews some of the personal variables are collected from registers using record linkage. By using registers for most parts of the personal income data the questionnaire can be shorter compared to a full interview. Some parts of the income still need to be collected through the interview though.
5.4.2 Timing
The use of registers in EU-SILC sets time restrictions on the freshness of the data. Late availability of registers, delay in the processing of the data, could imply problems of meeting the requirements for the transmission of data to Eurostat. At the moment timeliness is not a problem since all registers used for EU-SILC are available and updated well ahead of the Eurostat deadlines.
There are many different reference periods in the EU-SILC such as at the time of the interview (current), previous, week, four previous weeks, income reference period, last twelve months, at the time of selection or compared to the year before the time of the interview. Besides adding to the cognitive burden in the interview, this may cause variation in the time lag between the (current) non-income variables and the income variables relating to the previous calendar year. The fieldwork periods are, however, not that different with the exception of Sweden.
5.4.2.1 Timeliness of registers
There is a lag from when the information is reported into the registers to when the registers are up to date and ready to use. For the tax information it is necessary to wait until the final tax returns the year after the income reference year. Similar timing issues can be found in other registers that aren’t updated or available on a daily or monthly basis. Data from registers is usually available between December t (relating to t-1) and

5 EU-SILC and registers in the Nordic countries
The use of registers in the context of EU-SILC: challenges and opportunities 82
February t+1 in all Nordic countries. However this doesn’t result in any problems with regards to delivering data to Eurostat since the deadline for delivering data is currently at least 6 months after the last register data are available.
5.4.2.2 Reference periods and timing of field work
The Nordic countries generally use the same set of reference periods for the different indicators in EU-SILC although Sweden has chosen current (time of the interview) for more variables probably due to the choice of doing a continuous survey.
Current (time of the interview) is generally used for the non-monetary household deprivation indicators, housing indicators related to amenities in the dwelling, one education variable and health. In Iceland and Sweden the time of the interview is also used for basic data, physical and social environment, the rest of the housing conditions and childcare.
Current (set to last day of the income reference period) is in Finland used for basic data, physical and social environment and the housing indicators related to dwelling type, tenure status and housing conditions.
Current (set to last month of the income reference period) is used for child care (except in Iceland and Sweden), and for labour information (except Sweden) on current activity status and current main job, detailed labour information and a part of the housing costs (except Sweden).
Last twelve months preceding the interview is used for access to health care in all countries and for the labour activity status in Sweden. The moving 12-months reference period used for activity status in Sweden is based on questions from the interview about the activity for each month preceding the interview. Since the income is based on the full year t-1 it means that activity and income is not fully coherent in the Swedish case.
The income reference year t-1 is used for indicators related to income, housing and non-housing related arrears, and some of the housing costs. In all countries except Sweden the income reference year is also used for the labour activity status.
The gap between the income reference period and the time of the interview is sometimes a problem. Finland has tried to solve this problem by setting ‘current’ as the time at the end of the year and try to perform the fieldwork during the first part of the year. In contrast the Swedish field work takes place throughout the full year.
As is shown in Figure 5.3 Denmark, Finland, Iceland and Norway have chosen to perform the field work during the first part of the year. Sweden has adopted the method of continuous survey throughout the year starting the field work in February and ending in December.
Figure 5.3: Field work period for the 2010 operation of EU-SILC
Source: EU-SILC Comparative Intermediate Quality Report 2010 (Eurostat).
EU-SILC and registers in the Nordic countries 5
83 The use of registers in the context of EU-SILC: challenges and opportunities
5.4.3 Sampling
In EU-SILC the statistical units are persons and households. The survey design applicable for countries using registers such as the Nordic countries is the selected respondent method. This means that the samples are drawn from individuals. One person aged 16 or older is interviewed. The household is then defined as the household the selected person belongs to at the start of the survey.
The sample is drawn from the national registers of population. The sampled person has to turn 16 years during the survey year. The sample is then supplemented with those who have immigrated since the panel was drawn. People living in institutions are excluded from the sample. In Denmark addresses with more than a certain number of people will be identified as living in institutions and deleted from the sample.
Based on this sample a new sample is drawn. This sampling is performed slightly different in the Nordic countries. Denmark, Iceland and Norway use simple random sampling. Finland uses a stratified two-phase sampling. Sweden is the only country using systematic sampling without stratification. From 2012 Sweden use simple random sampling. The sampling frames are the basic population registers. Register variables can be used for making stratified samples.
5.4.4 Processing
During the early stages of the implementation of EU-SILC both personal and telephone interviews were used for collecting data. However computer-aided-telephone-interviews (CATI) are now the main method in all Nordic countries except Denmark. Denmark has recently implemented computer aided web interviews (CAWI) and has an increasing share of web interviews. At this stage (2012) 56 % of the Danish interviews are web based.
Denmark is the first Nordic country to use online web surveys for the EU-SILC. The first step of the process is that a letter is sent out to the sampled person with information on the survey and a logon ID for the respondent to use for logging on to the web survey. If the respondent doesn’t participate in the web survey Statistics Denmark tries to perform a telephone interview using CATI. The final option, if there hasn’t been any success with neither online nor phone interview, is to send the respondent a paper interview.
In the rest of the Nordic countries CATI is still the prevailing method. In Finland roughly half of the interviews are done by calling mobile phones, sometimes outside the respondent’s home. If the household is very large, or if the respondent lacks a phone, the interviewer is allowed to change the mode into computer aided personal interview (CAPI).
As the sample is drawn from individuals the respondent is sometimes asked about information regarding other members of the household. It could be household economy, household debts, child care, housing items or the other household members’ activities. As a result the Nordic countries(5) have quite high rates of proxy interviews concerning personal interviews. One example from Norway is the employment status where only 35 per cent of the household members answered this question themselves.
The different proxy rates depend on slightly different views on deciding when to interview another member of the household on household related issues instead of the selected respondent. In Finland the interviewers are trained to decide when to allow another household member for the interview. In Denmark there are more formal rules. An example is the case where the selected respondent is younger than 25 years and is living with their parents. One of the parents is then interviewed regarding household related questions.
5.4.5 Data processing and evaluation of the data
Using register data during the estimation phase improves the quality of the adjustments of the weights.
5.4.5.1 Weighting and post-stratification
Using register data provides a lot of information that can be used for weighting and post-stratification. The weights are usually used for adjusting the sampling weights in order to improve quality of the
(5) This relates to all Nordic countries except Sweden. It seems that Sweden either reports proxy interviews differently than the other Nordic countries or have fewer actual cases of proxy interviews.
5 EU-SILC and registers in the Nordic countries
The use of registers in the context of EU-SILC: challenges and opportunities 84
(6) Finland uses different methods (mean/median imputation, a regression model, hot deck and other methods to a small extent) to impute interview-based income and consumption data (interest received, housing costs).
estimates. Denmark uses weights based on register information for age, sex household type, household size, socioeconomic status the previous year, educational level, income deciles and below or above ROP 60. In Iceland the weights are based on sex, age and area of residence and then calibrated to totals for the subgroups of these variables. Norway uses weights based on sex, age, family size and education. In Finland, the weights are calibrated to demographic variables (age and sex, area of residence, household size) and income data (total sums of several income variables and number of recipients of main income variables). Non-private households are excluded from the external benchmarks.
In Sweden the weights are only calibrated according to gender and age intervals. The main reason for using this quite basic method is that it’s seen as simple and robust. For the yearly estimates it would be possible to calibrate the data using more variables. For the longitudinal data the process would be more complicated.
5.4.5.2 Editing and imputation
Usually a control mechanism is built into the electronic questionnaire which decreases the need for post data control and editing. One example is Norway where all selections are done automatically by the programme to reduce the risk of manual errors. All numeric variables have absolute limits. For example the number of hours worked per week cannot exceed the value of 168. There are also built in checks when it comes to year and date of birth and checks against extreme values.
Regarding imputation Finland is the Nordic country using imputation to the greatest extent(6). Norway uses imputation for estimating housing costs (HH070). Iceland uses imputation for utilities based on the household budget survey and also estimate insurance based on estimated household value from the household register. Repairs and maintenance costs are based on interviews whereas mortgage interest payments come from registers. Denmark and Sweden don’t perform any imputations in EU-SILC except for imputed rent.
5.4.5.3 Evaluation of the data
Some of the countries perform (more or less frequently) coherence comparisons with other statistical sources, for example the Household Budget Survey (HBS), the Labour Force Survey (LFS), the National Income definition or the National Accounts. Additionally some countries compare the data with administrative resources. According to the quality reports, the countries that do not perform comparisons with other data refer to the fact that they use register data and that this is the reason why coherence checks aren’t necessary (Eurostat 2010). In Finland, the coherence is checked also with respect to register-based statistics to reveal potential errors in estimation.
5.5 Summary and conclusionsOverall the structures of the administrative registers are very similar in the Nordic countries. There are differences though; some of them affecting the set-up of the EU-SILC. Also the countries have sometimes interpreted the regulations regarding EU-SILC slightly differently. Since the EU-SILC is an output-harmonised survey there is also room for choosing methods adapted to the local circumstances.
The structures of the registers are set up slightly differently in the Nordic countries. The basic registers usually consist of three or four registers. Denmark, Finland, Iceland and Norway have organised their data in three basic registers: a Population register, a Register of buildings and dwellings and a Business register. Sweden has built up a statistical system based on four basic registers: the Population Register, Activity Register, Real Estate Register and Business Register. This doesn’t seem to have any practical implications on the EU-SILC though.
The population and dwelling registers are more (Denmark, Finland and Norway) or less (Iceland and Sweden) developed which has implications on the use of the registers for creating households for EU-SILC. In a few years’ time though, all Nordic countries will be using similar population registers which would imply similar conditions for EU-SILC in all countries.
EU-SILC and registers in the Nordic countries 5
85 The use of registers in the context of EU-SILC: challenges and opportunities
The sampling is performed slightly different in the Nordic countries. Denmark, Norway and Sweden use simple random sampling while Finland uses a stratified two-phase sampling. Iceland uses post-stratified simple random sampling. All countries sample individuals instead of addresses, and follow the so-called selected respondent design, wherein mostly only one adult is interviewed and household splits are not followed in the longitudinal part.
All Nordic countries mainly use CATI as the main method for interviewing except Denmark — where now almost 6 in 10 interviews are performed through web interviews (CAWI).
The field work is set up differently. In Denmark, Finland, Iceland and Norway the field work takes place during the first part of the year. Sweden performs a continuous survey throughout the year.
The reference periods are in some cases a bit different. One example is the activity status which in Sweden is seen as the twelve months preceding the time of the interview whereas in Finland it is seen as the full calendar year ahead of the interview — or the same year as the income year.
According to the national EU-SILC quality reports only Finland and Norway actually perform coherence studies with other statistical sources. Increased use of register data in other, similar surveys will mean better opportunities to perform analysis in order to further enhance the quality of the EU-SILC data.
5.6 ReferencesCarlsson, F. and Holmberg, A. (2008), ‘Availability, Infrastructure, Use and Reuse of administrative Data in Statistical Production — A Scandinavian Example.’ Paper prepared for the Seventh Management Seminar for the Heads of National Statistical Offices in Asia and the Pacific 13-15 October 2008, Shanghai, China. Available at: http://www.unsiap.or.jp/ms/ms7/swedish_ms7.ppt.
Epland, J. and Törmälehto, V-M. (2007), ‘From Sample Surveys to Totally Register-based Household Income Statistics: Experiences from Finland and Norway.’ Paper prepared for the conference of the European Survey Research Association, 25-29 June 2008, Prague, Czech Republic.
Eurostat (2009), ‘Comparative EU Intermediate Quality Report Version 3 — July 2011 (Doc LC 61/11/EN rev.1)’, Annex 2: Sampling Design. Available at: http://epp.eurostat.ec.europa.eu/portal/page/portal/income_social_inclusion_living_conditions/quality/eu_quality_reports.
Eurostat, Intermediate and Final Quality reports for Denmark, Finland, Iceland, Norway and Sweden regarding the 2009 and 2010 SILC Operations. Available at: http://epp.eurostat.ec.europa.eu/portal/page/portal/income_social_inclusion_living_conditions/quality/national_quality_reports.
Tønder, J.-K. (2008), ‘The Register-based Statistical System.’ Paper prepared for the International Association for Official Statistics Conference in Shanghai, October 14–18, 2008.
Törmälehto, V.-M. (2008), ‘Social Statistics — integrated use of survey and administrative data at Statistics Finland.’ Paper prepared for the International Association for Official Statistics Conference on Reshaping Official Statistics, Shanghai 2008.
Törmälehto, V.-M. and Jäntti, M. (2012), ‘Combining sample surveys and registers — an overview in the context of EU-SILC’ (DRAFT). Paper prepared for the Net-SILC2 workshop on the use of registers in the context of EU-SILC, Vienna, Austria 2012.
Wallgren, A. and Wallgren, B. (2006), ‘Register-Based Statistics — Administrative Data for Statistical Purposes.’ John Wiley & Sons Ltd.

EU-SILC and registers in Slovenia 6
87 The use of registers in the context of EU-SILC: challenges and opportunities
6. EU-SILC and registers in Slovenia
Rihard Tomaž Inglič(1)
Abstract: EU-SILC was the first sample survey in which the Statistical Office of the Republic of Slovenia began to use administrative sources in 2005. In the beginning it was necessary to find out if all conditions for using administrative sources were met – the legal basis, the quality of the administrative data, timeliness of the data, etc. The chapter describes which sources are used in EU-SILC in Slovenia and presents several analyses that were done. The data about activity status from administrative sources and from the questionnaire are compared, as are the share of imputed data for income and the coherence with the data from the Household Budget Survey, where no administrative data were used. The final findings are that using administrative sources has a lot of advantages but also some disadvantages.
6.1 IntroductionEU Statistics on Income and Living Conditions (EU-SILC) is a harmonised survey, which is conducted in all EU Member States and additionally also in some other countries such as Norway, Island and Switzerland. EU-SILC has been conducted in Slovenia from 2005 on; before 2005, two waves of the pilot survey were conducted in 2003 and 2004. The legal basis for conducting the survey is Regulation (EC) No 1177/2003 of the European Parliament and of the Council. This regulation and all regulations which depend on this regulation ensure comparability of the data from all countries, which participate in EU-SILC.
EU-SILC is the EU reference source for comparative statistics on income distribution and social exclusion at European level, particularly in the context of the ‘Programme of Community action to encourage cooperation between Member States to combat social exclusion’ and for producing structural indicators on social cohesion for the annual spring report to the European Council (Eurostat, 2011).
EU-SILC data are published on both the Eurostat website and the SURS website. EU-SILC microdata are widely used by the research community.
6.2 History of using registers and administrative sources in Slovenia and introducing them into EU-SILCThe Statistical Office of the Republic of Slovenia (hereinafter SURS) decided to use register and administrative sources in the 1970s. The first register was the Register of Territorial Units, which was set up after the 1961 Population Census and for the first time used in the 1971 Population Census. After the 1971 Population Census the Central Population Register (CRP) was set up, which was not updated regularly. Namely, at that time persons did not have PINs. The CRP was completely introduced after the 1981 Population Census, when the legal basis for PINs was introduced (Križman, et al., 2004). At that time, the population register in Slovenia was the only population register in the whole territory of Yugoslavia. At the same time, also the Register of Territorial Units was introduced.
The 1991 Population Census was the last one which was conducted in Yugoslavia and also the last one where only the Central Population Register was used as an administrative source. In the 2002 Population Census,
(1) Rihard Tomaž Inglič is from the Statistical Office of the Republic of Slovenia. This work has been supported by the second Network for the analysis of EU-SILC (Net-SILC2), funded by Eurostat. The European Commission bears no responsibility for the analyses and conclusions, which are solely those of the author. Email address for correspondence: [email protected].
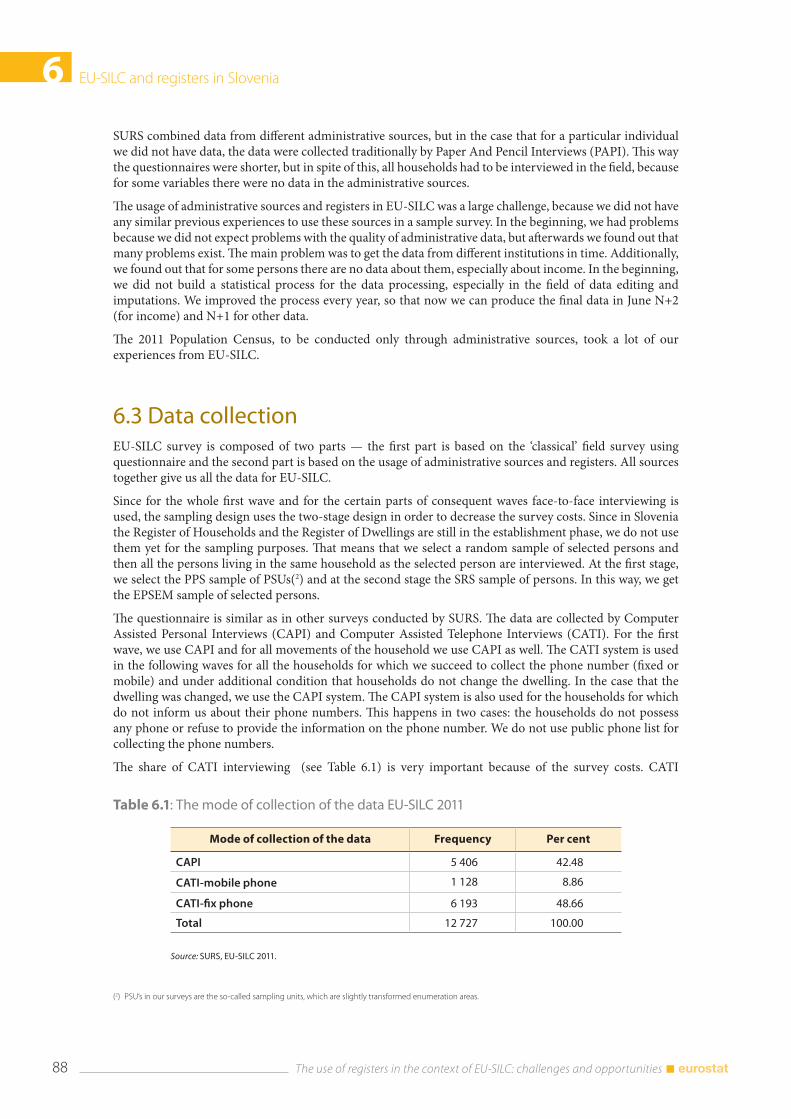
6 EU-SILC and registers in Slovenia
The use of registers in the context of EU-SILC: challenges and opportunities 88
SURS combined data from different administrative sources, but in the case that for a particular individual we did not have data, the data were collected traditionally by Paper And Pencil Interviews (PAPI). This way the questionnaires were shorter, but in spite of this, all households had to be interviewed in the field, because for some variables there were no data in the administrative sources.
The usage of administrative sources and registers in EU-SILC was a large challenge, because we did not have any similar previous experiences to use these sources in a sample survey. In the beginning, we had problems because we did not expect problems with the quality of administrative data, but afterwards we found out that many problems exist. The main problem was to get the data from different institutions in time. Additionally, we found out that for some persons there are no data about them, especially about income. In the beginning, we did not build a statistical process for the data processing, especially in the field of data editing and imputations. We improved the process every year, so that now we can produce the final data in June N+2 (for income) and N+1 for other data.
The 2011 Population Census, to be conducted only through administrative sources, took a lot of our experiences from EU-SILC.
6.3 Data collection EU-SILC survey is composed of two parts — the first part is based on the ‘classical’ field survey using questionnaire and the second part is based on the usage of administrative sources and registers. All sources together give us all the data for EU-SILC.
Since for the whole first wave and for the certain parts of consequent waves face-to-face interviewing is used, the sampling design uses the two-stage design in order to decrease the survey costs. Since in Slovenia the Register of Households and the Register of Dwellings are still in the establishment phase, we do not use them yet for the sampling purposes. That means that we select a random sample of selected persons and then all the persons living in the same household as the selected person are interviewed. At the first stage, we select the PPS sample of PSUs(2) and at the second stage the SRS sample of persons. In this way, we get the EPSEM sample of selected persons.
The questionnaire is similar as in other surveys conducted by SURS. The data are collected by Computer Assisted Personal Interviews (CAPI) and Computer Assisted Telephone Interviews (CATI). For the first wave, we use CAPI and for all movements of the household we use CAPI as well. The CATI system is used in the following waves for all the households for which we succeed to collect the phone number (fixed or mobile) and under additional condition that households do not change the dwelling. In the case that the dwelling was changed, we use the CAPI system. The CAPI system is also used for the households for which do not inform us about their phone numbers. This happens in two cases: the households do not possess any phone or refuse to provide the information on the phone number. We do not use public phone list for collecting the phone numbers.
The share of CATI interviewing (see Table 6.1) is very important because of the survey costs. CATI
(2) PSU’s in our surveys are the so-called sampling units, which are slightly transformed enumeration areas.
Table 6.1: The mode of collection of the data EU-SILC 2011
Mode of collection of the data Frequency Per cent
CAPI 5 406 42.48
CATI-mobile phone 1 128 8.86
CATI-fix phone 6 193 48.66
Total 12 727 100.00
Source: SURS, EU-SILC 2011.
EU-SILC and registers in Slovenia 6
89 The use of registers in the context of EU-SILC: challenges and opportunities
interviewing is namely significantly cheaper than CAPI, but we can still get satisfactory quality of the data. We estimated that in the first wave the questionnaire is too long to use the CATI system, and additionally we did not have a complete register of phone numbers. We collect the phone numbers (fixed phone numbers and mobile phone numbers) for the following waves through the questions in the survey. The only condition to use CATI is that the majority of income data are collected from administrative sources. Because of using administrative sources, the questionnaire is not so long; although we know that also without the income questions the questionnaire is burdensome for participants who answer the questions by phone. At SURS, for now we do not have any experiences with CAWI interviewing; this remains a challenge for the future. We estimate that 30 minutes of interviewing is the upper limit for CATI interviewing. Because of this, we have only some questions for national purposes in the survey, for which interviewers on average do not need more than 2 minutes.
The data collection is similar as in other register-based countries. Some of them use a mixed mode of interviewing, some of them only CATI, while in Denmark also CAWI is used. In comparison to Nordic countries, Slovenia does not have such a long tradition of using registers and administrative sources. They have been extensively used for approximately ten years. All this time we have been improving cooperation with other institutions, and SURS and the institutions signed official agreements and technical protocols. Consequently, we got the data usually in time and in the agreed format. In comparison to Nordic countries, Slovenia does not have registers of dwellings and this causes some problems. It will be a challenge for the future to introduce the register of households.
6.4 Legal basis for using registers in EU-SILCFor using registers and administrative data, we need a legal basis. The legal basis is the National Statistics Act, which in Article 4 stipulates that the reporting units shall be holders of official and other administrative data collections (records, registers, databases, etc.), and also natural and legal persons that are defined by the Programme of statistical surveys as data providers.
According to this Act, official collections shall be data collections, established by regulations or general acts of public power holders, on the basis of which certificates and public documents shall be issued.
According to the National Statistics Act, the Statistical Office has the right to get all administrative sources in Slovenia to use them for statistical purposes (Official Journal of the Republic of Slovenia 45/1995).
6.5 Data sources for EU-SILCIn EU-SILC, we use the sources listed in Table 6.2 below.
The advantages of using registers are (Inglič, 2007):
1. Shorter questionnaire and consequently less time needed for interviewing
2. Skipping the most difficult and sensible questions about income
3. More accurate data
4. Less effect of forgetfulness by interviewing
5. Item non-response and unit non-response are lower
6. Use of administrative data means lower costs for conducting the survey.
Of course, using registers and administrative sources has also disadvantages:
1. More difficult to combine all data into a logical integrity
2. Cleaning and editing the data take more time
3. Some persons are not in registers because of different reasons
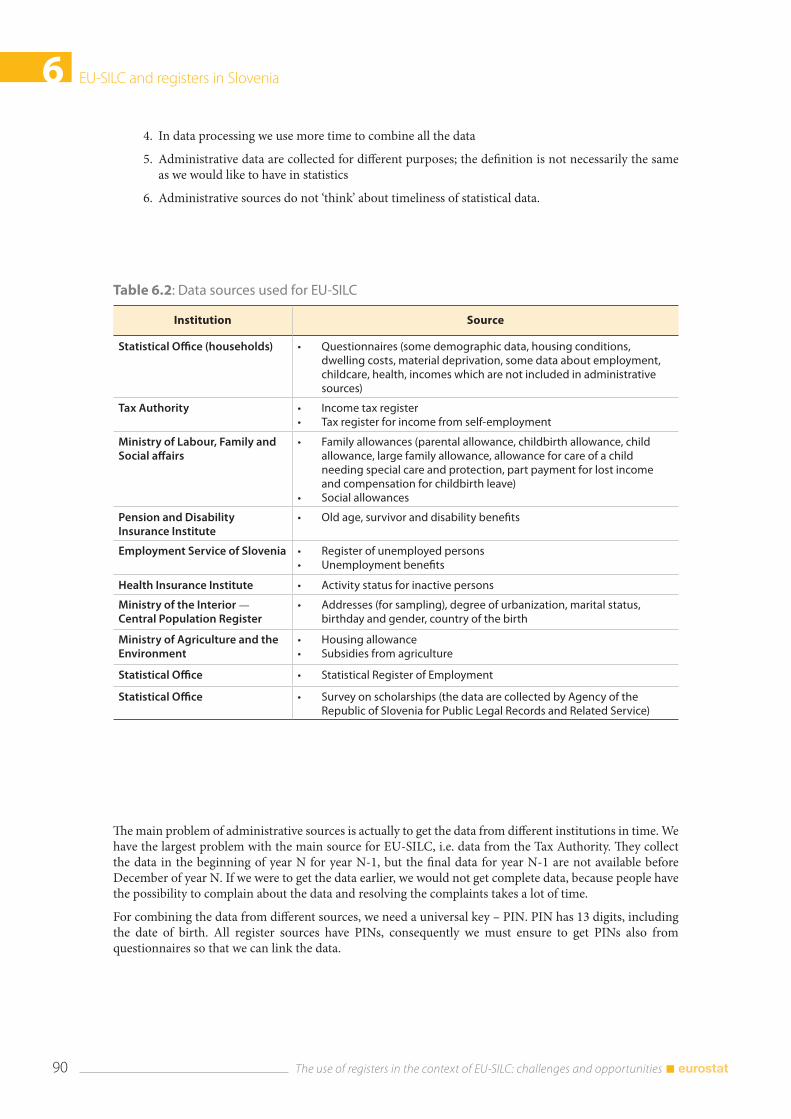
6 EU-SILC and registers in Slovenia
The use of registers in the context of EU-SILC: challenges and opportunities 90
4. In data processing we use more time to combine all the data
5. Administrative data are collected for different purposes; the definition is not necessarily the same as we would like to have in statistics
6. Administrative sources do not ‘think’ about timeliness of statistical data.
Table 6.2: Data sources used for EU-SILC
Institution Source
Statistical Office (households) • Questionnaires (some demographic data, housing conditions, dwelling costs, material deprivation, some data about employment, childcare, health, incomes which are not included in administrative sources)
Tax Authority • Income tax register• Tax register for income from self-employment
Ministry of Labour, Family and Social affairs
• Family allowances (parental allowance, childbirth allowance, child allowance, large family allowance, allowance for care of a child needing special care and protection, part payment for lost income and compensation for childbirth leave)
• Social allowances
Pension and Disability Insurance Institute
• Old age, survivor and disability benefits
Employment Service of Slovenia • Register of unemployed persons• Unemployment benefits
Health Insurance Institute • Activity status for inactive persons
Ministry of the Interior — Central Population Register
• Addresses (for sampling), degree of urbanization, marital status, birthday and gender, country of the birth
Ministry of Agriculture and the Environment
• Housing allowance• Subsidies from agriculture
Statistical Office • Statistical Register of Employment
Statistical Office • Survey on scholarships (the data are collected by Agency of the Republic of Slovenia for Public Legal Records and Related Service)
The main problem of administrative sources is actually to get the data from different institutions in time. We have the largest problem with the main source for EU-SILC, i.e. data from the Tax Authority. They collect the data in the beginning of year N for year N-1, but the final data for year N-1 are not available before December of year N. If we were to get the data earlier, we would not get complete data, because people have the possibility to complain about the data and resolving the complaints takes a lot of time.
For combining the data from different sources, we need a universal key – PIN. PIN has 13 digits, including the date of birth. All register sources have PINs, consequently we must ensure to get PINs also from questionnaires so that we can link the data.
EU-SILC and registers in Slovenia 6
91 The use of registers in the context of EU-SILC: challenges and opportunities
6.6 Record linkage After conducting the survey in the field, the first step is to find PINs for all the persons included in the survey. For the persons who had already been interviewed in the previous waves, we only transmit PINs, but for all others we have to find the correct PINs. The data that we use for composing PINs from the questionnaire are name, surname, birthday and gender. In the EU-SILC database for 2011, 29,377 persons were included. For 93.32 % of them we were able to find PINs with a computer program. This share includes persons from previous waves and selected persons from the sample, for which we have PINs in advance. This way we had to find manually 6.63 % of PINs. If we take into account only the first wave, we found out that 18.16 % of PINs were searched manually. Complete imputation of PINs is performed only in the case that we are not able to find in the Central Population Register any person for which we can suppose that it could be right. In 2011, there were only 0.04 % such persons. Imputation is made by hot deck method, using age, gender and municipality of the person.
A computer algorithm cannot find exact PINs in the case that interviewer wrote a wrong name or misspelled it (for example NAVAK instead of NOVAK as a surname), a wrong birthday or a wrong gender. Besides these data, we also manually use the address of the household. Unfortunately, in Slovenia there is no complete register of households and thus we do not know who lives together in the same household. This is especially a problem in large buildings with several flats and consequently with several households. We suppose that in the future this problem will be solved by introducing the dwelling number as a part of the address. At the moment, we have to ask in the first wave for all the personal data such as name, surname, day of birth and gender. In the following waves, interviewers only check if the same persons still live in the household.
We do not ask directly persons for their PINs, because persons do not know them by heart. This is especially a problem by proxies, which we have in our survey relatively a large share. In 2011, there were 773 (2.6 %) persons with wrong birthdate in the questionnaire and 80 (0.3 %) persons with wrong gender. In the case that we would ask only for PIN, all these persons would be lost for us, because it would be then impossible to find the correct PINs.
6.6.1 Data processing
When all the PINs are found, the data are transmitted to the ORACLE database. The database has several tables: household’s data, person’s data, Statistical Register of Employment, income data and other sources. Every table is checked for the data to be possible and logical. In this phase of work we edit extreme values, impossible values and similar. Moreover, we edit the data in the questionnaires according to the data from previous years, for example who is father, mother, partner, number of rooms and similar if we know that these data did not change from the previous year. This stage is also important for preparing the questionnaire for the following year, because the data entry program depends on the data from previous years – which question should be asked in the particular household and which should not be asked.
The data from different sources (for the whole population of Slovenia) are loaded into EU-SILC partial databases (only EU-SILC population). Here some basic checks (impossible values, extremes) are performed and errors are edited.
After checking the data in the ‘partial’ databases, we produce the so-called ‘integrated database’ where all the data are included. There we can find all inconsistencies in the data from different sources. For different variables, we use different methods to edit them. In some cases, survey data from the questionnaire have priority, while in some cases data from administrative sources are prioritised.
For income variables, we use the data from the tax register. There are data on gross taxes and social contributions available in this register. Before using the data, also net values are calculated for the whole population; this way we got complete data before we use them in EU-SILC.
The final stage of data processing is weighting. The procedure of weight calculation is quite complex because there are several different weights to be calculated. Especially the longitudinal aspect of the survey makes the process more demanding. Roughly, the whole procedure could be divided into three parts: 1st part: sampling weight calculation. Since the persons are selected, the unequal probability at the level of households must be taken into account. 2nd part: re-weighting for (unit) non-response. The procedure is slightly different for the
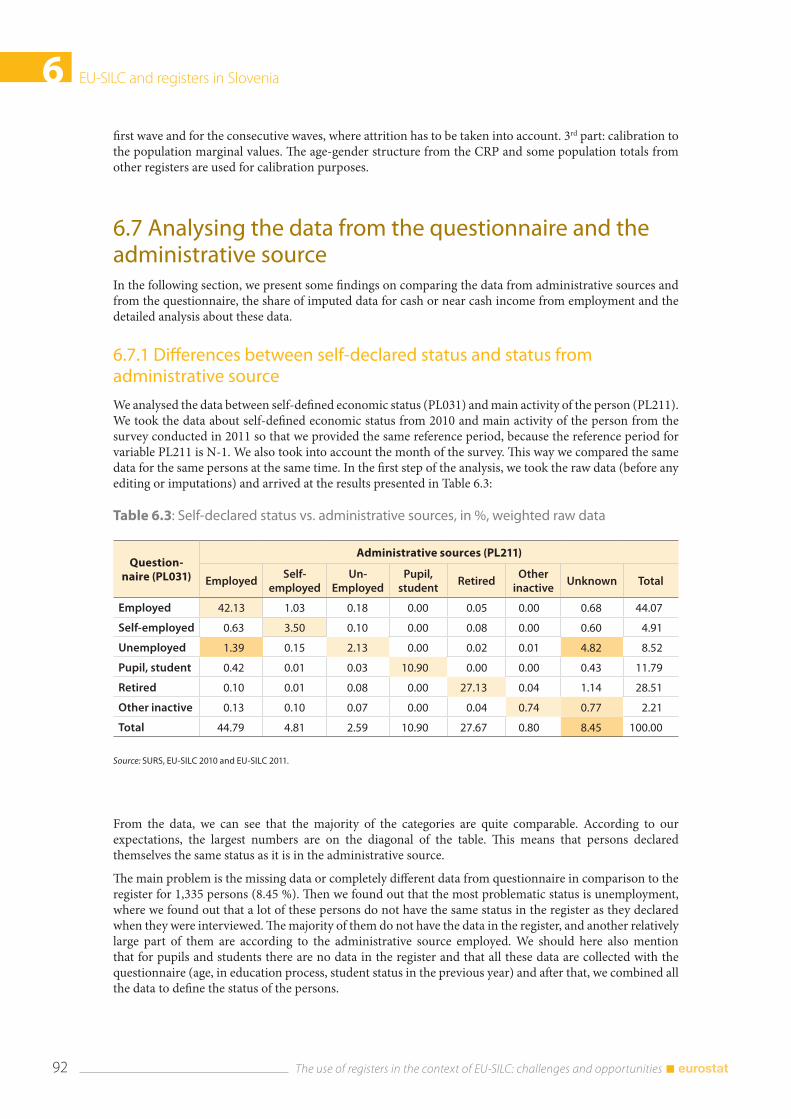
6 EU-SILC and registers in Slovenia
The use of registers in the context of EU-SILC: challenges and opportunities 92
Table 6.3: Self-declared status vs. administrative sources, in %, weighted raw data
Question-naire (PL031)
Administrative sources (PL211)
Employed Self-
employed Un-
EmployedPupil,
studentRetired
Other inactive
Unknown Total
Employed 42.13 1.03 0.18 0.00 0.05 0.00 0.68 44.07
Self-employed 0.63 3.50 0.10 0.00 0.08 0.00 0.60 4.91
Unemployed 1.39 0.15 2.13 0.00 0.02 0.01 4.82 8.52
Pupil, student 0.42 0.01 0.03 10.90 0.00 0.00 0.43 11.79
Retired 0.10 0.01 0.08 0.00 27.13 0.04 1.14 28.51
Other inactive 0.13 0.10 0.07 0.00 0.04 0.74 0.77 2.21
Total 44.79 4.81 2.59 10.90 27.67 0.80 8.45 100.00
Source: SURS, EU-SILC 2010 and EU-SILC 2011.
first wave and for the consecutive waves, where attrition has to be taken into account. 3rd part: calibration to the population marginal values. The age-gender structure from the CRP and some population totals from other registers are used for calibration purposes.
6.7 Analysing the data from the questionnaire and the administrative sourceIn the following section, we present some findings on comparing the data from administrative sources and from the questionnaire, the share of imputed data for cash or near cash income from employment and the detailed analysis about these data.
6.7.1 Differences between self-declared status and status from administrative source
We analysed the data between self-defined economic status (PL031) and main activity of the person (PL211). We took the data about self-defined economic status from 2010 and main activity of the person from the survey conducted in 2011 so that we provided the same reference period, because the reference period for variable PL211 is N-1. We also took into account the month of the survey. This way we compared the same data for the same persons at the same time. In the first step of the analysis, we took the raw data (before any editing or imputations) and arrived at the results presented in Table 6.3:
From the data, we can see that the majority of the categories are quite comparable. According to our expectations, the largest numbers are on the diagonal of the table. This means that persons declared themselves the same status as it is in the administrative source.
The main problem is the missing data or completely different data from questionnaire in comparison to the register for 1,335 persons (8.45 %). Then we found out that the most problematic status is unemployment, where we found out that a lot of these persons do not have the same status in the register as they declared when they were interviewed. The majority of them do not have the data in the register, and another relatively large part of them are according to the administrative source employed. We should here also mention that for pupils and students there are no data in the register and that all these data are collected with the questionnaire (age, in education process, student status in the previous year) and after that, we combined all the data to define the status of the persons.
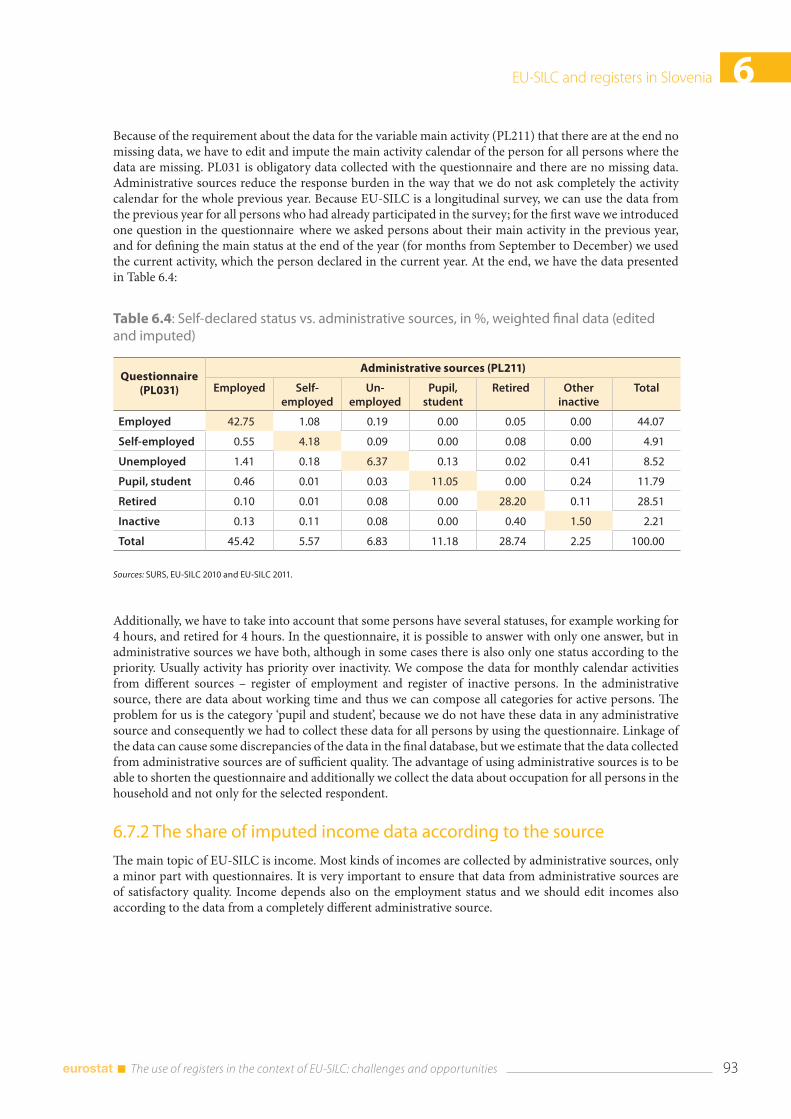
EU-SILC and registers in Slovenia 6
93 The use of registers in the context of EU-SILC: challenges and opportunities
Table 6.4: Self-declared status vs. administrative sources, in %, weighted final data (edited and imputed)
Questionnaire (PL031)
Administrative sources (PL211)
Employed Self-employed
Un-employed
Pupil, student
Retired Other inactive
Total
Employed 42.75 1.08 0.19 0.00 0.05 0.00 44.07
Self-employed 0.55 4.18 0.09 0.00 0.08 0.00 4.91
Unemployed 1.41 0.18 6.37 0.13 0.02 0.41 8.52
Pupil, student 0.46 0.01 0.03 11.05 0.00 0.24 11.79
Retired 0.10 0.01 0.08 0.00 28.20 0.11 28.51
Inactive 0.13 0.11 0.08 0.00 0.40 1.50 2.21
Total 45.42 5.57 6.83 11.18 28.74 2.25 100.00
Sources: SURS, EU-SILC 2010 and EU-SILC 2011.
Because of the requirement about the data for the variable main activity (PL211) that there are at the end no missing data, we have to edit and impute the main activity calendar of the person for all persons where the data are missing. PL031 is obligatory data collected with the questionnaire and there are no missing data. Administrative sources reduce the response burden in the way that we do not ask completely the activity calendar for the whole previous year. Because EU-SILC is a longitudinal survey, we can use the data from the previous year for all persons who had already participated in the survey; for the first wave we introduced one question in the questionnaire where we asked persons about their main activity in the previous year, and for defining the main status at the end of the year (for months from September to December) we used the current activity, which the person declared in the current year. At the end, we have the data presented in Table 6.4:
Additionally, we have to take into account that some persons have several statuses, for example working for 4 hours, and retired for 4 hours. In the questionnaire, it is possible to answer with only one answer, but in administrative sources we have both, although in some cases there is also only one status according to the priority. Usually activity has priority over inactivity. We compose the data for monthly calendar activities from different sources – register of employment and register of inactive persons. In the administrative source, there are data about working time and thus we can compose all categories for active persons. The problem for us is the category ‘pupil and student’, because we do not have these data in any administrative source and consequently we had to collect these data for all persons by using the questionnaire. Linkage of the data can cause some discrepancies of the data in the final database, but we estimate that the data collected from administrative sources are of sufficient quality. The advantage of using administrative sources is to be able to shorten the questionnaire and additionally we collect the data about occupation for all persons in the household and not only for the selected respondent.
6.7.2 The share of imputed income data according to the source
The main topic of EU-SILC is income. Most kinds of incomes are collected by administrative sources, only a minor part with questionnaires. It is very important to ensure that data from administrative sources are of satisfactory quality. Income depends also on the employment status and we should edit incomes also according to the data from a completely different administrative source.
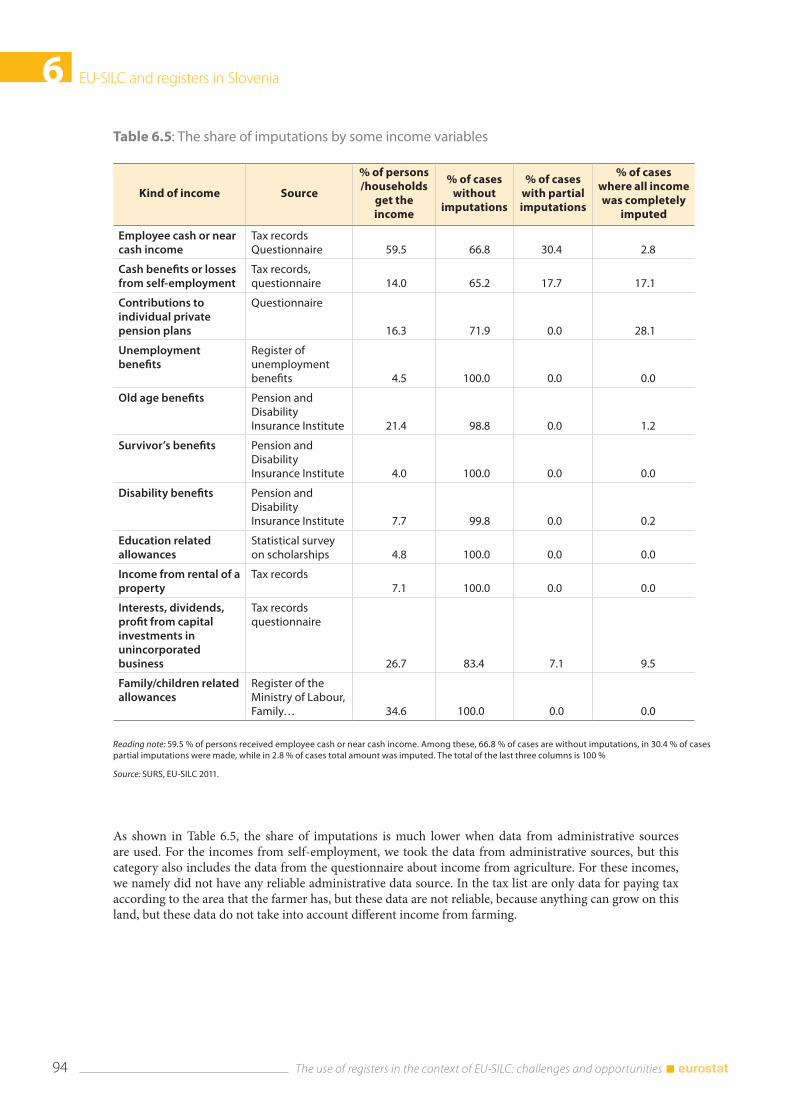
6 EU-SILC and registers in Slovenia
The use of registers in the context of EU-SILC: challenges and opportunities 94
As shown in Table 6.5, the share of imputations is much lower when data from administrative sources are used. For the incomes from self-employment, we took the data from administrative sources, but this category also includes the data from the questionnaire about income from agriculture. For these incomes, we namely did not have any reliable administrative data source. In the tax list are only data for paying tax according to the area that the farmer has, but these data are not reliable, because anything can grow on this land, but these data do not take into account different income from farming.
Table 6.5: The share of imputations by some income variables
Kind of income Source
% of persons /households
get the income
% of cases without
imputations
% of cases with partial imputations
% of cases where all income was completely
imputed
Employee cash or near cash income
Tax records Questionnaire 59.5 66.8 30.4 2.8
Cash benefits or losses from self-employment
Tax records, questionnaire 14.0 65.2 17.7 17.1
Contributions to individual private pension plans
Questionnaire
16.3 71.9 0.0 28.1
Unemployment benefits
Register of unemployment benefits 4.5 100.0 0.0 0.0
Old age benefits Pension and Disability Insurance Institute 21.4 98.8 0.0 1.2
Survivor’s benefits Pension and Disability Insurance Institute 4.0 100.0 0.0 0.0
Disability benefits Pension and Disability Insurance Institute 7.7 99.8 0.0 0.2
Education related allowances
Statistical survey on scholarships 4.8 100.0 0.0 0.0
Income from rental of a property
Tax records7.1 100.0 0.0 0.0
Interests, dividends, profit from capital investments in unincorporated business
Tax records questionnaire
26.7 83.4 7.1 9.5
Family/children related allowances
Register of the Ministry of Labour, Family… 34.6 100.0 0.0 0.0
Reading note: 59.5 % of persons received employee cash or near cash income. Among these, 66.8 % of cases are without imputations, in 30.4 % of cases partial imputations were made, while in 2.8 % of cases total amount was imputed. The total of the last three columns is 100 %
Source: SURS, EU-SILC 2011.
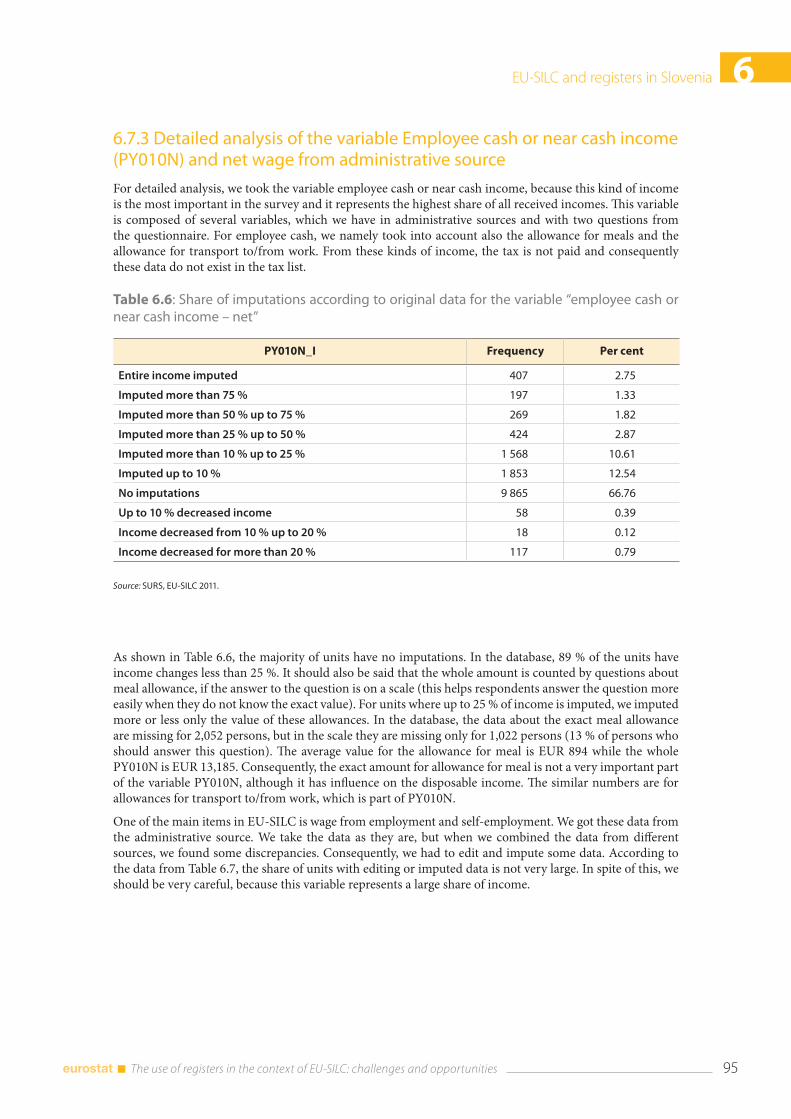
EU-SILC and registers in Slovenia 6
95 The use of registers in the context of EU-SILC: challenges and opportunities
Table 6.6: Share of imputations according to original data for the variable “employee cash or near cash income – net”
PY010N_I Frequency Per cent
Entire income imputed 407 2.75
Imputed more than 75 % 197 1.33
Imputed more than 50 % up to 75 % 269 1.82
Imputed more than 25 % up to 50 % 424 2.87
Imputed more than 10 % up to 25 % 1 568 10.61
Imputed up to 10 % 1 853 12.54
No imputations 9 865 66.76
Up to 10 % decreased income 58 0.39
Income decreased from 10 % up to 20 % 18 0.12
Income decreased for more than 20 % 117 0.79
Source: SURS, EU-SILC 2011.
6.7.3 Detailed analysis of the variable Employee cash or near cash income (PY010N) and net wage from administrative source
For detailed analysis, we took the variable employee cash or near cash income, because this kind of income is the most important in the survey and it represents the highest share of all received incomes. This variable is composed of several variables, which we have in administrative sources and with two questions from the questionnaire. For employee cash, we namely took into account also the allowance for meals and the allowance for transport to/from work. From these kinds of income, the tax is not paid and consequently these data do not exist in the tax list.
As shown in Table 6.6, the majority of units have no imputations. In the database, 89 % of the units have income changes less than 25 %. It should also be said that the whole amount is counted by questions about meal allowance, if the answer to the question is on a scale (this helps respondents answer the question more easily when they do not know the exact value). For units where up to 25 % of income is imputed, we imputed more or less only the value of these allowances. In the database, the data about the exact meal allowance are missing for 2,052 persons, but in the scale they are missing only for 1,022 persons (13 % of persons who should answer this question). The average value for the allowance for meal is EUR 894 while the whole PY010N is EUR 13,185. Consequently, the exact amount for allowance for meal is not a very important part of the variable PY010N, although it has influence on the disposable income. The similar numbers are for allowances for transport to/from work, which is part of PY010N.
One of the main items in EU-SILC is wage from employment and self-employment. We got these data from the administrative source. We take the data as they are, but when we combined the data from different sources, we found some discrepancies. Consequently, we had to edit and impute some data. According to the data from Table 6.7, the share of units with editing or imputed data is not very large. In spite of this, we should be very careful, because this variable represents a large share of income.
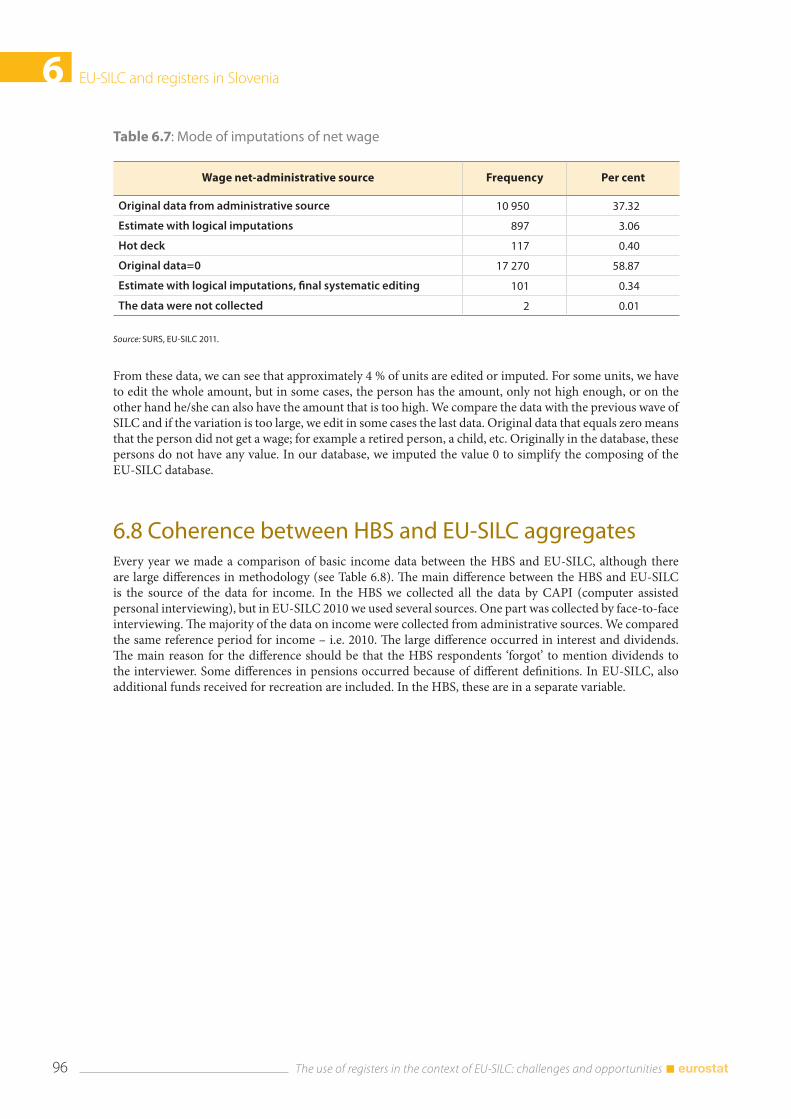
6 EU-SILC and registers in Slovenia
The use of registers in the context of EU-SILC: challenges and opportunities 96
Table 6.7: Mode of imputations of net wage
Wage net-administrative source Frequency Per cent
Original data from administrative source 10 950 37.32
Estimate with logical imputations 897 3.06
Hot deck 117 0.40
Original data=0 17 270 58.87
Estimate with logical imputations, final systematic editing 101 0.34
The data were not collected 2 0.01
Source: SURS, EU-SILC 2011.
From these data, we can see that approximately 4 % of units are edited or imputed. For some units, we have to edit the whole amount, but in some cases, the person has the amount, only not high enough, or on the other hand he/she can also have the amount that is too high. We compare the data with the previous wave of SILC and if the variation is too large, we edit in some cases the last data. Original data that equals zero means that the person did not get a wage; for example a retired person, a child, etc. Originally in the database, these persons do not have any value. In our database, we imputed the value 0 to simplify the composing of the EU-SILC database.
6.8 Coherence between HBS and EU-SILC aggregatesEvery year we made a comparison of basic income data between the HBS and EU-SILC, although there are large differences in methodology (see Table 6.8). The main difference between the HBS and EU-SILC is the source of the data for income. In the HBS we collected all the data by CAPI (computer assisted personal interviewing), but in EU-SILC 2010 we used several sources. One part was collected by face-to-face interviewing. The majority of the data on income were collected from administrative sources. We compared the same reference period for income – i.e. 2010. The large difference occurred in interest and dividends. The main reason for the difference should be that the HBS respondents ‘forgot’ to mention dividends to the interviewer. Some differences in pensions occurred because of different definitions. In EU-SILC, also additional funds received for recreation are included. In the HBS, these are in a separate variable.
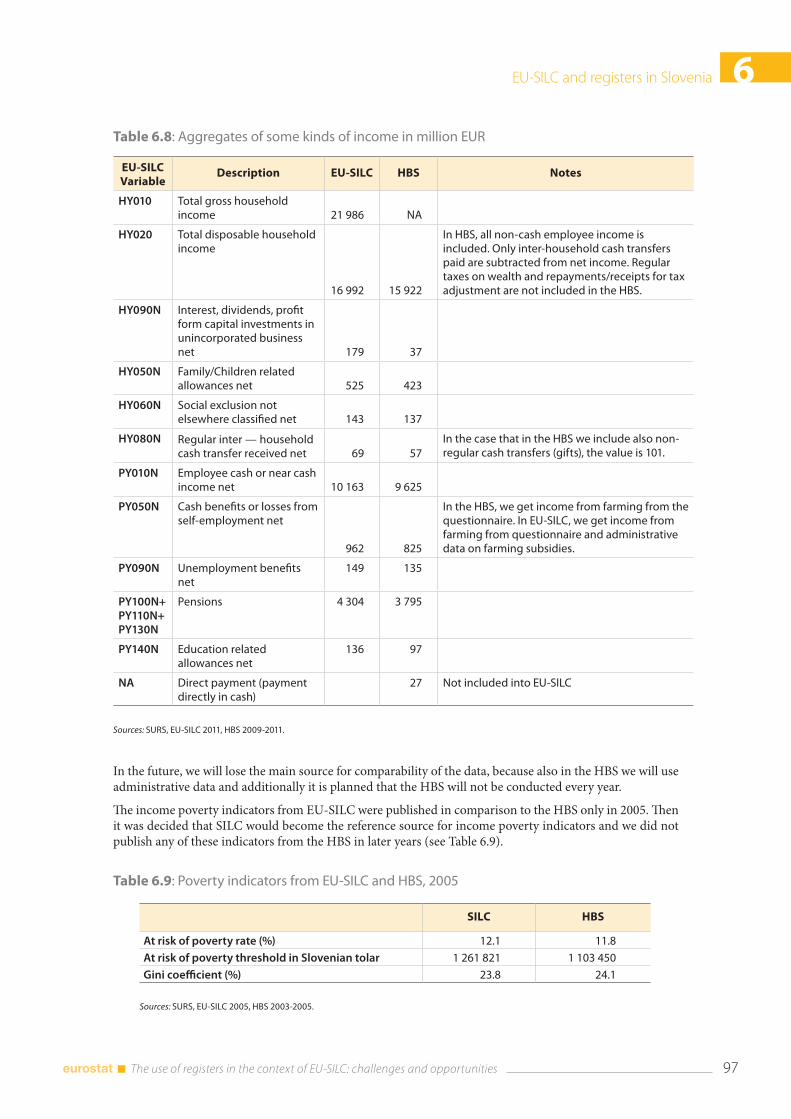
EU-SILC and registers in Slovenia 6
97 The use of registers in the context of EU-SILC: challenges and opportunities
Table 6.8: Aggregates of some kinds of income in million EUR
EU-SILC Variable
Description EU-SILC HBS Notes
HY010 Total gross household income 21 986 NA
HY020 Total disposable household income
16 992 15 922
In HBS, all non-cash employee income is included. Only inter-household cash transfers paid are subtracted from net income. Regular taxes on wealth and repayments/receipts for tax adjustment are not included in the HBS.
HY090N Interest, dividends, profit form capital investments in unincorporated business net 179 37
HY050N Family/Children related allowances net 525 423
HY060N Social exclusion not elsewhere classified net 143 137
HY080N Regular inter — household cash transfer received net 69 57
In the case that in the HBS we include also non-regular cash transfers (gifts), the value is 101.
PY010N Employee cash or near cash income net 10 163 9 625
PY050N Cash benefits or losses from self-employment net
962 825
In the HBS, we get income from farming from the questionnaire. In EU-SILC, we get income from farming from questionnaire and administrative data on farming subsidies.
PY090N Unemployment benefits net
149 135
PY100N+PY110N+ PY130N
Pensions 4 304 3 795
PY140N Education related allowances net
136 97
NA Direct payment (payment directly in cash)
27 Not included into EU-SILC
Sources: SURS, EU-SILC 2011, HBS 2009-2011.
Table 6.9: Poverty indicators from EU-SILC and HBS, 2005
SILC HBS
At risk of poverty rate (%) 12.1 11.8
At risk of poverty threshold in Slovenian tolar 1 261 821 1 103 450
Gini coefficient (%) 23.8 24.1
Sources: SURS, EU-SILC 2005, HBS 2003-2005.
In the future, we will lose the main source for comparability of the data, because also in the HBS we will use administrative data and additionally it is planned that the HBS will not be conducted every year.
The income poverty indicators from EU-SILC were published in comparison to the HBS only in 2005. Then it was decided that SILC would become the reference source for income poverty indicators and we did not publish any of these indicators from the HBS in later years (see Table 6.9).
6 EU-SILC and registers in Slovenia
The use of registers in the context of EU-SILC: challenges and opportunities 98
6.9 ConclusionsEU-SILC is the first sample survey where administrative sources are used. Nowadays and in the future, the administrative sources are much more widely used by sample surveys. Now we are using them also in the HBS. On the other hand, this means also that we will lose the reference source to compare the data and we will not have any indicator if something were wrong with the data.
The main problem of using administrative sources is timeliness. For the institutions where these data are produced, the timeliness is not as important as it is for statistics to prepare data for policy-makers. This comes to the fore especially after the economic and financial crises. In the beginning, we had many more problems with the administrative data and the process of EU-SILC. Now, after several years of conducting EU-SILC, we have improved timeliness by approximately half a year. In the first year, we published the data in January N+2 while in 2011 we published the data in June N+1. In 2012, one question about monthly net income by household was introduced, which is not an administrative source, to get the first estimation of the movements of the poverty indicator. These data should be available much earlier than any other data.
6.10 ReferencesEurostat (2011), EU-SILC 065 2011 operation (version May 2011).
Inglič, R. T. (2007), ‘Administrative data and registers in EU-SILC’, paper presented on Seminar on Registers in Statistics — methodology and quality, took from the web page 3rd October 2012, available at http://www.stat.fi/registerseminar/sessio2_inglic.pdf.
Križman, I. et al. (2004), ‘60 Years of National Statistics in Slovenia’, SURS, Ljubljana.
Slovenian Parliament (1995), National Statistics Act, Official Journal Republic of Slovenia (No. 45/1995), available at http://www.stat.si/doc/drzstat/zakon_o_dsta_eng.pdf.
EU-SILC and the use of registers in the Netherlands 7
99 The use of registers in the context of EU-SILC: challenges and opportunities
7. EU-SILC and the use of registers in The Netherlands
Bart Huynen, Ferdy Otten, Karolijne van der Houwen and Koos Arts(1)
Abstract: This chapter describes the use of register information at Statistics Netherlands (SN), with special reference to EU-SILC. SN has access to a wide range of government administrations which are integrated in the SSD, the overarching database on which all output of social, regional and spatial statistics is or will be based in the future (e.g. income). Through the so-called satellite on income and wealth, EU-SILC is annually provided with register data on income and wealth. Apart from replacing variables in surveys, register data also improve the efficiency of the survey process by streamlining the data collection and supporting more efficient sampling schemes. Moreover, register data help in improving the quality of the output of household surveys by providing auxiliary variables for weighting purposes.
7.1 IntroductionIn the past decade, a paradoxical situation has arisen in the field of social statistics. On the one hand, there is an increasing demand by social policy makers for quantitative information on interrelated socioeconomic phenomena. To an increasing extent, the procedure of policy-making has shifted from an ideological driven approach based on central norms and values of leading political parties and institutions to an approach in which evidence-based statistical parameters form the crucial drivers. This transition applies to both the national, European and international level and is reflected in the numerous statistical descriptions and statistical outcomes in regular policy reports of governmental agencies, EU-institutes and the OECD. Nowadays, it is hard to imagine policy measures that are not based on statistical indicators. For example, the Europe 2020 target of lowering the number of people who are at risk of poverty or social exclusion by 20 million is monitored by three statistical indicators: at-risk-of-poverty, severe material deprivation, and living in households with very low work intensity.
On the other hand, statistical institutes in all Member States are continuously faced with extensive budget cuts. While there is a constantly growing policy demand for valid and reliable statistics, less money is available to meet this demand. Survey research based on face-to-face interviewing is considered too expensive and is therefore used less and less. Also, a growing number of respondents and enterprises are complaining about the response burden related to these traditional statistical data gaining procedures. Partly because of this, survey response rates are declining. These developments together created a sense of urgency to look for substitute data sources and statistical procedures in order to fulfil statistical demands. This search has led Statistics Netherlands (SN) to a full exploration of available registers and administrations and to the application of smart designs, model-based parameter estimation, little domain estimators, and web interviewing. Unfortunately, new data sources, collection procedures and methodology also have disadvantages. These include increased design complexity, insufficient coverage of the target population, problems regarding timeliness, increased non-response and panel attrition. Furthermore, empirical observations are increasingly substituted by statistical modelling.
In order to cope with budgetary constraints and to decrease the response burden for people and enterprises SN has changed its course rather drastically in the last decade of the previous century. Since then, the use of
(1) All authors are from Statistics Netherlands. This work has been supported by the second Network for the analysis of EU-SILC (Net-SILC2), funded by Eurostat. The European Commission bears no responsibility for the analyses and conclusions, which are solely those of the authors. Email address for correspondence: [email protected].
7 EU-SILC and the use of registers in the Netherlands
The use of registers in the context of EU-SILC: challenges and opportunities 100
secondary data from registers and administrations has been given priority over the use of primary (survey) data in the preparation of economic and socioeconomic statistics. SN has adopted the principle that statistics should in principal be based on register data. Only when register data are seriously lacking, primary data collection procedures are allowed. To ensure the accessibility of existing registers for SN and to guarantee the availability of unique identifiers for purposes of individual data linking, the Dutch government passed a special law on register data in 2003. This legislative framework stimulated the further development of an integrated and harmonised system of mutually linkable, integral data pillars, reflecting the different socioeconomic subjects, the so-called Social Statistics Database (SSD).
The datasets of the Population Register are the backbone of the SSD as all the other datasets are linked to this register. In addition to the core database, there are also several sub databases (so-called satellites), that focus on specific topics. For example, the Satellite on Income and Wealth contains different income components that are constructed from available tax registers for all Dutch households and persons. In accordance with the register driven approach of SN, EU-SILC makes optimal use of the available register information from the SSD. In order to further reduce the number of primary observations, EU-SILC was integrated into the Dutch Labour Force Survey (LFS).
The present chapter describes the use of register information in the Netherlands, with special reference to EU-SILC. In Section 7.2, we describe briefly the overarching SSD and the record-linking process between its components. In this section, we also discuss the content of the SSD Satellite on Income and Wealth which is used for producing national statistics on income and wealth. Section 7.3 describes the integration of EU-SILC in the Dutch Labour Force Survey (LFS). The use of register data in EU-SILC, the micro-linkage of EU-SILC data with the SSD and the calibration procedure that SN uses, are presented in Section 7.4. In Section 7.5, we explain how SN derives the so-called calendar of activities from available register data. At the end of the chapter, some conclusions will be drawn and an outline of (possible) future applications of register data in EU-SILC will be presented.
7.2 The Social Statistical Database The SSD is a register-based system that contains micro data on persons, households, jobs, profits, social security benefits, pensions, addresses and dwellings (Van Rooijen, 2010). The SSD is currently based on over forty registers and continues to grow.
7.2.1 Statistical processes underlying the SSD
The SSD is based on an extensive statistical process that consists of the following components:
• inspection and corrections;
• data security measures;
• standardisation;
• micro-integration.
Inspection and correction is carried out at the level of the individual input register. This process entails checks of record layout, population coverage and plausibility of information at the variable level as well as corrections such as imputations of missing values. Data security measures include among others things the substitution of the citizen service number with a ‘Record Identification Number’, which is only known and used at SN. This number can also be used to link data from different sources in subsequent processes. Standardisation consists of a number of steps. First, names of files and variables are transformed to comply with naming conventions. Second, files are converted to a standard format. Third, meta-information is added in a standard format; descriptions regarding content of registers, codes of categorical variables and data models. In the process of micro-integration, different registers are confronted and conflicting information is corrected (for example, if a job still exists according to one register whereas the corresponding employee has deceased according to another). In addition, longitudinal consistency is realised. Thus, micro-integration increases both quality and consistency of the data.
EU-SILC and the use of registers in the Netherlands 7
101 The use of registers in the context of EU-SILC: challenges and opportunities
7.2.2 Use of SSD data
SSD data are disclosed in the form of so-called components, which are stored in a central library, accompanied by meta-information. Components are always provided with a key. For example, in the household component the relation between the household key and the key for individuals is given for the entire Dutch population. The income component contains the yearly household income, where the same household key is being used. By linking the two components, the yearly household income can be added to the data records of individuals as well as to other characteristics of the household.
A tool has been developed to link components on the basis of keys, resulting in data sets which form the basis of analyses and subsequent publications. By linking the data, a wide range of socio-economic questions can be addressed statistically.
7.2.3 The satellite on income and wealth
SN has produced statistics on income and wealth, based on register data, from 1977 onwards. However, in the previous century data collection of income statistics was restricted to a sample of persons and their household members. In 1977, 1981 and 1985 income statistics were compiled on a cross-sectional base. From 1989 onwards, this was changed to a yearly panel survey, the Income Panel Survey (IPS). Every year a sample of new-born and immigrants was added to this longitudinal panel. Wealth data from administrative sources became available from 1993 onwards for the same panel, allowing for an integration of income and wealth statistics since then. During the last decade, the Dutch panel on income and wealth consisted of approximately 90 thousand households and 270 thousand people annually.
From 2004 onwards, yearly income and wealth data have become available for the entire Dutch population. SN now has data on income and wealth from over 7 million households and more than 16 million people. SN is currently working on a production system that uses full register data on income and wealth to create national income statistics. Unfortunately, using full register data may slow down the process of creating statistics and does not necessarily result in (more) reliable statistics. Necessary imputations and data checking, for instance, are much easier to handle for sample data than for register data.
Given the availability of integral records on components of income and wealth, SN constructed a separate satellite, the satellite on income, within the overarching system of the SSD. The satellite on income contains all information necessary (all in all more than 200 variables or components) to construct the three different income concepts (primary, gross and disposable income) and the two head components of wealth (property and debts) that are published by SN. The satellite allows for the much sought-after cross linkages of income and wealth variables with the variables in other SSD satellites. Furthermore, it makes possible to add personal information on income and wealth to existing surveys. Through the satellite important surveys like EU-SILC, the Labour Force Survey and the Household Budget Survey are annually provided with register income data.
In the Netherlands, EU-SILC is not and will not be used to publish income inequality and poverty indicators on a national level. In fact, EU-SILC statistics differ from national statistics because of differences in target population, income definition and equivalence scales. EU-SILC is only used to publish about subjective indicators (e.g. ability to make ends meet) and other topics like indicators on childcare.
7.3 The integration of the EU-SILC in the LFS In the Netherlands, EU-SILC was first conducted in 2005. Eurostat strongly encouraged the use of existing data sources, whether they were surveys or registers and the use of national sampling designs. Statistics Netherlands decided to make maximum use of registers and, because of the common labour variables, to integrate EU-SILC in the Labour Force Survey as an additional panel wave. The Dutch LFS is conducted according to a rotating panel design, in which respondents are interviewed five times at quarterly intervals. Households that have taken part in the fifth wave are recruited for the EU-SILC survey. About 80 per cent is willing to participate (approximately 30 per cent of the original LFS sample). If the household is willing to participate, it is contacted in the month following the final LFS interview. As a result, a relatively short
7 EU-SILC and the use of registers in the Netherlands
The use of registers in the context of EU-SILC: challenges and opportunities 102
telephone-interview (on average 15 minutes) is sufficient to collect the additional EU-SILC information.
Integration with the LFS also has a disadvantage. Research has shown that refusing LFS-households in the Netherlands have more volatile employment behaviour than regular panel households (Banning & Schouten, 2009) which means that bias is introduced into EU-SILC. This is expected to affect income statistics based on EU-SILC. By using an appropriate calibration scheme, that includes variables such as main source of income, bias is adjusted.
For the LFS, each month a sample of addresses is selected through a stratified two-stage cluster design. Strata are formed by geographic regions. Municipalities are considered as primary sampling units and addresses as secondary sampling units. This address frame, consisting of records including an address and municipality code, is constructed by SN using a random 10 % sample from the population register each year.
7.3.1 The use of registers in the LFS
Information on the labour market is only limited available in the Dutch registers. Very little registry information is suitable to derive labour market statistics. From 2009 onwards, register data are mainly used to further stratify the LFS-sampling. Registered job-seekers, non-western immigrants and young people (14-26 years) are oversampled. These variables are derived from the registry from the unemployment office and the population register. Using oversampling, the gross sample of the Labour Force Survey can be reduced without lowering the quality of the results. To reduce costs even further, addresses with only people aged 65 years or over, are under sampled, since the target parameters of the LFS concern people aged 15-64 years.
Recently, SN has started to use register data to streamline the LFS data collection. Until 2011, respondents in the first wave were interviewed through computer assisted personal interviewing (CAPI) whereas in the four subsequent waves of the panel, data were collected by means of computer assisted telephone interviewing (CATI). During the telephone interviews, a reduced questionnaire was used to establish changes in the labour market position of the relevant household members. In 2011, a mixed mode (CATI/CAPI) design was introduced in the first wave. Households consisting of no more than two people older than 15 years of age are also interviewed by telephone in the first wave. For larger households face-to-face interviewing is used in the first wave, because the interview would take too long since detailed information on the labour position is needed for each household member aged 14 years or over. The household size is predetermined based on the information from the population register.
Starting this year, register data are also used to replace some questions in both LFS and EU-SILC. For employees, the branch of economic activity is derived from the Jobs and Social Security Register. This register encompasses extensive information on all jobs in the Netherlands. For self-employed people and for temporary workers the economic activity still needs to be determined in the questionnaire, because information on these groups is not available in the registers or it does not meet statistical needs. All other labour variables, such as the number of hours usually worked (PL060) and occupation code (PL051), are still determined during the interview.
Finally, register data are used to calibrate the LFS data. The weighting scheme is based on a combination of different socio-demographic variables, which are taken from the population register and the administrated unemployment register.
7.3.2 The EU-SILC design in the Netherlands
Statistics Netherlands implemented the integrated four-year rotational design, which means that the cross-sectional and longitudinal EU-SILC data are based on the same set of sample observations. In terms of the units involved, four types of data can be distinguished in EU-SILC:
1. variables measured at the household level;
2. information on household size and composition and basic characteristics of household members;
3. ‘basic’ variables measured at the person level, but aggregated to construct household-level variables (income and other more complex variables, such as education and basic labour information);
4. ‘detailed’ variables collected and analysed at the person level (for example health, access to health care, detailed labour information, activity history and calendar of activities).
EU-SILC and the use of registers in the Netherlands 7
103 The use of registers in the context of EU-SILC: challenges and opportunities
The first two types of variables are collected from a single respondent in each sample household — using a household questionnaire for the first type of variable and a household member roster for the second. Basic variables must be collected directly at the person level, covering all persons in each sample household. In the so-called ‘survey countries’, these income variables are collected through personal interviews with all adults aged 16+ in each sample household. By contrast, in ‘register countries’, such as the Netherlands, they are compiled from registers and other administrative sources, thus avoiding the need to interview all adult members in the sample household. EU-SILC in the Netherlands uses both survey and register data (income) to collect the basic variables. The survey data on education and labour position, however, do not come from the SILC survey, but are added from the LFS.
Detailed variables are collected through direct personal interviews. These variables are too complex or personal in nature to be collected by proxy and they are not available from registers. For the ‘survey countries’, the collection of basic and detailed variables is combined. However, there is no requirement to collect detailed variables for all persons in each sample household. Collection can be done on a representative sample of persons, such as by randomly selecting one person per sample household, the so-called selected respondent. This option is followed in the Netherlands.
The EU-SILC interview in the Netherland consists of two parts. The first part is the household questionnaire in which the first two types of variables are collected from someone who can ‘speak for’ the household. The second part is the personal questionnaire in which the detailed variables are collected from the selected respondent. For 80 per cent of the households, including single person households, both representatives are the same person. In the other 20 per cent, the selected respondent is someone (for example a child) who is not capable of providing good quality information on variables assessed at the household level (e.g. housing costs). For such households the interview is divided into two parts and two people are interviewed. Sometimes these two people are interviewed on different days if they are not both available at the same time.
7.3.3 Linking EU-SILC and the SSD
In this section, we describe the strategy for linking household sample surveys, like EU-SILC, to administrative registers. First, both surveys and registers are linked to the so-called ‘persons’ backbone’. The backbone is a longitudinal file starting in 1995 of all persons who have ever lived in the Netherlands. The longitudinal nature of the file means that multiple records exist for one person if changes have occurred in personal characteristics, such as marital status. The backbone is maintained by the central record linking unit at Statistics Netherlands and is mainly fed by the Population Register. The file contains a number of personal identifiers. The Citizen Service Number is a unique personal identifier for every (registered) Dutch inhabitant and for those living abroad who receive an income from activities in the Netherlands and consequently have to pay tax over their earnings to the Dutch fiscal authorities. This number is used in many government registers to identify persons. We assume that the quality of the Citizen Service Number is high, as this number is used for administrative and fiscal purposes. Tax departments and employee insurance administration in particular require a high quality for their own tasks and duties.
However, Statistics Netherlands does not collect personal identifiers, like the Citizen Service Number, in household surveys. Asking persons for their personal identifier is sometimes pointless, because people simply do not know their identifier, or it is not advisable because it may cause non-response. Sample persons are linked to the backbone through a combination of their address, sex and date of birth. In this linking process, a distinction is made between primary and secondary matching variables. Primary variables have to be identical in both files, while secondary may differ to a certain extent (e.g. to allow for misspellings or figure inversions). The matching criterion used specifies which differences are allowed to decide on a successful match. EU-SILC records are matched with the persons’ backbone using address (postal code and house number) as a primary key and day, month and year of birth and sex as secondary matching variables.
It turns out that 99 per cent of the EU-SILC respondents can be linked to the persons’ backbone when a difference between survey and backbone is tolerated in one (and no more than one) of the secondary keys. This is a very good result, though some selectivity may occur in this micro-linking process. The percentage of non-matched records is higher among young people (between 15 and 24) than among other age groups. Young people (e.g. students) move more frequently and therefore they are often registered at the wrong address. However, bias that could result from this can be adjusted with an appropriate weighting model including age.
7 EU-SILC and the use of registers in the Netherlands
The use of registers in the context of EU-SILC: challenges and opportunities 104
Households containing a person that could not be linked to the backbone result in partial unit non-response, because the household income is calculated by summing the incomes of all household members. Given the fact that the total number of non-matched records is very small these records are rejected from the EU-SILC data files.
7.3.4 Privacy and confidentiality concerns
Data matching opens up enormous possibilities for statistics, but it also means a possible intrusion on people’s privacy. Statistical offices should act very carefully. Advance letters always mention the fact that respondents’ data will or may be matched with other data sources. Based on this information, people can always refrain from participating. Furthermore, the information stored at Statistics Netherlands may only be used for statistical purposes. A sound confidentiality policy implies that access to personal identifiers should be limited to a minimum of people who have access to these identifiers. SN created a separate unit responsible for matching individual data.
SN never uses the citizen service number as the personal identification number in micro data files. The main reason for this is one of disclosure control. A person’s service number is not completely confidential and may be known by others. Using the number in statistical databases opens up the risk of disclosing a large number of characteristics of a person. Therefore, SN uses unique ‘Record Identification Numbers’ (RIN) for every person to store and to match individual data. RIN-numbers are only used at SN and do not contain any personal information.
7.4 The use of registers in EU-SILCEU-SILC is the EU reference source for comparative statistics on income distribution and social exclusion. It is the successor to the European Household Community Panel (ECHP). Until 2002, the Socio-Economic Panel survey (SEP) was the data supplier for the ECHP.
At that time, it was not possible to match register data to household sample surveys because the register data were not available for the entire population. Integral data on income became available from 2004 onwards. Before first conducting EU-SILC, SN performed a study on the consequences of substituting survey-based by register-based income data. This study concluded that register data were of higher quality than survey data (Grubben & Huynen, 2002). The study also showed that the selective non-response of the lower income groups can be eliminated with register data by extending the weighting scheme with register-based income data.
7.4.1 Construction of target variables
From 2004 onwards, extensive register data on income are available in the SSD and are used to construct nearly all EU-SILC target variables on income. Some target variables are collected from the SSD core database, for instance the country of birth (PB210), Citizenship 1 (PB220A) and Citizenship 2 (PB220B).
In the tax registers, information on income is recorded gross. This means that neither taxes nor social contributions have yet been deducted. All income components are registered at the individual level (i.e. the person registered as the receiver of the income). The same applies for incomes that are typically household-related, such as housing benefits and social assistance. As income data are based on register information, the income variables do not suffer from any item non-response. However, some income components are not available in the tax registers because they are not taxable or tax deductible. This applies to some inter-household transfers and the income from rental of property or land (HY040G). These income components are collected in the EU-SILC questionnaire. This has some disadvantages. Because few questions are asked about income, questions about the above-mentioned components are unexpected and out of a context. Furthermore, questions about income are difficult to answer by telephone. One reason for this is that respondents do not have their administration on hand during the interview, which results in less accurate or missing answers.
EU-SILC and the use of registers in the Netherlands 7
105 The use of registers in the context of EU-SILC: challenges and opportunities
More specifically, paid and received child support is an important income component that is missing from the registers. For single-parent households, child support is a substantial source of income. In 2010, about 35 per cent of the single parents with minor children said that they had received child support in the previous calendar year, almost 5000 euro’s on average.
7.4.2 Calibration
Several registrations provide auxiliary information from which variables can be selected to be used for weighting and estimation. In general, adjustments made by calibration improve the accuracy of the data. There are three good reasons for using calibration schemes: 1) the estimates of variables that are used in the calibration scheme are made consistent with those of more reliable sources; 2) the standard error of the estimates is reduced if the calibration variables correlate with target variables; 3) non-response bias is reduced if the calibration variables correlate with both target variables and response probabilities. Calibration improves coherence and consistency of the estimates with other statistics. Basic demographic distributions, e.g. distribution of population by age and sex, are commonly used as calibration variables in surveys. Statistics Netherlands uses an elaborated calibration model with register-based proxies of the EU-SILC target variables to be estimated, such as distributions of equivalised incomes in deciles or the at-risk-of-poverty rate.
Two external data sources are used in the EU-SILC calibration procedure: the Population Register (GBA) and the Income Panel Survey (IPS). The set of variables used for calibration includes the smaller subset suggested by Eurostat. Additional calibration variables that correlate strongly with the target variables are added: income data, data on tenure status and ethnic background. The following variables are included in the calibration scheme:
• sex;
• age in years, 0,1,2,3,4…..85 and 85 years and over;
• household size: 1, 2, 3, 4 or more household members;
• region: 12 categories, one for each of the provinces (nuts 2);
• tenure status: owner, tenant;
• equivalised disposable income in deciles;
• main source of income: employee, self-employed, unemployed, social assistance, disabled, retired aged under 65, retired aged 65 years or older, student, no income;
• low income: non target population, low income and other income;
• at-risk-of-poverty rate;
• ethnic background: native, western immigrant, non-western immigrant.
The calibration makes use of deciles based on the IPS data file. The income concept used is the disposable income according to the national definition. This means that income is based solely on registry variables and that interest repayments on mortgage (HY100G) and imputed rent (HY030G) are included in the equivalised income. The classification based on these deciles shows an underrepresentation of the lower income groups. After calibration, the groups are equal in size. Another advantage of the calibration to decile groups is that the median income (the fifth decile) in SILC is about as high as it is in the Income Panel Survey. The poverty threshold is actually based on the median.
7.4.3 Calendar of activities
The Europe 2020 indicator ‘persons living in households with low work intensity’ is defined as the number of persons living in households having a work intensity below a certain threshold. The work intensity of the household refers to the number of months that all working age household members have been working during the income reference year as a proportion of the total number of months that they could theoretically have worked. For persons who have worked part-time, an estimate of the number of months in terms of

7 EU-SILC and the use of registers in the Netherlands
The use of registers in the context of EU-SILC: challenges and opportunities 106
fulltime equivalent is computed on the basis of the number of hours usually worked per week. A threshold of 20 % has been adopted to distinguish low work intensity.
For each household member aged 16 or over, the number of months spent at work are registered in target variables PL073 to PL076 (number of months spent at fulltime/part-time work as employee or as self-employed). These variables are, in turn, derived from the calendar of activities (PL211A to PL211L) which is derived for all respondents aged 16 and over.
According to the EU-SILC regulation, monthly activity status is self-defined. The distinction between fulltime and part-time work should be made on the basis of a spontaneous answer given by the respondent. However, SN uses register information to determine monthly activity status. The calendar of activities is part of the SSD and is based on the main income source in a specific month. The highest amount determines the activity status. For employees the Jobs and Social Security Register, that contains data on all jobs (start and end date, working hours), social benefits, and pensions is the main data source. For self-employed people the information from the tax registers is used to derive activity status. For the latter group, the distinction between part-time and fulltime work depends on whether or not they receive a self-employment benefit. To be eligible for this benefit self-employed people need to spend at least 1.225 hours per year on their business activities.
Students are assigned the activity status ‘pupil / student’ if their income (excluding study allowances) is less than 70 per cent of the minimum wage. If their income is equal to or greater than 70 per cent of the minimum wage, then it is taken into account in determining the activity status in the specific month. The same applies to the self-employed people who also have earnings as an employee. They will be assigned ‘self-employed’ if their income as employee is less than 70 per cent of the minimum wage.
Information from the EU-SILC questionnaire is used to classify people without any income in a given month. The self-defined status at the time of interview is then used to distinguish between the categories ‘fulfilling domestic tasks’ and ‘other inactive person’.
Because of the longitudinal component of EU-SILC, it is possible to compare the self-defined status (PL031) at the date of interview with the register-based calendar of activities in the subsequent survey year. The reference period for this calendar is the previous calendar year. For example, 95 per cent of people who indicate that they are employed would have been identified as such, had the register-based variable been used. Over 85 per cent of the fulltime workers also work fulltime according to the register-based variable.
As shown in Table 7.1 the differences are larger for inactive people. For instance, Students are classified as working part-time if they have a substantial job. People defining themselves as ‘fulfilling domestic tasks’ are often classified as pensioners because they received pension income. In the Netherlands, anyone aged 65 and over receives a basic state pension. The amount received does not depend on former income or on contributions paid in the past. Housewives who have never worked are also entitled to this pension when they reach the age of 65. However, for the calculation of the work intensity only the distinction between working and non-working is of interest.
Table 7.1: Self-defined activity status in EU-SILC (PLO31) versus the register-based activity status (calender of activities)
Working
full time (%)Working
part time (%)Unemployed
(%)Student
(%)
In retirement
(%)
Other inactive
(%)
Total (%)
Working full time 85 12 0 0 1 1 100
Working part time 17 73 3 1 4 2 100
Unemployed 7 7 59 6 7 13 100
Student 2 9 2 83 1 2 100
In retirement 0 0 1 97 1 100
Other inactive 1 7 11 0 43 36 100
Sources: EU-SILC 2010 (PL031) and EU-SILC 2011 (PL211A to PL211L).
EU-SILC and the use of registers in the Netherlands 7
107 The use of registers in the context of EU-SILC: challenges and opportunities
7.5 ConclusionSN has access to a wide range of government administrations which are integrated in the SSD, the overarching database on which all output of social, regional and spatial statistics is or will be based in the future (e.g. income). Through the so-called satellite on income and wealth, EU-SILC is annually provided with register data on income and wealth. Apart from replacing variables in surveys, register data also improve the efficiency of the survey process by streamlining the data collection and supporting more efficient sampling schemes. Moreover, register data help in improving the quality of the output of household surveys by providing auxiliary variables for weighting purposes.
The income calibration variables used in EU-SILC are based on the Income Panel Survey. From EU-SILC 2012 onwards the calibration variables will be based on the SSD, which covers the entire population in the Netherlands. The at-risk-of-poverty rate, based on the national definition of equivalised income, is one of the calibration variables.
A number of registers have become available that might be of use for replacing variables or calibration purposes in EU-SILC. Examples of these include registers containing information on paid rent and the use of child care. Work still has to be done in order to decide if and how these registers can be useful in the near future.
7.6 ReferencesBanning, R. and Schouten, B. (2009). ‘A mixed-mode follow-up of panel refusers in the Dutch LFS’, Den Haag/Heerlen: Statistics Netherlands.
Grubben, B and Huynen , B. (2002). ‘Comparison of income data from interview surveys and administrative records’, Den Haag/Heerlen: Statistics Netherlands.
Rooijen, J. van (2010). ‘The Social Statistical Database of Statistics Netherlands: Invaluable source for socio-economic research’. In: Groot, M. de and Wittenberg, M. (eds.) Driven by data: exploring the research horizon, Den Haag/Heerlen: Statistics Netherlands, pp. 35-39.

Using register income data in EU-SILC
III

Transition from survey data to registers in the French SILC survey 8
111 The use of registers in the context of EU-SILC: challenges and opportunities
8. Transition from survey data to registers in the French SILC survey
Carine Burricand (1)
Abstract: The French EU-SILC survey was launched in 2004 and data were collected by interviews. Since 2008, income data have been mainly obtained from fiscal registers. But as fiscal registers do not cover all income, a mixed strategy on income data collection has been used. The match between collected data and registers is good even if some categories of population are more difficult to match. The use of administrative data allows us to have more valuable and consistent information on income. The change of methodology has not a significant impact on the poverty rate but this has consequences on longitudinal analyses.
8.1 IntroductionAdministrative data have been used in France to complement survey data since 1956. The first attempt to collect information on income by using administrative record was done between the tax files and the census data and resulted in the so-called Tax Income Survey (Enquêtes Revenus Fiscaux 1956, 1962, 1965, 1970, 1975, 1979, 1984 and 1990). The Tax Administration was responsible for complementing a questionnaire on income for taxpayers who lived in a sample of dwellings covered by the census. The statistical process (link with census data, imputation and weighting) was then carried out by INSEE.
Since 1996, the survey vehicle has changed to allow doing deeper socio-economic analysis and Tax income surveys have then consisted in a linking between Labour Force Surveys and tax files. The linking process has since been carried out by INSEE who receives tax files for such statistical purposes. This process has become annual. Each year, data from Labour Force Surveys is complemented with data from tax files. Two different kind of tax files are used in the process:
• The local residence tax file, which is a complete database of all the dwellings for which a housing tax has to be paid
• The income tax file, which includes all the income tax returns.
Wealth tax returns and property tax returns cannot yet be used as survey data.
In 2004, France amended its 1951 Statistics Act (concerning legal obligation, coordination, and confidentiality in the field of statistics) to require the transmission of administrative data to official statistical agencies that request them. Previously, the administration had the option of transmitting individual data to official agencies. They are now required to do so if the agencies ask for the data. This amendment of statistic act has facilitated, in theory, the use of administrative data(2).
In practice, we still need to discuss and negotiate with the administration to obtain the delivery of the administration files and the way the NSI can use it: for sampling purposes, for treating non-response, or, as we do for income data, as a substitute for data collection.
Since 2005, the Tax income survey has also been linked with social benefits files (renamed ERFS — the Tax and social income survey). These data from social files comes from the family and the elderly branches of the French social security system. ERFS is the reference survey that is used in France to disseminate the
(1) Carine Burricand is from the France’s National Institute of Statistics and Economic Studies. This work has been supported by the second Network for the analysis of EU-SILC (Net-SILC2), funded by Eurostat. The European Commission bears no responsibility for the analyses and conclusions, which are solely those of the authors. Email address for correspondence: [email protected].
(2) On the other hand, this is a field where the French National Commission on Information Technology and Civil Liberties (CNIL) is very vigilant and the final goals must be defined very carefully.
8 Transition from survey data to registers in the French SILC survey
The use of registers in the context of EU-SILC: challenges and opportunities 112
at-risk of poverty rate and other income distribution statistics. However, this survey does not contain any information concerning living conditions. Therefore, to best meet the European demand to create the EU-SILC (EU Statistics on Income and Living conditions) survey and to satisfy the demand to deliver two types of annual data (cross-sectional and longitudinal data), France decided to create a new specific survey on the income and living conditions of households. Nevertheless, ERFS remains the national reference source on income distribution and poverty, mainly as the sample design is larger than for the SILC survey.
The first SILC survey data were entirely collected by face-to-face interview in 2004. Confusion between francs and euros or between monthly and yearly income were frequent. Furthermore, although it was suggested, households did not always use official documents to answer the questions and income amounts were frequently rounded. Item non-response was frequent as well. For example, in 2004, 7 % of the wages had been corrected after consistency checks and 7 % of the wages had to be computed again due to answers in brackets. All these factors led to measurement error in the income data, and meeting quality objectives was all the more uneasy.
Then, it was decided to link SILC survey data with the administrative files as administrative data provides a better and homogeneous quality of income variables and as income variables are the core variables of this survey. It was decided to do a methodological test to evaluate the possibility of linking the two data sources on income (survey by face-to-face interview and tax files), to assess advantages and disadvantages of the two sources and to help decide which income is necessary to continue collecting by interview.
Unfortunately, because of the time it took to get legal authorisation to do this test and due to the obligation to inform the interviewees of the matching process with administrative data, it was 2008 by the time the test was conducted. The results were studied after the revision of the data collection in the SILC survey.
The first part of this chapter presents the preparation of the 2008 data collection and the linkage record process. The second part of the chapter presents the results of the test on comparison with the quality of income data from the two data sources. Then, the third part presents the impact of the changes in income data collection on the poverty indicators.
8.2 The new data collection
8.2.1 Preparation of the 2008 data collection
A respondent consent for matching survey data with the administrative file is required. This principle of transparency of data collection (we call it ‘fair data collection’ in French) is a direct consequence of the 1978 ‘Informatique et libertés’ law: it is mandatory for the data collector to notify the data subjects of the various processing steps and thus to make clear the link between the two sources that took place (Isnard, 2006). A solution consists of notifying the people interviewed by the survey presentation brochure they are given by the INSEE interviewer or in advance letter. In the SILC survey, we also inform them in the individual questionnaire: ‘One goal of this survey is to measure your income. For this purpose, the survey data will be further completed with all the guarantees of confidentiality with administrative data. The questionnaire is therefore limited to some income components (alimony, retirement veterans...) but does not cover those that INSEE can collect through other sources (such as wages for example)’. Interviewers have to read the full sentence.
Giving this information during the interview permits to explain why we do not ask for the amount of some income while others will still be asked. However, the effect on participation could also be impacted by the place, within the questionnaire, where the information was delivered. Different strategies have been tested. It was excluded to do it at the beginning of the questionnaire (to prevent a decrease of the response rate) and at the end of the questionnaire (we consider it is not fair play). Finally, it was decided to explain this point at the beginning of the income part of the individual questionnaire.
Furthermore, interviewers were specifically trained on how best to argue in favour of this approach with a FAQ document. After 5 years of experience with this, we have observed that the use of the administrative data is well accepted by respondents. And some are even surprised that we still ask for property tax or
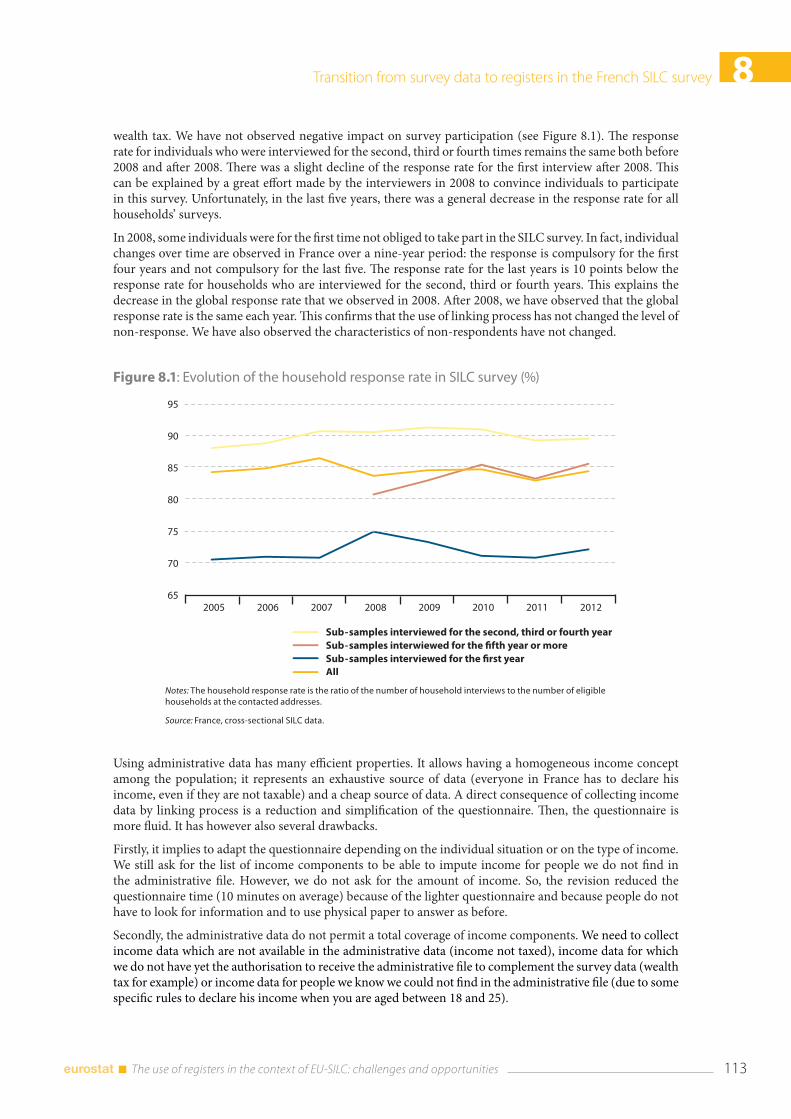
Transition from survey data to registers in the French SILC survey 8
113 The use of registers in the context of EU-SILC: challenges and opportunities
wealth tax. We have not observed negative impact on survey participation (see Figure 8.1). The response rate for individuals who were interviewed for the second, third or fourth times remains the same both before 2008 and after 2008. There was a slight decline of the response rate for the first interview after 2008. This can be explained by a great effort made by the interviewers in 2008 to convince individuals to participate in this survey. Unfortunately, in the last five years, there was a general decrease in the response rate for all households’ surveys.
In 2008, some individuals were for the first time not obliged to take part in the SILC survey. In fact, individual changes over time are observed in France over a nine-year period: the response is compulsory for the first four years and not compulsory for the last five. The response rate for the last years is 10 points below the response rate for households who are interviewed for the second, third or fourth years. This explains the decrease in the global response rate that we observed in 2008. After 2008, we have observed that the global response rate is the same each year. This confirms that the use of linking process has not changed the level of non-response. We have also observed the characteristics of non-respondents have not changed.
Figure 8.1: Evolution of the household response rate in SILC survey (%)
Notes: The household response rate is the ratio of the number of household interviews to the number of eligible households at the contacted addresses.
Source: France, cross-sectional SILC data.
Using administrative data has many efficient properties. It allows having a homogeneous income concept among the population; it represents an exhaustive source of data (everyone in France has to declare his income, even if they are not taxable) and a cheap source of data. A direct consequence of collecting income data by linking process is a reduction and simplification of the questionnaire. Then, the questionnaire is more fluid. It has however also several drawbacks.
Firstly, it implies to adapt the questionnaire depending on the individual situation or on the type of income. We still ask for the list of income components to be able to impute income for people we do not find in the administrative file. However, we do not ask for the amount of income. So, the revision reduced the questionnaire time (10 minutes on average) because of the lighter questionnaire and because people do not have to look for information and to use physical paper to answer as before.
Secondly, the administrative data do not permit a total coverage of income components. We need to collect income data which are not available in the administrative data (income not taxed), income data for which we do not have yet the authorisation to receive the administrative file to complement the survey data (wealth tax for example) or income data for people we know we could not find in the administrative file (due to some specific rules to declare his income when you are aged between 18 and 25).
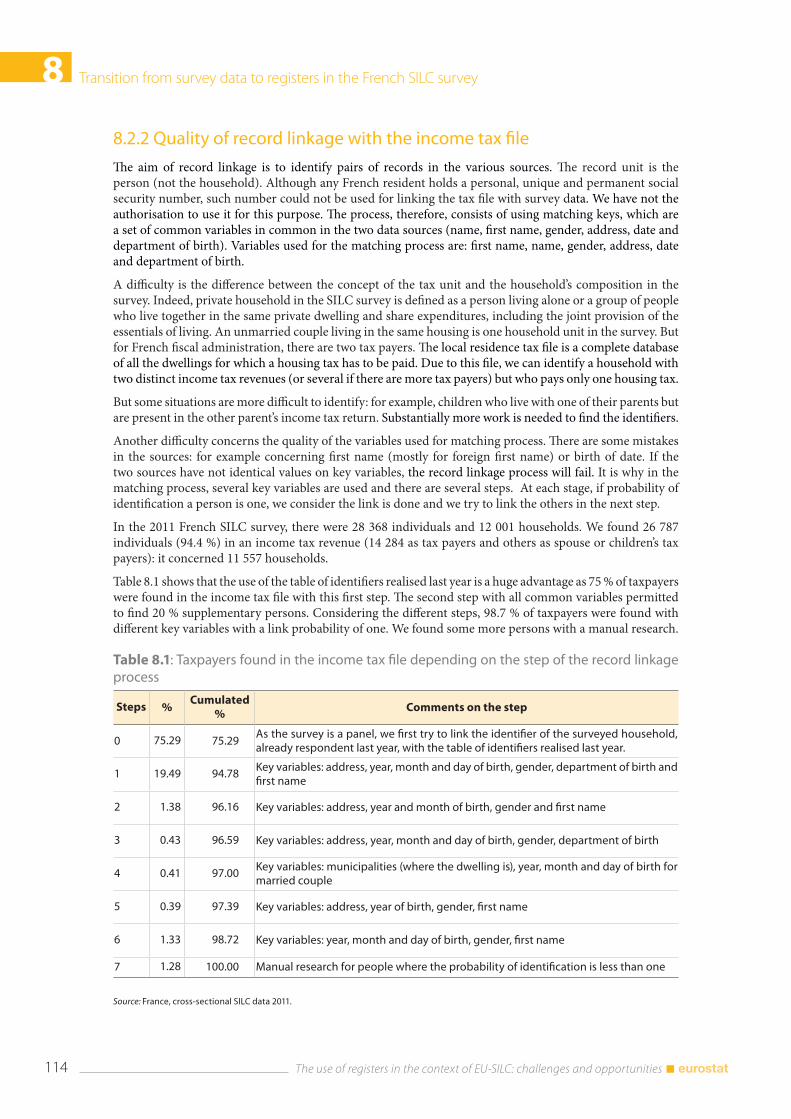
8 Transition from survey data to registers in the French SILC survey
The use of registers in the context of EU-SILC: challenges and opportunities 114
8.2.2 Quality of record linkage with the income tax file
The aim of record linkage is to identify pairs of records in the various sources. The record unit is the person (not the household). Although any French resident holds a personal, unique and permanent social security number, such number could not be used for linking the tax file with survey data. We have not the authorisation to use it for this purpose. The process, therefore, consists of using matching keys, which are a set of common variables in common in the two data sources (name, first name, gender, address, date and department of birth). Variables used for the matching process are: first name, name, gender, address, date and department of birth.
A difficulty is the difference between the concept of the tax unit and the household’s composition in the survey. Indeed, private household in the SILC survey is defined as a person living alone or a group of people who live together in the same private dwelling and share expenditures, including the joint provision of the essentials of living. An unmarried couple living in the same housing is one household unit in the survey. But for French fiscal administration, there are two tax payers. The local residence tax file is a complete database of all the dwellings for which a housing tax has to be paid. Due to this file, we can identify a household with two distinct income tax revenues (or several if there are more tax payers) but who pays only one housing tax.
But some situations are more difficult to identify: for example, children who live with one of their parents but are present in the other parent’s income tax return. Substantially more work is needed to find the identifiers.
Another difficulty concerns the quality of the variables used for matching process. There are some mistakes in the sources: for example concerning first name (mostly for foreign first name) or birth of date. If the two sources have not identical values on key variables, the record linkage process will fail. It is why in the matching process, several key variables are used and there are several steps. At each stage, if probability of identification a person is one, we consider the link is done and we try to link the others in the next step.
In the 2011 French SILC survey, there were 28 368 individuals and 12 001 households. We found 26 787 individuals (94.4 %) in an income tax revenue (14 284 as tax payers and others as spouse or children’s tax payers): it concerned 11 557 households.
Table 8.1 shows that the use of the table of identifiers realised last year is a huge advantage as 75 % of taxpayers were found in the income tax file with this first step. The second step with all common variables permitted to find 20 % supplementary persons. Considering the different steps, 98.7 % of taxpayers were found with different key variables with a link probability of one. We found some more persons with a manual research.
Table 8.1: Taxpayers found in the income tax file depending on the step of the record linkage process
Steps %Cumulated
% Comments on the step
0 75.29 75.29As the survey is a panel, we first try to link the identifier of the surveyed household, already respondent last year, with the table of identifiers realised last year.
1 19.49 94.78 Key variables: address, year, month and day of birth, gender, department of birth and first name
2 1.38 96.16 Key variables: address, year and month of birth, gender and first name
3 0.43 96.59 Key variables: address, year, month and day of birth, gender, department of birth
4 0.41 97.00 Key variables: municipalities (where the dwelling is), year, month and day of birth for married couple
5 0.39 97.39 Key variables: address, year of birth, gender, first name
6 1.33 98.72 Key variables: year, month and day of birth, gender, first name
7 1.28 100.00 Manual research for people where the probability of identification is less than one
Source: France, cross-sectional SILC data 2011.
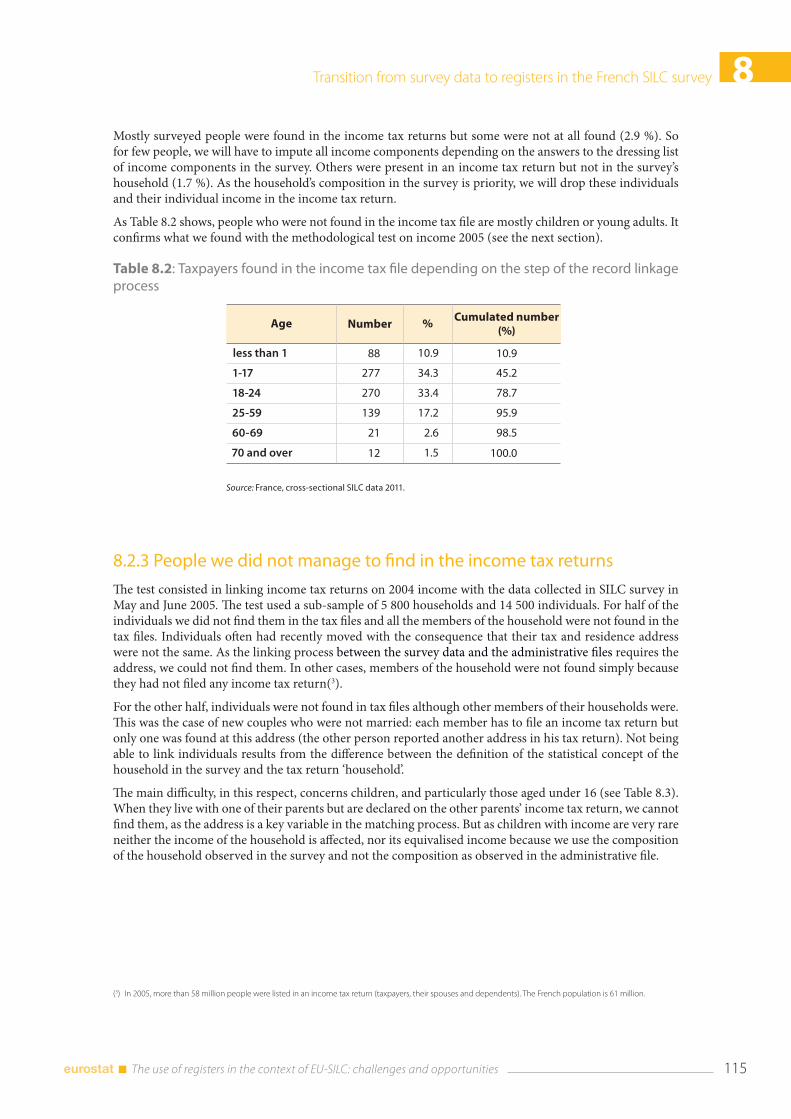
Transition from survey data to registers in the French SILC survey 8
115 The use of registers in the context of EU-SILC: challenges and opportunities
Mostly surveyed people were found in the income tax returns but some were not at all found (2.9 %). So for few people, we will have to impute all income components depending on the answers to the dressing list of income components in the survey. Others were present in an income tax return but not in the survey’s household (1.7 %). As the household’s composition in the survey is priority, we will drop these individuals and their individual income in the income tax return.
As Table 8.2 shows, people who were not found in the income tax file are mostly children or young adults. It confirms what we found with the methodological test on income 2005 (see the next section).
Table 8.2: Taxpayers found in the income tax file depending on the step of the record linkage process
Age Number % Cumulated number (%)
less than 1 88 10.9 10.9
1-17 277 34.3 45.2
18-24 270 33.4 78.7
25-59 139 17.2 95.9
60-69 21 2.6 98.5
70 and over 12 1.5 100.0
Source: France, cross-sectional SILC data 2011.
8.2.3 People we did not manage to find in the income tax returns
The test consisted in linking income tax returns on 2004 income with the data collected in SILC survey in May and June 2005. The test used a sub-sample of 5 800 households and 14 500 individuals. For half of the individuals we did not find them in the tax files and all the members of the household were not found in the tax files. Individuals often had recently moved with the consequence that their tax and residence address were not the same. As the linking process between the survey data and the administrative files requires the address, we could not find them. In other cases, members of the household were not found simply because they had not filed any income tax return(3).
For the other half, individuals were not found in tax files although other members of their households were. This was the case of new couples who were not married: each member has to file an income tax return but only one was found at this address (the other person reported another address in his tax return). Not being able to link individuals results from the difference between the definition of the statistical concept of the household in the survey and the tax return ‘household’.
The main difficulty, in this respect, concerns children, and particularly those aged under 16 (see Table 8.3). When they live with one of their parents but are declared on the other parents’ income tax return, we cannot find them, as the address is a key variable in the matching process. But as children with income are very rare neither the income of the household is affected, nor its equivalised income because we use the composition of the household observed in the survey and not the composition as observed in the administrative file.
(3) In 2005, more than 58 million people were listed in an income tax return (taxpayers, their spouses and dependents). The French population is 61 million.
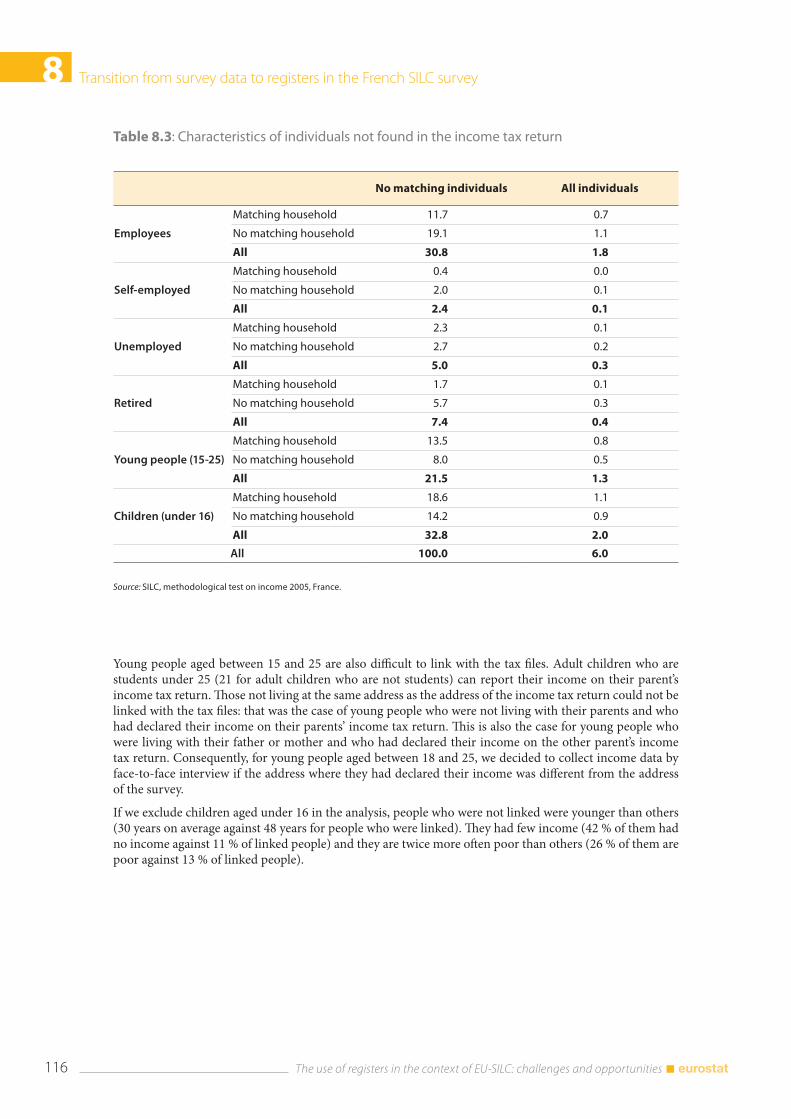
8 Transition from survey data to registers in the French SILC survey
The use of registers in the context of EU-SILC: challenges and opportunities 116
Table 8.3: Characteristics of individuals not found in the income tax return
No matching individuals All individuals
Employees
Matching household 11.7 0.7
No matching household 19.1 1.1
All 30.8 1.8
Self-employed
Matching household 0.4 0.0
No matching household 2.0 0.1
All 2.4 0.1
Unemployed
Matching household 2.3 0.1
No matching household 2.7 0.2
All 5.0 0.3
Retired
Matching household 1.7 0.1
No matching household 5.7 0.3
All 7.4 0.4
Young people (15-25)
Matching household 13.5 0.8
No matching household 8.0 0.5
All 21.5 1.3
Children (under 16)
Matching household 18.6 1.1
No matching household 14.2 0.9
All 32.8 2.0
All 100.0 6.0
Source: SILC, methodological test on income 2005, France.
Young people aged between 15 and 25 are also difficult to link with the tax files. Adult children who are students under 25 (21 for adult children who are not students) can report their income on their parent’s income tax return. Those not living at the same address as the address of the income tax return could not be linked with the tax files: that was the case of young people who were not living with their parents and who had declared their income on their parents’ income tax return. This is also the case for young people who were living with their father or mother and who had declared their income on the other parent’s income tax return. Consequently, for young people aged between 18 and 25, we decided to collect income data by face-to-face interview if the address where they had declared their income was different from the address of the survey.
If we exclude children aged under 16 in the analysis, people who were not linked were younger than others (30 years on average against 48 years for people who were linked). They had few income (42 % of them had no income against 11 % of linked people) and they are twice more often poor than others (26 % of them are poor against 13 % of linked people).
Transition from survey data to registers in the French SILC survey 8
117 The use of registers in the context of EU-SILC: challenges and opportunities
8.2.4 Quality of record linkage with the social files
The survey data are also linked with the social files from the family and the elderly branches of the French social security system:
• The CNAF (Caisse nationale des allocations familiales) is the leading player and a cornerstone of France’s pro-family policy. Apart from family benefits and a broad range of actions in the social sphere, it also administers three minimum income programmes, playing a major role in delivering France’s solidarity policy. The different types of benefits financed and administered by the family branch of France’s social security system are: family allowance, housing allowance, the single parent’s allowance (API), the disabled adult’s allowance (AAH) and the guaranteed minimum income (Revenu Minimum d’Insertion)
• The CCMSA (Central Agricultural Workers’ and Farmers’Mutual Benefit Fund) is the agricultural workers’ and farmers’ mutual welfare fund. The MSA covers all aspects of social welfare, some of whom are family and allowance housing and old-age pensions and minimum old-age pension or Solidarity allowance for elderly persons (ASPA)(4)
• The old age branch managed by the Caisse nationale d’assurance vieillesse, CNAV (National Old Age Pension Fund) covers old-age pensions and minimum old-age pension for people who were employees.
The record linkage process is different for each file and key variables used depend on the common variables between the sources.
The quality of record linkage with the social file from CNAF is essential because this body pays around 90 % of benefits in France. 18 % of the individuals participating in the French SILC Survey of 2011 were found in the social file as beneficiaries. In comparison with 17 % (11 millions) CNAF beneficiaries in the total French population, the results seem good. But the conclusion is not so easy as we do not know the real proportion of beneficiaries in the total population of France (overseas excluded) who are not living in collectivity. A way to approximate is to compare the number of households who declared in the survey that they were beneficiaries with those found in the social file(5). For 96 % of people who declared themselves to receive family allowances (which is the most frequent allowance) from CNAF, we found family allowances in the social file: so we can consider the link is good.
The quality of record linkage with the social file from MSA could be substantially improved, as the information on the address of the beneficiary is very poor at the moment. We estimate that only half of the beneficiaries who received allowances from this body can be found in their social file. In the future, we hope to receive a complete file to improve the quality of record linkage: discussions are on-going.
Concerning minimum old-age pension for people who were employees, the record linkage process is done directly by the National Old Age Pension Fund. Among persons aged 60 years and over, 96 % are found on their file but only 1.4 % receive a minimum old-age pension: for us, there is an area of doubt about this point as, considering the figures known, we think that twice as many people will have received this minimum. Furthermore, 20 % of this minimum old-age pension is paid by other pension funds. So, we need still to impute minimum old-age pension for some people. This point could be clarified with a next test done on linking process between exhaustive fiscal and social administrative data. We could use in the future the exhaustive file of the National Old Age Pension Fund to do ourselves the linking process with household’s survey data.
What we learned from these results is twofold:
• First, there is no need for personal identification number in both files to be able to link them. A linking based on identifying information such as names and address works extremely well for the purpose and quality objectives of a sample survey, but of course, the quality of the linking crucially hinges on the quality of such information, and in particular the address. Default of linkage can be
(4) ASPA is a new allowance that replaced, in January 2007, the former old age pension allowances for new beneficiaries.
(5) It could have some errors in the survey but we consider it is not significant.
8 Transition from survey data to registers in the French SILC survey
The use of registers in the context of EU-SILC: challenges and opportunities 118
dealt with standard techniques of imputation. Consequently, it is still necessary to ask them in the questionnaire which type of income people have
• Secondly, even when the linking works at the household (broadly speaking), some categories of population, e.g. young adults or more generally young people, can be very difficult to link. However, in the case of children it has on average no impact, and for young adult, it can be resolved through survey interviews.
8.3 Results of the methodological test: comparison of some income components distributions across sourcesIn this part, we compare the survey responses and the administrative information for some income components from the test on 2004 income with the data collected in SILC survey in 2005.
8.3.1 Comparison of the type of income observed in the survey and in the income tax file
For 83 % of individuals, the types of income observed in the survey and in the income tax file were the same. 7 % of people had income in the two sources but the type of income was different. For 4 % of individuals, we found income in the tax file but not in the survey. Inversely, for 3 % of individuals, we found income in the survey but not in the administrative file.
Concerning wages, the results are quite similar. The vast majority of respondents correctly reported that they either did or did not receive wages during the year. For 4 % of respondent, wages were collected in the income tax return but individuals had not been reported it in the survey. Inversely, 3 % of people said in the survey they received wages and we found no information about it in the administrative file.
During the fieldwork, the interviewer was supposed to ask the respondent whether he accepted to look at his tax documents (physical paper provided by the household during the interview) in the best case or payroll documents. Differences were twice more important for people who did not use income tax returns to answer: 6 % (against 3 %) of people answered in the survey that they did not receive wages in 2004 whereas wages were reported in the tax file. Inversely, 4 % of people (against 2 %) answered in the survey they received wages in 2004 whereas no wages were reported in the administrative file. Where do such differences come from? Recall bias is very likely to be an important factor, but errors might also result from proxy answering or simply mistakes about the type of income (self-employed declared they received wages in the survey while it was self-employed benefits). Some differences came from a reversal between the income earned by the wife and this one earned by the husband in one of the data source: this point was corrected in the process linking. Then, retired people were more likely to underreport wage earnings. In most cases, it concerned small amounts, as found in income tax returns.
8.3.2 Comparison of some income components distributions
Concerning wages, the difference on the distribution of income was slight between the two data sources for respondents for whom we collected both survey responses(6) and the administrative data (see Figure 8.2). Generally, the quality of this variable is good in the survey. Furthermore, econometric models for wages imputation, if we do not have this information, permit to have good estimation. This variable is well known by individuals and not too difficult to model.
The annual mean wage was very close between the two sources. Table 8.4 shows that wages were under-evaluated in the first quartile and over-evaluated in the last one.
(6) For those who said by interview they received wages but did not transmit the amount, imputations had been done.
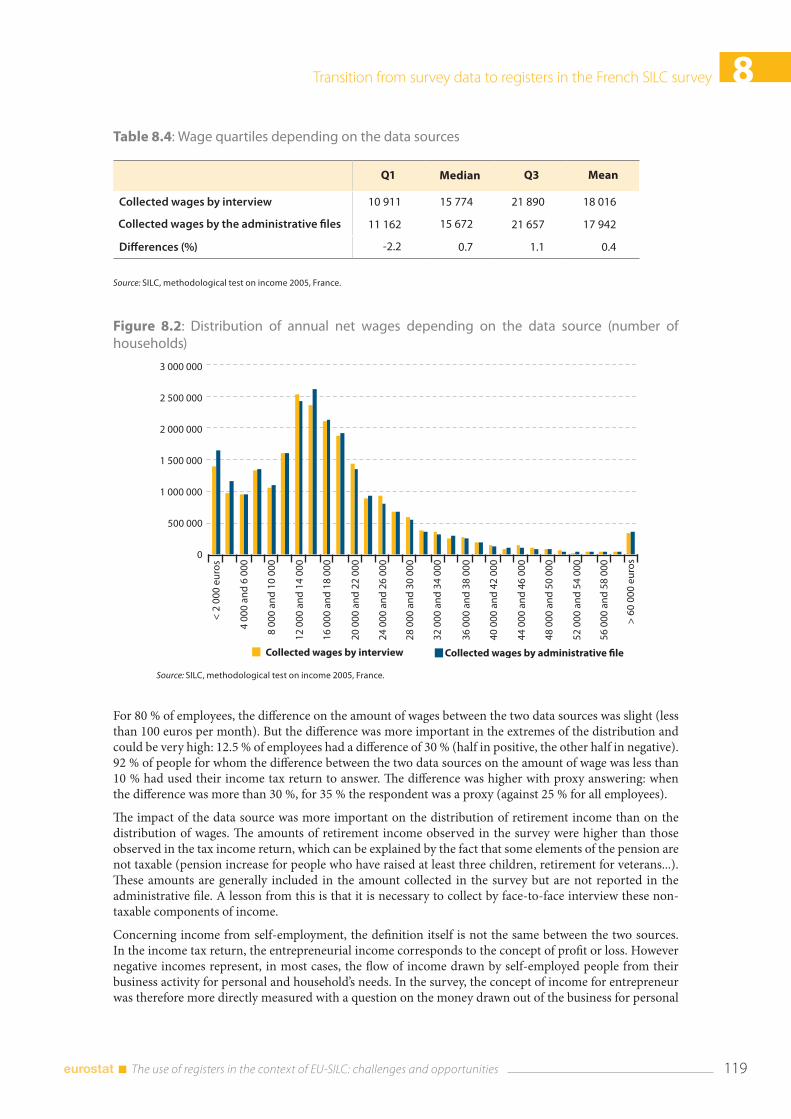
Transition from survey data to registers in the French SILC survey 8
119 The use of registers in the context of EU-SILC: challenges and opportunities
Table 8.4: Wage quartiles depending on the data sources
Q1 Median Q3 Mean
Collected wages by interview 10 911 15 774 21 890 18 016
Collected wages by the administrative files 11 162 15 672 21 657 17 942
Differences (%) -2.2 0.7 1.1 0.4
Source: SILC, methodological test on income 2005, France.
For 80 % of employees, the difference on the amount of wages between the two data sources was slight (less than 100 euros per month). But the difference was more important in the extremes of the distribution and could be very high: 12.5 % of employees had a difference of 30 % (half in positive, the other half in negative). 92 % of people for whom the difference between the two data sources on the amount of wage was less than 10 % had used their income tax return to answer. The difference was higher with proxy answering: when the difference was more than 30 %, for 35 % the respondent was a proxy (against 25 % for all employees).
The impact of the data source was more important on the distribution of retirement income than on the distribution of wages. The amounts of retirement income observed in the survey were higher than those observed in the tax income return, which can be explained by the fact that some elements of the pension are not taxable (pension increase for people who have raised at least three children, retirement for veterans...). These amounts are generally included in the amount collected in the survey but are not reported in the administrative file. A lesson from this is that it is necessary to collect by face-to-face interview these non-taxable components of income.
Concerning income from self-employment, the definition itself is not the same between the two sources. In the income tax return, the entrepreneurial income corresponds to the concept of profit or loss. However negative incomes represent, in most cases, the flow of income drawn by self-employed people from their business activity for personal and household’s needs. In the survey, the concept of income for entrepreneur was therefore more directly measured with a question on the money drawn out of the business for personal
Figure 8.2: Distribution of annual net wages depending on the data source (number of households)
Source: SILC, methodological test on income 2005, France.
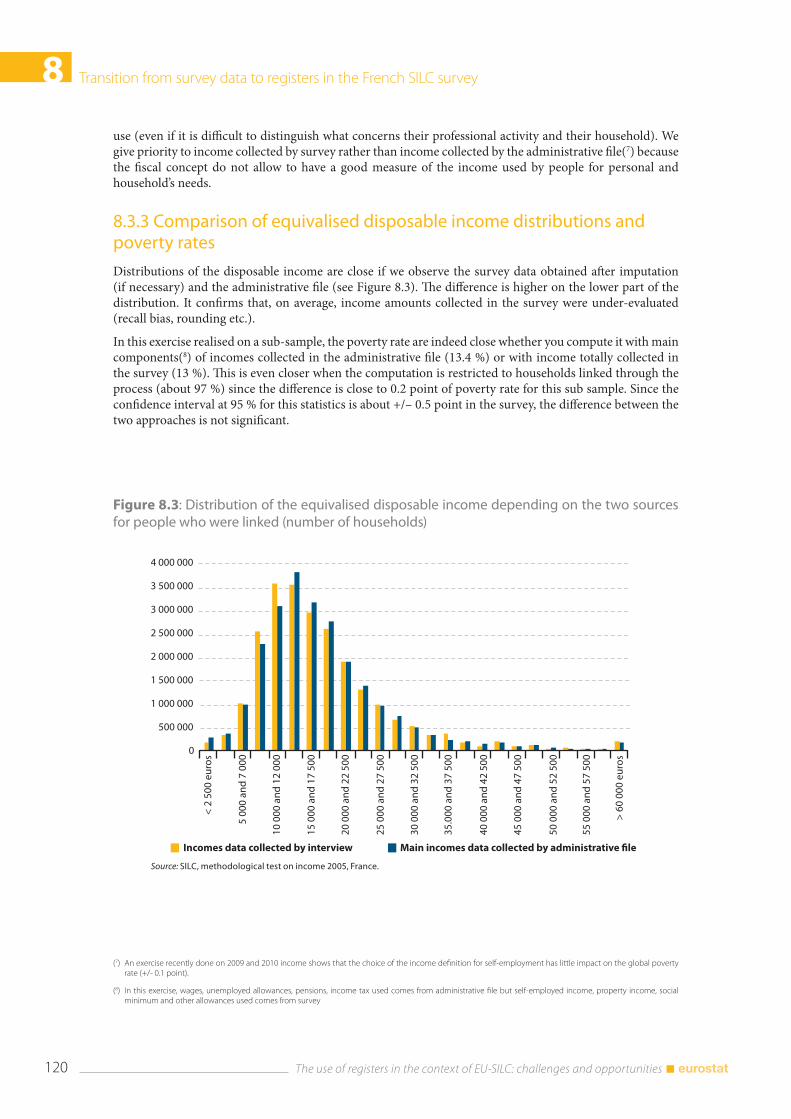
8 Transition from survey data to registers in the French SILC survey
The use of registers in the context of EU-SILC: challenges and opportunities 120
use (even if it is difficult to distinguish what concerns their professional activity and their household). We give priority to income collected by survey rather than income collected by the administrative file(7) because the fiscal concept do not allow to have a good measure of the income used by people for personal and household’s needs.
8.3.3 Comparison of equivalised disposable income distributions and poverty rates
Distributions of the disposable income are close if we observe the survey data obtained after imputation (if necessary) and the administrative file (see Figure 8.3). The difference is higher on the lower part of the distribution. It confirms that, on average, income amounts collected in the survey were under-evaluated (recall bias, rounding etc.).
In this exercise realised on a sub-sample, the poverty rate are indeed close whether you compute it with main components(8) of incomes collected in the administrative file (13.4 %) or with income totally collected in the survey (13 %). This is even closer when the computation is restricted to households linked through the process (about 97 %) since the difference is close to 0.2 point of poverty rate for this sub sample. Since the confidence interval at 95 % for this statistics is about +/– 0.5 point in the survey, the difference between the two approaches is not significant.
(7) An exercise recently done on 2009 and 2010 income shows that the choice of the income definition for self-employment has little impact on the global poverty rate (+/- 0.1 point).
(8) In this exercise, wages, unemployed allowances, pensions, income tax used comes from administrative file but self-employed income, property income, social minimum and other allowances used comes from survey
Figure 8.3: Distribution of the equivalised disposable income depending on the two sources for people who were linked (number of households)
Source: SILC, methodological test on income 2005, France.
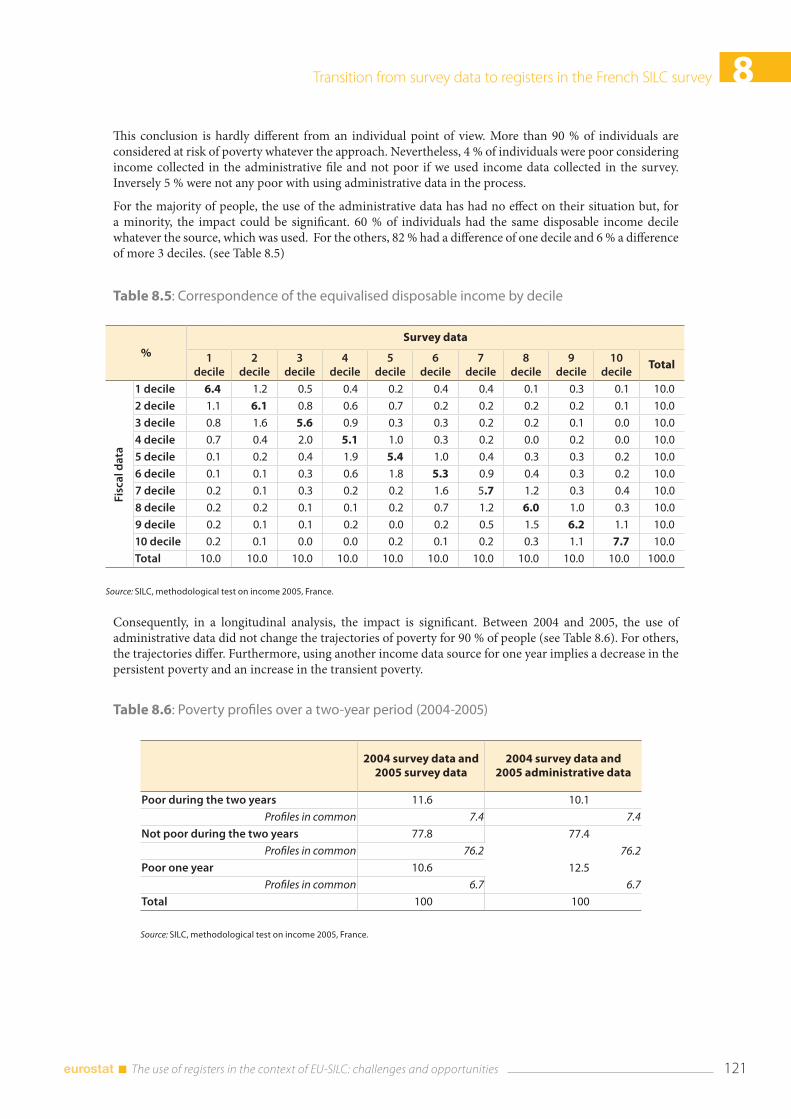
Transition from survey data to registers in the French SILC survey 8
121 The use of registers in the context of EU-SILC: challenges and opportunities
This conclusion is hardly different from an individual point of view. More than 90 % of individuals are considered at risk of poverty whatever the approach. Nevertheless, 4 % of individuals were poor considering income collected in the administrative file and not poor if we used income data collected in the survey. Inversely 5 % were not any poor with using administrative data in the process.
For the majority of people, the use of the administrative data has had no effect on their situation but, for a minority, the impact could be significant. 60 % of individuals had the same disposable income decile whatever the source, which was used. For the others, 82 % had a difference of one decile and 6 % a difference of more 3 deciles. (see Table 8.5)
Table 8.5: Correspondence of the equivalised disposable income by decile
%Survey data
1decile
2decile
3decile
4decile
5decile
6decile
7decile
8decile
9decile
10decile
Total
Fisc
al d
ata
1 decile 6.4 1.2 0.5 0.4 0.2 0.4 0.4 0.1 0.3 0.1 10.0
2 decile 1.1 6.1 0.8 0.6 0.7 0.2 0.2 0.2 0.2 0.1 10.0
3 decile 0.8 1.6 5.6 0.9 0.3 0.3 0.2 0.2 0.1 0.0 10.0
4 decile 0.7 0.4 2.0 5.1 1.0 0.3 0.2 0.0 0.2 0.0 10.0
5 decile 0.1 0.2 0.4 1.9 5.4 1.0 0.4 0.3 0.3 0.2 10.0
6 decile 0.1 0.1 0.3 0.6 1.8 5.3 0.9 0.4 0.3 0.2 10.0
7 decile 0.2 0.1 0.3 0.2 0.2 1.6 5.7 1.2 0.3 0.4 10.0
8 decile 0.2 0.2 0.1 0.1 0.2 0.7 1.2 6.0 1.0 0.3 10.0
9 decile 0.2 0.1 0.1 0.2 0.0 0.2 0.5 1.5 6.2 1.1 10.0
10 decile 0.2 0.1 0.0 0.0 0.2 0.1 0.2 0.3 1.1 7.7 10.0
Total 10.0 10.0 10.0 10.0 10.0 10.0 10.0 10.0 10.0 10.0 100.0
Source: SILC, methodological test on income 2005, France.
Consequently, in a longitudinal analysis, the impact is significant. Between 2004 and 2005, the use of administrative data did not change the trajectories of poverty for 90 % of people (see Table 8.6). For others, the trajectories differ. Furthermore, using another income data source for one year implies a decrease in the persistent poverty and an increase in the transient poverty.
Table 8.6: Poverty profiles over a two-year period (2004-2005)
2004 survey data and2005 survey data
2004 survey data and2005 administrative data
Poor during the two years 11.6 10.1
Profiles in common 7.4 7.4
Not poor during the two years 77.8 77.4Profiles in common 76.2 76.2
Poor one year 10.6 12.5Profiles in common 6.7 6.7
Total 100 100
Source: SILC, methodological test on income 2005, France.
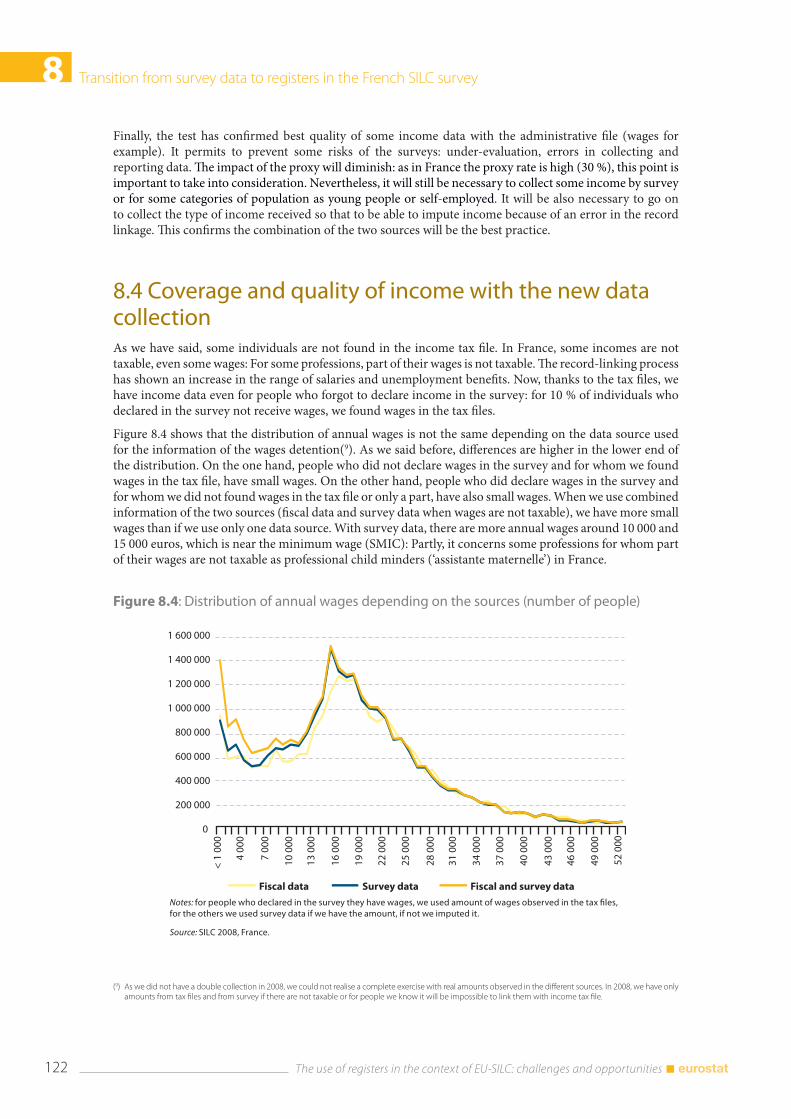
8 Transition from survey data to registers in the French SILC survey
The use of registers in the context of EU-SILC: challenges and opportunities 122
Finally, the test has confirmed best quality of some income data with the administrative file (wages for example). It permits to prevent some risks of the surveys: under-evaluation, errors in collecting and reporting data. The impact of the proxy will diminish: as in France the proxy rate is high (30 %), this point is important to take into consideration. Nevertheless, it will still be necessary to collect some income by survey or for some categories of population as young people or self-employed. It will be also necessary to go on to collect the type of income received so that to be able to impute income because of an error in the record linkage. This confirms the combination of the two sources will be the best practice.
8.4 Coverage and quality of income with the new data collection As we have said, some individuals are not found in the income tax file. In France, some incomes are not taxable, even some wages: For some professions, part of their wages is not taxable. The record-linking process has shown an increase in the range of salaries and unemployment benefits. Now, thanks to the tax files, we have income data even for people who forgot to declare income in the survey: for 10 % of individuals who declared in the survey not receive wages, we found wages in the tax files.
Figure 8.4 shows that the distribution of annual wages is not the same depending on the data source used for the information of the wages detention(9). As we said before, differences are higher in the lower end of the distribution. On the one hand, people who did not declare wages in the survey and for whom we found wages in the tax file, have small wages. On the other hand, people who did declare wages in the survey and for whom we did not found wages in the tax file or only a part, have also small wages. When we use combined information of the two sources (fiscal data and survey data when wages are not taxable), we have more small wages than if we use only one data source. With survey data, there are more annual wages around 10 000 and 15 000 euros, which is near the minimum wage (SMIC): Partly, it concerns some professions for whom part of their wages are not taxable as professional child minders (‘assistante maternelle’) in France.
(9) As we did not have a double collection in 2008, we could not realise a complete exercise with real amounts observed in the different sources. In 2008, we have only amounts from tax files and from survey if there are not taxable or for people we know it will be impossible to link them with income tax file.
Figure 8.4: Distribution of annual wages depending on the sources (number of people)
Notes: for people who declared in the survey they have wages, we used amount of wages observed in the tax files, for the others we used survey data if we have the amount, if not we imputed it.
Source: SILC 2008, France.
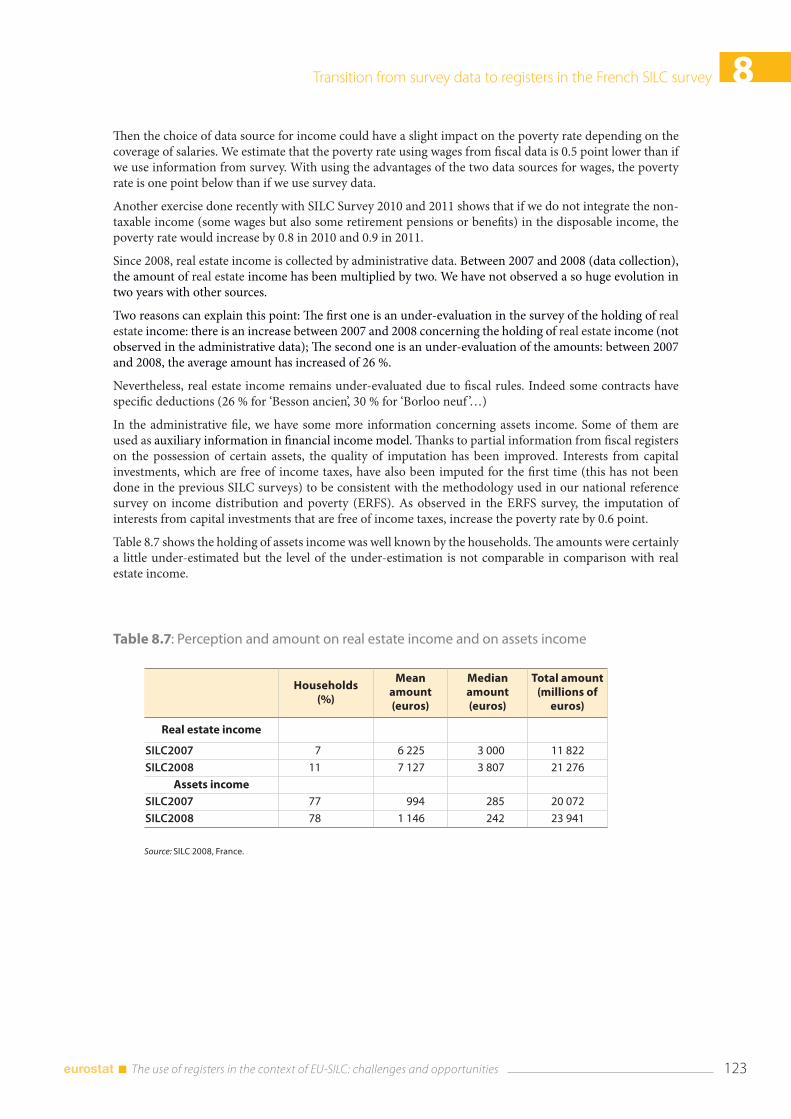
Transition from survey data to registers in the French SILC survey 8
123 The use of registers in the context of EU-SILC: challenges and opportunities
Then the choice of data source for income could have a slight impact on the poverty rate depending on the coverage of salaries. We estimate that the poverty rate using wages from fiscal data is 0.5 point lower than if we use information from survey. With using the advantages of the two data sources for wages, the poverty rate is one point below than if we use survey data.
Another exercise done recently with SILC Survey 2010 and 2011 shows that if we do not integrate the non-taxable income (some wages but also some retirement pensions or benefits) in the disposable income, the poverty rate would increase by 0.8 in 2010 and 0.9 in 2011.
Since 2008, real estate income is collected by administrative data. Between 2007 and 2008 (data collection), the amount of real estate income has been multiplied by two. We have not observed a so huge evolution in two years with other sources.
Two reasons can explain this point: The first one is an under-evaluation in the survey of the holding of real estate income: there is an increase between 2007 and 2008 concerning the holding of real estate income (not observed in the administrative data); The second one is an under-evaluation of the amounts: between 2007 and 2008, the average amount has increased of 26 %.
Nevertheless, real estate income remains under-evaluated due to fiscal rules. Indeed some contracts have specific deductions (26 % for ‘Besson ancien’, 30 % for ‘Borloo neuf ’…)
In the administrative file, we have some more information concerning assets income. Some of them are used as auxiliary information in financial income model. Thanks to partial information from fiscal registers on the possession of certain assets, the quality of imputation has been improved. Interests from capital investments, which are free of income taxes, have also been imputed for the first time (this has not been done in the previous SILC surveys) to be consistent with the methodology used in our national reference survey on income distribution and poverty (ERFS). As observed in the ERFS survey, the imputation of interests from capital investments that are free of income taxes, increase the poverty rate by 0.6 point.
Table 8.7 shows the holding of assets income was well known by the households. The amounts were certainly a little under-estimated but the level of the under-estimation is not comparable in comparison with real estate income.
Table 8.7: Perception and amount on real estate income and on assets income
Households(%)
Mean amount(euros)
Median amount(euros)
Total amount (millions of
euros)
Real estate income SILC2007 7 6 225 3 000 11 822
SILC2008 11 7 127 3 807 21 276
Assets income SILC2007 77 994 285 20 072
SILC2008 78 1 146 242 23 941
Source: SILC 2008, France.
8 Transition from survey data to registers in the French SILC survey
The use of registers in the context of EU-SILC: challenges and opportunities 124
Due to improvements and mixed strategy for using advantages of the two sources on data collection, the average amount of disposable income has increased by 15 % between 2007 and 2008. Furthermore, the inequality (Gini coefficient) has increased from 0.39 to 0.44. Then, the poverty rate is lower: between SILC2007 and SILC2008, it has decreased from 13.1 % to 12.6 %. Nevertheless, since the confidence interval at 95 % for this statistics is about +/– 0.5 point in the survey, this evolution is not significant.
Poverty transitions are certainly more affected by the change of methodology. As we have seen in the methodological test, about 9 % of people did not have the same position on the scale if we used administrative data than if we used survey data. Consequently, it makes little sense to compare 2005 with the 2008 income values. It is why, since 2008, we have stopped the dissemination of the longitudinal poverty indicators. Then, all income-related indicators have been flagged in 2008 with a ‘b’ (break in the time series) to inform users there were some changes.
For longitudinal analysis, we can eliminate some differences between the two methodologies to confirm results of an analysis which could be impacted by the change of methodology: for example, not using interests from capital investments, not using non-taxable income and work only with people who declared in the survey they have income and for which we found income in the administration data. Furthermore, 2008-2011 transversal data will be disseminated in 2013 and longitudinal analysis on four years could be again realised on the basis of a common methodology.
8.5 ConclusionsTo conclude, the best way to do a total evaluation of the transition would have been to collect the same year income by face-to-face and by register. These double data collection were not possible for France. However, the methodological test on income 2005 and the analyses of 2007 and 2008 data permit us to conclude that this transition has had a slight impact on the main cross-sectional indicators on poverty but has increased inequality indicators. This follows from improved coverage of income and the quality of the amount of income. It is why the transition from survey data to registers in France was an important step for the quality of data. It permitted to conclude that the best way for collecting household’s income is to combine register and survey income data. It permitted to improve the coverage and the quality of income data by having a homogeneous income concept among the population and by collecting the real amounts of income. It also reduced errors control during the data process and imputation of income. Due to this progress, INSEE has generalised the linking with administrative data for main household surveys in France.
8.6 ReferencesBurricand, C. and Lorgnet, J.-P. (2012), ‘L’attrition dans SRCV: déterminants et effets de l’attrition sur la mesure des variables’, Journées de méthodologies statistiques, INSEE.
Dauphin, L. (2008), ‘La qualité des données sur les revenus: enquête versus fichier administratif. L’exemple de l’enquête SRCV 2005’.
Desrosières, A. (2007), ‘Surveys versus administrative records: reflections on the duality of statistical sources’, Courrier des Statistiques, English series n°13 INSEE.
Isnard, M. (2006), ‘Statistics and individual liberties: recent changes in French law’, Courrier des Statistiques, English series n°12 INSEE.
Lollivier, S. and Verger, D. (2005), ‘Trois apports des données longitudinales à l’analyse de la pauvreté’, Economie et statistique n°383-384-385, INSEE.
Improvements of data quality through the combined use of survey and administrative sources and micro simulation model 9
125 The use of registers in the context of EU-SILC: challenges and opportunities
9. Improvements of data quality through the combined use of survey and administrative sources and micro simulation model
Paolo Consolini and Gabriella Donatiello(1)
Abstract: This chapter reviews the Italian SILC (IT-SILC) multi-sources data collection strategy developed at Italian National Institute of Statistics since 2004 focussing on the integration of survey data and administrative data in order to improve data quality and the under reporting on income components. The leading idea is to exploit administrative data (particularly the fiscal agency and the pension database) in order to fill in the survey missing values, correct outliers or unreliable values, improve the quality of income estimates. The integration process essentially affects the final estimates of income, therefore synthetic measures of such impact will be provided. In addition the integration of microsimulation technique with register data for the construction of gross income variables is also outlined. The joint use of the University of Siena’s SM2 model and the administrative sources definitely enhances the advantages obtainable from the exclusive use of either fiscal data or microsimulation techniques using survey. Some outputs, compared with external sources, are finally presented.
9.1 IntroductionThe Italian SILC (IT-SILC) is based on the ‘face to face interview’ method of collecting data and uses administrative micro-data in order to reduce measurement errors. In order to limit the impact of errors on the income reported in the questionnaire by the interviewees, and generally to improve the data quality in the survey, a project of multi-source data collection has been started up at ISTAT since 2004. At the first IT-SILC edition (survey 2004), this process involved only two income components which are self-employment income and pensions. Since the second edition (survey 2005) it has also included the employee income. In what follows it will be analysed the main steps of the integration process with a focus on solutions employed to solve typical problems arising from the integration of different data-sources (harmonisation of the units and definitions, incoherencies on income profiles, reconciliation of incoherent income levels). At the same time it will be provided an estimate of the impact that integration has on the final values of the income distribution.
This chapter also gives an insight into the construction of IT-SILC gross income variables using an innovative methodology which applies both a microsimulation model (Siena Micro-Simulation Model — SM2-EU-SILC) and administrative sources. The administrative data in terms of net income, tax credits and income deductions are utilised with survey data as input file of the model and as benchmark for microsimulation results. Therefore fiscal data and microsimulation estimates are both applied for reciprocal comparison and validation together with the construction of the gross variables at individual and household level. The IT-SILC gross income production process is summed up through the development of the model SM2-EU-SILC starting from SM2, and the integration of survey data and administrative data jointly used with microsimulation.
(1) Paolo Consolini and Gabriella Donatiello are with the Italian National Institute of Statistics (ISTAT). We would like to thank Eric Marlier, Veli-Matti Törmälehto and Markus Jäntti for very helpful comments on earlier versions of this document and for all their valuable suggestions. These persons should not, however, be held responsible in any way for the present contents. This work has been supported by the second Network for the analysis of EU-SILC (Net-SILC2), funded by Eurostat. The European Commission and ISTAT bear no responsibility for the analyses and conclusions, which are solely those of the authors. Addresses for correspondence: [email protected] and [email protected].
9 Improvements of data quality through the combined use of survey and administrative sources and micro simulation model
The use of registers in the context of EU-SILC: challenges and opportunities 126
The chapter reviews the integration methodology developed in ISTAT and highlights the combined use of survey data and administrative data for the construction of IT-SILC net and gross income target variables. Section 9.2 explains the integration process developed and the setting up of the integrated data set of the net income variables. Section 9.3 focuses on the ISTAT methodology of using in conjunction a microsimulation model and an exact record linkage between survey and fiscal data at micro level for the production of gross income variables. Finally, in Section 9.4 some outputs are reported and compared with external sources used as benchmark.
9.2 The record linkage of administrative and survey data for IT-SILC The EU-SILC (European Union Statistics on Income and Living Conditions) Italian team has developed a multi-source data collection strategy in the measurement of main income components since 2004. This strategy consists in bringing together paper and pencil face-to-face interviews (PAPI) with administrative records(2). The standard way to combine administrative and survey data is by selecting an individual matching-key able to link the same unit among different data-sources (record linkage)(3). The aim of combining administrative and survey data is to improve data quality on income components (target variables) and relative earners by means of imputation of item non-responses and reduction of measurement errors. In addition, matching tax returns records with survey data also provide information at micro level on social security contributions, taxable incomes and tax liabilities. All this information is used to measure the gross/net taxable income and represents the input of SM2 micro-simulation model. The target population is represented by the Italian reference population of IT-SILC: all private households and their current members residing in Italy at time of data collection. Persons living in collective households and in institutions are excluded from the target population. The analysis units are adult members (15+ aged) living in private households(4).
9.2.1 The measurement of income components
With regard to the measurement of self-employment incomes in household surveys, there are two clear-cut statements that depict the state of the art: ‘Income data for the self-employed are also generally regarded as unreliable as a guide to living standards’; ‘Household surveys are notoriously bad at measuring income from capital and self-employment income’. The use of alternative sources on earnings from self-employment may create problems when the objective is to determine the variable ‘disposable income’(5). Survey data may be affected by under-reporting. However, administrative data gathering individual tax returns do not take account of illegal tax evasion and may not display all the authorised deductions allowed in the calculation of taxable income (tax avoidance). In general, neither taxable income is identical to gross income, nor net taxable income is identical to disposable income. In principle, if the deductions from profits are available to the company owners for their personal use, then they should be considered as components of both the gross and the disposable personal incomes. However, not all the tax abatements allowed are explicitly shown in the tax returns. By definition, tax evasion is also not available in the tax files. In the EU-SILC project, the net self-employment income is defined as: ‘the amount of money drawn out of self-employment business’. In order to minimise under-estimation, the IT-SILC self-employment income has been set to the maximum value between the net income resulting from the tax source and the net income reported in the survey(6).
Regarding the measurement of income from pensions, it is assumed that administrative data provide more accurate information than survey data. The latter data source is used only if it is impossible to match the
(2) The conversion from Papi to Capi interviews has taken place starting from 2011 edition.
(3) Newcombe (1988).
(4) The IT-SILC survey also collects information on fifteen-year-old persons, even if the P file (Personal data) released to Eurostat includes only 16+ adult members living in private households.
(5) Canberra Group, (2001, p. 54 and p. 62).
(6) For a more detailed analysis of this subject it is advised to see Consolini et al (2006) and Di Marco (2006).
Improvements of data quality through the combined use of survey and administrative sources and micro simulation model 9
127 The use of registers in the context of EU-SILC: challenges and opportunities
sample units to those recorded in the Personal Tax Annual Register or in the Pension Register (unmatched units). The integration of the administrative sources on pensions and pensioners needs developing system solutions to the problem of the harmonisation of units, definitions and variables and the reconciliation of the incoherencies in income values between the sources involved. In order to derive net pension income distinctly for each function (target variables), the ‘yearly net tax income of the pensions’ from the Tax Agency of Italy (henceforth referred to as ‘NTA’, i.e. ‘National Tax Agency’) and the ‘monthly gross payments on pensions’ broken down into functions and types from INPS (National Social Insurance Agency) have to be joined. The Pension Register collects a set of attributes on the pensioners: the monthly amount before tax, the type of pension classified according to EU-SILC functions (target variables), etc. On the other hand, the Tax Registers record the information on yearly gross/net incomes received by each pensioner without any distinction between functions or target variables. In order to join the information included in the Tax Registers and in the Pension Register we need to define a ‘harmonised definition of pension income’ that is comparable between these data-sources. The common base of the comparison is represented by the derived variable: ‘yearly taxable income from pensions’. The tool of relative differences, in terms of income values observed on the same statistical units across different data sources (social security and tax data), represents the core of the decisional structure used when defining the pension levels and, generally, when attributing the income components(7). Comparing the gross taxable pensions respectively from the Pension Register and the CUD/770 tax source, we find out high coherence: 84.14 % of the matched cases show relative differences in absolute values under the 5 % threshold. There is evidence that the Pension Register provides more accurate information on gross income, and fiscal sources report proper information on the tax at source, as well as on tax credits.
The measurement of employee income is based on comparison of administrative and survey data on wages and salaries after retention at source. The main administrative source for this income component is represented by CUD/770 tax statements register. In Italy, employers, as withholding agents, are obliged to declare the amounts of wages/salaries and social benefits annually paid to their employees. As the employee income’s components covered by administrative source are not perfectly comparable with the target variable PY010 (employee cash or near cash income) it is necessary to reallocate some of them in a proper way. With respect to employee income, we assume that true disposable employee income is included in the administrative source providing that employee does not receive exempt income items (like tips or bonuses) or is employed in sectors of hidden economy (like agricultural, private educational institutes, etc.). The CUD/770 tax register includes 99.1 % of employee income records reported in all administrative sources.
9.2.2 The integration methodology
In order to carry out the integration of alternative database, some basic requirements have to be satisfied by all sources involved. Therefore, the statistical units are to be defined uniformly in all sources (harmonisation of units), all sources should cover the same target population (completion of populations), all variables have to be defined and classified in the same way among the data-sources considered (harmonisation of the variables and classifications), all data should refer to the same period or the same point in time(8). In other terms, administrative data need to be comparable with the EU-SILC survey data. The technique used to link the administrative units to those in the survey sample is exact record linkage. This technique allows combining information related to the same statistical units by means of a collection of identifiers called ‘match keys’provided that each unit is associated with a unique identifier not affected by errors. Different typologies of exact record linkage exist: in this case we refer to the simplest ‘one-to one’ relationship, where every statistical unit of a data source is associated with at most one record from the other data source(9). Records in different data sources are matched by means of the Personal Tax Number. Once that is accomplished the integration task, the identification numbers are dropped and replaced with an internal system code according to the confidentiality policy of the Italian National Institute of Statistics. The integration process between survey and administrative data can be summarised in the following four phases(10):
(7) See for more details: Consolini (2008).
(8) van der Laan (2000).
(9) See Newcombe (1988), Herzog et al (2007).
(10) See Consolini (2009).
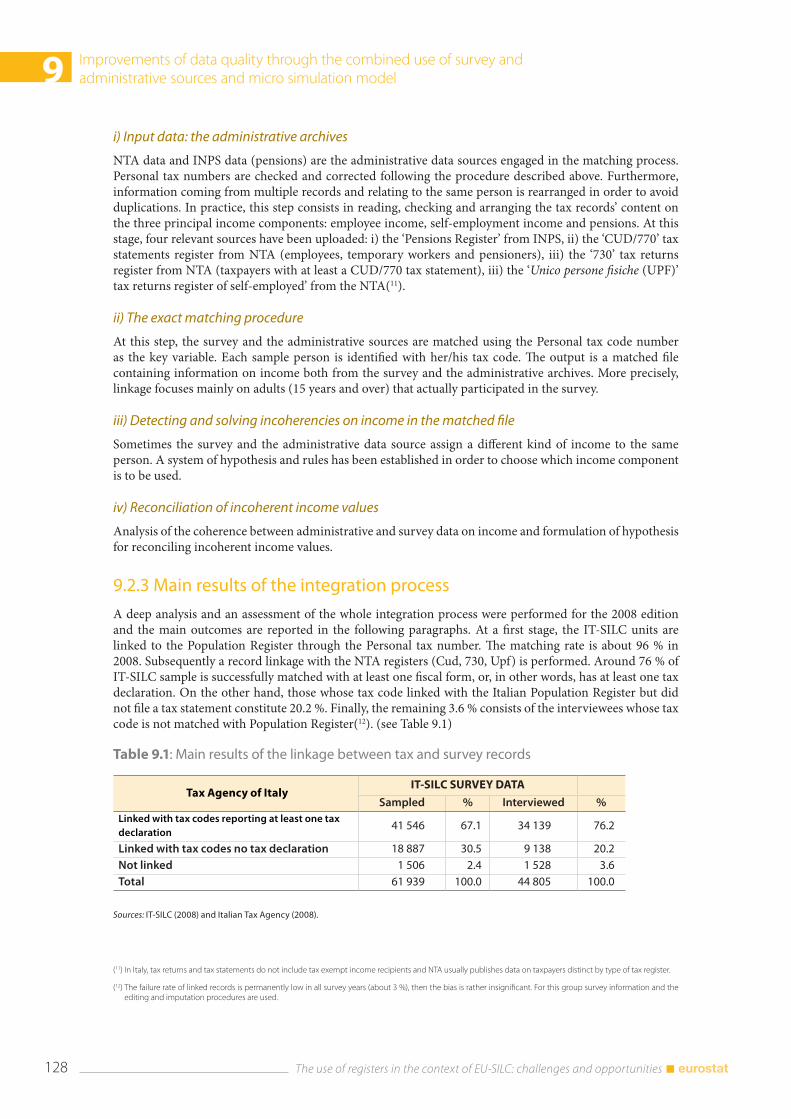
9 Improvements of data quality through the combined use of survey and administrative sources and micro simulation model
The use of registers in the context of EU-SILC: challenges and opportunities 128
i) Input data: the administrative archives
NTA data and INPS data (pensions) are the administrative data sources engaged in the matching process. Personal tax numbers are checked and corrected following the procedure described above. Furthermore, information coming from multiple records and relating to the same person is rearranged in order to avoid duplications. In practice, this step consists in reading, checking and arranging the tax records’ content on the three principal income components: employee income, self-employment income and pensions. At this stage, four relevant sources have been uploaded: i) the ‘Pensions Register’ from INPS, ii) the ‘CUD/770’ tax statements register from NTA (employees, temporary workers and pensioners), iii) the ‘730’ tax returns register from NTA (taxpayers with at least a CUD/770 tax statement), iii) the ‘Unico persone fisiche (UPF)’ tax returns register of self-employed’ from the NTA(11).
ii) The exact matching procedure
At this step, the survey and the administrative sources are matched using the Personal tax code number as the key variable. Each sample person is identified with her/his tax code. The output is a matched file containing information on income both from the survey and the administrative archives. More precisely, linkage focuses mainly on adults (15 years and over) that actually participated in the survey.
iii) Detecting and solving incoherencies on income in the matched file
Sometimes the survey and the administrative data source assign a different kind of income to the same person. A system of hypothesis and rules has been established in order to choose which income component is to be used.
iv) Reconciliation of incoherent income values
Analysis of the coherence between administrative and survey data on income and formulation of hypothesis for reconciling incoherent income values.
9.2.3 Main results of the integration process
A deep analysis and an assessment of the whole integration process were performed for the 2008 edition and the main outcomes are reported in the following paragraphs. At a first stage, the IT-SILC units are linked to the Population Register through the Personal tax number. The matching rate is about 96 % in 2008. Subsequently a record linkage with the NTA registers (Cud, 730, Upf) is performed. Around 76 % of IT-SILC sample is successfully matched with at least one fiscal form, or, in other words, has at least one tax declaration. On the other hand, those whose tax code linked with the Italian Population Register but did not file a tax statement constitute 20.2 %. Finally, the remaining 3.6 % consists of the interviewees whose tax code is not matched with Population Register(12). (see Table 9.1)
Table 9.1: Main results of the linkage between tax and survey records
Tax Agency of ItalyIT-SILC SURVEY DATA
Sampled % Interviewed %Linked with tax codes reporting at least one tax declaration
41 546 67.1 34 139 76.2
Linked with tax codes no tax declaration 18 887 30.5 9 138 20.2 Not linked 1 506 2.4 1 528 3.6
Total 61 939 100.0 44 805 100.0
Sources: IT-SILC (2008) and Italian Tax Agency (2008).
(11) In Italy, tax returns and tax statements do not include tax exempt income recipients and NTA usually publishes data on taxpayers distinct by type of tax register.
(12) The failure rate of linked records is permanently low in all survey years (about 3 %), then the bias is rather insignificant. For this group survey information and the editing and imputation procedures are used.
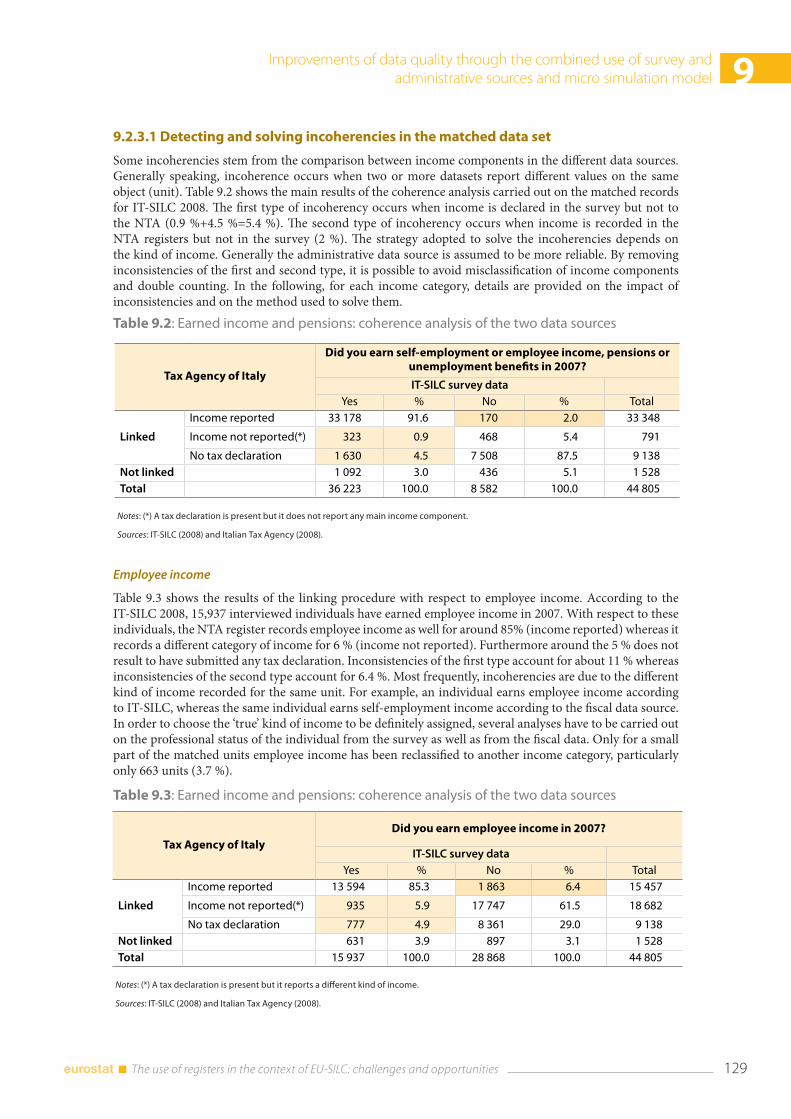
Improvements of data quality through the combined use of survey and administrative sources and micro simulation model 9
129 The use of registers in the context of EU-SILC: challenges and opportunities
9.2.3.1 Detecting and solving incoherencies in the matched data set
Some incoherencies stem from the comparison between income components in the different data sources. Generally speaking, incoherence occurs when two or more datasets report different values on the same object (unit). Table 9.2 shows the main results of the coherence analysis carried out on the matched records for IT-SILC 2008. The first type of incoherency occurs when income is declared in the survey but not to the NTA (0.9 %+4.5 %=5.4 %). The second type of incoherency occurs when income is recorded in the NTA registers but not in the survey (2 %). The strategy adopted to solve the incoherencies depends on the kind of income. Generally the administrative data source is assumed to be more reliable. By removing inconsistencies of the first and second type, it is possible to avoid misclassification of income components and double counting. In the following, for each income category, details are provided on the impact of inconsistencies and on the method used to solve them.
Table 9.2: Earned income and pensions: coherence analysis of the two data sources
Tax Agency of Italy
Did you earn self-employment or employee income, pensions or unemployment benefits in 2007?
IT-SILC survey dataYes % No % Total
Linked
Income reported 33 178 91.6 170 2.0 33 348
Income not reported(*) 323 0.9 468 5.4 791
No tax declaration 1 630 4.5 7 508 87.5 9 138Not linked 1 092 3.0 436 5.1 1 528Total 36 223 100.0 8 582 100.0 44 805
Notes: (*) A tax declaration is present but it does not report any main income component.
Sources: IT-SILC (2008) and Italian Tax Agency (2008).
Employee income
Table 9.3 shows the results of the linking procedure with respect to employee income. According to the IT-SILC 2008, 15,937 interviewed individuals have earned employee income in 2007. With respect to these individuals, the NTA register records employee income as well for around 85% (income reported) whereas it records a different category of income for 6 % (income not reported). Furthermore around the 5 % does not result to have submitted any tax declaration. Inconsistencies of the first type account for about 11 % whereas inconsistencies of the second type account for 6.4 %. Most frequently, incoherencies are due to the different kind of income recorded for the same unit. For example, an individual earns employee income according to IT-SILC, whereas the same individual earns self-employment income according to the fiscal data source. In order to choose the ‘true’ kind of income to be definitely assigned, several analyses have to be carried out on the professional status of the individual from the survey as well as from the fiscal data. Only for a small part of the matched units employee income has been reclassified to another income category, particularly only 663 units (3.7 %).
Table 9.3: Earned income and pensions: coherence analysis of the two data sources
Tax Agency of ItalyDid you earn employee income in 2007?
IT-SILC survey dataYes % No % Total
Linked
Income reported 13 594 85.3 1 863 6.4 15 457
Income not reported(*) 935 5.9 17 747 61.5 18 682
No tax declaration 777 4.9 8 361 29.0 9 138Not linked 631 3.9 897 3.1 1 528Total 15 937 100.0 28 868 100.0 44 805
Notes: (*) A tax declaration is present but it reports a different kind of income.
Sources: IT-SILC (2008) and Italian Tax Agency (2008).
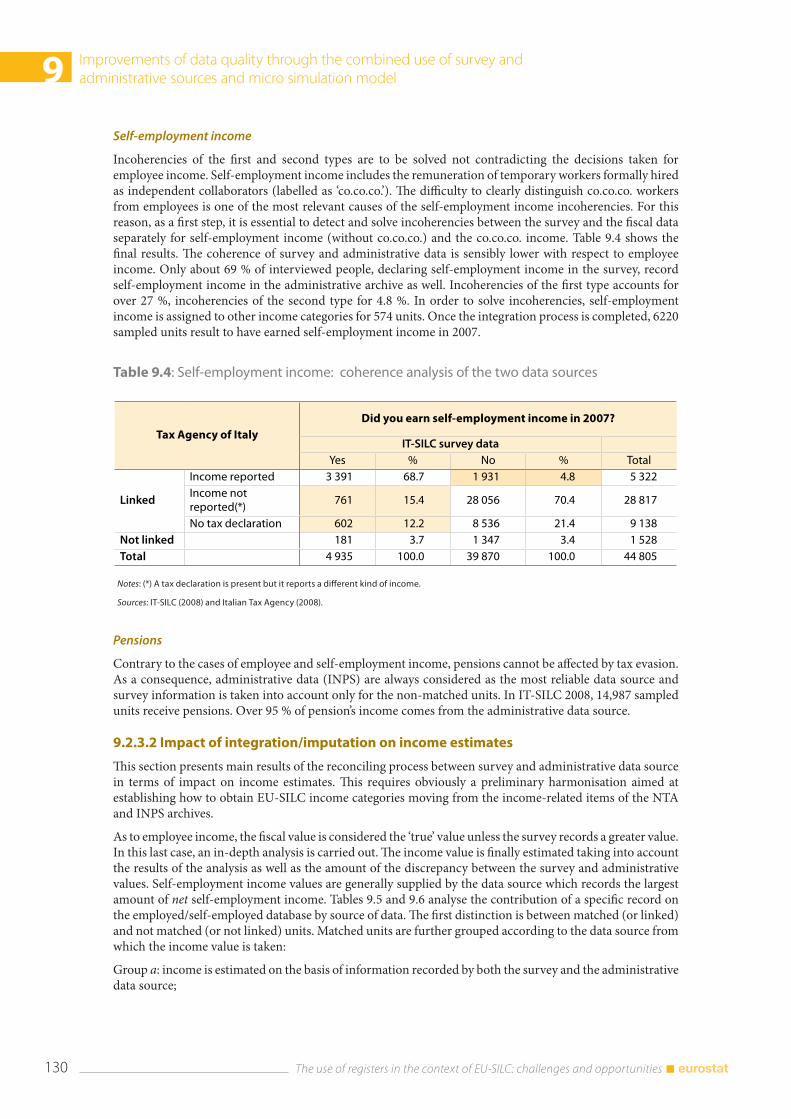
9 Improvements of data quality through the combined use of survey and administrative sources and micro simulation model
The use of registers in the context of EU-SILC: challenges and opportunities 130
Self-employment income
Incoherencies of the first and second types are to be solved not contradicting the decisions taken for employee income. Self-employment income includes the remuneration of temporary workers formally hired as independent collaborators (labelled as ‘co.co.co.’). The difficulty to clearly distinguish co.co.co. workers from employees is one of the most relevant causes of the self-employment income incoherencies. For this reason, as a first step, it is essential to detect and solve incoherencies between the survey and the fiscal data separately for self-employment income (without co.co.co.) and the co.co.co. income. Table 9.4 shows the final results. The coherence of survey and administrative data is sensibly lower with respect to employee income. Only about 69 % of interviewed people, declaring self-employment income in the survey, record self-employment income in the administrative archive as well. Incoherencies of the first type accounts for over 27 %, incoherencies of the second type for 4.8 %. In order to solve incoherencies, self-employment income is assigned to other income categories for 574 units. Once the integration process is completed, 6220 sampled units result to have earned self-employment income in 2007.
Table 9.4: Self-employment income: coherence analysis of the two data sources
Tax Agency of ItalyDid you earn self-employment income in 2007?
IT-SILC survey dataYes % No % Total
Linked
Income reported 3 391 68.7 1 931 4.8 5 322Income not reported(*)
761 15.4 28 056 70.4 28 817
No tax declaration 602 12.2 8 536 21.4 9 138Not linked 181 3.7 1 347 3.4 1 528Total 4 935 100.0 39 870 100.0 44 805
Notes: (*) A tax declaration is present but it reports a different kind of income.
Sources: IT-SILC (2008) and Italian Tax Agency (2008).
Pensions
Contrary to the cases of employee and self-employment income, pensions cannot be affected by tax evasion. As a consequence, administrative data (INPS) are always considered as the most reliable data source and survey information is taken into account only for the non-matched units. In IT-SILC 2008, 14,987 sampled units receive pensions. Over 95 % of pension’s income comes from the administrative data source.
9.2.3.2 Impact of integration/imputation on income estimates
This section presents main results of the reconciling process between survey and administrative data source in terms of impact on income estimates. This requires obviously a preliminary harmonisation aimed at establishing how to obtain EU-SILC income categories moving from the income-related items of the NTA and INPS archives.
As to employee income, the fiscal value is considered the ‘true’ value unless the survey records a greater value. In this last case, an in-depth analysis is carried out. The income value is finally estimated taking into account the results of the analysis as well as the amount of the discrepancy between the survey and administrative values. Self-employment income values are generally supplied by the data source which records the largest amount of net self-employment income. Tables 9.5 and 9.6 analyse the contribution of a specific record on the employed/self-employed database by source of data. The first distinction is between matched (or linked) and not matched (or not linked) units. Matched units are further grouped according to the data source from which the income value is taken:
Group a: income is estimated on the basis of information recorded by both the survey and the administrative data source;
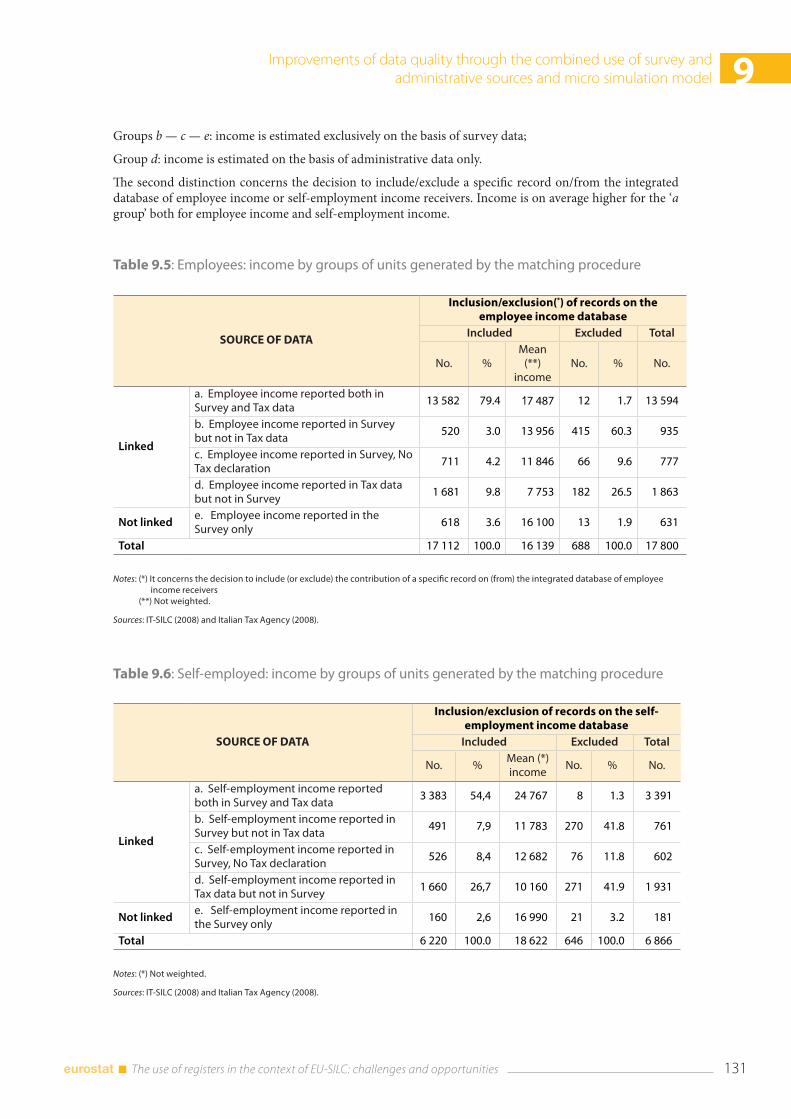
Improvements of data quality through the combined use of survey and administrative sources and micro simulation model 9
131 The use of registers in the context of EU-SILC: challenges and opportunities
Groups b — c — e: income is estimated exclusively on the basis of survey data;
Group d: income is estimated on the basis of administrative data only.
The second distinction concerns the decision to include/exclude a specific record on/from the integrated database of employee income or self-employment income receivers. Income is on average higher for the ‘a group’ both for employee income and self-employment income.
Table 9.5: Employees: income by groups of units generated by the matching procedure
SOURCE OF DATA
Inclusion/exclusion(*) of records on the employee income database
Included Excluded Total
No. %Mean
(**) income
No. % No.
Linked
a. Employee income reported both in Survey and Tax data
13 582 79.4 17 487 12 1.7 13 594
b. Employee income reported in Survey but not in Tax data
520 3.0 13 956 415 60.3 935
c. Employee income reported in Survey, No Tax declaration
711 4.2 11 846 66 9.6 777
d. Employee income reported in Tax data but not in Survey
1 681 9.8 7 753 182 26.5 1 863
Not linkede. Employee income reported in the Survey only
618 3.6 16 100 13 1.9 631
Total 17 112 100.0 16 139 688 100.0 17 800
Notes: (*) It concerns the decision to include (or exclude) the contribution of a specific record on (from) the integrated database of employee income receivers (**) Not weighted.
Sources: IT-SILC (2008) and Italian Tax Agency (2008).
Table 9.6: Self-employed: income by groups of units generated by the matching procedure
SOURCE OF DATA
Inclusion/exclusion of records on the self-employment income database
Included Excluded Total
No. %Mean (*) income
No. % No.
Linked
a. Self-employment income reported both in Survey and Tax data 3 383 54,4 24 767 8 1.3 3 391
b. Self-employment income reported in Survey but not in Tax data
491 7,9 11 783 270 41.8 761
c. Self-employment income reported in Survey, No Tax declaration
526 8,4 12 682 76 11.8 602
d. Self-employment income reported in Tax data but not in Survey
1 660 26,7 10 160 271 41.9 1 931
Not linkede. Self-employment income reported in the Survey only
160 2,6 16 990 21 3.2 181
Total 6 220 100.0 18 622 646 100.0 6 866
Notes: (*) Not weighted.
Sources: IT-SILC (2008) and Italian Tax Agency (2008).
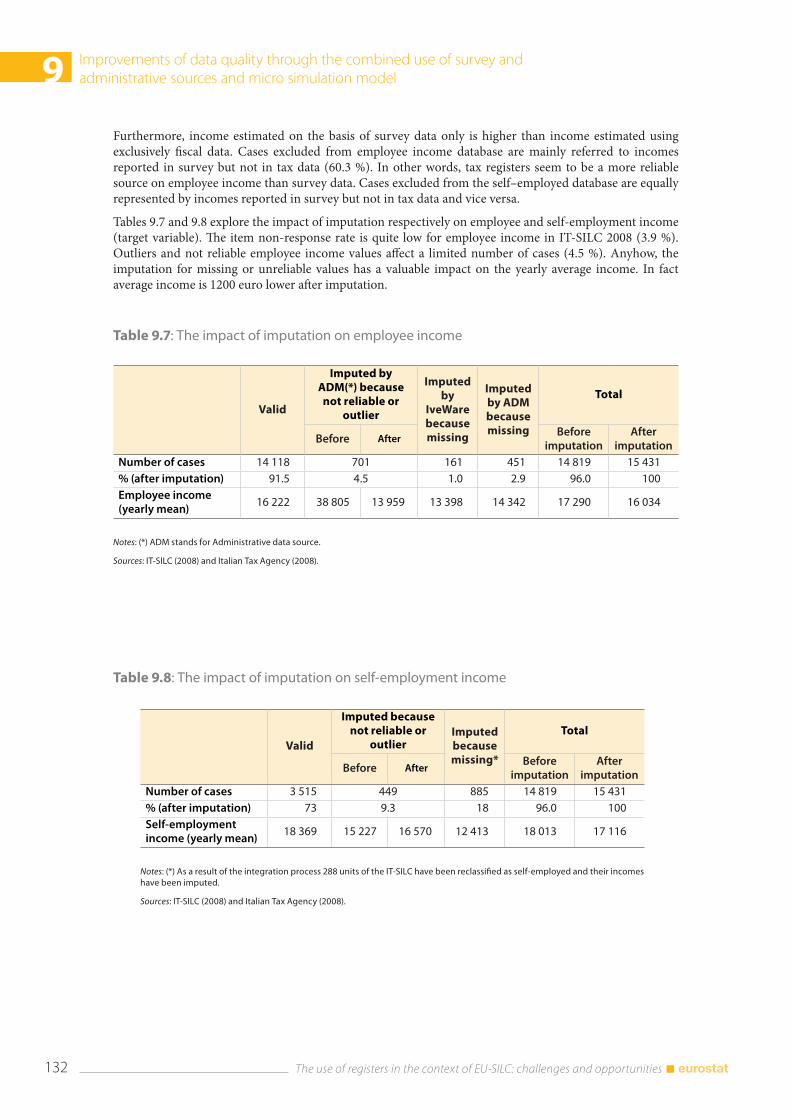
9 Improvements of data quality through the combined use of survey and administrative sources and micro simulation model
The use of registers in the context of EU-SILC: challenges and opportunities 132
Furthermore, income estimated on the basis of survey data only is higher than income estimated using exclusively fiscal data. Cases excluded from employee income database are mainly referred to incomes reported in survey but not in tax data (60.3 %). In other words, tax registers seem to be a more reliable source on employee income than survey data. Cases excluded from the self–employed database are equally represented by incomes reported in survey but not in tax data and vice versa.
Tables 9.7 and 9.8 explore the impact of imputation respectively on employee and self-employment income (target variable). The item non-response rate is quite low for employee income in IT-SILC 2008 (3.9 %). Outliers and not reliable employee income values affect a limited number of cases (4.5 %). Anyhow, the imputation for missing or unreliable values has a valuable impact on the yearly average income. In fact average income is 1200 euro lower after imputation.
Table 9.7: The impact of imputation on employee income
Table 9.8: The impact of imputation on self-employment income
Valid
Imputed by ADM(*) because not reliable or
outlier
Imputed by
IveWare because missing
Imputed by ADM because missing
Total
Before AfterBefore
imputationAfter
imputationNumber of cases 14 118 701 161 451 14 819 15 431 % (after imputation) 91.5 4.5 1.0 2.9 96.0 100 Employee income (yearly mean)
16 222 38 805 13 959 13 398 14 342 17 290 16 034
Notes: (*) ADM stands for Administrative data source.
Sources: IT-SILC (2008) and Italian Tax Agency (2008).
Valid
Imputed because not reliable or
outlierImputed because missing*
Total
Before AfterBefore
imputationAfter
imputationNumber of cases 3 515 449 885 14 819 15 431 % (after imputation) 73 9.3 18 96.0 100 Self-employment income (yearly mean)
18 369 15 227 16 570 12 413 18 013 17 116
Notes: (*) As a result of the integration process 288 units of the IT-SILC have been reclassified as self-employed and their incomes have been imputed.
Sources: IT-SILC (2008) and Italian Tax Agency (2008).
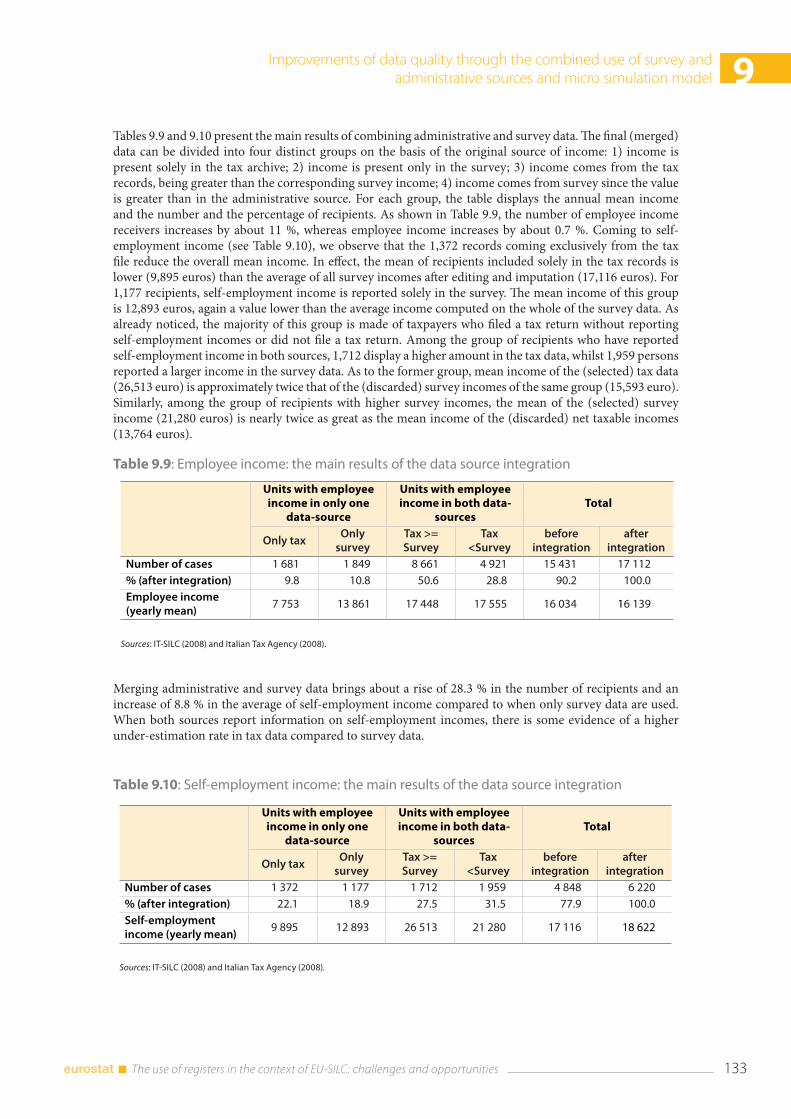
Improvements of data quality through the combined use of survey and administrative sources and micro simulation model 9
133 The use of registers in the context of EU-SILC: challenges and opportunities
Tables 9.9 and 9.10 present the main results of combining administrative and survey data. The final (merged) data can be divided into four distinct groups on the basis of the original source of income: 1) income is present solely in the tax archive; 2) income is present only in the survey; 3) income comes from the tax records, being greater than the corresponding survey income; 4) income comes from survey since the value is greater than in the administrative source. For each group, the table displays the annual mean income and the number and the percentage of recipients. As shown in Table 9.9, the number of employee income receivers increases by about 11 %, whereas employee income increases by about 0.7 %. Coming to self-employment income (see Table 9.10), we observe that the 1,372 records coming exclusively from the tax file reduce the overall mean income. In effect, the mean of recipients included solely in the tax records is lower (9,895 euros) than the average of all survey incomes after editing and imputation (17,116 euros). For 1,177 recipients, self-employment income is reported solely in the survey. The mean income of this group is 12,893 euros, again a value lower than the average income computed on the whole of the survey data. As already noticed, the majority of this group is made of taxpayers who filed a tax return without reporting self-employment incomes or did not file a tax return. Among the group of recipients who have reported self-employment income in both sources, 1,712 display a higher amount in the tax data, whilst 1,959 persons reported a larger income in the survey data. As to the former group, mean income of the (selected) tax data (26,513 euro) is approximately twice that of the (discarded) survey incomes of the same group (15,593 euro). Similarly, among the group of recipients with higher survey incomes, the mean of the (selected) survey income (21,280 euros) is nearly twice as great as the mean income of the (discarded) net taxable incomes (13,764 euros).
Table 9.9: Employee income: the main results of the data source integration
Units with employee income in only one
data-source
Units with employee income in both data-
sourcesTotal
Only taxOnly
surveyTax >= Survey
Tax <Survey
before integration
after integration
Number of cases 1 681 1 849 8 661 4 921 15 431 17 112 % (after integration) 9.8 10.8 50.6 28.8 90.2 100.0 Employee income (yearly mean)
7 753 13 861 17 448 17 555 16 034 16 139
Sources: IT-SILC (2008) and Italian Tax Agency (2008).
Units with employee income in only one
data-source
Units with employee income in both data-
sourcesTotal
Only taxOnly
surveyTax >= Survey
Tax <Survey
before integration
after integration
Number of cases 1 372 1 177 1 712 1 959 4 848 6 220 % (after integration) 22.1 18.9 27.5 31.5 77.9 100.0 Self-employment income (yearly mean)
9 895 12 893 26 513 21 280 17 116 18 622
Sources: IT-SILC (2008) and Italian Tax Agency (2008).
Table 9.10: Self-employment income: the main results of the data source integration
Merging administrative and survey data brings about a rise of 28.3 % in the number of recipients and an increase of 8.8 % in the average of self-employment income compared to when only survey data are used. When both sources report information on self-employment incomes, there is some evidence of a higher under-estimation rate in tax data compared to survey data.
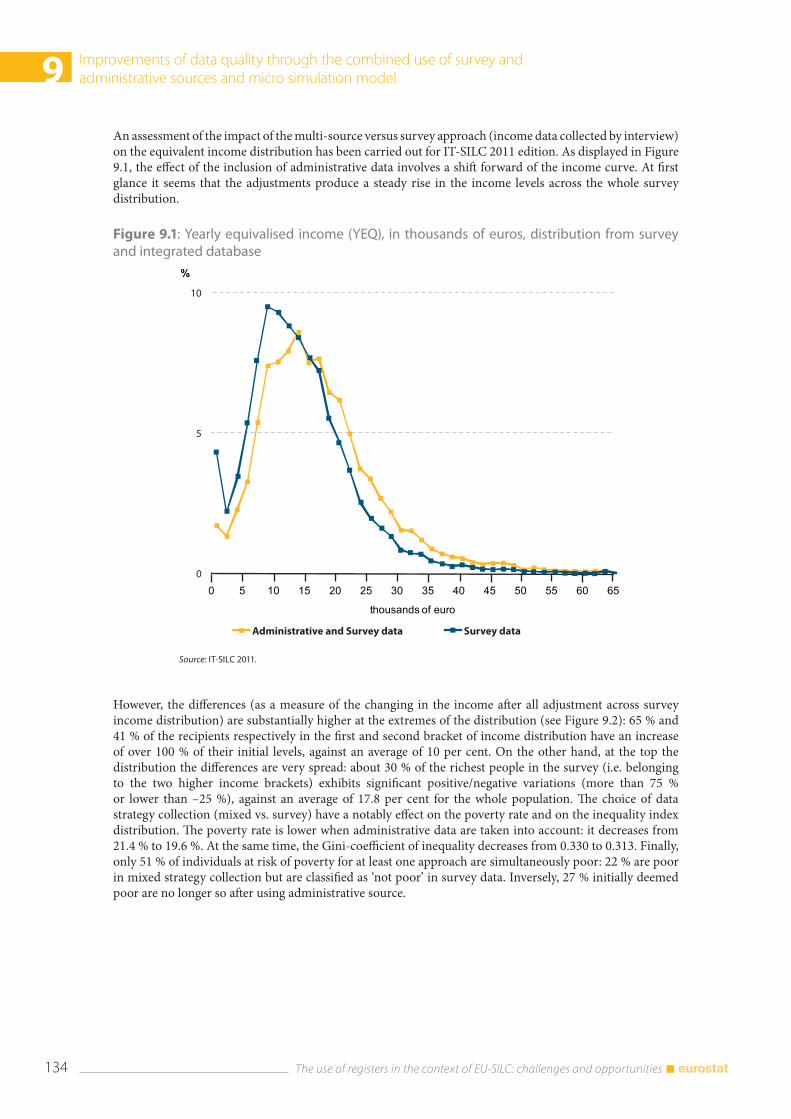
9 Improvements of data quality through the combined use of survey and administrative sources and micro simulation model
The use of registers in the context of EU-SILC: challenges and opportunities 134
An assessment of the impact of the multi-source versus survey approach (income data collected by interview) on the equivalent income distribution has been carried out for IT-SILC 2011 edition. As displayed in Figure 9.1, the effect of the inclusion of administrative data involves a shift forward of the income curve. At first glance it seems that the adjustments produce a steady rise in the income levels across the whole survey distribution.
Figure 9.1: Yearly equivalised income (YEQ), in thousands of euros, distribution from survey and integrated database
Source: IT-SILC 2011.
However, the differences (as a measure of the changing in the income after all adjustment across survey income distribution) are substantially higher at the extremes of the distribution (see Figure 9.2): 65 % and 41 % of the recipients respectively in the first and second bracket of income distribution have an increase of over 100 % of their initial levels, against an average of 10 per cent. On the other hand, at the top the distribution the differences are very spread: about 30 % of the richest people in the survey (i.e. belonging to the two higher income brackets) exhibits significant positive/negative variations (more than 75 % or lower than –25 %), against an average of 17.8 per cent for the whole population. The choice of data strategy collection (mixed vs. survey) have a notably effect on the poverty rate and on the inequality index distribution. The poverty rate is lower when administrative data are taken into account: it decreases from 21.4 % to 19.6 %. At the same time, the Gini-coefficient of inequality decreases from 0.330 to 0.313. Finally, only 51 % of individuals at risk of poverty for at least one approach are simultaneously poor: 22 % are poor in mixed strategy collection but are classified as ‘not poor’ in survey data. Inversely, 27 % initially deemed poor are no longer so after using administrative source.
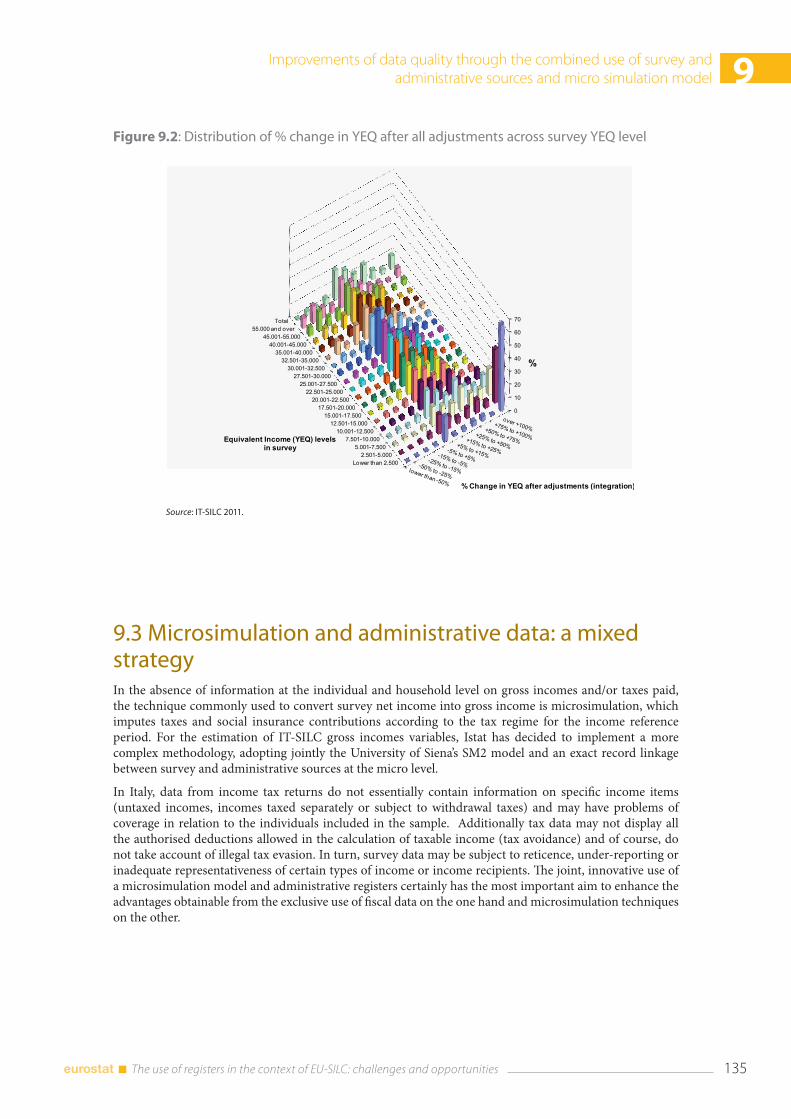
Improvements of data quality through the combined use of survey and administrative sources and micro simulation model 9
135 The use of registers in the context of EU-SILC: challenges and opportunities
Figure 9.2: Distribution of % change in YEQ after all adjustments across survey YEQ level
Source: IT-SILC 2011.
9.3 Microsimulation and administrative data: a mixed strategyIn the absence of information at the individual and household level on gross incomes and/or taxes paid, the technique commonly used to convert survey net income into gross income is microsimulation, which imputes taxes and social insurance contributions according to the tax regime for the income reference period. For the estimation of IT-SILC gross incomes variables, Istat has decided to implement a more complex methodology, adopting jointly the University of Siena’s SM2 model and an exact record linkage between survey and administrative sources at the micro level.
In Italy, data from income tax returns do not essentially contain information on specific income items (untaxed incomes, incomes taxed separately or subject to withdrawal taxes) and may have problems of coverage in relation to the individuals included in the sample. Additionally tax data may not display all the authorised deductions allowed in the calculation of taxable income (tax avoidance) and of course, do not take account of illegal tax evasion. In turn, survey data may be subject to reticence, under-reporting or inadequate representativeness of certain types of income or income recipients. The joint, innovative use of a microsimulation model and administrative registers certainly has the most important aim to enhance the advantages obtainable from the exclusive use of fiscal data on the one hand and microsimulation techniques on the other.

9 Improvements of data quality through the combined use of survey and administrative sources and micro simulation model
The use of registers in the context of EU-SILC: challenges and opportunities 136
9.3.1 The gross income data production process
The European Commission has adopted the model SM2 as the recommended procedure for the net-gross conversion of EU-SILC income variables. Siena University team has developed the model SM2 as a flexible tool useful for multi-country application, given that the model can be applied to diverse input data collected in various forms across and within countries and it is able to generate variables in a comparable and standardised form. At the outset, the SM2 model has been developed for calendar year 2003 and applied to the ECHP (European Community Household Panel) survey data of three countries (Italy, Spain and France) (13).
ISTAT production of IT-SILC gross income variables can be summed up in three important steps: the first one is the implementation of the model SM2-EU-SILC starting from SM2; the second one is the integration of survey data and administrative data used in conjunction with microsimulation and the third one is the validation of the two previous steps and the construction of the final data set of individual and household gross income variables. The set-up of the ISTAT model (SM2-EU-SILC) starting from SM2 required a preliminary transition from the ECHP to the EU-SILC data. The introduction of the model to the new survey called for new procedures for the construction of auxiliary variables and the input file and implied the adjustment of some conversion routines of SM2(14).
The availability of administrative data used for the production of IT-SILC net income variables has consented to use both microsimulation and administrative archives in an innovative way. The starting point was the accessibility of data on withholding taxes and taxes paid for the surveyed individuals with non-zero income in the administrative tax data. Four registers related to employee income, self-employment income, old age benefits and unemployment benefits were used. In particular, the ‘730 tax returns’ and the ‘UNICO tax returns’ have provided data on net and gross incomes, taxes at national and regional level and also information on tax credits and income deductions. It should be noted that in any static microsimulation models the income deductions and tax credits based on consumption expenditure generally need to be estimated by the regression technique, based on external sources. But in the SM2-EU-SILC, income deductions and tax credits from tax returns are employed.
Through an exact matching of administrative and survey records, the tax data are integrated with survey microdata. Before using the integrated data set as input file of SM2-EU-SILC, a further procedure of coherence analysis and correction was applied in order to check the consistency and accuracy of the data. Specifically, a number of anomalies between withholding taxes, social security contributions and corresponding incomes were eliminated. The withholding taxes or taxes paid from administrative sources were not used when no income data were present, or when the values were inconsistent. After that, the administrative data are utilised with survey data as input file of the model and as benchmark for microsimulation results. Instead of applying the microsimulation model only for those individuals not present in tax data (i.e. individuals who were present at the time of interview but who were not included in the sample frame or individuals who report incomplete information on tax identification numbers), all the available information (survey and registers) have been used as in the model for estimating income taxes and social security contributions (only partially covered by administrative sources) for all the surveyed individuals. After that the SM2-EU-SILC outputs have been compared with the available administrative gross figures at the micro level in order to assess the quality of microsimulation estimates. Furthermore, the reciprocal comparison and validation of the two data sets (SM2-EU-SILC outputs and tax data) has been very useful for detecting irregularities in administrative data (i.e. self-employed contributions). After a validation with the National Accounts figures, the SM2-EU-SILC estimates are preferred. Hence, fiscal data and microsimulation estimates have been used for the production of the final data set of gross incomes variables. The final IT-SILC individual and household gross income variables therefore are computed as net amounts plus taxes and social insurance contributions provided by register data, if available, or estimated by SM2-EU-SILC(15). In more detail, the final data set of gross income target variables has been built up as follow:
(13) The model was developed under the Eurostat project ‘Development of Appropriate modelling or imputation to Construct the EU-SILC Target Income Variables for each EU Member States’. For a description of the model see: Betti et al, (2011) and Donatiello et al (2012).
(14) See Donatiello (2011).
(15) In order to anonymise the administrative data used, a stochastic component has been added to the withholding taxes and to the taxes paid from registers.
Improvements of data quality through the combined use of survey and administrative sources and micro simulation model 9
137 The use of registers in the context of EU-SILC: challenges and opportunities
• when the net administrative incomes are higher than the survey incomes, the net and gross amounts of incomes and the taxes derived from register data, whereas social insurance contributions are estimated by SM2-EU-SILC. The final IT-SILC gross variables do not differ from the tax gross variables;
• on the opposite, when the survey incomes are higher than the register data, the net incomes are those taken from the survey (collected or imputed), while the taxes derived from register data. As in the ‘a’ case, the social insurance contributions are estimated by SM2-EU-SILC. The final IT-SILC gross variables can be different from the tax gross variables.
Consequently the typical ‘adjustment factors’ used in any microsimulation model for correcting the disposable income and the gross income values in order to take into account the tax evasion are not applied. In effect IT-SILC disposable income partly includes income not reported to tax authorities while the taxes for the most part are those derived from the income tax returns and do not require any adjustments. However in comparing survey and registers data it is worth mentioning that when the surveyed incomes are higher than the register data, the difference between the surveyed data and the tax data could not be considered as a definite measure of illegal tax evasion. In effect it is not easy to distinguish between the legal tax avoidance, allowed by the national fiscal system, and the tax evasion. Nonetheless for the relevance of the phenomenon a feasibility study on the estimation of the tax evasion/avoidance on the basis of IT-SILC data is now in progress at ISTAT.
9.4 Comparison with external sources In this section, we present the comparison between IT-SILC target variables and some appropriate external sources. Data from National Accounts by ISTAT and data from Italian Tax Agency (Ministry of the Economy and Finance — MEF) and the Pensions Register by INPS (National Institute for Social Security) are used as external benchmarks. Table 9.11 shows the comparison of IT-SILC data with figures by National Accounts. IT-SILC estimates embrace all income components of target variables even those not included in HY010 at present (i.e. imputed rent, all fringe benefits, own consumption, pension from individual private plans, employers’ social insurance contributions). The agreement of IT-SILC results and National Accounts figures is very good and let the IT-SILC results satisfactory. Nonetheless some aspects have to be considered when comparing IT-SILC with National Accounts. NA estimates generally use all the administrative data sources which are integrated in IT-SILC and as well-known NA estimates are adjusted for accounting of the grey economy. However the grey economy is partially covered in IT-SILC given that some interviewees report incomes that are not enclosed in tax registers, including both tax avoidance/evasion and tax exempt. On the one hand the IT-SILC integration methodology applies the rule of the maximum between survey and administrative income level, consequently the mean income of IT-SILC usually is higher than the administrative one (which is employed in NA estimates). Moreover IT-SILC survey, as well as all income surveys, typically under-estimates financial capital incomes, which are subject to tax withholding at source at some flat rate, whereas IT-SILC estimation method of imputed rent produces higher value than NA aggregate. It is expected that the combined effect of the above mentioned features explains the closeness between the two data sources estimates. Finally, in Table 9.12 data on social expenditure and beneficiaries for three kinds of functions — old-age, survival and disability (according to ESSPROS classification) —are reported. The comparison with external sources shows that IT-SILC estimates are quite close to the administrative data. In effect the differences on social benefits amount (PY100N/G-PY110N/G-PY130N/G) displayed by the two sources are mainly due to the inclusion of an income component ‘severance pay’ in the IT-SILC survey (estimated at 3,612 millions of euro before tax) that is not allocated in NA.
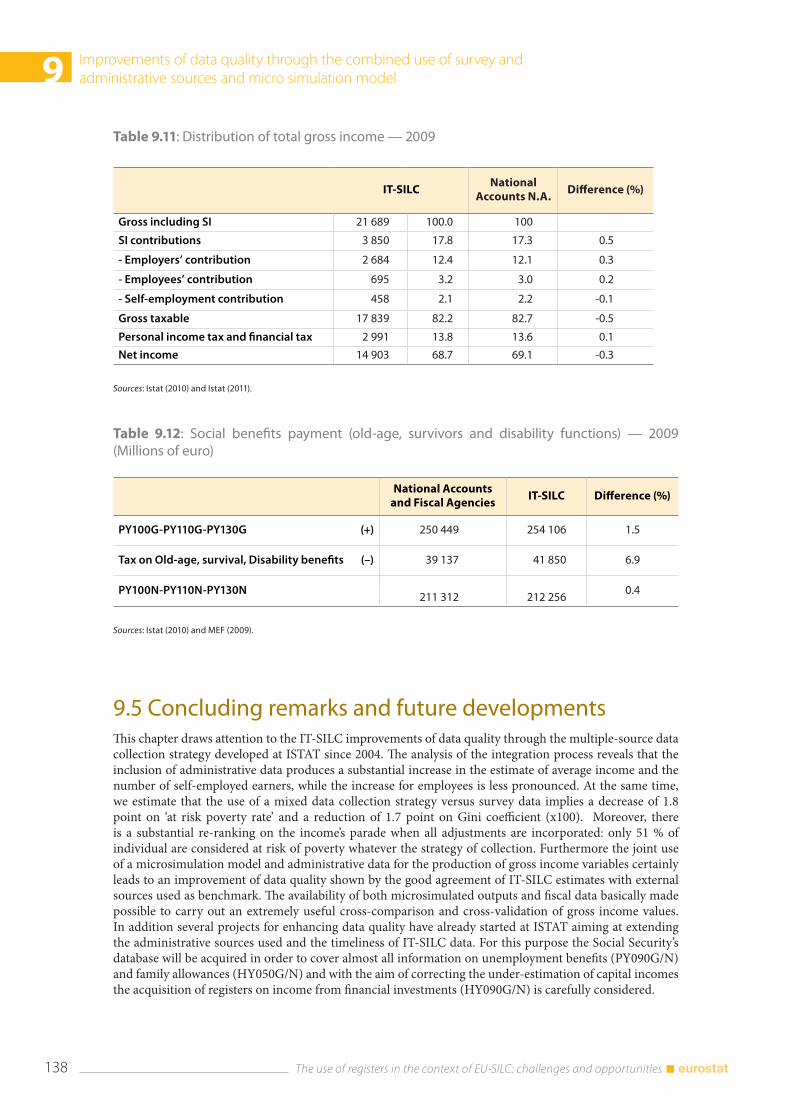
9 Improvements of data quality through the combined use of survey and administrative sources and micro simulation model
The use of registers in the context of EU-SILC: challenges and opportunities 138
Table 9.11: Distribution of total gross income — 2009
IT-SILCNational
Accounts N.A.Difference (%)
Gross including SI 21 689 100.0 100 SI contributions 3 850 17.8 17.3 0.5
- Employers’ contribution 2 684 12.4 12.1 0.3
- Employees’ contribution 695 3.2 3.0 0.2
- Self-employment contribution 458 2.1 2.2 -0.1
Gross taxable 17 839 82.2 82.7 -0.5
Personal income tax and financial tax 2 991 13.8 13.6 0.1
Net income 14 903 68.7 69.1 -0.3
Sources: Istat (2010) and Istat (2011).
Table 9.12: Social benefits payment (old-age, survivors and disability functions) — 2009 (Millions of euro)
National Accounts and Fiscal Agencies
IT-SILC Difference (%)
PY100G-PY110G-PY130G (+) 250 449 254 106 1.5
Tax on Old-age, survival, Disability benefits (–) 39 137 41 850 6.9
PY100N-PY110N-PY130N
211 312
212 256 0.4
Sources: Istat (2010) and MEF (2009).
9.5 Concluding remarks and future developmentsThis chapter draws attention to the IT-SILC improvements of data quality through the multiple-source data collection strategy developed at ISTAT since 2004. The analysis of the integration process reveals that the inclusion of administrative data produces a substantial increase in the estimate of average income and the number of self-employed earners, while the increase for employees is less pronounced. At the same time, we estimate that the use of a mixed data collection strategy versus survey data implies a decrease of 1.8 point on ‘at risk poverty rate’ and a reduction of 1.7 point on Gini coefficient (x100). Moreover, there is a substantial re-ranking on the income’s parade when all adjustments are incorporated: only 51 % of individual are considered at risk of poverty whatever the strategy of collection. Furthermore the joint use of a microsimulation model and administrative data for the production of gross income variables certainly leads to an improvement of data quality shown by the good agreement of IT-SILC estimates with external sources used as benchmark. The availability of both microsimulated outputs and fiscal data basically made possible to carry out an extremely useful cross-comparison and cross-validation of gross income values. In addition several projects for enhancing data quality have already started at ISTAT aiming at extending the administrative sources used and the timeliness of IT-SILC data. For this purpose the Social Security’s database will be acquired in order to cover almost all information on unemployment benefits (PY090G/N) and family allowances (HY050G/N) and with the aim of correcting the under-estimation of capital incomes the acquisition of registers on income from financial investments (HY090G/N) is carefully considered.
Improvements of data quality through the combined use of survey and administrative sources and micro simulation model 9
139 The use of registers in the context of EU-SILC: challenges and opportunities
9.6 ReferencesBetti, G. Donatiello, G. and Verma, V. (2011), ‘The Siena Microsimulation Model (SM2) For net-gross conversion of EU-SILC income variables’, The International Journal of Microsimulation, 4(1): 35-53, available at: http://www.microsimulation.org/ijm/issues/volume-41-spring-2011/.
Canberra Group (2001), ‘Final Report and Recommendations’, Ottawa.
Consolini, P., Di Marco, M., Ricci, R. and Vitaletti, S. (2006), ‘Administrative and Survey Microdata on Self-Employment: the Italian Experience with the EU-SILC project’, IARIW 29th General Conference, Joensuu, Finland, 20-26 August.
Consolini, P. (2008), ‘Experiences on the harmonization of the definitions, the variables and the units for the EU-SILC project in Italy’, Working package WP2 ‘Recommendations on the use of methodologies for the integration of surveys and administrative data, final report of ‘ESSnet Statistical Methodology Project on the Area: Integration of survey and administrative data’: 58-67, available at: http://cenex-isad.istat.it/archivio/Reports_of_the_project_workpackages/Report_of_WP2.pdf.
Consolini, P. (2009), ‘Integrazione dei dati campionari Eu-Silc con dati di fonte amministrativa’, Collana Istat Metodi e Norme vol. 39/2009, Rome, available at: http://www3.istat.it/dati/catalogo/20090318_00/.
Di Marco, M. (2006), ‘International Comparability of Microdata on Incomes: Lessons From the EU-SILC Project’, VIII International Meeting on Quantitative Methods for Applied Sciences, Certosa di Pontignano (Siena), 11-13 September.
Donatiello, G. (a cura di) (2011), ‘La metodologia di stima dei redditi lordi nell’indagine EU-SILC — Indagine europea sui redditi e le condizioni di vita delle famiglie’, Istat Metodi e Norme n. 49, available at: http://www3.istat.it/dati/catalogo/20110726_00/.
Donatiello, G., Betti, G., Consolini, P. (2012), ‘The Construction of Gross Income Variables of EU-SILC (Eu Statistics on Income and Living Conditions) in Italy: A Mixed Strategy Using Microsimulation and Administrative Data’, Università degli Studi di Siena, Quaderni del Dipartimento di Economia Politica e Statistica, n. 652 – Settembre, available at: http://econpapers.repec.org/paper/usiwpaper/652.htm.
Herzog, T.N., Scheuren, F.J., Winkler, W.E. (2007), Data quality and Record Linkage Techniques, New York: Springer ed.
ISTAT (2008), ‘Condizioni di vita (UDB IT-SILC)’, Rome, ISTAT, available at: http://www.istat.it/it/archivio/4152.
ISTAT (2010), ‘Condizioni di vita (UDB IT-SILC)’, Rome, ISTAT, available at: http://www.istat.it/it/archivio/4152
ISTAT (2011), ‘National Accounts Years 2007-2011’, Rome, ISTAT.
MEF, Ministero dell’Economia e delle Finanze (2009), ‘Dichiarazioni fiscali’, available at: http://www.finanze.gov.it/export/finanze/Per_conoscere_il_fisco/studi_statistiche/dichiarazioni.html.
Newcombe, H.B. (1988), ‘Handbook of Record Linkage: Methods for Health and Statistical Studies, Administration, and Business’, Oxford University Press, Oxford, UK.
van der Laan, P. (2000), ‘Integrating administrative registers and household surveys’, Netherlands Official Statistics vol.15, Summer.

The use of register data in the Austrian SILC survey 10
141 The use of registers in the context of EU-SILC: challenges and opportunities
10. The use of register data in the Austrian SILC survey
Richard Heuberger, Thomas Glaser and Elisabeth Kafka(1)
Abstract: This chapter deals with the use of register data for the calculation of income target variables in EU-SILC in Austria. The transition to using register data is a process that will be fully implemented with the data production of EU-SILC 2012. We give an overview of the steps already taken in this process and assess if the assumptions connected with the use of register data apply for EU-SILC in Austria. Use of register data reduces response burden, non-response and survey error, and data editing. The first part of the chapter deals describes the linking process and the legal situation in Austria. The chapter describes and evaluation undertaken for EU-SILC data for 2009 and 2010. The evaluation is exemplied on several target variables. The chapter also deals with the practical issues of the transition process from survey to register data taken in EU-SILC 2012. Lastly, the chapter summarises the Austrian experience with register data and the transition process, and discusses future plans.
10.1 IntroductionThis chapter deals with the use of register data for the calculation of income target variables in EU-SILC in Austria. The transition to using register data is a process that will be fully implemented with the data production of EU-SILC 2012. We give an overview of the steps already taken in this process and assess if the assumptions connected with the use of register data apply for EU-SILC in Austria.
Three reasons can be named for the decision to use register data to calculate the income target variables. The first reason is that the use of register data eases the burden for respondents of the survey (cf. Wallgren, A. and Wallgren, B. 2007). Income questions are sensitive and detailed by definition. Therefore, these questions on income may lead to a high unit- or item-nonresponse. Using register data, or rather omitting a majority of income questions in the survey, may increase the willingness to respond. In general, the use of register data simply reduces the number of questions in the questionnaire. The sensitivity of income questions, additionally, may also lead to a biased measurement of incomes: people tend to avoid extreme answers in income questions, particularly in retrospective questions. This leads to the second argument in favour of register data: register data are objective information and are not distorted by incorrect or imprecise answers given by the respondents (Rendtel et al. 2004, Lohmann 2011). It can be expected that register data are a more accurate basis for information on income and are not affected by retrieval errors (exact values, exact source of income, exact income reference periods, etc.). Register data give full information on what is officially recorded and therefore are also able to cover extreme values on the fringes of the income distribution. In short, register data may improve the data quality of income information in the survey. The third reason for the use of register data is that the editing for these data is less demanding so that the editing process is shorter and target variables are available sooner. The shorter data preparation process (and the ‘savings’ in the data collection process) may also help to reduce the costs of the survey.
There are at least two prerequisites for using register data in EU-SILC. Firstly that the framework of the survey allows for the use of register data for the filling of variables. EU-SILC is output harmonised, which means that the participating countries are required to deliver harmonised target variables instead of using a harmonised questionnaire. Therefore, register as well as survey variables can be used to calculate target
(1) Statistics Austria. This work has been supported by the second Network for the analysis of EU-SILC (Net-SILC2), funded by Eurostat. The European Commission bears no responsibility for the analyses and conclusions, which are solely those of the authors. Correspondence to [email protected].
10 The use of register data in the Austrian SILC survey
The use of registers in the context of EU-SILC: challenges and opportunities 142
variables. Secondly, the use of register data necessitates the legal and technical means to link different registers and survey data. Hence, the first part of the chapter deals with this linking process and the legal situation in Austria.
The second part of the chapter describes the evaluation that has been carried out for the data of EU-SILC 2009 and 2010. The first step for the data of EU-SILC 2009 consisted of filling the variables for employment income (PY010) and for old-age benefits (PY100) with register data. For the data of EU-SILC 2010 we assessed which other income target variables in EU-SILC could be filled from registers. In Austria not all income information is available in (centralised) registers. Hence, the first step of the evaluation was to clarify what kind of income information is available from registers. As a second step the coherence of register and survey data was evaluated. We exemplify this evaluation in the third part of the chapter on the target variable PY010, PY100 and PY090.
The fourth part of the chapter deals with the practical issues of the transition process from survey to register data taken in EU-SILC 2012. The transition process affects the fieldwork, the communication with respondents, the questionnaire and the data editing process — in short, any aspect of the data production process.
The last part of the chapter summarises our experience with register data and the transition process. Additionally, an outlook on the further data production process in the Austrian EU-SILC is presented.
10.2 The link between register and survey dataA suitable link between register and survey data is crucial for using registers instead of survey questions to collect information on income. A pilot survey undertaken before the start of EU-SILC in Austria in 2003 has shown that a linkage of survey and register data solely on the basis of personal information like name, address and birth date has disadvantages over a reliable personal identification number (PIN) for the link with Austrian registers. Not until the introduction of an individual, encrypted identifier in the course of the implementation of the Austrian e-government strategy in 2004 for the secure communication of person-related data between administrative authorities, enabled a practicable, secure and pseudonymised identifier for individuals in official register data. This identifier is a sector specific personal identifier, the so-called ‘bPK’ (bereichsspezifisches Personenkennzeichen)(2) (cf. Hackl 2009).
This PIN, i.e. the bPK, then can be used as a cryptographically secure way to link survey and register data since it is available for (almost) every person in Austria, for all registers and also in the sampling frame of EU-SILC, the central residence register ZMR (Zentrales Melderegister). The PIN is an alphanumeric key with 28 characters from which it is impossible to infer any individual characteristics that could identify a person. The use of the PIN for EU-SILC is defined by a national regulation (ELStV — Einkommens- und Lebensbedingungen-Statistikverordnung)(3).
In principal, the PIN is known for all persons in the sampling frame and it is therefore available for all persons registered at addresses in the gross sample. However, not all persons in the net sample could be assigned a PIN on the basis of the gross sample. According to the sampling design of the first wave of EU-SILC in Austria addresses are drawn from the ZMR and hence the PIN is known for all persons registered at addresses which were selected in the gross sample. The questionnaire of EU-SILC collects data about all household members at a selected address at the time of the interview. So persons who are not registered at a selected household may become part of the net sample if a selected household takes part in the questionnaire of the survey. For these persons the PINs can be obtained from the Ministry of the Interior. This procedure is also defined by the national ELStV regulation.
Not for all persons in the net sample of EU-SILC a PIN can be assigned. The search for PINs of persons who were not registered at a selected address is typically impeded by misspelled names or incorrect birth dates. Although Statistics Austria can correct some errors in personal data, for some people no PIN can be obtained
(2) Cf. http://www.stammzahlenregister.gv.at/site/5970/default.aspx (retrieved October 18, 2012).
(3) Cf. http://www.statistik.at/web_de/static/eu-silc_nationale_statistik-verordnung_elstv_055277.pdf (retrieved October 18, 2012).
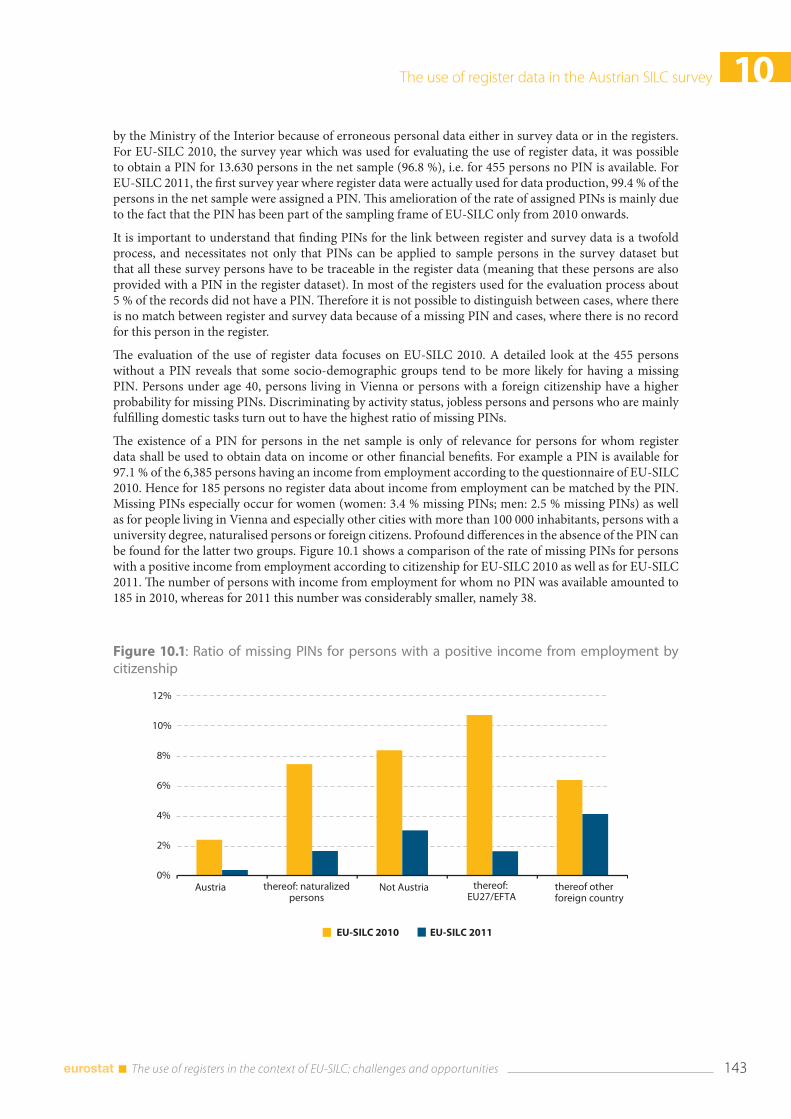
The use of register data in the Austrian SILC survey 10
143 The use of registers in the context of EU-SILC: challenges and opportunities
by the Ministry of the Interior because of erroneous personal data either in survey data or in the registers. For EU-SILC 2010, the survey year which was used for evaluating the use of register data, it was possible to obtain a PIN for 13.630 persons in the net sample (96.8 %), i.e. for 455 persons no PIN is available. For EU-SILC 2011, the first survey year where register data were actually used for data production, 99.4 % of the persons in the net sample were assigned a PIN. This amelioration of the rate of assigned PINs is mainly due to the fact that the PIN has been part of the sampling frame of EU-SILC only from 2010 onwards.
It is important to understand that finding PINs for the link between register and survey data is a twofold process, and necessitates not only that PINs can be applied to sample persons in the survey dataset but that all these survey persons have to be traceable in the register data (meaning that these persons are also provided with a PIN in the register dataset). In most of the registers used for the evaluation process about 5 % of the records did not have a PIN. Therefore it is not possible to distinguish between cases, where there is no match between register and survey data because of a missing PIN and cases, where there is no record for this person in the register.
The evaluation of the use of register data focuses on EU-SILC 2010. A detailed look at the 455 persons without a PIN reveals that some socio-demographic groups tend to be more likely for having a missing PIN. Persons under age 40, persons living in Vienna or persons with a foreign citizenship have a higher probability for missing PINs. Discriminating by activity status, jobless persons and persons who are mainly fulfilling domestic tasks turn out to have the highest ratio of missing PINs.
The existence of a PIN for persons in the net sample is only of relevance for persons for whom register data shall be used to obtain data on income or other financial benefits. For example a PIN is available for 97.1 % of the 6,385 persons having an income from employment according to the questionnaire of EU-SILC 2010. Hence for 185 persons no register data about income from employment can be matched by the PIN. Missing PINs especially occur for women (women: 3.4 % missing PINs; men: 2.5 % missing PINs) as well as for people living in Vienna and especially other cities with more than 100 000 inhabitants, persons with a university degree, naturalised persons or foreign citizens. Profound differences in the absence of the PIN can be found for the latter two groups. Figure 10.1 shows a comparison of the rate of missing PINs for persons with a positive income from employment according to citizenship for EU-SILC 2010 as well as for EU-SILC 2011. The number of persons with income from employment for whom no PIN was available amounted to 185 in 2010, whereas for 2011 this number was considerably smaller, namely 38.
Figure 10.1: Ratio of missing PINs for persons with a positive income from employment by citizenship
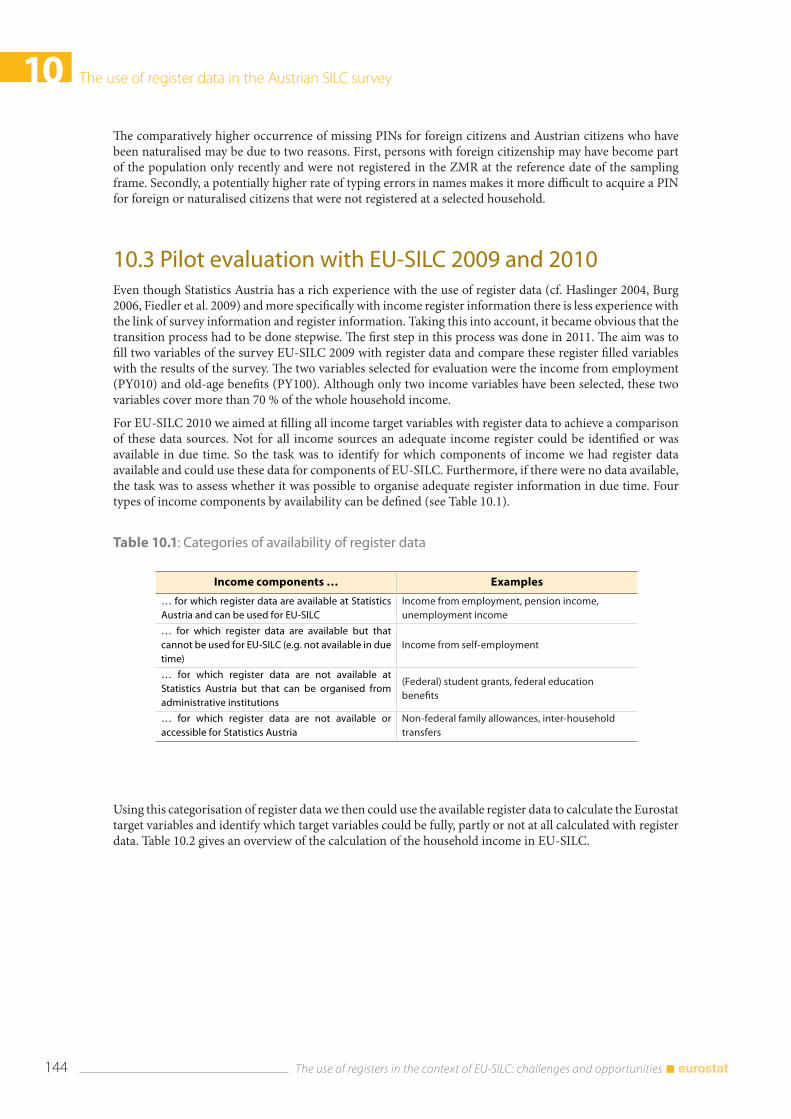
10 The use of register data in the Austrian SILC survey
The use of registers in the context of EU-SILC: challenges and opportunities 144
The comparatively higher occurrence of missing PINs for foreign citizens and Austrian citizens who have been naturalised may be due to two reasons. First, persons with foreign citizenship may have become part of the population only recently and were not registered in the ZMR at the reference date of the sampling frame. Secondly, a potentially higher rate of typing errors in names makes it more difficult to acquire a PIN for foreign or naturalised citizens that were not registered at a selected household.
10.3 Pilot evaluation with EU-SILC 2009 and 2010Even though Statistics Austria has a rich experience with the use of register data (cf. Haslinger 2004, Burg 2006, Fiedler et al. 2009) and more specifically with income register information there is less experience with the link of survey information and register information. Taking this into account, it became obvious that the transition process had to be done stepwise. The first step in this process was done in 2011. The aim was to fill two variables of the survey EU-SILC 2009 with register data and compare these register filled variables with the results of the survey. The two variables selected for evaluation were the income from employment (PY010) and old-age benefits (PY100). Although only two income variables have been selected, these two variables cover more than 70 % of the whole household income.
For EU-SILC 2010 we aimed at filling all income target variables with register data to achieve a comparison of these data sources. Not for all income sources an adequate income register could be identified or was available in due time. So the task was to identify for which components of income we had register data available and could use these data for components of EU-SILC. Furthermore, if there were no data available, the task was to assess whether it was possible to organise adequate register information in due time. Four types of income components by availability can be defined (see Table 10.1).
Table 10.1: Categories of availability of register data
Income components … Examples
… for which register data are available at Statistics Austria and can be used for EU-SILC
Income from employment, pension income, unemployment income
… for which register data are available but that cannot be used for EU-SILC (e.g. not available in due time)
Income from self-employment
… for which register data are not available at Statistics Austria but that can be organised from administrative institutions
(Federal) student grants, federal education benefits
… for which register data are not available or accessible for Statistics Austria
Non-federal family allowances, inter-household transfers
Using this categorisation of register data we then could use the available register data to calculate the Eurostat target variables and identify which target variables could be fully, partly or not at all calculated with register data. Table 10.2 gives an overview of the calculation of the household income in EU-SILC.
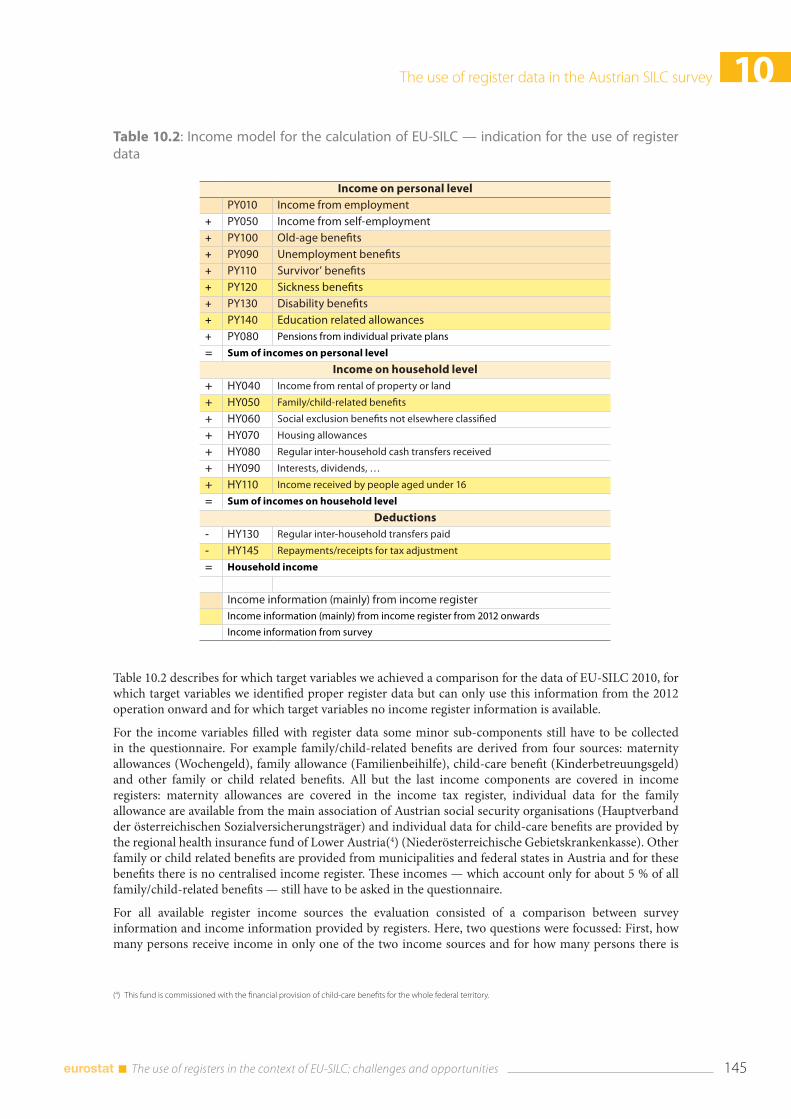
The use of register data in the Austrian SILC survey 10
145 The use of registers in the context of EU-SILC: challenges and opportunities
Table 10.2: Income model for the calculation of EU-SILC — indication for the use of register data
Income on personal level PY010 Income from employment+ PY050 Income from self-employment+ PY100 Old-age benefits+ PY090 Unemployment benefits+ PY110 Survivor’ benefits+ PY120 Sickness benefits+ PY130 Disability benefits+ PY140 Education related allowances+ PY080 Pensions from individual private plans
= Sum of incomes on personal level
Income on household level+ HY040 Income from rental of property or land
+ HY050 Family/child-related benefits
+ HY060 Social exclusion benefits not elsewhere classified
+ HY070 Housing allowances
+ HY080 Regular inter-household cash transfers received
+ HY090 Interests, dividends, …
+ HY110 Income received by people aged under 16
= Sum of incomes on household level
Deductions- HY130 Regular inter-household transfers paid
- HY145 Repayments/receipts for tax adjustment
= Household income
Income information (mainly) from income register Income information (mainly) from income register from 2012 onwards
Income information from survey
Table 10.2 describes for which target variables we achieved a comparison for the data of EU-SILC 2010, for which target variables we identified proper register data but can only use this information from the 2012 operation onward and for which target variables no income register information is available.
For the income variables filled with register data some minor sub-components still have to be collected in the questionnaire. For example family/child-related benefits are derived from four sources: maternity allowances (Wochengeld), family allowance (Familienbeihilfe), child-care benefit (Kinderbetreuungsgeld) and other family or child related benefits. All but the last income components are covered in income registers: maternity allowances are covered in the income tax register, individual data for the family allowance are available from the main association of Austrian social security organisations (Hauptverband der österreichischen Sozialversicherungsträger) and individual data for child-care benefits are provided by the regional health insurance fund of Lower Austria(4) (Niederösterreichische Gebietskrankenkasse). Other family or child related benefits are provided from municipalities and federal states in Austria and for these benefits there is no centralised income register. These incomes — which account only for about 5 % of all family/child-related benefits — still have to be asked in the questionnaire.
For all available register income sources the evaluation consisted of a comparison between survey information and income information provided by registers. Here, two questions were focussed: First, how many persons receive income in only one of the two income sources and for how many persons there is
(4) This fund is commissioned with the financial provision of child-care benefits for the whole federal territory.
10 The use of register data in the Austrian SILC survey
The use of registers in the context of EU-SILC: challenges and opportunities 146
income information in both sources? Second, what is the distribution of the income recorded in income registers compared to the distribution of the income in the survey? Third, to what extent are incomes from both data sources different on individual level? This allowed evaluating advantages and restrictions caused by the use of income information from registers. The following section will present a comparison of three types of personal income as examples of the evaluation done for the income target variables of EU-SILC 2010.
10.4 Results of the pilotThe aim of the 2010 evaluation pilot was to find adequate register data sources, merge them with the EU-SILC 2010 sample and calculate the income target variables based on the register data. In this section the use of register data for collecting three different income target variables is presented: income from employment (PY010), old-age benefits (PY100) and unemployment benefits (PY090). Since income from employment is the largest component, the main focus will be on PY010.
10.4.1 Income from employment (PY010) in EU-SILC 2010
In EU-SILC, the income reference period is the year preceding the year of the survey. The recorded income is the annual income of that period. Data about income from employment are captured in the form of gross and net income. The most important components of PY010 are the monthly income, private use of a company car, extra payments during the year, income from overtime and severance payments. Income from compulsory military and civil service is also part of PY010(5). By definition, the variable PY010 cannot capture income from employment from persons aged younger than 16, because it is only defined for persons aged 16 or older. Income from persons younger than 16 is part of the household variable HY110.
The most reliable source of register data on income from employment is the wage tax register. For the evaluation of these register data as a data source for EU-SILC, wage tax data of the year 2009 were used in order to fit the income reference period of EU-SILC 2010. This register provides different components of income from employment which are part of the pay slip and are needed for the wage tax. However, one person may have more than one job and therefore more than one pay slip. For the case of multiple jobs, data from pay slips were aggregated on personal level resulting in an adjusted register dataset where each row represents one person. In contrast to the EU-SILC questionnaire, there is no explicit variable for the net income from employment in the wage tax data. Therefore, the net income according to the EU-SILC income concept in PY010N(6) had to be calculated by subtracting specific components of the pay slip from the gross income. All the relevant income components included in the wage tax register were matched on personal level to the persons in the net sample of EU-SILC 2010 by using the PIN as an identification key.
In order to evaluate the use of registers as data source containing income from employment for the EU-SILC survey in Austria, a comparison of the availability of income values from income registers or the EU-SILC survey was carried out. The basis for comparisons are persons aged 16 or more in the net sample of EU-SILC 2010 for whom register data are available because of an existing link via PIN. Income from compulsory military or civil service in PY010 is not included in the comparison as this component is not included in the wage tax register by definition. Table 10.3 compares income from employment (‘EInc’) in EU-SILC and in the wage tax register (‘REG’) for this group.
(5) Since these incomes are not covered in other variables, there is an arrangement with Eurostat that income from this source should be recorded in PY010.
(6) Some components of income from employment are captured differently in EU SILC as compared to the wage tax.
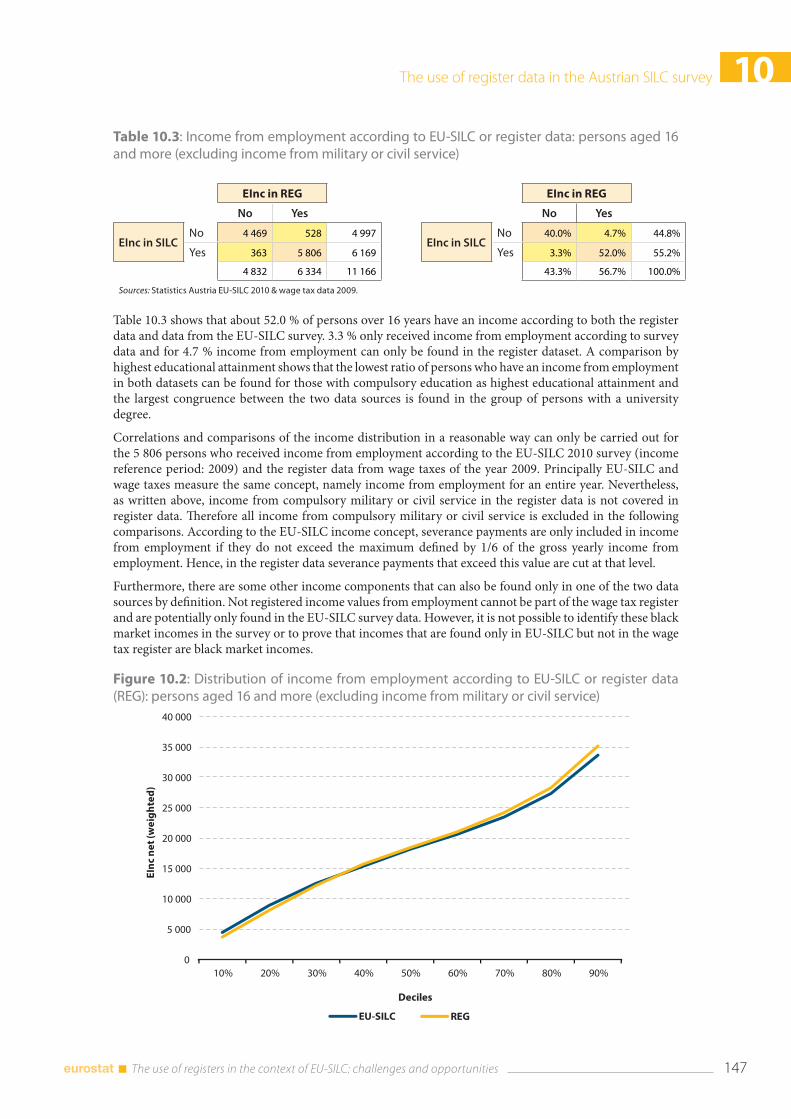
The use of register data in the Austrian SILC survey 10
147 The use of registers in the context of EU-SILC: challenges and opportunities
Table 10.3: Income from employment according to EU-SILC or register data: persons aged 16 and more (excluding income from military or civil service)
EInc in REG EInc in REG
No Yes No Yes
EInc in SILCNo 4 469 528 4 997
EInc in SILCNo 40.0% 4.7% 44.8%
Yes 363 5 806 6 169 Yes 3.3% 52.0% 55.2%
4 832 6 334 11 166 43.3% 56.7% 100.0%
Sources: Statistics Austria EU-SILC 2010 & wage tax data 2009.
Table 10.3 shows that about 52.0 % of persons over 16 years have an income according to both the register data and data from the EU-SILC survey. 3.3 % only received income from employment according to survey data and for 4.7 % income from employment can only be found in the register dataset. A comparison by highest educational attainment shows that the lowest ratio of persons who have an income from employment in both datasets can be found for those with compulsory education as highest educational attainment and the largest congruence between the two data sources is found in the group of persons with a university degree.
Correlations and comparisons of the income distribution in a reasonable way can only be carried out for the 5 806 persons who received income from employment according to the EU-SILC 2010 survey (income reference period: 2009) and the register data from wage taxes of the year 2009. Principally EU-SILC and wage taxes measure the same concept, namely income from employment for an entire year. Nevertheless, as written above, income from compulsory military or civil service in the register data is not covered in register data. Therefore all income from compulsory military or civil service is excluded in the following comparisons. According to the EU-SILC income concept, severance payments are only included in income from employment if they do not exceed the maximum defined by 1/6 of the gross yearly income from employment. Hence, in the register data severance payments that exceed this value are cut at that level.
Furthermore, there are some other income components that can also be found only in one of the two data sources by definition. Not registered income values from employment cannot be part of the wage tax register and are potentially only found in the EU-SILC survey data. However, it is not possible to identify these black market incomes in the survey or to prove that incomes that are found only in EU-SILC but not in the wage tax register are black market incomes.
Figure 10.2: Distribution of income from employment according to EU-SILC or register data (REG): persons aged 16 and more (excluding income from military or civil service)
10 The use of register data in the Austrian SILC survey
The use of registers in the context of EU-SILC: challenges and opportunities 148
On the other hand, employment relationships that only exist in pretence may turn up only in the wage tax register data, but again they cannot be clearly identified. A comparison of the deciles of the distribution of income from employment shows that income measurement based on survey and register data delivers similar results.
Especially the lower and the intermediate deciles in both income distributions shown in Figure 10.2 are very similar. Up to the seventh decile the absolute difference between annual income from employment according to EU-SILC and the wage tax register is considerably smaller than 1,000 Euro. The higher deciles show a tendency of an increasing difference between register and EU-SILC data. The sum of income from employment from register data is about 3.3 % higher compared to income from employment according to EU-SILC. These deviations between the two income sources could have various reasons. In the lower deciles, income from employment based on EU-SILC is slightly higher compared to register data. This could lie in the fact that persons with low income may report an income that is higher than the true value in order to present themselves in a socially more desirable way. On the other hand, persons with an income from employment situated in the higher deciles might forget about some extra payments or bonuses when asked in the survey.
A better understanding of the discrepancies between the income distributions based on EU-SILC or the wage tax register can be achieved by comparing income levels on individual level. Pearson’s coefficient of correlation for the two income variables (EU-SILC and wage tax register) amounts to 0.80, showing a linear correlation that is rather low if one keeps in mind that both income variables should measure the same concept. The correlation between income from employment based on EU-SILC and on wage tax register might also be distorted by some extreme values. Restricting the comparison to the 5 751 persons with income values lower than 80 000 Euro eliminates the effects caused by some high outliers on the correlation delivers a correlation coefficient of 0.87.
On individual level large discrepancies can be found for those persons who received more than one pay slip in 2009 according to the wage tax register. These discrepancies were highest for incomes lower than 20 000 Euro. Other groups of persons where differences are rather profound are persons who were not employed for a whole year, those who received more than two different kinds of non-cash employee income (according to EU-SILC) and persons where the net income was missing in the EU-SILC questionnaire and had to be deduced from gross income or had to be imputed.
Overall, the evaluation of the use of the wage tax register for collecting data about income from employment in order to fill the Eurostat variable PY010 showed that this register can very well be used instead of the questionnaire. However, some forms of income from employment are not explicitly included in the register and have to be deduced or estimated. The net income value can be calculated easily, because all the relevant information about taxes and payments to social security insurances are part of the register data. Non-cash employee income in the form of the private use of a company car has to be estimated. These estimations are based on data that are available in the wage tax register and from additional survey questions. For example, the EU-SILC 2012 questionnaire included a question about the kind of non-cash employee income received during the income reference period.
10.4.2 Income from old-age benefits (PY100) in EU-SILC 2010
In EU-SILC old-age benefits are recorded in the target variable PY100. In Austria, men are entitled by law to receive old-age benefits from the age of 65 onwards and women from the age of 60 onwards. In some situations, which are also recorded in PY100, it is possible to receive old-age benefits from the state before the official retirement age. Besides these pensions due to early retirement, also pensions from company pension plans or pensions based on a sufficiently long period of paying into the old-age insurance can be a reason for receiving a pension before the official retirement age. Special forms of pensions, like accident benefits or care allowances are also included in PY100 if a person receiving such a payment is above the official retirement age.
The main source of register data for old-age benefits is the wage tax register. It contains all incomes from pensions which are subjected to wage taxation, but a distinction of different types of pensions is not possible. This differentiation is facilitated by the yearly pension dataset (PJ-dataset) of the pension insurance. Also data from the main association of Austrian social security organisations (Hauptverband der österreichischen
The use of register data in the Austrian SILC survey 10
149 The use of registers in the context of EU-SILC: challenges and opportunities
Sozialversicherungsträger) make a distinction of different types of pensions possible. Another register data source is the accident benefit dataset. It contains information from accident insurances, i.e. accident benefits as well as a part of the survivor’s benefits which can be found in this dataset.
The EU-SILC survey of 2010 contains 2.790 persons, who are above the official retirement age. For 97.9 % of these persons a PIN could be retrieved. Altogether 3.013 persons surveyed in EU-SILC 2010 received some form of old-age benefits and for 98 % a PIN for matching with register data could be found. This means that for people receiving old-age benefits the matching between register and survey data using the PIN is slightly better than for income from employment. The number of persons receiving old-age benefits according to register data is a bit higher (about 3 %). However, in EU-SILC 2010 the number of persons above the official retirement age receiving a benefit is higher than in the register data. This means that the wage tax register contains more people below the official retirement age receiving old-age benefits than are recorded in the EU-SILC questionnaire.
A comparison of the distributions of the gross values of old-age benefits from register data and EU-SILC 2010 show that the mean income is about 11 % higher according to the questionnaire. Especially below the third decile income values from register data are lower. Also a comparison of the net values show on average lower values in the register data (about 5 % lower) than those recorded in EU-SILC 2010. On the other hand, if only those persons who have income values in both EU-SILC and register data are put side by side, then the sum of the income values is higher in the register data.
One has to bear in mind that it is possible that not all kinds of old-age benefits can be covered with register data: pensions from non-Austrian pension insurances or some forms of company pensions may not be adequately recorded in register data.
10.4.3 Income from unemployment benefits (PY090) in EU-SILC 2010
Unemployment benefits in EU-SILC contain all assistances that are aimed at compensating for the loss of income due to having no job anymore. In EU-SILC the classification of unemployment benefits follows the ESSPROS (European System of Integrated Social Protection Statistics) categorisation. Unemployment benefits are collected in the target variable PY090. The main data source of unemployment benefits from registers is the transfer data set from the Public Employment Service Austria (Arbeitsmarktservice AMS).
According to the EU-SILC 2010 questionnaire 876 persons (aged 16 years or older) received unemployment benefits. The transfer dataset matched to the EU-SILC data 2010 provided 1.201 persons (aged 16 or older) who received some sort of unemployment benefit. Apparently, register data contain more unemployment benefits than the EU-SILC questionnaire. The main reason for this discrepancy may be short unemployment periods which may be forgotten or not mentioned. On the other hand, the sum of the payments is on average higher in EU-SILC. The reason for this lies again in short periods of unemployment which are recorded more precisely in register data. This higher number of small payments leads to a lower average of unemployment benefits from register data.
A comparison of the distributions of unemployment benefits in EU-SILC 2010 and transfer data 2009 show that overall volume is about 10 % higher in the register data. The deciles of the distribution of unemployment benefits in register data are systematically slower than in EU-SILC. The largest discrepancies can be observed in the two highest deciles. However, if the comparison is narrowed to the 780 persons having received unemployment benefits according to EU-SILC and register data, the data are much more similar (with a Pearson’s coefficient of correlation amounting to 0.77). Unemployment benefits according to EU-SILC are on average slightly higher. Therefore it can be concluded the collection of the amount of unemployment benefits is quite similar in EU-SILC and in register data, disregarding the small amounts of short unemployment periods. This means that the use of register data adds additional information about unemployment benefits which could hardly be recorded in the EU-SILC survey.
10 The use of register data in the Austrian SILC survey
The use of registers in the context of EU-SILC: challenges and opportunities 150
10.5 Practical issues: register data in EU-SILC 2012The evaluation process for the use of register data confirmed that it would be reasonable to use register data for most of the income information from EU-SILC 2012 onwards. Although the process of data production has not been finished it is safe to argue that the implementation of the use of register data has changed the data production process in almost every step. The use of register data requires an adaptation of the questionnaire, adaptations in the communication with respondents and interviewers and an adaptation of the data editing process. Furthermore, when the data production process is finished, the implementation of register data will also affect the comparability to other statistics at Statistics Austria.
The survey instrument of EU-SILC 2012 was adapted based on the evaluation of register data. Firstly, the adaptation process included the deletion of questions on income components that will be filled with register information. Secondly, the questionnaire was reorganised to achieve a new logical and practical structure, e.g. by changing question order and reformulating texts between questions. Thirdly, the new questions were formulated for income sources that are not covered in register data and were covered previously in the category ‘other income’.
An example for the latter case are family related benefits granted by provinces, municipalities and other institutions: up until 2011 these family related benefits were part of a residual category of family related benefits but have to be named explicitly in the questionnaire in 2012 when the main components of income are not asked anymore. We will evaluate whether the effort of the collection is worth the added income information. Most of all, it has to be checked if income components on national level were erroneously collected in these additional variables to prevent double counting of income components.
Communicating the use of register data and particularly the linking of register data with survey data is a sensitive topic in the communication with respondents which was also taken into account for the redesign of the questionnaire. Since EU-SILC is a panel survey and about three fourths of the sample are already aware of the question programme of EU-SILC, a change in the questions and particularly the omission of the majority of income questions are likely to be noticed. Due to an extensive module in 2012 on housing, the household questionnaire was not particularly shorter. In the communication strategy to the respondents in advance letters and other information material the fact that the survey data were linked with register data was not highlighted, but the national regulation was introduced to indicate a change in the EU-SILC operation. The main idea was to inform the respondents without invoking any fears about data protection. Additionally, the interviewers were informed about the legal basis, the link of register and survey data and about the procedures to anonymise the datasets. This information should enable the interviewers to ensure respondents that their data are protected and that there is no link to other administrative institutions like fiscal authorities.
The use of register data in EU-SILC also brought us to reformulate and sharpen the strategy towards data security and privacy. The strategy addresses three topics: the management of personal data for the longitudinal component with limited access, the identification and anonymisation of datasets and single records, and the linking of datasets. Additionally, the use of register data will lead to a revision of the anonymisation process for data that are distributed to users and Eurostat, e.g. regarding the treatment of extreme values.
10.6 First answers and open questionsThe introduction of register data in the data production procedure of EU-SILC is still an on-going process in Austria. We have aimed at evaluating the effects of register data on the income information in EU-SILC, we have developed an approximate framework for the use of register data and we have developed guidelines for the treatment of the micro data with register information. But still some work has to be done.
First, the evaluation process is still not finished. Although we have managed to calculate the most important income target variables (PY010, PY090, PY100, etc.) using register data, some variables are still missing, mainly because the necessary register information was not available in due time. The main aim here would be to use all available income information from registers and calculate all income target variables, so that we could finally compare two household incomes: one using survey information and one using (mainly) register
The use of register data in the Austrian SILC survey 10
151 The use of registers in the context of EU-SILC: challenges and opportunities
information. The comparison then could inform us about the effect on indicators that can be expected with the EU-SILC 2012 operation and on analytical implications of the use of register information. Additionally, it would enable us to test the framework for the data production when using register information.
From the evaluation process, we learned that register data are able to cover the fringes of the income distribution and that register data cover possibly more people having an income than the survey. This would suggest that the income coverage by using register data is more complete. But completeness does not imply unbiasedness, the conceptual logic of register data differs partly from the conceptual logic of the target income variables: For example in the wage tax register, there is no information on informal, unregistered employment income and no information about persons working in other countries (but living in Austria)(7).
The development of a new data production framework is necessary to implement the register information in the data production process. Up until now the data production process is a semi-automated process programmed in SPSS. Therefore a significant part of the syntax has to be revised, and it has to be considered to introduce SAS programs in the data production process itself to cope with larger datasets (up until now SAS is only used for sampling, weighting and calculation of indicators in EU-SILC in Austria). Additionally, the revision of the data production structure is necessary since the imputation strategy, imputation procedures and quality management processes will change with the use of register data.
After finishing the production of the data for EU-SILC 2012 we will have to deal with the break in time series of Austrian EU-SILC data. Regardless of the resulting outcomes, this break has to be understood on micro (individual) and macro (aggregate) level. The break means that data from EU-SILC 2012 are not fully comparable with former years which will affect all comparisons, time series and longitudinal analyses. To acknowledge for this break is inevitable to fully understand differences between household incomes calculated with survey and with register data. This also requires a clear communication strategy towards the users of EU-SILC, be it the users of the results of the survey or the users of the micro data.
From the availability of register data also additional opportunities arise. More information on non-respondents will be available from registers which could then be integrated in the sample management during fieldwork or post-survey nonresponse adjustments. The reduced burden due to the shortened questionnaire could increase the share of CATI interviews in the follow-up interviews. More profound changes of the survey design so far have not been discussed yet, e.g. using CATI alongside CAPI mode in first wave interviews(8) or switching to a selected respondent model.
10.7 Conclusions Coming back to the three reasons for using register data in EU-SILC, so far it turned out that we are able to reduce the burden for respondents by abandoning a great deal of presumably troublesome and difficult income questions. Additionally, the evaluation has shown that for almost all income questions the quality of the data will improve to a certain extent. Register data improve the measurement of income, but only to an extent that is defined by the conceptual definitions of the registers used. But, as we are still in the process of introducing register data in EU-SILC in Austria, for the time being we refrain from stating that the data production process will be shortened to a noteworthy extent.
(7) These persons are taxable in Austria (income tax), but are not registered in the wage tax register. Unfortunately, the income tax register does not provide proper information and is not timely available.
(8) CAPI mode is not likely to be replaced completely as telephone numbers can only be provided for a section of the gross sample from public telephone registers.
10 The use of register data in the Austrian SILC survey
The use of registers in the context of EU-SILC: challenges and opportunities 152
10.8 ReferencesBurg, T. (2006), ‘The use of Central Population Register data for filling in the Austrian House and Dwelling Register’, paper presented at the European Conference on Quality in Survey Statistics, 24-26 April, Cardiff, UK.
Fiedler, R., Schwerer, E., Berka, C., Moser, M. and Humer, S. (2009), ‘Quality Assessment for register-based Statistics in Austria’, paper presented at the European Conference on Quality in Official Statistics, 4-6 May, Helsinki, FI.
Hackl, P. (2009), ‘Using Administrative Data at Statistics Austria: Legal Provisions’, paper presented at the 95th DGINS Conference, 1st October, Malta, MT.
Haslinger, A. (2004), ‘Data Matching for the Maintenance of the Business Register of Statistics Austria’, Austrian Journal of Statistics, 33 (1&2): 55-67.
Henning, L. (2011), ‘Comparability of EU-SILC survey and register data: The relationship among employment, earnings and poverty’, Journal of European Social Policy, 21 (1): 37-54.
Inglic, R. (2007), ‘Administrative data and registers in EU-SILC’, paper presented at the Seminar on Registers in Statistics — methodology and quality, 21-23 May, Helsinki, FI.
Rendtel, U. and Nordberg, L. and Jäntti, M. and Hanisch, M. and Basic, E. (2004), ‘Report on quality of income data’, Chintex Working Paper 21.
Statistics Austria (2011), Intermediate Quality Report relating to the EU-SILC 2011 operation, Technical Report.
Törmälehto, V.-M. (2008), ‘Social statistics — integrated use of survey and administrative data at Statistics Finland’, paper presented at the International Association for Official Statistics conference on Reshaping Official Statistics, 14-16 October, Shanghai, CN.
Wallgren, A. and Wallgren, B. (2007), Register-based Statistics. Administrative Data for Statistical Purposes, Chichester, Wiley.
Reconciliation of income data from survey and from administrative sources 11
153 The use of registers in the context of EU-SILC: challenges and opportunities
11. Reconciliation of income data from survey and from administrative sources
José María Méndez Martín(1)
Abstract: The Encuesta de Condiciones de Vida (Spanish SILC Survey) is an annual survey carried out by the National Statistics Institute (INE-Spain). The primary aim of this survey is the systematic production of statistics on household income and living conditions. Access to administrative records offers a good opportunity to improve the quality of income data and allows the use of a more efficient collection method. This chapter offers a comparative overview of different income components by linking the survey data with available data from the Spanish Tax Agency or the Social Security system. The potential impact of using administrative files on the basic indicators is also analysed. The comparative analysis has implications for the planned methodology of production based on the use of administrative data combined with survey data. The strategy is to use a mixed methodology taking mainly income data from the registers and also from questionnaires when the register information is insufficient. As a result, respondent burden will be substantially reduced.
11.1 IntroductionThe Encuesta de Condiciones de Vida (Spanish SILC survey) is an annual survey compiled by the National Statistics Institute (INE-Spain). The primary aim of this survey is the systematic production of statistics on household income and living conditions. The survey, which is harmonised at the European level through a Community Regulation, allows us to find out the level and composition of poverty and social exclusion.
A difficult task in household surveys is the collection of income data through personal interview. This type of variable usually has a high rate of partial non-response, so imputation is needed to calculate total disposable household income. Besides, in EU-SILC, both gross and net income must be recorded and very frequently the respondent cannot give gross amounts. This means gross amounts must be obtained using net-gross conversion models.
Access to administrative registers would give us the opportunity to improve the quality of income data and reduce respondent burden. The link between the individuals in the sample and the data available at the Tax Agency or the Secretary of State for Social Security, at the microdata level, would provide detailed information on the majority of income components. Moreover, in this survey the legal issue is clear. The availability of a European Regulation makes possible the access to the microdata and it is possible to use administrative data without the respondent consent. Thanks to this access, some comparative analysis has been done and the methodology for the future use of administrative data is being developed.
There are several methodological issues that need to be addressed when accessing this type of data. One of the most important is the availability of a common variable of personal identification. The personal identification in Spain is the ‘NIF’ (Tax Identification Number), which is used in most administrative procedures. To obtain the NIF in the survey, data collection has been adapted since 2009 to make use of the municipal register of inhabitants, indicating the people registered in the household (with their associated details, full name, date of birth, personal identification, etc.). Before the interview, the data of the Municipal Register (selected dwellings) is loaded in the CAPI program. During the interview, the interviewer matches the household members to the individuals living in the dwelling according to the Municipal Register. Some basic demographic information is checked. If the match is not possible during the interview, manual procedures are applied afterwards. Ultimately, this identification is collected in approximately 98 % of all adults in the sample.
(1) José María Méndez Martín is from the National Statistics Institute (INE-Spain). This work has been supported by the second Network for the analysis of EU-SILC (Net-SILC2), funded by Eurostat. The European Commission bears no responsibility for the analyses and conclusions, which are solely those of the author. Email address for correspondence: [email protected].
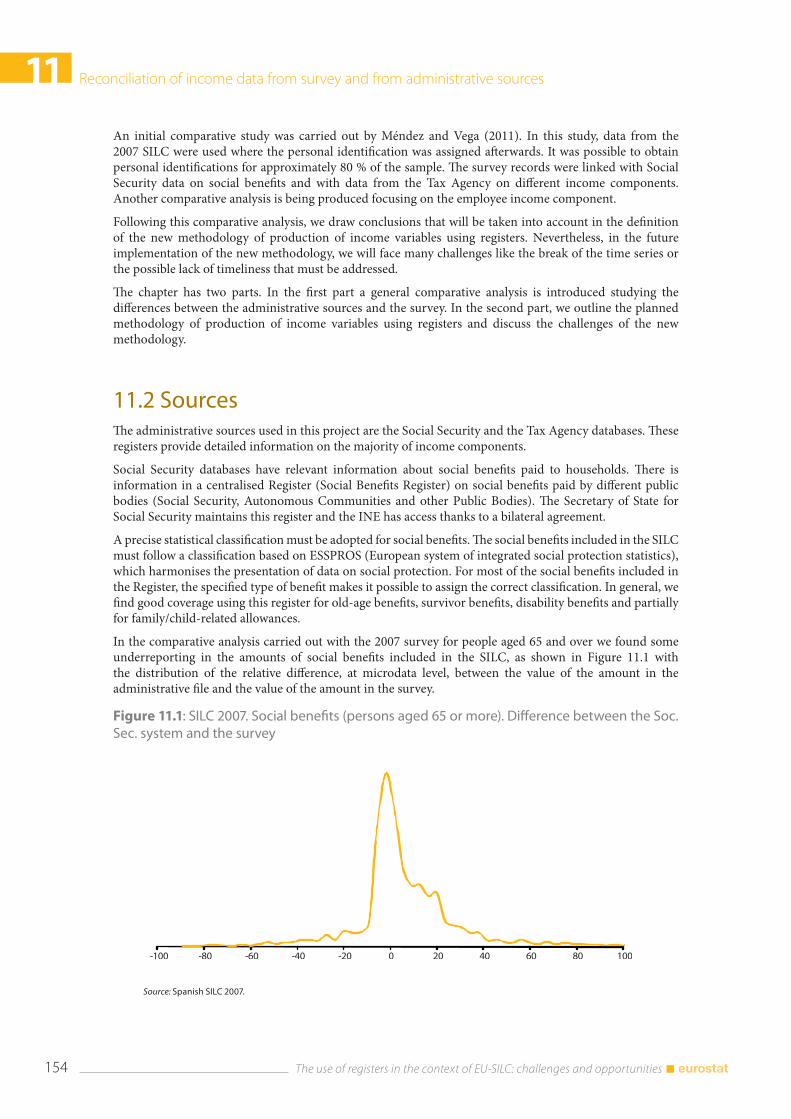
11 Reconciliation of income data from survey and from administrative sources
The use of registers in the context of EU-SILC: challenges and opportunities 154
An initial comparative study was carried out by Méndez and Vega (2011). In this study, data from the 2007 SILC were used where the personal identification was assigned afterwards. It was possible to obtain personal identifications for approximately 80 % of the sample. The survey records were linked with Social Security data on social benefits and with data from the Tax Agency on different income components. Another comparative analysis is being produced focusing on the employee income component.
Following this comparative analysis, we draw conclusions that will be taken into account in the definition of the new methodology of production of income variables using registers. Nevertheless, in the future implementation of the new methodology, we will face many challenges like the break of the time series or the possible lack of timeliness that must be addressed.
The chapter has two parts. In the first part a general comparative analysis is introduced studying the differences between the administrative sources and the survey. In the second part, we outline the planned methodology of production of income variables using registers and discuss the challenges of the new methodology.
11.2 Sources The administrative sources used in this project are the Social Security and the Tax Agency databases. These registers provide detailed information on the majority of income components.
Social Security databases have relevant information about social benefits paid to households. There is information in a centralised Register (Social Benefits Register) on social benefits paid by different public bodies (Social Security, Autonomous Communities and other Public Bodies). The Secretary of State for Social Security maintains this register and the INE has access thanks to a bilateral agreement.
A precise statistical classification must be adopted for social benefits. The social benefits included in the SILC must follow a classification based on ESSPROS (European system of integrated social protection statistics), which harmonises the presentation of data on social protection. For most of the social benefits included in the Register, the specified type of benefit makes it possible to assign the correct classification. In general, we find good coverage using this register for old-age benefits, survivor benefits, disability benefits and partially for family/child-related allowances.
In the comparative analysis carried out with the 2007 survey for people aged 65 and over we found some underreporting in the amounts of social benefits included in the SILC, as shown in Figure 11.1 with the distribution of the relative difference, at microdata level, between the value of the amount in the administrative file and the value of the amount in the survey.
Figure 11.1: SILC 2007. Social benefits (persons aged 65 or more). Difference between the Soc. Sec. system and the survey
Source: Spanish SILC 2007.
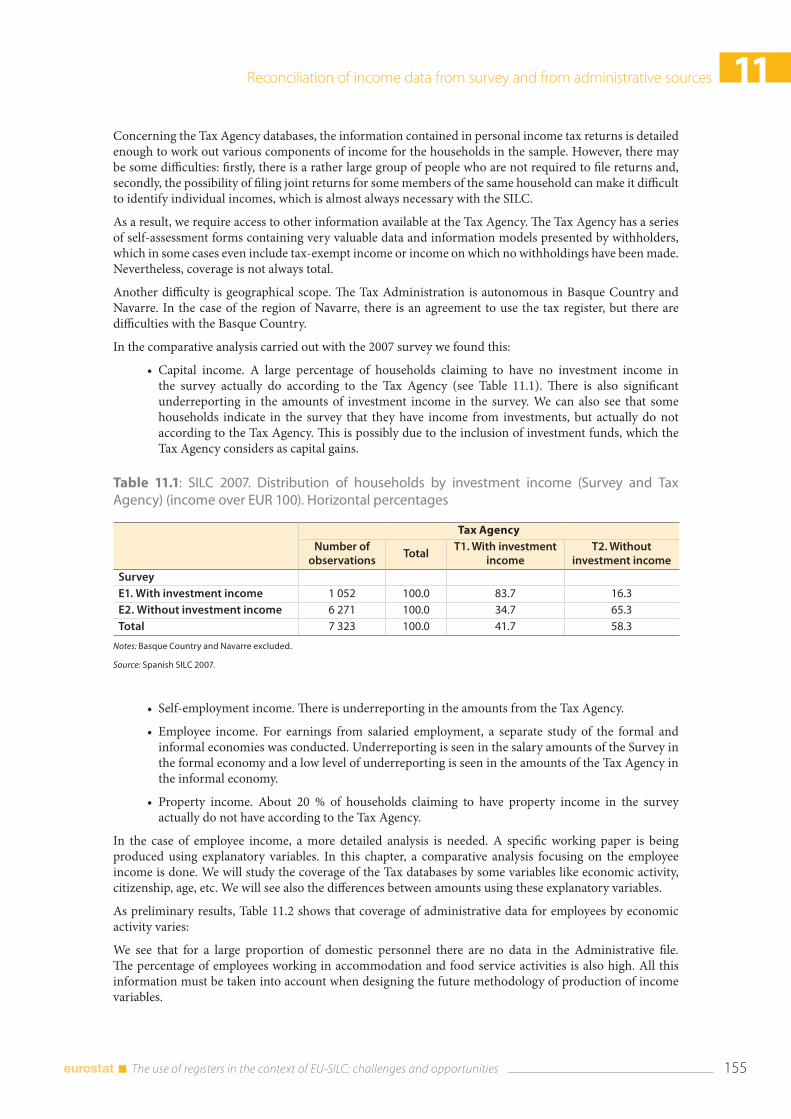
Reconciliation of income data from survey and from administrative sources 11
155 The use of registers in the context of EU-SILC: challenges and opportunities
Concerning the Tax Agency databases, the information contained in personal income tax returns is detailed enough to work out various components of income for the households in the sample. However, there may be some difficulties: firstly, there is a rather large group of people who are not required to file returns and, secondly, the possibility of filing joint returns for some members of the same household can make it difficult to identify individual incomes, which is almost always necessary with the SILC.
As a result, we require access to other information available at the Tax Agency. The Tax Agency has a series of self-assessment forms containing very valuable data and information models presented by withholders, which in some cases even include tax-exempt income or income on which no withholdings have been made. Nevertheless, coverage is not always total.
Another difficulty is geographical scope. The Tax Administration is autonomous in Basque Country and Navarre. In the case of the region of Navarre, there is an agreement to use the tax register, but there are difficulties with the Basque Country.
In the comparative analysis carried out with the 2007 survey we found this:
• Capital income. A large percentage of households claiming to have no investment income in the survey actually do according to the Tax Agency (see Table 11.1). There is also significant underreporting in the amounts of investment income in the survey. We can also see that some households indicate in the survey that they have income from investments, but actually do not according to the Tax Agency. This is possibly due to the inclusion of investment funds, which the Tax Agency considers as capital gains.
Table 11.1: SILC 2007. Distribution of households by investment income (Survey and Tax Agency) (income over EUR 100). Horizontal percentages
Tax AgencyNumber of
observationsTotal
T1. With investment income
T2. Without investment income
SurveyE1. With investment income 1 052 100.0 83.7 16.3E2. Without investment income 6 271 100.0 34.7 65.3Total 7 323 100.0 41.7 58.3
Notes: Basque Country and Navarre excluded.
Source: Spanish SILC 2007.
• Self-employment income. There is underreporting in the amounts from the Tax Agency.
• Employee income. For earnings from salaried employment, a separate study of the formal and informal economies was conducted. Underreporting is seen in the salary amounts of the Survey in the formal economy and a low level of underreporting is seen in the amounts of the Tax Agency in the informal economy.
• Property income. About 20 % of households claiming to have property income in the survey actually do not have according to the Tax Agency.
In the case of employee income, a more detailed analysis is needed. A specific working paper is being produced using explanatory variables. In this chapter, a comparative analysis focusing on the employee income is done. We will study the coverage of the Tax databases by some variables like economic activity, citizenship, age, etc. We will see also the differences between amounts using these explanatory variables.
As preliminary results, Table 11.2 shows that coverage of administrative data for employees by economic activity varies:
We see that for a large proportion of domestic personnel there are no data in the Administrative file. The percentage of employees working in accommodation and food service activities is also high. All this information must be taken into account when designing the future methodology of production of income variables.
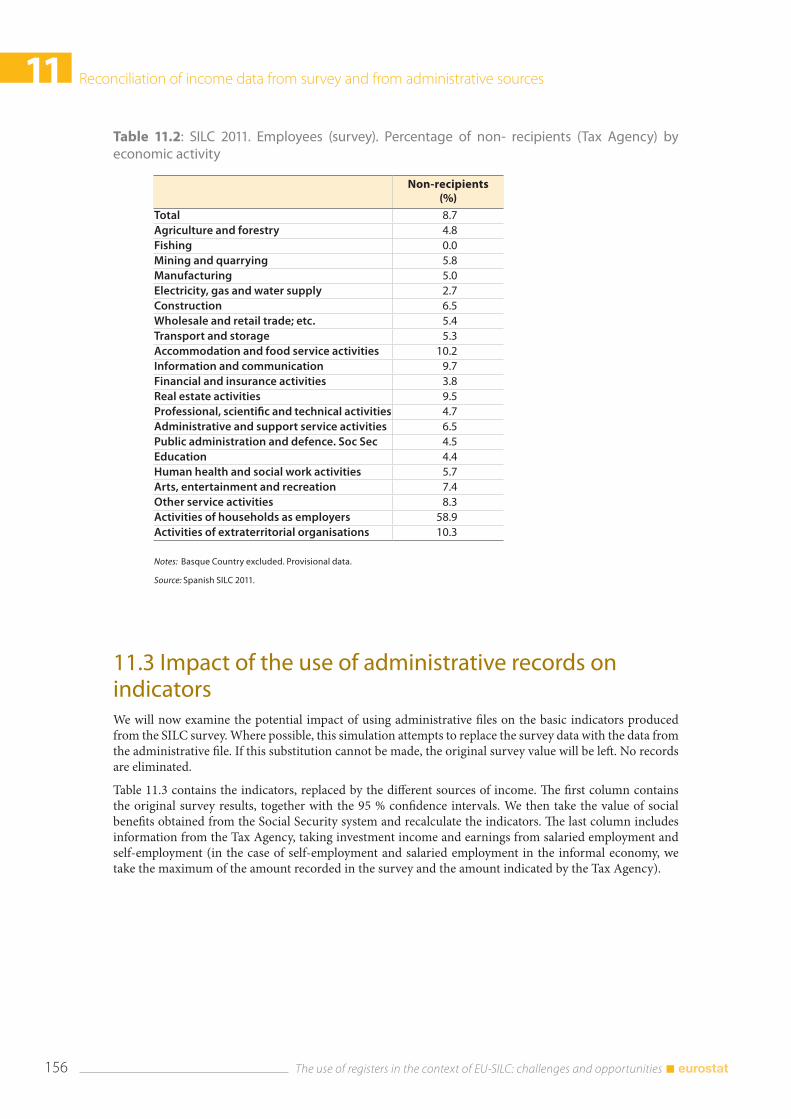
11 Reconciliation of income data from survey and from administrative sources
The use of registers in the context of EU-SILC: challenges and opportunities 156
Table 11.2: SILC 2011. Employees (survey). Percentage of non- recipients (Tax Agency) by economic activity
Non-recipients(%)
Total 8.7Agriculture and forestry 4.8Fishing 0.0Mining and quarrying 5.8Manufacturing 5.0Electricity, gas and water supply 2.7Construction 6.5Wholesale and retail trade; etc. 5.4Transport and storage 5.3Accommodation and food service activities 10.2Information and communication 9.7Financial and insurance activities 3.8Real estate activities 9.5Professional, scientific and technical activities 4.7Administrative and support service activities 6.5Public administration and defence. Soc Sec 4.5Education 4.4Human health and social work activities 5.7Arts, entertainment and recreation 7.4Other service activities 8.3Activities of households as employers 58.9Activities of extraterritorial organisations 10.3
Notes: Basque Country excluded. Provisional data.
Source: Spanish SILC 2011.
11.3 Impact of the use of administrative records on indicatorsWe will now examine the potential impact of using administrative files on the basic indicators produced from the SILC survey. Where possible, this simulation attempts to replace the survey data with the data from the administrative file. If this substitution cannot be made, the original survey value will be left. No records are eliminated.
Table 11.3 contains the indicators, replaced by the different sources of income. The first column contains the original survey results, together with the 95 % confidence intervals. We then take the value of social benefits obtained from the Social Security system and recalculate the indicators. The last column includes information from the Tax Agency, taking investment income and earnings from salaried employment and self-employment (in the case of self-employment and salaried employment in the informal economy, we take the maximum of the amount recorded in the survey and the amount indicated by the Tax Agency).
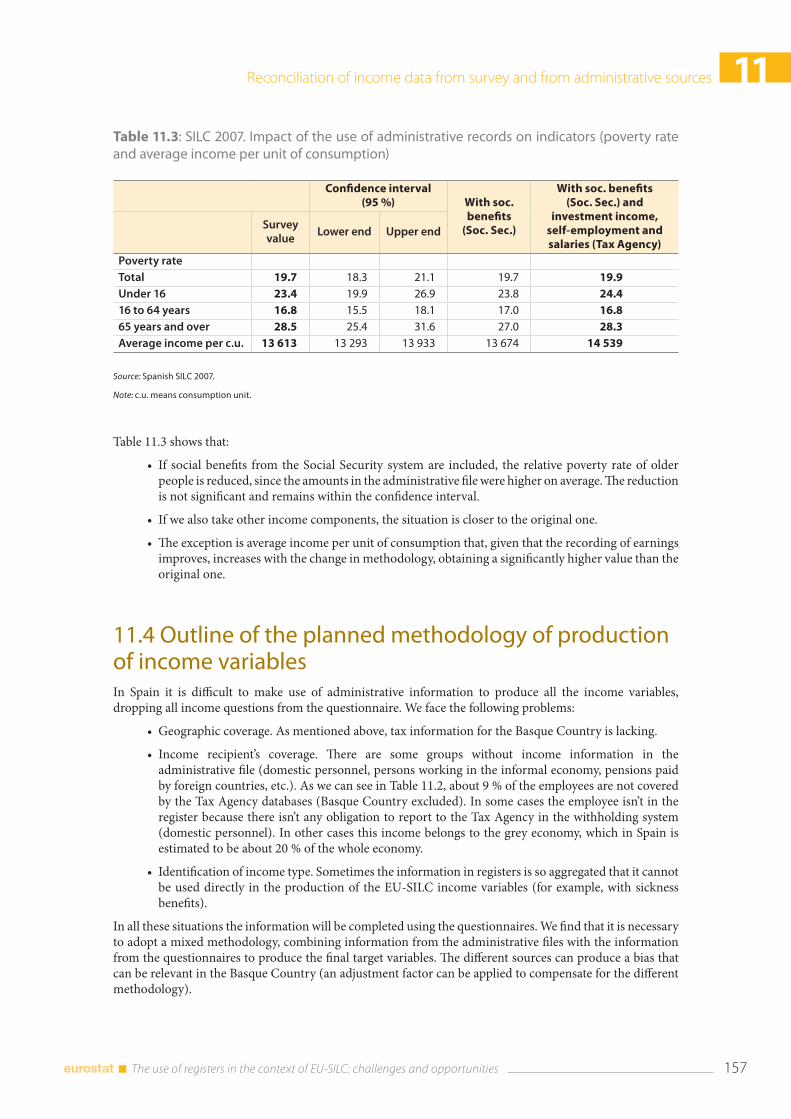
Reconciliation of income data from survey and from administrative sources 11
157 The use of registers in the context of EU-SILC: challenges and opportunities
Table 11.3: SILC 2007. Impact of the use of administrative records on indicators (poverty rate and average income per unit of consumption)
Confidence interval (95 %) With soc.
benefits(Soc. Sec.)
With soc. benefits(Soc. Sec.) and
investment income,self-employment and salaries (Tax Agency)
Survey value
Lower end Upper end
Poverty rateTotal 19.7 18.3 21.1 19.7 19.9Under 16 23.4 19.9 26.9 23.8 24.416 to 64 years 16.8 15.5 18.1 17.0 16.865 years and over 28.5 25.4 31.6 27.0 28.3Average income per c.u. 13 613 13 293 13 933 13 674 14 539
Source: Spanish SILC 2007.
Note: c.u. means consumption unit.
Table 11.3 shows that:
• If social benefits from the Social Security system are included, the relative poverty rate of older people is reduced, since the amounts in the administrative file were higher on average. The reduction is not significant and remains within the confidence interval.
• If we also take other income components, the situation is closer to the original one.
• The exception is average income per unit of consumption that, given that the recording of earnings improves, increases with the change in methodology, obtaining a significantly higher value than the original one.
11.4 Outline of the planned methodology of production of income variablesIn Spain it is difficult to make use of administrative information to produce all the income variables, dropping all income questions from the questionnaire. We face the following problems:
• Geographic coverage. As mentioned above, tax information for the Basque Country is lacking.
• Income recipient’s coverage. There are some groups without income information in the administrative file (domestic personnel, persons working in the informal economy, pensions paid by foreign countries, etc.). As we can see in Table 11.2, about 9 % of the employees are not covered by the Tax Agency databases (Basque Country excluded). In some cases the employee isn’t in the register because there isn’t any obligation to report to the Tax Agency in the withholding system (domestic personnel). In other cases this income belongs to the grey economy, which in Spain is estimated to be about 20 % of the whole economy.
• Identification of income type. Sometimes the information in registers is so aggregated that it cannot be used directly in the production of the EU-SILC income variables (for example, with sickness benefits).
In all these situations the information will be completed using the questionnaires. We find that it is necessary to adopt a mixed methodology, combining information from the administrative files with the information from the questionnaires to produce the final target variables. The different sources can produce a bias that can be relevant in the Basque Country (an adjustment factor can be applied to compensate for the different methodology).
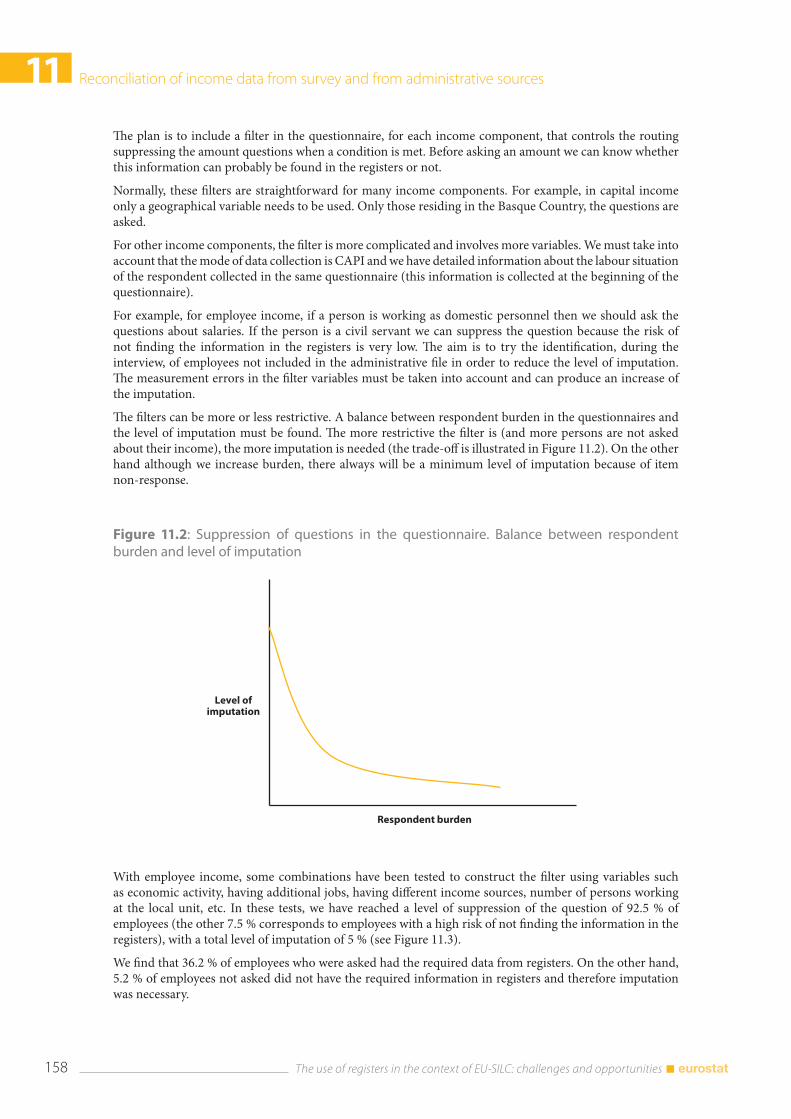
11 Reconciliation of income data from survey and from administrative sources
The use of registers in the context of EU-SILC: challenges and opportunities 158
The plan is to include a filter in the questionnaire, for each income component, that controls the routing suppressing the amount questions when a condition is met. Before asking an amount we can know whether this information can probably be found in the registers or not.
Normally, these filters are straightforward for many income components. For example, in capital income only a geographical variable needs to be used. Only those residing in the Basque Country, the questions are asked.
For other income components, the filter is more complicated and involves more variables. We must take into account that the mode of data collection is CAPI and we have detailed information about the labour situation of the respondent collected in the same questionnaire (this information is collected at the beginning of the questionnaire).
For example, for employee income, if a person is working as domestic personnel then we should ask the questions about salaries. If the person is a civil servant we can suppress the question because the risk of not finding the information in the registers is very low. The aim is to try the identification, during the interview, of employees not included in the administrative file in order to reduce the level of imputation. The measurement errors in the filter variables must be taken into account and can produce an increase of the imputation.
The filters can be more or less restrictive. A balance between respondent burden in the questionnaires and the level of imputation must be found. The more restrictive the filter is (and more persons are not asked about their income), the more imputation is needed (the trade-off is illustrated in Figure 11.2). On the other hand although we increase burden, there always will be a minimum level of imputation because of item non-response.
Figure 11.2: Suppression of questions in the questionnaire. Balance between respondent burden and level of imputation
With employee income, some combinations have been tested to construct the filter using variables such as economic activity, having additional jobs, having different income sources, number of persons working at the local unit, etc. In these tests, we have reached a level of suppression of the question of 92.5 % of employees (the other 7.5 % corresponds to employees with a high risk of not finding the information in the registers), with a total level of imputation of 5 % (see Figure 11.3).
We find that 36.2 % of employees who were asked had the required data from registers. On the other hand, 5.2 % of employees not asked did not have the required information in registers and therefore imputation was necessary.
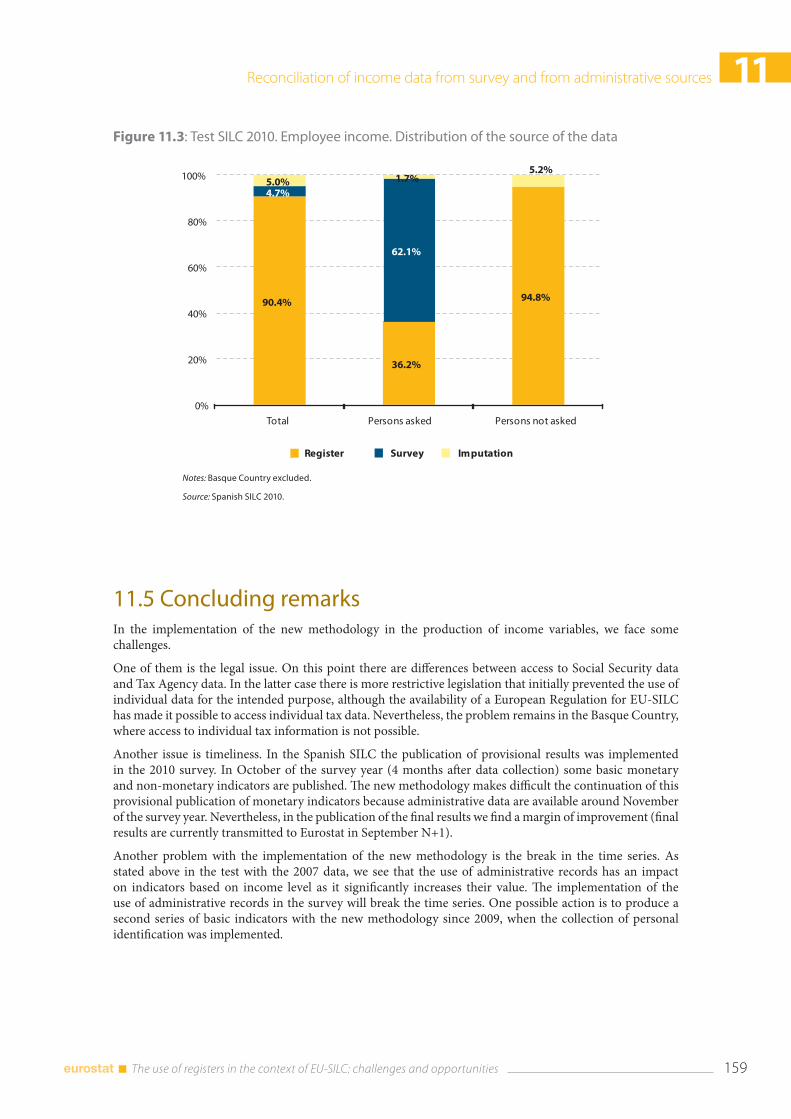
Reconciliation of income data from survey and from administrative sources 11
159 The use of registers in the context of EU-SILC: challenges and opportunities
Figure 11.3: Test SILC 2010. Employee income. Distribution of the source of the data
Notes: Basque Country excluded.
Source: Spanish SILC 2010.
11.5 Concluding remarks In the implementation of the new methodology in the production of income variables, we face some challenges.
One of them is the legal issue. On this point there are differences between access to Social Security data and Tax Agency data. In the latter case there is more restrictive legislation that initially prevented the use of individual data for the intended purpose, although the availability of a European Regulation for EU-SILC has made it possible to access individual tax data. Nevertheless, the problem remains in the Basque Country, where access to individual tax information is not possible.
Another issue is timeliness. In the Spanish SILC the publication of provisional results was implemented in the 2010 survey. In October of the survey year (4 months after data collection) some basic monetary and non-monetary indicators are published. The new methodology makes difficult the continuation of this provisional publication of monetary indicators because administrative data are available around November of the survey year. Nevertheless, in the publication of the final results we find a margin of improvement (final results are currently transmitted to Eurostat in September N+1).
Another problem with the implementation of the new methodology is the break in the time series. As stated above in the test with the 2007 data, we see that the use of administrative records has an impact on indicators based on income level as it significantly increases their value. The implementation of the use of administrative records in the survey will break the time series. One possible action is to produce a second series of basic indicators with the new methodology since 2009, when the collection of personal identification was implemented.
11 Reconciliation of income data from survey and from administrative sources
The use of registers in the context of EU-SILC: challenges and opportunities 160
11.6 ConclusionsIn this chapter, we present an outline of the opportunities of using administrative files in the production of the Spanish SILC survey. Some comparative analysis has already been carried out linking data from the survey and data from the Spanish Tax Agency and the Social Security system.
A summary of the planned methodology of production is presented. The strategy is to use a mixed methodology taking mainly income data from the registers and also from questionnaires when the register information is insufficient. As a result, respondent burden will be substantially reduced, although in some specific cases income questions will not be suppressed.
11.7 ReferencesMéndez, J.M. and Vega, P. (2011), ‘Linking data from administrative records and the Living Conditions Survey’, INE Working Papers, 01/2011.
Instituto Nacional de Estadística (2005). ) ‘Living Conditions Survey. Methodology’. www.ine.es.

Challenges and quality assessments
IV

Data linking the Family Resources Survey with social security benefits 12
163 The use of registers in the context of EU-SILC: challenges and opportunities
12. Data linking the Family Resources Survey with social security benefits
Simon Lunn and Stephen McKay (1)
Abstract: The chapter looks at approaches for using survey data that has been linked with social security benefits data. It introduces the range of social security benefits, how the administrative data are warehoused along with some background information on the Family Resources Survey. A high level overview of the fuzzy matching approach for linking the data is presented. The chapter shows the extent to which bias exists for respondents who agree for their records to be linked, and the level of mis-measurement in the amount of benefit reported. It concludes with a discussion and evaluation of approaches for using linked data based on various treatments of respondents dependent on whether or not they consented to link. Each approach does better than the existing approach that relies only on survey responses, although there may be a trade-off between the complexity of approach, the resources required, and the additional information gained.
12.1 IntroductionThe Family Resources Survey (FRS) is a cross-sectional household survey of the United Kingdom which collects detailed information on household income and general household characteristics. The FRS has consistent data available since 1994/95.
Under reporting of certain benefits is a known issue for the FRS. To address this, a consent question was added in April 2008 to enable linking data with administrative data.
This chapter provides a summary of analysis conducted to date using linked FRS data and draws largely from Stephen McKay’s paper Evaluating Approaches to FRS Data Linking: http://research.dwp.gov.uk/asd/asd5/WP110.pdf.
12.2 The UK benefits systemThe UK benefits system is a complex combination of means-tested, universal and contributory benefits. The original inspiration for William Beveridge’s social security system was contribution-based but over time this has increasingly become means-tested for working age benefits. A new ‘Universal Credit’ introduced from October 2013 will be means tested. In 2011/12, about £202 billion was spent on social security benefits and Tax Credits in Great Britain (GB).
Expenditure on social security is the largest single function of government spending and in 2011/12 amounted to approximately £3 291 (or around €3,878) for every man, woman and child in the country in real terms. It represents around 30 per cent of total government expenditure or about 13 per cent of GDP. More than half of the 60 million people in the UK receive income from at least one social security benefit (see Figure 12.1). More than half of all welfare spending goes to pensioners through the State Pension and other benefits.
(1) Simon Lunn is from the UK Department for Work and Pensions (DWP) and Stephen McKay is a Professor at the University of Lincoln, School of Social and Political Sciences. This work has been supported by the second Network for the analysis of EU-SILC (Net-SILC2), funded by Eurostat. The European Commission bears no responsibility for the analyses and conclusions, which are solely those of the authors. Email address for correspondence: [email protected].
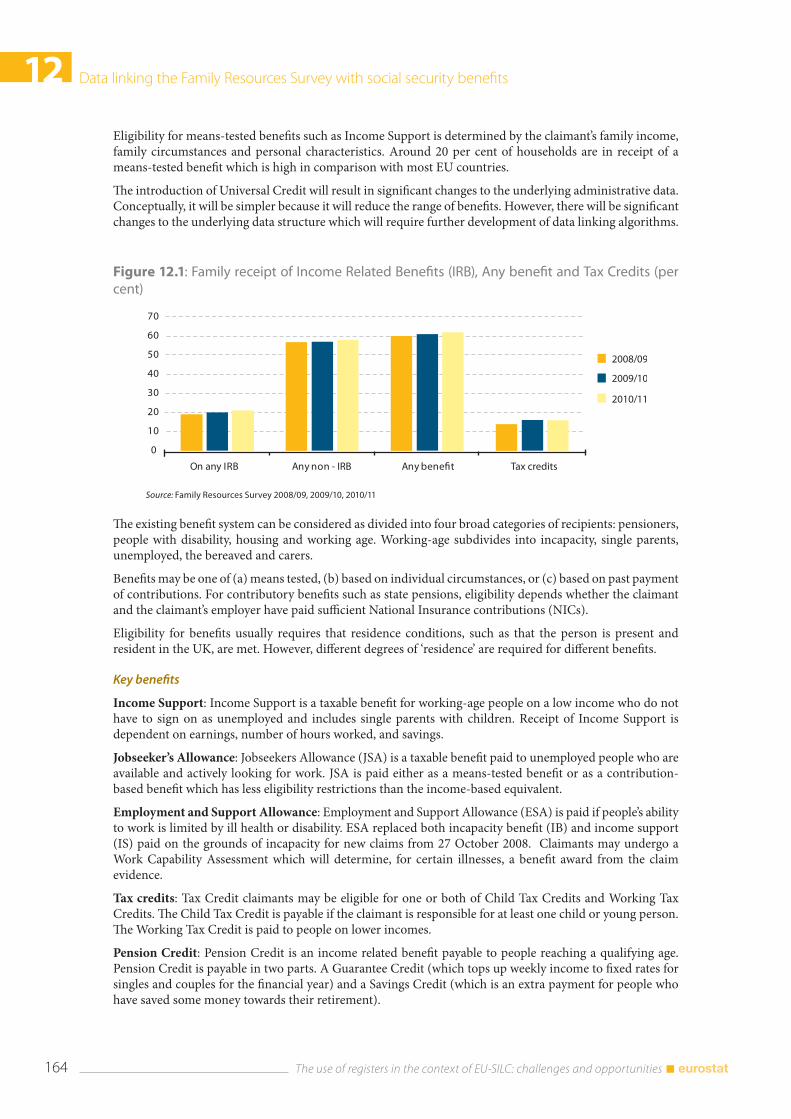
12 Data linking the Family Resources Survey with social security benefits
The use of registers in the context of EU-SILC: challenges and opportunities 164
Eligibility for means-tested benefits such as Income Support is determined by the claimant’s family income, family circumstances and personal characteristics. Around 20 per cent of households are in receipt of a means-tested benefit which is high in comparison with most EU countries.
The introduction of Universal Credit will result in significant changes to the underlying administrative data. Conceptually, it will be simpler because it will reduce the range of benefits. However, there will be significant changes to the underlying data structure which will require further development of data linking algorithms.
Figure 12.1: Family receipt of Income Related Benefits (IRB), Any benefit and Tax Credits (per cent)
The existing benefit system can be considered as divided into four broad categories of recipients: pensioners, people with disability, housing and working age. Working-age subdivides into incapacity, single parents, unemployed, the bereaved and carers.
Benefits may be one of (a) means tested, (b) based on individual circumstances, or (c) based on past payment of contributions. For contributory benefits such as state pensions, eligibility depends whether the claimant and the claimant’s employer have paid sufficient National Insurance contributions (NICs).
Eligibility for benefits usually requires that residence conditions, such as that the person is present and resident in the UK, are met. However, different degrees of ‘residence’ are required for different benefits.
Key benefits
Income Support: Income Support is a taxable benefit for working-age people on a low income who do not have to sign on as unemployed and includes single parents with children. Receipt of Income Support is dependent on earnings, number of hours worked, and savings.
Jobseeker’s Allowance: Jobseekers Allowance (JSA) is a taxable benefit paid to unemployed people who are available and actively looking for work. JSA is paid either as a means-tested benefit or as a contribution-based benefit which has less eligibility restrictions than the income-based equivalent.
Employment and Support Allowance: Employment and Support Allowance (ESA) is paid if people’s ability to work is limited by ill health or disability. ESA replaced both incapacity benefit (IB) and income support (IS) paid on the grounds of incapacity for new claims from 27 October 2008. Claimants may undergo a Work Capability Assessment which will determine, for certain illnesses, a benefit award from the claim evidence.
Tax credits: Tax Credit claimants may be eligible for one or both of Child Tax Credits and Working Tax Credits. The Child Tax Credit is payable if the claimant is responsible for at least one child or young person. The Working Tax Credit is paid to people on lower incomes.
Pension Credit: Pension Credit is an income related benefit payable to people reaching a qualifying age. Pension Credit is payable in two parts. A Guarantee Credit (which tops up weekly income to fixed rates for singles and couples for the financial year) and a Savings Credit (which is an extra payment for people who have saved some money towards their retirement).
Source: Family Resources Survey 2008/09, 2009/10, 2010/11
Data linking the Family Resources Survey with social security benefits 12
165 The use of registers in the context of EU-SILC: challenges and opportunities
Disability Living Allowance and Attendance Allowance: Disability Living Allowance, and Attendance Allowance for people over 65, is designed to support people who have a disability and need extra help with personal care, mobility, or both.
12.3 Data
12.3.1 The Family Resources Survey (FRS)
The Family Resources Survey (FRS) is an annual household survey which in 2010/11 surveyed approximately 25,000 households with a sampling ratio of approximately one in every 1,000. An annual report summarises the results.
The FRS is the UK’s premier survey on incomes. The Households Below Average Income report, published by the UK’s Department for Work and Pension (DWP), provides key statistics on income distributions sourced from the FRS. The report monitors impact indicators on pensioner poverty, disability poverty and six of fifteen child poverty indicators.
Prior to 2002/03, the survey covered Great Britain; from 2002/03 the survey was extended to cover the UK by including Northern Ireland. The FRS, from November 2013, will for the first time be a core component of the UK’s EU-SILC contribution.
As with any household survey, the FRS has limitations which include: sampling error, non-response error, survey coverage in remote areas or private institutions, and survey design (it is a clustered sample).
12.3.2 Consent question
The FRS consent question is only asked of respondents that undergo a face to face interview. This means that consent is not asked of household members with proxy information recorded on their behalf because they were not present during the interview. Of those respondents that were physically present for the interview, 60 per cent gave consent for their records to be linked. Factoring in proxy interviews this falls to an overall consent rate of approximately 50 per cent of the sample.
Consent is asked at the end of the interview as this may be a trigger to respondents terminating the interview before completion. The respondent is given a consent letter to sign and all respondents are provided with an information leaflet explaining the purpose of linking their data. The consent question does not appear to have had an adverse effect on overall FRS response rates.
Respondents are informed that their names and addresses will only be seen by the FRS data linking team. It is also explained that records will be anonymised and used only for research and statistics. Respondents are given assurances that answers will not be used to check the accuracy of respondents’ benefits or tax credits in payment.
12.3.3 The Work and Pensions Longitudinal Study
The ‘Work and Pensions Longitudinal Study’ (WPLS) is a longitudinal administrative dataset of GB residents and holds details of their benefit history, earning history, Tax Credit history and employer pension schemes.
12.3.4 Matching processes and match rates
SAS matching processes have been developed by DWP’s FRS data linking team using a fuzzy matching algorithm that operates in two stages. The first stage is to produce a consistent index on both survey and administrative datasets based on various combinations of the soundex function of name, date of birth, and address.
12 Data linking the Family Resources Survey with social security benefits
The use of registers in the context of EU-SILC: challenges and opportunities 166
Six rules are considered to produce an acceptable quality of match. The rules are run separately on the survey data and the administrative data with results subsequently matched and unique cases selected.
The matching process results in an 80 per cent match rate for the consenters we attempt to match. It should be noted that we would not expect a 100 per cent match because not all respondents will have an administrative record due to incomplete coverage of the WPLS. Combined with the 50 per cent consent rate this yields an overall match rate between survey and administrative records of around 40 per cent.
12.3.5 Timeliness/processing delays and scope for use of register data in EU-SILC micro data provision
Social security benefit data are typically available two months after the scan date. Administrative data on income from employment is made available to DWP up to four months after the end of the financial year.
The FRS is available as a 12-month test release approximately eight months after the end of the survey year. Monthly feeds of names and addresses are provided to the data linking team four months in arrears. Hence, there are opportunities to make use of administrative data without causing significant further delays to the annual FRS release schedule (the work may cause a slight delay if it fell to the same team to process linking and the FRS).
However, there are currently no plans to use linked data as part of the EU-SILC micro data provision required in November. Methodological reasons for this are covered in the concluding remarks section. There are further factors to consider: for example the introduction of new data linking processes would risk delays to existing national statistics publications such as Households Below Average Income. The UK’s micro data provision is currently considered particularly timely as it is entirely based on survey information. Hence, linking with administrative would risk leading to a deterioration in the timeliness of this provision.
12.4 Extent of survey mis-measurementThe profiles of consenters were compared with (a) those declining to provide consent and (b) proxy cases where consent was not asked. Results for a range of demographic variables are shown in Table 12.1.
Overall, there was a high degree of similarity between the consenting cases and the overall sample profile.
Non-consenters tended to vary slightly from the consenters, but differences were not particularly large. Non-consenters were less likely to report a limiting long-term illness (30 per cent compared with 34 per cent for consenters) and were more likely to be from a non-white background (18 per cent compared with 11 per cent). Profiles by age group and gender were very similar, with only slight differences by marital status. Consenters were slightly more likely to be in one-adult households than non-consenters.
Comparisons with proxy respondents grouped with non-consenters resulted in larger differences. In particular, whilst 24 per cent of consenters lived in one-adult households, this was only true of 22 per cent of explicit non-consenters, but virtually none of the proxies. Conversely 21 per cent of the proxy cases were living in households with at least four adults, compared with only eight per cent of the consenting group and nine per cent of the explicit non-consenters. This reflects a higher rate of proxy interviews in larger households. Proxy respondents were also more likely to be aged 18-29, or single, or male.
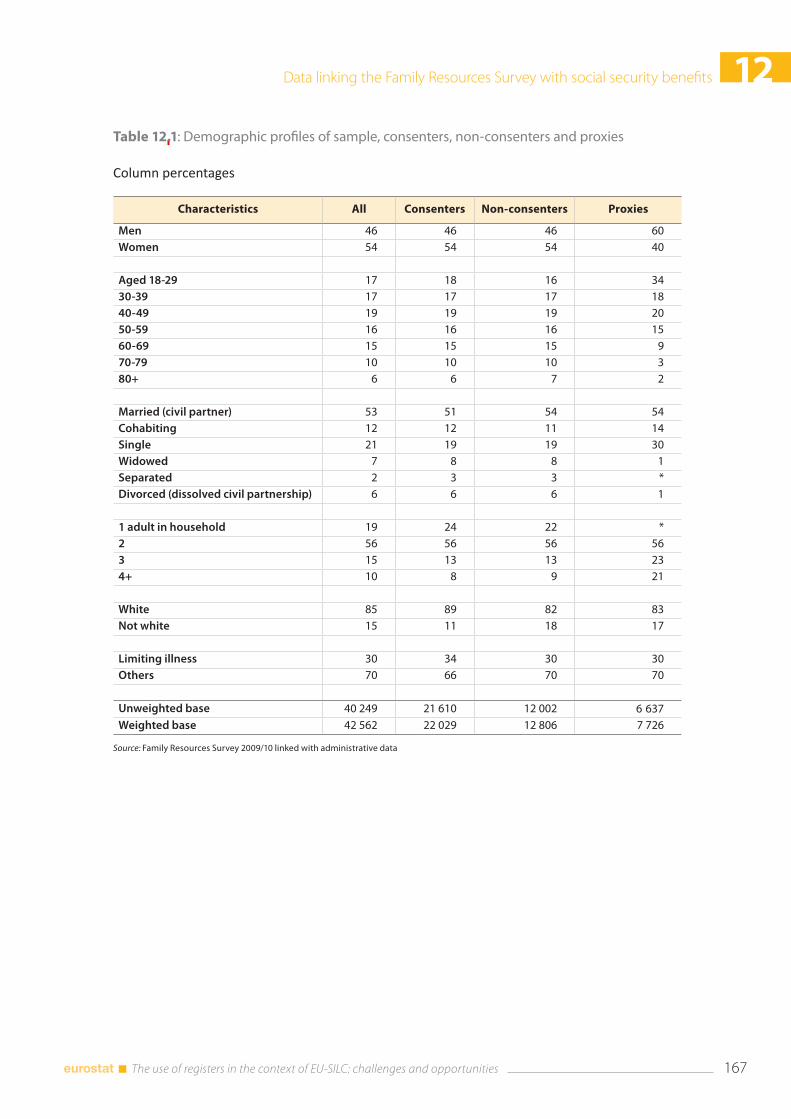
Data linking the Family Resources Survey with social security benefits 12
167 The use of registers in the context of EU-SILC: challenges and opportunities
Table 12.1: Demographic profiles of sample, consenters, non-consenters and proxies
Column percentages
Characteristics All Consenters Non-consenters Proxies
Men 46 46 46 60Women 54 54 54 40
Aged 18-29 17 18 16 3430-39 17 17 17 1840-49 19 19 19 2050-59 16 16 16 1560-69 15 15 15 970-79 10 10 10 380+ 6 6 7 2
Married (civil partner) 53 51 54 54Cohabiting 12 12 11 14Single 21 19 19 30Widowed 7 8 8 1Separated 2 3 3 *Divorced (dissolved civil partnership) 6 6 6 1
1 adult in household 19 24 22 *2 56 56 56 563 15 13 13 234+ 10 8 9 21
White 85 89 82 83Not white 15 11 18 17
Limiting illness 30 34 30 30Others 70 66 70 70
Unweighted base 40 249 21 610 12 002 6 637Weighted base 42 562 22 029 12 806 7 726
Source: Family Resources Survey 2009/10 linked with administrative data
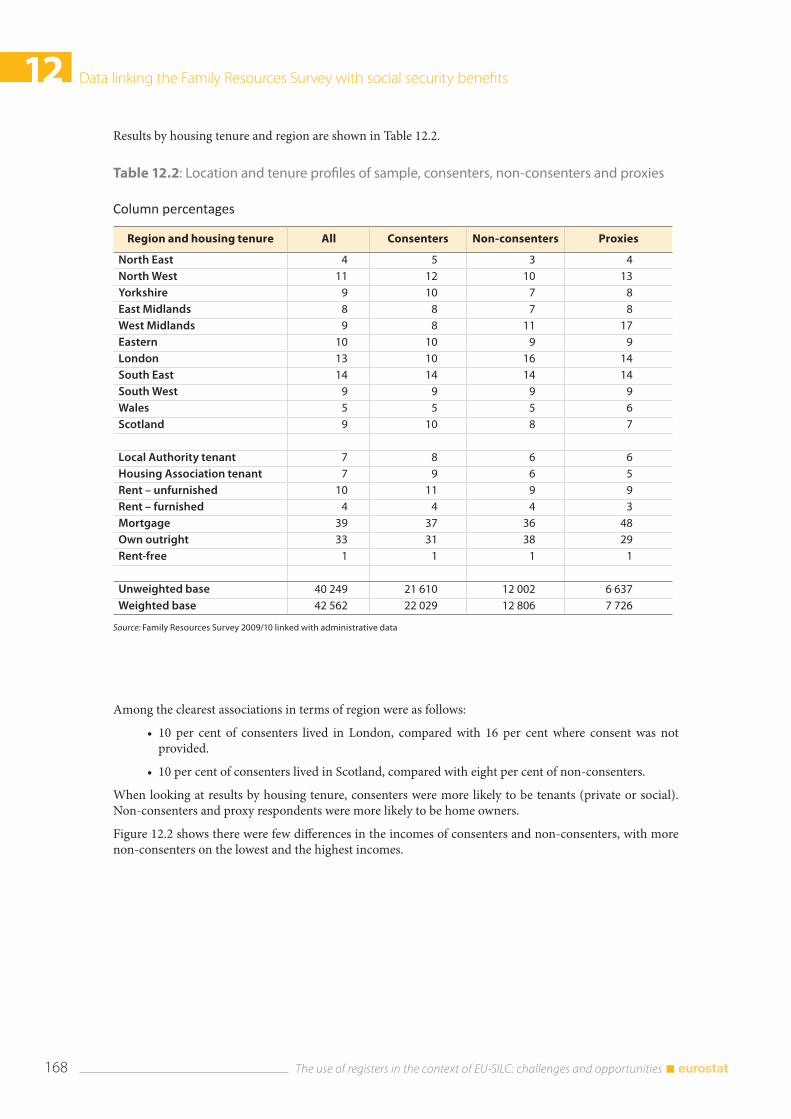
12 Data linking the Family Resources Survey with social security benefits
The use of registers in the context of EU-SILC: challenges and opportunities 168
Table 12.2: Location and tenure profiles of sample, consenters, non-consenters and proxies
Column percentages
Region and housing tenure All Consenters Non-consenters Proxies
North East 4 5 3 4North West 11 12 10 13Yorkshire 9 10 7 8East Midlands 8 8 7 8West Midlands 9 8 11 17Eastern 10 10 9 9London 13 10 16 14South East 14 14 14 14South West 9 9 9 9Wales 5 5 5 6Scotland 9 10 8 7
Local Authority tenant 7 8 6 6Housing Association tenant 7 9 6 5Rent – unfurnished 10 11 9 9Rent – furnished 4 4 4 3Mortgage 39 37 36 48Own outright 33 31 38 29Rent-free 1 1 1 1
Unweighted base 40 249 21 610 12 002 6 637Weighted base 42 562 22 029 12 806 7 726
Results by housing tenure and region are shown in Table 12.2.
Among the clearest associations in terms of region were as follows:
• 10 per cent of consenters lived in London, compared with 16 per cent where consent was not provided.
• 10 per cent of consenters lived in Scotland, compared with eight per cent of non-consenters.
When looking at results by housing tenure, consenters were more likely to be tenants (private or social). Non-consenters and proxy respondents were more likely to be home owners.
Figure 12.2 shows there were few differences in the incomes of consenters and non-consenters, with more non-consenters on the lowest and the highest incomes.
Source: Family Resources Survey 2009/10 linked with administrative data
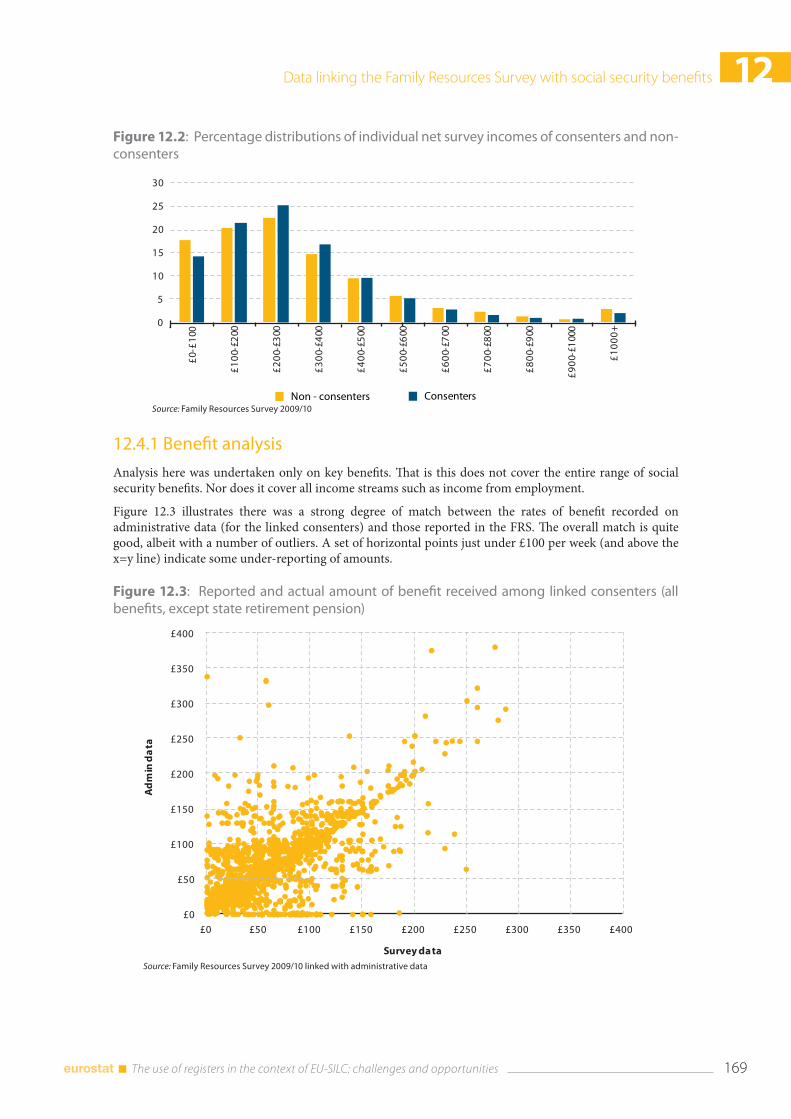
Data linking the Family Resources Survey with social security benefits 12
169 The use of registers in the context of EU-SILC: challenges and opportunities
Figure 12.2: Percentage distributions of individual net survey incomes of consenters and non-consenters
12.4.1 Benefit analysis
Analysis here was undertaken only on key benefits. That is this does not cover the entire range of social security benefits. Nor does it cover all income streams such as income from employment.
Figure 12.3 illustrates there was a strong degree of match between the rates of benefit recorded on administrative data (for the linked consenters) and those reported in the FRS. The overall match is quite good, albeit with a number of outliers. A set of horizontal points just under £100 per week (and above the x=y line) indicate some under-reporting of amounts.
Figure 12.3: Reported and actual amount of benefit received among linked consenters (all benefits, except state retirement pension)
Source: Family Resources Survey 2009/10
Source: Family Resources Survey 2009/10 linked with administrative data
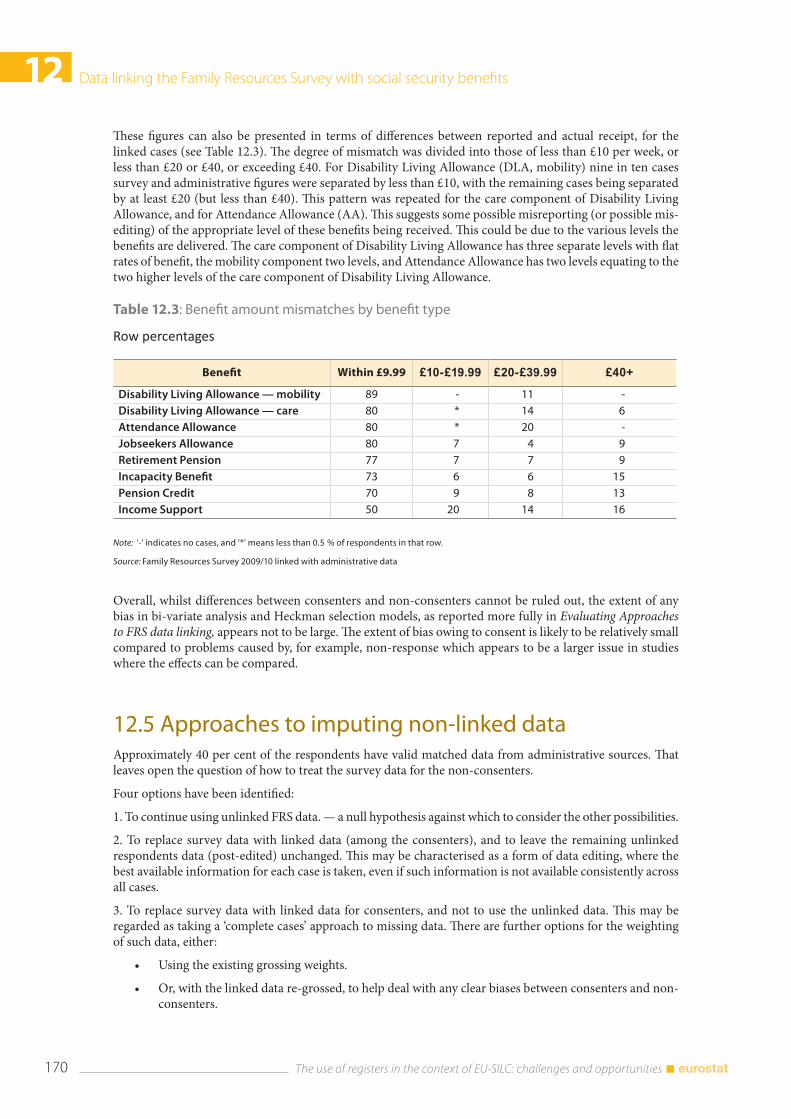
12 Data linking the Family Resources Survey with social security benefits
The use of registers in the context of EU-SILC: challenges and opportunities 170
These figures can also be presented in terms of differences between reported and actual receipt, for the linked cases (see Table 12.3). The degree of mismatch was divided into those of less than £10 per week, or less than £20 or £40, or exceeding £40. For Disability Living Allowance (DLA, mobility) nine in ten cases survey and administrative figures were separated by less than £10, with the remaining cases being separated by at least £20 (but less than £40). This pattern was repeated for the care component of Disability Living Allowance, and for Attendance Allowance (AA). This suggests some possible misreporting (or possible mis-editing) of the appropriate level of these benefits being received. This could be due to the various levels the benefits are delivered. The care component of Disability Living Allowance has three separate levels with flat rates of benefit, the mobility component two levels, and Attendance Allowance has two levels equating to the two higher levels of the care component of Disability Living Allowance.
Table 12.3: Benefit amount mismatches by benefit type
Row percentages
Benefit Within £9.99 £10-£19.99 £20-£39.99 £40+
Disability Living Allowance — mobility 89 - 11 -Disability Living Allowance — care 80 * 14 6Attendance Allowance 80 * 20 -Jobseekers Allowance 80 7 4 9Retirement Pension 77 7 7 9Incapacity Benefit 73 6 6 15Pension Credit 70 9 8 13Income Support 50 20 14 16
Note: ‘-’ indicates no cases, and ‘*’ means less than 0.5 % of respondents in that row.
Source: Family Resources Survey 2009/10 linked with administrative data
Overall, whilst differences between consenters and non-consenters cannot be ruled out, the extent of any bias in bi-variate analysis and Heckman selection models, as reported more fully in Evaluating Approaches to FRS data linking, appears not to be large. The extent of bias owing to consent is likely to be relatively small compared to problems caused by, for example, non-response which appears to be a larger issue in studies where the effects can be compared.
12.5 Approaches to imputing non-linked dataApproximately 40 per cent of the respondents have valid matched data from administrative sources. That leaves open the question of how to treat the survey data for the non-consenters.
Four options have been identified:
1. To continue using unlinked FRS data. — a null hypothesis against which to consider the other possibilities.
2. To replace survey data with linked data (among the consenters), and to leave the remaining unlinked respondents data (post-edited) unchanged. This may be characterised as a form of data editing, where the best available information for each case is taken, even if such information is not available consistently across all cases.
3. To replace survey data with linked data for consenters, and not to use the unlinked data. This may be regarded as taking a ‘complete cases’ approach to missing data. There are further options for the weighting of such data, either:
• Using the existing grossing weights.
• Or, with the linked data re-grossed, to help deal with any clear biases between consenters and non-consenters.
Data linking the Family Resources Survey with social security benefits 12
171 The use of registers in the context of EU-SILC: challenges and opportunities
4. To replace the survey data with linked data and to adjust the unlinked data as necessary (based on inferences from the linked data). In the context of distributing relevant micro-data, this may be seen as a form of imputation. There are various ways in which such imputation may be implemented — single and multiple imputations, and with different algorithms used to impute (including hot-deck approaches and Heckman-style selection models).
The key differences lie in the treatment of the unlinked cases, which are affected in different ways.
According to Lumley (2010: 186) ‘Multiple imputation and survey re-weighting are sometimes described as “statistically principled” approaches to inference with missing data’. In survey research, it is more usual to use weighting rather than imputation for complete non response (‘unit non-response’), and imputation for ‘item non-response’ where data on particular questions is missing.
The example of data linking, where it is usually not possible to link all cases, could be said to fall into either camp. This situation may be considered either analogous to unit non-response (treating admin data like another wave of data collection — where weighting is generally used) or to item non-response (there is missing data on only a few variables – use imputation).
These are all micro-level adjustments, adapting the dataset in various ways for later use. It is worth noting that for any given application, analysts may not need to adjust data at the unit-level (for each person). Instead, they may make aggregate adjustments based on information from the linked data. For instance, assuming that the proportion of ‘hidden recipients’ is the same in the unlinked data as in the linked data (as happens with take-up figures for Pension Credit) is akin to option 3. This embodies the strong (but not rebutted) assumption that the non-consenters share the same pattern of hidden receipt as the consenters. However, these adjustments are somewhat ad hoc, and do not provide a means of distributing a general purpose dataset that would meet a range of user needs.
12.6 EvaluationLogistic regression models were developed with receipt of UK benefits as separate response variables and characteristics of age and gender as regressor variables. This enabled comparisons of a benchmark model using aggregate totals from published administrative totals against various imputation approaches using linked data, and an unadjusted FRS survey. Comparisons were made as shown in Table 12.4 by calculating the deviation of regression coefficients from the benchmark using the Root Mean Squared Error metric.
The ‘Admin + Imputed survey’ model performed best. But this appeared only marginally better than the simpler scenario of using actual administrative data and (unadjusted) survey data. This in turn was marginally better than the unadjusted FRS model.
Models based on imputing the levels of benefits for non-consenters generally provided good results. Further imputation of hidden recipients by a different technique, here logistic regression, moved results in the right direction. However, it is a much bigger analytical step to take to attribute benefits on a statistical basis to those who said they didn’t receive them. And it is not clear that such an approach would be in line with user needs.
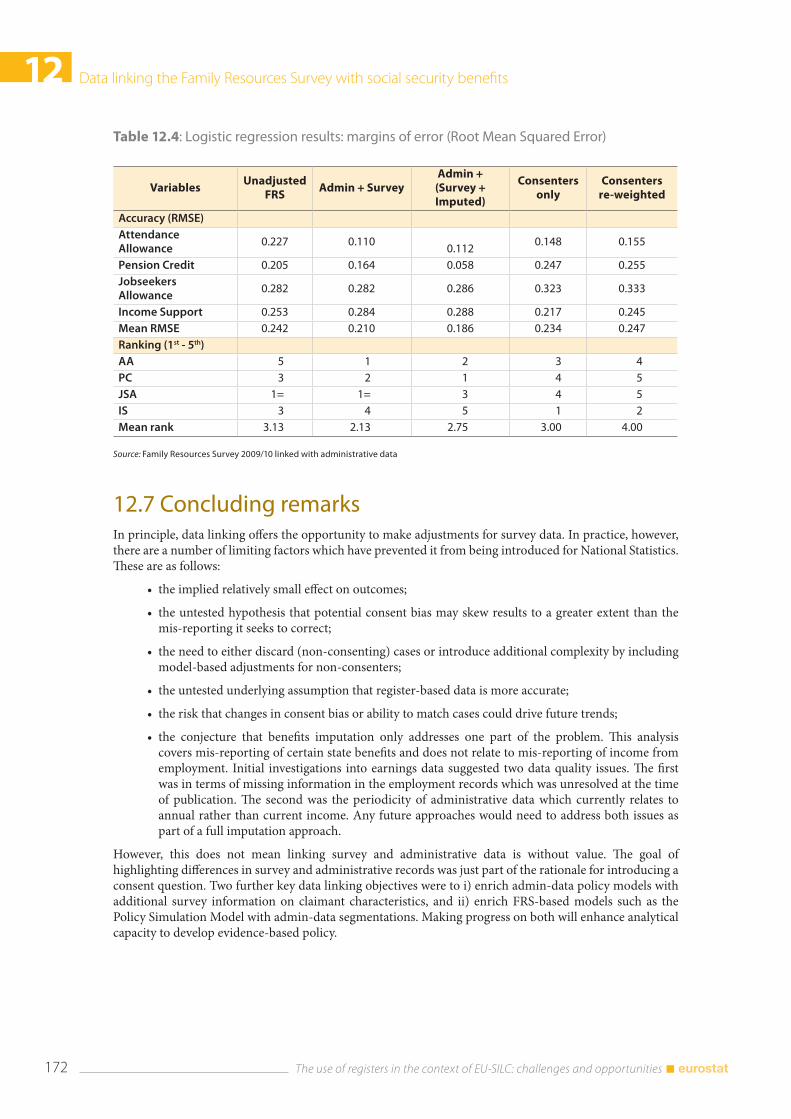
12 Data linking the Family Resources Survey with social security benefits
The use of registers in the context of EU-SILC: challenges and opportunities 172
Table 12.4: Logistic regression results: margins of error (Root Mean Squared Error)
12.7 Concluding remarksIn principle, data linking offers the opportunity to make adjustments for survey data. In practice, however, there are a number of limiting factors which have prevented it from being introduced for National Statistics. These are as follows:
• the implied relatively small effect on outcomes;
• the untested hypothesis that potential consent bias may skew results to a greater extent than the mis-reporting it seeks to correct;
• the need to either discard (non-consenting) cases or introduce additional complexity by including model-based adjustments for non-consenters;
• the untested underlying assumption that register-based data is more accurate;
• the risk that changes in consent bias or ability to match cases could drive future trends;
• the conjecture that benefits imputation only addresses one part of the problem. This analysis covers mis-reporting of certain state benefits and does not relate to mis-reporting of income from employment. Initial investigations into earnings data suggested two data quality issues. The first was in terms of missing information in the employment records which was unresolved at the time of publication. The second was the periodicity of administrative data which currently relates to annual rather than current income. Any future approaches would need to address both issues as part of a full imputation approach.
However, this does not mean linking survey and administrative data is without value. The goal of highlighting differences in survey and administrative records was just part of the rationale for introducing a consent question. Two further key data linking objectives were to i) enrich admin-data policy models with additional survey information on claimant characteristics, and ii) enrich FRS-based models such as the Policy Simulation Model with admin-data segmentations. Making progress on both will enhance analytical capacity to develop evidence-based policy.
VariablesUnadjusted
FRSAdmin + Survey
Admin + (Survey + Imputed)
Consenters only
Consenters re-weighted
Accuracy (RMSE)Attendance Allowance
0.227 0.1100.112
0.148 0.155
Pension Credit 0.205 0.164 0.058 0.247 0.255Jobseekers Allowance
0.282 0.282 0.286 0.323 0.333
Income Support 0.253 0.284 0.288 0.217 0.245Mean RMSE 0.242 0.210 0.186 0.234 0.247Ranking (1st - 5th)AA 5 1 2 3 4PC 3 2 1 4 5JSA 1= 1= 3 4 5IS 3 4 5 1 2Mean rank 3.13 2.13 2.75 3.00 4.00
Source: Family Resources Survey 2009/10 linked with administrative data

Data linking the Family Resources Survey with social security benefits 12
173 The use of registers in the context of EU-SILC: challenges and opportunities
12.8 Some helpful sources http://www.ifs.org.uk/bns/bn13.pdf.
http://statistics.dwp.gov.uk/asd/asd4/budget_2012_summ.xls.
http://budgetresponsibility.independent.gov.uk/wordpress/docs/March-2012-EFO1.pdf.
http://www.ons.gov.uk/ons/dcp171778_271962.pdf.

Asking income and consumption questions in the same survey: what are the risks? 13
175 The use of registers in the context of EU-SILC: challenges and opportunities
13. Asking income and consumption questions in the same survey: What are the risks?
Giulia Cifaldi and Andrea Neri(1)
Abstract: Sample surveys providing high quality information on both total household expenditure (consumption) and income are not commonly available. Nevertheless, surveys focusing on income usually do collect some information on expenditure data. A main drawback of this practice is that it could let some researchers think that both sets of information have similar accuracy, as they are derived from the same survey. This chapter provides an empirical investigation of the consequences of such an assumption. We draw on the Survey of Household Income and Wealth (SHIW, thereafter) as a case study, since it collects information on both income and consumption. We combine this survey with the information coming from other surveys that are assumed to be more reliable than the SHIW for specific items. On average, we find that the underestimation of household income is lower than the one relating to consumption. As a consequence, saving rates are likely to be overestimated in the survey. We also find evidence that measurement error in income data is proportionally higher for high incomes. This does not appear to be the case for consumption data. Household saving is likely to be overestimated, especially for households in the low-income classes. Finally, we find evidence that measurement error may bias the relationship between household savings and its determinants.
13.1 IntroductionSample surveys providing high-quality information on both total household expenditure (consumption) and income are not commonly available. One of the main reasons is that collecting high-quality data on both topics requires a very large number of questions that would result in an excessive respondent burden. Both the concepts of income and consumption consist of a high number of components and, in order to collect accurate data, it would be necessary to include a specific question for each single item rather than asking few questions at a more aggregate (Krosnick and Presser, 2010, Fowler, 1995, Crossley and Winter, 2011). Quality expenditure data usually call for the use of diaries in which the household records all purchases made within a short period of time (at least for small and frequently purchased items). The diary method minimises the reliance on respondents’ memories at a higher cost in terms of respondent burden. Moreover, collecting high-quality information on income is a burdensome task. First, it requires asking each member of the household whether or not he/she has received a particular type of income. This must be done for all possible sources of income (self-employment, employment, pensions, return on assets, etc.). Moreover, it is good practice to collect additional data such as the type of work the respondent is engaged in, the type of pension received, the characteristics of a rented dwelling, and so on. Since asking detailed questions on income and consumption in the same survey can be problematic, surveys tend to specialise in one of the two topics.
Surveys whose main focus is income usually include few recall questions on consumption as well. This is done for at least two reasons. First, it enables the study of household savings decisions, where saving is defined as income minus consumption. This topic is usually of great interest to policy makers and, when available, surveys are widely used since they allow economists to analyse relevant subgroups of the population. Second, asking consumption questions may help improve the quality of income responses. This could be achieved during the interview by probing the respondents when answers do not appear to be fully coherent, or at a later stage during the editing process (via call-backs).
(1) This work has been supported by the second Network for the analysis of EU-SILC (Net-SILC2), funded by Eurostat. The European Commission and Banca d’Italia bear no responsibility for the analyses and conclusions, which are solely those of the authors. Authors: Giulia Cifaldi (Economic and Financial Statistics Department, Banca d’Italia,[email protected]) and Andrea Neri (Economic and Financial Statistics Department, Banca d’Italia, [email protected]).
13 Asking income and consumption questions in the same survey: what are the risks?
The use of registers in the context of EU-SILC: challenges and opportunities 176
This practice risks having one major drawback. External users may be tempted to use both variables in the same study without giving due consideration to measurement issues. They may implicitly assume that responses about consumption have the same accuracy as those on income, since they are both collected in the same survey (using the same procedures and standards for quality checks). This then risks jumping to erroneous conclusions, especially when investigating household saving decisions.
There are at least two reasons why the ̀ equal accuracy assumption’ may not be valid. The first is that questions on income are usually considered sensitive and tend to produce comparatively higher nonresponse rates or larger measurement error in responses than questions on other topics (Tourangeau and Yan, 2007). For instance, some respondents may feel that such questions are overly intrusive and that they are none of the researcher’s business. Others may fear consequences in providing truthful answers in case of possible disclosure to a third party (such as fiscal authorities).
A second reason is that if the questions on consumption are not part of the focus of the survey, diaries are not used to collect expenditure information. Even if in the literature there are studies showing that diaries are not perfect (Crossley and Winter, 2011), there appears to be a prevailing view that the diary approach provides more accurate measures than recall questions as far as nondurable expenditure is concerned (Battistin, 2003).
In this chapter, we use an empirical application to answer the following research question: what are the consequences of being unaware that income and consumption data might have a different level of accuracy? For this, we draw on data from the Survey of Household Income and Wealth, a national representative probabilistic sample of the Italian population. The main focus of the SHIW is to collect detailed information on household income and wealth, but the questionnaire also includes some questions that attempt to reconstruct total household expenditure.
To the best of our knowledge, this is the first application on this topic. A paper by Browning, Crossley and Weber (2003) studies the quality of responses to questions on expenditure in multipurpose surveys. After reviewing the way consumption questions are framed, the authors assess the quality of the responses by comparing them with external sources of information. They argue that, even if there is evidence of bias, valid information can be collected by adding specific recall questions to general purpose surveys. They also provide recommendations on how to do so. However, the paper only focuses on total expenditure; it does not consider income or other variables. In a similar vein, other research studies the effects of measurement error in the two variables separately. For a review of studies about the measurement issue in income variables see Moore, Stinson and Welniak (2003) or Pedace and Bates (2000). As far as consumption is concerned, see, for example, Attanasio, Battistin and Ichimura (2004), Attanasio and Weber (2010), Battistin (2003), Kan and Pudney (2008) and Pudney (2008). Rather surprisingly, there are no studies dealing with both consumption and income at the same time.
13.2 DataThe SHIW is conducted every two years by the Bank of Italy to study the economic situation of Italian households. The sample consists of about 8 000 households selected from population registers. The survey has been run since 1962. In this analysis, we use data from the 2008 wave. The survey also collects some information on total household expenditure. This feature makes it suitable for an empirical investigation of our research question. Similar surveys usually include questions only relating to some of the components of total expenditure. For instance, the US Panel Study on Income Dynamics (PSID) asks questions about food, rent, transport, education, health and child care expenses. The British Household Panel Survey (BHPS) collects information on durable items and on food expenses. The European survey on Income and Living Conditions (EU-SILC) includes questions on main residence related expenses, while the Household Income and Labour Dynamics in Australia (HILDA) survey asks respondents about groceries, food, and meals outside the home.
Previous research using the SHIW has shown that both data on income and on consumption are affected by non-sampling errors. According to Neri and Zizza (2010), the main problems affecting the measurement of income in the SHIW are: 1) the difficulty respondents have recalling secondary sources of income; 2) the
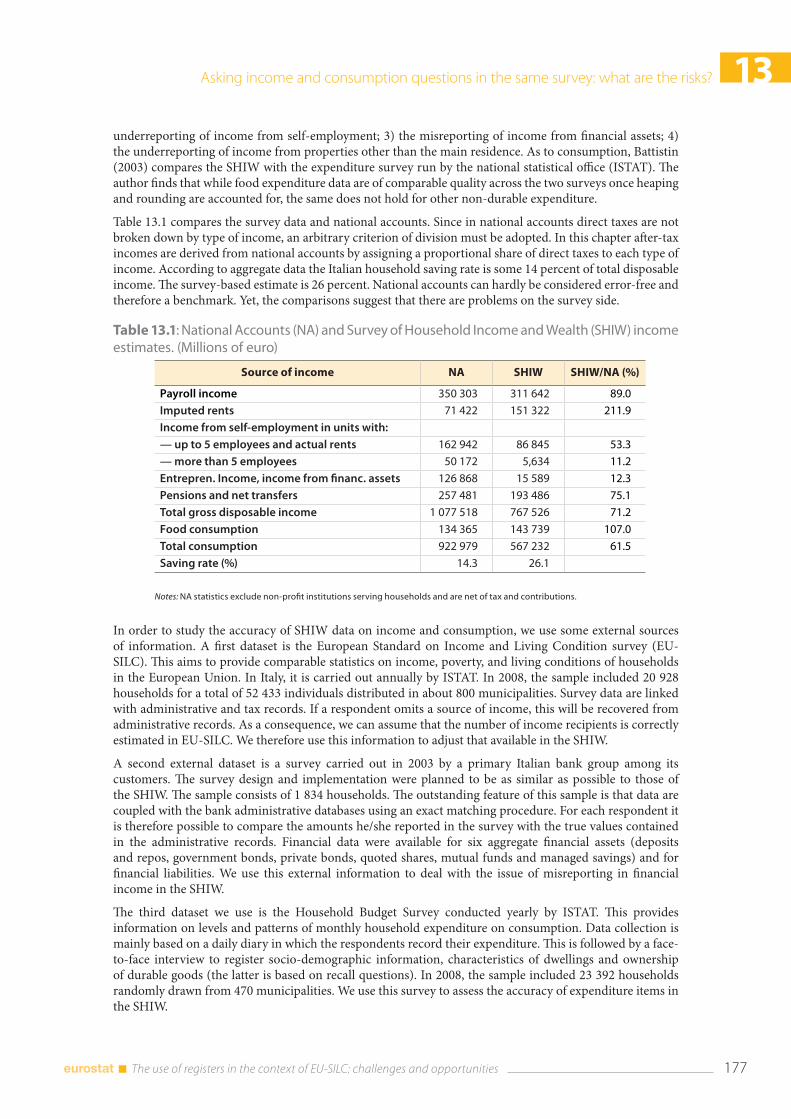
Asking income and consumption questions in the same survey: what are the risks? 13
177 The use of registers in the context of EU-SILC: challenges and opportunities
underreporting of income from self-employment; 3) the misreporting of income from financial assets; 4) the underreporting of income from properties other than the main residence. As to consumption, Battistin (2003) compares the SHIW with the expenditure survey run by the national statistical office (ISTAT). The author finds that while food expenditure data are of comparable quality across the two surveys once heaping and rounding are accounted for, the same does not hold for other non-durable expenditure.
Table 13.1 compares the survey data and national accounts. Since in national accounts direct taxes are not broken down by type of income, an arbitrary criterion of division must be adopted. In this chapter after-tax incomes are derived from national accounts by assigning a proportional share of direct taxes to each type of income. According to aggregate data the Italian household saving rate is some 14 percent of total disposable income. The survey-based estimate is 26 percent. National accounts can hardly be considered error-free and therefore a benchmark. Yet, the comparisons suggest that there are problems on the survey side.
Table 13.1: National Accounts (NA) and Survey of Household Income and Wealth (SHIW) income estimates. (Millions of euro)
Source of income NA SHIW SHIW/NA (%)
Payroll income 350 303 311 642 89.0
Imputed rents 71 422 151 322 211.9
Income from self-employment in units with:
— up to 5 employees and actual rents 162 942 86 845 53.3
— more than 5 employees 50 172 5,634 11.2
Entrepren. Income, income from financ. assets 126 868 15 589 12.3
Pensions and net transfers 257 481 193 486 75.1
Total gross disposable income 1 077 518 767 526 71.2
Food consumption 134 365 143 739 107.0
Total consumption 922 979 567 232 61.5
Saving rate (%) 14.3 26.1
Notes: NA statistics exclude non-profit institutions serving households and are net of tax and contributions.
In order to study the accuracy of SHIW data on income and consumption, we use some external sources of information. A first dataset is the European Standard on Income and Living Condition survey (EU-SILC). This aims to provide comparable statistics on income, poverty, and living conditions of households in the European Union. In Italy, it is carried out annually by ISTAT. In 2008, the sample included 20 928 households for a total of 52 433 individuals distributed in about 800 municipalities. Survey data are linked with administrative and tax records. If a respondent omits a source of income, this will be recovered from administrative records. As a consequence, we can assume that the number of income recipients is correctly estimated in EU-SILC. We therefore use this information to adjust that available in the SHIW.
A second external dataset is a survey carried out in 2003 by a primary Italian bank group among its customers. The survey design and implementation were planned to be as similar as possible to those of the SHIW. The sample consists of 1 834 households. The outstanding feature of this sample is that data are coupled with the bank administrative databases using an exact matching procedure. For each respondent it is therefore possible to compare the amounts he/she reported in the survey with the true values contained in the administrative records. Financial data were available for six aggregate financial assets (deposits and repos, government bonds, private bonds, quoted shares, mutual funds and managed savings) and for financial liabilities. We use this external information to deal with the issue of misreporting in financial income in the SHIW.
The third dataset we use is the Household Budget Survey conducted yearly by ISTAT. This provides information on levels and patterns of monthly household expenditure on consumption. Data collection is mainly based on a daily diary in which the respondents record their expenditure. This is followed by a face-to-face interview to register socio-demographic information, characteristics of dwellings and ownership of durable goods (the latter is based on recall questions). In 2008, the sample included 23 392 households randomly drawn from 470 municipalities. We use this survey to assess the accuracy of expenditure items in the SHIW.
13 Asking income and consumption questions in the same survey: what are the risks?
The use of registers in the context of EU-SILC: challenges and opportunities 178
13.3 MethodologyIn ideal conditions, we would have information from administrative records about each respondent’s income and consumption. Unfortunately, this is not the case in the present study. Accordingly, we try to explore the information from external surveys that for some specific items may be assumed to produce accurate measurements.
The method consists in adjusting SHIW data along the following steps: (1) adjustment of secondary sources of income; (2) adjustment of income for the self-employed; (3) adjustment of property income; (4) adjustment of income from financial assets; (5) adjustment of non-durable expenditure. The final result is the production of a synthetic dataset in which measurement error should be accounted for. This file can be used to gain an insight into the consequences of the ‘equal accuracy assumption’. However, it is worth stressing that none of the adjustments described in the chapter are currently part of the production process of SHIW data. To the best of our knowledge, the same applies for most of the existing similar surveys. Corrections for measurement error in public use data files are seldom, if ever made.
In the following sections, we describe the method used to adjust for underreporting in secondary sources of income and non-durable expenditure. This is the original contribution of the work, while for the other steps we replicate existing methods.
For self-employment income, we replicate the method described in Neri and Zizza (2010). This is a modified version of the approach by Pissarides and Weber (1989). It consists of imputing income on the basis of the value of the main residence (while controlling for other socio-demographic variables). This value is assumed to be reported accurately even by the self-employed. The first step is to estimate the relation between income from work and the value of the main residence in a subsample of reliable SHIW respondents while controlling for a set of observed characteristics. The estimated coefficients are then projected on to the self-employed to obtain their predicted income.
The procedure for adjusting rental income is borrowed from Cannari, D’Alessio (1993) and is limited to dwellings other than the main residence. The Census provides an estimate of the total number of secondary dwellings. We can therefore calculate the number of missing dwellings as the difference between the Census figure and the one from the survey. We then assign these missing dwellings to SHIW respondents. In order to do so, we first estimate for each respondent the probability of holding one or more dwellings as a function of a set of household characteristics. On the basis these probabilities, we impute the ownership of the missing dwellings using a random experiment.
As regards financial income, we replicate the procedure by D’Aurizio et al. (2006), which is based on a sample survey of customers of a leading Bank coupled with administrative data on the assets actually owned. For each respondent we then have information on both the true amount of financial wealth survey and the one reported in the survey. We use this information to estimate the misreporting behavior in the external data and we then project it on to SHIW respondents. This is done for six different categories of financial asset (deposits, government bonds, private bonds, shares, managed savings, mutual funds) and for financial liabilities. The adjustment consists of the following steps. First, we adjust for misreporting in the ownership. Using the external data, we estimate the probability of holding a financial asset (or liability) as a function of the ownership declared in the survey and other household characteristics. We then project these probabilities on to SHIW respondents and impute ownership with a random experiment. Second, we adjust misreporting in the amounts following a similar procedure. In the external data, we compute the ratio between the true and the declared amount for each asset (and for liabilities) and we estimate its relation with a set of socio-demographic variables. Eventually we use this information to impute the true amount of financial wealth held by SHIW respondents.
The adjustment process for both income and consumption items results in a final dataset with imputed values. We then compare imputed and initial values both in a univariate and in a multivariate context. For the latter, we pool the adjusted and the original data and create a dummy indicator for the imputed observations. Then, we fit an ordinal regression model using as the dependent variable the observed household saving class. In case there are no significant differences between imputed and original values, the dummy variable and its interactions with other variables should not be significantly different from zero.
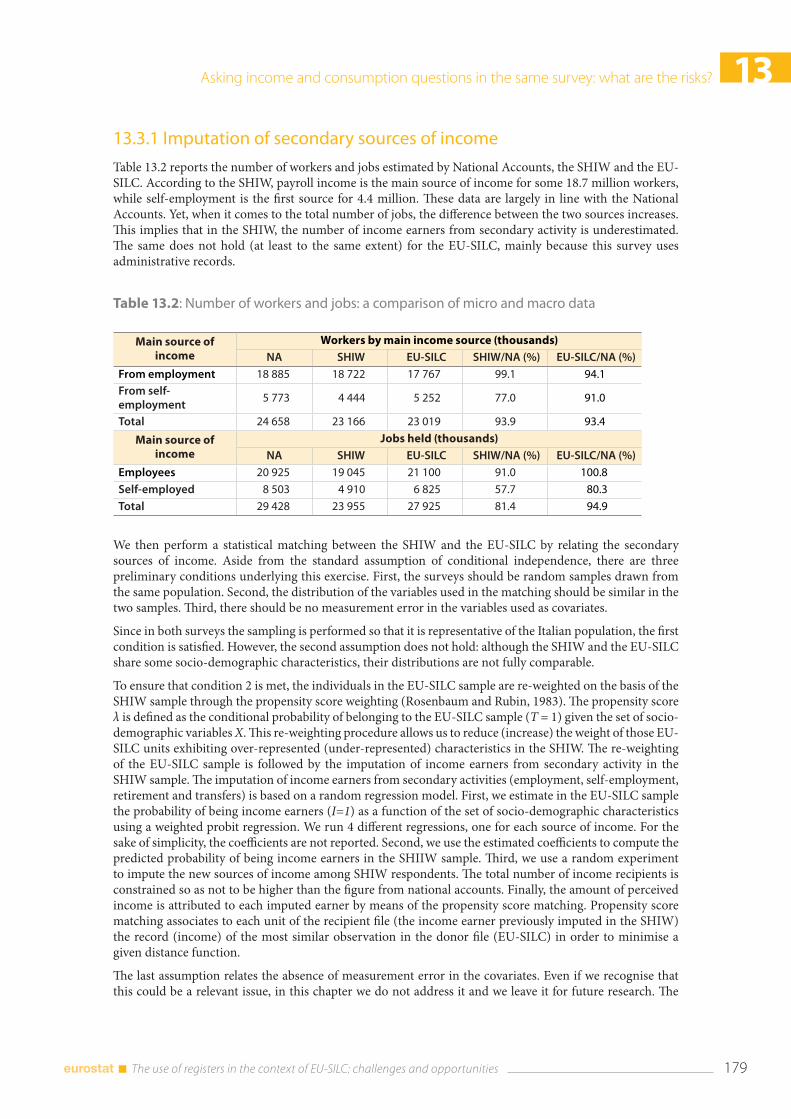
Asking income and consumption questions in the same survey: what are the risks? 13
179 The use of registers in the context of EU-SILC: challenges and opportunities
13.3.1 Imputation of secondary sources of income
Table 13.2 reports the number of workers and jobs estimated by National Accounts, the SHIW and the EU-SILC. According to the SHIW, payroll income is the main source of income for some 18.7 million workers, while self-employment is the first source for 4.4 million. These data are largely in line with the National Accounts. Yet, when it comes to the total number of jobs, the difference between the two sources increases. This implies that in the SHIW, the number of income earners from secondary activity is underestimated. The same does not hold (at least to the same extent) for the EU-SILC, mainly because this survey uses administrative records.
Table 13.2: Number of workers and jobs: a comparison of micro and macro data
Main source of income
Workers by main income source (thousands)NA SHIW EU-SILC SHIW/NA (%) EU-SILC/NA (%)
From employment 18 885 18 722 17 767 99.1 94.1From self-employment
5 773 4 444 5 252 77.0 91.0
Total 24 658 23 166 23 019 93.9 93.4
Main source of income
Jobs held (thousands)NA SHIW EU-SILC SHIW/NA (%) EU-SILC/NA (%)
Employees 20 925 19 045 21 100 91.0 100.8
Self-employed 8 503 4 910 6 825 57.7 80.3
Total 29 428 23 955 27 925 81.4 94.9
We then perform a statistical matching between the SHIW and the EU-SILC by relating the secondary sources of income. Aside from the standard assumption of conditional independence, there are three preliminary conditions underlying this exercise. First, the surveys should be random samples drawn from the same population. Second, the distribution of the variables used in the matching should be similar in the two samples. Third, there should be no measurement error in the variables used as covariates.
Since in both surveys the sampling is performed so that it is representative of the Italian population, the first condition is satisfied. However, the second assumption does not hold: although the SHIW and the EU-SILC share some socio-demographic characteristics, their distributions are not fully comparable.
To ensure that condition 2 is met, the individuals in the EU-SILC sample are re-weighted on the basis of the SHIW sample through the propensity score weighting (Rosenbaum and Rubin, 1983). The propensity score λ is defined as the conditional probability of belonging to the EU-SILC sample (T = 1) given the set of socio-demographic variables X. This re-weighting procedure allows us to reduce (increase) the weight of those EU-SILC units exhibiting over-represented (under-represented) characteristics in the SHIW. The re-weighting of the EU-SILC sample is followed by the imputation of income earners from secondary activity in the SHIW sample. The imputation of income earners from secondary activities (employment, self-employment, retirement and transfers) is based on a random regression model. First, we estimate in the EU-SILC sample the probability of being income earners (I=1) as a function of the set of socio-demographic characteristics using a weighted probit regression. We run 4 different regressions, one for each source of income. For the sake of simplicity, the coefficients are not reported. Second, we use the estimated coefficients to compute the predicted probability of being income earners in the SHIIW sample. Third, we use a random experiment to impute the new sources of income among SHIW respondents. The total number of income recipients is constrained so as not to be higher than the figure from national accounts. Finally, the amount of perceived income is attributed to each imputed earner by means of the propensity score matching. Propensity score matching associates to each unit of the recipient file (the income earner previously imputed in the SHIW) the record (income) of the most similar observation in the donor file (EU-SILC) in order to minimise a given distance function.
The last assumption relates the absence of measurement error in the covariates. Even if we recognise that this could be a relevant issue, in this chapter we do not address it and we leave it for future research. The
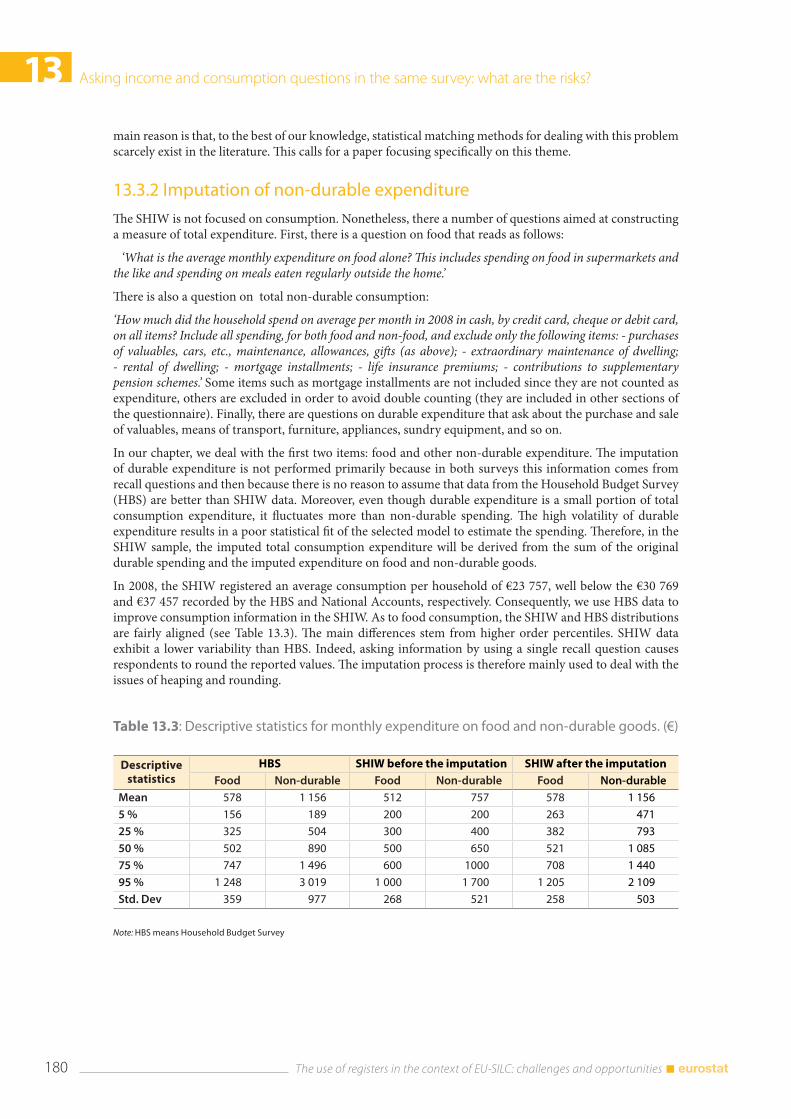
13 Asking income and consumption questions in the same survey: what are the risks?
The use of registers in the context of EU-SILC: challenges and opportunities 180
main reason is that, to the best of our knowledge, statistical matching methods for dealing with this problem scarcely exist in the literature. This calls for a paper focusing specifically on this theme.
13.3.2 Imputation of non-durable expenditure
The SHIW is not focused on consumption. Nonetheless, there a number of questions aimed at constructing a measure of total expenditure. First, there is a question on food that reads as follows:
‘What is the average monthly expenditure on food alone? This includes spending on food in supermarkets and the like and spending on meals eaten regularly outside the home.’
There is also a question on total non-durable consumption:
‘How much did the household spend on average per month in 2008 in cash, by credit card, cheque or debit card, on all items? Include all spending, for both food and non-food, and exclude only the following items: - purchases of valuables, cars, etc., maintenance, allowances, gifts (as above); - extraordinary maintenance of dwelling; - rental of dwelling; - mortgage installments; - life insurance premiums; - contributions to supplementary pension schemes.’ Some items such as mortgage installments are not included since they are not counted as expenditure, others are excluded in order to avoid double counting (they are included in other sections of the questionnaire). Finally, there are questions on durable expenditure that ask about the purchase and sale of valuables, means of transport, furniture, appliances, sundry equipment, and so on.
In our chapter, we deal with the first two items: food and other non-durable expenditure. The imputation of durable expenditure is not performed primarily because in both surveys this information comes from recall questions and then because there is no reason to assume that data from the Household Budget Survey (HBS) are better than SHIW data. Moreover, even though durable expenditure is a small portion of total consumption expenditure, it fluctuates more than non-durable spending. The high volatility of durable expenditure results in a poor statistical fit of the selected model to estimate the spending. Therefore, in the SHIW sample, the imputed total consumption expenditure will be derived from the sum of the original durable spending and the imputed expenditure on food and non-durable goods.
In 2008, the SHIW registered an average consumption per household of €23 757, well below the €30 769 and €37 457 recorded by the HBS and National Accounts, respectively. Consequently, we use HBS data to improve consumption information in the SHIW. As to food consumption, the SHIW and HBS distributions are fairly aligned (see Table 13.3). The main differences stem from higher order percentiles. SHIW data exhibit a lower variability than HBS. Indeed, asking information by using a single recall question causes respondents to round the reported values. The imputation process is therefore mainly used to deal with the issues of heaping and rounding.
Table 13.3: Descriptive statistics for monthly expenditure on food and non-durable goods. (€)
Descriptive statistics
HBS SHIW before the imputation SHIW after the imputationFood Non-durable Food Non-durable Food Non-durable
Mean 578 1 156 512 757 578 1 156
5 % 156 189 200 200 263 471
25 % 325 504 300 400 382 793
50 % 502 890 500 650 521 1 085
75 % 747 1 496 600 1000 708 1 440
95 % 1 248 3 019 1 000 1 700 1 205 2 109
Std. Dev 359 977 268 521 258 503
Note: HBS means Household Budget Survey
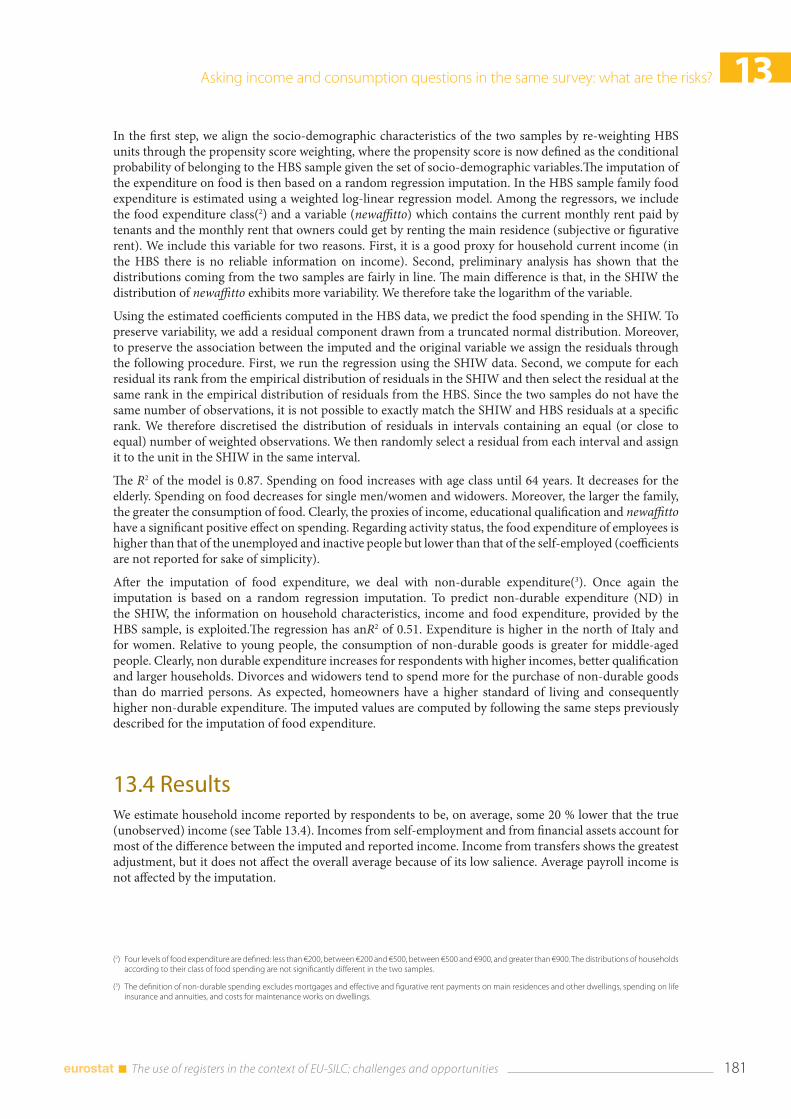
Asking income and consumption questions in the same survey: what are the risks? 13
181 The use of registers in the context of EU-SILC: challenges and opportunities
In the first step, we align the socio-demographic characteristics of the two samples by re-weighting HBS units through the propensity score weighting, where the propensity score is now defined as the conditional probability of belonging to the HBS sample given the set of socio-demographic variables.The imputation of the expenditure on food is then based on a random regression imputation. In the HBS sample family food expenditure is estimated using a weighted log-linear regression model. Among the regressors, we include the food expenditure class(2) and a variable (newaffitto) which contains the current monthly rent paid by tenants and the monthly rent that owners could get by renting the main residence (subjective or figurative rent). We include this variable for two reasons. First, it is a good proxy for household current income (in the HBS there is no reliable information on income). Second, preliminary analysis has shown that the distributions coming from the two samples are fairly in line. The main difference is that, in the SHIW the distribution of newaffitto exhibits more variability. We therefore take the logarithm of the variable.
Using the estimated coefficients computed in the HBS data, we predict the food spending in the SHIW. To preserve variability, we add a residual component drawn from a truncated normal distribution. Moreover, to preserve the association between the imputed and the original variable we assign the residuals through the following procedure. First, we run the regression using the SHIW data. Second, we compute for each residual its rank from the empirical distribution of residuals in the SHIW and then select the residual at the same rank in the empirical distribution of residuals from the HBS. Since the two samples do not have the same number of observations, it is not possible to exactly match the SHIW and HBS residuals at a specific rank. We therefore discretised the distribution of residuals in intervals containing an equal (or close to equal) number of weighted observations. We then randomly select a residual from each interval and assign it to the unit in the SHIW in the same interval.
The R2 of the model is 0.87. Spending on food increases with age class until 64 years. It decreases for the elderly. Spending on food decreases for single men/women and widowers. Moreover, the larger the family, the greater the consumption of food. Clearly, the proxies of income, educational qualification and newaffitto have a significant positive effect on spending. Regarding activity status, the food expenditure of employees is higher than that of the unemployed and inactive people but lower than that of the self-employed (coefficients are not reported for sake of simplicity).
After the imputation of food expenditure, we deal with non-durable expenditure(3). Once again the imputation is based on a random regression imputation. To predict non-durable expenditure (ND) in the SHIW, the information on household characteristics, income and food expenditure, provided by the HBS sample, is exploited.The regression has anR2 of 0.51. Expenditure is higher in the north of Italy and for women. Relative to young people, the consumption of non-durable goods is greater for middle-aged people. Clearly, non durable expenditure increases for respondents with higher incomes, better qualification and larger households. Divorces and widowers tend to spend more for the purchase of non-durable goods than do married persons. As expected, homeowners have a higher standard of living and consequently higher non-durable expenditure. The imputed values are computed by following the same steps previously described for the imputation of food expenditure.
13.4 ResultsWe estimate household income reported by respondents to be, on average, some 20 % lower that the true (unobserved) income (see Table 13.4). Incomes from self-employment and from financial assets account for most of the difference between the imputed and reported income. Income from transfers shows the greatest adjustment, but it does not affect the overall average because of its low salience. Average payroll income is not affected by the imputation.
(2) Four levels of food expenditure are defined: less than €200, between €200 and €500, between €500 and €900, and greater than €900. The distributions of households according to their class of food spending are not significantly different in the two samples.
(3) The definition of non-durable spending excludes mortgages and effective and figurative rent payments on main residences and other dwellings, spending on life insurance and annuities, and costs for maintenance works on dwellings.
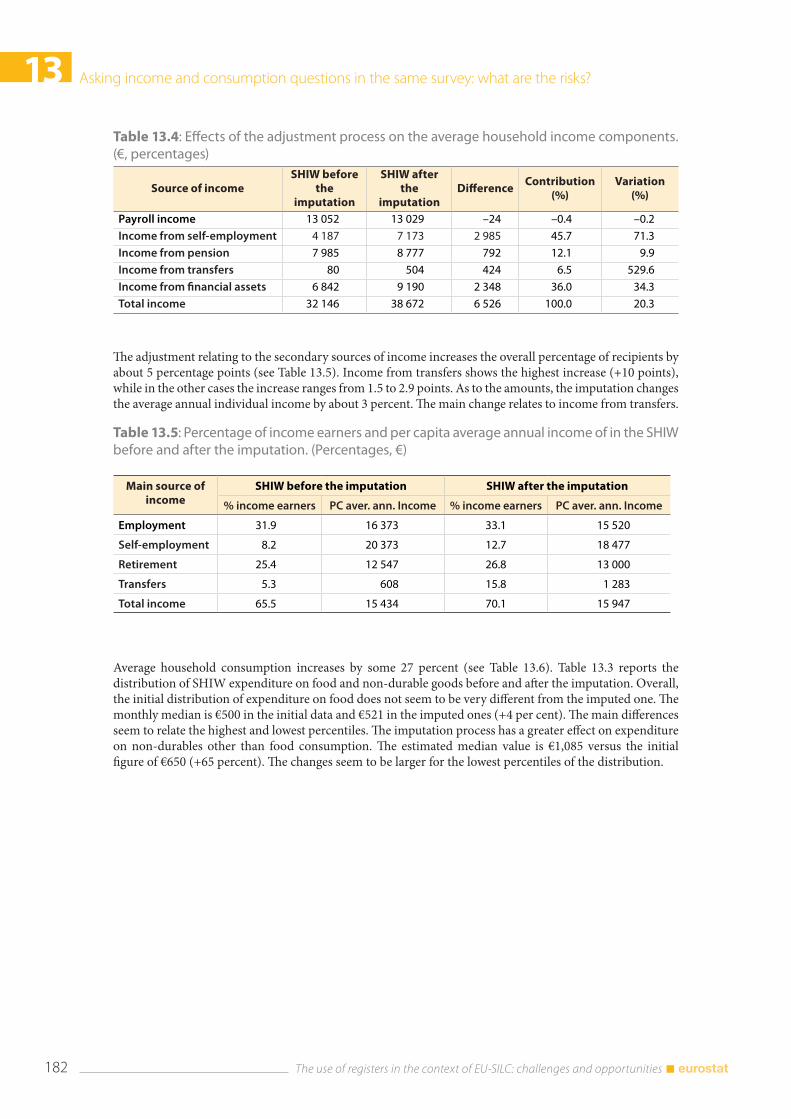
13 Asking income and consumption questions in the same survey: what are the risks?
The use of registers in the context of EU-SILC: challenges and opportunities 182
Table 13.4: Effects of the adjustment process on the average household income components.(€, percentages)
The adjustment relating to the secondary sources of income increases the overall percentage of recipients by about 5 percentage points (see Table 13.5). Income from transfers shows the highest increase (+10 points), while in the other cases the increase ranges from 1.5 to 2.9 points. As to the amounts, the imputation changes the average annual individual income by about 3 percent. The main change relates to income from transfers.
Source of incomeSHIW before
the imputation
SHIW after the
imputationDifference
Contribution (%)
Variation (%)
Payroll income 13 052 13 029 –24 –0.4 –0.2
Income from self-employment 4 187 7 173 2 985 45.7 71.3
Income from pension 7 985 8 777 792 12.1 9.9
Income from transfers 80 504 424 6.5 529.6
Income from financial assets 6 842 9 190 2 348 36.0 34.3
Total income 32 146 38 672 6 526 100.0 20.3
Table 13.5: Percentage of income earners and per capita average annual income of in the SHIW before and after the imputation. (Percentages, €)
Main source of income
SHIW before the imputation SHIW after the imputation
% income earners PC aver. ann. Income % income earners PC aver. ann. Income
Employment 31.9 16 373 33.1 15 520
Self-employment 8.2 20 373 12.7 18 477
Retirement 25.4 12 547 26.8 13 000
Transfers 5.3 608 15.8 1 283
Total income 65.5 15 434 70.1 15 947
Average household consumption increases by some 27 percent (see Table 13.6). Table 13.3 reports the distribution of SHIW expenditure on food and non-durable goods before and after the imputation. Overall, the initial distribution of expenditure on food does not seem to be very different from the imputed one. The monthly median is €500 in the initial data and €521 in the imputed ones (+4 per cent). The main differences seem to relate the highest and lowest percentiles. The imputation process has a greater effect on expenditure on non-durables other than food consumption. The estimated median value is €1,085 versus the initial figure of €650 (+65 percent). The changes seem to be larger for the lowest percentiles of the distribution.
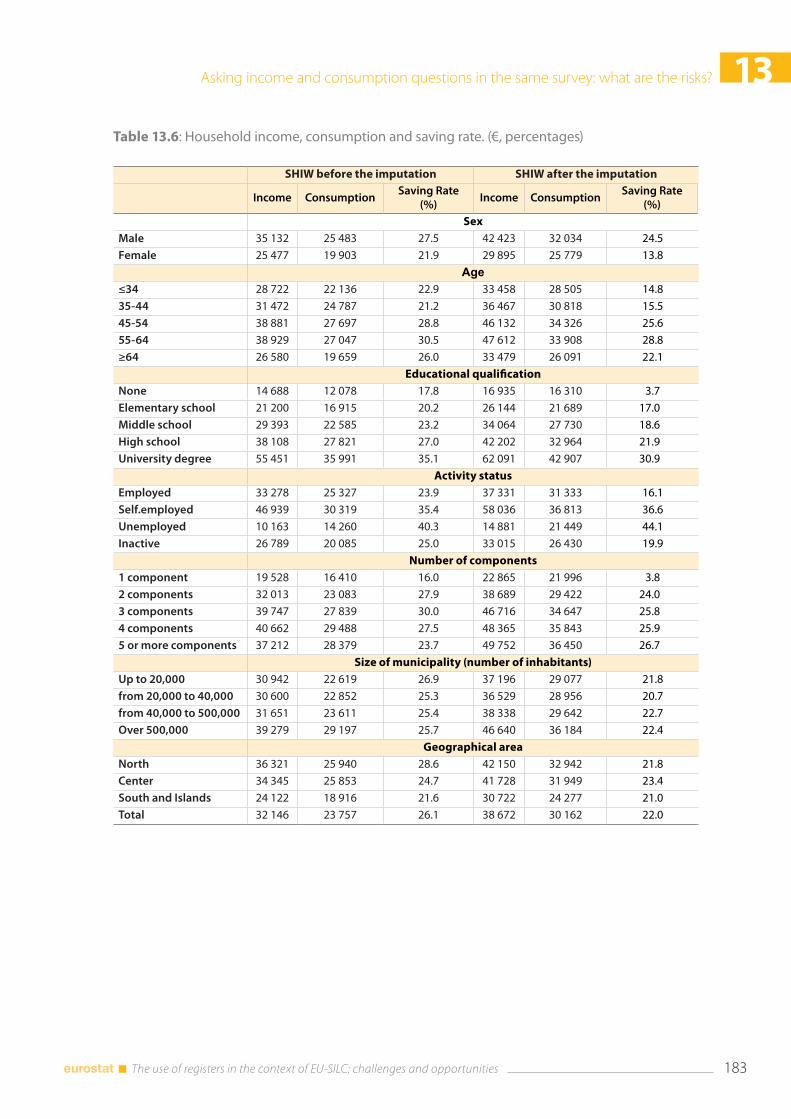
Asking income and consumption questions in the same survey: what are the risks? 13
183 The use of registers in the context of EU-SILC: challenges and opportunities
Table 13.6: Household income, consumption and saving rate. (€, percentages)
SHIW before the imputation SHIW after the imputation
Income ConsumptionSaving Rate
(%)Income Consumption
Saving Rate (%)
SexMale 35 132 25 483 27.5 42 423 32 034 24.5
Female 25 477 19 903 21.9 29 895 25 779 13.8
Age≤34 28 722 22 136 22.9 33 458 28 505 14.8
35-44 31 472 24 787 21.2 36 467 30 818 15.5
45-54 38 881 27 697 28.8 46 132 34 326 25.6
55-64 38 929 27 047 30.5 47 612 33 908 28.8
≥64 26 580 19 659 26.0 33 479 26 091 22.1
Educational qualificationNone 14 688 12 078 17.8 16 935 16 310 3.7
Elementary school 21 200 16 915 20.2 26 144 21 689 17.0
Middle school 29 393 22 585 23.2 34 064 27 730 18.6
High school 38 108 27 821 27.0 42 202 32 964 21.9
University degree 55 451 35 991 35.1 62 091 42 907 30.9
Activity statusEmployed 33 278 25 327 23.9 37 331 31 333 16.1
Self.employed 46 939 30 319 35.4 58 036 36 813 36.6
Unemployed 10 163 14 260 40.3 14 881 21 449 44.1
Inactive 26 789 20 085 25.0 33 015 26 430 19.9
Number of components1 component 19 528 16 410 16.0 22 865 21 996 3.8
2 components 32 013 23 083 27.9 38 689 29 422 24.0
3 components 39 747 27 839 30.0 46 716 34 647 25.8
4 components 40 662 29 488 27.5 48 365 35 843 25.9
5 or more components 37 212 28 379 23.7 49 752 36 450 26.7
Size of municipality (number of inhabitants)Up to 20,000 30 942 22 619 26.9 37 196 29 077 21.8
from 20,000 to 40,000 30 600 22 852 25.3 36 529 28 956 20.7
from 40,000 to 500,000 31 651 23 611 25.4 38 338 29 642 22.7
Over 500,000 39 279 29 197 25.7 46 640 36 184 22.4
Geographical areaNorth 36 321 25 940 28.6 42 150 32 942 21.8
Center 34 345 25 853 24.7 41 728 31 949 23.4
South and Islands 24 122 18 916 21.6 30 722 24 277 21.0
Total 32 146 23 757 26.1 38 672 30 162 22.0
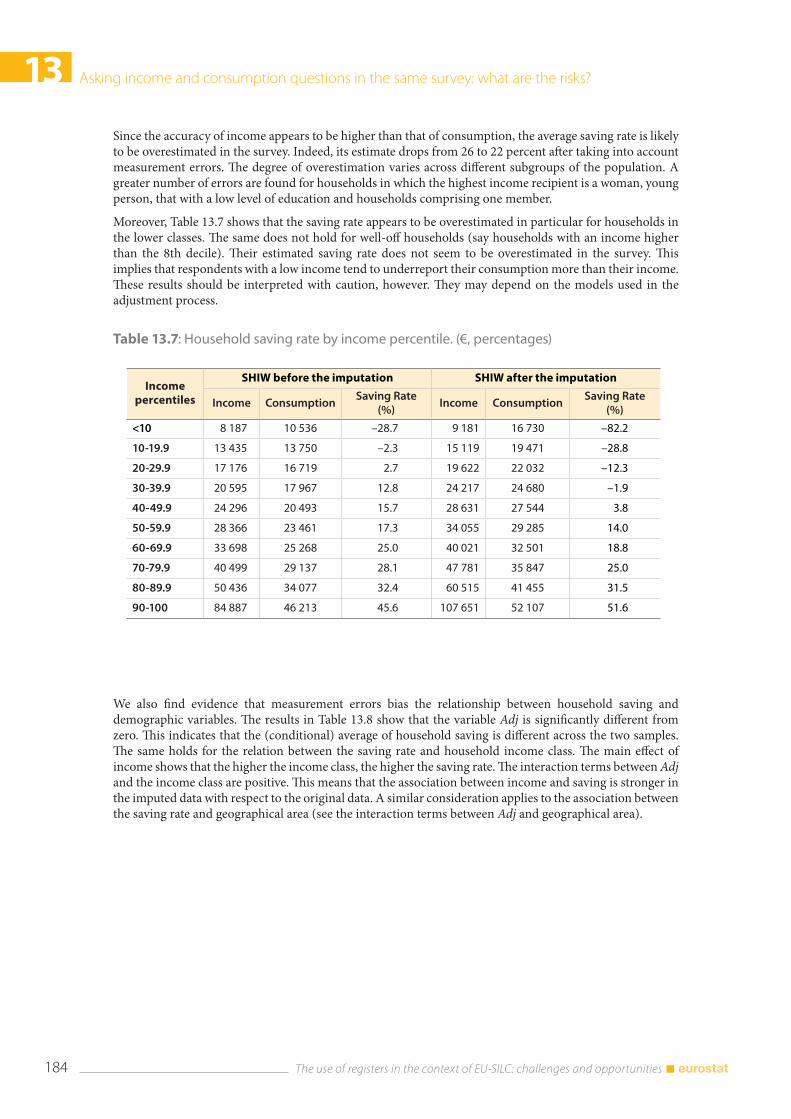
13 Asking income and consumption questions in the same survey: what are the risks?
The use of registers in the context of EU-SILC: challenges and opportunities 184
Since the accuracy of income appears to be higher than that of consumption, the average saving rate is likely to be overestimated in the survey. Indeed, its estimate drops from 26 to 22 percent after taking into account measurement errors. The degree of overestimation varies across different subgroups of the population. A greater number of errors are found for households in which the highest income recipient is a woman, young person, that with a low level of education and households comprising one member.
Moreover, Table 13.7 shows that the saving rate appears to be overestimated in particular for households in the lower classes. The same does not hold for well-off households (say households with an income higher than the 8th decile). Their estimated saving rate does not seem to be overestimated in the survey. This implies that respondents with a low income tend to underreport their consumption more than their income. These results should be interpreted with caution, however. They may depend on the models used in the adjustment process.
Table 13.7: Household saving rate by income percentile. (€, percentages)
Income percentiles
SHIW before the imputation SHIW after the imputation
Income ConsumptionSaving Rate
(%)Income Consumption
Saving Rate (%)
<10 8 187 10 536 –28.7 9 181 16 730 –82.2
10-19.9 13 435 13 750 –2.3 15 119 19 471 –28.8
20-29.9 17 176 16 719 2.7 19 622 22 032 –12.3
30-39.9 20 595 17 967 12.8 24 217 24 680 –1.9
40-49.9 24 296 20 493 15.7 28 631 27 544 3.8
50-59.9 28 366 23 461 17.3 34 055 29 285 14.0
60-69.9 33 698 25 268 25.0 40 021 32 501 18.8
70-79.9 40 499 29 137 28.1 47 781 35 847 25.0
80-89.9 50 436 34 077 32.4 60 515 41 455 31.5
90-100 84 887 46 213 45.6 107 651 52 107 51.6
We also find evidence that measurement errors bias the relationship between household saving and demographic variables. The results in Table 13.8 show that the variable Adj is significantly different from zero. This indicates that the (conditional) average of household saving is different across the two samples. The same holds for the relation between the saving rate and household income class. The main effect of income shows that the higher the income class, the higher the saving rate. The interaction terms between Adj and the income class are positive. This means that the association between income and saving is stronger in the imputed data with respect to the original data. A similar consideration applies to the association between the saving rate and geographical area (see the interaction terms between Adj and geographical area).
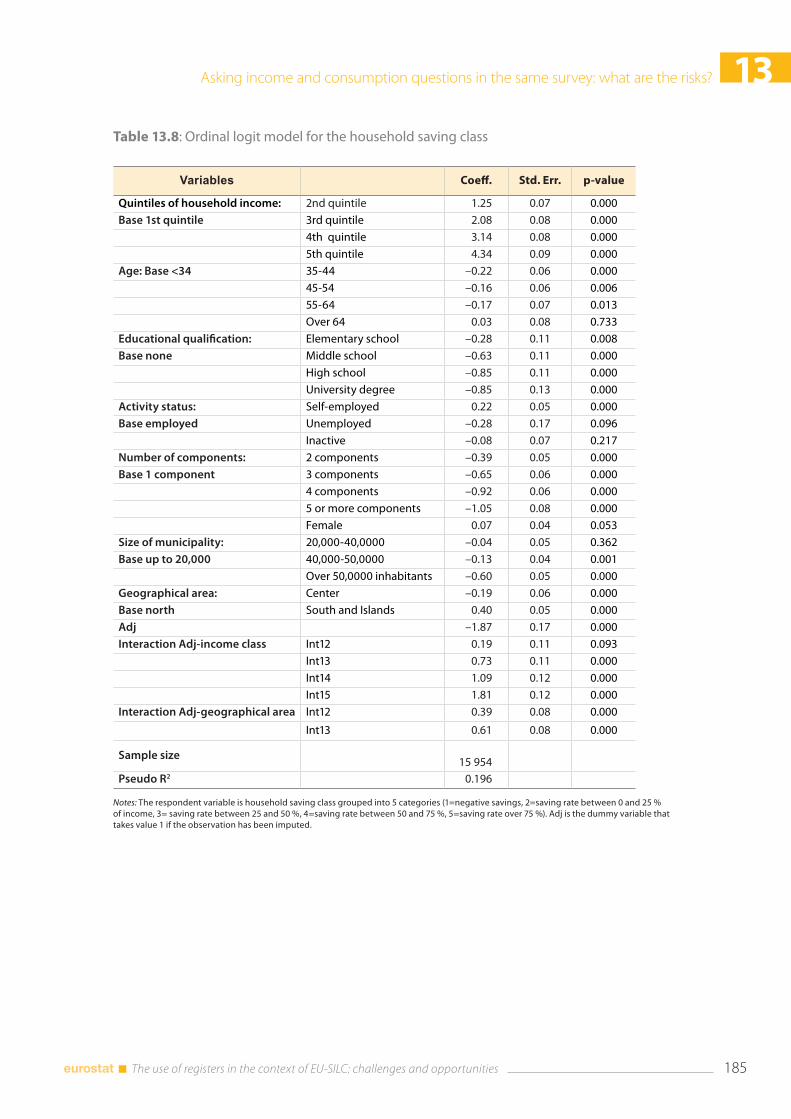
Asking income and consumption questions in the same survey: what are the risks? 13
185 The use of registers in the context of EU-SILC: challenges and opportunities
Table 13.8: Ordinal logit model for the household saving class
Variables Coeff. Std. Err. p-value
Quintiles of household income: 2nd quintile 1.25 0.07 0.000
Base 1st quintile 3rd quintile 2.08 0.08 0.000
4th quintile 3.14 0.08 0.000
5th quintile 4.34 0.09 0.000
Age: Base <34 35-44 –0.22 0.06 0.000
45-54 –0.16 0.06 0.006
55-64 –0.17 0.07 0.013
Over 64 0.03 0.08 0.733
Educational qualification: Elementary school –0.28 0.11 0.008
Base none Middle school –0.63 0.11 0.000
High school –0.85 0.11 0.000
University degree –0.85 0.13 0.000
Activity status: Self-employed 0.22 0.05 0.000
Base employed Unemployed –0.28 0.17 0.096
Inactive –0.08 0.07 0.217
Number of components: 2 components –0.39 0.05 0.000
Base 1 component 3 components –0.65 0.06 0.000
4 components –0.92 0.06 0.000
5 or more components –1.05 0.08 0.000
Female 0.07 0.04 0.053
Size of municipality: 20,000-40,0000 –0.04 0.05 0.362
Base up to 20,000 40,000-50,0000 –0.13 0.04 0.001
Over 50,0000 inhabitants –0.60 0.05 0.000
Geographical area: Center –0.19 0.06 0.000
Base north South and Islands 0.40 0.05 0.000
Adj –1.87 0.17 0.000
Interaction Adj-income class Int12 0.19 0.11 0.093
Int13 0.73 0.11 0.000
Int14 1.09 0.12 0.000
Int15 1.81 0.12 0.000
Interaction Adj-geographical area Int12 0.39 0.08 0.000
Int13 0.61 0.08 0.000
Sample size
15 954
Pseudo R2 0.196 Notes: The respondent variable is household saving class grouped into 5 categories (1=negative savings, 2=saving rate between 0 and 25 % of income, 3= saving rate between 25 and 50 %, 4=saving rate between 50 and 75 %, 5=saving rate over 75 %). Adj is the dummy variable that takes value 1 if the observation has been imputed.
13 Asking income and consumption questions in the same survey: what are the risks?
The use of registers in the context of EU-SILC: challenges and opportunities 186
13.5 Discussion and conclusionsIn this chapter, we discuss the consequences of asking questions on income and expenditure in the same survey. In particular, we try to assess what consequences a researcher could face, by assuming that the measurements of these two variables have the same accuracy. We use the SHIW survey which collects detailed information on income and some recall questions on total household expenditure.
Our first finding is that the underreporting of household expenditure appears to be higher than that of relating to household income. As a consequence, any survey-based estimate of saving rate is likely to be overestimated. This result goes in the expected direction, as the SHIW is mainly focused on income.
As to the total household expenditure, the main problems don’t stem from the measurement of food consumption. We find the distribution of food consumption expenditure to be in line with the one from a survey using the diary method. One main drawback of having a single recall question is that it leads to heaping and rounding. Respondents seem to be good at reporting their spending on food in a typical month, even though they are less likely to report exact amounts.
On the contrary, problems stem from asking a single recall question relating to the bulk of other non-durable expenditure. Even if in the SHIW survey some important items are excluded from the bulk question because they are inquired into separately, the question still seems to be overly general to provide accurate data. Indeed, the concept of non-durable expenditure is too complex to be measured by a single item. It includes a number of components such as clothing and footwear, housing, water, electricity, gas and other fuels, health, transport, communication, recreation and culture, education, restaurants and hotels, and so on. Without any specific indication of the items to be included, some respondents do not include some categories in their estimates of totals.
Another finding is that misreporting in income and in consumption seems to have a different association with the reported amounts. The higher the income declared by respondents, the higher the measurement error. For consumption we don’t find similar evidence.
We think this may for at least two reasons. First, consumption is probably a less sensitive topic than income. Wealthy households may be afraid of reporting all their true income, for instance because they think that fiscal authorities may request such information from the Bank of Italy and link it to tax records. For consumption it is less so, since this data is not generally used by fiscal authorities. Second, consumption may be more difficult to hide from an interviewer. The interview takes place in the household’s main residence. So interviewers can usually get an idea of the level of total expenditure of the respondent from the items they see in the house. Moreover they are trained to probe in case they feel that replies are clearly not compatible with what they see. Respondents know that and so it could be more difficult for them to underreport household expenditure substantially.
One important consequence of this finding is that household saving rates are likely to be overestimated, especially for low-income households. Since policy analysis usually focuses on poor households, the information from surveys should be interpreted with caution.
We also find evidence that the different level of accuracy of income and consumption items is also likely to bias the relationship between household saving and its correlates. This result suggests that researchers interested in households’ saving decisions should tackle measurement issues before jumping to any economic interpretations.
Our results have implications for data producers, also. The main one is that a single question asking about the total expenditure does not provide good quality data. We suggest to include, at least, a few questions on the main categories of spending before asking for the total. They could be selected from among those that are the most salient items according to the HBS survey. Besides helping respondents, this solution would also enable researchers to make a better matching between the SHIW and HBS surveys.
Another possibility could be to list precisely all the main items the respondent should think about in the wording of the question. This solution would offer two main advantages. First, it could help ensure that every respondent answers the same question. Second, it would help the respondent since he/she is likely to think of all the main items and then sum them up before answering. He/she is unlikely to known their total expenditure offhand. Of course, these speculations would call for some specific controlled experimental
Asking income and consumption questions in the same survey: what are the risks? 13
187 The use of registers in the context of EU-SILC: challenges and opportunities
study on the effects of using different questions in the quality of expenditure items.
Moreover, data producers should provide external users with clear information about the different level of accuracy of the two variables, in order to reduce the risk of misinterpretations. Indeed, not all the users are supposed to be familiar with measurement issues.
13.6 References Attanasio, O., Battistin, E. and Ichimura, H. (2004), ‘What really happened to consumption inequality in the US?’, Working Paper 10338, National Bureau of Economic Research.
Attanasio, O. and Weber. G. (2010), ‘Consumption and saving: Models of intertemporal allocation and their implications for public policy’, Journal of Economic Literature, 48(3):693-751.
Battistin, E. (2003), ‘Errors in survey reports of consumption expenditures’, IFS Working Papers, Institute for Fiscal Studies, W03/07.
Browning, M., Crossley, T. F. and Weber, G. (2003), ‘Asking consumption questions in general purpose surveys’, The Economic Journal, 113(491):540-567.
Cannari, L. and D’Alessio, G. (1993), ‘Non-Reporting and Under-Reporting Behaviour in the Bank of Italy’s Survey of Household Income and Wealth’, Bulletin of the International Statistics Institute, 65: 395-412.
Crossley, T. F. and Winter, J.K. (2012), ‘Asking households about expenditures: What have we learned?’ in ‘Improving the Measurement of Consumer Expenditures’, NBER Chapters, National Bureau of Economic Research.
D’Aurizio, L., Faiella, I., Iezzi, S. and Neri, A. (2006), ‘The under-reporting of financial wealth in the survey on household income and wealth’, Temi di discussione (Working papers, Bank of Italy, Economic Research Department, 610.
Fowler, F.J. Jr. (1995), Improving Survey Questions: Design and Evaluation: Applied Social Research Methods, SAGE Publications, Thousand Oaks.
Kan, M.Y. and Pudney, S. (2008), ‘Measurement error in stylized and diary data on time use’, Sociological Methodology.
Krosnick, J. A. and Presser, S. (2010), ‘Questionnaire design’, in Wright, J. D. and Marsden, P.V, (editors), Handbook of Survey Research (Second Edition), CA: Elsevier, San Diego.
Moore, J.C., Stinson, L.L. and Welniak, E.J. (2000), ‘Income measurement error in surveys: a Review’, Journal of Official Statistics, 16:331-361.
Neri, A. and Zizza, R. (2010), ‘Income reporting behaviour in sample surveys’, Temi di discussione (Working papers), Bank of Italy, Economic Research Department, 777.
Pedace, R. and Bates, N. (2000), ‘Using administrative records to assess earnings reporting error in the survey of income and program participation’, Journal of Economic and Social Measurement, 26:173-192.
Pissarides, C. A. and Weber, G. (1989), ‘An expenditure-based estimate of Britain’s black economy’, Journal of Public Economics, 39(1):17-32.
Pudney, S. (2008), ‘Heaping and leaping: survey response behaviour and the dynamics of self-reported consumption expenditure’, ISER Working Paper Series, Institute for Social and Economic Research.
Rosenbaum, P.R. and Rubin, D.R. (1983), ‘The central role of the propensity score in observational studies for causal effects’, Biometrika, 40(1):41-55.
Tourangeau, R. and Yan, T. (2007), ‘Sensitive questions in surveys’, Psychological Bulletin, 133(5).

Cross-validating administrative and survey datasets through micro-simulation in Luxembourg 14
189 The use of registers in the context of EU-SILC: challenges and opportunities
14. Cross-validating administrative and survey datasets through microsimulation in Luxembourg
Philippe Liégeois, Frédéric Berger, Nizamul Islam and Raymond Wagener(1)
Abstract: This chapter assesses the reliability of tax-benefit microsimulation based on survey and administrative data, using Luxembourg as a case study. The Luxembourg household panel (PSELL) is the basis of the Luxembourg EU-SILC dataset, and is also the basis for the main tax-benefit microsimulation model in Luxembourg. The survey’s relatively small size raises concerns regarding the reliability and robustness. The newly launched Luxembourg Social Security Data Warehouse based upon administrative data relating to the year 2003 can now be used as a potential alternative data source for microsimulation purposes. This chapter conducts extensive cross-validation of both data sources to examine their robustness and reliability. The survey database performs reasonably well in capturing the relevant characteristics of the resident population and allows analyses with respect to characteristics not found in the administrative database, and vice versa. The shapes of the equivalised income distributions broadly coincide but, we do observe a few important discrepancies at the extremes of the curves. Finally, through use of the EUROMOD microsimulation platform, we are able to show that the discrepancies observed between these income data sources are insufficient to significantly affect the conclusions drawn from analysis of policy alternatives.
14.1 IntroductionThe Luxembourg household panel (PSELL)(2) is used as a basis for the wider European Union Statistics on Income and Living Conditions (EU-SILC)(3) survey, and has for a number of years underpinned the microsimulation-based tax-benefit analysis of social policies in Luxembourg. However, the survey’s relatively small sample size necessarily raises concerns regarding the reliability and robustness of the data collected and of analyses based upon them. Recently the first operational dataset from the newly launched Luxembourg Social Security Data Warehouse was released, based upon administrative data relating to the year 2003. This provides a potential alternative data source for microsimulation purposes.
Unfortunately, administrative data have some obvious limitations compared to survey data. In general, the former records only information needed for administrative purposes such as social contributions or social benefits payments, whereas the questionnaires used for survey data may be designed specifically for defined research purposes, including a need for standardisation and comparability between countries (see Figari et al., 2007). For example, the PSELL survey data offer detailed information on incomes, family relationships, and other socio-economic dimensions. On the other hand, the kind of administrative data provided by the Luxembourg Social Security Data Warehouse offers some important advantages over survey data, including completeness, timeliness, and the availability of time series data of different granularity, such as yearly or monthly data. Moreover, administrative data include some information not available in survey data, for example in relation to health and long-term care, cross-border workers and so on.
As the reliability of each dataset, either administrative or survey-based, seems difficult to assess directly, we concentrate instead upon cross-validating the two data sources. In so far as both datasets are shown to be
(1) Liegeois, Berger and Islam are researchers at CEPS/INSTEAD and Wagener is director of the ‘Inspection Générale de la Sécurité Sociale’ (IGSS) in Luxembourg. This research is part of the REDIS project funded by the Luxembourg National Research Fund under Grant FNR/06/28/19. This chapter is a summarised version of “Cross-validating administrative and survey datasets through microsimulation” published in the International Journal of Microsimulation (2011, 4(1), 1-18) and has been supported by the second Network for the analysis of EU-SILC (Net-SILC2), funded by Eurostat. The European Commission bears no responsibility for the analyses and conclusions, which are solely those of the authors. Email address for correspondence: [email protected].
(2) Panel Socio-Economique Liewen zu Lëtzebuerg (see http://www.ceps.lu).
(3) EU-SILC is an instrument aiming at collecting timely and comparable cross-sectional and longitudinal multidimensional microdata on income, poverty, social exclusion and living conditions (see http://epp.eurostat.ec.europa.eu/portal/page/portal/microdata/eu_silc).
14 Cross-validating administrative and survey datasets through micro-simulation in Luxembourg
The use of registers in the context of EU-SILC: challenges and opportunities 190
broadly comparable, this cross-validation exercise will help improve confidence in both datasets.
The principal motivation for this chapter, therefore, is to assess the reliability of tax-benefit microsimulations based upon survey and administrative data, using Luxembourg as a case study. Given the difficulty of this undertaking, a second motivation is to offer a methodological template to others facing a similar challenge in their own local context. For examples of comparisons of survey (interview) and administrative (register) data, see Nordberg (2003) and Nordberg and Penttilä (2001), for Finland. Contrary to these authors, we situate the analysis in a microsimulation perspective.
This chapter is a summarised version of Liégeois, Islam, Berger and Wagener (2011), referred henceforth as the “background paper”. It is organised as follows. Section 14.2 describes the setting up of the datasets and points out the difficulty in making them as comparable as possible ex ante for a more sensible cross-validation ex post. The two datasets are compared in Section 14.3. Finally, Section 14.4 presents conclusions.
14.2 Setting up the datasets for comparisonLuxembourg, as a partner in the EUROMOD and MICRESA projects, uses the EUROMOD model, up to now based on the Luxembourg household panel data but here ‘extended’ so that it is alternatively served by administrative data. The EUROMOD static microsimulation model(4) has been adopted as it allows us to easily derive the equivalised disposable income of households (a key instrument for the comparison of monetary characteristics) through an effective and consistent implementation of the structure of the population, the distribution of earnings, and the tax-benefit system. EUROMOD, like other microsimulation models, relies on microdata representative of a population (households and individuals).
In this section of the chapter, we first introduce the main characteristics of the two alternative ‘input’ datasets and their initial set-up to conform with the EUROMOD input framework (Sections 14.2.1 and 14.2.2). Following this, we consider the adaptations needed for making them as comparable as possible (e.g., in terms of the target population and income components involved) and the implications of the methodological choices made (Section 14.2.3).
14.2.1 PSELL survey data
For this chapter, the sample survey we use is PSELL version 3/2004 covering income reference year 2003 (PSELL3). This sample survey provides a representative but stratified random sample of approximately 3 600 private households (9 800 individuals) resident in Luxembourg (‘international civil servants’ included). Institutional households (mainly elderly people residing in institutions) are not covered by the survey. The unit of analysis is the ‘resident household’ (people living in the same house). The data collection method is face-to-face interview. Information about all types of gross earnings are collected through the survey, including labour income, investment and property income, social benefits in cash, private transfers, etc.
PSELL3 survey weights are determined taking into account non–response patterns (see Section 14.3.4) and calibrating them to external control distributions. Non-response is controlled using the variables gender, age, citizenship, activity status, type of health insurance, and marital status of the ‘reference person’ of the household. Calibration relies on ‘updated information’ from the last census (2001). At the household level, the variables concerned are the household type (a typology based on the age of members of the household and size of the household), the tenure status of the head, and a geographical criterion. At the individual level, the variables include gender, age and citizenship.
14.2.2 SSDW administrative data
Our source of administrative data is the Social Security Data Warehouse (SSDW), recently set up by the Inspection Générale de la Sécurité Sociale (IGSS) administration in Luxembourg. The main objective of
(4) https://www.iser.essex.ac.uk/euromod.
Cross-validating administrative and survey datasets through micro-simulation in Luxembourg 14
191 The use of registers in the context of EU-SILC: challenges and opportunities
the Data Warehouse is to compose a normalised and exhaustive basis for the generation of statistics serving diversified purposes (general reports, OECD, etc.). The basic unit is the individual. Administrative data, exhaustive in their universe of definition, are related neither to a sampling process nor to high non-response rates that require weighting and imputation on the survey data side. However, they are not error free.
One omission in the SSDW is a lack of data from the fiscal administration. Instead the IGSS administration provides the information on labour earnings required to calculate the social contributions paid either by the employer, or by the earner when self-employed or socially insured on a voluntary basis. This results in three limitations concerning SSDW income data. First, in Luxembourg wages ‘declared’ to the social security administration are allowed to be truncated when greater than seven times the Minimum Social Wage(5). As a result, labour earnings may be truncated for high wages. Second, the declared earnings of persons paying social contributions on a voluntary basis may be far from their real level. Third, on the basis of the data available, farmers’ income cannot be properly determined. In addition to those limitations, the SSDW contains no information concerning capital income and private transfers.
Within the SSDW, ‘families’ are constructed on a ‘fiscal basis’. ‘Resident households’, which are the unit of analysis in PSELL3, cannot be identified. Instead, an alternative form of ‘fiscal household’ must be constructed. First, spouses(6) are identified as a foundation for the household. This means that unmarried cohabitants do not appear as linked in the database (they belong to different fiscal households); this conforms to fiscal rules, which are briefly described in the Appendix. Second, a link is created between parents and their ‘children’ (in essence, those who are unmarried and either younger than 21; or older but still a student or disabled) through the family benefits raised by the former during the year(7).
For the purposes of this chapter, only persons recorded as having positive earnings (income or allowance), plus the voluntarily insured or co-insured, have been extracted from the SSDW. One implication is that ‘international civil servants’ residing in Luxembourg may not appear in the EUROMOD input database (because they usually neither contribute to, nor benefit from, in monetary terms, the social security system in Luxembourg). In addition, in conformity with the PSELL3 database, only residents are included(8). We thereby exclude all non-resident cross-border workers, despite the fact that they represent as much as 37 % of total employment in 2003(9); a level which is a particularity of Luxembourg (hence their importance in relation to the tax-benefit system). Finally, because it is impossible to identify people living in institutional households in the SSDW, they are included in SSDW data extract (but not in PSELL3). The net result is that the administrative data extracted from the SSDW for the year 2003 contains observations on 449 000 residents.
14.2.3 Improving comparability of the datasets
To permit cross-validation of the two input datasets, it is important to eliminate identifiable dissimilarities between them with regard to their respective populations and the lack of precision in some important (income-related) variables. Table 14.1 summarises the problem and provides insight about complementary adaptations that are needed for an ex ante better comparability of the survey and administrative datasets. We can see, for example, that capital income has to be dropped from the survey-based data because no information is available about such an income in the administrative-based data. Keeping capital income on one side only would bias our results and weaken comparability of outcomes.
Individuals receiving an income from agriculture are also dropped from both datasets, again to enhance comparability, because in the administrative-based dataset there is an imperfect link between the contents of the income variable and the reality of earnings.
(5) Minimum Social Wage = €1368.74 per month as of 1 January 2003.
(6) Either married all through the year or married during the (civil) year, or divorced during the year.
(7) If unmarried parents, the child goes to his mother’s household, unless there is an explicit demand from the mother to link the child with his father concerning the family benefits. If born during the year or when family benefits come to an end during the (civil) year, a child is still linked to the household of his parent(s).
(8) Information for non-residents is partially available in the Data Warehouse.
(9) STATEC - National statistical institute of Luxembourg (http://www.statistiques.public.lu).
14 Cross-validating administrative and survey datasets through micro-simulation in Luxembourg
The use of registers in the context of EU-SILC: challenges and opportunities 192
In all cases, when individuals are dropped, all members of the household are dropped as well in order to avoid bias due to a change in the structure of the household, a bias that might be transferred downstream.
When comparing monetary characteristics, the ‘equivalised disposable income’ of households will play a crucial role. As is well known, the equivalised disposable income(10) is the ratio of total disposable income(11) to the equivalent number of persons in the household (based on the ‘OECD-modified scale’). The equivalised disposable income (which from now on will be ‘called’ ‘equivalised income’ for short) is evaluated at the household level. Each member of the household is then attributed this (common) value of equivalised income.
Usually in the literature, the ‘resident’ household matters rather than the ‘fiscal’ one. Departing from this, we work with fiscal households, whether they are in survey-based or administrative-based data. This may generate some discrepancies between our results and the results based on (as they usually are) resident households (see Section 2.3 of the background paper for more details). Moreover, as stated by Burkhauser et al. (2012) in a dynamic perspective, “this choice carries significant implications for assessing income trends. Focusing on tax units rather than households greatly reduces measured growth in middle class income”. This does not prevent us from comparing datasets based on fiscal households; yet, in a dynamic perspective, economic conclusions derived from each dataset would be sensitive to the present methodological choice (constraint).
(10) For a detailed presentation of social indicators, see Atkinson et al. (2002) and Marlier et al. (2007).
(11) Total disposable income = (earnings – social contributions – taxes + social benefits) summed up for all members of the household.
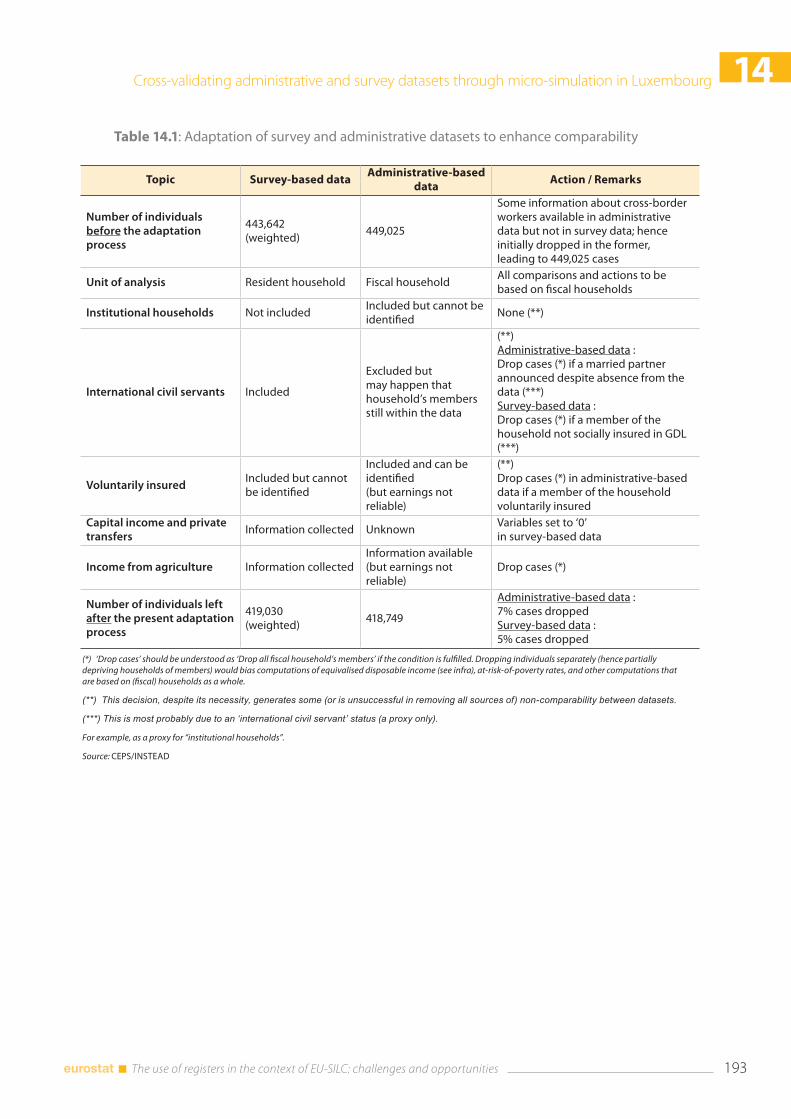
Cross-validating administrative and survey datasets through micro-simulation in Luxembourg 14
193 The use of registers in the context of EU-SILC: challenges and opportunities
Table 14.1: Adaptation of survey and administrative datasets to enhance comparability
Topic Survey-based dataAdministrative-based
dataAction / Remarks
Number of individuals before the adaptation process
443,642(weighted)
449,025
Some information about cross-border workers available in administrative data but not in survey data; hence initially dropped in the former, leading to 449,025 cases
Unit of analysis Resident household Fiscal householdAll comparisons and actions to be based on fiscal households
Institutional households Not included Included but cannot be identified
None (**)
International civil servants Included
Excluded but may happen that household’s members still within the data
(**)Administrative-based data :Drop cases (*) if a married partner announced despite absence from the data (***)Survey-based data :Drop cases (*) if a member of the household not socially insured in GDL (***)
Voluntarily insuredIncluded but cannot be identified
Included and can be identified(but earnings not reliable)
(**)Drop cases (*) in administrative-based data if a member of the household voluntarily insured
Capital income and private transfers
Information collected UnknownVariables set to ‘0’ in survey-based data
Income from agriculture Information collectedInformation available(but earnings not reliable)
Drop cases (*)
Number of individuals left after the present adaptation process
419,030(weighted)
418,749
Administrative-based data :7% cases dropped Survey-based data :5% cases dropped
(*) ‘Drop cases’ should be understood as ‘Drop all fiscal household’s members’ if the condition is fulfilled. Dropping individuals separately (hence partially depriving households of members) would bias computations of equivalised disposable income (see infra), at-risk-of-poverty rates, and other computations that are based on (fiscal) households as a whole.
(**) This decision, despite its necessity, generates some (or is unsuccessful in removing all sources of) non-comparability between datasets.
(***) This is most probably due to an ‘international civil servant’ status (a proxy only).
For example, as a proxy for “institutional households”.
Source: CEPS/INSTEAD
14 Cross-validating administrative and survey datasets through micro-simulation in Luxembourg
The use of registers in the context of EU-SILC: challenges and opportunities 194
14.3 Cross-validating survey and administrative dataThe process of harmonising coverage and variable definitions results in two alternative input datasets, one survey-based, one administrative-based, made as comparable as possible ex ante. The next step is to undertake a range of comparisons aimed at cross-validating the two datasets.
We first analyse important non-monetary variables relating to households and individuals (Section 14.3.1). Then, individual monetary dimensions are considered (Section 14.3.2). As the sampling process and weights on the survey-based data side incorporate controls for various demographic characteristics (both at household and individual levels), the present cross-validation put more emphasis on such monetary characteristics. Then the distributions of equivalised income are considered and inequality indicators introduced (Section 14.3.3). Finally, the outcomes of microsimulations based upon the two alternative input datasets are considered (Section 14.3.4).
14.3.1 Non-monetary characteristics at the household and individual levels
Table 14.2 compares selected measures for which the household is the unit of analysis. Differences attributable to the switch from resident to fiscal households are identified by presenting results from the survey data on both a resident and a fiscal household basis.
As one can see in Table 14.2, the weighted results from the harmonised survey dataset are ‘representative’ of a population of 169 620 resident households or, through the splitting procedure, 205 802 fiscal households. The higher number of fiscal households is to be expected, as nineteen per cent of resident households contain two or more fiscal households. For the same reason a higher percentage of fiscal households comprise only one person (47 %) than resident households (30 %).
Therefore, Table 14.2 shows how close the survey-based data are to administrative-based data, despite the ex-ante difference in source data. Of course, a partial reason for the similarity in results is the adaptation/ selection procedure described in Section 14.2. Moreover, the weighting process of the survey data is itself based on administrative data sources partially overlapping our administrative-based dataset (see Section 14.2.1). Even so, this is not a priori a guarantee for comparability at the level of fiscal households, bearing in mind issues for which full harmonisation was not possible and the relatively small survey sample size. For this reason the level of agreement between survey-based and administrative-based data sources is, in this case, reassuring.
It can also be shown that, when considering non-monetary characteristics at the individual level (gender, age, etc.) one observes once again strong similarities between the two datasets (see Section 3.2 of the background paper).
14.3.2 Individual level: monetary characteristics (average)
To an extent the similarity in non-monetary survey and administrative measures presented in Table 14.2, whilst reassuring, is perhaps relatively unsurprising, given that harmonisation focused upon comparability of population coverage and the weighting of survey data to known (administratively recorded) socio-demographic totals. More challenging, and of more interest, is the comparison and cross-validation of monetary measures, none of which have been directly controlled as part of the harmonisation process.
As a starting point for this cross-validation, Table 14.3 focuses on differences in the mean and median values of the main income components. This comparison reveals that, at an individual level, the mean ‘primary income’ (see notes to Table 14.3) recorded in the administrative dataset is 7.3 % lower than that recorded in the survey dataset. A search for further explanations reveals that this difference appears to be mainly due to a discrepancy in recorded employment income (about 90 % of primary income, excluding capital income), which is 9 % higher in the survey than in the administrative records. Interestingly, Nordberg (2003), using Finnish data, finds a recorded level of ‘earned income’ (conceptually similar to our ‘primary income’) lower for register data in 1995 but higher in 1999.
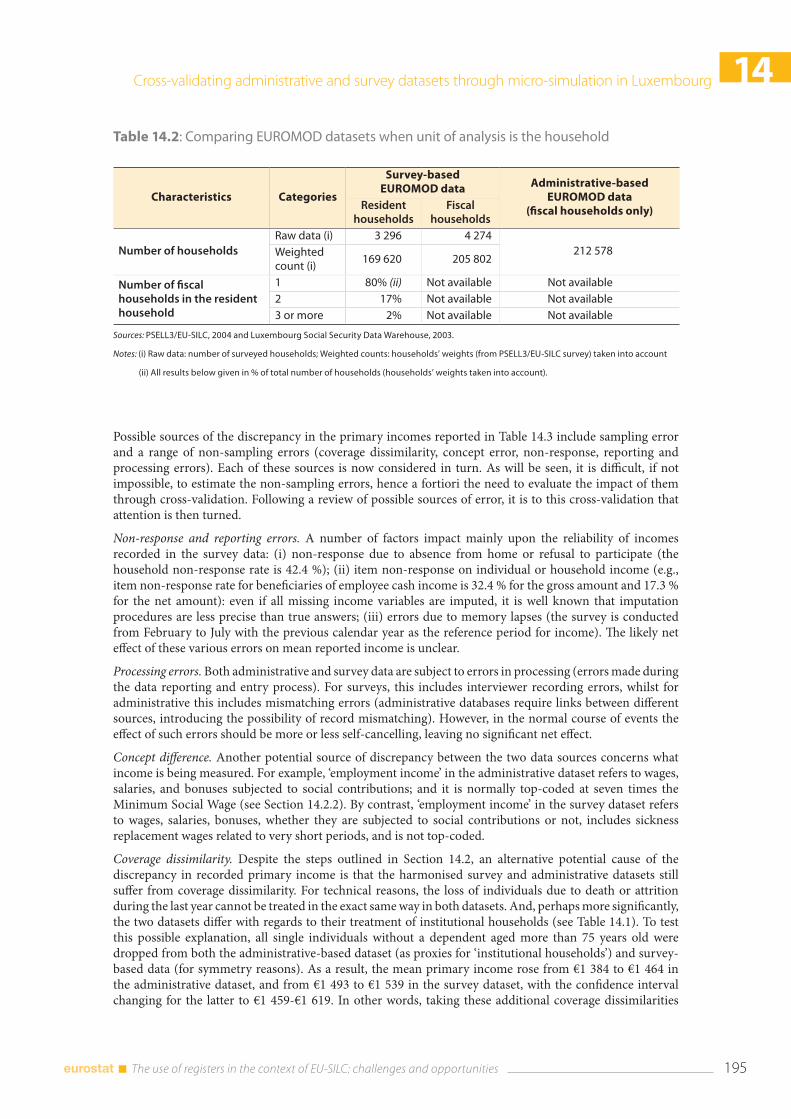
Cross-validating administrative and survey datasets through micro-simulation in Luxembourg 14
195 The use of registers in the context of EU-SILC: challenges and opportunities
Possible sources of the discrepancy in the primary incomes reported in Table 14.3 include sampling error and a range of non-sampling errors (coverage dissimilarity, concept error, non-response, reporting and processing errors). Each of these sources is now considered in turn. As will be seen, it is difficult, if not impossible, to estimate the non-sampling errors, hence a fortiori the need to evaluate the impact of them through cross-validation. Following a review of possible sources of error, it is to this cross-validation that attention is then turned.
Non-response and reporting errors. A number of factors impact mainly upon the reliability of incomes recorded in the survey data: (i) non-response due to absence from home or refusal to participate (the household non-response rate is 42.4 %); (ii) item non-response on individual or household income (e.g., item non-response rate for beneficiaries of employee cash income is 32.4 % for the gross amount and 17.3 % for the net amount): even if all missing income variables are imputed, it is well known that imputation procedures are less precise than true answers; (iii) errors due to memory lapses (the survey is conducted from February to July with the previous calendar year as the reference period for income). The likely net effect of these various errors on mean reported income is unclear.
Processing errors. Both administrative and survey data are subject to errors in processing (errors made during the data reporting and entry process). For surveys, this includes interviewer recording errors, whilst for administrative this includes mismatching errors (administrative databases require links between different sources, introducing the possibility of record mismatching). However, in the normal course of events the effect of such errors should be more or less self-cancelling, leaving no significant net effect.
Concept difference. Another potential source of discrepancy between the two data sources concerns what income is being measured. For example, ‘employment income’ in the administrative dataset refers to wages, salaries, and bonuses subjected to social contributions; and it is normally top-coded at seven times the Minimum Social Wage (see Section 14.2.2). By contrast, ‘employment income’ in the survey dataset refers to wages, salaries, bonuses, whether they are subjected to social contributions or not, includes sickness replacement wages related to very short periods, and is not top-coded.
Coverage dissimilarity. Despite the steps outlined in Section 14.2, an alternative potential cause of the discrepancy in recorded primary income is that the harmonised survey and administrative datasets still suffer from coverage dissimilarity. For technical reasons, the loss of individuals due to death or attrition during the last year cannot be treated in the exact same way in both datasets. And, perhaps more significantly, the two datasets differ with regards to their treatment of institutional households (see Table 14.1). To test this possible explanation, all single individuals without a dependent aged more than 75 years old were dropped from both the administrative-based dataset (as proxies for ‘institutional households’) and survey-based data (for symmetry reasons). As a result, the mean primary income rose from €1 384 to €1 464 in the administrative dataset, and from €1 493 to €1 539 in the survey dataset, with the confidence interval changing for the latter to €1 459-€1 619. In other words, taking these additional coverage dissimilarities
Table 14.2: Comparing EUROMOD datasets when unit of analysis is the household
Characteristics Categories
Survey-based EUROMOD data Administrative-based
EUROMOD data (fiscal households only)Resident
householdsFiscal
households
Number of householdsRaw data (i) 3 296 4 274
212 578Weighted count (i)
169 620 205 802
Number of fiscal households in the resident household
1 80% (ii) Not available Not available2 17% Not available Not available3 or more 2% Not available Not available
Sources: PSELL3/EU-SILC, 2004 and Luxembourg Social Security Data Warehouse, 2003.
Notes: (i) Raw data: number of surveyed households; Weighted counts: households’ weights (from PSELL3/EU-SILC survey) taken into account
(ii) All results below given in % of total number of households (households’ weights taken into account).
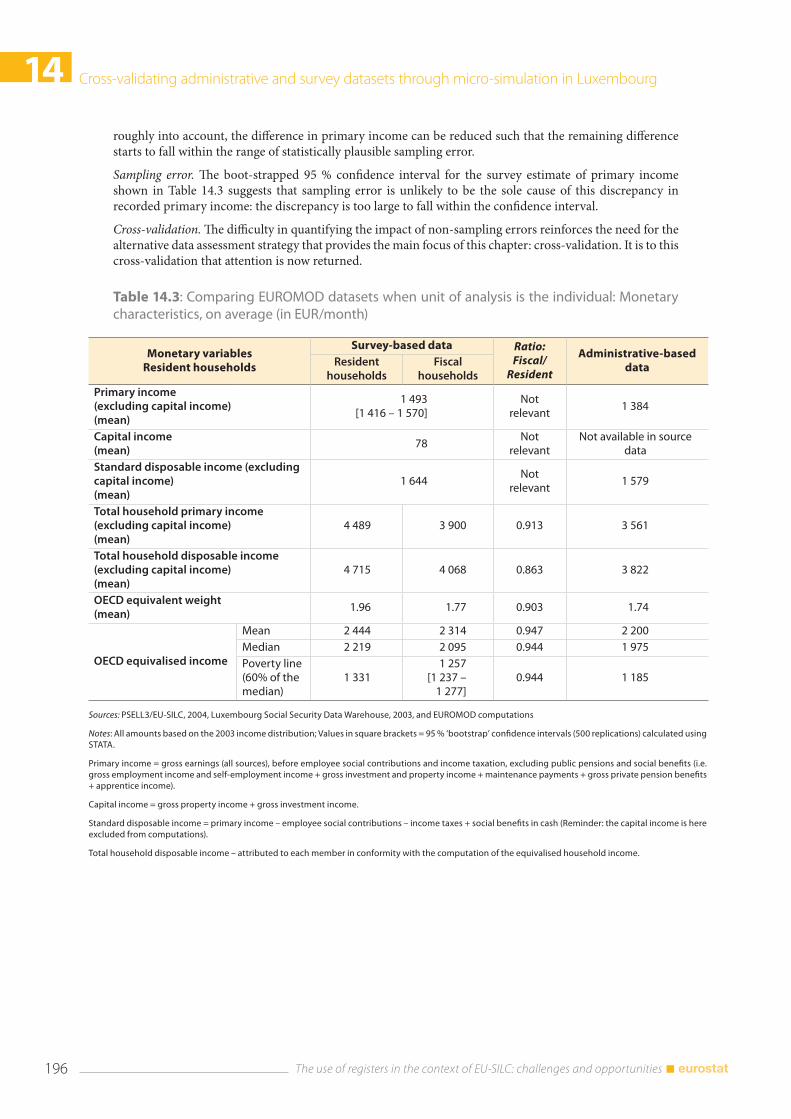
14 Cross-validating administrative and survey datasets through micro-simulation in Luxembourg
The use of registers in the context of EU-SILC: challenges and opportunities 196
roughly into account, the difference in primary income can be reduced such that the remaining difference starts to fall within the range of statistically plausible sampling error.
Sampling error. The boot-strapped 95 % confidence interval for the survey estimate of primary income shown in Table 14.3 suggests that sampling error is unlikely to be the sole cause of this discrepancy in recorded primary income: the discrepancy is too large to fall within the confidence interval.
Cross-validation. The difficulty in quantifying the impact of non-sampling errors reinforces the need for the alternative data assessment strategy that provides the main focus of this chapter: cross-validation. It is to this cross-validation that attention is now returned.
Table 14.3: Comparing EUROMOD datasets when unit of analysis is the individual: Monetary characteristics, on average (in EUR/month)
Monetary variablesResident households
Survey-based data Ratio:Fiscal/
Resident
Administrative-based dataResident
householdsFiscal
householdsPrimary income (excluding capital income) (mean)
1 493 [1 416 – 1 570]
Notrelevant
1 384
Capital income (mean)
78Not
relevantNot available in source
dataStandard disposable income (excluding capital income) (mean)
1 644Not
relevant1 579
Total household primary income (excluding capital income) (mean)
4 489 3 900 0.913 3 561
Total household disposable income (excluding capital income) (mean)
4 715 4 068 0.863 3 822
OECD equivalent weight (mean)
1.96 1.77 0.903 1.74
OECD equivalised income
Mean 2 444 2 314 0.947 2 200Median 2 219 2 095 0.944 1 975Poverty line (60% of the median)
1 3311 257
[1 237 – 1 277]
0.944 1 185
Sources: PSELL3/EU-SILC, 2004, Luxembourg Social Security Data Warehouse, 2003, and EUROMOD computations
Notes: All amounts based on the 2003 income distribution; Values in square brackets = 95 % ‘bootstrap’ confidence intervals (500 replications) calculated using STATA.
Primary income = gross earnings (all sources), before employee social contributions and income taxation, excluding public pensions and social benefits (i.e. gross employment income and self-employment income + gross investment and property income + maintenance payments + gross private pension benefits + apprentice income).
Capital income = gross property income + gross investment income.
Standard disposable income = primary income – employee social contributions – income taxes + social benefits in cash (Reminder: the capital income is here excluded from computations).
Total household disposable income – attributed to each member in conformity with the computation of the equivalised household income.
Cross-validating administrative and survey datasets through micro-simulation in Luxembourg 14
197 The use of registers in the context of EU-SILC: challenges and opportunities
It has already been observed that there is a 7.3 % difference in the primary income recorded in survey and administrative datasets. This gap in primary income is transferred downstream throughout the tax-benefit system (see Table 14.3). In principle, information on these downstream effects is at least partially available directly from the input datasets. However, direct comparison of these downstream values raises additional questions regarding variability in take-up rates as observed in administrative-based and survey-based data. Instead, using EUROMOD, social security contributions, family allowances, social assistance and taxes have been determined via microsimulation, and disposable as well as equivalised incomes derived.
The resulting survey-based estimate of the mean OECD-equivalised fiscal-household income is €2 314 per month. The comparable value, derived using EUROMOD from the administrative dataset, is €2 200, which is 4.9 % lower (median: 5.7 % lower). The gap has then been reduced, compared to the initial difference in primary income. This is partly due to the tax system which dampens inequalities, as can be seen for example from the total household ‘primary’ income versus ‘disposable’ income (8.7 % of difference for the former, 6.0 % only of the latter). In other words, the progressive nature of the tax system reduces downstream differences. But the equivalisation also plays a role, with a mean ‘weight’ lower through administrative data compared to survey data (–1.7 %), on average.
As might be expected, switching the unit of analysis from fiscal to resident household increases the mean household disposable income by 15.9 % and the mean OECD equivalisation weight by 11.1 %, for reasons explored in Section 2.3 of the background paper. Consequently, the mean equivalised income increases by 5.6 %.
In summary, there are clear differences in the levels of pre-tax income recorded in the SSDW administrative data and PSELL3 survey data. These differences can be explained at least in part by known non-sampling errors not controlled for as part of our data harmonisation strategy. These differences remain, but reduce in size, when considering post-tax and post-equivalisation incomes.
14.3.3 Individual level: monetary characteristics (distributional)
Section 14.3.2 focused on estimates of average monetary values. We now turn our attention to the distribution of equivalised income. Unlike average values, synthetic measurements of inequalities do not differ too much between the datasets. A balanced indicator like the Gini coefficient is statistically compatible when derived from the survey-based data (0.245, confidence interval [0.238 – 0.251]) with the one resulting from administrative-based data (0.248). This is also true for the interquartile or interdecile ratios. The value of the more targeted Atkinson index is also close to being statistically compatible ([0.045 – 0.050] through survey-based data, 0.051 if administrative-based data) when the aversion to inequality is low (with a coefficient of 0.5) but severely diverges if a stronger aversion to inequality is considered (Atkinson index with a coefficient of 2): [0.160 – 0.177] to be compared with 0.226. This point is clarified below.
In general terms, we might conclude that if averages of equivalised income differ, the shapes of the distributions (as determined on a ‘fiscal household’ basis following microsimulation of tax and benefit rules using EUROMOD) roughly coincide, except for discrepancies observed at the extremes of the curves.
This is confirmed through an analysis of the at-risk-of-poverty rates and a more detailed description of the distributions of income. The ‘at-risk-of-poverty rate’ is conventionally defined as the proportion of individuals whose equivalised income is below the so-called ‘poverty line,’ which is 60 % of the median equivalised income. Table 14.4 shows at-risk-of-poverty rates for various population typologies and all categories within each of them(12).
We are focusing here on indicators relating to fiscal households. Indeed, we are constrained by the administrative-based data where no information is available about resident households. It would therefore make no sense to compare our results with others published at the European or national levels, and based on resident households. Rather, one must remember that our main objective is simply the comparison of our two input datasets for cross-validation purposes.
(12) A decomposition of inequality indices by population sub-group could also enlighten the question.
14 Cross-validating administrative and survey datasets through micro-simulation in Luxembourg
The use of registers in the context of EU-SILC: challenges and opportunities 198
The global survey-based at-risk-of-poverty rate of 11.5 % is higher than that derived from our administrative data(13) (9.6 %) (see Table 14.4). This holds true as well for most categories: only singles more than 65 years old and households with 2 workers or more are signalled as less at risk of poverty through survey-based than administrative-based data(14). Meanwhile the poverty line is lower than the first income decile group (€1 189) in the administrative-based data but higher (€1 243 EUR for the first decile) in survey-based data. More generally, the usual findings follow: younger people, singles younger than 65, singles with dependent(s) (most often lone parents) and the members of households where either nobody or only one person is working are more at risk of poverty than the other categories within the population, whichever dataset is under consideration.
One can also see that these populations are more concentrated in the lower end of the income distributions. Singles with dependent(s) and the households with no worker also experience less equivalised income, on average, than the members of the other associated categories (see Table 8 of the background paper). Nevertheless, no systematic link can be observed between the mean level of equivalised income within a category and the at-risk-of-poverty rate. Finally, the number of dependents in two-parent households is also shown to play a role in raising the risk of poverty. A higher average for the survey-based at-risk-of-poverty rate could be seen as somewhat contradictory compared to the lower degree of inequality as measured via the variant of the Atkinson index focused on poorer individuals (inequality aversion coefficient = 2). However, a larger share of the population below the poverty line does not say too much about the distribution of the ‘poor’ along the income line. For example, it can be shown that the intensity of poverty, measured by the ‘income gap ratio’, is lower through survey-based data(15): the poor, relatively more numerous, are nevertheless benefiting from equivalised incomes closer to the poverty line, on average. This ‘concentration’ effect is also broadly visible through the Gini coefficient when computed within the population under the poverty line. The coefficient is lower for survey-based data (0.0847) than for administrative-based data (0.0884). Moreover, it is well known that the Atkinson index with a high aversion to inequality is very sensitive to the lower end of the income distribution. For example, dropping only the first percentile of the equivalised income distributions from both data sources results in indices that that are not only closer, but that also become statistically compatible(16) . This result is perhaps not overly surprising, given that panel data like the PSELL3/EU-SILC, although well suited for income distribution studies, often lack precision regarding the lower end of the income distribution due, for example, to low response rates in specific categories of the population, including ‘poorer’ households.
Concerning the other extreme of the distribution of equivalised income, a few striking discrepancies between the datasets are once again noticeable. In particular, mean income within the upper decile, as expressed in terms of the population mean, is found to be highly variable. For example, the upper decile mean for the elderly is 233 % higher than the global mean in the administrative-based dataset (211 % higher in the survey-based dataset). In similar fashion the upper decile mean for singles with dependents is lower, compared to the population mean, in the administrative data (203 %) than in the survey data (214 %). However, such deviations were expected, given the known distortions regarding the collection of higher incomes.
Between those tail ends of the distributions, it is shown in the background paper that the profiles of the distributions are remarkably similar.
(13) As this difference falls outside the 95 % confidence interval for the survey-based poverty rate (10.5 % - 12.5 %), it also appears to be statistically significant.
(14) However, the difference is not statistically significant at the 1 % level for the former category.
(15) The Foster-Greer-Thorbecke poverty index with parameter 1, which is the product of the poverty rate and the income gap ratio, is shown to be 0.015 through survey-based data (respectively 0.016 through administrative-based data), leading to an income gap ratio of 0.015/0.115 = 13 % (resp. 17 %). The income gap ratio = 1 – (Mean income of the “poor”/Poverty line); it refers to the extent to which the incomes of the poor lie below the poverty line.
(16) If the first percentile of the equivalised income distribution is left out, the Atkinson index with an inequality aversion of 2 drops from 0.226 to 0.159 for administrative-based data. It is much more slightly modified for survey-based data, from 0.168 down to 0.156 with a 95 % confidence interval, which becomes [0.149-0.162]. For a more general analysis of such tendencies, see Van Kerm (2007).
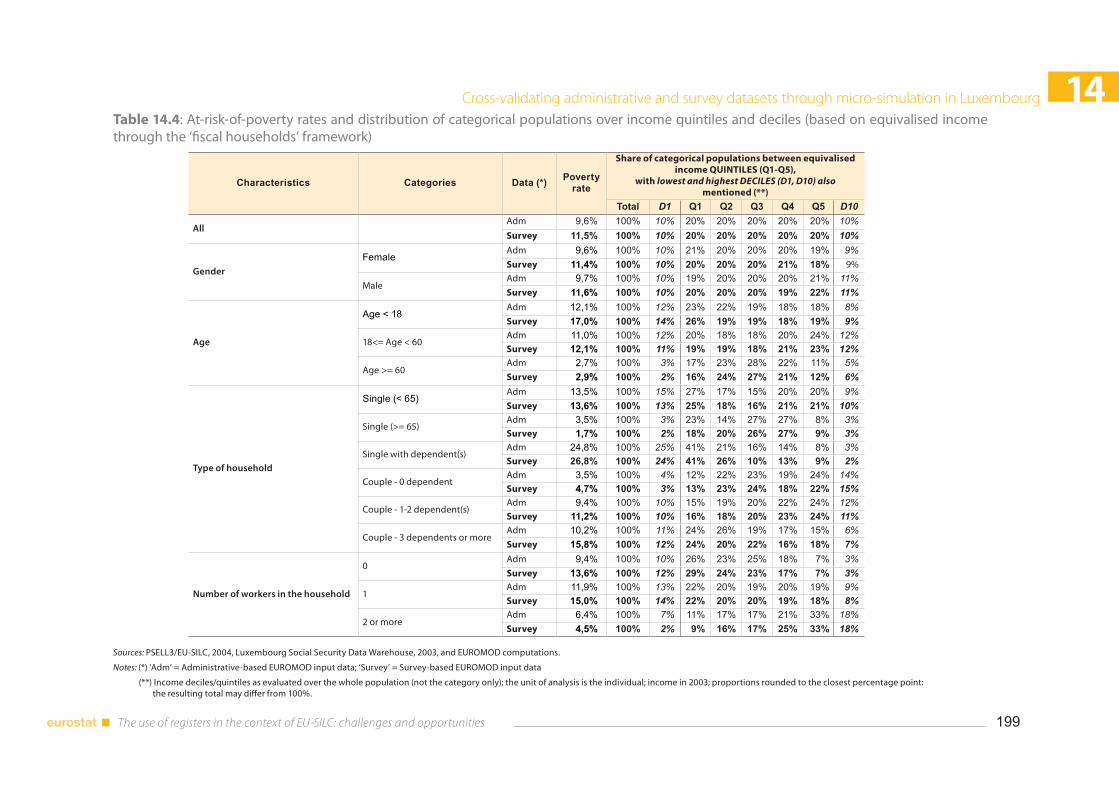
Cross-validating administrative and survey datasets through micro-simulation in Luxembourg 14
199The use of registers in the context of EU-SILC: challenges and opportunities
Table 14.4: At-risk-of-poverty rates and distribution of categorical populations over income quintiles and deciles (based on equivalised income through the ‘fiscal households’ framework)
Characteristics Categories Data (*) Poverty rate
Share of categorical populations between equivalised income QUINTILES (Q1-Q5),
with lowest and highest DECILES (D1, D10) also mentioned (**)
Total D1 Q1 Q2 Q3 Q4 Q5 D10
All Adm 9,6% 100% 10% 20% 20% 20% 20% 20% 10%Survey 11,5% 100% 10% 20% 20% 20% 20% 20% 10%
Gender
FemaleAdm 9,6% 100% 10% 21% 20% 20% 20% 19% 9%Survey 11,4% 100% 10% 20% 20% 20% 21% 18% 9%
MaleAdm 9,7% 100% 10% 19% 20% 20% 20% 21% 11%Survey 11,6% 100% 10% 20% 20% 20% 19% 22% 11%
Age
Age < 18Adm 12,1% 100% 12% 23% 22% 19% 18% 18% 8%Survey 17,0% 100% 14% 26% 19% 19% 18% 19% 9%
18<= Age < 60Adm 11,0% 100% 12% 20% 18% 18% 20% 24% 12%Survey 12,1% 100% 11% 19% 19% 18% 21% 23% 12%
Age >= 60Adm 2,7% 100% 3% 17% 23% 28% 22% 11% 5%Survey 2,9% 100% 2% 16% 24% 27% 21% 12% 6%
Type of household
Single (< 65)Adm 13,5% 100% 15% 27% 17% 15% 20% 20% 9%Survey 13,6% 100% 13% 25% 18% 16% 21% 21% 10%
Single (>= 65)Adm 3,5% 100% 3% 23% 14% 27% 27% 8% 3%Survey 1,7% 100% 2% 18% 20% 26% 27% 9% 3%
Single with dependent(s)Adm 24,8% 100% 25% 41% 21% 16% 14% 8% 3%Survey 26,8% 100% 24% 41% 26% 10% 13% 9% 2%
Couple - 0 dependentAdm 3,5% 100% 4% 12% 22% 23% 19% 24% 14%Survey 4,7% 100% 3% 13% 23% 24% 18% 22% 15%
Couple - 1-2 dependent(s)Adm 9,4% 100% 10% 15% 19% 20% 22% 24% 12%Survey 11,2% 100% 10% 16% 18% 20% 23% 24% 11%
Couple - 3 dependents or moreAdm 10,2% 100% 11% 24% 26% 19% 17% 15% 6%Survey 15,8% 100% 12% 24% 20% 22% 16% 18% 7%
Number of workers in the household
0Adm 9,4% 100% 10% 26% 23% 25% 18% 7% 3%Survey 13,6% 100% 12% 29% 24% 23% 17% 7% 3%
1Adm 11,9% 100% 13% 22% 20% 19% 20% 19% 9%Survey 15,0% 100% 14% 22% 20% 20% 19% 18% 8%
2 or moreAdm 6,4% 100% 7% 11% 17% 17% 21% 33% 18%Survey 4,5% 100% 2% 9% 16% 17% 25% 33% 18%
Sources: PSELL3/EU-SILC, 2004, Luxembourg Social Security Data Warehouse, 2003, and EUROMOD computations.
Notes: (*) ‘Adm’ = Administrative-based EUROMOD input data; ‘Survey’ = Survey-based EUROMOD input data
(**) Income deciles/quintiles as evaluated over the whole population (not the category only); the unit of analysis is the individual; income in 2003; proportions rounded to the closest percentage point: the resulting total may differ from 100%.
14 Cross-validating administrative and survey datasets through micro-simulation in Luxembourg
The use of registers in the context of EU-SILC: challenges and opportunities 200
14.3.4 Microsimulated responses to changes in the tax system
So far in our cross-validation we have emphasised the similarities and discrepancies observed between our survey-based and administrative-based datasets. In doing so, all of our results have referred to the tax system as implemented and applied to earnings in 2003. Such an approach is static, focusing on the fiscal benchmark of 2003. In so far as differences have been observed, the unanswered question remains: how sensitive will the microsimulation of alternative tax systems be to these observed differences? To address this question, we compared in Section 3.5 of the background paper the outcomes resulting from the two datasets after changing the fiscal rules. Similarities consistent with the previously observed proximities between the distributions of income might be expected. This expectation is confirmed.
14.4 ConclusionsIn this chapter we have initiated, through the EUROMOD microsimulation framework, the cross-validation of administrative data derived from the recently implemented Luxembourg Social Security Data Warehouse, on the one hand, and of the PSELL3/EU-SILC survey data, on the other hand. This case study is, we believe, of wider interest because of the lessons it has to offer regarding the relative strengths and weaknesses of survey and administrative datasets as inputs for microsimulation models. In particular, the nature of any discrepancies and the importance of these discrepancies relative to the kinds of differences likely to be observed downstream when modelling changes in fiscal systems are examined in the chapter. Given the lack of previously peer-reviewed work in this area, we also hope that this chapter might offer some valuable pointers to others considering embarking on a similar cross-validation exercise. We summarise our approach and main findings below, before moving on to consider possible future refinements.
Before comparing our survey and administrative datasets we endeavoured to eliminate as many dissimilarities as we could control for, including the target population, the lack of precision in some important (income-related) variables and the time-frame covered (we have restricted ourselves to 2003). As a result of this process of harmonisation we had to drop about 6 % of the initial population in both datasets and adapt the calculation of variables such as those related to capital income-related due to missing information in the administrative dataset. For the same reason it also proved necessary to adopt the fiscal household as the unit of analysis rather than the more usual resident household. Because fiscal households nest within residential households, this led to an observed distribution of equivalised income that departed from the usually observed residential-based ones, with lower values for both means (5 % less when fiscal households are used) and medians (–6 %). The at-risk-of-poverty rate and the position of the different categories of population were also affected.
Following harmonisation the two datasets appear to be satisfactorily similar with regards to several non-monetary characteristics. For monetary characteristics, a discordance is observed, mainly stemming from a gap in primary income, which is, on average, 7 % lower in administrative-based data. The difference in primary income implies downstream effects on equivalised income. Even so, while the average equivalised income differs, the shapes of the income distributions recorded in the two datasets broadly coincide. The exception is the occurrence of some notable discrepancies at the extremes of the income distribution.
On the whole, therefore, we can conclude from comparisons that our survey database performs reasonably well in capturing the relevant characteristics of population shared in common with our administrative dataset. Making the assumption that the survey data are equally representative of the elements of the resident population over-looked for the purposes of cross-validation, our survey dataset appears to offer the scope to undertake analyses with respect to characteristics not found in our administrative database (and vice versa).
Of course, our conclusion is based upon cross-validation of outcomes arising from the treatment we have chosen to impose to the initial datasets to make them target closer populations and to get rid of the effect of some income-related missing or unevenly biased variables. A next step is to explore alternative avenues for validating those elements of our datasets not covered directly by this cross-validation, with a view to reducing the number of data interventions required. We could also profit, in the future, from available complementarities between administrative and survey data, and create an operational link, for example, through statistical matching or actual matching (subject to the limitations imposed by the statutory
Cross-validating administrative and survey datasets through micro-simulation in Luxembourg 14
201 The use of registers in the context of EU-SILC: challenges and opportunities
protection of data privacy). This would also help in introducing into our administrative data a variable crucial for most socio-economic analyses, namely education.
14.5 References
Atkinson, T., Cantillon, B., Marlier, E. and Nolan, B. (2002), ‘Social indicators: The EU and social inclusion’, New York: Oxford University Press.
Burkhauser, R., Larrimore, J. and Simon, K. (2012), ‘A ‘Second Opinion’ on the Economic Health of the American Middle Class’, National Tax Journal 65 (1), 7-32.
Figari, F., Levy, H. and Sutherland, H. (2007), ‘Using the EU-SILC for policy simulation: Prospects, some limitations and suggestions’, EUROMOD Working paper, EM1/07, University of Essex, United Kingdom.
Liégeois, P., Islam, N., Berger, F. and Wagener, R. (2011), ‘Cross-validating administrative and survey datasets through microsimulation’, International Journal of Microsimulation, 4(1), 1-18.
Marlier, E., Atkinson, A. B., Cantillon, B. and Nolan, B. (2007), ‘The EU and social inclusion: Facing the challenges’, Bristol: Policy Press.
Nordberg, L. (2003), ‘An analysis of the effects of using interview versus register data in income distribution analysis based on the Finnish ECHP-surveys in 1996 and 2000’, CHINTEX Working Paper #15, Abo Akademi university, Finland.
Nordberg, L. and Penttilä, I. (2001), ‘Interview and register data in income distribution analysis. Experiences from the Finnish European Community Household Panel in 1996’, Reviews 2000/9, Helsinki: Statistics Finland.
Van Kerm, P. (2007), ‘Extreme incomes and the estimation of poverty and inequality indicators from EU-SILC’, IRISS Working paper, 2007-01, CEPS/INSTEAD, Luxembourg.


Workshop conclusionsV

Combining sample surveys and registers — an overview in the context of EU-SILC — Conclusions 15
205 The use of registers in the context of EU-SILC: challenges and opportunities
15. Combining sample surveys and registers — an overview in the context of EU-SILC — Conclusions
Veli-Matti Törmälehto and Markus Jäntti(1)
Abstract: In this concluding chapter, we discuss documentation challenges and new results on the effect of measurement differences on income distribution. We then provide some concluding remarks in view of the expected revision of EU-SILC in the coming years.
15.1 IntroductionThe chapters in this volume document aspects of the use of registers in EU-SILC datasets in general and in selected countries (Parts I and II), the use of registers to measure income variables in particular (Part III), and issues that register data can be used to assist with on a more substantive basis (Part IV). As several authors point out, the increased use of registers reduces costs and respondent burden, but can lead to breaks in statistical series and generate differences across countries in estimates. In this concluding chapter, we first take up two issues of particular concern, namely documentation challenges and selected new results on how survey- and register-based estimates of income distribution statistics differ. We then conclude with more general remarks, taking a long-term view on collecting European data on income and living conditions.
15.2 Documentation challengesA major challenge in conjunction with increased use of register data in EU-SILC is documentation. Documentation is challenging on several different levels. First, users of the EU-SILC data – of both the microdata and the indicators that are published – need to know exactly how the variables have been constructed, which elements stem from registers and surveys, respectively, or whether or not both register and survey information are used in constructing the same variable, and so on. While this in itself is challenging, it is a task that is little different from standard data documentation. Well-developed tools and procedures exist for implementing such documentation needs. In particular, the income flags that are provided with the EU-SILC variables offer a convenient vehicle for providing such information. One option to implement this would entail amending the flag variables so that they can carry the information on the data source for each observation (register, CAPI, CATI, CAWI...).
The greater challenge concerns the provision of metadata on the registers used on a basis that is comparable across countries. As several of the chapters in this volume have made clear, even highly similar registers, such as those held by tax authorities, vary substantially across countries in their timeliness, coverage, the legal institutions regulating their use, and so on. A complete set of metadata covering the administrative registers that either provide information included in the EU-SILC variables, or that are used in producing the dataset (such as those used to construct the sampling frame or that are used for calibrating weights) would be a major undertaking. Such a source of data would, however, be highly useful for power users of EU statistics and would also be a highly useful source of institutional information for analysts. Chapter 3 in this volume does provide several useful pieces of information that should be included in such a meta-database and also suggests ways in which the data can be gathered.
A third documentation challenge, which is closely related to the first two above but is from a user perspective distinct, is the documentation of changes to the use of register data in EU-SILC. As discussed in Chapter 3, the idea is that countries that move to using registers rather than surveys should provide one year in which both types of sources are available. But such major changes in measurement instruments are one thing, minor changes in the way in which registers are used, or in the mix of register/survey information
15 Combining sample surveys and registers — an overview in the context of EU-SILC — Conclusions
The use of registers in the context of EU-SILC: challenges and opportunities 206
may be too frequent to warrant the provision of two sets of instruments on every round. But users need to be informed of such changes all the same. At the country level, country-specific studies and overlapping measurements at least once are essential to cope with expected breaks in time-series with transition from survey to register data.
15.3 Register and survey results on income distribution in EU-SILCSeveral chapters in this volume provide rich information on differences in income distribution statistics based on surveys and registers in the context of EU-SILC that extends what is known from earlier work, as surveyed in Chapter 4.
In France (Chapter 8), results for 2005 suggest interview income overestimates mean and median wages and overestimates its dispersion. The differences are small, for the most part, but can be large at the ends of the distribution. As EU-SILC is used especially to examine the living conditions of the disadvantaged populations, it is what happens in the lower tail that is particularly important. Disposable income at-risk-of-poverty rates using the two sources suggest in 2005 a high agreement in estimates, however, with about 13% poor using both sources and a very high degree of overlap. On the other hand, between 2007 and 2008, the source of real estate income changed from surveys to registers and the amounts collected in the aggregate doubled. There is some evidence that an increase in overall income inequality in France between those years is driven by the change in sources.
In Italy (Chapter 9), using a mixture of survey and register information, as opposed to only survey information, produces data with a mostly close correspondence. Both the poverty rate and the Gini coefficient are lower in the former case, by a not unsubstantial margin. Poverty is 19.6% and the Gini coefficient 0.313 when also register information is included, when not, poverty is 21.4% and the Gini is 0.330. The misclassification rates are also not small. The results in Chapter 14, in turn, suggest that savings rates are underestimated and that the bias varies across the distribution of income, driven by differential measurement error processes in income and consumption by income status.
In Spain (Chapter 11), poverty rates are remarkably similar when survey data are and are not used – the overall at-risk-of-poverty rate is 19.7 from the survey only and 19.9 when register information is used. Mean income is higher in the latter case, though.
Slovenia (Chapter 6) compares income distribution statistics between EU-SILC and their Household Budget Survey (HBS). The main difference between the two is that for the HBS, incomes are surveyed (by CAPI) and for EU-SILC while, as detailed in Chapter 6, most of the EU-SILC income (for Slovenia) are now collected from administrative registers. Although the information is not available for the same units – so this is a cross-validation exercise – the comparison suggests errors, especially underreporting, in survey responses are prevalent. In 2005, the year distributional statistics in the two were published, both poverty rates and Gini coefficients are very similar and very likely statistically insignificantly different from each other.
Taken together, several chapters in this volume suggest that the differences between survey- and register-based estimates in inequality and poverty can be of an order of magnitude that, if observed as a change from year-to-year in a country, would be considered a substantial change in inequality. These estimates, often produced as part of quality assessments in the statistical agencies, provide useful contextual information. It would appear useful if the data that underlie these assessments were available for academic research on the importance of measurement errors in income distribution statistics.
Combining sample surveys and registers — an overview in the context of EU-SILC — Conclusions 15
207 The use of registers in the context of EU-SILC: challenges and opportunities
15.4 From the ECHP to EU-SILC: where do we stand now?EU-SILC has been running now for about ten years, and a revision of the legal basis of the instrument is expected to take place in the next couple of years. The future seems to hold even more variation than before in the EU-SILC implementations and use of multiple data sources. To put the revision in context, this section gives a very brief history of how European data on income and living conditions have been collected in the past.
EU-SILC is the successor of the European Community Household Panel (ECHP), which ran from 1994 to 2001 in the EU-15. The focus of the ECHP was very much on comparability and longitudinal data. It was set up as an input harmonised single-mode panel survey with a standardised questionnaire. After a few years, the ECHP data were replaced with ex-post harmonised data in some countries (UK, Germany, Sweden), and some countries used register income data in the ECHP (e.g. Finland).The production of each wave of the ECHP took a lot of time, and eventually timeliness became the main drawback of the ECHP.
The challenges with timeliness and feasibility of full input harmonisation, coupled with the enlargement of the EU, led to a major revision of the instrument resulting in EU-SILC in the early 2000s. The changes to the objectives and the overall design were fundamental. The focus was put on timely cross-sectional data, and integration with the national statistical systems was emphasised. Comparability was still seen as an overriding quality criterion, but input harmonisation was not seen as a necessary mean to achieve a high degree of comparability. Thus, EU-SILC was set up as an ex-ante output harmonised instrument, allowing flexible multi-mode implementation at the country level. Common rules and definitions of target output variables and essentials of the sample designs -- such as the minimum effective sample sizes, the use of probability sampling, the following rules for the longitudinal part, and so forth .-- were the tools to have timely and comparable database for producing European Statistics on Income and Living Conditions.
While in the ECHP the use of administrative data was ‘tolerated’, it was accepted in EU-SILC. Consequently, the transition from the ECHP to EU-SILC also involved an explicit split into the ‘survey countries’ and the ‘register countries’. Moreover, the ‘selected respondent’ (SR) design was tailored for the register countries, which could extract the personal target variables (income, personal demographics mainly) largely from registers. The specifics of the SR design were discussed in Chapter 1 of this volume. The design was adopted from the beginning of EU-SILC by the ‘register countries’, i.e. the Nordic countries, Slovenia and the Netherlands.
The current trend in European statistics is to encourage use of administrative data. The present volume has highlighted the recent expansion in the use of register data in EU-SILC, in particular on regular income components such as wages and salaries, pensions, and social benefits. Nowadays, one could well split the EU-SILC countries into two groups instead of three. The first group consists of the ‘old’ register countries that use the SR design. The second consists of countries that use or will use income data from registers extensively but have not adopted the SR design. The third group consists of countries that rely, by necessity, largely on interview-based income data for EU-SILC.
Regarding the second group of the ‘new’ register countries (e.g. France, Austria, Switzerland), the chapters in this volume have presented examples of good practises in how make the transition to register data. This seems to involve adaptation of the legal basis, careful quality assessments, and changes to the production processes (see, for instance, Chapter 10). In contrast, these ‘new’ register countries mostly have not adapted the basic designs, including the mode of collection, or interviewing all adults. I.e., they have not adopted the SR design. The challenges with technical and quality aspects (units not linked, coverage problems, quality of e.g. self-employment income) exist but seem to be manageable using mixed or combined approaches. Furthermore, within-country comparability across time is generally an issue, and the transition to registers tends to imply breaks in at least some time-series.
The third group of the ‘survey’ countries is a large and important one, and includes countries such as Germany, the UK, Poland, Portugal, Greece, and others. These countries may have legal and actual barriers to access and/or link register data to the EU-SILC sample, and the quality of the register data may not be fit for purpose due to low quality of the available registers. Even then, there may be some scope for utilising register data for EU-SILC purposes, at least for quality assessments, as demonstrated e.g. in Chapters 12-14.
15 Combining sample surveys and registers — an overview in the context of EU-SILC — Conclusions
The use of registers in the context of EU-SILC: challenges and opportunities 208
The register countries who use the ‘selected respondent’ design (see Chapters 5-7) tend to have a comprehensive system-based approach to using registers for statistics and many also have a long tradition in using registers for surveys.. Legal and actual access to using registers is well established, and technical issues (e.g. record linkage) are generally not an issue Because these countries sample individuals (except the Netherlands) and take nearly all personal income data from registers, they have opted to interview only a random sub-sample of 16+ adults instead of all adults. There are pros and cons with this design (see Chapter 1), but as of this writing, it seems that the SR design needs to remain as an option in the future EU-SILC as well.
15.5 Concluding remarksFor the resource-constrained National Statistical Institutes, the ECHP ideal of an input harmonised data collection to maximise comparability seems even less feasible now than it was ten years ago. Given this, it seems that even more monitoring and documentation of data quality and comparability is needed. In a broader quality context, there are some important trade-offs to consider with administrative data as well.
Following the economic crisis of the past years, timely indicators on inequality and poverty for policy monitoring are more important than they ever have been. In many countries, registers are in conflict with timeliness due to late availability of administrative data. The first trade-off may then be between timeliness and accuracy, and timeliness may have to be prioritised at the cost of accuracy. Second, with even more variation in the EU-SILC implementations, there is a trade-off between comparability and flexibility of implementation. The differences in survey versus register data do have implications for cross-country comparability; the selected respondent design prevents some analyses that require intra-household data, and likely variation in mode and context effects remain a concern in output harmonised surveys. For practical reasons, however, a de-centralised ex-ante harmonised survey such as EU-SILC may have to accept a somewhat lower degree of comparability.
In terms of substantial contents of EU-SILC, extending register-based measurement of social benefits to as many countries as possible could be one important and practical objective. This would save quite some space from the ‘survey country’ questionnaires, and it would improve quality and comparability of important EU-SILC variables and the associated indicators. Moreover, the discrepancies in data sources and validity issues may be of much less concern than, say, with self-employment income.
In the early 2000s, the EU-SILC legislation was written considering the variation in the data collection practices in the member states. The revision of the EU-SILC legislation is expected in the near future. At a minimum, the revised framework and the detailed guidelines for EU-SILC should not prevent utilisation of registers. This warrants careful consideration of the target populations, data collection units, contents, modalities, reference times and so forth in such a way that they can implemented in any multi-mode design at a de-centralised level.
Related Documents