THE USE OF PERSONALITY PROFILES IN PERSONNEL SELECTION: AN EXPLORATION OF ISSUES ENCOUNTERED IN PRACTICAL APPLICATIONS A Dissertation by MATTHEW LARRENCE SHELTON Submitted to the Office of Graduate Studies of Texas A&M University in partial fulfillment of the requirements for the degree of DOCTOR OF PHILOSOPHY August 2004 Major Subject: Counseling Psychology

Welcome message from author
This document is posted to help you gain knowledge. Please leave a comment to let me know what you think about it! Share it to your friends and learn new things together.
Transcript

THE USE OF PERSONALITY PROFILES IN PERSONNEL SELECTION:
AN EXPLORATION OF ISSUES ENCOUNTERED IN PRACTICAL
APPLICATIONS
A Dissertation
by
MATTHEW LARRENCE SHELTON
Submitted to the Office of Graduate Studies of
Texas A&M University in partial fulfillment of the requirements for the degree
of
DOCTOR OF PHILOSOPHY
August 2004
Major Subject: Counseling Psychology

ii
THE USE OF PERSONALITY PROFILES IN PERSONNEL SELECTION:
AN EXPLORATION OF ISSUES ENCOUNTERED IN PRACTICAL
APPLICATIONS
A Dissertation
by
MATTHEW LARRENCE SHELTON
Submitted to Texas A&M University in partial fulfillment of the requirements
for the degree of
DOCTOR OF PHILOSOPHY
Approved as to style and content by:
_________________________ _______________________ Daniel Brossart Winfred Arthur, Jr. (Chair of Committee) (Member)
_________________________ _______________________ Michael Duffy Cecil Reynolds (Member) (Member) _________________________ Victor L. Willson (Head of Department)
August 2004
Major Subject: Counseling Psychology

iii
ABSTRACT
The Use of Personality Profiles in Personnel Selection:
An Exploration of Issues Encountered in Practical
Applications. (August 2004)
Matthew Larrence Shelton, B.A., Southern Methodist
University; M.A. University of Missouri – Kansas City
Chair of Advisory Committee: Dr. Daniel Brossart
The purpose of this study was to explore the issues
that are typically encountered when using personality
instruments for personnel selection. Cattell’s Sixteen
Personality Factor Questionnaire (16PF) was used in the
study to predict job performance in a small team-based
manufacturing organization. Issues including the utility of
the 16PF in this setting, the bandwidth fidelity argument
(to use narrow or broad traits), and whether job-specific
versus company-wide profiles provide better prediction
success were addressed. The usefulness of the
organization’s current selection process of using the 16PF
to generate interview questions was also investigated.
Results indicate that the 16PF can be a useful tool
for personnel selection in this setting and that the 16PF
was able to correctly classify if an applicant was going to

iv
be successful over 86% of the time. Evidence for using
narrow factors instead of broad factors was also presented,
and the benefits of using job specific profiles were
discussed. The limitations of this study were addressed,
which included conducting this type of research with
relatively small sample sizes. Additionally, this study
provides suggestions for additional research in the future.

v
DEDICATION
This dissertation is dedicated to my grandfather,
Okley Kinder. He has taught me the power of perseverance
through the many obstacles that he has overcome throughout
his lifetime and how he has always approached new
challenges in his life with unbridled optimism about the
future. These values have always helped me get through the
challenges in my own life. Thank you for your love and
support.

vi
ACKNOWLEDGEMENTS
I would like to thank my family for all of their
support and encouragement. Thank you, Dr. Charlotte
Shelton, my mother, for all of the support and guidance you
have given me over the years. You have had a dramatic
influence on both my career and who I am today. Your
assistance and consultation on this project were invaluable
and I truly appreciate all that you have done for me. I
would also like to thank my father, Larry Shelton, for his
unwavering support and encouragement for all of my
endeavors. I appreciated the financial contributions and
sacrifices that both of my parents made in contributing to
my education. I would also like to thank my sister, Laura
Shelton. The mountains that you have had to overcome in
your own career path to get to where you are today are
inspirational.
I would like to thank my chair, Dr. Dan Brossart, for
his constant support and encouragement. Your positive
attitude and brilliant problem solving have been a huge
help in the project. I would also like to thank Dr. Winfred
Arthur, Jr. for all of the help that he has provided me on
this project. Thank you for investing such time and energy

vii
into a student outside of your department. This
dissertation would never have happened without your input
and help. Thanks to Dr. Michael Duffy for the support and
encouragement that you have provided me. I use the skills
that I learned from you on a daily basis and you have been
the most influential person on my own professional frame of
reference. I would also like to thank Dr. Cecil Reynolds
for his help on experimental design. You have pushed me to
consider factors that I had not previously considered and
to look at problems in different ways. I would also like to
thank the College of Education faculty and staff for their
support.
Finally, I would like to thank my wife, Jenny Shelton.
You are my best friend and my biggest supporter. You always
seem to know the perfect words of encouragement whenever I
feel stuck and have demonstrated incredible patience with
me throughout this journey. I know it has been a long haul
for you as well, and I am grateful for all of your
wonderful help and support. I look forward to spending many
years with you and our growing family.

viii
TABLE OF CONTENTS
Page
ABSTRACT……………………………………………………………………………………………………………… iii
DEDICATION………………………………………………………………………………………………………… v
ACKNOWLEDGEMENTS………………………………………………………………………………………… vi
TABLE OF CONTENTS……………………………………………………………………………………… viii
LIST OF TABLES……………………………………………………………………………………………… xi
LIST OF FIGURES…………………………………………………………………………………………… xiv
CHAPTER
I INTRODUCTION………………………………………………………………………… 1
Research Questions…………………………………………… 5 II REVIEW OF THE LITERATURE………………………………………… 6 The 16PF for Personnel Selection……… 7 The Five Factor Model/The Big Five… 11 The Bandwidth-Fidelity Argument………… 17 Contextual and Task Performance………… 20 RIASEC Theory………………………………………………………… 24 Situational Constraints……………………………… 25 Score Correcting………………………………………………… 27 Legal Issues…………………………………………………………… 28 Statement of Problem……………………………………… 32 III METHOD………………………………………………………………………………………… 37 Participants…………………………………………………………… 37 Instruments……………………………………………………………… 39 Job Performance…………………………………………………… 42 Procedure…………………………………………………………………… 44 Data Analysis………………………………………………………… 45

ix
CHAPTER Page IV RESULTS……………………………………………………………………………………… 52 Research Questions One, Two, and Three……………………………………………………………………………… 52 Additional Analysis………………………………………… 64 Summary of the Findings for the First Three Research Questions…………… 71 Research Question Four………………………………… 75 Summary of Findings for the Fourth Research Question……………………………………………… 98 V SUMMARY AND DISCUSSION……………………………………………… 100 Research Question One…………………………………… 100 Research Question Two…………………………………… 101 Research Question Three……………………………… 104 Research Question Four………………………………… 106 Limitations……………………………………………………………… 108 Implications for Future Research……… 111 REFERENCES………………………………………………………………………………………………………… 114 APPENDIX A………………………………………………………………………………………………………… 122 APPENDIX B………………………………………………………………………………………………………… 123 APPENDIX C………………………………………………………………………………………………………… 124 APPENDIX D………………………………………………………………………………………………………… 125
APPENDIX E………………………………………………………………………………………………………… 126
APPENDIX F………………………………………………………………………………………………………… 127
APPENDIX G………………………………………………………………………………………………………… 128 APPENDIX H………………………………………………………………………………………………………… 129 APPENDIX I………………………………………………………………………………………………………… 130 APPENDIX J………………………………………………………………………………………………………… 131
APPENDIX K………………………………………………………………………………………………………… 132

x
Page
APPENDIX L………………………………………………………………………………………………………… 133
APPENDIX M………………………………………………………………………………………………………… 134
APPENDIX N………………………………………………………………………………………………………… 135
APPENDIX O………………………………………………………………………………………………………… 136
VITA………………………………………………………………………………………………………………………… 137

xi
LIST OF TABLES
TABLE Page
1 Normal Personality Domain……………………………………………………… 12 2 Sample Sizes for Each Comparison ………………………………… 39 3 Broad Factor Reliability Coefficients……………………… 49 4 Descriptive Analysis: 16 Narrow Factors (APO)… 55 5 Descriptive Analysis: Five Broad Factors (APO) 57 6 Logistic Regression Analysis of Success as a Function of the Five Broad Factors From the 16PF (Press Operator)………………………………………………………………… 58 7 Descriptive Analysis: 16 Narrow Factors (Company-Wide)…………………………………………………………………………………… 60 8 Logistic Regression Analysis of Success as a Function of the Sixteen Narrow Factors from the 16PF (Company-Wide)…………………………………………………………… 62 9 Descriptive Analysis: Five Broad Factors (Company-Wide)…………………………………………………………………………………… 63 10 Logistic Regression Analysis of Success as a Function of the Five Broad Factors from the 16PF (Company-Wide)……………………………………………………………………… 64 11 Five Strongest Narrow Predictors…………………………………… 65 12 Descriptive Analysis: Best Five Narrow Factors (APO)…………………………………………………………………………………………………………… 67 13 Logistic Regression Analysis of Success as a Function of the Five Best Narrow Factors from the 16PF (APO)…………………………………………………………………………………… 68 14 Descriptive Analysis: Best Five Narrow Factors (Company-Wide)…………………………………………………………………………………… 69

xii
TABLE Page 15 Logistic Regression Analysis of Success as a Function of the Five Best Narrow Factors from the 16PF (Company-Wide)…………………………………………………………… 70 16 Summary of Results from the First Three Research Questions………………………………………………………………………… 72 17 R2 and Adjusted-R2 ………………………………………………………………………… 74 18 Descriptive Analysis: Hired vs. Successful (16)……………………………………………………………………………………………………………… 77 19 Logistic Regression Analysis of Group Membership as a Function of the Sixteen Narrow Factors from the 16PF……………………………………………… 79 20 Descriptive Analysis: Hired vs. Successful (5)………………………………………………………………………………………………………………… 80 21 Logistic Regression Analysis of Group Membership as a Function of the Five Broad Factors from the 16PF………………………………………………………………… 81 22 Descriptive Analysis: Hired vs. Unsuccessful (16)…………………………………………………………………………… 83 23 Logistic Regression Analysis of Group Membership as a Function of the Sixteen Narrow Factors from the 16PF……………………………………………… 84 24 Descriptive Analysis: Hired vs. Unsuccessful (5)……………………………………………………………………………… 85 25 Logistic Regression Analysis of Group Membership as a Function of the Five Broad Factors from the 16PF………………………………………………………………… 86 26 Descriptive Analysis: Not Hired vs. Successful (16)………………………………………………………………………………… 88 27 Logistic Regression Analysis of Group Membership as a Function of the Sixteen Narrow Factors from the 16PF………………………………………………………………… 89

xiii
TABLE Page 28 Descriptive Analysis: Not Hired vs. Successful (5)…………………………………………………………………………………… 91 29 Logistic Regression Analysis of Group Membership as a Function of the Five Broad Factors from the 16PF………………………………………………………………… 92 30 Descriptive Analysis: Not Hired vs. Unsuccessful (16)…………………………………………………………………………… 94 31 Logistic Regression Analysis of Group Membership as a Function of the Sixteen Narrow Factors from the 16PF………………………………………………………………… 95 32 Descriptive Analysis: Not Hired vs. Unsuccessful(5)………………………………………………………………………………… 96 33 Logistic Regression Analysis of Group Membership as a Function of the Five Broad Factors from the 16PF………………………………………………………………… 97 34 Summary of Results for the Fourth Research Question…………………………………………………………………………………………………… 98

xiv
LIST OF FIGURES
FIGURE Page
1 Ideal Cross Validation Results……………………………… 51
2 Cross Validation Results……………………………………………… 107

1
CHAPTER I
INTRODUCTION The use of personality measures in the area of
personnel selection has received much attention in the
literature. This practice can be traced to Hull’s work in
the 1920s. In Aptitude Testing (1928) Hull introduced the
idea of matching human traits with job requirements.
Cronbach and Gleser (1965) further advocated the use of
psychological tests for employment selection in their book
Psychological Tests and Personnel Decisions. Cronbach and
Gleser believed that the use of psychological testing can
be a very beneficial and cost effective way of selecting
employees. Holland (1973) explained, in his principle of
congruence, that people who resemble coworkers will tend to
perform well, be satisfied, and stay on the job. These
early works have stimulated a large body of research
pertaining to the use of personality measures for personnel
selection.
__________________ This dissertation follows the style and format of the Journal of Counseling Psychology.

2
The use of personality factors as predictors of job
performance was on the decline until the early 1990s
(Hogan, Hogan, & Roberts, 1996). Until that time,
personality factors failed to demonstrate statistical
validation of their predictive effectiveness. This began to
change with the publication of a series of meta-analyses
indicating that personality factors might indeed be valid
predictors of job performance (Barrick & Mount, 1991; Tett,
Jackson, & Rothstien, 1991). Barrick and Mount (1991) found
that measures of conscientiousness predict supervisors’
ratings of job performance (r = .23). Tett et al. (1991)
found even higher validity coefficients when using measures
of intellect and agreeableness to predict job performance
(r = .27 and .33 respectively). Other researchers have
found mean validity coefficients as high as r = .50 for
predicting rated performance in service jobs (McDaniel &
Frei, 1998). Ones and Viswevaran stated, “There is now
overwhelming validity evidence from this literature
suggesting that earlier reviews of the personality-job
performance relationships which found very little, if any,
validity for personality variables were premature” (1996,
p. 612).

3
Research regarding the use of personality measures for
selection purposes continues to grow and the findings from
these studies have been applied to a broad array of
practical applications. Personality measures have been used
for selection purposes in military, education, religious,
and service organizations, as well as in a wide range of
other work environments. Using personality measures for
selection purposes has been applied to both small and large
organizations. They have been used to select entry-level
positions all the way up to CEOs of major corporations.
Some organizations use traditional personality measures,
while others rely on measures that were developed
especially for business and organizational applications.
Of course in using personality measures there are some
issues that need to be addressed. First, there is the issue
of making sure that the personality traits assessed are
correlated to some measure of performance. The construct of
performance must be carefully determined and clearly
defined. It must be decided whether performance will be
judged by evaluating how effectively certain tasks are
performed or if it will be a broader construct such as how
an individual interacts with other members of the
organization and contributes to the overall organizational

4
goals. Also, decisions of whether to use broad personality
traits or narrow, more specific personality traits must
also be determined. Each of these decisions will be highly
influenced by the goals of the organization, the structure
of the organization, and the specific job-related variables
that apply to that particular job within that unique
organizational setting. Finally, there are legal and
ethical issues that must be addressed when using
personality measures for selection.
The present study will attempt to address each of
these issues and explore their applications in a relatively
small, team-based manufacturing setting. It will chronicle
this organization’s adaptation of a selection model to its
own unique environment and examine the success and pitfalls
in their personnel selection approach. This small
manufacturing company has some unique characteristics, but
also presents many of the obstacles that other small
organizations encounter when trying to implement a
selection protocol that incorporates personality measures.

5
Research Questions
The following three research questions will be
addressed in the current study:
1. How useful is the 16PF in predicting job performance
in a small team-based organization?
2. In team-based organizations, should job specific or
organizational-wide profiles be used for personnel
selection?
3. Which type of personality traits (narrow or broad) are
the best predictors of job performance?
4. Is the organization’s current selection procedure, in
which the 16PF is only used to generate interview
questions, effective?

6
CHAPTER II
REVIEW OF THE LITERATURE
Personality measures are now used in many different
settings as selection tools. Inwald and Brockwell (1991)
used the Inwald Personality Inventory (IPI) and Minnesota
Multiphasic Personality Inventory (MMPI) to predict
performance for government security personnel as rated on a
Four-point global performance scale by their immediate
supervisor. The employees were rated after nine and twelve
months of employment. They found that the MMPI could
accurately predict employees’ performance ratings 74.3% of
the time (p < .001) and that the IPI could accurately
predict the ratings 69.7% of the time (p < .001).
Furthermore, they found that the IPI and MMPI could also be
used together to accurately predict employee performance
ratings 77.2% percent of the time (p < .001). This study
illustrates the usefulness of personality testing in the
field of personnel selection for security personnel.
Schmidt and Hunter (1998) reviewed the past 85 years
of research findings in the area of personnel selection
methods and conducted a meta-analytical study of prior
findings. They concluded that a combination of integrity

7
tests and tests of general mental ability (GMA) were the
strongest predictors of future job performance across
occupations. They found that the combination of a GMA test
and an integrity test produced a composite validity of .65.
Additionally, they found that the combination of a GMA test
and a structured interview produced a composite validity of
.63. They found similar results when using performance in a
job-training program as a criterion (.67 for a GMA test and
an integrity test and .59 for a GMA test and a structured
interview). They urge practitioners to use selection
measures with the highest predictive validity and warn that
failure to do so can have a substantial impact on
productivity. They state, “In economic terms, the gains
from increasing the validity of hiring methods can amount
over time to literally millions of dollars” (1998, p.273).
The 16PF for Personnel Selection
Bartram (1992) notes that the Sixteen Personality
Factor Questionnaire (16PF) is being increasingly used for
employee selection purposes. He successfully used the 16PF
to examine differences between managers and the general
population in the United Kingdom. Statistically significant
differences were found on all 16 scales (absolute t (4014)

8
> 13 in all cases, p <.001). Furthermore, Herman and Usita
(1994) conducted a study that used the 16PF to predict the
appropriateness of volunteers in the Big Brothers/Big
Sisters Organization. Appropriateness was based on review
of files and staff ratings. They conducted a stepwise
discriminant analysis and found that Apprehensive vs. Self-
Assured (O), Perfectionistic vs. Tolerates Disorder (Q3),
Dominant vs. Deferential (E), Abstract-Reasoning vs.
Concrete-Reasoning (B), Rule-Conscious vs. Expedient (G),
and High Anxiety vs. Low Anxiety (AX) were all predictive
of appropriateness. The discriminant function yielded an
over-all correct classification rate of 79.4% (N = 143,
canonical correlation = .54, Wilks λ = .70).
Batram (1995) conducted a study that used the 16PF and
Eysenck Personality Inventory (EPI) to predict training
outcomes in flying. The predictive validity of the study
was lower than expected (uncorrected composite validities
in the region of r = .20 - .30), but it was proposed that
the effects of range restriction were considerable with
this population. Wakcher, Cross, and Blackman (2003)
suggest that due to the high-risk nature of the occupation
of being a pilot, this population likely self-selects

9
itself and that there is a very consistent pilot profile.
Additionally, Batram found that the 16PF was better at
distinguishing between groups (e.g., officers vs. NCOs)
than the EPI. Overall, the 16PF accounted for larger
proportions of the criterion variance than the EPI and all
variance accounted for by the EPI was also accounted for by
the 16PF. Furthermore, Bartram purports that the 16PF has
some additional advantages over the EPI. The 16PF’s greater
complexity and length makes the test less transparent to
the applicant and, therefore, less susceptible to faking.
The 16PF also has none of the medical questions found on
the EPI.
There is currently a large body of research that
correlates different scores on the scales of the 16PF with
many different occupations. Traditionally, this information
has been used in vocational psychology to help individuals
in occupational exploration (Cattell, Eber, & Tatsuoka,
1970). The manual for the 16PF reports a large number of
ideal profiles for a wide variety of occupations. This can
be very useful from the individual’s point of view, but
employers are interested in how successful that individual
will be in their particular organization after the person
is hired. This requires organizations to go the extra step

10
and use empirical data to develop their own ideal profile
for a particular job. Matching job applicants’ personality
profiles with an ideal profile developed from successful
current employees will allow the organization to select
potential employees with the greatest likelihood of
succeeding within that organization.
It should be noted that the term ideal profile is
being used here to describe the ideal profile for
individuals who are high performers in a given job. The
term is not being used in the context of describing an
ideal fit of an applicant into the organizational culture
or environment. This distinction is critical in the area of
personnel selection. In practice, if an organization were
attempting to develop a selection protocol that selected
employees who fit their organizational culture, that
organization would first have to administer the personality
instrument to their current employees and develop an ideal
organizational profile. Then when future applicants applied
to the organization, their personality profiles would be
compared to the ideal organizational profile to see how
good of a fit they were. The problem is that if an
organization only hires applicants who resemble their
current employees, the organization may therefore, be
11
discriminating against applicants who do not resemble the
current employee profile. This issue is avoided by linking
personality characteristics to job performance.
Consequently, the organization is simply using personality
factors to help select the candidate who will best perform
the job.
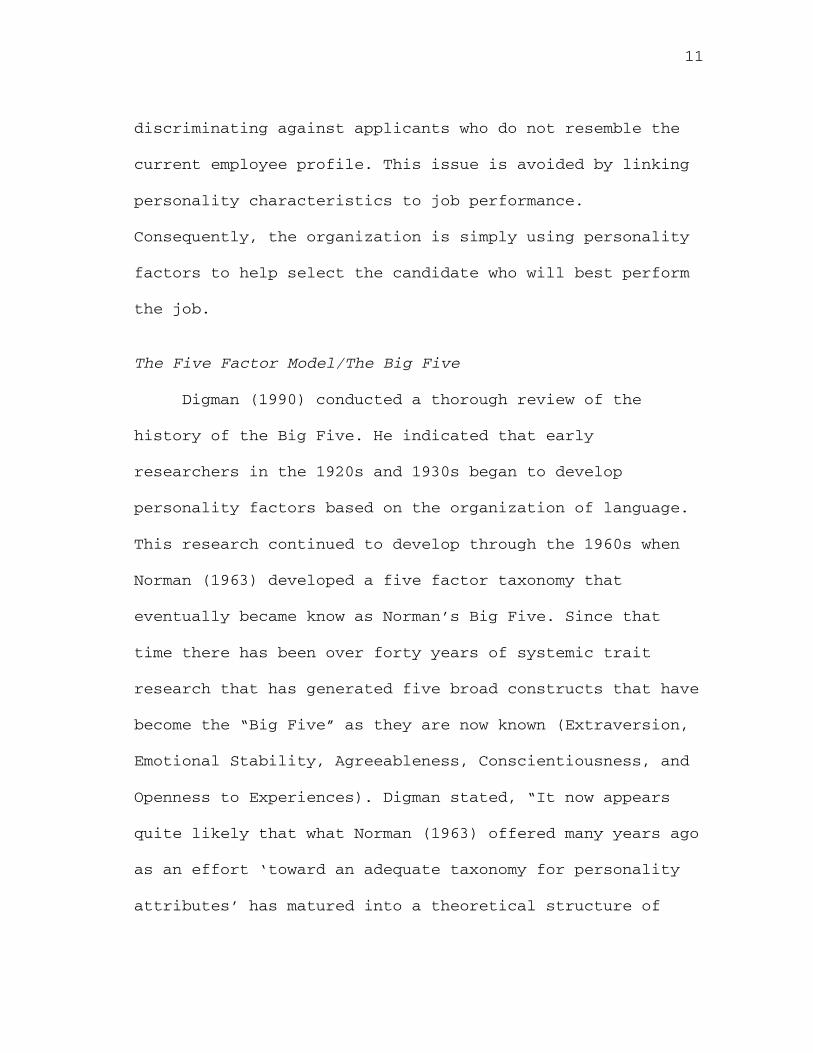
The Five Factor Model/The Big Five Digman (1990) conducted a thorough review of the
history of the Big Five. He indicated that early
researchers in the 1920s and 1930s began to develop
personality factors based on the organization of language.
This research continued to develop through the 1960s when
Norman (1963) developed a five factor taxonomy that
eventually became know as Norman’s Big Five. Since that
time there has been over forty years of systemic trait
research that has generated five broad constructs that have
become the “Big Five” as they are now known (Extraversion,
Emotional Stability, Agreeableness, Conscientiousness, and
Openness to Experiences). Digman stated, “It now appears
quite likely that what Norman (1963) offered many years ago
as an effort ‘toward an adequate taxonomy for personality
attributes’ has matured into a theoretical structure of

12
surprising generality, with stimulating links to
psycholinguistics and cross-cultural psychology, cognitive
theory, and other areas of psychology” (1990, p. 418).
It should be noted that the Big Five Model
(BFM)developed out of a lexical tradition whereas the Five
Factor Model (FFM) had its origins in a cluster analytic
study of Cattell’s 16PF (Davis & Million, 1999). The five
domains of the BFM are compared to the FFM in Table 1.
Although there are differences between the two models, for
simplicity and parsimony, the term BFM will be used
interchangeably with the FFM, both terms referring
specifically to the FFM used in the NEO-PRI.
Table 1
Normal Personality Domain
Lexical “Big Five” Model Five-Factor Model
1. Surgency (or Extraversion) 1. Extraversion
2. Agreeableness 2. Agreeableness
3. Emotional Stability (vs. Neuroticism)
3. Neuroticism
4. Conscientiousness 4. Conscientiousness
5. Intellect (or Culture) 5. Openness to Experience
13
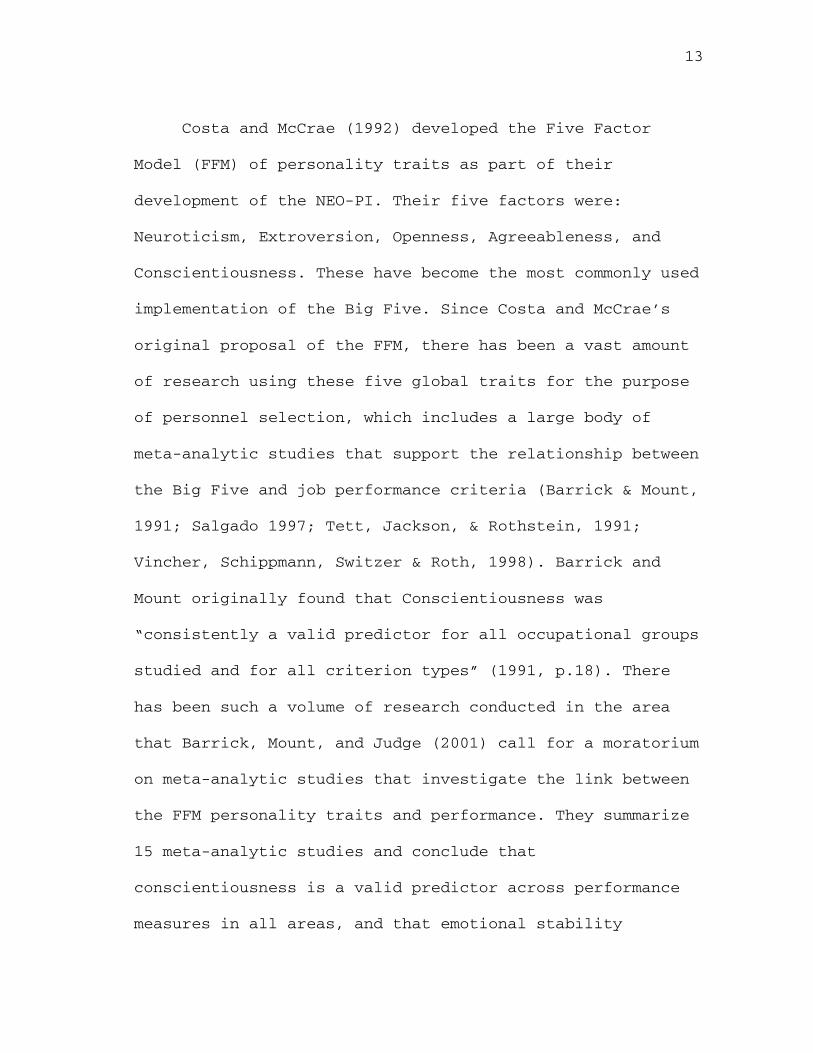
Costa and McCrae (1992) developed the Five Factor
Model (FFM) of personality traits as part of their
development of the NEO-PI. Their five factors were:
Neuroticism, Extroversion, Openness, Agreeableness, and
Conscientiousness. These have become the most commonly used
implementation of the Big Five. Since Costa and McCrae’s
original proposal of the FFM, there has been a vast amount
of research using these five global traits for the purpose
of personnel selection, which includes a large body of
meta-analytic studies that support the relationship between
the Big Five and job performance criteria (Barrick & Mount,
1991; Salgado 1997; Tett, Jackson, & Rothstein, 1991;
Vincher, Schippmann, Switzer & Roth, 1998). Barrick and
Mount originally found that Conscientiousness was
“consistently a valid predictor for all occupational groups
studied and for all criterion types” (1991, p.18). There
has been such a volume of research conducted in the area
that Barrick, Mount, and Judge (2001) call for a moratorium
on meta-analytic studies that investigate the link between
the FFM personality traits and performance. They summarize
15 meta-analytic studies and conclude that
conscientiousness is a valid predictor across performance
measures in all areas, and that emotional stability

14
appeared to be a generalizable predictor when overall work
performance was the criterion, but its relationship to
specific work criteria and occupations was less consistent
than conscientiousness.
It should be noted that not all researchers agree that
the construct of conscientiousness might be the ‘g’ of
personality and the best predictor of performance in most
occupational areas. Robertson et al. (2000) conducted a
study that examined the relationship between
conscientiousness and managerial performance. They suggest
that some of the qualities associated with the low-end of
the conscientiousness scale (i.e., nonconforming,
rebellious, and unconventional) are, at least some of the
time, linked to managerial success. It is unlikely that
managers who have extremely low scores on conscientiousness
would be successful as managers, but modest tendencies
towards some of these features may well be useful. In a
sample of 437 managers in the United Kingdom, Robertson et
al. found no relationship between conscientiousness and job
performance (r = .09). Instead, they found a negative
correlation between conscientiousness and job promotability
(r = -.20, p <.001, two-tailed) where both job performance
and promotability were determined by supervisor ratings. It

15
is suggested that although conscientiousness may be linked
to performance in many occupations, there is evidence that
it should not be considered the ‘g’ of personality related
to job performance. There are still other researchers that
call into question the statistical methodology of the meta-
analysis (Schmidt, Gooding, Noe, & Kirsh, 1984; Hermelin &
Robertson, 2001). Schmidt, Ones, and Hunter point out
several inconsistencies in the statistical methodology of
some of the meta-analytical findings and suggest,
“different decisions by meta-analysts (e.g., about which
studies to include) can result in somewhat different final
numerical results (correlation and effect size estimates)”
(1992, p.628). However, they purport that most differences
are not in the numerical results, but in the substantive
interpretations of results, which is not a fault of the
procedure itself.
Salgado (2003) reported that there are currently over
fifteen inventories that have been specifically developed
within the Five Factor Model (FFM) framework and used in
organizational settings. He urges the adaptation of these
FFM-based instruments as opposed to non-FFM-based
instruments. He found that Conscientiousness and Emotional
Stability (low end of Neuroticism scale) showed higher

16
operational validity when assessed by FFM-based instruments
than by non-FFM-based inventories. Considering that the
results of the meta-analytical studies mentioned above
suggest that these two factors may be the strongest link
between personality and performance, this is strong
evidence to support the use of FFM-based instruments in
personnel selection.
There is also a significant body of research linking
the FFM to other work-related criteria such as absenteeism
and counterproductive behaviors (Judge, Martochio, &
Thoresen, 1997; Salgado, 2002). Judge et al. (1997) found
that in a sample of 89 non-academic university employees,
the control variables and the Big Five traits accounted for
30% of the variance in absence. Conscientiousness and
extroversion were the strongest predictors, but part of
that relationship was mediated through absence history.
Salgado conducted a meta-analysis that examined the
relationship between the FFM and counterproductive
behaviors. He did not find a strong relationship between
any of the five factors and absenteeism (r = -.06 to .08)
or accident rates (r = -.09 to -.08), but did find that
conscientiousness (r = .26), and agreeableness (r = .20)
were valid predictors of deviant behaviors (e.g., theft,

17
drug and alcohol use). Salgado also found that the lack of
turnover was predicted by all of the five personality
dimensions. Emotional stability was the best predictor of
lack of turnover with an operational validity of rho = .35
(rho = r corrected for criterion reliability and range
restriction in predictor), followed by conscientiousness
with an operational validity of rho = .31, and
agreeableness with rho = .22. The data suggest that the FFM
cannot only be used to predict performance, but also
behaviors that are considered to be detrimental to
productivity.
The Bandwidth-Fidelity Argument There has been much discussion of the issue of
bandwidth-fidelity within the literature pertaining to
personnel selection and personality factors (Hogan &
Roberts, 1996; Ones & Viswesvaran, 1996; Paunonen,
Rothstein, & Jackson, 1999). The crux of this dilemma is
whether researchers and practitioners should use narrow or
broad traits when using personality factors to predict
performance. Murphy describes this dilemma: “In
psychological testing, there is an ‘inevitable’ trade-off
between attaining a high degree of precision in measurement

18
of any one attribute or characteristic, and obtaining
information about a large number of characteristics” (1993,
p. 139). The bandwidth-fidelity trade-off argument states
that broad, global, constructs should be able to predict
broad criteria with moderate validity. Conversely, narrow,
specific constructs should be able to predict specific
criteria with maximal validity (Ones & Viswesvaran, 1996).
This would suggest that narrow constructs would be
preferred by practitioners who have the goal of selecting
job applicants who will perform better at specific job-
related tasks.
Other researchers have argued that this bandwidth-
fidelity argument is just a statistical artifact and
broader traits should be used (Hogan & Roberts, 1996; Ones
& Viswesvaran, 1996). This position supports the current
climate of moving towards the Big Five personality factors
that have become widely accepted in the field of industrial
organizational psychology (Cascio, 1998). The Big Five
typology is extremely useful to researchers in that it
provides a common terminology to discuss and research
personality factors and it allows for the combination of
data from many different studies. This is a critical
component of theory development and testing (Ones &

19
Viswesvaran, 1996). By limiting the scope of these
instruments to standardized global factors, it lays the
corner stone for meta-analytic reviews of the research.
Thus, meta-analytically focused researchers who may be more
concerned with theory building often have very different
views than practitioners regarding the appropriate level of
analysis.
Ashton (1998) suggests that broad factor supporters
use the argument that test manuals indicate that the Big
Five traits have higher reliabilities than do the narrow
subscales, but that this actually follows directly from
psychometric theory. He indicated that any group of
positively intercorrelated subscales will produce a
composite scale whose reliability exceeds that of the
average of those subscales. Ashton argues that despite the
increase in reliability, it does not follow that the broad
scales will be a better predictor of a given criteria than
all of the narrow scales that constitute the broad scales.
He explores this issue in a study where he uses the scales
from the Jackson Personality Inventory as predictors of
performance with a sample of 127 entry-level employees. He
found that two narrow traits, Responsibility and Risk
Taking scales, had higher validities than the Big Five

20
dimensions with respect to job performance. He used a self-
reported measure of involvement in delinquent workplace
activities as his performance measure. The correlation of
the unit-weighted sum of the Responsibility and Risk Taking
scales was r = -.45, while he found the two most powerful
broad factors (agreeableness and conscientiousness) to have
a unit-weighted sum correlation of r = -.38. No other
factor yielded a statically significant correlation with
delinquency. Although the narrow factors were found to be
only slightly better predictors, this study provides clear
evidence that narrow factors should not be ignored simply
because they are not as useful in meta-analytical research.
Contextual and Task Performance Another pertinent issue in the job performance
literature is the difference between contextual and task
performance. Borman and Motowidlo defined task performance
as “the effectiveness with which job incumbents perform
activities that contribute to the organization’s technical
core either directly by implementing part of its
technological process, or indirectly by providing it with
needed materials of services” (1997, p. 99). For example,
the task performance dimensions for the job of a

21
firefighter include performing rescue operations,
conducting salvage operations, and applying ventilation
procedures. Each one of these specific tasks relates to the
individual’s overall job performance.
Borman and Motowidlo (1997) argue that contextual
performance is fundamentally different from task
performance. Contextual performance does not support the
technical performance directly, but instead, it creates and
maintains the psychological, social, and organizational
environment in which the task performance takes place
(Borman & Motowidlo, 1993; Hogan, Rybicki, Motowidlo, &
Borman, 1998). Contextual performance involves such
behaviors as volunteering to participate in tasks that are
not formally part of the job and working with others within
the organization to get tasks completed. Contextual
performance is similar to the concept of organizational
citizenship behavior (OCB), which was originally introduced
by Smith, Organ, and Near (1983). Borman, Penner, Allen,
and Motowidlo (2001) purport that an important distinction
between task performance and contextual performance is that
task activities vary across jobs and citizenship activities
are similar across jobs.

22
Many researchers have also found empirical evidence
that supports the distinction between contextual and task
performance. Conway (1996) conducted a study using a
multitrait-multirater analysis that provided construct
validity in the task/contextual performance distinction.
He found higher correlations for dimensions within a domain
(.70 and .70 for task and contextual performance) than
between domains (mean correlation = .55). Motowidlo and Van
Scotter (1994) explored how each domain related to an
overall rating of performance. They found that the
correlation between task performance and overall
performance ratings was .43. The correlation between
contextual performance and overall performance ratings was
.41. This evidence lends support to the idea that task and
conceptual performance are both related to overall
performance.
Hurtz and Donovan (2000) conducted a meta-analysis
that examined the relationship between the Big Five and
contextual performance. This study was conducted by
partitioning performance into the following categories:
task performance, job dedication, and interpersonal
facilitation. They found that conscientiousness predicted
all three of the performance dimensions equally well (pv =

23
.15 - .18) and the same was found for emotional stability
(pv = .15 - .16). However, agreeableness emerged as a
potentially valid predictor, predicting interpersonal
facilitation just as well as conscientiousness and
emotional stability. The authors suggest that the
relationship between personality and performance may be
more complex and not as strong as other researchers have
suggested. They purport that factors other than
conscientiousness may have an impact on performance
depending on the type of job and the importance of
contextual factors. They strongly urge that more research
be conducted in this area. Mount, Barrick, and Stewart
(1998) found similar results and concluded that
conscientiousness, agreeableness, and emotional stability
are positively related to performance in jobs involving
interpersonal interactions. Their findings also suggest
that emotional stability and agreeableness are more
strongly related to performance in jobs that involve
teamwork (r = .27 and r = .33, respectively) than in jobs
that do not (r = .12 and r = .13, respectively).

24
RIASEC Theory There is also a large body of research that focuses on
how occupational identities and work environment affect
performance (Fritzsche, Powell, & Hoffman, 1999; Hogan &
Shelton, 1998). Holland (1973) classified people and work
environments as six types: realistic (R), investigative
(I), artistic (A), social (S), enterprising (E), and
conventional (C). Holland purports that both people and
work environments can be classified using his taxonomy and
that people tend to seek out work environments that are
congruent with their personalities. Person-environment
congruence is expected to lead to positive outcomes for the
individual, such as greater work achievement and job
satisfaction. Hogan and Shelton (1998) purport that people
choose their occupations based on their personalities, and
employer’s appraisals of their performance are influenced
by how well those identities are conveyed to them.
Fritzsche, McIntire, and Yost (2002) conducted a study
that explored the value of using Holland’s personality and
work environment types as a moderator to improve
predictions of the personality-performance relationship.
They found that across all participants, personality
accounted for only 2-3% of the variance in performance, but

25
when the data were analyzed by RIASEC type, they accounted
for more than 9% of the variance. Results indicated that
agreeableness was a better predictor of performance in
investigative, artistic, and social environments than in
realistic, enterprising, and conventional environments.
Conscientiousness appears to best predict performance in
social and investigative environments. This adds additional
support to the argument against viewing conscientiousness
as the ‘g’ of the personality-performance relationship and
suggests that individual and job-environment interaction
needs to be explored further to better understand its
impact on performance.
Situational Constraints There is a growing body of research that looks at the
role that situational constraints play in job performance.
Situational constraints are those aspects of a job that are
outside of the control of the employee. In their early work
in this area, O’Connor et al. (1984) operationally defined
situational constructs to include job-related information,
tools and equipment, materials and supplies, budgetary
support, required services and help from others, task
preparation, time availability, and work environment.

26
O’Connor et al. found that situational constraints
correlated -.12 (p < .001) with overall performance. These
correlations were much lower than expected. More recent
studies have begun to call these early results into
question. Villanova (1996) argues that most of the findings
from these early studies are contaminated by poor research
design. For example, Villanova calls into question the
exclusive use of single-panel designs and poorly developed
self-report constraint information. In another study, Kane
(1997) attempted to control for some of the deficiencies in
the early research and found that a perceived constraint
measure explained 69.7% of the variance in the performance
measure. It would appear that situational constraints may
play a larger role in performance measures then previously
thought.
This is an important development in terms of personnel
selection. The goal in constructing a personnel selection
battery is to make a strong connection between pre-
employment selection measures and performance. If
performance were artificially suppressed due to external
factors, it would have a direct effect on this
relationship. The amount of situational constraint is
obviously job specific. Certain jobs where there is a lot

27
of autonomy, such as outside sales, may have few
situational constraints, while other jobs, such as working
on an assembly line, may have significant situational
constraints. Additionally, Kane (1997) purports that
situational constraints vary between different tasks within
a particular job. Performance on some tasks may receive
little or no influence from situational constraints while
performance on other tasks may be almost totally dictated
by situational constraints. Therefore, researchers in
personnel selection should be aware of the impact of
situational constraints for each measure of performance
that they use.
Score Correcting
The issue of how to best control for participants
trying to present themselves in the best possible light
needs to be taken into consideration when discussing
personality-based selection instruments. Hogan and Hogan
(1992) suggest that the possibility that personality
measures are susceptible to dissimulation is probably the
most frequently cited criticism regarding the use of
personality measures in applied settings. Hough et al.
(1990) found that a faking response set failed to moderate

28
the relationship between a personality measure and job
performance. They conclude that correcting for faking is
not necessary when using personality measures for selection
purposes.
Christiansen et al. (1994) conducted a study that
specifically examined how faking influenced a selection
model based on the 16PF. Their study examined the results
of 495 assessment center candidates in a large forestry
products organization. They used both the Krung approach
and the partialling approach to correction. They found that
all multiple correlations were within the .36 to .39 range,
regardless of whether a correction for faking was used or
not. The authors conclude that corrected scores should not
be used and that if faking is suspected, it is better
advised to use the faking scales as predictors in a
multiple regression equation along with other relative
traits.
Legal Issues
There are numerous legal issues that arise when using
personality measures as pre-employment selection tools.
Cascio (1998) points to several key case law decisions that
affect the employee selection process. The Supreme Court

29
found in Griggs v. Duke Power Company (1971) that any given
requirement for employment has to be related to job
performance. The Supreme Court went on to find in Albemarle
Paper Co. v. Moody (1974) that organizations not only have
to show that a pre-employment test is relevant for
employees at that organization in general, but the test is
relevant for the specific job for which that applicant
applied. Therefore, an organization can legally use any
measure, including personality measures, as long as that
organization empirically proves that the measure is related
to the performance of the specific job that the applicant
is applying for. All organizations are required to
empirically validate any selection measure if any
subgroup’s performance on the measure is less than 80% of
the level of the highest performing subgroup.
A second issue that arises when using personality
measures for selection purposes is whether or not the
measure meets the guidelines set forth by the American
Disabilities Act of 1990 (ADA). As noted by Cascio,
“Section 102 (c)(3) of the ADA specifies that an employer
may not ‘conduct medical examinations or make inquiries
about the existence, nature, or severity of a disability of
a job applicant until after making a conditional offering

30
of employment, and then only when the results of the
medical examination are job related” (1994, p. 199).
Therefore, if a personality measure’s primary purpose is to
diagnose psychological disorders, it may be problematic to
use that instrument for pre-employment selection purposes.
Inwald and Resko (1995) purport that certain tests
such as the Minnesota Multiphasic Personality Inventory
(MMPI), because of their diagnostic nature and their
prominence in medical settings, should not be used as a
pre-employment selection instrument. But what about other
personality measures, such as the Sixteen Personality
Factor Questionnaire (16PF) and the Myers-Briggs Type
Indicator (MBTI), which are sometimes used in medical
settings but differ from the MMPI in that they are less
diagnostic of psychopathology in nature and were developed
to be used with normal populations instead of clinical
populations? Inwald and Resko (1995) argue that any
instrument used in any medical setting is in direct
violation of the ADA guidelines. Cascio (1994) takes a
slightly more moderate stance on the issue. He argues that
the important issue is the intended use of the results of
the measure. Cascio states that employers should be able to
use a broad range of personality measures during pre-
31
employment screening “as long as the purpose of the
assessment is to predict necessary, job-related behavior,
rather then to diagnose disability” (1994, p. 200). To be
safe, practitioners should be vigilant in following any
regulations made by the Equal Employment Opportunity
Commission (EEOC) or any relevant legal case decisions.
Posthuma (2002) makes the argument that selection
procedures, such as personality tests, can be used even if
they have an adverse impact on a particular group, as long
as the employer can justify the selection procedure. He
provides a detailed legal framework of how to justify the
use of a selection procedure with adverse impact. He
stated:
In general, the Guidelines (Uniform Guidelines for
Employee Selection) require employers to collect data
to determine if their selection practices have adverse
impact. If there is adverse impact, the Guidelines
state that selection practices should be both
validated and evaluated for fairness to the extent
feasible. The Guidelines also specify how test
validation should proceed. Finally, the Guidelines
indicate that test users should consider the

32
usefulness of alternative tests, which may reduce
adverse impact (2002, p. 62).
Posthuma further suggests that changes mandated by federal
legislation and the courts, along with professional
organizations such as APA and SIOP updating their testing
guidelines, may prompt the EEOC to consider revising its
guidelines in the near future.
Statement of Problem
All of the issues discussed thus far regarding the use
of personality testing for selection are relevant in
applied settings. The organization in this study has made
some unique attempts to use personality testing in their
selection process while staying within legal boundaries.
How the organization uses personality instruments differs
significantly from common practice. This organization has a
consultant administer the 16PF to perspective employees.
However, instead of using the test results to determine if
the perspective employee has personality traits that are
empirically related to performance, they have the
consultant generate a list of applicant-specific, job-
relevant interview questions that are then used by the
organization during a subsequent interview. These

33
behaviorally-based questions help the hiring manager probe
areas of potential concern (e.g., low group orientation or
low rule consciousness).
It is not the purpose of this study to explore the
legality of this strategy, rather, this company’s selection
process provides a unique set of data that allow for the
examination of the effectiveness of their approach to
selection testing. It also allows for the comparison of
such a process to empirically-based approaches such as
profile matching.
The study will first address the broad question of how
useful personality measures, specifically the 16PF, are in
predicting job performance in a small manufacturing
setting. Although this study focuses on a small
manufacturing setting that emphasizes a team-based work
environment, which differentiates it from most other
studies in the literature, this part of the study should
still be viewed as a basic replication study. The
organizational culture and structure is primarily focused
on contextual performance in that all production activities
are done through a team-based approach. As mentioned
before, there is significant evidence supporting the use of
personality measures in predicting job performance,

34
including contextual performance. Since the relationship
between personality and job performance appears to be
rather robust, it is hypothesized that the 16PF will be
able to identify differences in successful and unsuccessful
press operators’ personality profiles. It is felt that the
16PF addresses a wide range of personality factors that are
relevant towards job performance and, therefore, will be
able to identify differences in successful and unsuccessful
employees. If this hypothesis is supported, this study will
add further support to the link between personality and
performance in the personnel selection literature.
The second research question that will be addressed
concerns the use of personality measures in a team-based
organization. It is widely accepted that if personality
measures are going to be used for selection purposes, they
need to be linked to specific job-related behaviors
(Cascio, 1998; Robertson & Smith, 2001). Typically, this
involves linking personality characteristics to specific
work-related behaviors for a particular job title. It seems
logical that different sets of personality characteristics
could be linked to performance on different types of jobs.
How does this logic apply to an organization that is team-
based where the stated primary performance goal for all of
35
its employees is being a “good” team member? Should the
organization still look for a job-specific personality
profile or should they attempt to develop an organization-
wide personality profile? It is hypothesized, due to
situational constraints and other job-specific variables,
that greater differences in personality profiles between
successful and unsuccessful employees will be found when
contrasting job-specific profiles. If validated, this would
provide support for the current practice of developing job-
specific profiles even when the performance criteria are
not job specific.
The third research question that this study addresses
is the bandwidth-fidelity question discussed earlier. The
design of the 16PF allows for the unique opportunity to not
only examine the instrument's utility as a selection tool,
but also to compare narrow and broad traits. The 16PF
reports on sixteen narrow factors and five global factors
(described later). This study will examine which type of
traits (narrow or broad) are better predictors of job
performance. It is hypothesized that the narrow scales will
prove to be better predictors of performance in this
setting. If this hypothesis is supported, it will provide
additional evidence that narrow factors should not

36
arbitrarily be rejected in favor of broad factors due to
the recent wave of meta-analytical research focusing on the
Big Five. It will lend support to the practice of using
narrow factors if it can be proven that they are, in fact,
better predictors in a particular setting.
The final issue that the study will address is whether
or not the organization’s current selection procedures, in
which personality measures are given only to help generate
interview questions, are effective. It is hypothesized that
using this non-empirically based method of administering
personality measures for selection purposes will not be a
valid means of selection. This will be determined through a
backwards cross-validation procedure. If this hypothesis is
supported, it will further strengthen the argument that
empirical validation studies are a critical component when
using personality measures for selection purposes.

37
CHAPTER III
METHOD
The purpose of this study was to examine the ability
of the 16PF to discriminate between successful and
unsuccessful employees in a small, team-based manufacturing
organization. As part of this analysis the issue of whether
broad or narrow personality traits serve as better
predictors of job performance, along with the issue of
whether or not company-wide profiles are appropriate when
used in team-based organizations was addressed.
Additionally, the study examined the effectiveness of the
company’s current selection procedures.
Participants The participants in this study were prospective
employees who were tested as part of their application for
employment procedures at a mid-western manufacturing
company. Over a three-year time period 363 applicants (275
male and 88 female) were tested. Of these 363 applicants,
129 (103 male and 26 female) were selected for employment
with the organization. Appendix A lists all of the jobs
that applicants applied for and the percentage of
applications that correspond with each of those jobs. The

38
company produces printed plastic packaging materials, which
involves the use of multiple large-scale industrial
printing presses. The primary entry-level job applicants
were applying for was the Assistant Press Operator (APO)
position, the job for which 211 of the 363 applicants
tested were applying. The size of the final group of
participants who were hired and analyzed in the Assistant
Press Operator comparisons was 80 employees (76 male and 4
female). A power analysis for a zero-order correlational
analysis with N = 80 yielded a power (1-β) of .4367 (α =.05,
r = .20). A power analysis for all hired employees (N =
129) yielded a power (1-β) of .6323 (α = .05, r = .20).
Finally, a power analysis for the entire applicant pool (N
= 363) yielded a power (1-β) of 97.24 (α =.05, r = .20)
(Buchner, Faul, & Erdfelder, 1997). The r = .20 level was
chosen based on Batram’s (1995) findings of r’s in the .20
to .30 range using the 16PF. Job requirements varied by
position. There were no minimum educational requirements
for the job of Assistant Press Operator, so applicants had
a wide range of educational backgrounds. The sample sizes
for each of the groups that will be compared are presented
in Table 2.

39
Table 2. Sample Sizes for Each Comparison Group Level N Research Question Successful Employees Job-Specific 28 1,2,3 Unsuccessful Employees Job-Specific 17 1,2,3 Successful Employees Company-Wide 50 1,2,3,4 Unsuccessful Employees Company-Wide 27 1,2,3,4 Hired Applicants Company-Wide 129 4 Not Hired Applicants Company-Wide 234 4
Instruments
Sixteen Personality Factor Questionnaire. The Sixteen
Personality Factor Questionnaire (16PF) is an instrument
that provides a total of twenty-four scales, which include
sixteen primary factor scales, five global scales, and
three validity scales (Russell & Karol, 1994). Cattell
developed the 16PF through factor analysis of questions
that were believed to be related to personality. He
identified 16 traits he considered to be “primary” to human
personality (Mitchell, 1985). The scales are: reserved vs.
warm (A), concrete reasoning vs. abstract reasoning (B),
reactive vs. emotionally stable (C), deferential vs.
dominant (E), serious vs. lively (F), expedient vs. rule-
conscious (G), shy vs. socially bold (H), utilitarian vs.
sensitive (I), trusting vs. vigilant (L), grounded vs.
abstracted (M), forthright vs. private (N), self-assured
vs. apprehensive (O), traditional vs. open to change (Q1),

40
group-oriented vs. self-reliant (Q2), tolerates disorder
vs. perfectionistic (Q3), and relaxed vs. tense (Q4). The
five global scales are Extroverted vs. Introverted (EX),
High Anxiety vs. Low Anxiety (AX), Tough-Minded vs.
Receptive (TM), Independent vs. Accommodating (IN), and
Self-Control vs. Unrestrained (SC). The 16PF also includes
three validity scales: impression management (IM),
infrequency (INF), and acquiescence (ACQ). The 16PF
contains 187 items and requires from 25 to 50 minutes to
complete. The 16PF can be scored using male, female, or
combined norms. In this case, the company had previously
chosen to use the combined norms and, therefore, that data
will be used in the current analysis. Hofer and Eber (2002)
note that the 16PF has been included in over 2100
publications since 1974.
The 16PF is better suited for personnel selection
purposes than some of the other personality inventories
such as the Minnesota Multiphasic Personality Inventory-2
(MMPI-2) because it is primarily concerned with measuring
personality attributes of normal rather than pathological
populations (Walsh & Betz, 1995). Since the 16PF was
designed to be used with normal populations, it is

41
conceptually better suited for use in organizational
settings.
The 16PF was originally published in 1949. One of its
main strengths is that it is a well-established research
instrument that has withstood the test of time. There is a
vast body of research supporting both validity and
reliability issues with the 16PF. Items on the most recent
edition, the fifth edition, have been revised to update
language, remove ambiguity, and diminish unnecessary
length. Items were also reviewed for gender and racial bias
(Rotto, 1995). For the fifth edition, which was published
in 1994, data indicate test-retest reliability coefficients
of scores from the 16PF for a two-week period were very
good for the global factors (ranging from .84 to .91).
Test-retest reliability coefficents for scores on the
primary factors ranged from .69 to .91. At the two-month
interval, test-retest reliability dropped to a mean of .78
for scores on the global factors and a mean of .70 for
scores on the primary factors. Internal consistency was
calculated with Cronbach’s coefficient alpha and values
ranged from .64 to .85 with a mean .74. The standard error
of measurement is within an acceptable range given the
purpose and scope of the test (McLellan, 1995).

42
The five global factors on the 16PF were developed
through factor analysis of the primary scales (Russell &
Karol, 1994). These global factors have traditionally been
called “second-order” factors in the 16PF literature.
Cattell (1993) argues that although the global factors on
the 16PF were developed long before the advent of the “Big
Five,” the two line up relatively well. Conn and Rieke
(1993) found the NEO Personality Inventory (NEO-PI)
Neuroticism dimension lines up with the 16PF Anxiety factor
(r = .75); the two Extroversion dimensions also correlate
well (r = .65); the NEO-PI Conscientiousness dimension
corresponds to the 16PF Self-Control (r = .66); the NEO-PI
Openness to Experience factor corresponds to the low end
(sensitivity, intuitive, open to change, imaginative) of
16PF Tough-Mindedness (r = .56); and the NEO-PI
Agreeableness factor correlates with the low end
(Accommodating) of the 16PF Independence (r = .42).
Job Performance Employees were classified as successful employees or
unsuccessful employees based upon whether or not they were
a current employee or had been involuntarily terminated.
This method was chosen due to inconsistencies and constant

43
changes in other types of performance records the company
collected. This approach for classification may be
considered vague in some situations, but is well suited for
this particular setting because of the organization’s
termination procedures. The organization has worked very
closely with a legal consultant to develop a strict
termination policy. Involuntary termination must be based
on very specific criteria that are related to individual
and team performance. Employees are given an Unacceptable
Performance Notification (UPN) if they are not in
compliance with company standards. A UPN can be classified
as a major or minor violation. Two minor violations or one
major violation is cause for dismissal.
Involuntarily terminated employees were chosen to
represent the unsuccessful group after talking with company
management. Management reported that the economic
environment in the community where the company is located
was thriving during the period of time when the data were
collected and that the company actually had difficulty
remaining fully staffed. It was common for employees to
leave because another near-by company offered them higher
wages. Management indicated that employees who left
voluntarily typically included some high performers and,

44
thus, were not a good sample of unsuccessful employees;
whereas, all employees who were involuntarily terminated
were considered to be unsuccessful by management.
Therefore, success in this study is defined as not being
involuntarily terminated.
Procedure The company contracted an outside consultant to
administer the 16PF to all qualified job applicants from
1997 until 2000. A qualified applicant is an applicant who
has passed the company’s initial screening interview that
focuses mainly on criteria such as relevant work history
and references. The 16PF test results have been archived by
the organization’s human resources manager along with
employment records. This information was made available for
the purpose of this study.
All data were collected through the human resources
manager and entered by the researcher for analysis. Data
were collected in a manner where only a representative from
the company had any direct contact with the personnel
records to assure that complete confidentiality was
ensured. The only data that were collected were the gender
of the applicant, the job title for which they applied,
45
whether or not they were selected for employment, their
current employment status (i.e, currently employed,
voluntarily terminated, involuntarily terminated), and
scores from the 16PF profile. Each profile was assigned an
anonymous identification number and the researcher never
had any contact with the actual employees or any
documentation that included their names or identifying
information. Profile analysis was used to detect
differences between the personality profiles of each of the
groups. Data analysis was conducted using the SPSS and SAS
statistical packages.
Data Analysis
There are many ways in which personality profiles have
been dealt with in the literature (Edwards, 1993; Stevens
1986; von Eye 1990). Some measures call for the aggregation
of profiles into groups, such as high and low performers,
and then the examination of the differences between the
profiles. This approach is what Stevens (1986) refers to as
a profile analysis, and is best suited for examining
differences between two or more naturally occurring groups.
There are several different approaches that researchers can
employ to analyze profile data (von Eye, 1990; Waller &

46
Meehl, 1998), but due to the sample size restraints that
often occur in practical applications, many researchers and
practitioners alike use what is known as profile similarity
indices (PSI) when comparing different groups of profiles
(Edwards, 1993, 1994).
Edwards (1993) argues that the term PSI is a broad
term that is used to describe an approach that compares
profiles on two different levels. One of these categories
consists of indices that are derived from the sum of the
differences between profile elements. For example, D2
represents the sum of the squared differences between the
profile elements. This does not indicate the direction of
any of the differences for any of the elements. The second
category of PSIs consists of indices representing the
correlation between two profiles. Each of these statistics
gives information about the profiles that are independent
of one another. It is critical that both of the procedures
be conducted because having both pieces of information is
the only way in which the profile can be looked at as a
whole. For example, if a researcher chose only to use the
mean difference in comparing two profiles, there is a
possibility that the mean differences of each of the scales
would be exactly the same, but the shape of the two

47
profiles could be radically different. This is because the
mean differences do not take into account on which scales
the differences occur. Thus, both methods must be used.
Ideally, the profile of a good job applicant would have a
high correlation with the “good performance” profile and
have a low mean difference.
The previous approach to analyzing profiles is often
used in predicting future job performance for job
applicants. Arthur, Woehr, and Graziano suggest that this
approach is very useful in the person-organizational fit
framework in that it takes into account the “totality of an
applicant’s personality” (1997, p. 12). This approach is
ideally suited for a study that is comparing profiles from
two groups of participants who are classified by a
categorical variable such as the classification of
successful and unsuccessful employees.
In this study, all of the applicants were first
classified by the job they were applying for and whether or
not they were hired. Next, all hired employees were
classified by their employment status: current employee,
voluntary termination, or involuntary termination. All 16PF
data were entered and mean profiles for the following

48
groups were generated using both the five global factors
and the sixteen narrow factors:
1. Hired Applicants 2. Non-Hired Applicants 3. Hired Assistant Press Operator Applicants 4. Non-Hired Assistant Press Operator Applicants 5. Current Employees 6. Involuntarily Terminated Employees 7. Current Assistant Press Operators 8. Involuntarily Terminated Assistant Press Operators
The results from those profiles were analyzed in a
series of paired comparisons and the first three research
questions were answered by the following sets of
comparisons: Successful vs. Unsuccessful (company-wide) and
Successful vs. Unsuccessful (APO). Separate profiles were
developed using both the sixteen narrow factors and the
five broad factors.
First, a descriptive correlation was conducted, which
involves graphically superimposing one group’s profile over
the other, visually inspecting the shape of the profiles,
and then calculating the correlation of the means of the
two groups on each of the scales. If the 16PF is
differentiating between the two profiles, then there should
be noticeable differences in the overall general shape of
the two profiles and the correlations should be low. Next,
the differences on each of the scales were assessed by

49
calculating the effect size (d) for the scores from the two
groups on each of the scales. The effect sizes were
calculated using the pooled standard deviations. After the
effect sizes were calculated, they were corrected for
unreliability using the formula purposed by Hunter and
Schmidt (1990). The formula corrects for unreliability by
dividing the effect size by the square root of the
reliability coefficient (r) listed the 16PF manual. The
16PF manual only provides reliability coefficients for the
16 narrow factors so the reliability coefficients for the
broad factors had to be computed using the procedure
described by Mosier (1943) from: the primary scale
intercorrelation matrix; the primary factor alphas; and the
second-order factor score weights. The reliability
coefficients for the broad factors are presented in Table
3. These results are similar to what Bartram (1992) found
when using a prior version of the 16PF.
Table 3 Broad Factor Reliability Coefficients Broad Factors Alpha Bartram Results Extraversion 0.90 0.90 Anxiety 0.89 0.92 Tough-Mindedness 0.81 0.71 Independence 0.79 0.89 Self-Control 0.85 0.82

50
If the profiles of the two groups are different then
the shape of the two profiles will be different and the
effect sizes on each of the scales will be large. The
average of the absolute effect sizes (mean of corrected
|d|) from each of the individual scales will be calculated
so that the difference in the sixteen-factor comparison can
be compared to the difference in the five-factor
comparison. This was critical in answering the third
research question regarding broad and narrow traits.
Finally, a logistic regression was performed in which
each of the scales from the 16PF were used as predictors
with current job status (successful employee vs.
involuntarily terminated employee) as outcome. A logistic
regression was conducted for each of the comparisons and
addresses how well the factors as a whole predict success.
The same analytical procedure was used to answer the
fourth research question that examines the company’s
current selection process. A backwards cross-validation
procedure was conducted to see how well the current
selection procedure discriminated between successful and
unsuccessful employees. The profiles of all applicants who
were hired were compared first to the profiles of employees
who were successful and then to profiles of unsuccessful

51
Hired Applicants
Not Hired Applicants
Successful Employees
Unsuccessful Employees
Similar Different
employees. If the current selection procedure is effective,
the profiles of applicants who were hired should be similar
to the profiles of successful employees and be dissimilar
to profiles of unsuccessful employees. Profiles of
applicants that were not hired should be similar to
unsuccessful employees and dissimilar to successful
employees. This model is presented in Figure 1. If all four
of these tenets are met, then it will provide evidence that
the company’s current selection process of generating
interview questions from the results of the 16PF is
effective.
Figure 1. Ideal Cross Validation Results

52
CHAPTER IV
RESULTS
This chapter presents the statistical results obtained
from the research data. The first three research questions
(which are all inter-related) will be addressed in the
first part of the data analysis and the fourth research
question will be addressed in the second part of the
analysis. The results are organized in this manner because
the first three research questions are answered by
comparing the same sets of data (successful vs.
unsuccessful employees) on both the broad and narrow
factors, comparing both job-specific and company-wide
profiles. The second stage of the analysis will examine the
utility of the organization’s current selection procedures.
Research Questions One, Two, and Three
According to the first hypothesis, the 16PF should be
able to predict differences between successful and
unsuccessful employees. This question was addressed by
analyzing the profiles of employees who were considered to
be successful versus the profiles of employees who were
involuntarily terminated (unsuccessful). The second
hypothesis states that job-specific profiles should be able

53
to discriminate better between successful and unsuccessful
employees than company-wide profiles. The third hypothesis
suggests that the sixteen narrow factors will be more
effective than the five broad factors in discriminating
between high and low performers. All of these questions
will be answered by the following comparisons:
1. Assistant Press Operators (APO) a. Successful vs. Unsuccessful (16 Factors) b. Successful vs. Unsuccessful (5 Factors)
2. All Employees (company-wide) c. Successful vs. Unsuccessful (16 Factors) d. Successful vs. Unsuccessful (5 Factors)
Job Specific Sixteen Factor Comparison. The first step
in the profile comparison was to create a graphical
representation of the means of the two groups (Appendix B).
It was hypothesized that the shape of the two graphs would
be different. If true, the correlation between the two
profiles should be low and the effect sizes should be
large. An examination of the graphed results reveals that
the overall shape of the two profiles was found to be
similar and the means are highly correlated (r = .92). The
descriptive statistics and effect sizes are presented in
Table 4. The involuntarily terminated group scored higher
on all but four scales across the profile (Scales B, C, G,
and Q3). Successful employees tend to be more trusting,

54
relaxed, organized, and emotionally stable, while
unsuccessful employees tend to be more suspicious, tense,
flexible, and reactive. The average of the absolute d
values were calculated as an overall measure of how well
the sixteen factors as a whole differentiated between the
two groups (mean of corrected |d|= 0.37).
Next a direct logistic regression analysis was
performed on job status as outcome and personality factors
as predictors: the sixteen narrow personality factors from
the 16PF. Analysis was performed using the binary logit
model in SAS. Each of the assumptions outlined by
Tabachnick and Fidell (2001) were checked and problems were
found with convergence. There was evidence of
multicollinearity and the analysis could not be completed.
Results showed that a complete separation of data points
was detected and, therefore, the validity of the model fit
is questionable. The N for this comparison was 45 assistant
press operators with only 17 in the involuntarily
terminated group. The small sample size, particularly in
the involuntarily terminated group, is likely contributing
to these results. It should be noted that this is the only
comparison where the assumptions were not met and the
logistical regression could not be conducted.

55
Table 4 Descriptive Analysis: 16 Narrow Factors (APO)
95% Confidence Cor- Range Interval for d rected Variable Mean SD Lower Upper d Lower Upper d r A -0.14 -0.74 0.47 -0.17 -0.07 Successful 5.18 1.66 1 9 Unsuccessful 5.41 1.66 4 9 B 0.16 -0.44 0.76 0.18 0.08 Successful 4.57 2.10 2 10 Unsuccessful 4.24 1.92 1 C 0.50 -0.12 1.10 0.57 0.24 Successful 7.64 1.37 5 9 Unsuccessful 6.94 1.44 5 9 E -0.20 -0.80 0.41 -0.25 -0.10 Successful 6.04 2.10 2 10 Unsuccessful 6.41 1.37 3 8 F -0.33 -0.93 0.28 -0.39 -0.16 Successful 6.00 1.39 4 9 Unsuccessful 6.53 1.94 2 9 G 0.17 -0.43 0.77 0.20 0.09 Successful 7.29 1.63 4 9 Unsuccessful 7.00 1.73 4 9 H -0.40 -1.00 0.21 -0.43 -0.20 Successful 6.75 1.86 3 9 Unsuccessful 7.47 1.66 4 9 I 0.06 -0.55 0.66 0.07 0.03 Successful 3.25 1.08 1 6 Unsuccessful 3.18 1.38 1 7 L -0.80 -1.41 -0.16 -0.93 -0.37 Successful 5.11 1.50 2 9 Unsuccessful 6.35 1.62 4 9 M -0.35 -0.96 0.26 -0.41 -0.18 Successful 4.18 1.64 2 7 Unsuccessful 4.76 1.64 3 8 N -0.25 -0.85 0.36 -0.29 -0.12 Successful 4.54 1.73 1 9 Unsuccessful 4.94 1.39 2 7 O 0.04 -0.56 0.64 0.05 0.02 Successful 4.00 1.33 2 7 Unsuccessful 3.94 1.89 1 7 Q1 -0.38 -0.98 0.24 -0.48 -0.19 Successful 4.79 1.34 2 8 Unsuccessful 5.29 1.31 3 7 Q2 -0.01 -0.61 0.60 -0.01 -0.00 Successful 3.46 1.43 1 7 Unsuccessful 3.47 1.23 2 5 Q3 0.55 -0.07 1.15 0.65 0.26 Successful 7.32 1.19 5 9 Unsuccessful 6.47 2.00 2 9 Q4 -0.71 -1.31 -0.07 -0.82 -0.33 Successful 2.43 1.43 1 6 Unsuccessful 3.65 2.15 1 8

56
Job-Specific Five Factor Comparison. Next the same
analysis was conducted using the five global factors on the
16PF to compare the same two groups (successful and
involuntarily terminated). It was again hypothesized that
the shape of the two graphs would be different. If true,
the correlation between the two profiles should be low and
the effect sizes should be large. The graphical
presentation of the means of the two groups is presented in
Appendix C. An examination of the graphed results reveals
that the overall shape of the two profiles were again found
to be similar and the means are highly correlated (r =
0.94). The descriptive statistics and effect sizes are
presented in Table 5. The involuntarily terminated group
scored higher on three of the five scales (Scales EX, AX,
and IN). Successful employees tend to be less anxious, more
self-controlled, and more accommodating, while unsuccessful
employees tend to be more anxious, unrestrained, and
independent. Again, the average of the absolute d values
was calculated as an overall measure of how well the five
factors as a whole differentiated between the two groups
(mean of corrected |d|= 0.50).

57
Table 5
Descriptive Analysis: Five Broad Factors (APO) 95% Confidence Cor- Range Interval for d rected Variable Mean SD Lower Upper d Lower Upper d r EX -0.14 -0.74 0.47 -0.15 -0.07 Successful 6.75 1.21 9 4 Unsuccessful 6.94 1.68 5 10 AX -0.75 -1.36 -0.12 -0.80 -0.35 Successful 2.68 1.28 1 5 Unsuccessful 3.88 2.03 1 7 TM 0.22 -0.39 0.82 0.24 0.11 Successful 7.43 1.43 3 10 Unsuccessful 7.12 1.45 4 10 IN -0.59 -1.19 0.03 -0.66 -0.28 Successful 5.93 1.59 3 9 Unsuccessful 6.76 1.03 4 8 SC 0.61 -0.02 1.21 0.66 0.29 Successful 7.36 1.31 4 9 Unsuccessful 6.53 1.46 3 9
Next a direct logistic regression analysis was
performed on job status as outcome and the five personality
factors as predictors: the five global factors from the
16PF. Analysis was performed using the binary logit model
in SAS. All of the assumptions mentioned by Tabachnick and
Fidell (2001) were met. There were no missing data and
parameter estimates were in good range. Therefore, there
was no need to conduct the EM Correlations procedures
suggested. None of the cells have an expected frequency
that is less than five. Therefore, there is no restriction
on the goodness-of-fit criteria to evaluate this model. The
assumption of linearity in the logit was met and all of the
predictors were found to be non-significant when

58
interactions among them were examined. The SAS analysis
shows that there is no problem with convergence, nor are
the standard errors for parameters exceedingly large.
Therefore, no multicollinearity is evident. Finally, there
was adequate model fit, therefore there is no need to
search for outliers in the solution.
A test of the full model with all five predictors
against a constant-only model was not statistically
reliable, X2 (5, N = 45) = 10.66, p = .0584, which means
all of the predictors as a set, do not distinguish between
assistant press operators who were successful and those who
were involuntarily terminated.
Table 6 shows regression coefficients, Wald
statistics, odds ratios, and 95% confidence intervals for
odds ratios for each of the five predictors. According to
the Wald criterion, none of the five factors reliably
predicted success at the p < .05 level.
Table 6
Logistic Regression Analysis of Success as a Function of the Five Broad Factors from the 16PF (Press Operator) 95% Confidence Wald Test Odds Interval for Odds Ratio Variable B (z-ratio) Ratio Upper Lower EX -0.18 2.25 0.84 0.66 1.06 AX –0.02 0.04 0.98 0.79 1.21 TM -0.13 1.26 0.88 0.70 1.10 IN -0.04 0.16 0.96 0.78 1.18 SC -0.13 1.08 0.88 0.69 1.12

59
Organization-Wide Sixteen Factor Comparison. The same
analytical process was used to compare the profiles between
successful employees and involuntarily terminated employees
across the company as a whole. It was again hypothesized
that the shape of the two groups would be different. If
true, the correlations between the two profiles should be
low and effect sizes should be large. The graphical
presentation of the means of the two groups is presented in
Appendix D. An examination of the graphed results reveals
that the overall shape of the two profiles was again found
to be similar and the means are highly correlated (r =
0.93). The descriptive statistics and effect sizes are
presented in Table 7. The involuntarily terminated group
scored higher on nine of the sixteen scales (Scales E, F,
G, H, I, L, M, N and Q4). Successful employees tend to be
more trusting, relaxed, forthright, and emotionally stable,
while unsuccessful employees tend to be more suspicious,
tense, private, and reactive. Again, the average of the
absolute d values was calculated as an overall measure of
how well the sixteen factors as a whole differentiated
between the two groups (mean of corrected |d|= 0.31).

60
Table 7
Descriptive Analysis: 16 Narrow Factors (Company-Wide) 95% Confidence Cor- Range Interval for d rected Variable Mean SD Lower Upper d Lower Upper d r A 0.19 -0.29 0.65 0.23 0.09 Successful 5.50 1.95 1 9 Unsuccessful 5.15 1.75 2 9 B 0.40 -0.08 0.86 0.45 0.19 Successful 5.18 2.15 2 10 Unsuccessful 4.37 1.84 1 8 C 0.40 -0.08 0.87 0.45 0.19 Successful 7.62 1.32 5 9 Unsuccessful 7.07 1.47 4 9 E -0.19 -0.65 0.28 -0.23 -0.09 Successful 5.76 2.07 2 10 Unsuccessful 6.11 1.48 3 8 F -0.13 -0.60 0.34 -0.15 -0.06 Successful 6.10 1.37 4 9 Unsuccessful 6.30 1.68 2 9 G -0.08 -0.54 0.39 -0.09 -0.04 Successful 7.10 1.57 4 9 Unsuccessful 7.22 1.58 4 9 H -0.10 -0.57 0.37 -0.11 -0.05 Successful 6.86 1.82 3 9 Unsuccessful 7.04 1.72 4 9 I -0.05 -0.52 0.42 -0.06 -0.03 Successful 3.72 1.70 1 10 Unsuccessful 3.81 1.78 1 8 L -0.66 -1.13 -0.17 -0.77 -0.30 Successful 4.88 1.71 2 9 Unsuccessful 6.00 1.66 3 9 M -0.34 -0.81 0.13 -0.40 -0.16 Successful 4.16 1.57 2 7 Unsuccessful 4.70 1.59 2 8 N -0.46 -0.93 0.02 -0.53 -0.22 Successful 4.56 1.70 1 9 Unsuccessful 5.30 1.44 2 8 O 0.12 -0.35 0.59 0.14 0.06 Successful 4.18 1.38 1 7 Unsuccessful 4.00 1.59 1 7 Q1 -0.03 -0.50 0.44 -0.04 -0.02 Successful 5.28 1.65 2 9 Unsuccessful 5.33 1.36 3 8 Q2 -0.27 -0.74 0.20 -0.31 -0.13 Successful 3.76 1.67 1 9 Unsuccessful 4.22 1.72 2 8 Q3 0.28 -0.19 0.75 0.33 0.14 Successful 7.12 1.37 4 9 Unsuccessful 6.70 1.68 2 9 Q4 -0.55 -1.02 -0.07 -0.63 -0.26 Successful 2.66 1.35 1 6 Unsuccessful 3.52 1.89 1 8

61
Next, a direct logistic regression analysis was
performed on job status as outcome and the sixteen narrow
personality factors from the 16PF as predictors. Analysis
was performed using the binary logit model in SAS. All of
the assumptions mentioned by Tabachnick and Fidell (2001)
were again met. A test of the full model with all sixteen
predictors against a constant-only model was statistically
reliable, X2 (16, N = 77) = 32.52, p < .05, indicating that
all the predictors, as a set, reliably distinguish between
employees of the organization who were successful and those
who were involuntarily terminated. Prediction success was
impressive with an 86.1% overall success rate.
Table 8 shows regression coefficients, Wald
statistics, odds ratios, and 99% confidence intervals for
odds ratios for each of the five predictors. According to
the Wald criterion, Factors H, L, and Q4 of the sixteen
factors reliably predicted success at the p < .05 level.
The odds ratio for H is 2.643 indicating that even a slight
change on this scale would have a large impact on the odds
of being classified into a particular category.

62
Table 8
Logistic Regression Analysis of Success as a Function of the Sixteen Narrow Factors from the 16PF (Company-Wide) 95% Confidence Wald Test Odds Interval for Odds Ratio Variable B (z-ratio) Ratio Upper Lower A -0.29 1.40 0.75 0.46 1.21 B -0.29 1.95 0.75 0.50 1.12 C 0.13 0.11 1.14 0.54 2.41 E 0.03 0.02 1.03 0.69 1.54 F 0.22 0.75 1.25 0.76 2.06 G 0.25 1.12 1.28 0.81 2.02 H 0.97 8.38 2.64 1.37 5.11 I 0.34 1.91 1.41 0.87 2.28 L 0.63 4.81 1.88 1.07 3.30 M 0.29 0.92 1.33 0.74 2.39 N 0.37 2.02 1.45 0.87 2.43 O -0.26 0.96 0.77 0.46 1.30 Q1 0.10 0.16 1.11 0.67 1.85 Q2 0.47 3.26 1.60 0.96 2.67 Q3 -0.12 0.20 0.89 0.52 1.50 Q4 0.53 4.35 1.69 1.03 2.79
Organization-Wide Five Factor Comparison. The analysis
was again repeated to compare the profiles between
successful employees and involuntarily terminated employees
using the five factors. It was hypothesized that the shape
of the two graphs would be different. If true, the
correlation between the two profiles should be low and the
effect size should be large. The graphical presentation of
the means of the two groups is presented in Appendix E. An
examination of the graphed results reveals that the overall
shape of the two profiles was again found to be similar and
the means are highly correlated (r = 0.99). The descriptive
statistics and effect sizes are presented in Table 9. The

63
successful group scored higher on three of the five scales
(Scales EX, AX, and IN). Successful employees tend to be
less anxious, more self-controlled, and more extroverted,
while unsuccessful employees tend to be more anxious,
unrestrained, and introverted. The average of the absolute
d values was calculated as an overall measure of how well
the five factors as a whole differentiated between the two
groups (mean of corrected |d|= 0.30).
Table 9 Descriptive Analysis: Five Broad Factors (Company-Wide) 95% Confidence Cor- Range Interval for d rected Variable Mean SD Lower Upper d Lower Upper d r EX 0.25 -0.22 0.72 0.26 0.12 Successful 6.84 1.65 3 10 Unsuccessful 6.41 1.76 3 10 AX -0.63 -1.10 -0.14 -0.67 -0.29 Successful 2.78 1.23 1 5 Unsuccessful 3.70 1.84 1 7 TM 0.02 -0.45 0.49 0.02 0.01 Successful 6.92 1.70 2 10 Unsuccessful 6.89 1.53 3 10 IN -0.24 -0.70 0.23 -0.27 -0.12 Successful 5.96 1.68 3 10 Unsuccessful 6.33 1.30 3 8 SC 0.28 -0.19 0.75 0.30 0.14 Successful 7.16 1.32 4 9 Unsuccessful 6.78 1.40 3 9
A direct logistic regression analysis using the binary
logit model in SAS was performed on job status as outcome
and the five personality factors as predictors: the five
global factors from the 16PF. All of the assumptions
mentioned by Tabachnick and Fidell (2001) were met. A test

64
of the full model with five global predictors against a
constant-only model was not statistically reliable, X2 (5,
N = 77) = 8.45, p = 0.1331, indicating that all the
predictors, as a set, do not reliably distinguish between
employees of the organization who were successful and those
who were involuntarily terminated.
Table 10 shows regression coefficients, Wald
statistics, odds ratios, and 99% confidence intervals for
odds ratios for each of the five predictors. According to
the Wald criterion, none of the five factors reliably
predicted success at the p < .05 level.
Table 10 Logistic Regression Analysis of Success as a Function of the Five Broad Factors from the 16PF (Company-Wide) 95% Confidence Wald Test Odds Interval for Odds Ratio Variable B (z-ratio) Ratio Upper Lower EX -0.14 0.61 0.86 0.60 1.25 AX 0.34 3.09 1.42 0.96 2.09 TM 0.08 0.19 1.08 0.76 1.52 IN 0.24 1.60 0.88 0.88 1.83 SC -0.07 0.12 0.61 0.61 1.41
Additional Analysis
Due to the fact that the data for the job-specific
comparison on the sixteen factors did not converge and,
therefore, could not be analyzed through a logistical
regression, it was determined that the data from the

65
sixteen factor group would be re-analyzed using only the
five strongest predictors. This will not only provide
valuable information for answering the first three research
questions, the selection of the five strongest narrow
factors will have the added benefit of being able to be
directly compared to the five broad traits without having
to be weighted due to differing numbers of predictors.
Tabachnick and Fidell suggest selecting the strongest
predictors and that “an additional run is prudent to
evaluate the predictors in the model” (2001, p.559). The
five strongest factors from both the job-specific and
company-wide comparisons are listed in Table 11. These
factors were selected because they had the highest odds
ratios. It should be noted that factors H, L, and Q4 are
present in both groups and the other two variables differ
between the two groups.
Table 11 Five Strongest Narrow Predictors (Based on Odds Ratios) Job-Specific (APO) Company-Wide H – Social Boldness H - Social Boldness Q1 – Openness to Change L - Vigilance L - Vigilance Q4 - Tension Q4 - Tension Q2 – Self-Reliance G - Rule-Consciousness N - Privateness

66
Job Specific Five Best Narrow Factor Comparison. The
first step in the profile comparison was to create
graphical representation of the means of the two groups
(Appendix F). It was hypothesized that the shape of the two
graphs would be different. If true, the correlation between
the two profiles should be low and the effect sizes should
be large. An examination of the graphed results reveals
that the overall shape of the two profiles was found to be
similar and the means are highly correlated (r = 0.96). The
descriptive statistics and effect sizes are presented in
Table 12. The unsuccessful group scored higher on all but
scales G. Successful employees tend to be more trusting,
relaxed, and shy, while unsuccessful employees tend to be
more suspicious, tense, and socially bold. The average of
the absolute d values was calculated as an overall measure
of how well the five factors as a whole differentiated
between the two groups (mean of corrected |d|= 0.57).
A direct logistic regression analysis was performed on
job status as outcome and the five personality factors as
predictors: the five best narrow factors from the 16PF.
Analysis was performed using the binary logit model in SAS.
All of the assumptions mentioned by Tabachnick and Fidell
(2001) were again met. A test of the full model with five

67
predictors against a constant-only model was statistically
reliable, X2 (5, N = 45) = 19.51, p < 0.5, indicating that
all the predictors, as a set, reliably distinguish between
employees of the organization who were successful and those
who were involuntarily terminated. Prediction success was
impressive with an 85.1% overall success rate.
Table 12 Descriptive Analysis: Best Five Narrow Factors (APO) 95% Confidence Cor- Range Interval for d rected Variable Mean SD Lower Upper d Lower Upper d r G 0.17 -0.43 0.77 0.20 0.85 Successful 7.29 1.63 4 9 Unsuccessful 7.00 1.73 4 9 H -0.40 -1.00 0.21 -0.43 -0.20 Successful 6.75 1.86 3 9 Unsuccessful 7.47 1.66 4 9 L -0.80 -1.41 -0.16 -0.93 -0.37 Successful 5.11 1.50 2 9 Unsuccessful 6.36 1.62 4 9 Q1 -0.38 -0.98 0.24 -0.48 -0.19 Successful 4.79 1.34 2 8 Unsuccessful 5.29 1.31 3 7 Q4 -0.71 -1.31 0.07 -0.82 -0.33 Successful 2.43 1.43 1 6 Unsuccessful 3.65 2.15 1 8
Table 13 shows regression coefficients, Wald
statistics, odds ratios, and 99% confidence intervals for
odds ratios for each of the five predictors. According to
the Wald criterion, Factors H, L, and Q4 of the five
factors reliably predicted success at the p < .05 level.
The odds ratio for Factors H and L (2.19 and 2.38) indicate
that even a slight change on either of those two scales

68
would have a large impact on the odds of being classified
into a particular category.
Table 13 Logistic Regression Analysis of Success as a Function of the Five Best Narrow Factors from the 16PF (APO) 95% Confidence Wald Test Odds Interval for Odds Ratio Variable B (z-ratio) Ratio Upper Lower G 0.05 0.03 1.05 0.64 1.73 H 0.78 5.80 2.19 1.22 4.12 L 0.87 6.48 2.38 1.22 4.65 Q1 0.37 1.40 1.45 0.78 2.69 Q4 0.50 3.90 1.65 1.00 2.70
Company-Wide Five Best Narrow Factor Comparison. The
first step in the profile comparison was to create a
graphical representation of the means of the two groups
(Appendix G). It was hypothesized that the shape of the two
graphs would be different. If true, the correlation between
the two profiles should be low and the effect size should
be large. An examination of the graphed results reveals
that the overall shape of the two profiles was found to be
similar and the means are highly correlated (r = 0.98). The
descriptive statistics and effect sizes are presented in
Table 14. The involuntarily terminated group scored higher
on all of the scales. Yet, successful employees tend to be
more trusting, relaxed, and forthright, while unsuccessful
employees tend to be more suspicious, tense, and private.

69
The average of the absolute d values was calculated as an
overall measure of how well the five factors as a whole
differentiated between the two groups (mean of corrected
|d|= 0.47).
Table 14 Descriptive Analysis: Best Five Narrow Factors (Company-Wide) 95% Confidence Cor- Range Interval for d rected Variable Mean SD Lower Upper d Lower Upper d r H -0.10 -0.57 0.37 -0.11 -0.05 Successful 6.86 1.82 3 9 Unsuccessful 7.04 1.72 4 9 L -0.66 -1.13 -0.17 -0.77 -0.30 Successful 4.88 1.71 2 9 Unsuccessful 6.00 1.66 3 9 N -0.46 -0.93 0.02 -0.53 -0.22 Successful 4.56 1.70 1 9 Unsuccessful 5.30 1.44 2 8 Q2 -0.27 -0.74 0.20 -0.31 -0.13 Successful 3.76 1.67 1 9 Unsuccessful 4.22 1.72 2 8 Q4 -0.55 -1.02 -0.07 -0.63 -0.26 Successful 2.66 1.35 1 6 Unsuccessful 3.52 1.89 1 8
A direct logistic regression analysis was performed on
job status as outcome and the five personality factors as
predictors: the five best narrow factors from the 16PF.
Analysis was performed using the binary logit model in SAS.
All of the assumptions mentioned by Tabachnick and Fidell
(2001) were again met. A test of the full model with five
predictors against a constant-only model was statistically
reliable, X2 (5, N = 77) = 23.15, p < .05, indicating that

70
all the predictors, as a set, reliably distinguish between
employees of the organization who were successful and those
who were involuntarily terminated. Prediction success was
impressive with an 80.7% overall success rate. It should be
noted that this is a slight decrease from the 86.1% overall
success rate found when using all sixteen narrow factors.
Table 15 shows regression coefficients, Wald
statistics, odds ratios, and 99% confidence intervals for
odds ratios for each of the five predictors. According to
the Wald criterion, Factors H, L, and Q2 all reliably
predicted success at the p < .05 level. The odds ratios for
Factors H and L (2.07 and 1.84) once again indicate that
even a slight change on either of those two scales would
have a large impact on the odds of being classified into a
particular category.
Table 15 Logistic Regression Analysis of Success as a Function of the Five Best Narrow Factors from the 16PF (Company-Wide) 95% Confidence Wald Test Odds Interval for Odds Ratio Variable B (z-ratio) Ratio Upper Lower H 0.73 7.78 2.08 1.24 3.47 L 0.61 8.09 1.85 1.21 2.81 N 0.39 3.29 1.47 0.97 2.24 Q2 0.42 4.02 1.53 1.01 2.32 Q4 0.36 3.34 1.43 0.97 2.10

71
Summary of the Findings for the First Three Research
Questions
The results for the first three research questions are
presented in Table 16. These include comparisons between
the successful and unsuccessful Assistant Press Operators
and employees in general for both the sixteen narrow
factors and the five broad factors. Results indicate that
the five broad factors were not able to differentiate
between successful and unsuccessful employees at the p <
.05 level in either the job-specific or company-wide
comparison, although they did somewhat better when used in
the job-specific comparison. Unfortunately, the sixteen
narrow factors could not be calculated at the job-specific
level, but were statistically significant at the p < 0.5
level when used company-wide. Furthermore, when selecting
the five narrow factors which were the best predictors from
the 16 narrow factors, both the job-specific and company-
wide comparisons were statistically significant at the p <
0.5 level. The factors H, L, and Q4 appear to be important
factors at both the job-specific and company-wide levels.

72
Table 16
Summary of Results from the First Three Research Questions Groups Chi Squared Percent Factors Sig. Mean of r (X2) Concordant at p<.05 Corrected level |d| Job-Specific (APO) 16 Factors ** *** ** 0.37 0.92 *5 Narrow Factors 19.51 (p=0.0015) 85.1% H, L, and Q4 0.57 0.96 5 Broad Factors 10.66 (p=0.0584) *** None 0.50 0.94 Company-Wide 16 Factors 32.52 (p=0.0085) 86.1% H, L, and Q4 0.31 0.93 *5 Narrow Factors 23.15 (p=0.0003) 80.7% H, L, and Q2 0.47 0.98 5 Broad Factors 8.45 (p=0.1331) *** None 0.30 0.99 * Five strongest predictors from the 16 narrow factors. ** Model did not converge. *** Model as a whole is not statistically significant at the p<.05 level.
In each of the comparisons the correlations between
the two profiles were similar (in the .092 to 0.99 range),
which indicates that the general shape of the profiles was
fairly similar between the groups. Ideally the correlations
would be lower. However, the effect sizes suggest that
there were some differences at the individual scale level
in each of the profile comparisons.
Logistical regression capitalizes on error variance to
make the most accurate classification for the current
sample. Unfortunately this can lead to results that are
unique to a particular sample and are not replicable
outside of that sample. This is a particular concern when
there are a large number of predictors and a relatively
small sample size. This issue is typically dealt with in

73
multiple regression by calculating an adjusted-R2, which is
an estimate of the population squared multiple correlation.
The following equation is typically used to calculate
adjusted-R2:
ˆ R 2 = 1− (1− R2)(n −1)
(n − k −1)
Here n is the sample size, k is the number of predictors,
and R2 is the observed squared multiple correlation between
outcome and predictors. The issue of shrinkage is
compounded in the current study by the fact that the five
strongest factors were selected from the logistical
regression model and may have a disproportionate amount of
error variance allocated to them. C. R. Reynolds (personal
communication, May 2004) suggested that this issue can be
dealt with by using the above adjusted-R2 formula and using
sixteen factors (k = 16) instead of five when calculating
the adjusted-R2 for the five best narrow factor
comparisons. It should be noted that R2 is not
traditionally calculated for data with a dichotomous or
categorical dependent variable because the maximum variance
would be a 50-50 split. However, Reynolds suggest that R2
can still be calculated for data sets with a dichotomous
dependent variable to address the issue of shrinkage, but

74
that it is not as powerful of a predictor in logistical
regression. Therefore, the R2 and the adjusted- R2 data for
the first three research questions are listed in Table 17,
but these values should only be used to examine the issue
of shrinkage in this data set and should not be used to
compare the results from this study to R2 values derived
from other studies.
Table 17 R2 and Adjusted-R2 Groups R2 Adjusted-R2 Corrected for k Job-Specific (APO) 16 Factors 0.459 0.149 *5 Narrow Factors 0.353 0.270 0.000 5 Broad Factors 0.219 0.119 Company-Wide 16 Factors 0.334 0.156 *5 Narrow Factors 0.257 0.205 0.059** 5 Broad Factors 0.108 0.045 * Five best factors from the 16 narrow factors. **k = 16 instead of 5 in the adjusted-R2 formula.
These results illustrate the common dilemma of having
small sample sizes. In all comparisons, except for the five
best narrow factors, the adjusted-R2 is less than half the
R2. When adjusted-R2 is corrected for the number of
predictors in the best narrow factor group, there is a
large decrease, which suggest that these results would not
be replicable in other samples. It appears that the
adjusted-R2 basically falls back to the level of the five

75
broad factors in the company-wide comparison and falls even
below the level of five broad factors in the job-specific
comparisons. However, it should be noted that these results
do provide further support that the 16 narrow factors were
better predictors than the five broad factors. The
adjusted-R2 values for the 16 factor groups were
comparatively the highest for both the job-specific and
company-wide comparisons.
Research Question Four The same analytical approach was also used when
answering the fourth research question that asked if the
company’s current selection procedure is effective. This is
done through comparing profiles through the backwards cross
validation procedure described in Chapter Three. The
following groups were compared in order to answer this
question:
1. Hired vs. Successful 16 Factors 5 Factors
2. Hired vs. Unsuccessful 16 Factors 5 Factors
3. Not Hired vs. Successful 16 Factors 5 Factors
4. Not Hired vs. Unsuccessful 16 Factors 5 Factors

76
All of these comparisons were done at the company-wide
level.
Hired vs. Successful (16 Factors). The profiles
between those employees who were hired were compared to
profiles of employees who were successful. If the current
selection process is discriminating between successful and
unsuccessful employees, then the profiles of all hired
employees and employees who were successful should be
similar, which would result in a high correlation and small
effect sizes. The graphical presentation of the means of
the two groups is presented in Appendix H. An examination
of the graphed results reveals that the overall shape of
the two profiles is very similar and the means are highly
correlated (r = 0.99). The descriptive statistics and
effect sizes are presented in Table 18. Again, the average
of the absolute d values was calculated as an overall
measure of how well the sixteen factors as a whole
differentiated between the two groups (mean of corrected
|d|= 0.12).

77
Table 18 Descriptive Analysis: Hired vs. Successful (16) 95% Confidence Cor- Range Interval for d rected Variable Mean SD Lower Upper d Lower Upper d r A -0.13 -0.46 0.20 -0.16 -0.06 Hired 5.26 1.77 1 9 Successful 5.50 1.95 1 9 B -0.27 -0.60 0.06 -0.31 -0.12 Hired 4.62 2.03 1 10 Successful 5.18 2.15 2 10 C -0.16 -0.49 0.16 -0.18 -0.07 Hired 7.40 1.36 4 9 Successful 7.62 1.32 5 9 E 0.10 -0.23 0.42 0.12 0.04 Hired 5.95 1.95 1 10 Successful 5.76 2.07 2 10 F -0.02 -0.35 0.31 -0.02 -0.01 Hired 6.07 1.55 2 9 Successful 6.10 1.37 4 9 G 0.12 -0.21 0.44 0.14 0.05 Hired 7.28 1.52 4 9 Successful 7.10 1.57 4 9 H 0.05 -0.27 0.38 0.05 0.03 Hired 6.95 1.66 3 9 Successful 6.86 1.82 3 9 I 0.04 -0.29 0.37 0.05 0.02 Hired 3.79 1.75 1 10 Successful 3.72 1.70 1 10 L 0.17 -0.16 0.50 0.20 0.08 Hired 5.18 1.78 2 9 Successful 4.88 1.71 2 9 M 0.03 –0.29 0.36 0.03 0.01 Hired 4.21 1.57 2 8 Successful 4.16 1.57 2 7 N 0.19 -0.13 0.52 0.22 -0.09 Hired 4.88 1.62 1 9 Successful 4.56 1.70 1 9 O -0.03 -0.35 0.30 -0.03 -0.01 Hired 4.14 1.66 1 9 Successful 4.18 1.38 1 7 Q1 0.01 -0.31 0.34 0.01 0.01 Hired 5.30 1.67 2 10 Successful 5.28 1.65 2 9 Q2 0.07 -0.25 0.40 0.08 0.03 Hired 3.88 1.60 1 9 Successful 3.76 1.67 1 9 Q3 -0.01 -0.34 0.31 -0.01 -0.01 Hired 7.10 1.37 2 9 Successful 7.12 1.37 4 9 Q4 0.24 -0.09 0.56 0.28 0.11 Hired 3.01 1.52 1 8 Successful 2.66 1.35 1 6

78
Next, a direct logistic regression analysis was
performed on group membership as outcome and the sixteen
personality factors as predictors: the sixteen narrow
factors from the 16PF. Analysis was performed using the
binary logit model in SAS. All of the assumptions mentioned
by Tabachnick and Fidell (2001) were again met. A test of
the full model with all sixteen predictors against a
constant-only model was not statistically reliable, X2 (16,
N = 179) = 11.25, p = 0.7941, indicating that all the
predictors, as a set, do not reliably distinguish between
employees who were hired and employees who were successful.
Table 19 shows regression coefficients, Wald
statistics, odds ratios, and 95% confidence intervals for
odds ratios for each of the sixteen predictors. According
to the Wald criterion, none of the sixteen factors reliably
predicted between the two groups at the p < .05 level.

79
Table 19
Logistic Regression Analysis of Group Membership as a Function of the Sixteen Narrow Factors from the 16PF 95% Confidence Wald Test Odds Interval for Odds Ratio Variable B (z-ratio) Ratio Upper Lower A -1.12 0.82 0.88 0.69 1.15 B -0.15 2.33 0.86 0.72 1.04 C -0.12 0.42 0.89 0.62 1.27 E 0.06 0.41 1.07 0.88 1.30 F -0.05 0.12 0.96 0.73 1.25 G 0.13 0.89 1.13 0.87 1.47 H 0.22 2.45 1.25 0.95 1.66 I 0.12 0.95 1.13 0.88 1.45 L 0.05 0.17 1.05 0.83 1.34 M -0.06 0.15 0.94 0.70 1.27 N 0.12 1.13 1.13 0.90 1.42 O -0.02 0.01 0.98 1.76 1.28 Q1 0.05 0.19 1.05 0.84 1.32 Q2 0.04 0.11 1.05 0.80 1.37 Q3 -0.04 0.05 0.96 0.71 1.31 Q4 0.17 1.56 1.20 0.90 1.58
Hired vs. Successful (5 Factors). The profiles between
those employees that were hired were compared to profiles
of employees who were successful using the five broad
factors. Again, if the current selection process is
discriminating between successful and unsuccessful
employees, then these profiles should be similar, which
would result in a high correlation and small effect sizes.
The graphical presentation of the means of the two groups
is presented in Appendix I. An examination of the graphed
results reveals that the overall shape of the two profiles
was again found to be similar and the means are highly
correlated (r = 1.00). The descriptive statistics and

80
effect sizes are presented in Table 20. The average of the
absolute d values was calculated as an overall measure of
how well the five factors as a whole differentiated between
the two groups (mean of corrected |d|= 0.11).
Table 20 Descriptive Analysis: Hired vs. Successful (5) 95% Confidence Cor- Range Interval for d rected Variable Mean SD Lower Upper d Lower Upper d r EX -0.14 -0.46 0.19 -0.15 -0.06 Hired 6.62 1.57 3 10 Successful 6.84 1.65 3 10 AX 0.23 -0.09 0.56 0.24 0.10 Hired 3.12 1.52 1 8 Successful 2.78 1.23 1 5 TM 0.01 -0.32 0.33 0.01 0.00 Hired 6.93 1.69 1 10 Successful 6.92 1.70 2 10 IN 0.10 -0.23 0.42 0.11 0.04 Hired 6.12 1.65 2 10 Successful 5.96 1.68 3 10 SC 0.02 -0.31 0.34 0.02 0.01 Hired 7.18 1.30 3 9 Successful 7.16 1.32 4 9
Next, a direct logistic regression analysis was
performed on group membership as outcome and the five
personality factors as predictors: the five broad factors
from the 16PF. Analysis was performed using the binary
logit model in SAS. All of the assumptions mentioned by
Tabachnick and Fidell (2001) were again met. A test of the
full model with all five predictors against a constant-only
model was not statistically reliable, X2 (16, N = 179) =

81
3.55, p = 0.6160, indicating that all the predictors, as a
set, do not reliably distinguish between employees who were
hired and employees who were successful.
Table 21 shows regression coefficients, Wald
statistics, odds ratios, and 95% confidence intervals for
odds ratios for each of the five predictors. According to
the Wald criterion, none of the five factors reliably
predicted between the two groups at the p < .05 level.
Table 21 Logistic Regression Analysis of Group Membership as a Function of the Five Broad Factors from the 16PF 95% Confidence Wald Test Odds Interval for Odds Ratio Variable B (z-ratio) Ratio Upper Lower EX -0.10 0.50 0.91 0.70 1.18 AX 0.18 1.54 1.19 0.90 1.58 TM 0.02 0.03 1.02 0.81 1.28 IN 0.12 1.03 1.13 0.89 1.42 SC 0.09 0.35 1.09 0.82 1.46
Hired vs. Unsuccessful (16 Factors). The profiles of
all hired employees were compared to profiles of employees
who were unsuccessful using the sixteen narrow factors from
the 16PF. If the current selection process is
discriminating between successful and unsuccessful
employees, then these profiles should be different, and
thus the 16PF should discriminate between the two groups.
Therefore the correlations between the two groups should be

82
low and the effect sizes should be large. The graphical
presentation of the means of the two groups is presented in
Appendix J. An examination of the graphed results reveals
that the overall shape of the two profiles was again found
to be similar and the means are highly correlated (r =
0.97). The descriptive statistics and effect sizes are
presented in Table 22. Again, the average of the absolute d
values was calculated as an overall measure of how well the
sixteen factors as a whole differentiated between the two
groups (mean of corrected |d|= 0.20).
Next, a direct logistic regression analysis was
performed on group membership as outcome and the sixteen
personality factors as predictors: the sixteen narrow
factors from the 16PF. Analysis was performed using the
binary logit model in SAS. All of the assumptions mentioned
by Tabachnick and Fidell (2001) were again met. A test of
the full model with all sixteen predictors against a
constant-only model was not statistically reliable, X2 (16,
N = 156) = 15.17, p = 0.5121, indicating that all the
predictors, as a set, do not reliably distinguish between
employees who were hired and employees who were
unsuccessful.

83
Table 22 Descriptive Analysis: Hired vs. Unsuccessful (16) 95% Confidence Cor- Range Interval for d rected Variable Mean SD Lower Upper d Lower Upper d r A 0.06 -0.35 -.48 0.07 0.02 Hired 5.26 1.77 1 9 Unsuccessful 5.15 1.75 2 9 B 0.13 -0.29 0.54 0.15 0.05 Hired 4.62 2.03 1 10 Unsuccessful 4.37 1.84 1 8 C 0.24 -0.18 0.65 0.27 0.09 Hired 7.40 1.36 4 9 Unsuccessful 7.07 1.47 4 9 E -0.09 -0.50 0.33 -0.11 -0.03 Hired 5.95 1.95 1 10 Unsuccessful 6.11 1.48 3 8 F -0.15 -0.56 0.27 -0.18 -0.06 Hired 6.07 1.55 2 9 Unsuccessful 6.30 1.68 2 9 G 0.04 -0.38 0.45 0.05 0.01 Hired 7.28 1.52 4 9 Unsuccessful 7.22 1.58 4 9 H -0.05 -0.47 0.36 -0.05 -0.02 Hired 6.95 1.66 3 9 Unsuccessful 7.04 1.72 4 9 I -0.01 -0.43 0.40 -0.01 -0.01 Hired 3.79 1.75 1 10 Unsuccessful 3.81 1.78 1 8 L -0.47 -0.88 -0.05 -0.55 -0.18 Hired 5.18 1.78 2 9 Unsuccessful 6.00 1.66 3 9 M -0.31 -0.73 0.11 -0.36 -0.12 Hired 4.21 1.57 2 8 Unsuccessful 4.70 1.59 2 8 N -0.26 -0.68 0.15 -0.30 -0.10 Hired 4.88 1.62 1 9 Unsuccessful 5.30 1.44 2 8 O 0.09 -0.33 0.50 0.10 0.03 Hired 4.14 1.66 1 9 Unsuccessful 4.00 1.59 1 7 Q1 -0.02 -0.43 0.40 -0.03 -0.01 Hired 5.30 1.67 2 10 Unsuccessful 5.33 1.36 3 8 Q2 -0.21 -0.62 0.21 -0.24 -0.08 Hired 3.88 1.60 1 9 Unsuccessful 4.22 1.72 2 8 Q3 0.28 -0.14 0.69 0.33 0.11 Hired 7.10 1.37 2 9 Unsuccessful 6.70 1.68 2 9 Q4 -0.32 -0.74 0.10 -0.37 0.12 Hired 3.01 1.52 1 8 Unsuccessful 3.52 1.89 1 8

84
Table 23 shows regression coefficients, Wald
statistics, odds ratios, and 95% confidence intervals for
odds ratios for each of the sixteen predictors. According
to the Wald criterion, none of the sixteen factors reliably
predicted between the two groups at the p < .05 level.
Table 23 Logistic Regression Analysis of Group Membership as a Function of the Sixteen Narrow Factors from the 16PF 95% Confidence Wald Test Odds Interval for Odds Ratio Variable B (z-ratio) Ratio Upper Lower A 0.03 0.02 1.03 0.72 1.46 B 0.04 0.11 1.04 0.81 1.35 C 0.04 0.03 1.05 0.65 1.69 E -0.02 0.01 0.98 0.72 1.33 F -0.16 0.83 0.85 0.60 1.21 G -0.20 1.24 0.82 0.57 1.17 H -0.33 2.49 0.72 0.48 1.08 I -0.06 0.10 0.95 0.67 1.33 L -0.28 2.92 0.75 0.54 1.04 M -0.15 0.61 0.86 0.58 1.26 N -0.24 1.63 0.79 0.55 1.14 O 0.14 0.61 1.15 0.81 1.62 Q1 -0.01 0.01 0.99 0.70 1.38 Q2 -0.26 1.95 0.77 0.54 1.11 Q3 0.18 0.99 1.20 0.84 1.73 Q4 -0.16 0.95 0.85 0.61 1.18
Hired vs. Unsuccessful (5 Factors). The profiles of
all hired employees were compared to profiles of employees
who were unsuccessful using the five broad factors on the
16PF. Again, if the current selection process is
discriminating between successful and unsuccessful
employees, then these profiles should be different, and
thus the 16PF should discriminate between the two groups.

85
Therefore the correlations between the two groups should be
low and the effect sizes large. The graphical presentation
of the means of the two groups is presented in Appendix K.
An examination of the graphed results reveals that the
overall shape of the two profiles was again found to be
similar and the means are highly correlated (r = 0.99). The
descriptive statistics and effect sizes are presented in
Table 24. Again, the average of the absolute d values was
calculated as an overall measure of how well the five
factors as a whole differentiated between the two groups
(mean of corrected |d|= 0.21).
Table 24 Descriptive Analysis: Hired vs. Unsuccessful (5) 95% Confidence Cor- Range Interval for d rected Variable Mean SD Lower Upper d Lower Upper d r EX 0.13 -0.28 0.55 0.14 0.05 Hired 6.62 1.57 3 10 Unsuccessful 6.41 1.76 3 10 AX -0.37 -0.78 0.05 -0.39 -0.14 Hired 3.12 1.52 1 8 Unsuccessful 3.70 1.84 1 7 TM 0.02 -0.39 0.44 0.02 0.01 Hired 6.93 1.69 1 10 Unsuccessful 6.89 1.53 3 10 IN -0.13 -0.55 0.28 -0.15 -0.05 Hired 6.12 1.65 2 10 Unsuccessful 6.33 1.30 3 8 SC 0.30 -0.11 0.72 0.33 0.12 Hired 7.18 1.30 3 9 Unsuccessful 6.78 1.40 3 9
Next, a direct logistic regression analysis was
performed on group membership as outcome and the five

86
personality factors as predictors: the five broad factors
from the 16PF. Analysis was performed using the binary
logit model in SAS. All of the assumptions mentioned by
Tabachnick and Fidell were again met. A test of the full
model with all five predictors against a constant-only
model was not statistically reliable, X2 (5, N = 156) =
4.57, p = 0.4708, indicating that all the predictors, as a
set, do not reliably distinguish between employees who were
hired and employees who were unsuccessful.
Table 25 shows regression coefficients, Wald
statistics, odds ratios, and 95% confidence intervals for
odds ratios for each of the five predictors. According to
the Wald criterion, none of the five factors reliably
predicted between the two groups at the p < .05 level.
Table 25 Logistic Regression Analysis of Group Membership as a Function of the Five Broad Factors from the 16PF 95% Confidence Wald Test Odds Interval for Odds Ratio Variable B (z-ratio) Ratio Upper Lower EX 0.08 0.28 1.09 0.80 1.48 AX -0.17 1.22 0.85 0.63 1.14 TM -0.08 0.29 0.93 0.70 1.23 IN -0.12 0.56 0.89 0.65 1.21 SC 0.16 0.93 1.18 0.84 1.65
Not Hired vs. Successful (16 Factors). The profiles of
all employees who were not hired were compared to profiles

87
of employees who were successful using the sixteen narrow
factors from the 16PF. If the current selection process is
discriminating between successful and unsuccessful
employees, then these profiles should be different, and
thus the 16PF should discriminate between the two groups.
Therefore the correlation between the two groups should be
low and the effect sizes large. The graphical presentation
of the means of the two groups is presented in Appendix L.
An examination of the graphed results reveals that the
overall shape of the two profiles was again found to be
similar and the means are high correlated (r = 0.97). The
descriptive statistics and effect sizes are presented in
Table 26. Again, the average of the absolute d values was
calculated as an overall measure of how well the sixteen
factors as a whole differentiated between the two groups
(mean of corrected |d|= 0.26).
Next, a direct logistic regression analysis was
performed on group membership as outcome and the sixteen
personality factors as predictors: the sixteen narrow
factors from the 16PF. Analysis was performed using the
binary logit model in SAS. All of the assumptions mentioned
by Tabachnick and Fidell were again met.

88
Table 26
Descriptive Analysis: Not Hired vs. Successful (16) 95% Confidence Cor- Range Interval for d rected Variable Mean SD Lower Upper d Lower Upper d r A -0.19 -0.50 0.11 -0.23 -0.07 Not Hired 5.15 1.77 1 9 Successful 5.50 1.96 1 9 B -0.36 -0.66 -0.05 -0.41 -0.14 Not Hired 4.47 1.96 1 10 Successful 5.18 2.15 2 10 C -0.29 -0.59 -0.02 -0.33 -0.11 Not Hired 7.16 1.67 2 9 Successful 7.62 1.32 5 9 E 0.11 -0.20 0.41 0.14 0.04 Not Hired 5.96 1.81 1 10 Successful 5.76 2.07 2 10 F -0.17 -0.47 0.14 -0.20 -0.06 Not Hired 5.84 1.57 1 9 Successful 6.10 1.37 4 9 G -0.17 -0.48 0.14 -0.20 -0.06 Not Hired 6.82 1.65 2 9 Successful 7.10 1757 4 9 H -0.17 -0.48 0.13 -0.18 -0.07 Not Hired 6.55 1.76 2 9 Successful 6.86 1.82 3 9 I 0.33 0.02 0.64 0.38 0.13 Not Hired 4.27 1.65 1 8 Successful 3.72 1.70 1 10 L 0.17 -0.13 0.48 0.20 0.07 Not Hired 5.20 1.87 1 10 Successful 4.88 1.71 2 9 M 0.14 -0.17 0.45 0.16 0.05 Not Hired 4.40 1.73 2 9 Successful 4.16 1.57 2 7 N 0.42 0.11 0.72 0.48 0.16 Not Hired 5.25 1.65 1 9 Successful 4.56 1.70 1 9 O 0.02 -0.29 0.32 0.02 0.01 Not Hired 4.21 1.62 1 9 Successful 4.18 1.38 1 7 Q1 -0.09 -0.39 0.22 -0.10 -0.03 Not Hired 5.13 1.76 1 10 Successful 5.28 1.65 2 9 Q2 0.25 -0.05 0.56 0.31 0.10 Not Hired 4.14 1.45 2 9 Successful 3.76 1.67 1 9 Q3 -0.25 -0.55 0.06 -0.30 -0.09 Not Hired 6.75 1.53 2 9 Successful 7.12 1.37 4 9 Q4 0.47 0.16 0.78 0.54 0.18 Not Hired 3.47 1.78 1 9 Successful 2.66 1.35 1 6

89
A test of the full model with all sixteen predictors
against a constant-only model was statistically reliable,
X2 (16, N = 284) = 31.90, p = 0.0103, indicating that all
the predictors, as a set, reliably distinguish between
employees who were hired and employees who were
unsuccessful. Prediction success was moderate with a 75.0%
overall success rate.
Table 27 shows regression coefficients, Wald
statistics, odds ratios, and 95% confidence intervals for
odds ratios for each of the sixteen predictors. According
to the Wald criterion, Factor B, I, and Q4 reliably
predicted success at the p < .05 level.
Table 27 Logistic Regression Analysis of Group Membership as a Function of the Sixteen Narrow Factors from the 16PF 95% Confidence Wald Test Odds Interval for Odds Ratio Variable B (z-ratio) Ratio Upper Lower A -0.09 0.53 0.91 0.72 1.16 B -0.25 6.94 0.78 0.64 0.94 C 0.05 0.10 1.05 0.77 1.42 E 0.12 1.31 1.13 0.92 1.39 F -0.08 0.40 0.92 0.71 1.20 G -0.08 0.41 0.92 0.71 1.19 H 0.11 0.74 1.12 0.86 1.45 I 0.29 6.15 1.33 1.06 1.67 L -0.03 0.07 0.97 0.77 1.21 M -0.11 0.56 0.90 0.68 1.19 N 0.20 3.18 1.22 0.98 1.52 O -0.08 0.41 0.92 0.71 1.19 Q1 0.02 0.02 1.02 0.81 1.27 Q2 0.02 0.02 1.02 0.78 1.34 Q3 -0.14 0.93 0.87 0.65 1.16 Q4 0.35 6.10 1.42 1.08 1.87

90
Not Hired vs. Successful (5 Factors). The profiles of
all employees who were not hired were compared to profiles
of employees who were successful using the five broad
factors from the 16PF. If the current selection process is
discriminating between successful and unsuccessful
employees, then these profiles should be different, and
thus the 16PF should discriminate between the two groups.
Therefore the correlation between the two groups should be
low and the effect sizes should be large. The graphical
presentation of the means of the two groups is presented in
Appendix M. An examination of the graphed results reveals
that the overall shape of the two profiles was again found
to be similar and the means of the two groups are highly
correlated (r = 0.99). The descriptive statistics and
effect sizes are presented in Table 28. The average of the
absolute d values was calculated as an overall measure of
how well the five factors as a whole differentiated between
the two groups (mean of corrected |d|= 0.24).

91
Table 28
Descriptive Analysis: Not Hired vs. Successful (5) 95% Confidence Cor- Range Interval for d rected Variable Mean SD Lower Upper d Lower Upper d r EX -0.37 -0.68 -0.06 -0.39 -0.14 Not Hired 6.24 1.61 1 10 Successful 6.84 1.65 3 10 AX 0.40 0.09 0.70 0.43 0.15 Not Hired 3.46 1.80 1 10 Successful 2.78 1.23 1 5 TM -0.09 -0.40 0.22 -0.10 -0.04 Not Hired 6.77 1.66 2 10 Successful 6.92 1.70 2 10 IN 0.01 -0.30 0.31 0.01 0.00 Not Hired 5.97 1.61 2 10 Successful 5.96 1.68 3 10 SC -0.27 -0.57 0.04 -0.29 -0.10 Not Hired 6.75 1.59 2 10 Successful 7.16 1.32 4 9
Next, a direct logistic regression analysis was
performed on group membership as outcome and the five
personality factors as predictors: the five broad factors
from the 16PF. Analysis was performed using the binary
logit model in SAS. All of the assumptions mentioned by
Tabachnick and Fidell (2001) were again met. A test of the
full model with all five predictors against a constant-only
model was statistically reliable, X2 (5, N = 284) = 11.66,
p = 0.0397, indicating that all the predictors, as a set,
reliably distinguish between employees who were not hired
and employees who were successful. Prediction success was
not impressive with a 64.0% overall success rate.

92
Table 29 shows regression coefficients, Wald
statistics, odds ratios, and 95% confidence intervals for
odds ratios for each of the five predictors. According to
the Wald criterion, Factor EX reliably predicted success at
the p < .05 level.
Table 29 Logistic Regression Analysis of Group Membership as a Function of the Five Broad Factors from the 16PF 95% Confidence Wald Test Odds Interval for Odds Ratio Variable B (z-ratio) Ratio Upper Lower EX -0.27 4.32 0.77 0.60 0.99 AX 0.14 1.13 1.15 0.89 1.48 TM -0.05 0.20 0.95 0.76 1.19 IN 0.14 1.36 1.14 0.91 1.44 SC -0.09 0.48 0.92 0.71 1.18
Not Hired vs. Unsuccessful (16 Factors). The profiles
of all applicants who were not hired were compared to
profiles of employees who were unsuccessful using the
sixteen narrow factors from the 16PF. If the current
selection process is discriminating between successful and
unsuccessful employees, then these profiles should be
similar, and thus the 16PF should not discriminate between
the two groups. Therefore the two profiles should be highly
correlated and have small effect sizes. The graphical
presentation of the means of the two groups is presented in
Appendix N. An examination of the graphed results reveals

93
that the overall shape of the two profiles was again found
to be similar and the means are highly correlated (r =
0.97). The descriptive statistics and effect sizes are
presented in Table 30. The average of the absolute d values
was calculated as an overall measure of how well the
sixteen factors as a whole differentiated between the two
groups (mean of corrected |d|= 0.17).
Next, a direct logistic regression analysis was
performed on group membership as outcome and the sixteen
personality factors as predictors: the sixteen narrow
factors from the 16PF. Analysis was performed using the
binary logit model in SAS. All of the assumptions mentioned
by Tabachnick and Fidell were again met. A test of the full
model with all sixteen predictors against a constant-only
model was not statistically reliable, X2 (16, N = 261) =
20.51, p = 0.1982, indicating that all the predictors, as a
set, did not reliably distinguish between employees who
were not hired and employees who were unsuccessful.

94
Table 30
Descriptive Analysis: Not Hired vs. Unsuccessful (16) 95% Confidence Cor- Range Interval for d rected Variable Mean SD Lower Upper d Lower Upper d r A 0.00 -0.40 0.40 0.00 0.00 Not Hired 5.15 1.77 1 9 Unsuccessful 5.15 1.75 2 9 B 0.05 -0.35 0.45 0.07 0.02 Not Hired 4.47 1.96 1 10 Unsuccessful 4.37 1.84 1 8 C 0.06 -0.34 0.45 0.07 0.02 Not Hired 7.16 1.65 2 9 Unsuccessful 7.07 1.47 4 9 E -0.08 -0.48 0.31 -0.10 -0.03 Not Hired 5.96 1.81 1 10 Unsuccessful 6.11 1.48 3 8 F -0.29 -0.69 0.11 -0.34 -0.09 Not Hired 5.84 1.57 1 9 Unsuccessful 6.30 1.68 2 9 G -0.24 -0.64 0.16 -0.28 -0.07 Not Hired 6.82 1.65 2 9 Unsuccessful 7.22 1.58 4 9 H -0.28 -0.68 0.12 -0.30 -0.08 Not Hired 6.55 1.76 2 9 Unsuccessful 7.04 1.72 4 9 I 0.28 -0.12 0.67 0.32 0.08 Not Hired 4.27 1.65 1 8 Unsuccessful 3.81 1.78 1 8 L -0.43 -0.83 -0.03 -0.50 -0.13 Not Hired 5.20 1.87 1 10 Unsuccessful 6.00 1.66 3 9 M -0.17 -0.57 0.22 -0.20 -0.05 Not Hired 4.40 1.73 2 9 Unsuccessful 4.70 1.59 2 8 N -0.03 -0.43 0.37 -0.03 -0.01 Not Hired 5.25 1.65 1 9 Unsuccessful 5.30 1.44 2 8 O 0.13 -0.27 0.53 0.15 0.04 Not Hired 4.21 1.62 1 9 Unsuccessful 4.00 1.59 1 7 Q1 -0.12 -0.51 0.28 -0.15 -0.04 Not Hired 5.13 1.76 1 10 Unsuccessful 5.33 1.36 3 8 Q2 -0.05 -0.45 0.34 -0.06 -0.02 Not Hired 4.14 1.45 2 9 Unsuccessful 4.22 1.72 2 8 Q3 0.03 -0.37 0.43 0.04 0.01 Not Hired 6.75 1.53 2 9 Unsuccessful 6.70 1.68 2 9 Q4 -0.03 -0.43 0.37 -0.03 -0.01 Not Hired 3.47 1.78 1 9 Unsuccessful 3.52 1.89 1 8

95
Table 31 shows regression coefficients, Wald
statistics, odds ratios, and 95% confidence intervals for
odds ratios for each of the sixteen predictors. According
to the Wald criterion, Factor G and L reliably predicted
success at the p < .05 level.
Table 31 Logistic Regression Analysis of Group Membership as a Function of the Sixteen Narrow Factors from the 16PF 95% Confidence Wald Test Odds Interval for Odds Ratio Variable B (z-ratio) Ratio Upper Lower A 0.02 0.02 1.03 0.74 1.42 B 0.01 0.01 1.01 0.80 1.28 C 0.12 0.38 1.13 0.77 1.66 E 0.17 1.35 1.18 0.89 1.57 F -0.24 2.06 0.78 0.56 1.09 G -0.51 7.21 0.60 0.41 0.87 H -0.24 1.86 0.79 0.56 1.11 I 0.22 1.98 1.25 0.92 1.69 L -0.30 4.80 0.74 0.57 0.97 M -0.19 1.09 0.83 0.57 1.18 N -0.04 0.07 0.96 0.68 1.33 O 0.12 0.48 1.13 0.81 1.58 Q1 -0.19 1.54 0.83 0.62 1.11 Q2 -0.11 0.40 0.90 0.64 1.26 Q3 0.07 0.15 1.07 0.76 1.50 Q4 -0.09 0.56 0.92 0.68 1.24
Not Hired vs. Unsuccessful (5 Factors). The profiles
of all applicants who were not hired were compared to
profiles of employees who were unsuccessful using the five
broad factors from the 16PF. If the current selection
process is discriminating between successful and
unsuccessful employees, then these profiles should be
similar, and thus the 16PF should not discriminate between

96
the two groups. Therefore the two profiles should be highly
correlated and the effect sizes should be small. The
graphical presentation of the means of the two groups is
presented in Appendix O. An examination of the graphed
results reveals that the overall shape of the two profiles
was again found to be similar and the means are highly
correlated (r = 1.00). The descriptive statistics and
effect sizes are presented in Table 32. The average of the
absolute d values was calculated as an overall measure of
how well the five factors as a whole differentiated between
the two groups (mean of corrected |d|= 0.12).
Table 32 Descriptive Analysis: Not Hired vs. Unsuccessful (5) 95% Confidence Cor- Range Interval for d rected Variable Mean SD Lower Upper d Lower Upper d r EX -0.10 -0.50 0.29 -0.11 -0.03 Not Hired 6.24 1.61 1 10 Unsuccessful 6.41 1.76 3 10 AX -0.13 -0.53 0.27 -0.14 -0.04 Not Hired 3.46 1.79 1 10 Unsuccessful 3.70 1.84 1 7 TM -0.07 -0.47 0.33 -0.08 -0.02 Not Hired 6.77 1.66 2 10 Unsuccessful 6.89 1.53 3 10 IN -0.23 -0.63 0.17 -0.26 -0.07 Not Hired 5.97 1.61 2 10 Unsuccessful 6.33 1.30 3 8 SC -0.02 -0.42 0.38 -0.02 -0.01 Not Hired 6.75 1.59 2 10 Unsuccessful 6.78 1.40 3 9
Next, a direct logistic regression analysis was
performed on group membership as outcome and the five

97
personality factors as predictors: the five broad factors
from the 16PF. Analysis was performed using the binary
logit model in SAS. All of the assumptions mentioned by
Tabachnick and Fidell were again met. A test of the full
model with all five predictors against a constant-only
model was not statistically reliable, X2 (5, N = 261) =
3.03, p = 0.6940, indicating that all the predictors, as a
set, did not reliably distinguish between employees who
were not hired and employees who were unsuccessful.
Table 33 shows regression coefficients, Wald
statistics, odds ratios, and 95% confidence intervals for
odds ratios for each of the five predictors. According to
the Wald criterion, none of the factors reliably predicted
success at the p < .05 level.
Table 33 Logistic Regression Analysis of Group Membership as a Function of the Five Broad Factors from the 16PF 95% Confidence Wald Test Odds Interval for Odds Ratio Variable B (z-ratio) Ratio Upper Lower EX -0.09 0.31 0.92 0.68 1.24 AX -0.16 1.32 0.85 0.65 1.12 TM -0.10 0.52 0.90 0.69 1.19 IN -0.15 1.11 0.86 0.64 1.14 SC -0.08 0.24 0.93 0.68 1.26

98
Summary of Findings for the Fourth Research Question
The results for the fourth research question are
presented in Table 34. The 16PF revealed statistically
significant differences at the p < .05 level between
applicants who were not hired and successful employees on
both the five and sixteen factors.
Table 34 Summary of Results for the Fourth Research Question Groups Chi Squared Percent Factors Sig. Mean of r (X2) Concordant at p<.05 Corrected
level |d| Hired vs. Successful
16 Factors 11.25 (p=0.7941) *** None 0.12 0.99 5 Factors 3.55 (p=0.6160) *** None 0.11 1.00 Hired vs. Unsuccessful 16 Factors 15.17 (p=0.5121) *** None 0.20 0.97 5 Factors 4.57 (p=0.4708) *** None 0.21 0.99 Not Hired vs. Successful
16 Factors 31.90 (p=0.0103) 75.0% B, I, Q4 0.26 0.97 5 Factors 11.66 (p=0.0397) 64.0% EX 0.24 0.99 Not Hired vs. Unsuccessful 16 Factors 20.51 (p=0.1982) *** G, L 0.17 0.97 5 Factors 3.03 (p=0.6940) *** None 0.12 1.00 *** Model as a whole not statistically significant at the p < .05 level
The fact that the 16PF differentiated between
applicants that were not hired and successful employees
indicates that those profiles are different. The 16PF could
not differentiate between all hired employees and
successful employees or between applicants who were not
hired and involuntarily terminated (unsuccessful)

99
employees. This suggests that the profiles of members of
those groups are similar. Unfortunately, the 16PF was
unable to differentiate between hired applicants and
unsuccessful employees.

100
CHAPTER V
SUMMARY AND DISCUSSION This chapter provides evaluation and interpretation of
the results obtained for each of the research questions.
This will include discussing the generalizability of the
research findings, practical implications, limitations, and
suggestions for future research.
Research Question One
The first research question was: How useful is the
16PF in predicting job performance in a small, team-based
manufacturing organization? This part of the study is
basically a replication study to provide additional support
for the use of the 16PF in personnel selection. Results in
the current study indicate that the 16PF was able to
correctly classify successful and unsuccessful employees
over 86% of the time using the sixteen narrow factors at
the company-wide level. This was despite the fact that the
general shape of the profiles from the two groups appears
to be relatively similar (r = .93; |d|= .31) and no
conclusions could be drawn from simple visual comparisons
of the profiles. Unfortunately the effect sizes typically
ranged from the small to medium range, which suggests that

101
these results may not be generalizable to other settings.
The distinction between the two groups only became apparent
during the logistical regression. These results support
other findings in the literature such as Batram (1995)
supporting the use of the 16PF in assessing job
performance. More importantly, these results add to the
literature by not only providing additional support for the
use of the 16PF in personnel selection, but also by
providing a specific practical example of using the 16PF as
a screening tool in a small, team-based manufacturing
environment.
Research Question Two
The second research question was: In team-based
organizations, should job specific or organizational-wide
profiles be used for personnel selection? It was
hypothesized that despite the company’s stated emphasis on
small groups and the importance of being a good team member
across jobs within the organization, job-specific
comparisons will yield better classification rates than
company-wide comparisons. If the performance criterion (in
this case, employment status) was purely contextual in

102
nature, then one would expect to find no differences
between job-specific and company-wide profile comparisons.
Results from the current study suggest that the 16
narrow factors were successful at correctly classifying
employees as successful or unsuccessful at both the
company-wide (80.7% correct classification rate; r = .98;
|d|= .47) and job-specific (85.1% correct classification
rate; r = .96; |d|= .57) levels. These comparisons were
made using the five best predictors from the 16PF (the
narrow traits). The rationale for doing so will be
discussed later in the limitations section, but it should
be noted that when using all narrow factors, the sixteen
predictors had a correct company-wide classification rate
of 86.1% (r = .93; |d|= .31). Although the job-specific
comparison had a slightly higher classification rate, was
less correlated, and had a larger effect size, due to the
magnitude of these differences it is not prudent to say
that this provides clear evidence that either job-specific
or company-wide profiles would be acceptable to use for
personnel selection.
A closer examination of the results reveals that H
(Social Boldness), L (Vigilance), and Q4 (Tension) were the
most powerful predictors at the job-specific level and H

103
(Social Boldness), L (Vigilance), Q2 (Self-Reliance), and
Q4 (Tension) were the most powerful predictors for the
company-wide level. Although Social Boldness and Vigilance
appear to be the strongest predictors in both groups, it
can be argued that all of these factors can be linked in
one way or another to social interactions and team
membership. In general, successful employees are more shy,
trusting, and relaxed, while unsuccessful employees are
more socially bold, suspicious, and tense. However, it is
notable that factor Q2 (self-reliance) appears to be a
better predictor for the company-wide profile than the job-
specific profile. It appears that successful employees are
more group-oriented and unsuccessful employees are more
self-reliant on the company-wide level, but there is almost
no difference between the two groups at the job-specific
level. This may be because specific job-related
characteristics that are associated with the job of an
assistant press operator are not present in the company as
a whole. For example, although the company reports that it
is highly team-oriented across all job descriptions, the
noise level on the plant floor precludes much talking in
the actual printing areas where the assistant press
operators work. Therefore, assistant press operators may

104
need to be more independent than employees in other areas
of the organization due to job specific demands. Thus, the
company-wide profiles may not be the best predictor for
job-specific performance even in team-based organizations.
Although the hypothesis that the results from the 16PF
would predict job-specific performance better than company-
wide performance was not supported, the fact that different
factors were more powerful predictors in the two groups
gives support to the practice of using job-specific data in
personnel selection. It is also suspected that although the
company reports that being a good team member is the most
important criteria for performance within their
organization, the chosen performance criteria for this
study (involuntary termination) may not be as contextual in
nature as team membership and, therefore, is job specific
and not applicable company-wide.
Research Question Three
The third research question was: Which type of
personality traits (narrow or broad) are the best
predictors of job performance? It was hypothesized that the
narrow traits would better predict success in this
organization. Results indicated that the five strongest

105
narrow traits correctly classified employees as successful
85.1% (r = .96; |d|= .58) of the time at the job specific
level and 80.7% (r = .98; |d|= .47) of the time at the
company-wide level. The broad traits were unable to
distinguish between the two groups at a statistically
significant level for either the job-specific or company-
wide level.
The fact that not one of the five individual broad
factors or the five factors as a whole were statistically
significant at the p < .05 level as predictors of success
at either the job-specific or company-wide level, while
three individual narrow factors and the model as a whole (5
narrow factors) were statistically significant at the p <
.05 level for both the job-specific and company-wide
levels, provides more supporting evidence for the use of
narrow factors in practical applications (Ashton, 1998;
Ones & Viswesvaran, 1996). The fact that none of the five
global factors were statistically significant suggests that
using an assessment instrument that only focused on the Big
Five likely would not have found any significant results,
while the narrow (more specific) traits were able to detect
the subtle differences in the profile and, therefore, were
stronger predictors.

106
These results support Ashton’s (1998) findings that
narrow factors can be better predictors than broad factors
in practical applications. The results also appear to
support Ones and Viswesvaran’s (1996) statements regarding
how global constructs should be able to predict broad
criteria with moderate validity and narrow constructs
should be able to predict specific criteria with maximal
validity. Most researchers would probably argue that when
performance is defined by employment status, it would be
considered a broad criteria, but in the current study,
there were very specific behavioral criteria that resulted
in involuntary termination. Therefore, in this case,
termination can be considered a more specific criterion,
which suggests that these results are congruent with Ones
and Visesvaran’s statement. The results give support to the
hypotheses that the narrow traits would be better
predictors in practical settings.
Research Question Four
The fourth research question was: Is the
organization’s current selection procedure, in which the
16PF is only used to generate interview questions,
effective? It was hypothesized that the company’s current

107
method of developing non-empirically based interview
questions based on the 16PF scales was not a valid means of
selection. This was addressed through conducting the
backwards-cross validity procedure discussed in Chapter
Three. The results of that comparison are graphically
presented in Figure 2.
Figure 2. Cross Validation Results
The ideal relationship between the four groups is
represented on the left and the actual results are
represented on the right. If the relationship of the
results would have been exactly matched with the
relationship on the right, then we could have reasonably
Hired
Applicants
Not Hired Applicants
Successful Employees
Un-Successful Employees
Hired
Applicants
Not HiredApplicants
Successful Employees
Un-Successful Employees
Ideal Results
Similar Different

108
concluded that the current selection procedure was
effective. In this case, three out of the four
relationships suggest that the organization’s current
selection procedure is at least partially effective. The
profiles of hired applicants appear similar to successful
employees and the profiles of non-hired applicants appear
similar to unsuccessful employees. The scales on the 16PF
also discriminated between successful employees and non-
hired employees, which indicates that these two groups are
different. The only one of the four relationships that did
not support the current selection procedure was that the
factors could not discriminate between hired applicants and
unsuccessful employees. The fact that three of the four
tenets of this approach were met, lends at least partial
support to the fact that the current selection procedure is
being effective in selecting successful employees. The
results indicate that the hypothesis that the company’s
current selection method is not effective does not appear
to be supported.
Limitations
The first and most obvious limitation of the current
study is the small sample size. This is an excellent

109
example of one of the biggest hurdles that practitioners
encounter when attempting to use personality measures for
selection purpose in small organizations. It is very
difficult to gather enough data to validate instruments in
particular settings when there are not a lot of employees
in that setting. For example, the current data were
collected over a three-year period and there were still
only 17 employees who were assistant press operators and
who had been involuntarily terminated. This is likely the
reason why the logistic regression between the successful
and unsuccessful assistant press operators (using all 16
factors) did not converge in the current study. However,
the data could be analyzed using just the five strongest
factors, but the results need to be interpreted with
caution due to the small sample size. This issue is
frequently encountered and makes running validity studies
of hiring practices in small organizations difficult.
Another limitation to the current study is the
criterion variable. Although this company has a highly
structured process for an employee to be involuntarily
terminated, this is still not a precisely defined variable.
There could be a wide range of counter-productive behaviors
that could technically lead to being involuntarily

110
terminated and that information was not available for the
current study. It seems that if there were a more
behaviorally-based measure of performance then it is likely
that the personality variables from the 16PF could have
more accurately predicted performance. This highlights
another practical implication of this study. The
organization that this study was conducted in had
performance data, but they were constantly developing and
changing their rating scales and this data was very
inconsistent. To add to these inconsistencies, a cursory
examination of the current performance-rating scales
indicated that there was a large amount of variability
between different manager’s ratings of employees. Some of
the rating sheets were completely filled out with detailed
explanations, while others simply had a single score
written on the bottom. Again, small companies have
difficulty gathering data over a long enough time period to
accumulate the numbers that they need to validate
particular instruments. Therefore, performance often has to
be operationally defined by vague variables such as
employment status.
A final limitation of the current study was that the
16PF was not a true measure of the five-factor model. As

111
mentioned earlier, the five global factors from the 16PF
are correlated with the Big Five, but were actually
developed long before the inception of the Big Five Model.
Therefore, the generalizability of these results to other
studies that used instruments that were developed based on
the Big Five typology should be done with caution. Also,
the fact that most of the d’s were in the very low to
moderate range according to Cohen’s (1983) criteria, limits
the practical implications of these findings. This suggests
that there was very little variability between the groups
of successful and unsuccessful employees on the majority of
both the broad and narrow factors.
Implications for Future Research
The results of the current study support the use of
the 16PF as an effective tool in personnel selection. It
provides further evidence of the importance of making the
job-performance connection at the job-specific level and
that the narrow factors appear to be more powerful
predictors of success. The results from the current study
suggest that additional research be conducted in using
personality measures to predict performance in team-based
organizations. Current findings also suggest that

112
additional research needs to be conducted in controlling
for work-environment fit purported by Holland (1973). It is
possible that if the employee’s work-environment fit could
have been controlled for in the current study, then perhaps
the factors from the 16PF could have been even more
powerful predictors as Fritzsche, McIntire, and Yost (2002)
found.
There has been a recent effort in personality research
to conduct factor analysis on several of the traditional
personality instruments (including the 16PF) so that the
narrow scales factor into the actual Big Five model
(Goldberg, 1999). It would be beneficial to conduct this
research with this type of data set so that a more direct
comparison to the Big Five body of research can be made.
This would allow the current results to be compared to a
much broader body of work and would be a logical next step
for this study.
Finally, non-empirically based selection procedures
need to be further researched. The results of this study
suggest that the company’s current selection model, where
interview questions are generated from results of
personality measures, were at least partially successful.
Highhouse (2002) suggests that these types of evaluations

113
are common when evaluating candidates for executive
positions and for highly specialized jobs, but there is
limited empirical evidence for personality tests to be used
in this manner.
In summary, the research findings suggest that the
16PF can be effectively used as part of a selection model
and that it appears to be a valid instrument for predicting
performance in a small, team-based manufacturing
environment. The research adds support for using narrow
personality factors in predicting success and assessing
performance at a job-specific level. Results also call for
further investigation into the use of non-empirically based
selection procedures such as the approach used by the
company in this study.

114
REFERENCES
Arthur, W., Jr., Woehr, D.J., & Graziano, W.G. (1997).
Personality testing in employment settings: Problems and issues in the application of typical selection practices. Paper presented at the 11th Annual Conference of the Society for Industrial and Organizational Psychology in St. Louis, MO, April 1997.
Ashton, M.C. (1998). Personality and job performance: The importance of narrow traits. Journal of Organizational Behavior, 19, 289-303.
Barrick, M.R., & Mount, M.K. (1991). The Big-Five personality dimensions in job performance: A meta-analysis. Personnel Psychology, 44, 1-26.
Barrick, M.R., Mount, M.K., & Judge, T.A. (2001).
Personality and performance at the beginning of a new millennium: What do we know and were do we go next. Personality and Peformance, 9, 9-30.
Bartram, D. (1992). The personality of UK Managers: 16PF
norms for short-listed applicants. Journal of Occupational and Organizational Psychology, 65, 159-172.
Batram, D. (1995). The predictive validity of the EPI and
the 16PF for military flying training. Journal of Occupational and Organizational Psychology, 68, 219-236.
Borman, W.C., & Motowidlo, S.J. (1993). Expanding the
criterion domain to include elements of contextual performance. In N. Schmitt & W.C. Borman (Eds.), Personnel selection in organizations. San Francisco, CA: Jossey-Bass.
Borman, W.C., & Motowidlo, S.J. (1997). Task performance
and contextual performance: The meaning for personnel research. Human Performance, 10, 99-109.

115
Borman, W.C., Penner, L.A., Allen, T.D., & Motowidlo,
S.J. (2001). Personality predictors of citizenship performance. International Journal of Selection and Assessment, 9, 52-69.
Buchner, A., Faul, F., & Erdfelder, E. (1997). G-Power: A
priori, post-hoc, and compromise poser analyses for the Macintosh (Version 2.1.2) [Computer program]. Trier, Germany: University of Trier.
Cascio, W. (1994). The Americans with Disabilities Act of
1990 and the 1991 Civil Rights Act: Requirements for psychological practice in the workplace. In B.D. Sales & G.R. Vandenbos (Eds.), Psychology in litigation and legislation. Washington, DC: American Psychological Association.
Cascio, W. (1998). Applied psychology in human resource
management. Upper Saddle River, NJ: Prentice-Hall. Cattell, H.E. (1993). Comments on Goldberg. American
Psychologist, 48, 1302-1303. Cattell, R.B., Eber, H.W., & Tatsuoka, M.M. (1970).
Handboook for the Sixteen Personality Factor Questionnaire (16PF). Champaign, IL: Institute for Personality and Ability Testing.
Christiansen, N.D., Goffin, R.D., Johnston, N.G., &
Rothstein, M.G. (1994). Correcting the 16PF for faking: Effects on criterion-related validity and individual hiring decisions. Personnel Psychology, 47, 847-860.
Cohen, J., & Cohen, P. (1983). Applied multiple
regression/correlational analysis for the behavioral sciences. Hillsdale, NJ: Erlbaum.
Conn, S., & Rieke, M.L. (1993). Constuct validation of the
16PF fifth edition. In S. Conn & M.L. Rieke (Eds.), The Sixteen Personality Factor Questionnaire fifth edition technical manual. Champaign, IL: Institute for Personality and Ability Testing.

116
Conway, J.M. (1996). Additional construct validity evidence to the task/contextual performance distinction. Human Performance, 9, 309-329.
Costa, P.T., and McCrae, R.R. (1992). Manual for the
Revised NEO Personality Inventory (NEO-PI-R). Odessa, Fl: Psychological Assessment Resources.
Cronbach, L.J., & Gleser, G.C. (1965). Psychological
tests and personnel decisions. Urbana: University of Illinois Press.
Davis, R.D., & Million, T. (1999). Models of personality
and its disorders. In T. Million, P.H. Blaney, & R.D. Davis (Eds.), Oxford textbook of psychopathology (pp. 485-522). New York: Oxford University Press.
Digman, J.M. (1990). Personality structure: Emergence of
the Five-Factor Model. Annual Review of Psychology, 41, 417-440.
Edwards, J.R. (1993). Problems with the use of profile
similarity indices in the study of congruence in organizational research. Personnel Psychology, 46, 641-665.
Edwards, J.R. (1994). The study of congruence in
organizational behavior research: Critique and a proposed alternative. Organizational Behavior and Human Decision Making, 58, 51-100.
Fritzsche, B.A., McIntire, S.A., and Yost, A.P. (2002).
Holland type as a moderator of personality-performance predictions. Journal of Vocational Behavior, 60, 422-436.
Fritzsche, B.A., Powell, A.B., and Hoffman, R. (1999).
Person-environment congruence as a predictor of customer service performance. Journal of Vocational Behavior, 54, 59-70.
Goldberg, L. R. (1999). A broad-bandwidth, public domain, personality inventory measuring the lower-level facets of several five-factor models. In I. Mervielde, I. Deary, F. De Fruyt, & F. Ostendorf (Eds.), Personality Psychology in Europe, Vol. 7 (pp. 7-28). Tilburg, The Netherlands: Tilburg University Press.

117
Herman, K., & Usita, P. (1994). Predictive validity of the
16PF in screening volunteers for big brothers/big sisters. Psychological Reports, 74, 249-250.
Hermelin, E., & Robertson, I.T. (2001). A critique and
standardization of meta-analytic validity coefficients in personnel selection. Journal of Occupational and Organizational Psychology, 74, 253-277.
Highhouse, S. (2002). Assessing the candidate as a whole: A
historical and crucial analysis of individual psychological assessment for personnel decision making. Personnel Psychology, 55, 363-396.
Hofer, S.M., & Eber, H.W. (2002). Second-order factor
structure of the Cattell Sixteen Personality Factor Questionnaire. In de Radd, B. (Ed.), Big five assessment (pp. 397-404). Ashland, OH: Hogrefe & Hubler Publishers.
Hogan, J. & Roberts, B.W. (1996). Issues and non-issues in
the fidelity-bandwidth trade-off. Journal of Organizational Behavior, 17, 627-637.
Hogan, J., Rybicki, S.L., Motowidlo, S.J., & Borman, W.C.
(1998). Relations between contextual performance, personality, and occupational advancement. Human Performance, 11, 189-207.
Hogan, R. and Hogan J. (1992). Hogan Personality Inventory Manual. Tulsa, OK: Hogan Assessment Systems.
Hogan, R., Hogan, J., & Roberts, B.W. (1996). Personality
measurement and employment decisions. American Psychologist, 51, 469-477.
Hogan, R., & Shelton, D. (1998). A socioanalytic perspective on job performance. Human Performance, 11, 129-144.
Holland, J.L. (1973). Making vocational choices: A theory
of careers. Englewood, NJ: Prentice-Hall.

118
Hough, L.M., Eaton, N.K., Dunnette, M.D., Kamp, J.D., and
McCloy, R.A. (1990). Criterion-related validities of personality constructs and the effect of response distortion on those validities. Journal of Applied Psychology, 75, 581-585.
Hull, C.L. (1928). Aptitude testing. Yonkers on Hudson,
NY: World Book Company. Hunter, J.E., and Schmidt, F.L. (1990). Methods of meta- analysis: Correcting error and bias in research
findings. Newbury Park, CA: Sage. Hurtz, G.M. and Donovan, J.J. (2000). Personality and job
performance: The big five revisited. Journal of Applied Psychology, 85, 869-879.
Inwald, R.E., & Brockwell, A.L. (1991). Predicting the
performance of government security personnel with the IPI and MMPI. Journal of Personality Assessment, 56, 522-535.
Inwald, R.E., & Resko, J.A. (1995). Preemployment
screening for public safety personnel. In L. Vandercreek, S. Knapp, and T.L. Jackson (Eds.), Innovations in clinical practice: Vol. 14. a source book. Sarasota, FL: Professional Resource Press.
Judge, T.A., Martocchio, J.J., & Thoresen, C.J. (1997).
Five-factor model of personality and employee absences. Journal of Applied Psychology, 82, 745-755.
Kane, J. S. (1997). Assessment of the situational and
individual components of job performance. Human Performance, 10, 193-226.
McDaniel, M. A., & Frei, R. L. (1998). Validity of customer
service measures in personnel selection: A review of criterion and construct evidence. Human performance, 11, 1-27.

119
McLellan, M.J. (1995). Review of the Sixteen Personality Factor Questionnaire, Fifth Edition. The twelfth mental measurements yearbook. Lincoln, NE: The University of Nebraska Press.
Mitchell, J.V., Jr. (Ed.) (1985). The ninth mental
measurements yearbook. Lincoln, NE: The Buros Institute of Mental Measurements.
Mosier, C.I. (1943). On the reliability of a weighted composite. Psychometrika, 8, 161-168.
Motowidlo, S.J., & Van Scotter, J.R. (1994). Evidence that
task performance should be distinguished from contextual performance. Journal of Applied Psychology, 79, 475-480.
Mount, J.K., Barrick, M.R., and Stewart, G.L. (1998). Five-
factor model of personality and performance in jobs involving interpersonal interactions. Human Performance, 11, 145-165.
Murphy, K.R. (1993). Honesty in the workplace. Pacific Grove, CA: Brooks & Cole.
Norman, W.T. (1963). Toward an adequate taxonomy of
personality attributes: Replicated factor structure in peer nominated personality ratings. Journal of Abnormal Social Psychology, 66, 574-583.
O’Connor, E.J., Peters, L.H., Pooyan, A., Weekley, J.,
Frank, B., & Erenkrantz, B. (1984). Situational constraint effects on performance, affective reactions, and turnover: A field replication and extension. Journal of Applied Psychology, 69, 663-672.
Ones, D.S., & Viswesvaran, C. (1996). Bandwidth-fidelity
dilemma in personality measurement for personnel selection. Journal of Organizational Behavior, 17, 609-626.
Paunonen, S.V., Rothstein, M.G., & Jackson, D.N. (1999).
Narrow reasoning about the use of broad personality measures for personnel selection. Journal of Organizational Behavior, 20, 389-405.

120
Postuma, R.A. (2002). Employee selection procedures and the business necessity defense. Applied H.R.M. Research, 7, 53-64.
Robertson, I.T., Baron, H., Gibbons, P., MacIver, R, &
Nyfield, G. (2000). Journal of Occupational and Organizational Psychology, 73, 171-180.
Robertson, I.T., & Smith, M. (2001). Personnel selection.
Journal of Occupational and Organizational Psychology, 74, 441-472.
Rotto, P.C. (1995). Review of the Sixteen Personality
Factor Questionnaire, Fifth Edition. The twelfth mental measurements yearbook. Lincoln, NE: The University of Nebraska Press.
Russell, M.T., & Karol, K.L (1994). The 16PF Fifth
Edition administrator’s manual. Champaign, IL: Institute for Personality and Ability Testing.
Salgado, J.F. (1997). The five factor model of personality
and job performance in the European community. Journal of Applied Psychology, 82, 30-43.
Salgado, J.F. (2002). The big five personality dimensions
and counterproductive behaviors. International Journal of Selection and Assessment, 10, 117-125.
Salgado, J.F. (2003). Predicting job performance using FFM
and non-FFM personality measures. Journal of Occupational and Organizational Psychology, 76, 323-346.
Schmidt, F.L., & Hunter, J.E. (1998). The validity and
utility of selection methods in personnel psychology: Practical and theoretical implications of 85 years of research findings. Psychological Bulletin, 124, 262-274.
Schmidt, F.L., Ones, D.S., & Hunter, H.E. (1992).
Personnel selection. Annual Review of Psychology, 43, 627-670.

121
Schmitt, N., Gooding R.Z., Noe R.A., & Kirsh M. (1984). Meta-analyses of validity studies published between 1964 and 1982 and the investigation of study characteristics. Personnel Psychology, 37, 407-421.
Smith, C.A., Organ, D.W., & Near, J.P. (1983).
Organizational citizenship behavior: Its nature and antecedents. Journal of Applied psychology, 68, 653-663.
Stevens, J. (1986). Applied multivarite statistics for the
social sciences. Hillsdale, NJ: Lawrence Erlbaum Associates, Inc.
Tabachnick, B.G., & Fidell, F.S. (2001). Using multivariate
statistics. Boston: Allyn and Bacon. Tett, R.P., Jackson, D.N., & Rothstein, M. (1991).
Personality measures as predictors of job performance: A meta-analytical review. Personnel Psychology, 21, 703-742.
Villanova, P. (1996). Predictive validity of situational
constraints in general versus specific performance domains. Journal of Applied Psychology, 81, 532-547.
Vinchur, A.J., Schippmann, J.S., Switzer, F.S. & Roth,
P.L. (1998). A meta-analytic review of predictors of job performance in salespeople. Journal of Applied Psychology, 83, 586-597.
von Eye, A. (1990). Introduction to configural frequency
analysis. New York: Cambridge Press. Wakcher, S., Cross, K., & Blackman, M.C. (2003).
Personality comparison of airline pilot incumbents, applicants, and general population norms on the 16PF. Psychological Reports, 92, 773-780.
Waller, N.G., & Meehl, P.E. (1998). Multivariate
taxometric procedures: Distinguishing types from continua. Thousand Oaks, CA: Sage Publications.
Walsh, W.B. & Betz, N.E. (1995). Tests and assessment (3rd
ed.). Englewood Cliffs, NJ: Prentice-Hall, Inc.

122
APPENDIX A
List of jobs for which applicants were applying Number of Job Title Applicants Percent (%) Assistant Press Operator 211 58.1 Shipping/Receiving Clerk 48 13.2 Perforator/Bag Operator 12 3.2 Team Leader 21 5.8 Customer Service Rep / Sales 15 4.1 Other 15 4.1 Maintenance Technician 10 2.8 Admin/Clerical 7 1.9 Press Operator 6 1.7 Receptionist 5 1.4 Computer/Info Systems 4 1.1 Human Resources 4 1.1 Accounting 2 0.6 Ink Tech 2 0.6 Graphics 1 0.3
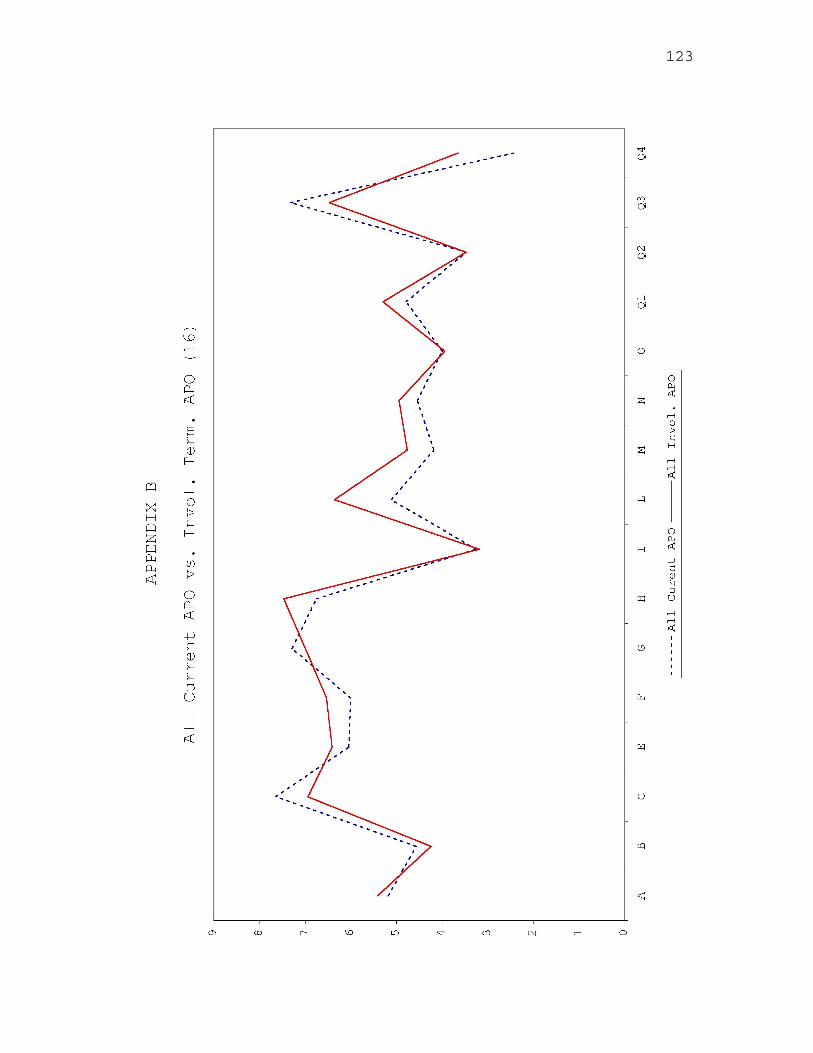
123

124

125

126

127

128

129

130

131

132

133
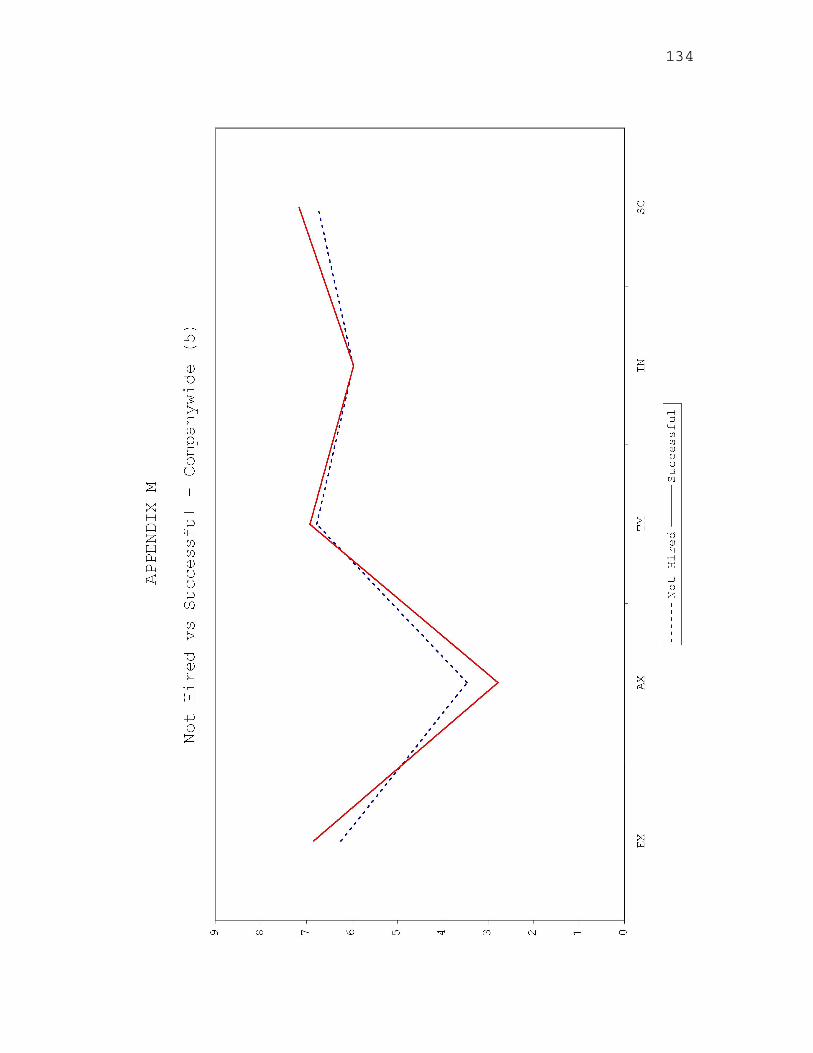
134

135

136

137
VITA
Matthew L. Shelton Professional Harris County MHMRA Address: Child and Adolescent Services Forensic Unit
3540 W. Dallas Houston, TX 77019 (713) 512-4165
Professional Assessment, Individual, Group, Family, Anger Interest Management/Domestic Violence, Personnel
Selection, Geropsychology EDUCATION 1997-present Doctor of Philosophy (Expected: Aug. 2004) Counseling Psychology Texas A&M University College Station, Texas APA Accredited Program 1995-1997 Master of Arts Counseling and Guidance University of Missouri-Kansas City Kansas City, Missouri 1990-1994 Bachelor of Arts
Psychology Southern Methodist University Dallas, Texas
DOCTORAL INTERSHIP 2000-2001 Houston VA Medical Center
Houston, TX
Clinical Mental Health, Geropsychology, Vocational Rotations Psychology, Forensic Psychology, Admin- istration, Neuropsychology, Trauma Recovery POST-DOCTRAL FELLOWSHIP 2004-2005 Harris County MHMRA (expected)
In Juvenile Forensic Psychology
Related Documents