SIDT 2011 – International Conference Venice, 6-7 October 2011 The use of microsimulation as a tool for the evaluation of traffic safety performances Vittorio Astarita 1 , Demetrio C. Festa 1 , Vincenzo P. Giofré 1 , Giuseppe Guido 1 , Frank F. Saccomanno 2 , Alessandro Vitale 1 1 Dipartimento di Pianificazione Territoriale, Università della Calabria 2 Department of Civil and Environmental Engineering, University of Waterloo

Welcome message from author
This document is posted to help you gain knowledge. Please leave a comment to let me know what you think about it! Share it to your friends and learn new things together.
Transcript

SIDT 2011 – International Conference Venice, 6-7 October 2011
The use of microsimulation as a tool for the evaluation of traffic safety performances
Vittorio Astarita1, Demetrio C. Festa1, Vincenzo P. Giofré1, Giuseppe Guido1, Frank F. Saccomanno2, Alessandro Vitale1
1Dipartimento di Pianificazione Territoriale, Università della Calabria
2Department of Civil and Environmental Engineering, University of Waterloo

Study framework
TrafficSafety
performance indicators
crashes?According the Federal Highway Administration(FHWA 2003), when properly formulatedsafety performance measures from simulationcan provide a useful platform from which toidentify high risk situations in the traffic streamand guide cost-effective interventionstrategies.

Safety performance measures highlight potentially unsafe road and traffic conditions,and provide an effective means for explaining complex vehicle interactions in the trafficstream at a given point in time and space.These can be used to guide effective decisions for enhancing safety (Hayward 1971;Minderhoud and Bovy 2001; Huguenin 2005).
Measuring safety performance
Safety Performance is influenced by a number of traffic and geometric factors, such as,driver attributes and condition (experience, tiredness, stress, drug and alcoholimpairment, health issues, etc.), characteristics of the road (type of road, road surface,geometric features, etc.), traffic conditions (volume, speed, density, accelerationprofiles, etc.), vehicle attributes (maneuverability, braking capability, stability, tire wear,etc.), and environment (weather conditions, light conditions, etc.) (Elvik and Vaa 2004;Ogden 1996; Evans 1991).
Safety performance measures, also known as proximal safety indicators or surrogatesafety measures, are defined to reflect high risk events in relation to a projected point ofcollision. These measures are usually based on pair-wise vehicular velocity and spacingattributes.

The main assumption underlying the use of safety performance measures is that if one isable to detect high risk situations that occur considerably more frequent than crashes,then statistically reliable results would be possible without the need of historical crashdata.
Measuring safety performance
The use of safety performance measures also constitutes in essence a proactiveapproach to road safety studies it is able to detect safety problems before they result incrash.
A potential problem to the application of such measures is the need for an objectivedefinition of “high risk” situations or “near-misses” that did not result in a crash becauseof some evasive manoevre or other factors to be used in lieu of historical crash data.
Amundsen and Hydén (1977) provided the most accepted definition of traffic conflict as“an observable situation in which two or more road users approach each other in spaceand time to such an extent that there is a risk of collision if their movement remainunchanged”.

Measuring safety performance
Safety performance measures attempt to capture vehicle interactions in the trafficstream and identify high risk situations leading to crashes at different geometriclocations. These vehicle interactions have been expressed by Hyden (1987) in terms of asafety performance pyramid. This pyramid reflects the full spectrum of vehicleinteractions in the traffic stream, from undisturbed events at the base of the pyramid toless frequent higher risk events (conflicts and crashes) at the peak. A comprehensiveassessment of safety performance must reflect interactions over the entire pyramid,since crashes can also occur near the base of the pyramid where conditions are safer.

Measuring safety performance
Safety performance for individual vehicles is expressed in two ways:
a) Time Based Measures
A number of safety performance measures based on the projected time of a potentialcollision can be found in literature. The most common are: time to collision (TTC), timeto accident (TTA), post-encroachment time (PET), encroachment time (ET), and gap time(GT).
b) Required Braking Power Measures
The differential speeds of vehicles at the moment of impact plays a major role in crashseverity due to the kinetic energy of the system right before the collision.Safety measures based on the required rate of speed reduction or braking power ofvehicles have the best theoretical formulation to provide good estimates of potentialconflicts. The most common are: deceleration rate to avoid a crash (DRAC) andproportion of stopping distance (PSD).

A number of safety performance measures have been investigated over the past twodecades. The literature review suggests that safety performance measures based onindividual brakig requirements, such as the deceleration rate to avoid the crash (DRAC),provide a better measure to represent both frequency and severity of high risk vehicleinteractions.
Measuring safety performance
Recent developments in real-time data acquisition techniques and increasing use ofmicroscopic simulation in safety studies have fostered the development of safety indicesthat incorporate a temporal dimension to traditional safety performance measures. Theconflict severity and the correspondent time exposed to such conflict can provide abetter measure of safety than a single measurement (such as the highest DRAC).
The most common safety indices are: time exposed time to collision (TET), timeintegrated time to collision (TIT), unsafety density (UD), and crash potential index (CPI).

Study framework
Real TrafficScenario Sampling
SafetyPerformance
Indicators
TrafficSimulation
SafetyPerformance
Indicators
Comparison

Study framework
Real TrafficScenario
Alternative Traffic
Scenario
TrafficSimulation
TrafficSimulation
SafetyPerformance
Indicators
SafetyPerformance
Indicators
Comparison
SafetyEvaluation and
Assessment
CountermeasuresEvaluation

Study framework
Real TrafficScenario Sampling
TrafficSimulation

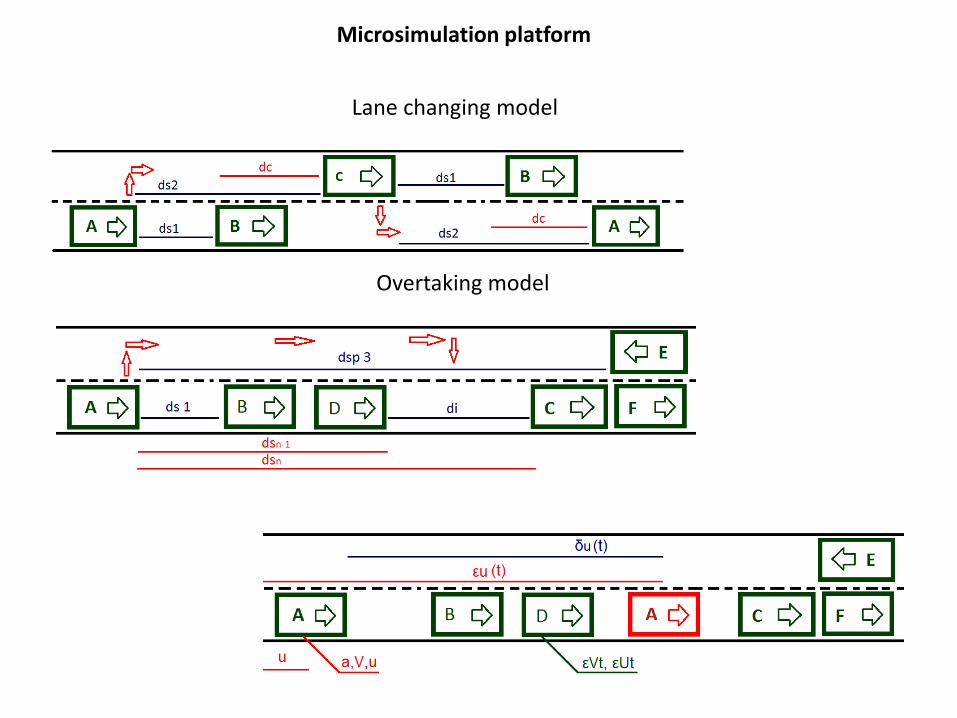
Microsimulation platform
The TRITONE model is a fully microscopic simulation model, as it tracks both the lateral and longitudinalmovements of individual vehicles.The model is designed to trace individual vehicle movements from a vehicle’s origin to its destination at a level ofresolution of one status update every 0.1 sec.This microscopic approach permits the analysis of many dynamic traffic phenomena, such as shock waves, gapacceptance, and weaving.
Travel activities within urban areas are an interrelated sequence of decisions that travelers must typically makein order to complete a particular trip.

Microsimulation platform
The first set of decisions (pre-trip) relates to the particular time at which the trip maker may elect to start itsintended trip within a given time window.
The other decisions are made once a trip has started, and usually need to be revisited several times as the actualtrip progresses.The microscopic approach permits considerable flexibility in terms of representing spatial variations in trafficconditions.TRITONE permits the density of traffic to vary continuously along the link.

Microsimulation platform
Speed distribution and drivers

Microsimulation platform
nome numero acc dec lungh peso CO2 Cons Vmax
Grande Punto 1.2 5p 0 1,92 0,96 4,03 1030 0,139 6,10 155
500 1.3 MJT 16v 1 2,22 1,11 3,55 980 0,110 4,20 165
Panda 1.2 4x4 2 1,39 0,69 3,54 965 0,155 6,60 145
Croma 2.4 MJT 20v 3 3,27 1,63 4,76 1575 0,191 8,00 216
Ypsilon 1.3 MJT 75cv 4 1,84 0,92 3,81 1045 0,155 4,50 167
Classe E 500 EVO ele 5 5,24 2,62 4,86 1710 0,275 11,5 250
SLK 55 AMG
Performan 6 5,67 2,83 4,09 1500 0,288 12,0 280
107 1.0 3p 7 2,03 1,01 3,43 790 0,108 4,60 157
307 1.6 HDi 16v berl 8 2,00 1,00 4,20 1231 0,129 4,90 179
Porsche 911 Turbo C. 9 7,12 3,56 4,43 1585 0,307 12,8 310
Panda 1000 fire 10 1,20 0,60 3,40 715 0,360 14,9 130
C3 1.4 16v Classiq 11 2,17 1,09 4,26 1182 0,153 6,40 182
Volvo C30 1.6 12 2,35 1,18 4,25 1240 0,167 7,00 185
Golf 1.9 TDI dpf 13 2,46 1,23 4,2 1338 0,135 5,00 187
Polo 1.2 60cv 3p 14 1,68 0,84 3,92 939 0,138 5,80 157
Rav 4 2.0 15 2,62 1,31 4,32 1575 0,202 8,60 185
Yaris 1.0 5p sol 16 1,77 0,88 3,75 1010 0,127 5,40 155
Smart fortwo 62kW 17 2,55 1,27 2,70 770 0,116 4,90 145
Seat Leon 1.9 TDI 18 2,46 1,23 4,32 1290 0,135 5,20 185
207 1.6 HDI 110cv 19 2,75 1,38 4,03 1253 0,126 4,80 193
Astra 1.7 CDTI101cv 20 2,26 1,13 4,25 1290 0,135 5,00 180
Opel Corsa 1.4 16v 21 2,24 1,12 4,00 1110 0,142 5,90 173
Mini One 22 2,55 1,27 3,70 1060 0,128 5,30 185
Classe A 150 23 2,20 1,10 3,88 1150 0,148 6,20 175
Fiesta 1.6 TDCi S 24 2,33 1,17 3,92 1107 0,116 4,40 180
BMW serie 5 520i 25 3,19 1,60 4,84 1460 0,162 6,70 224
Audi A3 S3 SPB 2.0 26 4,79 2,39 4,29 1545 0,201 8,50 250
159 1.9 JTDm 16v 27 2,96 1,48 4,66 1535 0,157 6,00 210
147 1.6 16v TS 105 28 2,16 1,23 4,22 1190 0,196 8,10 185
APE TM benzina 29 0,60 0,30 3,15 700 0,25 6,06 60
Car fleet characteristics

Microsimulation platform
Microsimulation platform
Lane changing model
Overtaking model

Microsimulation platform
Car-following models
• Gazis-Herman-Rothery (GHR) model (Brackstone and McDonald, 1998), that is
sometimes referred to as the General Motor car-following model;
• Gipps model (Gipps, 1981);
• unsymmetrical GHR model (Brackstone and McDonald, 1998);
•Van Aerde car following model (Van Aerde et al., 1996);
• psycho-physical model developed by Fritzsche (Fritzsche, 1994);
• psycho-physical model developed by Wiedemann (Wiedemann, 1974);
• FRESIM car-following model (Halati et al., 1997).

Calibrating microsimulation parameters
The microscopic rules have been carefully calibrated in order to capture concurrently most of the targetmacroscopic traffic features that traffic engineers are most familiar with. Examples of these features are linkspeed-flow relationships, uniform, random or over-saturation delay, and weaving and ramp capacities.

Study framework
Real TrafficScenario Sampling
SafetyPerformance
Indicators

All traffic data (From camera view)
Trajectories in time
Severity of crashes
12 3 4
Time (one year)
Crash occurence
Time (one year) Time (one year)Time (one year)
Time (one year) Time (one year) Time (one year)
Safety performances
Filtering
Too much
FilteringFiltering
Safety performances

Measuring safety performance
Safety performance measures can be obtained either through simulation based oncalibrated traffic models or experimentally through observational vehicle tracking data.Regardless of the approach adopted (i.e. simulation or observational), the estimation ofsafety performance needs to be linked to individual vehicle speed, acceleration andposition information observed at a given location over a given period of time (Cunto etal. 2008; Guido et al. 2009).
In this analysis, Safety Performance for an individual vehicle was obtained throughobservational data and expressed in terms of CPI.
Crash Potential Index (CPI) is a safety index, integrating over time with 0.1 secincrements the probability that the Deceleration Rate Required to Avoid a Crash (DRAC)exceeds the maximum available braking capability (MADR).
DRAC is estimated for each time interval as a function of the differential speed andspacing between interacting vehicles using uniform deceleration.

Measuring safety performance
where,CPIi = crash potential index for Vehi
MADR= maximum available deceleration rate for Vehi (m/s2)DRACi,t = deceleration rate to avoid the crash for Vehi during time interval t (m/s2)tii = initial observed time interval for Vehi
tfi = final observed time interval for Vehi
t = observation time interval (s)b = state variable, 1 if Vehi is interacting with Vehi-1 (closing the gap reducing the spacing), 0otherwiseTi = total observed time for Vehi (s)
Crash potential index

Measuring safety performance
where,t = time interval (s)X = position of the vehicles (m)L = vehicle length (m)V = speed (m/s)
Deceleration Rate to Avoid a Crash

Measuring safety performance
where,t = time interval (s)X = position of the vehicles (m)L = vehicle length (m)V = speed (m/s)
Time to Collision (TTC)

Measuring safety performance
Time Integrated Time-to-Collision (TIT)

Measuring safety performance
where,RD = remaining distance to the potential point of collision (m)
MSD = minimum acceptable stopping distance (m), which is defined as:
where,V = approaching velocity (m/s)
d = maximum acceptable deceleration rate (m/s2)
Proportion of Stopping Distance (PSD)

Case study A: safety performances evaluation on two-lane undivided rural highway
Collecting data
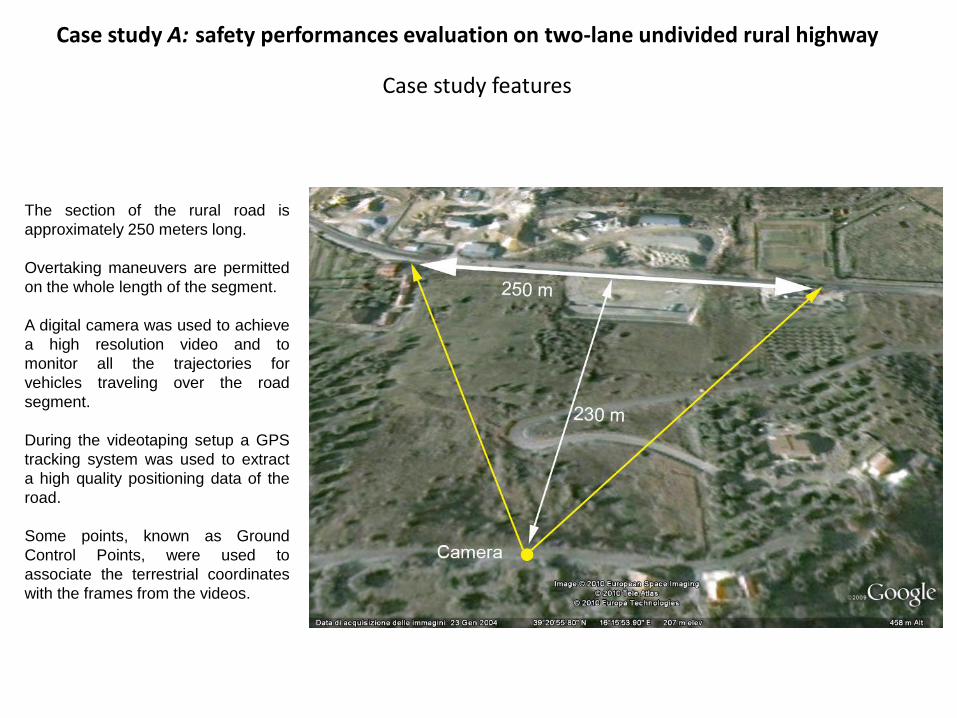
A segment of a two-lane rural road was selected toconduct the survey and to obtain the traffic data.
The section coincides with a straight segment of arural road (Strada Provinciale Destra Crati) inSouthern Italy.
A segment of a two-lane rural road was selected toconduct the survey and to obtain the traffic data.
The section coincides with a straight segment of arural road (Strada Provinciale Destra Crati) inSouthern Italy.
N
Case study features
The section of the rural road is
approximately 250 meters long.
Overtaking maneuvers are permitted
on the whole length of the segment.
A digital camera was used to achieve
a high resolution video and to
monitor all the trajectories for
vehicles traveling over the road
segment.
During the videotaping setup a GPS
tracking system was used to extract
a high quality positioning data of the
road.
Some points, known as Ground
Control Points, were used to
associate the terrestrial coordinates
with the frames from the videos.
Case study A: safety performances evaluation on two-lane undivided rural highway

Case study A: safety performances evaluation on two-lane undivided rural highway
Identification of vehicle trajectories through a video image processing algorithm

Identification of vehicle trajectories through a video image processing algorithm
Loading video and extracting frames Checking Ground Control Points
Defining road axis and maximum width of the scanning area Semi‐Automatic vehicle identification procedure
1 2
3 4
Case study A: safety performances evaluation on two-lane undivided rural highway

Calibrating microsimulation parameters
Monitoring period: 9:30 am – 10:30 am (off-peak traffic conditions)
Observed traffic flow: 392 vph (NB) – 432 vph (SB)
Average observed speeds: 54 kph (NB) – 53 kph (SB)
Number of simulation runs: 10
Thresholds adopted for the transition from the free-moving condition to the car-following regime: hf = 5 (sec)
Thresholds adopted for the transition from the car-following regime to the close-following condition: hc = 1 (sec)
Case study A: safety performances evaluation on two-lane undivided rural highway

Root mean squared normalized error (RMSNE)Root mean squared error (RMSE)
Case study A: safety performances evaluation on two-lane undivided rural highway
Calibrating microsimulation parameters
Observed and simulated speeds and flows were compared every 60 seconds.

Table 1: TTC values (sec) obtained from 10 simulation runsa
Link # veh. General Motors 3 Van Aerde Fritzsche Wiedemann Gipps Fresim/INTRAS
Run 1 1 103 40,50 56,50 18,32 27,26 54,26 16,85
2 93 42,45 52,26 17,16 19,56 52,74 14,93
Run 2 1 103 44,62 46,12 14,24 17,14 62,10 21,71
2 93 38,08 52,85 16,61 18,82 69,68 17,27
Run 3 1 103 39,41 60,95 16,84 20,56 56,09 17,76
2 93 38,29 46,75 16,68 19,70 50,54 14,24
Run 4 1 103 43,63 64,80 18,86 21,97 44,48 17,13
2 93 35,63 50,60 19,89 21,83 62,54 15,96
Run 5 1 103 37,40 54,91 19,49 23,02 67,18 21,22
2 93 37,99 53,96 16,62 20,31 58,62 16,54
Run 6 1 103 41,85 57,97 15,65 19,74 69,88 18,35
2 93 39,49 43,26 16,99 21,28 51,98 15,98
Run 7 1 103 44,91 51,04 20,50 23,66 68,53 17,27
2 93 39,51 51,35 18,00 21,27 56,00 16,49
Run 8 1 103 40,29 54,64 17,00 23,36 59,14 16,09
2 93 41,50 51,43 15,65 21,30 66,79 16,91
Run 9 1 103 40,80 59,65 17,80 23,73 58,57 19,29
2 93 39,33 49,80 17,75 17,69 45,45 15,08
Run 10 1 103 42,68 51,36 19,42 23,54 65,71 16,04
2 93 41,89 59,60 14,83 19,54 58,22 16,82
Average 1 103 41,61 55,80 17,81 22,40 60,60 18,17
2 93 39,42 52,19 17,02 20,13 57,26 16,02
St. Dev. 1 103 2,39 5,44 1,91 2,75 7,80 1,99
2 93 2,08 4,33 1,37 1,31 7,53 0,98
aObserved values are 10,59 secs for link 1 and 9,92 secs for link 2
Case study A: safety performances evaluation on two-lane undivided rural highway
TTC estimated values

bObserved values are 0,44 m/sec2 for link 1 and 0,47 m/sec2 for link 2
Table 2: DRAC values (m/sec2) obtained from 10 simulation runs
b
Link # veh. General Motors 3 Van Aerde Fritzsche Wiedemann Gipps Fresim/INTRAS
Run 1 1 103 0,12 0,53 0,23 0,29 0,21 0,25
2 93 0,11 0,64 0,21 0,25 0,36 0,28
Run 2 1 103 0,08 0,36 0,17 0,18 0,37 0,27
2 93 0,11 0,55 0,13 0,32 0,22 0,26
Run 3 1 103 0,09 0,44 0,16 0,30 0,24 0,25
2 93 0,07 0,53 0,13 0,17 0,25 0,27
Run 4 1 103 0,11 0,45 0,19 0,22 0,18 0,23
2 93 0,08 0,50 0,14 0,21 0,21 0,45
Run 5 1 103 0,08 0,45 0,26 0,36 0,24 0,22
2 93 0,11 0,61 0,16 0,19 0,20 0,31
Run 6 1 103 0,09 0,41 0,16 0,34 0,18 0,24
2 93 0,08 0,66 0,16 0,33 0,22 0,30
Run 7 1 103 0,09 0,60 0,19 0,35 0,25 0,22
2 93 0,08 0,52 0,18 0,31 0,24 0,39
Run 8 1 103 0,11 0,41 0,17 0,36 0,25 0,30
2 93 0,08 0,48 0,17 0,30 0,20 0,32
Run 9 1 103 0,11 0,38 0,16 0,20 0,24 0,26
2 93 0,07 0,75 0,14 0,27 0,35 0,34
Run 10 1 103 0,08 0,38 0,14 0,17 0,22 0,35
2 93 0,08 0,44 0,16 0,78 0,41 0,32
Average 1 103 0,10 0,44 0,18 0,28 0,24 0,26
2 93 0,09 0,57 0,16 0,31 0,27 0,32
St. Dev. 1 103 0,02 0,07 0,04 0,08 0,05 0,04
2 93 0,02 0,09 0,02 0,17 0,08 0,06
Case study A: safety performances evaluation on two-lane undivided rural highway
DRAC estimated values

Case study B: stop-controlled intersection vs roundabout, comparison of safety performances obtained by microsimulation
Stop controlled intersection (A) Four-leg roundabout (B)
Case study features

Case study B: stop-controlled intersection vs roundabout, comparison of safety performances obtained by microsimulation
Collecting data
Monitoring period: 9:30 am – 10:30 am (off-peak traffic conditions)
Observed circulating traffic flow: 530 vph
Number of simulation runs: 10

Scenario
Aver. TTC
(sec)
Aver. DRAC
(m/sec2)
Run 1 A 1.65 1.12
B 14.30 0.81
Run 2 A 0.75 0.30
B 8.55 0.13
Run 3 A 1.24 1.05
B 2.70 0.14
Run 4 A 3.28 0.58
B 3.49 0.45
Run 5 A 5.44 0.69
B 54.75 0.87
Run 6 A 1.46 0.28
B 8.64 0.12
Run 7 A 4.99 0.33
B 2.45 0.32
Run 8 A 10.32 0.46
B 3.28 0.20
Run 9 A 2.98 0.84
B 7.82 0.04
Run 10 A 2.83 0.62
B 15.53 0.23
Average A 3.53 0.54
B 7.46 0.33
Comparison of safety performance indicators obtained from 10 simulation runs
Case study B: stop-controlled intersection vs roundabout, comparison of safety performances obtained by microsimulation
TTC and DRAC estimated values

M2M – Mobile to Mobility
Sistemi informativi e di telecomunicazione per la sicurezza stradale


Struttura di attuazioneProponente Sede in Area Convergenza
Università della Calabria (Capofila)Via Pietro Bucci 87036 Rende (CS)
Via Pietro Bucci 87036 Rende (CS)
Neos Sistemi S.r.l. Via Tadini, 4725100 Brescia
Via Pietro Bucci 87036 Rende (CS)
FGA (Elasis) S.C.p.A.via ex Aeroporto, sn80038 Pomigliano d’Arco (NA)
via ex Aeroporto, sn80038 Pomigliano d’Arco (NA)
IGOP Istituto giuridico opere pubblichevia Giuseppe Mercalli, 1500197 Roma (Roma)
Via Pietro Bucci 87036 Rende (CS)
Partner
TMS Consultancy Italy S.r.l.Via Serapide 580078 Pozzuoli (NA)
Cosmed S.r.l.Largo Rodolfo Villani, 4500125 Roma (Roma)


Conclusions
•We have just started to assess the use of microsimulation as a tool for the evaluation of traffic safety performances
•New technologies will be helpful to feed the needed data for both the evaluation of traffic safety performances and the assesment of microsimulation as a tool for traffic safety evaluation.
•There is a great need of traffic data samples to validate different traffis situations.
Related Documents