Theor Appl Genet (2004) 109: 1494–1503 DOI 10.1007/s00122-004-1766-x ORIGINAL PAPER A. Mahmood . P. S. Baenziger . H. Budak . K. S. Gill . I. Dweikat The use of microsatellite markers for the detection of genetic similarity among winter bread wheat lines for chromosome 3A Received: 7 April 2004 / Accepted: 25 June 2004 / Published online: 29 July 2004 # Springer-Verlag 2004 Abstract Previous studies with chromosome substitution and recombinant inbred chromosome lines identified that chromosome 3A of wheat cv. Wichita contains alleles that influence grain yield, yield components and agronomic performance traits relative to alleles on chromosome 3A of Cheyenne, a cultivar believed to be the founder parent of many Nebraska developed cultivars. This study was carried out to examine the genetic similarity among wheat cultivars based on the variation in chromosome 3A. Forty-eight cultivars, two promising lines and four substitution lines (in duplicate) were included in the study. Thirty-six chromosome 3A-specific and 12 group-3 barley simple sequence repeat (SSR) primer pairs were used. A total of 106 polymorphic bands were scored. Transferability of barley microsatellite markers to wheat was 73%. The coefficient of genetic distance (D) among the genotypes ranged from 0.40 to 0.91 and averaged D=0.66. Cluster analysis by the unweighted pair-group method with arithmetic averages showed one large and one small cluster with eight minor clusters in the large cluster. Several known pedigree relationships largely corresponded with the results of SSR clusters and principal coordinate analysis. Cluster analysis was also carried out by using 22 alleles that separate Wichita 3A from Cheyenne 3A, and three clusters were identified (a small cluster related to Cheyenne of mainly western Nebraska wheat cultivars; a larger, intermediate cluster with many modern Nebraska wheat cultivars; a large cluster related to Wichita with many modern high-yielding or Kansas wheat cultivars). Using three SSR markers that identify known agronomically important quantitative trait loci (QTL) regions, we again separated the cultivars into three main clusters that were related to Cheyenne or Wichita, or had a different 3A lineage. These results suggest that SSR markers linked to agronomically important QTLs are a valuable asset for estimating both genetic similarity for chromosome 3A and how the chromosome has been used in cultivar improvement. Introduction In crop improvement programs, information on genetic diversity and the relationships among elite experimental lines and cultivars is useful for the development of new cultivars. This knowledge may speed up the breeding procedure and identify lines that need to be crossed to combine desirable characters. To understand and use genetic diversity, molecular markers that are highly polymorphic and easy to use are beneficial. The degree of genetic variation in wheat (Triticum aestivum L.) has been assessed with different types of DNA molecular markers (Koebner et al. 2001). Microsatellites (syn. simple sequence repeats, SSRs) are commonly used to study genetic relationships among lines of a species because of their high level of polymorphism (Bowcock et al. 1994; Röder et al. 1995). In addition, microsatellites exhibit codominant inheritance (Hernandez et al. 2002), which is essential for effective discrimination between closely related lines (Akkaya et al. 1992). Microsatellite markers are currently used to identify genotypes, quantitative trait loci (QTLs) and genetic diversity (Gupta and Varshney 2000; Budak et al. 2003). Recent investigations in comparative genetics have revealed that gene content and order are highly conserved among closely related species (Devos and Gale 2000; Gaut 2002). Colinearity of common markers illustrated by comparative maps suggests that a marker of one genus/ Communicated by B. Friebe A. Mahmood . P. S. Baenziger (*) . H. Budak . I. Dweikat Department of Agronomy and Horticulture, University of Nebraska, Lincoln, NE, 68583, USA e-mail: [email protected] A. Mahmood Barani Agricultural Research Institute, P.O. Box 35 Chakwal, 48800, Pakistan K. S. Gill Department of Crop and Soil Sciences, Washington State University, Pullman, WA, 99164, USA

Welcome message from author
This document is posted to help you gain knowledge. Please leave a comment to let me know what you think about it! Share it to your friends and learn new things together.
Transcript
Theor Appl Genet (2004) 109: 1494–1503DOI 10.1007/s00122-004-1766-x
ORIGINAL PAPER
A. Mahmood . P. S. Baenziger . H. Budak . K. S. Gill .I. Dweikat
The use of microsatellite markers for the detection of genetic
similarity among winter bread wheat lines for chromosome 3A
Received: 7 April 2004 / Accepted: 25 June 2004 / Published online: 29 July 2004# Springer-Verlag 2004
Abstract Previous studies with chromosome substitutionand recombinant inbred chromosome lines identified thatchromosome 3A of wheat cv. Wichita contains alleles thatinfluence grain yield, yield components and agronomicperformance traits relative to alleles on chromosome 3A ofCheyenne, a cultivar believed to be the founder parent ofmany Nebraska developed cultivars. This study wascarried out to examine the genetic similarity amongwheat cultivars based on the variation in chromosome 3A.Forty-eight cultivars, two promising lines and foursubstitution lines (in duplicate) were included in thestudy. Thirty-six chromosome 3A-specific and 12 group-3barley simple sequence repeat (SSR) primer pairs wereused. A total of 106 polymorphic bands were scored.Transferability of barley microsatellite markers to wheatwas 73%. The coefficient of genetic distance (D) amongthe genotypes ranged from 0.40 to 0.91 and averagedD=0.66. Cluster analysis by the unweighted pair-groupmethod with arithmetic averages showed one large andone small cluster with eight minor clusters in the largecluster. Several known pedigree relationships largelycorresponded with the results of SSR clusters and principalcoordinate analysis. Cluster analysis was also carried outby using 22 alleles that separate Wichita 3A fromCheyenne 3A, and three clusters were identified (a smallcluster related to Cheyenne of mainly western Nebraskawheat cultivars; a larger, intermediate cluster with many
modern Nebraska wheat cultivars; a large cluster related toWichita with many modern high-yielding or Kansas wheatcultivars). Using three SSR markers that identify knownagronomically important quantitative trait loci (QTL)regions, we again separated the cultivars into three mainclusters that were related to Cheyenne or Wichita, or had adifferent 3A lineage. These results suggest that SSRmarkers linked to agronomically important QTLs are avaluable asset for estimating both genetic similarity forchromosome 3A and how the chromosome has been usedin cultivar improvement.
Introduction
In crop improvement programs, information on geneticdiversity and the relationships among elite experimentallines and cultivars is useful for the development of newcultivars. This knowledge may speed up the breedingprocedure and identify lines that need to be crossed tocombine desirable characters. To understand and usegenetic diversity, molecular markers that are highlypolymorphic and easy to use are beneficial. The degreeof genetic variation in wheat (Triticum aestivum L.) hasbeen assessed with different types of DNA molecularmarkers (Koebner et al. 2001). Microsatellites (syn. simplesequence repeats, SSRs) are commonly used to studygenetic relationships among lines of a species because oftheir high level of polymorphism (Bowcock et al. 1994;Röder et al. 1995). In addition, microsatellites exhibitcodominant inheritance (Hernandez et al. 2002), which isessential for effective discrimination between closelyrelated lines (Akkaya et al. 1992). Microsatellite markersare currently used to identify genotypes, quantitative traitloci (QTLs) and genetic diversity (Gupta and Varshney2000; Budak et al. 2003).
Recent investigations in comparative genetics haverevealed that gene content and order are highly conservedamong closely related species (Devos and Gale 2000; Gaut2002). Colinearity of common markers illustrated bycomparative maps suggests that a marker of one genus/
Communicated by B. Friebe
A. Mahmood . P. S. Baenziger (*) . H. Budak . I. DweikatDepartment of Agronomy and Horticulture, University ofNebraska,Lincoln, NE, 68583, USAe-mail: [email protected]
A. MahmoodBarani Agricultural Research Institute,P.O. Box 35 Chakwal, 48800, Pakistan
K. S. GillDepartment of Crop and Soil Sciences, Washington StateUniversity,Pullman, WA, 99164, USA
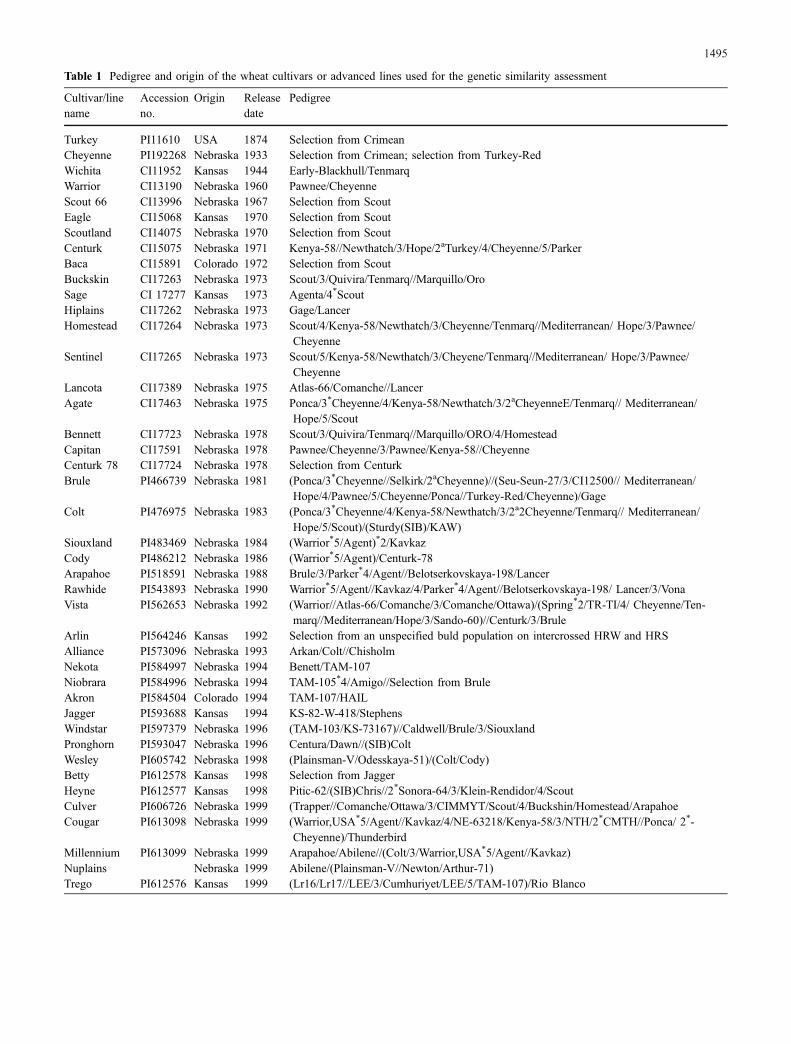
Table 1 Pedigree and origin of the wheat cultivars or advanced lines used for the genetic similarity assessment
Cultivar/linename
Accessionno.
Origin Releasedate
Pedigree
Turkey PI11610 USA 1874 Selection from CrimeanCheyenne PI192268 Nebraska 1933 Selection from Crimean; selection from Turkey-RedWichita CI11952 Kansas 1944 Early-Blackhull/TenmarqWarrior CI13190 Nebraska 1960 Pawnee/CheyenneScout 66 CI13996 Nebraska 1967 Selection from ScoutEagle CI15068 Kansas 1970 Selection from ScoutScoutland CI14075 Nebraska 1970 Selection from ScoutCenturk CI15075 Nebraska 1971 Kenya-58//Newthatch/3/Hope/2aTurkey/4/Cheyenne/5/ParkerBaca CI15891 Colorado 1972 Selection from ScoutBuckskin CI17263 Nebraska 1973 Scout/3/Quivira/Tenmarq//Marquillo/OroSage CI 17277 Kansas 1973 Agenta/4*ScoutHiplains CI17262 Nebraska 1973 Gage/LancerHomestead CI17264 Nebraska 1973 Scout/4/Kenya-58/Newthatch/3/Cheyenne/Tenmarq//Mediterranean/ Hope/3/Pawnee/
CheyenneSentinel CI17265 Nebraska 1973 Scout/5/Kenya-58/Newthatch/3/Cheyene/Tenmarq//Mediterranean/ Hope/3/Pawnee/
CheyenneLancota CI17389 Nebraska 1975 Atlas-66/Comanche//LancerAgate CI17463 Nebraska 1975 Ponca/3*Cheyenne/4/Kenya-58/Newthatch/3/2aCheyenneE/Tenmarq// Mediterranean/
Hope/5/ScoutBennett CI17723 Nebraska 1978 Scout/3/Quivira/Tenmarq//Marquillo/ORO/4/HomesteadCapitan CI17591 Nebraska 1978 Pawnee/Cheyenne/3/Pawnee/Kenya-58//CheyenneCenturk 78 CI17724 Nebraska 1978 Selection from CenturkBrule PI466739 Nebraska 1981 (Ponca/3*Cheyenne//Selkirk/2aCheyenne)//(Seu-Seun-27/3/CI12500// Mediterranean/
Hope/4/Pawnee/5/Cheyenne/Ponca//Turkey-Red/Cheyenne)/GageColt PI476975 Nebraska 1983 (Ponca/3*Cheyenne/4/Kenya-58/Newthatch/3/2a2Cheyenne/Tenmarq// Mediterranean/
Hope/5/Scout)/(Sturdy(SIB)/KAW)Siouxland PI483469 Nebraska 1984 (Warrior*5/Agent)*2/KavkazCody PI486212 Nebraska 1986 (Warrior*5/Agent)/Centurk-78Arapahoe PI518591 Nebraska 1988 Brule/3/Parker*4/Agent//Belotserkovskaya-198/LancerRawhide PI543893 Nebraska 1990 Warrior*5/Agent//Kavkaz/4/Parker*4/Agent//Belotserkovskaya-198/ Lancer/3/VonaVista PI562653 Nebraska 1992 (Warrior//Atlas-66/Comanche/3/Comanche/Ottawa)/(Spring*2/TR-TI/4/ Cheyenne/Ten-
marq//Mediterranean/Hope/3/Sando-60)//Centurk/3/BruleArlin PI564246 Kansas 1992 Selection from an unspecified buld population on intercrossed HRW and HRSAlliance PI573096 Nebraska 1993 Arkan/Colt//ChisholmNekota PI584997 Nebraska 1994 Benett/TAM-107Niobrara PI584996 Nebraska 1994 TAM-105*4/Amigo//Selection from BruleAkron PI584504 Colorado 1994 TAM-107/HAILJagger PI593688 Kansas 1994 KS-82-W-418/StephensWindstar PI597379 Nebraska 1996 (TAM-103/KS-73167)//Caldwell/Brule/3/SiouxlandPronghorn PI593047 Nebraska 1996 Centura/Dawn//(SIB)ColtWesley PI605742 Nebraska 1998 (Plainsman-V/Odesskaya-51)/(Colt/Cody)Betty PI612578 Kansas 1998 Selection from JaggerHeyne PI612577 Kansas 1998 Pitic-62/(SIB)Chris//2*Sonora-64/3/Klein-Rendidor/4/ScoutCulver PI606726 Nebraska 1999 (Trapper//Comanche/Ottawa/3/CIMMYT/Scout/4/Buckshin/Homestead/ArapahoeCougar PI613098 Nebraska 1999 (Warrior,USA*5/Agent//Kavkaz/4/NE-63218/Kenya-58/3/NTH/2*CMTH//Ponca/ 2*-
Cheyenne)/ThunderbirdMillennium PI613099 Nebraska 1999 Arapahoe/Abilene//(Colt/3/Warrior,USA*5/Agent//Kavkaz)Nuplains Nebraska 1999 Abilene/(Plainsman-V//Newton/Arthur-71)Trego PI612576 Kansas 1999 (Lr16/Lr17//LEE/3/Cumhuriyet/LEE/5/TAM-107)/Rio Blanco
1495
species will be present in another related genus/species(Van Deynze et al. 1998; Tikhonov et al. 1999). Sequencedata obtained from several crop plants indicate homologyexists between genomes in the regions flanked by SSR loci(Brown et al. 1996; Peakall et al. 1998; Van Deynze et al.1998; Tikhonov et al. 1999) . Thus, primer pairs designedfor one species could be used to detect SSRs in relatedspecies. The transfer of SSRs has been proposed andsuccessfully demonstrated in many genera, includingGlycine (Peakall et al. 1998), Prunus (Dirlewanger et al.2002), between Aegilops and Triticum (Sourdille et al.2001) and wheat, rye (Secale cereale L.) and Triticale(×Triticosecale Wittmack) (Kuleung et al. 2004).
Scientists conducting QTL experiments in wheat haveaccess to unique genetic resources, including chromosomesubstitution lines. The evaluation of reciprocal chromo-some substitution lines between two parental lines forcomplex traits enables the identification of singlechromosomes containing QTLs for those characters.Since cv. Cheyenne (CNN) is believed to be the founderparent of many Nebraska developed cultivars, a completeset of chromosome substitution lines between CNN andsome other cultivars were developed at Nebraska by Dr.M. R. Morris to study the effect of individual chromo-somes (Berke et al. 1992a, b; Campbell et al. 2003).
Several studies have found evidence of the importanceof chromosome 3A in wheat. Berke et al. (1992a, b)evaluated a full set of reciprocal chromosome substitutionlines between cv. CNN and cv. Wichita (WI) and foundthat WI 3A carried allele(s) that significantly increasedgrain yield, 1,000 kernel weight and grain volume weightwhile decreasing plant height and anthesis date whenplaced in the CNN background. They also found thatCNN 3A carried allele(s) that significantly decreased grainyield, tillers per square meter and grain volume weightwhen placed in the WI background. In order to identifyand locate these genes on WI 3A, a set of chromosome 3Arecombinant inbred chromosome lines (RICLs-3A) wasderived from a cross between CNN and CNN (WI 3A).
Shah et al. (1999a, b) evaluated 50 RICLs-3A. Anthesisdate was mapped as a single gene on the short arm ofchromosome 3A and explained a significant variation for1,000 kernel weight, kernel per spike and plant height.Additional QTLs were detected for yield components andplant height elsewhere on the chromosome. Campbell etal. (2003), using a larger population of RICLs and morereplications, detected QTLs for seven agronomic traits andmapped the QTLs to three regions of chromosome 3A.Major QTLs for kernels per square meter and grain yieldwere located within a 5-cM interval and were inherited assingle QTL with pleiotropic effects. These studies indicatethat wheat cultivars containing chromosome 3A fromhigh-yielding cultivars could contribute to grain-yieldenhancement and agronomic improvement. Therefore, acomparison of genetic diversity and similarity amongcultivars of bread wheat for chromosome 3A is useful forthe evaluation of local breeding material and for theexploitation and introduction of these QTLs in othergermplasm.
To date, molecular markers, including SSRs, have beenused to assay diversity of wheat lines or cultivars(Mercado et al. 1996; Kim and Ward 1997; Barrett andKidwell 1998; Huang et al. 2002; Sun et al. 2003). Thepurpose of the investigation reported here was to addressthese three hypotheses: (1) current SSR markers that target3A loci are robust tools for breeders that can effectivelydistinguish genotypes and measure relationships in linesand cultivars that represent important central plains winterbread wheat germplasm; (2) chromosome 3A alleles canbe identified that mark cvs. WI and CNN chromosomesand allow breeders to track these chromosomal segmentsin cultivars adapted for high-yielding or high-stressenvironments; (3) chromosome 3A alleles from markerslinked to agronomically important QTLs can be used todetermine if cultivars have marker genotypes associatedwith high yield versus high-stress tolerance.
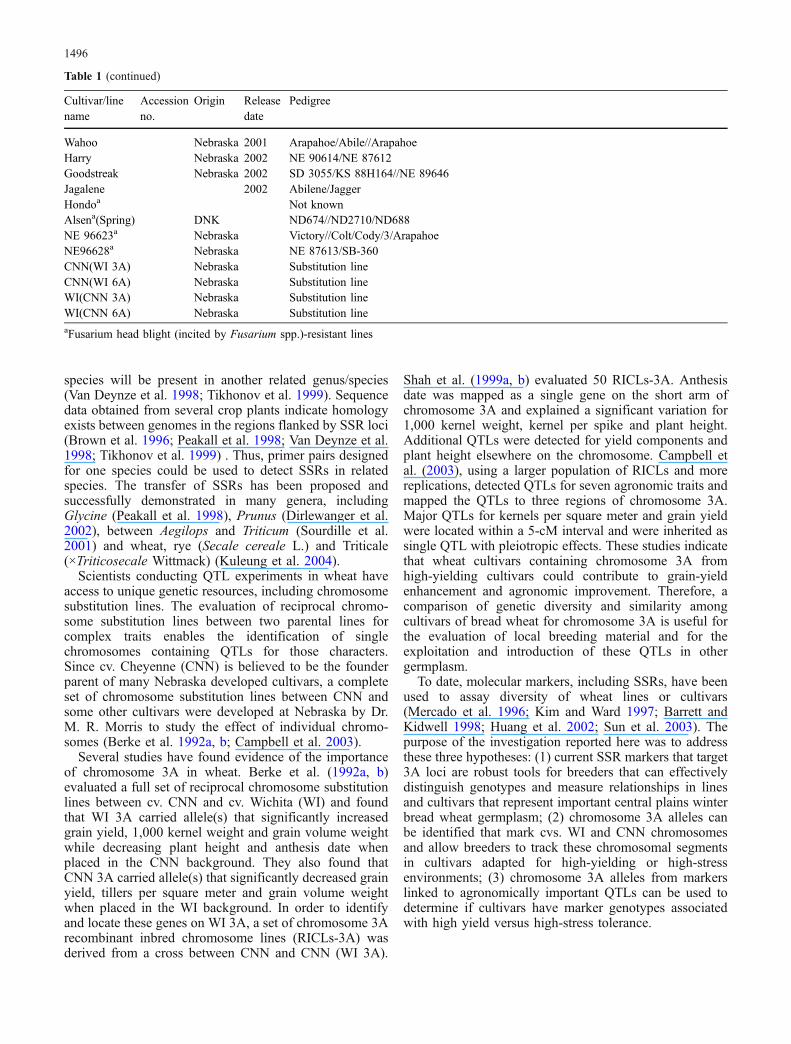
Cultivar/linename
Accessionno.
Origin Releasedate
Pedigree
Wahoo Nebraska 2001 Arapahoe/Abile//ArapahoeHarry Nebraska 2002 NE 90614/NE 87612Goodstreak Nebraska 2002 SD 3055/KS 88H164//NE 89646Jagalene 2002 Abilene/JaggerHondoa Not knownAlsena(Spring) DNK ND674//ND2710/ND688NE 96623a Nebraska Victory//Colt/Cody/3/ArapahoeNE96628a Nebraska NE 87613/SB-360CNN(WI 3A) Nebraska Substitution lineCNN(WI 6A) Nebraska Substitution lineWI(CNN 3A) Nebraska Substitution lineWI(CNN 6A) Nebraska Substitution lineaFusarium head blight (incited by Fusarium spp.)-resistant lines
Table 1 (continued)
1496
Materials and methods
Plant material
Forty-eight elite winter wheat cultivars including WI andCNN, two advanced lines and four substitution lines induplicate [CNN(WI 3A), CNN(WI 6A), WI(CNN 3A) andWI(CNN 6A)] were included in the study (Table 1). Twocultivars (Scout 66 and Centurk) were included twicebecause seed from different sources was obtained. The twosets of the four substitution lines were included becausethey were independently developed, and we wanted toconfirm their genetics. Of the genotypes, 38 were elitewinter wheat cultivars and two advanced lines developedby Nebraska, eight cultivars were developed by Kansasand two cultivars were developed by Colorado. Thesegenotypes were selected for this study because CNN or WIare founder parents of many cultivars released in the GreatPlains. Seed were obtained from the breeders or the USDANational Small Seed Grain Collection, Aberdeen, Idaho.
DNA extraction
Genomic DNA of each line was isolated from 100 mgfresh tissue using a sap extraction method. Leaves of 2-week-old seedlings grown in greenhouse were placedbetween the two rollers of a sap extraction apparatus(Ravenel Specialities, Seneca, S.C.), and 1 ml of extrac-tion buffer (50 mM Tris-HCl, 25 mM EDTA, 1 M NaCl,1% CTAB, 1 mM 1,10-phenathroline and 0.15% 2-mercaptoethanol) was slowly added to the rollers,immediately mixing with the sap for collection in 1.5-mlmicrocentrifuge tubes. The extract was incubated at 60°Cfor 1 h then mixed with equal volume of chloroform-isoamyl alcohol (24:1). After centrifugation at 12,000 rpmthe supernatant was transferred to a new tube andisopropanol added for a 30-min incubation to precipitatethe DNA. The pellet was dried, resuspended in 200 μl TEbuffer (10 mM Tris-HCl, 0.1 mM EDTA, pH 8.0) plus20 μg of RNase, then incubated at room temperatureovernight. The DNA solution was mixed with 20 μl 8 Mammonium acetate and 400 μl of cold absolute ethanol for30 min, centrifuged for 10 min and air-dried at roomtemperature. The DNAwas then resuspended in 200 μl TE
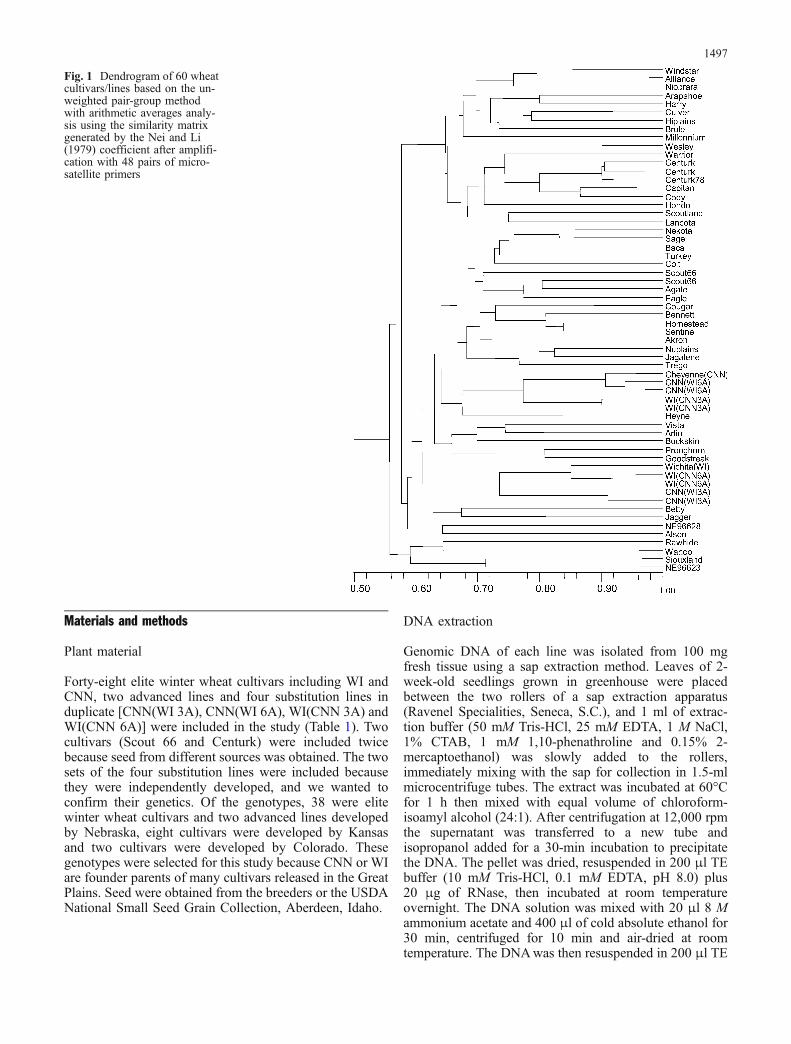
Fig. 1 Dendrogram of 60 wheatcultivars/lines based on the un-weighted pair-group methodwith arithmetic averages analy-sis using the similarity matrixgenerated by the Nei and Li(1979) coefficient after amplifi-cation with 48 pairs of micro-satellite primers
1497
buffer and the DNA concentration quantified by spectro-photometry (TKO100 Fluorometer, Hoefer ScientificInstruments, San Francisco, Calif.).
PCR amplification
Fifty-two wheat chromosome 3A (kindly provided by Dr.P. Cregan, USDA-ARS, Beltsville, Md.; Röder et al. 1998)and 37 barley (Hordeum vulgare L.) group-3 (Liu et al.1996) SSR markers were screened for amplification andpolymorphism in 60 genotypes of wheat. The PCRreaction mixture (25 μl total) consisted of 50 mM KCland 10 mM Tris-HCl, pH 8.8), 2 mM MgCl2, 125 μM ofdNTP, 50 ng of each primer, 1.0 U Taq polymerase(Promega, Madison, Wis.) and 20 ng of genomic DNA.Amplification was carried out in a MJ Research PTC_100(programmable thermal controller; MJ Research, Wal-tham, Mass.) using a program that consisted of initialdenaturation for 1 min at 94°C, followed by 32 cycles of30 s at 94°C, 50 s at 53 and 72°C, and final extension for5 min at 72°C. The amplified PCR products were gel-fractionated on a 12% polyacrylamide gel (37:1, acryl-amide:bis-acrylamide) in a TAE buffer (40 mM Tris-HCl,20 mM sodium acetate, 1 mM EDTA) using a Hoefervertical gel apparatus (SE600) at 300 V for 3 h at 20°Cand a circulating bath to maintain temperature. The gelswere stained in ethidium bromide (1 μg/ml) for 20 min,destained in deionized water for 1 h and photographedunder the Gel Doc2000 (Bio-Rad, Hercules, Calif.).
Data analysis
Presence or absence of each SSR fragment was coded as“1” and “0”, where “1” indicated the presence of a specificallele and “0” indicated its absence. Genetic diversity foreach locus was then calculated by Weir’s (1996) genediversity (Dl)=1−ΣPlu
2 and average gene diversity (D)=1−(1/m)ΣlΣuPlu
2, where Plu is the frequency of the uthallele at lth locus and m is the number of loci. All analyseswere performed using the NTSYSPC ver. 2.1 softwarepackage (Exeter Software, Setanket, N.Y.) (Rohlf 2000).Genetic similarities between pairs of accessions weremeasured by the DICE similarity coefficient based on theproportion of shared alleles (Dice 1945; Nei and Li 1979)with the SIMQUAL module. The Dice similarity coefficien-t=2a/(2a+b+c), where a is the number of positive matches(presence of a band in both accessions), and b+c is thenumber of no matches (presence of a band either in oneaccession but absent in the other accession). Theaccessions were clustered based on a similarity matrixusing an unweighted pair group method with arithmeticaverage (UPGMA ) algorithm with the SAHN module. Theresult was used to construct a dendrogram with the TREE
module. A principal coordinate analysis was performedwith the DCENTER and EIGEN modules and illustrated by the3D PLOT module.
Results and discussion
Transferability of barley group-3 SSR markers towheat
Of the 37 barley group-3 SSR markers, 27 (73%)amplified in wheat. Of the 27 amplified markers, 15(56%) were monomorphic and 12 (44%) were polymor-phic. The barley SSR-amplified fragments were usuallyweaker than those of the wheat marker fragments. Severalreports indicate that microsatellite primer pairs developedfrom one genus or species can amplify DNA of closerelatives. Korzun et al. (2001) reported that approximately27% of wheat SSR markers were amplified in rye, whereasRöder et al. (1995) observed a high level of transferabilityof the wheat SSR markers to rye (60%), although mostamplified products were weak. While the transferability ofthe plant SSR markers is usually less effective than that ofrestriction fragment length polymorphism (RFLP) markers(Korzun et al. 1998; Van Deynze et al. 1998), this is notalways the case, Dirlewanger et al. (2002) reported a hightransferability of SSR markers in peach (Prunus spp.).
Genetic similarity between cultivars forchromosome 3A
Of the 52 SSR primer pairs specific for wheatchromosome 3A, 36 (69%) were polymorphic. Hence,36 wheat chromosome-3A and 12 barley group-3H SSRs(total of 48) were used for estimating genetic diversity.About one-half of the samples were repeated to test forreproducibility, and only reproducible and unambiguousbands were used for the analysis.
Based on the 106 shared alleles of the 48 SSRs, wecalculated a similarity coefficient for each pair of the 60wheat genotypes. This similarity coefficient ranged from0.40 to 0.91 and averaged 0.66 (data not shown). Thegreatest diversity was observed between Siouxland andAlliance, while Centurk and Bennett were most closelyrelated cultivars. Three of the most closely relatedcultivars to CNN (WI 3A) were Nekota, Homestead andTrego, each with similarity coefficients of 0.70 or more.Nekota and Trego shared a common ancestor, Bennett, andHomestead is one of the parents of Bennett. Wichita isrelated to Bennett, as both share a common parent,Tenmarq.
The UPGMA cluster analysis established from thesimilarity data revealed two main cluster groups ofindividuals within the population of 60 cultivars/lines(Fig. 1). Windstar and NE 96623 (both developed by theUniversity Nebraska breeding effort) were found to spanthe extremes of the dendrogram, with all other germplasmdistributed between the maximum genetic distance of0.56 U. The clustering generally agreed with the pedigreeinformation. One of the two main groups consisted of fourcultivars/lines (Rawhide, Wahoo, Siouxland andNE 96623) released from the University of Nebraska; allexcept Siouxland share four common ancestors (Parker,
1498
Agent, Beloterkovskaya 198 and Lancer). It is unlikelythat Agent was the reason for this cluster, as it was used asthe donor parent with five backcrosses to the recurrentparent in many cultivars in addition to the four listedabove, and the selection was for the important diseaseresistance genes (Sr24, Lr24) from an alien speciestranslocated to chromosome 3DL. Only if our primersamplified an allele on the homoeologous group-3 chro-mosome would alleles from Agent be visualized.
The other main group was subdivided into eightsubgroups. One of the subgroups, which consisted ofnine lines, including seven recently released cultivarsdeveloped at the University of Nebraska after 1988(Windstar, Alliance, Niobrara, Arapahoe, Harry, Culverand Millennium), and two older cultivars developed before1988 (Hiplains and Brule), grouped together at a geneticdistance value of 0.67 U. Brule and Hiplains wereextensively used as parents of the seven new cultivars ofthis group. Another subgroup consisted of eight olderNebraska cultivars, a newer Nebraska cultivar, Wesley anda cultivar developed by AgriPro (Hondo). All cultivarsshared the common parent, CNN. In this group, Nebraskacv. Centurk was repeated twice as seed was received fromtwo different sources. Centurk was developed in 1971 andwas a highly heterogeneous cultivar as can be seen byCenturk 78 being selected from Centurk. The geneticsimilarity between two sources of Centurk and Centurk 78(a selection from Centurk) was 0.89 U. The differencesbetween the two sources of Centurk may be due to a smallnumber of plants being sampled for DNA extraction in aknown heterogeneous cultivar or possibly due to mutationor outcrossing in one source. Seventeen cultivars wereclustered together, all of which, except for Turkey, wereeither selected from Scout or shared Scout as an ancestralparent. Cultivars Cheyenne and Heyne grouped with the
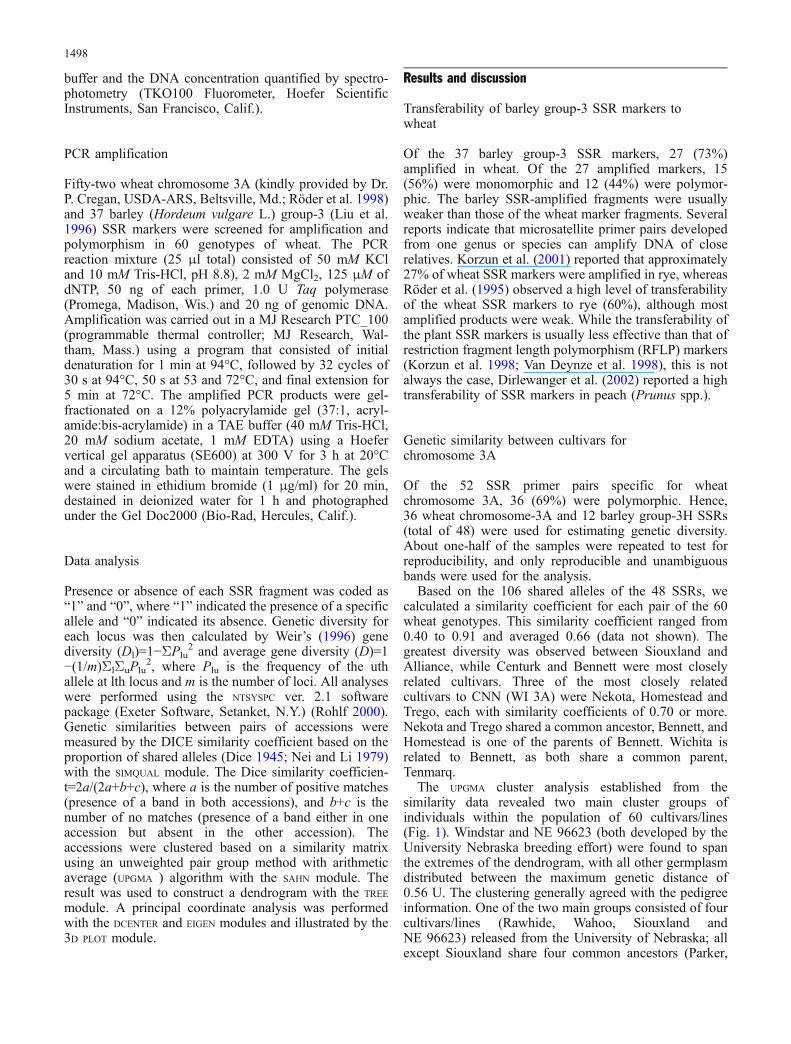
Fig. 2 Relationships among the60 wheat genotypes visualizedby PCA of SSR-based geneticsimilarities. Coordinates 1, 2,and 3 are indicated
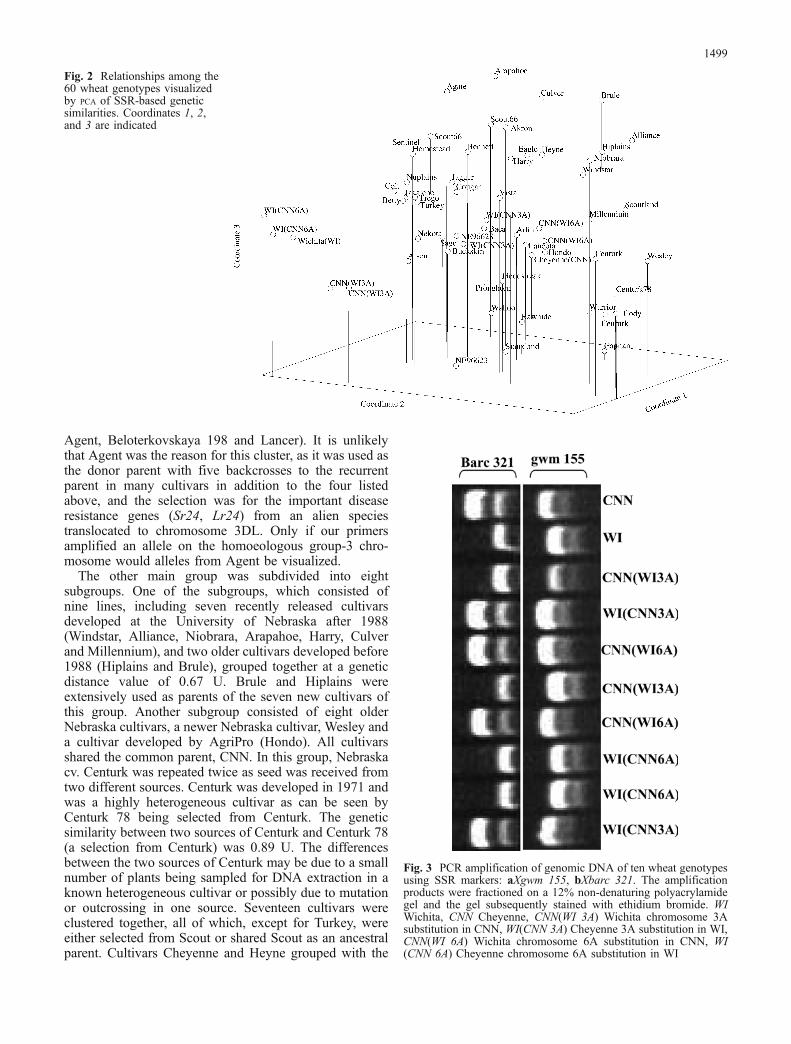
Fig. 3 PCR amplification of genomic DNA of ten wheat genotypesusing SSR markers: aXgwm 155, bXbarc 321. The amplificationproducts were fractioned on a 12% non-denaturing polyacrylamidegel and the gel subsequently stained with ethidium bromide. WIWichita, CNN Cheyenne, CNN(WI 3A) Wichita chromosome 3Asubstitution in CNN, WI(CNN 3A) Cheyenne 3A substitution in WI,CNN(WI 6A) Wichita chromosome 6A substitution in CNN, WI(CNN 6A) Cheyenne chromosome 6A substitution in WI
1499
Cheyenne substitution lines or WI(CNN 3A), and Heynehas Cheyenne as an ancestor. Three new Nebraskacultivars (Vista, Pronghorn and Goodstreak), one olderNebraska cultivar, Buckskin, and one Kansas cultivar,Arlin, were grouped together. All cultivars of this grouphave all or many of the lines Ponca, CNN, Tenmarq andHope as ancestors. This group was remarkably diverse inthat Vista and Arlen are high-yielding semidwarf cultivars,while Buckskin, Pronghorn, and Goodstreak are cultivarsof conventional height that yield best in low-yielding,drought-prone environments. The diversity among thesecultivars presumably is due to genes on other chromo-somes. As was expected, cv. Wichita grouped with itssubstitution lines having the WI 3A chromosome,although the CNN(WI 3A) was not as similar as WI(CNN 6A), which would have the WI 3A indicating ourSSR makers may amplify DNA from homoeologouschromosomes. Two cultivars released from Kansas, Bettyand Jagger were grouped together as Betty was developedas a selection from Jagger. NE 96628 and Alsen groupedtogether. Very little is known about the pedigree of Alsen,
but it includes Wheaton, Grandin and Sumai 3, which isknown to have a QTL for Fusarium head blight onchromosome 3BS (Liu and Anderson 2003). Both lineswere included because they are reported to be tolerant toFusarium head blight (incited by Fusarium spp.), and aQTL for Fusarium head blight has been found onchromosome 3A (Shen et al. 2003). Therefore, theselines possibly share a common ancestor.
Duplicate sets of each substitution line were used, andeach set had a small diversity compared with that of theother. As these lines were developed by the backcrossingmethod, the differences may be due to the number ofbackcrosses made with the recurrent parent during prep-aration of the lines, or some scorable bands may be fromchromosome(s) other than 3A. In this study, two samplesof Scout 66 and Centurk were used to represent seed fromtwo different sources. Both sources of Centurk weresimilar, however two sources of Scout 66 showed somedissimilarity. Scout 66 was a derivative of Scout, a highlyheterogeneous cultivar as indicated by the fact that Eagle,Scoutland and Baca were selected from Scout. Scout 66
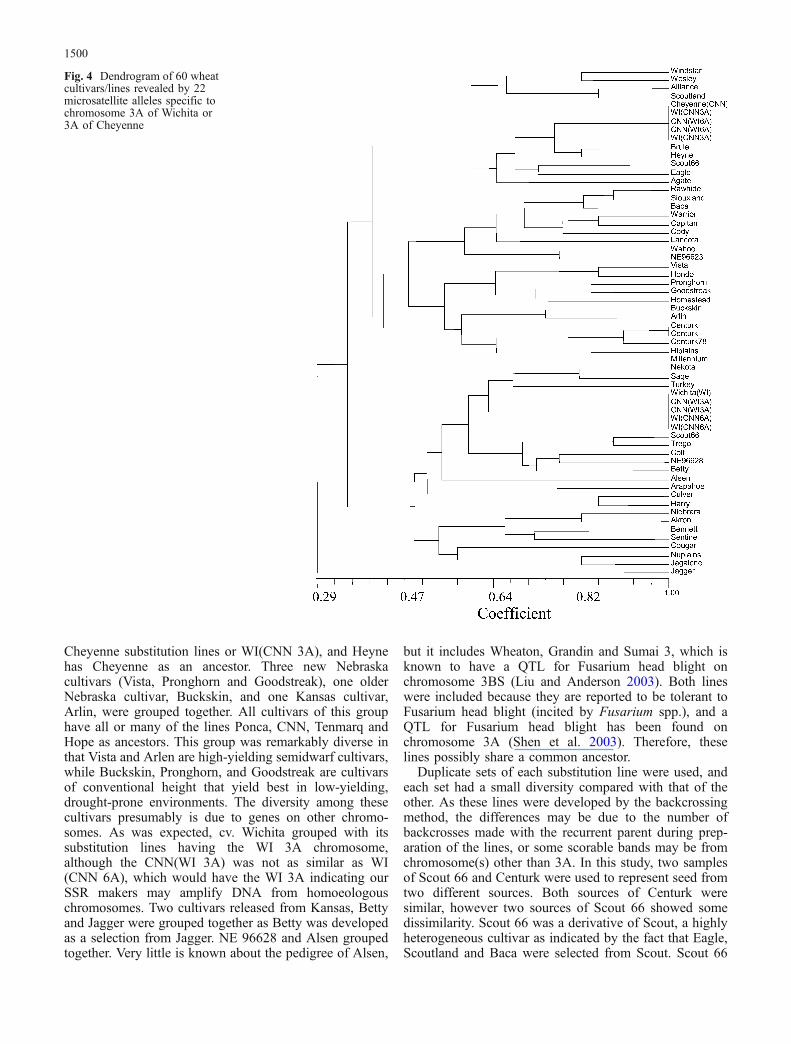
Fig. 4 Dendrogram of 60 wheatcultivars/lines revealed by 22microsatellite alleles specific tochromosome 3A of Wichita or3A of Cheyenne
1500
may also be heterogeneous, and this dissimilarity may bethe result of sampling a few plants from a heterogeneouscultivar.
Principal coordinate analysis (PCA) was performed basedon the genetic similarity matrix in order to gain a betterunderstanding of the relationship among the cultivars,lines and substitution lines (Fig. 2). The PCA revealed agrouping that was almost similar to that of the UPGMA
analysis. As was observed in the dendrogram, substitutionlines having Wichita chromosome 3A grouped with cv.Wichita, while substitution lines without WIchromosome 3A grouped with cv. Cheyenne. The fourmost divergent cultivars of the distinct group in UPGMA
were also well separated from the other cultivars. All othercultivars were largely separated into the same groups asthey were in the cluster analysis.
Microsatellite analysis of the WI 3A and CNN 3Achromosomes
Of the 48 pairs of primers, 20 primer pairs revealed 22polymorphic bands specific to the WI 3A or CNN 3Achromosomes such that bands were only present for cv.Wichita (or where the WI 3A chromosome was present inthe substitution lines) and absent in Cheyenne (or wherethe CNN 3A chromosome was present in the substitutionlines) or vice versa (Fig. 3). Data on the 22 alleles wereused for determining similarity coefficients and perform-ing a clustering analysis of 60 lines/cultivars to determinesimilarity among lines specific to the WI 3A and CNN 3Achromosome. For each locus, a screen of the wheatcultivars was performed to identify the alleles correspond-ing in size to the WI 3A or CNN 3A chromosome. wefound three main clusters in an UPGMA dendrogram basedon these 22 alleles that separated WI and CNN (Fig. 4).
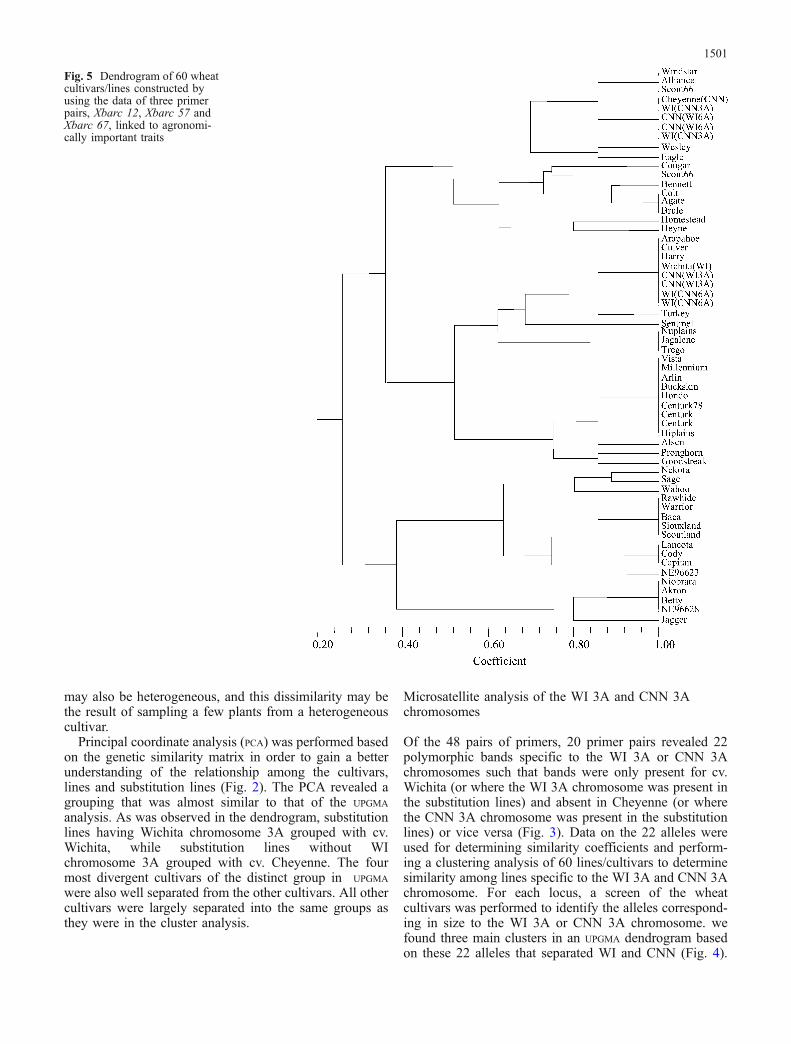
Fig. 5 Dendrogram of 60 wheatcultivars/lines constructed byusing the data of three primerpairs, Xbarc 12, Xbarc 57 andXbarc 67, linked to agronomi-cally important traits
1501
No one cultivar had all 22 alleles from either WI or CNN.The first cluster was small and contained CNN andsubstitution lines having CNN 3A and predominantlywheat cultivars adapted to western Nebraska (e.g. Alli-ance, Windstar, Brule, Scoutland) with two exceptions,Wesley and Heyne. The second cluster was a large clusterthat was more closely related to CNN than WI andcontained many of the Nebraska-bred modern cultivars(e.g. Rawhide, Siouxland, Wahoo, Pronghorn, Millen-nium). The third cluster was related to WI and containedTurkey, the first important hard wheat in the Great Plains(hence potentially the source of many WI alleles), andsome of the Kansas cultivars (e.g. Trego, Sage, Betty).This cluster also included modern Nebraska cultivars thattend to be adapted to higher yielding environments.Twenty-two alleles provided sufficient information forsimilarity studies of the cultivars with a WI 3A orCNN 3A chromosome. Previous genotype studies foundthat seven microsatellites were enough for the identifica-tion of soybean (Glysine max L.) genotypes (Rongwen etal. 1995). The genetic distance and dendrogram wasconstructed for rice (Oryza sativa L.) using ten micro-satellites (Garland et al. 1999) and 15 microsatellites inbarley (Hordeum vulgare L.) (Struss and Plieske 1998).Twelve microsatellite loci were used for chromosomalinheritance studies of 59 wheat cultivars (Pestsova andRöder 2002), and a set of 12 primer pairs were able todistinguish 48 wheat genotypes (Prasad et al. 2000).
Similarity analysis using agronomically importantmicrosatellites
In a previous study (Campbell et al. 2003) comparingCNN and CNN (WI 3A) and their derivatives, QTLs weredetected for grain yield, 1,000 kernel weight, kernels persquare meter and kernel number per spike linked withXbarc 12, Xbarc 57 and Xbarc 67. Data for only thesethree primer pairs were analyzed in the present investiga-tion. UPGMA cluster analysis separated the lines into threebroad groups (Fig. 5). One group consisted of cultivarsrelated to CNN and its substitution lines, the second groupconsisted of WI and its substitution lines, while the thirdgroup consisted of cultivars apparently not related to anyof the two above-mentioned historically important culti-vars. We believe these three groups represent: (1) cultivarsthat generally do well in western Nebraska where the CNNalleles are not deleterious (e.g. Windstar, Alliance,Scout 66), (2) cultivars that tend to do better in easternNebraska or are high yielding in western Nebraska wherethe WI alleles may be beneficial (e.g. Arapahoe, Harry,Culver) and (3) cultivars where the genes onchromosome 3A have been replaced by new alleles notpresent in either WI or CNN (e.g. Jagger, Lancota,Wahoo). For these three loci, Arapahoe, Culver and Harryhad the same genotypes as CNN (WI 3A). These threelines are modern semidwarf cultivars that are or wereknown to have a very high yield potential in regions wherethe QTLs on 3A would be beneficial. In contrast, no
cultivar had a similarity coefficient of 1.00 with Cheyenne.The most closely related cultivars to Cheyenne for thesethree loci were Windstar, Alliance, and Scout 66, allwestern Nebraska cultivars that are grown where the CNNand WI alleles are not beneficial or, in fact, are deleterious(Campbell et al. 2003). Wesley is an interesting cultivar inthat it does extremely well in high-yielding conditions, yethas mainly unfavorable alleles from CNN. Wesley wouldbe a good candidate for transferring the alleles from eitherWI-related lines (e.g. Harry) or new alleles from theunrelated lines (e.g. Jagger).
In conclusion, chromosome 3A is known to be animportant chromosome that contains useful QTLs foragronomic performance (Berke et al. 1992a, b; Campbellet al. 2003). Using microsatellites, it is possible to detectpolymorphisms specific for chromosome 3A among wheatcultivars, thus allowing them to be grouped on either onthe basis of using markers specific to WI 3A or CNN 3A(important historical wheat cultivars and parents of manymodern cultivars) or on the basis of known QTL regionson 3A. In all cases, microsatellite-based genetic analysissuggests a hierarchical pattern of genetic similarity amongwheat lines. These similar clusters provide insight intohow genes and QTLs in ancestral parents have been usedin breeding improved cultivars. Also, these results provideuseful information for appropriate parent selection that canbe used in crossing schemes for elite cultivar development.
Acknowledgements We thank C. Kuleung, F. Pedraza and F. Birrufor their technical help during the studies. We acknowledge USDANRICGP 00-353000-9266 and USDA-IFAFS competitive grant2001-04462 for partially funding the research and USDA-ARS forproviding seed for this study. This work was supported in part by theMinistry of Science and Technology, Government of Pakistan.
References
Akkaya MS, Bhagwat AA, Cregan PB (1992) Length polymor-phism of simple sequence repeat DNA in soybean. Genetics132:131–139
Barrett BA, Kidwell KK (1998) AFLP-based genetic diversityassessment among wheat cultivars from the Pacific Northwest.Crop Sci 38:1261–1271
Berke TG, Baenziger PS, Morris R (1992a) Chromosomal locationof wheat quantitative loci affecting agronomic performance ofseven traits, using reciprocal chromosome substitutions. CropSci 32:621–627
Berke TG, Baenziger PS, Morris R (1992b) Chromosomal locationof wheat quantitative loci affecting stability of six traits, usingreciprocal chromosome substitutions. Crop Sci 32:628–633
Bowcock AA, Ruiz-Linares A, Tomfohrde J, Minch E, Kidd JR,Cavalli-Sforza LL (1994) High resolution human evolutionarytree with polymorphic microsatellites. Nature 368:455–457
Brown SM, Hopkins MS, Mitchell SE, Senior MI, Wang TY,Duncan RR, Gonzales-Canelas F, Kresovich P (1996) Multiplemethods for the identification of polymorphic simple sequencerepeats (SSRs) in sorghum [Sorghum bicolor (L.) Moench].Theor Appl Genet 93:190−198
Budak H, Pedraza F, Cregan PB, Baenziger PS, Dweikat I (2003)Development and utilization of SSRs to estimate the degree ofgenetic relationships in collection of pearl millet germplasm.Crop Sci 43:2284–2290
1502
Campbell BT, Baenziger PS, Gill KS, Eskridge KM, Budak H,Erayman M, Dweikat I, Yen Y (2003) Identification of QTLsand environmental interactions associated with agronomic traitson chromosome 3A of wheat. Crop Sci 43:1493–1505
Devos K, Gale M (2000) Genome relationships: the grass model incurrent research. Plant Cell 12:637–646
Dice LR (1945) Measures of the amount of ecologic associationbetween species. Ecology 26:297–302
Dirlewanger E, Cosson P, Tavaud M, Aranzana MJ, Poizat C,Zanetto A, Arus P, Laigret F (2002) Development ofmicrosatellite markers in peach [Prunus persica (L.) Batsch]and their use in genetic diversity analysis in peach and sweetcherry (Prunus avium L.). Theor Appl Genet 105:127–138
Garland SH, Lewin L, Abedinia M, Henry R, Blakeney A (1999)The use of microsatellite polymorphism for the identification ofAustralian breeding lines of rice (Oryza sativa L.). Euphytica108:53–63
Gaut BS (2002) Evolutionary dynamics of grass genomes. NewPhytol 154:15–28
Gupta PK, Varshney RK (2000) The development and use ofmicrosatellite markers for genetic analysis and plant breedingwith emphasis on bread wheat. Euphytica 113:163–185
Hernandez P, Laurie DA, Martin A, Snape JW (2002) Utility ofwheat simple sequence repeat (SSR) markers for geneticanalysis of Hordeum chilense and tritordeum. Theor ApplGenet 104:535–739
Huang X, Borner A, Röder M, Ganal M (2002) Assessing geneticdiversity of wheat (Triricum aestivum L.) germplasm usingmicrosatellite markers. Theor Appl Genet 105:699–707
Kim HS, Ward RW (1997) Genetic diversity in eastern U.S. softwinter wheat (Triticum aestivum L.em.Thell) based on RFLPsand coefficent of parentage. Theor Appl Genet 94:472–479
Koebner RMD, Powell W, Donini P (2001) The contribution ofcurrent and forthcoming DNA molecular marker technologiesto wheat and barley genetics and breeding. In: Janick J (ed)Plant breeding review, vol 21. Wiley, New York, pp 181–220
Korzun V, Malyshev S, Kartel N, Westermann T, Weber WE, BornerA (1998) A genetic linkage map of rye (Secale cereale L.).Theor Appl Genet 96:203–208
Korzun V, Malyshev S, Voylokov AV, Borner A (2001) A geneticmap of rye (Secale cereale L.) combining RFLP, isozyme,protein, microsatellite and gene loci. Theor Appl Genet102:709–717
Kuleung C, Baenziger PS, Dweikat I (2004) Transferability of SSRmarkers among wheat, rye and triticale. Theor Appl Genet108:1147–1150
Liu S, Anderson JA (2003) Targeted molecular mapping of a majorwheat QTL for Fusarium head blight resistance using wheatESTs and synteny with rice. Genome 46:817–823
Liu ZW, Biyashev RM, Saghai-Maroof MA (1996) Development ofsimple sequence repeat DNA markers and their integration intoa barley linkage map. Theor Appl Genet 93:869–876
Mercado LA, Souza E, Kephart KD (1996) Origin and diversity ofNorth American hard spring wheats. Theor Appl Genet93:593–599
Nei M, Li WH (1979) Mathematical model for studying geneticvariation in terms of restriction endonucleases. Proc Natl AcadSci USA 76:5269–5273
Peakall R, Gilmore S, Keys W, Morgante M, Rafaske A (1998)Cross-species amplification of soybean (Glycine max) simplesequence repeat (SSRs) within the genus and other legumegenera: implication for the transferability of SSRs in plants.Mol Biol Evol 15:1275–1287
Pestsova E, Röder MS (2002) microsatellite analysis of wheatchromosome 2D allows the reconstruction of chromosomalinheritance in pedigrees of breeding programmes. Theor ApplGenet 106:84–90
Prasad M, Varshney RK, Roy JK, Balyan HS, Gupta PK (2000) Theuse of microsatellite for detecting DNA polymorphism, geno-type identification and genetic diversity in wheat. Theor ApplGenet 100:584–592
Röder MS, Plaschke J, Konog SU, Borner A, Sorrells ME, TanksleySD, Ganal MW (1995) Abundance, variability and chromo-somal location of microsatellites in wheat. Mol Gen Genet 246:327–333
Röder MS, Korzun V, Wendehake K, Plaschke J, Tixier MH, LeroyP, Ganal MW (1998) A microsatellite map of wheat. Genetics149:2007–2023
Rohlf JF (2000) ntsys-pc numerical taxonomy and multivariateanalysis system. Exeter Software, Setauket
Rongwen J, Akkaya MS, Bhagwat AA, Lavi U, Cregan PB (1995)The use of microsatellite DNA markers for soybean genotypeidentification. Theor Appl Genet 90:43–48
Shah M, Baenziger B, Yen Y, Gill K, Moreno-Sevilla B, Haliloglu K(1999a) Genetic analysis of agronomic traits controlled bywheat chromosome 3A. Crop Sci 39:1016–1021
Shah MM, Gill KS, Baenziger PS, Yen Y, Kaeppler SM,Ariyarathne HM (1999b) Molecular mapping of loci foragronomic traits on chromosome 3A of bread wheat. CropSci 39:1728–1732
Shen X, Ittu M, Ohm HW (2003) Quantitative trait loci conditioningresistance to Fusarium head blight in wheat line F201R. CropSci 43:850–857
Sourdille P, Tavaud M, Charmet G, Bernard M (2001) Transfer-ability of wheat microsatellites to diploid Triticeae speciescarrying the A, B and D genome. Theor Appl Genet 103:346–352
Struss D, Plieske J (1998) The use of microsatellite markers fordetection of genetic diversity in barley populations. Theor ApplGenet 97:308–315
Sun G, Bond M, Nass H, Martin R, Dong Z (2003) RAPDpolymorphism in spring wheat cultivars and lines with differentlevel of Fusarium resistance. Theor Appl Genet 106:1059–1067
Tikhanov AP, SanMiguel PJ, Nakajima Y, Gorenstein NM,Bennetzen JF, Avramova Z (1999) Colinearity and itsexceptions in orthologous adh regions of maize and sorghum.Proc Natl Acad Sci USA 96:7409–7414
Van Deynze AE, Sorrells ME, Park WD, Ayres NM, Fu H,Cartinhour SW, Paul E, McCouch SR (1998) Anchor probes forcomparative mapping of grass genera. Theor Appl Genet97:356–369
Weir BS (1996) Genetic data analysis. II. Methods for the discretepopulation genetic data, 2nd edn. Sinauer Assoc, Sunderland
1503
Related Documents