The use of mathematical methods in production management Citation for published version (APA): Zijm, W. H. M. (1988). The use of mathematical methods in production management. (Memorandum COSOR; Vol. 8830). Technische Universiteit Eindhoven. Document status and date: Published: 01/01/1988 Document Version: Publisher’s PDF, also known as Version of Record (includes final page, issue and volume numbers) Please check the document version of this publication: • A submitted manuscript is the version of the article upon submission and before peer-review. There can be important differences between the submitted version and the official published version of record. People interested in the research are advised to contact the author for the final version of the publication, or visit the DOI to the publisher's website. • The final author version and the galley proof are versions of the publication after peer review. • The final published version features the final layout of the paper including the volume, issue and page numbers. Link to publication General rights Copyright and moral rights for the publications made accessible in the public portal are retained by the authors and/or other copyright owners and it is a condition of accessing publications that users recognise and abide by the legal requirements associated with these rights. • Users may download and print one copy of any publication from the public portal for the purpose of private study or research. • You may not further distribute the material or use it for any profit-making activity or commercial gain • You may freely distribute the URL identifying the publication in the public portal. If the publication is distributed under the terms of Article 25fa of the Dutch Copyright Act, indicated by the “Taverne” license above, please follow below link for the End User Agreement: www.tue.nl/taverne Take down policy If you believe that this document breaches copyright please contact us at: [email protected] providing details and we will investigate your claim. Download date: 03. Feb. 2022

Welcome message from author
This document is posted to help you gain knowledge. Please leave a comment to let me know what you think about it! Share it to your friends and learn new things together.
Transcript

The use of mathematical methods in production management
Citation for published version (APA):Zijm, W. H. M. (1988). The use of mathematical methods in production management. (Memorandum COSOR;Vol. 8830). Technische Universiteit Eindhoven.
Document status and date:Published: 01/01/1988
Document Version:Publisher’s PDF, also known as Version of Record (includes final page, issue and volume numbers)
Please check the document version of this publication:
• A submitted manuscript is the version of the article upon submission and before peer-review. There can beimportant differences between the submitted version and the official published version of record. Peopleinterested in the research are advised to contact the author for the final version of the publication, or visit theDOI to the publisher's website.• The final author version and the galley proof are versions of the publication after peer review.• The final published version features the final layout of the paper including the volume, issue and pagenumbers.Link to publication
General rightsCopyright and moral rights for the publications made accessible in the public portal are retained by the authors and/or other copyright ownersand it is a condition of accessing publications that users recognise and abide by the legal requirements associated with these rights.
• Users may download and print one copy of any publication from the public portal for the purpose of private study or research. • You may not further distribute the material or use it for any profit-making activity or commercial gain • You may freely distribute the URL identifying the publication in the public portal.
If the publication is distributed under the terms of Article 25fa of the Dutch Copyright Act, indicated by the “Taverne” license above, pleasefollow below link for the End User Agreement:www.tue.nl/taverne
Take down policyIf you believe that this document breaches copyright please contact us at:[email protected] details and we will investigate your claim.
Download date: 03. Feb. 2022

EINDHOVEN UNIVERSITY OF TECHNOLOGY
Department of Mathematics and Computing Science
Memorandum COSOR 88-30
THE USE OF MATHEMATICAL METHODS
IN PRODUCTION MANAGEMENT
W.H.M.Zijm
Eindhoven University ofTechnology
Department of Mathematics and Computing Science
P.O. Box513
5600 MB Eindhoven
The Netherlands
Eindhoven, November 1988
The Netherlands

1
THE USE OF MATHEMATICAL METHODS IN PRODUCTION MANAGEMENT
*W.H.M. Zijm
Abstract
In this report, the use of mathematical models and mathematical tech
niques for solving design and planning problems in industrial production
systems is discussed. We describe several projects carried out in different
Philips factories. Topics include design problems in an (automated) manufac
turing system, production planning and inventory management in a Telecom
munication company, and shopfloor scheduling problems in a cable factory. In
addition, we briefly list a number of research activities, motivated by
these projects, which take place at the Eindhoven University of Technology.
* Nederlandse Philips Bedrijven B.V.,
Centre for Quantitative Methods,
Building HCM-721,
p.o. Box 218,
5600 MD - Eindhoven,
The Netherlands,
and
* Eindhoven University of Technology,
Department of Mathematics and Computing Science,
Building DG-Oll,
p.o. Box 513,
5600 MB - Eindhoven,
The Netherlands.

2
1. Introduction
The development of new industrial products and of advanced technologies
requires an ever increasing application of, often complex, mathematical
techniques. As an example, one may think of the use of combinatorial methods
for the design of integrated circuits (IC's), the use of discrete mathema
tics for the development of coding systems, the finite element method as a
building stone in certain CAD (Computer Aided Design) systems, applications
of systems theory in audio and video signal processing, developments in
fluid dynamics, etc. To quote David[1984]: "When we entered the era of high
technology, we entered the era of mathematical technology."
Apart from their use in approaching purely technical problems, there is a
growing tendency to apply mathematical techniques for designing, planning
and controlling complex industrial processes, with the aim to increase their
performance. In particular, Industrial Statistics and Operational Research
have provided useful tools that can be applied in this area. Mathematical
statistics, arosen initially from an attempt to describe certain processes
in demography (Mal thus) an biogenetics (Pearson, Fisher) became popular in
industry by the work of Walter Shewhart on statistical quality control at
Bell Laboratories. Other pioneers in this field are e.g. Wald, Deming, Juran
and Crosby.
The term "Operations Research" or "Operational Research" stems from the
second world war, when scientific methods were developed to solve complex
logistics problems. However, industrial mathematics that can be classified
as Operational Research avant la lettre, can be traced back to the preceding
century. In 1832, Charles Babbage, who later became famous as the father of
the first digital computer, wrote "On the Economy of Machinery and Manufac
tures" in which he followed and extended Adam Smith's idea's on labour
division. Another pioneer was the Danish mathematician Erlang; ~n his
studies on the expected performance of telephone exchanges he developed the
roots of modern queueing theory. Stochastic networks were proposed by
Jackson in the early sixties to study the behavior of Job Shop production
systems (cf. Jackson[l963]). In the field of production control, the book of
Holt, Modigliani, Muth and Simon "Planning Production, Inventories and Work
Force" marked an important step ahead (see Holt et. al.[l960]). Forrester's
"Industrial Dynamics" is now recognized as a pathbreaking study on the

3
cyclical variation of stocks in large production/distribution chains (cf.
Forrester[1961]).
Despite of all this, the acceptance of mathematics as an important tool
to solve complex industrial problems is certainly not as widespread as seems
to be desirable. Industrial mathematicians are working mainly within large
companies, and quite often in a research function, developing mathematical
methods for the design of advanced products and complex technologies. The
use of mathematics on a routine basis as a tool for planning and controlling
complex production processes is still limited, despite the undeniable
successes that have been reached. Only large multinational organisations
(e.g. IBM, AT&T, Philips) seem to employ groups of mathematicians who direct
their efforts primarily to the solution of problems arising in the field of
production management and logistics control.
Philips' Centre for Quantitative Methods is a group of mainly mathemati
cally skilled consultants working on projects in the latter field: indus
trial production management, industrial process control (including quality
control), logistics issues, design and control of flexible manufacturing
systems, forecasting and project management, etc. In this report, we
describe some projects carried out in different Philips factories by the
author, as a member of the Operations Research Group of the Centre for
Quantitative Methods. The examples each highlight a specific type of
problem. Production planning and inventory management is the key element in
the analysis of the production of telephone exchanges in a Telecommunication
company. Certain design problems had to be solved when developing a com
pletely automated production line for transformers (to be built in in TV
sets). Shopfloor scheduling techniques were proposed for a mains leads
department in one of Philips' cable factories.
In describing the examples, we omit all mathematical details, these fall
beyond the scope of this report. Several projects have motivate.d more
theoretical research activities; these are carried out at the Eindhoven
University of Technology, under the supervision of the author. A brief
description of some of these research interests will be given in section 3.

4
2. Projects in production management
In this section, we briefly describe a number of studies carried out in
the field of production management in several Philips organizations.
Mathematical details are omitted.
2.1. Production and inventory management in a Telecommunication industry
Fig. 1 shows the logistics diagram of the production process of our first
example, i. e. the assembly of large office exchanges for voice- and data
transmission. The production process of these exchanges (starting with the
supply of components and ending with the installation of the exchange) can
be divided in three important phases, separated by physical stock points. In
the first phase, components and raw materials (electrical components,
integrated circuits, cables, wood, etc.) are delivered by external sup
pliers. In the second phase the production of subassemblies takes place
(cables prepared for connection, shelves and, in particular, printed circuit
boards). In the third phase we find the final assembly, the functional
tests, the packing and the expedition. Often, also transport and installa
tion are included in this phase. Two warehouses exist: the component store
(components and raw materials) and the commercial store (for all subassem
blies). Finally, we note that some subassemblies are also delivered directly
."-..----------.,,.r-<: Industrial Planning '>- - - -.-I - - - - - - - - - --'...I
Subassembly
,----------.-.- - T - - -.- - -<' . Commercial Planning '>--,, ,
I -- - - - - - - - - - .., I+ •I I
Fin. Ass. Transp. ~C.Pack & Exp. & Install. L::J
I
+- - - - - - Forecast-driven - - - - - - +I+- - Customer-Order-driven - - - - ..I
Decoupling point
Fig. 1. Logistics diagram of the exchange production process.

5
from outside suppliers.
The production planning department of the company works according to the
following rule. Upon arival of an order, a commercial delivery time is
agreed upon with the customer which is sufficient to incorporate the time
needed to complete the third phase of the production process (i.e. final
assembly, tests, packing, expedition and sometimes transport and instal
lation). In our example, the total leadtime needed to complete this third
phase varied from 2 to 4 months, depending on the size and the complexity of
the exchange. Hence, upon arrival of a completely specified order, the
necessary amount of all types of subassemblies (specified by the Equipment
Survey) must be available, to make sure that the final assembly of the
exchange can be started almost immediately.
It follows that purchase orders for components and production orders for
subassemblies have to be released before customer orders that need the
subassemblies have arrived (or before all details of a customer order, such
as size, special features, etc. are completely specified). Therefore,
production of subassemblies will be driven by inventory control rules, based
on forecasts of the demand. The logistic performance of the production
process depends heavily on the choice of these rules and in particular on
the value of the parameters which determine the size of production orders,
safety stock levels, etc. The third phase (final assembly, etc) is then
completely order-driven. We also say that the decoupling point in the
logistics chain is located between the subassembly and the final assembly
phase, at the commercial store.
We have developed a so-called Master Production Scheduling (MPS) rule for
the production of subassemblies, which served as the basis for a computer
based Materials Requirements Planning (MRP) program (for concepts like MPS
and MRP, see Orlicky[ 1975]). This MPS was based on the concept of the
Economic Inventory Position (see e. g. Silver and Peterson[ 1985]) of all
subassemblies. This Inventory Position is formally defined as
Economic Inventory Position (subassemblies) - Inventory in commercial store
+ released production orders
for subassemblies
- subassemblies, committed to
customer orders.

6
Note that the work in process inventory in the subassembly phase is included
in the economic inventory position, since also released production orders
are counted.
It is important to realize that, in our example, the inventory positions
of hundreds of different types of subassemblies have to be recorded. Since
this requires a lot of data processing capacity and time, the inventory
positions are updated only once in a fixed review period (instead of
continuously). As a result, production orders for subassemblies are also
released only once per review period.
The Master Production Scheduling rule for period t is based on the
forecasted demand in the period [t,t+R+L], where R denotes the length of the
review period and L the subassembly leadtime. It takes into account a safety
stock factor, based on forecast errors of the demand, as well as lotsize
considerations. Also, commonality of subassemblies was considered. We speak
of a high degree of commonality if the same subassembly can be applied in a
large variety of final exchanges; such a high degree of commonality requires
a highly modular product structure, based on standardized subassemblies, of
these final exchanges. The final MPS rule orders subassemblies such that the
Economic Inventory Position of these subassemblies is returned to an order
up-to level St (based on the above mentioned forecasts) at the beginning of
every review period. This rule is known to perform well in the case of
nonstationary demand (see e.g. Silver and Peterson[1985]). A detailed
description of the MPS rule can be found in De Kok and Zijm[1988] .
Since the production planning procedure for subassemblies highly influen
ces average commercial stocks and work in process inventory levels, we next
built a simulation model to investigate the effects on these inventories of
various actions, including
- reduction of the subassembly leadtime L,
- better pre-information from the Sales Department to Production Management
in order to reduce forecast errors and therebye safety stocks,
- standardization of subassemblies, resulting in a higher commonality degree
and hence again lower safety stocks in the commercial store,
- reduction of both subassembly and final assembly leadtime, without
changing the commercially agreed delivery time of exchanges. This may
ultimately enable Production Management to shift the decoupling point to
the component store, thus making the production of subassemblies customer
order-driven. The absence of uncertainty, together with the leadtime
reductions, cause a dramatic reduction in inventory levels.

7
The model enables decision makers to evaluate the effects of these actions
in quantitative terms of FAV (Factory Accounting Value) and Turnover (the
rate of annual sales divided by the average inventory levels, both expressed
in terms of money). Hence, the model serves as a Decision Support System,
helping Production Management to choose the proper mix of actions to be
taken to improve the competitive position of the Telecommunication company
by a severe cost reduction.
2.2. Design of an automated manufacturing system for transformers.
For the production of certain new types of transformers, which perform
several important functions in a TV set, one of Philips' factories has
installed a number of highly productive and flexible manufacturing lines. An
automated conveyor system moves products (one by one) on coded product
carriers between different locations, except for some oven processes where
transport is in batches. All production steps, handling and tests are
mechanized or automated. Also, the transport of the products is under rigid
computer control.
Before building such a system of production lines, it seems desirable to
gain insight into the performance of a proposed design, to predict the
effects of a large number of variations, or even to evaluate completely
alternative designs. Performance must be understood in terms of produc
tivity, throughput and waiting times, sensitivity of a line with respect to
machine breakdowns (reliability), flexibility with respect to product mix
and variability in demand, etc.
Let us highlight one design issue in more detail. In order to cope with
uncertainty in the production process caused by machine breakdowns, buffers
have to be situated at crucial points in order to achieve a satisfactory
production rate. Absence of buffers would cause the whole line to stop each
time a machine breaks down. However, since all transport functions are com
pletely automated and all products in the system are coded, any buffer
system must be integrated with the automatic conveyors. Spacial and finan
cial considerations place a severe constraint on the size of buffers. The
question now is how the effective productivity of a line depends on the
location and the size of these, necessarily limited, buffers.

8
A simple example may illustrate what happens. Fig. 2 depicts a line,
consisting of only two machines and one finite buffer (of size K) in
between. Both machines are unreliable. Fig. 3 shows a sample path of the
stochastic process representing the behavior of the buffer contents as a
function of the machine conditions. Note that machine 1 may continue
production, even if machine 2 fails, as long as the buffer is not completely
filled; in the other case we say machine 1 is blocked. Also, machine 2 may
continue production, even if machine 1 has failed, as long as the buffer is
not empty; in the other case we say machine 2 is starved. If machine 2 is
the faster one, then it can only work at a rate equal to the production rate
of machine 1 in the case of both machines working and an empty buffer in
between; we say that machine 2 is slowed down. It will be clear that the
effective capacity of the line is severely influenced by the size of the
buffer.
-------.-------[;]---···--9-·-·----[;]----.-.-----.Fig. 2. Two serial unreliable machines with a finite buffer.
':Jnnuun~,._-. I.•... u •••uuu.....u... m •••U·n .. nnulm~.. t • 'I H·---
: DJUU:.u;- ...u T :: [un-r·rf-Tunml l 1
o.m..,~. .. -. i " I ~ . - - n,' ,i ---I I ~ ~ .. ! '" -. ~. -- .~- -- .. ',' I I I . . I . I .1 I I I ,'I I , "
1[1--I-~-T-;-7------;>1""'T"'i'o;;:;:----:!:--,-'-t-'-----;I-~I-+---t-.-_~,.;.,."",·.,..-.L_.:...I--I I I
I
O'~-_IC:..l.....L..-L-J-L...I.....J....J-L.L....L-L-L...L...J....J-L..L.J...J....J-L..L.J.....L.!--l-.L.J....Ll....LLl....LJLL.l.....l...L.:LL.l.....l-LLL.Ll.:l:::._
Fig. 3. Buffer behavior corresponding to alterations in machine states. When
both working, machine 2 is the faster one.

9
When lifetimes (times between breakdowns) and repair times are specified
by probability functions of phase type (see e.g. Neuts[198l]), it is
possible to calculate the effective capacity of such a line by solving a
system of differential equations (using a fluid model approach) or by
analyzing a specially structured Markov Chain (using a queueing-theoretical
approach). See e.g. Wijngaard[l979] or Neuts[l98l), ch. 5. Approximations
for longer lines have been studied by several authors; a fluid model
approach for this particular Philips case has been described by Wessels,
Hontelez and Zijm[l986).
Returning to the transformer manufacturing lines, a natural decomposition
appears to be possible. First, demand characteristics allows the allocation
of each line to one particular family of products, within these families
products can be manufactured alternately, without changeover times of
machines. Hence, flexibility with respect to product mix is assured.
Furthermore, from an aggregate point of view, each line can be divided into
three parts. In parts land 3, products are moved one by one on unit product
carriers, running through a set of small cycle time operations and tests; in
the middle part where several oven processes take place, transport is in
large batches (on multiple product carriers). Product handling between the
unit product carriers and the multiple product carriers is performed by
specially designed robots. Machines in part land 3 are not completely
reliable, the middle part is almost perfect. Between machines in part I only
very small buffers (of two or three products at most) are allowed. The same
holds for part 3. Between the three parts, hence in front of and immediately
behind the oven processes, larger buffers are allowed, because of storage
possibilities on multiple product carriers.
Using a fluid model approach, in combination with a simulation study, we
evaluated a number of alternative designs and we developed a control rule
for dispatching products to the line. In particular, the following results
were obtained.
The optimal sizes and locations of the buffers were determined. On the one
hand these buffers had to be as small as possible, on the other hand they
had to be large enough to gaurantee a desired minimum throughput.
- The best performance of the line was achieved by giving it a "push-pull"
character. Recall that, from an aggregate point of view, the line could be
divided in three main parts. The first part had to push products into a
buffer in front of the middle part, thereby guaranteeing input for the

10
(expensive) ovens, even when, due to breakdowns, that first part is
blocked temporarily. The latter part pulls products from the middle part
even when taking into account its disturbance rates - therebye preventing
overflow or an excessive amount of work in process.
- For capacity balancing reasons, some operations should be located at a
point parallel to the line.
- At the beginning of the line, a number of parallel machine units were
situated along the conveyor system. Each machine unit has its own cycle
time. Products visit only one of the parallel machine units. In order to
avoid blocking on the conveyor system, caused by products operated at one
machine (in line), a control rule has been developed for dispatching
products to these machines.
Valuable insight with respect to the performance of the different alterna
tives has thus been obtained. The proposed model and the subsequent analysis
appeared to be powerful instruments to support the design process of these
type of production lines. These types of models are now frequently used,
also after the realization of production lines, to assist management in
making the right decisions when product or process changes need to be
introduced. So it may properly be thought of as a management tool.
2.3. Shopfloor scheduling in a cable factory
Our third example concerns the production of mains leads, with attached
plugs, in a cable factory. These leads are then distributed to other product
divisions such as the Consumer Electronics Division (audio and video
equipment), Domestic Appliances, etc. The leads are supplied on reels by
another department (one reel may contain several kilometers of lead). The
processing of leads with plugs takes place in three phases. In the first
phase, the leads are cut to the right 1enght (between 1. 5 and 3 meters),
stripped at the end, the end points are soldered, etc. In the second phase,
the plastic plugs are attached by an injection moulding machine. In the
third phase finally, certain specified leads are tested (only those leads
for which a test certificate is required by the customer) and all leads are
packed in boxes.

BUFFER
11
BUFFER
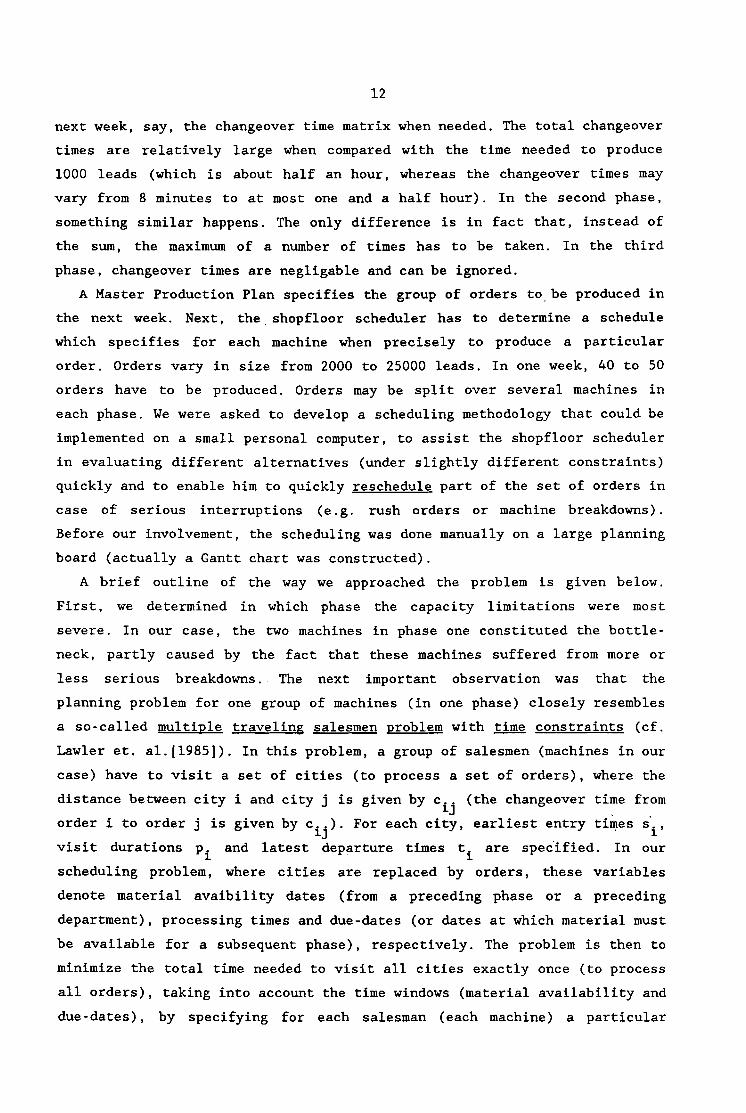
PACK
Fig. 4. Production layout for mains leads manufacturing.
For the first phase, two identical machines are available, for the second
phase six identical machines. In the third phase, three high-voltage test
machines are available, leads that pass through one of these three machines
are packed immediately after testing. Another part of the daily production
is packed directly.
Between each two phases buffers are available to store products tem
porarily, on the floor (in case no machine in the next phase is directly
available for processsing that particular kind of product). Buffers however
have only limited capacity.
Weekly production plans are made for this mains leads department, taking
into account due-dates (delivery dates which may be even within that week),
the availability of material and in particular changeover times. Both the
machines in the first and in the second phase are characterised by sequence
dependent changeover times, i. e. the changeover time depends both on the
type of product just produced and the type of product to be produced. Since
there exist about 200 different type numbers, a matrix of changeover times
would require 40,000 entries (200*200). It appeared to be possible however
to considerably reduce the number of space required by taking a closer look
at the changeover times.
For the two machines in the first phase, the changeover times are built
up as the sum of the times needed to perform changes in a number of tool
settings. For each tool setting, there are only a few choices possible (at
most four in our case). Each type number is characterized by a specified
tool setting for each tool needed. Hence, a database which specifies the
tool settings for all 200 product types, together with a small database
which contains the times needed to perform changes in the tool settings, is
sufficient to calculate for each group of part types, to be produced in the
12
next week, say, the changeover time matrix when needed. The total changeover
times are relatively large when compared with the time needed to produce
1000 leads (which is about half an hour, whereas the changeover times may
vary from 8 minutes to at most one and a half hour). In the second phase,
something similar happens. The only difference is in fact that, instead of
the sum, the maximum of a number of times has to be taken. In the third
phase, changeover times are negligable and can be ignored.
A Master Production Plan specifies the group of orders to. be produced in
the next week. Next, the. shopfloor scheduler has to determine a schedule
which specifies for each machine when precisely to produce a particular
order. Orders vary in size from 2000 to 25000 leads. In one week, 40 to 50
orders have to be produced. Orders may be split over several machines in
each phase. We were asked to develop a scheduling methodology that could be
implemented on a small personal computer, to assist the shopfloor scheduler
in evaluating different alternatives (under slightly different constraints)
quickly and to enable him to quickly reschedule part of the set of orders in
case of serious interruptions (e. g. rush orders or machine breakdowns).
Before our involvement, the scheduling was done manually on a large planning
board (actually a Gantt chart was constructed).
A brief outline of the way we approached the problem is given below.
First, we determined in which phase the capacity limitations were most
severe. In our case, the two machines in phase one constituted the bottle
neck, partly caused by the fact that these machines suffered from more or
less serious breakdowns .. The next important observation was that the
planning problem for one group of machines (in one phase) closely resembles
a so-called multiple traveling salesmen problem with time constraints (cf.
Lawler et. al.[1985]). In this problem, a group of salesmen (machines in our
case) have to visit a set of cities (to process a set of orders), where the
distance between city i and city j is given by c .. (the changeover time from1.J
order i to order j is given by cij
). For each city, earliest entry ti~es si'
visit durations Pi and latest departure times ti
are specified. In our
scheduling problem, where cities are replaced by orders, these variables
denote material avaibility dates (from a preceding phase or a preceding
department), processing times and due-dates (or dates at which material must
be available for a subsequent phase), respectively. The problem is then to
minimize the total time needed to visit all cities exactly once (to process
all orders), taking into account the time windows (material availability and
due-dates), by specifying for each salesman (each machine) a particular

13
sequence of cities (orders), to be visited (processed) in that order.
Al though the original problem setting was slightly different, the main
question was to produce as efficiently as possible hence to minimize the
time lost to changeovers, which in a natural way constitutes the multiple
traveling salesmen problem with time constraints for each phase. The only,
not unimportant, difference with the usual traveling salesmen problem is
that our scheduling problem is essentially asymmetric (i. e. a changeover
time c .. from type i to type J' is in general not equal to c .. ). Since all1.J - - J1.known (heuristic) algorithms for traveling salesmen problems with time
constraints are developed for the symmetric case, we had to develop new
heuristics.
We developed a heuristic (based on local search techniques) for
scheduling the two machines in the first phase (since this phase appeared to
be the bottleneck). We omit mathematical details again. If not absolutely
necessary (because of due-dates) orders are not split and processed on two
machines in parallel, in order to avoid additional changeovers. In planning
the first two machines, we loosely take into account the main changeover
times in the second phase, in order to prevent arriving at sequences which
would cause a very unsatisfying changeover pattern in the second phase.
The resulting schedules appeared to be a very serious improvement over
the manually prepared schedules (an improvement of 20% was the rule rather
than the exception). Even more important however was the fact that the
runtime needed to arrive at a good schedule on a micro-computer was only a
matter of seconds, thus enabling the shopfloor scheduler to use the method
as an instrument in what-if simulations. All kind of unforeseen events could
be handled easily now by proposing new schedules, starting from the situa
tion at which the event occurred (this constituted another constraint on our
traveling salesmen problem formulation which however could be easily
handled). In this way, a practical and easy to handle instrument was made
available to the shopfloor controller, to enable him to develop production
schedules within a few nlinutes, to evaluate whether a proposed Master
Production Plan is feasible indeed and, if not, to evaluate alternatives,
and to reschedule quickly in case of breakdowns or rush orders, a situation
which could not be handled in a satisfactory way when planning manually.

14
3. Research activities in production management
The first responsibility when carrying out projects in factories, is to
respond properly to the problems posed by management, within a reasonable
time. Problems in factories or logistics organizations have to be solved
adequately, but a reasonable trade-off has to be made between the efforts
needed to replace a good solution by an optimal one (if possible) and the
benefits that can be expected from a very minor improvement of an already
good solution to for example a production planning problem. Besides that,
optimality is not always clearly defined in the often turbulent environments
we are working in.
On the other hand, one often feels the need for a more basic theoretical
understanding of certain problems, for instance because their appearance in
many different places in many different forms justifies such a serious
research investment, or simply because the importance of the area is
recognized by top management. Another (very good) reason may be the personal
interest of a researcher in the field. In our case, many proj ects led to
research activities which are carried out at both Philips and the University
of Technology in Eindhoven. In this section, we briefly indicate some of
these activities, carried out at the Mathematical Department of the EUT,
under the supervision of the author.
3.1. Global performance analysis of automated transport systems in factories
This problem area was motivated by several projects, among which the case
described in section 2.2 and a study concerning the redesign of the tran
sport system in a vacuum cleaner factory in the Netherlands. One may think
of automated conveyor belts but also on so-called AGVS's (Automatic Guided
Vehicle Systems) or railcart systems which both are often applied in
Flexible Manufacturing Systems (see e.g. Ranky[1983] or Zijm[1987]).
Queueing network models have provided valuable insights into the behavior of
these systems (cf. Stecke and Suri[1986]). In our research, we concentrate
on approximative network models, and in particular on issues such as traffic
priority rules, integration with local or centralized buffer systems, etc. A

15
comprehensive description of the queueing analysis of the vacuum cleaner
case can be found in Repkes and Zijm[1988].
3.2. Machine scheduling problems
Many machine scheduling problems can be classified as so-called general
ized f1owshop scheduling problems. All products have to pass through a
sequence of machine banks, where each bank consists of one or a number of
parallel machines. Products visit at most one machine in each bank (products
may skip a bank). Machines in each bank may suffer from changeover times or
breakdowns. Orders may be subject to release and due-dates, they mayor may
not be split in smaller lots, etc. Certain orders may have a higher priority
than others. With respect to the product structure a certain family struc
ture may be apparent.
Combinatorial optimization methods can be exploited to solve only rather
small problems in manufacturing environments which are a very special case
of the above sketched general situation (e. g. a single parallel machine
system or a simple f1owshop with only one machine in each phase and no
changeover times at all). In our research, we concentrate on approximation
methods for more complex environments such as the generalized f1owshop
described above. The approach is based on decomposition methods, using
combinatorial procedures for the smaller problems as our building blocks,
and exploiting a rather sophisticated iterative aggregation procedure
recently proposed by Adams et. al. [1988]. A first attempt to solve a
generalized f1owshop scheduling problem without changeover times is des
cribed in Zijm and Ne1issen[1988].
Another important research topic is the analysis of these scheduling
procedures in a rolling planning environment (where the set of orders m;ay
change frequently) and the development of order acceptance procedures based
on feasibility of the eventually resulting schedules.

16
3.3. Multi-echelon production/inventory control systems
Consider a logistic chain, consisting of a number of suppliers, a
components warehouse, a factory (possibly to be split into a subassembly and
a final assembly department), a central warehouse for final products,
several local warehouses and finally retailers and market. To develop models
which adequately describe the many complex interactions in such a chain
still appears to be extremely difficult, despite the many attempts that have
been made in the past. We first devoted our attention to a description of
these interactions, both in terms of the physical materials flow and in
terms of the flow of information in such a system (including the role of a
central planning department). Next, we concentrate on a comparison between a
Base Stock Control System and a Manufacturing Resources Planning System
(compare e.g. Vol1mann et. al. [1984]). In the near future, we wish to
include concepts such as Hierarchical Production Planning, commonality of
components, size and location of safety stocks, flexibility in capacity and
the like.
A central role in our models and analysis methods is played by the
concept of echelon stock, developed by Clark and Scarf[1960] and, in our
view, highly underestimated by both researchers and practitioners. The
decomposion approach, proposed by Clark and Scarf, has been generalized to
more complex environments, compared with the simple line system studied by
these authors. A first review article will appear in the beginning of the
next year (Langenhoff and Zijm[1989]).
3.4. Design and control of flexible assembly systems
About 90 % of the literature in the field of Flexible Manufacturing
Systems concerns Machining Centres, more in particular in a Metal Cutting
Environment. We have planned to study assembly systems and, as an example,
we have taken the mounting of printed circuit boards, being one of the most
widespread processes in electronics manufacturing. Problems we study include
- Machine control problems. How to load components on a particular insertion
machine? How to control so-called pick-and-place devices?

17
- How to spread a total amount of work over a number of parallel machines?
- What are preferrable production configurations? Line structures or
assembly cells?
- What MRS (Material Handling System) should be chosen?
- How to estimate overall performance of different assembly configurations?
Right now, we concentrate on the last issue. We try to develop approximation
methods, based on queueing theory, for difficult assembly structures. In
particular, we study job-dependent parallel structures, Le. a system of
basically parallel machines, visited by jobs belonging to several different
classes (types of printed circuit boards), where each job type can only
visit a subset of the group of parallel machines. The subsets however may
overlap which causes essential difficulties. Moreover, jobs may choose a
queue according to a shortest queue principle, a very common control rule in
practice which unfortunately leads to known hard problems in a queueing
theoretical sense. First results have been obtained, see Adan et. al. [1988] .
References
Adams, J., E. Balas and D. Zawack[1986], The shifting bottleneck procedure
for job shop scheduling, Management Science Research Report No. MSRR
525, Carnegie Mellon University, Pittsburgh,
Adan, I., J. Wessels and W.H.M. Zijm[1988], Queueing analysis in a flexible
assembly system with a job-dependent parallel structure, to appear in:
H. Schellhaas et. al. (eds.), Operations Research Proceedings 1988,
Springer-Verlag, Heidelberg,
Clark, A.J. and H. Scarf[1960], Optimal policies for a multi-echelon
inventory problem, Management Science Q, pp. 475-490,
David, E.E. ,Jr. [1984] , Renewing U.S. Mathematics: Critical Resource for
the Future, Report of the National Research Council's Ad Hoc Committee
on Resources for the Mathematical Sciences, Notices of the AMS 31, pp.
435-466,
De Kok, A.G. and W.H.M. Zijm[1988], Production Planning and Inventory
Management in a Telecommunication Industry, in: A. Chikan (ed.),
Proceedings of the Fourth International Symposium on Inventories,
Elsevier, New York,

18
Forrester, J.W.[1961J, Industrial Dynamics, The M.LT. Press, Cambridge,
Massachusetts,
Holt, C.C., F. Modig1iani, J.F. Muth and H.A. Simon[1960], Planning
Production, inventories, and Work Force, Prentice-Hall, Inc., Englewood
Cliffs, N.J.,
Jackson, J.R.[1963], Jobshop-1ike Queueing systems, Management Science 10,
pp. 131-142,
Langenhoff, L. and W.H.M. Zijm[1989], Multi-echelon production/inventory
systems with assembly and distribution structures, to appear,
Lawler, E.L., J.K. Lenstra, A.H.G. Rinnooy Kan and D.B. Shmoys (eds.)[1985],
The Traveling Salesman Problem: a guided tour of Combinatorial Optimi
zation, Wiley, New York,
Neuts, M.F.[1981], Matrix-geometric solutions in stochastic models, an
algorithmic approach, John Hopkins University Press, Baltimore,
Or1icky, J.A.[1975], Materials Requirements Planning, McGraw-Hill, New York,
Ranky, P.G. [1983], The Design and Operation of Flexible Manufacturing
Systems, IFS Publications, Kempston, Bedford, U.K.,
Repkes, J.P. and W.H.M. Zijm[1988], Analyses of automatic transport systems
in an assembly factory, to appear in: H. Sche11haas et. al. (eds.),
Operations Research Proceedings 1988, Springer-Verlag, Heidelberg,
Silver, E.A. and R. Peterson[1985], Decision Systems for Inventory Manage
ment and Production Planning, 2nd. ed., Wiley, New York,
Stecke, K. and R. Suri (eds.)[1986], Flexible Manufacturing Systems,
Operations Research models and applications, Elsevier, Amsterdam,
Vollman, Th. E., W.L. Berry and D.C. Whybark[1984], Manufacturing Planning
and Control Systems, Dow Jones-Irwin, Homewood, Illinois,
Wessels, J., J. Honte1ez and W.H.M. Zijm[1986], Eine Produktions1inie mit
unzuverliissigen Komponenten (in German), presented at the 15th DGOR
meeting, Ulm, FRG,
Wijngaard, J.[1979], The effect of interstage buffer storage on the output
of two unreliable production units in series with different production
rates, AIlE Transactions 11, pp. 42-47,
Zijm, W.H.M.[1987], Flexible Manufacturing Systems: background, examples and
models, in: H. Sche11haas et. al. (eds.), Operations Research Procee
dings 1987, Springer-Verlag, Heidelberg, pp. 142-161,
Zijm, W.H.M. and E.H.B.L. Ne1issen[1988], Scheduling a Flexible Machining
Centre, to appear in A. Chikan (ed.), Proceedings of the Fifth Interna
tional Symposium on Inventories, Elsevier, New York.

EINDHOVEN UNIVERSITY OF TECHNOLOGY
Deparunent of Mathematics and Computing Science
PROBABILITY THEORY, STATISTICS, OPERATIONS RESEARCH AND SYSTEMSTHEORYP.O. Box 513
5600 MB Eindhoven - The Netherlands
Secretariate: Dommelbuilding 0.02
Telephone: 040 - 473130
List of COSOR-memoranda - 1988
Number Month Author Title
M 88-01 January F.W. Steutel, Haight's distribution and busy periods.
B.G. Hansen
M 88-02 January J. ten Vregelaar On estimating the parameters of a dynamics model from
noisy input and output measurement
M 88-03 January B.G. Hansen, The generalized logarithmic series distribution.
E. Willekens
M 88-04 January J. van Geldrop, A general equilibrium model of international trade with
C. Withagen exhaustible natural resource commodities.
M 88-05 February A.H.W. Geerts A note on "Families oflinear-quadratic problems":
continuity properties.
M88-06 February Siquan, Zhu A continuity property of a parametric projection and an
iterative process for solving linear variational inequalities.
M 88-07 February J. Beirlant, Rapid variation with remainder and rates of convergence.
E.K.E. Willekens
M 88-08 April Jan v. Doremalen, A recursive aggregation-disaggregation method to approxi-
J. Wessels mate large-scale closed queuing netwoIXs with multiple job
types.

Number Month Author
-2-
Title
M 88-09 April J. Hoogendoom. The Vax/YMS Analysis and measurement packet (VAMP):
R.C. Marcelis, a case study.
AP. de Grient Dreux,
J. v.d. Wal,
R.J. Wijbrands
M 88-10 April E.Omey, Abelian and Tauberian theorems for the Laplace transform
E. Willekens of functions in several variables.
M 88-11 April E. Willekens, Quantifying closeness of distributions of sums and maxima
S.I. Resnick when tails are fat.
M 88-12 May E.E.M. v. Berkum Exact paired comparison designs for quadratic models.
M 88-13 May J. ten Vrege1aar Parameter estimation from noisy observations of inputs
and outputs.
M 88-14 May L. Frijters, Lot-sizing and flow production in an MRP-environment.
T.deKok,
J. Wessels
M 88-15 June J.M. Soethoudt, The regular indefinite linear quadratic problem with linear
H.L. Trentelman endpoint constraints.
M 88-16 July J.C. Engwerda Stabilizability and detectability of discrete-time
time-varying systems.
M 88-17 August AH.W. Geerts Continuity properties of one-parameter families of linear-
quadratic problems without stability.
M 88-18 September W.EJ.M. Bens Design and implementation of a push-pull algorithm for
manpower planning.
M 88-19 September AJ.M. Driessens Ontwikkeling van een informatie systeem voor het werken
met Markov-modellen.
M 88-20 September W.Z. Venema Automatic generation of standard operations on data structures.

- 3 -
Number Month Author Title
M 88-21 October A. Dekkers Global optimization and simulated annealing.
E. Aarts
M 88-22 October J. Hoogendoom Towards a DSS for perfonnance evaluation of VAXNMS-clusters.
M 88-23 October R.de Veth PET, a perfonnance evaluation tool for flexible modeling and
analysis of computer systems.
M 88-24 October J. Thiemann Stopping a peat-moor fire.
M 88-25 October H.L. Trentelman Convergence properties of indefinite linear quadratic
J.M. Soethoudt problems with receding horizon.
M 88-26 October J. van Geldrop Existence of general equilibria in economies with natural
Shou Jilin enhaustible resources and an infinite horizon.
C. Withagen
M 88-27 October A. Geerts On the output-stabilizable subspace.
M. Hautus
M 88-28 October C. Withagen Topics in resource economics.
M 88-29 October P. Schuur The cellular approach: a new method to speed up
simulated annealing for macro placement.
M 88-30 November W.H.M.Zijm The use of mathematical methods in production
management
Related Documents