The Use of Hyperspectral Visible and Near Infrared Reflectance Spectroscopy for the Characterization of Salt-Affected Soils in the Harran Plain, Turkey Ali Volkan Bilgili 1,2 , M. Ali Cullu 1 , Harold van Es 2 , Aydin Aydemir 3 , and Salih Aydemir 1 1 Department of Soil Science, Agriculture Faculty, Harran University, Sanliurfa, Turkey 2 Department of Crop and Soil Sciences, Cornell University, Ithaca, New York, USA 3 The Regional Directorate of Agrarian Reform, Sanliurfa, Turkey The quality of lands may be degraded by the accumulation of salts in soils, which is typically measured as soil Electrical Conductivity (EC e ). High-salinity soils developed in low elevation spots in the Harran Plain after the initiation of intensive irrigation and crop production on clayey soils under high evaporation. This study evaluated the feasibility of using hyperspectral Visible and Near Infrared Reflec- tance Spectroscopy (VNIRRS) as a potentially more cost-effective approach for the characterization of soil salinity. 150 locations were taken at 0–15 and 15–30 cm depths from an area of 1000 ha with salinity levels ranging from none to very high. Sieved soils were measured for EC e using saturation paste and also scanned by VNIRRS in both air dried and oven dry states. For spectral preproces- sing, raw reflectance spectra were averaged over 10 nm and a continuum removal (CR) method was applied. Calibration models between spectra and ECe were based on Multiple Adaptive Regression Splines (MARS), Partial Least Square Regression (PLSR), and Classification and Regression Trees (CART, for group- ings). The VNIRRS data were also combined with topographical parameters from digital elevation models to improve estimations. Results showed that the estimation quality of EC e varied depending on approaches used, with the best results using con- tinuum removed spectra of oven dried samples using MARS after separating sam- ples containing high amounts of gypsum (R 2 ¼ 0.86, RPD ¼ 2.70). Topographical variables with VNIRRS data improved estimations up to 12%. CART analysis showed that soils could be categorized as saline and non-saline based on soil reflectance with 65% accuracy. Keywords CART, MARS, soil salinity, PLSR, visible-near infrared reflectance spectra Received 19 May 2009; accepted 22 September 2010. This study was in part funded by Scientific Research Administration of Harran University, Sanliurfa, Turkey (HUBAK) and the Cornell University Computational Agriculture Initiative. Address correspondence to Ali Volkan Bilgili, Department of Soil Science, Agriculture Faculty, Harran University, Sanliurfa, 63100, Turkey. E-mail: [email protected] Arid Land Research and Management, 25:19–37, 2011 Copyright # Taylor & Francis Group, LLC ISSN: 1532-4982 print=1532-4990 online DOI: 10.1080/15324982.2010.528153 19

Welcome message from author
This document is posted to help you gain knowledge. Please leave a comment to let me know what you think about it! Share it to your friends and learn new things together.
Transcript
The Use of Hyperspectral Visible and Near InfraredReflectance Spectroscopy for the Characterizationof Salt-Affected Soils in the Harran Plain, Turkey
Ali Volkan Bilgili1,2, M. Ali Cullu1, Harold van Es2,Aydin Aydemir3, and Salih Aydemir1
1Department of Soil Science, Agriculture Faculty, Harran University,Sanliurfa, Turkey2Department of Crop and Soil Sciences, Cornell University, Ithaca,New York, USA3The Regional Directorate of Agrarian Reform, Sanliurfa, Turkey
The quality of lands may be degraded by the accumulation of salts in soils, which istypically measured as soil Electrical Conductivity (ECe). High-salinity soilsdeveloped in low elevation spots in the Harran Plain after the initiation of intensiveirrigation and crop production on clayey soils under high evaporation. This studyevaluated the feasibility of using hyperspectral Visible and Near Infrared Reflec-tance Spectroscopy (VNIRRS) as a potentially more cost-effective approach forthe characterization of soil salinity. 150 locations were taken at 0–15 and15–30 cm depths from an area of 1000 ha with salinity levels ranging from none tovery high. Sieved soils were measured for ECe using saturation paste and alsoscanned by VNIRRS in both air dried and oven dry states. For spectral preproces-sing, raw reflectance spectra were averaged over 10 nm and a continuum removal(CR) method was applied. Calibration models between spectra and ECe were basedon Multiple Adaptive Regression Splines (MARS), Partial Least SquareRegression (PLSR), and Classification and Regression Trees (CART, for group-ings). The VNIRRS data were also combined with topographical parameters fromdigital elevation models to improve estimations. Results showed that the estimationquality of ECe varied depending on approaches used, with the best results using con-tinuum removed spectra of oven dried samples using MARS after separating sam-ples containing high amounts of gypsum (R2¼ 0.86, RPD¼ 2.70). Topographicalvariables with VNIRRS data improved estimations up to 12%. CART analysisshowed that soils could be categorized as saline and non-saline based on soilreflectance with 65% accuracy.
Keywords CART, MARS, soil salinity, PLSR, visible-near infrared reflectancespectra
Received 19 May 2009; accepted 22 September 2010.This study was in part funded by Scientific Research Administration of Harran University,
Sanliurfa, Turkey (HUBAK) and the Cornell University Computational Agriculture Initiative.Address correspondence to Ali Volkan Bilgili, Department of Soil Science, Agriculture
Faculty, Harran University, Sanliurfa, 63100, Turkey. E-mail: [email protected]
Arid Land Research and Management, 25:19–37, 2011Copyright # Taylor & Francis Group, LLCISSN: 1532-4982 print=1532-4990 onlineDOI: 10.1080/15324982.2010.528153
19
Accumulation of various types of salts leads to degradation of soils and limitationsto plant growth. Salinity affects 20% of total irrigated lands across the globe(Ghassemi et al., 1995), and this fraction increases with the expanding irrigated areasneeded to meet the growing food, fiber, and bioenergy needs. Twenty-three and 37%of total cultivated lands of the world (1.5 billion ha) in over 100 countries have beendegraded by salinity and sodicity, respectively (Tanji, 2002). Accumulation of salts inthe root zone dramatically affects plant growth, causing yield losses, and alsoadversely affecting soil physical structure, soil fertility, and soil life (Howari et al.,2002; Muhammad et al., 2008).
Saline soils are mostly encountered in arid and semi-arid areas with low rainfall,where salt accumulation may be inevitable. In the Harran Plain, salt affected areascover around 11403 ha which corresponds to 10% of total irrigated area of the plain(Cullu et al., 2002). These are mainly located in the low-lying parts of the plainbetween elevations of 350 to 400m, and salinity levels have increased after intensiveirrigation was initiated in recent decades. Inefficient flood irrigation combined withpoor natural drainage amplifies the problem, preventing salts from being washed outof the soil profile, and allowing groundwater tables to rise. These soils are mostlyclay textured, and salty groundwater (as close as 1 to 1.5m in some locations) easilyraises to the land surface with capillary water movement under high evaporationrates (�1800mm=year).
Soil salinity is generally assessed through the measurement of soil electrical con-ductivity (ECe), in the saturation extract, in a soil paste, or using different soil towater ratios (Sonmez, et al., 2008). Soil with ECe, which is measured in saturationextract >4 dS=m, is referred to as saline. The values above this threshold constraingrowth of certain types of crops or may cause damage.
ECe has been evaluated as one of several soil quality assessment parameters(Andrews et al., 2004; Karlen et al., 2008). Monitoring soil salinity on a regular basisis important for efficient soil and water management and sustainability of agricul-tural lands. Conventional laboratory methods can be tedious and relatively costly.Also, soils are highly spatially variable, especially for soil salinity, which can changerapidly over time and small distances (Pozdnyakova & Zhang, 1999). It, therefore,requires large numbers of samples to be collected and analyzed for better character-ization of ECe. Its variability is impacted by parent material, soil type, and landscapeposition (Clay et al., 2001).
Earlier studies have made use of digital image analysis methods and remotelysensed images. Soil salinity was related to different band ratios and parametersextracted from satellite images using soil and vegetation-based indices (Csillaget al., 1993; Kalra & Joshi, 1996; Khan et al., 2001; Eldeiry et al., 2005; Tamas &Lenart, 2006). Accuracy of these methods has been constrained by factors such asspatial and spectral resolution of the image, crop coverage, and atmospheric effects(Farifteh et al., 2006; Metternicht & Zinck, 2008).
Reflectance spectroscopy shows promise for its speed, accuracy, and cost effec-tiveness in characterizing various soil properties both in lab and in the field (Ben-Dor& Banin, 1995; Shepherd & Walsh, 2002; Waiser et al., 2007). Once calibrationmodels between reflectance spectra and soil variables have been constructed, theycan be successfully used for the estimation of new samples with unknown parametersof interest. The accuracy of predictions of these models may be affected by thechoice of soil the variables, parent material, and the correlation strength with soilparameters that are spectrally active (Ben-Dor et al., 1995; Shepherd & Walsh,
20 A. V. Bilgili et al.
2002; Islam et al., 2003). Chang et al. (2001) used reflectance spectroscopy toestimate over 30 soil properties simultaneously and Brown et al. (2006) alsopredicted multiple soil properties from over 4000 samples.
The use of VNIRRS for the characterization of the soil salinity was explored byHowari et al. (2002) who measured reflectance of salt crust after incubating soils withdifferent types and amounts of salt solutions in the laboratory. Farifteh et al. (2007)tested VNIRRS to determine its capability to identify different salt minerals and alsoquantify the soil salinity levels using samples artificially spiked with different saltsminerals in the laboratory, as well as those collected from a field experiment.
Earlier studies that used remote sensing or hyperspectral reflectance spec-troscopy mostly explored their potential for spectral characterization of different saltmineral types of samples collected from the field or on qualitative and quantitativecharacterization of salinity using soil samples artificially spiked in the laboratory.The number of such studies on the quantitative assessment of soil salinity undernatural field conditions is limited, especially at the scale of this study. Controlledlaboratory conditions are different than the natural field conditions where otherfactors are also involved.
The objectives of this study were 1) to evaluate the feasibility of VNIRRS forquantitative and categorical characterization of soil salinity formed under poordrainage conditions and high groundwater levels; 2) to compare different approachesfor preprocessing of soil samples and reflectance spectra, and to use different statisti-cal models; PLSR vs MARS in estimating ECe; and 3) to evaluate the combined useof VNIRSS with topographical indicators for ECe estimation.
Material and Methods
Study Area
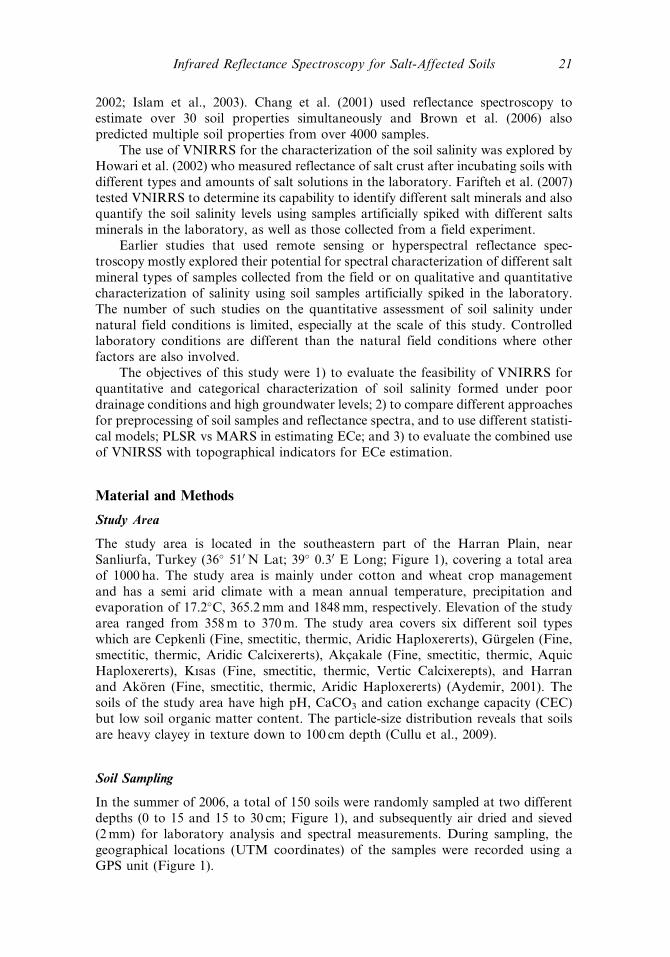
The study area is located in the southeastern part of the Harran Plain, nearSanliurfa, Turkey (36� 510 N Lat; 39� 0.30 E Long; Figure 1), covering a total areaof 1000 ha. The study area is mainly under cotton and wheat crop managementand has a semi arid climate with a mean annual temperature, precipitation andevaporation of 17.2�C, 365.2mm and 1848mm, respectively. Elevation of the studyarea ranged from 358m to 370m. The study area covers six different soil typeswhich are Cepkenli (Fine, smectitic, thermic, Aridic Haploxererts), Gurgelen (Fine,smectitic, thermic, Aridic Calcixererts), Akcakale (Fine, smectitic, thermic, AquicHaploxererts), Kısas (Fine, smectitic, thermic, Vertic Calcixerepts), and Harranand Akoren (Fine, smectitic, thermic, Aridic Haploxererts) (Aydemir, 2001). Thesoils of the study area have high pH, CaCO3 and cation exchange capacity (CEC)but low soil organic matter content. The particle-size distribution reveals that soilsare heavy clayey in texture down to 100 cm depth (Cullu et al., 2009).
Soil Sampling
In the summer of 2006, a total of 150 soils were randomly sampled at two differentdepths (0 to 15 and 15 to 30 cm; Figure 1), and subsequently air dried and sieved(2mm) for laboratory analysis and spectral measurements. During sampling, thegeographical locations (UTM coordinates) of the samples were recorded using aGPS unit (Figure 1).
Infrared Reflectance Spectroscopy for Salt-Affected Soils 21
Laboratory Analysis
Soil EC was determined from soil water extracts obtained from saturation pastesprepared using 100 g air dried and sieved soil, which were also analyzed for pH,and soluble cations, Caþþ, Mgþþ, Naþ, Kþ, B using an ICP-AEAS (Varian-Vista,Palo Alto, CA, USA). Sodium Absorption Ratio (SAR) was calculated from soilsoluble cations as follows:
SAR ¼ Na
ffiffiffiffiffiffiffiffiffiffiffiffiffiffiffiffiffiffiffiffiCa þMg
2
r,ð1Þ
where Na, Ca, and Mg are the concentrations of soluble cations in soil water extracts(meq=L).
Topographical Indicators
Topographical maps (1:5000 scale) of the study area were digitized to create a DigitalElevation Map (DEM). From the DEM, topographical parameters such as slope(%), flow TWI¼ ln(a=tan b) accumulation and Topo Wetness Index (TWI) were
Figure 1. Map of the study area and sample locations overlapped on soil map.
22 A. V. Bilgili et al.
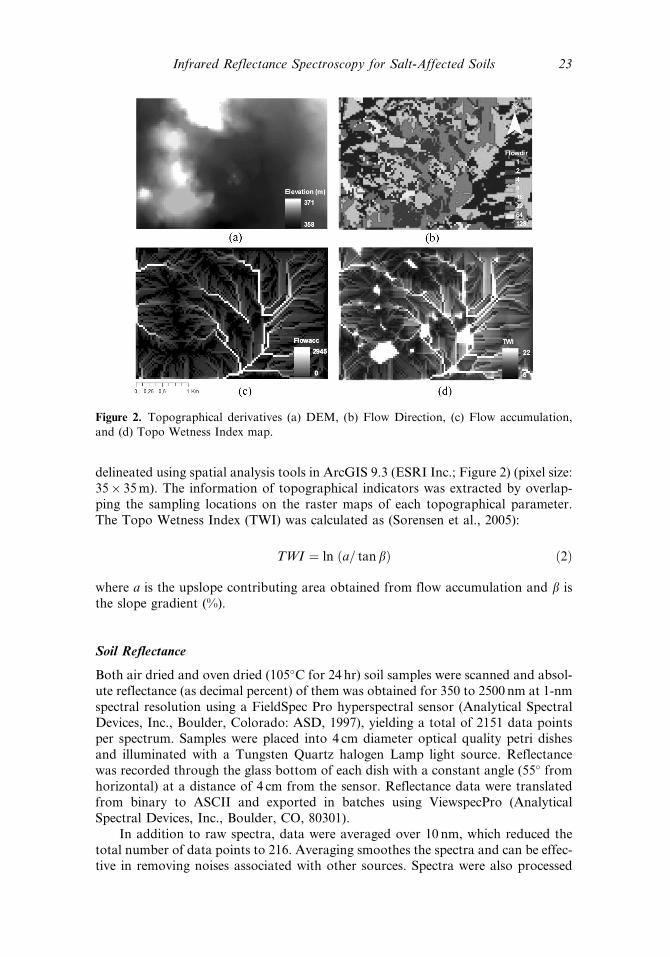
delineated using spatial analysis tools in ArcGIS 9.3 (ESRI Inc.; Figure 2) (pixel size:35� 35m). The information of topographical indicators was extracted by overlap-ping the sampling locations on the raster maps of each topographical parameter.The Topo Wetness Index (TWI) was calculated as (Sorensen et al., 2005):
TWI ¼ ln ða= tan bÞ ð2Þ
where a is the upslope contributing area obtained from flow accumulation and b isthe slope gradient (%).
Soil Reflectance
Both air dried and oven dried (105�C for 24 hr) soil samples were scanned and absol-ute reflectance (as decimal percent) of them was obtained for 350 to 2500 nm at 1-nmspectral resolution using a FieldSpec Pro hyperspectral sensor (Analytical SpectralDevices, Inc., Boulder, Colorado: ASD, 1997), yielding a total of 2151 data pointsper spectrum. Samples were placed into 4 cm diameter optical quality petri dishesand illuminated with a Tungsten Quartz halogen Lamp light source. Reflectancewas recorded through the glass bottom of each dish with a constant angle (55� fromhorizontal) at a distance of 4 cm from the sensor. Reflectance data were translatedfrom binary to ASCII and exported in batches using ViewspecPro (AnalyticalSpectral Devices, Inc., Boulder, CO, 80301).
In addition to raw spectra, data were averaged over 10 nm, which reduced thetotal number of data points to 216. Averaging smoothes the spectra and can be effec-tive in removing noises associated with other sources. Spectra were also processed
Figure 2. Topographical derivatives (a) DEM, (b) Flow Direction, (c) Flow accumulation,and (d) Topo Wetness Index map.
Infrared Reflectance Spectroscopy for Salt-Affected Soils 23
using a Continuum Removal (CR) procedure where a convex hull is fitted on top ofa spectrum using a straight-line and actual spectra are divided by the value of theconvex hull line at each corresponding wavelength:
Scr ¼ ðS=CÞ ð3Þ
where Scr is the continuum-removed spectrum, S is original spectrum, and C thecontinuum curve.
Continuum removal was performed using ENVI 4.5 (ITT visual informationSolutions, USA). The CR is known to remove unwanted spectral absorption featuresand is also effective in enhancing distinguishing spectral features (Clark & Roush,1984). In addition to actual soil samples, reflectance of pure salt minerals thatmay commonly exist in the studied area were also scanned and included gypsum(CaSO4 � 2H2O; fine powder), calcite (CaCO3; fine powder), Na2CO3 (anhydrous;powder), halite (NaCl; granular), and MgCl2 � 6H2O (crystalline; granular).
Data Mining
Calibration of soil reflectance data on soil electrical conductivity data was performedusing both Partial Least Square regression (PLS) and Multivariate AdaptiveRegression Splines (MARS) analyses. The calibration models were evaluated usingboth cross validation, where all samples were used in the calibration, and also usingseparate validation sample subsets.
Partial Least Square Regression
Partial Least Square regression (PLSR) relates two data matrices X and Y througha linear multivariate model and is widely used in reflectance spectroscopy dataanalysis. The PLSR decomposes both X and Y variables and finds new components(scores), called latent variables, which are both orthogonal. Then, a regression iscalculated between these new components of X and Y variables where X is soilreflectance and Y is a measured soil property.
X ¼ TPþ E ð4Þ
Y ¼ UQþ F ð5Þ
U ¼ BT ð6Þ
where T and U are scores of X and Y variable blocks, respectively, and P and Q areloadings of X and Y variable blocks, respectively. B is the coefficient of regressionbetween U and T. E and F are error terms.
Unlike multiple linear regression, it can handle data with strong co-linearity inindependent (X) variables, which can also be more numerous than observations. InPLSR, the selection of the number of latent variables is critical to preventing over orunder fitting of the data, which would create models with poor prediction capability.Proper fitting was achieved using cross validation where the models were constructedeach time by leaving some samples out of the calibration data set for use in thevalidation process until all samples or groups were tested. The PLSR was performedusing Unscrumbler1 V.8.0.5 software.
24 A. V. Bilgili et al.
Multivariate Adaptive Regression Splines
Multivariate Adaptive Regression Splines (MARS) is an explanatory data analysis(data mining) technique developed by Friedman (1991). MARS splits the data intosubsections (splines) with different interval ending knots (boundaries between each sec-tion), which are the points in the slopes where the regression coefficients change and fitsthe data in each subregion using a set of adaptive piecewise linear regression functions.These are called as basis functions. These basis functions are then used as new predictorvariables for modeling purposes. Each basis function may contain nonlinear and inter-action factors (second and third order) among variables, as well as linear combinations.
The basis functions take two possible forms:
Fi ¼ maxð0;Xf-cfÞ ð7Þ
Fi ¼ maxð0; cf-XfÞ ð8Þ
where Y is output of basis function, Xf is predictor variable and cf is threshold valueof the predictor Xf. The final MARS model representing the relationship betweenresponse (Y) and target variable (X) is weighed sum of other basis functions:
Y ¼ b0 þX
bi � fiðX Þ ð9Þ
where b0 is constant (intercept) and bi is constant of fi, and Y is final output.The number of basic functions is determined by using a forward stepwise
procedure where, first, a deliberately over-fitted model is constructed. Then, back-ward stepwise elimination is used, where the basic functions which do not contributesufficiently to the accuracy of the fit are discarded to get a final model of the propersize (Friedman, 1991).
In order to measure lack of fit and avoid overfitting the data, MARS uses amodified form of the generalized cross validation criterion. MARS attempts to keepthe model least complex, and the optimum model has the lowest generalized crossvalidation value. MARSTM software, Windows (V.2; Salford Systems, San Diego,CA) was used in this study.
Prediction Accuracy
The prediction ability of the VNIR technique was evaluated using the coefficient ofdetermination (R2) of measured and predicted values of samples, the root meansquare error of prediction (RMSEP), and the ratio of standard error of predictionto standard deviation (Ratio of Prediction to Deviation; RPD), which is calculatedby dividing the Standard Deviation (SD) of reference values used in the validationset by the RMSEP:
RMSEP ¼ffiffiffiffiffiffiffiffiffiffiffiffiffiffiffiffiffiffiffiffiffiffiffiffiffiffiffiffiffiffiffiffiffiffiffiffiffiffiffiffiffiffiffiffiffiffiffiffiffiffiffiffiffiffiffiffiffiffiffiXni¼1
ðYpred: � Ymeas:Þ2=ðn� 1Þs
ð10Þ
RPD¼SD/RMSEP
RPD values in the ranges >2.0, 1.4–2.0, and <1.4 were considered as excellent,acceptable and poor predictions, respectively (Chang et al., 2001).
Infrared Reflectance Spectroscopy for Salt-Affected Soils 25
Classification
Classification Trees in the Classification and Regression Trees (CART) method wasused to assess the capability of soil reflectance in categorizing the soil samplesaccording to different salinity classes. The CART is a nonparametric statisticalmethod used for classification and pattern recognition (Brieman et al., 1984). Ifthe response variables are categorical then classification trees are used; otherwise,regression trees are used. The CART uses a binary recursive partitioning methodin which a training data set is repeatedly partitioned into different subgroups ofdifferent sizes depending on some decision rules imposed on predictor variables(splitters). CART basically consists of three main steps: 1) construction of the treewith maximum branches (training), 2) choice of the right size tree (pruning), and3) classification of new samples (testing the constructed tree; validation). In first step,a flexible tree with maximum number of nodes is built on the input data (trainingdata) which the classes are known in advance. Tree is constructed by splittingsamples in the training data into small groups based on splitting rule, and splittingwill continue until each observation will assign to one of the classes. Tree hasroot (parent), child, and terminal roots. Root node contains all samples, and othersubsequent nodes, which are child and terminal nodes where the splitting processcontinues further down and stops, respectively. The CART uses some criteria, suchas Gini index (most commonly used), to choose the best splitters, the predictorwhich is the most distinguishing between different classes at each node, which alsomaximizes the number of samples falling within one class (node purity).
The second step is the pruning where insignificant nodes are cut off. Before thetree is tested with new samples, it is pruned to the optimal size, which can be achievedusing cross validation. The tree with optimum size is the one producing a minimummisclassification error rate. It is zero in the tree with maximum size. Finally, aconstructed tree can be tested using new samples. At the end, each of new samplesis placed in one terminal node where it is assigned into one of the classes.
The classifications according to the lab method and CART-VNIRRS werecompared statistically using kappa statistics. For the CART model, different samplesets for training and testing were used. Classification tree analysis was performedusing CARTTM software, (Salford Systems, San Diego, CA). Kappa statistics (j)were calculated to evaluate whether classifications were statistically significant(Cohen, 1960).
Results
Salinity Parameters
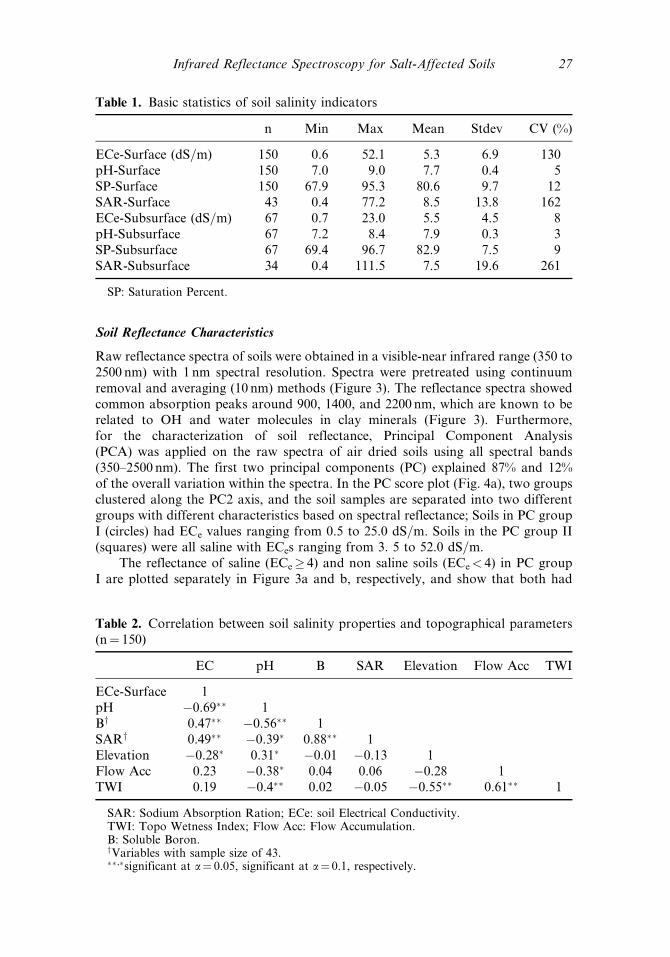
Basic statistics related with soil salinity parameters, and their correlations with eachother and topographical indices, are shown in Tables 1 and 2, respectively. The ECeshowed a broad range from 0.5 to 52 dS=m and was significantly correlated withSodium Absorption Ratio (SAR; r¼ 0.49) and pH (r¼�0.69). Another significantcorrelation (a¼ 0.1) existed between ECe and elevation (r¼�0.28), while TWI(r¼ 0.19) and flow accumulation (r¼ 0.23) were not statistically significant(a> 0.1). The ECe of surface soil and subsurface soils were also highly correlated(r¼ 0.7). The areas with high TWI values at low elevations are more likely to becomesaturated and capillary movement of groundwater to the surface, but correlationwith ECe, were nevertheless weak.
26 A. V. Bilgili et al.
Soil Reflectance Characteristics
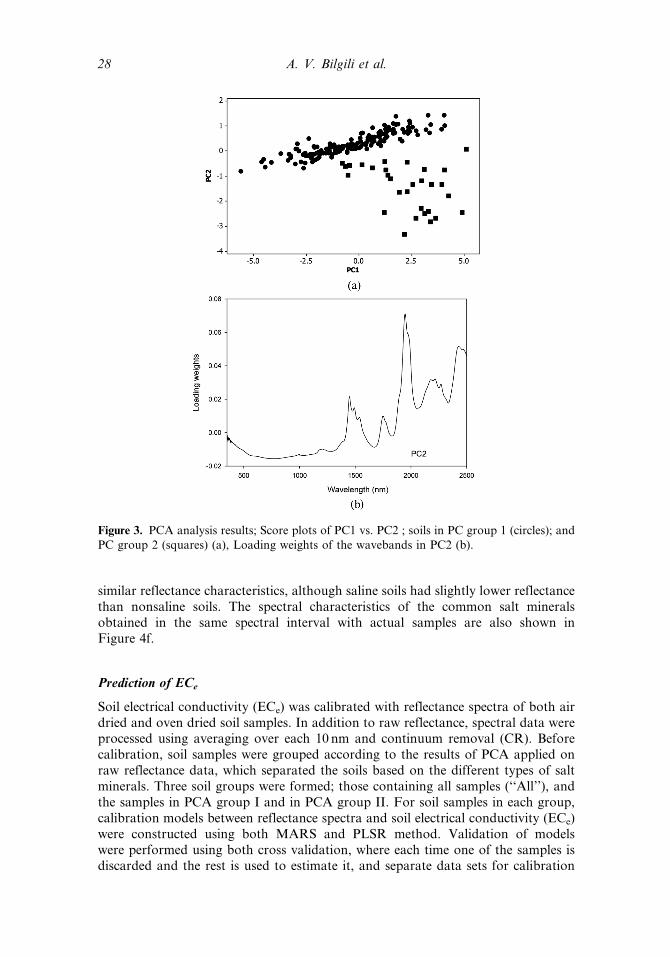
Raw reflectance spectra of soils were obtained in a visible-near infrared range (350 to2500 nm) with 1 nm spectral resolution. Spectra were pretreated using continuumremoval and averaging (10 nm) methods (Figure 3). The reflectance spectra showedcommon absorption peaks around 900, 1400, and 2200 nm, which are known to berelated to OH and water molecules in clay minerals (Figure 3). Furthermore,for the characterization of soil reflectance, Principal Component Analysis(PCA) was applied on the raw spectra of air dried soils using all spectral bands(350–2500 nm). The first two principal components (PC) explained 87% and 12%of the overall variation within the spectra. In the PC score plot (Fig. 4a), two groupsclustered along the PC2 axis, and the soil samples are separated into two differentgroups with different characteristics based on spectral reflectance; Soils in PC groupI (circles) had ECe values ranging from 0.5 to 25.0 dS=m. Soils in the PC group II(squares) were all saline with ECes ranging from 3. 5 to 52.0 dS=m.
The reflectance of saline (ECe� 4) and non saline soils (ECe< 4) in PC groupI are plotted separately in Figure 3a and b, respectively, and show that both had
Table 1. Basic statistics of soil salinity indicators
n Min Max Mean Stdev CV (%)
ECe-Surface (dS=m) 150 0.6 52.1 5.3 6.9 130pH-Surface 150 7.0 9.0 7.7 0.4 5SP-Surface 150 67.9 95.3 80.6 9.7 12SAR-Surface 43 0.4 77.2 8.5 13.8 162ECe-Subsurface (dS=m) 67 0.7 23.0 5.5 4.5 8pH-Subsurface 67 7.2 8.4 7.9 0.3 3SP-Subsurface 67 69.4 96.7 82.9 7.5 9SAR-Subsurface 34 0.4 111.5 7.5 19.6 261
SP: Saturation Percent.
Table 2. Correlation between soil salinity properties and topographical parameters(n¼ 150)
EC pH B SAR Elevation Flow Acc TWI
ECe-Surface 1pH �0.69�� 1By 0.47�� �0.56�� 1SARy 0.49�� �0.39� 0.88�� 1Elevation �0.28� 0.31� �0.01 �0.13 1Flow Acc 0.23 �0.38� 0.04 0.06 �0.28 1TWI 0.19 �0.4�� 0.02 �0.05 �0.55�� 0.61�� 1
SAR: Sodium Absorption Ration; ECe: soil Electrical Conductivity.TWI: Topo Wetness Index; Flow Acc: Flow Accumulation.B: Soluble Boron.yVariables with sample size of 43.��,�significant at a¼ 0.05, significant at a¼ 0.1, respectively.
Infrared Reflectance Spectroscopy for Salt-Affected Soils 27
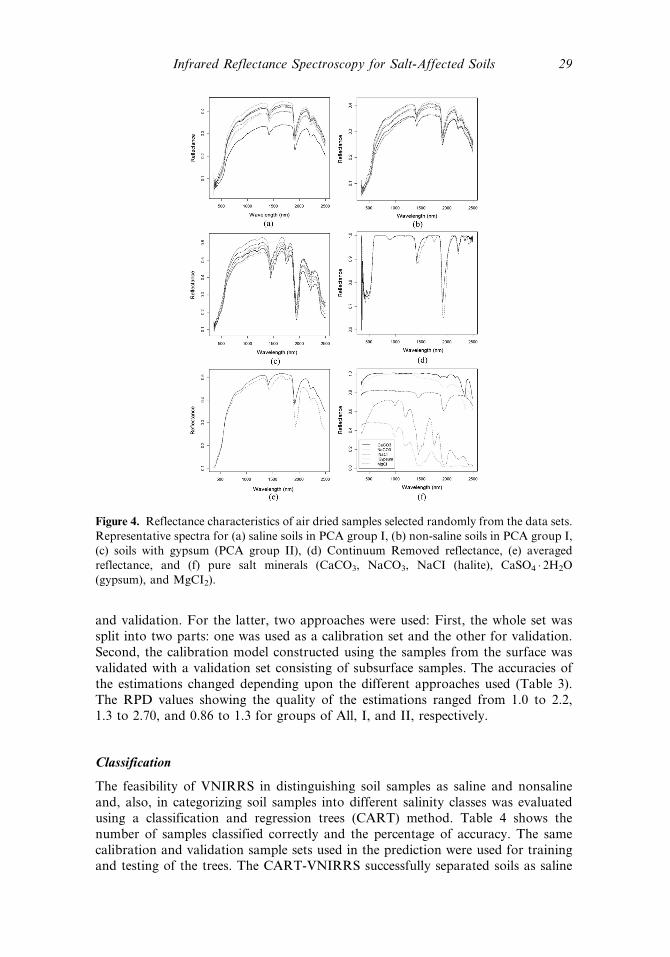
similar reflectance characteristics, although saline soils had slightly lower reflectancethan nonsaline soils. The spectral characteristics of the common salt mineralsobtained in the same spectral interval with actual samples are also shown inFigure 4f.
Prediction of ECe
Soil electrical conductivity (ECe) was calibrated with reflectance spectra of both airdried and oven dried soil samples. In addition to raw reflectance, spectral data wereprocessed using averaging over each 10 nm and continuum removal (CR). Beforecalibration, soil samples were grouped according to the results of PCA applied onraw reflectance data, which separated the soils based on the different types of saltminerals. Three soil groups were formed; those containing all samples (‘‘All’’), andthe samples in PCA group I and in PCA group II. For soil samples in each group,calibration models between reflectance spectra and soil electrical conductivity (ECe)were constructed using both MARS and PLSR method. Validation of modelswere performed using both cross validation, where each time one of the samples isdiscarded and the rest is used to estimate it, and separate data sets for calibration
Figure 3. PCA analysis results; Score plots of PC1 vs. PC2 ; soils in PC group 1 (circles); andPC group 2 (squares) (a), Loading weights of the wavebands in PC2 (b).
28 A. V. Bilgili et al.
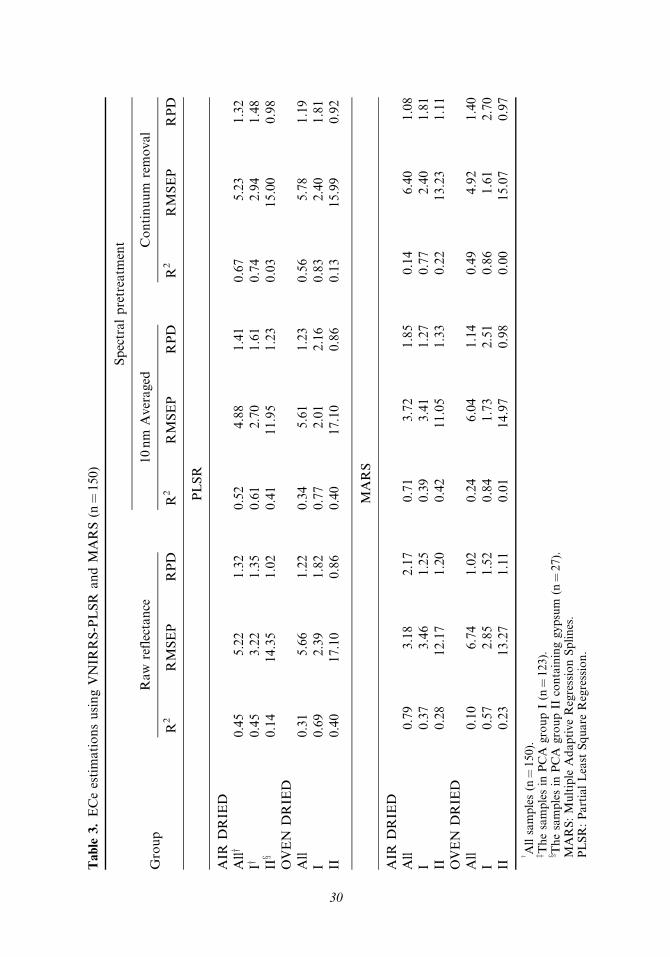
and validation. For the latter, two approaches were used: First, the whole set wassplit into two parts: one was used as a calibration set and the other for validation.Second, the calibration model constructed using the samples from the surface wasvalidated with a validation set consisting of subsurface samples. The accuracies ofthe estimations changed depending upon the different approaches used (Table 3).The RPD values showing the quality of the estimations ranged from 1.0 to 2.2,1.3 to 2.70, and 0.86 to 1.3 for groups of All, I, and II, respectively.
Classification
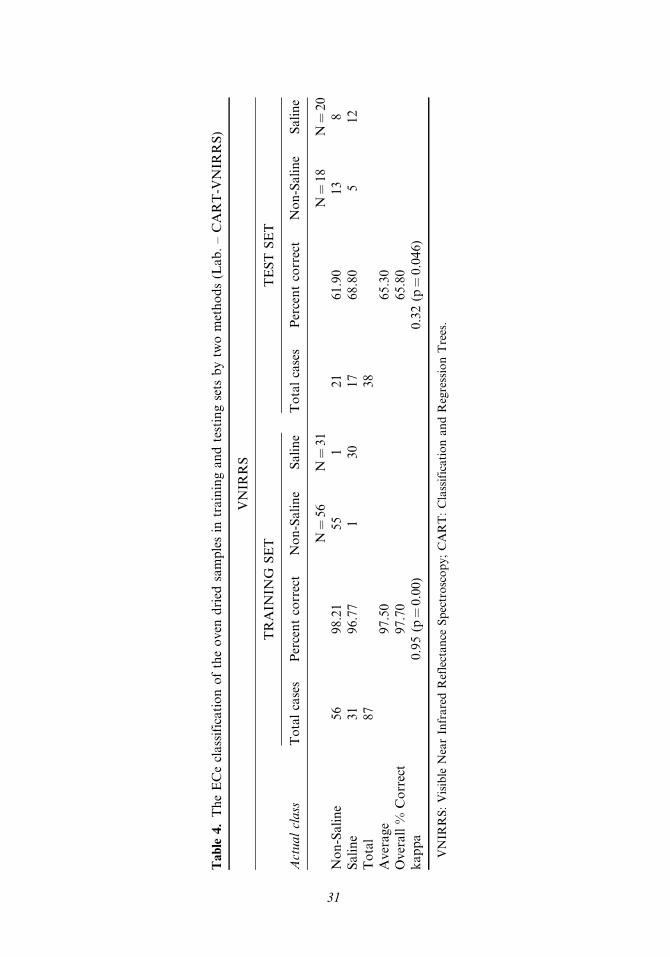
The feasibility of VNIRRS in distinguishing soil samples as saline and nonsalineand, also, in categorizing soil samples into different salinity classes was evaluatedusing a classification and regression trees (CART) method. Table 4 shows thenumber of samples classified correctly and the percentage of accuracy. The samecalibration and validation sample sets used in the prediction were used for trainingand testing of the trees. The CART-VNIRRS successfully separated soils as saline
Figure 4. Reflectance characteristics of air dried samples selected randomly from the data sets.Representative spectra for (a) saline soils in PCA group I, (b) non-saline soils in PCA group I,(c) soils with gypsum (PCA group II), (d) Continuum Removed reflectance, (e) averagedreflectance, and (f) pure salt minerals (CaCO3, NaCO3, NaCI (halite), CaSO4 � 2H2O(gypsum), and MgCI2).
Infrared Reflectance Spectroscopy for Salt-Affected Soils 29
Table
3.ECeestimationsusingVNIR
RS-PLSR
andMARS(n
¼150)
Spectralpretreatm
ent
Group
Raw
reflectance
10nm
Averaged
Continuum
removal
R2
RMSEP
RPD
R2
RMSEP
RPD
R2
RMSEP
RPD
PLSR
AIR
DRIE
DAlly
0.45
5.22
1.32
0.52
4.88
1.41
0.67
5.23
1.32
Iy0.45
3.22
1.35
0.61
2.70
1.61
0.74
2.94
1.48
IIx
0.14
14.35
1.02
0.41
11.95
1.23
0.03
15.00
0.98
OVEN
DRIE
DAll
0.31
5.66
1.22
0.34
5.61
1.23
0.56
5.78
1.19
I0.69
2.39
1.82
0.77
2.01
2.16
0.83
2.40
1.81
II0.40
17.10
0.86
0.40
17.10
0.86
0.13
15.99
0.92
MARS
AIR
DRIE
DAll
0.79
3.18
2.17
0.71
3.72
1.85
0.14
6.40
1.08
I0.37
3.46
1.25
0.39
3.41
1.27
0.77
2.40
1.81
II0.28
12.17
1.20
0.42
11.05
1.33
0.22
13.23
1.11
OVEN
DRIE
DAll
0.10
6.74
1.02
0.24
6.04
1.14
0.49
4.92
1.40
I0.57
2.85
1.52
0.84
1.73
2.51
0.86
1.61
2.70
II0.23
13.27
1.11
0.01
14.97
0.98
0.00
15.07
0.97
y Allsamples(n
¼150).
z Thesamplesin
PCA
groupI(n
¼123).
x Thesamplesin
PCA
groupII
containinggypsum
(n¼27).
MARS:Multiple
AdaptiveRegressionSplines.
PLSR:PartialLeast
Square
Regression.
30
Table
4.TheECeclassificationoftheoven
dried
samplesin
trainingandtestingsets
bytw
omethods(Lab.–CART-V
NIR
RS)
VNIR
RS
TRAIN
ING
SET
TEST
SET
Actualclass
Totalcases
Percentcorrect
Non-Saline
Saline
Totalcases
Percentcorrect
Non-Saline
Saline
N¼56
N¼31
N¼18
N¼20
Non-Saline
56
98.21
55
121
61.90
13
8Saline
31
96.77
130
17
68.80
512
Total
87
38
Average
97.50
65.30
Overall%
Correct
97.70
65.80
kappa
0.95(p
¼0.00)
0.32(p
¼0.046)
VNIR
RS:Visible
NearInfraredReflectance
Spectroscopy;CART:ClassificationandRegressionTrees.
31
and nonsaline with overall average accuracy of 97% (j¼ 0.95, p< 0.0005) and 65%(j¼ 0.32, p< 0.05) for training and testing, respectively (Table 4).
Discussion
Soil Reflectance
Overall, the magnitude of soil reflectance values was low, and even slightly lower forsaline soils (ECe >4; Figure 3). This could be explained by higher clay and moisturecontents of soils, which can reduce the overall reflectivity (Ben-Dor & Banin, 1995).
Applying PCA on the reflectance data of air dried samples separated soils intotwo distinctive groups. Soils in each group exhibited absorption peaks located atdifferent wavelengths, which indicates existence of different types of salt mineralsin each group.
Reflectance characteristics and distinguishing absorption features of various saltminerals prepared from pure chemicals in the laboratory were demonstrated byCrowley (1991). Howari et al. (2002) showed reflectance features and commonabsorption peaks of the different salt minerals in the laboratory using soils contami-nated with different types and amounts of salt minerals. Their study was performedunder controlled conditions with one type of soil while this study used soil samplescollected from the field with naturally-formed salt minerals.
The soils in PC group II showed absorption peaks at 1447, 1750, 1940, 2215, and2260nm (Figure 3c). Similar reflectance characteristics were observed for pure gypsum(Figure 3f). Howari et al. (2002) obtained these absorption peaks for gypsum usingartificially spiked soils. Similarly, wavelengths in the 1945–1950nm intervals hadthe highest loading weights in PC2, which separated the whole sample set into twogroups (Figure 4b). The absorption peaks in this range are characteristic for gypsum(Howari et al., 2002; Crowley, 1991; Tamas & Lenart, 2006; Farifteh et al., 2006).
The reflectance of the soils in the PC group I had absorption peaks around 1000,1783, 2220, 2251, and 2348 nm (Figure 3a). Howari et al. (2002) obtained absorptionpeak at the same positions using silty clay soil contaminated with halite mineral(NaCI2) and the mixture of both halite and gypsum salts. Comparison of spectrawith both these pure minerals and also with other work on spectral characteristicsof saline soils indicates that gypsum appears to be the common salt mineral forthe soil samples in PC group II, while halite or a mixture of both halite and gypsummay be common salt minerals of the saline soils in PC group I.
Estimation
Estimation quality of ECe by VNIRRS varied according to different pretreatment ofsoil and spectra, as well as different calibration models used. In general, the successof the calibrations constructed using the samples in group I with presumed NaCl saltminerals were better than group All, indicating that constructing separate calibrationmodels for soils with different salt mineral would have been more successful. Theimprovements on the estimations were further enhanced using oven dried sampleswhich may be due to increased spectral presence of the salts in crystallized form aftermore complete drying. Farifteh et al. (2007) reported poor ECe estimation for soilswith finer texture, attributing it to the relatively higher moisture content. Similarly,the air-dried soils in this study had fine texture and moisture content between 3 and
32 A. V. Bilgili et al.
10%. For the soil samples in group All and II, results were not improved by usingreflectance from oven dried samples, and, in some cases, the results were betterfor air dried samples. The difference between these groups and group I is the typeof salt mineral available. The dominant salt mineral type of soils in group II was gyp-sum, and the crystallized form of gypsum may have changed with oven drying. Thus,the estimations rely on the amount of gypsum degraded. Also, the number of sam-ples is lower than in the other two groups.
The estimation quality between air dried and oven dried samples also changeddepending on different pretreatment and calibration methods. For example, MARSwithout spectral pretreatment provided better results than PLSR and estimationquality for the samples in group All sharply decreased using oven dried samples,while PLSR provided better results than MARS for the samples in group All andI using oven dried samples when using raw spectra without spectral pretreatment(Table 3). Similarly, averaging spectra always improved calibrations constructedusing PLSR. Averaging smoothes out the spectra, removes noise, and reduces thenumber and depth of peaks such as those from water absorption (Reeves andMcCarty, 2001). Removing those components may also have eliminated factorscausing nonlinearities. MARS is known to provide better results for the cases wherethe relationship between predictor and response variables may be nonlinear, andPLSR fits linear relationships only (Brown et al., 2006). As a result, soil moisturemay cause nonlinearities between soil spectra and the parameter of interest andremoving moisture increased linearity without applying any pretreatment on thespectra. Overall, MARS provided better estimation results depending on the differ-ent salt types and the pretreatment approach used. The best quality (RPD¼ 2.7) wasobtained using MARS for the soils in group I.
For continuum removal (CR), the best estimation results for ECe were obtainedfor group I with RPD and R2 values of 2.7 and 0.86, respectively. Continuumremoval enhances spectral absorption features (Dehaan & Taylor, 2002; Clark &Roush, 1984) and can help improve the estimations. Soil reflectance did not showany clear pattern regarding salt content, i.e., a decrease or increase in the magnitudeof spectral reflectance; therefore, the estimations were made possible via absorptionpeaks associated with common salt minerals in soils that are the source of soilsalinity. Weng et al. (2008) reported improvements in the estimation of ECe usingreflectance spectroscopy after applying CR on the spectra. CR also generallyimproved estimations in this study compared to raw spectra although not consist-ently. Overall, using either pretreatment method provided better results comparedto using only raw spectra.
Figure 5 presents the results of estimations obtained using different sample setsfor calibration and validation, as well as a calibration model constructed fromsurface samples that was validated using subsurface samples. Calibration modelswere constructed using the best approach obtained for the cross validation, basedon oven dried samples for obtaining VNIR reflectance spectra and averaging of spec-tra after discarding samples containing gypsum. Success was moderate (R2¼ 0.64,RPD¼ 1.64) when using separate data sets for calibration and validation, and poor(R2¼ 0.42, RPD¼ 1.31) when estimating the ECe values of the samples at subsurfacedepth.
Topographical parameters that have significant correlations with soil electricalconductivity such as elevation, TWI and flow accumulation were combined withsoil reflectance to improve the estimations of ECe (Figure 5c). Estimations of new
Infrared Reflectance Spectroscopy for Salt-Affected Soils 33
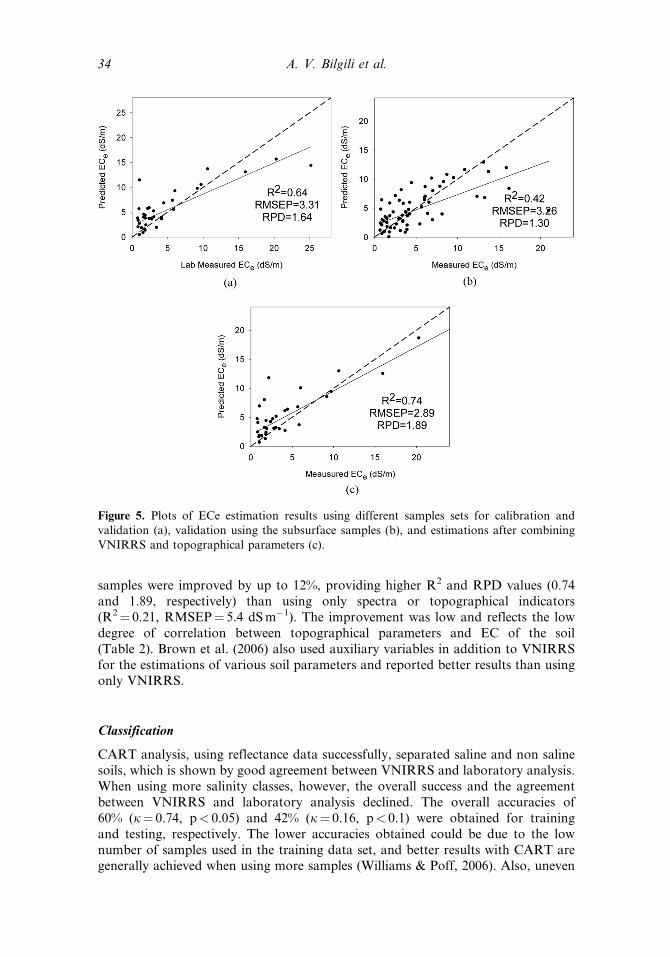
samples were improved by up to 12%, providing higher R2 and RPD values (0.74and 1.89, respectively) than using only spectra or topographical indicators(R2¼ 0.21, RMSEP¼ 5.4 dSm�1). The improvement was low and reflects the lowdegree of correlation between topographical parameters and EC of the soil(Table 2). Brown et al. (2006) also used auxiliary variables in addition to VNIRRSfor the estimations of various soil parameters and reported better results than usingonly VNIRRS.
Classification
CART analysis, using reflectance data successfully, separated saline and non salinesoils, which is shown by good agreement between VNIRRS and laboratory analysis.When using more salinity classes, however, the overall success and the agreementbetween VNIRRS and laboratory analysis declined. The overall accuracies of60% (j¼ 0.74, p< 0.05) and 42% (j¼ 0.16, p< 0.1) were obtained for trainingand testing, respectively. The lower accuracies obtained could be due to the lownumber of samples used in the training data set, and better results with CART aregenerally achieved when using more samples (Williams & Poff, 2006). Also, uneven
Figure 5. Plots of ECe estimation results using different samples sets for calibration andvalidation (a), validation using the subsurface samples (b), and estimations after combiningVNIRRS and topographical parameters (c).
34 A. V. Bilgili et al.
distribution of the samples in each class may have caused poor classification results,especially in the case where the model was tested using more categories.
Conclusion
Soil samples with different dominant salt minerals could be separated by applyingPrincipal Component Analysis on the reflectance of air dried soil samples. The qual-ity of estimations of soil ECe with VNIRS was improved by constructing differentcalibration models for the soil groups with different types of salt minerals andusing the reflectance obtained from oven dried samples after applying spectralpretreatment methods such as continuum removal. The estimation quality was poorfor samples containing gypsum, but was greatly improved after these samples wereremoved. MARS provided better estimations for ECe than the commonly usedPLSR method, providing the best cross validation R2 and RPD values of 0.86 and2.7, respectively. Combining the information obtained from topographical dataand reflectance spectroscopy improved the estimation of ECe modestly. The classi-fication tree method was moderately successful in distinguishing saline and nonsaline soils based on reflectance spectra. In summary, VNIRRS has potential foruse in soil salinity assessment, but factors such as texture and mineral content makeestimations complicated. For future studies, reflectance spectra could be obtainedin situ and integrated with other tools such as GIS for modeling and mapping thedistribution of soil salinity more efficiently.
References
Andrews, S. S., D. L. Karlen, and C. A. Cambardella. 2004. The Soil Management Assess-ment Framework: A quantitative soil quality evaluation method. Soil Science Societyof America Journal 68:1945–1962.
Aydemir, S. 2001. Properties of palygorskite-influenced vertisols and vertic-like soils in theHarran Plain of Southeastern Turkey. Dissertation, Texas A&M University, CollegeStation, TX, USA.
Ben-Dor, E., and A. Banin. 1995. Near infrared analysis as a rapid method to simultaneouslyevaluate several soil properties. Soil Science Society of AmericaJournal 59:364–372.
Brieman, L., J. Friedman, C. J. Stone, and R. A. Olshen. 1984. Classification and regressiontrees. Pacific Grove, CA. Wadsworth.
Brown, D. J., K. D. Shepherd, M. G. Walsh, M. D. Mays, and T. G. Reinsch. 2006. Globalsoil characterization with VNIR diffuse reflectance spectroscopy. Geoderma 132:273–290.
Chang C. W., D. A. Laird, M. J. Mausbach, J. Maurice, and J. R. Hurburgh. 2001. Near-Infrared reflectance spectroscopy – principal components regression analyses of soilproperties. Soil Science Society of America Journal 65:480–490.
Clark, R. N., and T. Roush. 1984. Reflectance spectroscopy: Quantitative analysis techniquesfor remote sensing applications. Journal of Geophysical Research 89:6329–6340.
Clay, D. E., J. Chang, D. D. Malo, C. G. Carlson, C. Reese, S. A. Clay, M. Ellsbury, andB. Berg. 2001. Factors influencing spatial variability of soil apparent electricalconductivity. Communications in Soil Science and Plant Analysis 32:2993–3008.
Cohen, J. 1960. A coefficient of agreement for nominal scales. Educational and PsychologicalMeasurement 20:37–46.
Crowley, J. K. 1991. Visible and near-infrared (0.4–2.5=mm) reflectance spectra of playaevaporite minerals. Journal of Geophysical Research 96:231–240.
Csillag, F., L. Pasztor, and L. Biehl. 1993. Spectral Band Selection for the Characterization ofsalinity status of soils. Remote sensing of environment 43:231–242.
Infrared Reflectance Spectroscopy for Salt-Affected Soils 35
Cullu, M. A., A. Almaca, Y. Sahin, and S. Aydemir. 2002. Application of GIS for monitoringsoil salinization in the Harran Plain, Turkey. International meeting on sustainable landand management, Soil Science Society of Turkey. Canakkale, Turkey.
Cullu, M. A., S. Aydemir, M. Qadir, A. Almaca, A. R. Ozturkmen, A. Bilgic, and N. Agca.2009. Implication of groundwater fluctuation on the seasonal dynamic in the HarranPlain, South-Eastern Turkey. irrigation and drainage (2009). DOI: 10.1002=ird.507.
Dehaan, R. L., and G. R. Taylor. 2002. Field-derived spectra of salinized soils and vegetationas indicators of irrigation-induced soil salinization. Remote Sensing of Environment80:406–417.
Eldeiry, A. A., and L. A. Garcia. 2008. Detecting soil salinity in alfalfa fields using spatialmodeling and remote sensing. Soil Science Society of America Journal 72:201–211.
Farifteh, J., A. Farshad, and R. J. George. 2006. Assessing salt affected soils using remotesensing, solute modeling, and geophysics. Geoderma 130:191–206.
Farifteh, J., F. V. Meer, C. Atzberger, and E. J. M. Carranza. 2007. Quantitative analysis ofsalt-affected soil reflectance spectra: A comparison of two adaptive methods (PLSR andANN). Remote Sensing of Environment 110:59–78.
Friedman, J. H. 1991. Multivariate adaptive regressions splines. The Annals of Statistics19:1–67.
Ghassemi, F., A. J. Jackeman, and H. A. Nix. 1995. Salinization of land and water resources:Human causes, extent, management and case studies. CAB International, WallingfordOxon, UK.
Howari, F. M., P. C. Goodell, and S. Miyamoto. 2002. Spectral properties of salt crustsformed on saline soils. J. Environ. Qual 31:1453–1461.
Islam, K., B. Singh, and A. McBratney. 2003. Simultaneous estimation of several soil proper-ties by ultra-violet, visible, and near – infrared reflectance spectroscopy. Australian Jour-nal of Soil Research 41:1193–1202.
Kalra, N. K., and D. C. Joshi. 1996. Potentiality of Landsat, SPOT and IRS satellite imagery,for recognition of salt affected soils in Indian Arid Zone. International Journal of RemoteSensing 17:3001–3014.
Karlen, D. L., M. D. Tomer, J. Neppel, and A. Cambardella. 2008. A preliminary water-shed scale soil quality assessment in north central Iowa, USA. Soil&Tillage Research99:291–299.
Khan, N. M., V. V. Rastoskuev, E. Shalina, and Y. Sato. 2001. Mapping salt-affected soilusing remote sensing indicators. A simple approach with the use of Gis Idrissi, 22nd AsianConference on Remote Sensing, 5–9 November 2001, Singapore (2001).
Metternicht, G. I., and J. A. Zinck. 2008. Remote sensing of soil salinization: Impact on landmanagement. CRC Press. Boca Raton, FL.
Muhammad, S., T. Muller, and R. G. Joergensen. 2008. Relationships between soil biologicaland other soil properties in saline and alkaline arable soils from the Pakistani Punjab.Journal of Arid Environments 72:448–457.
Pozdnyakova, P., and R. Zhang. 1999. Geostatistical analysis of soil salinity in a large field.Precision Agriculture 1:153–165.
Reeves, J. B., and G. W. McCarty. 2001. Quantitative analysis of agricultural soils using nearinfrared reflectance spectroscopy and a fibre-optic probe. Journal of Near Infrared Reflec-tance Spectroscopy 9:25–34.
Shepherd, K. D, and M. G. Walsh. 2002. Development of reflectance spectral librariesfor characterization of soil properties. Soil Science Society of America Journal66:988–998.
Sonmez, S., D. Buyuktas, F. Okturen, and S. Citak. 2008. Assessment of different soil to waterratios (1:1, 1:2.5, 1:5) in soil salinity studies. Geoderma 144:361–369.
Sorensen, R., U. Zinko, and J. Seibert. 2005. On the calculation of the topographicwetnessindex: Evaluation of different methods based on field observations.Hydrology and Earth System Sciences 2:1807–1834.
36 A. V. Bilgili et al.

Tamas, J., and C. Lenart. 2006. Analysis of a small agricultural watershed using remotesensing techniques. International Journal of Remote Sensing 27:3727–3738.
Tanji, K. K. 2002. Salinity in the soil environment, pp. 21–53, in A. Lauchli and U. Luttge,eds., Salinity: Environment – plants – molecules. Kuwer Academic Publishers, Dordrecht=Boston=London.
Waiser, T. H., C. L. S. Morgan, D. J. Brown, and T. C. Hallmark. 2007. In situ characterizationof soil clay content with visible near-infrared diffuse reflectance spectroscopy. Soil ScienceSociety of America Journal 71:389–396.
Weng, Y., P. Gong, and Z. Zhu. 2008. Reflectance spectroscopy for the assessment of soilsalt content in soils of the Yellow River Delta of China. International Journal of RemoteSensing 29:5511–5531.
Williams, J. B., and N. L. Poff. 2006. Informatic software for the ecologist’s toolbox: A basicexample. Ecological Informatics 1:325–329.
Infrared Reflectance Spectroscopy for Salt-Affected Soils 37

Copyright of Arid Land Research & Management is the property of Taylor & Francis Ltd and its content may
not be copied or emailed to multiple sites or posted to a listserv without the copyright holder's express written
permission. However, users may print, download, or email articles for individual use.
Related Documents