See discussions, stats, and author profiles for this publication at: https://www.researchgate.net/publication/5930647 The Use of Fungal In Vitro Systems for Studying Translational Regulation ARTICLE in METHODS IN ENZYMOLOGY · FEBRUARY 2007 Impact Factor: 2.09 · DOI: 10.1016/S0076-6879(07)29010-X · Source: PubMed CITATIONS 22 READS 70 4 AUTHORS, INCLUDING: Allan Jacobson University of Massachusetts… 139 PUBLICATIONS 10,562 CITATIONS SEE PROFILE Available from: Allan Jacobson Retrieved on: 06 April 2016

Welcome message from author
This document is posted to help you gain knowledge. Please leave a comment to let me know what you think about it! Share it to your friends and learn new things together.
Transcript

Seediscussions,stats,andauthorprofilesforthispublicationat:https://www.researchgate.net/publication/5930647
TheUseofFungalInVitroSystemsforStudyingTranslationalRegulation
ARTICLEinMETHODSINENZYMOLOGY·FEBRUARY2007
ImpactFactor:2.09·DOI:10.1016/S0076-6879(07)29010-X·Source:PubMed
CITATIONS
22
READS
70
4AUTHORS,INCLUDING:
AllanJacobson
UniversityofMassachusetts…
139PUBLICATIONS10,562CITATIONS
SEEPROFILE
Availablefrom:AllanJacobson
Retrievedon:06April2016
METHODS IN ENZYMOLOGYEditors-in-Chief
JOHN N. ABELSON AND MELVIN I. SIMON
Division of BiologyCalifornia Institute of TechnologyPasadena, California
Founding Editors
SIDNEY P. COLOWICK AND NATHAN O. KAPLAN
CONTENTS
Contributors xi
Preface xv
Volumes in Series xvii
1. Use of Reticulocyte Lysates for Mechanistic Studies of Eukaryotic
Translation Initiation 1William C. Merrick and Diane Barth-Baus
1. Introduction 2
2. Materials 3
3. Methods 4
4. Translation of an mRNA to Yield a Radioactive Product 5
5. Quantitation of Reaction Products 6
6. Optimization of Translations 8
7. Reporter Proteins for Translation 10
8. Experimental Use of Nuclease-Treated Lysates 11
References 19
2. Studying Translational Control in Drosophila Cell-Free Systems 23
Fatima Gebauer and Matthias W. Hentze
1. Introduction 23
2. Preparation of Ovary Extracts 25
3. Preparation of Embryo Extracts 27
4. The Translation Assay 28
Acknowledgments 32
References 32
3. Use of In Vitro Translation Extract Depleted in Specific Initiation Factors
for the Investigation of Translational Regulation 35Daniel R. Gallie
1. Introduction 36
2. Factors Involved in Translation Initiation 36
3. Experimental Methods to Generate and Use Fractionated
Translation Extracts 37
References 50
v
vi Contents
4. A Highly Efficient and Robust In Vitro Translation System for Expression
of Picornavirus and Hepatitis C Virus RNA Genomes 53Yuri V. Svitkin and Nahum Sonenberg
1. Introduction 54
2. Cell-Free Model for EMCV Replication 55
3. Materials for Cell-Free Synthesis of EMCV 58
4. Methods for Cell-Free Synthesis of EMCV 61
5. In Vitro Translation of HCV RNA 66
6. Materials for In Vitro Translation of HCV RNA 68
7. Methods and Applications of In Vitro Translation of HCV RNA 70
8. Perspectives and Future Applications 76
Acknowledgments 79
References 79
5. A Practical Approach to Isolate 48S Complexes: Affinity Purification
and Analyses 83Nicolas Locker and Peter J. Lukavsky
1. Introduction 84
2. Design of Strepto-Tagged mRNAs for Affinity Purification
of 48S Complexes 86
3. Affinity Purification of 48S Complexes 88
4. Analysis of the Purified 48S Complexes 94
5. Functional Analysis of the Purified 48S Complexes 99
6. Conclusion 102
Acknowledgments 102
References 103
6. Yeast Phenotypic Assays on Translational Control 105
Bumjun Lee, Tsuyoshi Udagawa, Chingakham Ranjit Singh, and
Katsura Asano
1. Introduction 106
2. Quantitative Yeast Growth Assay 109
3. Use of FOA to Assay Lethal Mutations and Perform Plasmid Shuffling 114
4. Assay of Dominant Negative Mutants, Foreign Proteins, or Phenotypic
Suppression by Overexpression 116
5. Assay of Stringency in Start Codon Selection 120
6. Assay of Translation Initiation Activities with GCN4 as Reporter 123
7. Polysome Profiling 129
Acknowledgments 133
References 133

Contents vii
7. Localization and Characterization of Protein–Protein
Interaction Sites 139Chingakham Ranjit Singh and Katsura Asano
1. Introduction 140
2. The Use of Two-Hybrid Assay to Identify Protein–Protein
Interaction Sites 141
3. GST Pull-Down Assay 146
4. Site-Directed Mutagenesis to Study Protein–Protein Interactions 154
5. Co-IP Assay 156
Acknowledgments 159
References 160
8. In Vivo Stabilization of Preinitiation Complexes by
Formaldehyde Cross-Linking 163Leos Valasek, Bela Szamecz, Alan G. Hinnebusch, and Klaus H. Nielsen
1. Introduction 164
2. Rationale Behind the Choice of HCHO as a Stabilization Agent 166
3. Whole Cell Extract Preparation and WCE Fractionation 168
4. Analysis of Fractionated Preinitiation Complexes 169
5. Special Considerations and the Resedimentation Protocol 171
6. Final Remarks 179
Acknowledgments 181
References 181
9. Molecular Genetic Structure–Function Analysis of Translation
Initiation Factor eIF5B 185Byung-Sik Shin and Thomas E. Dever
1. Introduction 186
2. Methods 188
3. Future Directions 200
References 200
10. The Use of Fungal In Vitro Systems for Studying
Translational Regulation 203Cheng Wu, Nadia Amrani, Allan Jacobson, and Matthew S. Sachs
1. Introduction 204
2. Methods and Discussion 204
3. Summary 222
Acknowledgments 223
References 223

viii Contents
11. Investigating Translation Initiation Using Drosophila
Molecular Genetics 227Gritta Tettweiler and Paul Lasko
1. Introduction 227
2. P-Elements 228
3. Perspectives and Conclusions 238
4. Important Sources for Drosophila Protocols 238
5. Drosophila Stock Centers 239
References 239
12. Analysis of RNA:Protein Interactions In Vivo: Identification of
RNA-Binding Partners of Nuclear Factor 90 243Andrew M. Parrott, Melissa R. Walsh, and Michael B. Mathews
1. Introduction 244
2. Expression of Epitope-Tagged Proteins 245
3. RNP Immunoprecipitation (RIP) Assay 246
4. Identification of Unknown RNAs by PCR Amplification and Sequencing 252
5. Summary 256
Acknowledgment 258
References 258
13. Approaches for Analyzing the Differential Activities and Functions of
eIF4E Family Members 261Robert E. Rhoads, Tzvetanka D. Dinkova, and Rosemary Jagus
1. Introduction 262
2. In Silico Detection and Analysis of eIF4E Family Members 267
3. Assessing Differential Cap-Binding Properties of eIF4E Family Members 271
4. Expression of eIF4E Family Members 273
5. Assessing eIF4E Family Members in Translation Systems 279
6. Protein–Protein Interaction Assays as a Means to Differentiate
Functions of eIF4E Family Members 283
7. Global Microarray Studies of Polysomal mRNA Distribution 290
Acknowledgments 292
References 292
14. Tethered Function Assays: An Adaptable Approach to Study RNA
Regulatory Proteins 299Jeff Coller and Marv Wickens
1. Introduction and Rationale 300
2. The Basic Design of the Tethered Function Assay 302

Contents ix
3. The Tether 303
4. The Reporter mRNA 305
5. A Priori Considerations about the Logic of the Assay 307
6. Important Controls 308
7. Examples of the Tethered Function Assay in the Literature 312
8. Prospects 318
Acknowledgments 318
References 318
15. Analysis of Ribosomal Shunting During Translation Initiation in
Eukaryotic mRNAs 323Vincent P. Mauro, Stephen A. Chappell, and John Dresios
1. Introduction 324
2. Defining the Site or Sites of Ribosomal Recruitment 324
3. Experimental Approaches to Determine Which Segments of an
mRNA Are Shunted 334
4. Identification of Ribosomal Shunt Sites 339
5. Determining Whether Putative Shunt Sites Bind to Ribosomal Subunits 340
6. Assessing mRNA–rRNA Base Pairing in Yeast 344
7. Assessing Ribosomal Shunting Mediated by mRNA–rRNA Base
Pairing Interactions 349
8. Considerations in Using the Mouse–Yeast Hybrid rRNA System 351
Acknowledgments 352
References 352
Author Index 355
Subject Index 371

CONTRIBUTORS
Nadia AmraniDepartment of Molecular Genetics and Microbiology, University of Massachusetts
Medical School, Worcester, Massachusetts
Katsura AsanoMolecular, Cellular, and Developmental Biology Program, Division of Biology,
Kansas State University, Manhattan, Kansas
Diane Barth-BausDepartment of Biochemistry, School ofMedicine, CaseWesternReserveUniversity,
Cleveland, Ohio
Stephen A. ChappellDepartment of Neurobiology, The Scripps Research Institute, and The Skaggs
Institute for Chemical Biology, La Jolla, California
Jeff CollerCenter for RNA Molecular Biology, Case Western Reserve University, Cleveland,
Ohio
Thomas E. DeverLaboratory of Gene Regulation and Development, National Institute of Child
Health and Human Development, National Institutes of Health, Bethesda,
Maryland
Tzvetanka D. DinkovaDepartamento de Bioquimica L-103, Facultad de Quimica Conjunto ‘‘E,’’ Paseo
de la Inv. Cientifica, Universidad Nacional Autonoma de Mexico, Mexico D.F.
John DresiosDepartment of Neurobiology, The Scripps Research Institute, and The Skaggs
Institute forChemical Biology, La Jolla, California; Science Applications International
Corporation, San Diego, California
Daniel R. GallieDepartment of Biochemistry, University of California, Riverside, California
Fatima GebauerCentre de Regulacio Genomica (CRG-UPF), Barcelona, Spain
xi

xii Contributors
Matthias W. HentzeGene Expression Unit, European Molecular Biology Laboratory, Heidelberg,
Germany
Alan G. HinnebuschNational Institute of Child Health and Human Development, National Institutes of
Health, Bethesda, Maryland
Allan JacobsonDepartment of Molecular Genetics and Microbiology, University of Massachusetts
Medical School, Worcester, Massachusetts
Rosemary JagusCenter of Marine Biotechnology, University of Maryland Biotechnology Institute,
Baltimore, Maryland
Paul LaskoDepartment of Biology and DBRI, McGill University, Montreal, Quebec, Canada
Bumjun LeeMolecular, Cellular, and Developmental Biology Program, Division of Biology,
Kansas State University, Manhattan, Kansas
Nicolas LockerMRC Laboratory of Molecular Biology, Cambridge, United Kingdom
Peter J. LukavskyMRC Laboratory of Molecular Biology, Cambridge, United Kingdom
Michael B. MathewsDepartment of Biochemistry and Molecular Biology, University of Medicine and
Dentistry of New Jersey, New Jersey Medical School, Newark, New Jersey
Vincent P. MauroDepartment of Neurobiology, The Scripps Research Institute, and The Skaggs
Institute for Chemical Biology, La Jolla, California
William C. MerrickDepartment of Biochemistry, School ofMedicine, CaseWesternReserveUniversity,
Cleveland, Ohio
Klaus H. NielsenDepartment of Molecular Biology, University of Arhus, Arhus C, Denmark
Andrew M. ParrottDepartment of Biochemistry and Molecular Biology, University of Medicine and
Dentistry of New Jersey, New Jersey Medical School, Newark, New Jersey

Contributors xiii
Chingakham Ranjit SinghMolecular, Cellular, and Developmental Biology Program, Division of Biology,
Kansas State University, Manhattan, Kansas
Robert E. RhoadsDepartment of Biochemistry and Molecular Biology, Louisiana State University
Health Sciences Center, Shreveport, Louisiana
Matthew S. SachsDepartment of Environmental and Biomolecular Systems, OGI School of Science
and Engineering, and Department of Molecular Microbiology and Immunology,
School of Medicine, Oregon Health and Science University, Portland, Oregon
Byung-Sik ShinLaboratory of Gene Regulation and Development, National Institute of Child
Health and Human Development, National Institutes of Health, Bethesda,
Maryland
Nahum SonenbergDepartment of Biochemistry and McGill Cancer Center, McGill University,
Montreal, Quebec, Canada
Yuri V. SvitkinDepartment of Biochemistry, McGill University, Montreal, Quebec, Canada
Bela SzameczInstitute of Microbiology, AS CR, Prague, Czech Republic
Gritta TettweilerDepartment of Biology and DBRI, McGill University, Montreal, Quebec, Canada
Tsuyoshi UdagawaMolecular, Cellular, and Developmental Biology Program, Division of Biology,
Kansas State University, Manhattan, Kansas
Leos ValasekInstitute of Microbiology, AS CR, Prague, Czech Republic
Melissa R. WalshDepartment of Biochemistry and Molecular Biology, University of Medicine and
Dentistry of New Jersey, New Jersey Medical School, Newark, New Jersey
Marv WickensDepartment of Biochemistry, University of Wisconsin, Madison, Wisconsin
Cheng WuDepartment of Environmental and Biomolecular Systems, OGI School of Science
and Engineering, Oregon Health and Science University, Beaverton, Oregon

PREFACE
Over the past 15 years, it has become clear that translation initiation is a keyregulatory point in the control of gene expression. Loss-of-control ofprotein synthesis has been implicated in a variety of diseases ranging fromcancer to viral infection, and there is increasing interest in the developmentof new drugs that target translation initiation. Despite the profoundbiological and medical importance of this key step in gene expression, weare only beginning to understand the molecular mechanics that underlietranslation initiation and its control, and much work remains to be done.
These MIE volumes (429, 430, and 431) are a compilation of currentapproaches used to dissect the basic mechanisms bywhich bacterial, archaeal,and eukaryotic cells assemble, and control the assembly of, ribosomal com-plexes at the initiation codon. Awide range of methods is presented from cellbiology to biophysics to chemical biology. It is clear that no one approachcan answer all of the important questions about translation initiation, and thatmajor advances will require collaborative efforts that bring together variousdisciplines. I hope that these volumes will facilitate cross-disciplinary think-ing and enable researchers from a wide variety of fields to explore aspects oftranslation initiation throughout biology.
Initially, we had planned to publish a single volume on this subject.However, the remarkable response to my requests for chapters allowed us toscale up to three volumes. I would like to express my sincerest appreciationand admiration for the contributors to this endeavor. I am impressed withthe outstanding quality of the work produced by the authors, all of whomare leaders in the field. I am especially grateful to John Abelson for giving methe opportunity to edit this publication and for his support and advicethroughout the project. Finally, I am indebted to Cindy Minor and thestaff at Elsevier for their help and wisdom along the way.
JON LORSCH
xv
METHODS IN ENZYMOLOGY
VOLUME I. Preparation and Assay of Enzymes
Edited by SIDNEY P. COLOWICK AND NATHAN O. KAPLAN
VOLUME II. Preparation and Assay of Enzymes
Edited by SIDNEY P. COLOWICK AND NATHAN O. KAPLAN
VOLUME III. Preparation and Assay of Substrates
Edited by SIDNEY P. COLOWICK AND NATHAN O. KAPLAN
VOLUME IV. Special Techniques for the Enzymologist
Edited by SIDNEY P. COLOWICK AND NATHAN O. KAPLAN
VOLUME V. Preparation and Assay of Enzymes
Edited by SIDNEY P. COLOWICK AND NATHAN O. KAPLAN
VOLUME VI. Preparation and Assay of Enzymes (Continued)
Preparation and Assay of Substrates
Special Techniques
Edited by SIDNEY P. COLOWICK AND NATHAN O. KAPLAN
VOLUME VII. Cumulative Subject Index
Edited by SIDNEY P. COLOWICK AND NATHAN O. KAPLAN
VOLUME VIII. Complex Carbohydrates
Edited by ELIZABETH F. NEUFELD AND VICTOR GINSBURG
VOLUME IX. Carbohydrate Metabolism
Edited by WILLIS A. WOOD
VOLUME X. Oxidation and Phosphorylation
Edited by RONALD W. ESTABROOK AND MAYNARD E. PULLMAN
VOLUME XI. Enzyme Structure
Edited by C. H. W. HIRS
VOLUME XII. Nucleic Acids (Parts A and B)
Edited by LAWRENCE GROSSMAN AND KIVIE MOLDAVE
VOLUME XIII. Citric Acid Cycle
Edited by J. M. LOWENSTEIN
VOLUME XIV. Lipids
Edited by J. M. LOWENSTEIN
VOLUME XV. Steroids and Terpenoids
Edited by RAYMOND B. CLAYTON
xvii
xviii Methods in Enzymology
VOLUME XVI. Fast Reactions
Edited by KENNETH KUSTIN
VOLUME XVII. Metabolism of Amino Acids and Amines (Parts A and B)
Edited by HERBERT TABOR AND CELIA WHITE TABOR
VOLUME XVIII. Vitamins and Coenzymes (Parts A, B, and C)
Edited by DONALD B. MCCORMICK AND LEMUEL D. WRIGHT
VOLUME XIX. Proteolytic Enzymes
Edited by GERTRUDE E. PERLMANN AND LASZLO LORAND
VOLUME XX. Nucleic Acids and Protein Synthesis (Part C)
Edited by KIVIE MOLDAVE AND LAWRENCE GROSSMAN
VOLUME XXI. Nucleic Acids (Part D)
Edited by LAWRENCE GROSSMAN AND KIVIE MOLDAVE
VOLUME XXII. Enzyme Purification and Related Techniques
Edited by WILLIAM B. JAKOBY
VOLUME XXIII. Photosynthesis (Part A)
Edited by ANTHONY SAN PIETRO
VOLUME XXIV. Photosynthesis and Nitrogen Fixation (Part B)
Edited by ANTHONY SAN PIETRO
VOLUME XXV. Enzyme Structure (Part B)
Edited by C. H. W. HIRS AND SERGE N. TIMASHEFF
VOLUME XXVI. Enzyme Structure (Part C)
Edited by C. H. W. HIRS AND SERGE N. TIMASHEFF
VOLUME XXVII. Enzyme Structure (Part D)
Edited by C. H. W. HIRS AND SERGE N. TIMASHEFF
VOLUME XXVIII. Complex Carbohydrates (Part B)
Edited by VICTOR GINSBURG
VOLUME XXIX. Nucleic Acids and Protein Synthesis (Part E)
Edited by LAWRENCE GROSSMAN AND KIVIE MOLDAVE
VOLUME XXX. Nucleic Acids and Protein Synthesis (Part F)
Edited by KIVIE MOLDAVE AND LAWRENCE GROSSMAN
VOLUME XXXI. Biomembranes (Part A)
Edited by SIDNEY FLEISCHER AND LESTER PACKER
VOLUME XXXII. Biomembranes (Part B)
Edited by SIDNEY FLEISCHER AND LESTER PACKER
VOLUME XXXIII. Cumulative Subject Index Volumes I-XXX
Edited by MARTHA G. DENNIS AND EDWARD A. DENNIS
VOLUME XXXIV. Affinity Techniques (Enzyme Purification: Part B)
Edited by WILLIAM B. JAKOBY AND MEIR WILCHEK

Methods in Enzymology xix
VOLUME XXXV. Lipids (Part B)
Edited by JOHN M. LOWENSTEIN
VOLUME XXXVI. Hormone Action (Part A: Steroid Hormones)
Edited by BERT W. O’MALLEY AND JOEL G. HARDMAN
VOLUME XXXVII. Hormone Action (Part B: Peptide Hormones)
Edited by BERT W. O’MALLEY AND JOEL G. HARDMAN
VOLUME XXXVIII. Hormone Action (Part C: Cyclic Nucleotides)
Edited by JOEL G. HARDMAN AND BERT W. O’MALLEY
VOLUME XXXIX. Hormone Action (Part D: Isolated Cells, Tissues,
and Organ Systems)
Edited by JOEL G. HARDMAN AND BERT W. O’MALLEY
VOLUME XL. Hormone Action (Part E: Nuclear Structure and Function)
Edited by BERT W. O’MALLEY AND JOEL G. HARDMAN
VOLUME XLI. Carbohydrate Metabolism (Part B)
Edited by W. A. WOOD
VOLUME XLII. Carbohydrate Metabolism (Part C)
Edited by W. A. WOOD
VOLUME XLIII. Antibiotics
Edited by JOHN H. HASH
VOLUME XLIV. Immobilized Enzymes
Edited by KLAUS MOSBACH
VOLUME XLV. Proteolytic Enzymes (Part B)
Edited by LASZLO LORAND
VOLUME XLVI. Affinity Labeling
Edited by WILLIAM B. JAKOBY AND MEIR WILCHEK
VOLUME XLVII. Enzyme Structure (Part E)
Edited by C. H. W. HIRS AND SERGE N. TIMASHEFF
VOLUME XLVIII. Enzyme Structure (Part F)
Edited by C. H. W. HIRS AND SERGE N. TIMASHEFF
VOLUME XLIX. Enzyme Structure (Part G)
Edited by C. H. W. HIRS AND SERGE N. TIMASHEFF
VOLUME L. Complex Carbohydrates (Part C)
Edited by VICTOR GINSBURG
VOLUME LI. Purine and Pyrimidine Nucleotide Metabolism
Edited by PATRICIA A. HOFFEE AND MARY ELLEN JONES
VOLUME LII. Biomembranes (Part C: Biological Oxidations)
Edited by SIDNEY FLEISCHER AND LESTER PACKER

xx Methods in Enzymology
VOLUME LIII. Biomembranes (Part D: Biological Oxidations)
Edited by SIDNEY FLEISCHER AND LESTER PACKER
VOLUME LIV. Biomembranes (Part E: Biological Oxidations)
Edited by SIDNEY FLEISCHER AND LESTER PACKER
VOLUME LV. Biomembranes (Part F: Bioenergetics)
Edited by SIDNEY FLEISCHER AND LESTER PACKER
VOLUME LVI. Biomembranes (Part G: Bioenergetics)
Edited by SIDNEY FLEISCHER AND LESTER PACKER
VOLUME LVII. Bioluminescence and Chemiluminescence
Edited by MARLENE A. DELUCA
VOLUME LVIII. Cell Culture
Edited by WILLIAM B. JAKOBY AND IRA PASTAN
VOLUME LIX. Nucleic Acids and Protein Synthesis (Part G)
Edited by KIVIE MOLDAVE AND LAWRENCE GROSSMAN
VOLUME LX. Nucleic Acids and Protein Synthesis (Part H)
Edited by KIVIE MOLDAVE AND LAWRENCE GROSSMAN
VOLUME 61. Enzyme Structure (Part H)
Edited by C. H. W. HIRS AND SERGE N. TIMASHEFF
VOLUME 62. Vitamins and Coenzymes (Part D)
Edited by DONALD B. MCCORMICK AND LEMUEL D. WRIGHT
VOLUME 63. Enzyme Kinetics and Mechanism (Part A: Initial Rate and
Inhibitor Methods)
Edited by DANIEL L. PURICH
VOLUME 64. Enzyme Kinetics and Mechanism
(Part B: Isotopic Probes and Complex Enzyme Systems)
Edited by DANIEL L. PURICH
VOLUME 65. Nucleic Acids (Part I)
Edited by LAWRENCE GROSSMAN AND KIVIE MOLDAVE
VOLUME 66. Vitamins and Coenzymes (Part E)
Edited by DONALD B. MCCORMICK AND LEMUEL D. WRIGHT
VOLUME 67. Vitamins and Coenzymes (Part F)
Edited by DONALD B. MCCORMICK AND LEMUEL D. WRIGHT
VOLUME 68. Recombinant DNA
Edited by RAY WU
VOLUME 69. Photosynthesis and Nitrogen Fixation (Part C)
Edited by ANTHONY SAN PIETRO
VOLUME 70. Immunochemical Techniques (Part A)
Edited by HELEN VAN VUNAKIS AND JOHN J. LANGONE
Methods in Enzymology xxi
VOLUME 71. Lipids (Part C)
Edited by JOHN M. LOWENSTEIN
VOLUME 72. Lipids (Part D)
Edited by JOHN M. LOWENSTEIN
VOLUME 73. Immunochemical Techniques (Part B)
Edited by JOHN J. LANGONE AND HELEN VAN VUNAKIS
VOLUME 74. Immunochemical Techniques (Part C)
Edited by JOHN J. LANGONE AND HELEN VAN VUNAKIS
VOLUME 75. Cumulative Subject Index Volumes XXXI, XXXII, XXXIV–LX
Edited by EDWARD A. DENNIS AND MARTHA G. DENNIS
VOLUME 76. Hemoglobins
Edited by ERALDO ANTONINI, LUIGI ROSSI-BERNARDI, AND EMILIA CHIANCONE
VOLUME 77. Detoxication and Drug Metabolism
Edited by WILLIAM B. JAKOBY
VOLUME 78. Interferons (Part A)
Edited by SIDNEY PESTKA
VOLUME 79. Interferons (Part B)
Edited by SIDNEY PESTKA
VOLUME 80. Proteolytic Enzymes (Part C)
Edited by LASZLO LORAND
VOLUME 81. Biomembranes (Part H: Visual Pigments and Purple Membranes, I)
Edited by LESTER PACKER
VOLUME 82. Structural and Contractile Proteins (Part A: Extracellular Matrix)
Edited by LEON W. CUNNINGHAM AND DIXIE W. FREDERIKSEN
VOLUME 83. Complex Carbohydrates (Part D)
Edited by VICTOR GINSBURG
VOLUME 84. Immunochemical Techniques (Part D: Selected Immunoassays)
Edited by JOHN J. LANGONE AND HELEN VAN VUNAKIS
VOLUME 85. Structural and Contractile Proteins (Part B: The Contractile Apparatus
and the Cytoskeleton)
Edited by DIXIE W. FREDERIKSEN AND LEON W. CUNNINGHAM
VOLUME 86. Prostaglandins and Arachidonate Metabolites
Edited by WILLIAM E. M. LANDS AND WILLIAM L. SMITH
VOLUME 87. Enzyme Kinetics and Mechanism (Part C: Intermediates,
Stereo-chemistry, and Rate Studies)
Edited by DANIEL L. PURICH
VOLUME 88. Biomembranes (Part I: Visual Pigments and Purple Membranes, II)
Edited by LESTER PACKER

xxii Methods in Enzymology
VOLUME 89. Carbohydrate Metabolism (Part D)
Edited by WILLIS A. WOOD
VOLUME 90. Carbohydrate Metabolism (Part E)
Edited by WILLIS A. WOOD
VOLUME 91. Enzyme Structure (Part I)
Edited by C. H. W. HIRS AND SERGE N. TIMASHEFF
VOLUME 92. Immunochemical Techniques (Part E: Monoclonal Antibodies and
General Immunoassay Methods)
Edited by JOHN J. LANGONE AND HELEN VAN VUNAKIS
VOLUME 93. Immunochemical Techniques (Part F: Conventional Antibodies, Fc
Receptors, and Cytotoxicity)
Edited by JOHN J. LANGONE AND HELEN VAN VUNAKIS
VOLUME 94. Polyamines
Edited by HERBERT TABOR AND CELIA WHITE TABOR
VOLUME 95. Cumulative Subject Index Volumes 61–74, 76–80
Edited by EDWARD A. DENNIS AND MARTHA G. DENNIS
VOLUME 96. Biomembranes [Part J: Membrane Biogenesis: Assembly and
Targeting (General Methods; Eukaryotes)]
Edited by SIDNEY FLEISCHER AND BECCA FLEISCHER
VOLUME 97. Biomembranes [Part K: Membrane Biogenesis: Assembly and
Targeting (Prokaryotes, Mitochondria, and Chloroplasts)]
Edited by SIDNEY FLEISCHER AND BECCA FLEISCHER
VOLUME 98. Biomembranes (Part L: Membrane Biogenesis: Processing
and Recycling)
Edited by SIDNEY FLEISCHER AND BECCA FLEISCHER
VOLUME 99. Hormone Action (Part F: Protein Kinases)
Edited by JACKIE D. CORBIN AND JOEL G. HARDMAN
VOLUME 100. Recombinant DNA (Part B)
Edited by RAY WU, LAWRENCE GROSSMAN, AND KIVIE MOLDAVE
VOLUME 101. Recombinant DNA (Part C)
Edited by RAY WU, LAWRENCE GROSSMAN, AND KIVIE MOLDAVE
VOLUME 102. Hormone Action (Part G: Calmodulin and
Calcium-Binding Proteins)
Edited by ANTHONY R. MEANS AND BERT W. O’MALLEY
VOLUME 103. Hormone Action (Part H: Neuroendocrine Peptides)
Edited by P. MICHAEL CONN
VOLUME 104. Enzyme Purification and Related Techniques (Part C)
Edited by WILLIAM B. JAKOBY

Methods in Enzymology xxiii
VOLUME 105. Oxygen Radicals in Biological Systems
Edited by LESTER PACKER
VOLUME 106. Posttranslational Modifications (Part A)
Edited by FINN WOLD AND KIVIE MOLDAVE
VOLUME 107. Posttranslational Modifications (Part B)
Edited by FINN WOLD AND KIVIE MOLDAVE
VOLUME 108. Immunochemical Techniques (Part G: Separation and
Characterization of Lymphoid Cells)
Edited by GIOVANNI DI SABATO, JOHN J. LANGONE, AND HELEN VAN VUNAKIS
VOLUME 109. Hormone Action (Part I: Peptide Hormones)
Edited by LUTZ BIRNBAUMER AND BERT W. O’MALLEY
VOLUME 110. Steroids and Isoprenoids (Part A)
Edited by JOHN H. LAW AND HANS C. RILLING
VOLUME 111. Steroids and Isoprenoids (Part B)
Edited by JOHN H. LAW AND HANS C. RILLING
VOLUME 112. Drug and Enzyme Targeting (Part A)
Edited by KENNETH J. WIDDER AND RALPH GREEN
VOLUME 113. Glutamate, Glutamine, Glutathione, and Related Compounds
Edited by ALTON MEISTER
VOLUME 114. Diffraction Methods for Biological Macromolecules (Part A)
Edited by HAROLD W. WYCKOFF, C. H. W. HIRS, AND SERGE N. TIMASHEFF
VOLUME 115. Diffraction Methods for Biological Macromolecules (Part B)
Edited by HAROLD W. WYCKOFF, C. H. W. HIRS, AND SERGE N. TIMASHEFF
VOLUME 116. Immunochemical Techniques
(Part H: Effectors and Mediators of Lymphoid Cell Functions)
Edited by GIOVANNI DI SABATO, JOHN J. LANGONE, AND HELEN VAN VUNAKIS
VOLUME 117. Enzyme Structure (Part J)
Edited by C. H. W. HIRS AND SERGE N. TIMASHEFF
VOLUME 118. Plant Molecular Biology
Edited by ARTHUR WEISSBACH AND HERBERT WEISSBACH
VOLUME 119. Interferons (Part C)
Edited by SIDNEY PESTKA
VOLUME 120. Cumulative Subject Index Volumes 81–94, 96–101
VOLUME 121. Immunochemical Techniques (Part I: Hybridoma Technology and
Monoclonal Antibodies)
Edited by JOHN J. LANGONE AND HELEN VAN VUNAKIS
VOLUME 122. Vitamins and Coenzymes (Part G)
Edited by FRANK CHYTIL AND DONALD B. MCCORMICK
xxiv Methods in Enzymology
VOLUME 123. Vitamins and Coenzymes (Part H)
Edited by FRANK CHYTIL AND DONALD B. MCCORMICK
VOLUME 124. Hormone Action (Part J: Neuroendocrine Peptides)
Edited by P. MICHAEL CONN
VOLUME 125. Biomembranes (Part M: Transport in Bacteria, Mitochondria, and
Chloroplasts: General Approaches and Transport Systems)
Edited by SIDNEY FLEISCHER AND BECCA FLEISCHER
VOLUME 126. Biomembranes (Part N: Transport in Bacteria, Mitochondria, and
Chloroplasts: Protonmotive Force)
Edited by SIDNEY FLEISCHER AND BECCA FLEISCHER
VOLUME 127. Biomembranes (Part O: Protons and Water: Structure
and Translocation)
Edited by LESTER PACKER
VOLUME 128. Plasma Lipoproteins (Part A: Preparation, Structure,
and Molecular Biology)
Edited by JERE P. SEGREST AND JOHN J. ALBERS
VOLUME 129. Plasma Lipoproteins (Part B: Characterization, Cell Biology,
and Metabolism)
Edited by JOHN J. ALBERS AND JERE P. SEGREST
VOLUME 130. Enzyme Structure (Part K)
Edited by C. H. W. HIRS AND SERGE N. TIMASHEFF
VOLUME 131. Enzyme Structure (Part L)
Edited by C. H. W. HIRS AND SERGE N. TIMASHEFF
VOLUME 132. Immunochemical Techniques (Part J: Phagocytosis and
Cell-Mediated Cytotoxicity)
Edited by GIOVANNI DI SABATO AND JOHANNES EVERSE
VOLUME 133. Bioluminescence and Chemiluminescence (Part B)
Edited by MARLENE DELUCA AND WILLIAM D. MCELROY
VOLUME 134. Structural and Contractile Proteins (Part C: The Contractile
Apparatus and the Cytoskeleton)
Edited by RICHARD B. VALLEE
VOLUME 135. Immobilized Enzymes and Cells (Part B)
Edited by KLAUS MOSBACH
VOLUME 136. Immobilized Enzymes and Cells (Part C)
Edited by KLAUS MOSBACH
VOLUME 137. Immobilized Enzymes and Cells (Part D)
Edited by KLAUS MOSBACH
VOLUME 138. Complex Carbohydrates (Part E)
Edited by VICTOR GINSBURG

Methods in Enzymology xxv
VOLUME 139. Cellular Regulators (Part A: Calcium- and
Calmodulin-Binding Proteins)
Edited by ANTHONY R. MEANS AND P. MICHAEL CONN
VOLUME 140. Cumulative Subject Index Volumes 102–119, 121–134
VOLUME 141. Cellular Regulators (Part B: Calcium and Lipids)
Edited by P. MICHAEL CONN AND ANTHONY R. MEANS
VOLUME 142. Metabolism of Aromatic Amino Acids and Amines
Edited by SEYMOUR KAUFMAN
VOLUME 143. Sulfur and Sulfur Amino Acids
Edited by WILLIAM B. JAKOBY AND OWEN GRIFFITH
VOLUME 144. Structural and Contractile Proteins (Part D: Extracellular Matrix)
Edited by LEON W. CUNNINGHAM
VOLUME 145. Structural and Contractile Proteins (Part E: Extracellular Matrix)
Edited by LEON W. CUNNINGHAM
VOLUME 146. Peptide Growth Factors (Part A)
Edited by DAVID BARNES AND DAVID A. SIRBASKU
VOLUME 147. Peptide Growth Factors (Part B)
Edited by DAVID BARNES AND DAVID A. SIRBASKU
VOLUME 148. Plant Cell Membranes
Edited by LESTER PACKER AND ROLAND DOUCE
VOLUME 149. Drug and Enzyme Targeting (Part B)
Edited by RALPH GREEN AND KENNETH J. WIDDER
VOLUME 150. Immunochemical Techniques (Part K: In Vitro Models of B and
T Cell Functions and Lymphoid Cell Receptors)
Edited by GIOVANNI DI SABATO
VOLUME 151. Molecular Genetics of Mammalian Cells
Edited by MICHAEL M. GOTTESMAN
VOLUME 152. Guide to Molecular Cloning Techniques
Edited by SHELBY L. BERGER AND ALAN R. KIMMEL
VOLUME 153. Recombinant DNA (Part D)
Edited by RAY WU AND LAWRENCE GROSSMAN
VOLUME 154. Recombinant DNA (Part E)
Edited by RAY WU AND LAWRENCE GROSSMAN
VOLUME 155. Recombinant DNA (Part F)
Edited by RAY WU
VOLUME 156. Biomembranes (Part P: ATP-Driven Pumps and Related Transport:
The Na, K-Pump)
Edited by SIDNEY FLEISCHER AND BECCA FLEISCHER

xxvi Methods in Enzymology
VOLUME 157. Biomembranes (Part Q: ATP-Driven Pumps and Related Transport:
Calcium, Proton, and Potassium Pumps)
Edited by SIDNEY FLEISCHER AND BECCA FLEISCHER
VOLUME 158. Metalloproteins (Part A)
Edited by JAMES F. RIORDAN AND BERT L. VALLEE
VOLUME 159. Initiation and Termination of Cyclic Nucleotide Action
Edited by JACKIE D. CORBIN AND ROGER A. JOHNSON
VOLUME 160. Biomass (Part A: Cellulose and Hemicellulose)
Edited by WILLIS A. WOOD AND SCOTT T. KELLOGG
VOLUME 161. Biomass (Part B: Lignin, Pectin, and Chitin)
Edited by WILLIS A. WOOD AND SCOTT T. KELLOGG
VOLUME 162. Immunochemical Techniques (Part L: Chemotaxis
and Inflammation)
Edited by GIOVANNI DI SABATO
VOLUME 163. Immunochemical Techniques (Part M: Chemotaxis
and Inflammation)
Edited by GIOVANNI DI SABATO
VOLUME 164. Ribosomes
Edited by HARRY F. NOLLER, JR., AND KIVIE MOLDAVE
VOLUME 165. Microbial Toxins: Tools for Enzymology
Edited by SIDNEY HARSHMAN
VOLUME 166. Branched-Chain Amino Acids
Edited by ROBERT HARRIS AND JOHN R. SOKATCH
VOLUME 167. Cyanobacteria
Edited by LESTER PACKER AND ALEXANDER N. GLAZER
VOLUME 168. Hormone Action (Part K: Neuroendocrine Peptides)
Edited by P. MICHAEL CONN
VOLUME 169. Platelets: Receptors, Adhesion, Secretion (Part A)
Edited by JACEK HAWIGER
VOLUME 170. Nucleosomes
Edited by PAUL M. WASSARMAN AND ROGER D. KORNBERG
VOLUME 171. Biomembranes (Part R: Transport Theory: Cells and Model
Membranes)
Edited by SIDNEY FLEISCHER AND BECCA FLEISCHER
VOLUME 172. Biomembranes (Part S: Transport: Membrane Isolation
and Characterization)
Edited by SIDNEY FLEISCHER AND BECCA FLEISCHER
Methods in Enzymology xxvii
VOLUME 173. Biomembranes [Part T: Cellular and Subcellular Transport:
Eukaryotic (Nonepithelial) Cells]
Edited by SIDNEY FLEISCHER AND BECCA FLEISCHER
VOLUME 174. Biomembranes [Part U: Cellular and Subcellular Transport:
Eukaryotic (Nonepithelial) Cells]
Edited by SIDNEY FLEISCHER AND BECCA FLEISCHER
VOLUME 175. Cumulative Subject Index Volumes 135–139, 141–167
VOLUME 176. Nuclear Magnetic Resonance (Part A: Spectral Techniques
and Dynamics)
Edited by NORMAN J. OPPENHEIMER AND THOMAS L. JAMES
VOLUME 177. Nuclear Magnetic Resonance (Part B: Structure and Mechanism)
Edited by NORMAN J. OPPENHEIMER AND THOMAS L. JAMES
VOLUME 178. Antibodies, Antigens, and Molecular Mimicry
Edited by JOHN J. LANGONE
VOLUME 179. Complex Carbohydrates (Part F)
Edited by VICTOR GINSBURG
VOLUME 180. RNA Processing (Part A: General Methods)
Edited by JAMES E. DAHLBERG AND JOHN N. ABELSON
VOLUME 181. RNA Processing (Part B: Specific Methods)
Edited by JAMES E. DAHLBERG AND JOHN N. ABELSON
VOLUME 182. Guide to Protein Purification
Edited by MURRAY P. DEUTSCHER
VOLUME 183. Molecular Evolution: Computer Analysis of Protein and
Nucleic Acid Sequences
Edited by RUSSELL F. DOOLITTLE
VOLUME 184. Avidin-Biotin Technology
Edited by MEIR WILCHEK AND EDWARD A. BAYER
VOLUME 185. Gene Expression Technology
Edited by DAVID V. GOEDDEL
VOLUME 186. Oxygen Radicals in Biological Systems (Part B: Oxygen Radicals and
Antioxidants)
Edited by LESTER PACKER AND ALEXANDER N. GLAZER
VOLUME 187. Arachidonate Related Lipid Mediators
Edited by ROBERT C. MURPHY AND FRANK A. FITZPATRICK
VOLUME 188. Hydrocarbons and Methylotrophy
Edited by MARY E. LIDSTROM
VOLUME 189. Retinoids (Part A: Molecular and Metabolic Aspects)
Edited by LESTER PACKER

xxviii Methods in Enzymology
VOLUME 190. Retinoids (Part B: Cell Differentiation and Clinical Applications)
Edited by LESTER PACKER
VOLUME 191. Biomembranes (Part V: Cellular and Subcellular Transport:
Epithelial Cells)
Edited by SIDNEY FLEISCHER AND BECCA FLEISCHER
VOLUME 192. Biomembranes (Part W: Cellular and Subcellular Transport:
Epithelial Cells)
Edited by SIDNEY FLEISCHER AND BECCA FLEISCHER
VOLUME 193. Mass Spectrometry
Edited by JAMES A. MCCLOSKEY
VOLUME 194. Guide to Yeast Genetics and Molecular Biology
Edited by CHRISTINE GUTHRIE AND GERALD R. FINK
VOLUME 195. Adenylyl Cyclase, G Proteins, and Guanylyl Cyclase
Edited by ROGER A. JOHNSON AND JACKIE D. CORBIN
VOLUME 196. Molecular Motors and the Cytoskeleton
Edited by RICHARD B. VALLEE
VOLUME 197. Phospholipases
Edited by EDWARD A. DENNIS
VOLUME 198. Peptide Growth Factors (Part C)
Edited by DAVID BARNES, J. P. MATHER, AND GORDON H. SATO
VOLUME 199. Cumulative Subject Index Volumes 168–174, 176–194
VOLUME 200. Protein Phosphorylation (Part A: Protein Kinases: Assays,
Purification, Antibodies, Functional Analysis, Cloning, and Expression)
Edited by TONY HUNTER AND BARTHOLOMEW M. SEFTON
VOLUME 201. Protein Phosphorylation (Part B: Analysis of Protein
Phosphorylation, Protein Kinase Inhibitors, and Protein Phosphatases)
Edited by TONY HUNTER AND BARTHOLOMEW M. SEFTON
VOLUME 202. Molecular Design and Modeling: Concepts and Applications
(Part A: Proteins, Peptides, and Enzymes)
Edited by JOHN J. LANGONE
VOLUME 203. Molecular Design and Modeling: Concepts and Applications
(Part B: Antibodies and Antigens, Nucleic Acids, Polysaccharides, and Drugs)
Edited by JOHN J. LANGONE
VOLUME 204. Bacterial Genetic Systems
Edited by JEFFREY H. MILLER
VOLUME 205. Metallobiochemistry (Part B: Metallothionein and
Related Molecules)
Edited by JAMES F. RIORDAN AND BERT L. VALLEE
Methods in Enzymology xxix
VOLUME 206. Cytochrome P450
Edited by MICHAEL R. WATERMAN AND ERIC F. JOHNSON
VOLUME 207. Ion Channels
Edited by BERNARDO RUDY AND LINDA E. IVERSON
VOLUME 208. Protein–DNA Interactions
Edited by ROBERT T. SAUER
VOLUME 209. Phospholipid Biosynthesis
Edited by EDWARD A. DENNIS AND DENNIS E. VANCE
VOLUME 210. Numerical Computer Methods
Edited by LUDWIG BRAND AND MICHAEL L. JOHNSON
VOLUME 211. DNA Structures (Part A: Synthesis and Physical Analysis of DNA)
Edited by DAVID M. J. LILLEY AND JAMES E. DAHLBERG
VOLUME 212. DNA Structures (Part B: Chemical and Electrophoretic
Analysis of DNA)
Edited by DAVID M. J. LILLEY AND JAMES E. DAHLBERG
VOLUME 213. Carotenoids (Part A: Chemistry, Separation, Quantitation,
and Antioxidation)
Edited by LESTER PACKER
VOLUME 214. Carotenoids (Part B: Metabolism, Genetics, and Biosynthesis)
Edited by LESTER PACKER
VOLUME 215. Platelets: Receptors, Adhesion, Secretion (Part B)
Edited by JACEK J. HAWIGER
VOLUME 216. Recombinant DNA (Part G)
Edited by RAY WU
VOLUME 217. Recombinant DNA (Part H)
Edited by RAY WU
VOLUME 218. Recombinant DNA (Part I)
Edited by RAY WU
VOLUME 219. Reconstitution of Intracellular Transport
Edited by JAMES E. ROTHMAN
VOLUME 220. Membrane Fusion Techniques (Part A)
Edited by NEJAT DUZGUNES,
VOLUME 221. Membrane Fusion Techniques (Part B)
Edited by NEJAT DUZGUNES,
VOLUME 222. Proteolytic Enzymes in Coagulation, Fibrinolysis, and Complement
Activation (Part A: Mammalian Blood Coagulation Factors and Inhibitors)
Edited by LASZLO LORAND AND KENNETH G. MANN

xxx Methods in Enzymology
VOLUME 223. Proteolytic Enzymes in Coagulation, Fibrinolysis, and Complement
Activation (Part B: Complement Activation, Fibrinolysis, and Nonmammalian
Blood Coagulation Factors)
Edited by LASZLO LORAND AND KENNETH G. MANN
VOLUME 224. Molecular Evolution: Producing the Biochemical Data
Edited by ELIZABETH ANNE ZIMMER, THOMAS J. WHITE, REBECCA L. CANN,
AND ALLAN C. WILSON
VOLUME 225. Guide to Techniques in Mouse Development
Edited by PAUL M. WASSARMAN AND MELVIN L. DEPAMPHILIS
VOLUME 226. Metallobiochemistry (Part C: Spectroscopic and Physical Methods
for Probing Metal Ion Environments in Metalloenzymes and Metalloproteins)
Edited by JAMES F. RIORDAN AND BERT L. VALLEE
VOLUME 227. Metallobiochemistry (Part D: Physical and Spectroscopic Methods
for Probing Metal Ion Environments in Metalloproteins)
Edited by JAMES F. RIORDAN AND BERT L. VALLEE
VOLUME 228. Aqueous Two-Phase Systems
Edited by HARRY WALTER AND GOTE JOHANSSON
VOLUME 229. Cumulative Subject Index Volumes 195–198, 200–227
VOLUME 230. Guide to Techniques in Glycobiology
Edited by WILLIAM J. LENNARZ AND GERALD W. HART
VOLUME 231. Hemoglobins (Part B: Biochemical and Analytical Methods)
Edited by JOHANNES EVERSE, KIM D. VANDEGRIFF, AND ROBERT M. WINSLOW
VOLUME 232. Hemoglobins (Part C: Biophysical Methods)
Edited by JOHANNES EVERSE, KIM D. VANDEGRIFF, AND ROBERT M. WINSLOW
VOLUME 233. Oxygen Radicals in Biological Systems (Part C)
Edited by LESTER PACKER
VOLUME 234. Oxygen Radicals in Biological Systems (Part D)
Edited by LESTER PACKER
VOLUME 235. Bacterial Pathogenesis (Part A: Identification and Regulation of
Virulence Factors)
Edited by VIRGINIA L. CLARK AND PATRIK M. BAVOIL
VOLUME 236. Bacterial Pathogenesis (Part B: Integration of Pathogenic Bacteria
with Host Cells)
Edited by VIRGINIA L. CLARK AND PATRIK M. BAVOIL
VOLUME 237. Heterotrimeric G Proteins
Edited by RAVI IYENGAR
VOLUME 238. Heterotrimeric G-Protein Effectors
Edited by RAVI IYENGAR

Methods in Enzymology xxxi
VOLUME 239. Nuclear Magnetic Resonance (Part C)
Edited by THOMAS L. JAMES AND NORMAN J. OPPENHEIMER
VOLUME 240. Numerical Computer Methods (Part B)
Edited by MICHAEL L. JOHNSON AND LUDWIG BRAND
VOLUME 241. Retroviral Proteases
Edited by LAWRENCE C. KUO AND JULES A. SHAFER
VOLUME 242. Neoglycoconjugates (Part A)
Edited by Y. C. LEE AND REIKO T. LEE
VOLUME 243. Inorganic Microbial Sulfur Metabolism
Edited by HARRY D. PECK, JR., AND JEAN LEGALL
VOLUME 244. Proteolytic Enzymes: Serine and Cysteine Peptidases
Edited by ALAN J. BARRETT
VOLUME 245. Extracellular Matrix Components
Edited by E. RUOSLAHTI AND E. ENGVALL
VOLUME 246. Biochemical Spectroscopy
Edited by KENNETH SAUER
VOLUME 247. Neoglycoconjugates (Part B: Biomedical Applications)
Edited by Y. C. LEE AND REIKO T. LEE
VOLUME 248. Proteolytic Enzymes: Aspartic and Metallo Peptidases
Edited by ALAN J. BARRETT
VOLUME 249. Enzyme Kinetics and Mechanism (Part D: Developments in
Enzyme Dynamics)
Edited by DANIEL L. PURICH
VOLUME 250. Lipid Modifications of Proteins
Edited by PATRICK J. CASEY AND JANICE E. BUSS
VOLUME 251. Biothiols (Part A: Monothiols and Dithiols, Protein Thiols, and
Thiyl Radicals)
Edited by LESTER PACKER
VOLUME 252. Biothiols (Part B: Glutathione and Thioredoxin; Thiols in Signal
Transduction and Gene Regulation)
Edited by LESTER PACKER
VOLUME 253. Adhesion of Microbial Pathogens
Edited by RON J. DOYLE AND ITZHAK OFEK
VOLUME 254. Oncogene Techniques
Edited by PETER K. VOGT AND INDER M. VERMA
VOLUME 255. Small GTPases and Their Regulators (Part A: Ras Family)
Edited by W. E. BALCH, CHANNING J. DER, AND ALAN HALL
VOLUME 256. Small GTPases and Their Regulators (Part B: Rho Family)
Edited by W. E. BALCH, CHANNING J. DER, AND ALAN HALL

xxxii Methods in Enzymology
VOLUME 257. Small GTPases and Their Regulators (Part C: Proteins Involved
in Transport)
Edited by W. E. BALCH, CHANNING J. DER, AND ALAN HALL
VOLUME 258. Redox-Active Amino Acids in Biology
Edited by JUDITH P. KLINMAN
VOLUME 259. Energetics of Biological Macromolecules
Edited by MICHAEL L. JOHNSON AND GARY K. ACKERS
VOLUME 260. Mitochondrial Biogenesis and Genetics (Part A)
Edited by GIUSEPPE M. ATTARDI AND ANNE CHOMYN
VOLUME 261. Nuclear Magnetic Resonance and Nucleic Acids
Edited by THOMAS L. JAMES
VOLUME 262. DNA Replication
Edited by JUDITH L. CAMPBELL
VOLUME 263. Plasma Lipoproteins (Part C: Quantitation)
Edited by WILLIAM A. BRADLEY, SANDRA H. GIANTURCO, AND JERE P. SEGREST
VOLUME 264. Mitochondrial Biogenesis and Genetics (Part B)
Edited by GIUSEPPE M. ATTARDI AND ANNE CHOMYN
VOLUME 265. Cumulative Subject Index Volumes 228, 230–262
VOLUME 266. Computer Methods for Macromolecular Sequence Analysis
Edited by RUSSELL F. DOOLITTLE
VOLUME 267. Combinatorial Chemistry
Edited by JOHN N. ABELSON
VOLUME 268. Nitric Oxide (Part A: Sources and Detection of NO; NO Synthase)
Edited by LESTER PACKER
VOLUME 269. Nitric Oxide (Part B: Physiological and Pathological Processes)
Edited by LESTER PACKER
VOLUME 270. High Resolution Separation and Analysis of Biological
Macromolecules (Part A: Fundamentals)
Edited by BARRY L. KARGER AND WILLIAM S. HANCOCK
VOLUME 271. High Resolution Separation and Analysis of Biological
Macromolecules (Part B: Applications)
Edited by BARRY L. KARGER AND WILLIAM S. HANCOCK
VOLUME 272. Cytochrome P450 (Part B)
Edited by ERIC F. JOHNSON AND MICHAEL R. WATERMAN
VOLUME 273. RNA Polymerase and Associated Factors (Part A)
Edited by SANKAR ADHYA
VOLUME 274. RNA Polymerase and Associated Factors (Part B)
Edited by SANKAR ADHYA
Methods in Enzymology xxxiii
VOLUME 275. Viral Polymerases and Related Proteins
Edited by LAWRENCE C. KUO, DAVID B. OLSEN, AND STEVEN S. CARROLL
VOLUME 276. Macromolecular Crystallography (Part A)
Edited by CHARLES W. CARTER, JR., AND ROBERT M. SWEET
VOLUME 277. Macromolecular Crystallography (Part B)
Edited by CHARLES W. CARTER, JR., AND ROBERT M. SWEET
VOLUME 278. Fluorescence Spectroscopy
Edited by LUDWIG BRAND AND MICHAEL L. JOHNSON
VOLUME 279. Vitamins and Coenzymes (Part I)
Edited by DONALD B. MCCORMICK, JOHN W. SUTTIE, AND CONRAD WAGNER
VOLUME 280. Vitamins and Coenzymes (Part J)
Edited by DONALD B. MCCORMICK, JOHN W. SUTTIE, AND CONRAD WAGNER
VOLUME 281. Vitamins and Coenzymes (Part K)
Edited by DONALD B. MCCORMICK, JOHN W. SUTTIE, AND CONRAD WAGNER
VOLUME 282. Vitamins and Coenzymes (Part L)
Edited by DONALD B. MCCORMICK, JOHN W. SUTTIE, AND CONRAD WAGNER
VOLUME 283. Cell Cycle Control
Edited by WILLIAM G. DUNPHY
VOLUME 284. Lipases (Part A: Biotechnology)
Edited by BYRON RUBIN AND EDWARD A. DENNIS
VOLUME 285. Cumulative Subject Index Volumes 263, 264, 266–284, 286–289
VOLUME 286. Lipases (Part B: Enzyme Characterization and Utilization)
Edited by BYRON RUBIN AND EDWARD A. DENNIS
VOLUME 287. Chemokines
Edited by RICHARD HORUK
VOLUME 288. Chemokine Receptors
Edited by RICHARD HORUK
VOLUME 289. Solid Phase Peptide Synthesis
Edited by GREGG B. FIELDS
VOLUME 290. Molecular Chaperones
Edited by GEORGE H. LORIMER AND THOMAS BALDWIN
VOLUME 291. Caged Compounds
Edited by GERARD MARRIOTT
VOLUME 292. ABC Transporters: Biochemical, Cellular, and Molecular Aspects
Edited by SURESH V. AMBUDKAR AND MICHAEL M. GOTTESMAN
VOLUME 293. Ion Channels (Part B)
Edited by P. MICHAEL CONN
xxxiv Methods in Enzymology
VOLUME 294. Ion Channels (Part C)
Edited by P. MICHAEL CONN
VOLUME 295. Energetics of Biological Macromolecules (Part B)
Edited by GARY K. ACKERS AND MICHAEL L. JOHNSON
VOLUME 296. Neurotransmitter Transporters
Edited by SUSAN G. AMARA
VOLUME 297. Photosynthesis: Molecular Biology of Energy Capture
Edited by LEE MCINTOSH
VOLUME 298. Molecular Motors and the Cytoskeleton (Part B)
Edited by RICHARD B. VALLEE
VOLUME 299. Oxidants and Antioxidants (Part A)
Edited by LESTER PACKER
VOLUME 300. Oxidants and Antioxidants (Part B)
Edited by LESTER PACKER
VOLUME 301. Nitric Oxide: Biological and Antioxidant Activities (Part C)
Edited by LESTER PACKER
VOLUME 302. Green Fluorescent Protein
Edited by P. MICHAEL CONN
VOLUME 303. cDNA Preparation and Display
Edited by SHERMAN M. WEISSMAN
VOLUME 304. Chromatin
Edited by PAUL M. WASSARMAN AND ALAN P. WOLFFE
VOLUME 305. Bioluminescence and Chemiluminescence (Part C)
Edited by THOMAS O. BALDWIN AND MIRIAM M. ZIEGLER
VOLUME 306. Expression of Recombinant Genes in Eukaryotic Systems
Edited by JOSEPH C. GLORIOSO AND MARTIN C. SCHMIDT
VOLUME 307. Confocal Microscopy
Edited by P. MICHAEL CONN
VOLUME 308. Enzyme Kinetics and Mechanism (Part E: Energetics of
Enzyme Catalysis)
Edited by DANIEL L. PURICH AND VERN L. SCHRAMM
VOLUME 309. Amyloid, Prions, and Other Protein Aggregates
Edited by RONALD WETZEL
VOLUME 310. Biofilms
Edited by RON J. DOYLE
VOLUME 311. Sphingolipid Metabolism and Cell Signaling (Part A)
Edited by ALFRED H. MERRILL, JR., AND YUSUF A. HANNUN

Methods in Enzymology xxxv
VOLUME 312. Sphingolipid Metabolism and Cell Signaling (Part B)
Edited by ALFRED H. MERRILL, JR., AND YUSUF A. HANNUN
VOLUME 313. Antisense Technology (Part A: General Methods, Methods of
Delivery, and RNA Studies)
Edited by M. IAN PHILLIPS
VOLUME 314. Antisense Technology (Part B: Applications)
Edited by M. IAN PHILLIPS
VOLUME 315. Vertebrate Phototransduction and the Visual Cycle (Part A)
Edited by KRZYSZTOF PALCZEWSKI
VOLUME 316. Vertebrate Phototransduction and the Visual Cycle (Part B)
Edited by KRZYSZTOF PALCZEWSKI
VOLUME 317. RNA–Ligand Interactions (Part A: Structural Biology Methods)
Edited by DANIEL W. CELANDER AND JOHN N. ABELSON
VOLUME 318. RNA–Ligand Interactions (Part B: Molecular Biology Methods)
Edited by DANIEL W. CELANDER AND JOHN N. ABELSON
VOLUME 319. Singlet Oxygen, UV-A, and Ozone
Edited by LESTER PACKER AND HELMUT SIES
VOLUME 320. Cumulative Subject Index Volumes 290–319
VOLUME 321. Numerical Computer Methods (Part C)
Edited by MICHAEL L. JOHNSON AND LUDWIG BRAND
VOLUME 322. Apoptosis
Edited by JOHN C. REED
VOLUME 323. Energetics of Biological Macromolecules (Part C)
Edited by MICHAEL L. JOHNSON AND GARY K. ACKERS
VOLUME 324. Branched-Chain Amino Acids (Part B)
Edited by ROBERT A. HARRIS AND JOHN R. SOKATCH
VOLUME 325. Regulators and Effectors of Small GTPases (Part D: Rho Family)
Edited by W. E. BALCH, CHANNING J. DER, AND ALAN HALL
VOLUME 326. Applications of Chimeric Genes and Hybrid Proteins (Part A: Gene
Expression and Protein Purification)
Edited by JEREMY THORNER, SCOTT D. EMR, AND JOHN N. ABELSON
VOLUME 327. Applications of Chimeric Genes and Hybrid Proteins (Part B: Cell
Biology and Physiology)
Edited by JEREMY THORNER, SCOTT D. EMR, AND JOHN N. ABELSON
VOLUME 328. Applications of Chimeric Genes and Hybrid Proteins (Part C:
Protein–Protein Interactions and Genomics)
Edited by JEREMY THORNER, SCOTT D. EMR, AND JOHN N. ABELSON

xxxvi Methods in Enzymology
VOLUME 329. Regulators and Effectors of Small GTPases (Part E: GTPases
Involved in Vesicular Traffic)
Edited by W. E. BALCH, CHANNING J. DER, AND ALAN HALL
VOLUME 330. Hyperthermophilic Enzymes (Part A)
Edited by MICHAEL W. W. ADAMS AND ROBERT M. KELLY
VOLUME 331. Hyperthermophilic Enzymes (Part B)
Edited by MICHAEL W. W. ADAMS AND ROBERT M. KELLY
VOLUME 332. Regulators and Effectors of Small GTPases (Part F: Ras Family I)
Edited by W. E. BALCH, CHANNING J. DER, AND ALAN HALL
VOLUME 333. Regulators and Effectors of Small GTPases (Part G: Ras Family II)
Edited byW. E. BALCH, CHANNING J. DER, AND ALAN HALL
VOLUME 334. Hyperthermophilic Enzymes (Part C)
Edited by MICHAEL W. W. ADAMS AND ROBERT M. KELLY
VOLUME 335. Flavonoids and Other Polyphenols
Edited by LESTER PACKER
VOLUME 336. Microbial Growth in Biofilms (Part A: Developmental and
Molecular Biological Aspects)
Edited by RON J. DOYLE
VOLUME 337. Microbial Growth in Biofilms (Part B: Special Environments and
Physicochemical Aspects)
Edited by RON J. DOYLE
VOLUME 338. Nuclear Magnetic Resonance of Biological Macromolecules (Part A)
Edited by THOMAS L. JAMES, VOLKER DOTSCH, AND ULI SCHMITZ
VOLUME 339. Nuclear Magnetic Resonance of Biological Macromolecules (Part B)
Edited by THOMAS L. JAMES, VOLKER DOTSCH, AND ULI SCHMITZ
VOLUME 340. Drug–Nucleic Acid Interactions
Edited by JONATHAN B. CHAIRES AND MICHAEL J. WARING
VOLUME 341. Ribonucleases (Part A)
Edited by ALLEN W. NICHOLSON
VOLUME 342. Ribonucleases (Part B)
Edited by ALLEN W. NICHOLSON
VOLUME 343. G Protein Pathways (Part A: Receptors)
Edited by RAVI IYENGAR AND JOHN D. HILDEBRANDT
VOLUME 344. G Protein Pathways (Part B: G Proteins and Their Regulators)
Edited by RAVI IYENGAR AND JOHN D. HILDEBRANDT
VOLUME 345. G Protein Pathways (Part C: Effector Mechanisms)
Edited by RAVI IYENGAR AND JOHN D. HILDEBRANDT

Methods in Enzymology xxxvii
VOLUME 346. Gene Therapy Methods
Edited by M. IAN PHILLIPS
VOLUME 347. Protein Sensors and Reactive Oxygen Species (Part A:
Selenoproteins and Thioredoxin)
Edited by HELMUT SIES AND LESTER PACKER
VOLUME 348. Protein Sensors and Reactive Oxygen Species (Part B:
Thiol Enzymes and Proteins)
Edited by HELMUT SIES AND LESTER PACKER
VOLUME 349. Superoxide Dismutase
Edited by LESTER PACKER
VOLUME 350. Guide to Yeast Genetics and Molecular and Cell Biology (Part B)
Edited by CHRISTINE GUTHRIE AND GERALD R. FINK
VOLUME 351. Guide to Yeast Genetics and Molecular and Cell Biology (Part C)
Edited by CHRISTINE GUTHRIE AND GERALD R. FINK
VOLUME 352. Redox Cell Biology and Genetics (Part A)
Edited by CHANDAN K. SEN AND LESTER PACKER
VOLUME 353. Redox Cell Biology and Genetics (Part B)
Edited by CHANDAN K. SEN AND LESTER PACKER
VOLUME 354. Enzyme Kinetics and Mechanisms (Part F: Detection and
Characterization of Enzyme Reaction Intermediates)
Edited by DANIEL L. PURICH
VOLUME 355. Cumulative Subject Index Volumes 321–354
VOLUME 356. Laser Capture Microscopy and Microdissection
Edited by P. MICHAEL CONN
VOLUME 357. Cytochrome P450, Part C
Edited by ERIC F. JOHNSON AND MICHAEL R. WATERMAN
VOLUME 358. Bacterial Pathogenesis (Part C: Identification, Regulation, and
Function of Virulence Factors)
Edited by VIRGINIA L. CLARK AND PATRIK M. BAVOIL
VOLUME 359. Nitric Oxide (Part D)
Edited by ENRIQUE CADENAS AND LESTER PACKER
VOLUME 360. Biophotonics (Part A)
Edited by GERARD MARRIOTT AND IAN PARKER
VOLUME 361. Biophotonics (Part B)
Edited by GERARD MARRIOTT AND IAN PARKER
VOLUME 362. Recognition of Carbohydrates in Biological Systems (Part A)
Edited by YUAN C. LEE AND REIKO T. LEE

xxxviii Methods in Enzymology
VOLUME 363. Recognition of Carbohydrates in Biological Systems (Part B)
Edited by YUAN C. LEE AND REIKO T. LEE
VOLUME 364. Nuclear Receptors
Edited by DAVID W. RUSSELL AND DAVID J. MANGELSDORF
VOLUME 365. Differentiation of Embryonic Stem Cells
Edited by PAUL M. WASSAUMAN AND GORDON M. KELLER
VOLUME 366. Protein Phosphatases
Edited by SUSANNE KLUMPP AND JOSEF KRIEGLSTEIN
VOLUME 367. Liposomes (Part A)
Edited by NEJAT DUZGUNES,
VOLUME 368. Macromolecular Crystallography (Part C)
Edited by CHARLES W. CARTER, JR., AND ROBERT M. SWEET
VOLUME 369. Combinational Chemistry (Part B)
Edited by GUILLERMO A. MORALES AND BARRY A. BUNIN
VOLUME 370. RNA Polymerases and Associated Factors (Part C)
Edited by SANKAR L. ADHYA AND SUSAN GARGES
VOLUME 371. RNA Polymerases and Associated Factors (Part D)
Edited by SANKAR L. ADHYA AND SUSAN GARGES
VOLUME 372. Liposomes (Part B)
Edited by NEJAT DUZGUNES,
VOLUME 373. Liposomes (Part C)
Edited by NEJAT DUZGUNES,
VOLUME 374. Macromolecular Crystallography (Part D)
Edited by CHARLES W. CARTER, JR., AND ROBERT W. SWEET
VOLUME 375. Chromatin and Chromatin Remodeling Enzymes (Part A)
Edited by C. DAVID ALLIS AND CARL WU
VOLUME 376. Chromatin and Chromatin Remodeling Enzymes (Part B)
Edited by C. DAVID ALLIS AND CARL WU
VOLUME 377. Chromatin and Chromatin Remodeling Enzymes (Part C)
Edited by C. DAVID ALLIS AND CARL WU
VOLUME 378. Quinones and Quinone Enzymes (Part A)
Edited by HELMUT SIES AND LESTER PACKER
VOLUME 379. Energetics of Biological Macromolecules (Part D)
Edited by JO M. HOLT, MICHAEL L. JOHNSON, AND GARY K. ACKERS
VOLUME 380. Energetics of Biological Macromolecules (Part E)
Edited by JO M. HOLT, MICHAEL L. JOHNSON, AND GARY K. ACKERS
VOLUME 381. Oxygen Sensing
Edited by CHANDAN K. SEN AND GREGG L. SEMENZA

Methods in Enzymology xxxix
VOLUME 382. Quinones and Quinone Enzymes (Part B)
Edited by HELMUT SIES AND LESTER PACKER
VOLUME 383. Numerical Computer Methods (Part D)
Edited by LUDWIG BRAND AND MICHAEL L. JOHNSON
VOLUME 384. Numerical Computer Methods (Part E)
Edited by LUDWIG BRAND AND MICHAEL L. JOHNSON
VOLUME 385. Imaging in Biological Research (Part A)
Edited by P. MICHAEL CONN
VOLUME 386. Imaging in Biological Research (Part B)
Edited by P. MICHAEL CONN
VOLUME 387. Liposomes (Part D)
Edited by NEJAT DUZGUNES,
VOLUME 388. Protein Engineering
Edited by DAN E. ROBERTSON AND JOSEPH P. NOEL
VOLUME 389. Regulators of G-Protein Signaling (Part A)
Edited by DAVID P. SIDEROVSKI
VOLUME 390. Regulators of G-Protein Signaling (Part B)
Edited by DAVID P. SIDEROVSKI
VOLUME 391. Liposomes (Part E)
Edited by NEJAT DUZGUNES,
VOLUME 392. RNA Interference
Edited by ENGELKE ROSSI
VOLUME 393. Circadian Rhythms
Edited by MICHAEL W. YOUNG
VOLUME 394. Nuclear Magnetic Resonance of Biological Macromolecules (Part C)
Edited by THOMAS L. JAMES
VOLUME 395. Producing the Biochemical Data (Part B)
Edited by ELIZABETH A. ZIMMER AND ERIC H. ROALSON
VOLUME 396. Nitric Oxide (Part E)
Edited by LESTER PACKER AND ENRIQUE CADENAS
VOLUME 397. Environmental Microbiology
Edited by JARED R. LEADBETTER
VOLUME 398. Ubiquitin and Protein Degradation (Part A)
Edited by RAYMOND J. DESHAIES
VOLUME 399. Ubiquitin and Protein Degradation (Part B)
Edited by RAYMOND J. DESHAIES
VOLUME 400. Phase II Conjugation Enzymes and Transport Systems
Edited by HELMUT SIES AND LESTER PACKER

xl Methods in Enzymology
VOLUME 401. Glutathione Transferases and Gamma Glutamyl Transpeptidases
Edited by HELMUT SIES AND LESTER PACKER
VOLUME 402. Biological Mass Spectrometry
Edited by A. L. BURLINGAME
VOLUME 403. GTPases Regulating Membrane Targeting and Fusion
Edited by WILLIAM E. BALCH, CHANNING J. DER, AND ALAN HALL
VOLUME 404. GTPases Regulating Membrane Dynamics
Edited by WILLIAM E. BALCH, CHANNING J. DER, AND ALAN HALL
VOLUME 405. Mass Spectrometry: Modified Proteins and Glycoconjugates
Edited by A. L. BURLINGAME
VOLUME 406. Regulators and Effectors of Small GTPases: Rho Family
Edited by WILLIAM E. BALCH, CHANNING J. DER, AND ALAN HALL
VOLUME 407. Regulators and Effectors of Small GTPases: Ras Family
Edited by WILLIAM E. BALCH, CHANNING J. DER, AND ALAN HALL
VOLUME 408. DNA Repair (Part A)
Edited by JUDITH L. CAMPBELL AND PAUL MODRICH
VOLUME 409. DNA Repair (Part B)
Edited by JUDITH L. CAMPBELL AND PAUL MODRICH
VOLUME 410. DNA Microarrays (Part A: Array Platforms and
Web-Bench Protocols)
Edited by ALAN KIMMEL AND BRIAN OLIVER
VOLUME 411. DNA Microarrays (Part B: Databases and Statistics)
Edited by ALAN KIMMEL AND BRIAN OLIVER
VOLUME 412. Amyloid, Prions, and Other Protein Aggregates (Part B)
Edited by INDU KHETERPAL AND RONALD WETZEL
VOLUME 413. Amyloid, Prions, and Other Protein Aggregates (Part C)
Edited by INDU KHETERPAL AND RONALD WETZEL
VOLUME 414. Measuring Biological Responses with Automated Microscopy
Edited by JAMES INGLESE
VOLUME 415. Glycobiology
Edited by MINORU FUKUDA
VOLUME 416. Glycomics
Edited by MINORU FUKUDA
VOLUME 417. Functional Glycomics
Edited by MINORU FUKUDA
VOLUME 418. Embryonic Stem Cells
Edited by IRINA KLIMANSKAYA AND ROBERT LANZA
VOLUME 419. Adult Stem Cells
Edited by IRINA KLIMANSKAYA AND ROBERT LANZA
Methods in Enzymology xli
VOLUME 420. Stem Cell Tools and Other Experimental Protocols
Edited by IRINA KLIMANSKAYA AND ROBERT LANZA
VOLUME 421. Advanced Bacterial Genetics: Use of Transposons and Phage for
Genomic Engineering
Edited by KELLY T. HUGHES
VOLUME 422. Two-Component Signaling Systems, Part A
Edited by MELVIN I. SIMON, BRIAN R. CRANE, AND ALEXANDRINE CRANE
VOLUME 423. Two-Component Signaling Systems, Part B
Edited by MELVIN I. SIMON, BRIAN R. CRANE, AND ALEXANDRINE CRANE
VOLUME 424. RNA Editing
Edited by JONATHA M. GOTT
VOLUME 425. RNA Modification
Edited by JONATHA M. GOTT
VOLUME 426. Integrins
Edited by DAVID A. CHERESH
VOLUME 427. MicroRNA Methods
Edited by JOHN J. ROSSI
VOLUME 428. Osmosensing and Osmosignaling
Edited by HELMUT SIES AND DIETER HAUSSINGER
VOLUME 429. Translation Initiation: Extract Systems and Molecular Genetics
Edited by JON LORSCH
VOLUME 430. Translation Initiation: Reconstituted Systems and Biophysical
Methods (in preparation)
Edited by JON LORSCH
VOLUME 431. Translation Initiation: Cell Biology, High-Throughput Methods,
and Chemical-Based Approaches (in preparation)
Edited by JON LORSCH
VOLUME 432. Lipidomics and Bioactive Lipids: Mass-Spectrometry–Based
Lipid Analysis (in preparation)
Edited by H. ALEX BROWN
VOLUME 433. Lipidomics and Bioactive Lipids: Specialized Analytical Methods and
Lipids in Disease (in preparation)
Edited by H. ALEX BROWN
VOLUME 434. Lipidomics and Bioactive Lipids: Lipids and Cell
Signaling (in preparation)
Edited by H. ALEX BROWN
VOLUME 435. Oxygen Biology and Hypoxia (in preparation)
Edited by HELMUT SIES AND BERNHARD BRUNE

xlii Methods in Enzymology
VOLUME 436. Globins and Other Nitric Oxide-Reactive Proteins, Part A
(in preparation)
Edited by ROBERT K. POOLE
VOLUME 437. Globins and Other Nitric Oxide-Reactive Proteins, Part B
(in preparation)
Edited by ROBERT K. POOLE

C H A P T E R O N E
M
IS
D
ethods
SN 0
epartm
Use of Reticulocyte Lysates forMechanistic Studies of EukaryoticTranslation Initiation
William C. Merrick and Diane Barth-Baus
Contents
1. In
in
076
en
troduction
Enzymology, Volume 429 # 2007
-6879, DOI: 10.1016/S0076-6879(07)29001-9 All rig
t of Biochemistry, School of Medicine, Case Western Reserve University, Cleveland
Else
hts
, O
2
2. M
aterials 32
.1. N uclease-treated reticulocyte lysates 32
.2. tR NA 32
.3. m RNA 33. M
ethods 43
.1. P reparation of tRNA 43
.2. P reparation of mRNA 54. T
ranslation of an mRNA to Yield a Radioactive Product 55. Q
uantitation of Reaction Products 66. O
ptimization of Translations 87. R
eporter Proteins for Translation 108. E
xperimental Use of Nuclease-Treated Lysates 118
.1. In itiation mechanisms 118
.2. C ompetition between mRNAs 128
.3. S ynthesis of proteins of high specific radioactivity 138
.4. In fluence of variations of factor activity 138
.5. S ucrose gradients 168
.6. T oe printing 18Refe
rences 19Abstract
This chapter describes how commercially available, nuclease-treated rabbit
reticulocyte lysates can be used to study different types of translation initiation
(cap-dependent initiation, reinitiation, internal ribosome entry site-mediated initi-
ation) and the influence of different initiation factors on these translation
mechanisms. Additionally, with the use of sucrose gradients, it is possible to use
vier Inc.
reserved.
hio
1
2 William C. Merrick and Diane Barth-Baus
nuclease-treated reticulocyte lysates to monitor the formation of ribosomal com-
plexes for their content of mRNA, initiator met-tRNAi, and initiation factors. The
advantage of using nuclease-treated lysates rather than purified initiation factors
is that reactions occur at or near the in vivo rate in contrast to rates observed in
reactions with purified components, which are generally 10- to 1000-fold lower.
The disadvantage is not being able to accurately control the amount of individual
initiation factors, although the use of either factor additions or specific inhibitors
can be helpful in assessing the role of specific individual initiation factors.
1. Introduction
The original development of the rabbit reticulocyte system tookadvantage of two discrete characteristics. First, by the use of phenylhydra-zine, rabbits could be treated to the point at which their blood containedapproximately 95% reticulocytes and, second, as reticulocytes, the predom-inant protein being made was 85 to 90% hemoglobin (Borsook et al., 1952;Kruh and Borsook, 1956). In early studies, one of the concerns was whetherthe amino acids were accurately incorporated into hemoglobin chains.Given that both the sequence of the chains and the procedures for resolvingthe tryptic peptides of hemoglobin were well established, it was easilydetermined that a cell-free system using reticulocyte lysates did indeedperform accurate protein synthesis. In addition, the rate of protein synthesiswas nearly the same as the in vivo rate. With the clever use of the Ca2þ-dependent micrococcal nuclease, Jackson and Hunt (1983) made thereticulocyte lysate a system dependent on exogenous mRNA for proteinsynthesis. This translation system is now available commercially from fivedifferent sources (GE Healthcare Life Sciences, Promega, Ambion, AlatorBiosciences, and Pel-Freeze; note that the names of these companies havebeen subject to change and are the ones presently listing reticulocyte lysate)and the direct testing of several of these systems indicates that they can yieldreliable results with the appropriate controls (Kozak, 1990).
Much of the use of reticulocyte lysates has focused on studies that haveexamined regulation via eIF2a phosphorylation or the characteristics ofmRNAs that either enhance or inhibit their translation. Although manystudies have examined mRNAs for factor requirements, the need for exoge-nous proteins, or for regulation via RNA-binding proteins, these studies haveprimarily used fractionated systems and eithermRNAbinding to ribosomes ortoe printing as the readout for analysis. The limitation here is the loss of kineticsas the reactions generally proceed rather slowly and notwith goodmolar yield.As a consequence, it is often useful to check the individual systems in reticu-locyte lysates to determine if consistent results are obtainedwhen assayed at thein vivo rate.
Translation Initiation in Reticulocyte Lysates 3
This chapter will cover the general conditions for the use ofnuclease-treated rabbit reticulocyte lysates, optimization, types of reporters,basic experiments and then more refined experiments that vary the standardconditions for mRNA utilization, and the influence of changing the effec-tive activity for various translation initiation factors (either by the additionof exogenous initiation factors or by the direct inhibition of endogenousinitiation factors).
2. Materials
2.1. Nuclease-treated reticulocyte lysates
This lysate can be obtained from a number of commercial vendors (GEHealthcare Life Sciences, Promega, Ambion, Alator Biosciences, and Pel-Freeze). However, we have used the lysate provided by Promega and, thus, allof the comments below will relate to this product. In general, this should alsoapply to the lysates provided by the other vendors. The lysate comes in severalkit forms depending on your choice of reporter and whether you want to useradioactivity, fluorescence, or light emission as the readout for protein synthe-sis. The technical manual from Promega titled ‘‘Rabbit Reticulocyte LysateSystem: Instructions for Use of Products L4960 and L4151’’ is very completein describing the reagents required for these various readouts.
2.2. tRNA
The reticulocyte lysates are optimized to synthesize the a and b chains ofhemoglobin, which have an unusual amino acid composition relative tomost proteins. Therefore, to ensure that your mRNA of choice is notrestricted by codon usage, often researchers add tRNA from a general tissueto balance the tRNA isoacceptors. Standard preparations of tRNA fromrabbit or beef liver or from yeast are commercially available. We have foundthat these tRNAs are more active if first extracted with phenol and thenpurified on a Sephadex G-100 column that removes any large RNAs (eitherintact or fragments of rRNA or mRNA).
2.3. mRNA
For most researchers, mRNAs are generated by the use of T7RNA polymer-ase to synthesize a particular mRNA or dicistronic mRNA. Several commer-cial vendors (Ambion, Promega, Invitrogen) have kits available that require aplasmid containing the T7 promoter 50 of the desired RNA sequence. Alter-natively, Promega has a plasmid available that contains two different luciferasereporters in which the nucleic acid sequence between the reporters may bevaried to assess possible internal ribosome entry site (IRES) activity.

4 William C. Merrick and Diane Barth-Baus
3. Methods
3.1. Preparation of tRNA
If the original source is a tissue, the tissue is homogenized at 4 (all steps areperformed at 4 unless noted otherwise) in a buffer containing 20 mMTrisHCl, pH 7.5, 1 mM dithiothreitol, 100 mM KCl (other standardhomogenizing buffers are also acceptable). The homogenate is centrifugedat 10,000g for 30 min to pellet cellular debris. The supernatant is thenshaken vigorously with an equal volume of water-saturated phenol for10 min and the phases are separated by centrifugation at 10,000g for20 min. The aqueous phase (the top phase) is removed and one-tenthvolume of 20% potassium acetate, pH 4.5, and two volumes of chilled95% ethanol are added. This solution is allowed to sit overnight at20 andthe precipitated RNA is collected by centrifugation at 10,000g for 20 min.The supernatant is discarded and the pellet suspended in a minimal volumeof homogenizing buffer. To eliminate any contaminating phenol, thesolution can either be extracted with ether or a second ethanol precipitationcan be performed. The purified RNA is then applied to a Sephadex G-100column equilibrated with 20 mM TrisHCl, pH 7.5, 1 mM dithiothreitol,and 1 mM MgCl. The tRNA will elute in the back half of the column andcan be monitored by any aminoacylation reaction (Merrick, 1979a) or bygel electrophoresis. rRNA and mRNA will elute either in the void volumeor near the void volume. The tRNA is concentrated by ethanol precipita-tion (as above), collected by centrifugation, and suspended in the column-equilibrating buffer used above. For convenience, the tRNA is usuallytaken up at a concentration of about 50 to 200 A260 units/ml. Good qualitytRNA should have an absorption profile where A260 ¼ A220 ¼ 2 A230 or2 A280.
If the starting material was a crude tRNA (or soluble RNA) purchasedcommercially, the tRNA is taken up in the previously described columnequilibration buffer, extracted with an equal volume of water-saturatedphenol, and then precipitated with one-tenth volume of potassium acetate,pH 4.5, and two volumes of 95% ethanol as described. This tRNA is thensubjected to gel filtration on Sephadex G-100 and concentrated asdescribed.
It is important to note that phenol is quite caustic and extreme careshould be taken to avoid contact with the skin or eyes. In the event the skinis contacted with phenol, rinse immediately with 95% ethanol, as phenol isinfinitely soluble in ethanol. Failure to do this quickly (within a minute) willresult in scarring of the skin. If phenol gets into the eye, flush the eyeextensively with water and then seek immediate medical attention.

Translation Initiation in Reticulocyte Lysates 5
3.2. Preparation of mRNA
The preparation of mRNA from a plasmid is the most common source ofmRNAs now used, although mRNAs prepared by the use of oligo(dT)selection from natural sources is fine as well. Since the various buffers andenzymes are proprietary in nature, the researcher should follow the instruc-tions provided by themanufacturer for generating transcript mRNAs. For ourstudies, we have used the enzymes and reagents fromAmbion and found themto be very good. The key variable is the substrate used to generate a cappedmRNA.The older compound ism7GpppG. This reagent has the advantage ofbeing less expensive, but can also be misincorporated with the m7G being thefirst nucleotide in the RNA chain and a G as the ‘‘cap nucleotide’’ (Stepinskiet al., 2001). The amount of RNA obtained and the degree of capping areinversely related, with an optimal degree of cap addition achieved with a capanalog-to-GTP ratio of about 1 to 8. To avoid the difficulty of a misincorpo-rated cap analog, we use the ‘‘antireverse cap analog’’ (ARCA; Ambion),which is similar to m7GpppG except that the m7G portion has a 30 OCH3
group. This blocking of the 30 hydroxyl group means that this analog can beincorporated only in the correct orientation (m7G as the cap and G as the firstnucleotide in the RNA). Following transcription, the mRNA is purifiedaccording to the manufacturer’s directions, which usually include a phenol/chloroform extraction followed by ethanol precipitation. As with tRNAabove, ether extraction or a second ethanol precipitation is required to removeany traces of phenol. It is convenient to have the final mRNA at a concentra-tion of about 2 to 10 A260/ml, which corresponds to about 80 to 400 mg/ml.
4. Translation of an mRNA to Yielda Radioactive Product
The standard reaction mixture for translation would contain thefollowing:
1
1. Rabbit reticulocyte lysate 35 ml 2. Amino acid mixture minus methionine1 1 ml 3. [35S]Methionine at 10 mCi/ml2 2 ml 4. RNasin (ribonuclease inhibitor)1 1 ml 5. mRNA 2 ml 6. Nuclease-free water1 9 ml Total 50 ml1 Materials are supplied in the reticulocyte lysate kit or are available from Promega.2 Given the estimate that the methionine concentration in the lysate is about 5 mM, thisresults in the specific activity of the methionine being about 100 mCi/mmol.

6 William C. Merrick and Diane Barth-Baus
If the reporter peptide to be made is from a tissue other thanreticulocytes, it would be advisable to add about 0.2 A260 per reaction oftRNA from liver or yeast (previously described) if not included in the kitlysate. Also, for most purposes, the researcher can use a 25 ml reactionvolume as the high specific activity of the [35S]methionine allows forquite sensitive detection. Additionally, we have found that best results areobtained with [35S]methionine that is less than 6 weeks old.
5. Quantitation of Reaction Products
A simple mechanism to quantitate protein synthesis is to determine theamount of hot trichloroacetic acid (TCA)-precipitable radioactivity. Thismethod uses the strength of a 10% TCA solution at high temperature tohydrolyze the aminoacyl linkage between methionine and the tRNA andat the same time precipitates the protein. In this case, it is best to performthe reaction in 13 100-mm test tubes. At the end of the reaction, to eachtube is added 2 ml of cold 10%TCA and the tubes are mixed.Next, each tubeis heated to 90 for 10 min. The tubes are then placed on ice for 5 min and,finally, the precipitated protein is collected by vacuum filtration using a finefilter membrane (Millipore filter, type HAWP). After the sample has beenapplied, it is washed twice with 2 ml of cold 10% TCA and then finally with2 ml of cold 95% ethanol. The ethanol wash removes the last traces of TCA;failure to do so may result in some quenching when the samples are subjectedto liquid scintillation spectrometry. The filters are then dried for 10 min undera heat lamp, placed in scintillation vials, and scintillation cocktail is added.Radioactivity is then determined using scintillation spectroscopy. The advan-tage of this procedure is that it is relatively rapid and very quantitative. Forsome applications (use of 3H-labeled amino acids or unusual proteins), aslightly different protocol may be preferred (see the Promega ReticulocyteLysate manual). For example, the hemoglobin in the lysate tends to quench alow-energy emitter such as 3H or some proteins, like collagen, are hydrolyzedin 10% TCA at 90.
The most common alternative is to subject the sample to analysis bysodium dodecyl sulfate (SDS) gel electrophoresis. To this end, after thereaction time has been completed, the tubes are placed on ice and usually2 to 4 ml of the reaction mixture is mixed with 20 ml of SDS sample buffer(50 mM TrisHCl, pH 8.0, 2% SDS, 0.1% bromophenol blue, 10% glyc-erol, 10 mM dithiothreitol; note: add the dithiothreitol from a frozen 1 Mstock just before the buffer is to be used), heated to 90 for 10 min, and thenthe sample is ready to be applied to an SDS gel (tube or slab; see formula-tions following). It is not possible to apply more sample due to the very highprotein content of the lysate. The gel is run until the tracking dye has nearlyreached the bottom of the gel. At the end of the run, the gel is placed instain (0.01% Coomassie blue, 40% methanol, 7% acetic acid: 40 min for

Translation Initiation in Reticulocyte Lysates 7
0.75-mm-thick gels and 60 min for 1.0-mm-thick gels). After this, the gelis briefly rinsed with distilled H2O, placed in destain (7% acetic acid, 5%methanol), and destained overnight with several changes of destain. Justprior to drying, the gel is soaked in destain made 1% in glycerol (to preventcracking of the gel as it dries). Using one of several methods, the gel isdried. (Technical note: the gel is well dried when there is no smell of aceticacid.) The radioactivity in the gel is visualized by the use of X-ray film or theuse of a PhosphorImager. The dried gel is exposed for 6 to 20 h to obtaina reasonable level of signal. As the energy of emission for either 35S or 14C israther low, the dried gel must be directly in contact with themeasuring device(X-ray film or PhosphorImager plate). Paper or Saran wrap will block detec-tion. The following indicates that the experiment was successful: there is noprotein band in the absence of added mRNA, the protein band is presentwhen mRNA is added, and there is only a single protein band (in particular,no protein bands that are of lower molecular weight).
Note: if the researcher has used 14C-labeled amino acids to label theprotein, it may require longer exposure times to obtain a good signal giventhe reduced specific activity compared to [35S]methionine. If 3H is used, thegel may need to be soaked in a fluorographic solution (i.e., Amplify,GEHealthcare Inc.) to permit detection of the very low-energy tritiumemissions. In this case, treatment of the gel and subsequent drying of the gelshould follow the manufacturer’s protocol.
Gel formulations (12.5% SDS gels): note that the volume required willdepend on the gel electrophoresis system used.
Separating gel (the lower gel):
1.2.3.4.5.T
S
1.2.3.4.5.T
40% acrylamide (w/v)3 (ratio 29:1 acrylamide:bisacrylamide)
5 ml 4 separating buffer (1.5M TrisHCl, pH 8.8, 0.4% SDS) 4 ml Double deionized water 6.86 ml 10% ammonium persulfate (w/v)4 0.13 ml TEMED 0.013 mlotal
16 mltacking gel (the upper gel):
40% acrylamide (w/v)3 (ratio 29:1 acrylamide: bisacrylamide)
0.33 ml 4 stacking buffer (0.5M TrisHCl, pH 6.8, 0.4% SDS) 1.0 ml Double deionized water 2.63 ml 10% ammonium persulfate4 0.04 ml TEMED 0.004 mlotal
4.0 ml3 Acrylamide and bisacrylamide are neurotoxins with cumulative effects. These solutions are absorbeddirectly through the skin. Therefore, gloves should be worn at all times when handling these solutions.In addition, even the polymerized gels should be handled with gloves as they may still contain someunpolymerized material.
4 Add the ammonium persulfate solution last as this initiates the polymerization reaction. The stocksolution can be stored at 4 for 2 weeks and for 4 months at 20.
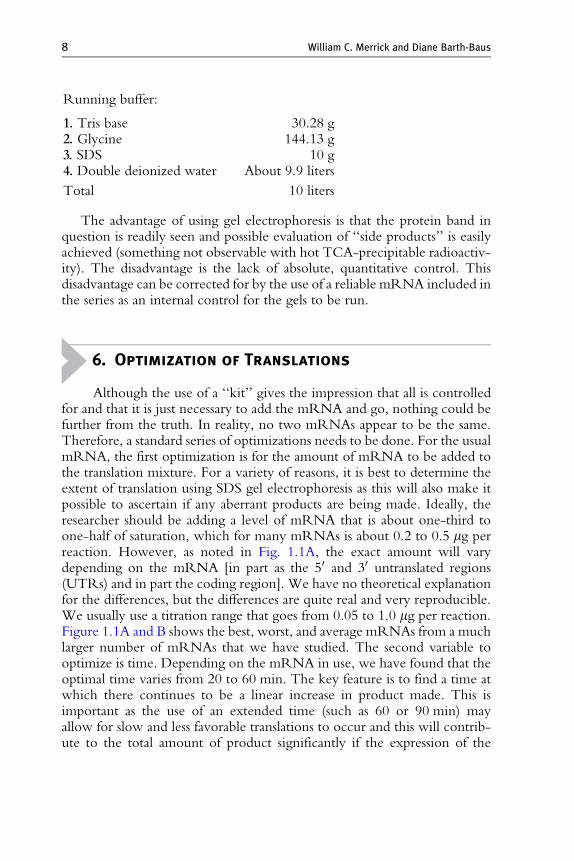
8 William C. Merrick and Diane Barth-Baus
Running buffer:
1. Tris base
30.28 g 2. Glycine 144.13 g 3. SDS 10 g 4. Double deionized water About 9.9 litersTotal
10 litersThe advantage of using gel electrophoresis is that the protein band inquestion is readily seen and possible evaluation of ‘‘side products’’ is easilyachieved (something not observable with hot TCA-precipitable radioactiv-ity). The disadvantage is the lack of absolute, quantitative control. Thisdisadvantage can be corrected for by the use of a reliable mRNA included inthe series as an internal control for the gels to be run.
6. Optimization of Translations
Although the use of a ‘‘kit’’ gives the impression that all is controlledfor and that it is just necessary to add the mRNA and go, nothing could befurther from the truth. In reality, no two mRNAs appear to be the same.Therefore, a standard series of optimizations needs to be done. For the usualmRNA, the first optimization is for the amount of mRNA to be added tothe translation mixture. For a variety of reasons, it is best to determine theextent of translation using SDS gel electrophoresis as this will also make itpossible to ascertain if any aberrant products are being made. Ideally, theresearcher should be adding a level of mRNA that is about one-third toone-half of saturation, which for many mRNAs is about 0.2 to 0.5 mg perreaction. However, as noted in Fig. 1.1A, the exact amount will varydepending on the mRNA [in part as the 50 and 30 untranslated regions(UTRs) and in part the coding region]. We have no theoretical explanationfor the differences, but the differences are quite real and very reproducible.We usually use a titration range that goes from 0.05 to 1.0 mg per reaction.Figure 1.1A and B shows the best, worst, and average mRNAs from a muchlarger number of mRNAs that we have studied. The second variable tooptimize is time. Depending on the mRNA in use, we have found that theoptimal time varies from 20 to 60 min. The key feature is to find a time atwhich there continues to be a linear increase in product made. This isimportant as the use of an extended time (such as 60 or 90 min) mayallow for slow and less favorable translations to occur and this will contrib-ute to the total amount of product significantly if the expression of the
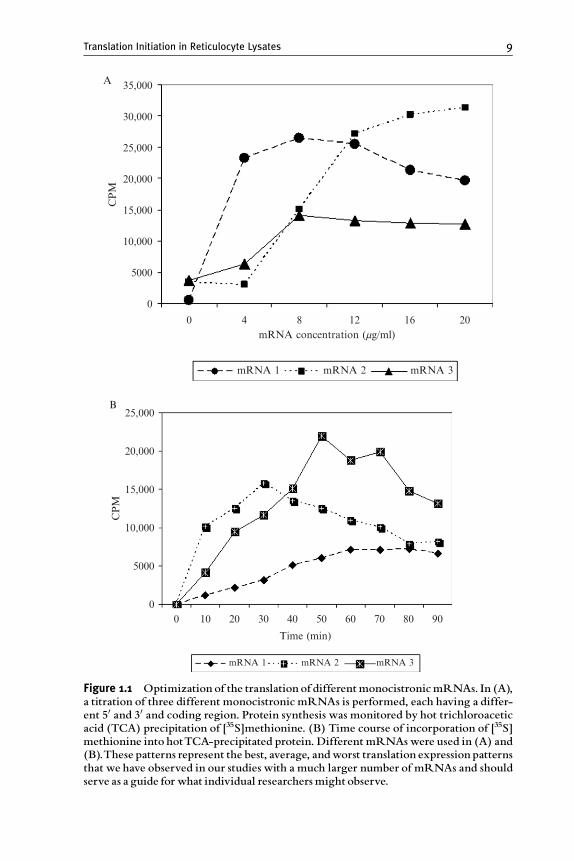
35,000A
30,000
25,000
20,000
15,000
10,000
5000
0
0 4 8 12 16mRNA concentration (mg/ml)
mRNA 1 mRNA 2
CPM
mRNA 3
20
25,000B
20,000
15,000
10,000
5000
00 10 20 30 40 50 60 70 80 90
Time (min)
mRNA 1 mRNA 2
CPM
mRNA 3
Figure 1.1 Optimization of the translation of differentmonocistronicmRNAs. In (A),a titration of three different monocistronic mRNAs is performed, each having a differ-ent 50 and 30 and coding region. Protein synthesis was monitored by hot trichloroaceticacid (TCA) precipitation of [35S]methionine. (B) Time course of incorporation of [35S]methionine into hotTCA-precipitated protein. Different mRNAswere used in (A) and(B).These patterns represent the best, average, andworst translation expression patternsthat we have observed in our studies with a much larger number of mRNAs and shouldserve as a guide for what individual researchersmight observe.
Translation Initiation in Reticulocyte Lysates 9

10 William C. Merrick and Diane Barth-Baus
desired protein was only linear for the first 30 min. The third variable isadded exogenous tRNA, especially for mRNAs that encode proteins thatuse a much different codon bias [i.e., especially any of the proteins frombacteria such as thymidine kinase (TK), chloramphenicol acetyltransfer-ase (CAT), or b-galactosidase (bgal), or proteins with an unusual codonusage]. The titration range here would be from 0.05 to 0.5 A260 units perreaction.
7. Reporter Proteins for Translation
A number of reporter proteins have been used to monitor proteinsynthesis in reticulocyte lysates; the most common are luciferase (firefly andRenilla), TK, CAT, and bgal. The advantage of these reporters is that theyare often used by others (so there is a basis for comparison) and they can allbe used in standard in vivo eukaryotic cell systems with essentially nobackground (only the luciferase proteins are from a eukaryotic source).That said, the luciferase proteins are the most enzymatically active and canbe readily quantitated in the cell-free translation system where usually only5 to 10 pmol (or less) of product might be made (roughly 0.2 to 0.5 mg of aprotein with a molecular weight of 50,000 Da). Although any of theseproteins may be used to monitor the incorporation of a radioactive aminoacid, the extreme length of bgal makes it less suitable (approximately 1000amino acids in length). The real utility of the luciferase proteins is that theirsynthesis can be independently monitored in the presence of other mRNAs.This is either useful or necessary when examining nonnuclease-treatedextracts or when measuring luciferase production in the presence of anmRNA preparation that encodes proteins of a similar molecular weight.Essentially any other protein could also be used for monitoring expres-sion. The key concern would be whether there is any contribution of thecoding region to the efficiency of translation of the mRNA (that is, asequence or structure within the coding region that might interact witheither the 50 or 30 UTRs to influence translation). Although this is notexpected, some mRNAs do contain an IRES element within their codingsequence that can lead to the synthesis of multiple protein products (Komaret al., 2003). Others may contain weak initiation start sites and yield morethan one protein product (either with overlapping reading frames or dif-ferent reading frames). As should be obvious, these proteins/mRNAs maybe the direct target of studies to determine the differential utilization ofthe various start sites or elements that might biologically regulate theirexpression.

Translation Initiation in Reticulocyte Lysates 11
8. Experimental Use ofNuclease-Treated Lysates
8.1. Initiation mechanisms
There are a variety of initiation mechanisms used by various eukaryoticsystems. The most predominant by far is ‘‘cap-dependent’’ initiation( Johannes et al., 1999); the general scheme for this pathway has beenpresented in a number of reviews (for example, see Hershey and Merrick,2000). For this pathway, the mRNA is recognized by its 50 m7G capstructure and then bound to the 43S subunit complex. Subsequent scanningof the mRNA in a 30 direction leads to the identification of the initiatingAUG codon through base pairing with the met-tRNAi present in theternary complex (eIF2GTPmet-tRNAi). Curiously, mRNAs that havebeen shown to use this pathway are reasonably translated in reticulocytelysates even if the mRNA lacks an m7G cap. It is anticipated that thispromiscuity is the result of the mRNA not having to compete for transla-tion and that should the level of a capped mRNA added to the reaction besaturating, then the uncapped mRNA would be poorly translated.
There are two general strategies when examining the cap dependence ofthe translation of an mRNA. The first is to synthesize an mRNA that has astructure similar to the m7G cap, but lacks the methyl group (either ApppGor GpppG is used in the synthetic synthesis in place of m7GpppG). ThesemRNAs behave as if they are uncapped for translation, but the presence ofthe nonmethylated nucleotide protects against RNA degradation from the50 end. While this is a real concern when using extracts from tissues or cellsfor in vitro translations, we have not found that the mRNA is degraded inreticulocyte lysates during a routine 30- to 40-min incubation, so that thismay be an unnecessary concern. The second method to examine the cap-dependent translation of an mRNA is to monitor the reduction in transla-tion of the mRNA when a cap analog is added to the reaction mixture(100 mM m7GTP). Generally, a 60% reduction in translation is observed,which compares poorly with the reduced translation of an uncappedmRNA that is 10 to 20% the level of the capped mRNA. In part, thismay reflect the presence of bits of the 50 end of the globin mRNA resultingfrom the initial nuclease treatment (globin mRNA is about 0.1 mM inuntreated lysate) such that there is some inhibition at the beginning.
Reinitiation has been well characterized for only a few mRNAs (for areview, see Geballe and Sachs, 2000; Hinnebusch, 2000). In general, mostof these mRNAs can be translated in the reticulocyte lysate system. How-ever, to observe the biological regulation associated with the mRNA, there

12 William C. Merrick and Diane Barth-Baus
may be an additional requirement. In the case of using the GCN4 50 UTR,up-regulation of expression is achieved by reducing the level of the ternarycomplex. The simplest way to do this is to take advantage of the high levelsof the interferon-induced eIF2a protein kinase, PKR. This kinase requiresdouble-stranded RNA for activation; a commercially available double-stranded RNA that is often used is poly(I)poly(C). To obtain the optimallevel of up-regulation of reinitiation, the poly(I)poly(C) should be titratedinto the lysate, although the optimal level is usually around 5 to 10 ng/ml.Other mRNAs that utilize reinitiation are influenced by polyamines orarginine (Geballe and Sachs, 2000), and these components can also betitrated into the lysate to evaluate their influence. In all of these, controlswith normal cap-dependent translation should be performed in parallel todetermine the effect of these additions on normal translation.
IRES-mediated translation has been well characterized for viral IRESelements, but less well for cellular IRES elements. To monitor the expressionof mRNAs containing an IRES element, the original mRNAs are usuallymade in both a capped form and an uncapped form to show that the presenceof the m7G cap does not enhance translation. As a control, IRES-mediatedtranslation is usually compared with an internal control, a cap-dependentmRNA. This can be done in two ways. First, the two mRNAs can be mixedtogether so that each is translated as a monocistronic mRNA (note that thisneeds to be done at nonsaturating levels of the mRNA mixture). The secondway is to generate an mRNA where the cap-dependent coding regionfollows the 50 UTR and the IRES and its associated coding region are 30 ofthe first reading frame. This classic bicistronic mRNAmakes it possible to usea single mRNA and evaluate both cap-dependent and IRES-mediatedexpression at the same time, in the same reaction (Pelletier and Sonenberg,1988). The only limitation here is that most commonly, the level of expres-sion from the IRES element is roughly three to eight times lower than what isobserved if the IRES element is in a monocistronic mRNA. The reason forthis reduction is not clear, but may reflect steric hindrance for accessing theIRES element when there are translating ribosomes in the vicinity (i.e., onthe samemRNA). Standard manipulations of the translation of these mRNAsinclude the effect of adding m7GTP, dsRNA, omission of the m7G cap,omission of the poly(A) tail, insertion of elements in either the 50 or 30 UTRsuspected/known to alter the translation of other mRNAs, and the influenceof ionic strength.
8.2. Competition between mRNAs
A common concern about different mRNAs is how efficiently they aretranslated. This cannot be determined from simply observing how muchradioactivity is incorporated per microgram of RNA added to the transla-tion mixture. It can be determined by comparing two or more differentmRNAs in the same translation reaction mixture (Brendler et al., 1981;

Translation Initiation in Reticulocyte Lysates 13
Godefroy and Thach, 1981). Starting with a mixture that is roughly one toone on a molar basis for each mRNA, the mixture is titrated into the lysateuntil well past saturation (Fig. 1.2A). What is observed in this process is thefollowing. At limiting mRNA concentrations, the proteins expressed areroughly in proportion to the amount of mRNA present (as noted above, inthe bicistronic mRNA, IRES-mediated translation is artificially suppressed).However, as saturation is approached, the more competitive mRNA beginsto dominate at the expense of the less competitive mRNA and the ratio ofprotein products changes reflecting this competition (Fig. 1.2B). From thecompetition shown in Fig. 1.2B, it is evident in the bicistronic mRNA thatthe cap-dependently expressed protein represents the more competitivemRNA (i.e., in comparing cap-dependent translation to IRES-mediatedtranslation; Anthony and Merrick, 1991). This general observation oncompetition is more thoroughly reflected in the mathematical treatment oftranslation published by Godefroy and Thach (1981). Unfortunately, thisdirect competition experiment gives only a relative readout, such thatmultiple comparisons need to be made if the investigator wishes to rankorder a number of different mRNAs.
8.3. Synthesis of proteins of high specific radioactivity
For some specific uses, access to a highly radioactive protein can be of value.This can be achieved with the correct mRNA template and the use ofamino acids of high specific activity (the most commonly used is the 35Smixture of methionine and cysteine, although some may choose to use [3H]leucine, which is also available at high specific activity). The key here is tohave an affinity purification system available, as there is very little proteinmade and the lysate is generally several hundred milligrams of protein permilliliter. Alternatively, if the protein of interest will react with ligand,substrate, or binding protein to yield a complex detectable by gel shift,pull down, or resolution by some column matrix (most commonly gelfiltration), then it may not be necessary to purify the labeled protein fromthe lysate. Under the standard conditions as defined above (considering thecontent of cold amino acid in the lysate), a protein of 50,000 molecularweight should have a specific activity of approximately 1000 cpm/pmol or20,000 cpm/mg (assuming methionine is 1% of the incorporated aminoacid). This value can be increased by using a 35S mixture of cysteine andmethionine or by increasing the number of millicuries of [35S]methionineadded to the reaction mixture.
8.4. Influence of variations of factor activity
For those who have access to purified factors (Benne et al., 1979; Merrick,1979b; Staehelin et al., 1979), one can ask whether changing the concen-trations of initiation factors influences start site selection (when initiation is

A
0
20
40
60
80
100
120
0 50 100 150 200
mRNA concentration (mg/ml)
% T
otal
tra
nsla
tion
B
0
20
40
60
80
100
120
5 10 20
ORF 1 ORF 2
40 100 200
mRNA concentration (mg/ml)
% T
otal
tra
nsla
tion
Figure 1.2 Competition between cap-dependent and internal ribosome entry site(IRES)-mediated translation. A T7 transcript of the bicistronic mRNA TK/P2CAT,kindly provided by Dr. Nahum Sonenberg, was titrated into reticulocyte lysates.(A) Hot trichloroacetic acid (TCA) precipitated [35S]methionine representing the sumof thymidine kinase (TK) and chloramphenicol acetyltransferase (CAT) protein syn-thesis following a 60-min incubation at 30. (B) Relative synthesis of each of the poly-peptides (TK and CAT) as determined from sodium dodecyl sulfate (SDS) gelelectrophoresis and scanning laser densitometry. % Translational Efficiency representsthe relative amount of protein made in comparison to the maximal total synthesisobserved at 100 mg/ml RNA (with correction for the methionine content in TK andCAT). See Anthony and Merrick (1991) for a more complete description of thisexperiment.
14 William C. Merrick and Diane Barth-Baus

Translation Initiation in Reticulocyte Lysates 15
occurring at two different start codons). Although we have yet to completethe studies examining a larger number of mRNAs and different factors, itdoes appear that increased concentrations of either eIF5 or eIF5B caninfluence start site selection with increased activity favoring the 50 startsite, although with a noted decrease in overall expression (unpublishedobservation). This is similar to what Donahue and coworkers have observedin yeast using a hyperactive eIF5 (Huang et al., 1997). Addition of eIF4F(and to some extent eIF4B or eIF4A) to a translation reaction with abicistronic mRNA enhances expression more from the IRES elementthan the 50 cap-dependent coding region (Anthony and Merrick, 1991).These same factors also dramatically stimulate the translation of uncappedmRNAs. Similarly, the addition of eIF4A is required if the amount ofsecondary structure in the 50 UTR is systematically increased (Svitkinet al., 2001). Others have used dominant negative mutants of the translationfactors, such as eIF4A (Pause et al., 1994). This mutant effectively inhibitedboth cap-dependent and IRES-mediated expression.
However, most laboratories do not have access to all the translationfactors and may have access only to those factors that can be expressed inEscherichia coli as single polypeptide chains. As an alternative, it is possible togain insights into the translation mechanisms outlined above by the use ofinhibitors. Two inhibitors are readily available, m7GTP and poly(I)poly(C). Although m7GTP would be anticipated to inhibit cap-dependenttranslation (as it does), it also tends to stimulate expression from IRESelements in a bi-cistronic mRNA (Anthony and Merrick, 1991). Thisstimulation may reflect that more eIF4F is available since it cannot bind tothe m7G cap of the mRNA or it may indicate that eIF4F is more activewhen bound to m7GTP. The addition of poly(I)poly(C) leads to theactivation of PKR, the phosphorylation of eIF2, and the subsequent reduc-tion of the levels of ternary complex available to initiate protein synthesis. Ingeneral terms, this would be expected to inhibit cap-dependent and IRES-mediated translation while stimulating the translation of mRNAs contain-ing upstream (and regulatory) open reading frames (ORFs) as in the case ofGCN4. Our experience is that this reduction in ternary complexes does notreduce the level of expression from IRES-mediated translation (Hui et al.,2003). Thus, there would appear to be either an alternate pathway forIRES-mediated translation or an alternate rate-limiting step, as this obser-vation is not consistent with the use of the standard, ordered 80S initiationpathway where the ternary complex binds to the 40S subunit prior to thebinding of mRNA.
Recent studies from the Pelletier laboratory have indicated that a num-ber of small molecules can be used as inhibitors of translation initiation orelongation (Bordeleau et al., 2005, 2006; Chan et al., 2004; Kumar et al.,2004; Malina et al., 2005; Novac et al., 2004; Robert et al., 2006a,b).Although the general mechanism of inhibition has been established for

16 William C. Merrick and Diane Barth-Baus
most of these inhibitors, their differential effect on various aspects oftranslation initiation has not been examined and could be useful in extendedstudies of reinitiation, IRES-mediated initiation, cap-dependent initiation,or alternate start site selection. Use of one of these inhibitors confirmed theobservation that IRES-mediated translation appears to be refractory toreduced levels of ternary complexes (Robert et al., 2006a). Althoughsome of these small molecule inhibitors have restricted availability, it ishoped that in the near future all will become accessible.
More sophisticated options are to use protein inhibitors of translation.The three best characterized proteins are 4E-BP (which binds eIF4E andblocks cap-dependent translation), Pdcd4 (isolated as a tumor suppressor),which binds to eIF4A, and the p56 family of interferon-induced proteinsthat bind to different subunits of eIF3 and, depending on the protein, appearto inhibit either eIF2 or eIF4F activity. As each of these proteins is a singlepolypeptide chain, each can be (and has been) expressed in E. coli fromappropriate plasmids.
In summary, a large number of inhibitors of translation have beenidentified and most are rather readily available. These inhibitors havealready been useful in probing initiation reactions and show great promisefor continued use to more accurately define the steps (or different steps)used in the various initiation schemes previously described. Given theuncertainty of most initiation schemes for everything except normal cap-dependent translation, these inhibitors provide an excellent alternativemechanism to examine the less utilized initiation pathways.
8.5. Sucrose gradients
The use of sucrose gradients in the study of protein synthesis has beenextensive and has been the foundation for many of the initiation schemesproposed to date. This methodology allows for the separation of both freemet-tRNAi and mRNA from higher molecular weight complexes and, assuch, makes it possible to determine the components associated with com-plexes based upon their resolution according to sedimentation rate (roughly,molecular weight). For most studies, the sedimentation rate of any of theribosomal complexes is 40S or greater, whereas tRNA and mRNA havesedimentation rates of 4S and 10 to 30S, respectively. While it is possible tofollow the presence of met-tRNAi as [
35S]methionine and the mRNA as a32P label (body labeled or end labeled), the availability of antibodies to eachof the translation initiation factors (Santa Cruz Biotechnologies) makes itpossible to monitor the presence of the factors as a function of the complexthey are in or as a function of the mRNA under study (i.e., perhaps anunusual mRNA such as a GCN4-type mRNA that uses reinitiation). Forthose with access to individually purified factors, these can be radiolabeled byreductive methylation using [14C]formaldehyde so that the proteins can be
Translation Initiation in Reticulocyte Lysates 17
monitored by radioactivity (either as direct scintillation counting or by theuse of SDS gel electrophoresis) (Benne et al., 1979; Peterson et al., 1979).
For standard sucrose gradients that will resolve 40S, 60S, and 80Scomplexes, we routinely use the SW28 rotor (Beckman) and buckets thathold tubes of about 16.5 ml. Gradients are made from 10 to 30% sucrose in abuffer that contains 20 mM TrisHCl, pH 7.5 (or 20 mMHEPES, pH 7.4),3 mMMgCl2, 100 mM KCl, 2 mM dithiothreitol, and either 100 mM GTPor GDPNP (the inclusion of a guanine nucleotide in the gradient increasesthe yield of ternary complexes associated with 40S subunits; Peterson et al.,1979). The sample, generally 50 to 100 ml, is applied to the top of the chilledgradient and centrifugation is for 20 h at 16,000 rpm at 4. The gradients arefractionated using upward displacement with 60% sucrose with an ISCOmodel 640 fractionator, which makes it possible to monitor the absorbanceof the subunits at A254. Various fraction sizes can be used depending on theresearcher’s need; however, we have found that rarely is resolutionenhanced by collecting more than about 20 individual fractions. Ifthe desired analysis is a determination of radioactivity, aliquots fromeach fraction can be mixed with a scintillation solution for aqueous samplesand radioactivity determined by scintillation spectroscopy. If the position orquantitation of proteins bound to the subunits/ribosome is desired, aliquotscan be analyzed by SDS gel electrophoresis (as previously described). As theconcentration of the proteins is often dilute in the gradient, we commonlyprecipitate the proteins with cold 10% TCA. In a typical example, 200 ml ofeach fraction is mixed in a microfuge tube with 2 ml of a 1 mg/ml solutionof soybean trypsin inhibitor and 20 ml of 100% cold TCA (100 g/100 ml).The mixture is held on ice for 30 min and then microfuged for 10 min at 4.The supernatant is carefully decanted and the pellet is vigorously mixedwith 200 ml acetone (this step will remove traces of TCA). The solution isagain centrifuged for 10 min at 4. The supernatant is carefully decanted andthe acetone allowed to evaporate. To the pellet is added 20 ml of SDSsample buffer and the tube is heated to 90 for 10 min. These samples arenow ready for SDS gel electrophoresis. The soybean trypsin inhibitor that isincluded acts as a carrier protein to facilitate quantitative precipitation.However, it also serves as an internal control for equivalent recovery andloading of each gradient fraction. Soybean trypsin inhibitor was chosenbecause its 21,000 molecular weight does not overlap with any of thetranslation initiation factor proteins (or their subunits) and thus will notinterfere with evaluating whether a given protein (peptide) is present.Depending on whether the researcher wants to identify the protein ofinterest by subsequent Coomassie blue (or silver) staining or by Westernblot, the following guideline may be useful in deciding which to use.A milliliter of reticulocyte lysate contains about 20 A260 units of RNA,mostly rRNA. This corresponds to 160 mg of ribosomes or 40 pmol in the100 ml reaction mixture. For a protein of molecular weight 50,000, 40 pmol

18 William C. Merrick and Diane Barth-Baus
would correspond to 2 mg. However, most of the initiation factors arepresent at a fraction of the concentration of ribosomes (0.05 to 0.5 to 1.0)and, therefore, less than 2 mg of protein would be expected.
An alternate use of sucrose gradients (or gel filtration) is to isolatecomplexes that are on the pathway to forming 80S initiation complexes.In this case, fractions that had formed 43S complexes could be tested forwhat additional factors are required to convert the 43S complex into an 80Sinitiation complex (Merrick, 1979c). In these instances, the small molecules(amino acid, nucleotides, tRNA, free mRNA, free factor, etc.) sedimentmore slowly (or much more slowly) than the 43S subunit and thus areresolved from the 40S subunit bound met-tRNAi, mRNA, and initiationfactors.
8.6. Toe printing
The term ‘‘toe printing’’ or primer extension inhibition refers to a methodto determine the location of a ribosome (or ribosomal subunit) bound to anmRNA (Hartz et al., 1988). This analysis has the advantage of identifyingthe position at which a 40S subunit is bound to the mRNA (i.e., is it boundin the vicinity of the m7G cap, within the 50 UTR, or at the initiatingAUG?). This assay has been used effectively with purified factors to charac-terize those initiation factors that are essential for accurate pairing of theinitiator met-tRNAi with the initiating AUG codon in the mRNA(Kolupaeva et al., 2000; Pestova et al., 1996). For reticulocyte lysates, aradioactive primer for reverse transcription is annealed to an mRNAapproximately 40 nucleotides 30 of the initiating AUG codon and thenadded to the reticulocyte lysate (along with any other additions as describedabove; Anthony and Merrick, 1992). After an incubation for 10 min at 30,the reaction mixture is layered on a chilled sucrose gradient and the 48S (or80S) complex is identified both by A254 and radioactivity cofractionatingwith the 40S (or 80S) complex (see the discussion of sucrose gradients).After resolution by centrifugation and displacement of the gradient from thecentrifuge tube, aliquots from each fraction can then be tested for the abilityof reverse transcriptase to extend the radioactive primer knowing that thestable association of a subunit or ribosome will block primer extension. Todo this, to 200-ml aliquots is added four dNTPs, each at a concentration of0.2 mM, and four units of AMV reverse transcriptase. After incubation for30 min at 37, the reaction mixture is extracted with phenol:chloroform(1:1) followed by ethanol precipitation of the RNA. The pellets are thensolubilized in nucleic acid sequencing buffer (98% formamide, 10 mMEDTA, 0.25% xylene cyanol, 0.25% bromophenol blue) and analyzed byelectrophoresis in an 8% acrylamide sequencing gel. The positions of anystops in the extension (the toe print) are determined by comparison with anucleotide ladder generated from the same primermRNA complex where
Translation Initiation in Reticulocyte Lysates 19
the primer is extended in the presence of 0.15 mM dideoxynucleotide and0.2 mM dNTPs.
Alternatively, toe printing can be performed directly without the sepa-ration of ribosomal complexes (Kozak, 1998). The important note here isthat the toe printing cannot be done directly with the original incubationreaction. However, a 20-fold dilution of the reaction mixture with coldbuffer (50 mM TrisHCl, pH 7.5, 40 mM KCl, 6 mM MgCl2, 5 mMdithiothreitol, 110 mg/ml cyclohexamide, and 575 mM of each dNTP)will allow direct toe printing. The toe printing is initiated with the additionof 2 U/ml Superscript II reverse transcriptase (Gibco BRL) to the dilutedreaction mixture and incubating at 25 for 10 min. Primer-extended pro-ducts are then analyzed as described following phenol extraction and pre-cipitation with ethanol and the toe print localized by use of a DNAsequencing ladder obtained using the same primermRNA pair andextension in the presence of dideoxynucleotides.
REFERENCES
Anthony, D. D., and Merrick, W. C. (1991). Eukaryotic initiation factor 4F: Implicationsfor a role in internal initiation of translation. J. Biol. Chem. 266, 10218–10226.
Anthony, D. D., and Merrick, W. C. (1992). Analysis of 40S and 80S complexes withmRNA as measured by sucrose density gradients and primer extension inhibition. J. Biol.Chem. 267, 1554–1562.
Benne, R., Brown-Leudi, M. L., and Hershey, J. W. B. (1979). Protein synthesis initiationfactors from rabbit reticulocytes: Purification, characterization and radiochemical label-ing. Methods Enzymol. 60, 15–35.
Bordeleau, M. E., Matthews, J., Wojnar, J. M., Lindqvist, L., Novac, O., Jankowsky, E.,Sonenberg, N., Northcote, P., Teesdale-Spittle, P., and Pelletier, J. (2005). Stimulationof mammalian translation initiation factor eIF4A activity by a small molecule inhibitor ofeukaryotic translation. Proc. Natl. Acad. Sci. USA 102, 10460–10465.
Bordeleau, M. E., Mori, A., Oberer, M., Lindqvist, L., Chard, L. S., Higa, T.,Belsham, G. J., Wagner, G., Tanaka, J., and Pelletier, J. (2006). Functional characteriza-tion of IRESes by an inhibitor of the RNA helicase eIF4A.Nat. Chem. Biol. 2, 176–177.
Borsook, H., Deasy, C. L., Haggensmit, A. J., Keighley, G., and Lowy, P. H. (1952).Incorporation in vitro of labeled amino acids into proteins of rabbit reticulocyes. J. Biol.Chem. 196, 669–694.
Brendler, T., Godefroy-Colburn, T., Carlill, R. D., and Thach, R. E. (1981). The role ofmRNA competition in regulating translation II. Development of a quantitative in vitroassay. J. Biol. Chem. 256, 11747–11754.
Chan, J., Khan, S. N., Harvey, I., Merrick, W. C., and Pelletier, J. (2004). Eukaryoticprotein synthesis inhibitors identified by comparison of cytotoxicity profiles. RNA 10,528–543.
Geballe, A. P., and Sachs, M. S. (2000). Translational control by upstream open readingframes. In ‘‘Translational Control of Gene Expression’’ (N. Sonenberg, J. W. B. Hershey,and M. B. Mathews, eds.), pp. 595–614. Cold Spring Harbor Laboratory Press, ColdSpring Harbor, N.Y.
Godefroy-Colburn, T., and Thach, R. E. (1981). The role of mRNA competition inregulating translation IV. Kinetic model. J. Biol. Chem. 256, 11762–11773.
20 William C. Merrick and Diane Barth-Baus
Hartz, D., McPheeters, D. S., Traut, R., and Gold, L. (1988). Extension inhibition analysisof translation initiation complexes. Methods Enzymol. 164, 419–425.
Hershey, J. W. B., and Merrick, W. C. (2000). The pathway and mechanism of initiation ofprotein synthesis. In ‘‘Translational Control of Gene Expression’’ (N. Sonenberg,J. W. B. Hershey, and M. B. Mathews, eds.), pp. 33–88. Cold Spring Harbor LaboratoryPress, Cold Spring Harbor, N.Y.
Hinnebusch, A. G. (2000). Mechanism and regulation of initiator methionyl-tRNA bindingto ribosomes. In ‘‘Translational Control of Gene Expression’’ (N. Sonenberg,J. W. B. Hershey, and M. B. Mathews, eds.), pp. 185–243. Cold Spring HarborLaboratory Press, Cold Spring Harbor, N.Y.
Huang, H. K., Yoon, H., Hannig, E. M., and Donahue, T. F. (1997). GTP hydrolysiscontrols stringent selection of the AUG start codon during translation initiation inSaccharomyces cerevisiae. Genes Dev. 11, 2396–2413.
Hui, D. J., Bhasker, C. R., Merrick, W. C., and Sen, G. C. (2003). Viral stress-inducibleprotein p56 inhibits translation by blocking the interaction of eIF3 with the ternarycomplex eIF2GTPMet-tRNAi. J. Biol. Chem. 278, 39477–39482.
Jackson, R. J., and Hunt, T. (1983). Preparation and use of nuclease-treated rabbit reticulo-cyte lysates for the translation of eukaryotic messenger RNA. Methods Enzymol. 96,50–74.
Johannes, G., Carter, M. S., Eisen, M. B., Brown, P. O., and Sarnow, P. (1999). Identifica-tion of eukaryotic mRNAs that are translated at reduced cap binding complex eIF4Fconcentrations using a cDNA microarray. Proc. Natl. Acad. Sci. USA 96, 13118–13123.
Kolupaeva, V. G., Pestova, T. V., and Hellen, C. U. (2000). An enzymatic footprintinganalysis of the interaction of the 40S ribosomal subunits with the internal ribosomal entrysite of hepatitis C virus. J. Virol. 74, 6242–6250.
Komar, A. A., Lesnik, T., Cullin, C., Merrick, W. C., Trachsel, H., and Altman, M. (2003).Internal initiation drives the synthesis of Ure2 protein lacking the prion domain andaffects [URE3] propagation in yeast cells. EMBO J. 22, 1199–1209.
Kozak, M. (1990). Evaluation of the fidelity of initiation of translation in reticulocyte lysatesfrom commercial sources. Nucl. Acids Res. 18, 2828.
Kozak, M. (1998). Primer extension analysis of eukaryotic ribosome-mRNA complexes.Nucl. Acids Res. 26, 4853–4859.
Kruh, J., and Borsook, H. (1956). Hemoglobin synthesis in rabbit reticulocytes in vitro.J. Biol. Chem. 220, 905–915.
Kumar, R., Garneau, P., Nguyen, N., William Lown, J., and Pelletier, J. (2004). Methio-nine substituted polyamides are RNAse mimics that inhibit translation. J. Drug Target 12,125–134.
Malina, A., Khan, S., Carlson, C. B., Svitkin, Y., Harvey, I., Sonenberg, N., Beal, P. A., andPelletier, J. (2005). Inhibitory properties of nucleic acid-binding ligands on proteinsynthesis. FEBS Lett. 579, 79–89.
Merrick, W. C. (1979a). Assays for eukaryotic protein synthesis. Methods Enzymol. 60,108–123.
Merrick, W. C. (1979b). Purification of protein synthesis initiation factors from rabbitreticulocytes. Methods Enzymol. 60, 101–108.
Merrick, W. C. (1979c). Evidence that a single GTP is used in the formation of 80Sinitiation complexes. J. Biol. Chem. 254, 3708–3711.
Novac, O., Guenier, A. S., and Pelletier, J. (2004). Inhibitors of protein synthesis identifiedby a high throughput multiplexed translation screen. Nucl. Acids. Res. 32, 902–915.
Pause, A., Methot, N., Svitkin, Y., Merrick, W. C., and Sonenberg, N. (1994). Dominantnegative mutants of mammalian translation initiation factor eIF4A define a critical role foreIF4F in cap-dependent and cap-independent initiation of translation. EMBO J. 13,1205–1215.

Translation Initiation in Reticulocyte Lysates 21
Pelletier, J., and Sonenberg, N. (1988). Internal initiation of translation directed by asequence derived from poliovirus RNA. Nature 334, 320–325.
Pestova, T. V., Hellen, C. U., and Shatsky, I. N. (1996). Canonical eukaryotic initiationfactors determine initiation of translation by internal ribosomal entry. Mol. Cell Biol. 16,6859–6869.
Peterson, D. T., Merrick, W. C., and Safer, B. (1979). Binding and release of radiolabeledeukaryotic initiation factors 2 and 3 during 80S initiation complex formation. J. Biol.Chem. 254, 2509–2516.
Robert, F., Kapp, R. F., Khan, S. N., Acker, M. G., Kolitz, S., Kazemi, S., Kaufman, R. J.,Merrick, W. C., Koromoilas, A. E., Lorsch, J. R., and Pelletier, J. (2006a). Initiation ofprotein synthesis by hepatitis C virus is refractory to reduced eIF2GTPMet-tRNAi
ternary complex availability. Mol Biol. Cell 17, 4632–4644.Robert, F., Gao, H. Q., Donia, M., Merrick, W. C., Hanamm, M. T., and Pelletier, J.
(2006b). Chlorissoclimides: New inhibitors of eukaryotic protein synthesis. RNA 12,717–725.
Staehelin, T., Erni, B., and Schreier, M. H. (1979). Purification and characterization of seveninitiation factors for mammalian protein synthesis. Methods Enzymol. 60, 136–165.
Stepinski, J., Waddel, C., Stolarski, R., Darzynkiewicz, E., and Rhoads, R. E. (2001).Synthesis and properties of mRNAs containing the novel ‘‘anti-reverse’’ cap analogs7-methyl(30-O-methyl)GpppG and 7-methyl(30 deoxy)GpppG. RNA 7, 1486–1495.
Svitkin, Y. V., Pause, A., Haghighat, A., Pyronnet, S., Witherell, G., Belsham, G. J., andSonenberg, N. (2001). The requirement for eukaryotic initiation factor 4A (eIF4A) intranslation is in direct proportion to the degree of mRNA 50 secondary structure.RNA 7,382–394.

C H A P T E R T W O
M
IS
*
ethods
SN 0
CentrGene
Studying Translational Control inDrosophila Cell-Free Systems
Fatima Gebauer* and Matthias W. Hentze†
Contents
1. In
in
076
e dExp
troduction
Enzymology, Volume 429 # 200
-6879, DOI: 10.1016/S0076-6879(07)29002-0 All r
e Regulacio Genomica (CRG-UPF), Barcelona, Spainression Unit, European Molecular Biology Laboratory, Heidelberg, Germany
7 Elsevie
ights rese
23
2. P
reparation of Ovary Extracts 253. P
reparation of Embryo Extracts 274. T
he Translation Assay 28Ackn
owledgments 32Refe
rences 32Abstract
Classically, Drosophila cell-free translation systems have been used to study
the response of the translational machinery to heat shock treatment. We and
others have developed optimized Drosophila embryo and ovary extracts, and
their use has expanded to the study of a variety of translational control events.
These extracts recapitulate many of the aspects of mRNA translation observed
in vivo and retain critical regulatory features of several translational control
processes. Indeed, their use is rapidly improving our knowledge of molecular
mechanisms of translational control. In this chapter we provide general guide-
lines and detailed protocols to obtain and use translation extracts derived from
Drosophila embryos and ovaries.
1. Introduction
Cell-free translation systems derived from animal cells such as rabbitreticulocytes, HeLa, or other cultured cells have been instrumental indeciphering key aspects of translation, including the mechanism of transla-tion initiation, the role of mRNA features [cap structure, poly(A) tail,structural and other regulatory elements] in translation, or the mechanisms
r Inc.
rved.
23
24 Fatima Gebauer and Matthias W. Hentze
by which some RNA-binding proteins interfere with the translationalmachinery. In the 1980s, Drosophila extracts derived from embryos andcells in culture (SL-1, SL-2, and Kc cells) were typically used to study theprofound change in protein synthesis caused by heat shock (Maroto andSierra, 1988; Storti et al., 1980; Zapata et al., 1991). These extracts wereresponsive to the addition of exogenous mRNA because of pretreatmentwith micrococcal nuclease to destroy the endogenous mRNAs (Scott et al.,1979). This treatment, however, was not always successful and ofteninactivated the embryo extract (Scott et al., 1979).
More recently,Drosophila embryo and ovary extracts that translate exog-enous mRNA with high efficiency have been obtained (Castagnetti et al.,2000; Gebauer et al., 1999; Lie and Macdonald, 2000). These extractshave been used to study translational control events that impinge on flydevelopment, such as the regulation of the mRNAs encoding the antero-posterior axis determinants Oskar andNanos, or of themRNA encoding thedosage compensation complex component Msl-2 (Beckmann et al., 2005;Chekulaeva et al., 2006; Clark et al ., 2000). Similar lysates have been used tostudy sequence-specific mRNAdeadenylation events ( Jeske et al., 2006) andthe phenomenon of RNA interference (Tuschl et al., 1999).
Translationally active extracts have been prepared from a range of stagesof embryo development (0–18 h postfertilization). Embryo and ovaryextracts recapitulate key properties of translation observed in vivo, such asthe stimulatory role of the mRNAm7GpppN cap structure and the poly(A)tail, as well as the synergism between the two (Castagnetti et al., 2000;Gebauer et al., 1999; Lie and Macdonald, 2000). While many mRNAsdisplay a strong cap dependence in these systems, the overall effect of thepoly(A) tail is more variable and depends not only on its length but also onthe particular mRNA tested. In addition, the presence of a cap structuregreatly improves the stability of the mRNA in both embryo and ovaryextracts whereas the poly(A) tail does not appear to contribute significantlyto mRNA stability in these extracts (Castagnetti et al., 2000; Gebauer et al.,1999; Lie and Macdonald, 2000). Thus, to preserve mRNA stability, werecommend that the exogenous transcripts to be evaluated in these systemscarry either a canonical (m7GpppN) or a noncanonical (ApppN) 50 capstructure, depending on the purpose of the experiment. Although, as statedabove, the cap structure plays an important role in the translational effi-ciency of most mRNAs, translation driven by the IRESs of Drosophilareaper, hsp70, hid and grim mRNAs also occurs efficiently in embryoextracts (Hernandez et al., 2004; Vazquez-Pianzola et al., 2006).
Ovary and embryo translation extracts differ in important practicalaspects. First, we and others have attempted to establish large-scale prepara-tions of ovary extracts without success (Lie and Macdonald, 2000;F. Gebauer, S. Castagnetti, M. W. Hentze, and A. Ephrussi, unpublished).Ovary extracts are obtained in limited amounts by manually dissecting flies,
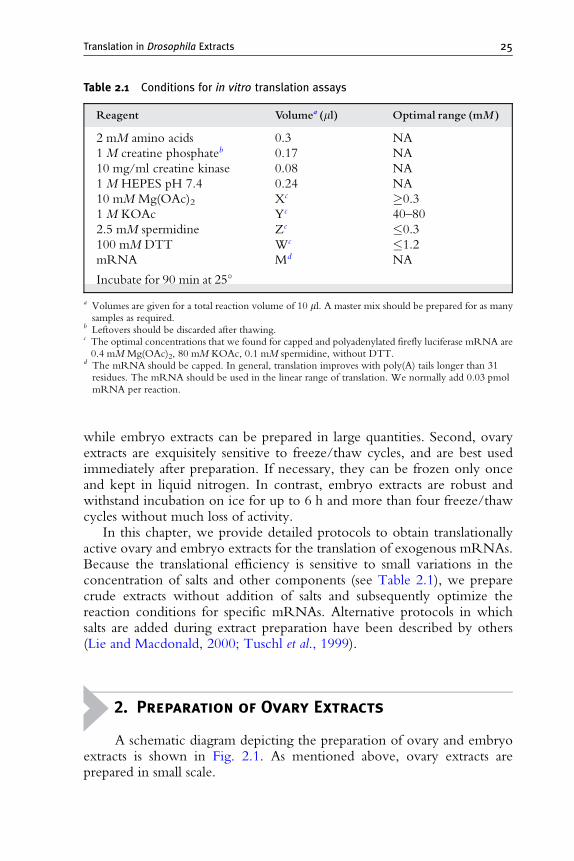
Table 2.1 Conditions for in vitro translation assays
Reagent Volumea (ml) Optimal range (mM )
2 mM amino acids 0.3 NA
1 M creatine phosphateb 0.17 NA
10 mg/ml creatine kinase 0.08 NA
1 M HEPES pH 7.4 0.24 NA
10 mM Mg(OAc)2 Xc 0.3
1 M KOAc Yc 40–80
2.5 mM spermidine Zc 0.3
100 mM DTT Wc 1.2
mRNA Md NA
Incubate for 90 min at 25
a Volumes are given for a total reaction volume of 10 ml. A master mix should be prepared for as manysamples as required.
b Leftovers should be discarded after thawing.c The optimal concentrations that we found for capped and polyadenylated firefly luciferase mRNA are0.4 mM Mg(OAc)2, 80 mM KOAc, 0.1 mM spermidine, without DTT.
d The mRNA should be capped. In general, translation improves with poly(A) tails longer than 31residues. The mRNA should be used in the linear range of translation. We normally add 0.03 pmolmRNA per reaction.
Translation in Drosophila Extracts 25
while embryo extracts can be prepared in large quantities. Second, ovaryextracts are exquisitely sensitive to freeze/thaw cycles, and are best usedimmediately after preparation. If necessary, they can be frozen only onceand kept in liquid nitrogen. In contrast, embryo extracts are robust andwithstand incubation on ice for up to 6 h and more than four freeze/thawcycles without much loss of activity.
In this chapter, we provide detailed protocols to obtain translationallyactive ovary and embryo extracts for the translation of exogenous mRNAs.Because the translational efficiency is sensitive to small variations in theconcentration of salts and other components (see Table 2.1), we preparecrude extracts without addition of salts and subsequently optimize thereaction conditions for specific mRNAs. Alternative protocols in whichsalts are added during extract preparation have been described by others(Lie and Macdonald, 2000; Tuschl et al., 1999).
2. Preparation of Ovary Extracts
A schematic diagram depicting the preparation of ovary and embryoextracts is shown in Fig. 2.1. As mentioned above, ovary extracts areprepared in small scale.
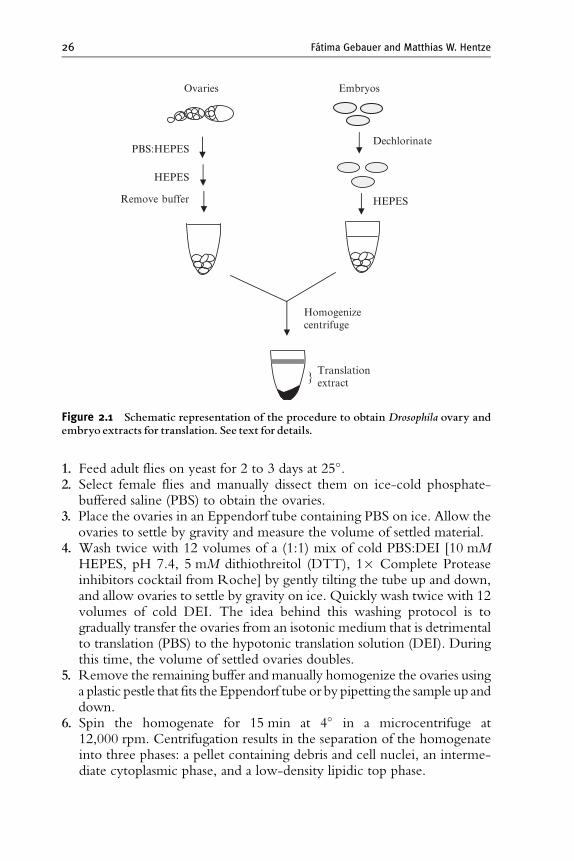
Ovaries Embryos
PBS:HEPES
HEPES
Remove buffer
Dechlorinate
HEPES
Homogenizecentrifuge
Translationextract
Figure 2.1 Schematic representation of the procedure to obtain Drosophila ovary andembryo extracts for translation. See text for details.
26 Fatima Gebauer and Matthias W. Hentze
1. Feed adult flies on yeast for 2 to 3 days at 25.2. Select female flies and manually dissect them on ice-cold phosphate-
buffered saline (PBS) to obtain the ovaries.3. Place the ovaries in an Eppendorf tube containing PBS on ice. Allow the
ovaries to settle by gravity and measure the volume of settled material.4. Wash twice with 12 volumes of a (1:1) mix of cold PBS:DEI [10 mM
HEPES, pH 7.4, 5 mM dithiothreitol (DTT), 1 Complete Proteaseinhibitors cocktail from Roche] by gently tilting the tube up and down,and allow ovaries to settle by gravity on ice. Quickly wash twice with 12volumes of cold DEI. The idea behind this washing protocol is togradually transfer the ovaries from an isotonic medium that is detrimentalto translation (PBS) to the hypotonic translation solution (DEI). Duringthis time, the volume of settled ovaries doubles.
5. Remove the remaining buffer and manually homogenize the ovaries usinga plastic pestle that fits the Eppendorf tube or by pipetting the sample up anddown.
6. Spin the homogenate for 15 min at 4 in a microcentrifuge at12,000 rpm. Centrifugation results in the separation of the homogenateinto three phases: a pellet containing debris and cell nuclei, an interme-diate cytoplasmic phase, and a low-density lipidic top phase.
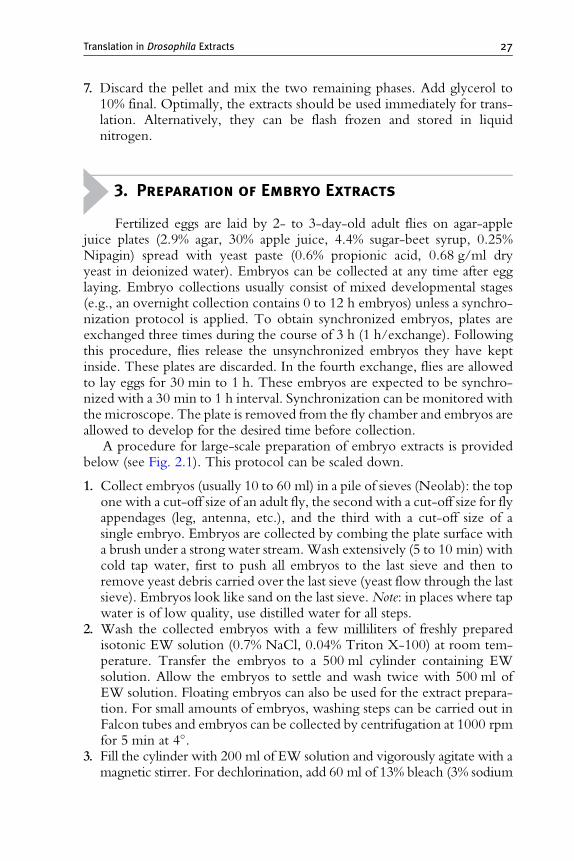
Translation in Drosophila Extracts 27
7. Discard the pellet and mix the two remaining phases. Add glycerol to10% final. Optimally, the extracts should be used immediately for trans-lation. Alternatively, they can be flash frozen and stored in liquidnitrogen.
3. Preparation of Embryo Extracts
Fertilized eggs are laid by 2- to 3-day-old adult flies on agar-applejuice plates (2.9% agar, 30% apple juice, 4.4% sugar-beet syrup, 0.25%Nipagin) spread with yeast paste (0.6% propionic acid, 0.68 g/ml dryyeast in deionized water). Embryos can be collected at any time after egglaying. Embryo collections usually consist of mixed developmental stages(e.g., an overnight collection contains 0 to 12 h embryos) unless a synchro-nization protocol is applied. To obtain synchronized embryos, plates areexchanged three times during the course of 3 h (1 h/exchange). Followingthis procedure, flies release the unsynchronized embryos they have keptinside. These plates are discarded. In the fourth exchange, flies are allowedto lay eggs for 30 min to 1 h. These embryos are expected to be synchro-nized with a 30 min to 1 h interval. Synchronization can be monitored withthe microscope. The plate is removed from the fly chamber and embryos areallowed to develop for the desired time before collection.
A procedure for large-scale preparation of embryo extracts is providedbelow (see Fig. 2.1). This protocol can be scaled down.
1. Collect embryos (usually 10 to 60 ml) in a pile of sieves (Neolab): the topone with a cut-off size of an adult fly, the second with a cut-off size for flyappendages (leg, antenna, etc.), and the third with a cut-off size of asingle embryo. Embryos are collected by combing the plate surface witha brush under a strong water stream.Wash extensively (5 to 10 min) withcold tap water, first to push all embryos to the last sieve and then toremove yeast debris carried over the last sieve (yeast flow through the lastsieve). Embryos look like sand on the last sieve.Note: in places where tapwater is of low quality, use distilled water for all steps.
2. Wash the collected embryos with a few milliliters of freshly preparedisotonic EW solution (0.7% NaCl, 0.04% Triton X-100) at room tem-perature. Transfer the embryos to a 500 ml cylinder containing EWsolution. Allow the embryos to settle and wash twice with 500 ml ofEW solution. Floating embryos can also be used for the extract prepara-tion. For small amounts of embryos, washing steps can be carried out inFalcon tubes and embryos can be collected by centrifugation at 1000 rpmfor 5 min at 4.
3. Fill the cylinder with 200 ml of EW solution and vigorously agitate with amagnetic stirrer. For dechlorination, add 60 ml of 13% bleach (3% sodium

28 Fatima Gebauer and Matthias W. Hentze
hypochlorite final) and incubate for 3 min at room temperature underagitation. Quickly transfer the dechlorinated embryos to the sieve andwash extensively with a strong stream of tap water for about 5 min.
4. Transfer the embryos to a 100 ml cylinder and wash twice with 100 ml ofDE buffer (10 mM HEPES, pH 7.4, 5 mM DTT). Many embryos willfloat. These embryos can also be used for the preparation. As in step 2,small amounts of embryos can be collected and washed in Falcon tubes.
5. Remove the buffer and measure the volume of remaining embryos. Addone volume of DEI buffer (DE buffer supplemented with 1 Completeprotease inhibitor cocktail from Roche, see also step 4 of the previoussection) and homogenize at 4 by 20 strokes of a Potter-Elvehjemhomogenizer at about 1500 rpm. Keep the homogenate on ice.
6. Spin the homogenate in a tabletop ultracentrifuge at 24,000 rpm(40,000g) in a TLS-55 rotor at 4 for 20 min. Small volumes ofhomogenate can be spun in a microcentrifuge at 14,000 rpm for15 min at 4.
7. Collect the clear cytoplasmic interphase by puncturing the tube with asyringe. Add glycerol to a final concentration of 10%, aliquot, and flashfreeze in liquid nitrogen. Store at 80.
4. The Translation Assay
The translational efficiency of an extract is subject to some batch-to-batch variation and is influenced by the assay conditions. Cell-free translationusing embryo and ovary extracts is sensitive to variations in the concentrationof Mg2þ and Kþ. While the optimal concentration of Kþ ranges between 40and 80 mM for most mRNAs, the response to Mg2þ varies greatly (Fig. 2.2).In addition, spermidine and DTT may affect the translational efficiency ofsome mRNAs. These parameters should be optimized for each mRNAtested. A typical translation reaction together with the optimal range ofconcentrations for various critical parameters are shown in Table 2.1.
mRNAs to be compared in a translation reaction should be assayedunder the same conditions (in parallel or, when possible, internally con-trolled) and, optimally, also synthesized in the same batch. Importantly, atranslation curve with increasing amounts of mRNA should be performedto select a concentration in the linear range of translation.
As mentioned above, the mRNA should contain a cap structure toimprove its translational efficiency and stability. Because the cap analogand GTP compete for incorporation at the 50 end of the mRNA, optimalcapping during mRNA synthesis is obtained by preincubating the reactionmix in the absence of GTP for 5 min at 37 to allow for cap incorporationand subsequently adding the GTP to allow for RNA synthesis. In addition,
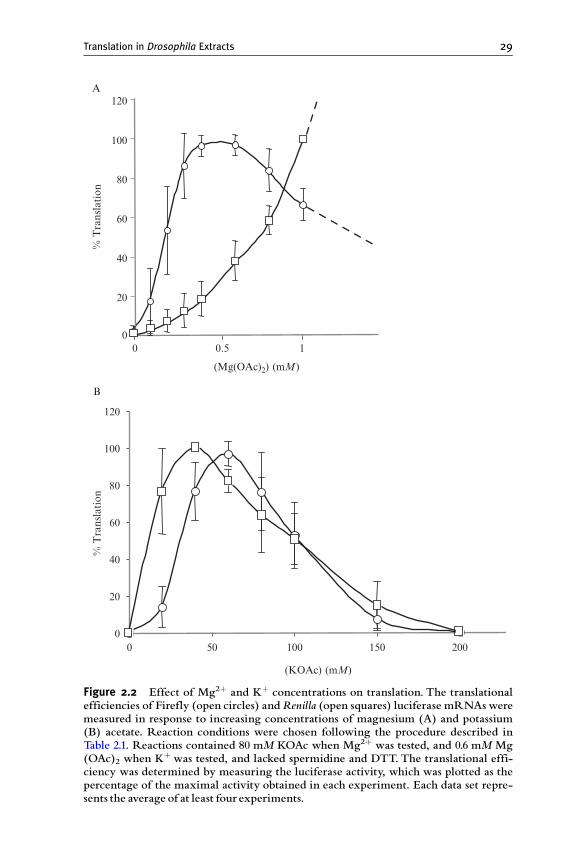
B
0
20
40
60
80
100
120
0 50 100 150 200
% T
rans
lation
(KOAc) (mM)
0
20
40
60
80
100
120A
0.5 10
(Mg(OAc)2) (mM)
% T
rans
lation
Figure 2.2 Effect of Mg2þ and Kþ concentrations on translation. The translationalefficiencies of Firefly (open circles) andRenilla (open squares) luciferase mRNAsweremeasured in response to increasing concentrations of magnesium (A) and potassium(B) acetate. Reaction conditions were chosen following the procedure described inTable 2.1. Reactions contained 80 mM KOAc when Mg2þ was tested, and 0.6 mM Mg(OAc)2 when Kþ was tested, and lacked spermidine and DTT. The translational effi-ciency was determined by measuring the luciferase activity, which was plotted as thepercentage of the maximal activity obtained in each experiment. Each data set repre-sents the average of at least four experiments.
Translation in Drosophila Extracts 29

0
50,000
100,000
150,000
200,000
250,000
Nuclease
− +
Luc
ifer
ase
activi
ty (
arbi
trar
y un
its)+ +Luc mRNA:
−
− −
+Nuclease:
Luc
Lane: 1 2 3 4
Figure 2.3 Micrococcal nuclease treatment. Embryo extract was treated with 0.15units/ml micrococcal nuclease in the presence of 1 mMCaCl2 for 2 min at 20, or mocktreated.The reactionwas stopped with 2 mM EGTA, and the extract was used to trans-late Firefly luciferase mRNA in the presence of [35S]methionine. Part of the reactionwas loaded in an SDS-polyacrylamide gel, and the protein products visualized by auto-radiography (left panel). The other part was used to measure the luciferase activity(right panel). Nuclease treatment effectively eliminated the background translationfrom endogenous mRNAs and did not decrease exogenous luciferase mRNAtranslation.
30 Fatima Gebauer and Matthias W. Hentze
modified cap analogs with improved geometry for appropriate incorpora-tion at the 50 end of the mRNA have been developed (Stepinski et al.,2001). Usually, translation improves if the mRNA contains a poly(A)tail longer than 31 residues. Optimally, the poly(A) tail is encoded in theDNA construct used to synthesize RNA. Poly(A) tails of more than 20residues are unstable in most bacteria. Thus, we recommend to keepplasmids containing poly(A) stretches in the bacterial strain XL1-Blue.Long poly(A) tails can also be added after mRNA synthesis by the use ofyeast poly(A) polymerase (yPAP, Amersham). When required, cordycepin(30 deoxyadenosine) can be incorporated at the 30 end of the mRNA usingyPAP to prevent further adenylation by activities present in the translationextract.
Translation requires an ATP regenerating system (creatine phosphateand creatine kinase). Creatine phosphate is prepared in water, aliquoted, andstored at 80, and remainders of aliquots should be discarded afterthawing. Creatine kinase is prepared as a stock solution at a concentrationof 10 mg/ml in 20 mMHEPES, pH 7.4, 50% glycerol, and is stable at20for up to a year. Contrary to some cell-free systems, translation in embryo

0
20
40
60
80
100
120
0 10 20 30 40
% T
rans
lation
Molar ratio protein/mRNA
Figure 2.4 Translation inhibition by the RNA-binding protein Sex-lethal (SXL).Increasing amounts of recombinant SXL (circles) or a control protein (mRBD, trian-gles) were incubated in translation reactions containing both an mRNAtarget for SXL(Firefly luciferase fused to the untranslated regions of msl-2 mRNA; Gebauer et al.,1999) and RenillamRNA as an internal control.The translational efficiency was deter-mined by measuring the respective luciferase activities. The Firefly luciferase valueswere corrected for Renilla luciferase expression and plotted as percentages against themolar ratio protein:mRNA.The activity obtained in the absence of added protein wastaken as100%.
Translation in Drosophila Extracts 31
extracts is not stimulated by the addition of GTP. In addition, we haveobserved that de novo translation is largely inactive in extracts that have beenpreincubated at 25 for at least 15 min in the presence of an energy-generating system and, thus, have already initiated translation (F. Gebauerand M. W. Hentze, unpublished).
The use of luciferase and other reporter systems whose activities can bemeasured enzymatically has circumvented the need to eliminate the endoge-nous mRNAs, which would otherwise generate a background that preventsthe detection of the exogenous translation product (Fig. 2.3, lanes 1 and 2).Indeed, to study regulatory mechanisms it is often more convenient topreserve the complement of endogenous mRNAs to maximally mimic phys-iological conditions. If needed, endogenous mRNAs can be eliminated effi-ciently without significant loss of translation activity by treating the extractwith 0.15 units/ml micrococcal nuclease for 2 to 4 min at 20 after adjustingthe extract to 1 mM CaCl2 (see Fig. 2.3). Micrococcal nuclease treatment isstopped by adding EGTA to a final concentration of 2 mM.
Buffers such as Tris or PBS may inhibit the translation reaction. Thus,when testing the effect of recombinant proteins on translation, we recom-mend dialyzing the proteins against HEPES-based buffers in the absence of
32 Fatima Gebauer and Matthias W. Hentze
salts. We usually dialyze proteins against a buffer containing 20 mMHEPES,pH 8.0, 0.2 mM EDTA, 1 mM DTT, 0.01% NP40, and 20% glycerol.Ideally, different concentrations of recombinant protein are tested in reac-tions that contain two exogenously added mRNAs: the mRNA under studyand a control mRNA that serves normalization purposes. An example of theeffect of adding a recombinant regulatory protein on translation is shown inFig. 2.4.
ACKNOWLEDGMENTS
F. Gebauer was supported by Grants SGR05/00669 from DURSI and BFU2006–01874/BMC from the Spanish Ministry of Education and Science. M. W. Hentze acknowledgessupport by multiple sources, especially the European Molecular Biology Laboratory and theDeutsche Forschungsgemeinschaft.
REFERENCES
Beckmann, K., Grskovic, M., Gebauer, F., and Hentze, M. W. (2005). A dual inhibitorymechanism restricts msl-2 mRNA translation for dosage compensation inDrosophila. Cell122, 529–540. Erratum in: Cell 123, 171.
Castagnetti, S., Hentze, M. W., Ephrussi, A., and Gebauer, F. (2000). Control of oskarmRNA translation by Bruno in a novel cell-free system from Drosophila ovaries. Devel-opment 127, 1063–1068.
Chekulaeva, M., Hentze, M. W., and Ephrussi, A. (2006). Bruno acts as a dual repressor ofoskar translation, promoting mRNA oligomerization and formation of silencing parti-cles. Cell 124, 521–533.
Clark, I. E., Wyckoff, D., and Gavis, E. R. (2000). Synthesis of the posterior determinantNanos is spatially restricted by a novel cotranslational regulatory mechanism. Curr. Biol.10, 1311–1314.
Gebauer, F., Corona, D. F., Preiss, T., Becker, P. B., and Hentze, M. W. (1999). Transla-tional control of dosage compensation in Drosophila by Sex-lethal: Cooperative silencingvia the 50 and 30 UTRs of msl-2 mRNA is independent of the poly(A) tail. EMBO J. 18,6146–6154.
Hernandez, G., Vazquez-Pianzola, P., Sierra, J. M., and Rivera-Pomar, R. (2004). Internalribosome entry site drives cap-independent translation of reaper and heat shock protein70 mRNAs in Drosophila embryos. RNA 10, 1783–1797.
Jeske, M., Meyer, S., Temme, C., Freudenreich, D., and Wahle, E. (2006). Rapid ATP-dependent deadenylation of nanos mRNA in a cell-free system from Drosophila embryos.J. Biol. Chem. 281, 25124–25133.
Lie, Y. S., and Macdonald, P. M. (2000). In vitro translation extracts prepared fromDrosophilaovaries and embryos. Biochem. Biophys. Res. Commun. 270, 473–481.
Maroto, F. G., and Sierra, J. M. (1988). Translational control in heat-shocked Drosophilaembryos: Evidence for the inactivation of initiation factor(s) involved in the recognitionof mRNA cap structure. J. Biol. Chem. 263, 15720–15725.
Scott, M. P., Storti, R. V., Pardue, M. L., and Rich, A. (1979). Cell-free protein synthesis inlysates of Drosophila melanogaster cells. Biochemistry 18, 1588–1594.

Translation in Drosophila Extracts 33
Stepinski, J., Waddell, C., Stolarski, R., Darzynkiewicz, E., and Rhoads, R. E. (2001).Synthesis and properties of mRNAs containing the novel ‘‘anti-reverse’’ cap analogs7-methyl(30-O-methyl)GpppG and 7-methyl (30-deoxy)GpppG. RNA 7, 1486–1495.
Storti, R. V., Scott, M. P., Rich, A., and Pardue, M. L. (1980). Translational control ofprotein synthesis in response to heat shock in D. melanogaster cells. Cell 22, 825–834.
Tuschl, T., Zamore, P. D., Lehmann, R., Bartel, D. P., and Sharp, P. A. (1999). TargetedmRNA degradation by double-stranded RNA in vitro. Genes Dev. 13, 3191–3197.
Vazquez-Pianzola, P., Hernandez, G., Suter, B., and Rivera-Pomar, R. (2006). Differentmodes of translation for hid, grim and sickle mRNAs in Drosophila. Cell Death Differ.14(2), 286–295.
Zapata, J. M., Maroto, F. G., and Sierra, J. M. (1991). Inactivation of mRNA cap-bindingprotein complex in Drosophila melanogaster embryos under heat shock. J. Biol. Chem. 266,16007–16014.

C H A P T E R T H R E E
M
IS
D
ethods
SN 0
epartm
Use of In Vitro Translation ExtractDepleted in Specific Initiation Factorsfor the Investigation ofTranslational Regulation
Daniel R. Gallie
Contents
1. In
in
076
en
troduction
Enzymology, Volume 429 # 2007
-6879, DOI: 10.1016/S0076-6879(07)29003-2 All rig
t of Biochemistry, University of California, Riverside, California
Else
hts
36
2. F
actors Involved in Translation Initiation 363. E
xperimental Methods to Generate and Use FractionatedTranslation Extracts
373
.1. In vitro RNA synthesis 373
.2. P reparation of fractionated lysates 383
.3. S DS–PAGE analysis 393
.4. W estern analysis 403
.5. In vitro translation in fractionated lysates 41Refe
rences 50Abstract
Regulation of gene expression often involves the control of translation
mediated through one or more initiation factors that are required for the
translation of eukaryotic mRNAs. Genetic and molecular biological approaches
can be highly useful in the initial identification of translational regulation, but
the use of in vitro translation lysates can be essential in elucidating the details
of translational regulatory mechanisms. Wheat germ lysate has long been used
for in vitro translation studies. The noncompetitive conditions that prevail in
this lysate as it is normally produced, however, preclude the translational
regulatory analysis of many mRNAs involving the preferential recruitment of
initiation factors. The development of lysate depleted in specific translation
initiation factors converts wheat germ lysate from a noncompetitive system to
one that is competitive in a fast and simple procedure that enables it to be used
in the analysis of many more translational regulatory mechanisms than is
currently possible with unfractionated lysate.
vier Inc.
reserved.
35
36 Daniel R. Gallie
1. Introduction
Eukaryotic translation initiation differs from that in bacteria in itsincreased number and complexity of factors that are involved in proteinsynthesis. In some cases, these factors represent regulatory proteins that targetspecific mRNAs to promote or repress their translation. Translation in eukar-yotes also requires a larger number of initiation factors to assemble a ribosomeat the appropriate initiation codon. The regulatory role that initiation factorsplay in determining the level of expression at a genome-wide level is only nowreceiving attention. Elucidating the contribution that they make will beessential in understanding how the translational machinery influences thecomposition of the proteome in a given cell, tissue, or organ. The use of plantsas a model for translation and translational regulation in higher eukaryotes hasseveral advantages. Plants provide a ready and inexpensive source of materialfor analysis, mutations can be easily generated, and they possess signalingpathways and stress responses that are conserved in many instances withthose of other eukaryotes. In addition, a translation lysate derived fromwheat germ has long been used to study protein synthesis. The wheat embryo,fromwhichwheat germ lysate ismade, is rich in the factors required for proteinsynthesis and low in endogenous mRNAs. While this has the advantage ofproducing an active translation system, it also means that translation is carriedout under conditions that are noncompetitive, i.e., an excess of translationalmachinery for the mRNA being translated. This can make the study oftranslational regulation difficult or impossible as the high level of translationfactors obscures those features of an mRNA that contribute to controllingexpression at the translational level. Because most regulation of translationoccurs during the initiation phase of protein synthesis, depleting the lysate ofspecific initiation factors can convert this noncompetitive system into a com-petitive one in which regulatory features of an mRNA can be revealed. In thischapter,we describe the preparation of fractionated lysates depleted for specificinitiation factors and their use in the study of translational regulation.
2. Factors Involved in Translation Initiation
Early in initiation, the 50-cap structure (m7GpppN, where N repre-sents any nucleotide) and the 30-terminal poly(A) tail cooperate to recruitthose translation initiation factors critical for the early steps that lead tobinding of an 40S ribosomal subunit to an mRNA (Gallie, 2002a). The50-cap structure serves as the binding site for the eukaryotic initiation factor(eIF) 4F that is composed of three subunits: eIF4E, eIF4A, and eIF4G.eIF4E functions as the cap-binding subunit, eIF4A possesses RNA helicase

Use of Factor-Dependent Translation Lysates 37
activity required to remove secondary structure within the 50 leadersequence that would otherwise inhibit scanning of the 40S ribosomalsubunit, and eIF4G is a large subunit that binds eIF4E and eIF4A throughdirect protein–protein interactions. eIF4G also recruits other proteinsinvolved in stimulating 40S ribosomal subunit binding to an mRNA suchas eIF3 and the poly(A)-binding protein (PABP). The interaction betweenPABP and eIF4G is conserved in plants, yeast, and animals and serves tostabilize the binding of eIF4F to the 50-cap (Wei et al., 1998). In plants andanimals, PABP also interacts with eIF4B, a factor that assists the activities ofeIF4A and eIF4F (Bushell et al., 2001; Le et al., 1997, 2000). The 50-cap andpoly(A) tail, therefore, serve to recruit eIF4G to the mRNA through theproteins that bind each mRNA element, i.e., eIF4E and PABP, respec-tively. Two related but distinct eIF4G proteins are expressed in plants,animals, and yeast (Browning et al., 1992; Goyer et al., 1993; Gradi et al.,1998). The two plant eIF4G proteins, referred to as eIF4G and eIFiso4G,differ in size (165 kDa and 86 kDa, respectively) and share only 30%identity.
3. Experimental Methods to Generate and UseFractionated Translation Extracts
3.1. In vitro RNA synthesis
T7-based monocistronic and dicistronic luciferase constructs have beendescribed previously (Gallie et al., 1989, 1991, 2000). The polyadenylated,monocistronic and dicistronic luciferase constructs that contain the50-leader sequence from tobacco etch virus (TEV), the 50-leader sequencefrom tobacco mosaic virus (TMV) that is referred to as O, or controlsequences have been described previously (Gallie, 2002b; Niepel andGallie, 1999). Following linearization downstream of the poly(A)50 tract,the DNA concentration is quantitated spectrophotometrically and broughtto 0.5 mg/ml. In vitro transcription is carried out for 2 h as describedpreviously (Yisraeli and Melton, 1989) using 40 mM Tris–HCl, pH 7.5,6 mM MgCl2, 100 mg/ml bovine serum albumin (BSA), 0.5 mM each ofATP, CTP, UTP, and GTP, 10 mM dithiothreitol (DTT), 0.3 units/mlRNasin (Promega), and 0.5 units/ml T7 RNA polymerase. Capped RNAsare synthesized using 3 mg of template in the same reaction mix except GTPis used at 160 mM and 1 mM of either GpppG or m7GpppG is included.Under these conditions more than 95% of the mRNA is capped.

38 Daniel R. Gallie
3.2. Preparation of fractionated lysates
To generate an eIF4F/eIFiso4F or PABP-dependent lysate, 200 ml of com-mercial wheat germ extract (Promega) is thawed on ice. Once thawingbegins, the tube is briefly hand mixed to facilitate complete thawing rapidly.To prepare eIF4F/eIFiso4F-dependent lysate, 300 ml of m7GTP-Sepharose(Pharmacia) is equilibrated in 1 ml N0 buffer (20 mM HEPES-KOH, pH7.6, 1 mMDTT, 0.1 mM EDTA, 10% glycerol) for 40 min, washed twice inone volume N0 buffer, and the supernatant is removed. Then 200 ml ofwheat germ extract is added to the m7GTP-Sepharose resin and incubatedwith rotation at 4 for 15 min. The lysate is collected by centrifugation(800g for 1 min) through a spin column (Promega) and used immediately.To prepare PABP-dependent lysate, 100 ml of poly(A)-agarose (Sigma) isequilibrated in 0.5 ml N0 buffer for 40 min, washed twice in one volume ofN0 buffer, and the supernatant is removed. Then 200 ml of wheat germextract is added to the poly(A)-agarose and incubated with rotation at 4for 15 min. The lysate is collected by centrifugation (800g for 1 min)through a spin column (Promega) and used immediately.
The depletion of initiation factors such as eIF4G, eIF4E, eIFiso4G,eIFiso4E, eIF4A, eIF4B, eIF3, eEF2, or PABP is confirmed by Westernanalysis following resolution of the lysate by sodium dodecyl sulfate poly-acrylamide gel electrophoresis (SDS–PAGE). Because eIF4G, eIFiso4G,and eIF4B also bind poly(A) RNA, albeit with considerably lower affinitythan does PABP, and PABP is known to physically interact with eIF4G,eIFiso4G, and eIF4B (Le et al., 1997, 2000), which in turn can interact witheIF4A and eIF3, the incubation of wheat germ lysate with poly(A)-agaroseis effective in reducing the level of eIF4G and eIFiso4G in addition to thedepletion of PABP, whereas no reduction was observed for the heat shockprotein, HSP101, that was used as a control (Fig. 3.1) (Gallie, 2001; Gallieand Browning, 2001).
The translational characteristics of the eIF4F/eIFiso4F or PABP-depen-dent lysates are reproducible when lysates are prepared in a similar fashion.It is particularly important for reproducible results among experiments that thesame volumes of lysate andm7GTP-Sepharose resin [or poly(A)-agarose resin]are used each time and the incubation time of the resin with the lysate is notvaried. As the activity of lysate is lost over time following thawing, it isimportant to perform the fractionation protocol in as short a time as possibleand maintain all components on ice at all times. Translation should beperformed immediately following preparation of the eIF4F/eIFiso4F orPABP-dependent lysate. For the greatest reproducibility between experi-ments, a batch of fractionated lysate can be prepared and immediately frozenas aliquots, each of which can be used once for translation. Multiple freeze/thaw cycles of the lysate should be avoided. Moreover, to minimize anyvariability in the unfractionated lysate used to prepare fractionated lysate, a

eIF4E
eIF4G
eIFiso4E
eIFiso4GU
nfr
acti
on
ated
Dep
lete
d
m7GTP
eIF4B
eIF4A
eIF3
PABP
Hsp101
eIF4E
eIF4G
eIFiso4E
eIFiso4G
Un
frac
tio
nat
ed
Dep
lete
d
poly(A)
eIF4B
eIF4A
eIF3
PABP
Hsp101
A B
Figure 3.1 Depletion of eIF4Fand eIFiso4F fromwheat germ lysate.Wheat germ lysatewas incubated with (A) m7GTP-Sepharose or (B) poly(A)-Sepharose for 30 min.Western analysis was performed to determine the level of eIF4G, eIF4E, eIFiso4G, eIFi-so4E, eIF4A, eIF4B, eIF3, and PABP relative to the unfractionated lysate.Western analy-sis of the heat shock protein, HSP101, was performed as a control. (Reproduced withpermission fromGallie, 2001.)
Use of Factor-Dependent Translation Lysates 39
sufficient quantity of lysate from the same lot should be purchased (or preparedin the laboratory) prior to the initiation of the analysis.
3.3. SDS–PAGE analysis
Proteins are fractionated using thin (0.75 mm) SDS-polyacrylamide gelsprepared as described (Laemmli, 1970; Sambrook et al., 1989). Wearinggloves, the gel casting parts are cleaned with 95% ethanol and assembled.

40 Daniel R. Gallie
It is important to keep the plates clean as protein stuck to plates from previousexperiments may appear as ghost bands in the Western analysis. If necessary,plates can be given an acid wash followed by an alkaline wash. To make an8% SDS-polyacrylamide resolving gel solution (8% acrylamide, 0.375 MTris, pH 8.8, 0.1% SDS, 0.1% ammonium persulfate, 0.08% TEMED)sufficient for two thin minigels (i.e., 15 ml), combine 6.9 ml H2O, 4.0 ml30% acrylamide, 3.8 ml 1.5 MTris, pH 8.8, 150 ml 10% SDS, 9 ml TEMED,and 150 ml 10% ammonium persulfate. Mix all ingredients in a 50 ml tube inthe order above. Work quickly after adding the ammonium persulfatebecause polymerization starts immediately and the solution will soonbecome too viscous to pour. Pour the gel solution into the gel caster (HoeferMighty Small II Gel Electrophoresis Unit) up to a point premarked 3 mmabove the final size of the resolving gel. The volume will shrink duringpolymerization. Overlay with 300 ml of water-saturated n-butanol to makethe top of the resolving gel flat. Allow this to polymerize for at least 30 min.Remove the water-saturated n-butanol by rinsing with water and shake outthe excess water.
To make a 5.1% acrylamide stacking gel solution (5.1% acrylamide,125 mM Tris, pH 6.8, 0.1% SDS, 0.1% TEMED, 0.1% ammonium persul-fate) sufficient for two thin minigels (i.e., 8 ml), combine 5.5 ml H2O,1.3 ml 30% acrylamide, 1.0 ml 1 M Tris, pH 6.8, 80 ml 10% SDS, 8.0 mlTEMED, and 80 ml 10% ammonium persulfate. Mix all ingredients in a15 ml tube and work quickly to avoid polymerization prior to pouring themixture into the gel caster. Insert combs. Polymerization should be com-plete in about 30 min. (Note: gels can be wrapped in plastic and stored at 4for several weeks. The older the gel, however, the poorer the resolution.)Following polymerization, remove the comb and rinse the wells with water,and clamp gels to the running frame. Add 70 ml SDS–PAGE running buffer(25 mM Tris, pH 8.3, 0.192 M glycine, 0.1% SDS) to the top reservoir and60 ml to the bottom reservoir.
Mix the samples with SDS–PAGE loading buffer. To make 5 ml of a6 loading buffer solution, combine 1.5 ml 1 M Tris, pH 6.8, 0.6 g SDS,0.46 g DTT, 3 ml glycerol, and 120 ml 5% bromophenol blue. (Note: 5%2-mercaptoethanol can be used instead of 100 mM DTT.) The gel will runmore evenly if every sample is at the same volume. Boil samples in loadingbuffer for 2 min and centrifuge. Load the samples and run at 15 mA per geluntil the bromophenol blue band reaches approximately 1 cm from the gelbottom.
3.4. Western analysis
Following SDS–PAGE, incubate the gel in Western blotting transfer buffer(4.8 mM Tris, 3.9 mM glycine, 10% methanol). Soak the nitrocellulosemembrane and six pieces of Whatman paper (both 8.3 6.1 cm) in transfer

Use of Factor-Dependent Translation Lysates 41
buffer for at least 10 min. Assemble the transfer sandwiches, i.e., three piecesof Whatman paper, the gel, then the membrane, and finally three additionalpieces of Whatman paper on the bottom plate of a semidry apparatus.Remove all air bubbles from the paper and between the gel and membrane.Bolt the top plate of the semidry unit tightly and transfer at 50 mA per gel forat least 30 to 60 min depending on the size of the protein. Larger proteinsrequire longer transfer times whereas small proteins can transfer completelythrough the nitrocellulose membrane during prolonged transfers. Whenanalyzing both large and small proteins, the use of duplicate gels can avoidthe compromise that is necessary if the analysis of both is attempted with asingle gel. For proteins larger than approximately 80 kDa, the concentrationof acrylamide in the resolving gel should be reduced to 6% to facilitateprotein transfer. Following transfer, block the membrane in blocking solu-tion [5% milk, 0.01% thimerosal, in phosphate-buffered saline (PBS):13.7 mM NaCl, 2.7 mM KCl, 10 mM Na2HPO4, 1.8 mM KH2PO4] forat least 1 h (or overnight at 4). Rinse the membrane twice with PBST (PBSwith 0.05% Tween-20). Incubate the membrane in the primary antibody(diluted typically 1:1000 to 1:2000 in TPBS with 1% milk for 1.5 h) inantibody buffer (1% BSA, 0.01% thimerosal, in PBS). Rinse the membraneonce with PBST and then wash for 1, 2, 4, and 8 min, replacing the PBSTbetween each wash. Incubate in blocking solution once again for 30 to60 min to eliminate background. Rinse off excess blocking solution withPBST. Incubate the membrane in secondary antibody (e.g., goat antirabbithorseradish peroxidase-conjugated antibodies in a 1:20,000 dilution) for 1 h.Rinse the membrane once with PBST and then wash for 1, 2, 4, and 8 min,replacing the PBST between each wash. Incubate the membrane in chemi-luminescence reagents according to the manufacturer’s instructions using 4to 5 ml per membrane, blot dry, cover with plastic wrap, and expose to filmfor a length of time necessary to detect the signal.
3.5. In vitro translation in fractionated lysates
Translations are performed using eIF4F/eIFiso4F or PABP-dependentlysates supplemented with 2.5 ml KOAc and 2 ml of a 1 mM unlabeledamino acid mix in a 25 ml volume. mRNAs whose translation product isto be assayed by enzyme activity can be translated with no radiolabeledamino acid (e.g., 35S-Met) added. If radiolabeled protein is desired, theradiolabeled amino acid should be included in the translation reaction anda 1 mM amino acid mix used that lacks the (radiolabeled) amino acid.The translation reactions are incubated at 25 for 2 h and each mRNAconstruct should be translated in triplicate. The amount of each mRNA tobe used in translation reactions must be determined empirically. A range ofmRNA concentrations can be used in trial translations to determine whichconcentration results in competitive translation.

42 Daniel R. Gallie
Supplementation of the lysates with native or recombinant initiationfactors is done prior to the addition of the mRNA to be translated. Thepurification of recombinant initiation factors or factors purified from wheatgerm extract has been described for PABP (Le et al., 1997), eIF4F andeIFiso4F (Browning et al., 1992), eIF4B (Browning et al., 1987), eIF4A (Laxet al., 1986), and recombinant eIFiso4G and eIFiso4E (van Heerden andBrowning, 1994). These can be added singly or in any combination toanalyze the contribution of each to the translational regulation.
3.5.1. Luciferase assayTwo-microliter aliquots of the wheat germ translation lysate are removedfrom each reaction and added to 100 ml luciferase assay buffer (25 mMtricine, pH 8, 5 mM MgCl2, 0.1 mM EDTA, supplemented with33.3 mMDTT, 270 mM coenzyme A, and 500 mM ATP) at room tempera-ture and mixed briefly. Luciferase activity is measured following injection of100 ml of 0.5 mM luciferin using a Monolight 2010 Luminometer(Analytical Luminescence Laboratory). Each translation reaction is assayedin duplicate and the average and standard deviation for the triplicatetranslation reactions are determined. It is important that the volumeof the luciferase assay be constant for all samples as luciferase uses oxygenin the luciferase reaction and the use of equal volumes for all sampleseliminates any differences in the surface-to-volume ratio that would other-wise affect the rate of oxygen diffusion into the reaction. If it is desirable toperform a time course of translation to determine the rate of translation, 2-mlaliquots of lysate can be removed at specific time points during the reactionand assayed for luciferase activity. The slope of the curve representing theincrease in luciferase activity over time can be determined and this serves as ameasure of the rate of translation.
3.5.2. ExamplesAnalysis of the cap dependency of translation of an mRNA To examinethe extent to which a cap stimulates translation from a given mRNA, eIF4F-dependent, eIFiso4F-dependent lysate, generated by depleting wheat germlysate of eIF4F (composed of eIF4G and eIF4E) and eIFiso4F (composed ofeIFiso4G and eIFiso4E) through their binding to m7GTP-Sepharose resin,can be used to translate the mRNA in its capped and uncapped forms.Reduction of the level of eIF4E, eIF4G, eIFiso4E, and eIFiso4G up to 90to 95% can be achieved (see Fig. 3.1). This reduces the amount of these factorsto a point that competitive conditions are created, but allows a low level ofthe factors to remain to permit the 50-cap to recruit the factors to an mRNA.The eIF4F or eIFiso4F dependency of the fractionated lysate can be measuredby translating capped-luc-A50 mRNA in the fractionated lysate supplementedwith increasing amounts of purified eIF4F or eIFiso4F. The extent to whichthe reporter mRNA is translated is determined by measuring luciferase
Use of Factor-Dependent Translation Lysates 43
activity. Other reporters can be assayed accordingly or the amount of proteinproduced determined using SDS–PAGE/fluorography for radiolabeled pro-teins or Western analysis if antiserum to the protein is available. Reduction inthe level of eIF4F and eIFiso4F can reduce translation more than 95% (Gallieand Browning, 2001). Residual translational activity of the fractionated lysatemay be the result of the low level of either eIF4G and eIFiso4G remaining inthe lysate (see Fig. 3.1). Supplementation with eIF4F (up to 16 nM, thehighest concentration tested) increased reporter mRNA translation nearly10-fold in the fractionated lysate, but did not affect translation of the samemRNA in unfractionated lysate (Gallie and Browning, 2001). Supplementa-tion with eIFiso4F also increased reporter mRNA translation in the fractio-nated lysate but not in the unfractionated lysate.
Wheat germ lysate is highly message dependent because of a low concen-tration of endogenous transcripts and the high level of unengaged translationalmachinery. As a consequence, those features that increase the competitivenessof an mRNA, such as a 50-cap structure, would not be expected to provide atranslational advantage under the noncompetitive conditions that prevail innormal lysate and would only do so in fractionated lysate where translation iscompetitive. Each preparation of eIF4F-dependent, eIFiso4F-dependentlysate (or the PABP-dependent lysate) is programmed with capped oruncapped mRNAs to determine the degree to which translation is capdependent. The presence of the cap has been shown to increase translation3-fold in the eIF4F-dependent, eIFiso4F-dependent lysate and 10-fold in thePABP-dependent lysate, but has little effect in normal lysate (Gallie andBrowning, 2001). Supplementation of the PABP-dependent lysate (whichwas also reduced in the level of eIF4F and eIFiso4F, see Fig. 3.1) withincreasing amounts of eIF4F or eIFiso4F reduced the cap dependency oftranslation, indicating that the depletion of PABP in combination with thepartial reduction of eIF4F and eIFiso4F increases cap-dependent translation toa greater extent than does a reduction in eIF4F and eIFiso4F alone. Interest-ingly, the basal level of translational activity in the PABP-dependent lysatewas substantially lower than that observed in the eIF4F/eIFiso4F-dependentor complete lysates (Gallie and Browning, 2001), suggesting that in additionto eIF4F and eIFiso4F, PABP contributes to the overall translational activityof the lysate.
Just as a 50-cap provides a translational advantage in fractionated lysates,those features that reduce the competitiveness of an mRNA, such asmoderate secondary structure within the 50-leader, would be expected tobe revealed in the fractionated lysate where the lower level of initiationfactors required for removing secondary structure would reduce the abilityto melt moderate secondary structure that impairs translation. Translation ofluc reporter mRNAs containing a stable stem–loop structure in the 50-leaderin eIF4F/eIFiso4F-dependent revealed that translation is sensitive to thepresence of even moderate secondary structure (e.g., 4.5 kcal/mol) at an

[RNA]:∆G
(kcal/mol)
luc-A50 −0.9
−4.5
−21.3
−31.8
−42.9
SL7-luc-A50
SL13-luc-A50
SL19-luc-A50
SL24-luc-A50
9.6 ng/ml 2.4 ng/ml 0.5 ng/ml
100%
16.5%
16.3%
12.3%
15.7%
Light units 103
0 50 100
150
200
100%
108%
90.0%
25.6%
29.6%
Light units 103
0 25 50 75 100
Light units 1030 25 50 75 100
100%
195%
345%
37.2%
40.2%
Figure 3.2 50-Proximal secondary structure is inhibitory to translation in eIF4F/eIFiso4-F-reduced lysate. A stem^loop (SL)with a 7,13,19, or 24 base pair stemwas introduced 4 ntdownstream of the 50-terminus of luc-A50 mRNA to result in SL7 -luc-A50, SL13-luc-A50,SL19-luc-A50, and SL24-luc-A50, respectively. The free energy (DG) of the control leader(i.e., present in luc-A50) and each stem^loop construct is indicated.The lucmRNA con-structs were synthesized in vitro as capped, polyadenylated mRNAs and translated ineIF4F/eIFiso4F-dependent wheat germ lysate at three concentrations: 9.6 ng/ml (left),2.4 ng/ml (middle), and0.5 ng/ml (right).EachmRNAconstructwastranslated in triplicateand the average value and standard deviation of the absolute level of expression from eachconstructare reportedasahistogram.Luciferaseexpression isalsoindicatedasapercentage(indicated to the right of each histogram) of the SL24-luc-A50 mRNA. (Reproducedwithpermission fromGallie andBrowning,2001.)
44 Daniel R. Gallie
RNA concentration of 9.6 ng/ml (Fig. 3.2) (Gallie and Browning, 2001).A substantially more stable secondary structure in the 50-leader was requiredto inhibit translation in an unfractionated lysate (Gallie and Browning,2001). Moderately stable secondary structures inhibited translation increas-ingly in the fractionated lysate as the concentration of the input mRNAincreased (see Fig. 3.2), indicating that higher concentrations of mRNA actto titrate RNA helicase activity (e.g., from eIF4A and eIF4F). When a lowconcentration of RNA (i.e., 0.5 ng/ml) was used in the fractionated lysate,expression from mRNAs containing moderate secondary structure wasactually higher than an mRNA containing little secondary structure in its50-leader (see Fig. 3.2). This may have been a result of the sequenceintroduced to generate the secondary structure increasing the length ofthe 50-leader, a factor known to increase translation (Gallie and Walbot,1992). However, the advantage conferred by the additional sequence at alow RNA concentration was lost at higher RNA concentrations and theinhibitory effect of the moderate secondary structure was revealed (seeFig. 3.2). The lack of an inhibitory effect from the presence of moderatesecondary structure at a low RNA concentration in a fractionated lysatemay be a result of limited RNA helicase activity remaining in the lysate.Increasing the RNA concentration in the fractionated lysate would increasethe demand for RNA helicase activity. For those mRNAs containingmoderate secondary structure, the advantage of the increased length of the50-leader conferred at a low concentration of RNA is lost at higher RNAconcentrations when the secondary structure can no longer be removed by
Use of Factor-Dependent Translation Lysates 45
the limited amount of RNA helicase activity, resulting in translation inhi-bition. These data illustrate that the translation of mRNAs in a fractionatedlysate at the appropriate RNA concentration can reveal the effect of evenmoderate secondary structure on protein synthesis. Therefore, the extent towhich any mRNA leader sequence may regulate translation through thepresence of secondary structure can be measured with eIF4F/eIFiso4F-dependent or PABP-dependent lysates.
Translation of luc reporter mRNAs with an unstructured leader or with amoderately stable secondary structure in eIF4F/eIFiso4F-dependent lysatethat was supplemented with either eIF4F or eIFiso4F revealed that eIF4Fincreased translation from structured mRNA whereas eIFiso4F did not(Gallie and Browning, 2001). These results show how fractionated lysatecan be used to reveal functional differences between the eIF4F isoforms.Other depleted initiation factors, such as eIF4A or eIF4B, can be added tothe fractionated lysates to examine their impact on translation under thesecompetitive conditions. The fractionated lysates can also be used to examinethe effect of specific regulatory proteins that are not standard initiationfactors to examine their regulatory function during competitive translation.
Analysis of cap-dependent viral translational enhancer The 68 nt 50-leader (called O) of tobacco mosaic virus (TMV), a single-strand, positive-sense RNA virus, functions as a translational enhancer (Gallie and Walbot,1992; Gallie et al., 1987, 1988). O promotes release of the genomic mRNAfrom the virion particle while enhancing translation of the 50-proximal cistronencoding the replicase through a cotranslation disassembly process. Host cell40S ribosomal subunits are recruited by O to which coat protein only looselybinds (Mundry et al., 1991). During translation elongation, ribosomes syn-thesize replicase protein from the 50-cistron and simultaneously strip the coatprotein from the viral RNA. Although the genomic RNA is capped, it is anunusual mRNA in that it does not terminate with a poly(A) tail but insteadcontains a 204 nt 30-untranslated region (30-UTR). Although the TMV 30-UTR also functions as a translation enhancer (Gallie and Walbot, 1990;Leathers et al., 1993), the 30-end of the virion particle does not undergodisassembly until after replicase protein is synthesized (Wu et al., 1994),suggesting that the 30 translational enhancer cannot participate in the firstround of translation. O enhances the translation of reporter mRNAs in theabsence of other viral sequences or viral proteins, including the TMV 30-UTR. Thus, O facilitates ribosome recruitment to a virion particle in theabsence of the participation of the 30 translational enhancer, enabling itto promote translation initiation of encapsidated RNA without assistancefrom any 30-terminal regulatory element (Gallie and Walbot, 1990, 1992;Gallie et al., 1987, 1988; Leathers et al., 1993). The heat shock protein,HSP101, binds to the translational enhancer within O and is sufficient tomediate the translational enhancement associated with O (Wells et al., 1998).

067
130
670
013
03.4
3.40
00.67
Luc
exp
ress
ion
(lig
ht u
nits
)
0.670
12 2.4 1.5 0.9
0
200,000
400,000
600,000
800,000
1,000,000
1,200,000
1,400,000
0
1,000,000
2,000,000
3,000,000
4,000,000
5,000,000
6,000,000
Ω-luc-A50 (ng/ml):luc-A50 (ng/ml):
067
130
670
013
03.4
3.40
00.67
Luc
exp
ress
ion
(lig
ht u
nits
)
0.670
Fold increase:
Ω-luc-A50 (ng/ml):luc-A50 (ng/ml):
Ω-luc-A50 (ng/ml):luc-A50 (ng/ml):
Fold increase:
1.1 1.0 1.0 0.7
067
130
670
013
03.4
3.40
00.67
Luc
exp
ress
ion
(lig
ht u
nits
)
0.670
Fold increase: 83 31 7.3 3.5
0
2000
4000
6000
8000
10,000
12,000
14,000
A
B
C
Figure 3.3 O confers a translational advantage in vitrowhen the level of eIF4F, eIFiso4F,or PABP is limiting. Unfractionated (A), eIF4F/eIFiso4F-dependent (B), or PABP-dependent (C) wheat germ lysate was programmed with capped O-luc-A50 or luc-A50
46 Daniel R. Gallie

Use of Factor-Dependent Translation Lysates 47
Genetic analysis suggested that the translational activity of HSP101 requireseIF4G and eIF3 (Wells et al., 1998).
Because of the excess of unengaged translational machinery and lowlevel of endogenous transcripts in wheat germ lysate, O conferred littletranslational advantage at any RNA concentration in the unfractionatedlysate (Fig. 3.3A) (Gallie, 2002b), making a detailed analysis of this transla-tional enhancer difficult to achieve in vitro. Therefore, fractionated wheatgerm lysate was used to determine whether O would provide a translationaladvantage under the competitive conditions that prevail following theremoval of the excess translational machinery. Capped-luc-A50 and O-luc-A50 mRNAs were translated at different RNA concentrations in eIF4F/eIFiso4F-dependent lysate. At low mRNA concentrations, O failed tostimulate translation substantially as translation remained noncompetitivewhen a low mRNA concentration was used (Fig. 3.3B). However, Ostimulated translation up to 12-fold higher when the mRNA concentrationwas increased (see Fig. 3.3B), demonstrating that the stimulatory effect ofthis well-characterized translational enhancer could be revealed best whenfractionated wheat germ lysate was used.
Lysate depleted of PABP by incubating lysate with poly(A)-agarose wasalso used in the analysis of function of O in promoting translation. BecausePABP interacts with eIF4G and eIFiso4G (Le et al., 1997, 2000), theincubation of lysate with poly(A)-agarose is effective in reducing the levelof eIF4G and eIFiso4G in addition to the depletion of PABP, whereas noreduction was observed for HSP101 or other components of the transla-tional machinery (see Fig. 3.1) (Gallie, 2001; Gallie and Browning, 2001).In the PABP-dependent lysate, O conferred a translational advantage at allRNA concentrations (Fig. 3.3C) (Gallie, 2002b). The stimulatory effect ofO increased with RNA concentration, demonstrating that the analysis oftranslational regulatory elements that confer a competitive advantage to anmRNA is best revealed in fractionated lysates at a range of RNA concentra-tion that achieves a competitive condition.
Fractionated wheat germ lysate could also be used to examine the initia-tion factor requirements for the function of O. The ability of O to improvethe translation of anmRNA in PABP-dependent or eIF4F/eIFiso4F-depen-dent lysate suggests recruitment of a limited factor required for translationinitiation. Restoring the factor in question through its supplementation to
mRNAs at the concentration indicated below the histograms.The degree towhich eachmRNAwas translated was determined by luciferase assays. Luciferase activity is indi-cated as the average (from 2 ml of lysate) of three translation reactions with the standarddeviation for each construct shown. The degree to which the presence of O increasedtranslation relative to the control (i.e., fold increase) is indicated below each pair ofmRNAs for each concentration tested. (Reproduced with permission from Gallie,2002b.)

48 Daniel R. Gallie
the lysate would be expected to reduce the translational advantage conferredby O. By determining whether a factor can reduce the translational advan-tage conferred by an RNA element, the requirement for that factor can beestablished. As genetic analysis had suggested that eIF4Gwas required for theHSP101-mediated function of O (Wells et al., 1998), the requirement ofeIF4F or eIFiso4F could be examined using fractionated lysates. Capped-luc-A50 and O-luc-A50 mRNAs were translated in PABP-dependent lysate(which was reduced in eIF4F/eIFiso4F) at an RNA concentration thatprovided a substantial degree of translational enhancement. The lysate wassupplemented with either eIF4F or eIFiso4F and their effect on translationand the translational advantage conferred by O were determined. eIF4F andeIFiso4F purified from wheat do not contain eIF4A, therefore, the purifiedeIF4F and eIFiso4F were supplemented with eIF4A. The translationaladvantage conferred by O was reduced following supplementation witheIF4F but not with eIFiso4F (Gallie, 2002b), suggesting that O functionsby recruiting eIF4F when the factor is present in limiting amounts, but thatthe translational advantage conferred by O is lost when the concentration ofeIF4F is no longer limiting.
Analysis of cap-independent translation conferred by a viral 50-leader The50-leader of tobacco etch virus (TEV), a potyvirus whose genomic mRNA ispolyadenylated but naturally lacks a 50 cap structure, confers cap-independenttranslation to an mRNA and exhibits internal ribosome entry site (IRES)activity when present in the intercistronic region of a dicistronic mRNA(Carrington and Freed, 1990; Gallie, 2001; Gallie et al., 1995; Niepel andGallie, 1999). The TEV 50-leader stimulated cap-independent translation upto 73-fold in eIF4F/eIFiso4F-dependent lysate, whereas it had little to noeffect in unfractionated lysate (Gallie, 2001). Similar results were obtained forIRES activity (Fig. 3.4), indicating that these mechanisms do function in vitroand that the TEV 50-leader confers a translational advantage only underconditions of competitive translation. These results demonstrate that thecap-independent translation and IRES activity conferred by the TEV 50-leader that are not observed in normal lysate can be easily revealed whenfractionated lysate is employed.
The translational advantage conferred by the TEV IRES under theseconditions was lost when the fractionated lysate was supplemented witheIF4F (or to a lesser extent, eIFiso4F), but not when supplementedwith eIF4E, eIFiso4E, eIF4A, or eIF4B (Gallie, 2001). Supplementationof the lysate with eIF4G, the large subunit of eIF4F, specifically reduced thecompetitive advantage conferred by the TEV IRES, demonstrating that thissubunit of eIF4F was required. Addition of either eIF4A or eIF4B reducedthe translational advantage conferred by the TEV IRES only to a smallextent, but substantially improved the ability of eIF4F to reduce the trans-lational advantage conferred by the TEV IRES (Gallie, 2001). Thus, the

TEV (ng/ml):Control (ng/ml):
060
300
600
030
015
150
010
Luc
exp
ress
ion
(lig
ht u
nits
)
7.50
100
07.5
06
0
60,000
120,000
180,000
240,000
300,000
360,000
420,000
60
03
04
40
30
Fold increase: 73 28 7.7 4.5 3.4 2.3 1.7 1.5
Figure 3.4 The TEV IRES directs internal initiation in vitro under competitiveconditions. eIF4F/eIFiso4F-reducedwheat germ lysatewas programmedwith uncappedcontrol (i.e., GUS-SL-Con144-luc-A50) or uncappedTEV IRES-containing (i.e., GUS-SL-TEV-luc-A50) dicistronic constructs at the concentration indicated below thehistograms. Luciferase activity is reported as the average (from 2 ml of lysate) of threetranslation reactions with the standard deviation for each construct shown.The degreeto which the presence of theTEV 50-leader increased translation relative to the control(i.e., fold increase) is indicated beloweachpair ofmRNAs for eachconcentration tested.(Reproducedwith permission fromGallie, 2001.)
Use of Factor-Dependent Translation Lysates 49
combinatorial supplementation of fractionated lysate can be used to exam-ine the functional interaction between initiation factors during translation.
Because PABP interacts with eIF4G and eIFiso4G (Le et al., 1997, 2000),PABP-dependent lysate was used to determine whether PABP affected theextent to which the TEV 50-leader sequence functions to stimulate cap-independent translation. Depletion of PABP from the lysate following incu-bation with poly(A)-agarose was confirmed by Western, which also revealedsome reduction in eIF4G, eIFiso4G, eIF4A, eIF3, and eIF4B (see Fig. 3.1). Toexamine the activity of the TEV 50-leader in the PABP-reduced lysate,monocistronic TEV-luc-A50 mRNA and a control mRNA that contained aleader of similar length but unrelated in sequence were translated over a rangeof RNA concentrations. The TEV 50-leader stimulated translation up to95-fold when the lysate was programmed with a high level of RNA (Gallie,2001). As was observed in the eIF4F/eIFiso4F-reduced lysate, the degree towhich the TEV 50-leader stimulated cap-independent translation increasedwith an increase in RNA concentration. Similar results were obtained whenthe TEV 50-leader was tested as part of the intercistronic region of a dicistronicmRNA construct. In the PABP-reduced lysate, the TEV IRES increasedinternal initiation up to 79-fold relative to the control mRNA. These datademonstrate that PABP-dependent lysate, like eIF4F/eIFiso4F-dependentlysate, can be used to reveal and investigate IRES activity and the requirementfor specific trans-acting factors.
50 Daniel R. Gallie
REFERENCES
Browning, K. S., Maia, D. M., Lax, S. R., and Ravel, J. M. (1987). Identification of a newprotein synthesis initiation factor from wheat germ. J. Biol. Chem. 262, 538–541.
Browning, K. S., Webster, C., Roberts, J. K., and Ravel, J. M. (1992). Identification of anisozyme form of protein synthesis initiation factor 4F in plants. J. Biol. Chem. 267,10096–10100.
Bushell, M., Wood, W., Clemens, M. J., and Morley, S. J. (2001). Disruption of theinteraction of mammalian protein synthesis eukaryotic initiation factor 4B with thepoly(A)-binding protein by caspase- and viral protease-mediated cleavages. Eur.J. Biochem. 267, 1083–1091.
Carrington, J. C., and Freed, D. D. (1990). Cap-independent enhancement of translation bya plant potyvirus 50 nontranslated region. J. Virol. 64, 1590–1597.
Gallie, D. R. (2001). Cap-independent translation conferred by the 50-leader of tobacco etchvirus is eIF4G-dependent. J. Virol. 75, 12141–12152.
Gallie, D. R. (2002a). Protein-protein interactions required during translation. Plant Mol.Biol. 50, 949–970.
Gallie, D. R. (2002b). The 50-leader of tobacco mosaic virus promotes translation throughenhanced recruitment of eIF4F. Nucl. Acids Res. 30, 3401–3411.
Gallie, D. R., and Browning, K. S. (2001). eIF4G functionally differs from eIFiso4G inpromoting internal initiation, cap-independent translation, and translation of structuredmRNAs. J. Biol. Chem. 276, 36951–36960.
Gallie, D. R., Feder, J. N., Schimke, R. T., and Walbot, V. (1991). Post-transcriptionalregulation in higher eukaryotes: The role of the reporter gene in controlling expression.Mol. Gen. Genet. 228, 258–264.
Gallie, D. R., Lucas, W. J., and Walbot, V. (1989). Visualizing mRNA expression in plantprotoplasts: Factors influencing efficient mRNA uptake and translation. Plant Cell 1,301–311.
Gallie, D. R., and Walbot, V. (1990). RNA pseudoknot domain of tobacco mosaic viruscan functionally substitute for a poly(A) tail in plant and animal cells. Genes Dev. 4,1149–1157.
Gallie, D. R., and Walbot, V. (1992). Identification of the motifs within the tobacco mosaicvirus 50 leader responsible for enhancing translation. Nucl. Acids Res. 20, 4631–4638.
Gallie, D. R., Ling, J., Niepel, M., Morley, S. J., and Pain, V. M. (2000). The role of50-leader length, secondary structure and PABP concentration on cap and poly(A) tailfunction during translation in Xenopus oocytes. Nucl. Acids Res. 28, 2943–2953.
Gallie, D. R., Sleat, D. E., Watts, J. W., Turner, P. C., and Wilson, T. M. A. (1987). The50-leader sequence of tobacco mosaic virus RNA enhances the expression of foreign genetranscripts in vitro and in vivo. Nucl. Acids Res. 15, 3257–3273.
Gallie, D. R., Sleat, D. E., Watts, J. W., Turner, P. C., and Wilson, T. M. A. (1988).Mutational analysis of the tobacco mosaic virus 50-leader for altered ability to enhancetranslation. Nucl. Acids Res. 16, 883–893.
Gallie, D. R., Tanguay, R. L., and Leathers, V. (1995). The tobacco etch viral 50 leader andpoly(A) tail are synergistic regulators of translation. Gene 165, 233–238.
Goyer, C., Altmann, M., Lee, H. S., Blanc, A., Deshmukh, M., Woolford, J. L.,Trachsel, H., and Sonenberg, N. (1993). Tif4631 and Tif4632—Two yeast genesencoding the high-molecular-weight subunits of the cap-binding protein complex(eukaryotic initiation factor-4F) contain an RNA recognition motif-like sequence andcarry out an essential function. Mol. Cell. Biol. 13, 4860–4874.
Gradi, A., Imataka, H., Svitkin, Y. V., Rom, E., Raught, B., Morino, S., and Sonenberg, N.(1998). A novel functional human eukaryotic translation initiation factor 4G. Mol. Cell.Biol. 18, 334–342.
Use of Factor-Dependent Translation Lysates 51
Laemmli, U. K. (1970). Cleavage of structural proteins during the assembly of the head ofbacteriophage T4. Nature 227, 680–685.
Lax, S. R., Lauer, S. J., Browning, K. S., and Ravel, J. M. (1986). Purification and propertiesof protein synthesis initiation and elongation factors from wheat germ.Methods Enzymol.118, 109–128.
Le, H., Tanguay, R. L., Balasta, M. L., Wei, C.-C., Browning, K. S., Metz, A. M.,Goss, D. J., and Gallie, D. R. (1997). Translation initiation factors eIF-iso4G and eIF-4B interact with the poly(A)-binding protein and increase its RNA binding activity.J. Biol. Chem. 272, 16247–16255.
Le, H., Browning, K. S., and Gallie, D. R. (2000). The phosphorylation state of poly(A)-binding protein specifies its binding to poly(A) RNA and its interaction with eukaryoticinitiation factor (eIF) 4F, eIFiso4F, and eIF4B. J. Biol. Chem. 275, 17452–17462.
Leathers, V., Tanguay, R., Kobayashi, M., and Gallie, D. R. (1993). A phylogeneticallyconserved sequence within viral 30 untranslated RNA pseudoknots regulates translation.Mol. Cell. Biol. 13, 5331–5347.
Mundry, K. W., Watkins, P. A., Ashfield, T., Plaskitt, K. A., Eisele-Walter, S., andWilson, T. M. (1991). Complete uncoating of the 50 leader sequence of tobacco mosaicvirus RNA occurs rapidly and is required to initiate cotranslational virus disassemblyin vitro. J. Gen. Virol. 72, 769–777.
Niepel, M., and Gallie, D. R. (1999). Identification and characterization of the functionalelements within the tobacco etch viral 50-leader required for cap-independent translation.J. Virol. 73, 9080–9088.
Sambrook, J., Fritsch, E. F., and Maniatis, T. (1989). ‘‘Molecular Cloning.’’ Cold SpringHarbor Press, Cold Spring Harbor, NY.
van Heerden, A., and Browning, K. S. (1994). Expression in Escherichia coli of the twosubunits of the isozyme form of wheat germ protein synthesis initiation factor 4F.Purification of the subunits and formation of an enzymatically active complex. J. Biol.Chem. 269, 17454–17457.
Wei, C-C., Balasta, M. L., Ren, J., and Goss, D. J. (1998). Wheat germ poly(A) bindingprotein enhances the binding affinity of eukaryotic initiation factor 4F and (iso)4F for capanalogues. Biochemistry 37, 1910–1916.
Wells, D. R., Tanguay, R. L., Le, H., and Gallie, D. R. (1998). HSP101 functions as aspecific translational regulatory protein whose activity is regulated by nutrient status.Genes Devel. 12, 3236–3251.
Wu, X., Xu, Z., and Shaw, J. G. (1994). Uncoating of tobacco mosaic virus RNA inprotoplasts. Virology 200, 256–262.
Yisraeli, J. K., and Melton, D. A. (1989). Synthesis of long, capped transcripts in vitro by SP6and T7 RNA polymerases. Methods Enzymol. 180, 42–50.

C H A P T E R F O U R
M
IS
*
ethods
SN 0
DepaDepa
A Highly Efficient and Robust In VitroTranslation System for Expression ofPicornavirus and Hepatitis C VirusRNA Genomes
Yuri V. Svitkin* and Nahum Sonenberg†
Contents
1. In
in
076
rtmrtme
troduction
Enzymology, Volume 429 # 2007
-6879, DOI: 10.1016/S0076-6879(07)29004-4 All rig
ent of Biochemistry, McGill University, Montreal, Quebec, Canadant of Biochemistry and McGill Cancer Center, McGill University, Montreal, Quebe
Else
hts
c, C
54
2. C
ell-Free Model for EMCV Replication 552
.1. P icornavirus replication: An overview 552
.2. E xperimental results 563. M
aterials for Cell-Free Synthesis of EMCV 583
.1. A nimals, cells, virus, and viral RNA 583
.2. M edia and solutions 583
.3. O ther materials 603
.4. Is otopes 614. M
ethods for Cell-Free Synthesis of EMCV 614
.1. P ropagation and storage of Krebs-2 cells 614
.2. P reparation of Krebs-2 S10 extract 624
.3. N uclease treatment of the extract 634
.4. T ranslation protocol 634
.5. A nalyzing translation 634
.6. E MCV RNA replication protocol 644
.7. A nalyzing RNA replication 654
.8. V irus synthesis protocol 654
.9. P laque assay for infectivity 665. In
Vitro Translation of HCV RNA 665
.1. H CV replication: An overview 665
.2. G eneral characteristics of HCV RNA-directed translation andpolyprotein processing in vitro
676. M
aterials for In Vitro Translation of HCV RNA 687. M
ethods and Applications of In Vitro Translation of HCV RNA 70vier Inc.
reserved.
anada
53

54 Yuri V. Svitkin and Nahum Sonenberg
7
.1. H CV RNA in vitro translation protocol 707
.2. C haracterizing NS3 protease inhibitors 717
.3. P robing glycosylation of HCV envelope proteins 727
.4. P rotease protection assay for translocation of HCVenvelope proteins
758. P
erspectives and Future Applications 76Ack
nowledgments 79Refe
rences 79Abstract
A Krebs-2 cell-free extract that efficiently translates encephalomyocarditis virus
(EMCV) RNA and extensively processes the viral polyprotein is also capable of
supporting complete infectious EMCV replication. The system displays high
RNA synthesis activity and de novo synthesis of virus up to titers of 2 107
to 6 107 plaque-forming units (pfu)/ml. The preparation of Krebs-2 cell extract
and methods of analysis of EMCV-specific processes in vitro are described. We
also demonstrate that the Krebs-2 cell-free system translates the entire open
reading frame of the hepatitis C virus (HCV) RNA and properly processes the
viral polyprotein when supplemented with canine microsomal membranes. In
addition to processing, other posttranslational modifications of HCV proteins
take place in vitro, such as the N-terminal glycosylation of the E1 and the E2
precursor (E2-p7) and phosphorylation of NS5A. The HCV RNA-programmed
Krebs-2 cell-free extract should prove very useful as a novel screen for drugs
that inhibit NS3-mediated processing. The use of this system should help fill
the gap in understanding the regulation of synthesis and maturation of HCV
proteins. With further optimization of cell-free conditions, the entire reconstitu-
tion of infectious HCV synthesis in vitro might become feasible.
1. Introduction
The translation of the genomes of positive strand RNA viruses in cell-free systems is an important means for elucidation of the mechanisms ofvirus gene expression. Initial reports demonstrating that encephalomyocar-ditis virus (EMCV) RNA can stimulate amino acid incorporation in anextract of mammalian cells date back to the late 1960s (Aviv et al., 1971;Kerr et al., 1966; Mathews and Korner, 1970). The translation of EMCVRNA in these systems was not complete and did not yield mature viralproteins. A drastic improvement in translation efficiency of mRNAs in vitrowas achieved by employing extracts in which endogenous incorporationhad been decreased by digestion of cellular mRNAs with micrococcalnuclease rather than by preincubation at 37 to achieve ribosomal runoff(Pelham and Jackson, 1976). Nuclease-treated Krebs-2 cell extract (here-after referred to as Krebs-2 S10 extract) and rabbit reticulocyte lysate (RRL)
Viral Translation and Replication In Vitro 55
translate EMCV RNA efficiently and accurately with the formation ofalmost all virus-specific proteins (Pelham, 1978; Svitkin and Agol, 1978).Analyses of EMCV polyprotein processing in vitro by different techniquesmade it possible to delineate the organization of the picornavirus genomeand identify viral proteases responsible for cleavages (Gorbalenya et al.,1979; Jackson, 1986; Palmenberg et al., 1979; Svitkin et al., 1979). Efficienttranslation of poliovirus (PV) RNA was achieved in nuclease-treated HeLacell extracts (Molla et al., 1991). Moreover, conditions were found underwhich PV translation, RNA replication, and RNA encapsidation occur insuccession in the same test tube to produce infectious virus particles (Bartonet al., 1996; Molla et al., 1991).
We found that programming Krebs-2 S10 extracts with EMCV RNAalso yields infectious virus (Svitkin and Sonenberg, 2003). This chapterdescribes the preparation of Krebs-2 S10 extracts and the composition ofthe reaction mixture that was optimized for coupled translation–replicationof EMCVRNA and generation of infectious virus. In addition, we describea Krebs-2 cell extract-based system for translation of hepatitis C virus(HCV) RNA (Svitkin et al., 2005b). This system has made it possible forthe first time to translate the entire open reading frame of HCV in vitro andto reconstitute processing and other posttranslational modifications of HCVproteins.
2. Cell-Free Model for EMCV Replication
2.1. Picornavirus replication: An overview
The Picornaviridae RNA viruses include PV, human rhinovirus, foot-and-mouth disease virus, and EMCV. The genome of picornaviruses consists of a7- to 9-kb-long positive-strand RNA with a small viral protein (VPg) and apoly(A) tail present at the 50 and 30 terminus, respectively (Agol, 2002).Within cells, the viral RNA sequentially directs virus-specific translation andnegative strand RNA synthesis. The minus strand then serves as a templatefor the synthesis of new plus-strand RNA molecules. At a late stage ofinfection, the amplified copies of the plus-strand RNA are incorporatedinto viral capsid intermediate structures to produce virions.
Picornaviruses utilize a cap-independent internal ribosome entry site(IRES)-mediated mechanism for ribosome binding ( Jang et al., 1988;Pelletier and Sonenberg, 1988). Translation proceeds from a single initiationsite, and the expression ofmultiple virus genes occurs via processing of the viralpolyprotein. This consists of a series of cotranslational and posttranslationalcleavages, which in the case of EMCV are accomplished by the viral protease3Cpro and its precursor 3ABCpro (Gorbalenya et al., 1979; Jackson, 1986;Palmenberg et al., 1979). RNA replication involves negative and positive

56 Yuri V. Svitkin and Nahum Sonenberg
RNA synthesis and requires functions of several viral proteins (includingthe RNA polymerase 3Dpol and the genome-linked protein VPg) and cellularfactors (Paul, 2002).
2.2. Experimental results
We developed a system for complete replication of EMCV in vitro by usingan extract derived from Krebs-2 cells (Svitkin and Sonenberg, 2003). Theoptimization of this system involved studying the effects of many variables(such as salt, EMCV RNA and other component concentrations, tempera-ture, and time of incubation) on viral translation, RNA replication, andvirus yields.
In the absence of exogenous mRNA, the nuclease-treated Krebs-2 S10extract exhibits a very low level of incorporation of [35S]methionine intoproteins. When EMCV RNA is added, incorporation of [35S]methionine isrobust, and after appropriate incubation, translation yields all the known virusproteins (Fig. 4.1A). The kinetics of the appearance of P3, 3CD, and 3D (theC-terminal portion of the polyprotein) is consistent with the complete trans-lation of the viral genome over 0.5 h of incubation time. (Based on this value,the average elongation rate of the EMCV polyprotein can be estimated to benot less than 1.2 amino acids per second per ribosome. Because the time of theappearance of these polypeptides also includes the time periods required forthe initiation of translation and for processing of the respective precursorpolypeptides, the real rate of elongation is likely to be higher.) Subsequentincubation results in extensive cleavages of the L-P1–2A and P3 polypeptidesinto mature viral proteins by the viral proteases de novo (3Cpro/3ABCpro).
In addition to the virus-specific proteases, the translation of EMCVRNA yields an active RNA polymerase and other nonstructural viralproteins that are required for RNA replication. This could be demonstratedby pulse labeling of in vitro translation–RNA replication reactions with[a-32P]CTP and analysis of the newly synthesized RNAs by electrophoresis(Barton et al., 1996). The major RNA product synthesized between 4 and6 h of incubation comigrates with the full-length EMCV RNA in anagarose gel, although some slowly migrating RNA species, a putativedouble-stranded replicative-form RNA (Barton et al., 1995), is also appar-ent (Fig. 4.1B). The preferential synthesis of plus-strand RNA is consistentwith the known asymmetry of picornaviral replication in vivo (Giachetti andSemler, 1991; Novak and Kirkegaard, 1991). The time-course analysis ofplus-strand RNA synthesis reveals the maximum rate of RNA replication at4 h of incubation (Fig. 4.1B).
A small amount of the capsid protein 1B was evident in an EMCVRNAtranslation–replication reaction mixture after a 4-h incubation period,indicative of the final cleavage of 1AB, which occurs at a late stage of thematuration of virions (see Fig. 4.1A). At this time, generation of infectious

B Time (h)
1 2 3 4 5 6 8C 10
C
A
0.5 1 2 4
Time (h)
L-P1-2AP1-2AP1P3
3CD1ABC
3D
1AB/3ABC2C
1D1B
1C3C
2AL
2B
20
10
0
Time (h)0 4 8 12 20 30
PF
U/m
l (1
06)
Figure 4.1 EMCVtranslation, RNA replication, and virus synthesis in EMCVRNA-programmed Krebs-2 S10 extract. (A) Time course of synthesis and processing ofEMCV-specific proteins. EMCVRNA(20 mg/ml)was translated in the presence of [35S]methionine under standard reaction conditions. At the times indicated, 5-ml aliquots ofthe reaction mixture were withdrawn and analyzed by sodium dodecyl sulfate (SDS)^15% polyacrylamide gel electrophoresis (PAGE). An autoradiogram of the dried gel isshown. The assignment of polypeptides is based on their comparison with proteinssynthesized in EMCV-infected BHK-21 cells (Svitkin et al., 1998). An asterisk indicatesthe position of 1B. (B) Kinetics of EMCV RNA replication. EMCV RNA (10 mg/ml)-programmed reactionmixtureswerepulse labeledwith [a-32P]CTP for1 h (the labelwasadded 30 min before the times indicated on the figure). Products of RNAsynthesiswereisolated and analyzedbynative1%agarose gel electrophoresis and autoradiography.Thearrow indicates the position of single-stranded EMCV RNA. (C) Time course of theinfectivity titer of in vitro-synthesized EMCV. Reactions were programmed withEMCVRNA (10 mg/ml) at 32 for the indicated periods of time, treated with RNase A/T1, andassayed for infectivity following serialdilutions.Thedata are averages (with stan-dard deviations from the means) of three independent titer determinations. (Reprintedfrom Svitkin and Sonenberg, 2003, with permission from the American Society forMicrobiology.)
Viral Translation and Replication In Vitro 57
virus particles is first detected (Fig. 4.1C). During subsequent incubation, thevirus titer is raised exponentially, typically to 2 107 plaque-forming units(pfu)/ml. For unknown reasons, optimal RNA and virus syntheses occurredat significantly lower concentrations of input EMCV RNA than translation
58 Yuri V. Svitkin and Nahum Sonenberg
(i.e., 10 mg/ml compared to > 30 mg/ml) (Svitkin and Sonenberg, 2003).In general, the kinetics of viral functions depicted in Fig. 4.1 is consistentwith the sequential occurrence of viral translation, RNA replication, andvirus assembly in vitro.
3. Materials for Cell-Free Synthesis of EMCV
3.1. Animals, cells, virus, and viral RNA
1. Female white mice (BALB/c, 6 to 8 weeks old).2. Krebs-2 ascites carcinoma cells. These cells are available from several
laboratories (Aviv et al., 1971; Bordeleau et al., 2006; Svitkin and Agol,1978; Svitkin and Sonenberg, 2003; Villa-Komaroff et al., 1974). Theoriginal cell line is kept at the Imperial Cancer Research Institute (MillHill, London).
3. EMCV, K2 strain (Burness, 1969). The preparation and purification ofEMCV have been described (Kerr and Martin, 1972; Martin et al., 1961;Svitkin et al., 1998).
4. EMCVRNA, prepared by phenol/chloroform/isoamyl alcohol extractionof the purified EMCV. The viral RNA is purified by a 2M LiCl precipita-tion and CHROMA SPIN-1000 column chromatography as recom-mended by the manufacturer (BD Biosciences, Mississauga, ON,Canada). RNA integrity is confirmed by agarose gel electrophoresisunder denaturing conditions (Sambrook et al., 1989).
3.2. Media and solutions
All solutions used for cell-free translation experiments should be preparedusing analytical grade reagents and glass-distilled deionized water.
1. Earle’s balanced salt solution (EBSS) without calcium and magnesium(Invitrogen Corp., Carlsbad, CA).
2. Dimethyl sulfoxide (DMSO).3. Fetal bovine serum, dialyzed (Invitrogen).4. Methionine-free Dulbecco’s modified Eagle medium (DMEM) with
4.5 g/liter D-glucose, without L-glutamine and L-methionine (MP Bio-medicals, Inc., Solon, OH). The medium (500 ml) is supplementedwith 10 ml of 200 mM L-glutamine, 2 ml of 7.5% sodium bicarbonate,1 ml penicillin (10,000 U/ml)–streptomycin (10,000 mg/ml) solution,and 10 ml dialyzed fetal bovine serum.
5. Micrococcal nuclease (nuclease S7; Roche Diagnostics, Laval, QC,Canada): 15,000 U/ml (1 mg/ml). The lyophilized nuclease(15,000 U) is reconstituted by adding water (1 ml) and is stored at20 in small aliquots.

Viral Translation and Replication In Vitro 59
6. CaCl2: 75 mM.7. Ethylene glycol-bis(b-aminoethyl ether)-N,N,N 0,N 0-tetraacetic acid
(EGTA): 200 mM. A suspension of the free acid in water is neutralizedwith KOH to pH 7.3.
8. Dithiothreitol (DTT): 1 M, stored at 20 in 1-ml aliquots.9. Nucleoside 50-triphosphate solutions: 100 mM. The solutions of each
ATP (disodium salt), GTP (dilithium salt), CTP (disodium salt), andUTP (trisodium salt) (Roche Diagnostics) are prepared; their pH is thenadjusted to 6.0 to 8.0 with 9 to 15 ml of 50% (w/v) KOH per 1 ml ofthe solutions (pH indicator paper is used to monitor the pH), storedat 70.
10. Creatine phosphate (dipotassium salt, Calbiochem, San Diego, CA):1M, stored at 70.
11. Creatine phosphokinase (rabbit skeletal muscle, Calbiochem): 20 mg/ml.The lyophilized enzyme (20 mg) is reconstituted by adding 1 ml of buffercontaining 25 mM HEPES-KOH, pH 7.3, 1 mM DTT, and 10% (w/v)glycerol, stored at 70 in small aliquots.
12. Total L-amino acid mix (lacking L-methionine): 1 mM of each aminoacid. The mixture is commercially available (Promega Corp., Madison,WI) or may be prepared using an amino acid kit (Sigma-Aldrich, St.Louis, MO; this prepared mixture should be filter sterilized), stored at70 in 1-ml aliquots.
13. L-Methionine (Sigma-Aldrich): 0.4 mM solution in 1 mMDTT, storedat 70.
14. Sigmacote (Sigma-Aldrich).15. HEPES-KOH: 1 M, pH 7.7. The stock solution should be sterilized by
filtration through a 0.22-mm filter; it results in pH 7.3 after dilution.16. Buffer A (10 stock): 350 mM HEPES-KOH, pH 7.3, 1.46M NaCl,
110 mM D-glucose, filter sterilized through a 0.22-mm filter undervacuum and stored at 4. The buffer is diluted to 1 with water asrequired.
17. Buffer B: 25 mMHEPES-KOH, pH 7.3, 50 mM KCl, 1.5 mMMgCl2,1 mM DTT, prepared fresh as required.
18. Buffer C: 25 mM HEPES-KOH, pH 7.3, 1M potassium acetate,30 mM MgCl2, 30 mM DTT, prepared fresh as required.
19. Master mix: 10 mM ATP, 2 mM GTP, 2 mM CTP, 2 mM UTP,100 mM creatine phosphate, 1 mg/ml creatine phosphokinase, 19 unla-beled L-amino acids (lacking L-methionine, 0.2 mM each), 125 mMHEPES-KOH, pH 7.3. The mix is prepared using the stock solutionsabove and stored at 70 in 50-ml aliquots.
20. Salt mix (EMCV): 750 mM potassium acetate, 10 mM MgCl2, and2.5 mM spermidine (trihydrochloride), stored at 20.
21. Proteinase K stock solution (Roche Diagnostics): 20 mg/ml in water,stored at 70 in small aliquots.
60 Yuri V. Svitkin and Nahum Sonenberg
22. tRNA (Escherichia coli, Roche Diagnostics): 20 mg/ml in water, storedat 70 in small aliquots.
23. Sodium dodecyl sulfate (SDS): 10% (w/v) stock solution.24. Ethylenediaminetetraacetic acid (EDTA): 200 mM stock solution.
A suspension of the disodium salt in water is neutralized with NaOHto pH 8.0.
25. TNES buffer (2): 40 mM Tris-HCl, pH 8.0, 200 mM NaCl, 2 mMEDTA, and 2% (w/v) SDS.
26. Deproteinization solution: 0.4 mg/ml proteinase K and 50 mg/mltRNA in 1 TNES buffer, prepared fresh as required using the stocksolutions above.
27. RNase A/T1: 0.2 mg/ml RNase A and 1000 U/ml RNase T1 inwater, stored at 20 in small aliquots.
28. Trichloroacetic acid (TCA): 15%, 10%, and 5% (w/v) solutions (the 10%TCA solution is supplemented with 0.1% D,L-methionine), stored at 4.
29. Phosphate-buffered saline (PBS): 140 mMNaCl, 2.7 mM KCl, 10 mMNa2HPO4, and 1.8 mM KH2PO4, pH 7.3.
30. Phenol/chloroform/isoamyl alcohol (50:48:2) mixture, prepared usingphenol saturated with 100 mM Tris-HCl, pH 8.0. The mixture shouldbe stored protected from light at 4.
31. Ammonium acetate: 10M, stored at 20.32. 100% Ethanol, stored at 20.33. 70% Ethanol, containing 100 mM ammonium acetate, stored at 20.34. SDS sample buffer (1.5): 75 mM Tris–HCl, pH 6.8, 7.5% (v/v) 2-
mercaptoethanol, 15% (v/v) glycerol, 3% (w/v) SDS, and 0.15% (w/v)bromophenol blue.
35. Reagents and solutions for SDS–polyacrylamide gel electrophoresis(PAGE) (Sambrook et al., 1989) including 30% acrylamide stock solu-tions (with 29.7:0.3 and 29:1 acrylamide to N’,N’-methylene bisacryl-amide ratios, for preparing separating and stacking gels, respectively).
36. EN3HANCE (PerkinElmer Life Sciences, Inc., Boston, MA).37. Loading dye solution (6): 10 mM Tris–HCl, pH 7.6, 60 mM EDTA,
60% glycerol, 0.03% bromophenol blue, and 0.03% xylene cyanol FF;this solution is commercially available (Fermentas International Inc.,Burlington, ON, Canada).
38. Agarose (Biotechnology Grade).39. TBE buffer (10): 900 mM Tris base, 900 mM boric acid, and 20 mM
EDTA, pH 8.4.
3.3. Other materials
1. Filter papers, Whatman no. 1 and 3MM (Whatman, Hillsboro, OR).2. Dounce glass homogenizer (40 ml) with a tight-fitting pestle (Kontes,
Vineland, NJ).
Viral Translation and Replication In Vitro 61
3. CHROMA SPIN-1000 columns (BD Biosciences).4. Standard equipment for PAGE and agarose gel electrophoresis (Bio-Rad,
Richmond, CA), gel dryer, plastic wrap, and cellophane.
3.4. Isotopes
1. [35S]Methionine, translational grade: 1200 Ci/mmol, 10 mCi/ml(PerkinElmer Life Sciences).
2. [a-32P]CTP: 3000 Ci/mmol, 10 mCi/ml (PerkinElmer Life Sciences).
4. Methods for Cell-Free Synthesis of EMCV
4.1. Propagation and storage of Krebs-2 cells
Krebs-2 ascites tumor cells are maintained using passages in the peritonealcavity of mice (Villa-Komaroff et al., 1974).
1. Select a mouse that had been injected 8 days previously and exhibitsabdominal swelling. Euthanize the mouse by cervical dislocation oranother approved method (sedating the animal by CO2 prior to sacrifi-cing is recommended). Pin the limbs to a Styrofoam support exposingthe stomach. Saturate the skin with 70% alcohol (denatured).
2. Withdraw ascites fluid using a 10-ml syringe and a needle that allows forgood flow (18 gauge).
3. Change to a 26-gauge needle and inject 0.25 ml per mouse in the perito-neal cavity. After 8 days themicewill develop a large quantity (typically 4 to8 ml) of ascites fluid containing108 cells/ml, and their abdomens will beswollen.
4. If cell extract isolation is intended, conduct one or two additional cellpassages, so that 10 to 15 mice with well-developed tumors are obtained.
5. If cells are being frozen, add an equal volume of ice-cold EBBS contain-ing 20% DMSO to the ascites fluid. Deliver 1 ml of cell suspension(approx 5 107 cells) into each freezing vial. Place vials into NalgeneCryofreezer. Incubate overnight at 80, then transfer the vials into aliquid nitrogen storage tank.
6. To expand cells from a frozen stock, you should have one or two miceready for injection. Thaw frozen cells by briefly placing the vial into a20 water bath. Disinfect the outside of the vial with 70% alcohol(denatured). Once thawed, the cell suspension should be immediatelyused for injection (0.5 ml per mouse). Timing is important, since evenbrief storage of ascites at room temperature could result in its clotting andcell death.

62 Yuri V. Svitkin and Nahum Sonenberg
4.2. Preparation of Krebs-2 S10 extract
For efficient incorporation of [35S]methionine into proteins in vitro, it isnecessary to deplete the endogenous methionine pool. Krebs-2 S10 extractsdescribed here are neither dialyzed nor subjected to Sephadex G-25 chro-matography. Instead, the endogenous methionine is depleted by incubationof cells in methionine-free medium as described below.
1. Harvest 8-day-old liquid tumors from 10 to 15 mice into two 250-mlconical Corning tubes containing ice-cold EBSS (200 ml). Avoidcollecting bloody tumors. Mix the cell suspension after each transfer ofascites to the tubes.
2. Collect the cells by centrifugation (120g for 8 min at 4) and resuspendthem with ice-cold EBSS. Wash the cells by centrifugation through EBSSone more time as above. Note the cell volume after the second centrifuga-tion and estimate the cell number (the pellet contains3 108 cells/ml).
3. Suspend the pellet in methionine-free DMEM supplemented withfetal bovine serum and other ingredients at 107 cells/ml and dispense200 to 250 ml into each of two to four 1-liter Erlenmeyer flasks (treatedwith Sigmacote as recommended by the manufacturer). Seal the flaskswith rubber stoppers.
4. Incubate the cells for 2 h at 37 under gentle (100 rpm) agitation on arotary shaker.
5. Chill the cell suspension on ice and filter it through two layers of cheesecloth.Collect the cells by centrifugation as above and wash them with bufferA (twice as above, and once with centrifugation at 750g for 8 min).
6. Carefully remove the supernatant by aspiration. Resuspend the cells intwo packed-cell volumes of buffer B and allow them to swell for 20 min.
7. Break the cells with 15 to 30 strokes of a precooled tight-fitting Douncehomogenizer. Avoid generating bubbles by keeping the head of thepestle beneath the surface of the liquid. A decrease in viscosity andfrothing of the suspension indicate cell lysis. To confirm cell lysis, stainan aliquot of the homogenate with 0.04% trypan blue and inspect itunder a microscope. (Note: You should avoid excessive disruption ofcells, as this causes damage to the nuclei and leakage of components thatinhibit the activity of the extract; Villa-Komaroff et al., 1975.)
8. Add a one-ninth volume of buffer C. Pour the homogenate into 30-mlCorex tubes and centrifuge at 18,000g (e.g., Sorvall SS-34 rotor,12,000 rpm) for 20 min at 4. Carefully collect the supernatant with apipette (avoid collecting the upper lipid layer). Dispense the supernatantinto 200-ml aliquots. Flash-freeze the aliquots on dry ice or liquid nitrogenand store at 70. The extract remains active for several years. Repeatingfreezing and thawing of the extract decreases its activity and is notrecommended. The OD260 of the extract should be 45 to 60 units per ml.

Viral Translation and Replication In Vitro 63
4.3. Nuclease treatment of the extract
To destroy endogenous mRNA and thus reduce background translation,the extract is treated with micrococcal nuclease in the presence of CaCl2.This treatment should be carried out just before setting up translationreactions as follows.
1. Remove a 200-ml aliquot of Krebs-2 cell extract from storage and allowit to thaw in a 20 water bath. Quickly chill the extract on ice.
2. Add 2 ml micrococcal nuclease (15,000 U/ml) and 2 ml of 75 mM CaCl2per 200 ml extract. Mix and incubate at 20 for 20 min.
3. Add 3 ml of 200 mM EGTA (3 mM final concentration) to stop thereaction. Chill the extract on ice. (Note: The extract may become turbidduring nuclease treatment. This precipitate readily dissolves when theextract is supplemented with the salt mix and other components asdescribed below.)
4.4. Translation protocol
Translation reaction mixtures (20 ml) contain, by volume, 50% Krebs-2 S10extract, 10% master mix, 10% salt mix (EMCV), 5% [35S]methionine (or0.4 mM L-methionine, where indicated), and 25% mRNA solution andwater. Before assembling individual reaction mixtures, combine ingredientsthat are common to all samples. For example, to set up 19 reactions, proceedas follows.
1. To 200 ml Krebs-2 S10 extract, add 40 ml master mix, 40 ml of salt mix(EMCV), and 20 ml of [35S]methionine.
2. Dispense 15-ml aliquots of this mixture to precooled plastic tubes.3. If necessary, add components whose effects on translation are being
investigated.4. Add an appropriate amount of EMCV RNA (e.g., to 10 mg/ml final
concentration). As a control, assemble a reactionmixture without EMCVRNA. Bring the reaction volume to 20 ml with water. Gently mix eachreaction mixture.
5. Incubate the tubes at 32 as required (use Fig. 4.1A as a guide for thetiming of incubation).
6. Stop reactions by adding 40 ml of 1.5 SDS sample buffer.
4.5. Analyzing translation
For determining the incorporation of [35S]methionine into TCA-insolublematerial, withdraw 3-ml aliquots from the samples and spot them ontosquares of no. 1 Whatman filter paper (mark the squares with a pencilbefore use). Fix the proteins with cold 10% TCA containing methionine.

64 Yuri V. Svitkin and Nahum Sonenberg
Wash the filters first with 5% TCA (two times at room temperature andonce at 90) and then with 100% ethanol. Determine TCA-insolubleradioactivity by liquid scintillation counting. For more details aboutassaying TCA-insoluble radioactivity, see Svitkin and Sonenberg (2004).
To characterize translation products by PAGE, denature proteins in therest of the samples by heating (95 for 3 min). Resolve proteins by SDS–15%PAGE. (Note: For good resolution, we recommend using 12-cm or longerseparating gels with 29.7:0.3 acrylamide to N’,N’-metyhylene bisacrylamideratio.) A greater proportion of N’,N’-metyhylene bisacrylamide in the separ-ating gel should be avoided as this causes the gel to become brittle and prone tobreakage during drying. For more information on the preparation of SDS–polyacrylamide gels and separation of proteins by PAGE, refer to Sambrooket al. (1989). Following PAGE, fix the gel with amethanol/acetic acid solution(Sambrook et al., 1989) for at least 1 h. For fluorography, treat the gel first withEN3HANCEand thenwithwater (45 min each treatment). Place the gel ontotwo sheets ofWhatman 3MM paper, cover it with wet cellophane, and dry at80 for 2 h in a gel-drying apparatus. Expose the gel to X-ray film at 70(Bonner, 1983). To precisely quantify radioactivity in individual proteinbands, use the BAS-2000 analyzer (FUJI Medical Systems U.S.A., Inc.) or asimilar instrument. Individual EMCV proteins in vitro can also be detected byWestern immunoblotting as described previously (Svitkin et al., 2005a).
4.6. EMCV RNA replication protocol
RNA synthesis in EMCV RNA translation–replication reactions is assayedas described previously (Barton et al., 1996; Svitkin and Sonenberg, 2003).
1. Set up reactions in a 40-ml total volume without [35S]methionine (sub-stitute L-methionine for [35S]methionine). Use a final concentration of10 mg/ml of EMCV RNA. [Note: Excess input RNA inhibits RNAreplication (Svitkin and Sonenberg, 2003). We recommend that EMCVRNA be titrated for each extract preparation to determine its optimalconcentration.] As a negative control, use the reaction that does notcontain EMCV RNA.
2. Incubate the reaction mixtures at 32 for 4 h.3. Add 1 ml [a-32P]CTP to the reaction mixtures and continue the incuba-
tion at 32 for 1 h.4. Stop the reactions by adding 200 ml of deproteinization solution. Incu-
bate the samples at 37 for 15 min.5. Add 240 ml of the phenol/chloroform/isoamyl alcohol mixture. Vortex
for 30 sec and centrifuge at 16,000g for 1 min. Carefully recover theaqueous phases (withdraw 200 ml from each sample).
6. Precipitate the RNA with 20 ml of 10M ammonium acetate and 2 vol of100% ethanol. Store samples at 20 (overnight).

Viral Translation and Replication In Vitro 65
4.7. Analyzing RNA replication
The labeled products of RNA synthesis are unstable. Therefore, we recom-mend that this analysis be carried out no later than on the next day afterlabeling of RNA.
1. Recover RNA by centrifugation at 16,000g for 15 min at 4 (carefullyremove supernatants with a pipette). Wash the pellets with 70% ethanolby centrifugation (two times).
2. Following thorough removal of the supernatants from the last wash, drythe pellets (this may be accomplished by leaving the microcentrifugetubes open for approximately half an hour at room temperature).
3. Resuspend the RNA pellets in 40 ml 0.5 TBE containing 0.1% SDS.4. To 15-ml aliquots of the samples add 3 ml of the 6 loading dye solution.
Analyze RNA by electrophoresis using a native 1% agarose gel in 1TBE (without ethidium bromide). Marker RNAs of known sizes, suchas EMCV RNA or ribosomal RNAs, should be loaded into a slot on theside of the gel. We recommend freshly poured 5-mm-thick gels,voltage gradient of 10 V/cm, and running the bromphenol blue 8 cminto the gel for good resolution.
5. Following electrophoresis, cut the side lane off and use it to determinethe positions of themarkers by staining with ethidium bromide (Sambrooket al., 1989).
6. Fix the gel with cold 15% TCA for at least 1 h with gentle agitation on arotary shaker.
7. Briefly wash the gel with distilled water. (Note: To avoid the loss of RNAfrom the gel during blotting, the washing time should not exceed 2 min.)
8. For drying, lay the gel flat on a piece of the plastic wrap with slots pointingup. Cut five sheets of Whatman 3MM paper to a size slightly exceedingthat of the gel and place them on top of the gel. Stack precut paper towelson top of theWhatman 3MMpaper to a height of4 cm. Lay a glass plateand a weight on top of the stack. Leave this overnight; the gel should turnto a film during drying. If completely dry gel is desired, accomplish dryingof the gel under vacuum in a conventional gel dryer (2 h at 50).
9. Cover the dry gel with plastic wrap, and expose it to X-ray film. Use thefluorescent labels to allow for the alignment of the film against the gel.(Note: To increase the speed of detection, perform the autoradiographyat 70 with the use of an intensifying screen.)
4.8. Virus synthesis protocol
1. Assemble the reaction components in 40-ml reaction volumes asdescribed for assaying RNA replication (radioactive amino acids ornucleoside triphosphates are not added to these reaction mixtures at
66 Yuri V. Svitkin and Nahum Sonenberg
any time). (Note: Use a 5 to 10 mg/ml final concentration of EMCVRNA. However, for maximal virus yields, you should determine theoptimal concentration of the input RNA for each extract preparation.)Include a control reaction containing no added EMCV RNA.
2. Incubate the reaction mixtures at 32 for 8 to 20 h (use Fig. 4.1C as aguide for the timing of incubation).
3. Add 4 ml of RNase A/T1 and incubate the reaction mixtures at roomtemperature for 30 min.
4. Dilute the reaction mixtures 5-fold with PBS (add 176 ml).5. Flash-freeze the reaction mixtures on dry ice and store them at 70
until titer analysis is performed.
4.9. Plaque assay for infectivity
The numbers of plaque-forming units are measured in serially diluted in vitroreaction mixtures by standard methods (Rueckert and Pallansch, 1981).Briefly, BHK-21 cells are grown to confluency on 60-mm petri dishes,and the serial dilutions of virus are made up with DMEM containing 2%fetal bovine serum. The cell monolayers are exposed to virus (0.25 ml) for30 min at room temperature. The cells are then covered with 2.5 ml ofmedium P5 (Rueckert and Pallansch, 1981) containing 0.6% Noble agar(the agar overlay is maintained in the 44 water bath). When the overlayhardens, the liquid medium P5 overlay (2.5 ml) is added, and the plaques areallowed to develop at 37 for 26 h under 5% of CO2. The agar is thenremoved, and cell monolayers are stained with 0.1% crystal violet in 20%ethanol. After removing the stain and washing the dishes with water, theplaques appear as transparent spots (typically 1 to 2 mm diameter) on a bluebackground of adherent cells.
5. In Vitro Translation of HCV RNA
5.1. HCV replication: An overview
Hepatitis C virus (HCV) is a leading cause of chronic hepatitis and livercirrhosis in the developed world. HCV is an enveloped virus belonging tothe genus Hepacivirus in the family Flaviviridae. The virus possesses a 9.6-kb-long positive-strand RNA that is translated into a polyprotein of 3010amino acids (Reed and Rice, 2000). Akin to picornaviruses and pestiviruses,the translation of HCV RNA is IRES mediated (Pestova et al., 1998;Tsukiyama-Kohara et al., 1992).
HCV was found difficult to study owing to the lack of inexpensiveanimal models and inefficient propagation of most virus strains in cellculture. Nevertheless, data obtained through the use of transient expression

Viral Translation and Replication In Vitro 67
systems and the replicon systems have provided a general picture aboutHCV genome organization and polyprotein processing (reviewed inBartenschlager et al., 2004; Lindenbach and Rice, 2001). These studieshave suggested that the viral polyprotein is cleaved cotranslationally andposttranslationally into at least 10 polypeptides: (NH2) C-E1-E2-p7-NS2-NS3-NS4A-NS4B-NS5A-NS5B (COOH). Cleavages within the struc-tural region and at the p7/NS2 junction are mediated by host cell signalpeptidase(s) located in the lumen of the endoplasmic reticulum (ER). Thecore protein (C) is the major component of the nucleocapsid. Envelopeproteins E1 and E2 are type I transmembrane glycoproteins. The NS regionis processed by two overlapping viral proteases. The NS2–3 autoproteinasecleaves the polyprotein at the NS2/3 site. The NS3 serine proteinase withthe assistance of the NS4A cofactor cleaves the polyprotein at all sitesdownstream of the NS3 carboxy terminus. NS3 is also an RNA helicase,which, together with RNA-dependent RNA polymerase NS5B, other NSproteins, and host factors, forms a membrane-associated RNA replicationcomplex (Moradpour et al., 2004).
5.2. General characteristics of HCV RNA-directed translationand polyprotein processing in vitro
Elucidation of the mechanisms of HCV infection requires developing diversemethodological approaches. One promising way of studyingHCV replicationwould be the modeling of this process in a test tube, a method that proved towork for PV and EMCV. A major obstacle toward achieving this goal hadbeen that the systems for translation of HCV RNA in vitro were by and largeinefficient, yielding only structural proteins and aberrant products. No NS5Bwas evident, precluding the occurrence of RNA replication. We recentlydemonstrated that Krebs-2 S10 extracts translate HCV RNA completely andaccurately when supplemented with canine pancreatic microsomal mem-branes (CMMs) (Svitkin et al., 2005b). CMMs are known to mediate proces-sing, such as signal peptide cleavage, membrane insertion, translocation, andcore glycosylation of proteins (Walter and Blobel, 1983). However, wereported for the first time that in HCV RNA-programmed Krebs-2 extract,CMMs supportmostNS3 protease-mediated cleavages and also stabilizeHCVmRNA during translation.
To establish conditions that would allow translation of the entire openreading frame of HCV RNA in vitro, the RNA transcribed from theinfectious H77 HCV cDNA clone was used to program nuclease-treatedcytoplasmic extracts from different sources, such as Krebs-2, Huh7, andHeLa cell extracts, as well as commercially available RRL (Svitkin et al.,2005b). CMMs were included in all the systems in order to facilitateprocessing and maturation of proteins. The expression of HCV proteins wasmost efficient with Krebs-2 and Huh7 S10 extracts (Svitkin et al., 2005b).

68 Yuri V. Svitkin and Nahum Sonenberg
Because the Krebs-2 S10 extract performed more reliably and was availablein larger quantities, as compared to Huh7 S10 extract, it had been chosenfor further optimization. The translation of HCV RNA exhibited anunusually high potassium salt optimum for an uncapped mRNA (i.e.,160 mM ), and was much more accurate with KCl than potassium acetate(data not shown). The advantage of the use of KCl rather than potassiumacetate for the synthesis of authentic as opposed to abnormal products hasalso been demonstrated in the systems translating other viral RNAs ( Jackson,1991; Svitkin et al., 1981). HCV RNA did not differ from most mRNAwith respect of magnesium salt concentration optimum for translation(2.5 mM ).
Under optimal ionic conditions, the CMMs-supplemented Krebs-2 S10extract is highly efficient in the translation of HCV (H77C) RNA (Fig. 4.2,left panel). The products in vitro are similar in size to authentic HCV proteins(i.e., the core protein [C], E1, NS2, NS3, NS4B, NS5A, and NS5B). Weconfirmed the identity of the products in vitro byWestern blot analyses usingantibodies against C, E1, E2, NS3, NS5A, and NS5B (Svitkin et al., 2005b).A time-course experiment demonstrated that NS5B, which corresponds tothe C-terminal portion of the polyprotein, first appeared at 90 min. Such alate appearance of NS5B is surprising, given the fact that in EMCV RNA-programmed translation extracts the C-terminal polypeptide P3 and itscleavage products appear by 30 min (the coding region of EMCV RNA isshorter than that of HCV RNA by only 24%). Thus, the translation rate ofHCV RNA in vitro may be significantly slower than that of EMCV RNA.Alternatively, slow HCV polyprotein processing, in particular cleavage atthe NS5A/5B junction, may be responsible for the relatively late appearanceof NS5B. Importantly, the RNA of the JFH1 genotype 2a HCV isolate(Wakita et al., 2005) also directed, in a CMM-dependent manner, thesynthesis of mature viral proteins (Fig. 4.2, right panel). Thus, the systemdescribed is applicable for the expression of proteins of different HCVgenotypes.
6. Materials for In Vitro Translation ofHCV RNA
1. Infectious HCV cDNA clones, pCV-H77C (Yanagi et al., 1997) orpJFH1 (Kato et al., 2001), were used. pCV-H77C was a kind gift fromJens Bukh and Robert Purcell (National Institutes of Health, Bethesda,MD). pJFH1 was kindly provided by Takaji Wakita (TokyoMetropolitan Institute for Neuroscience, Tokyo, Japan).
2. Uncapped HCV RNA was transcribed from pCV-H77C or pJFH1using RiboMAX large-scale RNA production protocol (Promega

NS3NS5BNS5A
NS4B
NS2C
E1***
E1
CMMs −− −
+ ++
− − ++ ++HCV RNA
HCV 1a (H77) HCV 2a (JFH1)
220
97
66
45
30
20
Mr
1 2 3 4 5 6
Figure 4.2 Products of HCVRNAtranslation in Krebs-2 S10 extract.The assays wereperformed with genotype 1a, strain H77 (lanes 3 and 4) or genotype 2a, strain JFH1(lanes 5 and 6) HCV RNA (20 mg/ml) in the absence ( lanes 3 and 5) or presence (þlanes 4 and 6) of CMMs. Incubation in the presence of [35S]methionine was at 32 for3 h.Translation products were resolved by SDS^15% PAGE and detected by fluorogra-phy. Analyses of reaction mixtures that did not contain mRNA are shown in lanes 1and2.The assignment of genotype 1a (H77) HCVpolypeptides is based on their reactivitywith corresponding antibodies inWestern blotting (Svitkin et al., 2005b). E1 * * * is theform of E1 that lacks carbohydrate (see below). E2-p7 glycoprotein is highly heteroge-neous and requires a longer exposure of the gel to the film for detection (data notshown). NS4A (6-kDa polypeptide) is expressed in the presence of CMMs, and couldbe resolved on a higher percentage polyacrylamide gel (18% acrylamide; data notshown). The positions of the 14C-methylated protein molecular weight markers (GEHealthcare) are shown at the right.
Viral Translation and Replication In Vitro 69
Corp.). Prior to transcription, the plasmids were linearized with XbaIand treated with mung bean nuclease to remove the unpaired vector-derived nucleotides. HCV RNA is purified by 2 M LiCl precipitationand CHROMA SPIN-1000 column chromatography as recommendedby the manufacturer. The integrity of HCV RNA should be confirmedby denaturing agarose gel electrophoresis (Sambrook et al., 1989).
3. CMMs, available commercially (Promega Corp.), are stored at 70.4. CMM storage buffer: 50 mM triethanolamine, 2 mM DTT, and
250 mM sucrose, stored at 70.5. Salt mix (HCV): 1 M KCl, 5 mM MgCl2, and 2.5 mM spermidine
(trihydrochloride), stored at 20. (Note: Potassium and magnesiumconcentrations in this mixture may need to be optimized.)

70 Yuri V. Svitkin and Nahum Sonenberg
6. RNase/EDTA solution (10): 5 mg/ml RNase A and 100 mMEDTA, pH 8.0, stored at 20.
7. PNGase F (N-glycosidase F, recombinant, lyophilisate; Roche Diag-nostics). The content of the bottle (100 U) is dissolved in 0.1 ml waterand stored at 4.
8. Nonidet P-40 (NP-40): 10% solution.9. PNGase F buffer 1: 5 mM EDTA, 2% 2-mercaptoethanol, and 2% SDS,
prepared fresh as required.10. PNGase F buffer 2: 50 mM sodium phosphate, pH 7.5, 5 mM EDTA,
and 0.1% SDS, prepared fresh as required.11. PNGase F buffer 3: 50 mM sodium phosphate, pH 7.5, 5 mM EDTA,
1%-mercaptoethanol, 2% NP-40, and complete protease inhibitorcocktail (Roche Diagnostics), prepared fresh as required.
12. Proteinase K solution (0.3 mg/ml), prepared fresh as required by dilut-ing the proteinase K stock solution with water.
13. CaCl2: 200 mM.14. Phenylmethylsulfonyl fluoride (PMSF): 10 mg/ml in isopropanol,
prepared fresh as required.15. Western Lightning Chemiluminescence kit (PerkinElmer Life Sciences).16. CHROMA SPIN-10 columns (BD Biosciences).17. 100% Methanol (or 70% acetone), stored at 20.
Other materials are the same as used for EMCV synthesis.
7. Methods and Applications of In VitroTranslation of HCV RNA
7.1. HCV RNA in vitro translation protocol
Conditions for the translation of HCV RNA in vitro are similar to thosedescribed for EMCV RNA, except a higher KCl concentration is used andCMMs are included in the reaction cocktail. Final reaction mixtures contain9 ml of Krebs-2 S10 extract, 1ml of CMMs (or CMM storage buffer, whereappropriate), 2 ml of master mix, 2 ml of salt mix (HCV), 1 ml of [35S]methionine, and 0.4 mg of HCV RNA. (Note: To optimize the processingof HCV polyprotein, the amount of CMMs used in the reaction mixturemay need to be titrated.) The reaction mixtures are reconstituted to the finalvolume of 20 ml with water. Incubation is at 32 for 3 h. Reactions arestopped by the addition of 40 ml of 1.5 SDS-sample buffer. [35S]Methio-nine incorporation is assayed in 3-ml aliquots of the samples as detailedabove. The gel banding pattern of translation products is visualized byfluorography after SDS–15% PAGE of the samples. (Note: Upon incubationwith [35S]methionine, some Krebs-2 S10 preparations produce a broad
Viral Translation and Replication In Vitro 71
background band of 20 to 30 kDa. This band, presumably representing [35S]methionyl-tRNA, can be greatly reduced or eliminated if reactions areterminated by adding 2 ml of RNase/EDTA solution followed by incuba-tion at 32 for 5 min. If detection of particular virus proteins is desired,Western blotting as detailed previously can be used (Svitkin et al., 2005b).
7.2. Characterizing NS3 protease inhibitors
We previously evaluated the use of the HCV RNA-programmed Krebs-2 S10 extract for characterizing the specificity of NS3 serine proteaseinhibitors, potential therapeutic agents of HCV infection (Svitkin et al.,2005b). The NS3 protease is known to be sensitive to inhibition by specificpentapeptides and hexapeptides derived from the amino terminal NS3cleavage products (Tan et al., 2002). One highly specific inhibitor of NS3activity (compound A) was shown to dramatically reduce replication of asubgenomic HCV RNA in Huh7 cells (Pause et al., 2003; Tsantrizos et al.,2003). This compound, kindly provided by Daniel Lamarre and Michael G.Cordingley [Boehringer Ingelheim (Canada) Ltd., Laval, QC, Canada], wasassayed for its ability to inhibit HCV polyprotein processing in vitro. At 0.25to 1000 nM concentrations, compound A did not have an effect on [35S]methionine incorporation into protein in HCV RNA-programmed trans-lation reactions (Svitkin et al., 2005b). However, it decreased the accumu-lation of the mature viral proteins derived from the NS3-NS5B portion ofthe polyprotein (Fig. 4.3). At 50 mM and higher concentrations of com-pound A, the NS4B and NS5A bands disappeared and the intensities of theNS3, NS2–3, and NS5B bands were significantly reduced. Concomitantly,the enhanced accumulation of the high-molecular-weight precursor polypep-tides was evident. As expected, compound A did not inhibit the cleavagescarried out by a cellular signal peptidase(s), i.e., appearance of proteins C,E1 (E1 * and E1 * * * glycosylation forms), and NS2. These results validatethe HCV RNA in vitro translation assay for testing the specificities and po-tencies of NS3 inhibitors. To characterize an NS3 inhibitor by this method,proceed as follows.
1. Prepare the serial dilutions of the compound. (Note: Many compoundsare only slightly soluble in water and their stock solutions may have to bemade up with 100% DMSO. Because DMSO inhibits in vitro translation,it should be present in the serial dilutions at 1% or lower concentrations.)
2. Add 1 ml of each dilution to a 20-ml reaction mixture containing CMMs,[35S]methionine, HCV RNA, and other components as specified above.Include a control HCV RNA translation reaction supplemented withthe solvent alone.
3. Incubate at 32 for 3 h.4. Stop the reactions by adding 40 ml of 1.5 SDS sample buffer.
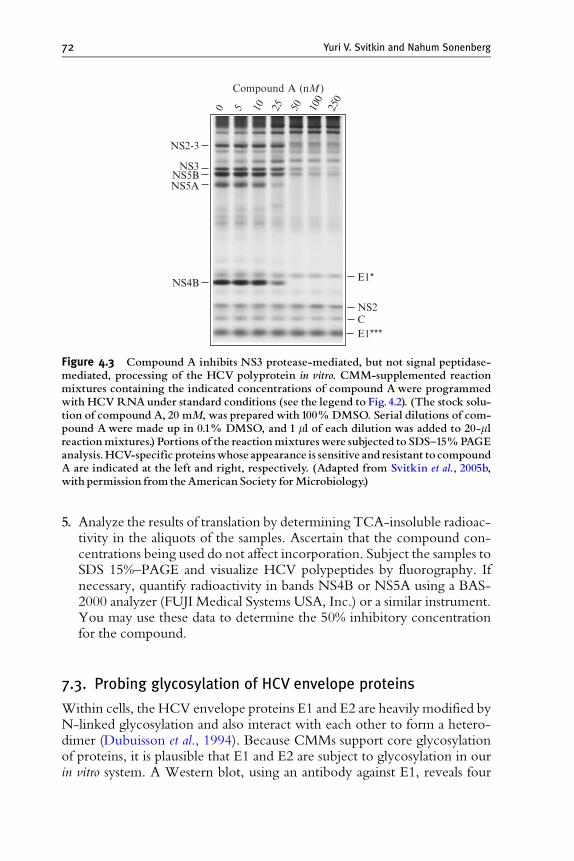
NS2-3
NS3NS5BNS5A
NS4B
CE1***
0 5 10 50 100
250
25
Compound A (nM)
NS2
E1*
Figure 4.3 Compound A inhibits NS3 protease-mediated, but not signal peptidase-mediated, processing of the HCV polyprotein in vitro. CMM-supplemented reactionmixtures containing the indicated concentrations of compound Awere programmedwith HCVRNAunder standard conditions (see the legend to Fig.4.2). (The stock solu-tion of compound A, 20 mM, was prepared with 100%DMSO. Serial dilutions of com-pound Awere made up in 0.1% DMSO, and 1 ml of each dilution was added to 20-mlreactionmixtures.) Portions of the reactionmixtureswere subjected to SDS^15%PAGEanalysis.HCV-specific proteinswhose appearance is sensitive and resistant to compoundA are indicated at the left and right, respectively. (Adapted from Svitkin et al., 2005b,with permission from theAmerican Society forMicrobiology.)
72 Yuri V. Svitkin and Nahum Sonenberg
5. Analyze the results of translation by determining TCA-insoluble radioac-tivity in the aliquots of the samples. Ascertain that the compound con-centrations being used do not affect incorporation. Subject the samples toSDS 15%–PAGE and visualize HCV polypeptides by fluorography. Ifnecessary, quantify radioactivity in bands NS4B or NS5A using a BAS-2000 analyzer (FUJI Medical Systems USA, Inc.) or a similar instrument.You may use these data to determine the 50% inhibitory concentrationfor the compound.
7.3. Probing glycosylation of HCV envelope proteins
Within cells, the HCV envelope proteins E1 and E2 are heavily modified byN-linked glycosylation and also interact with each other to form a hetero-dimer (Dubuisson et al., 1994). Because CMMs support core glycosylationof proteins, it is plausible that E1 and E2 are subject to glycosylation in ourin vitro system. A Western blot, using an antibody against E1, reveals four

Viral Translation and Replication In Vitro 73
products differing in the extent of glycosylation of E1 antigens, p29 (E1), p25(E1 *), p22 (E1 * *), and p18 (E1 * * *), where E1 and E1 * * * representcompletely glycosylated and unglycosylated forms, respectively, and E1 *and E1 * * are hypoglycosylated forms (Fig. 4.4A, lane 5; see also Svitkinet al., 2005b). All these forms of E1 are also detectable by autoradiography(Fig. 4.4A, lane 2). Digestion with PNGase F, which removes both high-mannose and complex glycans from glycoproteins (Maley et al., 1989), causesalmost complete loss of E1, E1 *, and E1 * * due to their conversion to E1 * * *and a slightly slower migrating 18.5-kDa polypeptide (Fig. 4.4A, lanes 3 and6), an apparent product of incomplete deglycosylation of E1 (Dubuisson et al.,1994; Svitkin et al., 2005b). E2 in vitro appears as a fusion protein, E2-p7,which is barely detectable due to its extreme heterogeneity (Fig. 4.4A, lane 5and Svitkin et al., 2005b). Deglycosylation by PNGase F downshifts all E2-p7bands to the position of migration of the nonglycosylated species, therebyfacilitating visualization of this protein after PAGE/fluorography or Westernblotting (Fig. 4.4A, lanes 3 and 6). The following procedure could be used fordeglycosylation of HCV envelope glycoproteins in vitro.
1. Set up an HCV RNA translation reaction (20 ml) with CMMs-supple-mented Krebs-2 S10 extract and [35S]methionine. Include a controlreaction containing no added mRNA.
2. Incubate at 32 for 3 h.3. Add 20 ml of PNGase F buffer 1. Denature proteins by heating them at
95 for 5 min. Quickly microcentrifuge the samples.4. Exchange the protein buffer solution for PNGase F buffer 2 by centri-
fugation of the samples through CHROMA SPIN-10 columns at roomtemperature (follow the manufacturer’s recommendations for pre-equilibration of the columns with PNGase F buffer 2).
5. To flow-through fractions add equal volumes of PNGase F buffer 3containing complete protease inhibitor cocktail. Divide each sampleinto two equal portions.
6. Incubate one portion in the absence and another in the presence of 4 Uof PNGase F at 37 overnight.
7. At the end of the incubation, add 4 ml of 100% TCA. Incubate on icefor 30 min and collect the precipitates by centrifugation (16,000g for10 min). Wash the pellets three times with 1 ml of ice-cold 100%methanol (alternatively, you may use 70% acetone). Carefully removethe supernatants and air-dry the pellets.
8. Resuspend the pellets in 40 ml of 1 SDS sample buffer.9. Dissolve the proteins by heating, first at 37 for 1 h and then at 95 for
10 min.10. Subject the samples to SDS–15% PAGE. Detect HCV proteins that
are sensitive to deglycosylation by fluorography or Western blotting(see above).

NP-40 Proteinase K
NS3NS5BNS5A
NS4B
E1***
E1
NS2
NS2-3
C
1 2 3 4
− +++−−
*
*
B
A
PNGase F++
− − +− ++
− − +−HCV RNA
E2-p7*
E2-p7
NS3NS5BNS5A
NS4B
NS2
E1***
E1
E1*
E1**
NS2-3
Autoradiograph Western blot1 2 3 4 5 6
a-E2
a-E1
Figure 4.4 Assays for glycosylation and translocation of HCV envelope proteins.(A) The translation of HCVRNAwas carried out in the CMM-supplemented Krebs-2S10 extract under standard conditions (see the legend to Fig. 4.2). The reaction wasstopped by the addition of PNGase F buffer 1, and proteins were denatured by heating.
74 Yuri V. Svitkin and Nahum Sonenberg

Viral Translation and Replication In Vitro 75
7.4. Protease protection assay for translocation of HCVenvelope proteins
Because N-glycosylation exclusively takes place in the ER, the bulk of bothE1 and E2-p7 polypeptide chains should be translocated into the lumen ofthe ER. As a proof of translocation, the protection of the protein from theaction of exogenously added protease is generally used. Conversely, degra-dation in the absence of detergent indicates a cytosolic location. Probing forHCV E1 translocation by protease protection is illustrated in Fig. 4.4B. Themajority of HCV proteins are extensively degraded after proteinase Ktreatment, consistent with their exposure on the cytosolic face of the ER.However, E1 and the 18-kDa polypeptide (presumably E1 * * *) are resistantto digestion in the absence but not in the presence of NP-40. This fact isconsistent with the transport of the most N-terminal part of E1 across thetranslocation sites in the ER membrane. The protocol below describes howto test the resistance of HCV proteins in vitro to proteolysis by proteinase K(Schmidt-Rose and Jentsch, 1997).
1. Set up an HCV RNA translation reaction in a 60-ml volume; includeCMMs and [35S]methionine in the reaction mixture.
2. Incubate at 32 for 3 h. Stop the reaction by placing the reaction tubeon ice.
3. Add 3 ml of 200 mM CaCl2 (to a final CaCl2 concentration of10 mM ).
The sample solutionwas then exchanged for PNGase F buffer 2 by CHROMASPIN-10column chromatography.The flow-through fractionwas supplemented with PNGase Fbuffer 3 and divided into two aliquots. One aliquot was incubated in the absence ()and another in the presence (þ) of PNGase F as described in the text.Translation pro-ducts were resolved by SDS^15% PAGE, blotted onto a nitrocellulose membrane, anddetected by autoradiography (left panel).The upper and the lower portions of the mem-brane were then probed with the antibodies against HCVglycoproteins (E2 and E1,respectively) using theWestern Lightning Chemiluminescence kit (right panel). Ana-lyses of a control reaction mixture that received no HCVRNAare shown in lanes 1and4. E1 *andE1 * *are putative hypoglycosylated forms of E1, and E1 * * * is unglycosylatedE1. Arrowheads indicate E1was not completely deglycosylated by PNGase F digestion(18.5-kDa polypeptide). E2-p7 * (44-kDa polypeptide) is the putative E2-p7 proteinbackbone (Svitkin et al., 2005b). (For unknown reasons, CHROMA SPIN-10 columnchromatography and TCA precipitation remove the core protein from the samples.)(Adapted from Svitkin et al., 2005b, with permission from the American Society forMicrobiology.) (B) Protease-protection assay for translocation of E1 in vitro. HCVRNAwas translated in the CMM-supplemented Krebs-2 S10 extract as above.The incubationmixturewas then divided into four equal portions. One portionwas left untreated (lane1), while other portionswere incubated in the absence (; lane 2) or presence (þ; lanes 3and 4) of proteinase K, and in the absence (; lanes 2 and 3) or presence (þ; lane 4) ofNP-40 as described in the text.The positions of HCVproteins are indicated at the left.Asterisksmarkthe positions of protease-protected proteins.
76 Yuri V. Svitkin and Nahum Sonenberg
4. Withdraw three 16-ml aliquots into fresh microcentrifuge tubes.5. To one aliquot add 2 ml of proteinase K solution (0.3 mg/ml) and 2 ml
of water. To another aliquot add 2 ml of each proteinase K solution and10% NP40. Supplement the third (control) aliquot with water alone(4 ml).
6. Incubate at 0 for 60 min.7. Stop digestion by adding 2 ml of 10 mg/ml PMSF and 2 ml of 200 mM
EGTA (add these components to all the samples).8. Add 48 ml of 1.5 SDS sample buffer.9. Denature the proteins by heating them at 95 for 15 min. Quickly
microcentrifuge the samples.10. Analyze the samples by SDS–15% PAGE and fluorography. Alterna-
tively, transfer the proteins to a nitrocellulose membrane for Westernblot analysis.
This technique is also applicable for analysis of E2-p7 topology. How-ever, for reliable detection, the E2-p7 glycoprotein should be renderedhomogeneous by deglycosylation. Thus, the analysis of E2-p7 localizationwould require conducting steps 3 to 10 in the previous section after step 7 inthis section.
8. Perspectives and Future Applications
Although any cell and tissue could potentially be used as a source oftranslational extract, RRL is a system of choice for many researchers due toits superior translation rate and commercial availability ( Jackson and Hunt,1983). However, RRL tends to use spurious initiation sites on somemRNAs, such as PV RNA, an adverse feature not characteristic of HeLaor Krebs-2 S10 extracts (Dorner et al., 1984). The added disadvantage ofRRL is its relatively low cap and poly(A) tail dependence (Munroe andJacobson, 1990; Svitkin et al., 1996). Finally, RRL does not supportpicornavirus replication to any measurable extent (data not shown). BecauseKrebs-2 cells are highly permissive for EMCV growth, we chose these cellsas a source of an extract for modeling of EMCV replication in vitro. We alsofavored the Krebs-2 S10 extract over other translation systems because of itsreproducible performance, low cost, and ease to prepare in large quantities.
Similar to the HeLa cell-free system for de novo poliovirus replication(Barton et al., 1996; Molla et al., 1991), the Krebs-2 S10 extract supports thecoordinated functions necessary for synthesis of EMCV and mengovirus(Fata-Hartley and Palmenberg, 2005; Svitkin and Sonenberg, 2003). Theexpression of virus genomes in this system has proved to be useful forstudying translational regulation of EMCV (Svitkin et al., 2005a) and the
Viral Translation and Replication In Vitro 77
mechanisms of action of anticardiovirus drugs (Fata-Hartley andPalmenberg, 2005). A pertinent question is whether or not the Krebs-2S10 extract is capable of supporting replication of picornaviruses notbelonging to the Cardiovirus genus. We found that the Krebs-2 S10 extractsynthesizes infectious PV when programmed with PV RNA; however, thissynthesis was 10 to 20 times less robust than that carried out by the HeLaS10 extract (data not shown). Conversely, EMCV replicated more effi-ciently in Krebs-2 than in HeLa S10 extract. Thus, extracts from cells towhich a particular virus is adapted seem to be best suited for this virussynthesis.
An obvious inconvenience of the viral RNA-programmed translation–replication assays is the need to grow infectious viruses for the purpose oftemplate RNA preparation. However, recent studies have validated syn-thetic picornavirus RNAs with a ribozyme at the 50-end as mRNAs for cell-free reactions (Fata-Hartley and Palmenberg, 2005; Herold and Andino,2000). The hammerhead ribozyme catalyzes the removal of 50 nonviralnucleotides that strongly inhibit plus-strand RNA synthesis. Importantly,with the use of this technique it has become possible to uncouple reactionsinvolved in minus- and plus-strand RNA synthesis and conduct mutationalanalysis of picornaviruses in vitro (Fata-Hartley and Palmenberg, 2005;Herold and Andino, 2000).
Several features distinguish virus synthesis in a cell-free environmentfrom that in vivo (Barton et al., 2002). One is that in vitro, the input RNA ispresent in a close-to-saturating concentration and the competition fromcellular mRNAs for translation is lacking. Under these conditions, viraltranslation proceeds with the maximum rate already in the beginning ofincubation. In contrast in vivo, virus protein synthesis is heavily dependenton the synthesis of new viral mRNAs taking place in the middle of theinfection cycle. We recently emphasized the importance of using a lowconcentration of the input EMCV RNA and an extract that was notnuclease treated for recapitulating the regulation of EMCV translation by4E-BPs (eIF4E-binding proteins) observed in vivo (Svitkin et al., 2005a).
An apparent limitation for virus RNA synthesis in vitro is a short supplyof nucleoside triphosphates at a time when this synthesis is occurring.Raising the concentration of creatine phosphate, which was also shown toincrease by about 3-fold maximal titers of EMCV in vitro (Svitkin andSonenberg, 2003), provides a partial solution to this problem. A muchmore radical solution is the substitution of a dialysis or continuous-flowcell-free system for the conventional batch system (Mikami et al., 2006b).Under the latter conditions, not only are the NTPs maintained at constantlevels during RNA synthesis, but also the waist products are continuouslyremoved from the incubation mixture. That RNA synthesis after EMCVRNA translation proceeds more efficiently in the dialysis system than in the
78 Yuri V. Svitkin and Nahum Sonenberg
system utilizing the batch protocol has recently been demonstrated(H. Imataka, personal communication).
The Krebs-2 S10 extract also completely translates HCV RNA,provided that it is supplemented with CMMs. No products resulting frominitiation at spurious internal sites on HCV RNA have been detected,attesting to the high fidelity of translation initiation in this system (Svitkinet al., 2005b). The appearance of almost all mature virus proteins is consis-tent with efficient processing of the viral polyprotein in vitro by host signalpeptidase(s) and virus-specific proteases, NS3 and NS2–3. Realization ofcotranslational and posttranslational modifications of newly synthesizedHCV proteins is another important asset of the system. In the presence ofCMMs, four products differing in the extent of glycosylation of E1 aresynthesized. A similar glycosylation pattern of E1 was revealed in cellstransiently expressing HCV glycoproteins (Dubuisson et al., 1994). Theabsence of the discrete E2 band is attributed to incomplete N-linkedglycosylation and the lack of cotranslational cleavage at the E2-p7 junction.Why these E2 maturation events cannot be recapitulated in vitro withcomplete fidelity is not known. However, the release of E2 from theN-terminus of p7 is also inefficient in vivo (Lin et al., 1994; Selby et al.,1994). We also noted that band NS5A shifted slightly upward upon chase orprolonged incubation (Svitkin et al., 2005b). The treatment with phospha-tase, on the other hand, increased the electrophoretic mobility of NS5Abut not of other HCV proteins. This result provides evidence forphosphorylation of NS5A in vitro.
It should be noted that even under optimal conditions, there is acessation of HCV RNA translation in vitro after 60 min of incubation(Svitkin et al., 2005b). The decay of HCV mRNA cannot fully account forthis effect. In fact, we found that in the CMM-supplemented Krebs-2 S10extract, almost 90% of HCV RNA remains intact over the 60-min incuba-tion period. A likely possibility is that eIF2a and eIF2a-kinases becomephosphorylated in the presence of ATP and the ATP-regenerating systemand that these modifications cause the inhibition of translation initiation(Kaufman, 2000; Mikami et al., 2006a). Obviously, eIF2a phosphorylationwould preclude the occurrence of new rounds of translation initiationin vitro irrespective of the nature of mRNA in use.
Despite efficient expression of NS5B and other components of the HCVRNA replication complex in the Krebs-2 S10 incubation mixture, ourattempts to detect [a-32P]CTP incorporation into minus- and plus-strandHCV RNAs in this system were not successful. In this regard, the Huh-7.5cell line that can be productively infected with the JFH1 HCV isolate(Lindenbach et al., 2005; Wakita et al., 2005) seems superior to Krebs-2 cells as a potential source of HCV RNA replication-competent extracts.Future studies would seek to identify components and conditions essentialfor infectious HCV synthesis in vitro.

Viral Translation and Replication In Vitro 79
ACKNOWLEDGMENTS
We thank Jens Bukh, Robert Purcell, and Takaji Wakita for the infectious HCV cDNAclones, Ralf Bartenschlager, Michinori Kohara, Darius Moradpour, Jane A. McKeating, andMichael Houghton for the antibodies against HCV proteins, Daniel Lamarre and Michael G.Cordingley for compound A and helpful discussions, and Sandra Perreault and Colin Listerfor excellent technical assistance. We are also grateful to Vadim I. Agol for advice on thepreparation of the Krebs-2 cell-free translation system and Hiroaki Imataka for communi-cating his unpublished results to us. This work was supported by grants from the CanadianInstitute of Health Research (CIHR) to N.S. N.S. is a CIHR Distinguished Scientist and aHoward Hughes Medical Institute International Scholar.
REFERENCES
Agol, V. I. (2002). Picornavirus genome: An overview. In ‘‘Molecular Biology of Picorna-viruses’’ (B. L. Semler and E.Wimmer, eds.), pp. 127–148. ASM Press,Washington, DC.
Aviv, H., Boime, I., and Leder, P. (1971). Protein synthesis directed by encephalomyocardi-tis virus RNA: Properties of a transfer RNA-dependent system. Proc. Natl. Acad. Sci.USA 68, 2303–2307.
Bartenschlager, R., Frese, M., and Pietschmann, T. (2004). Novel insights into hepatitis Cvirus replication and persistence. Adv. Virus Res. 63, 71–180.
Barton, D. J., Black, E. P., and Flanegan, J. B. (1995). Complete replication of poliovirusin vitro: Preinitiation RNA replication complexes require soluble cellular factors for thesynthesis of VPg-linked RNA. J. Virol. 69, 5516–5527.
Barton, D. J., Morasco, B. J., and Flanegan, J. B. (1996). Assays for poliovirus polymerase,3DPol, and authentic RNA replication in HeLa S10 extracts. Methods Enzymol. 275,35–57.
Barton, D. J., Morasco, B. J., Smerage, L. E., and Flanegan, J. B. (2002). Poliovirus RNAreplication and genetic complementation in cell-free reactions. In ‘‘Molecular Biology ofPicornaviruses’’ (B. L. Semler and E. Wimmer, eds.), pp. 461–469. ASM Press,Washington, DC.
Bonner, W.M. (1983). Use of fluorography for sensitive isotope detection in polyacrylamidegel electrophoresis and related techniques. Methods Enzymol. 96, 215–222.
Bordeleau, M. E., Mori, A., Oberer, M., Lindqvist, L., Chard, L. S., Higa, T.,Belsham, G. J., Wagner, G., Tanaka, J., and Pelletier, J. (2006). Functional characteriza-tion of IRESes by an inhibitor of the RNA helicase eIF4A.Nat. Chem. Biol. 2, 213–220.
Burness, A. T. (1969). Purification of encephalomyocarditis virus. J. Gen. Virol. 5, 291–303.Dorner, A. J., Semler, B. L., Jackson, R. J., Hanecak, R., Duprey, E., and Wimmer, E.
(1984). In vitro translation of poliovirus RNA: Utilization of internal initiation sites inreticulocyte lysate. J. Virol. 50, 507–514.
Dubuisson, J., Hsu, H. H., Cheung, R. C., Greenberg, H. B., Russell, D. G., andRice, C. M. (1994). Formation and intracellular localization of hepatitis C virus envelopeglycoprotein complexes expressed by recombinant vaccinia and Sindbis viruses. J. Virol.68, 6147–6160.
Fata-Hartley, C. L., and Palmenberg, A. C. (2005). Dipyridamole reversibly inhibits men-govirus RNA replication. J. Virol. 79, 11062–11070.
Giachetti, C., and Semler, B. L. (1991). Role of a viral membrane polypeptide in strand-specific initiation of poliovirus RNA synthesis. J. Virol. 65, 2647–2654.

80 Yuri V. Svitkin and Nahum Sonenberg
Gorbalenya, A. E., Svitkin, Y. V., Kazachkov, Y. A., and Agol, V. I. (1979). Encephalo-myocarditis virus-specific polypeptide p22 is involved in the processing of the viralprecursor polypeptides. FEBS Lett. 108, 1–5.
Herold, J., and Andino, R. (2000). Poliovirus requires a precise 50 end for efficient positive-strand RNA synthesis. J. Virol. 74, 6394–6400.
Jackson, R. J. (1986). A detailed kinetic analysis of the in vitro synthesis and processing ofencephalomyocarditis virus products. Virology 149, 114–127.
Jackson, R. J. (1991). Potassium salts influence the fidelity of mRNA translation initiation inrabbit reticulocyte lysates: Unique features of encephalomyocarditis virus RNA transla-tion. Biochim. Biophys. Acta 1088, 345–358.
Jackson, R. J., and Hunt, T. (1983). Preparation and use of nuclease-treated rabbit reticulo-cyte lysates for the translation of eukaryotic messenger RNA. Methods Enzymol. 96,50–74.
Jang, S. K., Krausslich, H. G., Nicklin, M. J., Duke, G. M., Palmenberg, A. C., andWimmer, E. (1988). A segment of the 50 nontranslated region of encephalomyocarditisvirus RNA directs internal entry of ribosomes during in vitro translation. J. Virol. 62,2636–2643.
Kato, T., Furusaka, A., Miyamoto, M., Date, T., Yasui, K., Hiramoto, J., Nagayama, K.,Tanaka, T., and Wakita, T. (2001). Sequence analysis of hepatitis C virus isolated from afulminant hepatitis patient. J. Med. Virol. 64, 334–339.
Kaufman, R. J. (2000). The double-stranded RNA-activated protein kinase PKR.In ‘‘Translational Control of Gene Expression’’ (N. Sonenberg, J. W. B. Hershey, andM. B. Mathews, eds.), pp. 503–527. Cold Spring Harbor Laboratory Press, Cold SpringHarbor, NY.
Kerr, I. M., and Martin, E. M. (1972). Simple method for the isolation of encephalomyo-carditis virus ribonucleic acid. J. Virol. 9, 559–561.
Kerr, I. M., Cohen, N., and Work, T. S. (1966). Factors controlling amino acid incorpora-tion by ribosomes from Krebs II mouse ascites-tumour cells. Biochem. J. 98, 826–835.
Lin, C., Lindenbach, B. D., Pragai, B. M., McCourt, D. W., and Rice, C. M. (1994).Processing in the hepatitis C virus E2-NS2 region: Identification of p7 and two distinctE2-specific products with different C termini. J. Virol. 68, 5063–5073.
Lindenbach, B. D., and Rice, C. M. (2001). Flaviviridae: the viruses and their replication.In ‘‘Fields Virology’’ (D. M. Knipe and P. M. Howley, eds.), Vol. 1, pp. 991–1042.Lippincott Williams & Wilkins, Philadelphia, PA.
Lindenbach, B. D., Evans, M. J., Syder, A. J., Wolk, B., Tellinghuisen, T. L., Liu, C. C.,Maruyama, T., Hynes, R. O., Burton, D. R., McKeating, J. A., and Rice, C. M. (2005).Complete replication of hepatitis C virus in cell culture. Science 309, 623–626.
Maley, F., Trimble, R. B., Tarentino, A. L., and Plummer, T. H., Jr. (1989). Characteriza-tion of glycoproteins and their associated oligosaccharides through the use of endogly-cosidases. Anal. Biochem. 180, 195–204.
Martin, E. M., Malec, J., Sved, S., and Work, T. S. (1961). Studies on protein and nucleicacid metabolism in virus-infected mammalian cells. 1. Encephalomyocarditis virus inKrebs II mouse-ascites-tumour cells. Biochem. J. 80, 585–597.
Mathews, M., and Korner, A. (1970). Mammalian cell-free protein synthesis directed byviral ribonucleic acid. Eur. J. Biochem. 17, 328–338.
Mikami, S., Kobayashi, T., Yokoyama, S., and Imataka, H. (2006a). A hybridoma-basedin vitro translation system that efficiently synthesizes glycoproteins. J. Biotechnol. 127,65–78.
Mikami, S., Masutani, M., Sonenberg, N., Yokoyama, S., and Imataka, H. (2006b). Anefficient mammalian cell-free translation system supplemented with translation factors.Protein Expr. Purif. 46, 348–357.
Viral Translation and Replication In Vitro 81
Molla, A., Paul, A. V., and Wimmer, E. (1991). Cell-free, de novo synthesis of poliovirus.Science 254, 1647–1651.
Moradpour, D., Brass, V., Bieck, E., Friebe, P., Gosert, R., Blum, H. E., Bartenschlager, R.,Penin, F., and Lohmann, V. (2004). Membrane association of the RNA-dependentRNA polymerase is essential for hepatitis C virus RNA replication. J. Virol. 78,13278–13284.
Munroe, D., and Jacobson, A. (1990). mRNA poly(A) tail, a 30 enhancer of translationalinitiation. Mol. Cell. Biol. 10, 3441–3455.
Novak, J. E., and Kirkegaard, K. (1991). Improved method for detecting poliovirus negativestrands used to demonstrate specificity of positive-strand encapsidation and the ratio ofpositive to negative strands in infected cells. J. Virol. 65, 3384–3387.
Palmenberg, A. C., Pallansch, M. A., and Rueckert, R. R. (1979). Protease required forprocessing picornaviral coat protein resides in the viral replicase gene. J. Virol. 32,770–778.
Paul, A. V. (2002). Possible unifying mechanism of picornavirus genome replication.In ‘‘Molecular Biology of Picornaviruses’’ (B. L. Semler and E. Wimmer, eds.),pp. 227–246. ASM Press, Washington, DC.
Pause, A., Kukolj, G., Bailey, M., Brault, M., Do, F., Halmos, T., Lagace, L., Maurice, R.,Marquis, M., McKercher, G., Pellerin, C., Pilote, L., et al. (2003). An NS3 serineprotease inhibitor abrogates replication of subgenomic hepatitis C virus RNA. J. Biol.Chem. 278, 20374–20380.
Pelham, H. R. B. (1978). Translation of encephalomyocarditis virus RNA in vitro yields anactive proteolytic processing enzyme. Eur. J. Biochem. 85, 457–462.
Pelham, H. R., and Jackson, R. J. (1976). An efficient mRNA-dependent translation systemfrom reticulocyte lysates. Eur. J. Biochem. 67, 247–256.
Pelletier, J., and Sonenberg, N. (1988). Internal initiation of translation of eukaryoticmRNA directed by a sequence derived from poliovirus RNA. Nature 334, 320–325.
Pestova, T. V., Shatsky, I. N., Fletcher, S. P., Jackson, R. J., and Hellen, C. U. (1998).A prokaryotic-like mode of cytoplasmic eukaryotic ribosome binding to the initiationcodon during internal translation initiation of hepatitis C and classical swine fever virusRNAs. Genes Dev. 12, 67–83.
Reed, K. E., and Rice, C. M. (2000). Overview of hepatitis C virus genome structure,polyprotein processing, and protein properties. Curr. Top. Microbiol. Immunol. 242,55–84.
Rueckert, R. R., and Pallansch, M. A. (1981). Preparation and characterization of enceph-alomyocarditis (EMC) virus. Methods Enzymol. 78, 315–325.
Sambrook, J., Fritsch, E. F., and Maniatis, T. (1989). ‘‘Molecular Cloning: A LaboratoryManual,’’ 2nd ed. Cold Spring Harbor Laboratory Press, Cold Spring Harbor, NY.
Schmidt-Rose, T., and Jentsch, T. J. (1997). Transmembrane topology of a CLC chloridechannel. Proc. Natl. Acad. Sci. USA 94, 7633–7638.
Selby, M. J., Glazer, E., Masiarz, F., and Houghton, M. (1994). Complex processing andprotein:protein interactions in the E2:NS2 region of HCV. Virology 204, 114–122.
Svitkin, Y. V., and Agol, V. I. (1978). Complete translation of encephalomyocarditis virusRNA and faithful cleavage of virus-specific proteins in a cell-free system from Krebs-2cells. FEBS Lett. 87, 7–11.
Svitkin, Y. V., and Sonenberg, N. (2003). Cell-free synthesis of encephalomyocarditis virus.J. Virol. 77, 6551–6555.
Svitkin, Y. V., and Sonenberg, N. (2004). An efficient system for cap- and poly(A)-dependent translation in vitro. Methods Mol. Biol. 257, 155–170.
Svitkin, Y. V., Gorbalenya, A. E., Kazachkov, Y. A., and Agol, V. I. (1979). Encephalo-myocarditis virus-specific polypeptide p22 possessing a proteolytic activity: Preliminarymapping on the viral genome. FEBS Lett. 108, 6–9.
82 Yuri V. Svitkin and Nahum Sonenberg
Svitkin, Y. V., Ugarova, T. Y., Chernovskaya, T. V., Lyapustin, V. N., Lashkevich, V. A.,and Agol, V. I. (1981). Translation of tick-borne encephalitis virus (flavivirus) genomein vitro: Synthesis of two structural polypeptides. Virology 110, 26–34.
Svitkin, Y. V., Ovchinnikov, L. P., Dreyfuss, G., and Sonenberg, N. (1996). General RNAbinding proteins render translation cap dependent. EMBO J. 15, 7147–7155.
Svitkin, Y. V., Hahn, H., Gingras, A. C., Palmenberg, A. C., and Sonenberg, N. (1998).Rapamycin and wortmannin enhance replication of a defective encephalomyocarditisvirus. J. Virol. 72, 5811–5819.
Svitkin, Y. V., Herdy, B., Costa-Mattioli, M., Gingras, A. C., Raught, B., andSonenberg, N. (2005a). Eukaryotic translation initiation factor 4E availability controlsthe switch between cap-dependent and internal ribosomal entry site-mediated translation.Mol. Cell. Biol. 25, 10556–10565.
Svitkin, Y. V., Pause, A., Lopez-Lastra, M., Perreault, S., and Sonenberg, N. (2005b).Complete translation of the hepatitis C virus genome in vitro: Membranes play a criticalrole in the maturation of all virus proteins except for NS3. J. Virol. 79, 6868–6881.
Tan, S. L., Pause, A., Shi, Y., and Sonenberg, N. (2002). Hepatitis C therapeutics: Currentstatus and emerging strategies. Nat. Rev. Drug Discov. 1, 867–881.
Tsukiyama-Kohara, K., Iizuka, N., Kohara, M., and Nomoto, A. (1992). Internal ribosomeentry site within hepatitis C virus RNA. J. Virol. 66, 1476–1483.
Tsantrizos, Y. S., Bolger, G., Bonneau, P., Cameron, D. R., Goudreau, N., Kukolj, G.,LaPlante, S. R., Llinas-Brunet, M., Nar, H., and Lamarre, D. (2003). Macrocyclicinhibitors of the NS3 protease as potential therapeutic agents of hepatitis C virusinfection. Angew. Chem. Int. Ed. 42, 1356–1360.
Villa-Komaroff, L., McDowell, M., Baltimore, D., and Lodish, H. F. (1974). Translation ofreovirus mRNA, poliovirus RNA and bacteriophage Qb RNA in cell-free extracts ofmammalian cells. Methods Enzymol. 30, 709–723.
Villa-Komaroff, L., Guttman, N., Baltimore, D., and Lodish, H. F. (1975). Completetranslation of poliovirus RNA in a eukaryotic cell-free system. Proc. Natl. Acad. Sci.USA 72, 4157–4161.
Wakita, T., Pietschmann, T., Kato, T., Date, T., Miyamoto, M., Zhao, Z., Murthy, K.,Habermann, A., Krausslich, H. G., Mizokami, M., Bartenschlager, R., and Liang, T. J.(2005). Production of infectious hepatitis C virus in tissue culture from a cloned viralgenome. Nat. Med. 11, 791–796.
Walter, P., and Blobel, G. (1983). Preparation of microsomal membranes for cotranslationalprotein translocation. Methods Enzymol. 96, 84–93.
Yanagi, M., Purcell, R. H., Emerson, S. U., and Bukh, J. (1997). Transcripts from a singlefull-length cDNA clone of hepatitis C virus are infectious when directly transfected intothe liver of a chimpanzee. Proc. Natl. Acad. Sci. USA 94, 8738–8743.

C H A P T E R F I V E
M
IS
M
ethods
SN 0
RC L
A Practical Approach to Isolate 48SComplexes: Affinity Purificationand Analyses
Nicolas Locker and Peter J. Lukavsky
Contents
1. In
in
076
abo
troduction
Enzymology, Volume 429 # 2007
-6879, DOI: 10.1016/S0076-6879(07)29005-6 All rig
ratory of Molecular Biology, Cambridge, United Kingdom
Else
hts
84
2. D
esign of Strepto-Tagged mRNAs for Affinity Purification of48S Complexes
863. A
ffinity Purification of 48S Complexes 883
.1. P reparation of the dihydrostreptomycin-coupled sepharose6B matrix
883
.2. P rotocol 1 883
.3. 4 8S assembly in RRL and isolation of 48S complexes byaffinity chromatography
893
.4. P rotocol 2 893
.5. F inal cleanup of 48S complexes by sucrose densitygradient centrifugation
913
.6. P rotocol 3 914. A
nalysis of the Purified 48S Complexes 944
.1. T oeprinting of affinity purified 48S complexes 944
.2. P rotocol 4 944
.3. Q uantitative immunoblotting of 48S complexes 954
.4. Q uantitative Northern blotting of 48S complexes 985. F
unctional Analysis of the Purified 48S Complexes 995
.1. P rotocol 5: GTP hydrolysis assay using purified 48s complexes 995
.2. P rotocol 6: Analysis of eIF5-induced eIF release from purified48S complexes
995
.3. P rotocol 7: Analysis of eIF5B-induced eIF release from purified48S complexes
1005
.4. P rotocol 8: Sucrose density gradient analysis of 80S ribosomeformation
100vier Inc.
reserved.
83

84 Nicolas Locker and Peter J. Lukavsky
6. C
onclusion 102Ackn
owledgments 102Refe
rences 103Abstract
In vitro assembly of eukaryotic translation initiation complexes requires purifi-
cation of ribosomal subunits, eukaryotic initiation factors, and initiator tRNA
from natural sources and therefore yields only limited material for func-
tional and structural studies. In this chapter, we describe a robust, affinity
chromatography-based method for the isolation of eukaryotic 48S initiation
complexes from rabbit reticulocyte lysate (RRL). Both canonical and internal
ribosome entry site (IRES)-containing mRNAs labeled with a streptomycin
aptamer sequence at the 30 end can be used to purify milligram quantities of
48S particles in a simple, two-step procedure. The 48S complexes purified
with this method are properly assembled at the initiation codon, contain the
expected RNA and protein components in a 1:1 stoichiometry, and are functional
intermediates along the initiation pathway.
1. Introduction
Initiation of translation in higher eukaryotes can occur in two majormodes: canonical initiation, which requires the full set of eukaryotic initia-tion factors (eIFs), Met-tRNAi
Met and a 50-capped mRNA to assemble the80S ribosome at the authentic AUG start codon, and internal ribosomeentry site (IRES)-mediated initiation, which uses only a subset of eIFs anda highly structured 50 UTR (Hellen and Sarnow, 2001; Kapp and Lorsch,2004b; Merrick, 2004; Pestova et al., 2001; Sachs et al., 1997). In the cano-nical initiation mode, the pathway commences with the recruitment of a43S particle, comprising the 40S subunit, eIF1, 1A, 3, and the eIF2/GTP/Met-tRNAi
Met ternary complex, to the 50-cap structure of the mRNAmediated through interactions with the 50-cap-binding complex, eIF4F.This ribosomal complex then scans the 50 UTR to locate the AUG startcodon. When the 43S components are assembled at the initiation codon, a48S complex is formed. Proper start codon selection is controlled by eIF1and 1A, which are believed to modulate 40S subunit conformation (Maaget al., 2005; Pestova et al., 1998a). Upon codon–anticodon base pairingbetween the mRNA and Met-tRNAi
Met in the ribosomal P site, a confor-mational change is proposed to occur, which releases eIF1 and triggerseIF5-mediated hydrolysis of eIF2-bound GTP, Pi release, and subsequentdissociation of eIF2/GDP from the 48S complex (Algire et al., 2005;Unbehaun et al., 2004). Finally, eIF5B mediates release of the remaining

Affinity Purification of 48S Complexes 85
eIFs and the joining of the 60S subunit in another GTP-dependent processto form 80S ribosomes (Pestova et al., 2000; Unbehaun et al., 2004).
In IRES-mediated initiation of translation, the requirements for eIFs aregreatly reduced. The genomic RNAs of many viruses are incompatible witha 50 end-dependent, scanning-based mechanism of AUG start codon selec-tion because they do not bear a 50 cap and have a highly structured 50 UTR.Instead, translation initiation on these mRNAs occurs via IRESs located inthe 50 UTR, which recruit ribosomal subunits directly at or near the initia-tion codon (Hellen and Sarnow, 2001; Sachs et al., 1997). Viral IRESRNAs differ both in nucleotide length and predicted secondary structure,and require different subsets of canonical eIFs to form a 48S complex. Atleast three distinct mechanisms for the formation of initiation complexeshave been identified so far (Pestova et al., 2001). In the mechanism used byencephalomyocarditis virus (EMCV) and EMCV-like IRESs from otherpicornaviruses, components of the eIF4F complex bind specifically to theIRES and thereby recruit the 43S particle near the AUG start codon (Pestovaet al., 1996). In contrast, hepatitis C virus (HCV) and other HCV-like IRESscan form stable binary IRES–40S complexes with the initiation codonplaced in the ribosomal P site; only eIF3 and the ternary complex are requiredto form a functional 48S complex (Pestova et al., 1998b). A third, distinctmechanism is employed by the intergenic IRES of the cricket paralysis virus(CrPV) and other CrPV-like IRESs, which assemble 80S ribosomes with-out any eIFs or Met-tRNAMet
i through binding to the ribosomal P andE sites, thereby initiating translation from the A site (Wilson et al., 2000).
Formerly, both the canonical and IRES-mediated initiation pathwayshave been studied by reconstituting 48S complexes in vitro using ribosomalsubunits, Met-tRNAMet
i , and individual eIFs purified from natural sources(Algire et al., 2002; Asano et al., 2002; Benne et al., 1979; Pestova et al.,1996). The reconstituted initiation complexes up to the 48S stage haverevealed the distinct eIF requirements of different IRESs and have helped toelucidate the role of several eIFs during canonical initiation (for reviews, seeHershey andMerrick, 2000; Pestova and Hellen, 2000; Pestova et al., 2001).While reconstitution gives a precise control over the composition of theparticles, the purification of the eIFs and Met-tRNAMet
i is rather laborintensive and their yield often poor. More recently, alternative methodswere presented to study aspects of initiation complex formation. Thesenovel methods are all based on affinity chromatography and focus onisolating intermediate complexes along the initiation pathway (Boehringeret al., 2005; Ji et al., 2004; Locker et al., 2006). Ji and coworkers isolatedinitiation complexes formed onto mutant HCV IRES RNAs to study 48Sand 80S assembly defects ( Ji et al., 2004). Boehringer and coworkers isolatedHCV 80S complexes for cryoelectron microscopy (EM) studies usingtagged IRES RNA (Boehringer et al., 2005). We have developed a protocolto prepare milligram quantities of canonical and IRES 48S complexes for

86 Nicolas Locker and Peter J. Lukavsky
structural and functional studies (Locker et al., 2006). The attractiveness ofisolation methods using affinity chromatography is the possibility of findingnew cofactors, intermediates, or subcomplexes at large scale suitable forbiochemical and structural studies. That being said, isolated complexes alsorequire strict characterization of composition and stoichiometry to ensurethe authenticity of the complexes. Here we provide detailed protocols forour affinity chromatography-based method for the isolation of 48S com-plexes from rabbit reticulocyte lysate (RRL). In addition, we describeexperiments we used to analyze the composition of the isolated particlesand their activity in subunit joining experiments.
2. Design of Strepto-Tagged mRNAs for AffinityPurification of 48S Complexes
RNA oligonucleotides used for affinity purification consist of a 50UTR (canonical or IRES element) followed by approximately 85 nucleo-tides (nt) of the authentic open reading frame (ORF), a toeprint primer-binding site (Pestova et al., 1996), a short uracil-cytosine linker followed bythe StreptoTag (Bachler et al., 1999) (Fig. 5.1A). The StreptoTag is a smallRNA aptamer, less than 50 nt in length (Wallace and Schroeder, 1998),which had been applied previously as an affinity tag to isolate RNA–proteincomplexes from cellular extracts (Bachler et al., 1999). The StreptoTag wasattached at the 30 end of the mRNA to enable both the internal ribosomeentry and scanning mode of initiation to occur freely on the 50 end ofmRNAs and to ensure that only ‘‘full-length’’ mRNAs are bound to theaffinity column. The aptamer binds reversibly to dihydrostreptomycin cou-pled to a Sepharose 6B matrix with micromolar affinity in a magnesium-dependent manner and the assembled complexes can be eluted with a buffercontaining free streptomycin (10 mM). The length of the ORF is best keptaround 85 nt to ensure sufficient spacing between the 48S particle and theStreptoTag. Shorter spacing seems to interfere with efficient resin bindingof the tagged mRNAs and therefore decreases the yield of the purifiedcomplexes. Furthermore, this length is also ideal to perform toeprintingexperiments using the toeprint primer-binding site inserted downstreamof the ORF (Pestova et al., 1996). Two restriction sites, HindIII and XbaI,are used for subcloning of different mRNAs (50 UTR and 85 nt ORF, seeFig. 5.1A). DNA inserts encoding the different mRNA elements wereprepared from overlapping primers using standard polymerase chain reac-tion (PCR) and cloning techniques as described (Locker et al., 2006).Tagged mRNAs are transcribed and purified using established protocols(Lukavsky and Puglisi, 2004) and stored at –20o in 10 mMTris–HCl solution(pH 7.4) at a concentration of about 1.0 A260 units/ml.

AUG
5'
3'
Streptomycinaptamer
HCV IRES
AUG
5'
3'
1. Incubate in rabbitreticulocyte Lysate
2.Apply to streptomycin-coupledaffinity column
Free IRES
3. Elute with streptomycin
AUG
5'
3'
Ribosomal complexes
5'Hind III T7 Promoter 5' UTR AUG ORF (~85 nt) Xba IToeprint primer binding site Streptomycin aptamer EcoR I 3'
B
A(UC)3-linker
Figure 5.1 Design of streptomycin aptamer-based affinity purification. (A) Schematic showing the design of tagged RNAs used for affinitypurification and analysis of initiation complexes. (B) Strategy for affinity purification of HCV IRES 48S complexes from RRL. (Reprintedwith permission from Locker et al., 2006.)

88 Nicolas Locker and Peter J. Lukavsky
3. Affinity Purification of 48S Complexes
3.1. Preparation of the dihydrostreptomycin-coupledsepharose 6B matrix
This recipe yields enough dihydrostreptomycin-coupled Sepharose 6Bmatrix for two 8-ml glass Econo-columns (Bio-Rad), which are used foraffinity purification. The preparation of the matrix is straightforward and isdone over 3 days. All the solutions are freshly prepared and water refers tosterile water (Millipore).
3.2. Protocol 1
1. Rehydrate a total of 3 g of epoxy-activated Sepharose 6B (Amersham)matrix in 50 ml of water in a 50-ml Falcon tube and place it on a rollerfor 10 min at room temperature (RT) to ensure complete resuspension.
2. Decant the whole suspension into a sintered glass filter (Schott, 500 mlcapacity) and wash with 600 ml of water. After washing, transfer theresin to a fresh 50-ml Falcon tube.
3. Rinse the filter with 10 ml of coupling solution [10 mM NaOH and3 mM dihydrostreptomycin (Sigma) in water] and combine with resin.Add additional coupling solution to the resin so that the final buffervolume is 35 to 40 ml. Place the tube on a roller at RT for 2 h, thenshake in a shaker incubator in the dark at 250 rpm at 37 overnight.
4. Decant the resin and buffer onto the sintered glass filter and wash with200 ml of 10 mM NaOH solution. Transfer the resin to a fresh 50-mlFalcon tube.
5. Rinse the filter with 10 ml of ethanolamine solution (Sigma, 6% inwater) and combine with resin. Add additional ethanolamine solutionso that the final buffer volume is 35 to 40 ml. Place the tube on a roller atRT for 10 min and then shake in a shaker incubator in the dark at250 rpm at 42 overnight.
6. Decant the resin and buffer onto the sintered glass filter. Apply threerounds of washes with alternating pH to the resin starting with 50 ml oflow pH buffer (0.1MNaOAc and 0.5MNaCl in water, pH 4) and then50 ml high pH buffer (0.1 M Tris–HCl and 0.5 M NaCl in water, pH7.4), etc. Finally, wash the resin with 200 ml of water and then transfer toa fresh 50-ml Falcon tube.
7. Resuspend the resin in 16 ml of storage solution (10 mM Tris–HCland 10 mM NaN3 in water, pH 7.6) and store in the dark at 4 for upto 3 weeks.
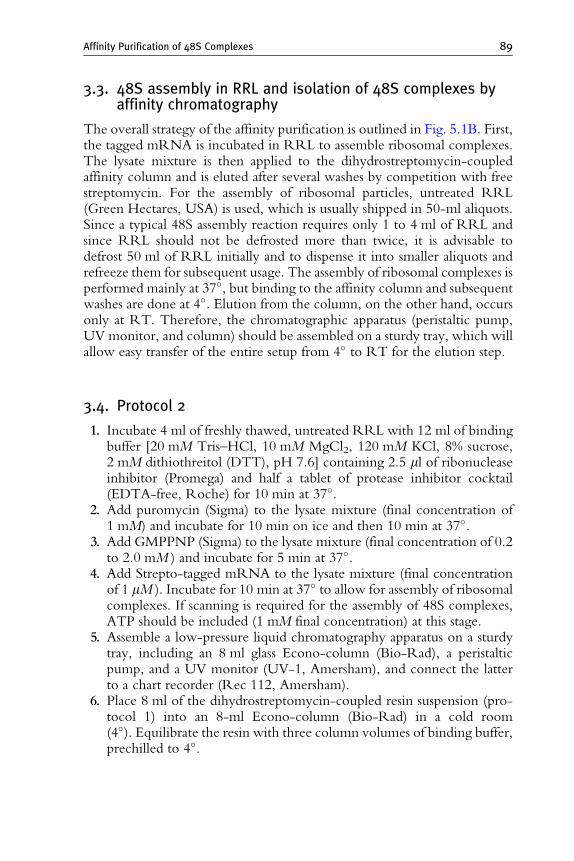
Affinity Purification of 48S Complexes 89
3.3. 48S assembly in RRL and isolation of 48S complexes byaffinity chromatography
The overall strategy of the affinity purification is outlined in Fig. 5.1B. First,the tagged mRNA is incubated in RRL to assemble ribosomal complexes.The lysate mixture is then applied to the dihydrostreptomycin-coupledaffinity column and is eluted after several washes by competition with freestreptomycin. For the assembly of ribosomal particles, untreated RRL(Green Hectares, USA) is used, which is usually shipped in 50-ml aliquots.Since a typical 48S assembly reaction requires only 1 to 4 ml of RRL andsince RRL should not be defrosted more than twice, it is advisable todefrost 50 ml of RRL initially and to dispense it into smaller aliquots andrefreeze them for subsequent usage. The assembly of ribosomal complexes isperformed mainly at 37, but binding to the affinity column and subsequentwashes are done at 4. Elution from the column, on the other hand, occursonly at RT. Therefore, the chromatographic apparatus (peristaltic pump,UV monitor, and column) should be assembled on a sturdy tray, which willallow easy transfer of the entire setup from 4 to RT for the elution step.
3.4. Protocol 2
1. Incubate 4 ml of freshly thawed, untreated RRL with 12 ml of bindingbuffer [20 mM Tris–HCl, 10 mM MgCl2, 120 mM KCl, 8% sucrose,2 mM dithiothreitol (DTT), pH 7.6] containing 2.5 ml of ribonucleaseinhibitor (Promega) and half a tablet of protease inhibitor cocktail(EDTA-free, Roche) for 10 min at 37.
2. Add puromycin (Sigma) to the lysate mixture (final concentration of1 mM) and incubate for 10 min on ice and then 10 min at 37.
3. Add GMPPNP (Sigma) to the lysate mixture (final concentration of 0.2to 2.0 mM ) and incubate for 5 min at 37.
4. Add Strepto-tagged mRNA to the lysate mixture (final concentrationof 1 mM ). Incubate for 10 min at 37 to allow for assembly of ribosomalcomplexes. If scanning is required for the assembly of 48S complexes,ATP should be included (1 mM final concentration) at this stage.
5. Assemble a low-pressure liquid chromatography apparatus on a sturdytray, including an 8 ml glass Econo-column (Bio-Rad), a peristalticpump, and a UV monitor (UV-1, Amersham), and connect the latterto a chart recorder (Rec 112, Amersham).
6. Place 8 ml of the dihydrostreptomycin-coupled resin suspension (pro-tocol 1) into an 8-ml Econo-column (Bio-Rad) in a cold room(4). Equilibrate the resin with three column volumes of binding buffer,prechilled to 4.

90 Nicolas Locker and Peter J. Lukavsky
7. Load the 48S assembly reaction (step 4) slowly (0.8 ml/min) onto thecolumn while monitoring the UV absorbance at 280 nm. After com-plete loading, wash with binding buffer at the same flow rate andmonitor UV absorbance until a stable baseline is reached, usually afterfive column volumes of binding buffer (Fig. 5.2A).
8. Place the entire chromatography setup to RT for elution and washthe column with two or three more column volumes of binding buf-fer, preequilibrated to RT, at 0.8 ml/min until the UV monitor isequilibrated to RT and a stable baseline is reached.
40S
48S
HC
V
48S
PT
V-1
48S
b-gl
obin
48S
EM
CV
60S
0
0.2
0.4
0.6
0.8
5 10 15 20 25
0
0.4
0.8
1.2
1.6
2.0
0 20 60 100 140 180
Abs
orba
nce
at 2
80 n
m
Fraction number
Abs
orba
nce
at 2
80 n
m
Elution time (min)
RRL application
Elution
48S
40S/IRES
IRES
48S
40S/IRES
IRES
A
C
B
D
40S
60S
Elu
tion
4 RT
Figure 5.2 Affinity purification of ribosomal 48S complexes. (A) Chromatographicprofile of a 48S complex assembled in RRL applied to a streptomycin affinity column.Plots of absorbance at 280 nm versus elution time are shown. (B) Visualization of theeluted fraction by1%native agarose gel. Lanes are loaded as noted on the gel using puri-fied 40S and 60S subunits as size markers. Bands corresponding to free IRES, IRES/40Sbinary, and 48S complexes are indicated. (C) Sucrose densitygradient profile of affinitypurified ribosomal complexes assembled onto an IRES RNA. Plots of absorbance at260 nmversus sucrose densitygradient fractions are shown; peaks corresponding to freeIRES, IRES/40S binary, and 48S complexes are indicated. (D) Analysis of pooled andconcentrated 48S fractions assembled ontovarious taggedmRNAsby1%native agarosegel. Lanes are loaded as indicated on the gel. (Reprinted with permission from Lockeret al., 2006.)

Affinity Purification of 48S Complexes 91
9. Elute the complexes with binding buffer containing 10 mM streptomy-cin (Sigma) at an increased flow rate (4 ml/min) into a 50-ml Falcontube on ice (see Fig. 5.2A). Save 50 ml of the eluate (typically 10 ml totalvolume) for gel analysis.
10. Immediately transfer the eluted ribosomal complexes to a prechilledTi90 tube (Beckman) and pellet by centrifugation at 45,000 rpm ina Ti90 rotor (Beckman) for 16 h at 4. The resulting pellet can bestored at –20 or immediately resuspended for the final purification step(protocol 3).
11. In themeantime, analyze the elution on a 1% agarose gel with tris-borateas running buffer (both containing 0.5 mg/ml ethidium bromide). Usepurified 40S and 60S subunits as size markers (Fig. 5.2B). Electrophoresisis performed at 100 V for 30 min at 4 and complexes are visualized byshortwave UV light.
3.5. Final cleanup of 48S complexes by sucrose densitygradient centrifugation
Since the eluted fraction (see Fig. 5.2B) usually also contains free taggedmRNA and binary mRNA–40S complexes in addition to the desired 48Scomplexes, a final sucrose density gradient centrifugation step (Fig. 5.2C) isrequired to obtain pure 48S particles shown in Fig 5.2D.
3.6. Protocol 3
1. Resuspend the ribosomal pellet (step 10, protocol 2) in 200 ml ofresuspension buffer (20 mM Tris–HCl, 100 mM KOAc, 200 mM KCl,2.5 mM MgCl2, 2 mM DTT, pH 7.6) at 4. Carefully layer the resus-pended mixture onto a 15% to 40% sucrose density gradient prepared ina Beckman Ultra-Clear tube (25 89 mm) with the same buffer.Centrifuge at 22,000 rpm in an SW28 rotor (Beckman) for 16 h at 4.
2. Fractionate the gradient into 1.5 ml fractions from the bottom of thetube to the top. Monitor absorbance at 260 nm (see Fig. 5.2C).
3. Analyze each fraction on a 1% agarose gel as before (step 11, protocol 2).4. Pool fractions containing pure 48S complexes and save an aliquot for
native agarose gel analysis (see Fig. 5.2D). Concentrate the pooledfractions in a centricon device (YM-50, Millipore) to a final concentra-tion of 10 A260 units/ml and store at –20. Alternatively, particles canalso be pelleted as before (step 10, protocol 2) and stored at –20.
Each dihydrostreptomycin-coupled affinity column can be used up tothree times for the isolation of 48S complexes from RRL: twice with aboutthe same efficiency (1.0 to 1.5 A260 units/ml of RRL) and then one moretime with 50% of the initial efficiency. This rapid decay of the resin is not

92 Nicolas Locker and Peter J. Lukavsky
observed when used with other lysates, which could be because of oxidativedamage to the resin caused by components in the RRL. From the extinc-tion coefficient of the three RNA components of the particle (18S rRNA,Met-tRNAMet
i , and tagged mRNA) determined with the biopolymer cal-culator (http://paris.chem.yale.edu/extinct.html), we calculated that oneA260 unit corresponds to 43 pmol of the 48S complex (about 2.5 MDa) andtherefore the final yield (1.0 to 1.5 A260 units/ml of RRL) after sucrosedensity gradient centrifugation corresponds to 110 to 160 mg complex foreach milliliter of RRL. The integrity of the complexes throughout thepurification procedures was tested by immunoblotting all fractions of theindividual purification steps for the presence of eIF2 and eIF3 with anti-bodies against the eIF2a or eIF3d subunits, respectively (Fig. 5.3A). In thisexample, 48S complexes were assembled onto tagged HCV IRES andpurified using our protocols. An estimated 20% of eIF2 and 35% of eIF3
GMPPNP
HCV 48S ++
+−
eIF2a
B
A
eIF2a
eIF3d
1 4 5 7
C
AUG
+16-17 ntfrom AUG
A G U PurifiedUnpurified
48S
++
2 3 6 8 C
Figure 5.3 Analysis of the efficiency of the purification protocol. (A) The presence ofeIF2 and eIF3 is followed throughout the purification steps by immunoblotting. Lanesare indicated as follows: (1) initial assembly reaction applied to the affinity column,(2) flow throughof the application fraction, (3)wash fraction, (4) elution, (5) supernatantof the centrifugation step after elution, (6) 48S peak from the sucrose densitygradient inFig. 5.2C, (7) 40S/IRES peak from the same gradient, and (8) pooled top fractions fromthe same gradient. (B) Immunoblotting analysis of HCV IRES 48S complexes assem-bled in the absence andpresenceof GMPPNPusing anti-eIF2a antibodies. (C)Toeprint-ing assayof both purified and unpurified 48SHCVinitiation complexes. Arrows denotepositions of the initiation AUG codon and toeprinting stops. A dideoxynucleotidesequence generatedwith the same primer and taggedRNA (shown on the left) was runin parallel. (Reprintedwith permission fromLocker et al., 2006.)
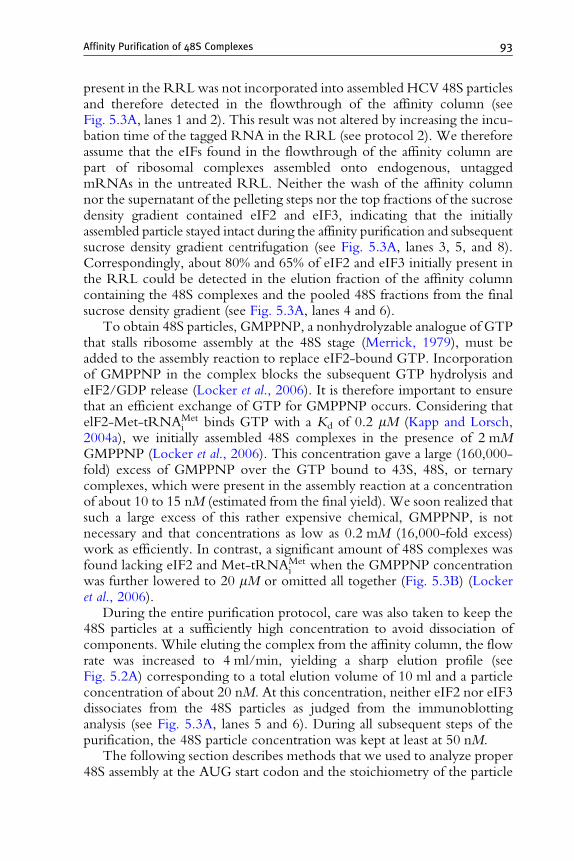
Affinity Purification of 48S Complexes 93
present in the RRLwas not incorporated into assembled HCV 48S particlesand therefore detected in the flowthrough of the affinity column (seeFig. 5.3A, lanes 1 and 2). This result was not altered by increasing the incu-bation time of the tagged RNA in the RRL (see protocol 2). We thereforeassume that the eIFs found in the flowthrough of the affinity column arepart of ribosomal complexes assembled onto endogenous, untaggedmRNAs in the untreated RRL. Neither the wash of the affinity columnnor the supernatant of the pelleting steps nor the top fractions of the sucrosedensity gradient contained eIF2 and eIF3, indicating that the initiallyassembled particle stayed intact during the affinity purification and subsequentsucrose density gradient centrifugation (see Fig. 5.3A, lanes 3, 5, and 8).Correspondingly, about 80% and 65% of eIF2 and eIF3 initially present inthe RRL could be detected in the elution fraction of the affinity columncontaining the 48S complexes and the pooled 48S fractions from the finalsucrose density gradient (see Fig. 5.3A, lanes 4 and 6).
To obtain 48S particles, GMPPNP, a nonhydrolyzable analogue of GTPthat stalls ribosome assembly at the 48S stage (Merrick, 1979), must beadded to the assembly reaction to replace eIF2-bound GTP. Incorporationof GMPPNP in the complex blocks the subsequent GTP hydrolysis andeIF2/GDP release (Locker et al., 2006). It is therefore important to ensurethat an efficient exchange of GTP for GMPPNP occurs. Considering thatelF2-Met-tRNAMet
i binds GTP with a Kd of 0.2 mM (Kapp and Lorsch,2004a), we initially assembled 48S complexes in the presence of 2 mMGMPPNP (Locker et al., 2006). This concentration gave a large (160,000-fold) excess of GMPPNP over the GTP bound to 43S, 48S, or ternarycomplexes, which were present in the assembly reaction at a concentrationof about 10 to 15 nM (estimated from the final yield). We soon realized thatsuch a large excess of this rather expensive chemical, GMPPNP, is notnecessary and that concentrations as low as 0.2 mM (16,000-fold excess)work as efficiently. In contrast, a significant amount of 48S complexes wasfound lacking eIF2 and Met-tRNAMet
i when the GMPPNP concentrationwas further lowered to 20 mM or omitted all together (Fig. 5.3B) (Lockeret al., 2006).
During the entire purification protocol, care was also taken to keep the48S particles at a sufficiently high concentration to avoid dissociation ofcomponents. While eluting the complex from the affinity column, the flowrate was increased to 4 ml/min, yielding a sharp elution profile (seeFig. 5.2A) corresponding to a total elution volume of 10 ml and a particleconcentration of about 20 nM. At this concentration, neither eIF2 nor eIF3dissociates from the 48S particles as judged from the immunoblottinganalysis (see Fig. 5.3A, lanes 5 and 6). During all subsequent steps of thepurification, the 48S particle concentration was kept at least at 50 nM.
The following section describes methods that we used to analyze proper48S assembly at the AUG start codon and the stoichiometry of the particle
94 Nicolas Locker and Peter J. Lukavsky
components and to assess whether the purified 48S complexes are functionalintermediates along the 80S assembly pathway competent in subunit joiningexperiments.
4. Analysis of the Purified 48S Complexes
4.1. Toeprinting of affinity purified 48S complexes
Inhibition of primer extension of reverse transcriptase, so-called toeprint-ing, is a powerful assay to monitor mRNA positioning on the 40S ribosomalsubunit (Hartz et al., 1988). In a properly assembled 48S complex, arrest ofreverse transcription leads to characteristic bands 16 to 18 nt downstream ofthe adenine of the AUG initiation codon on a sequencing gel. Suchtoeprints indicate that the AUG start codon is placed in the P site of thesmall ribosomal subunit and base paired to Met-tRNAMet
i (Hartz et al.,1988). To perform a toeprinting experiment, a primer has to be annealedto an mRNA under native conditions about 80 to 100 nt downstream of theAUG start codon. All our tagged mRNAs therefore contain a toeprintprimer-binding site downstream of the ORF (Pestova et al., 1996) (seeFig. 5.1A). In the following protocol, affinity-purified 48S particles arecompared to in vitro assembled, unpurified 48S complexes (using the sametagged mRNA) by toeprinting analysis.
4.2. Protocol 4
1. Dilute 20 ml of affinity-purified 48S particles (stock ¼ 10 A260 units/ml)with 20 ml of toeprinting buffer [20 mM Tris–HCl, 100 mM KOAc,2.5 mM Mg(OAc)2, 5% sucrose, 2 mM DTT, 0.1 mM GMPPNP, and0.25 mM spermidine, pH 7.6] at 4. Transfer to a polycarbonate tube(13 51 mm, Beckman) and pellet the complexes by centrifugation for1 h at 65,000 rpm at 4 in a TLA100.3 rotor (Beckman).
2. Resuspend the pellet in 40 ml of toeprinting buffer at 4 and pellet againto complete the buffer exchange.
3. Resuspend the ribosomal 48S complexes in 40 ml toeprinting buffer,incubate for 3 min at 30, and then add 5 pmol of toeprint primer 50-GGGATTTCTGATCTCGGCG-30(Pestova et al., 1996). The reactionis then placed on ice for 10 min to anneal the primer.
4. Add 1 mM dNTPs, 5 mM Mg(OAc)2 (both final concentration), 1 ml[a-32P]ATP (3000 Ci/mmol; Amersham), and 0.7 U of avian myelo-blastosis virus reverse transcriptase (Promega, 24 U/ml) to the reaction toa total volume of 50 ml and allow the primer extension reaction to occurfor 45 min at 30.

Affinity Purification of 48S Complexes 95
5. For comparison, perform a second toeprinting reaction on initiationcomplexes in vitro assembled in RRL using the same tagged mRNA,following previously published procedures (Wilson et al., 2000). Incu-bate a master mix containing 15 ml RRL, 0.15 ml of ribonucleaseinhibitor (Promega), and GMPPNP (1 mM final concentration)for 5 min at 30, then add 0.5 mg of tagged mRNA and incubate foranother 5 min at the same temperature. Dilute the reaction mixture to40 ml with the toeprinting buffer and then follow steps 3 and 4 inthis protocol.
6. Carefully remove proteins from the toeprinting reactions by phenolextraction, and then precipitate cDNAs with ethanol at –20 overnight.Analyze the cDNA products on a standard 6% sequencing gel comparingwith appropriate dideoxynucleotide sequence ladders performed on theunbound mRNA using the same primer.
Toeprinting of both the assembled, but unpurified, as well as the purifiedHCV 48S complexes yielded the same toeprints at position þ16 and þ17 ntdownstream of the AUG start codon (Fig. 5.3C). This shows that affinity-purified HCV 48S complexes are correctly assembled with the initiationcodon placed in the ribosomal P site and that the purification process doesnot alter the arrangement of components in the particle. To further test thequality of the isolated particles and especially the stoichiometry of the 48Scomponents, more quantitative assays are required, which are described in thenext section.
4.3. Quantitative immunoblotting of 48S complexes
Our goal here is to show the relative stoichiometry of eIF2, eIF3, and eIF5within purified 48S complexes. The quantities of eIF2a, eIF3d, and eIF5were assessed against individual standard curves using purified, recombinantproteins. All the quantification was done by chemiluminescence detectionon film using standard immunoblotting techniques. We will briefly describethe detection method we use for quantification and then focus more on theconstruction of standard curves and optimization of 48S loading using HCV48S complexes as an example (Fig. 5.4A–C).
Recombinant eIF2a, eIF3d, and eIF5 are purified as previouslydescribed (Locker et al., 2006; Pestova et al., 2000). The concentrations ofthese proteins are determined using extinction coefficients predicted fromprimary sequence and absorbance measurements at 280 nm of the proteinsunder native and/or denaturing conditions. The linear response ranges foreach protein were found to be 90 to 450 fmol for eIF2a, 6 to 90 pmol foreIF3d, and 10 to 1200 fmol for eIF5, respectively. The middle of the linearrange of each protein established the optimal amount of 48S complex usedfor comparison: 255 fmol of 48S particles (1A260 unit¼ 43 pmol) for eIF2a,30 pmol for eIF3d, and 500 fmol for eIF5, respectively. The optical density

Ban
d in
tens
ity
%
48S
HC
V
tRNAiMet
eIF2a
eIF3d
5 10 15 20 25
90 157 225 337 450
6 12 30 60 90
15
225
30
0
20
40
60
80
100
120
140
160
5 10 15 20 25 15
0
20
40
60
80
100
120
140
160
90 157 225 337 450 225
020406080
100120140160180
6 12 30 60 90 30
Ban
d in
tens
ity
%B
and
inte
nsity
%
pmol
fmol
pmol
pmol
fmol
pmol
D
A
B
48S
HC
V
48S
HC
V
eIF5 receIF5 rec
fmol10 120 700 1200 500 500
+48S
anti-eIF5
0
20
40
60
80
100
120
10 120 700 1200 500 500
Ban
d in
tens
ity
%
fmol
eIF
5 re
c
48S
HC
V n
o eI
F5
48S
HC
V +
eIF
5
eIF
5 re
c
eIF
5 re
c
eIF
5 re
c
fmol500 500
48S
anti eIF5Over-exposed
eIF5 rec+
anti-tRNAiMet
anti-eIF2a
anti-eIF3d
C
48S
HC
V48
S H
CV
48S
HC
V
Figure 5.4 Quantitative analysis to show the composition of HCV 48S complexes.(A) Quantitative immunoblotting analysis of purified HCV 48S complexes using anti-bodies specific to eIF2a. Dilutions of purified recombinant eIF2a (90 to 450 fmol) and255 fmol of purified HCV 48S complexes were loaded as indicated and resolved by 12%NuPAGEgel. Band intensities were quantified using ImageQuant software and relativelevels ofeIF2awere normalized tothatof the 225 fmol eIF2a intensity.Agraphical repre-sentation of the relative intensities is displayed on the right. All error bars are standard
96 Nicolas Locker and Peter J. Lukavsky

Affinity Purification of 48S Complexes 97
of each eIF within 48S particles loaded at the above values is used tonormalize the band intensity in each blot.
The serial dilutions of purified eIF2a, eIF3d, or eIF5 and the fixedamount of 48S complex are loaded on 4 to 12% NuPAGE gels (Invitrogen).Bands are resolved by electrophoresis, transferred to nitrocellulose mem-branes, and blocked with 5% dry milk in PBS–Tween 0.2%. Membranes arethen probed for eIF2a with monoclonal (Abcam, ab5369, at 1/2000 dilu-tion), for eIF3d with polyclonal (PTGlab, 10219-1-AP, at 1/1000 dilution),and for eIF5 with polyclonal (SantaCruz Biotechnology, sc-282, at 1/2000dilution) antibodies. Primary antibodies are detected using appropriateHRP-coupled secondary antibodies (Abcam, ab6728 for eIF2a and ab6721for eIF3d and eIF5, respectively; both at 1/2000 dilution), processed usingenhanced chemiluminescence (ECL reagent, Amersham) and exposed ontoHyperfilm ECL (Amersham). The films are scanned at a resolution of 600dots per inch in gray scale mode. ImageQuant software is used to convertband images to histograms. Rectangular areas are defined around each bandto obtain the total optical density. The same sized rectangles are used todefine the baselines, which are subsequently subtracted from the total opticaldensity.
error of the mean. Using a response curve analysis, an eIF2a concentration of 225 16fmol within the HCV 48S complexes has been determined. (B) Quantitative immuno-blotting analysis of purified HCV 48S complexes using antibodies specific to eIF3d.Dilutions of recombinant eIF3d (6 to 90 pmol) and 30 pmol of purified HCV 48S com-plexes were loaded as indicated and resolved by 12% NuPAGE gel. Band intensitieswere quantified using ImageQuant software and relative levels of eIF3d were normal-ized to that of the 30 pmol eIF3d intensity. Agraphic representation of the relative inten-sities is displayed on the right. All error bars are standard error of the mean. Using aresponse curve analysis, an eIF3d concentration of 38.7 4.2 pmol within the HCV 48Scomplexes has been determined. (C) Quantitative immunoblotting analysis of purifiedHCV 48S complexes assembled in the presence or absence of recombinant eIF5 usingantibodies specific to eIF5. Dilutions of recombinant eIF5 (10 to1200 fmol) and 500 fmolof purifiedHCV 48S complexeswere loaded as indicated and resolved by12%NuPAGEgel. Native eIF5 in 48S particles assembled without addition of recombinant eIF5 couldbe detected only upon overexposure of the immunoblots (on the right) and was esti-mated to be bound to 1% of the HCV 48S complexes. Intensities of normally exposedbandswere quantified using ImageQuant software, and relative levels of eIF5were nor-malized to that of the 1200 fmol eIF5 intensity. A graphic representation of the relativeintensities is displayed on the right. All error bars are standard error of the mean. Usinga response curve analysis, an eIF5 concentration of 470 20 fmol within the HCV 48Scomplexes (loaded at 500 fmol) has been determined. (D) Quantitative northern blotanalysis of purified 48S complexes using a probe specific to tRNAMet
i . Dilutions of tran-scribed tRNAMet
i (5 to 25 pmol) and15 pmolof purifiedHCV48Scomplexeswere loadedas indicated and resolved by 8% denaturing PAGE. Band intensities were quantifiedusing ImageQuant software and relative levels of tRNAMet
i were normalized to thatof the 15 pmol tRNAMet
i intensity. A graphic representation of the relative intensities isdisplayed below. All error bars are standard error of the mean. Using a response curveanalysis, a tRNAMet
i concentration of 17.31.5 pmolwithin theHCV 48S complexes hasbeen determined. (Reprintedwith permission fromLocker et al., 2006.)
98 Nicolas Locker and Peter J. Lukavsky
The quantitative analysis of eIFs within the HCV 48S complex clearlyshowed that the purified particles contain both eIF2 and eIF3 at the expected1:1 stoichiometry with 40S subunits (Locker et al., 2006) (see Fig. 54A and B).These complexes were further analyzed for the presence of eIF5, which wasexpected to be bound to the particles, since GTP hydrolysis is blockedby GMPPNP (see Fig. 5.4C). However, HCV IRESs contain less than10 fmol native eIF5 corresponding to about 1% of the HCV 48S complexes(see Fig. 5.4C, lane 5), which was clearly detectable only upon overexposureof the Western blot (see Fig. 5.4C, overexposed). This seems to reflectthe naturally low abundance of native eIF5 in RRL (Pestova et al., 2000).To test whether eIF5 can bind at 1:1 stoichiometry with other components,HCV 48S complexes were assembled in RRL supplemented with recombi-nant eIF5 (1 mM final concentration). In the 48S particle supplemented withpurified eIF5, the protein could be detected as a stably bound componentof the 48S complex, at 1:1 stoichiometry (see Fig. 5.4C, lane 6).
4.4. Quantitative Northern blotting of 48S complexes
Here we show how to quantify the amount of Met-tRNAMeti within 48S
complexes using Northern blot analysis. In principle, Met-tRNAMeti should
be present at 1:1 stoichiometry with eIF2 as part of the ternary complex.However, this method allows us to directly prove this stoichiometry indepen-dent of eIF2. The quantity of Met-tRNAMet
i was determined againsta standard curve using transcribed and purified tRNAMet
i (Pestova andHellen, 2001). Serial dilutions of tRNAMet
i ranging from 5 to 25 pmol areloaded on a 8% denaturing polyacrylamide gel (8 M urea) and resolved byelectrophoresis together with 15 pmol of purified 48S complexes assembledonto tagged mRNA. The bands are transferred to a nylon membrane andhybridized with 32P-labeled probe complementary to the 30 end of tRNAMet
i
(50-GGTAGCAGAGGATGGTTTCGATCC-30) in ExpressHybTM solu-tion (BD Biosciences); they were then exposed onto film and the resultingbands are visualized by PhosphoImager analysis and quantified as described forthe quantitative immunoblotting using ImageQuant software.
As shown in Fig. 5.4D, quantitative Northern blotting confirms that oneequivalent ofMet-tRNAMet
i is present inHCV48S particles. The same resultswere obtained for 48S complexes assembled onto other IRES RNAs orcanonical mRNA (Locker et al., 2006). These results also indirectly confirmthe 1:1 stoichiometry of eIF2 and eIF3 in the particle, since the association ofMet-tRNAMet
i with the 40S subunit withstands sucrose density gradientcentrifugation, which was used as the final purification step, only in thepresence of eIF2 (Unbehaun et al., 2004) and eIF3 is a prerequisite for stablerecruitment of the ternary complex to bothHCV IRES-mediated and canon-ical 48S particles ( Ji et al., 2004; Maag et al., 2005; Otto and Puglisi, 2004).
Affinity Purification of 48S Complexes 99
5. Functional Analysis of the Purified48S Complexes
The toeprinting experiment and quantitative analysis suggest that theisolated 48S particles are properly assembled initiation complexes, but itremains to be addressed whether they represent functional intermediatesalong the initiation pathway or GMPPNP-stalled, dead-end complexes.The affinity purification relies on the fact that eIF2-bound GTP is ex-changed to GMPPNP to block GTP hydrolysis and stall ribosome assemblyat the 48S stage. Addition of GMPPNP during the ribosome assembly inRRL is absolutely crucial for obtaining homogeneous particles (Lockeret al., 2006). If GMPPNP is omitted, only a small amount of 48S complexescarries the ternary complex (Locker et al., 2006), and therefore a large pro-portion of the 48S complexes is nonfunctional (see Fig. 5.3B). On the otherhand, if intermediates downstream of the 48S complex or initiated 80Sribosomes are to be assembled, GMPPNP needs to be backexchanged withGTP to allow eIF5-stimulated hydrolysis of eIF2-bound GTP (Chakrabartiand Maitra, 1991; Chaudhuri et al., 1994; Das et al., 2001; Unbehaun et al.,2004) and subsequent eIF5B-mediated, GTP hydrolysis-dependent joiningof the 60S subunit (Pestova et al., 2000). In the next section, we address thisquestion and show how the purified 48S complexes can be used to study eIFrelease and subunit joining.
5.1. Protocol 5: GTP hydrolysis assay using purified48s complexes
1. Incubate 2.5 pmol of purified 48S complexes in 200 ml release buffer(20 mM Tris–HCl, 100 mM KOAc, 2.5 mM MgCl2, 2 mM DTT, pH7.6) with 100 mM GTP, 50 mCi of [g32P]GTP, and 10 pmol ofrecombinant eIF5 for 30 min at 37.
2. Remove 20-ml aliquots at various time points over the 30-min periodand assay for the amount of inorganic 32P-Pi release reflecting theamount of total GTP hydrolysis using previously published protocols(Conway and Lipmann, 1964).
5.2. Protocol 6: Analysis of eIF5-induced eIF release frompurified 48S complexes
1. Incubate 25 pmol of purified 48S complexes in 150 ml of release buffercontaining 1.5 mM GTP and 100 pmol of eIF5 for 30 min at 37.
2. Remove 20-ml aliquots at various time points. Pellet ribosomal com-plexes by centrifugation for 1 h at 65,000 rpm at 4 in a TLA100.3 rotor(Beckman) using polycarbonate tubes (13 51 mm, Beckman).

100 Nicolas Locker and Peter J. Lukavsky
3. Analyze the presence of eIF2 and/or eIF3 in pellets and supernatants byimmunoblotting as described before.
5.3. Protocol 7: Analysis of eIF5B-induced eIF release frompurified 48S complexes
1. Incubate 25 pmol of 48S complexes in 150 ml of release buffer containing1.5 mM GTP, 100 pmol of eIF5, 100 pmol of DeIF5B, human eIF5BC-terminal domain [587 to 1220, which is fully active in subunit joining(Pestova et al., 2000)], and 40 pmol of 60S subunits for 15 min at 37.
2. Remove 20-ml aliquots at various time points. Pellet the ribosomalcomplexes by centrifugation for 1 h at 65,000 rpm at 4 in a TLA100.3rotor (Beckman) using polycarbonate tubes (13 51 mm, Beckman).
3. Analyze the presence of eIF2 and/or eIF3 in pellets and supernatants byimmunoblotting as described before.
5.4. Protocol 8: Sucrose density gradient analysis of 80Sribosome formation
1. Incubate 5 pmol of purified 48S complexes assembled onto 32P-labeled,tagged mRNA in 50 ml of release buffer supplemented with 1.5 mMGTP, 20 pmol of eIF5, 20 pmol of DeIF5B (Pestova et al., 2000), and10 pmol of 60S subunits for 15 min at 37.
2. Carefully layer the assembly reaction onto a 10% to 50% sucrose densitygradient prepared in a Beckman Ultra-Clear tube (25 89 mm) withrelease buffer.
3. Centrifuge at 22,000 rpm in an SW28 rotor (Beckman) for 16 h at 4Cand analyze the gradient from the top to the bottom using a gradientfractionator (Brandel) as previously described (Anthony and Merrick,1992; Pestova et al., 1996; Wilson et al., 2000).
In Fig. 5.5A and B, GTP hydrolysis and eIF2 release are monitored usingpurified HCV 48S complexes assembled in RRL (48S-eIF5–) or RRL sup-plemented with recombinant eIF5 (48S-eIF5þ). A large excess of GTP wasused in order to drive the back-exchange of eIF2-bound GMPPNP forGTP. Both particles were incubated with a 12,000-fold (GTP hydrolysis) or9000-fold (eIF2 release) excess of GTP and a 4-fold excess of eIF5 to ensurethat the back-exchange to GTP and binding of eIF5 are not rate limiting.In the case of 48S–eIF5– complexes, addition of both eIF5 and GTP isrequired to stimulate GTP hydrolysis and eIF2 release (see Fig. 5.5A and B).The 48S–eIF5þ particles, which contain eIF5 at 1:1 stoichiometry withother components, in contrast, show no sign of GTP hydrolysis or eIF2release (see Fig. 5.5A and B). This indicates that GMPPNP bound toeIF2 within 48S complexes can be exchanged with GTP only in the absence

HCV 48S-eIF5+
+GTPHCV 48S-eIF5−
+GTPHCV 48S-eIF5−
+GTP/eIF5
anti-eIF2a
0 5
Time (min)
2010
HCV 48S-eIF5+
+GTP
HCV 48S-eIF5−
+GTP
HCV 48S-eIF5−
+GTP/eIF5
HCV 48S-eIF5+
+GTP/eIF5
02468
101214161820
A
C D E
B
0 10 20 30Time (min)
32Pi (c
.p.m
10
5 )
48SeIF5GTP eIF5B60S
Bound
Released
anti-eIF3d0
1
2
0 15
48S48S+eIF5, GTP, 60S48S+eIF5, 5B, GTP, 60S
Fractions
32P m
RN
A (c.
p.m
1
04 )
80S
48S48
SRele
ased
Boun
d
eIF2a
eIF3d
anti-eIF3d
+GTP/eIF5
+++
+++
+
++++
+++++
1 3 42anti-eIF2a
Figure 5.5 Release ofeIFs fromHCV48Scomplexes during subunit joining. (A)Anal-ysis of eIF5-induced GTP hydrolysis in purified HCV IRES 48S complexes assembledin the presence (HCV 48S-eIF5þ) or absence (HCV 48S-eIF5^) of recombinant eIF5.48S complexes were treated with [g32P]GTP and eIF5, and 32P-Pi in the reactionwas quantified at different time points to reflect the amount of total GTP hydrolysis.(B) Analysis of eIF5-mediated eIF2 release from purified HCV IRES 48S complexesassembled in the presence (HCV 48S-eIF5þ) or absence (HCV 48S-eIF5^) of recombi-nant eIF5. Detection of eIF2 in the ribosomal pellet (not released from the complex) byimmunoblotting with antibodies against eIF2a at several time points during incubationwith GTP alone or GTP/eIF5 is indicated. (C) Analysis of eIF5-mediated eIF releasefrom purified HCV IRES 48S complexes. Detection of eIF2 and eIF3 by immunoblot-tingwith antibodies against eIF2a and eIF3d, respectively. Sampleswere analyzedbefore(48S) and after incubation of HCV 48S complexes with GTP and eIF5 (bound orreleased) for 15 min. (D) Analysis of eIF5B-mediated eIF3 release from purified HCVIRES 48S complexes. Detection of bound or released eIF3 by immunoblotting withantibody against eIF3d after incubation of HCV48Scomplexeswith different combina-tions of GTP, eIF5, eIF5B, and 60S subunits is as indicated for15 min. (E) Sucrose densitygradient analysis of purifiedHCV48S complexes before and after incubationwith GTP,eIF5,60S subunits, andwith or without eIF5B.The positions of ribosomal complexes areindicated above the appropriate peaks.The first fractions have been omitted for clarity.(Reprintedwith permission fromLocker et al., 2007.)
Affinity Purification of 48S Complexes 101

102 Nicolas Locker and Peter J. Lukavsky
of eIF5. The presence of eIF5 in the 48S particles seems to inhibit the releaseof GMPPNP, and as a result, its back-exchange to GTP. Therefore,48S complexes must be assembled in the absence of supplementary eIF5,if eIF release and subunit joining are to be studied.
48S complexes assembled from purified components have revealed therequirement of eIF5 and GTP for displacement of eIF2 and eIF5, eIF5B,GTP, and 60S subunits to release eIF3 during subunit joining (Unbehaunet al., 2004). Our 48S particles isolated and purified by affinity chromatog-raphy show exactly the same eIF requirements and convert into 80S ribo-somes when treated with eIF5, eIF5B, and 60S subunits in the presence ofGTP (Fig. 5.5C–E).
6. Conclusion
We presented detailed protocols for the affinity chromatography-based isolation of both canonical and IRES 48S initiation complexes fromRRL. The proper assembly, composition, and stoichiometry of the com-ponents within the isolated particles were assessed by toeprinting andquantitative Northern and Western blot analyses. Furthermore, eIF releaseexperiments showed that the isolated particles are functional intermediatesalong the initiation pathway and that they can therefore be used to study80S ribosome assembly downstream of 48S formation. We have recentlyapplied this method to study 48S and 80S assembly defects of mutant HCVIRES RNA lacking domain II (Locker et al., 2006), which is essential forIRES function (Rijnbrand et al., 1995). By analyzing eIF composition andtheir proper assembly within 48S complexes as a function of IRES RNAmutation, we could show that HCV IRES domain II is not required for 48Scomplex formation. Instead, we found that domain II functions down-stream of AUG start codon recognition, and using the experimentsdescribed in this chapter, we revealed that this domain mediates eIF2 releaseduring subunit joining (Locker et al., 2006). In addition to biochemicalapplications, our purification scheme also provides an efficient way to isolatemilligram quantities of 48S complexes, which will greatly benefit structuralstudies of eukaryotic initiation complexes.
ACKNOWLEDGMENTS
We thank Yoko Shibata for comments on the manuscript. N.L. is supported by a careerdevelopment fellowship from MRC.
Affinity Purification of 48S Complexes 103
REFERENCES
Algire, M. A., Maag, D., Savio, P., Acker, M. G., Tarun, S. Z., Jr., Sachs, A. B., Asano, K.,Nielsen, K. H., Olsen, D. S., Phan, L., et al. (2002). Development and characterization ofa reconstituted yeast translation initiation system. RNA 8, 382–397.
Algire, M. A., Maag, D., and Lorsch, J. R. (2005). Pi release from eIF2, not GTP hydrolysis,is the step controlled by start-site selection during eukaryotic translation initiation. Mol.Cell 20, 251–262.
Anthony, D. D., and Merrick, W. C. (1992). Analysis of 40S and 80S complexes withmRNA as measured by sucrose density gradients and primer extension inhibition. J. Biol.Chem. 267, 1554–1562.
Asano, K., Phan, L., Krishnamoorthy, T., Pavitt, G. D., Gomez, E., Hannig, E. M., Nika, J.,Donahue, T. F., Huang, H. K., and Hinnebusch, A. G. (2002). Analysis and reconstitu-tion of translation initiation in vitro. Methods Enzymol. 351, 221–247.
Bachler, M., Schroeder, R., and von Ahsen, U. (1999). StreptoTag: A novel method for theisolation of RNA-binding proteins. RNA 5, 1509–1516.
Benne, R., Brown-Luedi, M. L., and Hershey, J. W. (1979). Protein synthesis initiationfactors from rabbit reticulocytes: Purification, characterization, and radiochemical label-ing. Methods Enzymol. 60, 15–35.
Boehringer, D., Thermann, R., Ostareck-Lederer, A., Lewis, J. D., and Stark, H. (2005).Structure of the hepatitis C virus IRES bound to the human 80S ribosome: Remodelingof the HCV IRES. Structure (Camb.) 13, 1695–1706.
Chakrabarti, A., and Maitra, U. (1991). Function of eukaryotic initiation factor 5 in theformation of an 80 S ribosomal polypeptide chain initiation complex. J. Biol. Chem. 266,14039–14045.
Chaudhuri, J., Das, K., and Maitra, U. (1994). Purification and characterization of bacteriallyexpressed mammalian translation initiation factor 5 (eIF-5): Demonstration that eIF-5forms a specific complex with eIF-2. Biochemistry 33, 4794–4799.
Conway, T. W., and Lipmann, F. (1964). Characterization of a ribosome-linked guanosinetriphosphatase in Escherichia coli extracts. Proc. Natl. Acad. Sci. USA 52, 1462–1469.
Das, S., Ghosh, R., andMaitra, U. (2001). Eukaryotic translation initiation factor 5 functionsas a GTPase-activating protein. J. Biol. Chem. 276, 6720–6726.
Hartz, D., McPheeters, D. S., Traut, R., and Gold, L. (1988). Extension inhibition analysisof translation initiation complexes. Methods Enzymol. 164, 419–425.
Hellen, C. U., and Sarnow, P. (2001). Internal ribosome entry sites in eukaryotic mRNAmolecules. Genes Dev. 15, 1593–1612.
Hershey, J. W. B., and Merrick, W. C. (2000). The pathway and mechansim of initiationof protein synthesis. In ‘‘Translation Control of Gene Expression’’ (N. Sonenberg,J. W. B. Hershey, and M. B. Mathews, eds.), pp. 33–88. Cold Spring Harbor LaboratoryPress, Cold Spring Harbor, NY.
Ji, H., Fraser, C. S., Yu, Y., Leary, J., and Doudna, J. A. (2004). Coordinated assembly ofhuman translation initiation complexes by the hepatitis C virus internal ribosome entrysite RNA. Proc. Natl. Acad. Sci. USA 101, 16990–16995.
Kapp, L. D., and Lorsch, J. R. (2004a). GTP-dependent recognition of the methioninemoiety on initiator tRNA by translation factor eIF2. J. Mol. Biol. 335, 923–936.
Kapp, L. D., and Lorsch, J. R. (2004b). The molecular mechanics of eukaryotic translation.Annu. Rev. Biochem. 73, 657–704.
Locker, N., Easton, L. E., and Lukavsky, P. J. (2006). Affinity purification of eukaryotic 48Sinitiation complexes. RNA 12, 683–690.
Locker, N., Easton, L. E., and Lukavsky, P. J. (2007). HCV and CSFV IRES domain IImediate eIF2 release during 80S ribosome assembly. EMBO J. 26, 795–805.

104 Nicolas Locker and Peter J. Lukavsky
Lukavsky, P. J., and Puglisi, J. D. (2004). Large-scale preparation and purification ofpolyacrylamide-free RNA oligonucleotides. RNA 10, 889–893.
Maag, D., Fekete, C. A., Gryczynski, Z., and Lorsch, J. R. (2005). A conformational changein the eukaryotic translation preinitiation complex and release of eIF1 signal recognitionof the start codon. Mol. Cell. 17, 265–275.
Merrick, W. C. (1979). Evidence that a single GTP is used in the formation of 80 S initiationcomplexes. J. Biol. Chem. 254, 3708–3711.
Merrick, W. C. (2004). Cap-dependent and cap-independent translation in eukaryoticsystems. Gene 332, 1–11.
Otto, G. A., and Puglisi, J. D. (2004). The pathway of HCV IRES-mediated translationinitiation. Cell 119, 369–380.
Pestova, T. V., and Hellen, C. U. (2000). The structure and function of initiation factors ineukaryotic protein synthesis. Cell. Mol. Life Sci. 57, 651–674.
Pestova, T. V., and Hellen, C. U. (2001). Preparation and activity of synthetic unmodifiedmammalian tRNAi(Met) in initiation of translation in vitro. RNA 7, 1496–1505.
Pestova, T. V., Hellen, C. U., and Shatsky, I. N. (1996). Canonical eukaryotic initiationfactors determine initiation of translation by internal ribosomal entry.Mol. Cell. Biol. 16,6859–6869.
Pestova, T. V., Borukhov, S. I., and Hellen, C. U. (1998a). Eukaryotic ribosomes requireinitiation factors 1 and 1A to locate initiation codons. Nature 394, 854–859.
Pestova, T. V., Shatsky, I. N., Fletcher, S. P., Jackson, R. J., and Hellen, C. U. (1998b).A prokaryotic-like mode of cytoplasmic eukaryotic ribosome binding to the initiationcodon during internal translation initiation of hepatitis C and classical swine fever virusRNAs. Genes Dev. 12, 67–83.
Pestova, T. V., Lomakin, I. B., Lee, J. H., Choi, S. K., Dever, T. E., and Hellen, C. U.(2000). The joining of ribosomal subunits in eukaryotes requires eIF5B. Nature 403,332–335.
Pestova, T. V., Kolupaeva, V. G., Lomakin, I. B., Pilipenko, E. V., Shatsky, I. N.,Agol, V. I., and Hellen, C. U. (2001). Molecular mechanisms of translation initiationin eukaryotes. Proc. Natl. Acad. Sci. USA 98, 7029–7036.
Rijnbrand, R., Bredenbeek, P., van der Straaten, T., Whetter, L., Inchauspe, G., Lemon, S.,and Spaan, W. (1995). Almost the entire 50 non-translated region of hepatitis C virus isrequired for cap-independent translation. FEBS Lett. 365, 115–119.
Sachs, A. B., Sarnow, P., and Hentze, M. W. (1997). Starting at the beginning, middle, andend: Translation initiation in eukaryotes. Cell 89, 831–838.
Unbehaun, A., Borukhov, S. I., Hellen, C. U., and Pestova, T. V. (2004). Release ofinitiation factors from 48S complexes during ribosomal subunit joining and the linkbetween establishment of codon-anticodon base-pairing and hydrolysis of eIF2-boundGTP. Genes Dev. 18, 3078–3093.
Wallace, S. T., and Schroeder, R. (1998). In vitro selection and characterization ofstreptomycin-binding RNAs: Recognition discrimination between antibiotics. RNA 4,112–123.
Wilson, J. E., Pestova, T. V., Hellen, C. U., and Sarnow, P. (2000). Initiation of proteinsynthesis from the A site of the ribosome. Cell 102, 511–520.

C H A P T E R S I X
M
IS
MM
ethods
SN 0
olecuanhat
Yeast Phenotypic Assayson Translational Control
Bumjun Lee, Tsuyoshi Udagawa, Chingakham Ranjit Singh, and
Katsura Asano
Contents
1. In
in
076
lar,tan,
troduction
Enzymology, Volume 429 # 2007
-6879, DOI: 10.1016/S0076-6879(07)29006-8 All rig
Cellular, and Developmental Biology Program, Division of Biology, Kansas State UnKansas
Else
hts
ive
106
2. Q
uantitative Yeast Growth Assay 1092
.1. M aterials 1102
.2. P rocedures of yeast transformation 1122
.3. P rocedures of quantitative growth assay (spot assay) 1133. U
se of FOA to Assay Lethal Mutations and PerformPlasmid Shuffling
1143
.1. M aterials and procedures 1144. A
ssay of Dominant Negative Mutants, Foreign Proteins, orPhenotypic Suppression by Overexpression
1164
.1. M aterials 1174
.2. P rocedures 1195. A
ssay of Stringency in Start Codon Selection 1205
.1. M aterials 1215
.2. P rocedures of Sui test by histidine requirement 1215
.3. P rocedures of Sui test by b-galactosidase assay 1225
.4. b -galactosidase assay 1235
.5. U UG/AUG ratio calculation 1236. A
ssay of Translation Initiation Activities with GCN4 as Reporter 1236
.1. M aterials 1266
.2. G cd phenotype test by 3AT resistance 1276
.3. G cn phenotype test by 3AT sensitivity 1276
.4. G cd or Gcn phenotype test by b-galactosidase assay 1286
.5. T est of mechanisms causing Gcn phenotypes 1286
.6. U se of drugs other than 3AT to study yeast Gcd andGcn phenotypes
128vier Inc.
reserved.
rsity,
105

106 Bumjun Lee et al.
7. P
olysome Profiling 1297
.1. M aterials 1317
.2. P reparation of whole cell extracts 1317
.3. P rocedures of sucrose gradient-velocity sedimentation 1327
.4. M odification to identify vacant ribosomes 1337
.5. M odification to identify defects in elongation 133Ackn
owledgments 133Refe
rences 133Abstract
This chapter describes phenotypic assays on specific and general aspects
of translation using yeast Saccharomyces cerevisiae as a model eukaryote. To
study the effect on start codon selection stringency, a his4 or his4-lacZ allele
altering the first AUG to AUU is employed. Mutations relaxing the stringent
selection confer the Hisþ phenotype in the his4 strain background or increase
expression from his4-lacZ compared to that from wild-type HIS4-lacZ (Sui
phenotype). Translation of the Gcn4p transcription activator is strictly regulated
by amino acid availability depending on upstream ORF (uORF) elements in the
GCN4 mRNA leader. Mutations reducing the eIF2/GTP/Met-tRNAiMet complex
level or the rate of its binding to the 40S subunit derepress GCN4 translation
by allowing ribosomes to bypass inhibitory uORFs in the absence of the starva-
tion signal (Gcd phenotype). Mutations impairing scanning or AUG recognition
generally impair translational GCN4 induction during amino acid starvation
(Gcn phenotype). Different amino acid analogs or amino acid enzyme inhibi-
tors are used to study Gcd or Gcn phenotypes. The method of polysome
profiling is also described to gain an ultimate ‘‘phenotypic’’ proof for translation
defects.
1. Introduction
Alteration in the process of protein synthesis (translation), caused bygenetic mutations or by covalent modifications induced by external stimuli,has diverse effects on cell physiology. These effects include changes in therate of overall protein synthesis as well as translation of specific mRNA(specific translational control). If the accuracy of start codon selection by aninitiating ribosome is altered, the cell produces proteins from start codonsother than AUG, and some of the proteins produced in this manner canhave toxic effects on cells. If alteration in translation machineries specificallyaffects the mRNA encoding a transcription factor, the expression pattern ofgenes controlled by the transcription factor is also changed, leading to diversephysiological effects (Dever, 2002). These ideas have been established usingthe yeast Saccharomyces cerevisiae as a eukaryotic model organism.

Yeast Phenotypic Assays 107
The process of translation is composed of three phases: initiation, elon-gation, and termination. Eukaryotic translation involves at least 10 eukary-otic translation initiation factors (eIFs 1, 1A, 2, 2B, 3, 4A, 4B, 4F, 5, and 5B),in contrast to three initiation factors (IFs 1, 2, and 3) involved in bacterialtranslation (Pestova et al., 2006). It is noteworthy that most of the S. cerevisiaegenes encoding eIFs were isolated by genetic approaches (Hinnebusch et al.,2006). The Donahue group identified genes encoding eIF1 (SUI1), eIF5(SUI5/TIF5 ), and the three (ag) subunits of eIF2 (SUI2, SUI3, andGCD11/SUI4) as required for stringent start codon selection in yeast(Castilho-Valavicius et al., 1990; Huang et al., 1997). SUI stands for sup-pressor of initiation codon mutations; thus, Sui mutations increase thefrequency of translation from non-AUG codons.
Earlier genetic studies done by the groups of Fink, Hutter, and Greeremployed a variety of amino acid enzyme inhibitor drugs to identify genesinvolved in general yeast response to amino acid starvation stress (generalamino acid control response) (Hinnebusch, 1992). The Hinnebusch groupcharacterized GCD11, GCN3, GCD7, GCD1, GCD2, and GCD6 genesas encoding the eIF2g subunit and all five (aE) subunits of eIF2B, respec-tively. The mutants altering these genes are either able to overcome thestarvation stress independent of the key protein kinase Gcn2p (Gcd forgeneral control derepressed) or are unable to overcome the given stress dueto failure to induce the starvation response (Gcn for general controlnonderepressible) (Hinnebusch, 2005). The ability to overcome the starva-tion insult is due to translational activation of the Gcn4p transcriptionfactor, governing the general control response. On amino acid starvation,Gcn4p induces hundreds of genes including those involved in amino acidbiosynthesis genes that are required to overcome the starvation stress(Natarajan et al., 2001). Amino acid starvation activates the Gcn2p kinase,which then phosphorylates eIF2, thereby changing it from the substrate tothe inhibitor of the guanine nucleotide exchange factor eIF2B. WheneIF2B is inhibited, the level of eIF2-GTP, and hence its ternary complex(TC) with Met-tRNAi
Met, decreases. The decrease in TC level caused byeIF2 phosphorylation specifically changes the choice of start codons byribosomes reinitiating translation in the GCN4 mRNA leader, such thatGCN4 translation is induced under starvation conditions (see Fig. 6.1 fordetails). Thus, direct changes in eIF2 or eIF2B activities can induce GCN4translation independent of eIF2 phosphorylation. This mechanism allowedisolation of Gcd mutants altering genes encoding eIF2 or eIF2B. By con-trast, one mechanism to inhibit translational activation of GCN4 understarvation conditions (Gcn- phenotype) is by altering eIF2B to becomeresistant to inhibition by phospho-eIF2. A second mechanism is by inhi-biting GCN4 translation due to impaired preinitiation complex function(see details later).

35
T
3uORF1 translation
35
T
3uORF4 translation
3
3
Bypass uORF4
GCN4 OnGCN4 Off3
5T
Non-starvation (high TC level) A. A. starvation (low TC level)
GCN4 mRNA leader region
?
3?
?
?
?
uORF 1 2 3 4
Figure 6.1 Model for GCN4 translational control. Lines indicate the GCN4 mRNAleader with the gray boxes to the right (followed by diagonal hashed lines) representingtheGCN4 coding region. Of the four upstream open reading frames (uORFs), shown ontop, two (uORFs1and 4) have been shown tobe necessary and sufficient for regulation ofGCN4 expression, and are depicted as filled and open squares, respectively, on the secondline.The figure illustrates the ribosomemovement on the leader regionwith the focus onits associationwith eIF3 (3), eIF5 (5), and eIF2 TC (T).The 40S and 60S subunits are drawnas a gray rounded rectangle and gray oval, respectively. Under nonstarvation conditions(leftcolumn), thepreinitiationcomplex scans forandtranslatesuORF1.Evidencesuggeststhat eIF3 is associated with the ribosome at this stage.‘‘?’’ indicates the uncertainty of thisassociation. FollowinguORF1translation, apopulationof 40S subunits remains associatedwith the mRNA and resumes scanning after reacquiring TC and other eIFs (third andfourthpanels).Thetime it takestoscan fromuORF1touORF4 is sufficient forall scanningribosomes to reacquire TC before reaching uORF4, forcing them all to reinitiate at thisstart site (fifth to seventh panels). Under amino acid starvation conditions (right column),Gcn2pkinase is activated andphosphorylates eIF2.This phosphorylation renders eIF2 intoa competitive inhibitor of GDP/GTP exchange activity (catalyzed by eIF2B; not shown),thereby reducing the level of eIF2/GTPand henceTC levels. Accordingly, a fraction of themigrating ribosomes reaches uORF4without rebindingTC (first panel) and scanpast theuORF4 AUG codon (second panel), reacquiresTC in the uORF4^GCN4 interval (thirdpanel), and reinitiates at theGCN4AUGinstead. Implicit in thismechanism isthe fact thatAUG recognition by the scanning ribosomes requires the anticodon of initiator tRNA intheTC.
108 Bumjun Lee et al.

Yeast Phenotypic Assays 109
Since these discoveries, the reporter constructs that were designed todetect these genetic changes have been used as convenient tools for pheno-typic assays on translation initiation machineries. We used these assays todemonstrate the role for eIF4F in start codon selection (He et al., 2003) andthat of eIF5 for proper general control response (Singh et al., 2005;Yamamoto et al., 2005). This chapter describes the methods of the pheno-typic assays using HIS4 alleles as reporters for stringent AUG selection andGCN4 alleles as reporters for eIF2 or eIF2B activities, preinitiation complexassembly, or its postassembly activities.
Besides these specific changes, the inhibition of overall translationreduces the growth rate of the cell. Defects in translation initiation resultin ribosomes being shifted from polyribosomes (polysomes) engaged in tran-slation to vacant 80S ribosomes not engaged in translation. On the otherhand, defects in translation elongation result in increased abundance of thepolysomes due to slower migration of ribosomes on mRNA. Thus, poly-some profiling by density gradient-velocity sedimentation is an ultimate‘‘phenotypic’’ proof for defects in translation activities in vivo.
The yeast S. cerevisiae also provides a convenient tool to study thebiological function of foreign eukaryotic proteins. Translation machineriesare strikingly similar between this yeast and other eukaryotes. Thus, theheterologous expression of proteins from these other organisms can have asignificant impact on yeast translation, hence the growth or other specificphenotypes. A remarkable example is found in the study of eIF2 kinases.S. cerevisiae encodes Gcn2 as the sole eIF2 kinase, unlike other well-studiedeukaryotic model organisms encoding multiple eIF2 kinases. Taking advan-tage of this, mammalian eIF2 kinases, such as PKR (protein kinase RNA-activated), were expressed in yeast gcn2D strains to study the mechanism oftheir activation (Dever et al., 1993) and the regulation of PKR by virus-encoded translational inhibitors (Kawagishi-Kobayashi et al., 1997). In thischapter, phenotypic assays on specific and general aspects of translation aredescribed to examine the effects of mutations altering yeast translationfactors or regulators and of heterologous expression of foreign proteinsfrom various expression vectors.
2. Quantitative Yeast Growth Assay
Translation factors are, in general, essential for yeast growth. Thus,their mutations can show conditional or unconditional lethality. Condition-ally lethal mutants grow normally at a permissive temperature, typically at30o, but do not grow at a limiting temperature (for temperature-sensitive orTs mutants, typically at 37o; for cold-sensitive or Cs mutants, typically at18o). These can be analyzed by different growth assays, as described in this
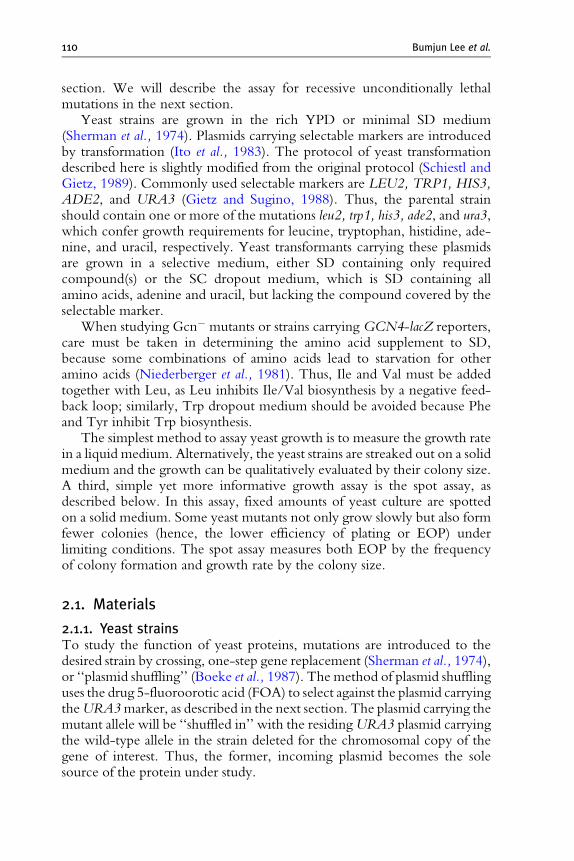
110 Bumjun Lee et al.
section. We will describe the assay for recessive unconditionally lethalmutations in the next section.
Yeast strains are grown in the rich YPD or minimal SD medium(Sherman et al., 1974). Plasmids carrying selectable markers are introducedby transformation (Ito et al., 1983). The protocol of yeast transformationdescribed here is slightly modified from the original protocol (Schiestl andGietz, 1989). Commonly used selectable markers are LEU2, TRP1, HIS3,ADE2, and URA3 (Gietz and Sugino, 1988). Thus, the parental strainshould contain one or more of the mutations leu2, trp1, his3, ade2, and ura3,which confer growth requirements for leucine, tryptophan, histidine, ade-nine, and uracil, respectively. Yeast transformants carrying these plasmidsare grown in a selective medium, either SD containing only requiredcompound(s) or the SC dropout medium, which is SD containing allamino acids, adenine and uracil, but lacking the compound covered by theselectable marker.
When studying Gcn mutants or strains carrying GCN4-lacZ reporters,care must be taken in determining the amino acid supplement to SD,because some combinations of amino acids lead to starvation for otheramino acids (Niederberger et al., 1981). Thus, Ile and Val must be addedtogether with Leu, as Leu inhibits Ile/Val biosynthesis by a negative feed-back loop; similarly, Trp dropout medium should be avoided because Pheand Tyr inhibit Trp biosynthesis.
The simplest method to assay yeast growth is to measure the growth ratein a liquid medium. Alternatively, the yeast strains are streaked out on a solidmedium and the growth can be qualitatively evaluated by their colony size.A third, simple yet more informative growth assay is the spot assay, asdescribed below. In this assay, fixed amounts of yeast culture are spottedon a solid medium. Some yeast mutants not only grow slowly but also formfewer colonies (hence, the lower efficiency of plating or EOP) underlimiting conditions. The spot assay measures both EOP by the frequencyof colony formation and growth rate by the colony size.
2.1. Materials
2.1.1. Yeast strainsTo study the function of yeast proteins, mutations are introduced to thedesired strain by crossing, one-step gene replacement (Sherman et al., 1974),or ‘‘plasmid shuffling’’ (Boeke et al., 1987). The method of plasmid shufflinguses the drug 5-fluoroorotic acid (FOA) to select against the plasmid carryingtheURA3marker, as described in the next section. The plasmid carrying themutant allele will be ‘‘shuffled in’’ with the residing URA3 plasmid carryingthe wild-type allele in the strain deleted for the chromosomal copy of thegene of interest. Thus, the former, incoming plasmid becomes the solesource of the protein under study.
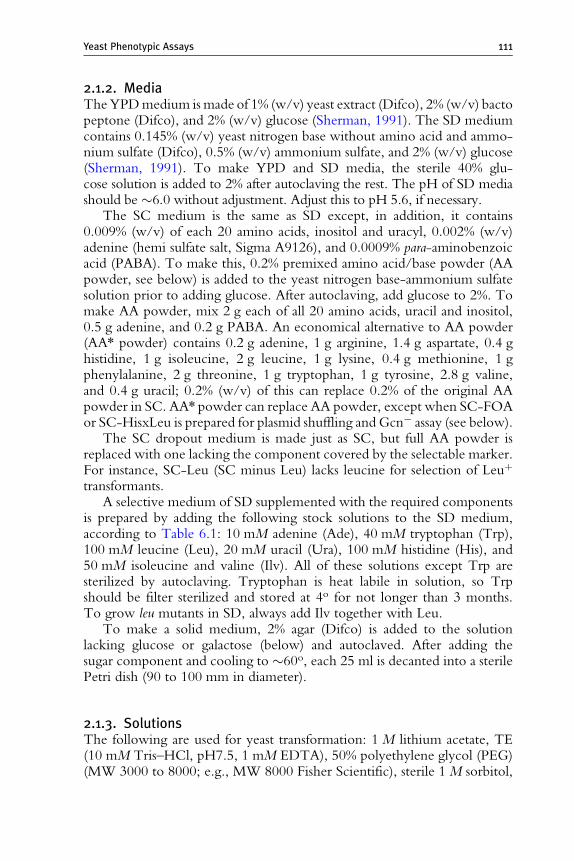
Yeast Phenotypic Assays 111
2.1.2. MediaTheYPDmedium is made of 1% (w/v) yeast extract (Difco), 2% (w/v) bactopeptone (Difco), and 2% (w/v) glucose (Sherman, 1991). The SD mediumcontains 0.145% (w/v) yeast nitrogen base without amino acid and ammo-nium sulfate (Difco), 0.5% (w/v) ammonium sulfate, and 2% (w/v) glucose(Sherman, 1991). To make YPD and SD media, the sterile 40% glu-cose solution is added to 2% after autoclaving the rest. The pH of SD mediashould be 6.0 without adjustment. Adjust this to pH 5.6, if necessary.
The SC medium is the same as SD except, in addition, it contains0.009% (w/v) of each 20 amino acids, inositol and uracyl, 0.002% (w/v)adenine (hemi sulfate salt, Sigma A9126), and 0.0009% para-aminobenzoicacid (PABA). To make this, 0.2% premixed amino acid/base powder (AApowder, see below) is added to the yeast nitrogen base-ammonium sulfatesolution prior to adding glucose. After autoclaving, add glucose to 2%. Tomake AA powder, mix 2 g each of all 20 amino acids, uracil and inositol,0.5 g adenine, and 0.2 g PABA. An economical alternative to AA powder(AA* powder) contains 0.2 g adenine, 1 g arginine, 1.4 g aspartate, 0.4 ghistidine, 1 g isoleucine, 2 g leucine, 1 g lysine, 0.4 g methionine, 1 gphenylalanine, 2 g threonine, 1 g tryptophan, 1 g tyrosine, 2.8 g valine,and 0.4 g uracil; 0.2% (w/v) of this can replace 0.2% of the original AApowder in SC. AA* powder can replace AA powder, except when SC-FOAor SC-HisxLeu is prepared for plasmid shuffling and Gcn assay (see below).
The SC dropout medium is made just as SC, but full AA powder isreplaced with one lacking the component covered by the selectable marker.For instance, SC-Leu (SC minus Leu) lacks leucine for selection of Leuþtransformants.
A selective medium of SD supplemented with the required componentsis prepared by adding the following stock solutions to the SD medium,according to Table 6.1: 10 mM adenine (Ade), 40 mM tryptophan (Trp),100 mM leucine (Leu), 20 mM uracil (Ura), 100 mM histidine (His), and50 mM isoleucine and valine (Ilv). All of these solutions except Trp aresterilized by autoclaving. Tryptophan is heat labile in solution, so Trpshould be filter sterilized and stored at 4o for not longer than 3 months.To grow leu mutants in SD, always add Ilv together with Leu.
To make a solid medium, 2% agar (Difco) is added to the solutionlacking glucose or galactose (below) and autoclaved. After adding thesugar component and cooling to 60o, each 25 ml is decanted into a sterilePetri dish (90 to 100 mm in diameter).
2.1.3. SolutionsThe following are used for yeast transformation: 1 M lithium acetate, TE(10 mM Tris–HCl, pH7.5, 1 mM EDTA), 50% polyethylene glycol (PEG)(MW 3000 to 8000; e.g., MW 8000 Fisher Scientific), sterile 1 M sorbitol,

Table 6.1 Amount of amino acid or base solutions to be added to SD medium
Amino acidor base
Stockconcentration
Milliliters addedper liter medium
Milliliters addedper 90-mmplate
Adenine (Ade) 10 mM 7.5 0.2
Tryptophan (Trp) 40 mM 10 0.1
Leucine (Leu) 100 mM 20 0.2
Uracil (Ura) 20 mM 10 0.25
Histidine (His) 100 mM 3 0.1
Isoleucine, valine
(Ilv)
50 mM each 10 0.1
112 Bumjun Lee et al.
and 1 mg/ml ssDNA solution. ssDNA is made by dissolving 250 mg sermonsperm DNA (ssDNA, Sigma D1626) into 25 ml of TE and mixing for 2 to4 h . After dissolving, use 18-gauge needles with syringe to pass the solutionthrough 20 times. Then break ssDNA further with a sonic dismembrator(Model 500 Fisher Scientific or equivalent) for 30 sec. Check the homoge-neity by pipetting. Treat the solution with an equal volume of phenol/chloroform/isoamylalcohol (25:24:1, pH 6.7, Fisher Scientific), and theaqueous phase is precipitated with ethanol. The purified DNA is suspendedinto the original volume of distilled water (final conc. is 1 mg/ml), aliquoted,and stored at –20o.
2.2. Procedures of yeast transformation
1. Prior to transformation, plasmid DNA is purified from an appropriatebacterial strain using a commercially available plasmid purification kit.The concentration of plasmid DNA typically obtained by Qiaprep SpinMiniprep Kit (Quiagen) or Wizard Plus SV Miniprep kit (Promega) issufficient for this method, and the DNA solution can be used withoutdilution.
2. Grow the overnight culture of the strain to be transformed.3. Dilute them 100-fold in 50 ml YPD in a flask (the starting A600 should
be between 0.1 and 0.3).4. Grow until A600¼ 0.5 to 0.7 at an appropriate rate of rotation at 30o.5. Transfer the culture to a 50-ml conical tube (Falcon) and spin it at 4.2k
rpm (3600g) for 5 min at 4 using Beckman J6-MI or equivalent.6. Wash the pelleted cells with 5 ml 1 M lithium acetate and spin again as
in step 4.7. Repeat step 6 to wash the cells again.8. Resuspend the cells in 0.3 ml TE. The suspended cells are competent
for transformation.

Yeast Phenotypic Assays 113
9. In a sterile microcentrifuge tube, add 50 ml ssDNA, 36 ml 1 M lithiumacetate, 3 ml plasmid DNA, 30 ml competent cells, and 240 ml 50% PEG.
10. Rotate the DNA–cell mixture for 30 to 60 min at 30o. (PEG makes themixture very viscous; thus it is very critical to make a uniform mixturehere.)
11. Incubate the cells at 42 for 7 min, and then spin down the cells in adesktop centrifuge at 5k rpm for 1 min at room temperature.
12. Suspend cells in 50 ml 1 M sorbitol and spread them onto a solidselective medium using a sterile triangular glass rod.
13. Incubate the plate at 30o unless specified otherwise.
Note on step 3. Each transformation reaction requires 5 ml of yeast mid-logarithmic culture in YPD. Thus, this method makes competent cells for10 reactions. Modify the scale of the culture according to the number ofreactions needed.
Note on step 12. The incubation time to transform wild-type yeast istypically 2 to 3 days. Successful transformation should yield colonies ofapproximately equal sizes. If the introduced plasmid carries a dominantnegative allele, the size of the transformants can become much smaller,and it may take a week to produce visible colonies.
2.3. Procedures of quantitative growth assay (spot assay)
1. Grow an overnight culture of yeast at the permissive temperature in theappropriate medium.
2. Collect the cells in 1.5-ml tubes by spinning with a desktop centrifuge(10k rpm, 1 min). Discard the supernatant by decantation.
3. Suspend the cells in 1 ml SD medium, and collect them again as instep 2.
4. Discard the supernatant by decantation and briefly spin them again.Completely remove the supernatant by pipetting.
5. Resuspend the washed cells in 1 ml SD medium.6. Measure cell density at A600 after appropriate dilution. Suspend cells
very well before taking cells for dilution and A600 measurement.7. Dilute the original overnight culture to A600 ¼ 0.15 into 500 ml SD
medium in sterile microcentrifuge tubes. For accurate pipetting, add6 ml of the original culture to an appropriate volume of SD medium,such that final A600¼ 0.15.
8. Starting with the diluted culture, make two 10-times serial dilutions(300 ml each) in sterile microcentrifuge tubes.
9. Mark the top side of the appropriate agar plates and set the plates on thetemplate, indicating the positions of three consecutive spots from adilution series in several rows. For clean results, diluted cultures shouldbe spotted on a plate according to the template under it.
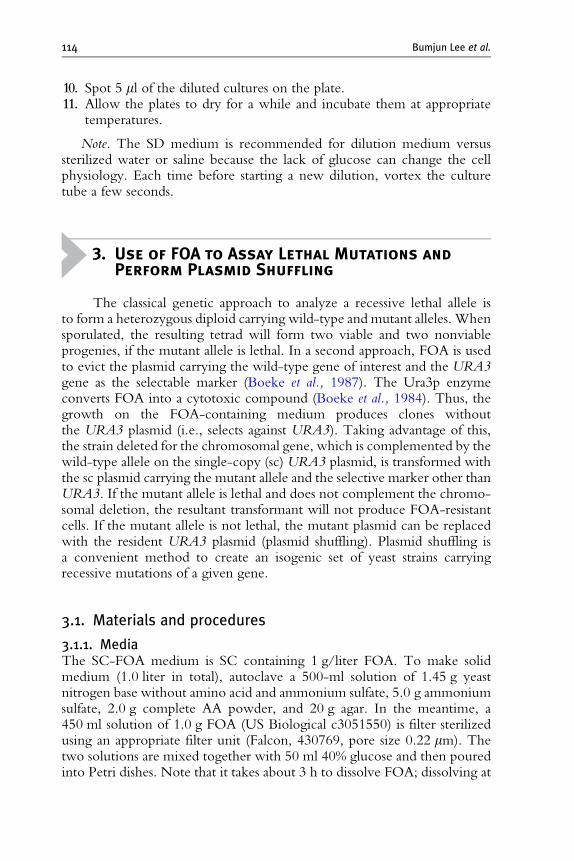
114 Bumjun Lee et al.
10. Spot 5 ml of the diluted cultures on the plate.11. Allow the plates to dry for a while and incubate them at appropriate
temperatures.
Note. The SD medium is recommended for dilution medium versussterilized water or saline because the lack of glucose can change the cellphysiology. Each time before starting a new dilution, vortex the culturetube a few seconds.
3. Use of FOA to Assay Lethal Mutations andPerform Plasmid Shuffling
The classical genetic approach to analyze a recessive lethal allele isto form a heterozygous diploid carrying wild-type and mutant alleles. Whensporulated, the resulting tetrad will form two viable and two nonviableprogenies, if the mutant allele is lethal. In a second approach, FOA is usedto evict the plasmid carrying the wild-type gene of interest and the URA3gene as the selectable marker (Boeke et al., 1987). The Ura3p enzymeconverts FOA into a cytotoxic compound (Boeke et al., 1984). Thus, thegrowth on the FOA-containing medium produces clones withoutthe URA3 plasmid (i.e., selects against URA3). Taking advantage of this,the strain deleted for the chromosomal gene, which is complemented by thewild-type allele on the single-copy (sc) URA3 plasmid, is transformed withthe sc plasmid carrying the mutant allele and the selective marker other thanURA3. If the mutant allele is lethal and does not complement the chromo-somal deletion, the resultant transformant will not produce FOA-resistantcells. If the mutant allele is not lethal, the mutant plasmid can be replacedwith the resident URA3 plasmid (plasmid shuffling). Plasmid shuffling isa convenient method to create an isogenic set of yeast strains carryingrecessive mutations of a given gene.
3.1. Materials and procedures
3.1.1. MediaThe SC-FOA medium is SC containing 1 g/liter FOA. To make solidmedium (1.0 liter in total), autoclave a 500-ml solution of 1.45 g yeastnitrogen base without amino acid and ammonium sulfate, 5.0 g ammoniumsulfate, 2.0 g complete AA powder, and 20 g agar. In the meantime, a450 ml solution of 1.0 g FOA (US Biological c3051550) is filter sterilizedusing an appropriate filter unit (Falcon, 430769, pore size 0.22 mm). Thetwo solutions are mixed together with 50 ml 40% glucose and then pouredinto Petri dishes. Note that it takes about 3 h to dissolve FOA; dissolving at

Yeast Phenotypic Assays 115
room temperature or at a temperature not higher than 50o is recommendedso as not to damage the compound. FOA plates are stored in the dark at 4o
for up to 6 months. Note also that FOA plates must contain uracil.
3.1.2. Procedures
1. Transform an appropriate yeast Uraþ strain with the incoming plasmidsmarked by LEU2 or TRP1.
2. Purify the transformants by streaking out on the solid selective mediumand by isolating a single colony (single-colony isolation).
3. Make a patch with an isolated colony on a selective media plate togetherwith patches of positive (the incoming plasmid carries a wild-type allele)and negative (the vector alone) controls.
4. The patches of the cells are grown for 1 to 2 days at 30o.5. The patches are printed onto sterile velvet (Q Biogene 5000-006) that is
set on a replica-plating base (Fisher Scientific 09-718-1).6. Transfer the cells on the velvet to the FOA plate first by applying the
plate onto the velvet and then to an appropriate selective medium tomaintain the incoming plasmid.
7. The cells are grown for 2 to 5 days at 30.8. If FOA-resistant cells do not appear, the allele is judged to be lethal.
FOA-resistant cells must appear from a control patch of transformantscarrying the wild-type plasmid.
9. (Plasmid shuffling) If FOA-resistant cells appear, the FOA-resistant deri-vatives should be purified by streaking cells from the patch for singlecolonies on a new FOA plate. Three colonies should be picked forphenotype testing. It is also advisable to carry out plasmid shuffling onfour or more of the six independent transformants for each mutant plasmidunder study and ensure that all (or three out of four) give rise to FOA-resistant derivatives that exhibit the same phenotypes. It is not uncommonto isolate variants incapable of respiration on FOA (Pet mutants), recog-nized by slow growth and lack of pigment on glucose medium and failureto grow on glycerol/ethanol medium. These should be discarded alongwith any other derivatives that show atypical phenotypes compared to themajority of five FOA-resistant clones.
Note on step 4. A common problem with this assay is the growth of FOA-resistant cells on the patch of the vector control. This is due to unknownchromosomal mutations, recombinational repair of the chromosomal dele-tion with the wild-type allele on the resident plasmid, or mutations inURA3 carried by the resident plasmid. To avoid this, the amount of cellson the replica velvet needs to be carefully controlled. For this purpose, thecells can be printed onto two FOA plates (to choose onewith the best pattern)or onto a blank SD plate first, and then onto an FOA plate (to remove cellswith the blank plate).

116 Bumjun Lee et al.
Note on step 9. It is desirable to observe URA3 plasmid loss with a highenough frequency that confluent growth of the replica-printed patch isobserved as opposed to individual papillae.
4. Assay of Dominant Negative Mutants,Foreign Proteins, or Phenotypic Suppressionby Overexpression
Plasmid shuffling as described above provides for a prime opportunityto analyze recessive mutations. However, this requires construction of theappropriate strain lacking the chromosomal wild-type allele and harboringthe latter on a URA3 episome. In construct, the characterization of domi-nant mutants does not require such genetic engineering. Dominant lethalor ‘‘dominant negative’’ mutant protein expressed from a plasmid perturbsthe function of the endogenous wild-type protein. This effect may lead toconditional lethality, and hence can be measured by the phenotypic assays,as described in this chapter. Various truncated derivatives of eIF3 subunitsare known to form partial, inhibitory eIF3 complexes, leading to dominantnegative phenotypes (Evans et al., 1995; Valasek et al., 2003). The analysis ofdominant negative mutants can be done with the transformants with theexpression plasmids and therefore is simpler than that of recessive mutants.However, it should be noted that the interpretation of phenotypes pro-duced by dominant negative mutants is complicated by the functionalcontribution of the wild-type protein.
Dominant negative mutants can be expressed from the natural promoter,unless they severely impair yeast growth or revert frequently by secondarymutations. Alternatively, these proteins are expressed from an induciblepromoter, to suppress any toxic effects caused by dominant negativemutants before the mutant activity is measured. Induction of the mutantprotein is achieved simply by moving the yeast construct from the non-inducing medium to the inducing medium, which contains a specificcompound to activate transcription from the inducible promoter. Twoexamples of commonly used inducible promoters are the galactose-inducible GAL1 promoter (pGAL1) and the copper-inducible promoter(pCUP1). pCUP1 was used to promote transcription of a dominant negativeeIF4G mutant (Dominguez et al., 1999), and elegant genetic experimentsproved that this effect was due to formation of an inhibitory complex witheIF4A (Dominguez et al., 2001). Yeast expression plasmids carrying thesepromoters are described under Materials. We describe the growth assayconditions for the use of these plasmids.
In addition to studying dominant negative mutants, wild-type yeasteIFs were overexpressed in a Ts mutant of the partner protein to study
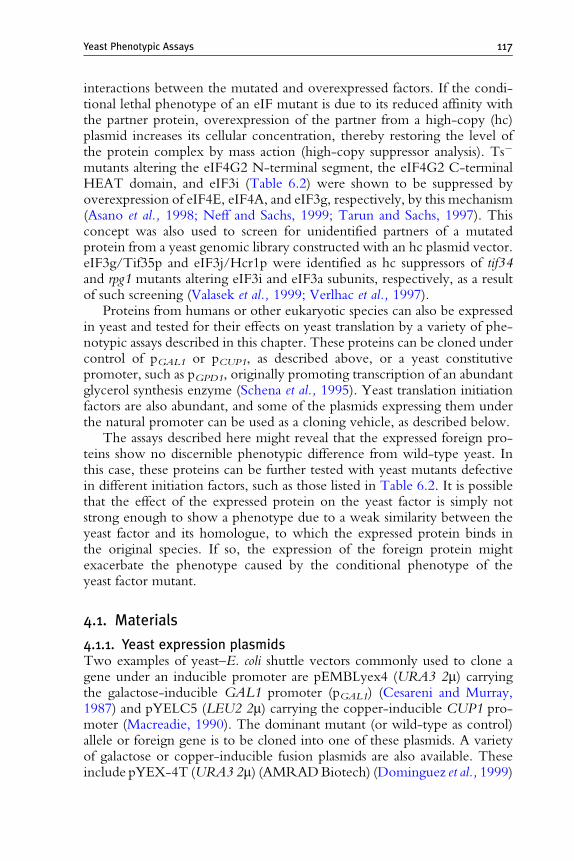
Yeast Phenotypic Assays 117
interactions between the mutated and overexpressed factors. If the condi-tional lethal phenotype of an eIF mutant is due to its reduced affinity withthe partner protein, overexpression of the partner from a high-copy (hc)plasmid increases its cellular concentration, thereby restoring the level ofthe protein complex by mass action (high-copy suppressor analysis). Tsmutants altering the eIF4G2 N-terminal segment, the eIF4G2 C-terminalHEAT domain, and eIF3i (Table 6.2) were shown to be suppressed byoverexpression of eIF4E, eIF4A, and eIF3g, respectively, by this mechanism(Asano et al., 1998; Neff and Sachs, 1999; Tarun and Sachs, 1997). Thisconcept was also used to screen for unidentified partners of a mutatedprotein from a yeast genomic library constructed with an hc plasmid vector.eIF3g/Tif35p and eIF3j/Hcr1p were identified as hc suppressors of tif34and rpg1 mutants altering eIF3i and eIF3a subunits, respectively, as a resultof such screening (Valasek et al., 1999; Verlhac et al., 1997).
Proteins from humans or other eukaryotic species can also be expressedin yeast and tested for their effects on yeast translation by a variety of phe-notypic assays described in this chapter. These proteins can be cloned undercontrol of pGAL1 or pCUP1, as described above, or a yeast constitutivepromoter, such as pGPD1, originally promoting transcription of an abundantglycerol synthesis enzyme (Schena et al., 1995). Yeast translation initiationfactors are also abundant, and some of the plasmids expressing them underthe natural promoter can be used as a cloning vehicle, as described below.
The assays described here might reveal that the expressed foreign pro-teins show no discernible phenotypic difference from wild-type yeast. Inthis case, these proteins can be further tested with yeast mutants defectivein different initiation factors, such as those listed in Table 6.2. It is possiblethat the effect of the expressed protein on the yeast factor is simply notstrong enough to show a phenotype due to a weak similarity between theyeast factor and its homologue, to which the expressed protein binds inthe original species. If so, the expression of the foreign protein mightexacerbate the phenotype caused by the conditional phenotype of theyeast factor mutant.
4.1. Materials
4.1.1. Yeast expression plasmidsTwo examples of yeast–E. coli shuttle vectors commonly used to clone agene under an inducible promoter are pEMBLyex4 (URA3 2m) carryingthe galactose-inducible GAL1 promoter (pGAL1) (Cesareni and Murray,1987) and pYELC5 (LEU2 2m) carrying the copper-inducible CUP1 pro-moter (Macreadie, 1990). The dominant mutant (or wild-type as control)allele or foreign gene is to be cloned into one of these plasmids. A varietyof galactose or copper-inducible fusion plasmids are also available. Theseinclude pYEX-4T (URA3 2m) (AMRADBiotech) (Dominguez et al., 1999)

Table 6.2 Yeast mutants altering essential translation initiation factors
Factor Mutation Defective in Mutant strainIsogenicwild-type
Emptymarker Reference
eIF1 sui1–1 AUG selection Y220 Y218 leu2 ura3 Cui et al., 1998
eIF1A tif1167–70 43S assembly H3580 H2999 ura3 Fekete et al., 2005
tif1198–101 AUG selection H3584 H3583 ura3 trp1 Fekete et al., 2005
eIF2a SUI2S51A eIF2 phosphorylation H1817 H1816 ura3 Dever et al., 1992
eIF2b SUI3–2 tRNAiMet binding KAY57 KAY56 ura3 Asano et al., 2000
eIF2g gcd11K250R GTP binding Unnameda Unnameda ura3 Erickson and Hannig,
1996
eIF2Be gcd6S576N eIF2 GEF activity GP3758 GP3751 leu2 Gomez and Pavitt, 2000
eIF3a rpg1–1 eIF3 function YLV314L W303 ade2 ura3
his3
Valasek et al., 1998
eIF3b prt1–1 48S function H1676 H2879 leu2 ura3 Nielsen et al., 2004
eIF3i tif34–1 eIF3b/g binding KAY11 KAY8 ura3 Asano et al., 1998
eIF4A tif1A79V RNA helicase SS8–3A SS8–3D ade2 trp1 Schmid and Linder, 1991
eIF4E cdc33–1 m7G-cap binding YAS1888 YAS538 ade2 leu2
ura3 trp1
Tarun and Sachs, 1997
eIF4G2 tif4632–430 eIF4E binding YAS2002 YAS1951 ade2 ura3 Tarun and Sachs, 1997
tif4632–1 eIF4A binding YAS1998 YAS1951 ade2 ura3 He et al., 2003
eIF5 SUI5G58S eIF2 GAP activity KAY321 KAY314 ura3 trp1 Singh et al., 2005
tif5–7A MFC assembly KAY328 KAY314 ura3 trp1 Singh et al., 2005
a Unnamed strains created by plasmid shuffling using transformants of DRD72 carrying wild-type or gcd11 plasmid.

Yeast Phenotypic Assays 119
and pEG(KT) (URA3 2m) (Mitchell et al., 1993) to express N-terminal GSTfusion from pCUP1 and pGAL1, respectively, and pAV1427 (pGAL1 URA3 2m)for N-terminal FLAG-epitope His6 tagging (Gomez et al., 2002). pAV1427is a derivative of pEMBLyex4 encoding N-terminal FLAG-His6-taggedGcd6p. A desired gene can be cloned into this plasmid by replacing theGCD6ORF using the flankingMluI and BamHI sites, of which the readingframe of the former is 50-ACG (Thr) CGT (Arg)-30.
Of expression vectors with a constitutive promoter, pG-1 carries pGPD1
before BamHI and SalI sites, followed by a PGK transcription terminator(Schena and Yamamoto, 1988). YCpSUI3 (LEU2 CEN) and YEpSUI3(LEU 2m) contain the NdeI–HindIII eIF2b ORF fragment flanked by itsnatural promoter and terminator (Asano et al., 1999). YCpTIF5 (LEU2CEN) and YEpTIF5 (LEU 2m) likewise contain the NdeI–SalI eIF5 ORFfragment flanked by its natural promoter and terminator (Asano et al., 1999).Any ORF DNA segment can be cloned into the unique NdeI and HindIIIor SalI sites of these plasmids; of these sites, the ATG triplet of the NdeI site(50-CAT ATG-30) is the start codon.
4.1.2. Yeast strainsFor pGAL1 constructs, it is advisable to use strains that contain GAL2,encoding the galactose permease. Yeast strains originating from the com-monly used wild-type strain S288c may be gal2, as this mutation occurs inS288c. Galactose induction occurs in gal2 mutants but is believed to occurboth less efficiently and more slowly. Pep4p and Prb1p protease-deficientstrains such as BJ1991, BJ5457, etc. (listed in Jones, 1991) are commonlyused as hosts to express foreign proteins. Table 6.2 lists yeast translationfactor mutants available to study the effect of expressed proteins includinghc suppressor analysis.
4.1.3. MediaThe SGal and SCGal media are the same as SD and SC, except that 4%galactose and 2% raffinose replace 2% glucose. To make these, the solutionsof yeast nitrogen base and ammonium sulfate and of galactose and raffinoseare separately prepared into 50% each of the final volume and mixedtogether after autoclaving. SD medium containing 0.5 mM CuSO4 is usedto induce the pCUP1-dependent transcription.
4.2. Procedures
The wild-type or dominant negative mutant alleles or foreign protein-encoding genes are cloned into the expression vectors, and the resultingplasmids are introduced to yeast strains with an appropriate reporter. Theresulting transformants are purified by single-colony isolation on the selec-tive medium, precultured in the same medium, and then cultured to a scale

120 Bumjun Lee et al.
required for the respective assays. If an inducible promoter is used, themedium used in the purification and preculturing steps should be chosen tosuppress expression from the inducible promoter. For instance, if the spotassay is used, the overnight culture should be grown in the liquid nonindu-cing medium and then spotted onto the solid inducing medium and thesolid noninducing medium as a control. The plates with the spots areincubated at 18o, 30o, 37o, or other temperatures to check for temperaturesensitivity.
5. Assay of Stringency in Start Codon Selection
The eIF2 or eIF5 mutations increasing the eIF2 GTPase activation(Huang et al., 1997; Singh et al., 2005) or the eIF1 mutations promoting itsspontaneous release (Cheung et al., 2007; Maag et al., 2005) relax thestringency of start codon selection and allow translation from UUG codons(Sui phenotype). To assay this, HIS4, which encodes a histidine synthesisenzyme, is often used as a reporter. The his4-303 mutant requires histidinein the growth medium, due to alteration of theHIS4 start codon to AUU. Itwas shown that its translation predominantly starts from the third codon ofthe HIS4 open reading frame, which is UUG, in most Sui mutants due torelaxed stringency in start codon selection (Huang et al., 1997). Thus, thesimplest and most reliable assay of Sui mutants is to check the histidinerequirement in a his4-303 background by plate assays. In this assay, a Hisþphenotype (growth in the absence of histidine) indicates a Sui phenotype.It is easy to assay for a Sui phenotype of plasmid-borne dominant negativemutants or foreign proteins by this method, as the expression plasmids canbe introduced to a his4-303 strain by transformation. However, to studyrecessive mutants altering yeast proteins, the mutations need to be intro-duced to a his4-303 or another appropriate reporter strain by crossing orplasmid shuffling. Before making such a strain, the Sui phenotype can bedetermined more quantitatively by the second assay using HIS4-lacZ plas-mids. In this assay, the strain bearing any mutation will be separatelytransformed with the HIS4-lacZ plasmid and its mutant his4-lacZ allelealtering the first AUG codon. The ratio of expression from the his4-lacZto theHIS4-lacZ allele (UUG/AUG ratio) is an indicator of the phenotype.If this ratio is significantly higher than the ratio obtained with the isogenicwild-type control, the mutant can be judged as Sui.
It should be noted that observing a Hisþ phenotype in his4-303 strainsharboring a Suimutation is dependent on transcriptional induction of his4-303 by Gcn4p and, hence, translational induction of GCN4 byeIF2a phosphorylation. Thus, the presence of any gcn mutation in thehis4-303 strain will confound the assay by suppressing the Sui phenotype.Moreover, it is possible that a Sui phenotype of a mutation can be
Yeast Phenotypic Assays 121
dampened if it also reduces the efficiency of GCN4 translational induction.This would be a complication for a mutation that reduces the rate of scan-ning as a means of increasing UUG selection, because the impairment ofscanning interferes with induction of GCN4 translation (see below). Mea-suring the ratio of expression from the UUG to AUG reporter normalizesfor any Gcn or Gcd effect of a given eIF mutation on transcriptionalactivation of the HIS4 promoter by Gcn4p.
Sui mutants altering eIF2 subunits or eIF5 (but not those altering eIF1)are, in general, dominant. Thus, the plasmid encoding one of these mutantscan be introduced to a wild-type strain as a positive control, when the effectof a dominant negative mutant or foreign protein is tested.
5.1. Materials
5.1.1. Plasmids and yeast strainsThe low-copy plasmid p367 carries URA3 and the wild-type HIS4-lacZ(HIS4AUG-lacZ) fusion (Cigan et al., 1988). p391 is a derivative of p367,with the first AUG codon of HIS4-lacZ ORF altered to UUG (his4UUG-lacZ) (Cigan et al., 1988). Each of these plasmids is used to transform yeaststrains carrying translation mutations or expressing foreign proteins. Twoexamples of Sui mutant plasmids that can be used as a positive control forSui assays are p2192 and p2187 encoding yeast Suimutant eIF2b andeIF5, respectively, on an sc LEU2 plasmid (Huang et al., 1997).
Yeast strain 76–8D (MATa ura3–52 leu2–3,112 his4–303) is used for adominant Sui test (Cigan et al., 1988). The his4–303 start codon is alteredto AUU. 76–8D is also available from K. Asano (stock # KAY84) or A.Hinnebusch (stock # F252).
5.1.2. Buffers and solutionsBuffers and solutions used for b-galactosidase assay are Breaking Buffer[0.1M Tris–HCl, pH 8.0, 20% glycerol (v/v), 1 mM 2-mercaptoethanol],Z-buffer (0.06 M Na2HPO4 7H2O, 0.04M NaH2PO4 H2O, 0.01M KCl, 0.001 M MgSO4 7H2O, 0.05M 2-mercaptoethanol), PMSF[40 mM phenylmethylsulfonyl fluoride (PMSF) in 90% ethanol, store at–20], 4 mg/ml 2-nitrophenyl-b-D-galactopyranoside (ONPG) (solutionin Z-buffer, prepared immediately before use), and 1 MNa2CO3. To makea 1-liter stock solution of Z-buffer, mix salt components first, adjust the pHto 7.0 with HCl, bring the volume to 1000 ml, and store at 4 or aliquot andthen store at –20.
5.2. Procedures of Sui test by histidine requirement
The appropriate strain or transformant carrying his4-303 is streaked outonto SC and SC-His plates and compared for the growth in the absence orpresence of histidine. Alternatively, the cells are grown in patches on the
122 Bumjun Lee et al.
solid medium and replica plated onto SC and SC-His plates, just asdescribed in the preceding section. The Hisþ strain is judged to be Sui.If a weak Hisþ phenotype is observed, the spot assay is used to bettercompare the growth between the selective media. Detection of a weakSui phenotype in a his4-303 strain can be facilitated by addition of a smallamount of histidine at a final concentration of 1 to 20 mM.
5.3. Procedures of Sui test by b-galactosidase assay
5.3.1. Cell growth and disruption
1. Introduce p367 and p391 separately to an appropriate yeast strain bytransformation, and streak out several independent transformants on asolid medium and incubate at 30o for 2 to 4 days.
2. Prepare a fresh overnight culture of transformants carrying p367 or p391in SC-Ura medium. Use appropriate SC dropout medium if differentreporter plasmids are chosen and they carry another selectable marker.
3. Add 1 ml of overnight culture to 50 ml of fresh medium and let growuntil it reaches a cell density of 2 to 4 106 cells/ml (A600 1.0). Itusually takes 8 h to grow in SC-Ura to this density.
4. Transfer the culture to a sterile centrifuge tube and spin at 3600g(4.2 k rpm in a Beckman J6-MI).
5. Resuspend in 125 ml breaking buffer and transfer to a 1.5-ml microcen-trifuge tube. If the assay is done in 2 days, this is the last step for the firstday; freeze the cell suspension at –70o.
6. Add 6.25 ml of 40 mM PMSF. Then add glass beads (Glass beads, acid-washed, Sigma G8772) to the meniscus.
7. Vortex four times for 15 sec at 4o. Check for cell breakage by examina-tion in the microscope (checking is optional).
8. Add 250 ml breaking buffer, then vortex twice for 1 min. This and thepreceding vortexing steps are critical for obtaining dense, active extracts.During vortexing, the meniscus should be V-shaped due to strongrotation. Mix and transfer the supernatant (350 ml) to an ice-cold,fresh microcentrifuge tube.
9. Centrifuge for 15 min in a microcentrifuge at 4o and transfer the super-natant to a new microcentrifuge tube.
Note on step 1. The assay needs to be done with several independenttransformants to obtain average values. Every time they are assayed, replen-ish them by growing a patch on fresh medium. If necessary, transformantscan be stored in 15% glycerol at –80o.
Note on step 4 and onward. These steps should be done on ice and all spinsshould be done at 4o in a cold room.
Yeast Phenotypic Assays 123
5.4. b-galactosidase assay
1. Incubate blank 450 ml Z-buffer at 28 for 2 min. Then add extracts to afinal volume of 0.5 ml (50 ml of extract). Include about four controlswith Z-buffer alone.
2. Add 100 ml ONPG, and gently vortex and incubate at 28. Be sure tonote this time as time 0.
3. When the color turns yellow stop the reaction by adding 250 ml 1 MNa2CO3. Note the time. Make sure that the final volume is 850 ml. Stoptwo blanks for the shortest time and two for the longest.
4. Read A420: 1 A420 unit is defined as 0.0045 nmol/ml.5. Determine the total protein concentration of the extracts by Bradford
assay and bovine serum albumin (BSA) as a standard, e.g., with Bio-RadProtein Assay (Cat. #500-0006).
6. Calculate specific b-galactosidase activity by nanomoles ONPG cleavedper minute per milligram total protein.
b-gal: unit ¼ A420 0:85=0:0045
time ðminÞ vol: of extract ðmlÞ total protien ðmg=mlÞ
5.5. UUG/AUG ratio calculation
The UUG/AUG ratio is a measure of the frequency of translation fromUUG codons compared to normal initiation frequency from AUG codons.This is calculated as the percentage of b-galactosidase activity from thetransformant carrying p391 (HIS4UUG-lacZ) to the activity from the trans-formant carrying p367 (HIS4AUG-lacZ). The typical UUG/AUG ratiovalues differ from strain to strain, ranging between 2 and 10%. However,the standard deviation for measurement with each Suiþ strain should bewithin 20% of the obtained value. Sui mutants should show a statisticallysignificant increase in this value compared to the isogenic wild-type controlstrain (p < 0.05).
6. Assay of Translation Initiation Activitieswith GCN4 as Reporter
Proper amino acid response of yeast to amino acid availability ismediated by controlled derepression of GCN4 translation in a mannerdepending on uORFs 1 to 4 (see Fig. 6.1). Gcd mutations decrease(1) the assembly of TC independent of eIF2a phosphorylation (e.g.,eIF2B mutations), or (2) the rate of TC loading on scanning 40S subunits.

124 Bumjun Lee et al.
Hence, they reduce the proportion of scanning ribosomes that have re-acquired TC by the time they reach uORF4, leading to an increased fractionthat reinitiates downstream at GCN4 instead. Other mutations impairingdifferent eIFs impair GCN4 translation derepression under starvation con-ditions, hence scoring as Gcn (see below for mechanisms). Thus, GCN4can serve as a specific reporter for translation initiation activities. There aretwo methods to measure the level of GCN4 expression. One is to use aGCN4-lacZ reporter and measure b-galactosidase activity from the reporterconstruct (Fig. 6.2A). The other indirect method uses theGCN4-dependent
GCN4
uORF1
uORF1
uORF
1 3 4p180
pM199
pM226
low high high high low low
A
B
3AT –
b-gal.
Wild type Gcd– Gcn–
C0.1
50.0
150.0
015
0.150.0
150.0
015
A600
WTtif5-I304N
WTtif5-I304N
WTtif5-I304N
+3AT–3AT
GCN2
gcn2D
gcn2Dhc TC
12
34
5
6
Gcd–
Gcn–
Gcd+
2
+ – + – +
GCN4 translation from p180
Figure 6.2 Assay of translation initiation activities using GCN4 as the reporter.(A) Structure of the leader region ofGCN4-lacZ fusion in the indicated plasmids. p180contains the wild-type regulatory region. (B) Expected GCN4-lacZ expression levelsfor wild-type, general control derepressed (Gcd) and general control nonderepressible(Gcn) mutants bearing p180 in the presence (þ) or absence (^) of 3AT in the medium.(C)Example of the 3ATtest forGcn (rows1and 2) andGcd (rows 3 and 4) phenotypesand the suppression of the Gcd phenotype by hc TC (rows 5 and 6). The isogenicGCN2þ strain bearingTIF5 (row1) or tif5-I304N (row 2) and the isogenic gcn2DTIF5 ortif5-I304N strain transformant carrying a URA3 vector (rows 3 and 4) or p1780-IMT(rows 5 and 6) are spotted onto SC-HisxLeuwith (þ) or without (^) 50 mM 3AT (rows1and 2) or SD with (þ) or without (^) 30 mM 3AT (rows 3 to 6).The culture was dilutedto the indicated A600 and 5 ml of diluted culture was spotted at each position. Cells inrows 1 and 2 and in rows 3 to 6 were incubated at 36o and 30o, respectively. (Data takenfromSingh et al.,2005.)

Yeast Phenotypic Assays 125
transcription of amino synthesis enzymes. Yeast overcomes the growthinhibition caused by amino acid starvation by inducing GCN4 translationand the attendant expression of amino acid enzymes. For instance, the drug3-amino-1,2,4-trizole (3AT) causes histidine starvation. Thus, yeast growthin the presence of 3AT is the result of Gcn4p activity and indicates strongGCN4 expression. Among the variety of drugs used to score these pheno-types, we focus on 3AT, a histidine enzyme (His3p) inhibitor, as this is oneof the most commonly used drugs to study expression from HIS3 reporters,e.g., in two hybrid assays.
To assay the Gcd phenotype as an indicator of reduced TC level orslow TC binding to the 40S subunit, we look for constitutive derepressionof GCN4 translation independent of Gcn2p kinase. In typical Gcdmutants, the wild-type GCN4-lacZ plasmid p180 (see Fig. 6.2A) shouldproduce b-galactosidase activity that is (1) higher than the activity obtainedwith the Gcdþ strain, and (2) cannot be elevated by histidine starvationin the presence of Gcn2p (Fig. 6.2B, Gcd). Note, however, that Gcdmutations that confer only partial derepression will show induction, albeitof a lesser magnitude than in GCN2þ cells starved with 3AT. It is alsoadvisable to assay p227, the p180 derivative lacking all four uORFs, toensure that the mutations of interest have no effect on its expression. Thiseliminates possible effects on transcription of GCN4-lacZ.
To use 3AT resistance as the measure of Gcn4p activity, the putativeGcd mutation needs to be introduced to a gcn2D strain. If the mutationis Gcd, it will confer 3AT resistance (Fig. 6.2C). The Gcd phenotyperesulting from a low TC level or slow TC recruitment to the ribosomeshould be suppressed by overexpressing all eIF2 subunits and tRNAi
Met
from the plasmid p1780-IMT (Asano et al., 1999) (see Fig. 6.2C).Gcd mutants can be assayed in GCN2þ backgrounds, as they are
resistant to amino acid analogs that compete with the cognate amino acidsfor incorporation into proteins. Wild-type cells are sensitive to these drugsbecause the drugs do not cause amino acid starvation. These drugs arebriefly reviewed under the section on ‘‘Use of drugs other than 3AT tostudy yeast Gcd and Gcn phenotypes.’’
To assay the Gcn phenotype, we seek failure to induce GCN4 transla-tion under 3AT-induced histidine starvation. Thus, Gcnmutations shouldnot increase b-galactosidase produced from p180 in the presence of 3AT(see Fig. 6.2B, Gcn). Gcn mutants should be sensitive to 3AT (seeFig. 6.2C). Alternatively, Gcn mutants can be scored with sulfometuronmethyl (SM) (Cheung et al., 2007).
There are three different possible mechanisms of Gcn mutations:(1) failure to initiate at uORF1 (leaky scanning of uORF1), (2) failure toresume scanning after uORF1 translation, and (3) slow rate of scanningbetween uORFs 1 and 4. The first two Gcn phenotypes arise from the factthat only ribosomes that translate uORF1 and resume scanning can skipuORF4 when TC loading is impaired. The third mechanism reflects the
126 Bumjun Lee et al.
fact that a decrease in the rate of scanning will allow a greater fraction ofscanning ribosomes to rebind TC before reaching uORF4 when the con-centration of TC is reduced by eIF2a phosphorylation, thereby decreasingthe proportion that can reach GCN4.
The following GCN4-lacZ fusion plasmids with a modified leaderregion are employed to investigate the molecular basis of a Gcn phenotype(see Fig. 6.2A). pM199 contains uORF1 only and is used to measure theefficiency of reinitiation ofGCN4 translation following uORF1 translation.pM226 is a derivative of pM199 with frameshift mutations in uORF1. Thelatter extends uORF1 to a site 130 nt downstream of the GCN4 startcodon, making the ribosome unable to reinitiate GCN4 translation aftertranslating the altered uORF1. Under these conditions, GCN4 can betranslated only by the ribosomes that had failed to initiate translation atuORF1 (e.g., by leaky scanning). Therefore, increased expression from thisreporter would indicate increased frequency of leaky scanning of uORF1.Thus, both mechanisms (1) and (2) can be directly implicated from theincrease in expression from pM226 and the decrease in expression frompM199, respectively. Indeed, both Gcn eIF5 and eIF5B mutants increasedGCN4 translation from pM226, indicative of leaky scanning of uORF1(Shin et al., 2002; Singh et al., 2005). Interestingly, Gcn eIF1A and eIF3bmutants did not alter translation from pM199 or pM226 (Fekete et al., 2005;Nielsen et al., 2004). A mechanism consistent with this phenotype is thethird mechanism to assume a slow migration of the ribosome on theGCN4leader, such that the ribosome would never reach GCN4 ORF even understrong starvation by 3AT.
6.1. Materials
6.1.1. PlasmidsThe GCN4-lacZ plasmids used are p180, p227 (Mueller and Hinnebusch,1986), pM199, and pM226 (Grant and Hinnebusch, 1994). pHQ414(gcn2D::hisG:URA3:hisG) (Qiu et al., 1998) is used to disrupt the chromo-somal GCN2. p1780-IMT is an hc plasmid encoding IMT SUI2 SUI3GCD11 and URA3 (Asano et al., 1999).
6.1.2. Yeast strainsGCNþ strains should be used to score Gcn phenotypes of a mutation ofinterest. H1894 (MATa ura3–52 leu2–3,-112 trp1–63 gcn2D) (Kawagishi-Kobayashi et al., 1997) or H2557 (MATa ura3–52 leu2–3 trp1–63 GAL2þgcn2D) (Marton et al., 1993) is used as a typical gcn2D host strain to scoreGcd phenotypes.
Yeast Phenotypic Assays 127
6.1.3. MediaAppropriate SC dropout or supplemented SD medium containing 3AT isused. 3AT is supplemented from stock solution, when the medium is cooledto 60o. To make a 3AT stock solution, 3AT (Fluka 09540) is dissolvedinto distilled water to 1 M by stirring for 1 h at 60o, filter sterilized using anappropriate filter unit (e.g., Falcon 43079, pore size 0.22 mm), aliquoted,and stored at –20. A test of the Gcn phenotype must use the complete AApowder instead of its economical alternative, AA*. SM (0.5 mg/ml) shouldbe added to SC lacking leucine, isoleucine, and valine.
To enhance the sensitivity of the Gcn test using 3AT, 3AT is added toSC-HisxLeu, which is SC-His supplemented with 40 mM leucine. Excessleucine suppresses the general control response and, therefore, may make aweak Gcn mutant more sensitive to 3AT.
6.2. Gcd phenotype test by 3AT resistance
For recessive mutations, introduce gcn2D by transforming the mutant strainor its isogenic wild type with the EcoRI–XbaI fragment of pHQ414 toUraþ. Integration at the correct position is confirmed by 3AT sensitivity(for otherwise wild-type strain), Southern blotting, or PCR using primershybridizing to pHQ414 and GCN2 flanking regions. If necessary, theURA3 allele inserted at the gcn2D locus is removed by homologous recom-bination (or ‘‘looping out’’) by growing gcn2D::URA3 cells on an SC-FOAplate. For dominant mutations or foreign genes, introduce the expressionplasmids to a gcn2D strain (such as H1894 or H2557) by transformation.
The desired strains or transformants are subjected to Spot Assay byspotting their culture onto appropriate SC-His (and other dropout asneeded) or SD solid medium with or without 10 to 50 mM 3AT andincubating the plates at 30o. Histidine should not be present because itrelaxes the general control response. Testing at a high temperature (such as37o) is not recommended because this also relaxes the general controlresponse. Weak Gcd mutants form visible colonies on 10 mM 3AT platesafter 6 to 8 days.
6.3. Gcn phenotype test by 3AT sensitivity
The test of the Gcn phenotype requires that the relevant mutation isintroduced to a HISþ GCNþ strain. Desired strains or transformants aresubjected to Spot Assay with SC-HisxLeu medium with or without 30 to50 mM 3AT. Plates are incubated at 30o at an appropriate restrictive orsemirestrictive temperature. For testing his GCNþ derivatives, use SM(0.5 mg/ml) (see below).
128 Bumjun Lee et al.
6.4. Gcd or Gcn phenotype test by b-galactosidase assay
Transform mutants and isogenic wild-type control with p180. After single-colony isolation, grow yeast and assay b-galactosidase, essentially asdescribed in the preceding section. To induce histidine starvation, 3AT isadded to the culture to 10 mM after 2 h of initial growth at step 3 of ‘‘CellGrowth and Disruption.’’ Again, be sure to remove histidine from themedium when 3AT is added.
6.5. Test of mechanisms causing Gcn phenotypes
Transform Gcn mutants and isogenic wild-type control with pM199and pM226. After single-colony isolation, grow yeast in SC-Ura and assayb-galactosidase, as exactly described in the preceding section. Note thatyeast must be grown at the temperature at which Gcn phenotypes areobserved. In the case of most eIF5 Gcn mutants, Gcnphenotypes wereobserved at 36o, but not at 30o or 33o. Thus, transformants with pM199 andpM226 were assayed at 36o (Singh et al., 2005).
6.6. Use of drugs other than 3AT to study yeast Gcd andGcn phenotypes
Gcd mutants can be assayed in GCN2þ backgrounds, as they are resistantto analogs that compete with the cognate amino acids for incorporation intoproteins (Niederberger et al., 1986), due to constitutively elevated aminoacid pools resulting from constitutively derepressed Gcn4p. Wild-type cellsare sensitive to such analogs because the analogs do not inhibit biosynthesisof the cognate amino acids and, hence, do not derepress Gcn4p. The bestones are 1,2,4-triazolealanine (TRA), 5-fluorotryptophan (5-FT), and aze-tidine-2-carboxylic acid (AZC), which mimic His, Trp, and Pro, respec-tively. A combination of 0.5 mM TRA and 0.25 mM 5-FT (in SD, see theNote below) can be used to increase discrimination between wild-type andGcd strains (Ramirez et al., 1992). Pavitt et al. were the first to use AZC toscore Gcd mutants altering eIF2B subunits (Richardson et al., 2004).
Besides 3AT, Gcn mutants are sensitive to other antimetabolites(which may or may not be amino acid analogs) that interfere with aminoacid biosynthesis, as these mutants cannot increase expression of the inhib-ited enzymes by inducing their transcription via Gcn4p. The most effectiveand specific inhibitors are 3AT and sulfometuron methyl (SM); SM inhibitsIlv2p, involved in synthesis of isoleucine and valine. This is a good choicefor scoring Gcn phenotypes in a his background, because adding therequired histidine overcomes the starvation effect imposed by 3AT.
Note. As 3AT cannot be used with his mutants, TRA cannot be usedwith his mutants and 5-FT cannot be used with trp auxotrophs. Finally, Pro

Yeast Phenotypic Assays 129
may be substituted for NH4 as a nitrogen source to increase uptake of TRAand 5-FT, and 5-FT must be used with minimal supplements to avoidcompetition with other amino acids for uptake.
7. Polysome Profiling
The ultimate test of in vivo translation deficiency is to measure theabundance of polysome by sucrose gradient-velocity sedimentation, inwhich extracts prepared from growing yeast are layered onto a sucrosedensity gradient and resolved by ultracentrifugation in a swinging bucketrotor. Polysome runoff occurs when mutants inhibit initiation but havenormal elongation rates, or at least have a stronger effect on initiation thanon elongation. If translation initiation is defective, this reduces the number ofribosomes translating a given mRNA and hence reduces the abundance ofpolysomes, due to defective ribosome loading onto mRNA. If translationelongation is defective, this increases the number of ribosomes on a givenmRNA and hence increases the abundance of polysomes, due to slowmigration of translating ribosomes on the mRNA (Anand et al., 2003;Ortiz and Kinzy, 2005).
Cycloheximide is added to the living cells just prior to harvesting tofreeze the polysomes in vivo and preserve them during extract preparation.This is necessary because without the drug, elongation and terminationcontinue in the extract, whereas new initiation events do not occur, result-ing in polysome runoff. Elongation defects will also prevent polysomerunoff in the absence of cycloheximide. Indeed, polysomes isolated fromelongation factor mutants are more stable in the absence of cycloheximide,as described below.
Because not all of the ribosomes are engaged in translation, a substantialfraction of ribosomes exists as ‘‘vacant’’ 80S ribosome. Thus, vacant 80Sribosome increases when polysome decreases, and the polysome abundanceis reliably measured as the polysome-to-monosome (P/M) ratio. In theory,the P/M ratio becomes smaller with initiation defects, while it becomeslarger with elongation defects. As described below, vacant ribosomes can bedemonstrated by specifically dissociating them into large and small subunits,taking advantage of their salt sensitivity.
Figure 6.3A shows an example of translation initiation defects observedwith a slow-growing tif5–7A mutant altering eIF5. The tif5–7A mutationreduced the P/M ratio, hence the initiation frequency, at the permissivetemperature of 30o (top panel), and this trend was enhanced by shiftingthe culture to the limiting temperature of 37o (third and fourth panels). Todetermine whether the difference in P/M ratio was accompanied by accu-mulation of vacant 80S ribosomes, vacant 80S ribosomes were dissociated

30
37
40S 60S
80S
P/M = 2.3( d.t. = 1.8 h)
P/M = 0.93( d.t. = 3.9 h)
P/M = 0.69( d.t. = 6.1 h)
P/M = 3.0( d.t. = 1.8 h)
TIF5-FL
23 4
5640S 60S
80S
40S 60S
80S
2 3 4 5 6
P/M = 2.5 P/M = 0.94
P/M = 0.74P/M = 2.4
Polysomes
40S 60S
80S Polysomes
t=0
4.5 h
4.5 h
1.5 h
tif5-FL-7AA
B
Figure 6.3 Polysome profiling ofTIF5 and tif5^7A strains. (A) IsogenicTIF5 and tif5^7A strains were cultured in appropriate volumes of YPD at 30o. When grown toA6001.0, 300 ml of the culture was transferred to a flask equilibrated at 30o, supplemen-ted with cycloheximide, and then collected for polysome profiling (top panel). Stillanother portion of the culture was transferred to a flask containing an appropriateamount of YPD equilibrated at 37o. After 1.5 and 4.5 h of temperature shift, 300 ml ofthe culture was withdrawn and subjected to polysome profiling (third and fourthpanels). The original culture was supplemented withYPD prewarmed at 30o and sub-jected to polysome profiling after 4.5 h (second panel). At each step, culture was dilutedwith appropriate volumes of prewarmed YPD to maintain the culture A600 of about1.0 when cells were collected next time. (B) Extracts prepared at time 0 were resolvedwith a sucrose gradient containing NaCl, as described in the text. (Adapted fromAsanoet al.,2000.)
130 Bumjun Lee et al.

Yeast Phenotypic Assays 131
into subunits by salt treatment during the velocity sedimentation.Figure 6.3B indeed indicates that vacant 80S ribosomes, as visualized by40S and 60S subunits, increased in the tif5–7A mutant.
7.1. Materials
7.1.2. Buffers and solutionsBreaking Buffer K includes 20 mM Tris–HCl, pH7.5, 50 mM KCl, 10 mMMgCl2, 1 mM DTT, 200 mg/ml heparin, 50 mg/ml cycloheximide,manufacture-recommended amounts of EDTA-free CompleteTM proteaseinhibitors (Roche Applied Science), and 1 mg/ml each of pepstatin A,leupeptin, and aprotinin (Roche Applied Science). A 10 mg/ml cyclohexi-mide (Sigma C-7698) solution in water is also used to supplement yeastgrowth media.
To set up a density gradient, 5% and 45% sucrose solutions (w/v) in20 mM Tris–HCl, pH 7.5, 50 mM KCl, 10 mM MgCl2, and 1 mM DTTare used. To make the sucrose solutions, consider that dissolving sucroseinto water substantially increases the volume of the solution, and start byadding sucrose to a volume of water of about one-third of the final volumerequired. For a longer-term storage, the recommendation is to sterilize thesolution by autoclaving. To do this, make the sucrose solution to 90% of thefinal volume and mark the meniscus on the bottle containing it. Autoclavethe solution in the bottle and restore it to the original marked volume withsterile water. After autoclaving, add salt components from the stock solu-tions and then water to the final volume. The resulting sucrose solution canbe stored at room temperature. Add DTT immediately before use.
7.2. Preparation of whole cell extracts
1. Grow 300 ml of yeast culture in a desired medium to A600 ¼ 1.5 to 2.0(mid-log phase). To aerate the cells well, grow them in a 1-liter flaskwith rotation at 250 rpm.
2. Five minutes prior to harvesting, add cycloheximide to 50 mg/ml andcontinue growing.
3. Collect the cells in ice-cold 500-ml centrifuge bottles (Nalgene). Topoff with ice before closing the bottle.
4. Centrifuge immediately in a GSA-3 rotor or equivalent at 7 k rpm(6500g) for 10 min at 4.
5. After decanting, suspend the cells in 10 ml BBK and transfer to a conical15-ml tube.
6. Spin in a J6-MI or equivalent centrifuge at 4.2k rpm for 7 min at 4.7. Remove the supernatant and estimate the cell volume. Expect1 ml of
cells at this point. Resuspend the cells in 1.5 volumes of ice-cold BBKand add 1 volume of cold glass beads (425 to 600 mm, Sigma G8772).

132 Bumjun Lee et al.
8. Break the cells by vortexing at 4o with eight consecutive cycles of 45 to60 sec, with 1 min intervals. Use a water/ice mixture bath or KCl/water/ice bath for quick chilling between cycles.
9. Spin in the J6-MI or equivalent at 1.0 k rpm for 5 min at 4 to pelletlarge debris and glass beads.
10. Transfer the supernatant to ice-cold microcentrifuge tubes and spin at14 k rpm for 10 min. Repeat as needed until the supernatant is clear.
11. Transfer the cleared lysates to a fresh ice-cold microcentrifuge tube.12. Make a 1/300 dilution and measure A260. Gradients should be loaded
with 25 A260 units, which corresponds to around 1 mg of total protein.
7.3. Procedures of sucrose gradient-velocity sedimentation
1. Using equal volumes of 5% and 45% sucrose, set up a sucrose gradientin a Beckman No. 331372 tube. Gradient preparation can be facilitatedusing a Gradient Master (Biocomp) according to the manufacturer’srecommendations.
2. Equilibrate the temperature of the gradient at 4o before loading thesample.
3. Carefully layer 25 A260 units of cell extract with a pipettor. To balancethe weight of two tubes for ultracentrifugation, an amount of sucrosegradient is removed very slowly from one tube prior to layering the cellextracts, such that the removed amount is equivalent to the difference inthe volumes of cell extract to be loaded on the two tubes.
4. Centrifuge in an SW41Ti rotor or equivalent at 39k rpm, 4o for 2.5 h.5. Place the tube onto a Tube Piercer (ISCO, Inc.), which connects to a
Type 11 Optical unit of a UA-6 UV/Vis detector or equivalent.6. Monitor and record A254 as the gradient sample flows into the UV unit.7. Calculate the polysome to monosome (P/M) ratio, using an appropriate
graphic software or photocopying the original chart, physically cuttingthe area under monosome and polysome peaks and weighing the piecesof paper (in milligrams).
Note on steps 5 and 6. The model 185 or equivalent density gradientfractionator (ISCO, Inc., Lincoln, NE) that is frequently used for gradientanalyses was discontinued. We use a unit assembled from the componentsrecommended by the same company. The sucrose gradient sample in the tubeis pumped up to the optical unit by a peristaltic pump. We use a Tris pumpfrom ISCO, Inc., which connects to a fractionator unit, Foxy Jr. FractionCollector from ISCO, Inc.The speed of the pump is set at 1 ml/min. Use 60%sucrose dyed with an appropriate amount of bromophenol blue to pump upthe sucrose gradient inside the tube into the optical unit. The sucrose thatcomes out from the tube is constantly monitored by the optical unit usinga filter for A254, which can be replaced with the desired absorption unit.

Yeast Phenotypic Assays 133
The optical unit signal is relayed into the UA-6 detector, which has a built-in recorder. The polysome profile is recorded on the recorder chart paper.The parameters are set on the recorder according to the experimentalrequirement. The sensitivity is kept at 1.0 A unit in full scale, speed at150 cm/h, and noise filter at 1.5.
7.4. Modification to identify vacant ribosomes
To identify ‘‘vacant’’ 80S ribosomes, cell extracts are prepared exactly asabove and layered on and resolved in the same 5% to 45% sucrose gradientexcept that it contains 0.7M NaCl.
7.5. Modification to identify defects in elongation
To identify elongation defects by leaving out cycloheximide, 600 ml ofyeast culture is grown and paired into two flasks at steps 1 and 2 of‘‘Preparation of whole cell extracts.’’ The 300-ml culture in one flask istreated with cycloheximide, collected, and washed and disrupted in BBK(with cycloheximide) as described above. The other 300-ml culture is nottreated with cycloheximide, collected, and washed and disrupted in BBKlacking cycloheximide. It is important to know that even the polysomesisolated from elongation mutants eventually run off in the absence ofcycloheximide. Thus, it is critical to prepare, layer, and spin the cell extractswith or without cycloheximide in parallel at a reasonable speed. TheKinzy group finds this method much more reliable in evaluating specificelongation defects.
ACKNOWLEDGMENTS
The methods described here are modified from standard procedures practiced by many yeastscientists. We thank Alan Hinnebusch for detailed reviews and numerous comments and hiscurrent and former colleagues for frank discussions about the methods described. Thanks arealso due to Terri Kinzy for personal communications, Beth Montelone for helping us set upthe initial yeast experiments and proofreading the manuscript, Ernie Hannig for straininformation, and the former colleagues in the Asano laboratory for discussions. The researchactivities in the Asano laboratory are supported by NIH R01 GM64781.
REFERENCES
Anand, M., Chakraburtty, K., Marton, M., Hinnebusch, A. G., and Kinzy, T. G. (2003).Functional interactions between yeast translation eukaryotic elongation factor (eEF) 1Aand eEF3. J. Biol. Chem. 278, 6985–6991.
Asano, K., Phan, L., Anderson, J., and Hinnebusch, A. G. (1998). Complex formation byall five homologues of mammalian translation initiation factor 3 subunits from yeastSaccharomyces cerevisiae. J. Biol. Chem. 273, 18573–18585.

134 Bumjun Lee et al.
Asano, K., Krishnamoorthy, T., Phan, L., Pavitt, G. D., and Hinnebusch, A. G. (1999).Conserved bipartite motifs in yeast eIF5 and eIF2Be, GTPase-activating and GDP-GTPexchange factors in translation initiation, mediate binding to their common substrateeIF2. EMBO J. 18, 1673–1688.
Asano, K., Clayton, J., Shalev, A., and Hinnebusch, A. G. (2000). A multifactor complex ofeukaryotic initiation factors eIF1, eIF2, eIF3, eIF5, and initiator tRNAMet is an importanttranslation initiation intermediate in vivo. Genes Dev. 14, 2534–2546.
Boeke, J. D., LaCroute, F., and Fink, G. R. (1984). A positive selection for mutants lackingorotidine-50-phosphate decarboxylase activity in yeast: 5-Fluoro-orotic acid resistance.Mol. Gen. Genet. 197, 345–346.
Boeke, J. D., Trueheart, J., Natsoulis, G., and Fink, G. R. (1987). 5-Fluoroorotic acid as aselective agent in yeast molecular genes. Methods Enzymol. 154, 164–175.
Castilho-Valavicius, B., Yoon, H., and Donahue, T. F. (1990). Genetic characterization ofthe Saccharomyces cerevisiae translational initiation suppressors sui1, sui2 and SUI3 and theireffects on HIS4 expression. Genetics 124, 483–495.
Cesareni, G., and Murray, J. A. H. (1987). Plasmid vectors carrying the replication origin offilamentous single-stranded phages. In ‘‘Genetic Engineering: Principals and Methods’’( J. K. Setlow and A. Hollaender, eds.), Vol. 9, pp. 135–154. Plenum Press, New York,NY.
Cheung, Y.-N., Maag, D., Mitchell, S. F., Fekete, C. A., Algire, M. A., Takacs, J. E.,Shirokikh, N., Pestova, T., Lorsch, J. R., and Hinnebusch, A. (2007). Dissociation ofeIF1 from the 40S ribosomal subunit is a key step in start codon selection in vivo. GenesDev. 21(10), 1217–1230.
Cigan, A. M., Pabich, E. K., and Donahue, T. F. (1988). Mutational analysis of the HIS4translational initiator region in Saccharomyces cerevisiae. Mol. Cell. Biol. 8, 2964–2975.
Cui, Y., Dinman, J. D., Kinzy, T. G., and Peltz, S. W. (1998). The Mof 2/Sui1 protein is ageneral monitor of translational accuracy. Mol. Cell. Biol. 18, 1506–1516.
Dever, T. E. (2002). Gene-specific regulation by general translation factors. Cell 108,545–556.
Dever, T. E., Feng, L., Wek, R. C., Cigan, A. M., Donahue, T. D., and Hinnebusch, A. G.(1992). Phosphorylation of initiation factor 2a by protein kinase GCN2 mediates gene-specific translational control of GCN4 in yeast. Cell 68, 585–596.
Dever, T. E., Chen, J. J., Barber, G. N., Cigan, A. M., Feng, L., Donahue, T. F.,London, I. M., Katze, M. G., and Hinnebusch, A. G. (1993). Mammalian eukaryoticinitiation factor 2a kinases functionally substitute for GCN2 in the GCN4 translationalcontrol mechanism of yeast. Proc. Natl. Acad. Sci. USA 90, 4616–4620.
Dominguez, D., Altmann, M., Benz, J., Baumann, U., and Trachsel, H. (1999). Interactionof translation initiation factor eIF4G with eIF4A in the yeast Saccharomyces cerevisiae.J. Biol. Chem. 274, 26720–26726.
Dominguez, D., Kislig, E., Altmann, M., and Trachsel, H. (2001). Structure and functionalsimilarities between the cenral eukaryotic initiation factor (eIF) 4A-binding domain ofmammalian eIF4G and the eIF4A-binding domain of yeast eIF4G. Biochem. J. 355,223–230.
Erickson, F. L., and Hannig, E. M. (1996). Ligand interactions with eukaryotic translationinitiation factor 2: Role of the g-subunit. EMBO J. 15, 6311–6320.
Evans, D. R. H., Rasmussen, C., Hanic-Joyce, P. J., Johnston, G. C., Singer, R. A., andBarnes, C. A. (1995). Mutational analysis of the Prt1 protein subunit of yeast translationinitiation factor 3. Mol. Cell. Biol. 15, 4525–4535.
Fekete, C. A., Applefield, D. J., Blakely, S. A., Shirokikh, N., Pestova, T., Lorsch, J. R., andHinnebusch, A. G. (2005). The eIF1A C-terminal domain promotes initiation complexassembly, scanning and AUG selection in vivo. EMBO J. 24, 3588–3601.
Yeast Phenotypic Assays 135
Gietz, R. D., and Sugino, A. (1988). New yeast-Escherichia coli shuttle vectors constructedwith in vitro mutagenized yeast genes lacking six-base pair restriction sites. Gene 74,527–534.
Gomez, E., and Pavitt, G. D. (2000). Identification of domains and residues within theepsilon subunit of eukaryotic translation initiation factor 2B (eIF2b) required for guaninenucleotide exchange reveals a novel activation function promoted by eIF2B complexformation. Mol. Cell. Biol. 20, 3965–3976.
Gomez, E., Mohammad, S. S., and Pavitt, G. P. (2002). Characterization of the minimalcatalytic domain within eIF2B: The guanine-nucleotide exchange factor for translationinitiation. EMBO J. 21, 5292–5301.
Grant, C. M., and Hinnebusch, A. G. (1994). Effect of sequence context at stop codonson efficiency of reinitiation in GCN4 translational control.Mol. Cell. Biol. 14, 606–618.
He, H., von der Haar, T., Singh, R. C., Ii, M., Li, B., McCarthy, J. E. G.,Hinnebusch, A. G., and Asano, K. (2003). The yeast eIF4G HEAT domain interactswith eIF1 and eIF5 and is involved in stringent AUG selection. Mol. Cell. Biol. 23,5441–5445.
Hinnebusch, A. G. (1992). General and pathway-specific regulatory mechanisms controllingthe synthesis of amino acid biosynthetic enzymes in Saccharomyces cerevisiae. In ‘‘TheMolecular and Cellular Biology of the Yeast Saccharomyces: Gene Expression’’( J. R. Broach, E. W. Jones, and J. R. Pringle, eds.), pp. 319–414. Cold Spring HarborLaboratory Press, Cold Spring Harbor, NY.
Hinnebusch, A. G. (2005). Translational regulation of gcn4 and the general amino acidcontrol of yeast. Annu. Rev. Microbiol. 59, 407–450.
Hinnebusch, A. G., Dever, T. E., and Asano, K. (2006). Mechanism of translation initiationin the yeast Saccharomyces cerevisiae. In ‘‘Translational Control in Biology and Medicine’’(M. B. Mathews, N. Sonenberg, and J. W. B. Hershey, eds.). Cold Spring HarborLaboratory Press, Cold Spring Harbor, NY.
Huang, H., Yoon, H., Hannig, E. M., and Donahue, T. F. (1997). GTP hydrolysis controlsstringent selection of the AUG start codon during translation initiation in Saccharomycescerevisiae. Genes Dev. 11, 2396–2413.
Ito, H., Fukada, Y., Murata, K., and Kimura, A. (1983). Transformation of intact yeast cellstreated with alkali cations. J. Bacteriol. 153, 163–168.
Jones, E. W. (1991). Tackling the protease problem in Saccharomyces cerevisiae. MethodsEnzymol. 194, 428–453.
Kawagishi-Kobayashi, M., Silverman, J. B., Ung, T. K., and Dever, T. E. (1997). Regula-tion of the protein kinase PKR by the vaccinia virus pseudosubstrate inhibitor K3L isdependent on residues conserved between the K3L protein and the PKR substrate eIF2a.Mol. Cell. Biol. 17, 4146–4158.
Maag, D., Fekete, C. A., Gryczynski, Z., and Lorsch, J. R. (2005). A conformational changein the eukaryotic translation preinitiation complex and release of eIF1 signal recognitionof the start codon. Mol. Cell 17, 265–275.
Macreadie, I. G. (1990). Yeast vectors for cloning and copper-inducible expression offoreign genes. Nucl. Acids Res. 18, 1078.
Marton, M. J., Crouch, D., and Hinnebusch, A. G. (1993). GCN1, a translational activatorof GCN4 in S. cerevisiae, is required for phosphorylation of eukaryotic translationinitiation factor 2 by protein kinase GCN2. Mol. Cell. Biol. 13, 3541–3556.
Mitchell, D. A., Marshall, T. K., and Deschenes, R. J. (1993). Vectors for the inducibleoverexpression of glutathione S-transferase fusion proteins in yeast. Yeast 9, 715–722.
Mueller, P. P., and Hinnebusch, A. G. (1986). Multiple upstream AUG codons mediatetranslational control of GCN4. Cell 45, 201–207.
Natarajan, K., Meyer, M. R., Jackson, B. M., Slade, D., Roberts, C., Hinnebusch, A. G.,and Marton, M. J. (2001). Transcriptional profiling shows that Gcn4p is a master

136 Bumjun Lee et al.
regulator of gene expression during amino acid starvation in yeast. Mol. Cell. Biol. 21,4347–4368.
Neff, C. L., and Sachs, A. B. (1999). Eukaryotic translation initiation factors eIF4G andeIF4A from Saccharomyces cerevisiae physically and functionally interact.Mol. Cell. Biol. 19,5557–5564.
Niederberger, P., Aebi, M., and Huetter, R. (1986). Identification and characterization offour new GCD genes in Saccharomyces cerevisiae. Curr. Genet. 10, 657–664.
Niederberger, P., Miozzari, G., and Huetter, R. (1981). Biological role of the general controlof amino acid biosynthesis in Saccharomyces cerevisiae. Mol. Cell. Biol. 1, 584–593.
Nielsen, K. H., Szamecz, B., Valasek, L., Jivotovskaya, A., Shin, B. S., andHinnebusch, A. G. (2004). Functions of eIF3 downstream of 48S assembly impactAUG recognition and GCN4 translational control. EMBO J. 23, 1166–1177.
Ortiz, P. A., and Kinzy, T. G. (2005). Dominant-negative mutant phenotypes and theregulation of translation elongation factor 2 levels in yeast. Nucl. Acids Res. 33,5740–5748.
Pestova, T. V., Lorsch, J. R., and Hellen, C. U. T. (2006). The mechanism of translationinitiation in eukaryotes. In ‘‘Translational Control in Biology and Medicine’’(M. B. Mathews, N. Sonenberg, and J. W. B. Hershey, eds.). Cold Spring HarborLaboratory Press, Cold Spring Harbor, NY.
Qiu, H., Garcia-Barrio, M. T., and Hinnebusch, A. G. (1998). Dimerization by translationinitiation factor 2 kinase GCN2 is mediated by interactions in the C-terminal ribosome-binding region and the protein kinase domain. Mol. Cell. Biol. 18, 2697–2711.
Ramirez, M., Wek, R. C., Vazquez de Aldana, C. R., Jackson, B. M., Freeman, B., andHinnebusch, A. G. (1992). Mutations activating the yeast eIF-2a kinase GCN2: Isolationof alleles altering the domain related to histidyl-tRNA synthetases. Mol. Cell. Biol. 12,5801–5815.
Richardson, J. P., Mohammad, S. S., and Pavitt, G. D. (2004). Mutations causing childhoodataxia with central nervous system hypomyelination reduce eukaryotic initiation factor2B complex formation and activity. Mol. Cell. Biol. 24, 2352–2363.
Schena, M., and Yamamoto, K. R. (1988). Mammalian glucocorticoid receptor derivativesenhance transcription in yeast. Science 241, 965–967.
Schena, M., Picard, D., and Yamamoto, K. R. (1995). Vectors for constitutive and induciblegene expression in yeast. Methods Enzymol. 194, 389–398.
Schiestl, R. H., and Gietz, R. D. (1989). High efficiency transformation of intact yeast cellsusing single stranded nucleic acids as a carrier. Curr. Genet. 16, 339–346.
Schmid, S. R., and Linder, P. (1991). Translation initiation factor 4A from Saccharomycescerevisiae: Analysis of residues conserved in the D-E-A-D family of RNA helicases. Mol.Cell. Biol. 11, 3463–3471.
Sherman, F. (1991). Getting started with yeast. Methods Enzymol. 191, 3–21.Sherman, F., Fink, G. R., and Lawrence, C.W. (1974). ‘‘Methods of Yeast Genetics.’’ Cold
Spring Harbor Laboratory, Cold Spring Harbor, NY.Shin, B. S., Maag, D., Roll-Mecak, A., Arefin, M. S., Burley, S. K., Lorsch, J. R., and
Dever, T. E. (2002). Uncoupling of initiation factor eIF5B/IF2 GTPase and translationalactivities by mutations that lower ribosome affinity. Cell 111, 1015–1025.
Singh, C. R., Curtis, C., Yamamoto, Y., Hall, N. S., Kruse, D. S., Hannig, E. M., andAsano, K. (2005). eIF5 is critical for the integrity of the scanning preinitiation complexand accurate control of GCN4 translation. Mol. Cell. Biol. 25, 5480–5491.
Tarun, S. Z., and Sachs, A. B. (1997). Binding of eukaryotic translation initiation factor 4E(eIF4E) to eIF4G represses translation of uncappedmRNA.Mol. Cell. Biol. 17, 6876–6886.
Valasek, L., Trachsel, H., Hasek, J., and Ruis, H. (1998). Rpg1, the Saccharomyces cerevisiaehomologue of the largest subunit of mammlian translation initiation factor 3, is requiredfor translational activity. J. Biol. Chem. 273, 21253–21260.

Yeast Phenotypic Assays 137
Valasek, L., Hasek, J., Trachsel, H., Imre, E. M., and Ruis, H. (1999). The Saccharomycescerevisiae HCRI gene encoding a homologue of the p35 subunit of human translationeukaryotic initiation factor 3 (eIF3) is a high copy suppressor of a temperature-sensitivemutation in the Rpg1p subunit of yeast eIF3. J. Biol. Chem. 274, 27567–27572.
Valasek, L., Mathew, A. A., Shin, B. S., Nielsen, K. H., Szamecz, B., and Hinnebusch, A. G.(2003). The yeast eIF3 subunits TIF32/a, NIP1/c, and eIF5 make critical connectionswith the 40S ribosome in vivo. Genes Dev. 17, 786–799.
Verlhac, M.-H., Chen, R.-H., Hanachi, P., Hershey, J. W. B., and Derynck, R. (1997).Identification of partners of TIF34, a component of the yeast eIF3 complex, required forcell proliferation and translation initiation. EMBO J. 16, 6812–6822.
Yamamoto, Y., Singh, C. R., Marintchev, A., Hall, N. S., Hannig, E. M., Wagner, G., andAsano, K. (2005). The eukaryotic initiation factor (eIF) 5 HEAT domain mediatesmultifactor assembly and scanning with distinct interfaces to eIF1, eIF2, eIF3 andeIF4G. Proc. Natl. Acad. Sci. USA 102, 16164–16169.

C H A P T E R S E V E N
M
IS
MM
ethods
SN 0
olecuanhat
Localization and Characterizationof Protein–Protein Interaction Sites
Chingakham Ranjit Singh and Katsura Asano
Contents
1. In
in
076
lar,tan,
troduction
Enzymology, Volume 429 # 2007
-6879, DOI: 10.1016/S0076-6879(07)29007-X All rig
Cellular, and Developmental Biology Program, Division of Biology, Kansas State UnKansas
Else
hts
ive
140
2. T
he Use of Two-Hybrid Assay to Identify Protein–ProteinInteraction Sites
1412
.1. M aterials 1422
.2. P rocedure of identifying interacting partners 1432
.3. P rocedure of identifying interacting domains bytwo-hybrid assay
1453. G
ST Pull-Down Assay 1463
.1. M aterials 1473
.2. P rocedure of GST pull-down assay 1483
.3. M odification to verify direct interactions 1533
.4. M odification to assay the effect of a third protein onprotein–protein interaction
1534. S
ite-Directed Mutagenesis to Study Protein–Protein Interactions 1544
.1. P rocedures of site-directed mutagenesis 1555. C
o-IP Assay 1565
.1. M aterials 1565
.2. P rocedure 1575
.3. P reparation of immunoaffinity resin adsorbed to antibodies 1585
.4. Im munoprecipitation reaction and detectionof precipitated proteins
159Ackn
owledgments 159Refe
rences 160Abstract
This chapter aims to describe methods to identify and characterize protein–
protein interactions that were developed during our studies on translation
initiation factor complexes. Methods include the two-hybrid assay, the GST
vier Inc.
reserved.
rsity,
139

140 Chingakham Ranjit Singh and Katsura Asano
pull-down assay, and the coimmunoprecipitation (co-IP) assay. The two-hybrid
assay provides for a convenient start to find the minimal interaction domains,
which generally produce well-behaved recombinant proteins suited for various
in vitro interaction assays. Emphasis is placed on demonstrating physiological
relevance of identified interactions. The effective strategy is to find mutations
that reduce the interaction by genetic or site-directed mutational approaches
and obtain correlations between their effects in vitro (GST pull down) and
effects in vivo (co-IP).
1. Introduction
Most protein complexes assemble and function in a highly coordi-nated fashion to regulate a variety of cellular activities. In eukaryotictranslation initiation, sequential binding of the eukaryotic initiation factor2ðeIF2Þ=GTP=Met-tRNAMet
i ternary complex (TC) and eIF4F/mRNAcomplex to the 40S ribosomal subunit mediates formation of the 43S and48S preinitiation complexes, respectively (for review of the pathway, seeHinnebusch et al., 2006; Pestova et al., 2006). The multisubunit factor eIF3and numerous other factors promote these assembly processes by bindingdirectly or indirectly to the 40S subunit. In the yeast Saccharomyces cerevisiae,formation of the 43S complex occurs in concert with eIF1A binding to the40S subunit and formation of a multifactor complex (MFC) containingeIF1, eIF2, eIF3, eIF5, and Met-tRNAMet
i , with the latter positioned atthe P-site. The 48S complex then scans for the first AUG codon in themRNA with the help of mRNA unwinding by the eIF4A helicase and itscofactor eIF4B. Correct tRNAMet
i anticodon pairing to the AUG promoteshydrolysis of the GTP bound to eIF2, which is mediated by the GTPaseactivation function of the eIF5-N-terminal domain (NTD), and the ribosomalconformational change. The release of Pi that is produced byGTPhydrolysis istightly coupled to AUG recognition by the 48S complex and directly signalsdissociation of eIF1, eIF2-GDP, and eIF5. Subsequent joining of the 60Ssubunit and release of the remaining eIFs to produce the 80S initiationcomplex are stimulated by a GTPase switch eIF5B.
The MFC was originally identified by systematic, pairwise two-hybridinteraction assays between all the eIFs encoded by the yeast genome (Asanoand Hinnebusch, 2001). This analysis identified interactions between eIF1and eIF3c, eIF5 and eIF2b, and eIF3c and eIF5 in addition to those betweensubunits of eIF2 and eIF3. The interaction siteswere identified by determiningthe minimal binding domains. Conserved amino acid residues found in theminimal domainsweremutated, and themutant proteinswere analyzed in vitroby interaction assays using recombinant glutathione-S-transferase (GST)fusion proteins (GST pull-down assay) and in vivo by coimmunoprecipitation

Protein–Protein Interaction Sites 141
(Co-IP) assays (Asano et al., 1998, 1999, 2000; Phan et al., 1998; Valaseket al., 2004). Specifically, we focused on the eIF5-CTD (C-terminaldomain), because this was found to bind simultaneously to eIF2b andeIF3c, hence potentially mediating a gigantic eIF2/eIF5/eIF3 complexcomposed of at least nine polypeptides (Asano et al., 1999). The tif5-7Amutant altering the eIF5-CTD residues conserved with the eIF2Be-CTDshowed a Ts phenotype (Asano et al., 1999) and disrupted eIF2 binding toeIF3 in vivo as shown by coimmunoprecipitation. The latter experimentdemonstrated that formation of the MFC is dependent on eIF5-CTD actingas an assembly core (Asano et al., 2000; Singh et al., 2004). In this chapter,we describe the methods that have been employed and modified to studythe MFC, anticipating that they will be applicable to the study of othermultiprotein complexes.
2. The Use of Two-Hybrid Assay to IdentifyProtein–Protein Interaction Sites
The two-hybrid assay is a powerful genetic technique that uses thetranscriptional activity from a reporter gene to measure protein–proteininteraction (Bartel et al., 1993). The assay requires construction of ‘‘twohybrids,’’ of which one is a DNA-binding domain fused to a protein ofinterest, and the other is a transcription activation domain fused to anotherprotein in question. These two hybrid proteins are expressed in a yeast straincarrying one or more reporter genes regulated by the transcription factorthat supplied the DNA-binding domain. If the two proteins interact, theyform a functional activator due to the close proximity between the activa-tion domain and the DNA-binding domain; as a result, the reporter genewill be expressed. The level of expression can be assayed to measure thestrength of the protein–protein interaction. Frequently used reporter genesdescribed in this section are Gal4p activator-driven HIS3 or lacZ genes.Positive two-hybrid constructs produce reconstructed Gal4p activators,which then turn on transcription of HIS3 or lacZ. Expression from thesereporters is assayed as described below.
The open reading frame (ORF) segment encoding each of the proteinsidentified in a multiprotein complex is cloned into two-hybrid vectors, nowcommercially available from various companies. Every pairwise combina-tion of activation and DNA-binding domain fusion plasmids is introducedto yeast carrying appropriate reporters and tested for expression of thereporter(s). To produce all possible combinations of two-hybrid yeast con-structs, we use the ability of a haploid yeast strain carrying one plasmid tomate with another of the opposite mating type carrying a second plasmid.In this way, it is easy to produce a diploid strain carrying both plasmids.
142 Chingakham Ranjit Singh and Katsura Asano
Once interacting protein pairs are found, the minimal interacting domainsare identified by creating and testing truncated versions of the two-hybridconstructs by polymerase chain reaction (PCR)-based recombinanttechniques.
2.1. Materials
2.1.1. Plasmids and yeast strainsDNA fragments encoding each of the known or predicted subunits of aprotein complex and their deletion or mutant derivatives are cloned into thetwo-hybrid expression vectors pGBT9 (TRP1) and pGAD424 (LEU2)(Bartel et al., 1993) or their commercially available equivalents (Clontech,Stratagene, etc.), fusing the yeast proteins to the Gal4 (or appropriatetranscription factor) DNA-binding domain (DBD) and activation domains(AD), respectively. We recommend introducing an NdeI site at the 50end of the ORF (in which the ATG triplet of the recognition site sequence50-CAT ATG-30 corresponds to the start codon of the ORF) following thesite used to clone the DNA fragment, if the NdeI site is not present in theORF. Then the NdeI site is used to move the DNA segment to GST fusionor yeast expression vectors (see below).
Y190 (a leu2 trp1GAL-lacZ GAL-HIS3) and Y187 (a leu2 trp1GAL-lacZ) (Harper et al., 1993), which contain chromosomal copies of the lacZand HIS3 genes under the regulation of the upstream activation sequence(UAS) recognized by Gal4p, were transformed with the resulting pGBT9-and pGAD424-derived plasmids, respectively, as described (Schiestl et al.,1993).
2.1.2. Buffers and solutionsZ buffer (Miller, 1972) contains 16.1 g/liter of Na2HPO4, 5.5 g/liter ofNaH2PO4, 0.75 g/liter of KCl, and 0.246 g/liter of MgSO4. Adjust the pHto 7.0. At the time of use, add 2-mercaptoethanol at 2.7 ml/liter. Preparea 2.5 M stock solution of 3-amino-1,2,4-triazole (3AT; Fluka 09540) bydissolving 21 g of 3AT in 100 ml of water, and sterilize by filtration. Preparea concentrated stock by dissolving X-Gal in N,N-dimethylformamide at aconcentration of 20 mg/ml. Store at 20.
2.1.3. Yeast growth mediaSynthetic complete medium and plates lacking leucine and tryptophan(SC-Leu-Trp) as well as lacking leucine, tryptophan, and histidine(SC-Leu-Trp-His) (Sherman, 1991): 1.45 g of Difco yeast nitrogen basewithout ammonium sulfate and amino acids, 5 g ammonium sulfate, and 2 gof appropriate amino acid drop-out powder are dissolved into water to950 ml (for plates add 20 g of agar). Autoclave and cool to < 65, and thenadd 50 ml of 40% D-glucose (Lee et al., this volume).

Protein–Protein Interaction Sites 143
2.2. Procedure of identifying interacting partners
The transformants of Y190 (Trpþ) and Y187 (Leuþ) are mated together asdescribed in Fig. 7.1 to produce Trpþ Leuþ diploid strains bearing allpairwise combinations of the pGBT9 and pGAD424 constructs (methodmodified from Bendixen et al., 1994). The Y190/Y187 diploids containtwo reporter genes, GAL-HIS3 and GAL-lacZ, which allowed us to judgethe strength of the two-hybrid interactions by two independent assays: thegrowth of cells on medium containing 3AT, a sensitive indicator of HIS3expression (Wolfner et al., 1975), and the degree of production of blueproducts from 5-bromo-4-chloro-3-indoyl-b-D-galactopyranoside (X-Gal),a chromogenic substrate for b-galactosidase (Breeden and Nasmyth, 1987),respectively, as described below.
2.2.1. Assay for GAL-HIS3 expression levelsThe collection of Y190/Y187 yeast hybrids containing all combinations ofpGAD424 and pGBT9 constructs was grown in patches on SC-Leu-Trp,incubated overnight at 30, and replica plated to the same medium alsolacking histidine (SC-Leu-Trp-His) and supplemented with 3AT at 5, 10,15, 20, 25, and 30 mM. The strength of each interaction was scoredqualitatively by the density of cell growth observed at 30 for up to 6 daysafter plating. Stronger two-hybrid interactions allowed cells to producemore HIS3 product from the GAL promoter and, hence, to grow onmedium containing higher concentrations of 3AT.
2.2.2. Assay for GAL-lacZ expression levels
1. Permeabilize yeast colonies or patches printed to a 45-mm nitrocellulosefilter (BA85, Schleicher & Schuell) by placing the filter on a sheet ofaluminum foil floating on the surface of liquid nitrogen for 5 to 10 sec.
2. Place the filter with the cell-side up on Whatman filter paper presoakedwith 3 ml of Z buffer containing 1 mg/ml X-Gal.
3. Incubate the filters at 30 for 3 to 4 h for the appearance of the blueproduct of X-Gal cleavage by b-galactosidase.
Note 1. It is important to test expression from both reporters by theseassays to confirm the authenticity of the interactions observed, with the fol-lowing fact in mind: interactions that can be detected by the b-galactosidaseassay with X-Gal are in general strong and correspond to the extent ofGAL-HIS3 expression allowing cells to grow on medium containing>30 mM 3AT.
Note 2. In the case of interaction between yeast eIF2b and eIF5, thiswas detected only with the combination of AD-eIF2b and DBD-eIF5 andnot with that of AD-eIF5 and DBD-eIF2b (Asano and Hinnebusch, 2001;
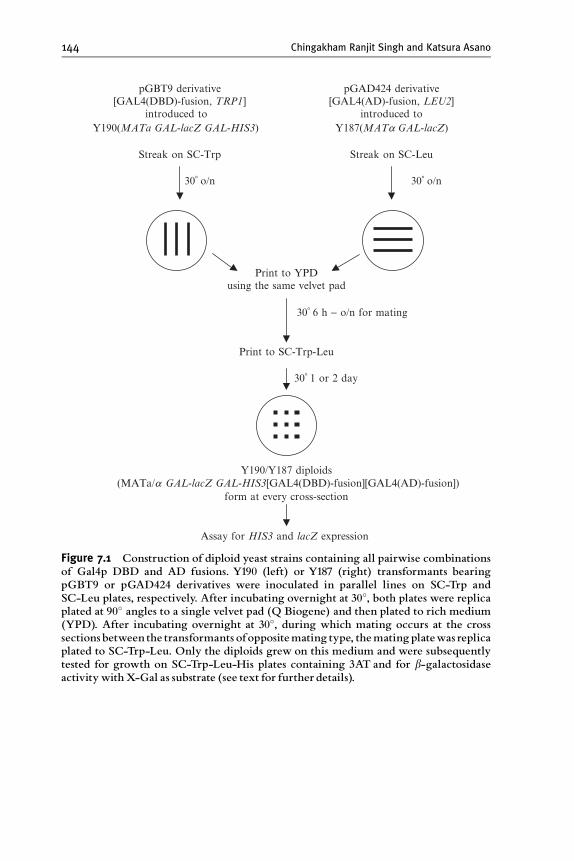
pGBT9 derivative[GAL4(DBD)-fusion, TRP1]
introduced to
pGAD424 derivative[GAL4(AD)-fusion, LEU2]
introduced toY190(MATa GAL-lacZ GAL-HIS3) Y187(MATa GAL-lacZ)
Streak on SC-Trp Streak on SC-Leu
30 o/n 30 o/n
Print to YPDusing the same velvet pad
30 6 h − o/n for mating
Print to SC-Trp-Leu
30 1 or 2 day
Y190/Y187 diploids(MATa/a GAL-lacZ GAL-HIS3[GAL4(DBD)-fusion][GAL4(AD)-fusion])
form at every cross-section
Assay for HIS3 and lacZ expression
Figure 7.1 Construction of diploid yeast strains containing all pairwise combinationsof Gal4p DBD and AD fusions. Y190 (left) or Y187 (right) transformants bearingpGBT9 or pGAD424 derivatives were inoculated in parallel lines on SC-Trp andSC-Leu plates, respectively. After incubating overnight at 30, both plates were replicaplated at 90 angles to a single velvet pad (Q Biogene) and then plated to rich medium(YPD). After incubating overnight at 30, during which mating occurs at the crosssectionsbetween the transformants ofoppositemating type, thematingplatewas replicaplated to SC-Trp-Leu. Only the diploids grew on this medium and were subsequentlytested for growth on SC-Trp-Leu-His plates containing 3AT and for b-galactosidaseactivity withX-Gal as substrate (see text for further details).
144 Chingakham Ranjit Singh and Katsura Asano
Protein–Protein Interaction Sites 145
Asano et al., 1999). Thus, we recommend testing both combinations of apotentially interacting pair of proteins fused to either DBD or AD.
2.2.3. TroubleshootingA common problem with two-hybrid assays is that some DBDfusion constructs alone autoactivate GAL promoters to turn on expressionfrom GAL-HIS3 or GAL-lacZ. Even if this happens, however, a positivetwo-hybrid interaction can still increase the reporter expression beyond thebasal level promoted by the DBD fusion alone. The difference beyondthe basal level can be detected using 3AT plate assays by carefullycontrolling the amount of the cells transferred to the replica velvet byprinting to blank plates prior to printing to test plates.
If no positive interaction is observed between any pair of proteincomplex partners, it is possible to construct GST fusion plasmids and testinteractions by GST pull-down assays, as described in the next section.Alternatively, it is possible to construct an AD fusion plasmid DNA libraryby shearing the subunitORFDNA segments by sonication to an average sizeof 600 kb and cloning them into pGAD424. The plasmid DNA libraryis used to screen for any pGBT9-derived fusion plasmids as the bait. AD orDBD-fused full-length proteins are sometimes unstable in yeast, whilefusions with shorter segments can be much more stable. If this is the case, aprotein segment of the partner protein can be identified by this method(Asano and Hinnebusch, 2001; Asano et al., 1998; Bartel et al., 1996).
2.3. Procedure of identifying interacting domains bytwo-hybrid assay
Plasmids encoding truncated protein fragments fused to the Gal4p AD orDBD (see below) are constructed by synthesizing DNA fragments contain-ing the corresponding coding regions by PCR using oligonucleotides thatintroduce restriction enzyme sites at both ends and inserting them intopGBT9 or pGAD424 (Bartel et al., 1993). The Y190 transformants carryingthe resulting plasmids were mated with the Y187 transformants carrying theother two-hybrid plasmid encoding the partner protein of a desired length,as shown in Fig. 7.1. The resulting diploid strains are tested for expression ofGAL-HIS3 or GAL-lacZ, as described above.
2.3.1. Design of deletion constructs and evaluation of the resultsThe endpoints of either N-terminal or C-terminal deletions can bedesigned at regular intervals, which can vary depending on the size of theprotein. As noted under ‘‘Troubleshooting’’ above, some of the DBD-fusedconstructs are likely to autoactivate GAL promoters. Thus, it is recom-mended that deletion constructs be made starting with an AD-fusionplasmid, if possible. Some of the deletion constructs may also lose protein

146 Chingakham Ranjit Singh and Katsura Asano
stability and produce a negative signal for this reason.Misinterpretation causedby these unexpected results can be avoided by testing a reasonable numberof N-terminal and C-terminal deletion constructs created at regular inter-vals. Alternatively, deletion constructs can be designed based on computer-predicted domains. In this case, it is recommended for the same reason thattruncated versions be tested with several different endpoints per predicteddomain at each terminus. The N-terminal end of the shortest N-terminaldeletion construct that shows a positive interaction defines the N-terminus ofthe minimal domain. The C-terminus of the minimal domain is definedsimilarly. It is recommended to create a two-hybrid plasmid encoding theminimal domain, which is truncated to both termini as defined above, andconfirm a positive interaction with its partner.
3. GST Pull-Down Assay
The GST pull-down assay is one of the most useful in vitro techniquesto study the interaction of two or more proteins. This is based on affinitychromatography and makes use of a purified, GST-fused protein (the bait)that is immobilized to a selected glutathione-linked resin to capture and‘‘pull down’’ a binding partner (the prey) by a small g force generated by amicrocentrifuge.
In the GST pull-down assay, the prey proteins can be prepared from avariety of sources, such as crude or purified, recombinant, or endogenousproteins. The source can even be whole cell extracts (WCE) of the originalorganism, and unknown protein partners can be identified by this methodin combination with mass spectrometry technology. The caveat to thistechnique is detection of nonspecific interactions. Thus, it is always neces-sary to include a negative control with binding by GST alone. In principle,nonspecific interactions can result from either experimental parameters, orthe unfolding or incorrect folding of proteins used in the assay. For theformer, some protein interactions are sensitive to changes in salt concentra-tion, decreasing specific interactions and increasing nonspecific interactions.In our experience, the quality of employed proteins, in particular of theprey, matters more. The GST fusion, in general, produces a high-qualitybait, because GST is a well-folded, soluble protein, and probably enhancesthe solubility and proper folding of the fused protein. Thus, GST fusionproteins are generally expected to retain the original propensity forinteraction.
As a source of the prey protein, we find it convenient to use 35S-labeledproteins expressed from a plasmid in reticulocyte lysates. Commerciallyavailable kits, such as the Promega TnT T7 or SP6 RNA polymerase-coupled system, are useful for this purpose. In this system, the gene, either
Protein–Protein Interaction Sites 147
wild-type or mutant, encoding a suspected partner protein is cloned underthe T7 or SP6 promoter. The purified plasmid is used as a template fortranscription by the bacteriophage RNA polymerases. Then the transcript istranslated in the same test tube in a ‘‘cap-independent’’ manner by thereticulocyte ribosomes and translation factors. The merit of this system isthat it generates a fresh and hopefully well-folded protein as the prey for theassay. The interactions between most yeast eIFs have been assayed with thissystem as the source of the prey. The disadvantage of this system is theimpurity of the prey, coming from protein and RNA components ofreticulocyte lysates. Thus, it is crucial at some point to confirm the interac-tion using a purified protein as the prey and including RNase to rule outbridging by RNA components. We also found that 35S-labeled mammalianeIF3 subunits expressed in reticulocyte lysate cannot bind GST-fused baitefficiently (Shalev et al., 2001). This was likely because the expressedsubunits are readily incorporated into reticulocyte translation complexes,as demonstrated for mammalian eIF2b as an early example (Pathak et al.,1988). If this prevents interaction, the prey proteins must be expressed inwheat germ extracts or purified from yeast or bacteria.
The methods of conducting the GST pull-down assay and evaluating theresults carefully are described later. The experimenter should keep in mindthe general cautions as discussed above. We also describe a modification ofthe method to study complex formation by three interacting proteins.
3.1. Materials
3.1.1. PlasmidsAll recombinant proteins are expressed in BL21 ½FompT hsdSBðrBm
B Þor BL21(DE3) carrying corresponding expression plasmids. GST fusionproteins are expressed from an isopropyl-b-D-thiogalactoside (IPTG)-inducible promoter present on the plasmids derived from a pGEX vectorseries (GE Healthcare Life Sciences). Using pGEX-4T-1 as the vector, wecreated pGEX-TIF5 (Phan et al., 1998) and pGEX-TIF35 (Asano et al.,1998), both containing the unique NdeI site (50-CATATG-30) overlappingwith yeast eIF5 and eIF3g start codons (underlined), respectively, which arein-frame with the GST coding sequence located 50 to them. In addition,these plasmids have BamHI*/SalI and PstI*/BglII/HindIII/SphI, respec-tively, following the fusion ORF (* indicates the site not unique to theplasmids). Thus,NdeI and one of these sites are used to conveniently preparea variety of GST fusion plasmids. The DE3 prophage integrated into theBL21(DE3) genome expresses T7 RNA polymerase dependent on IPTG.Thus, this strain is a useful host for expressing recombinant proteins from theT7 promoter. Useful cloning vehicles for this purpose are the pET- (Nova-gen) and pT7- (Tabor and Richardson, 1987) series of vectors. The FLAG
148 Chingakham Ranjit Singh and Katsura Asano
peptide (DYKDDDDK) or hexahistidine (His6) tags are introduced toeither terminus of the expressed proteins by PCR using oligonucleotidesthat include the coding sequence of the tags or their complementarysequences. These plasmids can also be used as a template for 35S-labeledprotein synthesis using the T7 RNA polymerase-coupled reticulocyte lysatesystem.
3.1.2. MediaLB-Ampicillin: One liter of LB-ampicillin is prepared with 10 g tryptone,10 g NaCl, 5 g yeast extract, and 1 liter distilled H2O. The pH is adjustedto 7.2 with HCl, and autoclaved. For LB plates, add 15 g agar/liter beforeautoclaving. One milliliter of ampicillin is added after autoclaving from astock concentration of 100 mg/ml; a 25 mM M IPTG solution in sterilewater (filter-sterilized) is used as a stock solution.
3.1.3. Reagents, buffers, and solutionsGlutathione Sepharose 4B resin (Pharmacia 17–0756–01), phosphate-buffered saline (PBS) (0.14 M NaCl, 2.7 mM KCl, 10.1 mM Na2HPO4,pH 7.3), and Binding buffer [20 mM HEPES/KOH, pH 7.5, 75 mM KCl,0.1 mM EDTA, 2.5 mM MgCl2, 1% skim milk, 1 mM dithiothreitol(DTT), 0.05% Triton X-100] are used. The Washing buffer is the same asthe Binding buffer except that it lacks skim milk. Staining solution (0.125%Coomassie Brilliant Blue R-250, 50% methanol, 10% acetic acid) and de-staining solution (40% methanol, 10% acetic acid) are used as well asPonceau S stain (0.2% Ponceau S, 1% acetic acid).
The stock solution of RNase A (from bovine pancreas, Sigma R4875) ismade at 10 mg/ml. After dissolving into 10 mM sodium acetate (pH 5.2),it was heated for 15 min at 90 and allowed to cool at room temperature.The final pH is adjusted to 7.4 by adding0.1 ml of 1MTris–HCl (pH 7.4)and stored at 20.
3.2. Procedure of GST pull-down assay
3.2.1. Preparation of bacterial lysate containing GST fusions
1. Grow the cells at 30 in 250 ml of LB-Amp in 1-liter flasks with goodaeration.
2. Add 0.1 mM IPTG to induce GST fusions when the A600 is 0.8. Theinduction time (at 30) depends on the nature of fusions, but typicallyit is 1 h.
3. Harvest the cells by centrifugation at 8000 rpm (10,000g) for 10 minin a Sorvall GSA rotor or equivalent, and discard the supernatant.
4. Suspend the cell pellets in 12.5 ml of PBS, and transfer into a 50-mlcentrifuge tube.

Protein–Protein Interaction Sites 149
5. Sonicate the cell suspension for 6 min (2 min on and 30 sec off ) with aFisher Scientific sonicator with the centrifuge tube held in ice.
6. Add 625 ml of 20% Triton X-100, and rotate the tubes for 30 min at 4in a cold room.
7. Centrifuge the tubes to clear the cell lysate (12k rpm, 10 min, 4) in amicrocentrifuge.
8. Transfer only the supernatant containing the GST fusion proteins in afresh 15-ml tube.
9. To determine the yield of GST fusions in the cell lysate, incubate 0.2 mlof lysates with 5 ml of glutathione resin for 30 min at room temperatureon a rocker.
10. Wash the resins three times with 0.2 ml ice-cold PBS.11. Add 10 ml of 2 sodium dodecyl sulfate polyacrylamide gel electropho-
resis (SDS–PAGE) loading buffer and heat the tubes at 95 for 2 min toelute the bound GST fusion proteins.
12. Load the supernatant on an SDS–PAGE gel. Include 5 mg and otheramounts of bovine serum albumin (BSA) protein in separate lanes toquantify the amount of GST fusion protein in the lysate. Electrophoreseuntil the front dye reaches the bottom of the gel.
13. Stain the SDS–PAGE gel with Coomassie Blue for 1 h to overnight ona rocker at room temperature.
14. Destain the gel using destaining solution until the gel backgroundbecomes clear and dry it on a gel dryer.
15. Store the cell lysates containing GST fusion protein at80 in aliquots.This helps to minimize degradation of the GST fusion proteins byrepeated thawing.
3.2.2. Preparation of the resin adsorbed to GST fusion proteins
1. Use 5 ml of glutathione resin (bed volume) for one reaction of a GSTpull-down assay. To maintain a 5 ml bed volume, take out 6.66 ml of theoriginal glutathione resin–buffer mixture in a fresh microcentrifuge tube.If the same GST fusion protein is used in multiple reactions, combineand handle GST fusions together through step 8.
2. Repeat step 1 for all of the GST fusions used in the set of experiments.3. Centrifuge the tubes at 5000 rpm for 2 min at room temperature.4. Discard the supernatant and wash the resin with 10 times bed volume of
ice-cold PBS.5. Add cell lysates, such that every 5 ml bed volume of resin binds an equal
molar amount of GST fusion proteins.6. Incubate for 30 min on a rocker at room temperature.7. Centrifuge the tubes and remove the supernatant slowly so as not to
disturb the resin at the bottom of the tube.
150 Chingakham Ranjit Singh and Katsura Asano
8. Wash three times with 10-times bed volume of ice-cold PBS. Equilibratethe resin with 10 times bed volume of ice-cold binding buffer. If theresin is taken for multiple reactions in a single microcentrifuge tube, splitthe buffer–resin mix into fresh tubes (55 ml each) where the bindingreaction will take place. Spin the tubes at normal parameters describedabove and discard the supernatant. Washed resin in the tube should beplaced on ice prior to setting up binding reactions.
3.2.3. Preparation of the prey proteinsIf 35S-labeled proteins are expressed in the TNT/T7 system (Promega)as the prey, set up the reaction using a recommended amount of 35S-labeled L-methionine (1.175 mCi/mmol, Easy TagTM Perkin ElmerNEG709A001MC) in a volume of 5 (n þ 1) ml, where n is the number ofreactions using the particular construct. The resultant 35S-labeled proteinshould be ready and fresh when the resins adsorbed to GST fusion proteinsare prepared. Treat the remaining 35S-labeled proteins with an exactly equalamount of SDS–PAGE loading buffer and keep on ice, to use later as inputs.This treatment will minimize the possible degradation of the 35S-labeledproteins for a few hours during the binding reaction.
If purified proteins are used as the prey, they are purified appropriately.We find it convenient to use FLAG- or His6-tagged constructs to purify therelevant recombinant proteins by affinity chromatography. The methodof purification of FLAG-tagged proteins from both yeast and bacteria haspreviously been described for the example of FLAG-eIF5 (Asano et al.,2002). To purify His6-tagged proteins, a variety of kits are available,including the His Bind Purification Kit from Novagen (cat. no. 70239–3).
Alternatively, extracts/lysates of bacteria or yeast expressing the preyprotein can be directly applied to the GST pull-down assay, if antibodiesspecific to the prey protein are available. If the prey is expressed in anorganism distantly related to the organism under study (e.g., bacterial lysatesin the case of studying yeast proteins), the use of the former’s extracts is not aproblem because there is little chance that the proteins in the extractsspecifically affect the interaction of interest. Rather, the proteins in theextracts can serve as blocking reagents (like dry milk in the binding buffer ofthe assay). The cell lysates/extracts from the same organism are a goodsource of endogenous protein complexes, such as eIF2 and eIF3 in the caseof translation initiation complexes (Asano et al., 1999). However, the con-trol reaction must be set up with the GST-bait mutant altering the bindingsites for the endogenous complexes.
3.2.4. Binding reaction for binary interaction
1. Add 100 ml of fresh binding buffer containing 5 ml of the 35S-labeledprotein expressed in the TNT/T7 system (Promega) or an appropriate
Protein–Protein Interaction Sites 151
amount of purified recombinant protein into each tube containing 5 mlresin attaching GST fusions.
2. Incubate the reaction in a cold room for 90 min on a rotator.3. Wash the resin three times with 100 ml of ice-cold Washing buffer.
Centrifuge each time for 2 min at 5k rpm at 4 and discard thesupernatant.
4. Elute the protein from the washed resin by suspending in 10 ml of SDS–PAGE loading buffer and heat at 95 for 2 min.
5. Run the eluates along with a 10% input amount of the expressedprotein on a 12% SDS–PAGE gel (the percentage of the gel can beadjusted according to the molecular weight of the proteins in the assay).
6. If the protein of interest is radiolabeled with 35S, stain the gel withCoomassie Blue to visualize the GST fusion proteins. After staining,treat it with destaining solution and dry in a gel dryer.
7. Expose the dried gel on a phosphorimaging screen for an appropriatetime and analyze the protein bands. Quantitate the amounts ofbound 35S-labeled proteins using STORM or TYPHOON (MolecularDynamics).
8. If the prey is a nonradioactive protein, transfer the proteins on the gel toa nitrocellulose membrane (e.g., Hybond ECL, Amersham Pharmacia)for immunoblotting.
9. Treat the nitrocellulose membrane for 1 or 2 min with Ponceau S stainto visualize the amount of GST fusion proteins used in the assay. Excessstain can be removed simply by washing with PBS until the backgroundis clear.
10. Detect the level of bound proteins by specific antibodies of the proteinof interest using appropriate antibodies, e.g., with the ECLTM chemi-luminescent system (Amersham Pharmacia) following the manufac-turer’s recommendation.
Note. It is generally not recommended that the equilibrium dissociationconstants (Kd) be measured with the GST pull-down assay, because the preyprotein can readily dissociate during the washing step of the assay, even ifthe reaction reaches equilibrium before this. It is also not clear if the reactionreaches the equilibrium at all at the beginning. Furthermore, the assay canerroneously produce too high values: high local concentrations of proteinon the beads may lead to excessively high retention. Binding of the GSTfusion protein to the beads may alter the affinity of the interaction. Finally, itis difficult to know the specific activity of the GST fusion protein, eventhough the GST may increase the solubility of the fused protein, as men-tioned above. Thus, this assay is best suited to detect the interaction andexamine the effect of mutations on the interaction.
To evaluate the nature of the reaction under study and increase thequality of the produced data, however, we recommend taking a titration

A
Fra
ctio
n of
35S-
prot
ein
boun
d
0
1
a
[GST fusion protein] (M )
B
Fra
ctio
n of
35S-
prot
ein
boun
d
0
a
[GST fusion protein] (M )
b
Major effect on association
Major effect on dissociation
Figure 7.2 Titration curves for well-behaved GST pull-down assays. (A) Becausethe GST pull-down assay involves an extensive washing step, a certain fraction (a) ofcomplex dissociates and lowers the plateau level.The avaluewould be lower if the disso-ciating rate of the complex is higher. (B) Predicted effect of mutations altering GSTfusions.When the GST fusion protein carries a mutation altering the mutual bindingsite, this may decrease the dissociation rate more than the association rate (dashedcurve). In this case, the plateau level decreases further to b. Alternatively, the mutationmay decrease the association rate without altering the dissociation rate (dotted curve).If this is the case, the plateau level stays at a. Considering both options, the rangeof the optimal concentration of the GST fusion protein for mutational studies can bedetermined in the area shown in gray.
152 Chingakham Ranjit Singh and Katsura Asano
curve of the reaction by binding a trace amount of the prey protein todifferent amounts of the GST fusion. Under favorable conditions where thereaction reaches equilibrium, the plot of the fraction of 35S-labeled preyprotein ( f ) bound to a known concentration of GST fusion protein (G)follows a hyperbolic profile under the equation G ¼ Kd/[(1/f ) – 1], asshown by the continuous line in Fig. 7.2A. This holds true whenG is muchgreater than the concentration of the 35S-labeled prey protein, and whenthe binding reaction reaches a plateau at 100% of the input amount. If thereaction under study follows this profile, it is a well-behaved reaction.
If the reaction follows a hyperbolic profile but reaches a plateau ata fraction (value a; 0 < a < 1) of the input amount under the equationG ¼ Kd/[(a/f ) – 1] (dotted line in Fig. 7.2A), the reaction may reach anequilibrium but a substantial amount of the prey protein would be disso-ciating from GST fusion proteins. If a is too low (less than 0.05), consider

Protein–Protein Interaction Sites 153
decreasing the number of washing steps to two times (step 3 above) ormodifying the composition of Binding and Washing buffers (usuallydecreasing salt concentrations helps). Keep this titration curve in mind todetermine the amount of GST fusion proteins used to test the effect ofmutations introduced to either prey or bait (gray zone in Fig. 7.2B).
3.3. Modification to verify direct interactions
As mentioned above, it is possible that interaction between the GST fusionprotein and 35S-labeled prey protein is bridged by RNA or protein compo-nents of the reticulocyte lysate. To exclude bridging by protein, the preyprotein should be purified and tested at some stage of the study. To excludebridging by RNA, RNase can be added at any step in the binding reaction.Any RNase, single-stranded or double-stranded specific, can be used for thispurpose, but we use RNase A, which cleaves 30 end of unpaired C and Uresidue, as this is one of the most commonly used RNases. We recommendthe following procedure.
1. Perform the binding reaction and wash the resin once, as described insteps 1 to 3.
2. Add 100 ml Washing buffer, and then RNase A to 10 mg/ml.3. Incubate at room temperature for 20 min.4. Wash the resin twice more and analyze the complex as in steps 3 to 10.
3.4. Modification to assay the effect of a third protein onprotein–protein interaction
The GST pull-down assay is modified by adding a third protein in thereaction. This is done to test the ability of the third protein to compete with,bridge, or enhance the interaction between the GST-fused bait and theprey. It is recommended that the prey concentration be set at least 10 timeslower than the bait concentration, which is usually 0.2 to 1 mM, to maintaina hyperbolic binding profile of the prey–bait interaction that is expectedunder favorable conditions. If 35S-labeled protein expressed in the TnT/T7system is used, the method described above is expected to meet thisrequirement.
To assay competition by the third protein, add the third protein indifferent amounts to a fixed amount of the GST-fused bait prior to addingthe bait. The amount of the prey bound to the bait should become lowerwith the increasing amount of the third protein. To assay bridging orenhancement, add the third protein in excess of the bait prior to addingthe prey. The third protein should bind rapidly to the bait due to highconcentrations of both, allowing a substantial amount of the prey to bepulled down due to bridging by the third protein. As a control, a reaction
154 Chingakham Ranjit Singh and Katsura Asano
should be set up with no third protein added. In this reaction, little (in thecase of enhancement) or no (in the case of bridging) prey should be pulleddown by the GST-fused bait alone.
To evaluate the bridging/enhancement assay, add different excessamounts of the third protein to fixed concentrations of the GST bait andthe prey protein. The concentration of the binary complex made of the baitand the third proteins can be determined by the amount of the third proteinprecipitated in the reaction, assuming an appropriate stoichiometry (usually1:1) of the complex. Then plot the fraction of the prey precipitated againstthe binary complex concentration to take a titration curve.
1. Purify the protein to be used as the third binding partner and check itsconcentration against a known amount of protein by running on anSDS–PAGE gel.
2. Distribute the resin bound to the GST fusion protein into an appropriatenumber of tubes. Each tube should contain 5 ml resin and 200 ml ofBinding buffer.
3. Assemble the reaction first with different amounts of the purified thirdprotein in each tube starting from zero to an increasing concentration.
4. Add 5 ml of TnT expressed 35S-radiolabeled protein in each tube andincubate for 90 min in cold room on a rotator.
5. Follow the washing steps as described above to run on an SDS–PAGE,followed by phosphoroimaging analysis.
6. After staining the gel with Coomassie Blue, quantitate the amount of thethird protein bound on the GST fusion protein. If the third protein is notvisible, spare a part of the precipitated fraction and detect it by immuno-blotting, for instance, with anti-His antibodies (Sigma, H1029), if thethird protein is His6 tagged.
7. Quantify the amount of the bound 35S-labeled protein usingphosphoroimaging.
8. Draw a graph of the amount of 35S-labeled protein against the amount ofpurified protein bound on the GST fusion proteins.
4. Site-Directed Mutagenesis to StudyProtein–Protein Interactions
The ultimate proof for any protein–protein interaction is to detect therelevant interaction in vivo in a wild-type strain (by Co-IP assay, as describedin the next section), and observing a decrease in this interaction in theisogenic mutant altering the binding site of the protein under study. Thus, itis very critical to find mutations that reduce the interaction of interest.
If the interaction is essential for cell growth or any other activity whosealteration produces a phenotype, a straightforward way to find such mutations

Protein–Protein Interaction Sites 155
is to use genetics; the yeast shuttle plasmid to express the protein understudy is modified, such that DNA encoding the minimal binding domain isflanked by unique restriction enzyme sites. The binding domain-encodingDNA is mutagenized by error-prone PCR and the resulting plasmid libraryis used to screen for mutants showing a desired phenotype. However, thismethod is laborious and needs to be done carefully so as not to spend toomuch time on false mutants.
To find appropriate mutations using an alternative approach, start byaltering a cluster of amino acids present in the minimal binding domain,which is highly conserved throughout evolution. These residues can bealtered to alanines, such that they disrupt the local structure of the bindingsite. If the structure of the protein or a homolog is known, charged surface(solvent-exposed) residues can be altered to polar residues with an equiva-lent size, e.g., basic residues to glutamine and acidic residues to serine.However, alanine substitutions are recommended for the initial, explor-atory stage of the study, as they are expected to produce a stronger effect onthe interaction of interest, if they alter the authentic binding site.
The created mutations are first introduced to appropriate plasmids tostudy their effects on protein interactions in a two-hybrid or GST pull-down assay. The GST pull-down assay is recommended at this stage becausethe introduced mutations can destabilize the protein in yeast and produce afalse negative signal in the two-hybrid assay. On the other hand, the GSTpull-down assay can use equal amounts of wild-type and mutant proteins toevaluate the results appropriately. Once the mutations that impair theinteraction in vitro are found, they are introduced to appropriate yeast strainsfor in vivo assays.
4.1. Procedures of site-directed mutagenesis
Oligodeoxyribonucleotide-directed site-directed mutagenesis is efficientlyperformed by modifying PCR reactions. If a unique restriction enzyme siteis present less than 100 bp from the desired mutation site, an oligo coveringboth the restriction site and the mutation site is designed and used togenerate a restriction DNA fragment containing the mutation site byPCR. The mutant fragment is cloned into appropriate plasmids. If there isno such restriction site, two complementary oligos covering the muta-tion site are designed and each is used to synthesize a mutant DNA segmentwith the mutation site at either the 50- or 30-end of the fragment. The twomutant DNA fragments are combined as template for a second PCR togenerate a larger DNA fragment with the mutation site in its middle.Finally, this is cloned into appropriate plasmids. Mutant plasmid construc-tion using these methods is described in detail in the supplementary file ofYamamoto et al. (2005).
156 Chingakham Ranjit Singh and Katsura Asano
5. Co-IP Assay
In Co-IP, an endogenous protein complex found in the WCE ispurified or ‘‘pulled down’’ in one step by small-scale immunoaffinitychromatography and the composition of the coprecipitated proteins isanalyzed by immunoblotting. While technically similar to GST pull-down, it is important to note that the Co-IP assay method should be usedto analyze protein–protein interactions that occur in vivo, while the GSTpull-down assay method should be used to study interactions that occurin vitro (even if the whole cell extract is used as the source of the prey).
To perform Co-IP, any antibody, polyclonal or monoclonal, can beused after attaching to protein A- or protein G-conjugated resin, and theexperiment can be controlled by using the same resin attached to commer-cially available IgG as a negative control. For a better controlled experiment,we recommend introducing an epitope tag to the protein of interest, andimmunoprecipitation of the tagged protein with commercially availablemonoclonal antibodies raised against the epitope tag. The tags commonlyused are FLAG (DYKDDDDK) and HA (for the influenza hemagglutininpeptide; YPYDVPDYA) epitopes. We describe below the Co-IP assaysspecifically using these epitopes. As a negative control, use cell extractsprepared from an isogenic strain encoding the untagged protein. To evalu-ate the amount of protein precipitated and the quality of the experiment,always analyze the pellet fractions together with input and supernatantfractions.
5.1. Materials
5.1.1. Yeast strainsA FLAG or HA epitope-coding sequence is conveniently introduced toeither terminus of the ORF of any protein by designing an oligo containingthe epitope-coding sequence or its complementary sequence and using it forPCR to make a DNA fragment encoding the tagged protein. The DNAsegment is then cloned into an appropriate yeast expression vector. For theCo-IP assay, it is desirable to construct a yeast strain expressing the taggedprotein as the sole source. This can be done by the method of ‘‘plasmidshuffling,’’ which uses the drug 5-fluoroorotic acid (FOA) to select againstthe plasmid carrying the URA3 marker (Boeke et al., 1984). The plasmidcarrying the tagged allele will be ‘‘shuffled in’’ to replace the residentURA3plasmid carrying the wild-type, unmodified allele in a strain deleted for thechromosomal copy of the gene of interest (Boeke et al., 1987).

Protein–Protein Interaction Sites 157
5.1.2. MediaSelection of yeast media for coimmunoprecipitation depends upon theexperimental design and strain backgrounds. Generally, YPD andSC drop-out media are used (Sherman, 1991). YPD medium consists of1% (w/v) yeast extract (Difco) and 2% (w/v) bacto peptone (Difco). SCmedium has a 0.2% (w/v) mixture of amino acid powder (0.2 g adenine, 1 garginine, 1.4 g aspartate, 0.4 g histidine, 1 g isoleucine, 2 g leucine, 1 glysine, 0.4 g methionine, 1 g phenylalanine, 2 g threonine, 1 g tryptophan,1 g tyrosine, 2.8 g valine, and 0.4 g uracil), 0.145% (w/v) yeast nitrogen basewithout amino acid and ammonium sulfate (Difco), and 0.5% (w/v) ammo-nium sulfate. Glucose is added to 2% from a sterile stock of 40% glucose inboth YPD and SC media. The SC drop-out medium is the same as SC, butlacks one or more amino acids/bases in the amino acid powder that arecovered by the selectable marker, e.g., SC-Leu (SC minus Leu) deficient inleucine is used for selection of Leuþ transformants.
5.1.3. Buffers and solutionsBuffer A consists of 100 mM KCl, 20 mM Tris–HCl, pH 7.5, 0.1 mMEDTA, 5 mM MgCl2, 7 mM 2-mercaptoethanol, 5 mM NaF, 1 mM phe-nylmethylsulfonyl fluoride, complete protease inhibitors (Roche AppliedScience), and 1 mg/ml each of pepstatin A, leupeptin, and aprotinin. BufferAþ T consists of Buffer A and 0.1% Triton X-100. Buffer Aþ 2T containsBuffer A and 0.2% Triton X-100; 0.1 M glycine–HCl, pH 3.5, is used torenature anti-FLAG affinity resin.
5.2. Procedure
5.2.1. Cell culture and whole cell extract (WCE) preparation
1. Grow the selected yeast cells overnight in 15-ml culture tubes and makea subculture in 100 ml of suitable liquid medium with a starting A600 of0.2 to 0.4 until the culture reaches the mid-exponential phase (A600 1).
2. Harvest the cells by centrifugation at 4000 rpm for 10 min at 4 in aBeckman J6-MI or equivalent.
3. Wash the cell pellets with 5 ml of ice-cold sterilized double-distilledwater.
4. Centrifuge at the same condition as above and remove the supernatant.5. Resuspend the cell pellets in 1.5 cell volume of Buffer A and 1 cell
volume of glass beads.6. Vortex to disrupt the cells for 30 sec followed by 30 sec on ice and
continued vortexing for six cycles.7. Transfer the cell suspension without the glass beads to a fresh microcen-
trifuge tube with the help of a pipette and microcentrifuge for 10 min at13,000 rpm at 4.
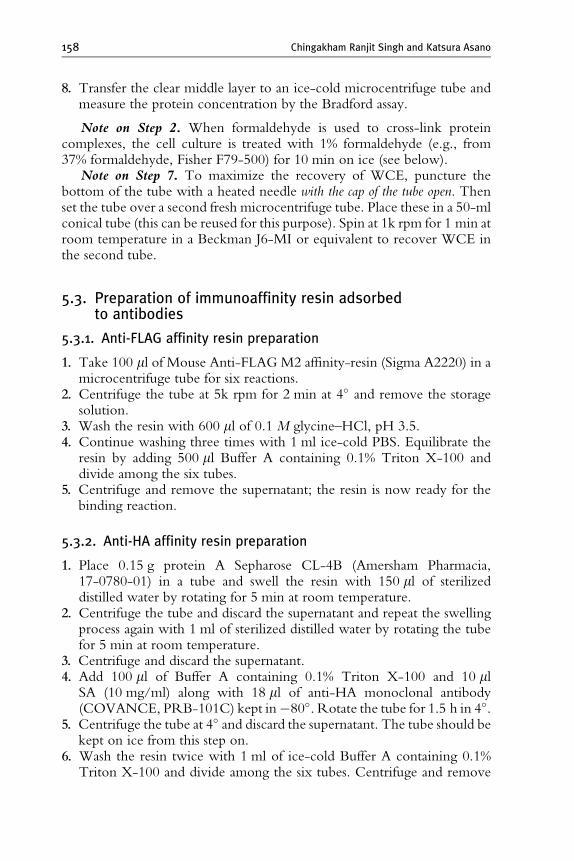
158 Chingakham Ranjit Singh and Katsura Asano
8. Transfer the clear middle layer to an ice-cold microcentrifuge tube andmeasure the protein concentration by the Bradford assay.
Note on Step 2. When formaldehyde is used to cross-link proteincomplexes, the cell culture is treated with 1% formaldehyde (e.g., from37% formaldehyde, Fisher F79-500) for 10 min on ice (see below).
Note on Step 7. To maximize the recovery of WCE, puncture thebottom of the tube with a heated needle with the cap of the tube open. Thenset the tube over a second fresh microcentrifuge tube. Place these in a 50-mlconical tube (this can be reused for this purpose). Spin at 1k rpm for 1 min atroom temperature in a Beckman J6-MI or equivalent to recover WCE inthe second tube.
5.3. Preparation of immunoaffinity resin adsorbedto antibodies
5.3.1. Anti-FLAG affinity resin preparation
1. Take 100 ml of Mouse Anti-FLAG M2 affinity-resin (Sigma A2220) in amicrocentrifuge tube for six reactions.
2. Centrifuge the tube at 5k rpm for 2 min at 4 and remove the storagesolution.
3. Wash the resin with 600 ml of 0.1 M glycine–HCl, pH 3.5.4. Continue washing three times with 1 ml ice-cold PBS. Equilibrate the
resin by adding 500 ml Buffer A containing 0.1% Triton X-100 anddivide among the six tubes.
5. Centrifuge and remove the supernatant; the resin is now ready for thebinding reaction.
5.3.2. Anti-HA affinity resin preparation
1. Place 0.15 g protein A Sepharose CL-4B (Amersham Pharmacia,17-0780-01) in a tube and swell the resin with 150 ml of sterilizeddistilled water by rotating for 5 min at room temperature.
2. Centrifuge the tube and discard the supernatant and repeat the swellingprocess again with 1 ml of sterilized distilled water by rotating the tubefor 5 min at room temperature.
3. Centrifuge and discard the supernatant.4. Add 100 ml of Buffer A containing 0.1% Triton X-100 and 10 ml
SA (10 mg/ml) along with 18 ml of anti-HA monoclonal antibody(COVANCE, PRB-101C) kept in80. Rotate the tube for 1.5 h in 4.
5. Centrifuge the tube at 4 and discard the supernatant. The tube should bekept on ice from this step on.
6. Wash the resin twice with 1 ml of ice-cold Buffer A containing 0.1%Triton X-100 and divide among the six tubes. Centrifuge and remove

Protein–Protein Interaction Sites 159
the supernatant; the resin (10 ml resin) is now ready for the nextbinding reaction with the whole cell extract.
5.4. Immunoprecipitation reaction and detectionof precipitated proteins
1. Add 200 mg WCE (as estimated by the Bradford assay) to a tube contain-ing an appropriate immunoaffinity resin. Fill up to 200 ml with Buffer Aand add Triton X-100 to 0.1%.
2. Incubate the resin–WCEmixture at 4 for 90 min with constant rocking.3. Microcentrifuge the tube to remove the supernatant. Keep the superna-
tant to analyze a portion (usually 10 ml or 5%) by immunoblotting.4. Wash the resin three times with 200 ml of Buffer A containing 0.1% of
Triton X-100. Each time, collect the resin by briefly spinning the tube.5. Elute the bound proteins with 10 ml of 2 Laemmli buffer (Laemmli,
1970) and heat for 2 min at 95.6. Resolve the immunoprecipitated (pellet) fraction with SDS–PAGE gel
of appropriate acrylamide concentration, together with 20% of input(original WCE) and 5% of supernatant fractions.
7. Detect precipitated proteins by immunoblotting with appropriateantibodies.
5.4.1. TroubleshootingA common problem with this assay occurs when the epitope is stericallysequestered. This can be solved by using a small amount of detergent in theimmunoprecipitation reaction. Specifically, the Triton X-100 concentra-tion may be increased to 0.2% and SDS may be additionally added to 0.1to 0.2%.
Like the GST pull-down assay, this assay is biased toward dissociation.To detect weaker interactions, washing conditions can be modified asdescribed in the section describing the GST pull-down assay. Alternatively,the immune complexes can be cross-linked using formaldehyde, as notedabove in step 2 of WCE preparation.
ACKNOWLEDGMENTS
All of the assays described here are modified from biochemical/genetic techniques practicedby many yeast scientists and, in particular, those developed and modified by members of theHinnebusch group. We are greatly indebted to Alan Hinnebusch and the present and formermembers of his laboratory for frank discussion about these methods. Special thanks are dueto Beth Montelone for skillful proofreading of the manuscript. We also thank YasufumiYamamoto, Tsuyoshi Udagawa, and Bumjun Lee for discussions. The research activities inthe Asano laboratory are supported by NIH R01 GM64781.
160 Chingakham Ranjit Singh and Katsura Asano
REFERENCES
Asano, K., and Hinnebusch, A. G. (2001). Protein interactions important in eukaryotictranslation initiation. In ‘‘Two Hybrid Systems, Methods and Protocols’’(P. N. MacDonald, ed.), Vol. 177, pp. 179–198. Humana Press, Inc., Totowa, NJ.
Asano, K., Phan, L., Anderson, J., and Hinnebusch, A. G. (1998). Complex formation byall five homologues of mammalian translation initiation factor 3 subunits from yeastSaccharomyces cerevisiae. J. Biol. Chem. 273, 18573–18585.
Asano, K., Krishnamoorthy, T., Phan, L., Pavitt, G. D., and Hinnebusch, A. G. (1999).Conserved bipartite motifs in yeast eIF5 and eIF2Be, GTPase-activating and GDP-GTPexchange factors in translation initiation, mediate binding to their common substrateeIF2. EMBO J. 18, 1673–1688.
Asano, K., Clayton, J., Shalev, A., and Hinnebusch, A. G. (2000). A multifactor complex ofeukaryotic initiation factors eIF1, eIF2, eIF3, eIF5, and initiator tRNAMet is an importanttranslation initiation intermediate in vivo. Genes Dev. 14, 2534–2546.
Asano, K., Lon, P., Krishnamoorthy, T., Pavitt, G. D., Gomez, E., Hannig, E. M., Nika, J.,Donahue, T. F., Huang, H.-K., and Hinnebusch, A. G. (2002). Analysis and reconstitu-tion of translation initiation in vitro. Methods Enzymol. 351, 221–247.
Bartel, P. L., Chien, C. T., Stemglanz, R., and Fields, S. (1993). Using the two-hybridsystem to detect protein-protein interactions. In ‘‘Cellular Interactions in Development:A Practical Approach’’ (D. A. Hartley, ed.), pp. 153–179. Oxford University Press,Oxford.
Bartel, P. L., Roecklein, J. A., SenGupta, D., and Fields, S. (1996). A protein linkage map ofEscherichia coli bacteriophage T7. Nature Genet. 12, 72–77.
Bendixen, C., Gangloff, S., and Rothestein, R. (1994). A yeast mating-selection scheme fordetection of protein-protein interactions. Nucleic Acids Res. 22, 1778–1779.
Boeke, J. D., LaCroute, F., and Fink, G. R. (1984). A positive selection for mutants lackingorotidine-50-phosphate decarboxylase activity in yeast: 5-Fluoro-orotic acid resistance.Mol. Gen. Genet. 197, 345–346.
Boeke, J. D., Trueheart, J., Natsoulis, G., and Fink, G. R. (1987). 5-Fluoroorotic acid as aselective agent in yeast molecular genes. Methods Enzymol. 154, 164–175.
Breeden, L., and Nasmyth, K. (1987). Cell cycle control of the yeast HO gene: Cis- andtrans-acting regulators. Cell 48, 389–397.
Harper, J. W., Adami, G. R., Wei, N., Keyomarsi, K., and Elledge, S. J. (1993). The p21Cdk-interacting protein Cip1 is a potent inhibitor of G1 Cyclin-dependent kinases. Cell75, 805–816.
Hinnebusch, A. G., Dever, T. E., and Asano, K. (2006). Mechanism of translation initiationin the yeast Saccharomyces cerevisiae. In ‘‘Translational Control in Biology and Medicine’’(M. B. Mathews, N. Sonenberg, and J. W. B. Hershey, eds.). Cold Spring HarborLaboratory Press, Cold Spring Harbor, NY.
Laemmli, U. (1970). Cleavage of structural proteins during the assembly of the head ofbacteriophage T4. Nature 227, 680–685.
Miller, J. H. (1972). ‘‘Experiments in Molecular Genetics.’’ Cold Spring Harbor LaboratoryPress, Cold Spring Harbor, NY.
Pathak, V. K., Nielsen, P. J., Trachsel, H., and Hershey, J. W. B. (1988). Structure of the bsubunit of translational initiation factor elF-2. Cell 54, 633–639.
Pestova, T. V., Lorsch, J. R., and Hellen, C. U. T. (2006). The mechanism of translationinitiation in eukaryotes. In ‘‘Translational Control in Biology and Medicine’’(M. B. Mathews, N. Sonenberg, and J. W. B. Hershey, eds.). Cold Spring HarborLaboratory Press, Cold Spring Harbor, NY.
Phan, L., Zhang, X., Asano, K., Anderson, J., Vornlocher, H. P., Greenberg, J. R., Qin, J.,and Hinnebusch, A. G. (1998). Identification of a translation initiation factor 3 (eIF3)

Protein–Protein Interaction Sites 161
core complex, conserved in yeast and mammals, that interacts with eIF5. Mol. Cell. Biol.18, 4935–4946.
Schiestl, R. H., Manivasakam, P., Woods, R. A., and Gietz, R. D. (1993). IntroducingDNA into yeast by transformation. Methods 5, 79–85.
Shalev, A., Valasek, L., Pise-Masison, C. A., Radonovich, M., Phan, L., Clayton, J., He, H.,Brady, J. N., Hinnebusch, A. G., and Asano, K. (2001). Saccharomyces cerevisiae proteinPci8p and human protein eIF3e/Int-6 interact with eukaryotic initiation factor 3 corecomplex by binding to cognate eIF3b subunits. J. Biol. Chem. 276, 34948–34957.
Sherman, F. (1991). Getting started with yeast. Methods Enzymol. 191, 3–21.Singh, C. R., Yamamoto, Y., and Asano, K. (2004). Physical association of eukaryotic
initiation factor 5 (eIF5) carboxyl terminal domain with the lysine-rich eIF2b segmentstrongly enhances its binding to eIF3. J. Biol. Chem. 279, 49644–49655.
Tabor, S., and Richardson, C. C. (1987). DNA sequence analysis with a modified bacterio-phage T7 DNA polymerase. Proc. Natl. Acad. Sci. USA 84, 4767–4771.
Valasek, L., Nielsen, K. H., Zhang, F., Fekete, C. A., and Hinnebusch, A. G. (2004).Interaction of eIF3 subunit NIP1/c with eIF1 and eIF5 promote preinitiation complexassembly and regulate start codon selection. Mol. Cell. Biol. 24, 9437–9455.
Wolfner, M., Yep, D., Messenguy, F., and Fink, G. R. (1975). Integration of amino acidbiosynthesis into the cell cycle of Saccharomyces cerevisiae. J. Mol. Biol. 96, 273–290.
Yamamoto, Y., Singh, C. R., Marintchev, A., Hall, N. S., Hannig, E. M., Wagner, G., andAsano, K. (2005). The eukaryotic initiation factor (eIF) 5 HEAT domain mediatesmultifactor assembly and scanning with distinct interfaces to eIF1, eIF2, eIF3 andeIF4G. Proc. Natl. Acad. Sci. USA 102, 16164–16169.

C H A P T E R E I G H T
M
IS
*
ethods
SN 0
InstitNatioMaryDepa
In Vivo Stabilization ofPreinitiation Complexes byFormaldehyde Cross-Linking
Leos Valasek,* Bela Szamecz,* Alan G. Hinnebusch,† and
Klaus H. Nielsen‡
Contents
1. In
in
076
utenallandrtme
troduction
Enzymology, Volume 429 # 2007
-6879, DOI: 10.1016/S0076-6879(07)29008-1 All rig
of Microbiology, AS CR, Prague, Czech RepublicInstitute of Child Health and Human Development, National Institutes of Health, Be
nt of Molecular Biology, University of Arhus, Arhus C, Denmark
Else
hts
the
164
2. R
ationale Behind the Choice of HCHO as a Stabilization Agent 1662
.1. In vivo protocols 1683. W
hole Cell Extract Preparation and WCE Fractionation 1684. A
nalysis of Fractionated Preinitiation Complexes 1694
.1. W estern blot analysis 1694
.2. N orthern blot analysis 1705. S
pecial Considerations and the Resedimentation Protocol 1715
.1. H eparin versus HCHO cross-linking 1725
.2. T wo percent HCHO cross-linking 1745
.3. R esedimentation experiments 1755
.4. P olysome profile analysis and halfmers 1766. F
inal Remarks 179Ackn
owledgments 181Refe
rences 181Abstract
Translation initiation starts with the formation of the 43S preinitiation com-
plex (PIC) consisting of several soluble factors, including the ternary complex
(TC; elF2-GTP-Met-tRNAiMet), which associate with the small ribosomal sub-
unit. In the next step, mRNA is recruited to form the 48S PIC and the entire
machinery starts scanning the 50 untranslated region of the mRNA until the AUG
start codon is encountered. The most widely used method to separate 40S
and 60S ribosomal subunits from soluble factors, monosomes and polysomes,
vier Inc.
reserved.
sda,
163

164 Leos Valasek et al.
is sucrose density centrifugation (SDC). Since PICs are intrinsically unstable
complexes that cannot withstand the forces imposed by SDC, a stabilization
agent must be employed to detect the association of factors with the 40S
subunit after SDC. This was initially achieved by adding heparin (a highly
sulfated glycosaminoglycan) directly to the breaking buffer of cells treated
with cycloheximide (a translation elongation inhibitor). However, the mecha-
nism of stabilization is not understood and, moreover, there are indications that
the use of heparin may lead to artifactual factor associations that do not reflect
the factor occupancy of the 43S/48S PICs in the cell at the time of lysis.
Therefore, we developed an alternative method for PIC stabilization using
formaldehyde (HCHO) to cross-link factors associated with 40S ribosomal sub-
units in vivo before the disruption of the yeast cells. Results obtained using
HCHO stabilization strongly indicate that the factors detected on the 43S/48S PIC
after SDC approximate a real-time in vivo ‘‘snapshot’’ of the 43S/48S PIC compo-
sition. In this chapter, we will present the protocol for HCHO cross-linking in detail
and demonstrate the difference between heparin and HCHO stabilization proce-
dures. In addition, different conditions for displaying the polysome profile or PIC
analysis by SDC, used to address different questions, will be outlined.
1. Introduction
Initiation of translation is a complicated process that involves manysoluble proteins called eukaryotic initiation factors (eIF) that interact withthe 40S ribosomal subunit to facilitate the recruitment of the ternarycomplex (TC) consisting of eIF2, Met-tRNAMet
i and GTP, and mRNAto form the 43S and 48S preinitiation complexes (PICs), respectively. The48 PIC searches for the correct AUG start codon on the mRNA in a processcalled scanning, after which subunit joining occurs and the ribosome entersthe elongation cycle. For a general review of initiation, see Hershey andMerrick (2000).
We will first introduce several eIFs that will be mentioned throughoutthe text and appear in the figures. In budding yeast Saccharomyces cerevisiae,the most complex initiation factor, eIF3, is composed of five essential sub-units, TIF32, NIP1, PRT1, TIF34, and TIF35, and one nonessentialsubunit, HCR1. Although its mammalian counterpart is composed of13 subunits, yeast eIF3 has, nevertheless, been shown to possess the criticalactivities of mammalian eIF3, including recruitment of TC and mRNA tothe 40S ribosomes (Phan et al., 1998, 2001). Genetic and biochemical datahave also implicated yeast eIF3 in scanning and AUG recognition (Nielsenet al., 2004; Valasek et al., 2004), suggesting that its activity is requiredthroughout the initiation process. Along with eIF3, eIF1 and eIF1A havealso been implicated in TC recruitment (Algire et al., 2002; Majumdar et al.,2003) in addition to their critical roles in scanning and AUG recognition

HCHO Cross-Linking in Initiation Complexes 165
(Pestova and Kolupaeva, 2002; Pestova et al., 1998). Thus, it appears thatthese three factors cooperate extensively during several steps of the initiationpathway. Finally, eIF5 is the GTPase-activating protein (GAP) that stimu-lates the GTPase activity of eIF2 in the TC when the initiator tRNAMet
i
base pairs with the AUG start codon (Hershey and Merrick, 2000). In yeast,eIF3 is found to associate with eIFs 1, 2, and 5 in the multifactor complex(MFC) that can be found free of ribosomes in vivo and was demonstrated tostimulate efficiency of the initiation process (Asano et al., 2000).
Comprehensive characterization of the translation initiation machineryand defects caused by its mutant variants requires a technique that will enablea researcher to visualize, in vivo, which factors are bound to the 40S ribo-somal subunit in wild-type (WT) versus mutant cells. A commonly usedmethod to separate the 40S ribosomal subunit from smaller soluble factorsand heavier ribosomal species is to subject whole cell extracts (WCE) tosucrose density centrifugation (SDC). However, PICs when left untreatedcannot withstand the forces during SDC and leave behind empty 40Sribosomal subunits with no bound initiation factors (Fig. 8.1, right panel).
1% HCHOIn Top 40S In Top 40S
No cross-linkingMFC
elF3
TIF32PRT1TIF34TIF35HCR1
eIF2g
eIF5
eIF1
eIF1A
RPS22
RPL41AmRNA
Fractions 1 2 3 4 5 6 7 8 9 10 11 1 2 3 4 5 6 7 8 9 10 11
MFC
Figure 8.1 Stabilizationof PICusing1%HCHO(leftpanel)where a fractionof factorsandmRNA is associatedwith the 40S ribosomal subunit in contrast to the right panel, inwhich no cross-linking agentwas used and all factors andmRNAsediment at the topofthe gradient. Immunodetection is performed by chemiluminescence (ECLTM, Amer-sham Pharmacia Biotech) using horseradish peroxidase-conjugated secondary antibo-dies (Amersham Pharmacia Biotech).The probe againstRPL41AmRNAwas generatedby using theRediprime II randomprime labeling system (Amersham) and [a-32P]dCTP(Redivue 6000, Ci/mmol; Amersham) according to the vendor’s protocol. (Reproducedwithpermission fromNielsen et al.,2006.)
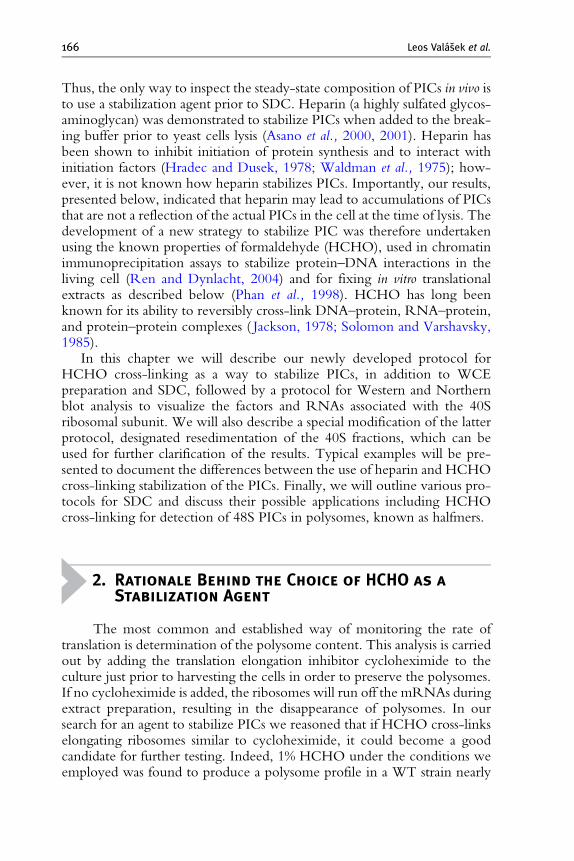
166 Leos Valasek et al.
Thus, the only way to inspect the steady-state composition of PICs in vivo isto use a stabilization agent prior to SDC. Heparin (a highly sulfated glycos-aminoglycan) was demonstrated to stabilize PICs when added to the break-ing buffer prior to yeast cells lysis (Asano et al., 2000, 2001). Heparin hasbeen shown to inhibit initiation of protein synthesis and to interact withinitiation factors (Hradec and Dusek, 1978; Waldman et al., 1975); how-ever, it is not known how heparin stabilizes PICs. Importantly, our results,presented below, indicated that heparin may lead to accumulations of PICsthat are not a reflection of the actual PICs in the cell at the time of lysis. Thedevelopment of a new strategy to stabilize PIC was therefore undertakenusing the known properties of formaldehyde (HCHO), used in chromatinimmunoprecipitation assays to stabilize protein–DNA interactions in theliving cell (Ren and Dynlacht, 2004) and for fixing in vitro translationalextracts as described below (Phan et al., 1998). HCHO has long beenknown for its ability to reversibly cross-link DNA–protein, RNA–protein,and protein–protein complexes ( Jackson, 1978; Solomon and Varshavsky,1985).
In this chapter we will describe our newly developed protocol forHCHO cross-linking as a way to stabilize PICs, in addition to WCEpreparation and SDC, followed by a protocol for Western and Northernblot analysis to visualize the factors and RNAs associated with the 40Sribosomal subunit. We will also describe a special modification of the latterprotocol, designated resedimentation of the 40S fractions, which can beused for further clarification of the results. Typical examples will be pre-sented to document the differences between the use of heparin and HCHOcross-linking stabilization of the PICs. Finally, we will outline various pro-tocols for SDC and discuss their possible applications including HCHOcross-linking for detection of 48S PICs in polysomes, known as halfmers.
2. Rationale Behind the Choice of HCHO as aStabilization Agent
The most common and established way of monitoring the rate oftranslation is determination of the polysome content. This analysis is carriedout by adding the translation elongation inhibitor cycloheximide to theculture just prior to harvesting the cells in order to preserve the polysomes.If no cycloheximide is added, the ribosomes will run off the mRNAs duringextract preparation, resulting in the disappearance of polysomes. In oursearch for an agent to stabilize PICs we reasoned that if HCHO cross-linkselongating ribosomes similar to cycloheximide, it could become a goodcandidate for further testing. Indeed, 1% HCHO under the conditions weemployed was found to produce a polysome profile in a WT strain nearly

HCHO Cross-Linking in Initiation Complexes 167
identical to cycloheximide (see Fig. 8.5A and B later in this chapter); thus werationalized that our cross-linking conditions were adequate to stabilizepolysomes and PICs without introducing artifactual associations (see below).
In Fig. 8.1, a WT strain was grown to 1 OD600 after which WCE,stabilized with 1% HCHO cross-linking, was prepared, subjected to SDC(7.5% to 30% gradient), and fractions were collected. To visualize the PICs,Western and Northern blot analyses were carried out on the first 11 fractionswith fractions 9 to 11 containing the 40S ribosomal subunits (PICs), usingspecific antibodies against chosen initiation factors and probes againsttRNAMet
i and specific mRNAs, respectively (Nielsen et al., 2006). We useda probe against the mRNA encoding RPL41A, due to the short length of thismRNA (340 nucleotides), which ensures that free mRNP complexes sedi-mentmore slowly than 40S subunits. Another shortmRNA that can be used isMFA2 ( Jivotovskaya et al., 2006); however, we found this mRNA to bemoresusceptible to degradation than RPL41A mRNA. A possible drawback ofusing RPL41A is its short, 22-nucleotide-long 50 untranslated region (UTR)(Yu and Warner, 2001), since its requirement for eIFs with respect to40S binding could be atypical. The presence of 40S ribosomal subunits canbe detected by immunoblotting using anti-RPS22 antibody that recognizesthe small ribosomal protein 22. The Western and Northern blot analyses offractions show that all factors andmRNAare present in the fractionswhere the40S ribosomal subunits sediment (except eIF1) (see Fig. 8.1, left panel).Conversely, with WCE, in which no cross-linking agent was used, all factorsand mRNA are found primarily in the upper fractions (see Fig. 8.1, rightpanel). Under the latter conditions, a multifactor complex (labeled MFCin Fig. 8.1) composed of eIF3, TC, eIF5, and eIF1 is observed free of the40S ribosomal subunit as originally reported (Asano et al., 2000).
Since subjecting a WCE to SDC would normally be considered anin vitro experiment, it is important to explain the difference between whatwe call in vivo and in vitro experiments. An in vivo experiment, in ourinterpretation, means that PICs assembled in the living cell are stabilizedeither with HCHO treatment of the cells or by adding heparin to thebreaking buffer used to prepare WCEs. These are then subjected to SDC,followed by Western and Northern blot analysis to visualize the factors andmRNA that cosediment in the fractions containing the 40S ribosomalsubunits. In contrast, an in vitro experiment means that translation-competent WCE is made from an appropriate strain to which radiolabeledmRNA, tRNA, or purified factors (either WT or mutant) are added andwhere the translational activity can be measured using, for example, areporter mRNA encoding luciferase (Asano et al., 2002). The lattertranslation-competent extracts can also be subjected to SDC to investigatethe factor/Met-tRNA/mRNA association with the 40S ribosomal subunitand HCHO is routinely used to fix these extracts before loading them onsucrose gradients (Phan et al., 1998).
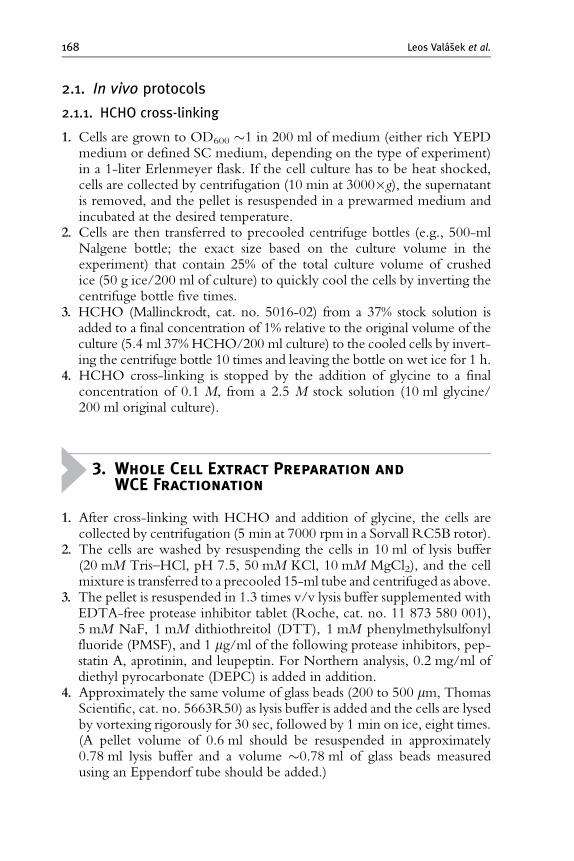
168 Leos Valasek et al.
2.1. In vivo protocols
2.1.1. HCHO cross-linking
1. Cells are grown to OD600 1 in 200 ml of medium (either rich YEPDmedium or defined SC medium, depending on the type of experiment)in a 1-liter Erlenmeyer flask. If the cell culture has to be heat shocked,cells are collected by centrifugation (10 min at 3000g), the supernatantis removed, and the pellet is resuspended in a prewarmed medium andincubated at the desired temperature.
2. Cells are then transferred to precooled centrifuge bottles (e.g., 500-mlNalgene bottle; the exact size based on the culture volume in theexperiment) that contain 25% of the total culture volume of crushedice (50 g ice/200 ml of culture) to quickly cool the cells by inverting thecentrifuge bottle five times.
3. HCHO (Mallinckrodt, cat. no. 5016-02) from a 37% stock solution isadded to a final concentration of 1% relative to the original volume of theculture (5.4 ml 37% HCHO/200 ml culture) to the cooled cells by invert-ing the centrifuge bottle 10 times and leaving the bottle on wet ice for 1 h.
4. HCHO cross-linking is stopped by the addition of glycine to a finalconcentration of 0.1 M, from a 2.5 M stock solution (10 ml glycine/200 ml original culture).
3. Whole Cell Extract Preparation andWCE Fractionation
1. After cross-linking with HCHO and addition of glycine, the cells arecollected by centrifugation (5 min at 7000 rpm in a Sorvall RC5B rotor).
2. The cells are washed by resuspending the cells in 10 ml of lysis buffer(20 mM Tris–HCl, pH 7.5, 50 mM KCl, 10 mM MgCl2), and the cellmixture is transferred to a precooled 15-ml tube and centrifuged as above.
3. The pellet is resuspended in 1.3 times v/v lysis buffer supplemented withEDTA-free protease inhibitor tablet (Roche, cat. no. 11 873 580 001),5 mM NaF, 1 mM dithiothreitol (DTT), 1 mM phenylmethylsulfonylfluoride (PMSF), and 1 mg/ml of the following protease inhibitors, pep-statin A, aprotinin, and leupeptin. For Northern analysis, 0.2 mg/ml ofdiethyl pyrocarbonate (DEPC) is added in addition.
4. Approximately the same volume of glass beads (200 to 500 mm, ThomasScientific, cat. no. 5663R50) as lysis buffer is added and the cells are lysedby vortexing rigorously for 30 sec, followed by 1 min on ice, eight times.(A pellet volume of 0.6 ml should be resuspended in approximately0.78 ml lysis buffer and a volume 0.78 ml of glass beads measuredusing an Eppendorf tube should be added.)
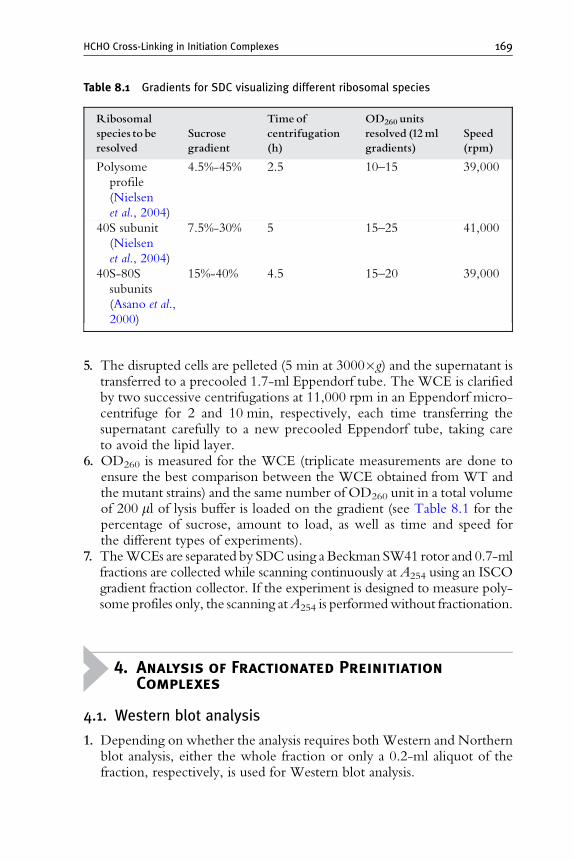
Table 8.1 Gradients for SDC visualizing different ribosomal species
R ibos o ma lspe c ie s to bere s o l ve d
Sucros eg radie nt
Ti me ofcent r i f ugat ion(h)
OD26 0 un itsre so l ve d (12 mlg radie nts )
Speed(rpm)
Polysome
pro file
(N ielsen
et al ., 2004)
4.5%- 45% 2. 5 10–15 39,000
40S subunit
(N ielsen
et al ., 2004)
7.5%-30% 5 15–25 41,000
40S-80S
subunits
(Asa no et al .,
2000)
15%-40% 4.5 15–20 39,000
HCHO Cross-Linking in Initiation Complexes 169
5. The disrupted cells are pelleted (5 min at 3000g) and the supernatant istransferred to a precooled 1.7-ml Eppendorf tube. The WCE is clarifiedby two successive centrifugations at 11,000 rpm in an Eppendorf micro-centrifuge for 2 and 10 min, respectively, each time transferring thesupernatant carefully to a new precooled Eppendorf tube, taking careto avoid the lipid layer.
6. OD260 is measured for the WCE (triplicate measurements are done toensure the best comparison between the WCE obtained from WT andthe mutant strains) and the same number of OD260 unit in a total volumeof 200 m l of lysis buffer is loaded on the gradient (see Table 8.1 for thepercentage of sucrose, amount to load, as well as time and speed forthe different types of experiments).
7. The WCEs are separated by SDC using a Beckman SW41 rotor and 0.7-mlfractions are collected while scanning continuously at A254 using an ISCOgradient fraction collector. If the experiment is designed to measure poly-some profiles only, the scanning atA254 is performedwithout fractionation.
4. Analysis of Fractionated PreinitiationComplexes
4.1. Western blot analysis
1. Depending on whether the analysis requires both Western and Northernblot analysis, either the whole fraction or only a 0.2-ml aliquot of thefraction, respectively, is used for Western blot analysis.

170 Leos Valasek et al.
2. A 6 sodium dodecyl sulfate (SDS)–polyacrylamide gel electrophoresisloading buffer is added [375 mMTris–HC, pH6.8, 12%SDS, 30% sucrose,0.06% bromophenol blue (sodium salt), and 1.47% 2-mercaptoethanol]to a final dilution of 1:6 and the samples are boiled for 10 min, atreatment sufficient to reverse cross-linking induced by HCHO, priorto SDS–polyacrylamide gel electrophoresis and Western blot analysis( Jivotovskaya et al., 2006).
3. This protocol may not be sensitive enough for some experiments. If it doesnot produce sufficiently strong signals after Western blotting, another,more sensitive approach is to precipitate the fraction with 1.7 volumes of100% ethanol chilled on dry ice and store at –20 overnight. The samplesare then sedimented at 13,000 rpm for 30 min in an Eppendorf microcen-trifuge, washedwith cold 100% ethanol, and the pellet is resuspended in 20to 100 ml 1 SDS–polyacrylamide gel electrophoresis loading bufferdepending on the original volume. The samples are then boiled andprocessed as described above (Nielsen et al., 2004).
4.2. Northern blot analysis
1. All RNA work is carried out taking special precautions to avoid con-tamination with RNAs. Gloves and Eppendorf tubes were RNase freeand deionized H2O was DEP treated.
2. RNA is extracted from the remaining 0.5 ml of the fractions. TotalRNA from the sucrose gradient fractions is precipitated overnight at–20 by the addition of 1.0 ml of ice cold 100% ethanol, 50 ml 3 MNaAc, and 80 mg of sheared denatured herring sperm DNA (the additionof this DNA presumably facilitates the transfer of small RNA speciesfrom the gel to the membrane; Maraia, 1991).
3. Precipitated RNA is pelleted by centrifugation at 13,000 rpm for 30 minin an Eppendorf centrifuge at 4. RNA is resuspended in 300 ml of RNAlysis buffer (20 mM Tris–HCl, pH 7.4, 100 mM NaCl, 2.5 mM EDTA,1% SDS).
4. The RNA is extracted two times with hot (70) phenol equilibratedin RNA lysis buffer lacking SDS for 15 min using an Eppendorf Ther-momixer (operated at 1000 rpm), which is sufficient to reverse the cross-linking. In between extractions, the Eppendorf tubes are centrifuged ina Beckman J-6 centrifuge for 10 min at 4200 rpm to obtain a phaseseparation perpendicular to the axis of rotation.
5. The RNA is precipitated by the addition of 600 ml of cold ethanol (at thisstage the RNA can be stored at –80) and pelleted by centrifugation at13,000 rpm for 30 min in an Eppendorf centrifuge at 4.
6. The RNA pellets are washed with 300 ml of cold 70% ethanol, brieflydried under vacuum in a speed vac (5 min with heating on), andresuspended in 70 ml RNA formamide loading buffer (10 ml deionized

HCHO Cross-Linking in Initiation Complexes 171
formamide, 50 ml 20% SDS, and xylene cyanol and bromophenol bluedyes aliquoted and stored at –20). After heating at 70 for 15 min, one-half is resolved on a 10% polyacrylamide-Tris-borate-EDTA-urea gel(Bio-Rad Laboratories).
7. General protocols are then used for Northern blot transfer and develop-ment (Nielsen et al., 2004, 2006; Sambrook et al., 1989).
5. Special Considerations and theResedimentation Protocol
For unknown reasons, eIF1 is weakly associated with the 40S ribo-somal subunit when 1% HCHO cross-linking is used to stabilize PICsinstead of heparin. Instead, a trailing of eIF1 evenly distributed throughoutthe gradient is observed. In addition, in certain cases we encountereddifficulties in detecting clear peaks with other eIFs or mRNAs. As describedin detail below, several approaches can be employed to overcome thisobstacle. For instance, 2% HCHO cross-linking can be used instead of 1%HCHO, which improves the amount of eIFs cosedimenting with the 40Sribosome ( Jivotovskaya et al., 2006); however, under these conditions theextracts are not suitable for polysome profiles.
A genetic trick to improve the odds of observing the mRNA peak in the40S-containing fractions is to delete RPL11B, one of two genes encodingthe 60S protein RPL11. The absence of RPL11B in the WT strain reducedthe steady-state level of 60S subunits and produced halfmers on the 80Sand polyribosome peaks, as expected from a reduced rate of 40S to 60Sjoining (Rotenberg et al., 1988). Consistent with this, deletion of RPL11Bin the otherwise WT strain increased the mRNA level in the 40S regionby 1.7-fold due to an accumulation of free 48S complexes ( Jivotovskayaet al., 2006). Unfortunately, in several cases this method was not sufficient toobserve a clear 40S-associated mRNA peak.
Another approach that was specifically designed to eliminate trailing isresedimentation (a second SDC) of the fractions containing the 40S species( Jivotovskaya et al., 2006). This technique greatly simplifies the interpreta-tion of whether a factor or RNA species is associated with the 40Sribosomal subunit (see Fig. 8.4 and Typical examples).
1. For resedimentation experiments, we follow the conventional protocolas described above with the exception that 2-fold greater OD260 units ofWCE are resolved on the first gradient.
2. Following the first sedimentation, the 40S fractions are pooled, dilutedwith 10 volumes of lysis buffer (but lacking all inhibitors). In this way,the sucrose is diluted so that the mixture can be concentrated.

172 Leos Valasek et al.
3. The diluted pooled 40S fractions are concentrated using an AmiconUltra-4 centrifugal filter device (Millipore) to about 200 ml, and sedi-mented through a second sucrose gradient under the same conditionsused for the first gradient separation.
Some factors, especially if bearing a mutation, might become more sus-ceptible to degradation under certain conditions. This fact can, in somecases, lead to data misinterpretation, as a loss of 40S binding is not accom-panied by a commensurate accumulation of a particular factor in the topfractions as expected. To determine if any redistribution of the factor inquestion has occurred, distribution profiles of the factor throughout thegradient in a mutant strain grown under permissive versus nonpermissiveconditions should be calculated and compared ( Jivotovskaya et al., 2006).The extent of degradation can be monitored by comparing inputs beforeand after centrifugation (Valasek et al., 2004). The input taken ‘‘before’’centrifugation is boiled upon completion of the WCE preparation, whilethe input ‘‘after’’ centrifugation is kept as WCE on ice during centrifugationand boiled upon the completion of SDC.
5.1. Heparin versus HCHO cross-linking
HCR1 is the only nonessential subunit of eIF3 and its deletion leads to aslow growth phenotype due to its involvement in translation initiation andribosomal biogenesis (Valasek et al., 2001a). Several recent reports havepredicted the involvement of HCR1 and its mammalian counterpart eIF3jin promoting the binding of eIF3 to the 40S ribosomal subunit (Fraser et al.,2004; Kolupaeva et al., 2005; Nielsen et al., 2006). However, initial SDCanalysis of heparin-treated WCE from a strain deleted for HCR1 showedno reduction in the amount of eIF3 associated with the 40S ribosomalsubunit (Fig. 8.2B) (Valasek et al., 2001b). However, when we repeatedthe experiment using extracts from HCHO cross-linked cells, a clearreduction in eIF3 association with the 40S ribosomal subunit was observedin the strain deleted for HCR1 (Fig. 8.2A) (Nielsen et al., 2006).
A wild-type strain (HCR1) was grown in parallel with an isogenic strainthat is deleted for HCR1 (hcr1D). The cell cultures were divided in half; onehalf was cross-linked with 1% HCHO as described above. The other halfwas treated with 50 mg cycloheximide/ml medium prior to harvesting,followed by lysis with the previously described lysis buffer that, in addition,contained 200 mg heparin/ml. Figure 8.2A shows the result of HCHOcross-linking. A significant portion of all initiation factors (except for eIF1)is cosedimenting with the 40S subunits in the WT strain (see Fig. 8.2A,left panel). In the hcr1D strain (see Fig. 8.2A, right panel), an obviousreduction in the amount of eIF3 subunits associated with the 40S is observedwith a concomitant increase in eIF3 abundance in the upper fractions.

Formaldehyde cross-linked
Heparin treated
HCR1
hcr1
∆
In
elF3
Top HCR1 40S 40STop hcr1∆
HCR1
hcr1
∆
In Top HCR1 40S 40STop hcr1∆
TIF32NIP1PRT1
HCR1
eIF2g
eIF5
eIF1
eIF1A
RPS22
eIF2g
eIF5
eIF1
eIF1A
RPS22
Fractions
TIF34TIF35
TIF32NIP1PRT1
HCR1
TIF34TIF35
1 2 3 4 5 6 7 8 9 10 11 1 2 3 4 5 6 7 8 9 10 11
elF3
Fractions 1 2 3 4 5 6 7 8 9 10 11 1 2 3 4 5 6 7 8 9 10 11
A
B
Figure 8.2 Comparison of factor association between the wild-type strain (HCR1)and the strain deleted for HCR1 (hcr1D), using HCHO cross-linking (A) or heparin(B) to stabilize the PICs during SDC. (Reproduced with permission from Nielsenet al.,2006.)
HCHO Cross-Linking in Initiation Complexes 173
In the heparin-treatedWCEs, by contrast, an increase, not a decrease, in theamount of eIF3 associated with the 40S ribosomal subunits was observed inthe hcr1D strain when compared to the WT strain (see Fig. 8.2B).
Another example of heparin treatment leading to a result different fromHCHO cross-linking involves mutants in the components of the MFC. Asdescribed above, theMFC consists of eIF3, TC, eIF1, and eIF5 that togetherform many intermolecular interactions. This network of protein–protein
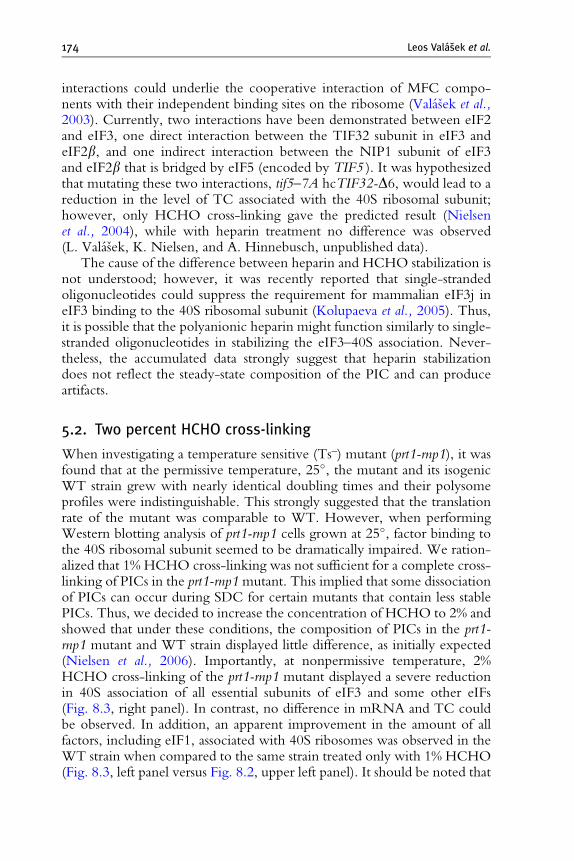
174 Leos Valasek et al.
interactions could underlie the cooperative interaction of MFC compo-nents with their independent binding sites on the ribosome (Valasek et al.,2003). Currently, two interactions have been demonstrated between eIF2and eIF3, one direct interaction between the TIF32 subunit in eIF3 andeIF2b, and one indirect interaction between the NIP1 subunit of eIF3and eIF2b that is bridged by eIF5 (encoded by TIF5 ). It was hypothesizedthat mutating these two interactions, tif5–7A hcTIF32-D6, would lead to areduction in the level of TC associated with the 40S ribosomal subunit;however, only HCHO cross-linking gave the predicted result (Nielsenet al., 2004), while with heparin treatment no difference was observed(L. Valasek, K. Nielsen, and A. Hinnebusch, unpublished data).
The cause of the difference between heparin and HCHO stabilization isnot understood; however, it was recently reported that single-strandedoligonucleotides could suppress the requirement for mammalian eIF3j ineIF3 binding to the 40S ribosomal subunit (Kolupaeva et al., 2005). Thus,it is possible that the polyanionic heparin might function similarly to single-stranded oligonucleotides in stabilizing the eIF3–40S association. Never-theless, the accumulated data strongly suggest that heparin stabilizationdoes not reflect the steady-state composition of the PIC and can produceartifacts.
5.2. Two percent HCHO cross-linking
When investigating a temperature sensitive (Ts–) mutant (prt1-rnp1), it wasfound that at the permissive temperature, 25, the mutant and its isogenicWT strain grew with nearly identical doubling times and their polysomeprofiles were indistinguishable. This strongly suggested that the translationrate of the mutant was comparable to WT. However, when performingWestern blotting analysis of prt1-rnp1 cells grown at 25, factor binding tothe 40S ribosomal subunit seemed to be dramatically impaired. We ration-alized that 1% HCHO cross-linking was not sufficient for a complete cross-linking of PICs in the prt1-rnp1mutant. This implied that some dissociationof PICs can occur during SDC for certain mutants that contain less stablePICs. Thus, we decided to increase the concentration of HCHO to 2% andshowed that under these conditions, the composition of PICs in the prt1-rnp1 mutant and WT strain displayed little difference, as initially expected(Nielsen et al., 2006). Importantly, at nonpermissive temperature, 2%HCHO cross-linking of the prt1-rnp1 mutant displayed a severe reductionin 40S association of all essential subunits of eIF3 and some other eIFs(Fig. 8.3, right panel). In contrast, no difference in mRNA and TC couldbe observed. In addition, an apparent improvement in the amount of allfactors, including eIF1, associated with 40S ribosomes was observed in theWT strain when compared to the same strain treated only with 1% HCHO(Fig. 8.3, left panel versus Fig. 8.2, upper left panel). It should be noted that

Wt
rnp1
PRT1 prt1-rnp137
Input Top Top40S 40S
eIF3
Fractions
TIF32NIP1PRT1TIF34TIF35HCR1
eIF2g
eIF5
eIF1
eIF1A
RPS22
RPL41AmRNA
tRNAiMet
MFC
1 2 3 4 5 6 7 8 9 10 11 1 2 3 4 5 6 7 8 9 10 11
Figure 8.3 Western and Northern blot analysis of gradient fractions from SDC ofWCEprepared from 2%HCHOcross-linking of aWTstrain (PRT1) (left panel) and amutant prt1-rnp1 strain (right panel) after heat shock for 30 min, which displays a dra-matic reduction in the amount of the eIF3 complex associated with the 40S ribosomalsubunit (right panel). (Reproducedwith permission fromNielsen et al.,2006.)
HCHO Cross-Linking in Initiation Complexes 175
the latter two experiments were not conducted in parallel; however, theyillustrate fairly well the standard outcomes of these two variants. To conclude,the use of 2% HCHO may always be a better choice when examining PICcomposition since the only concern is that it cannot be used for polysomeprofiles. With 2% HCHO, the cross-linking becomes more extensive andpresumably the heavy polysomes get cross-linked to each other and thereforesediment as a bulk during the SDC. We are not aware of any artifactualassociations in PICs that could be caused by 2% HCHO cross-linking, butwe cannot, of course, completely rule them out.
5.3. Resedimentation experiments
Association of factors and especially mRNA with the 40S ribosomal sub-unit, visualized as a peak, may sometimes be misrepresented by factors andmRNA trailing from the immediately preceding fractions. This phenome-non complicates the data interpretation as it becomes difficult to distinguishthe true amount of factors and mRNA associated with the 40S ribosomesfrom unbound portions of these components. A conspicuous example ofmRNA trailing is displayed in mutants showing prominent polysome runoffwith a resulting large accumulation of mRNA the top fractions. To cir-cumvent this problem, it is possible to perform an extra SDC of the 40Sfractions from the first SDC to minimize the trailing effect, as the trailing

176 Leos Valasek et al.
mRNA should be present primarily in the upper fractions after the secondSDC. As can be seen in Fig. 8.4A, the RPL41A mRNA does not form anobvious peak in the 40S fractions of a mutant yeast strain (tif32-td prt1-td ) inwhich the entire eIF3 complex has been depleted by the use of degron-tagging. (The -td stands for degron, a special tool used to make a conditionalnull-allele; Dohmen et al., 1994; Labib et al., 2000.) This was attributed tothe accumulation of unbound mRNA in the upper fractions because of thepolysome runoff that occurs in this mutant. Nevertheless, we still observed astrong and surprisingly evenly distributed signal running into the 40S-containing fractions—the trailing phenomenon. Deletion of RPL11Bincreased the amount of PICs and, thus, a stronger 40S peak was observedin the WT rpl11bD strain ( Fig. 8.4B, left panel). However, in the mutanttif32-td prt1-td rpl11b D strain we still observed trailing without the appear-ance of any obvious 40S peak (see Fig. 8.4B, right panel). When the 40Sfractions from this mutant were pooled and subjected to a second round ofSDC (resedimentation), the trailing effect was clearly diminished and anobvious loss of mRNA association with 40S ribosomes was observed in themutant strain when compared to the WT strain (Fig. 8.4C ). We believe theresedimentation protocol by itself, without the need for deletion ofRPL11B, in most cases, should be sufficient to distinguish 40S-boundmRNAs from trailing mRNAs.
Finally, it should also be mentioned that resedimentation did not com-pletely eliminate trailing in all cases, indicating that factors and mRNAs arestripped from the PICs even during the second SDC. This again suggeststhat cross-linking of the PICs is not complete when 1% HCHO is used.Thus, the use of 2% HCHO cross-linking is recommended in order toensure more complete stabilization of PICs.
5.4. Polysome profile analysis and halfmers
Varying the percentage of sucrose in the density gradients can be used toachieve optimal resolution of different ribosomal species (Table 8.1),including the complete profile of polysomes, 80S, and free subunits, the40S to 80S region or just free 40S. Translation initiation is considered to bethe rate-limiting step and a reduction in the polysome-to-monosome (P/M)ratio in a mutant strain serves as a hallmark of its defect. It should be notedthat cycloheximide is a proven tool to preserve polysome profiles and unlessWestern or Northern analysis of eIF/mRNA association with ribosomes isto be conducted, there is no need to replace it with HCHO. As demon-strated in Fig. 8.5, only a small difference in the entire polysome profile wasobserved when cells were treated with HCHO (A) or cycloheximide (B).Slightly better resolution is obtained with cycloheximide, which should beused as the primary tool for determination of the P/M.

A
B
C
TIF32 PRT1 (eIF3a/eIF3b)
TIF32 PRT1 rpl11b∆
TIF32 PRT1 rpl11b∆
tif32-td prt1-td rpl11b∆
tif32-td prt1-td rpl11b∆
tif32-td prt1-td
In
In
Top
In Top
40S
40S
40S
In
In
In
Top
Top
40S
40S
40S
RPL41A
RPL41A
RPL41A
Fractions
Fractions
1-4 5 6 7 8 9 10 11
4321 5 6 7 8 9 10 11
12 1-4
2-41
5 6 7 8 9 10 11
5 6 7 8 9 10 112-41 5 6 7 8 9 10 11
12mRNA
mRNA
mRNA
tRNAiMet
1 2 3 4 5 6 7 8 9 10 11
Figure 8.4 Northern analysis ofmRNA (A^C) and tRNAMeti (A) after SDCand fractionation ofWCEs fromHCHOcross-linked cells. (A)
Analysis ofWTandmutant strains. (B) Analysis similar to (A) but where both strains have RPL11B deleted. (C) Strains in (B) that have beensubjected to a second SDC of the fractions containing the 40S species, which allows a clear distinction between mRNA specifically bound toPICs and unboundmRNAthat accumulate in the upper fractions as the result of polysome runoff and trails into the 40S fractions. See the textfor further explanation. (Reproduced with permission from Jivotovskaya et al., 2006, and unpublished data from A. Jivotovskaya, K. Nielsen,andA.Hinnebusch.)
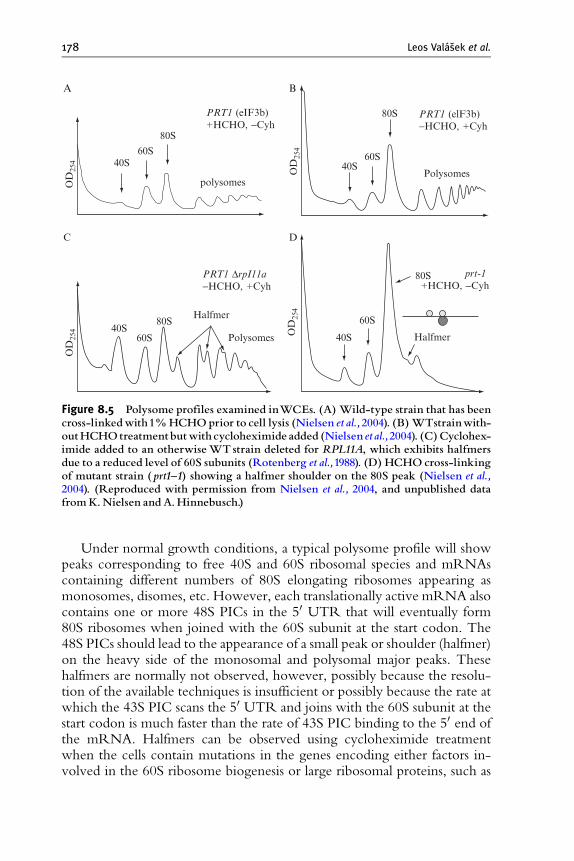
40S 40S
40S40S
60S 60S
60S
60S
80S
80S
80S
80S
PRT1 (eIF3b)+HCHO, −Cyh
PRT1 ∆rpI11a−HCHO, +Cyh
prt-1 +HCHO, −Cyh
PRT1 (elF3b)−HCHO, +Cyh
polysomes
Polysomes
Polysomes
OD
254
OD
254
OD
254
OD
254
Halfmer
Halfmer
A
C
B
D
Figure 8.5 Polysome profiles examined inWCEs. (A)Wild-type strain that has beencross-linkedwith1%HCHOprior to cell lysis (Nielsen et al.,2004). (B)WTstrainwith-outHCHOtreatmentbutwithcycloheximide added (Nielsen et al.,2004). (C)Cyclohex-imide added to an otherwiseWTstrain deleted for RPL11A, which exhibits halfmersdue to a reduced level of 60S subunits (Rotenberg et al.,1988). (D) HCHOcross-linkingof mutant strain (prt1^1) showing a halfmer shoulder on the 80S peak (Nielsen et al.,2004). (Reproduced with permission from Nielsen et al., 2004, and unpublished datafromK.Nielsen andA.Hinnebusch.)
178 Leos Valasek et al.
Under normal growth conditions, a typical polysome profile will showpeaks corresponding to free 40S and 60S ribosomal species and mRNAscontaining different numbers of 80S elongating ribosomes appearing asmonosomes, disomes, etc. However, each translationally active mRNA alsocontains one or more 48S PICs in the 50 UTR that will eventually form80S ribosomes when joined with the 60S subunit at the start codon. The48S PICs should lead to the appearance of a small peak or shoulder (halfmer)on the heavy side of the monosomal and polysomal major peaks. Thesehalfmers are normally not observed, however, possibly because the resolu-tion of the available techniques is insufficient or possibly because the rate atwhich the 43S PIC scans the 50 UTR and joins with the 60S subunit at thestart codon is much faster than the rate of 43S PIC binding to the 50 end ofthe mRNA. Halfmers can be observed using cycloheximide treatmentwhen the cells contain mutations in the genes encoding either factors in-volved in the 60S ribosome biogenesis or large ribosomal proteins, such as

HCHO Cross-Linking in Initiation Complexes 179
RPL11 (Fig. 8.5C). Alternatively, halfmers should be observed with mutantforms of those eIFs that promote postassembly processes such as scanningand AUG recognition. Indeed, this was the case of the prt1–1 mutant wherea weak but distinct halfmer was detected on the heavy side of the 80S peakwhen the cells were HCHO cross-linked (Fig. 8.5D). In this mutant, mostof the 80S peak is composed of inactive 80S couples that are not bound tomRNA and therefore the halfmer peak is not expected to be prominent,even though the 80S peak is large. Interestingly, this halfmer was notdetected if cycloheximide was used, not even in combination with heparin(see below). These results indicate that the composition of the prt1–1 half-mer (see Fig. 8.5D) might be different from the halfmers occurring in therpl11A mutant (see Fig. 8.5C). A possible explanation might be a differencein the rate-limiting step between these two mutant strains. The rpl11ADstrain has a defect in subunit joining because of the reduced 60S levels and,therefore, is expected to accumulate 48S PICs with Met-tRNAMet
i in theribosomal P-site base paired with the AUG start codon after GTP hydrolysison eIF2. These complexes are probably very stable since they do not requirestabilization with heparin or by HCHO cross-linking before SDC. On theother hand, the prt1–1 mutant is thought to have a defect in scanning suchthat 48S PICs in the process of scanning the 5 0 UTR would accumulate, andthese halfmers would presumably require HCHO cross-linking for stabili-zation. The fact that inclusion of heparin did not stabilize formation of theprt1–1 halfmer further indicates that the preservation of PICs by heparin ismechanistically different from that of HCHO cross-linking.
Two buffer solutions are used for preparation of the three different kinds ofsucrose gradients. Buffer A contains 45% sucrose in 20 mM Tris–HCl, pH 7.5,50 mM KC l, a nd 1 0 mM MgC l2. Buffer B is identical except that it containsno sucrose. A 60% sucrose solution (autoclaved) and a 10 stock solutioncontaining the buffer and salts (sterile filtrated) are used to prepare buffersA and B. Theywere then used to prepare a set of sucrose solutions tomake theselected sucrose density gradient, e.g., 7.5% and 30% solutions for the 7.5%to 30% gradient according to Table 8.2. Fresh DDT was added to a finalconcentration of 1 mM from a 1M stock solution immediately before makingthe gradients, which is conducted using a Gradient Master instrument(BioComp.).
6. Final Remarks
Dissection of the roles played by the different initiation factors intranslation initiation is an important task to achieve. The ability to deter-mine which eIFs or mRNAs remain associated with the 40S ribosomalsubunit in 43S or 48S PICs in a particular mutant strain is imperative for

Table 8.2 Volume of buffer A and B for preparing the indicated sucrose solutions
Volume solutions for 30% 7.5% 4.5%
# of gradients 2 4 6 2 4 6 2 4 6
Buffer A 10 ml 18 ml 26 ml 3 ml 5 ml 7 ml 2 ml 3 ml 4 ml
Buffer B 5 ml 9 ml 13 ml 15 ml 25 ml 35 ml 18 ml 27 ml 36 ml
1M DDT 15 ml 27 ml 39 ml 18 ml 30 ml 42 ml 20 ml 30 ml 40 ml

HCHO Cross-Linking in Initiation Complexes 181
reaching this goal. Since SDC requires stabilization of the PICs, it is criticalto employ the stabilization method that provides the best possible approxi-mation of the composition of native PICs. Based on the examples discussedhere, we believe that HCHO cross-linking is superior to heparin treatmentin this regard, as heparin seems to misrepresent the 40S binding defect ofeIFs in certain mutants such as hcr1D and tif5–7A hcTIF32-D6 mutantstrains, as described above. If the nature of this artifact is resolved, bothmethods may successfully complement each other. This would be desirableas one of the disadvantages of HCHO cross-linking not discussed aboveis a greater variation of obtained results requiring more independent experi-ments (three to five) than experiments performed with heparin. To sum-marize, cycloheximide should be used when the polysome-to-monosomeratio has to be calculated, whereas 2% HCHO cross-linking followedby resedimentation, if necessary, should be used to determine the PICcomposition.
ACKNOWLEDGMENTS
We would like to thank Jon Lorsch for inviting us to write this chapter for Methods inEnzymology. L. V. was supported by the Wellcome Trust’s Grant 076456/Z/05/Z, HowardHughes Medical Institute Grant 55005626, Global Research Initiative Program Grant 1 R01TW007271–01 from FIC NIH, Fellowship of Jan E. Purkyne from Academy of Sciencesof the Czech Republic, and Institute Research Concept AV0Z50200510. K.H.N. wassupported by the Danish National Research Foundation.
REFERENCES
Algire, M. A., Maag, D., Savio, P., Acker, M. G., Tarun, S. Z., Jr., Sachs, A. B., Asano, K.,Nielsen, K. H., Olsen, D. S., Phan, L., Hinnebusch, A. G., and Lorsch, J. R. (2002).Development and characterization of a reconstituted yeast translation initiation system.RNA 8, 382–397.
Asano, K., Clayton, J., Shalev, A., and Hinnebusch, A. G. (2000). A multifactor complex ofeukaryotic initiation factors eIF1, eIF2, eIF3, eIF5, and initiator tRNAMet is an importanttranslation initiation intermediate in vivo. Genes Dev. 14, 2534–2546.
Asano, K., Shalev, A., Phan, L., Nielsen, K., Clayton, J., Valasek, L., Donahue, T. F., andHinnebusch, A. G. (2001). Multiple roles for the carboxyl terminal domain of eIF5 intranslation initiation complex assembly and GTPase activation. EMBO J. 20, 2326–2337.
Asano, K., Phan, L., Krishnamoorthy, T., Pavitt, G. D., Gomez, E., Hannig, E. M., Nika, J.,Donahue, T. F., Huang, H. K., and Hinnebusch, A. G. (2002). Analysis and reconstitu-tion of translation initiation in vitro. Methods Enzymol. 351, 221–247.
Dohmen, R. J., Wu, P., and Varshavsky, A. (1994). Heat-inducible degron: A method forconstructing temperature-sensitive mutants. Science 263, 1273–1276.
Fraser, C. S., Lee, J. Y., Mayeur, G. L., Bushell, M., Doudna, J. A., and Hershey, J. W.(2004). The j-subunit of human translation initiation factor eIF3 is required for the stablebinding of eIF3 and its subcomplexes to 40 S ribosomal subunits in vitro. J. Biol. Chem.279, 8946–8956.

182 Leos Valasek et al.
Hershey, J. W. B., and Merrick, W. C. (2000). Pathway and mechanism of initiation ofprotein synthesis. In ‘‘Translational Control of Gene Expression’’ (N. Sonenberg,J. W. B. Hershey, and M. B. Mathews, eds.), pp. 33–88. Cold Spring Harbor LaboratoryPress, Cold Spring Harbor, NY.
Hradec, J., and Dusek, Z. (1978). All factors required for protein synthesis are retained onheparin bound to Sepharose. Biochem. J. 172, 1–7.
Jackson, V. (1978). Studies on histone organization in the nucleosome using formaldehyde asa reversible cross-linking agent. Cell 15, 945–954.
Jivotovskaya, A. V., Valasek, L., Hinnebusch, A. G., and Nielsen, K. H. (2006). Eukaryotictranslation initiation factor 3 (eIF3) and eIF2 can promote mRNA binding to 40Ssubunits independently of eIF4G in yeast. Mol. Cell. Biol. 26, 1355–1372.
Kolupaeva, V. G., Unbehaun, A., Lomakin, I. B., Hellen, C. U., and Pestova, T. V. (2005).Binding of eukaryotic initiation factor 3 to ribosomal 40S subunits and its role inribosomal dissociation and anti-association. RNA 11, 470–486.
Labib, K., Tercero, J. A., and Diffley, J. F. (2000). Uninterrupted MCM2–7 functionrequired for DNA replication fork progression. Science 288, 1643–1647.
Majumdar, R., Bandyopadhyay, A., and Maitra, U. (2003). Mammalian translation initiationfactor eIF1 functions with eIF1A and eIF3 in the formation of a stable 40S preinitiationcomplex. J. Biol. Chem. 278, 6580–6587.
Maraia, R. (1991). The subset of mouse B1 (Alu-equivalent) sequences expressed as smallprocessed cytoplasmic transcripts. Nucl. Acids Res. 19, 5695–5702.
Nielsen, K. H., Szamecz, B., Valasek, L., Jivotovskaya, A., Shin, B., and Hinnebusch, A. G.(2004). Functions of eIF3 downstream of 48S assembly impact AUG recognition andGCN4 translational control. EMBO J. 23, 1166–1177.
Nielsen, K. H., Valasek, L., Sykes, C., Jivotovskaya, A., and Hinnebusch, A. G. (2006).Interaction of the RNP1 motif in PRT1 with HCR1 promotes 40S binding of eukary-otic initiation factor 3 in yeast. Mol. Cell. Biol. 26, 2984–2998.
Pestova, T. V., and Kolupaeva, V. G. (2002). The roles of individual eukaryotic translationinitiation factors in ribosomal scanning and initiation codon selection. Genes Dev. 16,2906–2922.
Pestova, T. V., Borukhov, S. I., and Hellen, C. U. T. (1998). Eukaryotic ribosomes requireinitiation factors 1 and 1A to locate initiation codons. Nature 394, 854–859.
Phan, L., Zhang, X., Asano, K., Anderson, J., Vornlocher, H. P., Greenberg, J. R., Qin, J.,and Hinnebusch, A. G. (1998). Identification of a translation initiation factor 3 (eIF3)core complex, conserved in yeast and mammals, that interacts with eIF5. Mol. Cell. Biol.18, 4935–4946.
Phan, L., Schoenfeld, L. W., Valasek, L., Nielsen, K. H., and Hinnebusch, A. G. (2001).A subcomplex of three eIF3 subunits binds eIF1 and eIF5 and stimulates ribosomebinding of mRNA and tRNAMet
i . EMBO J. 20, 2954–2965.Ren, B., and Dynlacht, B. D. (2004). Use of chromatin immunoprecipitation assays in
genome-wide location analysis of mammalian transcription factors. Methods Enzymol.376, 304–315.
Rotenberg, M. O., Moritz, M., and Woolford, J. L., Jr. (1988). Depletion of Saccharomycescerevisiae ribosomal protein L16 causes a decrease in 60S ribosomal subunits and formationof half-mer polyribosomes. Genes Dev. 2, 160–172.
Sambrook, J., Fritsch, E. F., and Maniatis, T. (1989). ‘‘Molecular Cloning, a LaboratoryManual.’’ Cold Spring Harbor Laboratory Press, Cold Spring Harbor, NY.
Solomon, M. J., and Varshavsky, A. (1985). Formaldehyde-mediated DNA-protein cross-linking: A probe for in vivo chromatin structures. Proc. Natl. Acad. Sci. USA 82, 6470–6474.
Valasek, L., Hasek, J., Nielsen, K. H., and Hinnebusch, A. G. (2001a). Dual function ofeIF3j/Hcr1p in processing 20 S pre-rRNA and translation initiation. J. Biol. Chem. 276,43351–43360.

HCHO Cross-Linking in Initiation Complexes 183
Valasek, L., Phan, L., Schoenfeld, L. W., Valaskova, V., and Hinnebusch, A. G. (2001b).Related eIF3 subunits TIF32 and HCR1 interact with an RNA recognition motif inPRT1 required for eIF3 integrity and ribosome binding. EMBO J. 20, 891–904.
Valasek, L., Mathew, A., Shin, B. S., Nielsen, K. H., Szamecz, B., and Hinnebusch, A. G.(2003). The yeast eIF3 subunits TIF32/a and NIP1/c and eIF5 make critical connectionswith the 40S ribosome in vivo. Genes Dev. 17, 786–799.
Valasek, L., Nielsen, K. H., Zhang, F., Fekete, C. A., and Hinnebusch, A. G. (2004).Interactions of eukaryotic translation initiation factor 3 (eIF3) subunit NIP1/c with eIF1and eIF5 promote preinitiation complex assembly and regulate start codon selection.Mol.Cell. Biol. 24, 9437–9455.
Waldman, A. A., Marx, G., and Goldstein, J. (1975). Isolation of rabbit reticulocyteinitiation factors by means of heparin bound to sepharose. Proc. Natl. Acad. Sci. USA72, 2352–2356.
Yu, X., and Warner, J. R. (2001). Expression of a micro-protein. J. Biol. Chem. 276,33821–33825.

C H A P T E R N I N E
M
IS
LD
ethods
SN 0
aboratevelo
Molecular GeneticStructure–Function Analysisof Translation InitiationFactor eIF5B
Byung-Sik Shin and Thomas E. Dever
Contents
1. In
in
076
orypme
troduction
Enzymology, Volume 429
-6879, DOI: 10.1016/S0076-6879(07)29009-3
of Gene Regulation and Development, National Institute of Child Health and Humant, National Institutes of Health, Bethesda, Maryland
n
186
2. M
ethods 1882
.1. G enetic selection of intragenic suppressors 1882
.2. P olysome profile analysis 1902
.3. P reparation of yeast cell extracts for in vitro translation assays 1922
.4. E xpression and purification of eIF5B from yeast 1932
.5. R ibosome purification 1952
.6. R ibosome-dependent uncoupled GTPase assay of eIF5B 1972
.7. e IF5B ribosome-binding assay 1983. F
uture Directions 200Refe
rences 200Abstract
Recently, significant progress has beenmade in obtaining three-dimensional (3-D)
structures of the factors that promote translation initiation, elongation, and
termination. These structures, when interpreted in light of previous biochemical
characterizations of the factors, provide significant insight into the function of the
factors and the molecular mechanism of specific steps in the translation process.
In addition, genetic analyses in yeast have helped elucidate the in vivo roles of the
factors in various steps of the translation pathway. We have combined these two
approaches and use molecular genetic studies to define the structure–function
properties of translation initiation factors in the yeast Saccharomyces cerevisiae.
In this chapter, we describe ourmultistep approach inwhichwe first characterize a
site-directed mutant of the factor of interest using in vivo and in vitro assays of
protein synthesis. Next, we subject the mutant gene to random mutagenesis and
screen for second-site mutations that restore the factor’s function in vivo.
185
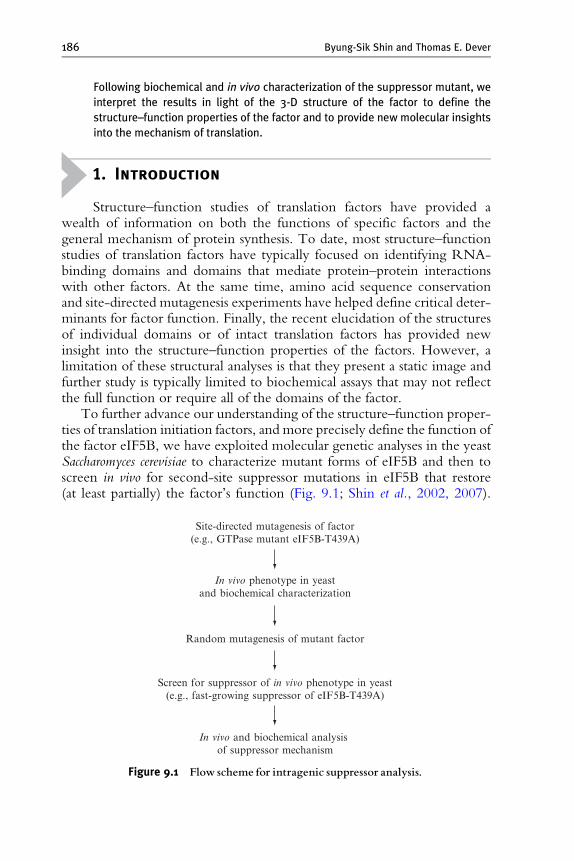
186 Byung-Sik Shin and Thomas E. Dever
Following biochemical and in vivo characterization of the suppressor mutant, we
interpret the results in light of the 3-D structure of the factor to define the
structure–function properties of the factor and to provide new molecular insights
into the mechanism of translation.
1. Introduction
Structure–function studies of translation factors have provided awealth of information on both the functions of specific factors and thegeneral mechanism of protein synthesis. To date, most structure–functionstudies of translation factors have typically focused on identifying RNA-binding domains and domains that mediate protein–protein interactionswith other factors. At the same time, amino acid sequence conservationand site-directed mutagenesis experiments have helped define critical deter-minants for factor function. Finally, the recent elucidation of the structuresof individual domains or of intact translation factors has provided newinsight into the structure–function properties of the factors. However, alimitation of these structural analyses is that they present a static image andfurther study is typically limited to biochemical assays that may not reflectthe full function or require all of the domains of the factor.
To further advance our understanding of the structure–function proper-ties of translation initiation factors, and more precisely define the function ofthe factor eIF5B, we have exploited molecular genetic analyses in the yeastSaccharomyces cerevisiae to characterize mutant forms of eIF5B and then toscreen in vivo for second-site suppressor mutations in eIF5B that restore(at least partially) the factor’s function (Fig. 9.1 ; Shin et al., 2002, 2007).
Site-directed mutagenesis of factor(e.g., GTPase mutant eIF5B-T439A)
In vivo phenotype in yeastand biochemical characterization
Random mutagenesis of mutant factor
Screen for suppressor of in vivo phenotype in yeast(e.g., fast-growing suppressor of eIF5B-T439A)
In vivo and biochemical analysis of suppressor mechanism
Figure 9.1 Flow scheme for intragenic suppressor analysis.

Structure–Function Analysis of eIF5B 187
Biochemical characterizations to elucidate the functional consequences ofthe second-site suppressor mutations, combined with mapping of the muta-tions on the structure of eIF5B (Roll-Mecak et al., 2000), have providedsignificant new insight into both the structure–function properties of eIF5Band the role of eIF5B in translation initiation. Similar strategies have provenpowerful in the study of the eIF2a kinase PKR (Dey et al., 2005) and theinitiation factor eIF2g (P. V. Alone and T. E. Dever, unpublished), indicat-ing that this approach may be useful for studying those translation factorsand regulators that have identifiable homologs in yeast.
The GTPase eIF5B, an ortholog of the bacterial translation factorIF2 (Choi et al., 1998), catalyzes ribosomal subunit joining, the final stepof translation initiation in eukaryotes (Pestova et al., 2000). In the firststep of translation initiation, the eIF2GTPMet-tRNAMet
i ternary com-plex binds the small ribosomal subunit forming a 43S preinitiation complexthat also contains the factors eIF1, eIF1A, and eIF3 (reviewed inHinnebusch, 2000). This complex binds an mRNA and scans to identifya start codon. The GTPase activity of eIF2 is functional on the scanningribosome and eIF2–GTP is in equilibrium with eIF2–GDP þ Pi. UponAUG codon recognition, release of eIF1 is coupled to release of Pi fromeIF2–GDP (Algire et al., 2005; Maag et al., 2005). The eIF2–GDP andseveral of the other factors dissociate from the complex leaving eIF1Abound to the subunit and Met-tRNAMet
i in the ribosomal P site. Recentevidence indicates that eIF1A helps recruit eIF5B to the 40S subunit, andthat subsequent GTP hydrolysis by eIF5B is required to release both eIF5Band eIF1A from the 80S ribosomal complex, which then enters theelongation phase of protein synthesis (Fringer et al., 2007).
In yeast, the nonessential FUN12 gene encodes eIF5B. Cells lackingthe FUN12 gene exhibit a severe slow-growth phenotype and polyribosomeprofile analyses revealed a runoff of polysomes and accumulation of inactive80S couples (associated 40S and 60S subunits lacking mRNA), consistentwith a defect in translation initiation (Choi et al., 1998). In vitro translationextracts prepared from cells lacking eIF5B were defective for translation of anexogenous luciferase reporter mRNA; however, translational activity wasrestored by addition of recombinant eIF5B, indicating that eIF5B directlystimulated translation initiation (Choi et al., 1998; Lee et al., 1999). Whilepurified eIF5B fails to bind isolated 40S and 60S ribosomal subunits, it bindsto 80S ribosomes in a GTP-dependent manner (Pestova et al., 2000; Shinet al., 2002). In addition, eIF5B hydrolyzes GTP in an 80S ribosome-dependent reaction (Pestova et al., 2000; Shin et al., 2002). Finally, asdescribed elsewhere in this volume, eIF5B catalyzes ribosomal subunit joiningin reconstituted translation initiation systems from yeast and mammalian cells(Algire et al., 2002; Lee et al., 2002; Pestova et al., 2000).
To decipher the role of GTP hydrolysis by eIF5B, wemutated conservedresidues in the GTP-binding (G) domain and characterized the functions of
188 Byung-Sik Shin and Thomas E. Dever
the mutant factor both in vivo and in vitro. Having found that GTPasedefective forms of eIF5B cause a severe slow-growth phenotype in yeast,yet retain subunit-joining activity in vitro (Shin et al., 2002), we chose agenetic approach to identify intragenic mutations in eIF5B that restore thein vivo function of GTPase-defective forms of the factor. A plasmid encodinga GTPase-defective mutant of eIF5B was subjected to random mutagenesisto generate a library of eIF5B mutant plasmids. This library was introducedinto an fun12D yeast strain lacking eIF5B and plasmids containing mutationsthat restored eIF5B function were identified as conferring a fast-growingphenotype. This genetic approach enabled us to identify physiologicallyimportant residues in eIF5B and further biochemical studies of the suppres-sor mutants revealed that GTP hydrolysis was critical for release of eIF5Bfrom the 80S ribosome following subunit joining. Analysis of the intragenicsuppressor mutations in light of the 3-D structure of aIF5B (Roll-Mecaket al., 2000) enabled us to map critical ribosome-binding determinants andstructurally important elements in the eIF5B (Shin et al., 2002, 2007).
In this article we will describe the strategy (see Fig. 9.1) and methods weuse to screen for intragenic suppressor mutations that restore eIF5B functionin vivo and the biochemical assays that we use to characterize the eIF5Bmutants. The in vivo methods are directly applicable to structure–functionstudies of other proteins, and several of the in vitro assays will be useful tocharacterize mutants in other translation factors.
2. Methods
2.1. Genetic selection of intragenic suppressors
2.1.1. Site-directed and random mutagenesis of the FUN12 geneencoding yeast eIF5B
As the N-terminal region (residues 1 to 396) of yeast eIF5B is not requiredfor viability in vivo or for biochemical activity in vitro, an N-terminallytruncated form of eIF5B (eIF5B397-1002) was used for mutational andsuppressor screening experiments. Site-directed mutagenesis of conservedeIF5B G domain residues Thr-439 in Switch I (Shin et al., 2002) andGly-479 in Switch II (Shin et al., 2007) was performed using the Quick-Change XL Site-Directed Mutagenesis Kit (Stratagene). This kit and relatedproducts from other vendors yield the desired mutation at greater than 90%efficiency. Following generation and characterization of eIF5B pointmutants that confer a significant growth defect on minimal completemedium or under restrictive conditions (e.g., elevated temperature, aminoacid starvation), we screened for intragenic suppressor mutations. A plasmidcontaining the mutant fun12 allele was subjected to random mutagenesis bypassage through the Escherichia coli mutator strain XL1-Red (Stratagene)

Structure–Function Analysis of eIF5B 189
according to the manufacturer’s instructions. XL1-Red cells were trans-formed with 100 ng of plasmid DNA, plated on LB medium containing100 mg/ml ampicillin and incubated 2 days at 37. Transformants (>500colonies) were collected by adding 1 ml LB broth to the plates, and thencolonies were pooled using a spreader and inoculated into 10 ml LB broth.Following growth at 37 for 16 h, the plasmid DNA was isolated. Inprevious studies we found that the plasmid DNA prepared from XL1-Red cells is not efficient for yeast transformation, so we introduced anotherstep and passed the mutated plasmids through DH5a. Since the plasmidDNA has random mutations, it is best to pool colonies (>104) from theLB þ ampicillin transformation plates rather than amplifying the library inbroth culture.
2.1.2. Screening for intragenic suppressor mutantsTo identify plasmids encoding functional forms of eIF5B, the pool ofrandomly mutated plasmids was used to transform the S. cerevisiae strainJ111 (MATa ura3-52 leu2-3 leu2-112 fun12D). As controls, the same strainwas transformed with plasmids encoding the original eIF5B mutant (e.g.,eIF5B-T439A), wild-type eIF5B, or an empty vector. Transformants grow-ing faster than the control expressing the original eIF5B mutant wereselected for further analysis. In our experience, we typically need to screenmore than 104 transformants to identify intragenic suppressor mutantsof eIF5B. For example, 5 104 transformants were screened to obtainthree intragenic suppressors of the eIF5B-T439A Switch I mutant (Shinet al., 2002) and 3 104 transformants were screened to identify twosuppressors of the eIF5B-G479A Switch II mutant (Shin et al., 2007).
Following the identification of fast-growing yeast transformants, it isnecessary to confirm that the improved growth is linked to the plasmid andnot due to a spontaneous mutation in the yeast genome. The plasmids wererecovered from the fast growing yeast transformants using standard proto-cols that rely on the ability of the plasmids to propagate in E. coli (Strathernand Higgins, 1991). The isolated plasmids were then reintroduced intostrain J111, and plasmids that again conferred a faster growth phenotypewere identified. Finally, the suppressor mutation was first mapped by sub-cloning the smallest fragment of the suppressor allele that conferred theimproved growth phenotype, and then identified by DNA sequencing.To ensure that the identified mutation confers the suppressor phenotype,we used site-directed mutagenesis to introduce the mutation into awild-type eIF5B plasmid and then retested the growth phenotype in yeast.
While the nonessential nature of the FUN12 gene greatly facilitatedthe genetic approach for screening for suppressor mutations, related strate-gies can be employed to study proteins encoded by essential genes. Foressential genes, the approach is modified using a plasmid-shuffling protocol(Sikorski and Boeke, 1991). First, the viability of a strain carrying a
190 Byung-Sik Shin and Thomas E. Dever
chromosomal deletion of the essential gene of interest is maintained by awild-type version of the gene on a plasmid marked with the counter-selectable yeast URA3 gene. A second plasmid marked with a compatiblegene of interest (typically LEU2 or TRP1) and carrying a defective (mutant)version of the gene of interest is subjected to random mutagenesis. Thislibrary is then introduced into the yeast strain and independent transfor-mants are selected and replica printed to medium containing the drug5-fluoroorotic acid (5-FOA) to select against cells carrying the URA3plasmid (Boeke et al., 1987). In this way, only cells containing versions ofthe mutant plasmid that restore the factor’s function are capable of growingon the 5-FOA medium.
Following the genetic screens to identify intragenic suppressor muta-tions in eIF5B, we used a series of in vivo and in vitro analyses to characterizethe activities of the eIF5B mutants. The first assay analyzes global proteinsynthesis in yeast cells by examining polysome profiles in sucrose densitygradients. The second assay examines the translation of a reporter mRNA incrude extracts from an eIF5B deletion strain that is supplemented withvarious amounts of wild-type eIF5B, the original mutant form of the factor,or the suppressor mutant. Additional in vitro assays described below weredesigned to characterize the eIF5B GTPase activity and the interaction ofthe factor with the ribosome.
2.2. Polysome profile analysis
2.2.1. Preparation of sucrose density gradientsWe prepare linear 7 to 47% sucrose gradients using the Gradient Master(BioComp Instruments, Inc., Canada), and we subject the gradients to cen-trifugation using a Beckman SW41 rotor. First, using RNase-free distilledwater (DW) prepare 50 ml each of 7% and 47 % sucrose solutions in 20 mMTris–Cl (pH 7.5), 50 mM KCl, 10 mM MgCl2, and 2 mM dithiothreitol(DTT). Next, using the Gradient Master according to the manufacturer’sinstructions, prepare six gradients by dispensing approximately 8 ml into thethin-walled polyallomer ultracentrifuge tubes for a Beckman SW41 rotor.Store the gradients at 4 and be careful to avoid disturbances that mightdisrupt the gradients.
2.2.2. Preparation of yeast cell extractsCells are grown in a 1-liter flask containing 200 ml of rich YPD medium orof synthetic complete (SC) medium containing all amino acids and lackingonly the nutrient(s) required to maintain selection of any plasmid(s) in thestrain (Sherman, 1991). Cultures are typically inoculated at an A600 ¼ 0.1and incubated at 30 while shaking at 250 rpm. When the density of theculture reaches anA600¼ 1.0, add cycloheximide (stock: 10 mg/ml in DW)to a final concentration of 50 mg/ml, and continue incubating for anadditional 5 to 10 min to halt protein biosynthesis. The cycloheximide is
Structure–Function Analysis of eIF5B 191
added to block translation elongation and freeze polysomes; otherwise,ribosomes would continue elongating and run off mRNAs during extractpreparation. During the incubation with cycloheximide, prepare centrifugebottles to collect the yeast cells. Fill the 500-ml centrifuge bottles for aSorvall G3 rotor about two-thirds full with crushed ice and store the bottleson ice. Pour the contents of the yeast culture into the ice-filled bottles andgently shake to rapidly cool the cells. Collect the cells by centrifugation at5000 rpm for 5 min at 4 in a Sorvall GS3 rotor. After pelleting the cells,suspend the pellets in 2 ml Breaking Buffer [20 mM Tris–Cl (pH 7.5),50 mM KCl, 10 mMMgCl2, 2 mMDTT, 1 Complete Protease Inhibitorcocktail (EDTA-free, Roche), 0.5 mM 4-(2-aminoethyl)benzenesulfonylfluoride (AEBSF), 5 mg/ml pepstatin, and 50 mg/ml cycloheximide]. Trans-fer the cell suspensions to 15-ml centrifuge tubes (Falcon), and collect thecells by centrifugation at 3000 rpm for 5 min in a Beckman JS-4.2 rotor.Resuspend the pellets in 0.5 ml Breaking Buffer, and add acid-washed glassbeads (Sigma) to60% final volume. Working in the cold room (4), mixthe tubes vigorously using a vortex for 1 min and then incubate the tubes onice for 1 min. Repeat this cycle of mixing and cooling for a total of fivetimes. Pellet any unbroken cells and the glass beads by spinning the tubes at3000 rpm for 5 min, and then transfer the supernatants containing the celllysates to 1.5 ml-microcentrifuge tubes. Clarify the lysates by centrifugationat 12,000 rpm for 10 min (4), and measure the absorbance (A260) of a1:1000 dilution of the final supernatant. Typically, the A260 ¼ 100.
2.2.3. Polysome analysisCarefully layer 100 ml of yeast extract (A260 ¼ 100) on the top of eachsucrose gradient, and use Breaking Buffer (without protease inhibitors) tobalance the volume in the centrifuge tubes. Subject the gradients to ultra-centrifugation at 39,000 rpm for 2.5 h (4) in a Beckman SW41 rotor. Wefractionate the gradients using an ISCO tube piercing system and ModelT11 gradient fractionation system with an attached UA-6 UV/VIS Detec-tor (with a 254-nm filter). Before fractionation, flush the detector withDW, set the sensitivity to 1.0, and adjust the baseline of the chart recorder.Following centrifugation, transfer individual gradients to the ISCO tubepiercing system, pierce the bottom of the tube, and withdraw the gradientusing an in-line peristaltic pump at the slowest speed. Once the unloadinghas initiated, increase the pump speed to maximum and set the chartrecorder speed at 150 (cm/h).
2.2.4. Comments
1. We have found it convenient to prepare the sucrose gradients a daybefore generating the cell extracts. We store the gradients at 4 andcarefully try to avoid any disturbances that may disrupt the gradients.

192 Byung-Sik Shin and Thomas E. Dever
2. If low amounts of cell extracts are loaded on the sucrose gradients, thesensitivity of UV/VIS detector can be increased to 0.5. Alternatively, if ahuge ribosome peak (80S) is anticipated, the entire peak can be visualizedwhen the sensitivity is set to 2.0.
3. To analyze the composition of individual fractions from the gradients, weconnect the outlet of the detector to an ISCOFoxy Jr. FractionCollector.Typically we use Northern and/or Western analyses to examine thedistribution of specific mRNAs and translation initiation factors, respec-tively, in the gradients. See the chapter by Valasek et al. (this volume) foradditional methods using sucrose density gradients to analyze initiationfactor–ribosome complexes.
2.3. Preparation of yeast cell extracts for in vitrotranslation assays
Building on the work of Peter Sarnow and co-workers (Iizuka et al., 1994),Alan Sachs and colleagues have described a robust in vitro translation systemfrom yeast that recapitulates the natural cap and poly(A) requirements fortranslation observed in vivo (Tarun and Sachs, 1995). We utilize their assaysystem in our studies exactly as has been described (Choi et al., 1998), exceptthat we have introduced some modifications to the protocol for preparingthe yeast cell extracts as described in this section.
Grow the strain of interest in YPDmedium toA600¼ 1 to 1.5. Typicallya 2-liter culture is sufficient to yield a good quality extract for a wild-typestrain; however, for slow-growing strains a larger volume of culture (6liters) may be required. Harvest the cells by centrifugation at 4000 rpm for10 min in a Sorvall GS-3 rotor. Wash the cell pellet twice with 200 ml coldBuffer A [30 mM HEPES–KOH (pH 7.4), 100 mM potassium acetate,2 mM magnesium acetate] and once with 30 ml of Buffer A containing8.5% mannitol and 5 mM 2-mercaptoethanol (prepared by adding 35 ml of2-mercaptoethanol to 100 ml of Buffer A þ 8.5% mannitol). Next, resus-pend the pellet in 6 ml of Buffer A containing 8.5% mannitol and 0.5 mMAEBSF and transfer to a 50-ml Falcon tube. Add acid-washed glass beads(60% v/v) to the cell suspension and break the cells by hand shaking in thecold (4) for 1 min: two cycles/sec over a 50 cm path. Then cool the cellson ice for 1 min. Repeat the cycles of shaking and cooling for a total of fivetimes. Following breakage, transfer the cell suspension (avoiding the glassbeads) to 50-ml centrifuge tubes, clarify the lysate by centrifugation at15,000 rpm for 20 min in a Sorvall SS34 rotor, and then carefully removethe supernatant fraction avoiding the lipid layer on the top.
While preparing the cell extract, preequilibrate a Sephadex G-25 (super-fine grade, autoclaved with DW before use) column (2.5 cm diameter 8 cm tall) with 200 ml of Buffer A containing 2 mMDTT. Load the clarified
Structure–Function Analysis of eIF5B 193
supernatant (4 ml) on the column, and start collecting 0.2 ml fractionsafter 15 ml of elution volume (we collect in a 96-well plate using an ISCOFoxy Jr. Fraction Collector). The peak fractions in the 96-well plate aredetected by their cloudy appearance (more easily seen against a dark back-ground). Next, measure the A260 values of the peak fractions by preparing1:500 dilutions in water. For extracts from wild-type strains, pool all frac-tions for which the A260 value of the dilution is > 0.18 (for extracts fromslow-growing fun12mutant strains, we pool all fractions for which the A260
value of the dilution is > 0.14). Finally, flash-freeze 50-ml aliquots of thepooled fraction in liquid nitrogen and store the frozen in vitro translationextracts at –80.
2.3.1. Comments
1. All extract preparation steps should be carried out in a cold room ifpossible.
2. RNAs are critical components of the translation extract. Try to avoidRNase contamination, and use DEPC-treated DW for all steps.
3. Manual breaking of the cells is recommended. In our experience,extracts prepared from cells broken using a French Press occasionallylack activity.
4. Do not use cells if the A600 exceeds 1.5. The translational activity issignificantly decreased in extracts prepared from dense cultures.
2.4. Expression and purification of eIF5B from yeast
Yeast eIF5B397–1002 can be expressed and purified from either bacterial oryeast cells. Whereas purification of recombinant eIF5B from E. coli typicallyrequires multiple chromatographic steps [GST- or nickel-affinity chroma-tography followed by ion-exchange chromatography (Algire et al., 2002)],overexpressed GST-eIF5B397-1002 can be purified to near homogeneity(>95% pure) from crude yeast extracts using Glutathione Sepharose 4Baffinity chromatography.
The DNA encoding yeast eIF5B397–1002 was subcloned to the yeastexpression vector pEG-KT (Mitchell et al., 1993) that is designed to expressGST fusion proteins under the control of the yeast GAL1 (galactose-inducible) promoter. The resulting pEG-KT-eIF5B plasmid was introducedinto the wild-type yeast strain H1511 (MATa ura3-52 leu2-3 leu2-112 trp1-D63). The resulting transformant was grown in 2 liters of S-raffinose medium[0.145% yeast nitrogen base (without amino acids and without ammoniumsulfate), 0.5% ammonium sulfate, and 2% raffinose] plus required supple-ments. In S-raffinose medium the GAL1 promoter is neither repressed norinduced and so GST-eIF5B expression is maintained at a low level. Oncethe A600 reaches 0.4 to 1.0, induce expression of GST-eIF5B by adding

194 Byung-Sik Shin and Thomas E. Dever
100 ml of a 40% galactose stock solution to achieve a final galactoseconcentration of 2%, and incubate the culture with shaking at 30 for 14 h.
Harvest the cells by centrifugation and suspend the cell pellet in 50%pellet volume of Cell Breaking Buffer: 1 phosphate buffered saline (PBS)solution containing 1 Complete Protease Inhibitor cocktail (EDTA-free,Roche), 0.5 mM AEBSF, and 5 mg/ml of pepstatin. Next, working in thecold room, freeze the cell suspension in liquid nitrogen. Using a 10-mlserological pipette, dispense individual drops of the cell suspension into500 ml of liquid nitrogen in a 1-liter Dewar. The cells will freeze as beadsin the liquid nitrogen, and the beads are then collected and broken using acoffee grinder (such as the Miracle MC 200, Miracle Exclusives Inc., Hicks-ville, NY). To avoid thawing of the cell beads during the grinding, prechillthe grinder cup by filling it with dry ice pellets or liquid nitrogen.In addition, add dry ice pellets or liquid nitrogen to the cell beadsimmediately prior to grinding. After grinding for 2 min, a very fine cellpowder with the consistency of ground coffee is obtained. Dissolve thiscell powder completely in 100 ml of Cell Breaking Buffer. Note that dry icecrystals remaining in the cell powder following cell breakage will generatemany bubbles when dissolved in the Cell Breaking Buffer. Therefore, it isrecommended that the dry ice be allowed to completely sublime prior todissolving the cell powder in buffer (and to allow all bubbles to dissipate priorto capping tubes containing the dissolved cell powder).
After dissolving the cell powder, clarify the extract by centrifugation at15,000 rpm for 30 min in a Sorvall SS34 rotor. Next, add 1 ml of a 50%slurry of Glutathione Sepharose 4B (GE Healthcare) to the extract (about80 ml), and gently mix the suspension at 4 for 2 h. The following stepsdescribing washing of the resin and elution of the eIF5B can be performedeither in batch using 1.5-ml microcentrifuge tubes, as described below, orchromatographically using a disposable column. Wash the resin extensivelyusing more than 20-times the resin volume of 1 PBS buffer. To elute theeIF5B, add 500 ml of 1 PBS buffer containing 20 units of thrombin tothe washed resin in a 1.5-ml microcentrifuge tube. Gently rock the mixture(we typically use either a Nutator or Labquake Shaker) at room temperaturefor 2 h, and then continue mixing at 4 overnight. The progress of thethrombin digestion can be monitored by testing for the presence of proteinreleased into the supernatant.
Once the digestion is complete, recover the released eIF5B by firstpelleting the resin (bound with uncleaved GST-eIF5B and with cleavedGST) by centrifugation at 2000 rpm for 2 min in a microcentrifuge.Remove the supernatant containing released eIF5B to another tube, thenwash the resin by adding 500 ml of 1 PBS (without thrombin) and mixgently. Next, pellet the resin, and combine the wash supernatant with thesupernatant obtained just prior to the wash. The pooled supernatants arethen dialyzed against eIF5B Storage Buffer [20 mM Tris–Cl (pH 7.5),

Structure–Function Analysis of eIF5B 195
100 mM NaCl, 2 mM DTT, and 10% glycerol]. Finally, the eIF5B solu-tion (typically 40 mM) can be concentrated using a Microcon YM-30(Millipore, Bedford, MA) if a higher concentration of the factor is required.
2.5. Ribosome purification
2.5.1. Purification of crude 80S ribosomes from yeastWe have found that the choice of yeast strain can have a substantial impacton the quality of the purified ribosomes. We use the strain F353 (MATatrp1 leu2-D1 his3-D200 pep4::HIS3 prb1-D1.6 GALþ) lacking the vacuolarproteinases A (PEP4) and B (PRB1), which are required both for proteindegradation and for activation of other vacuolar proteases. The followingprotocol has been developed in conjunction with Jon Lorsch and membersof his laboratory. Inoculate 2 liters of YPD medium with F353 and grow at30 until the A600 ¼ 1.0 to 1.5 (overgrowing the cells yields inactiveribosomes). Harvest the cells by centrifugation and suspend the cell pelletusing 50% of the pellet volume of Ribosome Buffer [30 mMHEPES–KOH(pH 7.4), 100 mM potassium acetate, 12.5 mM magnesium acetate, 2 mMDTT, 1 Complete Protease Inhibitor cocktail (EDTA-free, Roche),0.5 mM AEBSF, 5 mg/ml of pepstatin, and 1 mg/ml of heparin]. Freezethe cell suspension in liquid nitrogen and break the cell beads using a chilledcoffee grinder as described above in the section on eIF5B purification. Aftergrinding the cells, dissolve the cell powder completely in 100 ml of Ribo-some Buffer (remember to allow any dry ice in the cell powder to sublimeprior to capping any of the extracts).
Remove any unbroken cells and cell debris by centrifugation at15,000 rpm for 20 min in a Sorvall SS34 rotor, and then transfer the clarifiedsupernatant to 25-ml polycarbonate tubes designed for use in the BeckmanType70 Ti rotor (21 ml of lysate per tube). Next, insert a 5-ml serologicalpipette into the tube and slowly add 3 ml of ice-cold sucrose cushion[30 mM HEPES–KOH (pH 7.4), 100 mM potassium acetate, 12.5 mMmagnesium acetate, 2 mM DTT, and 1M sucrose] to the bottom of thetube. Pellet the 80S ribosomes through the sucrose cushion by centrifuga-tion at 40,000 rpm for 3 h in a Type70 Ti rotor. Discard the supernatant anddissolve the ribosome pellet in 5-ml of Ribosome Buffer, and then stir for1 h on ice. Clarify the ribosome solution by centrifugation at 12,000 rpmfor 10 min in a microcentrifuge, and then layer 0.5 to 1.0 ml of thesupernatant on pre-chilled 37-ml 5–40% sucrose gradients (prepared usingRibosome Buffer). Subject the gradients to velocity sedimentation at32,000 rpm for 6 h (or 20,000 rpm for 14 h) and at 4 in a BeckmanSW32 rotor. Fractionate the gradient while monitoring the absorbance atA254, and pool all fractions containing the 80S ribosomes. Pellet the ribo-somes in the 80S pool by centrifugation at 25,000 rpm for 24 h at 4 in aType70 Ti rotor. Finally dissolve the 80S ribosome pellet in 20 mM

196 Byung-Sik Shin and Thomas E. Dever
HEPES–KOH (pH 7.4), 50 mM potassium acetate, 2.5 mM magnesiumacetate, 2 mM DTT, and 250 mM sucrose. Quantify the concentration of80S ribosomes by measuring the A260 of the solution (we use the estimatethat 1.0 A260 unit corresponds to 20 nM 80S ribosomes).
2.5.2. Purification of reassociated 80S ribosomes from yeastFor some assays, including the eIF5B ribosome-dependent GTPase assay,we have found that reassociated 80S ribosomes prepared from purified 40Sand 60S subunits work better than 80S ribosomes prepared as described inthe previous section. The reassociated 80S ribosomes appear to have fewercontaminants, contributing to lower background activities in the assays.Incubate the strain F353 in 6 liters of YPD medium until the A600 ¼ 1.0 to1.5, and then harvest and break the cells, and pellet the ribosomes through asucrose cushion as described above for purification of crude 80S ribosomes.Dissolve the ribosomal pellet in 6 ml of Subunit Separation Buffer [50 mMHEPES–KOH (pH 7.4), 500 mM KCl, 2 mMMgCl2, and 2 mM DTT] bystirring on ice for 1 h, and then clarify the solution by pelleting insolublematerial using a microcentrifuge. The A260 of the dissolved ribosomesshould be 50 to 100. Using a 100 mM puromycin stock solution freshlyprepared in DW, add puromycin to a final concentration of 1 mM andincubate the mixture on ice for 15 min, then at 37 for 10 min, and finallyon ice for 10 min. Load 0.5 to 1.0 ml of the ribosome solution on 37-ml 5%to 20% sucrose gradients (prepared using Subunit Separation Buffer), andsubject the gradients to centrifugation at 32,000 rpm for 6 h (or 20,000 rpmfor 14 h) in a Beckman SW32 rotor. Fractionate the gradients while moni-toring the absorbance at A260, and separately pool the fractions containingthe 40S and 60S subunits.
To reassociate the subunits, first pellet the subunits by centrifugation at35,000 rpm for 17 h in a Beckman Type45 Ti rotor, discard the superna-tant, and dissolve the ribosomal pellets in Reassociation Buffer [20 mMHEPES–KOH (pH 7.4), 20 mM magnesium acetate, 100 mM KCl, and2 mMDTT]. Then mix the 40S and 60S subunits in a 1:1 ratio of A260 units(the final concentration should be 40 to 140 A260) and incubate at 32 for40 min, and then at 4 for 10 min. To separate the reassociated 80S ribo-somes from the free subunits, load 0.5 to 1.0 ml of the subunit mixture onprechilled 37-ml 5% to 40% sucrose gradients (prepared using ReassociationBuffer), and subject the gradients to centrifugation at 32,000 rpm for 6 h at4 in an SW32 rotor. Fractionate the gradients while monitoring theabsorbance at A260, and pool the fractions containing the 80S ribosomes.Pellet the ribosomes by centrifugation at 22,000 rpm for 24 h at 4 in aType70 Ti rotor, discard the supernatant, and then dissolve the ribosomepellets in Reassociation Buffer and incubate at 37 for 20 min. Finally,clarify the reassociated 80S ribosome solution in a microcentrifuge, andthen measure the A260 to quantify the concentration of 80S ribosomes.

Structure–Function Analysis of eIF5B 197
2.5.3. Comment
1. Because the subunits are never separated during the purification steps,the crude 80S ribosomes purified by the first method are contaminatedwith ribosome-bound translation factors (both initiation and elongationfactors), mRNAs, and tRNAs. However, the crude 80S ribosomes areuseful for the eIF5B ribosome-binding assay described in the nextsection. In contrast, the reassociated 80S ribosomes are very clean andprovide superior results in the uncoupled eIF5B ribosome-dependentGTPase assay. We also use the reassociated 80S ribosomes for hydroxylradical mapping of the eIF5B–80S complex.
2.6. Ribosome-dependent uncoupled GTPase assay of eIF5B
The GTPase activity of eIF5B is stimulated in the presence of 80S ribo-somes, but little activity is observed in the presence of either 40S or 60Ssubunits (Acker et al., 2006; Pestova et al., 2000; Shin et al., 2002).In addition, kinetic analyses revealed a biphasic nature of the eIF5B GTPaseactivity in the context of ribosomal subunit joining. An early phase of robustGTPase activity was followed by a weaker phase that matched the rate ofGTP hydrolysis observed with eIF5B and isolated 80S ribosomes (Ackeret al., 2006). Thus, eIF5B rapidly hydrolyzes GTP in assays coupling eIF5BGTPase activity with ribosomal subunit joining, and eIF5B hydrolyzesGTP with slower kinetics in assays uncoupled to subunit joining. Here, wedescribed the uncoupled eIF5B ribosome-dependent GTPase assay (theprotocol for the coupled assay is described by Acker et al., 2006). Thoughunlinked to translation initiation, the uncoupled GTPase assay is valuable forexamining the impact of eIF5B and ribosome mutations on eIF5B GTPaseactivity, and it is much simpler to perform (requiring only eIF5B and 80Sribosomes) than the coupled assay.
Reaction mixtures contain 1 mM eIF5B, 0.4 mM 80S ribosomes, andlimited amounts of [g-33P]GTP (typically 50 nM) in 1 Reaction Buffer(30 mM HEPES–KOH [pH 7.4], 50 mM potassium acetate, 2.5 mM mag-nesium acetate, and 2 mM DTT). Prior to the assay, prepare two 6-mlsolutions, the first containing 2 mM eIF5B and 0.8 mM 80S ribosomes in1 reaction buffer and the second containing 100 nM [g-33P]GTP in 1reaction buffer. Preincubate the two mixtures in a 30 water bath for 2 min,and then start the reaction bymixing the two solutions. Quench the reactionat various times by transferring 1-ml aliquots of the reaction mixture to tubescontaining 3 ml of Stop Solution (50 mM EDTA in 90% formamide).
The hydrolysis of GTP is monitored by polyethylenimine cellulose thin-layer chromatography (PEI-TLC, Selecto Scientific, Georgia). Prerun a10 cm 10 cm PEI-TLC plate with DW for 10 min and then air dry.

198 Byung-Sik Shin and Thomas E. Dever
Spot 1-ml aliquots of the quenched reactions at 1 cm from the bottom of theTLC plate. Allow the spots to dry completely, and then run the TLC for10 min using a buffer containing 0.8 M lithium chloride and 0.8 M aceticacid. Dry the TLC plate completely, expose for phosphorimage analysis orautoradiography, and quantify the amounts of GTP and Pi in each sample.To determine the rate constant for GTP hydrolysis, plot the fraction of Pireleased [Pi]/([Pi]þ [GTP]) as a function of the quench time (in seconds).When calculating the fraction of Pi released in the reactions, take intoaccount the amounts of Pi released in control reactions lacking ribosomesor eIF5B. We use the program KaleidaGraph (Synergy Software) to fit theresults to the single exponential equation: A[1 – exp(–kt)], in which A is theamplitude and k is the rate constant. Typically in our assays, eIF5B hydro-lyzes GTP in the presence of 80S ribosomes with a rate constant of0.06 sec1.
2.6.1. Comment
1. The ribosome-dependent uncoupled GTPase activity of eIF5B is dra-matically inhibited by increasing concentrations of potassium acetate orKCl. For example, the GTPase activity of WT eIF5B is decreased morethan 10-fold when the concentration of KCl (or potassium acetate) isincreased from 50 mM to 100 mM. At this time it is unclear whether thissalt dependence reflects impacts on eIF5B binding to 80S ribosomes,eIF5B catalytic function, or the association of 40S and 60S subunits togenerate 80S ribosomes. However, as 40S and 60S subunits shouldremain associated in 100 mM KCl, we disfavor the latter possibility.
2.7. eIF5B ribosome-binding assay
The 80S ribosome binding activity of eIF5B is regulated by the guaninenucleotide bound to the factor. In the presence of GTP, eIF5B binds to 80Sribosomes with high affinity, and the binding is decreased in the presence ofGDP or no nucleotide (Pestova et al., 2000; Shin et al., 2002). We adaptedthe bacterial IF2–70S ribosome-binding assay of Moreno et al. (1998) tomonitor eIF5B binding to 80S ribosomes pelleted through a sucrose cush-ion (Fig. 9.2). To conserve on reagents, and for convenience, we use atabletop ultracentrifuge for this assay. In 50-ml reactions, mix 0.5 mM eIF5Bwith 0.5 mM 80S ribosomes (crude 80S) in Binding Buffer [30 mMHEPES–KOH (pH 7.4), 100 mM potassium acetate, 2.5 mM magnesiumacetate, 2 mM DTT, and 2 mM guanine nucleotide], and incubate at 25for 5 min. Aliquot 50 ml of a 10% sucrose solution (containing 2 mM GTP,GDP, GDPNP, or no nucleotide, as appropriate) to mini (1.0-ml) polycar-bonate tubes (for the Beckman TLA 120.2 rotor) and then chill the tubes onice. Load the entire (50-ml) binding reaction on top of the ice-cold sucrose
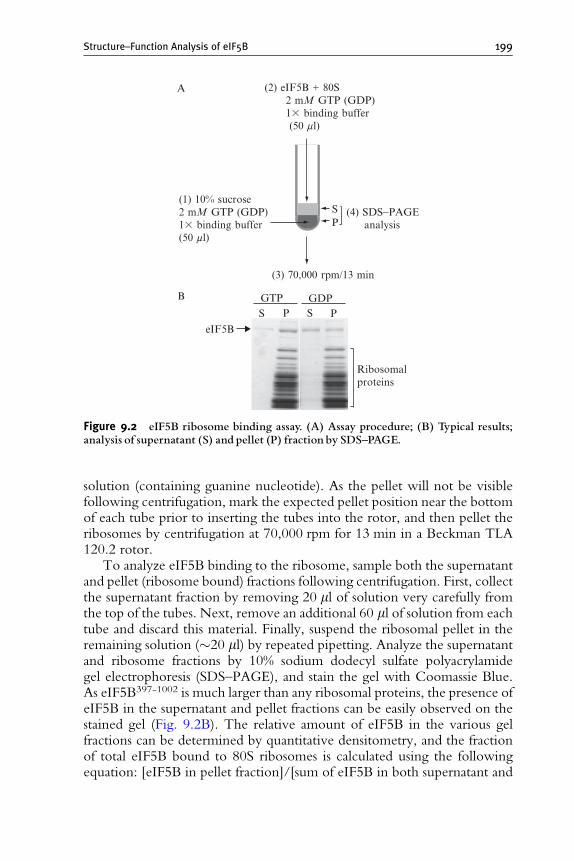
S P S P
GTP GDP
eIF5B
Ribosomalproteins
(1) 10% sucrose2 mM GTP (GDP)1 binding buffer(50 ml)
(2) eIF5B + 80S 2 mM GTP (GDP) 1 binding buffer (50 ml)
(3) 70,000 rpm/13 min
SP
(4) SDS−PAGE analysis
A
B
Figure 9.2 eIF5B ribosome binding assay. (A) Assay procedure; (B) Typical results;analysis of supernatant (S) and pellet (P) fraction by SDS^PAGE.
Structure–Function Analysis of eIF5B 199
solution (containing guanine nucleotide). As the pellet will not be visiblefollowing centrifugation, mark the expected pellet position near the bottomof each tube prior to inserting the tubes into the rotor, and then pellet theribosomes by centrifugation at 70,000 rpm for 13 min in a Beckman TLA120.2 rotor.
To analyze eIF5B binding to the ribosome, sample both the supernatantand pellet (ribosome bound) fractions following centrifugation. First, collectthe supernatant fraction by removing 20 ml of solution very carefully fromthe top of the tubes. Next, remove an additional 60 ml of solution from eachtube and discard this material. Finally, suspend the ribosomal pellet in theremaining solution (20 ml) by repeated pipetting. Analyze the supernatantand ribosome fractions by 10% sodium dodecyl sulfate polyacrylamidegel electrophoresis (SDS–PAGE), and stain the gel with Coomassie Blue.As eIF5B397-1002 is much larger than any ribosomal proteins, the presence ofeIF5B in the supernatant and pellet fractions can be easily observed on thestained gel (Fig. 9.2B). The relative amount of eIF5B in the various gelfractions can be determined by quantitative densitometry, and the fractionof total eIF5B bound to 80S ribosomes is calculated using the followingequation: [eIF5B in pellet fraction]/[sum of eIF5B in both supernatant and

200 Byung-Sik Shin and Thomas E. Dever
pellet fractions]. Note that two control reactions are required for everyribosome-binding assay: first, a binding reaction without eIF5B, and sec-ond, a binding reaction without ribosomes. As the results vary betweenseparate trials, the assay should be repeated several times (>3) to obtainreliable results.
3. Future Directions
As stated earlier, the molecular genetic techniques described here areapplicable both for nonessential genes like FUN12 and for the essentialgenes encoding most translation factors. Moreover, the approach to screenfor intragenic suppressors will be generally applicable for proteins function-ing in many cellular processes. The ability to test structural predictions in anin vivomodel, combined with the use of unbiased genetic screens to identifyimportant residues and domains in proteins, highlights the power of theyeast system as a tool to study the structure–function properties of proteins.With the current emphasis to acquire the 3-D structure of a large variety ofproteins, we believe that the molecular genetic structure–function studieswe have utilized to study eIF5B can serve as a model for the study of otheryeast proteins or heterologous proteins like the mammalian kinase PKR thatare functional in yeast cells (Dey et al., 2005).
REFERENCES
Acker, M. G., Shin, B. S., Dever, T. E., and Lorsch, J. R. (2006). Interaction betweeneukaryotic initiation factors 1A and 5B is required for efficient ribosomal subunit joining.J. Biol. Chem. 281, 8469–8475.
Algire, M. A., Maag, D., Savio, P., Acker, M. G., Tarun, S. Z., Jr., Sachs, A. B., Asano, K.,Nielsen, K. H., Olsen, D. S., Phan, L., Hinnebusch, A. G., and Lorsch, J. R. (2002).Development and characterization of a reconstituted yeast translation initiation system.RNA 8, 382–397.
Algire, M. A., Maag, D., and Lorsch, J. R. (2005). Pi release from eIF2, not GTP hydrolysis,is the step controlled by start-site selection during eukaryotic translation initiation. Mol.Cell 20, 251–262.
Boeke, J. D., Trueheart, J., Natsoulis, G., and Fink, G. R. (1987). 5-Fluoroorotic acid as aselective agent in yeast molecular genetics. Methods Enzymol. 154, 164–175.
Choi, S. K., Lee, J. H., Zoll, W. L., Merrick, W. C., and Dever, T. E. (1998). Promotion ofmet-tRNAiMet binding to ribosomes by yIF2, a bacterial IF2 homolog in yeast. Science280, 1757–1760.
Dey, M., Cao, C., Dar, A. C., Tamura, T., Ozato, K., Sicheri, F., and Dever, T. E. (2005).Mechanistic link between PKR dimerization, autophosphorylation, and eIF2alphasubstrate recognition. Cell 122, 901–913.
Fringer, J. M., Acker, M. G., Fekete, C. A., Lorsch, J. R., and Dever, T. E. (2007). Coupledrelease of eukaryotic translation initiation factors 5B and 1A from 80S ribosomes followingsubunit joining. Mol. Cell Biol. 27, 2384–2397.

Structure–Function Analysis of eIF5B 201
Hinnebusch, A. G. (2000). Mechanism and regulation of initiator methionyl-tRNA bindingto ribosomes. In ‘‘Translational Control of Gene Expression’’ (N. Sonenberg,J. W. B. Hershey, and M. B. Mathews, eds.), pp. 185–243. Cold Spring HarborLaboratory Press, Cold Spring Harbor, NY.
Iizuka, N., Najita, L., Franzusoff, A., and Sarnow, P. (1994). Cap-dependent and cap-independent translation by internal initiation of mRNAs in cell extracts prepared fromSaccharomyces cerevisiae. Mol. Cell Biol. 14, 7322–7330.
Lee, J. H., Choi, S. K., Roll-Mecak, A., Burley, S. K., and Dever, T. E. (1999). Universalconservation in translation initiation revealed by human and archaeal homologs ofbacterial translation initiation factor IF2. Proc. Natl. Acad. Sci. USA 96, 4342–4347.
Lee, J. H., Pestova, T. V., Shin, B. S., Cao, C., Choi, S. K., and Dever, T. E. (2002).Initiation factor eIF5B catalyzes second GTP-dependent step in eukaryotic translationinitiation. Proc. Natl. Acad. Sci. USA 99, 16689–16694.
Maag, D., Fekete, C. A., Gryczynski, Z., and Lorsch, J. R. (2005). A conformational changein the eukaryotic translation preinitiation complex and release of eIF1 signal recognitionof the start codon. Mol. Cell 17, 265–275.
Mitchell, D. A., Marshall, T. K., and Deschenes, R. J. (1993). Vectors for the inducibleoverexpression of glutathione S-transferase fusion proteins in yeast. Yeast 9, 715–722.
Moreno, J. M., Kildsgaard, J., Siwanowicz, I., Mortensen, K. K., and Sperling-Petersen, H. U. (1998). Binding of Escherichia coli initiation factor IF2 to 30S ribosomalsubunits: A functional role for the N-terminus of the factor. Biochem. Biophys. Res.Commun. 252, 465–471.
Pestova, T. V., Lomakin, I. B., Lee, J. H., Choi, S. K., Dever, T. E., and Hellen, C. U.(2000). The joining of ribosomal subunits in eukaryotes requires eIF5B. Nature 403,332–335.
Roll-Mecak, A., Cao, C., Dever, T. E., and Burley, S. K. (2000). X-Ray structures of theuniversal translation initiation factor IF2/eIF5B. Conformational changes on GDP andGTP binding. Cell 103, 781–792.
Sherman, F. (1991). Getting started with yeast. Methods Enzymol. 194, 3–21.Shin, B. S., Maag, D., Roll-Mecak, A., Arefin, M. S., Burley, S. K., Lorsch, J. R., and
Dever, T. E. (2002). Uncoupling of initiation factor eIF5B/IF2 GTPase and translationalactivities by mutations that lower ribosome affinity. Cell 111, 1015–1025.
Shin, B. S., Acker, M. G., Maag, D., Kim, J. R., Lorsch, J. R., and Dever, T. E. (2007).Intragenic suppressor mutations restore GTPase and translation functions of a eukaryoticinitiation factor 5B switch II mutant. Mol. Cell Biol. 27, 1677–1685.
Sikorski, R. S., and Boeke, J. D. (1991). In vitro mutagenesis and plasmid shuffling: Fromcloned gene to mutant yeast. Methods Enzymol. 194, 302–318.
Strathern, J. N., and Higgins, D. R. (1991). Recovery of plasmids from yeast into Escherichiacoli: Shuttle vectors. Methods Enzymol. 194, 319–329.
Tarun, S. Z., Jr., and Sachs, A. B. (1995). A common function for mRNA 50 and 30 ends intranslation initiation in yeast. Genes Dev. 9, 2997–3007.

C H A P T E R T E N
M
IS
*
ethods
SN 0
DepaHealtDepaWorcDepaUniv
The Use of Fungal In VitroSystems for StudyingTranslational Regulation
Cheng Wu,* Nadia Amrani,† Allan Jacobson,† and
Matthew S. Sachs*,‡
Contents
1. In
in
076
rtmh anrtmeestertmeersit
troduction
Enzymology, Volume 429 # 2007
-6879, DOI: 10.1016/S0076-6879(07)29010-X All rig
ent of Environmental and Biomolecular Systems, OGI School of Science and Engineerd Science University, Beaverton, Oregonnt of Molecular Genetics and Microbiology, University of Massachusetts Medical Scr, Massachusettsnt of Molecular Microbiology and Immunology, School of Medicine, Oregon Healthy, Portland, Oregon
Else
hts
ing
hoo
and
204
2. M
ethods and Discussion 2042
.1. M ethod set 1 2042
.2. M ethod set 2 2122
.3. E xamples of the method 2183. S
ummary 222Ackn
owledgments 223Refe
rences 223Abstract
The use of cell-free systems enables biochemical determination of factors
and mechanisms contributing to translational processes. The preparation
and use of cell-free translation systems from the fungi Saccharomyces
cerevisiae and Neurospora crassa are described. Examples provided illustrate
the use of these systems, in conjunction with luciferase assays, [35S]Met
incorporation, and primer-extension inhibition (toeprint) analyses, to assess
the translational effects of upstream open reading frames and premature
termination codons.
vier Inc.
reserved.
, Oregon
l,
Science
203
204 Cheng Wu et al.
1. Introduction
Eukaryotic cell-free in vitro translation systems that faithfully synthesizepolypeptides when programmedwithmRNAhave been inwide use since the1970s, when soluble systems derived fromwheat germ (Roberts and Paterson,1973) and rabbit reticulocytes (Pelham and Jackson, 1976) were described.Detailed protocols for the preparation of each have appeared in this series (e.g.,Anderson et al., 1983; Erickson and Blobel, 1983; Jackson and Hunt, 1983).Procedures adapted from those used to prepare wheat germ extracts have ledto the development of cap- and poly(A)-dependent cell-free translationextracts from Saccharomyces cerevisiae (Iizuka and Sarnow, 1997; Iizuka et al.,1994; Sachs et al., 2002; Tarun and Sachs, 1995) and Neurospora crassa (Wangand Sachs, 1997a,b). Here we provide detailed methods for the preparationand use of extracts from these two fungi. The assays described include themeasurement of luciferase enzyme activity, the mapping of ribosomeson mRNA templates by primer-extension inhibition (toeprinting), and thelabeling of translation products with [35S]Met.
2. Methods and Discussion
2.1. Method set 1
Method set 1 is used in the experiments shown in Figs. 10.1 through 10.3.All the water used in reactions, and reagent solutions that do not containTris, are treated with diethylpyrocarbonate (DEPC) to inactivate ribonu-cleases. DEPC is added to a concentration of 0.1% to water or reagentsolutions, and after at least 12 h has elapsed, the DEPC is inactivated byautoclaving. Unless otherwise noted, reagent solutions are stored at –80.
2.1.1. Buffers
Transcription buffer (5): 200 mM Tris–HCl, pH 7.5, 30 mM MgCl2,10 mM spermidine, 50 mM NaCl.
Buffer A: 30 mMHEPES-KOH, pH 7.6, 100 mM potassium acetate, 3 mMmagnesium acetate; 2 mM dithiothreitol (DTT). This is freshly preparedbefore use from concentrated stock solutions that are stored at 4 exceptfor DTT, which is stored at –20.
0.1 M phenylmethylsulfonyl fluoride (PMSF) stock: 1 g PMSF in 57.4 mlisopropanol, stored at room temperature; it is added immediately prior touse to buffers that require it.
Protease inhibitors (20): 500 mg/ml p-amidinophenylmethylsulfonyl fluo-ride, 100 mg/ml each of pepstatin A, antipain, chymostatin, and leupeptinin water.

1
0.8
0.6
Rel
ativ
e lu
cife
rase
exp
ress
ion
0.4
0.2
0WT D13N D13NWT
10 mM Arg500 mM Arg
∆AUG
Figure 10.1 The effects of uORF regulation of translation in vitro can be measured byluciferase reporter activity. Micrococcal nuclease-treated N. crassa translation reactionmixtures (20 ml) were programmedwith equal amounts (12 ng) of synthetic S. cerevisiaeCPA1-LUC RNA transcripts and incubated at 25 for 20 min. The CPA1-LUC tran-scripts contained either the wild-type (WT) or D13NuORF in thewild-type initiationcontext or the improved initiation context ("), or theAUG toAUUmutation that elimi-nates the uORF start codon (DAUG). All reactions containedmRNAspecifyingRenillaluciferase as an internal control. Reaction mixtures contained either 10 mM Arg or500 mMArg as indicated and10 mMeachof the other19 amino acids.The results obtainedfrom three independent translation reactions are shown. Firefly luciferase activity wasnormalized toRenilla luciferase activity and expressed as a ratio of normalized activityat a given Arg concentration relative to the normalized activity obtained from the con-struct lacking the CPA1 uORF start codon (i.e., the average value of firefly enzymeactivity in reactionmixtures containing10 mMArg is unity).
Fungal In Vitro Translation Systems 205
Energy mix (10): 10 mM ATP, 2.5 mM GTP, 250 mM creatinephosphate.
Common buffer (40): 400 mM HEPES-KOH, pH 7.6, 40 mM DTT.Variable buffer (10): 22.5 mMmagnesium acetate, 1 M potassium acetate.Reverse transcription buffer (5): 250 mM Tris–HCl, pH 8.0, 375 mMKCl, 50 mM MgCl2.
Cycloheximide: 10 mg/ml in water.Edeine: Obtained from the National Cancer Institute Developmental Ther-apeutics Program (Compound NSC153112); we prepare a 20 mM stockfrom 50 mg as an oily dispersion in water.
Sodium dodecyl sulfate–polyacrylamide gel electrophoresis (SDS–PAGE)loading buffer (5): 250 mM Tris–HCl, pH 6.8, 10% SDS, 50% glycerol,0.5% bromophenol blue, 500 mMDTT. The DTT is added immediatelyprior to use from a stock solution stored at –20; buffer lacking DTT isstored at room temperature.

WTArg
C T AG C TAG C TAG C TAG C T AG
− +WT
− +D13N
− +D13N
− + -RN
A-E
XT
∆AUG− +
Figure 10.2 Toeprint analyses of initiation and termination of polypeptide synthesis.Micrococcal nuclease-treated N. crassa translation reaction mixtures (20 ml ) were pro-grammed with equal amounts (120 ng) of synthetic S. cerevisiae CPA1-LUCRNAtran-scripts and incubated at 25 for 20 min.The CPA1-LUC transcripts used were the sameas in Fig.10.1. Reaction mixtures contained either 10 mMArg (^) or 2000 mMArg (þ) asindicated and 10 mM each of the other 19 amino acids. Radiolabeled primer ZW4 (19)was used for primer extension analysis and for sequencing of eachCPA1-LUC template(sequencing was accomplished using the Thermo Sequenase Cycle Sequencing Kit[USB]). The nucleotide complementary to the dideoxynucleotide added to eachsequencing reaction is indicated below the corresponding lane (C0,T0, A0, andG0) so thatthe sequence of the template can be directly deduced; the 50- to-30 sequence reads fromtop to bottom. Reading from top to bottom, the positions of the uORF start and stopcodons, and the LUC start codon, are boxed in the nucleotide sequence (theAUU in theDAUG construct is boxed with broken lines), and the position of the nucleotide changeat uORFcodon-13 thatdetermineswhether it encodesD13 (GAC) orN13 (AAC) is indi-cated by solid or open circles, respectively. Primer extension products corresponding tothe mRNA start 50-end are indicated by a star, the uORF start codon by an asterisk,the duORF stop codon by an open triangle, and the LUC start codon by a solid triangle.Control samples of RNA in reaction mixtures without extract (^EXT) and reactionmixtures containing extract but notmRNA (^RNA) are indicated.
206 Cheng Wu et al.

Met1−9
NA
B Edeine
2
26.6
17.0
6.5
3.5
1.1
Met9AAPwt-globin-AAPwt-LUC
3 4 5 6 8 10 12
C Edeine
2
Met9AAPwt-globin-AAPwt-LUC
3 4 5 6 8 10 12
I F
AAP12−33
AAP101−123
LUC124−215
a-globin37−98
Figure 10.3 Pulse^chase analyses of nascent polypeptide synthesis using [35S]Met inN. crassa cell-free extracts. (A) The Met9-AAP-globin-AAP-LUC construct was used(Fang et al., 2004). Arrows indicate where wild-type AAPAsp codons were changed toAsn (D12N mutation in the AAP). Filled arrowhead N indicates the C-terminus of theMet9-AAP polypeptide intermediate; open arrowhead I, the C-terminus of the Met9-AAP-globin-AAP intermediate; and asterisk F, the C-terminus of the completed poly-peptide. Transcripts (1.2 mg) specifying (B) Met9-AAPw-globin-AAPw-LUC or(C) Met9-AAPm-globin-AAPm-LUC were translated in independent 200 ml N. crassatranslation reaction mixtures supplementedwith 2 mM arginine. Edeine (final concen-tration of 1 mM) was added at 2 min (arrow) to each and 10-ml aliquots of each reactionmixture were removed at the indicated time points for analysis by SDS^PAGE (Fanget al., 2002). The arrowheads and asterisks indicate the positions where intermediateMet9-AAP; I, the polypeptide intermediate Met9-AAP-globin-AAP; and F, thefull-length polypeptidemigrate in these gels.
Fungal In Vitro Translation Systems 207
Toeprint gel loading buffer (2): 0.05% bromophenol blue, 0.05% xylenecyanol FF, 20 mM ethylenediaminetetraacetic acid (EDTA), pH 8.0,91% formamide; stored at –20.
2.1.2. Strains usedThe N. crassa strain is the standard laboratory wild-type designated OakRidge 74-OR23-IVA (Fungal Genetics Stock Center strain #2489). TheS. cerevisiae strain is MBS [MATa ade2-1 his3-11,15 leu2-3,112 trp1-1 ura3-1can1-100 (rhoþ) L-o, M-o] (see Iizuka et al., 1994).
208 Cheng Wu et al.
2.1.3. In vitro transcriptionReactions (100 ml) to synthesize capped RNA contain 4 mg of linearizedDNA template, 40 mM Tris–HCl, pH 7.5, 6 mMMgCl2, 2 mM spermidine,10 mMNaCl, 10 mMDTT, 0.5 mM each of ATP, CTP, and UTP, 2 mCi of[a-32P]UTP, 0.05 mM GTP, 0.5 mMm7G(50)ppp(50)G, 80 units of RNasin,and 100 units of T7, T3, or SP6 RNA polymerase as appropriate. Theradiolabel is used to quantify yields of RNA. Therefore, in all experiments, acommon stock of reactants without template DNA is prepared and aliquotedto separate tubes to which template DNA is then added. This ensures thatRNAs prepared in parallel will be radiolabeled with [a-32P]UTP to the samespecific activity. Reaction mixtures are incubated for 1.5 h at 37. The DNAtemplate is then removed by adding 1 unit of RQ1DNase I and incubation at37 for an additional 15 min. Water (35 ml) and 5 M NH4OAc (15 ml) areadded, and each reaction mixture is extracted with 150 ml of phenol:chloro-form (50:50), and then with 150 ml of chloroform. The aqueous phase istransferred to a fresh 1.6-ml Eppendorf tube and the mRNA is precipitatedby adding 1 volume of isopropanol, chilling for at least 15 min at –20, andcentrifugation at 4 for 20 min in an Eppendorf 5415D minicentrifuge at13,200 rpm. The supernatant is carefully removed and the pellet is washedonce with 70% ethanol at room temperature, briefly vacuum dried, and thenresuspended in 50 ml of water. mRNAs are stored in aliquots at –80, takinginto account our observation that multiple freeze–thaw cycles adversely affectthe translatability of the mRNA.
The amount of RNA synthesized in each reaction is determined bymeasuring the incorporation of radiolabeled nucleotide. Accurate quantita-tion can be achieved by polyethylenimine (PEI) thin layer chromatography(Selecto PEI cellulose #11078) using 0.75 M potassium phosphate, pH 3.5[RNA remains at the origin (Cashel et al., 1969)] or TCA precipitation(Sambrook and Russell, 2001). The fraction of [a-32P]UTP incorporated isused to calculate the amount of RNA synthesized. Specifically, the yields ofRNA obtained in parallel reactions are determined by considering the sizeof each RNA, the fraction of U in each, and the fraction of radiolabelednucleotide incorporated (the latter acts as a measure of the total amountof nucleotide incorporated). The integrity of the RNA is evaluated byethidium bromide staining following electrophoresis of a sample (at least180 ng of RNA) in formaldehyde agarose gels (Gaba et al., 2005).
2.1.4. Preparation of N. crassa cell-free extracts for translationGeneral methods for culturingN. crassa can be found at the Fungal GeneticsStock Center website (www.fgsc.net/Neurospora/NeurosporaProtocolGuide.htm) (see also Davis and de Serres, 1970). Conidia are germinatedin growth medium (Vogel’s minimal mediumþ 1.5% sucrose) at a concen-tration of 1 107 conidia/ml. Specifically, a 1-liter culture in a 2-liter

Fungal In Vitro Translation Systems 209
Erlenmeyer flask is incubated at 32 with orbital shaking (200 rpm) until90% of the conidia show germ tubes (typically 5 to 6 h). The germlings areharvested by vacuum filtration onto 9-cmWhatman 541 filter paper using aBuchner funnel. The filter paper with the germlings is placed in a sterile50-ml conical screwcap tube with 40 ml of fresh growth medium; thegermlings are resuspended by vigorous hand-shaking and transferred to1 liter of fresh prewarmed growth medium in a 2-liter flask, incubated anadditional 1 h at 32 with orbital shaking, and harvested again. Followingharvesting, germling pads are rinsed on the filter with ice-cold buffer A,then peeled from the filter and weighed; a typical yield from the wild-typestrain is 12 g. The pad is then frozen directly in liquid nitrogen. In the coldroom, liquid nitrogen-frozen germlings are powdered in the presence ofliquid nitrogen using a mortar (Coors #60322, 13 cm OD) and matchingpestle (the mortar and pestle are precooled to –80 to help prevent breakagewhen liquid nitrogen is added). Ice-cold buffer A (0.5 ml/g of wet weight)is added at intervals when the liquid nitrogen vaporizes away. The mortar isrefilled approximately halfway with liquid nitrogen and grinding iscontinued until a fine powder is obtained. The powdered mixture of cellsand buffer A are carefully transferred to a 50-ml polycarbonate centrifugetube using a wide-bore funnel, allowed to thaw on ice, and then centrifugedat 4 for 15 min at 16,000 rpm in an SS34 rotor. The supernatant is carefullycollected with a sterile Pasteur pipette, avoiding both the pellet and the fattyupper layer, and placed in a fresh 15-ml conical tube that is maintained onice. Typically, 8 ml of extract is recovered.
Small molecules are removed from the extract by centrifugation at 4through Zeba Desalt Spin Columns (Pierce 89894) using an Eppendorf5810R centrifuge and rotor A-4-62. Specifically, at 4, two 10-ml columnsare preequilibrated with buffer A by first centrifuging the columns at1000g for 2 min to remove the storage buffer; the column is then washedfour times with 5 ml of buffer A, each time removing the buffer bycentrifugation as above. Extract is loaded onto the columns (4 ml/column),which are then centrifuged at 1000g for 2 min. The eluates are pooled andthis material is theN. crassa extract used for cell-free translation experiments.Alternatively, small molecules can be removed from the extracts by chro-matography through Sephadex G-25 columns (described below). In eithercase, protease inhibitors are added to 1 final concentration to the extractsfollowing the removal of small molecules. For storage, aliquots of extract(200 ml) are put into 1.6-ml Eppendorf tubes, frozen with liquid nitrogen,and stored at –80.
2.1.5. Preparation of S. cerevisiae cell-free extracts for translationGeneral microbiological methods for S. cerevisiae cultures are as described(Burke et al., 2000). A 100 ml starter culture in YPD, begun from a singlecolony, is grown at 30 for 24 h with orbital shaking (200 rpm). This is used

210 Cheng Wu et al.
to inoculate 800 ml of YPD in a 2-liter Erlenmeyer flask at an initial OD600
of 0.03 to 0.06. Cultures are grown at 30 and 200 rpm until they reach anOD600 1.5 (typically 8 h for a wild-type strain).
Cells are harvested by centrifugation at 4 for 5 min at 3000 rpm in aSorvall GSA rotor using four centrifuge bottles. The supernatant is decantedand 15 ml of ice-cold buffer A/8.5% mannitol is added to each of twobottles. The pelleted cells are resuspended by shaking and each transferred toa remaining bottle containing a cell pellet, which is also resuspended. Thecombined cells are transferred to a preweighed 50-ml conical screwcaptube. Cells are collected by centrifugation at 4 in an Eppendorf 5810Rcentrifuge with rotor A-4-62 at 1470g, and washed four additional timeswith 10 ml buffer A/8.5% mannitol by consecutive rounds of gentle resus-pension followed by centrifugation; the final centrifugation is at 2500g.The wet weight of each cell pellet is determined by weighing the tubecontaining the cell pellet and subtracting the predetermined weight of thetube. The cells are resuspended in 1.5 ml of buffer A/8.5% mannitol/0.5 mM PMSF per gram wet cell weight. Resuspended cells are combinedwith 6 the wet cell weight of cold 0.5-mm glass beads (Biospec). In thecold room, cells are lysed by manual shaking for five 1-min periods with1-min cooling on ice between shaking periods. Shaking is performed at arate of two cycles/sec over a 50-cm hand path. The tubes containing celllysates and beads are centrifuged at 4 for 2 min at 650g. This supernatantis then transferred to a sterile 50-ml polycarbonate centrifuge tube using asterile Pasteur pipette, and centrifuged at 4 for 6 min at 18,000 rpm in aSorvall SS34 rotor. The supernatant is collected, taking care to avoid thefatty layer at the top and the cell debris at the bottom of the tube. Smallmolecules are removed from this clarified extract using Zeba Desalt SpinColumns (Pierce) that are preequilibrated with buffer A/0.5 mM PMSFessentially as described for the preparation of N. crassa extracts. Smallmolecules can also be removed by Sephadex G-25 chromatography (seebelow). Aliquots (200 ml) are pipetted into 1.6-ml Eppendorf tubes, frozenwith liquid nitrogen, and stored at –80.
2.1.6. Nuclease treatment of cell-free extractsImmediately prior to assembly of the translation reaction mixtures, 200 ml ofextract is thawed on ice, supplemented with 2 ml of 100 mM CaCl2,and then treated with 10 U of micrococcal nuclease by incubation at 25for 10 min. Then 3 ml of 170 mM ethyleneglycoltetraacetic acid (EGTA)is added to chelate the calcium and thus inhibit the activity of theCa2þ-dependent nuclease, and the mixture is placed on ice. Alternatively,nuclease treatment can be accomplished prior to preparing aliquots ofextracts for freezing by appropriately scaling up the nuclease treatmentprocedure.
Fungal In Vitro Translation Systems 211
2.1.7. Cell-free translation and analyses of translation productsThe procedure for setting up 10 20-ml N. crassa or S. cerevisiae translationreaction mixtures for assaying luciferase activity or for toeprinting is asfollows. The setup can be scaled as appropriate. All components are kepton ice until the reaction incubation is begun. A master solution, composedof 16.8 ml of energy mix, 1.2 ml of creatine phosphokinase (7.5 U/ml), 5 mlof common buffer (40), 20 ml of variable buffer (10), 2 ml of 1 mM 20amino acids, and 1 ml of RNasin (Promega cat. no. 40 U/ml) is combinedwith DEPC-treated water to adjust the volume to 80 ml. The compositionof the variable buffer used for what we define as our ‘‘standard conditions’’is given; different concentrations of Mg2þ and Kþ can be used in thevariable buffer to optimize translation of specific mRNAs (Spevak et al.,2006). For measurements of luciferase activity, the internal control mRNAspecifying Renilla (sea pansy) luciferase is added to this mixture and theamount of added water is reduced correspondingly. This mixture of reac-tants is aliquoted into individual tubes (8 ml/tube) and combined with 2 mlof appropriately diluted mRNA. Then 10 ml of nuclease treated cell-freeextract is added, gently mixed with reactants, and reactions are incubated ina 25 water bath for 20 min and stopped by freezing in liquid N2. Fireflyluciferase activity is determined by adding 5 ml of the thawed reactions to50 ml of the firefly luciferase assay reagent of the Dual Luciferase ReporterAssay System (Promega #E1960), and immediate measurement with aTurner TD-20e luminometer; 50 ml of Renilla luciferase assay reagent isadded, and that enzyme’s activity measured by luminometry.
For [35S]Met labeling of translation products, reaction conditions aresimilar to those described above, except that 10 mCi of [35S]methionine(MP #51001H, >1000 Ci/mmol) is used in each 20-ml reaction, and the1 mM amino acid solution used lacks methionine. After incubation, reac-tions are stopped by adding SDS–PAGE loading buffer. Translation pro-ducts are analyzed by electrophoresis in tricine gels containing a totalconcentration of 4% acrylamide in the stacking gel and 16.5% acrylamidein the separating gel (Schagger and von Jagow, 1987). Autoradiography isperformed with a Phosphor Screen (Amersham).
2.1.8. Preparation of 50-32P-labeled primer for toeprinting andsequencing reactions
Oligodeoxynucleotides are labeled at their 50 termini with T4 polynucleo-tide kinase and [g-32P]ATP. The reaction mixture (100 ml) contains50 pmol of oligodeoxynucleotide, 50 mM Tris–HCl, pH 8.0, 20 mMMgCl2, 4 mM spermidine, 4 mM DTT, 300 mCi [g-32P]ATP (4500 Ci/mmol; MP #38101X), and 10 units of T4 kinase. The primer is first mixedwith Tris–HCl, pH 8.0, and the volume is adjusted to 44 ml; the primer isthen heated at 90 for 3 min and chilled on ice. MgCl2, spermidine, DTT,

212 Cheng Wu et al.
[g-32P]ATP, and water (to bring the final volume to 100 ml) are added; thenkinase is added and the mixture is incubated at 37 for 45 min. EDTA isadded to a final concentration of 50 mM to stop the reaction. Labeledprimers are purified with mini Quick Spin Oligo Columns (Roche#11814397001). An aliquot (1 ml) of purified primer is analyzed by PEIthin layer chromatography (Selecto PEI cellulose #11078) using 0.75Mpotassium phosphate, pH 3.5, followed by PhosphorImager analyses toconfirm purification; radiolabeled oligonucleotide stays at the origin. Theprimer is adjusted to a predicted concentration of 0.5 mM.
2.1.9. Primer extension inhibition (toeprint) assayThe procedure for setting up 10 toeprint reaction mixtures is as follows.A 10 annealing solution contains 20 ml of 5 reverse transcription buffer,10 ml of 0.1M DTT, 10 ml of 2.5 mM dNTPs, 2.5 ml of RNasin (40 U/ml),and 12.5 ml of DEPC-treated water (Vf ¼ 55 ml). Translation reactions areperformed as outlined above except that instead of freezing in liquidnitrogen to stop the translation reaction, 3 ml of translation reaction isadded to 5.5 ml of annealing solution on ice. The mixture is incubated at55 for 3 min. This step is critical for the visualization of ribosomes bytoeprinting. Primer (1 ml) is added and the mixture is incubated at 37 for5 min. Then, 0.5 ml reverse transcriptase (100 U; Invitrogen Superscript III)is added and the sample is incubated at 37 for 30 min. The reactions arestopped by extraction with an equal volume of phenol:chloroform. Follow-ing extraction, the aqueous phase is combined with an equal volume of2 Toeprint gel loading buffer. Samples are heated at 80 to 85 for 5 minand then loaded on a 6% urea-polyacrylamide gel (prerun at 75 W for45 min) and electrophoresed at 65 W until the bromophenol blue dyeruns off the gel. It may be desirable to adjust acrylamide concentrationsand/or running times to optimize the resolution of products in different sizeranges. Autoradiography is performed by Phosphorimaging.
2.2. Method set 2
Unless otherwise specified, protocols and the composition of the buffers aresimilar to those of Method set 1. Method set 2 is used in the experimentsdescribed in Figs. 10.4–10.6. The preparation of extracts described below canbe done in three different stages, with the first step consisting of growing cells(overnight), collecting them the following day, and storage at –80. In thesecond step, cells are lysed and can again be kept at –80 for future use. Thethird step involves thawing the cells and preparing the extracts. The translationand toeprinting reactions can also be done in two separate steps. Translationreactions can be aliquoted and stored at –80, with the toeprinting reactionsdone on a different day using the frozen aliquots. This Method set also

min: 0.5 1 2 3 4 6 8 10 12 15 20 30
1 2 3 4 5 6 7 8 9 10 11 12
+12
+12
UAA-WA
min: 0.5 1 2 3 4 6 8 10 12 15 20 30
13 14 15 16 17 18 19 20 21 22 23 24
UAA
min: 0.5 1 2 3 4 6 8 10 12 15 20 30
1 2 3 4 5 6 7 8 9 10 11 12
+12
UAA-W
+12
B
min: 0.5 1 2 3 4 6 8 10 12 15 20 30
13 14 15 16 17 18 19 20 21 22 23 24
UAA
Figure 10.4 Toeprint analyses of premature termination in yeast wild-type and upf1Dextracts. Premature termination codon toeprints detected during translation of UAA-WandUAAmRNAs in the absence of CHX (Amrani et al., 2004).Translation reactionswere incubated with the mRNA for 0.5 min to 30 min. Primer extension inhibitionassays performed on aliquots of these reactions using oligoprimer #3029 (Amraniet al., 2004) are shown. (A) Wild-type extracts. (B) upf1D extracts. The position of theþ12 toeprint is indicatedwith an arrow.
Fungal In Vitro Translation Systems 213

H20 CHX Edeine
− + − + − +H20 CHX Edeine
− + − + − +
Wild-type sup45-2
+6
+12
Cap analog:
1 2 3 4 5 6 7 8 9 10 11 12
Figure 10.5 CHX addition to yeast wild-type or sup45^2 extracts promotes dissocia-tion of the ribosomes from the termination site. Translation reactions were incubatedfor 4 min, and terminated by incubation with CHX (0.6 mg/ml), edeine (0.5 mM), orwater for 3 min. Positions of the toeprints are shownon the left.
+6
Cap analog: − + − +
Wild
-typ
e
sup3
5-R
419G
1 32 4
Figure 10.6 Toeprints detected in yeast wild-type extracts are absent in sup35-R419Gextracts in the presence of CHX.The position of the þ6 toeprint is indicated with anarrow.
214 Cheng Wu et al.
provides a simple technique for labeling oligoprimers that will be used for bothtoeprinting and DNA sequencing reactions.
2.2.1. Buffers
Transcription buffer (5): Provided by the mMessage mMachine Kit(Ambion).
Buffer C: 20 mM HEPES (pH 7.4 with KOH), 100 mM potassium acetate,2 mM magnesium acetate, 2 mM DTT, 0.5 mM PMSF.
Buffer B: Buffer C þ 20% glycerol.

Fungal In Vitro Translation Systems 215
Translation Buffer (6): 32 mM HEPES (pH 7.4 with KOH), 170 mMpotassium acetate, 3 mM magnesium acetate, 0.75 mM ATP, 0.1 mMGTP, 25 mM creatine phosphate, 0.04 mM complete amino-acid,2.7 mM DTT.
Cycloheximide: 10 mg/ml in 100% ethanol, stored at –20.
2.2.2. Strains usedThe S. cerevisiae strains were MBS [MATa ade2-1 his3-11,15 leu2-3,112trp1-1 ura3-1 can1-100 (rhoþ) L-o, M-o], NA101 [MATa ade2-1 his3-11,15 leu2-3,112 trp1-1 ura3-1 can1-100 upf1::HIS3 (rhoþ) L-o, M-o],NA207 [MATa ade2-1 ura3-1 sup35::ADE2 (pRS316, sup35-R419G,URA3,CEN)], and MT552/8a (MATa sup45-2 ade2-1 ura3-1).
2.2.3. In vitro transcribed mRNAsSynthetic, capped poly(A)-containing RNA is synthesized in vitro fromchimeric genes cloned in a pSP65A vector that includes 65 dT residuesfor transcription of a poly(A) tail (Promega). An SP6 mMessage mMachinekit (Ambion), used according to the manufacturer’s protocol, generatessynthetic mRNA from HindIII-linearized plasmids. RNA yields are quan-tified by spectrophotometry and their integrities are assessed, as in Methodset 1, by formaldehyde agarose gel electrophoresis.
2.2.4. Preparation of extracts2.2.4.1. Growth of culture and cell lysis Yeast cells are streaked onto aYPD plate and incubated at 25 for 36 to 48 h. Starter cultures (100 ml) aregrown at 25 from a single colony and 2-liter YPD cultures are grown in6-liter Erlenmeyer flasks, starting at OD600 ¼ 0.03 to 0.06 by inoculationfrom the starter culture. Growth is continued at the same temperature(110 rpm, gyratory shaker) until the cultures reach OD600 ¼ 3 to 4.
Cultures are harvested in preweighed 0.5-liter bottles and centrifugedfor 10 min at 5000 rpm in a Sorvall GS-3 centrifuge rotor. The resultingsupernatants are discarded and the cell pellets are washed with 300 ml coldwater and centrifuged again at 5000 rpm for 10 min. The cell pellets areresuspended and washed twice in 200 ml of freshly prepared cold buffer C.The suspensions are centrifuged for 10 min at 5000 rpm in the same rotor,the supernatants discarded, and the wet weights of the resulting cell pelletsare determined. The cell pellets are resuspended in one-tenth the volume ofthe wet weight of the pellet using buffer C supplemented with proteaseinhibitor cocktail. The resulting cell suspensions are dripped into liquid N2
to generate small frozen cell pellets in the form of tiny beads. The frozen cellpellets from each culture are transferred to two 50-ml plastic tubes forstorage at –80 until the time of cell breakage.
To lyse cells, a ceramic mortar and pestle are first prechilled at –80.A small amount of liquid N2 is then added to the mortar. The frozen yeast
216 Cheng Wu et al.
pellets from one 50-ml tube are added to the liquid N2 and the mortar ispartially filled with liquid N2. The pellets are crushed using slight pressureand a circular motion. Once most of the liquid N2 has evaporated, themortar is partially filled with liquid N2 and the grinding process repeated,using much greater pressure. Liquid N2 is added as needed and grinding iscontinued until a fine powder is obtained. The grinding of cells from one50-ml tube takes about 15 min. The resulting powder is transferred to anew 50-ml tube and either stored again at –80 or allowed to thaw on ice,typically for 2 to 3 h. The thawed broken cells are transferred to prechilledNalgene 16 75-mm ultracentrifuge tubes and centrifuged at 18,000 rpmfor 15 min in a Beckman Ti50 ultracentrifuge rotor. The supernatant istransferred to a fresh 16 75-mm tube and spun for an additional 15 min at18,000 rpm. The resulting supernatant is removed with a Pasteur pipette,taking care to avoid both the lipid layer at the top and any pellet that hadformed at the bottom of the centrifuge tube.
2.2.4.2. Column chromatography Sephadex G-25 superfine (Sigma,50 ml of suspension autoclaved for 30 min, then cooled to 4) is pouredinto a 2.5 20-cm column and equilibrated with 50 ml buffer C in the coldroom using a Rainin peristaltic pump to control the flow rate (approxi-mately 5.5 ml/h). After equilibration, the sample (4 to 5 ml) is loaded ontothe column, which is then washed with buffer B to elute the sample.Column fractions (0.5 ml) are collected in microfuge tubes. Peak fractionsrepresenting material in the void volume (which appear slightly opaque)typically elute approximately 25 min after loading the sample. The A260 ofeach fraction is determined after diluting 2 ml of sample into 998 ml of water.All fractions with a diluted A260 of 0.4 or higher are pooled. The proteinconcentration of the extract is determined by BCA assay (Pierce) usingbovine serum albumin (BSA) as the standard. Aliquots (50 ml) in 0.5-mlmicrocentrifuge tubes are quickly frozen in liquid N2 for subsequent storageat –80. Columns can be reused after washing with buffer B.
2.2.4.3. Nuclease treatment Immediately prior to assembly of the trans-lation reaction mixtures, 50 ml extract, 1.0 ml 50 mM CaCl2, and 1 mlmicrococcal nuclease (41 U/ml) are combined and incubated at 25 for5 min. Then 1.0 ml of 100 mM EGTA is added to stop the nucleasereaction, and the mixture is placed on ice.
2.2.5. Analyses by translation and toeprinting2.2.5.1. Translation reactions Translation reactions (7.5 ml) containing2.5 ml 6 translation buffer, 1.0 ml creatine phosphokinase (4 mg/ml),0.1 ml RNasin (40 U/ml), 1.0 ml RNA (100 ng), and 2.9 ml of water (or,in those cases where additional components are added, the amount of waterrequired for a final volume of 7.5 ml) are assembled in 0.5-ml Eppendorf

Fungal In Vitro Translation Systems 217
tubes and mixed with 7.5 m l of nuclease-treated extract (different extracts arediluted to the same protein concentration, e.g., 16 mg/ml, using buffer B,after micrococcal nuclease treatment). The translation reactions are incu-bated at 25 for 4 min for a typical toeprinting reaction and are stopped bythe addition of 1.0 m l cycloheximide for 3 min at 25 . The reactions are thenkept on ice and 3-m l aliquots from each reaction are transferred into new 0.5-ml Eppendorf tubes. Routinely, samples are frozen in dry ice and kept at–80 until used for toeprinting reactions. Alternatively, the toeprint proce-dure can follow immediately.
2.2.5.2. Preparation of 32P-labeled primer Labeled oligonucleotideprimers are prepared in a 40 ml reaction containing 16 pmol primer, 4 ml10 kinase buffer, 2 m l T4 polynucleotide kinase (Promega), and 8 ml ATP[g -32P] 6000 Ci/mmol (Perkin Elmer). The reaction is incubated at 37 for30 min and stopped by heating at 65 for 5 min. The sample is then dilutedto 70 ml by the addition of water and purified with a mini Quick SpinColumn (Roche) following the manufacturer’s recommendations. Theradiolabeled primer is then stored at –20 and is suitable for use for up to2 weeks after labeling.
2.2.5.3. Sequencing reaction protocol This protocol is used to generatesequence ladders for toeprinting analyses and uses the DNA Sequencing Kitfrom USB.
1. Prepare denatured DNA in 1.6-ml Eppendorf tubes by mixing 1 mlDNA (0.5 to 1 mg), 3 ml labeled primer, 2.5 m l H2O, and 1 m l dimethylsulfoxide ( DMSO). Heat the mixture at 95 for 3 min then put in dryice.
2. Put 2.5 ml of each ddNTP per well in a microtiter plate (Nalge Nunc)and prewarm at 37 for 3 min.
3. Transfer the tube containing the denatured DNA on ice and add 2 mlof 5 Sequenase reaction buffer, 1 ml 0.1 M DTT, and 2 ml dilutedSequenase DNA polymerase (to prepare the dilution; mix 1 ml enzymewith 8 ml Sequenase dilution buffer).
4. Add 3 ml from the mixture prepared in step 3 to each well that containsthe ddNTP (see step 2). Incubate for 5 min at 37 .
5. Add 4 ml of Stop Solution (from the kit) to each well.6. Heat at 95 for 2 min, then put on ice.7. Load 6 ml per well.
2.2.5.4. Toeprint reaction protocol
1. Prepare Annealing Solution on ice in a 0.5-ml tube [1 Annealing Solu-tion: 1 ml radiolabeled primer, 1.25 ml water, 2 ml 5 reverse transcription

218 Cheng Wu et al.
buffer, 1 ml 0.1 M DTT, 1 ml from mix of 2.5 mM each dNTP, 0.25 mlRNasin (40 U/ml)].
2. Remove the translation reaction aliquots from the freezer and thaw onice. Add 6.5 ml annealing solution to each sample and maintain on ice.
3. Transfer the tubes to 55 for 2 min, then 37 for 5 min.4. Add 0.5 ml (100 units) reverse transcriptase (Superscript III; Invitrogen)
and incubate at 37 for 30 min.5. Stop the reaction by adding 1 ml EDTA (5 mM ) and place sample on ice.6. Extract with an equal volume of phenol:chloroform. Vortex briefly to
mix, centrifuge to separate phases, and add the extracted aqueous phaseto an equal volume of toeprint gel loading buffer.
7. Heat the samples at 95 for 5 min and load on a 6% urea-polyacrylamidegel that has been prerun at 110 W for 45 min.
9. Electrophorese samples at 65 W until the bromophenol blue dye runs offthe gel. If using shark’s-tooth combs, load the toeprint reactions intoevery other lane, placing the loading buffer in the blank lanes. It may bedesirable to adjust acrylamide concentrations and/or running times tooptimize the resolution of products in different size ranges.
2.3. Examples of the method
2.3.1. Analysis of translational regulation by upstream openreading frames
Each of the transcripts of the homologous genesN. crassa arg-2 and S. cerevisiaeCPA1 contains an evolutionarily conserved upstream open reading frame(uORF) encoding the arginine attenuator peptide. The nascent peptide causesribosomes to stall in response to a high level of arginine (Hood et al., 2007 andreferences therein). Regulation by uORFs in the N. crassa in vitro translationsystem is illustrated by analyses of synthetic reporter transcripts containingdifferent permutations of the S. cerevisiae CPA1 uORF (Gaba et al., 2005).In these constructs, the CPA1mRNA 50-leader is present upstream of fireflyluciferase. Figure 10.1 shows the results of assaying firefly luciferase activityderived from translation of synthetic capped and polyadenylated mRNA. ThemRNAs (1) contain the wild-type uORF, (2) contain a uORF with amissense mutation that eliminates Arg-specific regulation (D13N), (3) lackthe uORF because the uORF start codon has been removed by changing theAUG to AUU (DAUG), (4) contain the wild-type uORF in an improvedinitiation context, or (5) contain the D13N uORF in an improved initiationcontext. Firefly luciferase activity is measured and normalized to the activity ofRenilla luciferase that is produced from an internal control mRNA (Wanget al., 1998).
The luciferase data show that the wild-type uORF, but not the D13N orDAUG uORF, results in arginine-specific negative regulation of luciferase

Fungal In Vitro Translation Systems 219
synthesis. Furthermore, improving the initiation context of the uORF startcodon decreases gene expression, regardless of the uORF coding sequence(Fig. 10.1), as expected, because the improved initiation context shouldreduce leaky scanning past the uORF start codon (Gaba et al., 2005).
In theN. crassa cell-free system, but not in the S. cerevisiae cell-free system,it is possible to visualize ribosomes at start codons by toeprinting without theaddition of drugs that block elongation such as cycloheximide (CHX).Toeprinting analyses of the same five CPA1 mRNAs used for luciferaseassays in N. crassa extracts are shown in Fig. 10.2. Controls include toeprintanalyses of extract lacking mRNA (–RNA) and of mRNA incubated in theabsence of extract (–EXT). For each mRNA, the oligonucleotide used fortoeprinting is also used to sequence the DNA template used for mRNAtranscription; this confirms the sequence of each construct and also providesan appropriate sequence ladder for high-resolution mapping of ribosomes atrate-limiting steps in translation. These data show several important aspectsof CPA1 uORF control. First, the wild-type, but not the D13N, sequencecauses stalling at the uORF termination codon when high arginine ispresent, as evidenced by an increased toeprint signal at this site. Additionaltoeprint signals seen within the uORF coding region may represent addi-tional ribosomes whose movement has been impeded by the ribosomestalled at the termination codon. Second, stalling at the termination codonin high arginine is associated with reduced loading of ribosomes at theluciferase start codon. Third, improving the context of the uORF initiationcodon causes increased loading of ribosomes at that codon, relative to thewild-type context, and decreases loading of ribosomes at the downstreamluciferase start codon, independent of the effects of the uORF sequence onarginine regulation; the improved uORF initiation context reduces loadingfor uORFs specifying wild-type or D13N peptides.
2.3.2. Use of [35S]Met to examine polypeptide synthesisThe use of [35S]Met to follow polypeptide synthesis in pulse–chase experi-ments is shown in Fig. 10.3. In this experiment, mRNAs containing theN. crassaAAP near theN-terminus of a polypeptide, and also internally withinthe same polypeptide (Fig. 10.3A), are translated inN. crassa extracts contain-ing a high concentration of arginine. The results of a time-course for aconstruct containing two AAPs with a wild-type sequence, or a constructthat contains in each of the two AAPs the Asp to Asn mutation (N. crassaD12N) that results in loss of arginine-specific regulation, are shown inFig. 10.3B and C, respectively. To accomplish a pulse–chase under in vitroconditions, the constructs contain nine methionine residues (specified by nineconsecutive AUG codons) at their N-terminus, and no internal in-frameAUG codons (these constructs also lack out-of-frame AUG codons), there-fore, placing all of the [35S]Met at the N-terminus. Edeine, which inhibitstranslation initiation but not elongation or termination, is added 2 min after
220 Cheng Wu et al.
the translation reaction commences, resulting in cessation of initiation andallowing the incorporation of radiolabel to be followed by taking appropriatetime points for analyses by SDS–PAGE (in the experiments shown here,edeine was used at a final concentration of 1 mM). These analyses show thateach wild-type AAP domain causes ribosomes to stall in high arginine, andindicate that after stalling, ribosomes resume translation. No arginine-specificstalling is observed within the polypeptide containing two D12N AAPdomains.
2.3.3. Analyses of premature translation termination by toeprintingsamples of yeast translation reactions
The nonsense-mediated mRNA decay (NMD) pathway eliminates mRNAsthat contain premature termination codons (PTCs) and prevents suppressionof genetic nonsense (Amrani et al., 2006a,b; Jacobson, 1996; Pulak andAnderson, 1993). NMD substrates include transcripts that arise from genesinwhich amutation or an error in transcription or processing has given rise to apremature nonsense codon, inefficiently spliced pre-mRNAs that enter thecytoplasm with their introns intact, mRNAs in which the ribosome hasbypassed the initiator AUG and commenced translation further downstream,some mRNAs containing uORFs, mRNAs subject to frameshifting, bicis-tronic mRNAs, transcripts of pseudogenes and transposable elements, andmRNAs with abnormal extensions of their 30-UTRs. Yeast factors thatregulate NMD, identified in screens for translational suppressors or two-hybrid interactors with known factors, are principally those encoded by theUPF1, NMD2(UPF2), and UPF3 genes (Cui et al., 1995; He and Jacobson,1995; He et al., 1997; Lee et al., 1995; Leeds et al., 1991, 1992). They havebeen characterized extensively and are conserved in all eukaryotes examined.Mutations in the yeast UPF/NMD genes not only lead to the stabilization ofnonsense-containing mRNAs, they also promote nonsense suppression(Keeling et al., 2004; Leeds et al., 1992; Maderazo et al., 2000; Stahl et al.,2000; Weng et al., 1996a,b). Mutations in the release factors, Sup35p (eRF3)and Sup45p (eRF1), also promote nonsense suppression (Keeling et al., 2004;Stansfield et al., 1997), and these effects are additive with those of upf/nmdmutations (Keeling et al., 2004), indicating distinct functions in termination.
Tounderstand themechanism bywhich premature translation terminationevents influence mRNA decay, we have used toeprinting techniques tomonitor the position of ribosomes at premature stop codons (Amrani et al.,2004; Sachs et al., 2002;Wang et al., 1999). The yeast can1-100 allele containsa premature UAA codon at position 47 of the CAN1 coding region thateffectively terminates translation and destabilizes the CAN1 mRNA(Maderazo et al., 2000). We constructed a gene fusion encompassing theUAA-containing segment of the can1-100 allele and the firefly LUC codingregion, and used this construct to generate synthetic mRNA (termed UAARNA) as described previously (Amrani et al., 2004). Mutagenesis techniques

Fungal In Vitro Translation Systems 221
were used to create a can1-100 variant with a weak terminator (CAA UAACAA) at codon 47 (termed UAA-W RNA). Translation reactions in wild-type or upf1D extracts were incubated with these mRNAs for 0.5 min to30 min without addition of CHX, and samples were taken for toeprintinganalyses. As shown previously (Amrani et al., 2004), toeprints correspondingto ribosomes stalledwith a stop codon in their A-sites were obtainedwith bothRNAs at the expected position, 12 to 14 nucleotides (nt) downstream of thepremature nonsense codons (Fig. 10.4). However, analysis of those termina-tion toeprints in wild-type extracts shows a lag in the release of the ribosomefrom a weak termination codon (CAA UAA CAA) in the UAA-W mRNAcompared to the strong terminator in the UAA mRNA (AGT UAA GTC)(Fig. 10.4A, compare lanes 10, 11, and 12 with 22, 23, and 24). Likewise,toeprint reactions from upf1D extracts show a delay in the release of theribosomes from UAA-W mRNA compared to UAA mRNA (Fig. 10.4B,compare lanes 10, 11, and 12 with 22, 23, and 24). These data show that theefficiency of translation termination indeed depends on the sequence contextof the termination codon (Bonetti et al., 1995). Interestingly, a comparison ofthe toeprint bands of wild-type extracts with those of upf1D extracts shows adelay in the appearance and disappearance of the bands in upf1D compared tothe wild-type with both mRNAs (see Fig.10. 4A, lanes 1, 2 and 13, 14 andFig. 10.4B, lanes 1, 2 and 13, 14), suggesting a weaker or slower translationreaction in the upf1D extracts. These data show that the toeprint assay can beused to monitor the kinetics of ribosome release from a termination site inboth wild-type and mutant extracts.
2.3.4. Effects of cycloheximide on ribosomal toeprint at atermination site
Aswe showed previously (Amrani et al., 2004), translation ofUAAmRNA inwild-type extracts or sup45-2 mutant extracts for 4 min allows detection ofþ12 toeprints at the premature stop codon (Fig. 10.5, lanes 1 and 7). Thesetoeprint bands were dependent on mRNA translation, because they weresensitive to 7mGpppG, a cap analog that blocks cap-dependent translation incell-free extracts (see Fig. 10.5, lanes 2 and 8). Consistent with previousstudies, we were not able to efficiently toeprint initiator AUGs on the samemRNAs in the absence of drugs that block the elongation process (Dmitrievet al., 2003a,b; Kozak, 1998; Pestova and Hellen, 2003). However, in thepresence of CHX, toeprints were obtained from the AUG initiator codon ofthe UAA mRNA (data not shown). These toeprints reflect 80S ribosomes,centered on AUG codons, protecting 16 to 18 nt 30 of those codons. OtherCHX-dependent toeprints, sensitive to cap analog, were present in closeproximity to the location of the early stop codons (see Fig. 10.5, lanes3 and 4) and these mapped to a position 6 nt downstream of the U of thetermination codon. These toeprints corresponded to ribosomes stalled at the–11 AUG after termination and retroreinitiation events (Amrani et al., 2006a).

222 Cheng Wu et al.
By using extracts from the sup45-2 temperature-sensitive mutant MT552/8a,which carries an Ile-222-Ser substitution in the termination factor eRF1(Stansfield et al., 1995), we also found that the retroreinitiation band isdependent on fully functional eRF1 (see Fig. 10.5, lanes 9 and 10) (Amraniet al., 2006a). Interestingly, the addition of CHX not only blocked thetranslocation of ribosomes from the initiator AUG (thereby allowing visuali-zation of the toeprints), but also displaced the ribosomes from the terminationsite in both the wild-type and sup45-2 extracts. The latter effect is manifestedby the disappearance of the toeprints (see Fig. 10.5, lanes 3 and 9). The effect ofCHX at the termination site is not solely dependent on the lack of availabilityof ribosomes during the 3 min of incubation with the drug since, in thepresence of edeine (an inhibitor of AUG recognition that would block theformation of new 80S ribosomes during the 3 min of incubation), the þ12toeprint bands are still maintained (see Fig. 10.5, lanes 5 and 11). These datashow that CHX has opposing effects on the ribosome, depending on whetherthe latter is positioned at an initiation site or a termination site.
2.3.5. Retroreinitiation after a premature termination requiresfunctional Sup35p
Further elucidation of the mechanism of retroreinitiation (which led to theappearance of theþ6 toeprint in wild-type extracts; Fig. 10.6, lanes 1 and 2)was obtained by analyzing toeprints in extracts made from the sup35-R419G mutant, which carries an Arg-419-Gly substitution in the termina-tion factor Sup35p/eRF3 (Salas-Marco and Bedwell, 2004). Similar tosup45-2 mutant extracts (see Fig. 10.5, lanes 9 and 10), extracts madefrom cells of this mutant give no toeprints comparable to those obtainedin wild-type extracts (see Fig. 10.6, lanes 1 and 3). Ribosomes from sup35-R419G cells show no upstream þ6 toeprint bands and are thus incapable ofscanning after premature termination. The epistasis of the toeprints obtainedin sup45-2 and sup35-R419G extracts to those obtained in wild-typeextracts provides additional evidence that the aberrant toeprints do notarise from leaky scanning and suggests that prior to any reinitiation event,a premature stop codon in the ribosomal A-site must be recognized by thetermination machinery and trigger peptide hydrolysis in the adjoining P site(Song et al., 2000; Stansfield et al., 1997).
3. Summary
Cell-free translation systems enable rapid analyses of the cis- and trans-acting factors that regulate translation. The methods described herein applythis principle to unfractionated extracts from S. cerevisiae and N. crassa, twopowerful genetic systems in which extracts can be prepared from wild-type
Fungal In Vitro Translation Systems 223
or specific mutant cells and programmed with mRNAs harboring structuresor mutations in need of functional characterization.
ACKNOWLEDGMENTS
Research in the authors’ laboratories was supported by grants (award GM47498 to M.S.S.and award R37 GM27757 to A.J.) from the National Institutes of Health.
REFERENCES
Amrani, N., Ganesan, R., Kervestin, S., Mangus, D. A., Ghosh, S., and Jacobson, A. (2004).A faux 30-UTR promotes aberrant termination and triggers nonsense-mediated mRNAdecay. Nature 432, 112–118.
Amrani, N., Dong, S., He, F., Ganesan, R., Ghosh, S., Kervestin, S., Li, C., Mangus, D. A.,Spatrick, P., and Jacobson, A. (2006a). Aberrant termination triggers nonsense-mediatedmRNA decay. Biochem. Soc. Trans. 34, 39–42.
Amrani, N., Sachs, M. S., and Jacobson, A. (2006b). Early nonsense: mRNA decay solves atranslational problem. Nat. Rev. Mol. Cell. Biol. 7, 415–425.
Anderson, C. W., Straus, J. W., and Dudock, B. S. (1983). Preparation of a cell-free protein-synthesizing system from wheat germ. Methods Enzymol. 101, 635–644.
Bonetti, B., Fu, L. W., Moon, J., and Bedwell, D. M. (1995). The efficiency of translationtermination is determined by a synergistic interplay between upstream and downstreamsequences in Saccharomyces cerevisiae. J. Mol. Biol. 251, 334–345.
Burke, D., Dawson, D., and Stearns, T. (2000). ‘‘Methods in Yeast Genetics: A Cold SpringHarbor Laboratory Course Manual.’’ Cold Spring Harbor Laboratory Press, Plainview,NY.
Cashel, M., Lazzarini, R. A., and Kalbacher, B. (1969). An improved method for thin-layerchromatography of nucleotide mixtures containing 32P-labelled orthophosphate.J. Chromatogr. 40, 103–109.
Cui, L., Yoon, S., Schinazi, R. F., and Sommadossi, J. P. (1995). Cellular and molecular eventsleading to mitochondrial toxicity of 1-(2-deoxy-2-fluoro-1-b-D-arabinofuranosyl)-5-iodouracil in human liver cells. J. Clin. Invest. 95, 555–563.
Davis, R. H., and de Serres, F. J. (1970). Genetic and microbiological research techniques forNeurospora crassa. Methods Enzymol. 27A, 79–143.
Dmitriev, S. E., Pisarev, A. V., Rubtsova, M. P., Dunaevsky, Y. E., and Shatsky, I. N.(2003a). Conversion of 48S translation preinitiation complexes into 80S initiation com-plexes as revealed by toeprinting. FEBS Lett. 533, 99–104.
Dmitriev, S. E., Terenin, I. M., Dunaevsky, Y. E., Merrick, W. C., and Shatsky, I. N.(2003b). Assembly of 48S translation initiation complexes from purified componentswith mRNAs that have some base pairing within their 50 untranslated regions.Mol. Cell.Biol. 23, 8925–8933.
Erickson, A. H., and Blobel, G. (1983). Cell-free translation of messenger RNA in a wheatgerm system. Methods Enzymol. 96, 38–50.
Fang, P., Wu, C., and Sachs, M. S. (2002). Neurospora crassa supersuppressor mutants areamber codon-specific. Fungal Genet. Biol. 36, 167–175.
Fang, P., Spevak, C. C., Wu, C., and Sachs, M. S. (2004). A nascent polypeptide domainthat can regulate translation elongation. Proc. Natl. Acad. Sci. USA 101, 4059–4064.

224 Cheng Wu et al.
Gaba, A., Jacobson, A., and Sachs, M. S. (2005). Ribosome occupancy of the yeast CPA1upstream open reading frame termination codon modulates nonsense-mediated mRNAdecay. Mol. Cell 20, 449–460.
He, F., and Jacobson, A. (1995). Identification of a novel component of the nonsense-mediated mRNA decay pathway by use of an interacting protein screen. Genes Dev. 9,437–454.
He, F., Brown, A. H., and Jacobson, A. (1997). Upf1p, Nmd2p, and Upf3p are interactingcomponents of the yeast nonsense-mediated mRNA decay pathway. Mol. Cell. Biol. 17,1580–1594.
Hood, H. M., Spevak, C. C., and Sachs, M. S. (2007). Evolutionary changes in the fungalcarbamoyl-phosphate synthetase small subunit gene and its associated upstream openreading frame. Fungal Genet. Biol. 44, 93–104.
Iizuka, N., and Sarnow, P. (1997). Translation-competent extracts from Saccharomycescerevisiae: Effects of L-A RNA, 50 cap, and 30 poly(A) tail on translational efficiency ofmRNAs. Methods 11, 353–360.
Iizuka, N., Najita, L., Franzusoff, A., and Sarnow, P. (1994). Cap-dependent and cap-independent translation by internal initiation of mRNAs in cell extracts prepared fromSaccharomyces cerevisiae. Mol. Cell. Biol. 14, 7322–7330.
Jackson, R. J., and Hunt, T. (1983). Preparation and use of nuclease-treated rabbit reticulo-cyte lysates for the translation of eukaryotic messenger RNA. Methods Enzymol. 96,50–74.
Jacobson, A. (1996). Poly(A) metabolism and translation: the closed-loop model.In ‘‘Translational Control’’ ( J. W. B. Hershey, M. B. Mathews, and N. Sonenberg,eds.), pp. 451–480. Cold Spring Harbor Laboratory Press, Cold Spring Harbor, NY.
Keeling, K. M., Lanier, J., Du, M., Salas-Marco, J., Gao, L., Kaenjak-Angeletti, A., andBedwell, D. M. (2004). Leaky termination at premature stop codons antagonizesnonsense-mediated mRNA decay in S. cerevisiae. RNA 10, 691–703.
Kozak, M. (1998). Primer extension analysis of eukaryotic ribosome-mRNA complexes.Nucleic Acids Res. 26, 4853–4859.
Lee, S. I., Umen, J. G., and Varmus, H. E. (1995). A genetic screen identifies cellular factorsinvolved in retroviral-1 frameshifting. Proc. Natl. Acad. Sci. USA 92, 6587–6591.
Leeds, P., Peltz, S.W., Jacobson, A., and Culbertson, M. R. (1991). The product of the yeastUPF1 gene is required for rapid turnover of mRNAs containing a premature translationaltermination codon. Genes Dev. 5, 2303–2314.
Leeds, P., Wood, J. M., Lee, B. S., and Culbertson, M. R. (1992). Gene products thatpromote mRNA turnover in Saccharomyces cerevisiae. Mol. Cell. Biol. 12, 2165–2177.
Maderazo, A. B., He, F., Mangus, D. A., and Jacobson, A. (2000). Upf1p control ofnonsense mRNA translation is regulated by Nmd2p and Upf3p. Mol. Cell. Biol. 20,4591–4603.
Pelham, H. R., and Jackson, R. J. (1976). An efficient mRNA-dependent translation systemfrom reticulocyte lysates. Eur. J. Biochem. 67, 247–256.
Pestova, T. V., and Hellen, C. U. (2003). Translation elongation after assembly of ribosomeson the Cricket paralysis virus internal ribosomal entry site without initiation factors orinitiator tRNA. Genes Dev. 17, 181–186.
Pulak, R., and Anderson, P. (1993). mRNA surveillance by the Caenorhabditis elegans smggenes. Genes Dev. 7, 1885–1897.
Roberts, B. E., and Paterson, B. M. (1973). Efficient translation of tobacco mosaic virusRNA and rabbit globin 9S RNA in a cell-free system from commercial wheat germ. Proc.Natl. Acad. Sci. USA 70, 2330–2334.
Sachs, M. S., Wang, Z., Gaba, A., Fang, P., Belk, J., Ganesan, R., Amrani, N., andJacobson, A. (2002). Toeprint analysis of the positioning of translational apparatus

Fungal In Vitro Translation Systems 225
components at initiation and termination codons of fungal mRNAs. Methods 26,105–114.
Salas-Marco, J., and Bedwell, D. M. (2004). GTP hydrolysis by eRF3 facilitates stop codondecoding during eukaryotic translation termination. Mol. Cell. Biol. 24, 7769–7778.
Sambrook, J., and Russell, D. W. (2001). ‘‘Molecular Cloning: A Laboratory Manual,’’ 3rded. Cold Spring Harbor Laboratory Press, Cold Spring Harbor, NY.
Schagger, H., and von Jagow, G. (1987). Tricine-sodium dodecyl sulfate-polyacrylamide gelelectrophoresis for the separation of proteins in the range from 1 to 100 kDa. Anal.Biochem. 166, 368–379.
Song, H., Mugnier, P., Das, A. K., Webb, H. M., Evans, D. R., Tuite, M. F.,Hemmings, B. A., and Barford, D. (2000). The crystal structure of human eukaryoticrelease factor eRF1—mechanism of stop codon recognition and peptidyl-tRNA hydro-lysis. Cell 100, 311–321.
Spevak, C. C., Park, E. H., Geballe, A. P., Pelletier, J., and Sachs, M. S. (2006). her-2upstream open reading frame effects on the use of downstream initiation codons. Biochem.Biophys. Res. Commun. 350, 834–841.
Stahl, G., Bidou, L., Hatin, I., Namy, O., Rousset, J. P., and Farabaugh, P. (2000). The caseagainst the involvement of the NMD proteins in programmed frameshifting. RNA 6,1687–1688.
Stansfield, I., Akhmaloka, and Tuite, M. F. (1995). A mutant allele of the SUP45 (SAL4)gene of Saccharomyces cerevisiae shows temperature-dependent allosuppressor and omni-potent suppressor phenotypes. Curr. Genet. 27, 417–426.
Stansfield, I., Kushnirov, V. V., Jones, K. M., and Tuite, M. F. (1997). A conditional-lethaltranslation termination defect in a sup45mutant of the yeast Saccharomyces cerevisiae. Eur. J.Biochem. 245, 557–563.
Tarun, S. Z., Jr., and Sachs, A. B. (1995). A common function for mRNA 50 and 30 ends intranslation initiation in yeast. Genes Dev. 9, 2997–3007.
Wang, Z., and Sachs, M. S. (1997a). Arginine-specific regulation mediated by theNeurosporacrassa arg-2 upstream open reading frame in a homologous, cell-free in vitro translationsystem. J. Biol. Chem. 272, 255–261.
Wang, Z., and Sachs, M. S. (1997b). Ribosome stalling is responsible for arginine-specifictranslational attenuation in Neurospora crassa. Mol. Cell. Biol. 17, 4904–4913.
Wang, Z., Fang, P., and Sachs, M. S. (1998). The evolutionarily conserved eukaryoticarginine attenuator peptide regulates the movement of ribosomes that have translated it.Mol. Cell. Biol. 18, 7528–7536.
Wang, Z., Gaba, A., and Sachs, M. S. (1999). A highly conserved mechanism of regulatedribosome stalling mediated by fungal arginine attenuator peptides that appears indepen-dent of the charging status of arginyl-tRNAs. J. Biol. Chem. 274, 37565–37574.
Weng, Y., Czaplinski, K., and Peltz, S. W. (1996a). Genetic and biochemical characteriza-tion of mutations in the ATPase and helicase regions of the Upf1 protein.Mol. Cell. Biol.16, 5477–5490.
Weng, Y., Czaplinski, K., and Peltz, S. W. (1996b). Identification and characterization ofmutations in the UPF1 gene that affect nonsense suppression and the formation of theUpf protein complex but not mRNA turnover. Mol. Cell. Biol. 16, 5491–5506.
C H A P T E R E L E V E N
M
IS
D
ethods
SN 0
epartm
Investigating Translation InitiationUsing DrosophilaMolecular Genetics
Gritta Tettweiler and Paul Lasko
Contents
1. In
in
076
en
troduction
Enzymology, Volume 429 # 2007
-6879, DOI: 10.1016/S0076-6879(07)29011-1 All rig
t of Biology and DBRI, McGill University, Montreal, Quebec, Canada
Else
hts
227
2. P
-Elements 2282
.1. T he Gal4-UAS system 2292
.2. Im precise P-element excision 2332
.3. N on–P-element transposons 2332
.4. F LP recombinase mediated recombination 2352
.5. H omologous recombination 2352
.6. R NAi 2363. P
erspectives and Conclusions 2384. Im
portant Sources for Drosophila Protocols 2385. D
rosophila Stock Centers 239Refe
rences 239Abstract
Genetic tools enable insights into how translation controls development of a
multicellular organism. Different genetic approaches offer the ability to manipu-
late the Drosophila genome in very precise ways, thereby allowing the investiga-
tion of how translation factorswork in the context of awhole organism.Wepresent
here an overview of selected techniques used to identify genes involved in
translation initiation, and quantitative methods to characterize phenotypes
caused bymutations in genes encoding translation initiation or regulatory factors.
1. Introduction
The fruit fly Drosophila melanogaster has served as a model organism forgenetic studies for over a century, and work on this organism has beeninstrumental in understanding various developmental and cellular processes.
vier Inc.
reserved.
227

228 Gritta Tettweiler and Paul Lasko
When the genome sequence of Drosophila melanogaster became available,215 transcripts were identified that encoded proteins with predicted roles inprotein synthesis, and 69 were classified as translation factors (Adams et al.,2000). Further analysis of the Drosophila genome revealed additional factorswith predicted functions in translation initiation (Lasko, 2000). In thepostgenomic era, subsequent studies using molecular genetic methods onindividual genes uncovered in the genome sequence have provided a deeperlevel of information than is possible through large-scale annotation efforts.
Regulation of protein synthesis is implicated in the control of cell growth,proliferation, and differentiation. Several reports have shown that translationfactors are directly involved in the regulation of normal growth and develop-ment inDrosophila. Galloni and Edgar (1999) identified a series ofmutants withlarval growth defects. One class of such mutants affected eukaryotic initiationfactor 4A (eIF4A). Lachance et al. (2002) demonstrated that a mutation inanother translation initiation factor, eIF4E, leads to larval growth arrest as well,and that phosphorylation of eIF4E is essential for normal growth. Additionalstudies showed that the translational inhibitor 4E-BP, and the poly(A) bindingprotein interactor Paip2, can have an impact on cell growth (Miron et al.,2001). In addition, regulation of translation from specific maternally expressedmRNAs is essential for the establishment of an embryonic pattern ( Johnstoneand Lasko, 2001). Mechanisms to regulate translation of specific mRNAs inthe germline are believed to target eIF4E (Nelson et al., 2004; Zappavignaet al., 2004), eIF5B ( Johnstone and Lasko, 2004), and the 50 cap structurethrough an eIF4E-related protein, 4EHP (Cho et al., 2005, 2006).
Drosophila is a valuable organism to study the biological role of transla-tion initiation factors largely because of the broad range of genetic tools thatare available. A key advantage of Drosophila is that the GAL4-UAS system(see below) is best elaborated in this organism. This system allows theinvestigator to activate or inactivate a gene in specific cells or tissues andat specific developmental times. Transgenic techniques permit the study ofthe effects of inducing overexpression of translation initiation factors inspecific cells or tissues and/or at specific developmental stages. Such experi-ments enable measurement of the phenotypes produced by overexpressionof a wild-type protein, or by expression of a specific mutant form of atranslation factor in a wild-type or genetically mutant background. On theother hand, gene disruption, directed or random, and targeted gene silenc-ing experiments by expressing interfering RNAs can also provide insightinto the function of the gene of interest.
2. P-Elements
The most important tool for a modern Drosophila geneticist is theP-element, a naturally occurring transposon that has now been geneticallyengineered in various ways to conveniently tag genes or create mutations in

Drosophila Genetics and Translation Initiation 229
genes. P-element-mediated transposition allows efficient transfer of specificDNA segments into the germline and their stable inheritance in the progeny(Rubin and Spradling, 1982). Large-scale mutagenesis projects using variousP-element derivatives have resulted in the isolation of transposon insertionsin or very near approximately two-thirds of all Drosophila genes (Venkenand Bellen, 2005). These insertion lines are publicly available at nominalcost from various Drosophila stock centers (for contact information, seebelow). A selection of P-element insertion lines for translation initiationfactors available from the Bloomington Stock Centre (the largest suchcenter) is presented in Table 11.1.
The following techniques for the induced misexpression of a gene ofinterest are based on P-elements.
2.1. The Gal4-UAS system
The Gal4 upstream activating sequences (Gal4-UAS) system allows loca-lized induced expression of a given gene under the control of a promoter ofchoice (Brand and Perrimon, 1993).
At the present time, two UAS constructs are most commonly used forconditional gene expression in Drosophila, pUAST and pUASp. By usingpUAST (Brand and Perrimon, 1993), expression of a specific gene can beachieved efficiently in somatic tissue, but it is not possible to express thegene of interest in the germline during oogenesis. This problem wascircumvented by creating a modified UAS vector, pUASp (Rorth, 1998).Both vectors, and other derivatives of them, are available at nominal costfrom the Drosophila Genomics Resource Center.
Following cloning of the gene of interest into the appropriate UASvector, the plasmid is injected into the pole plasm of precellular embryos(Rubin and Spradling, 1982). This procedure is carried out routinely inmany Drosophila laboratories, but it does take some skill and significantpractice to master it. Occasional producers of transgenic Drosophila lineswithout a nearby cooperating fly laboratory should consider using one ofseveral available commercial services for this work (a list of providers isavailable on www.flybase.org). The plasmids contain a wild-type copy ofthe white gene and the recipient embryos are mutant for white. Transformantadults will therefore have red eyes (from the plasmid-borne wild-type copyof white) while nontransformed adults will have white eyes. Subsequently,the transgenic flies can be crossed to balancer lines to identify the chromo-some on which the transgene has inserted.
To induce expression of the gene of interest, the UAS line can becrossed with flies expressing the transcriptional activator Gal4. NumerousGal4 lines are available from the various stock centers (for contact informa-tion, see below), allowing the choice for control gene expression in time(Hsp70-Gal, for example, which allows activation of a gene at any particular

Table 11.1 Selection of transposable element insertion lines
Gene TransposableP-element insertion Reference
Translation initiation factor
eIF1A CG8053 PEPeIF-1AEP935 BDGP Project members, 2000–
eIF2 (dGcn2) CG1609 X
eIF2a CG9946 X
eIF2b CG4153 PEPgy2eIF-2bEY08063 Gene Disruption Project members, 2001–
eIF2g X X
eIF2Ba CG7883 PEPgy2eIF2B-aEY03991 Gene Disruption Project members, 2001–
eIF2Bb CG2677 PBacPBeIF2B-bc02002 Gene Disruption Project members and
Exelixis, 2005
eIF2Bg CG8190 PBacPBeIF2B-gc01931 Thibault et al., 2004
eIF2Bd CG10315 PEPgy2eIF2B-dEY03558 Gene Disruption Project members, 2001–
eIF2BE CG3806 X
eIF3-S1 (Adam) CG12131 PlacWAdamk13906 Spradling et al., 1999
eIF3-S2 (Trip1) CG8882 PSUPor-PTrip1KG06360 Gene Disruption Project members, 2001–
eIF3-S3 (p40) CG9124 PlacWeIF-3p40k09003 Spradling et al., 1999
eIF3-S4 CG10881 X
CG8636 X Gene Disruption Project members, 2001–
eIF3-S5 CG8335 PEPEP2003 BDGP Project members, 2000–
CG9769 PEPCG9769EP516 BDGP Project members, 2000–
eIF3-S6 CG9677 PPZInt610547 Cunniff et al., 1997
eIF3-S7 (p66) CG10161 PEPgy2eIF-3p66EY05735 Gene Disruption Project members, 2001–
CG4810 X
230

eIF3-S8 CG4954 PEPgy2eIF3-S8EY07713 Gene Disruption Project members, 2001–
eIF3-S9 CG4878 PEPgy2eIF3-S9EY14430 Gene Disruption Project members, 2001–
eIF3-S10 CG9805 PEPgy2eIF3-S10EY04238 Gene Disruption Project members, 2001–
eIF4AIII CG7483 PEPgy2eIF4AIIIEY14207 Gene Disruption Project members, 2001–
eIF4a CG9075 PlacWeIF-4a1013 Galloni and Edgar, 1999
eIF4B CG10837 X
eIF4-E-1,2 CG4035 PPZeIF-4E07238 Lachance et al., 2002
eIF4E-3 CG8023 X
eIF4E-4 CG10124 X
eIF4E-5 CG8277 X
eIF4E-6 CG1442 PBacWHCG1442f06737 Gene Disruption Project members and
Exelixis, 2005
eIF4E-7 CG32859 PEPEP1443 BDGP Project members, 1994–1999
eIF4E-8 CG33100 See d4EHP
eIF4G CG10811 PBacRBeIF-4Ge02087 Thibault et al., 2004
eIF5 CG9177 X
eIF5B (dIF2) CG10840 PEPgy2eIF5BEY01401 Gene Disruption Project members, 2001–
eIF6 CG17611 PlacWeIF6k13214 Spradling et al., 1999
Regulator
d4E-HP CG33100 PGT14EHPBG01713 Gene Disruption Project members, 2001–
d4E-BP CG8846 PlacWThork13517 BDGP Project members, 1994–1999
Cup CG11181 PBacPBcupc04119 Thibault et al., 2004
PABP CG5119 PlacWpAbpk10109 Sigrist et al., 2000
Paip2 CG12358 PSUPor-PKG03704 Gene Disruption Project members, 2001–
231
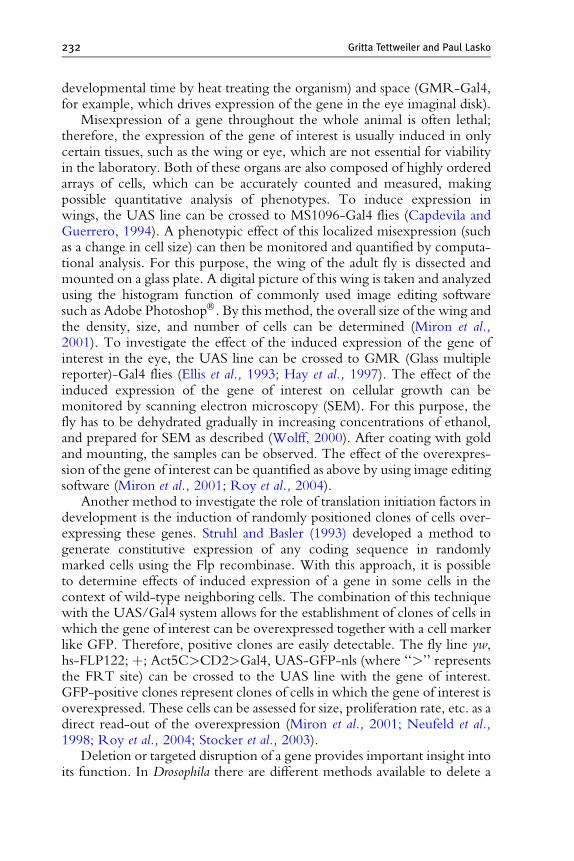
232 Gritta Tettweiler and Paul Lasko
developmental time by heat treating the organism) and space (GMR-Gal4,for example, which drives expression of the gene in the eye imaginal disk).
Misexpression of a gene throughout the whole animal is often lethal;therefore, the expression of the gene of interest is usually induced in onlycertain tissues, such as the wing or eye, which are not essential for viabilityin the laboratory. Both of these organs are also composed of highly orderedarrays of cells, which can be accurately counted and measured, makingpossible quantitative analysis of phenotypes. To induce expression inwings, the UAS line can be crossed to MS1096-Gal4 flies (Capdevila andGuerrero, 1994). A phenotypic effect of this localized misexpression (suchas a change in cell size) can then be monitored and quantified by computa-tional analysis. For this purpose, the wing of the adult fly is dissected andmounted on a glass plate. A digital picture of this wing is taken and analyzedusing the histogram function of commonly used image editing softwaresuch as Adobe PhotoshopÒ. By this method, the overall size of the wing andthe density, size, and number of cells can be determined (Miron et al.,2001). To investigate the effect of the induced expression of the gene ofinterest in the eye, the UAS line can be crossed to GMR (Glass multiplereporter)-Gal4 flies (Ellis et al., 1993; Hay et al., 1997). The effect of theinduced expression of the gene of interest on cellular growth can bemonitored by scanning electron microscopy (SEM). For this purpose, thefly has to be dehydrated gradually in increasing concentrations of ethanol,and prepared for SEM as described (Wolff, 2000). After coating with goldand mounting, the samples can be observed. The effect of the overexpres-sion of the gene of interest can be quantified as above by using image editingsoftware (Miron et al., 2001; Roy et al., 2004).
Another method to investigate the role of translation initiation factors indevelopment is the induction of randomly positioned clones of cells over-expressing these genes. Struhl and Basler (1993) developed a method togenerate constitutive expression of any coding sequence in randomlymarked cells using the Flp recombinase. With this approach, it is possibleto determine effects of induced expression of a gene in some cells in thecontext of wild-type neighboring cells. The combination of this techniquewith the UAS/Gal4 system allows for the establishment of clones of cells inwhich the gene of interest can be overexpressed together with a cell markerlike GFP. Therefore, positive clones are easily detectable. The fly line yw,hs-FLP122; þ; Act5C>CD2>Gal4, UAS-GFP-nls (where ‘‘>’’ representsthe FRT site) can be crossed to the UAS line with the gene of interest.GFP-positive clones represent clones of cells in which the gene of interest isoverexpressed. These cells can be assessed for size, proliferation rate, etc. as adirect read-out of the overexpression (Miron et al., 2001; Neufeld et al.,1998; Roy et al., 2004; Stocker et al., 2003).
Deletion or targeted disruption of a gene provides important insight intoits function. In Drosophila there are different methods available to delete a

Drosophila Genetics and Translation Initiation 233
gene of interest. Table 11.2 provides an overview of existing mutant allelesof translation initiation factors and selected regulators.
2.2. Imprecise P-element excision
Insertion of a P-element by itself frequently leads to a hypomorphic muta-tion, and sometimes fully inactivates a gene (Spradling et al., 1995). Thefailure of most P-element mutations to completely inactivate a gene resultsfrom the marked preference this transposon has for insertion sites outside ofprotein-coding regions. Nevertheless, it is often straightforward to producea complete loss-of-function mutation as a derivative of a P-element insertionmutation. At a frequency of approximately 1%, mobilized P-elements willexcise in an imprecise fashion, taking along with them a region of up to a fewkilobases of flanking DNA. Thus, if a P-element is inserted near the targetgene, it is possible to excise the P-element and parts of the gene of interest. Ifthe P-element is inactive (without its own transposase activity, the usual casefor most transgenic vectors used today), the strain that carries the P-elementhas to be crossed to a strain that produces transposase (Bellen et al., 2004).The advantage of using inactive P-elements is that transposase activity can becontrolled by adding or removing the transposase source. A commonly usedsource of transposase to mobilize P-elements is D2–3. To prevent furtherjumps, the source of transposase activity has to be separated in the subsequentgenerations through appropriate genetic crossing. A common crossingscheme using D2–3 is presented in Greenspan (2004). Deletions resultingfrom imprecise P-element excisions have to be confirmed by molecularmethods, like polymerase chain reaction (PCR), genomic Southern blotanalysis, and/or sequencing (Cho et al., 2005).
2.3. Non–P-element transposons
For reasons that are not well understood, around one-third of Drosophilagenes are refractory to P-element insertion despite extensive efforts. There-fore, other transposable elements with different target specificities are alsoused as mutagenic agents, the most common being the piggyBac element.piggyBac excision events from the germline are nearly always precise, how-ever, making the imprecise excision technique essentially impossible withinsertions of this element (Hacker et al., 2003; Horn et al., 2003; Thibaultet al., 2004). To circumvent this problem, Thibault et al. (2004) recentlydescribed the generation of over 29,000 XP and piggyBac insertion linescontaining FRT sites, all of which were made available to public stockcenters. These FRT-bearing transposons can be used to delete a gene ofinterest based on the FLP/FRT technique. Detailed crossing schemes andprimer sequences to test the putative deletion are described in Parks et al.(2004).
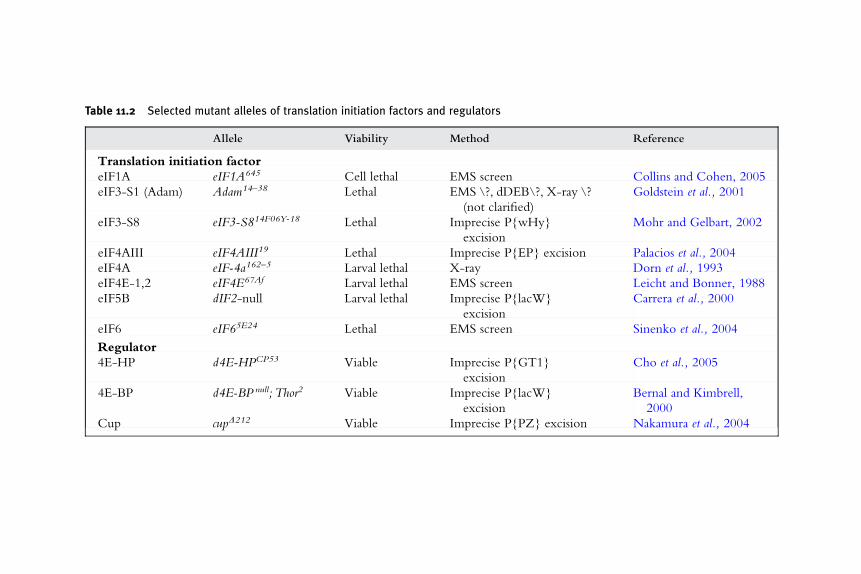
Table 11.2 Selected mutant alleles of translation initiation factors and regulators
Allele Viability Method Reference
Translation initiation factor
eIF1A eIF1A645 Cell lethal EMS screen Collins and Cohen, 2005
eIF3-S1 (Adam) Adam14–38 Lethal EMS \?, dDEB\?, X-ray \?
(not clarified)
Goldstein et al., 2001
eIF3-S8 eIF3-S814F06Y-18 Lethal Imprecise PwHy
excision
Mohr and Gelbart, 2002
eIF4AIII eIF4AIII19 Lethal Imprecise PEP excision Palacios et al., 2004
eIF4A eIF-4a162–5 Larval lethal X-ray Dorn et al., 1993
eIF4E-1,2 eIF4E67Af Larval lethal EMS screen Leicht and Bonner, 1988
eIF5B dIF2-null Larval lethal Imprecise PlacW
excision
Carrera et al., 2000
eIF6 eIF65E24 Lethal EMS screen Sinenko et al., 2004
Regulator
4E-HP d4E-HPCP53 Viable Imprecise PGT1
excision
Cho et al., 2005
4E-BP d4E-BP null; Thor2 Viable Imprecise PlacW
excision
Bernal and Kimbrell,
2000
Cup cupD212 Viable Imprecise PPZ excision Nakamura et al., 2004

Drosophila Genetics and Translation Initiation 235
Before the investigator starts with the crossing, which can take somemonths to complete, it is strongly recommended that the starting insertionline be checked by molecular means such as PCR to ensure that theinsertion site has been correctly mapped. A small but significant fractionof insertion lines available from large-scale mutagenesis screens does notcorrespond to the annotation details in the available databases.
2.4. FLP recombinase mediated recombination
Since all of the mutant alleles of translation initiation factors described so farare lethal early in development (Table 11.2), a different approach is neces-sary to investigate the consequences of a mutation in the context of an intactorganism. Site-specific mitotic recombination using the FLP/FRT systempermits the creation of mosaic animals in which mutant clones are generatedin a tissue-specific manner (Golic, 1991). After introducing FLP recombi-nase, a precise deletion can be obtained by the excision of two nearbytransposable elements that carry FRT sites in the same orientation.
For the generation of eIF5B-null germline mosaic clones (Carrera et al.,2000), the ‘‘FLP-DFS’’ (flippase-dominant female sterile) method was used(Chou and Perrimon, 1996). In this procedure, the X-linked germline-dependent dominant female sterile mutation ovoD1 acts as a selection markerfor the detection of germline recombination events, because only recombi-nant clones escape the cell-lethal ovoD1 phenotype. The following breedingscheme applied: y w HSFlp; FRT2A ovoD1/TM3 Sbmales were mated witheIF5BD1FRT2A wþ/TM3Ser virgin females. The progeny larvae were heatshocked at 37 for 2 h during the second and third instar larval stages toinduce mitotic recombination in proliferating germ cells. Ovaries fromhomozygous, non-Sb, non-Ser females were dissected and examinedusing Western blot analysis (Carrera et al., 2000).
Mosaic clones can be generated in any tissue based on the expressionpattern of the FLP line used. For the generation of eye-specific mosaicclones, the eyFLP driver is used (Newsome et al., 2000). In the eyFLPconstruct, the FLP recombinase cDNA is under the control of four tandemcopies of an eye-specific enhancer from the eyeless (ey) gene and an induc-ible hsp70 heat shock promoter. Heat treatment of larvae as described aboveresults in specific expression in eye imaginal discs. Using whiteþ (wþ) distalto an FRT insertion as a marker, it is possible to detect mosaicism in a w–
background.
2.5. Homologous recombination
Another method to investigate the role of a gene of interest in Drosophiladevelopment is the targeted knockout or replacement of a gene of interest(Rong and Golic, 2000). In this technique, a P-element vector containing
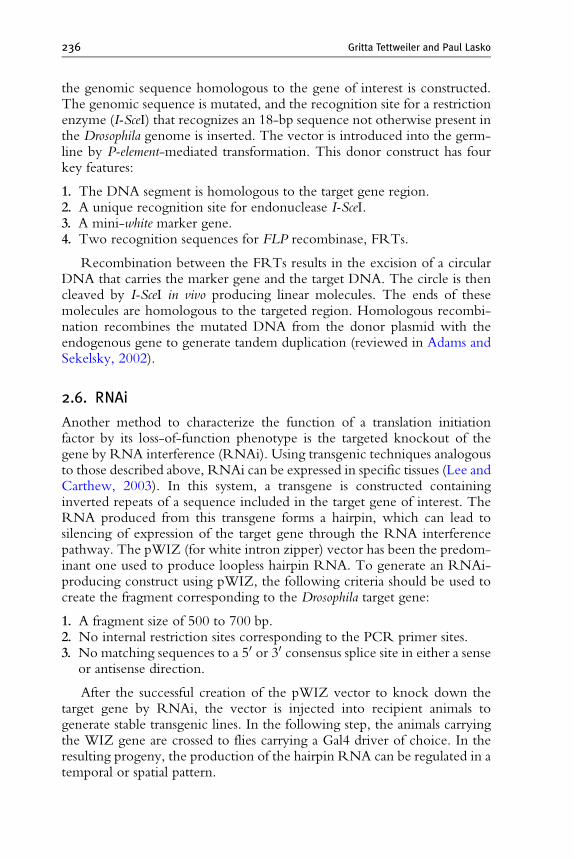
236 Gritta Tettweiler and Paul Lasko
the genomic sequence homologous to the gene of interest is constructed.The genomic sequence is mutated, and the recognition site for a restrictionenzyme (I-SceI) that recognizes an 18-bp sequence not otherwise present inthe Drosophila genome is inserted. The vector is introduced into the germ-line by P-element-mediated transformation. This donor construct has fourkey features:
1. The DNA segment is homologous to the target gene region.2. A unique recognition site for endonuclease I-SceI.3. A mini-white marker gene.4. Two recognition sequences for FLP recombinase, FRTs.
Recombination between the FRTs results in the excision of a circularDNA that carries the marker gene and the target DNA. The circle is thencleaved by I-SceI in vivo producing linear molecules. The ends of thesemolecules are homologous to the targeted region. Homologous recombi-nation recombines the mutated DNA from the donor plasmid with theendogenous gene to generate tandem duplication (reviewed in Adams andSekelsky, 2002).
2.6. RNAi
Another method to characterize the function of a translation initiationfactor by its loss-of-function phenotype is the targeted knockout of thegene by RNA interference (RNAi). Using transgenic techniques analogousto those described above, RNAi can be expressed in specific tissues (Lee andCarthew, 2003). In this system, a transgene is constructed containinginverted repeats of a sequence included in the target gene of interest. TheRNA produced from this transgene forms a hairpin, which can lead tosilencing of expression of the target gene through the RNA interferencepathway. The pWIZ (for white intron zipper) vector has been the predom-inant one used to produce loopless hairpin RNA. To generate an RNAi-producing construct using pWIZ, the following criteria should be used tocreate the fragment corresponding to the Drosophila target gene:
1. A fragment size of 500 to 700 bp.2. No internal restriction sites corresponding to the PCR primer sites.3. No matching sequences to a 50 or 30 consensus splice site in either a sense
or antisense direction.
After the successful creation of the pWIZ vector to knock down thetarget gene by RNAi, the vector is injected into recipient animals togenerate stable transgenic lines. In the following step, the animals carryingthe WIZ gene are crossed to flies carrying a Gal4 driver of choice. In theresulting progeny, the production of the hairpin RNA can be regulated in atemporal or spatial pattern.

Drosophila Genetics and Translation Initiation 237
A recent report described another transformation vector for RNAiexperiments in Drosophila, pRISE (for RNAi inducing silencing effector)(Kondo et al., 2006). The clear advantage with this vector is its relativelyeasy cloning procedure using the TOPO cloning system (Invitrogen). Theresulting plasmid contains an inverted repeat of the sequence of the targetgene, and a pentamer of UASGal4. It can be transformed into flies bycommonly used P-element-mediated transformation. When the transgenicflies are crossed to a Gal4 line, the expression of the target gene is reduced.As for pWIZ, the RNAi effect can also be controlled temporally andspatially by the choice of a Gal4 driver.
Efforts are nearly complete to establish a genome-wide library of trans-genic fly lines that produce hairpin RNAs in a temporally and spatiallyspecific pattern to enable a systematic overview of gene function in the fly(http://www.vdrc.at). There are several fly lines available in whichmRNAs encoding translation initiation factors can be inducibly silencedin vivo using the UAS-GAL4 system. Table 11.3 provides an overview ofthe UAS-RNAi flies available from the National Institute of Genetics inJapan (http://www.shigen.nig.ac.jp/fly/nigfly/).
For cultured Drosophila cells, a library of double-stranded RNAs(dsRNAs) directed against all predicted open reading frames in theDrosoph-ila genome has been created, and a high-throughput RNAi screeningservice is available (http://flyrnai.org; Boutros et al., 2004). An excellent
Table 11.3 RNAi flies
Synonym Gene Phenotype
eIF2 (dGcn2) CG1609 Viable
eIF2b CG4153 Lethal
eIF2Bd CG10315 Lethal
eIF2Bg CG8190 Lethal
eIF3-S1 CG12131 Lethal
eIF3-S3 (p40) CG9124 Lethal
eIF3-S4 CG10881 Lethal
eIF3-S5 CG8335 Viable
eIF3-S7 (p66) CG10161 Lethal
eIF3-S10 CG9805 Lethal
eIF4E-3 CG8023 Viable
eIF4E-5 CG8277 Lethal
eIF4E-7 CG32859 Lethal
eIF5B (dIF2) CG10840 Lethal
eIF6 CG17611 Lethal
Cup CG11181 Semilethal

238 Gritta Tettweiler and Paul Lasko
overview of the high-throughput RNAi screens in cultured Drosophila S2cells was recently published (Armknecht et al., 2005).
3. Perspectives and Conclusions
The regulation of translation initiation is a key means in controllingDrosophila development. To analyze the function of translation initiationfactors in development, genetic approaches offer the advantage of carryingout the experiments in a whole animal. The disruption of genes encodingtranslation initiation factors often results in lethality of the fly, underscoringthe importance of translational control for development. Since the wholegenome sequence of Drosophila is available, the focus now shifts toward thefunctional analysis of the genes identified.
4. Important Sources forDrosophila Protocols
Ashburner, M., Golic, K. G., and Hawley, R. S. (2005). ‘‘Drosophila:A Laboratory Handbook.’’ Cold Spring Harbor Laboratory Press, ColdSpring Harbor, NY.
Goldstein, L. S. B., and Fyrberg, E. A. (1994). ‘‘Drosophila melanogaster:Practical Uses in Cell and Molecular Biology.’’ Academic Press, SanDiego.
Greenspan, R. J. (2004). ‘‘Fly Pushing: The Theory and Practice ofDrosophila Genetics.’’ Cold Spring Harbor Laboratory Press, Cold SpringHarbor, NY.
Sullivan, W., Ashburner, M., and Hawley, R. S. (2000). ‘‘DrosophilaProtocols.’’ Cold Spring Harbor Laboratory Press, Cold Spring Harbor,NY.
http://flybase.bio.indiana.edu/ to order fly stocks, search for protocols,personal communications within the fly community, etc.
http://dgrc.cgb.indiana.edu/vectors/ Drosophila Genomics Resource Center.http://superfly.ucsd.edu/ to search for P-element lines.
http://portal.curagen.com/cgi-bin/interaction/flyHome.pl Drosophila InteractionDatabase [Giot, L., et al., Science 302(5651), 2003].
http://www.flyrnai.org/ DrosophilaRNAi Screening Center at Harvard Med-ical School (Flockhart et al., 2006).

Drosophila Genetics and Translation Initiation 239
5. Drosophila Stock Centers
http://flystocks.bio.indiana.edu/ Bloomington Stock Centerhttp://sagafly.dgrc.kit.ac.jp/en/ Kyoto Stock Centerhttp://kyotofly.kit.jp/cgi-bin/ehime/index.cgi Ehime University Stock Centerhttp://expbio.bio.u-szeged.hu/fly/ Szeged Stock Centerhttp://stockcenter.arl.arizona.edu/ Tuscon Stock Centerhttp://drosophila.med.harvard.edu/ Harvard Stock Collection
REFERENCES
Adams, M. D., and Sekelsky, J. J. (2002). From sequence to phenotype: Reverse genetics inDrosophila melanogaster. Nat. Rev. Genet. 3, 189–198.
Adams, M. D., Celniker, S. E., Holt, R. A., Evans, C. A., Gocayne, J. D., Amanatides, P. G.,Scherer, S. E., Li, P. W., Hoskins, R. A., Galle, R. F., George, R. A., Lewis, S. E., et al.(2000). The genome sequence of Drosophila melanogaster. Science 287, 2185–2195.
Armknecht, S., Boutros, M., Kiger, A., Nybakken, K., Mathey-Prevot, B., andPerrimon, N. (2005). High-throughput RNA interference screens in Drosophila tissueculture cells. Methods Enzymol. 392, 55–73.
BDGP Project Members (1994–1999). Berkeley Drosophila Genome Project.BDGP Project Members (2000–). Berkeley Drosophila Genome Project.Bellen, H. J., Levis, R. W., Liao, G., He, Y., Carlson, J. W., Tsang, G., Evans-Holm, M.,
Hiesinger, P. R., Schulze, K. L., Rubin, G. M., Hoskins, R. A., and Spradling, A. C.(2004). The BDGP gene disruption project: Single transposon insertions associated with40% of Drosophila genes. Genetics 167, 761–781.
Bernal, A., and Kimbrell, D. A. (2000). Drosophila Thor participates in host immune defenseand connects a translational regulator with innate immunity. Proc. Natl. Acad. Sci. USA97, 6019–6024.
Boutros, M., Kiger, A. A., Armknecht, S., Kerr, K., Hild, M., Koch, B., Haas, S. A.,Paro, R., and Perrimon, N. (2004). Genome-wide RNAi analysis of growth and viabilityin Drosophila cells. Science 303, 832–835.
Brand, A. H., and Perrimon, N. (1993). Targeted gene expression as a means of altering cellfates and generating dominant phenotypes. Development 118, 401–415.
Capdevila, J., and Guerrero, I. (1994). Targetted expression of the signaling moleculedecapentaplegic induces pattern duplications and growth alterations in Drosophilawings. EMBO J. 13, 4459–4468.
Carrera, P., Johnstone, O., Nakamura, A., Casanova, J., Jackle, H., and Lasko, P. (2000).VASA mediates translation through interaction with a Drosophila yIF2 homolog. Mol.Cell 5, 181–187.
Cho, P. F., Poulin, F., Cho-Park, Y. A., Cho-Park, I. B., Chicoine, J. D., Lasko, P., andSonenberg, N. (2005). A new paradigm for translational control: Inhibition via 50-30mRNA tethering by Bicoid and the eIF4E cognate 4EHP. Cell 121, 411–423.
Cho, P. F., Gamberi, C., Cho-Park, Y. A., Cho-Park, I. B., Lasko, P., and Sonenberg, N.(2006). Cap-dependent translational inhibition establishes two opposing morphogengradients in Drosophila embryos. Curr. Biol. 16, 2035–2041.

240 Gritta Tettweiler and Paul Lasko
Chou, T. B., and Perrimon, N. (1996). The autosomal FLP-DFS technique for generatinggermline mosaics in Drosophila melanogaster. Genetics 144, 1673–1679.
Collins, R. T., and Cohen, S. M. (2005). A genetic screen in Drosophila for identifyingnovel components of the hedgehog signaling pathway. Genetics 170, 173–184.
Cunniff, J., Chiu, Y. H., Morris, N. R., and Warrior, R. (1997). Characterization ofDnudC, theDrosophila homolog of an Aspergillus gene that functions in nuclear motility.Mech. Dev. 66, 55–68.
Dorn, R., Morawietz, H., Reuter, G., and Saumweber, H. (1993). Identification of anessential Drosophila gene that is homologous to the translation initiation factor eIF-4A ofyeast and mouse. Mol. Gen. Genet. 237, 233–240.
Ellis, M. C., O’Neill, E. M., and Rubin, G. M. (1993). Expression ofDrosophila glass proteinand evidence for negative regulation of its activity in non-neuronal cells by anotherDNA-binding protein. Development 119, 855–865.
Flockhart, I., Booker, M., Kiger, A., Boutros, M., Armknecht, S., Ramadan, N.,Richardson, K., Xu, A., Perrimon, N., and Mathey-Prevot, B. (2006). FlyRNAi: TheDrosophila RNAi screening center database. Nucleic Acids Res. 34, D489–D494.
Galloni, M., and Edgar, B. A. (1999). Cell-autonomous and non-autonomous growth-defective mutants of Drosophila melanogaster. Development 126, 2365–2375.
Gene Disruption Project members (2001–). BDGP Gene Disruption Project.Gene Disruption Project members and Exelixis (2005). Genomic mapping of Exelixis
insertion collection.Goldstein, E. S., Treadway, S. L., Stephenson, A. E., Gramstad, G. D., Keilty, A., Kirsch, L.,
Imperial, M., Guest, S., Hudson, S. G., LaBell, A. A., O’Day, M., Duncan, C., et al.(2001). A genetic analysis of the cytological region 46C-F containing the Drosophilamelanogaster homolog of the jun proto-oncogene. Mol. Genet. Genomics 266, 695–700.
Golic, K. G. (1991). Site-specific recombination between homologous chromosomes inDrosophila. Science 252, 958–961.
Greenspan, R. J. (2004). ‘‘Fly Pushing: The Theory and Practice of Drosophila Genetics.’’Cold Spring Harbor Laboratory Press, Cold Spring Harbor, NY.
Hacker, U., Nystedt, S., Barmchi, M. P., Horn, C., and Wimmer, E. A. (2003). piggyBac-based insertional mutagenesis in the presence of stably integrated P elements inDrosophila.Proc. Natl. Acad. Sci. USA 100, 7720–7725.
Hay, B. A., Maile, R., and Rubin, G. M. (1997). P element insertion-dependent geneactivation in the Drosophila eye. Proc. Natl. Acad. Sci. USA 94, 5195–5200.
Horn, C., Offen, N., Nystedt, S., Hacker, U., and Wimmer, E. A. (2003). piggyBac-basedinsertional mutagenesis and enhancer detection as a tool for functional insect genomics.Genetics 163, 647–661.
Johnstone, O., and Lasko, P. (2001). Translational regulation and RNA localization inDrosophila oocytes and embryos. Annu. Rev. Genet. 35, 365–406.
Johnstone, O., and Lasko, P. (2004). Interaction with eIF5B is essential for Vasa functionduring development. Development 131, 4167–4178.
Kondo, T., Inagaki, S., Yasuda, K., and Kageyama, Y. (2006). Rapid construction ofDrosophila RNAi transgenes using pRISE, a P-element-mediated transformation vectorexploiting an in vitro recombination system. Genes Genet. Syst. 81, 129–134.
Lachance, P. E., Miron, M., Raught, B., Sonenberg, N., and Lasko, P. (2002). Phosphory-lation of eukaryotic translation initiation factor 4E is critical for growth. Mol. Cell. Biol.22, 1656–1663.
Lasko, P. (2000). The Drosophila genome: Translation factors and RNA binding proteins.J. Cell Biol. 150, F51–F56.
Lee, Y. S., and Carthew, R. W. (2003). Making a better RNAi vector for Drosophila: Use ofintron spacers. Methods 30, 322–329.

Drosophila Genetics and Translation Initiation 241
Leicht, B. G., and Bonner, J. J. (1988). Genetic analysis of chromosomal region 67A-D ofDrosophila melanogaster. Genetics 119, 579–593.
Miron, M., Verdu, J., Lachance, P. E., Birnbaum, M. J., Lasko, P. F., and Sonenberg, N.(2001). The translational inhibitor 4E-BP is an effector of PI(3)K/Akt signalling and cellgrowth in Drosophila. Nat. Cell. Biol. 3, 596–601.
Mohr, S. E., and Gelbart, W. M. (2002). Using the P[wHy] hybrid transposable element todisrupt genes in region 54D-55B in Drosophila melanogaster. Genetics 162, 165–176.
Nakamura, A., Sato, K., and Hanyu-Nakamura, K. (2004). Drosophila cup is an eIF4Ebinding protein that associates with Bruno and regulates oskar mRNA translation inoogenesis. Dev. Cell 6, 69–78.
Nelson, M. R., Leidal, A. M., and Smibert, C. A. (2004). Drosophila Cup is an eIF4E-binding protein that functions in Smaug-mediated translational repression. EMBO J. 23,150–159.
Neufeld, T. P., de la Cruz, A. F., Johnston, L. A., and Edgar, B. A. (1998). Coordination ofgrowth and cell division in the Drosophila wing. Cell 93, 1183–1193.
Newsome, T. P., Asling, B., and Dickson, B. J. (2000). Analysis of Drosophila photoreceptoraxon guidance in eye-specific mosaics. Development 127, 851–860.
Palacios, I. M., Gatfield, D., St Johnston, D., and Izaurralde, E. (2004). An eIF4AIII-containing complex required for mRNA localization and nonsense-mediated mRNAdecay. Nature 427, 753–757.
Parks, A. L., Cook, K. R., Belvin, M., Dompe, N. A., Fawcett, R., Huppert, K., Tan, L. R.,Winter, C. G., Bogart, K. P., Deal, J. E., Deal-Herr, M. E., Grant, D., et al. (2004).Systematic generation of high-resolution deletion coverage of the Drosophila melanogastergenome. Nat. Genet. 36, 288–292.
Rong, Y. S., and Golic, K. G. (2000). Gene targeting by homologous recombination inDrosophila. Science 288, 2013–3018.
Rorth, P. (1998). Gal4 in the Drosophila female germline. Mech. Dev. 78, 113–118.Roy, G., Miron, M., Khaleghpour, K., Lasko, P., and Sonenberg, N. (2004).The Drosophila
poly(A) binding protein-interacting protein, dPaip2, is a novel effector of cell growth.Mol. Cell. Biol. 24, 1143–1154.
Rubin, G. M., and Spradling, A. C. (1982). Genetic transformation of Drosophila withtransposable element vectors. Science 218, 348–353.
Sigrist, S. J., Thiel, P. R., Reiff, D. F., Lachance, P. E. D., Lasko, P., and Schuster, C. F.(2000). Postsynaptic translation affects the efficacy and morphology of neuromuscularjunctions. Nature 405, 1062–1065.
Sinenko, S. A., Kim, E. K., Wynn, R., Manfruelli, P., Ando, I., Wharton, K. A.,Perrimon, N., and Mathey-Prevot, B. (2004). Yantar, a conserved arginine-rich proteinis involved in Drosophila hemocyte development. Dev. Biol. 273, 48–62.
Spradling, A. C., Stern, D. M., Kiss, I., Roote, J., Laverty, T., and Rubin, G. M. (1995).Gene disruptions using P transposable elements: An integral component of the Drosophilagenome project. Proc. Natl. Acad. Sci. USA 92, 10824–10830.
Spradling, A. C., Stern, D., Beaton, A., Rhem, E. J., Laverty, T., Mozden, N., Misra, S., andRubin, G. M. (1999). The Berkeley Drosophila Genome Project gene disruption project:Single P-element insertions mutating 25% of vital Drosophila genes. Genetics 153,135–177.
Stocker, H., Radimerski, T., Schindelholz, B., Wittwer, F., Belawat, P., Daram, P.,Breuer, S., Thomas, G., and Hafen, E. (2003). Rheb is an essential regulator of S6K incontrolling cell growth in Drosophila. Nat. Cell. Biol. 5, 559–565.
Struhl, G., and Basler, K. (1993). Organizing activity of wingless protein in Drosophila. Cell72, 527–540.
Thibault, S. T., Singer, M. A., Miyazaki, W. Y., Milash, B., Dompe, N. A., Singh, C. M.,Buchholz, R., Demsky, M., Fawcett, R., Francis-Lang, H. L., Ryner, L.,

242 Gritta Tettweiler and Paul Lasko
Cheung, L. M., et al. (2004). A complementary transposon tool kit for Drosophilamelanogaster using P and piggyBac. Nat. Genet. 36, 283–287.
Venken, K. J., and Bellen, H. J. (2005). Emerging technologies for gene manipulation inDrosophila melanogaster. Nat. Rev. Genet. 6, 167–178.
Wolff, T. (2000). ‘‘Histological Techniques for the Drosophila Eye. Part II: Adult.’’ ColdSpring Harbor Laboratory Press, Cold Spring Harbor, NY.
Zappavigna, V., Piccioni, F., Villaescusa, J. C., and Verrotti, A. C. (2004). Cup is anucleocytoplasmic shuttling protein that interacts with the eukaryotic translation initia-tion factor 4E to modulateDrosophila ovary development. Proc. Natl. Acad. Sci. USA 101,14800–14805.

C H A P T E R T W E L V E
Analysis of RNA:Protein InteractionsIn Vivo: Identification of RNA-BindingPartners of Nuclear Factor 90
Andrew M. Parrott, Melissa R. Walsh, and Michael B. Mathews
Contents
1. Introduction 244
2. Expression of Epitope-Tagged Proteins 245
3. RNP Immunoprecipitation (RIP) Assay 246
3.1. Buffers 247
3.2. Procedure 247
3.3. Results: G2/M phase cells 248
3.4. Results: asynchronous cells 251
4. Identification of Unknown RNAs by PCR Amplification
and Sequencing 252
4.1. Primers 253
4.2. Procedure 253
4.3. Results 254
4.4. Poly(A)-tailing procedure 255
4.5. Results 256
5. Summary 256
Acknowledgment 258
References 258
Abstract
Ribonucleoprotein complexes (RNPs) perform a multitude of functions in the
cell. Elucidating the composition of such complexes and unraveling their many
interactions are current challenges in molecular biology. To stabilize complexes
formed in cells and to preclude reassortment of their components during isola-
tion, we employ chemical crosslinking of the RNA and protein moieties. Here we
describe the identification of cellular RNAs bound to nuclear factor 90 (NF90),
the founder member of a family of ubiquitous double-stranded RNA-binding
proteins. Crosslinked RNA–NF90 complexes were immunoprecipitated from
Methods in Enzymology, Volume 429 # 2007 Elsevier Inc.
ISSN 0076-6879, DOI: 10.1016/S0076-6879(07)29012-3 All rights reserved.
Department of Biochemistry and Molecular Biology, University of Medicine and Dentistry of New Jersey,New Jersey Medical School, Newark, New Jersey
243
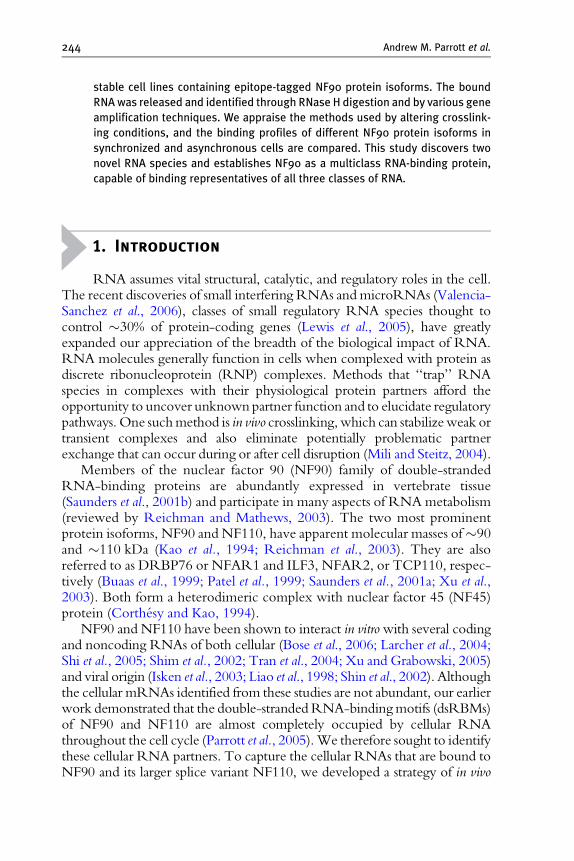
244 Andrew M. Parrott et al.
stable cell lines containing epitope-tagged NF90 protein isoforms. The bound
RNA was released and identified through RNase H digestion and by various gene
amplification techniques. We appraise the methods used by altering crosslink-
ing conditions, and the binding profiles of different NF90 protein isoforms in
synchronized and asynchronous cells are compared. This study discovers two
novel RNA species and establishes NF90 as a multiclass RNA-binding protein,
capable of binding representatives of all three classes of RNA.
1. Introduction
RNA assumes vital structural, catalytic, and regulatory roles in the cell.The recent discoveries of small interfering RNAs andmicroRNAs (Valencia-Sanchez et al., 2006), classes of small regulatory RNA species thought tocontrol 30% of protein-coding genes (Lewis et al., 2005), have greatlyexpanded our appreciation of the breadth of the biological impact of RNA.RNA molecules generally function in cells when complexed with protein asdiscrete ribonucleoprotein (RNP) complexes. Methods that ‘‘trap’’ RNAspecies in complexes with their physiological protein partners afford theopportunity to uncover unknownpartner function and to elucidate regulatorypathways. One suchmethod is in vivo crosslinking,which can stabilizeweak ortransient complexes and also eliminate potentially problematic partnerexchange that can occur during or after cell disruption (Mili and Steitz, 2004).
Members of the nuclear factor 90 (NF90) family of double-strandedRNA-binding proteins are abundantly expressed in vertebrate tissue(Saunders et al., 2001b) and participate in many aspects of RNAmetabolism(reviewed by Reichman and Mathews, 2003). The two most prominentprotein isoforms, NF90 and NF110, have apparent molecular masses of90and 110 kDa (Kao et al., 1994; Reichman et al., 2003). They are alsoreferred to as DRBP76 or NFAR1 and ILF3, NFAR2, or TCP110, respec-tively (Buaas et al., 1999; Patel et al., 1999; Saunders et al., 2001a; Xu et al.,2003). Both form a heterodimeric complex with nuclear factor 45 (NF45)protein (Corthe sy and Kao, 1994).
NF90 and NF110 have been shown to interact in vitrowith several codingand noncoding RNAs of both cellular (Bose et al., 2006; Larcher et al., 2004;Shi et al., 2005; Shim et al., 2002; Tran et al., 2004; Xu and Grabowski, 2005)and viral origin (Isken et al., 2003; Liao et al., 1998; Shin et al., 2002). Althoughthe cellular mRNAs identified from these studies are not abundant, our earlierwork demonstrated that the double-strandedRNA-bindingmotifs (dsRBMs)of NF90 and NF110 are almost completely occupied by cellular RNAthroughout the cell cycle (Parrott et al., 2005).We therefore sought to identifythese cellular RNA partners. To capture the cellular RNAs that are bound toNF90 and its larger splice variant NF110, we developed a strategy of in vivo

In Vivo RNA:Protein Interactions 245
crosslinking coupled with immunoprecipitation of epitope-tagged protein.Use of the epitope tag enhances the generality of themethod and largely avoidspossible complications resulting from antibody binding to critical features ofthe protein, such as its RNA-binding region.
2. Expression of Epitope-Tagged Proteins
Alternative splicing of ILF3 transcripts generates mRNAs encodingseveral isoforms of NF90 andNF110, both of which may contain an NVKQtetrapeptide insert between their two dsRBM motifs (Duchange et al.,2000). The ‘‘b’’ isoforms contain the insert, which is absent from the ‘‘a’’forms. To characterize the RNA partners of these proteins, we establishedstable human 293 cell lines expressing N-terminally epitope-tagged a and bisoforms of NF90 and NF110 (Fig. 12.1A). Stable cell lines were made bytransfection of monolayer 293 cells with pcDNA3.1HisB plasmid (Invitro-gen) constructs using Lipofectamine 2000 (Invitrogen). Single clones wereselected with cloning discs (Sigma) under 500 mg/ml G418 selection pres-sure, then passaged several times before immunoblot screening. High levelsof protein expression can lead to spurious interactions and ectopic localiza-tion within cells. Therefore, two criteria for the study of biologically mean-ingful interactions are that the tagged protein should not be substantiallyoverexpressed relative to its endogenous counterpart and that it shoulddisplay an identical cellular distribution. Examination of the NF90b-con-taining cell line showed that the tagged protein was expressed at slightlylower levels than its endogenous counterpart, and that the two proteinsdisplayed the same subcellular distribution when analyzed by differentialcentrifugation (Fig. 12.1B, upper panel). Both were present in the cyto-plasm, distributed evenly between the 100,000g pellet and supernatantfractions, P-100 and S-100. NF45, which accompanies both NF90 andNF110, had the same cytoplasmic distribution as NF90 (see Fig. 12.1B,middle panel). The RNA content of the fractions was analyzed to validatethe centrifugal fractionation: large RNA was resolved in an agarose gel andvisualized by ethidium bromide staining, and 30 end-radiolabeled smallRNA was resolved in an acrylamide/urea gel. As expected, 18S and 28SrRNA were enriched in the P-100 fraction, but absent from the S-100fraction (Fig. 12.1B, lower panel). Likewise, 5.8S rRNA was enriched inthe P-100 fraction and depleted in the S-100 fraction (Fig. 12.1C, upperpanel). A substantial proportion of 5S rRNA remained in the S-100 extract(see Fig. 12.1C, upper panel), presumably as RNP complexes awaiting entryto the nucleus and incorporation into nascent ribosomes (Lin et al., 2001).A Western blot for S6 ribosomal protein confirmed the presence of ribo-somes in the P-100 fraction (see Fig. 12.1C, lower panel). Similar results
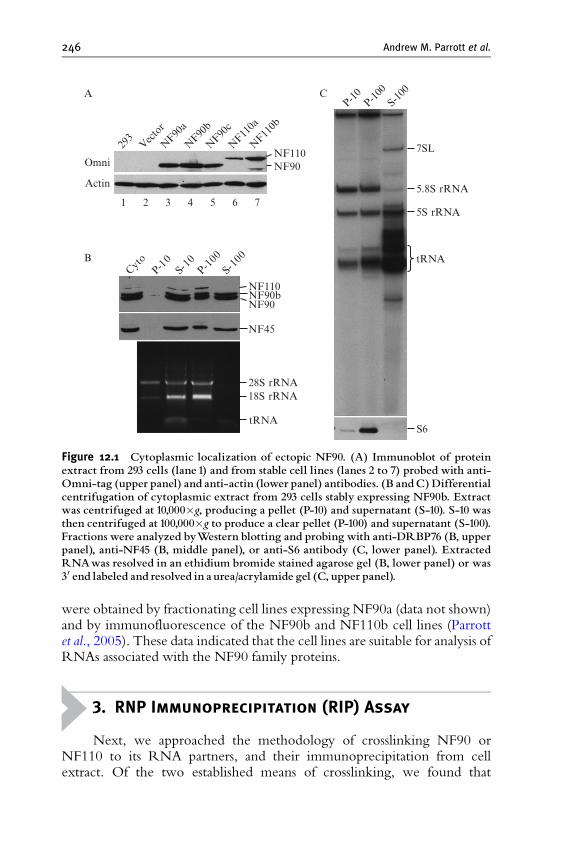
NF90
Cyto
P-10
S-10
P-10
0
S-10
0
NF90bNF90
NF110
NF45
A
S6
28S rRNA18S rRNA
tRNA
P-10
P-10
0S-10
0
5.8S rRNA
5S rRNA
tRNA
7SL
C
293
Vector
NF9
0a
NF9
0b
NF9
0c
NF1
10a
NF1
10b
Omni
1 32 4 5 6
Actin
NF110
B
7
Figure 12.1 Cytoplasmic localization of ectopic NF90. (A) Immunoblot of proteinextract from 293 cells (lane 1) and from stable cell lines (lanes 2 to 7) probed with anti-Omni-tag (upper panel) and anti-actin (lower panel) antibodies. (B andC)Differentialcentrifugation of cytoplasmic extract from 293 cells stably expressing NF90b. Extractwas centrifuged at 10,000g, producing a pellet (P-10) and supernatant (S-10). S-10 wasthen centrifuged at 100,000g to produce a clear pellet (P-100) and supernatant (S-100).Fractions were analyzed byWestern blotting and probing with anti-DRBP76 (B, upperpanel), anti-NF45 (B, middle panel), or anti-S6 antibody (C, lower panel). ExtractedRNAwas resolved in an ethidium bromide stained agarose gel (B, lower panel) or was30 end labeled and resolved in a urea/acrylamide gel (C, upper panel).
246 Andrew M. Parrott et al.
were obtained by fractionating cell lines expressing NF90a (data not shown)and by immunofluorescence of the NF90b and NF110b cell lines (Parrottet al., 2005). These data indicated that the cell lines are suitable for analysis ofRNAs associated with the NF90 family proteins.
3. RNP Immunoprecipitation (RIP) Assay
Next, we approached the methodology of crosslinking NF90 orNF110 to its RNA partners, and their immunoprecipitation from cellextract. Of the two established means of crosslinking, we found that

In Vivo RNA:Protein Interactions 247
formaldehyde was more effective than ultraviolet (UV) irradiation forestablishing the covalent attachment of NF90 to RNA. Formaldehydetreatment also has a distinct advantage in that its covalent attachment canbe reversed with heat under denaturing conditions. The overall crosslinkingscheme that we employed is based on that reported by Niranjanakumari andcolleagues (2002) with a significant change in the cell lysis procedure. Wefound that cell lysis by sonication as prescribed by these authors can bedetrimental to specificity. Therefore, we employed detergent lysis as theprimary means of cell lysis.
3.1. Buffers
RIPA: 50 mM Tris–HCl, pH 7.5, 1% NP-40 (v/v), 0.5% sodium deoxy-cholate (w/v), 0.05% sodium dodecyl sulfate (SDS) (w/v), 1 mM ethy-lenediaminetetraacetic acid (EDTA), 150 mM NaCl, 0.2 mMphenylmethylsulfonyl fluoride (PMSF), 0.5 mM dithiothreitol (DTT),0.1 mg/ml yeast tRNA, and 1 U/ml RNasin (Promega).
Harsh RIPA: 50 mM Tris–Cl, pH 7.5, 1% NP-40 (v/v), 1% sodiumdeoxycholate (w/v) , 0.1% SDS (w/v), 1 mM EDTA, 0.4 M NaCl,0.2 M urea, and 0.2 mM PMSF.
Crosslink reversal: 50 mM Tris–Cl, pH 7, 5 mM EDTA, 10 mM DTT, and1% SDS (w/v).
Formamide loading buffer: 10 mM Tris, pH 8, 20 mM EDTA, pH 8, 95%formamide (v/v), 0.005% bromophenol blue, and 0.005% xylene cyanol.
RT: 20 mM Tris–HCl, pH 8.4, 50 mM KCl, 2.5 mM MgCl2, 10 mMDTT, 0.4 mM dNTPs, and 1 U/ml RNasin (Promega).
Elution: 10 mM Tris–HCl, pH 8.5.Tailing: 10 mM Tris–HCl, pH 8.4, 25 mM KCl, 1.5 mM MgCl2, and0.2 mM dCTP.
3.2. Procedure
All incubations were carried out at room temperature unless stated other-wise. Asynchronously growing 293 cells (90% confluent cells growing infour 150-mm dishes) were growth arrested with 0.1 mg/ml cycloheximidefor 3 min at 37. Cycloheximide interferes with polypeptide chain elonga-tion and effectively ‘‘freezes’’ the polysome profile of the cell. Cells werewashed in 10 ml phosphate-buffered saline (PBS, Sigma) supplementedwith 0.1 mg/ml cycloheximide and 7 mM MgCl2, then incubated in10 ml PBS with 7 mM MgCl2 and 0.15 or 0.5% formaldehyde for 10 minon an orbital shaker. The crosslinking reaction was quenched with theaddition of 2 M glycine (pH 7) to 0.25 M and incubating for 5 min withshaking. Cells were harvested by scraping and pelleted at 500g for 1 minat 4. To obtain cells synchronized at the G2/M phase boundary, cells
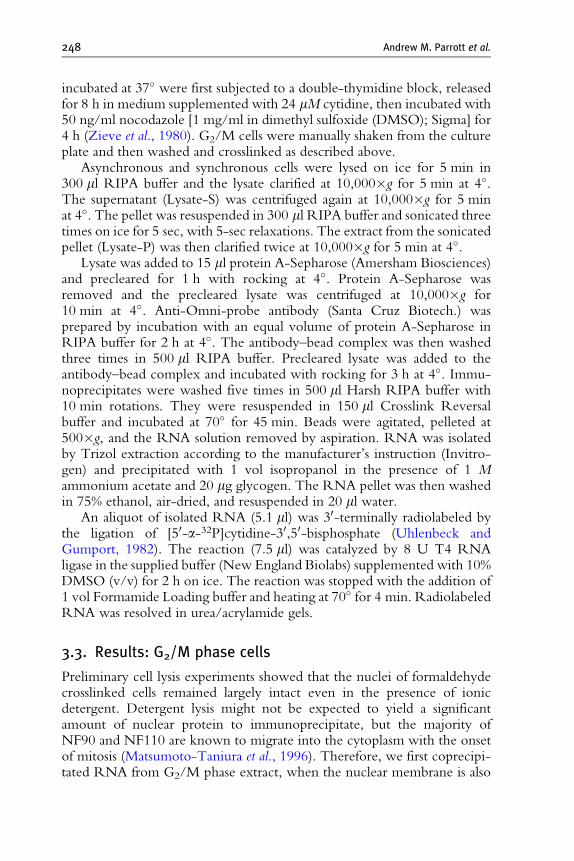
248 Andrew M. Parrott et al.
incubated at 37 were first subjected to a double-thymidine block, releasedfor 8 h in medium supplemented with 24 mM cytidine, then incubated with50 ng/ml nocodazole [1 mg/ml in dimethyl sulfoxide (DMSO); Sigma] for4 h (Zieve et al., 1980). G2/M cells were manually shaken from the cultureplate and then washed and crosslinked as described above.
Asynchronous and synchronous cells were lysed on ice for 5 min in300 ml RIPA buffer and the lysate clarified at 10,000g for 5 min at 4.The supernatant (Lysate-S) was centrifuged again at 10,000g for 5 minat 4. The pellet was resuspended in 300 ml RIPA buffer and sonicated threetimes on ice for 5 sec, with 5-sec relaxations. The extract from the sonicatedpellet (Lysate-P) was then clarified twice at 10,000g for 5 min at 4.
Lysate was added to 15 ml protein A-Sepharose (Amersham Biosciences)and precleared for 1 h with rocking at 4. Protein A-Sepharose wasremoved and the precleared lysate was centrifuged at 10,000g for10 min at 4. Anti-Omni-probe antibody (Santa Cruz Biotech.) wasprepared by incubation with an equal volume of protein A-Sepharose inRIPA buffer for 2 h at 4. The antibody–bead complex was then washedthree times in 500 ml RIPA buffer. Precleared lysate was added to theantibody–bead complex and incubated with rocking for 3 h at 4. Immu-noprecipitates were washed five times in 500 ml Harsh RIPA buffer with10 min rotations. They were resuspended in 150 ml Crosslink Reversalbuffer and incubated at 70 for 45 min. Beads were agitated, pelleted at500g, and the RNA solution removed by aspiration. RNA was isolatedby Trizol extraction according to the manufacturer’s instruction (Invitro-gen) and precipitated with 1 vol isopropanol in the presence of 1 Mammonium acetate and 20 mg glycogen. The RNA pellet was then washedin 75% ethanol, air-dried, and resuspended in 20 ml water.
An aliquot of isolated RNA (5.1 ml) was 30-terminally radiolabeled bythe ligation of [50-a-32P]cytidine-30,50-bisphosphate (Uhlenbeck andGumport, 1982). The reaction (7.5 ml) was catalyzed by 8 U T4 RNAligase in the supplied buffer (New England Biolabs) supplemented with 10%DMSO (v/v) for 2 h on ice. The reaction was stopped with the addition of1 vol Formamide Loading buffer and heating at 70 for 4 min. RadiolabeledRNA was resolved in urea/acrylamide gels.
3.3. Results: G2/M phase cells
Preliminary cell lysis experiments showed that the nuclei of formaldehydecrosslinked cells remained largely intact even in the presence of ionicdetergent. Detergent lysis might not be expected to yield a significantamount of nuclear protein to immunoprecipitate, but the majority ofNF90 and NF110 are known to migrate into the cytoplasm with the onsetof mitosis (Matsumoto-Taniura et al., 1996). Therefore, we first coprecipi-tated RNA from G2/M phase extract, when the nuclear membrane is also

NF9
0a
NF9
0b
Vector
NF9
0a
NF9
0b
Vector
Lysate-S Lysate-SLysate-P Lysate-P
Sup
10
−3
Sup
10
−3
5.8S rRNA
5S rRNA
tRNA
1 2 3 4 5 6 7
0.15% HCHO
8 9 10 11 12 13 14 15 16
NF9
0a
NF9
0b
Vector
NF9
0a
NF9
0b
Vector
Sup
10
−3
Sup
10
−3
0.5% HCHO
Figure 12.2 Visualization of immunoprecipitated RNA.Vector, NF90a, and NF90bstable cell lines were arrested at the G2/M boundary, treatedwith 0.15 or 0.5% formalde-hyde, and lysed inRIPAbuffer.The lysatewas centrifuged at10,000g, producing super-natant (Lysate-S) and a pellet that was resuspended, sonicated, and centrifuged at10,000g, and the supernatant retained (Lysate-P). RNA immunoprecipitated withOmni-probe antibody from Lysate-S and -P was 30 end labeled and resolved in a urea/acrylamide gel. RNAextracted fromthe immunoprecipitation supernatant (Sup) of thevectorcell line served as amarker.
In Vivo RNA:Protein Interactions 249
relatively porous. Immunoprecipitation of NF90 from Lysate-S yieldedspecific small RNAs (Fig. 12.2, lanes 2 to 4 and 10 to 12). Immunoprecipita-tion from Lysate-P resulted in quantitative, but not qualitative, differences inthe RNA band pattern when compared to the vector control (Fig. 12.2,lanes 6 to 8 and 14 to 16). The relatively high background seenwith Lysate-P(compare lanes 6 and 14 with lanes 2 and 10) led us to favor Lysate-S.
We employed RNase H digestion to confirm the identity of some of themore abundant RNAs that were crosslinked and immunoprecipitated withNF90. Figure 12.3A demonstrates the RNase H digestion of 5.8S (lanes 1and 2) and 5S rRNA (lanes 3 and 4) when annealed to their respectiveantisense oligonucleotides. Reverse transcription followed by polymerasechain reaction (RT-PCR) with specific primers was used to identify7SK RNA complexed with NF90b in Lysate-P (Fig. 12.3B, upper panel).

Vector
Sup
10
−3
NF9
0a
NF9
0b
7SK
NF90bNF90aVector
S SAS ASb -actin mRNA
Vector
NF9
0a
NF9
0b
A
NF90a/b
NF45
IgG
IgG
C
1 2 3
B
*
In Sup
IP In Sup
IP In Sup
IP
Lys
ate-
SL
ysat
e-P
NF90a/b
IgG
NF90a/b
IgG
D
5.8S rR
NA
5S rR
NA
5.8S rRNA
5S rRNA
?
4
Figure 12.3 Analysis of immunoprecipitated RNA and protein. (A) 30 End-labeledRNA immunoprecipitated from NF90b Lysate-P (G2/M, 0.5% HCHO) was digestedwith RNase H in the presence of 5.8S or 5S rRNA sense (S) or antisense (AS) oligonu-cleotides and resolved in a urea/acrylamide gel. (B) RT-PCR of 7SK and b-actinmRNA immunoprecipitated from Lysate-P (G2/M, 0.15% HCHO). RNA extractedfrom the vector cell line supernatant (Sup) served as a positive control. (C) Westernblot of Lysate-S and -P (G2/M, 0.15% HCHO) probed with Omni-probe antibody.Input (In), supernatant (Sup), and Omni-probe antibody immunoprecipitate (IP) lanesare present and heavy IgG chain is denoted. (D) Immunoprecipitate from Lysate-S(G2/M, 0.5% HCHO) was resolved in an SDS^PAGE gel and silver stained. Asteriskdenotes a nonspecific protein that comigrates with taggedNF90, and IgG heavy and lightchains aredenoted.
250 Andrew M. Parrott et al.
The high background of nonspecific binding mentioned above is evidencedby the detection of b-actin mRNA in all of the Lysate-P immunoprecipi-tates (Fig. 12.3B, lower panel).
The effect of varying the concentration of formaldehyde used for cross-linking was investigated. Figure 12.2 shows the different RNA profilesachieved by incubating G2/M phase cells with 0.15% or 0.5% formaldehyde.It was found that 5.8S rRNA was prominent in NF90 immunoprecipitatefrom cells treated with a low concentration of formaldehyde (0.15%)(Fig. 12.2, lanes 4 and 8). However, the presence of 5.8S rRNA was reducedin NF90 immunoprecipitate from Lysate-S with an increase in formaldehydeconcentration to 0.5% (Fig. 12.2, compare lane 4with lane 12), suggesting thatthe presence of macromolecular complexes such as ribosomes in Lysate-S isreduced with increased crosslinking. We find that half of cytoplasmic NF90fractionates in the P-100 extract (Fig. 12.1B, upper panel), and others haveobserved NF90 in the ribosomal salt wash fraction (Langland et al., 1999).

In Vivo RNA:Protein Interactions 251
NF90 might then be thought to associate with ribosomes by binding directlyto 5.8S rRNA. Additional bands migrating between tRNA and 5.8S rRNAalso became apparent with an increase in formaldehyde concentration, possi-bly indicating that transient complexes are ‘‘trapped’’ more efficiently withincreased crosslinking (Fig. 12.2, compare lane 4 with lane 12).
The efficiency of immunoprecipitation was examined by Western blot-ting (Fig. 12.3C). Both NF90 isoforms were effectively immunodepletedfrom Lysate-S supernatant (Fig. 12.3C, upper panel), but less so fromLysate-P supernatant (Fig. 12.3C, lower panel), probably because the pro-tein is buried in macromolecular complexes in the latter. In support of thisinterpretation, an increased formaldehyde concentration resulted in lessNF90 immunoprecipitated from Lysate-P (not shown). The presence orabsence of a tetrapeptide insert in the NF90 isoform did not appear to alterits RNA-binding specificity. However, NF90a was consistently expressedat a level lower than NF90b, and this resulted in less RNA being copreci-pitated ( Figs. 12.2 and 12.4A ). Attempts to immunoprecipitate crosslinkedNF110 isoforms from Lysate-S and Lysate-P were unsuccessful (notshown), probably because this protein is involved in large nuclear com-plexes (Parrott et al., 2005), which could mask the epitope tag or lead toinsolubility after crosslinking.
Coprecipitated protein was also analyzed by silver staining (Fig. 12.3D).Both NF90a and NF90b coprecipitated NF45 in an approximately stoi-chiometric amount; it is therefore likely that the NF90:NF45 heterodimericcomplex associates with the RNA isolated in the RIP assay, not NF90alone. Other unidentified proteins with apparent masses of 60 to 90 kDawere enriched in the NF90 immunoprecipitates (Fig. 12.3D, bracket), and anonspecific protein comigrated with tagged NF90 (Fig. 12.3D, asterisk).Evidently not all associated proteins were removed by harsh washing con-ditions, implying that these proteins, like NF45, may be crosslinked toNF90. This conclusion raises the possibility that isolated RNAs are boundindirectly to NF90, necessitating further studies to establish direct binding.We have confirmed by GST pull-down assay that the two novel RNAsidentified here bind directly to the dsRBMs of NF90 (A. M. Parrott andM. B. Mathews, unpublished observations).
3.4. Results: asynchronous cells
Immunoprecipitation of NF90 from Lysate-S prepared from asynchronouscells also yielded specific RNA bands (Fig. 12.4A, lanes 5 and 6). Thepresence of 5S and 5.8S rRNA in Lysate-P immunoprecipitates was con-firmed by RNase H digestion assay (Fig. 12.4B), as was that of 7SK fromLysate-S (not shown). The immunoprecipitation from Lysate-S of 7SL, theRNA component of the signal recognition particle, was also confirmed byRNase H digestion (not shown).
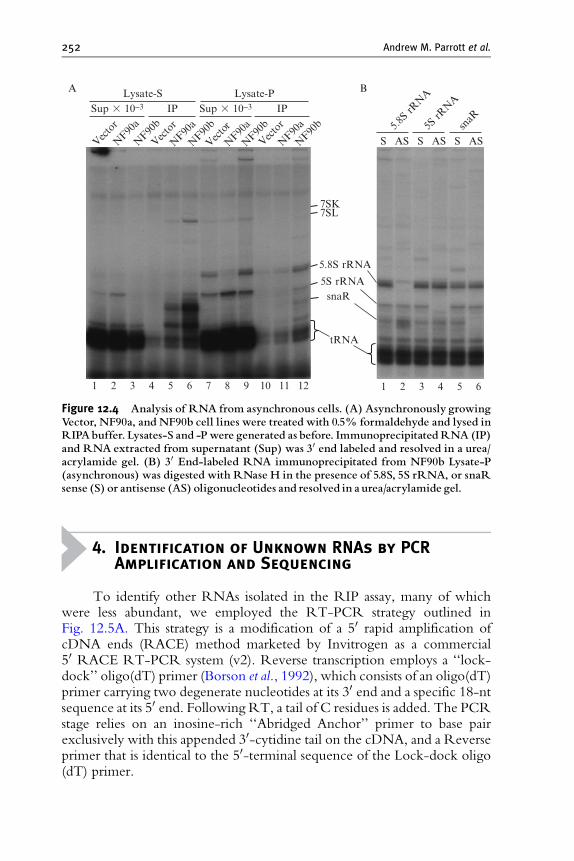
NF9
0a
NF9
0b
Vector
NF9
0a
Vector
NF9
0a
NF9
0b
Vector
NF9
0a
NF9
0b
Vector
NF9
0b
Sup 10−3 IP IPLysate-S Lysate-P
Sup 10−3
7SL
tRNA
1 2 3 4 5 6 1 2 3 4 5 67 8 9 10 11 12
5.8S rRNA
5S rRNA
7SK
A
S S SAS ASAS5.8
S rR
NA
5S rR
NA
snaR
snaR
B
Figure 12.4 Analysis of RNA from asynchronous cells. (A) Asynchronously growingVector, NF90a, and NF90b cell lines were treated with 0.5% formaldehyde and lysed inRIPAbuffer. Lysates-S and -Pwere generated as before. ImmunoprecipitatedRNA (IP)and RNA extracted from supernatant (Sup) was 30 end labeled and resolved in a urea/acrylamide gel. (B) 30 End-labeled RNA immunoprecipitated from NF90b Lysate-P(asynchronous) was digested with RNase H in the presence of 5.8S, 5S rRNA, or snaRsense (S) or antisense (AS) oligonucleotides and resolved in a urea/acrylamide gel.
252 Andrew M. Parrott et al.
4. Identification of Unknown RNAs by PCRAmplification and Sequencing
To identify other RNAs isolated in the RIP assay, many of whichwere less abundant, we employed the RT-PCR strategy outlined inFig. 12.5A. This strategy is a modification of a 50 rapid amplification ofcDNA ends (RACE) method marketed by Invitrogen as a commercial50 RACE RT-PCR system (v2). Reverse transcription employs a ‘‘lock-dock’’ oligo(dT) primer (Borson et al., 1992), which consists of an oligo(dT)primer carrying two degenerate nucleotides at its 30 end and a specific 18-ntsequence at its 50 end. Following RT, a tail of C residues is added. The PCRstage relies on an inosine-rich ‘‘Abridged Anchor’’ primer to base pairexclusively with this appended 30-cytidine tail on the cDNA, and a Reverseprimer that is identical to the 50-terminal sequence of the Lock-dock oligo(dT) primer.
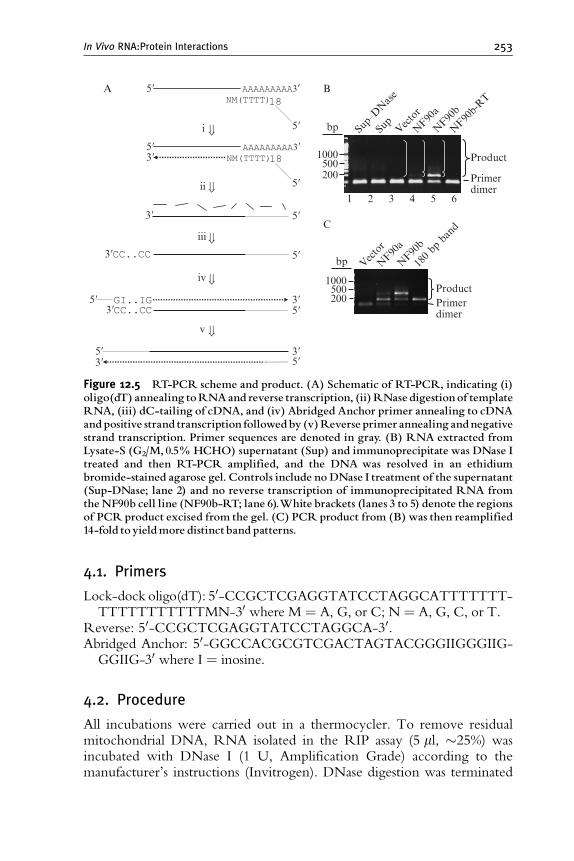
AAAAAAAAA3NM(TTTT)
GI..IG
5
35
3
3CC..CC
3CC..CC5
5
5
5
5
5
i
ii
iii
iv
Primerdimer
Primerdimer
Product
BA
bp Vector
5001000
200
Sup–
DNase
Sup
NF9
0a
NF9
0b
NF9
0b-R
T
Vector
NF9
0a
NF9
0b
180 bp
ban
d
Product
bp
5001000
200
C
AAAAAAAAA3NM(TTTT)18
18
3
5 3
v
53
654321
Figure 12.5 RT-PCR scheme and product. (A) Schematic of RT-PCR, indicating (i)oligo(dT) annealing toRNAand reverse transcription, (ii)RNase digestionof templateRNA, (iii) dC-tailing of cDNA, and (iv) Abridged Anchor primer annealing to cDNAandpositive strand transcription followedby (v)Reverse primer annealing andnegativestrand transcription. Primer sequences are denoted in gray. (B) RNA extracted fromLysate-S (G2/M, 0.5% HCHO) supernatant (Sup) and immunoprecipitate was DNase Itreated and then RT-PCR amplified, and the DNA was resolved in an ethidiumbromide-stained agarose gel. Controls include no DNase I treatment of the supernatant(Sup-DNase; lane 2) and no reverse transcription of immunoprecipitated RNA fromtheNF90b cell line (NF90b-RT; lane 6).White brackets (lanes 3 to 5) denote the regionsof PCRproduct excised from the gel. (C) PCRproduct from (B) was then reamplified14-fold toyieldmore distinctband patterns.
In Vivo RNA:Protein Interactions 253
4.1. Primers
Lock-dock oligo(dT): 50-CCGCTCGAGGTATCCTAGGCATTTTTTT-TTTTTTTTTTTMN-30 where M ¼ A, G, or C; N ¼ A, G, C, or T.
Reverse: 50-CCGCTCGAGGTATCCTAGGCA-30.Abridged Anchor: 50-GGCCACGCGTCGACTAGTACGGGIIGGGIIG-GGIIG-30 where I ¼ inosine.
4.2. Procedure
All incubations were carried out in a thermocycler. To remove residualmitochondrial DNA, RNA isolated in the RIP assay (5 ml, 25%) wasincubated with DNase I (1 U, Amplification Grade) according to themanufacturer’s instructions (Invitrogen). DNase digestion was terminated

254 Andrew M. Parrott et al.
with EDTA (2.3 mM final) for 10 min at 65. Lock-dock oligo(dT) reversetranscription primer was added to the RNA solution (0.1 mM final) andannealed by heating at 70 for 10 min, then cooling. Reverse transcription(15 ml final) was performed in RT buffer at 42 for 50 min using Super-Script II Reverse Transcriptase (200 U, Invitrogen). The reaction wasterminated at 70 for 15 min and RNA was digested with 0.5 ml RNase(15 U/ml RNase T1, 4 U/ml RNase H) for 30 min at 37.
cDNA was twice purified through a QIAquick desalting column (Qia-gen), eluting in 30 ml Elution buffer. Column purification reduces (but doesnot eliminate) the formation of primer–dimer byproducts in the subsequentPCR step. To add the 30-deoxycytidine tail, cDNA (10 ml) was heated at94 for 2 min in Tailing buffer (25 ml final), then chilled, before incubatingwith terminal deoxynucleotidyltransferase (8 U, New England BioLabs) for10 min at 37. The reaction was terminated at 65 for 10 min in readinessfor standard PCR. cDNA (5 ml) was amplified over 30 cycles with anannealing temperature of 63, using Reverse primer, Abridged Anchorprimer (Invitrogen), and SuperTaq polymerase (2.5 U, Ambion).
4.3. Results
RT-PCR products were resolved in agarose gels and visualized by ethidiumbromide staining. RT-PCR product was generated from NF90a andNF90b immunoprecipitates, but not in the absence of reverse transcriptaseor from empty vector control cells (Fig. 12.5B). Despite column purifica-tion of cDNA, primer–dimer byproducts tended to dominate subsequentcloning steps, so RT-PCR product was routinely excised from the gel,separating away the primer–dimer band. A dominant 180-bp productapparent in the NF90a and NF90b lanes was also isolated prior to cloning(Fig. 12.5B, white brackets). DNA was eluted from the excised gel and wasamplified over a further 14 PCR cycles yielding a more detailed bandpattern (Fig. 12.5C). PCR products were then ligated via TOPO TACloning technology (Invitrogen) into pCR2.1-TOPO vector (Invitrogen),and the ligation mix was used to transform competent Escherichia coli cells.Colonies were selected on the basis of blue-white screening and PCRinserts were sequenced by priming from the oligo(dT) end. Sequencingfrom the 50 end through the guanosine-rich Abridged Anchor primer oftenled to failed or truncated reads. The results of several cloning experimentsare summarized in Table 12.1. The most abundant clones corresponded to anovel family of small RNAs represented by the 180-bp band mentionedabove and termed snaR (Fig. 12.4B; A. M. Parrott and M. B. Mathews,unpublished observations), closely followed by the SINE repetitive ele-ment, dimeric Alu. The presence of snaR is visualized in NF90a and bimmunoprecipitates from Lysate-S (Fig. 12.4A, lanes 5 and 6) and in NF90b

Table 12.1 RNA species identified
Cell cycle stage andenzymatic treatment RNAspecies (numberof clones)
G2/M without DNase I Mitochondrial DNA (2), Alu-Y (2), snaR-A,
RPS19 intron containing Alu and Mir
sequence
G2/M Alu-S (4), snaR-A (4), snaR-B (2),
RPS9 mRNA (last exon including whole
30 UTR), mature RPSA mRNA (last two
exons and part of a third), Znf131 mRNA
(intron)
Asynchronous snaR-A (13), Alu-S (9), snaR-B, Alu-Y
Asynchronous with poly(A)
tailing
Pre-tRNAimet, hY5, U3 snRNA (180 nt
fragment)
G2/M and asynchronousa 5S rRNA, 5.8S rRNA, 7SL, 7SK
a RNA species were identified by RNase H digestion or gene-specific RT-PCR. All other species wereidentified by 50-RACE.
In Vivo RNA:Protein Interactions 255
immunoprecipitate from Lysate-P (Fig. 12.4A, lane 12), and was confirmedby RNase H digestion (Fig. 12.4B, lanes 5 and 6).
The RT-PCR procedure outlined above has two major limitations:first, the unknown RNA must possess a 30 oligo(A) tract to be copied intocDNA. We note that NF90 appears capable of binding RNAs such as 5.8SrRNA that do not possess a natural poly(A) tail. Second, RNA species suchas Alu and snaR may dominate the PCR reaction and prevent the detectionof rare RNAs. Hence, we modified our approach by excising gel regionsdevoid of Alu and snaR, and enzymatically appending a poly(A) tail ontothe eluted RNA.
4.4. Poly(A)-tailing procedure
A region of 5% acrylamide/7 M urea gel containing 30 end-labeled RNAbetween the snaR and tRNA bands (Fig. 12.4A, lanes 4 to 6) was excisedand the RNA eluted in 400 ml TE, pH 7.4, with 0.5% SDS (w/v) for 1.5 hat 25. The RNA was extracted with 1 vol phenol, then twice with 1 volchloroform:isoamyl alcohol (24:1). The RNA was precipitated with 2.5 volethanol in the presence of 20 mg glycogen and 1 M ammonium acetate ondry ice. The RNA pellet was dissolved in 26 ml water and treated with 1 Ucalf intestinal phosphatase according to the manufacturer’s instructions(New England Biolabs.). The RNA was extracted and precipitated asdescribed, then subjected to poly(A) tail addition using poly(A) polymerase(1 U) according to the manufacturer’s instructions (Invitrogen; 2.5 mM

256 Andrew M. Parrott et al.
ATP final). The RNA was extracted and precipitated as described inreadiness for RT-PCR.
4.5. Results
Although the poly(A) tailing procedure demands three extraction andprecipitation steps, which resulted in a 60% loss in RNA quantity (asdetermined by scintillation counting), it led to the identification of apreviously uncharacterized precursor of tRNAi
met and of hY5 RNA(Table 12.1).
5. Summary
The methods described here employ in vivo chemical crosslinkingcoupled with immunoprecipitation to stabilize and isolate RNP complexesfrom cells. Several RNA species (12) were found to associate with NF90protein, including two previously unidentified species. RNP complexes wereimmunoprecipitated from two different extracts, Lysate-S and Lysate-P.RNAs purified from these complexes were radiolabeled and resolved bygel electrophoresis. The relative amount of a particular RNA bound toNF90 could then be visualized and the relative solubility of its RNP couldbe gauged by varying the formaldehyde concentration. RNAs that comi-grated with abundant RNAs were identified by sequence-specific analysissuch as RNase H digestion. Those RNAs that were too scarce to bevisualized in a gel or did not comigrate with an abundant RNA wereidentified by 50-RACE RT-PCR. The latter scheme was modified toidentify nonpolyadenylated as well as polyadenylated RNAs.
The RNAs identified in this study (Table 12.1) are of disparate origin,between them being transcribed by all three eukaryotic RNA polymerases.Their relative abundance is also very different, ranging from mRNAs (suchas that for RPS9) and previously undescribed RNAs (snaR and a precursorof tRNAi
met) to among the most common cellular RNA species (5.8SrRNA). Care must be taken in interpreting data that include highly abun-dant RNAs such as 5S and 5.8S rRNA and tRNA.We observe that tRNAsare well represented in vector-alone immunoprecipitates, and conclude thatthese RNAs are non-specifically bound (Figs. 12.2 and 12.4A). Although5.8S rRNA is precipitated from vector alone Lysate-P extracts, it is highlyenriched in NF90 immunoprecipitations, particularly from G2/M cells(Fig. 12.2, lanes 4, 8, 12, and 16), when most ribosomes are dissociatedfrom mRNA and exist as free 40S and 60S subunits (Qin and Sarnow,2004). The 5S rRNA is slightly enriched in NF90 immunoprecipitations,but its presence, which is considerably less than that of 5.8S rRNA, could be

In Vivo RNA:Protein Interactions 257
a consequence of NF90 binding directly to ribosomes via 5.8S rRNA.Given that a substantial proportion of cytoplasmic NF90 is found in theP-100 pellet (Fig. 12.1) and that 5.8S rRNA is a major NF90 bindingpartner (Fig. 12.2), it is possible that NF90 exerts some influence ontranslation. Interestingly, three out of four mRNAs found to crosslinkwith NF90 are related to the small ribosomal subunit: two encode structuralcomponents (RPS9 and RPS19) and one encodes ribosomal protein SA(RPSA), which associates with the 40S subunit (Tohgo et al., 1994).
The dimeric form of Alu is a rare and unstable RNA polymerase III(PolIII) transcript estimated to be present in the cytosol at 100 to 1000copies per cell (Li and Schmid, 2004; Liu et al., 1994). However, dimericAlu was the second most abundant clone isolated (Table 12.1). Transcrip-tion of this RNA is rapidly upregulated (within 20 min in HeLa cells) in 293cells in response to translational inhibitors such as cycloheximide (Liu et al.,1995). Therefore, it is feasible that dimeric Alu RNA levels are elevated inthis study, but even after maximum induction (20-fold over 3 h in HeLacells), Alu levels approached only 5% of the level of 7SL RNA in the cell(Liu et al., 1995). There are more than one million Alu element copieswithin the human genome and the majority are inserted into untranslatedregions or introns of PolII-transcribed mRNA. Strikingly, this study iden-tified only one such Alu element in an intronic region of the ribosomalprotein S19. Therefore, polIII-transcribed dimeric Alu RNA is probably abiologically meaningful partner of NF90.
A number of PolIII-transcribed RNAs found to associate with NF90 inthis study are linked by secondary structure and even origin. Alu RNAs areconsidered to be derived from and share considerable sequence with 7SLRNA. These RNAs have a common secondary structure motif and bothbind the cognate signal recognition particle proteins SRP9/14 (Hasler andStrub, 2006). Human Ro-associated Y5 RNA folds into a stable hairpinloop structure, reminiscent of the left arm of the Alu dimer (van Gelderet al., 1994). Furthermore, the most abundant clone snaR-A and its closerelative snaR-B probably also fold into stable hairpin loops (A. M. Parrottand M. B. Mathews, unpublished observations). This secondary structuremotif could be conducive to NF90 binding and NF90 might play a role inthe biology of RNA polIII transcripts and possibly in their maturation:NF90 protein specifically binds a novel precursor of tRNAi
met, but hasgreatly reduced affinity for the mature form (data not shown).
The main objective of this study was to utilize in vivo crosslinking to findRNA partners and thereby reveal the functional roles of NF90 within theuninfected cell. A number of very different RNAs were isolated and identi-fied, but functional interpretation remains speculative. Noting that theRNAs can be grouped into those with a shared origin (PolIII-transcribed)and those with ribosome/translation-related biology, NF90 might have atleast two roles within the cell. This study places NF90 among a small group
258 Andrew M. Parrott et al.
of RNA-binding proteins that recognizes different classes of cellular RNA.The La protein is a well-known member of this group. Like NF90, La is aphosphoprotein that appears to have two overlapping functions, the biogen-esis of PolIII transcripts and the coordination of the production of thetranslational machinery (Kenan and Keene, 2004). While the NF90a and bisoforms appear to bind the same spectrum of RNA species, the present datado not altogether discount the possibility that alternative splicing and phos-phorylation status may modulate partner recognition.
ACKNOWLEDGMENT
This work was supported by Grant R01 AI034552 from the National Institutes of Health.
REFERENCES
Borson, N. D., Salo, W. L., and Drewes, L. R. (1992). A lock-docking oligo(dT) primer for50 and 30 RACE PCR. PCR Methods Appl. 2, 144–148.
Bose, S. K., Sengupta, T. K., Bandyopadhyay, S., and Spicer, E. K. (2006). Identificationof Ebp1 as a component of cytoplasmic bcl-2 mRNP (messenger ribonucleoproteinparticle) complexes. Biochem. J. 396, 99–107.
Buaas, F. W., Lee, K., Edelhoff, S., Disteche, C., and Braun, R. E. (1999). Cloning andcharacterization of the mouse interleukin enhancer binding factor 3 (Ilf3) homolog in ascreen for RNA binding proteins. Mamm. Genome 10, 451–456.
Corthesy, B., and Kao, P. N. (1994). Purification by DNA affinity chromatography of twopolypeptides that contact the NF-AT DNA binding site in the interleukin 2 promoter.J. Biol. Chem. 269, 20682–20690.
Duchange, N., Pidoux, J., Camus, E., and Sauvaget, D. (2000). Alternative splicing in thehuman interleukin enhancer binding factor 3 (ILF3) gene. Gene 261, 345–353.
Hasler, J., and Strub, K. (2006). Alu RNP and Alu RNA regulate translation initiationin vitro. Nucleic Acids Res. 34, 2374–2385.
Isken, O., Grassmann, C. W., Sarisky, R. T., Kann, M., Zhang, S., Grosse, F., Kao, P. N.,and Behrens, S. E. (2003). Members of the NF90/NFAR protein group are involved inthe life cycle of a positive-strand RNA virus. EMBO J. 22, 5655–5665.
Kao, P. N., Chen, L., Brock, G., Ng, J., Kenny, J., Smith, A. J., and Corthesy, B. (1994).Cloning and expression of cyclosporin A- and FK506-sensitive nuclear factor of activatedT-cells: NF45 and NF90. J. Biol. Chem. 269, 20691–20699.
Kenan, D. J., and Keene, J. D. (2004). La gets its wings. Nat. Struct. Mol. Biol. 11, 303–305.Langland, J. O., Kao, P. N., and Jacobs, B. L. (1999). Nuclear factor-90 of activated T-cells:
A double-stranded RNA-binding protein and substrate for the double-stranded RNA-dependent protein kinase, PKR. Biochemistry 38, 6361–6368.
Larcher, J. C., Gasmi, L., Viranaicken, W., Edde, B., Bernard, R., Ginzburg, I., andDenoulet, P. (2004). Ilf3 and NF90 associate with the axonal targeting element of TaumRNA. FASEB J. 18, 1761–1763.
Lewis, B. P., Burge, C. B., and Bartel, D. P. (2005). Conserved seed pairing, often flankedby adenosines, indicates that thousands of human genes are microRNA targets. Cell 120,15–20.

In Vivo RNA:Protein Interactions 259
Li, T. H., and Schmid, C. W. (2004). Alu’s dimeric consensus sequence destabilizes itstranscripts. Gene 324, 191–200.
Liao, H. J., Kobayashi, R., and Mathews, M. B. (1998). Activities of adenovirus virus-associated RNAs: Purification and characterization of RNA binding proteins. Proc. Natl.Acad. Sci. USA 95, 8514–8519.
Lin, E., Lin, S. W., and Lin, A. (2001). The participation of 5S rRNA in the co-translationalformation of a eukaryotic 5S ribonucleoprotein complex. Nucleic Acids Res. 29,2510–2516.
Liu, W. M., Maraia, R. J., Rubin, C. M., and Schmid, C. W. (1994). Alu transcripts:Cytoplasmic localisation and regulation by DNA methylation. Nucleic Acids Res. 22,1087–1095.
Liu, W. M., Chu, W. M., Choudary, P. V., and Schmid, C. W. (1995). Cell stress andtranslational inhibitors transiently increase the abundance of mammalian SINE tran-scripts. Nucleic Acids Res. 23, 1758–1765.
Matsumoto-Taniura, N., Pirollet, F., Monroe, R., Gerace, L., and Westendorf, J. M.(1996). Identification of novel M phase phosphoproteins by expression cloning. Mol.Biol. Cell. 7, 1455–1469.
Mili, S., and Steitz, J. A. (2004). Evidence for reassociation of RNA-binding proteins aftercell lysis: Implications for the interpretation of immunoprecipitation analyses. Rna 10,1692–1694.
Niranjanakumari, S., Lasda, E., Brazas, R., and Garcia-Blanco, M. A. (2002). Reversiblecross-linking combined with immunoprecipitation to study RNA-protein interactionsin vivo. Methods 26, 182–190.
Parrott, A. M., Walsh, M. R., Reichman, T.W., andMathews, M. B. (2005). RNA bindingand phosphorylation determine the intracellular distribution of nuclear factors 90 and110. J. Mol. Biol. 348, 281–293.
Patel, R. C., Vestal, D. J., Xu, Z., Bandyopadhyay, S., Guo, W., Erme, S. M.,Williams, B. R., and Sen, G. C. (1999). DRBP76, a double-stranded RNA-bindingnuclear protein, is phosphorylated by the interferon-induced protein kinase, PKR.J. Biol. Chem. 274, 20432–20437.
Qin, X., and Sarnow, P. (2004). Preferential translation of internal ribosome entry site-containing mRNAs during the mitotic cycle in mammalian cells. J. Biol. Chem. 279,13721–13728.
Reichman, T. W., and Mathews, M. B. (2003). RNA binding and intramolecular interac-tions modulate the regulation of gene expression by nuclear factor 110. Rna 9, 543–554.
Reichman, T. W., Parrott, A. M., Fierro-Monti, I., Caron, D. J., Kao, P. N., Lee, C. G.,Li, H., and Mathews, M. B. (2003). Selective regulation of gene expression by nuclearfactor 110, a member of the NF90 family of double-stranded RNA-binding proteins.J. Mol. Biol. 332, 85–98.
Saunders, L. R., Jurecic, V., and Barber, G. N. (2001a). The 90- and 110-kDa humanNFAR proteins are translated from two differentially spliced mRNAs encoded onchromosome 19p13. Genomics 71, 256–259.
Saunders, L. R., Perkins, D. J., Balachandran, S., Michaels, R., Ford, R., Mayeda, A., andBarber, G. N. (2001b). Characterization of two evolutionarily conserved, alternativelyspliced nuclear phosphoproteins, NFAR-1 and -2, that function in mRNA processingand interact with the double-stranded RNA-dependent protein kinase, PKR. J. Biol.Chem. 276, 32300–32312.
Shi, L., Zhao, G., Qiu, D., Godfrey, W. R., Vogel, H., Rando, T. A., Hu, H., andKao, P. N. (2005). NF90 regulates cell cycle exit and terminal myogenic differentiationby direct binding to the 30-untranslated region of MyoD and p21WAF1/CIP1 mRNAs.J. Biol. Chem. 280, 18981–18989.

260 Andrew M. Parrott et al.
Shim, J., Lim, H., Yates, J. R., and Karin, M. (2002). Nuclear export of NF90 is required forinterleukin-2 mRNA stabilization. Mol. Cell. 10, 1331–1344.
Shin, H. J., Kim, S. S., Cho, Y. H., Lee, S. G., and Rho, H. M. (2002). Host cell proteinsbinding to the encapsidation signal epsilon in hepatitis B virus RNA. Arch. Virol. 147,471–491.
Tohgo, A., Takasawa, S., Munakata, H., Yonekura, H., Hayashi, N., and Okamoto, H.(1994). Structural determination and characterization of a 40 kDa protein isolated fromrat 40 S ribosomal subunit. FEBS Lett. 340, 133–138.
Tran, H., Schilling, M., Wirbelauer, C., Hess, D., and Nagamine, Y. (2004). Facilitationof mRNA deadenylation and decay by the exosome-bound, DExH protein RHAU.Mol. Cell. 13, 101–111.
Uhlenbeck, O. C., and Gumport, R. I. (1982). T4 RNA ligase. In ‘‘The Enzymes’’ (Boyer,ed.), vol. 15B, pp. 31–58. Academic Press, New York.
Valencia-Sanchez, M. A., Liu, J., Hannon, G. J., and Parker, R. (2006). Control oftranslation and mRNA degradation by miRNAs and siRNAs. Genes Dev. 20, 515–524.
van Gelder, C. W., Thijssen, J. P., Klaassen, E. C., Sturchler, C., Krol, A., vanVenrooij, W. J., and Pruijn, G. J. (1994). Common structural features of the Ro RNPassociated hY1 and hY5 RNAs. Nucleic Acids Res. 22, 2498–2506.
Xu, Y. H., and Grabowski, G. A. (2005). Translation modulation of acid beta-glucosidase inHepG2 cells: Participation of the PKC pathway. Mol. Genet. Metab. 84, 252–264.
Xu, Y. H., Leonova, T., and Grabowski, G. A. (2003). Cell cycle dependent intracellulardistribution of two spliced isoforms of TCP/ILF3 proteins. Mol. Genet. Metab. 80,426–436.
Zieve, G. W., Turnbull, D., Mullins, J. M., and McIntosh, J. R. (1980). Production of largenumbers of mitotic mammalian cells by use of the reversible microtubule inhibitornocodazole. Nocodazole accumulated mitotic cells. Exp. Cell. Res. 126, 397–405.

C H A P T E R T H I R T E E N
M
IS
*
ethods
SN 0
DepaShrevDepaUnivCente
Approaches for Analyzing theDifferential Activities and Functionsof eIF4E Family Members
Robert E. Rhoads,* Tzvetanka D. Dinkova,† and Rosemary Jagus‡
Contents
1. In
in
076
rtmeportamersidr o
troduction
Enzymology, Volume 429 # 2007
-6879, DOI: 10.1016/S0076-6879(07)29013-5 All rig
ent of Biochemistry and Molecular Biology, Louisiana State University Health Sciencrt, Louisianaento de Bioquimica L-103, Facultad de Quimica Conjunto ‘‘E,’’ Paseo de la Inv. Ciad Nacional Autonoma de Mexico, Mexico D.F.f Marine Biotechnology, University of Maryland Biotechnology Institute, Baltimore,
Else
hts
es C
enti
Ma
262
2. In
Silico Detection and Analysis of eIF4E Family Members 2672
.1. S equence comparisons 2672
.2. R elationships among sequences 2692
.3. In formation derived from naturally occurring mutations 2702
.4. T ertiary structure modeling 2703. A
ssessing Differential Cap-Binding Properties of eIF4EFamily Members
2713
.1. F luorescence quenching 2713
.2. A ffinity chromatography 2724. E
xpression of eIF4E Family Members 2734
.1. D etermination of eIF4E mRNA levels 2734
.2. D etermination of eIF4E protein levels 2754
.3. A ltering expression of eIF4E family members 2765. A
ssessing eIF4E Family Members in Translation Systems 2795
.1. F unction by complementation in yeast 2795
.2. F unction in cell-free translation systems 2816. P
rotein–Protein Interaction Assays as a Means to DifferentiateFunctions of eIF4E Family Members
2836
.1. L ikely candidates 2836
.2. ‘‘ Pull-down’’ methods 2866
.3. F ar-Western analyses 2886
.4. M ethods to uncover new protein partners 289vier Inc.
reserved.
enter,
fica,
ryland
261

262 Robert E. Rhoads et al.
7. G
lobal Microarray Studies of Polysomal mRNA Distribution 290Ackn
owledgments 292Refe
rences 292Abstract
The translational initiation factor eIF4E binds to the m7G-containing cap of
mRNA and participates in recruitment of mRNA to ribosomes for protein syn-
thesis. eIF4E also functions in nucleocytoplasmic transport of mRNA, seques-
tration of mRNA in a nontranslatable state, and stabilization of mRNA against
decay in the cytosol. Multiple eIF4E family members have been identified in a
wide range of organisms that includes plants, flies, mammals, frogs, birds,
nematodes, fish, and various protists. This chapter reviews methods that have
been applied to learn the biochemical properties and physiological functions
that differentiate eIF4E family members within a given organism. Much has
been learned to date about approaches to discover new eIF4E family members,
their in vitro properties (cap binding, stimulation of cell-free translation sys-
tems), tissue and developmental expression patterns, protein-binding partners,
and their effects on the translation or repression of specific subsets of mRNA.
Despite these advances, new eIF4E family members continue to be found and
new physiological roles discovered.
1. Introduction
This chapter presents investigative approaches to distinguish amongfamily members of the mRNA cap-binding protein eIF4E. Since eIF4E actsin concert with numerous other proteins and RNAs during the initiation ofprotein synthesis, we begin with a brief overview of protein synthesisinitiation (Kapp and Lorsch, 2004). A different class of eukaryotic initiationfactors (eIF1, eIF2, etc.) catalyzes each step of initiation. A ternary complexof eIF2GTPMet-tRNAi binds to the 40S ribosomal subunit to form the43S initiation complex. Recruitment of mRNA to the 43S initiation com-plex to form the 48S initiation complex requires eIF3, poly(A)-bindingprotein (PABP), and the eIF4 proteins. The latter consist of eIF4A,a 46-kDaRNAhelicase; eIF4B, a 70-kDaRNA-binding andRNA-anneal-ing protein; eIF4H, a 25-kDa protein that acts with eIF4B to stimulateeIF4A helicase activity; eIF4E, a 25-kDa cap-binding protein; and eIF4G,a 185-kDa protein that specifically binds to and colocalizes all of the otherproteins involved in mRNA recruitment on the 40S subunit (molecularmasses refer to the human proteins). In the presence of eIF1 and eIF1A, the48S complex scans until the first AUG in good sequence context is encoun-tered. Then the GTPase-activating protein eIF5, together with eIF5B,

Characterization of eIF4E Family Members 263
stimulates GTP hydrolysis by eIF2. The initiation factors are replaced by the60S subunit, and the first peptide bond is formed.
eIF4E is probably the first of the canonical initiation factors to interactwith mRNA during its recruitment to the ribosome. eIF4E has beenextensively investigated in organisms that range from yeast to mammals(Dyer et al., 1998; Jankowska-Anyszka et al., 1998; Joshi et al., 2004;Rhoads et al., 1993; Robalino et al., 2004; Rodriguez et al., 1998).Sequence comparisons, coupled with deletion analyses of eIF4Es fromseveral species, have demonstrated an evolutionarily conserved core regionof 160 to 170 residues. This is represented by His-37 to His-200 of Homosapiens and Mus musculus eIF4E-1. The consensus sequence of the coreregion shows amino acid residues Trp, Phe, and His in a distinctive patternsummarized as H(x5)W(x2)W(x8–12)W(x9)F(x5)FW(x20)F(x7)W(x10)W(x9–12)W(x34–35)W(x32–34)H. The more variable N- and C-termini of eIF4Eappear to be dispensable for translation, although they may be involved inthe regulation of eIF4E activity or may affect stability of the protein.
The tertiary structures of mouse (Marcotrigiano et al., 1997), yeast(Matsuo et al., 1997), and human (Tomoo et al., 2003) eIF4Es have beensolved. The specificity of eIF4E interaction with the cap results primarilyfrom stacking of the alkylated purine base between Trp-56 and Trp-102(amino acid positions refer to human eIF4E-1) (Marcotrigiano et al., 1997;Matsuo et al., 1997; Niedzwiecka et al., 2002). In addition, Glu-103 formsH-bonds with N1 and N2 protons of m7G and the adjacent peptide bond.Direct interactions occur between Trp-56 and the ribose group andbetween Arg-157 and Lys-162 and the a- and b-phosphate oxygenatoms. A third Trp residue (Trp-166) interacts with the N7-methyl moietyof the cap structure.
eIF4E participates in mRNA recruitment through specific and high-affinity binding to eIF4G (Keiper et al., 1999). When isolated by affinitychromatography, eIF4E from mammals and plants is found in a complexwith eIF4A and eIF4G, termed eIF4F. The eIF4E–eIF4G interaction isprevented, and cap-dependent translation is inhibited, by binding of eIF4Eto 4E-BPs via a canonical eIF4E-binding motif, YXXXXLf (where f is anyhydrophobic amino acid). Two other conserved Trp residues in eIF4E, Trp-43 and Trp-73, are important for the interaction with eIF4G. Trp-73 is foundwithin a phylogenetically conserved sequence (S/T)V(e/d)(e/d)FW. Substi-tution of Trp-73 ofmammalian eIF4Ewith a nonaromatic amino acid disruptsthe ability of eIF4E to interact with either eIF4G or with 4E-BPs. Thefunction of the four other conserved Trp residues remains to be established.
In addition to translation, eIF4E functions in nucleocytoplasmic transportof mRNA, sequestration of mRNA in a nontranslatable state, and stabilizationofmRNA against decay in the cytosol (Gorlich andMattaj, 1996;Richter andSonenberg, 2005; Strudwick and Borden, 2002). eIF4E binds to the nucleo-cytoplasmic shuttling protein 4E-T (eIF4E-Transporter) (Dostie et al., 2000).

264 Robert E. Rhoads et al.
Both promyelocytic leukemia (PML) protein, a homeodomain protein(Cohen et al., 2001), and the proline-rich homeodomain (PRH) protein(Topisirovic et al., 2003) bind directly to nuclear eIF4E and inhibit its nucleo-cytoplasmic transport. Some cases of translational repression by 30 UTRsequences involve eIF4E (Richter and Sonenberg, 2005). For instance, inmeiotically arrested Xenopus oocytes, translation of maternal mRNAs isrepressed by binding of 30 UTR sequence elements termed CPEs by thecytoplasmic polyadenylation element binding protein (CPEB). CPEB bindsMaskin, which in turn binds eIF4E, inactivating the latter for translationalinitiation. A signal to resume oocyte development results in phosphorylationof CPEB, release of Maskin, poly(A) lengthening, and recruitment of thematernal mRNAs to the ribosome. The cap also serves as one determinant ofmRNAdegradation. In the 50 ! 30 pathway formRNAdecay, removal of thecap by the decapping enzyme Dcp1/Dcp2 exposes the transcripts to digestionby a highly processive 50 ! 30 exonuclease, XrnI (Hsu and Stevens, 1993).Dcp1 binds to both eIF4G and PABP as free proteins as well as to the complexof eIF4EeIF4GPABP (Vilela et al., 2000). Addition of eIF4E inhibits Dcp1/Dcp2 activity in vitro, but m7GTP restores decapping. 4E-T colocalizes withmRNA decapping factors in processing bodies (P-bodies), the sites of mRNAdecay (Ferraiuolo et al., 2005). Interaction of 4E-T with eIF4E repressestranslation, which is believed to be a prerequisite for targeting of mRNAs toP-bodies.
Intriguingly, from two to eight proteins with sequences similar to proto-typical eIF4Es have been found in plants, flies, mammals, frogs, birds, nema-todes, echinoderms, fish, and various protists ( Joshi et al., 2005; Morales et al.,2006) (Fig. 13.1). Evolutionarily, it seems that a single early eIF4E geneunderwent a series of gene duplications, generating multiple structural classesand in some cases subclasses. Today, eIF4E and its relatives comprise a family ofstructurally related proteins within a given organism. Sequence similarity ishighest in a core region of 160 to 170 amino acid residues identifiedby evolutionary conservation and functional analyses ( Joshi et al., 2005). Todistinguish prototypical eIF4E from its relatives, vertebrate eIF4E has beenrenamed eIF4E-1 (Keiper et al., 2000) or eIF4E-1A (Robalino et al., 2004).Prototypical eIF4E is considered to be eIF4E-1 of mammals, eIF4E and eIF(iso)4E of plants, and eIF4E of Saccharomyces cerevisiae.
With the exception of some eIF4Es from protists, all eIF4Es can begrouped into one of three classes (see Fig. 13.1). Class I members carry Trpresidues equivalent to Trp-43 and Trp-56 of H. sapiens eIF4E and appear tobe present in all eukaryotes. cDNAs encoding members of Class I can beidentified in species fromViridiplantae, Metazoa, and Fungi. As judged fromcompleted genomes, many protists also encode Class I-like family members.Evidence for gene duplication of Class I eIF4E family members can be foundin certain plant species, as well as in nematodes, insects, chordates, and somefungi (Hernandez and Vazquez-Pianzola, 2005; Joshi et al., 2005). Class I

Figure 13.1 A radial cladogram describing the overall relationship of selected eIF4Efamily members from multiple species. The figure is taken from Joshi et al. (2005) andcan also be viewed at http://umbicc 3^215.umbi.umd.edu/iisstart.asp.The topology of aneighbor-joining tree visualized in radial format is derived from an alignment of nucle-otide sequences representing the conserved core regions of the indicated eIF4E familymembers. eIF4E familymember names in blackor red indicatewhether or not the com-plete sequence of the conserved core region of themember could be predicted fromcon-sensus cDNA sequence data, respectively. eIF4E family member names in blue indicatethat genomic sequence data were used to either verify or determine the nucleotidesequence representing the core region of the member.The shape of a‘‘leaf ’’ indicates thetaxonomic kingdom from which the species containing the eIF4E family memberderives: Metazoa (diamonds), Fungi (squares), Viridiplantae (triangles), and Protista(circles).The color of a‘‘leaf ’’ indicates the subgroupof the eIF4E familymember:meta-zoan eIF4E-1 and IFE-3-like (red), fungal eIF4E-like (gold), plant eIF4E and eIF(iso)4E-like (green), metazoan eIF4E-2-like (cyan), plant nCBP-like (blue), fungal nCBP/eIF4E-2-like (purple), metazoan eIF4E-3-like (pink), and atypical eIF4E family mem-bers from some protists (white). eIF4E family members within structural Class I, ClassII, andClass III are indicated.
Characterization of eIF4E Family Members 265
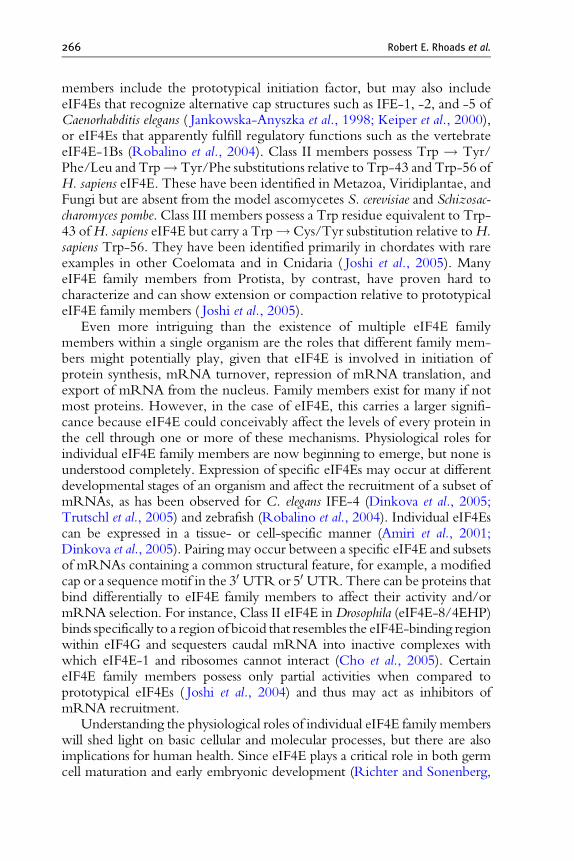
266 Robert E. Rhoads et al.
members include the prototypical initiation factor, but may also includeeIF4Es that recognize alternative cap structures such as IFE-1, -2, and -5 ofCaenorhabditis elegans ( Jankowska-Anyszka et al., 1998; Keiper et al., 2000),or eIF4Es that apparently fulfill regulatory functions such as the vertebrateeIF4E-1Bs (Robalino et al., 2004). Class II members possess Trp ! Tyr/Phe/Leu and Trp!Tyr/Phe substitutions relative to Trp-43 and Trp-56 ofH. sapiens eIF4E. These have been identified in Metazoa, Viridiplantae, andFungi but are absent from the model ascomycetes S. cerevisiae and Schizosac-charomyces pombe. Class III members possess a Trp residue equivalent to Trp-43 ofH. sapiens eIF4E but carry a Trp!Cys/Tyr substitution relative toH.sapiens Trp-56. They have been identified primarily in chordates with rareexamples in other Coelomata and in Cnidaria ( Joshi et al., 2005). ManyeIF4E family members from Protista, by contrast, have proven hard tocharacterize and can show extension or compaction relative to prototypicaleIF4E family members ( Joshi et al., 2005).
Even more intriguing than the existence of multiple eIF4E familymembers within a single organism are the roles that different family mem-bers might potentially play, given that eIF4E is involved in initiation ofprotein synthesis, mRNA turnover, repression of mRNA translation, andexport of mRNA from the nucleus. Family members exist for many if notmost proteins. However, in the case of eIF4E, this carries a larger signifi-cance because eIF4E could conceivably affect the levels of every protein inthe cell through one or more of these mechanisms. Physiological roles forindividual eIF4E family members are now beginning to emerge, but none isunderstood completely. Expression of specific eIF4Es may occur at differentdevelopmental stages of an organism and affect the recruitment of a subset ofmRNAs, as has been observed for C. elegans IFE-4 (Dinkova et al., 2005;Trutschl et al., 2005) and zebrafish (Robalino et al., 2004). Individual eIF4Escan be expressed in a tissue- or cell-specific manner (Amiri et al., 2001;Dinkova et al., 2005). Pairing may occur between a specific eIF4E and subsetsof mRNAs containing a common structural feature, for example, a modifiedcap or a sequence motif in the 30 UTRor 50 UTR. There can be proteins thatbind differentially to eIF4E family members to affect their activity and/ormRNA selection. For instance, Class II eIF4E inDrosophila (eIF4E-8/4EHP)binds specifically to a region of bicoid that resembles the eIF4E-binding regionwithin eIF4G and sequesters caudal mRNA into inactive complexes withwhich eIF4E-1 and ribosomes cannot interact (Cho et al., 2005). CertaineIF4E family members possess only partial activities when compared toprototypical eIF4Es ( Joshi et al., 2004) and thus may act as inhibitors ofmRNA recruitment.
Understanding the physiological roles of individual eIF4E family memberswill shed light on basic cellular and molecular processes, but there are alsoimplications for human health. Since eIF4E plays a critical role in both germcell maturation and early embryonic development (Richter and Sonenberg,
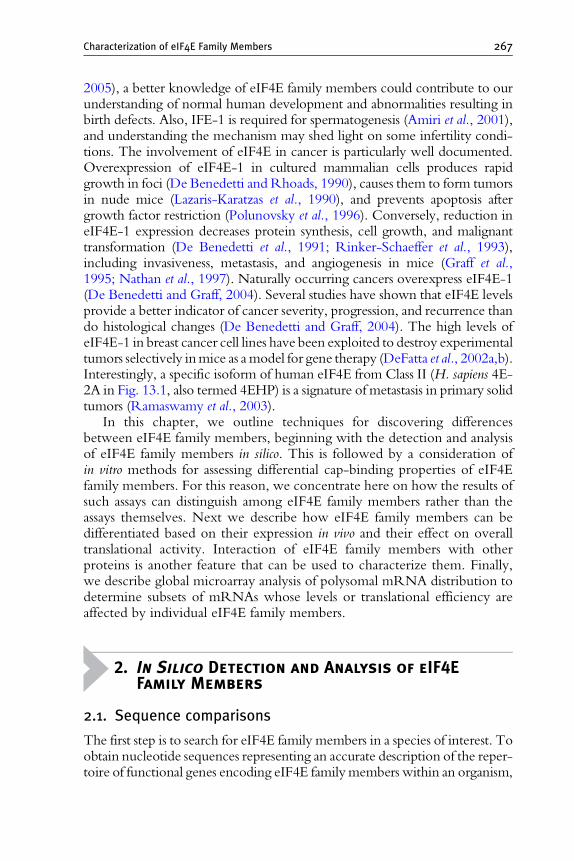
Characterization of eIF4E Family Members 267
2005), a better knowledge of eIF4E family members could contribute to ourunderstanding of normal human development and abnormalities resulting inbirth defects. Also, IFE-1 is required for spermatogenesis (Amiri et al., 2001),and understanding the mechanism may shed light on some infertility condi-tions. The involvement of eIF4E in cancer is particularly well documented.Overexpression of eIF4E-1 in cultured mammalian cells produces rapidgrowth in foci (De Benedetti and Rhoads, 1990), causes them to form tumorsin nude mice (Lazaris-Karatzas et al., 1990), and prevents apoptosis aftergrowth factor restriction (Polunovsky et al., 1996). Conversely, reduction ineIF4E-1 expression decreases protein synthesis, cell growth, and malignanttransformation (De Benedetti et al., 1991; Rinker-Schaeffer et al., 1993),including invasiveness, metastasis, and angiogenesis in mice (Graff et al.,1995; Nathan et al., 1997). Naturally occurring cancers overexpress eIF4E-1(De Benedetti and Graff, 2004). Several studies have shown that eIF4E levelsprovide a better indicator of cancer severity, progression, and recurrence thando histological changes (De Benedetti and Graff, 2004). The high levels ofeIF4E-1 in breast cancer cell lines have been exploited to destroy experimentaltumors selectively inmice as amodel for gene therapy (DeFatta et al., 2002a,b).Interestingly, a specific isoform of human eIF4E from Class II (H. sapiens 4E-2A in Fig. 13.1, also termed 4EHP) is a signature of metastasis in primary solidtumors (Ramaswamy et al., 2003).
In this chapter, we outline techniques for discovering differencesbetween eIF4E family members, beginning with the detection and analysisof eIF4E family members in silico. This is followed by a consideration ofin vitro methods for assessing differential cap-binding properties of eIF4Efamily members. For this reason, we concentrate here on how the results ofsuch assays can distinguish among eIF4E family members rather than theassays themselves. Next we describe how eIF4E family members can bedifferentiated based on their expression in vivo and their effect on overalltranslational activity. Interaction of eIF4E family members with otherproteins is another feature that can be used to characterize them. Finally,we describe global microarray analysis of polysomal mRNA distribution todetermine subsets of mRNAs whose levels or translational efficiency areaffected by individual eIF4E family members.
2. In Silico Detection and Analysis of eIF4EFamily Members
2.1. Sequence comparisons
The first step is to search for eIF4E family members in a species of interest. Toobtain nucleotide sequences representing an accurate description of the reper-toire of functional genes encoding eIF4E familymembers within an organism,

268 Robert E. Rhoads et al.
it is most useful to begin with expressed sequence tag (EST) databases sincethese represent the cDNAs of expressed genes. The direct use of genomicsequences is more problematic due to the possibility of including pseudogenesand can be further complicated by deficiencies in our ability to predict intron/exon boundaries. In addition, problems can arise from errors in the assembly ofgenomic sequence data. However, when insufficient EST data are available toassemble and verify an eIF4E sequence, it can be helpful to use genomicsequences and whatever EST sequences are available for confirmation. Theuse of genomic sequences is easier for organismswhose genomes are known tolack, or contain few, introns in genes transcribed by RNA polymerase II suchas some Protista and yeasts or in species for which expressed cDNAs can beidentified in closely related organisms.
Initial searches for expressed nucleotide sequences encoding putativeeIF4E family members can be acquired from GenBank NR, dbEST, or anyother available databases by using the nucleotide and amino acid sequencesencoding the conserved core regions of eIF4Es from the closest relatedspecies/order/phylum as probes for BLAST searches. Sequences encodingputative eIF4E family members can be easily identified by comparison ofcomputed translations with the core sequences of known eIF4Es and theconsensus pattern for the conserved core region, H(x5)W(x2)W(x8–12)W(x9)F(x5)FW(x20)F(x7)W(x10)W(x9–12)W(x34–35)W(x32–34)H ( Joshi et al., 2005).The retrieved eIF4E-related sequences can be used to reprobe the databanks toidentify further sequences of overlapping cDNA fragments from the samespecies or to obtain sequences from additional species. Overlapping sequencescan be aligned and a picture of the complete core, along with amino andcarboxy termini, can be assembled.Using the new eIF4E cDNA sequence, theprocess of iteration can be continued to obtain sequences encoding moreeIF4E family members.
To facilitate searches for novel eIF4E family members, a website databasehas been established by Dr. Bhavesh Joshi, http://umbicc3-215.umbi.umd.edu, that contains over 400 eIF4E sequences from eukaryotes and one from avirus (Mimivirus). Access is available to all but requires registration and log-in prior to use. Nucleotide or protein sequences can be downloaded for the‘‘core’’ or full sequence (where available). EST sequences corresponding toeach eIF4E family member are also provided, as well as its class and subtype ifapparent. The eIF4E Family Member Database allows the retrieval ofsequences representing eIF4E subtypes from multiple species. The databasecontains EST alignments, nucleotide coding sequences, and amino acidsequences. Retrieved records can be viewed through use of the Jalviewapplication (Clamp et al., 2004). Jalview requires that the investigator’sbrowser is capable of using and displaying JAVA applets. For MacOS users,this may be a problem if using older versions of OSX. ForWindows users, itis necessary to install JAVA software, available from SunOS.
Once new eIF4E family members have been identified, they can beassessed as to class membership. This will provide an initial intimation of

Characterization of eIF4E Family Members 269
function. In organisms with more than three eIF4E family members, thegreatest duplication has been found inClass I forms. For instance, inC. elegans,there are five eIF4E familymembers, IFE-1 to IFE-5. Four of them (IFE-1, -2,-3, and -5) carry Trp residues equivalent to Trp-43 and Trp-56 of H. sapienseIF4E, which is characteristic of Class I, and one (IFE-4) has a Trp ! Tyrsubstitution at amino acids equivalent to Trp-43 and Trp-56 of H. sapienseIF4E, characteristic of Class II. In Drosophila, there are seven eIF4E genesencoding eight eIF4Es, seven of which belong to Class I (Hernandez et al.,2005). The analysis of amino acid sequences of different eIF4E family mem-bers places plant eIF4E and eIF(iso)4E within Class I ( Joshi et al., 2005),although they share only 50% identity. These eIF4E family members have alsoshown some functional divergence in cap binding (see Section 3 below).
In contrast to Viridiplantae, Metazoa, and Fungi, some protists expressatypical eIF4E family members that are difficult to place within the threedefined structural classes due to extensive stretches of amino acids betweenunits of the eIF4E core structure ( Joshi et al., 2005). eIF4E family membersfrom Stramenopiles andAlveolata contain an unusual stretch of 12 to 15 aminoacids between residues equivalent to Trp-73 and Trp-102 of mammalianeIF4E-1 and 4 to 9 amino acids between residues equivalent to Trp-102 andTrp-166. Extended stretches between structural units of the core, albeit inpositions that differ from those found in Alveolata and Stramenopiles, are alsofound in the eIF4E family member termed Leish4E-1 from the trypanosomeLeishmania major (Yoffe et al., 2004). Leish4E-1 contains two areas of extendedamino acid stretches between structural units of the core. Studies in vitro haveshown that LeishIF4E-1 binds with similar affinities both m7GTP and anunusual cap structure found in L. major termed cap-4 (see Section 3). Suchcomparisons hint that the atypical protist eIF4Es are also likely to interact withunusual cap structures andwill serve to inform future functional studies.Otherdifferences in conserved motifs suggest alternative functions. For example,Mimivirus, the sole member of the newly proposed Mimiviridae family oflarge double-stranded DNA viruses, encodes its own eIF4E (Raoult et al.,2004). Mimivirus eIF4E differs from other eIF4E family members in that itlacks a Trp residue equivalent to Trp-73 ofmouse eIF4E-1, suggesting that theprotein may not interact with eIF4G or 4E-BPs and pointing toward a role insubversion of the host translational machinery by the virus.
2.2. Relationships among sequences
Similarity searches and multiple alignments of sequences lead to the questionof how they are related,which can in turn intimate similarities or differences infunction. Relationships are often more apparent by tree or dendrogramanalyses, using DNA or protein sequences as taxonomic characters. Lookingagain at the example ofC. elegans, IFE-1, -2, -3, and -5 possess more similarityto each other in sequence than to Class I family members from other phyla ofMetazoa, suggesting they arose from gene duplications of a progenitor IFE-3

270 Robert E. Rhoads et al.
( Joshi et al., 2005). However, IFE-1, -2, and -5 are more like each other thanIFE-3, suggestive of a divergence of function ( Joshi et al., 2005; Keiper et al.,2000). This corresponds well with the finding that only these three subtypesbind to the unusual trimethylated caps (containing 2,2,7-trimethylguanosine50 triphosphate; m3
2,2,7GTP) present on 70% of C. elegans mRNAs. Evi-dence in support of this hypothesis comes from recent studies of the sole eIF4Efrom the nematode Ascaris suum, an IFE-3-like protein. A. suum IFE-3 (alsotermed eIF4E-3) can bind to and stimulate the translation of mRNAs posses-sing mono- or trimethylated cap structures in vitro (Lall et al., 2004). Further-more, sequences identified from some nematodes such as the parasiticHaemanchus contortus suggest that they express a single form of eIF4E similarto IFE-3 and a single form related to IFE-1, -2, and -5.
2.3. Information derived from naturally occurring mutations
Clues to the function of different eIF4E family members can also be derivedfrom the study of naturally occurring mutations in eIF4E genes. In plants,recessive mutations conferring viral resistance have been mapped to eIF4Eand eIF(iso)4E genes. For example, the pepper pvr2 resistance gene againstpotato virus Y (PVY) corresponds to eIF4E (Ruffel et al., 2002). Naturalmutations in eIF4E genes from other plant species also display resistance toviral infections (Gao et al., 2004; Nicaise et al., 2003; Ruffel et al., 2005). Inall cases, mutations result in substitution of nonconserved amino acids nearthe cap-binding pocket or at the surface of the protein (based on tertiarystructure models). Interestingly, whereas all natural mutations in planteIF4E result in expression of a modified protein, the one reported for eIF(iso)4E results in the absence of a functional protein due to a premature stopcodon after the first 29 amino acids (Ruffel et al., 2006). Although theabsence of an obvious mutant phenotype raises the possibility that planteIF4E and eIF(iso)4E are functionally redundant, the changes in viralresistance suggest otherwise.
2.4. Tertiary structure modeling
The structural basis for the differences in cap-binding specificities for two C.elegans eIF4E family members was explored by molecular modeling of tertiarystructure and amino acid (Miyoshi et al., 2002). Tertiary structure models ofIFE-3 and IFE-5 were created by homology modeling (Dwyer, 2001) basedon the known atomic coordinates formouse eIF4E-1. Thewidth and depth ofthe cap-binding cavity were shown by molecular dynamics simulations to belarger in IFE-5 than in IFE-3. This supports a model in which IFE-3 dis-criminates against m3
2,2,7GTP by steric hindrance. Using site-directed muta-genesis, amino acid sequences of IFE-5 were substituted with homologoussequences from IFE-3. Two substitutions (N64Y/V65L) converted the cap

Characterization of eIF4E Family Members 271
specificity of IFE-5 to essentially that of IFE-3, as detected by affinity chroma-tography (see Section 3) and also narrowed the cap-binding cavity in molecu-larmodels. Computermodeling has also been used to show that theClass IIH.sapiens 4EHP (4E-2A in Fig. 13.1) is very similar in tertiary structure to H.sapiens eIF4E-1 (Rom et al., 1998), consistent with its ability to bind m7GTP.Similar computer modeling of L. major LeishIF4E-1 indicated that the proteinlacks a region corresponding to the C-terminus of mouse eIF4E-1 and yeasteIF4E (Yoffe et al., 2004).
3. Assessing Differential Cap-BindingProperties of eIF4E Family Members
The most obvious property to test when seeking differences amongcap-binding proteins is the affinity for cap structures. This can be deter-mined by a number of methods, among which fluorescence quenching andaffinity chromatography are the most widely used. Since most mRNAscontain a canonical cap structure (m7GpppG), the place to start is with capanalogs of this type.
3.1. Fluorescence quenching
The most easily performed quantitative method for determining affinity forthe cap is quenching of intrinsic Trp fluorescence in eIF4E upon binding ofthe cap. This biophysical measurement is carried out with a single purifiedprotein and a single cap analog. It is therefore necessary to obtain the eIF4Efamily member in a pure form. Since all eIF4Es have similar molecularmasses and amino acid compositions, biochemical purification and separa-tion of family members can be difficult. Instead, expression of a recombi-nant protein is preferred (see Section 6.2.2). Recombinant A. thaliananCBP, a Class II member (see Fig. 13.1), has been shown by fluorescencequenching to bind m7GTP with 5- to 20-fold higher affinity than eIF(iso)4F (Ruud et al., 1998). Equilibrium binding measurements comparingrecombinant C. elegans IFE-3, -4, and -5 revealed that IFE-5 formedspecific complexes with both m3
2,2,7G- and m7G-containing cap analogs,but IFE-3 and IFE-4 discriminated strongly in favor of m7G-containinganalogs (Stachelska et al., 2002) (Table 13.1).
It is also possible tomeasure the binding affinity of capped oligonucleotidesto purified eIF4E by biophysical methods. This makes it possible to test theeffect of both primary and secondary structure of the attached oligonucleotideon overall affinity to eIF4E. Capped oligonucleotides bind to mammalianeIF4E with an affinity that is up to 23-fold greater (depending on salt concen-tration and the nature of the oligonucleotide chain) than that of dinucleotidecap analogs, as determined by both equilibrium (Carberry et al., 1992) and
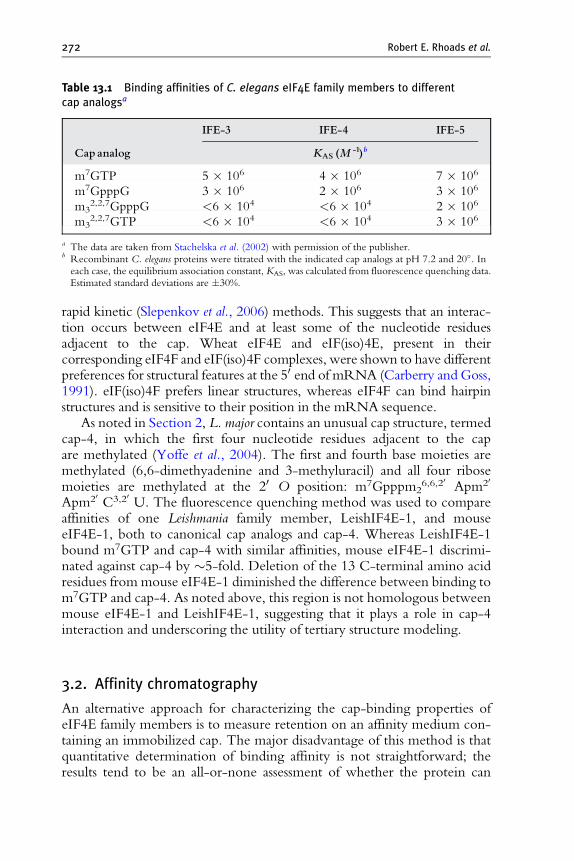
Table 13.1 Binding affinities of C. elegans eIF4E family members to differentcap analogs a
IFE-3 IFE-4 IFE-5
Capanalog KAS (M -1)b
m7GTP 5 106 4 106 7 106
m7GpppG 3 106 2 106 3 106
m32,2,7GpppG <6 104 <6 104 2 106
m32,2,7GTP <6 104 <6 104 3 106
a The data are taken from Stachelska et al. (2002) with permission of the publisher.b Recombinant C. elegans proteins were titrated with the indicated cap analogs at pH 7.2 and 20. Ineach case, the equilibrium association constant, KAS, was calculated from fluorescence quenching data.Estimated standard deviations are 30%.
272 Robert E. Rhoads et al.
rapid kinetic (Slepenkov et al., 2006) methods. This suggests that an interac-tion occurs between eIF4E and at least some of the nucleotide residuesadjacent to the cap. Wheat eIF4E and eIF(iso)4E, present in theircorresponding eIF4F and eIF(iso)4F complexes, were shown to have differentpreferences for structural features at the 50 end of mRNA (Carberry and Goss,1991). eIF(iso)4F prefers linear structures, whereas eIF4F can bind hairpinstructures and is sensitive to their position in the mRNA sequence.
As noted in Section 2, L. major contains an unusual cap structure, termedcap-4, in which the first four nucleotide residues adjacent to the capare methylated (Yoffe et al., 2004). The first and fourth base moieties aremethylated (6,6-dimethyadenine and 3-methyluracil) and all four ribosemoieties are methylated at the 20 O position: m7Gpppm2
6,6,20 Apm20
Apm20 C3,20 U. The fluorescence quenching method was used to compareaffinities of one Leishmania family member, LeishIF4E-1, and mouseeIF4E-1, both to canonical cap analogs and cap-4. Whereas LeishIF4E-1bound m7GTP and cap-4 with similar affinities, mouse eIF4E-1 discrimi-nated against cap-4 by 5-fold. Deletion of the 13 C-terminal amino acidresidues from mouse eIF4E-1 diminished the difference between binding tom7GTP and cap-4. As noted above, this region is not homologous betweenmouse eIF4E-1 and LeishIF4E-1, suggesting that it plays a role in cap-4interaction and underscoring the utility of tertiary structure modeling.
3.2. Affinity chromatography
An alternative approach for characterizing the cap-binding properties ofeIF4E family members is to measure retention on an affinity medium con-taining an immobilized cap. The major disadvantage of this method is thatquantitative determination of binding affinity is not straightforward; theresults tend to be an all-or-none assessment of whether the protein can

Characterization of eIF4E Family Members 273
bind to cap structures. The advantages, however, are numerous. It is notnecessary to clone the cDNA for the protein of interest or express it in asoluble, recombinant form, which is sometimes difficult (see Section 6.2.2).It makes it possible to test binding in crude extracts in which any eIF4E-interacting proteins that modulate binding are present. The retention of allcap-binding proteins present in an extract can be observed in a singleexperiment, provided that there are methods for distinguishing amongthem, e.g., different mobilities on sodium dodecyl sulfate polyacrylamidegel electrophoresis (SDS–PAGE) or specific antibodies.
Affinity chromatography has been used to indicate cap-binding specifi-cities of all five C. elegans family members ( Jankowska-Anyszka et al., 1998;Keiper et al., 2000). m7GTP-Sepharose can be obtained commercially(Amersham Biosciences), but m3
2,2,7GTP-Sepharose must be synthesized( Jankowska-Anyszka et al., 1998). Affinity chromatography of either crudeextracts or as recombinant proteins shows that all five family members areretained on m7GTP-Sepharose, but only IFE-1, -2, and -5 are retained onm3
2,2,7GTP-Sepharose. The interpretation of these experiments is thatC. elegans eIF4E family members differ in cap specificity: IFE-3 and -4bind only m7GTP, whereas IFE-1, -2, and -5 bind both m7GTP andm3
2,2,7GTP. This conclusion was confirmed by a competition assay inwhich either m7GTP or m3
2,2,7GTP was used to compete for binding ofC. elegans eIF4Es to the two types of affinity column. In a similar experi-ment, A. suum IFE-3, the only Class I eIF4E from this species (seeFig. 13.1), was retained on both m7GTP-Sepharose and m3
2,2,7GTP-Sepharose, and binding was completed by either m7GTP or m3
2,2,7GTP(Lall et al., 2004). By contrast, LeishIF4E-1 binds to m7GTP-Sepharose butnot m3
2,2,7GTP-Sepharose (Yoffe et al., 2004).
4. Expression of eIF4E Family Members
Expression of different eIF4E family members from a variety oforganisms has been assessed throughout development and in differenttissues. In most cases, eIF4E family members are differentially expressed.Expression can be measured at both the RNA and the protein levels. Belowwe describe the main techniques that have been used in the analysis ofeIF4E expression with their corresponding advantages and disadvantages.
4.1. Determination of eIF4E mRNA levels
To measure RNA levels, Northern blotting, semiquantitative reverse tran-scriptase polymerase chain reaction (RT-PCR), or quantitative real-timeRT-PCR can be used with either total or poly(A)-enriched RNA preparations.

274 Robert E. Rhoads et al.
When using Northern blotting, probes and hybridization conditions for eacheIF4E family member should be sufficiently specific to avoid cross reaction.This method has been used for two of the plant eIF4E family members, eIF4Eand eIF(iso)4E (Dinkova and Sanchez de Jimenez, 1999; Manjunath et al.,1999; Rodriguez et al., 1998), three from mouse, eIF4E-1, eIF4E-2, andeIF4E-3 ( Joshi et al., 2004), and all five IFEs from C. elegans (Amiri et al.,2001) (T. D. Dinkova, unpublished observations). The results revealed differ-ential expression for themRNAsof each eIF4E familymember. Themembersof Class III (e.g., mouse eIF4E-3) are the least abundant andmay be difficult todetect by Northern blotting ( Joshi et al., 2004). ForC. elegans, two of the fivemRNAs, for IFE-4 and IFE-5, could not be detected by this technique. Inaddition, sometimes the probe against a specific eIF4E family member detectsmore than one mRNA species, making the results difficult to interpret ( Joshiet al., 2004). In general, Northern blotting is neither sufficiently sensitive norquantitative to be very useful.
Semiquantitative RT-PCR has been used for zebrafish eIF4E-1A andeIF4E-1B (Robalino et al., 2004) and for mammalian eIF4E-1, eIF4E-2,and eIF4E-3 ( Joshi et al., 2004). This method usually requires the use of aninternal control, for example, a housekeeping gene. Sometimes it is difficultto find a good standard for all tissues or developmental stages. However, foreIF4E, the most appropriate control is probably the translational elongationfactor EF1A since the aim is generally to see how the level of a particulareIF4E family member compares with those of other components of thetranslation machinery. The method is useful to score important differencesbut is not sensitive to small changes. The key is to use a low cycle number,but it is almost impossible to be sure that all samples are still in theexponential versus plateau phase of the amplification reaction. CompetitiveRT-PCR is an option, but it involves additional adjustments. Quantitativereal-time PCR (QRT-PCR) provides the most information. It is quantita-tive and very sensitive, but it also requires careful primer design withappropriate programs (e.g., the Beacon Designer Tool from Bio-Rad) aswell as the generation of in vitro transcripts for each eIF4E family member tobe used for quantitation.
In small organisms for which specific tissues are difficult to isolate, orwhen specific cell type localization is needed, in situ hybridization can beused to describe eIF4E mRNA distributions. This has been done for IFE-1in C. elegans (Amiri et al., 2001). Also, making use of available microarraydatabases for a specific organism could help to identify the mRNA expres-sion pattern of eIF4E family members. These are available for C. elegans(Trutschl et al., 2005), mouse, and Arabidopsis thaliana (https://www.genevestigator.ethz.ch/). It is advisable to confirm the database expressionpattern by Northern blotting, RT-PCR, or QRT-PCR.
The mRNA level of a given eIF4E family member does not necessarilycorrespond to its protein level and may change with changing situations,
Characterization of eIF4E Family Members 275
such as developmental stage (Dinkova and Sanchez de Jimenez, 1999;Duprat et al., 2002). Northern blotting and RT-PCR experiments withtotal or poly(A)-enriched RNA do not provide information about transla-tion of themRNA.A better way to obtain insight about protein expression isto look at the polysomal distribution of the mRNA under investigation.Such an approach has been widely used for many organisms (Dinkova et al.,2005; Kawaguchi and Bailey-Serres, 2005; Zong et al., 1999). Polysomes areobtained by sucrose gradient sedimentation, with the specific gradient con-ditions depending on the organism and separation requirements. Polysomalfractions can be analyzed independently, pooled as light (two to five ribo-somes bound per mRNA) and heavy (more than five ribosomes per mRNA)(Dinkova et al., 2005), or pooled altogether (Zong et al., 1999) prior toanalysis for specific mRNAs. This topic is treated further in Section 7.
4.2. Determination of eIF4E protein levels
For protein levels of different eIF4E family members, Western blotting withspecific antibodies can be used. Alternatively, a picture of the relative levels ofexpression of different eIF4E family members can be developed using reporterconstructs [green fluorescent protein (GFP) fusions or other tagged versions]expressed behind the promoter for the eIF4E family member gene. Westernblotting is dependent on antibody availability. Some antibodiesmay react withmultiple eIF4E familymembers, in which case it may be necessary to seek a gelelectrophoresis system that will separate different eIF4E family members, e.g.,by vertical slap isoelectric focusing (VSIEF) or SDS–PAGE (Robalino et al.,2004). In general, antibodies are most likely to work within a class and lesslikely towork between classes. Antibodies raised to human eIF4E-1 have beenshown to interact with zebrafish eIF4E-1A and -1B, but not with humaneIF4E-2 (4EHP) or zebrafish eIF4E-2 (4EHP). Similarly, antibodies raisedagainst wheat eIF4E and eIF(iso)4E (or the corresponding 4F and iso4Fcomplexes) work forArabidopsis, maize, rice, tobacco, and other plant species,but nCBP, a Class II family member, is not recognized by these antibodies.Usually eIF4E family members have similar molecular masses, making separa-tion difficult. However, zebrafish eIF4E-1A and -1B (24,848 and 24,742 Da,respectively) can be resolved on 17.5% high-Tris gels using extended runningtimes (1600 V-h) (Robalino et al., 2004). VSIEF also provides a reliableseparation not only of different eIF4E family members but also of differentlymodified forms of the same eIF4E family member (such as differentphosphorylation states) (Manjunath et al., 1999; Robalino et al., 2004).
The five IFE proteins in C. elegans can be distinguished with antibodiesagainst peptides corresponding to dissimilar C-terminal sequences( Jankowska-Anyszka et al., 1998; Keiper et al., 2000). These antibodies workwell with the recombinant proteins. However, detection of IFE-4 and IFE-5in tissue extracts, even if enriched by m7GTP- Sepharose chromatography, is

276 Robert E. Rhoads et al.
difficult (Keiper et al., 2000), makingWestern blotting unsuitable for develop-mental expression studies of these two family members. Instead, GFP fusionshave been primarily used (see below).
Expression of reporter constructs encoding GFP or other tagged fusionscan be especially useful when low levels of the transcript do not allowdetection of the mRNA, suitable antibodies are not available, or an eIF4Efamilymember is present at very low levels. In addition, this approach providesa powerful tool for microscopy and subcellular localization of a protein. GFPfusions have been used for all fiveC. elegans IFE proteins. In this technique, thepromoter for each eIF4E familymember gene alongwith the coding sequenceis fused to the cDNA for GFP and the constructs microinjected into worms. Ifa promoter has not been verified experimentally, it is still possible to take acertain amount of DNA sequence upstream of the AUG (this depends on theorganism; 1000 to 1500 bp works forC. elegans) (Dinkova et al., 2005). If theGFP fusion protein is not functionally equivalent to the native protein, thiscould negatively influence the developmental process. Using this approach, ithas been shown that IFE-1::GFP is specifically expressed in germline cells andlocated in P-granules (Amiri et al., 2001), whereas IFE-4::GFP is expressed inmuscle and neurons (Dinkova et al., 2005). It is also possible to useGFP fusionsto display the differential developmental expression pattern beginning fromlate embryos to adults. The developmental expression patterns differ for all fiveC. elegans IFEs (Amiri et al., 2001; Trutschl et al., 2005; B.D.Keiper andR. E.Rhoads, unpublished).
4.3. Altering expression of eIF4E family members
Clues to the function of eIF4E family members can also be derived fromspecific gene deletions or reductions. However, deletion of a particular genemay or may not display an obvious phenotype. Reduction of the levels ofClass I members that function as initiation factors, which includes thecanonical eIF4Es, is expected to have drastic consequences on global cellulartranslation levels and hence to display striking phenotypes. Such has beenthe case of C. elegans IFE-3 knockdown by RNA interference (RNAi)(Keiper et al., 2000). However, for members of noncanonical eIF4E classes,their deletion or reduction may not correlate with an obvious phenotype.
Whenever possible, it is preferable to work with a null mutation, sincetechnical knockouts using agents such as RNAi are not always equallyefficient in all tissues or organisms (Combe et al., 2005; Dinkova et al.,2005). In C. elegans, there are differences in phenotype between the knock-outs and RNAi-treated animals. The null mutation proved very useful forinvestigating C. elegans IFE-4 (Class II/4EHP). Initially IFE-4 was consid-ered rare and of little importance, and no phenotype was apparent fromRNAi knockdowns (Keiper et al., 2000). However, the availability of aknockout strain for IFE-4 revealed a subtle phenotype characterized by

Characterization of eIF4E Family Members 277
defective egg laying and food sensing (Dinkova et al., 2005). Mutation ofthe orthologous gene in Drosophila (eIF4E-8/4EHP) also showed reducedembryo hatching and patterning defects (Cho et al., 2005).
Knockout of other genes can also change the specific expression patternof an eIF4E family member and thereby provide suggestions of function.TheC. elegans germline-deficient strain glp-4was used to show that IFE-1 isspecifically expressed in the germline (Amiri et al., 2001). IFE-3 and IFE-5were also shown by Western blotting to be enriched in germline, but notIFE-2 and IFE-4. RNAi against ife-1 does not cause embryonic lethality(Keiper et al., 2000), but a closer look at the F1 progeny of RNAi-treatedworms reveals temperature-sensitive sterility and reduced brood size infertile animals (Amiri et al., 2001). This phenotype is the result of defectivespermatogenesis in the absence of IFE-1. Therefore, the specific expressionand location of the IFE-1 protein are required for proper germlinedevelopment, although its mechanism of action is not known at present.
There are mutants generated by gene interruption through T-DNA inser-tion for each eIF4E family member in A. thaliana (mutant stock center atSainsburry Laboratory, http://www.arabidopsis.org). If the insertion is at thebeginning of the coding sequence, the protein is usually absent. Null mutantsfor plant eIF(iso)4E have no obvious phenotype, but in such organisms, theeIF4E family member is overexpressed (Duprat et al., 2002). As mentioned inSection 2, natural mutations within plant eIF4E family member genes havebeen identified by viral resistance. By thismethod, correlations between eithereIF4E or eIF(iso)4E and specific viral resistance have been found (Table 13.2).A virus may require eIF4E in one plant species and eIF(iso)4E in another forinfection, or it may require both family members. Such characteristics haverecently found plausible explanations based on interaction between eIF4E andthe VPg, a protein linked to the 50 end of the viral RNA (see Section 6). Sinceboth eIF4E and eIF(iso)4E belong to Class I, it has been proposed that theyperform redundant functions in plants. However, the fact that all plant specieshave both eIF4E and eIF(iso)4E, the specificity of eIF4E or eIF(iso)4E in viralresistance, and the emerging knowledge about eIF4E family members fromother organisms indicate that more careful follow-up on mutant phenotypesshould be performed to elucidate why plants have conserved both familymembers throughout evolution.
When eIF4E knockout mutants are not available, RNAi is a goodoption in some organisms to knock down individual family membersspecifically or a group of family members. The method is rapid and usuallyvery efficient for organisms in which RNAi is systemic. However, it isnecessary to take care in the design and delivery of double-stranded RNA(dsRNA). RNAi can reveal striking phenotypes, e.g., lethal versus viable,and is also useful for transient knockdown of an eIF4E family member’sexpression (Keiper et al., 2000). The latter feature was used to separate directfrom indirect effects of an ife-4 knockout strain (Dinkova et al., 2005).

Table 13.2 eIF4E family member mutations in different plant species that correlate with specific potyviral resistance
Virus HosteIF4E familymember Nature of alteration Source
Turnip mosaic virus A. thaliana eIF(iso)4E Knockout by T-DNA insertion Duprat et al., 2002
Tobacco etch virus A. thaliana eIF(iso)4E Knockout by T-DNA insertion Duprat et al., 2002
Capsicum spp. eIF4E Amino acids changed near the cap-binding
pocket: V67; L67; D109
Ruffel et al., 2002
Lettuce mosaic virus A. thaliana eIF(iso)4E Knockout by T-DNA insertion Duprat et al., 2002
Lactuca spp. eIF4E Amino acids changed near the cap-binding
pocket: A70; Q108-G109-A110
replaced by H
Nicaise et al., 2003
Potato virus Y Lycopersicon
spp.
eIF4E Amino acids changed near the cap-binding
pocket: N68; A77; M108
Ruffel et al., 2005
Capsicum spp. eIF4E Amino acids changed near the cap-binding
pocket: V67; L67; D109
Ruffel et al., 2002
Pepper veinal mottle
virus
Capsicum spp. eIF4E Amino acids changed near the cap-binding
pocket: V67; L67; D109
Ruffel et al., 2006
eIF(iso)4E Natural knockout by insertion of a stop
codon after aa 51
Pea seed borne
mosaic virus
Pisum sativum eIF4E Amino acids changed near the cap-binding
pocket: W62; D73; D74; R107
Gao et al., 2004

Characterization of eIF4E Family Members 279
Possible limitations of the method are the efficiency of RNAi and dsRNAdelivery. In C. elegans, RNAi does not work efficiently in neurons, whichled to knockdown of IFE-4 by RNAi in muscle but not in neurons(Dinkova et al., 2005). To circumvent this, the RNAi can be directed toneurons by the use of a neuron-specific promoter. In plants, a knockdownof tobacco eIF4E, eIF(iso)4E, or both by antisense RNA caused either nophenotype or a mild one (Combe et al., 2005). However, the efficiency ofknockdown was low, making it difficult to draw conclusions.
RNAi, although a commonly used technique for gene silencing, is notthe approach of choice for vertebrates, since RNAi can activate the inter-feron pathway as well as PKR, leading to spurious phenotypes (Marquesand Williams, 2005). Even short hairpin RNAs (shRNAs), which areprocessed to give small interfering RNAs (siRNAs) of 21 nucleotides,have been reported to trigger an interferon response. In view of this, it isnot surprising that RNAi has not proven satisfactory for use in zebrafish(Nasevicius and Ekker, 2000). However, functional depletion of severalgenes in developing zebrafish has been successful using morpholino oligo-nucleotides (Corey and Abrams, 2001). Morpholinos are nonionic DNAanalogues with altered backbone linkages that still bind to complementarynucleic acids by Watson–Crick base pairing. When selected to target thetranslational start site, they can be used to block translation of mRNA. Notall morpholinos are successful in knocking down gene expression, but theuse of multiple morpholinos can make them useful tools.
5. Assessing eIF4E Family Members inTranslation Systems
Examining functional activities of eIF4E family members at the level ofinteraction with the 50-cap structure of mRNAs and with specific mRNAsequences is outlined in Section 3. Function can also be assessed by looking attheir activities in translation, either in vivo in a yeast complementationsystem, or in vitro in a cell-free translation system.
5.1. Function by complementation in yeast
The most informative single assay to determine whether an eIF4E familymember acts as a functional translational factor is the rescue of the lethaldisruption of the sole S. cerevisiae eIF4E gene (cdc33). To accomplish this,an eIF4E family member must be able to interact with S. cerevisiae mRNAas well as with its eIF4G. This approach has exploited the finding that theevolutionarily distant mammalian eIF4E can rescue growth of S. cerevisiae

280 Robert E. Rhoads et al.
lacking functional eIF4E (Altmann et al., 1989). The early ‘‘eIF4Eknockout-and-rescue’’ systems employed auxotrophic markers, such asthat of the Leu2 gene, for the eIF4E gene replacement in either diploid orhaploid yeast strains that previously lacked this gene. Use of diploid strains toassess the function of an untested eIF4E is technically difficult and timeconsuming, requiring specialized microscopic equipment for, and expertisein, the isolation, separation, and analysis of haploid spores (tetrad analysis).However, an S. cerevisiae strain, JOS003, is available in which the yeast genehas been replaced with a G418-resistance cassette and that contains a vectorcarrying human eIF4E-1 cDNA under the control of the glucose-repressible, galactose-dependent GAL1 promoter ( Joshi et al., 2002).A simple glucose-based selection is used to deplete the strain of a humaneIF4E substitute and to assess the functionality of an untested eIF4E familymember, provided its expression is controlled by a glucose-insensitive pro-moter, using media selection techniques akin to those used routinely toculture and maintain bacterial stocks. This strain has been used as a tool toassess the ability of zebrafish (Robalino et al., 2004) and mammalian ( Joshiet al., 2004; McKendrick et al., 2001) eIF4E family members to rescuegrowth. Complementation assays have also demonstrated that five of theDrosophila Class I eIF4Es function as translation factors, eIF4E-1 (a), -2(eIF4E-1a-related), -3 (d), -4 (b), and -7 (e), consistent with their abilitiesto interact with eIF4G and m7GTP-Sepharose (Hernandez et al., 2005).
While a demonstration of complementation in yeast gives a clear indi-cation that an eIF4E family member functions as a translation factor, anegative result may arise from multiple causes. Failure to complementcould signify that the eIF4E in question does not function as a translationfactor. For instance, the Class II eIF4Es from mammals (eIF4E-2/4EHP)andDrosophila melanogaster (eIF4E-8) do not complement S. cerevisiae and donot function as translation factors, consistent with their inability to interactwith eIF4G (Hernandez et al., 2005; Joshi et al., 2004). Conversely, failureto complement could indicate that the eIF4E under investigation is tooevolutionarily distant to interact with S. cerevisiae eIF4G or can recognizeonly 50-cap structures distinct from those found in yeast. For instance, twoeIF4Es, termed eIF4E1 and eIF4E2, are found in the deeply rooted protistGiardia lamblia (Li and Wang, 2005) and fall under the classification ofatypical eIF4Es ( Joshi et al., 2005). Of the two, eIF4E2 has been shownto be essential inG. lamblia and binds to m7GTP-Sepharose, suggesting thatit functions in protein synthesis. The other, eIF4E1, is not essential andbinds only to m3
2,2,7GTP-Sepharose. However, neither homologue canrescue yeast eIF4E in a complementation assay.
Expression of an uncharacterized eIF4E family member in S. cerevisiaecan provide additional clues. For instance, if expression reduces growth inthe presence of galactose (when human eIF4E-1 is expressed), this couldindicate an inhibitory function. In such a situation, an S. cerevisiae strain
Characterization of eIF4E Family Members 281
lacking an endogenous eIF4E gene can be constructed in which the humaneIF4E-1 is expressed from a glucose-insensitive promoter and the putativeinhibitory eIF4E family member is expressed under control of the GAL1promoter. Removal of glucose from medium containing both glucose andgalactose would allow a determination of the effects of increasing levels ofthe putative inhibitory form on protein synthetic activity and growth.
5.2. Function in cell-free translation systems
Assessment of the function of eIF4E family members in cell-free translationsystems has so far received little attention for a variety of reasons. Mostimportant is the fact that eukaryotic cell-free translation systems are com-mercially available only from rabbit reticulocytes and wheat germ, althoughuseful systems have been developed for other species including the nema-todeA. suum (Lall et al., 2004) and the sea urchin Strongylocentrotus purpuratus(Jagus et al., 1992, 1993). Another complication is that cell-free translationsystems already have their own eIF4E. However, it is possible to developeIF4E-depleted mRNA-dependent systems to demonstrate the ability of aneIF4E family member to functionally replace the endogenous eIF4E, as wellas use cell-free systems to identify forms of eIF4E that inhibit or supporttranslation of specific mRNAs.
5.2.1. Recovery of translation in eIF4E-depleted mRNA-dependenttranslation systems
It is possible to assess whether an uncharacterized eIF4E family member canfunctionally replace rabbit eIF4E-1 and act as a translation initiation factorwith the ability to stimulate cap-dependent translation. eIF4E-depeletedcell-free translation systems can be produced by passing the cell extract overm7GTP-Sepharose to remove eIF4E. The complication is that eIF4E istethered to eIF4G, eIF3, and numerous other factors (Keiper et al., 1999),and consequently many other initiation factors are also removed by suchtreatments. One solution to this problem has been to pass wheat germextracts over m7GTP-Sepharose and then add back the missing factors asrecombinant proteins (Gallie and Browning, 2001). This created a systemthat is highly dependent on added wheat eIF4F (eIF4E in complex witheIF4G) or wheat eIF(iso)4F [eIF(iso)4E in complex with eIF(iso)4G]. Theinvestigators found that both eIF4F and eIF(iso)4F stimulated translation ofmRNAs containing little 50 UTR secondary structure, but eIF4F supportedtranslation of an mRNA containing 50-proximal secondary structure sub-stantially better than did eIF(iso)4F. This correlates with the direct bindingresults described in Section 3. A caveat for this study is that it was not possibleto separate the effects due to eIF4E from those due to eIF4G. This is particu-larly relevant since eIF4A bound to eIF4G acts as the RNA helicase that isnecessary to unwind 50 UTRsecondary structure, whereas a role for eIF4E per
282 Robert E. Rhoads et al.
se in unwinding has not been shown. A wheat germ translation system madedependent on eIF4E and eIF4G has also been used to demonstrate thatrecombinant A. thaliana nCBP is capable of stimulating translation, butonly half as well as eIF(iso)4E (Ruud et al., 1998).
An eIF4E-dependent reticulocyte translation system can be prepared inwhich endogenous rabbit eIF4E-1 is depleted by the addition of 4E-BP1(displacing eIF4G from the eIF4EeIF4G complex) followed by removal ofthe 4E-BP1eIF4E-1 complex by m7GTP-Sepharose chromatography(McKendrick et al., 2001). This technique removes eIF4E but only negligi-ble amounts of eIF4G. Depletion of rabbit eIF4E-1 reduces translation of acapped luciferase reporter mRNA to 20% of control values, and translationcan be restored by the addition of 1.4 mM recombinant eIF4E-1. Similarstimulation of translation by an uncharacterized eIF4E family memberwould indicate that it functions as a bona fide initiation factor. The additionof up to 100-fold more recombinant human eIF4E-1 or zebrafish eIF4E-1Athan rabbit eIF4E-1 present in a reticulocyte lysate has no inhibitory effect ontranslation in this system, suggesting that addition of other recombinanteIF4Es should pose no problem ( J. Robalino, B. Joshi, and R. Jagus,unpublished). Using appropriate luciferase reporter mRNAs, such a systemcould also be used to assess the ability of a particular eIF4E family member tostimulate translation of mRNAs containing different types of caps, ‘‘strong’’or ‘‘weak’’ 50 UTRs, poly(A) tracts, etc.
5.2.2. Function of eIF4E family members in an mRNA-dependentreticulocyte translation system not depleted of eIF4E
There are several ways in which an eIF4E family member could function as acompetitive inhibitor of translation by mimicking only some of the activitiesof eIF4E-1. If titration of an eIF4E family member into an unmodifiedreticulocyte translation system causes an inhibition of translation, the resultmay indicate that the protein competes with eIF4E-1 for binding to transla-tion components. Inhibition can also be assessed and verified in the eIF4E-depleted system described above: suboptimal amounts of recombinanthuman eIF4E-1 can be added to reconstitute the eIF4E-dependent transla-tion system, and the eIF4E family members being investigated can be addedto test for inhibition of translation. Recovery of inhibition by addition ofmore eIF4E-1 would indicate competitive inhibition, whereas failure torecover may indicate the presence of a noncompetitive inhibitor. If aneIF4E family member binds only to the mRNAcap and not to eIF4G, oronly to eIF4G, it could inhibit cap-dependent translation but make eIF4Gavailable to promote internal ribosome entry site (IRES)-driven translation.Inhibition of both cap-dependent and IRES-driven translation might indi-cate that the family member binds eIF4G and renders it nonfunctional. Bothscenarios are testable using a bicistronic reporter mRNA with Renilla lucif-erase as the first cistron and firefly luciferase as the second cistron behind a
Characterization of eIF4E Family Members 283
suitable IRES. Testing to see what purified factors overcome any inhibitionshould provide clues to the mechanism of inhibition.
6. Protein–Protein Interaction Assays as aMeans to Differentiate Functions of eIF4EFamily Members
There are many ways to look at protein–protein interactions involvingeIF4E family members. Feasible experimental strategies will vary with themodel organism under study. While the results of such studies will allowfunctional characterization of an eIF4E family member, they may notilluminate the role of an eIF4E in that organism ( Joshi et al., 2004;Robalino et al., 2004). There are many ways to look at interactions, and itis highly advisable to confirm interactions withmultiple alternativemethods.
6.1. Likely candidates
Except for the known exception of S. cerevisiae, cap-dependent translationdepends on the interaction of cap-bound eIF4E with ribosomal-subunit-associated eIF4G, making eIF4E–eIF4G interaction a hallmark of prototyp-ical Class I eIF4Es. An increasing number of proteins, generically known aseIF4E-inhibitory proteins, modulates the eIF4G–eIF4E-1 interaction(Richter and Sonenberg, 2005). The core portion of eIF4G that interactswith eIF4E is small, probably less than 15 amino acid residues. Several otherproteins contain similar peptide motifs, and it is this region that competeswith eIF4G for binding to eIF4E. This canonical eIF4E-binding motif isYXXXXLf (where f is any hydrophobic amino acid). The best character-ized of these are the 4E-BPs, which compete with eIF4G for binding toClass I eIF4Es and are therefore general inhibitors of cap-dependent trans-lation. Although found in most metazoa, the 4E-BPs are present in only aselection of protists and have not been found in plants, nematodes, or mostfungi. With regard to eIF4G and 4E-BP interaction, mammalian eIF4E-2(4EHP) and eIF4E-3 each possesses a range of partial activities. For instance,mammalian eIF4E-2 does not interact with eIF4G but does interact with4E-BPs, whereas mammalian eIF4E-3 interacts with eIF4G but not with4E-BPs ( Joshi et al., 2004).
A compilation of eIF4E-interactve proteins is given in Table 13.3. Inaddition to the 4E-BPs, an increasing number of eIF4E-binding proteinsinteracts with Class I eIF4Es only on specific mRNAs and does so throughaffiliations with specific mRNA-binding proteins to give translationalrepression (Richter and Sonenberg, 2005). These include proteins such asMaskin and Cup, which disrupt eIF4E–eIF4G interaction for mRNAs
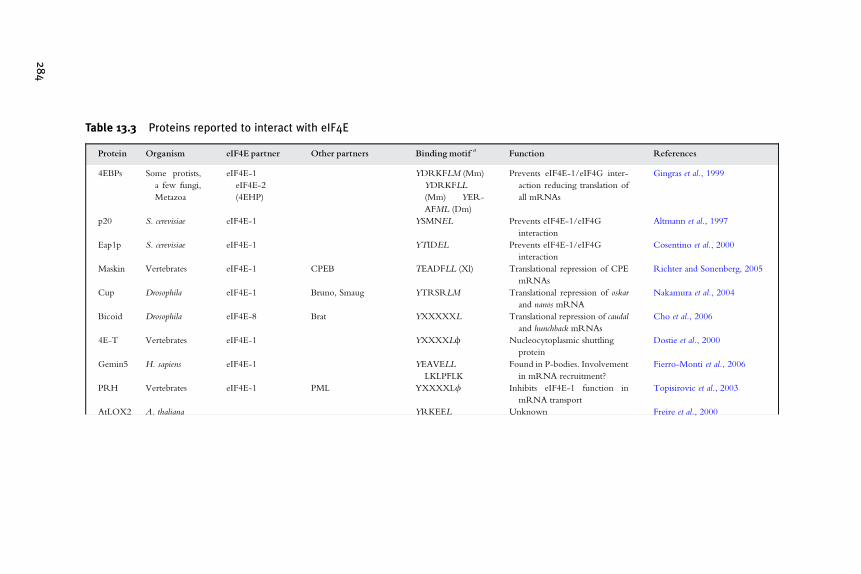
Table 13.3 Proteins reported to interact with eIF4E
Protein Organism eIF4E partner Other partners Bindingmotif a Function References
4EBPs Some protists,
a few fungi,
Metazoa
eIF4E-1
eIF4E-2
(4EHP)
YDRKFLM (Mm)
YDRKFLL
(Mm) YER-
AFML (Dm)
Prevents eIF4E-1/eIF4G inter-
action reducing translation of
all mRNAs
Gingras et al., 1999
p20 S. cerevisiae eIF4E-1 YSMNEL Prevents eIF4E-1/eIF4G
interaction
Altmann et al., 1997
Eap1p S. cerevisiae eIF4E-1 YTIDEL Prevents eIF4E-1/eIF4G
interaction
Cosentino et al., 2000
Maskin Vertebrates eIF4E-1 CPEB TEADFLL (Xl) Translational repression of CPE
mRNAs
Richter and Sonenberg, 2005
Cup Drosophila eIF4E-1 Bruno, Smaug YTRSRLM Translational repression of oskar
and nanos mRNA
Nakamura et al., 2004
Bicoid Drosophila eIF4E-8 Brat YXXXXXL Translational repression of caudal
and hunchback mRNAs
Cho et al., 2006
4E-T Vertebrates eIF4E-1 YXXXXLf Nucleocytoplasmic shuttling
protein
Dostie et al., 2000
Gemin5 H. sapiens eIF4E-1 YEAVELL
LKLPFLK
Found in P-bodies. Involvement
in mRNA recruitment?
Fierro-Monti et al., 2006
PRH Vertebrates eIF4E-1 PML YXXXXLf Inhibits eIF4E-1 function in
mRNA transport
Topisirovic et al., 2003
AtLOX2 A. thaliana YRKEEL Unknown Freire et al., 2000
284
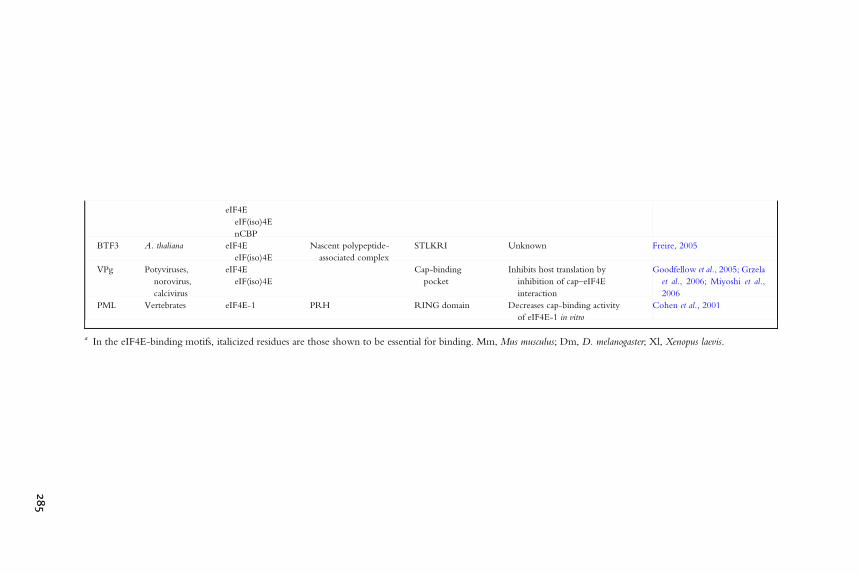
eIF4E
eIF(iso)4E
nCBP
BTF3 A. thaliana eIF4E
eIF(iso)4E
Nascent polypeptide-
associated complex
STLKRI Unknown Freire, 2005
VPg Potyviruses,
norovirus,
calcivirus
eIF4E
eIF(iso)4E
Cap-binding
Inhibits host translation by
inhibition of cap–eIF4E
interaction
Goodfellow et al., 2005; Grzela
et al., 2006; Miyoshi et al.,
2006
PML Vertebrates eIF4E-1 PRH RING domain Decreases cap-binding activity
of eIF4E-1 in vitro
Cohen et al., 2001
a In the eIF4E-binding motifs, italicized residues are those shown to be essential for binding. Mm, Mus musculus; Dm, D. melanogaster; Xl, Xenopus laevis.
285

286 Robert E. Rhoads et al.
containing certain sequence elements in the 30 UTR. In each case, theeIF4E interaction involves the YXXXXLfmotif of the translational repres-sor. More than 200 homeodomain proteins from Drosophila and vertebratescontain at least one of these potential eIF4E-binding sites including verte-brate PRH and PML (Topisirovic et al., 2003). Thus, some homeodomainproteins are potential modulators of eIF4E. Recently a Class II eIF4E familymember in Drosophila, 4EHP (eIF4E-8), was found as part of a similarinhibitory complex for Caudal (Cad), an mRNA also involved in antero-posterior embryo patterning (Cho et al., 2005). The approach was based firston phenotypic observation of 4EHP mutants. It was found that 4EHPinhibits local translation of Cad mRNA by interacting with Bicoid (a 30UTR-binding protein). The mechanism appears similar to the one foundfor eIF4E-1 and Cup. Another likely candidate for interaction with eIF4Efamily members is the nucleocytoplasmic transporter protein 4E-T. It iscurrently unknown whether 4E-T interacts with eIF4E family membersother than Class I.
New eIF4E-inhibitory proteins are still being uncovered, not all of whichcarry the YXXXXL motif. For instance, the VPgs of some potyviruses havebeen shown to interact withA. thaliana eIF4E and eIF(iso)4E with a bindingsite in or near the cap-binding pocket (Khan et al., 2006;Michon et al., 2006;Miyoshi et al., 2006). Not surprisingly, searches for naturally occurring viralresistance have identified either eIF(iso)4E or eIF4E in different plant speciesas the mutated genes related to viral resistance (Table 13.2). Future investi-gations are likely to uncover new eIF4E-inhibitory proteins, some of whichwill interact differentially with eIF4E family members, by methods such asthose described below.
6.2. ‘‘Pull-down’’ methods
A demonstration of the interaction between eIF4E family members andlikely candidate proteins can include copurification using appropriate affin-ity columns such as m7GTP-Sepharose or m3
2,2,7GTP-Sepharose, coim-munoprecipitation if appropriate antibodies are available, ‘‘pull-downs’’using tagged recombinant protein as bait or prey, and far-Western analyses.For any of these approaches, consideration should be paid to the source of‘‘bait’’ or ‘‘prey,’’ as well as to the analytical methods used to assess theinteraction.
6.2.1. Source of ‘‘bait’’Since new eIF4E family members are usually identified as the predictedtranslation products of cDNAs, it is most likely that some form of recombi-nant eIF4E will be used. Production of recombinant proteins allows theinclusion of a variety of tags that can be used to purify the protein or track itsinteractions with other proteins. Production of recombinant eIF4E family

Characterization of eIF4E Family Members 287
members is most likely to be from Escherichia coli, using vectors such as thepET (EMD Biosciences) or pGEX (GE Healthcare) series, since anyeukaryotic expression system will contain endogenous eIF4E family mem-bers as well as interacting proteins such as eIF4G or 4E-BPs. Alternatively,recombinant eIF4Es can be generated by in vitro expression using translationvectors such as pCITE (EMDBiosciences), which gives the added benefit ofgenerating radiolabeled eIF4Es if desired.
6.2.2. The vagaries of recombinant protein productionIt is never possible to predict what conditions will favor the production ofproperly folded, active eIF4Es. Recombinant eIF4E is found primarily ininclusion body pellets, requiring either the use of the small proportionfound in the bacterial supernatant or solubilization and renaturation fromthe pellets. A suitable solubilization/renaturation protocol is likely torequire trial and error. Solubilization in 6 M guanidine–HCl and 100 mMdithiothreitol (DTT) to give a protein concentration of not more than1 mg/ml usually works well ( Joshi et al., 2004). Proteins can be renaturedby staged dialyses or by rapid dilution (20-fold) into buffer containing50 mM HEPES-KOH, pH 7.2, 200 mM NaCl (Rudolph et al., 1997). Ifa glutathione-S-transferase (GST) vector is used, renaturation can be moni-tored by measuring GST activity spectrophotometrically (B. Joshi, unpub-lished method). This is particularly useful when making a recombinanteIF4E family member of unknown function, since a test of renaturationby function cannot be easily made. The renatured fusion proteins can beconcentrated and purified by glutathione-Sepharose (APBiotech) affinitychromatography and stored in liquid N2 until use. Since a bacteriallyproduced eIF4E family member may not be completely active, it is usefulto compare its activity with the same recombinant protein produced in anin vitro translation system ( Joshi et al., 2004; Robalino et al., 2004).
6.2.3. Source of ‘‘prey’’If recombinant eIF4E ‘‘bait’’ is used, the ideal prey would be endogenousprotein from tissue or cell extracts. This may work well for analyzing thepartners in a model system such as human or mouse, for which there is easyor commercial access to antibodies, but works less well in systems for whichfewer resources are available, such as zebrafish, Xenopus, sea urchin, orprotists. The easiest strategy to monitor interactions between eIF4E familymembers and suspected prey proteins is to cotranslate mRNAs for S-taggedeIF4E family members and a potential prey protein such as eIF4G or the4E-BPs. This is done using translation vector constructs such as pCITE inthe presence of [35S]methionine in a coupled reticulocyte transcription/translation system ( Joshi et al., 2004; Robalino et al., 2004). 35S-labeled preyproteins bound to S-tagged, 35S-labeled, eIF4E family members can berecovered by binding to S-protein agarose (Novagen) and visualized by

288 Robert E. Rhoads et al.
SDS–PAGE and autoradiography. However, to be confident about resultsusing only recombinant proteins, it is advisable to seek confirmation viaadditional methods. For instance, zebrafish eIF4E-1A but not eIF4E-1Binteracts with zebrafish 4E-BP, as assessed by pull-down of in vitro-synthe-sized, 35S-labeled 4E-BP with S-tagged, in vitro-synthesized, 35S-labeledeIF4E-1A and -1B (Robalino et al., 2004). This result was confirmed bydemonstrating that endogenous eIF4E-1A but not eIF4E-1B from zebrafishovary extracts could be pulled down with His-labeled 4E-BP (Robalinoet al., 2004).
When developing prey constructs for use in interaction studies, it ispreferable to use cDNAs encoding the potential prey (eIF4G, BPs, 4E-T,Maskin, etc.) from the same or a closely related species. This may not beimportant between rabbit and human, or even among vertebrates, but itcould be important for more distantly related species. For instance, humaneIF4G-1 interacts well with zebrafish eIF4E-1A (Robalino et al., 2004). Onthe other hand, Drosophila eIF4E-5(c) can interact with Drosophila eIF4Gbut not yeast eIF4G (Hernandez et al., 2005). Finally, when looking forinteractions of eIF4E family members with large proteins such as eIF4G, it istechnically challenging to use the full-length proteins, although expressionof the eIF4E-binding domain can be useful. A 455-amino acid fragmentequivalent to amino acids 159 to 614 of human eIF4G-1, which includesthe eIF4E-binding domain, interacts robustly with mouse eIF4E-1 andzebrafish eIF4E-1A ( Joshi et al., 2004; Robalino et al., 2004). Similar studieshave successfully used both a short eIF4E-binding peptide and an 100amino acid domain, although no careful comparisons of different sizedfragments have been reported.
6.2.4. Yeast two-hybrid (Y2H) analysisIf partners for eIF4E family members are identified by pull-down assays orother methods described below, they can be confirmed by Y2H analysis.For instance, the interactions of VPgs from different potyviruses with eithereIF(iso)4E or eIF4E have been demonstrated by pull-down assays of recom-binant tagged proteins and competition for cap binding to m7GTP-Sephar-ose or capped mRNA analogs, with the interactions then confirmed byY2H. Conversely, there have been potential binding partners for eIF4Efamily members in plants uncovered by Y2H that have been partiallyconfirmed in other assays.
6.3. Far-Western analyses
Because far-Western analysis employs a very concentrated membrane-bound substrate, it is possible that the sensitivity of this technique allowsdetection of weaker interactions. This has been shown to be the case formouse eIF4E-2 (4EHP), which shows a robust interaction with 4E-BP2

Characterization of eIF4E Family Members 289
and -BP3 in far-Western assays using GST-tagged eIF4E-2 as probe, andsome interaction with 4E-BP1 ( Joshi et al., 2004). However, the interac-tion is much less obvious in pull-down experiments. When identifyingprotein–protein interactions by the far-Western technique, it is importantto always include appropriate controls to distinguish true protein–proteininteraction bands from nonspecific artifactual ones. For example, experi-ments involving detection with recombinant GST fusion proteins should bereplicated with GST alone. A bait protein with an amino acid substitution inthe predicted interaction domain could also be used as a control to deter-mine specificity as could a nonrelevant protein. Ideally, the control proteinwould be of similar size and charge as the protein under investigation andwould not interact nonspecifically with the bait protein.
6.4. Methods to uncover new protein partners
6.4.1. Y2HThe Y2H system has been used as an approach to find eIF(iso)4E-interactingproteins in A. thaliana (Freire, 2005; Freire et al., 2000). Interestingly, thein vivo partner of eIF(iso)4E, eIF(iso)4G, was not found in the screen. Y2Hindicated an interaction between lipoxygenase 2 (AtLOX2; mainly a chlo-roplast protein) and eIF(iso)4E and an interaction between BTF3, a compo-nent of the nascent polypeptide-associated complex, and eIF(iso)4E. TheY2H findings were confirmed by coimmunoprecipitation, copurification onm7GTP-Sepharose, and reapplication of the Y2H system. Although initiallyfound for eIF(iso)4E, in vitro interactions with these proteins were demon-strated for all three plant eIF4E family members. No in vivo significance ofsuch interactions is known. In principle, the interaction of prey proteins witheIF4E could be mediated by yeast eIF4G, but this is unlikely for two reasons.First, the eIF4E under investigation would need to have high affinity foryeast eIF4G, which does not appear to be the case for human eIF4E (Joshiet al., 2002). Second, the interaction between the bait and prey proteinsneeds to be close enough to bring together the DNA-binding and theactivation domains; if the interaction were through yeast eIF4G, it wouldincrease this distance.
6.4.2. Mass spectrometryProteins from cells or tissue extracts obtained by pull-downs using eIF4Efamily members as bait proteins can be identified by liquid chromatographyand bothMALDI and electrospray tandemmass spectrometric methods. Suchanalyses can only be usefully done for organisms for which a protein databasehas been established. An example of a novel eIF4E-1-interacting proteinfound in this way is Gemin5 (Fierro-Monti et al., 2006). Gemin5 is presentin human cell lines and binds human eIF4E-1 in a GST pull-down assay.
290 Robert E. Rhoads et al.
The protein contains the YXXXXLf characteristic of eIF4E-interactingproteins and colocalizes to P-bodies.
6.4.3. Clues from interactome databasesThe availability of genome-scale sets of cloned open reading frames hasfacilitated systematic efforts at creating proteome-scale data sets of protein–protein interactions. These are represented as complex networks, or ‘‘inter-actome’’ maps. Currently, two experimental methodologies are usedfor generating genome-scale protein interaction maps: high-throughputyeast two-hybrid analysis (HT-Y2H) and analysis of protein complexes byaffinity purification and mass spectrometry (AP-MS). Y2H, being a binaryassay, captures direct protein–protein interactions, whereas AP-MS identi-fies components of stable complexes. Although far from complete, suchmaps are a useful resource to predict the function(s) of thousands of genes.These large-scale systematic surveys of protein–protein interactions are avail-able for an increasing number of species, giving databases that can bemined forinteracting partners of eIF4E family members. At present, comprehensivedatabases are available only for a handful of model organisms: S. cerevisiae[http://yeast-complexes.embl.de; http://tap.med.utoronto.edu (Legrain andSelig, 2000); C. elegans (http://vidal.dfci.harvard.edu/interactomedb/i-View/interactomeCurrent.pl [Li et al., 2004]); and D. melanogaster (http://gifts.univ-mrs.fr/FlyNets/FlyNets; http://gifts.univ-mrs.fr/GIFTS_home_page.html [Mohr et al., 1998]). They are currently being developedfor H. sapiens (http://www.himap.org:80/main/index.jsp) and A. thaliana(http://www.associomics.org/). So far, the worm and fly interactome mapseach contains more than 5000 high-quality putative interactions, derivedprimarily from HT-Y2H screens. Deductions on the dynamic nature ofinteractions can be obtained when HT-Y2H and AP-MS are combinedor when interaction data are supplemented with expression profiling dataand phenotypic analyses (Ge et al., 2003).
7. Global Microarray Studies of PolysomalmRNA Distribution
When no obvious phenotype is observable in a mutant strain for aneIF4E family member, and when there are no clues from specific proteininteractions, global expression analysis of mutants becomes very useful.Microarrays are available for completely or partially sequenced organismsas well as cell lines and tissues. Such an approach is feasible for severalorganisms in which eIF4E family members have been found. Since eIF4Eis a translation factor, the approach would initially consist of a search for

Characterization of eIF4E Family Members 291
translationally affected genes when a specific eIF4E family member isknocked out.
Such an analysis was undertaken in C. elegans to study the function ofIFE-4, a Class II member (Dinkova et al., 2005). Translationally activemRNAs were purified from ‘‘heavy’’ and ‘‘light’’ polysomal fractions,that is, having fast and slow sedimentation rates on a sucrose gradient,respectively. To assess the steady-state level of each mRNA, total RNAwas also prepared from the same samples. Hybridization of each mRNApool to Affymetrix microarrays containing the whole genome of C. elegans(19,000 genes) revealed that a small subset of transcripts changed inpolysomal distribution in the absence of IFE-4 (microarray results werecompared between the Dife-4 and wild-type strains). Some of the affectedmRNAs correlated with specific phenotypic traits of the Dife-4 worms.
In addition to the polysomal distribution changes, the microarray analy-sis showed that there were important changes in the steady-state levels ofsome mRNAs. The mechanisms underlying such regulation by IFE-4 inC. elegans remain unknown. As noted above, cap recognition by eIF4Eplays a role not only in translation initiation but also in mRNA transportfrom the nucleus and mRNA degradation. Therefore, microarrays canbe an important tool to find targets of eIF4E function at several levels ofmRNA metabolism. However, conclusions from microarray data ongene expression should be further confirmed by other techniques such asNorthern blotting, QRT-PCR, Western blotting, etc.
Microarray experiments yield a huge amount of information that isdifficult to analyze with standard biochemical tools. In the past 5 years, awealth of information has become available for transcriptomes of sequencedorganisms such as S. cerevisiae, C. elegans, D. melanogaster, M. musculus, andA. thaliana. As described in Section 4 , such information can be used to findthe mRNA expression pattern of different eIF4E family members within thelife cycle or individual tissues in the organism by simply typing the gene IDentry of the gene of choice (e.g., https://www.genevestigator.ethz.ch/). Inaddition, microarray data obtained for mutants of any eIF4E family membercould be analyzed using bioinformatics tools applied to available databases onexpression profiles, polysomal profiles, or UTR sequences (Kawaguchi andBailey-Serres, 2005; Trutschl et al., 2005).
We combined information from public databases on expression profiles forC. elegans (http://cmgm.stanford.edu/kimlab/dev/) with the results fromour Dife-4mutant polysomal microarray experiments (http://genome.cs.lsus.edu/mRNA/PG2005/) to search for a relationship between developmentalprofile of expression and sensitivity of translation to IFE-4 (Trutschl et al.,2005). We developed a method that utilized two algorithms for clusteringdatasets according to the expression profile during development and poly-somal distribution in the Dife-4 mutant. The outputs are linked using a two-dimensional color scale for visualization of any correlations. The result of this

292 Robert E. Rhoads et al.
analysis indicated the mRNAs affected in polysome distribution by the loss ofIFE-4 display a specific developmental expression pattern, similar to thatobserved for the IFE-4::GFP fusion protein. However, not all the mRNAswith such an expression pattern are affected by the absence of IFE-4. There-fore, additional characteristics of the mRNAs, besides being expressed withthe same developmental pattern as IFE-4, are needed tomake themdependenton this eIF4E family member for translation. The characteristics are yet to bediscovered.
The basis for mRNA specificity by individual eIF4E family members isonly beginning to be understood. As mentioned in Sections 3.1 and 6.1,eIF4E family members can have preferences for specific mRNA sequencesin the 50 UTR or can bind proteins that recognize specific sequences in the30 UTR. Therefore, it may be worthwhile to undertake bioinformaticsapproaches such as the one described above to explore the relationshipsbetween sequences in the UTRs and dependence of an mRNA’s translationon a specific eIF4E family member. A limitation is the paucity of reliableUTR sequences for genes that are present in a given microarray. However,if relevant databases are available for the organism of choice, UTRsequences could be extracted with bioinformatics tools. For example, theaffinity purification of capped mRNAs from A. thaliana has allowed thecapture of 50 UTR sequences for over 14,000 full-length cDNAs(Kawaguchi and Bailey-Serres, 2005). These and other collections ofhigh-quality cDNA sequence data are publicly available and provide avaluable resource for bioinformatics analysis of features in the 50 UTR,coding sequence, and 30 UTR that are relevant for translational regulation .
ACKNOWLEDGMENTS
The authors gratefully acknowledge the assistance of Dr. Bhavesh Joshi for help withFig. 13.1. This work was supported by Grant MCB-0134013 from the National ScienceFoundation (to R. J.) and 2 R01-GM020818 from the National Institute of General MedicalSciences (to R. E. R.).
REFERENCES
Altmann, M., Muller, P. P., Pelletier, J., Sonenberg, N., and Trachsel, H. (1989).A mammalian translation initiation factor can substitute for its yeast homologue in vivo.J. Biol. Chem. 264, 12145–12147.
Altmann, M., Schmitz, N., Berset, C., and Trachsel, H. (1997). A novel inhibitor of cap-dependent translation initiation in yeast: P20 competes with eIF4G for binding to eIF4E.EMBO J. 16, 1114–1121.
Amiri, A., Keiper, B. D., Kawasaki, I., Fan, Y., Kohara, Y., Rhoads, R. E., and Strome, S.(2001). An isoform of eIF4E is a component of germ granules and is required forspermatogenesis in C. elegans. Development 128, 3899–3912.

Characterization of eIF4E Family Members 293
Carberry, S. E., and Goss, D. J. (1991). Wheat germ initiation factors 4F and (iso)4F interactdifferently with oligoribonucleotide analogues of rabbit a-globin mRNA. Biochemistry30, 4542–4545.
Carberry, S. E., Friedland, D. E., Rhoads, R. E., and Goss, D. J. (1992). Binding of proteinsynthesis initiation factor 4E to oligoribonucleotides: Effects of cap accessibility andsecondary structure. Biochemistry 31, 1427–1432.
Cho, P., Poulin, F., Cho-Park, Y., Cho-Park, I., Chicoine, J., Lasko, P., and Sonenberg, N.(2005). A new paradigm for translational control: Inhibition via 50-30 mRNA tetheringby Bicoid and the eIF4E cognate 4EHP. Cell 121, 411–423.
Cho, P., Gamberi, C., Cho-Park, Y., Cho-Park, I., Lasko, P., and Sonenberg, N. (2006).Cap-dependent translational inhibition establishes two opposing morphogen gradients inDrosophila embryos. Curr. Biol. 16, 2035–2041.
Clamp, M., Cuff, J., Searle, S. M., and Barton, G. J. (2004). The Jalview Java alignmenteditor. Bioinformatics 20, 426–427.
Cohen, N., Sharma, M., Kentsis, A., Perez, J. M., Strudwick, S., and Borden, K. L. (2001).PML RING suppresses oncogenic transformation by reducing the affinity of eIF4E formRNA. EMBO J. 20, 4547–4559.
Combe, J., Petracek, M., van Eldik, G., Meulewaeter, F., and Twell, D. (2005). Translationinitiation factors eIF4E and eIFiso4E are required for polysome formation and regulateplant growth in tobacco. Plant Mol. Biol. 57, 749–760.
Corey, D., and Abrams, J. (2001). Morpholino antisense oligonucleotides: Tools for inves-tigating vertebrate development. Genome Biol. 2, reviews1015.1–1015.3.
Cosentino, G. P., Schmelzle, T., Haghighat, A., Helliwell, S. B., Hall, M. N., andSonenberg, N. (2000). Eap1p, a Novel eukaryotic translation initiation factor 4E-asso-ciated protein in Saccharomyces cerevisiae. Mol. Cell. Biol. 20, 4604–4613.
De Benedetti, A., and Graff, J. R. (2004). eIF-4E expression and its role in malignancies andmetastases. Oncogene 23, 3189–3199.
De Benedetti, A., and Rhoads, R. E. (1990). Overexpression of eukaryotic protein synthesisinitiation factor 4E in HeLa cells results in aberrant growth and morphology. Proc. Natl.Acad. Sci. USA 87, 8212–8216.
De Benedetti, A., Joshi-Barve, S., Rinker-Schaeffer, C., and Rhoads, R. E. (1991). Expres-sion of antisense RNA against initiation factor eIF-4E mRNA in HeLa cells results inlengthened cell division times, diminished translation rates, and reduced levels of botheIF-4E and the p220 component of eIF-4F. Mol. Cell. Biol. 11, 5435–5445.
DeFatta, R. J., Chervenak, R. P., and De Benedetti, A. (2002a). A cancer gene therapyapproach through translational control of a suicide gene. Cancer Gene Ther. 9, 505–512.
DeFatta, R. J., Li, Y., and De Benedetti, A. (2002b). Selective killing of cancer cells based ontranslational control of a suicide gene. Cancer Gene Ther. 9, 573–578.
Dinkova, T. D., and Sanchez de Jimenez, E. (1999). Differential expression and regulation oftranslation initiation factors -4E and -iso4E during maize germination. Physiol. Plant.107, 419–425.
Dinkova, T. D., Keiper, B. D., Korneeva, N. L., Aamodt, E. J., and Rhoads, R. E. (2005).Translation of a small subset of Caenorhabditis elegans mRNAs is dependent on a specificeIF4E isoform. Mol. Cell. Biol. 25, 100–113.
Dostie, J., Ferraiuolo, M., Pause, A., Adam, S. A., and Sonenberg, N. (2000). A novelshuttling protein, 4E-T, mediates the nuclear import of the mRNA 50 cap-bindingprotein, eIF4E. EMBO J. 19, 3142–3156.
Duprat, A., Caranta, C., Revers, F., Menand, B., Browning, K., and Robaglia, C. (2002).The Arabidopsis eukaryotic initiation factor (iso)4E is dispensable for plant growth butrequired for susceptibility to potyviruses. Plant J. 32, 927–934.
Dwyer, D. S. (2001). Model of the 3-D structure of the GLUT3 glucose transporter andmolecular dynamics simulation of glucose transport. Proteins 42, 531–541.

294 Robert E. Rhoads et al.
Dyer, J. R., Pepio, A. M., Yanow, S. K., and Sossin, W. S. (1998). Phosphorylation of eIF4Eat a conserved serine in Aplysia. J. Biol. Chem. 273, 29469–29474.
Ferraiuolo, M. A., Basak, S., Dostie, J., Murray, E. L., Schoenberg, D. R., andSonenberg, N. (2005). A role for the eIF4E-binding protein 4E-T in P-body formationand mRNA decay. J. Cell Biol. 170, 913–924.
Fierro-Monti, I., Mohammed, S., Matthiesen, R., Santoro, R., Burns, J., Williams, D.,Proud, C., Kassem, M., Jensen, O., and Roepstorff, P. (2006). Quantitative proteomicsidentifies Gemin5, a scaffolding protein involved in ribonucleoprotein assembly, as anovel partner for eukaryotic initiation factor 4E. J. Proteome Res. 5, 1367–1378.
Freire, M. (2005). Translation initiation factor (iso) 4E interacts with BTF3, the beta subunitof the nascent polypeptide-associated complex. Gene 345, 271–277.
Freire, M., Tourneur, C., Granier, F., Camonis, J., El Amrani, A., Browning, K., andRobaglia, C. (2000). Plant lipoxygenase 2 is a translation initiation factor-4E-bindingprotein. Plant Mol. Biol. 44, 129–140.
Gallie, D. R., and Browning, K. S. (2001). eIF4G functionally differs from eIFiso4G inpromoting internal initiation, cap-independent translation, and translation of structuredmRNAs. J. Biol. Chem. 276, 36951–36960.
Gao, Z., Johansen, E., Eyers, S., Thomas, C., Noel Ellis, T., and Maule, A. (2004). Thepotyvirus recessive resistance gene, sbm1, identifies a novel role for translation initiationfactor eIF4E in cell-to-cell trafficking. Plant J. 40, 376–385.
Ge, H., Walhout, A., and Vidal, M. (2003). Integrating ‘omic’ information: A bridgebetween genomics and systems biology. Trends Genet. 19, 551–560.
Gingras, A.-C., Raught, B., and Sonenberg, N. (1999). eIF4 initiation factors: Effectors ofmRNA recruitment to ribosomes and regulators of translation. Annu. Rev. Biochem. 68,913–963.
Goodfellow, I., Chaudhry, Y., Gioldasi, I., Gerondopoulos, A., Natoni, A., Labrie, L.,Laliberte, J., and Roberts, L. (2005). Calicivirus translation initiation requires an interac-tion between VPg and eIF 4 E. EMBO Rep. 6, 968–972.
Gorlich, D., andMattaj, I. W. (1996). Nucleocytoplasmic transport. Science 271, 1513–1518.Graff, J. R., Boghaert, E. R., De Benedetti, A., Chan, S. K., and Zimmer, S. G. (1995).
Reduction of the levels of initiation factor 4E mediates the malignant phenotype ofras-transformed rat fibroblasts. Int. J. Cancer 60, 255–263.
Grzela, R., Strokovska, L., Andrieu, J., Dublet, B., Zagorski, W., and Chroboczek, J.(2006). Potyvirus terminal protein VPg, effector of host eukaryotic initiation factoreIF4E. Biochimie 88, 887–896.
Hernandez, G., and Vazquez-Pianzola, P. (2005). Functional diversity of the eukaryotictranslation initiation factors belonging to eIF4 families. Mech. Dev. 122, 865–876.
Hernandez, G., Altmann, M., Sierra, J. M., Urlaub, H., del Corral, R. D., Schwartz, P., andRivera-Pomar, R. (2005). Functional analysis of seven genes encoding eight translationinitiation factor 4E (eIF4E) isoforms in Drosophila. Mech. Dev. 122, 529–543.
Hsu, C., and Stevens, A. (1993). Yeast cells lacking 50 ! 30 exoribonuclease 1 containmRNA species that are poly(A) deficient and partially lack the 50 cap structure.Mol. Cell.Biol. 13, 4826–4835.
Jagus, R., Huang, W.-I., Hansen, L. J., and Wilson, M. A. (1992). Changes in rates of proteinsynthesis and eukaryotic initiation factor-4 inhibitory activity in cell-free translation systemsof sea urchin eggs and early cleavage stage embryos. J. Biol. Chem. 267, 15530–15536.
Jagus,R.,Huang,W.-I.,Hiremath, L. S., Stern,B.D., andRhoads,R.E. (1993).Mechanismofaction of developmentally regulated sea urchin inhibitor of eIF-4.Dev. Genet. 14, 412–423.
Jankowska-Anyszka, M., Lamphear, B. J., Aamodt, E. J., Harrington, T., Darzynkiewicz, E.,Stolarski, R., and Rhoads, R. E. (1998). Multiple isoforms of eukaryotic proteinsynthesis initiation factor 4E in C. elegans can distinguish between mono- and trimethy-lated mRNA cap structures. J. Biol. Chem. 273, 10538–10542.
Characterization of eIF4E Family Members 295
Joshi, B., Robalino, J., Schott, E. J., and Jagus,R. (2002). Yeast ‘‘knockout-and-rescue’’ systemfor identification of eIF4E-family members possessing eIF4E-activity. Biotechniques 33,392–398.
Joshi, B., Cameron, A., and Jagus, R. (2004). Characterization of mammalian eIF4E-familymembers. Eur. J. Biochem. 271, 2189–2203.
Joshi, B., Lee, K., Maeder, D., and Jagus, R. (2005). Phylogenetic analysis of eIF4E-familymembers. BMC Evol. Biol. 5, 48.
Kapp, L. D., and Lorsch, J. R. (2004). The molecular mechanics of eukaryotic translation.Ann. Rev. Biochem. 73, 657–704.
Kawaguchi, R., and Bailey-Serres, J. (2005). mRNA sequence features that contribute totranslational regulation in Arabidopsis. Nucl. Acids Res. 33, 955–965.
Keiper, B. D., Gan, W., and Rhoads, R. E. (1999). Molecules in focus: Protein synthesisinitiation factor 4G. Int. J. Biochem. Cell Biol. 31, 37–41.
Keiper, B. D., Lamphear, B. J., Deshpande, A. M., Jankowska-Anyszka, M., Aamodt, E. J.,Blumenthal, T., and Rhoads, R. E. (2000). Functional characterization of five eIF4Eisoforms in Caenorhabditis elegans. J. Biol. Chem. 275, 10590–10596.
Khan, M. A., Miyoshi, H., Ray, S., Natsuaki, T., Suehiro, N., and Goss, D. J. (2006).Interaction of genome-linked protein (VPg) of turnip mosaic virus with wheat germtranslation initiation factors eIFiso4E and eIFiso4F. J. Biol. Chem. 281, 28002–28010.
Lall, S., Friedman, C. C., Jankowska-Anyszka, M., Stepinski, J., Darzynkiewicz, E., andDavis, R. E. (2004). Contribution of trans-splicing, 50-leader length, cap-poly(A) syner-gism, and initiation factors to nematode translation in an Ascaris suum embryo cell-freesystem. J. Biol. Chem. 279, 45573–45585.
Lazaris-Karatzas, A., Montine, K. S., and Sonenberg, N. (1990). Malignant transformation bya eukaryotic initiation factor subunit that binds to mRNA 50 cap. Nature 345, 544–547.
Legrain, P., and Selig, L. (2000). Genome-wide protein interaction maps using two-hybridsystems. FEBS Lett. 480, 32–36.
Li, L., and Wang, C. C. (2005). Identification in the ancient protist Giardia lamblia of twoeukaryotic translation initiation factor 4E homologues with distinctive functions. Eukaryot.Cell 4, 948–959.
Li, S., Armstrong, C. M., Bertin, N., Ge, H., Milstein, S., Boxem, M., Vidalain, P.-O.,Han, J.-D. J., Chesneau, A., Hao, T., Goldberg, D. S., Li, N., et al. (2004). A map of theinteractome network of the metazoan C. elegans. Science 303, 540–543.
Manjunath, S., Williams, A., and Bailey-Serres, J. (1999). Oxygen deprivation stimulatesCa2þ-mediated phosphorylation of mRNA cap-binding protein eIF4E in maize roots.Plant J. 19, 21–30.
Marcotrigiano, J., Gingras, A.-C., Sonenberg, N., and Burley, S. K. (1997). Cocrystal structureof the messenger RNA 50 cap-binding protein (eIF4E) bound to 7-methyl-GDP. Cell 89,951–961.
Marques, J., and Williams, B. (2005). Activation of the mammalian immune system bysiRNAs. Nat. Biotechnol. 23, 1399–1405.
Matsuo, H., Li, H., McGuire, A. M., Fletcher, C. M., Gingras, A.-C., Sonenberg, N., andWagner, G. (1997). Structure of translation factor eIF4E bound to m7GDP and interac-tion with 4E-binding protein. Nature Struct. Biol. 4, 717–724.
McKendrick, L., Morley, S. J., Pain, V. M., Jagus, R., and Joshi, B. (2001). Phosphorylationof eukaryotic initiation factor 4E (eIF4E) at Ser209 is not required for protein synthesisin vitro and in vivo. Eur. J. Biochem. 268, 5375–5385.
Michon, T., Estevez, Y., Walter, J., German-Retana, S., and Le Gall, O. (2006). Thepotyviral virus genome-linked protein VPg forms a ternary complex with the eukaryoticinitiation factors eIF4E and eIF4G and reduces eIF4E affinity for a mRNA cap analogue.FEBS J. 273, 1312–1322.

296 Robert E. Rhoads et al.
Miyoshi, H., Dwyer, D. S., Keiper, B. D., Jankowska-Anyszka, M., Darzynkiewicz, E., andRhoads, R. E. (2002). Discrimination between mono- and trimethylated cap structuresby two isoforms of Caenorhabditis elegans eIF4E. EMBO J. 21, 1–11.
Miyoshi, H., Suehiro, N., Tomoo, K.,Muto, S., Takahashi, T., Tsukamoto, T., Ohmori, T.,and Natsuaki, T. (2006). Binding analyses for the interaction between plant virusgenome-linked protein (VPg) and plant translational initiation factors. Biochimie 88,329–340.
Mohr, E., Horn, F., Janody, F., Sanchez, C., Pillet, V., Bellon, B., Roder, L., and Jacq, B.(1998). FlyNets and GIF-DB, two internet databases for molecular interactions inDrosophila melanogaster. Nucleic Acids Res. 26, 89–93.
Morales, J., Mulner-Lorillon, O., Cosson, B., Morin, E., Belle, R., Bradham, C.,Beane, W., and Cormier, P. (2006). Translational control genes in the sea urchingenome. Dev. Biol. 300, 293–307.
Nakamura, A., Sato, K., and Hanyu-Nakamura, K. (2004). Drosophila cup is an eIF4Ebinding protein that associates with Bruno and regulates oskar mRNA translation inoogenesis. Dev. Cell 6, 69–78.
Nasevicius, A., and Ekker, S. (2000). Effective targeted gene ‘knockdown’ in zebrafish. Nat.Genet. 26, 216–220.
Nathan, C., Carter, P., Liu, L., Li, B., Abreo, F., Tudor, A., Zimmer, S., and DeBenedetti, A. (1997). Elevated expression of eIF4E and FGF-2 isoforms during vascular-ization of breast carcinomas. Oncogene 15, 1087–1094.
Nicaise, V., German-Retana, S., Sanjuan, R., Dubrana, M.-P., Mazier, M.,Maisonneuve, B., Candresse, T., Caranta, C., and LeGall, O. (2003). The eukaryotictranslation initiation factor 4E controls lettuce susceptibility to the potyvirus lettucemosaic virus. Plant Physiol. 132, 1272–1282.
Niedzwiecka, A., Marcotrigiano, J., Stepinski, J., Jankowska-Anyszka, M., Wyslouch-Cieszynska, A., Dadlez, M., Gingras, A.-C., Mak, P., Darzynkiewicz, E.,Sonenberg, N., Burley, S. K., and Stolarski, R. (2002). Biophysical studies of eIF4Ecap-binding protein: Recognition of mRNA 50 cap structure and synthetic fragments ofeIF4G and 4E-BP1 proteins. J. Mol. Biol. 319, 615–635.
Polunovsky, V. A., Rosenwald, I. B., Tan, A. T., White, J., Chiang, L., Sonenberg, N., andBitterman, P. B. (1996). Translational control of programmed cell death: Eukaryotictranslation initiation factor 4E blocks apoptosis in growth-factor-restricted fibroblastswith physiologically expressed or deregulated Myc. Mol. Cell. Biol. 16, 6573–6581.
Ramaswamy, S., Ross, K., Lander, E., and Golub, T. (2003). A molecular signature ofmetastasis in primary solid tumors. Nat. Genet. 33, 49–54.
Raoult, D., Audic, S., Robert, C., Abergel, C., Renesto, P., Ogata, H., La Scola, B.,Suzan, M., and Claverie, J.-M. (2004). The 1.2-megabase genome sequence of mimi-virus. Science 306, 1344–1350.
Rhoads, R. E., Joshi-Barve, S., and Rinker-Schaeffer, C. (1993). Mechanism of action andregulation of protein synthesis initiation factor 4E: Effects on mRNA discrimination,cellular growth rate, and oncogenesis. Prog. Nucl. Acid Res. Mol. Biol. 46, 183–219.
Richter, J., and Sonenberg, N. (2005). Regulation of cap-dependent translation by eIF4Einhibitory proteins. Nature 433, 477–480.
Rinker-Schaeffer, C. W., Graff, J. R., De Benedetti, A., Zimmer, S. G., and Rhoads, R. E.(1993). Decreasing the level of translation initiation factor 4E with antisense RNA causesreversal of ras-mediated transformation and tumorigenesis of cloned rat embryo fibro-blasts. Int. J. Cancer 55, 841–847.
Robalino, J., Joshi, B., Fahrenkrug, S. C., and Jagus, R. (2004). Two zebrafish eIF4E familymembers are differentially expressed and functionally divergent. J. Biol. Chem. 279,10532–10541.
Characterization of eIF4E Family Members 297
Rodriguez, C., Freire, M., Camilleri, C., and Robaglia, C. (1998). The Arabidopsis thalianacDNAs coding for eIF4E and eIF(iso)4E are not functionally equivalent for yeastcomplementation and are differentially expressed during plant development. Plant J.13, 465–473.
Rom, E., Kim, H. C., Gingras, A.-C., Marcotrigiano, J., Favre, D., Olsen, H., Burley, S. K.,and Sonenberg, N. (1998). Cloning and characterization of 4EHP, a novel mammalianeIF4E-related cap-binding protein. J. Biol. Chem. 273, 13104–13109.
Rudolph, R., Bohm, G., Lilie, H., and Jaenicke, R. (1997). Folding proteins. In ‘‘ProteinFunction: A Practical Approach’’ (T. E. Creighton, ed.), pp. 57–100. Oxford UniversityPress, Oxford.
Ruffel, S., Dussault, M., Palloix, A., Moury, B., Bendahmane, A., Robaglia, C., andCaranta, C. (2002). A natural recessive resistance gene against potato virus Y in peppercorresponds to the eukaryotic initiation factor 4E (eIF4E). Plant J. 32, 1067–1075.
Ruffel, S., Gallois, J., Lesage, M., and Caranta, C. (2005). The recessive potyvirus resistancegene pot-1 is the tomato orthologue of the pepper pvr2-eIF4E gene. Mol. Genet.Genomics 274, 346–353.
Ruffel, S., Gallois, J.-L., Moury, B., Robaglia, C., Palloix, A., and Caranta, C. (2006).Simultaneous mutations in translation initiation factors eIF4E and eIF(iso)4E are requiredto prevent pepper veinal mottle virus infection of pepper. J. Gen. Virol. 87, 2089–2098.
Ruud, K. A., Kuhlow, C., Goss, D. J., and Browning, K. S. (1998). Identification andcharacterization of a novel cap-binding protein from Arabidopsis thaliana. J. Biol. Chem.273, 10325–10330.
Slepenkov, S. V., Darzynkiewicz, E., and Rhoads, R. E. (2006). Stopped-flow kineticanalysis of eIF4E and phosphorylated eIF4E binding to cap analogs and capped oligor-ibonucleotides: Evidence for a one-step binding mechanism. J. Biol. Chem. 281,14927–14938.
Stachelska, A., Wieczorek, Z., Ruszczynska, K., Stolarski, R., Pietrzak, M., Lamphear, B. J.,Rhoads, R. E., Darzynkiewicz, E., and Jankowska-Anyszka, M. (2002). Interaction ofthree Caenorhabditis elegans isoforms of translation initiation factor eIF4E with mono- andtrimethylated mRNA 50 cap analogues. Acta Biochim. Polon. 49, 671–682.
Strudwick, S., and Borden, K. L. (2002). The emerging roles of translation factor eIF4E inthe nucleus. Differentiation 70, 10–22.
Tomoo, K., Shen, X., Okabe, K., Nozoe, Y., Fukuhara, S., Morino, S., Sasaki, M.,Taniguchi, T., Miyagawa, H., Kitamura, K., Miura, K., and Ishida, T. (2003). Structuralfeature of human factor 4E, studied by X-ray crystal analysis and molecular dynamicssimulations. J. Mol. Biol. 328, 365–383.
Topisirovic, I., Culjkovic, B., Cohen, N., Perez, J. M., Skrabanek, L., and Borden, K. L. B.(2003). The proline-rich homeodomain protein, PRH, is a tissue-specific inhibitor ofeIF4E-dependent cyclin D1 mRNA transport and growth. EMBO J. 22, 689–703.
Trutschl, M., Dinkova, T. D., and Rhoads, R. E. (2005). Application of machine learningand visualization of heterogeneous datasets to uncover relationships between translationand developmental stage expression of C. elegans mRNAs. Physiol. Genom. 21, 264–273.
Vilela, C., Velasco, C., Ptushkina, M., and McCarthy, J. E. G. (2000). The eukaryoticmRNA decapping protein Dcp1 interacts physically and functionally with the eIF4Ftranslation initiation complex. EMBO J. 19, 4372–4382.
Yoffe, Y., Zuberek, J., Lewdorowicz, M., Zeira, Z., Keaser, C., Orr-Dahan, I., Jankowska-Anyszka, M., StepinskiI, J., Darzynkiewicz, E., and Shapira, M. (2004). Cap-bindingactivity of an eIF4E homolog from Leishmania. RNA 10, 1764–1775.
Zong, Q., Schummer, M., Hood, L., and Morris, D. R. (1999). Messenger RNA translationstate: The second dimension of high-throughput expression screening. Proc. Natl. Acad.Sci. USA 96, 10632–10636.

C H A P T E R F O U R T E E N
M
IS
*
ethods
SN 0
CenteDepa
Tethered Function Assays: AnAdaptable Approach to Study RNARegulatory Proteins
Jeff Coller* and Marv Wickens†
Contents
1. In
in
076
r fortme
troduction and Rationale
Enzymology, Volume 429 # 2007
-6879, DOI: 10.1016/S0076-6879(07)29014-7 All rig
r RNA Molecular Biology, Case Western Reserve University, Cleveland, Ohiont of Biochemistry, University of Wisconsin, Madison, Wisconsin
Else
hts
300
2. T
he Basic Design of the Tethered Function Assay 3022
.1. P osition of the tethering site 3023. T
he Tether 3033
.1. T he MS2 bacteriophage coat protein as a tether 3033
.2. N -peptide as a tether 3043
.3. U 1A protein and IRP as tethers 3043
.4. N -terminal or C-terminal fusions 3053
.5. T rans-effects 3054. T
he Reporter mRNA 3054
.1. T he number and location of tethered binding sites 3065. A
Priori Considerations About the Logic of the Assay 3075
.1. M ultiprotein complexes 3075
.2. T he role of RNA binding in function 3075
.3. A nalyzing function without knowing the target 3085
.4. A nalyzing the function of essential genes 3086. Im
portant Controls 3087. E
xamples of the Tethered Function Assay in the Literature 3127
.1. A nalyzing essential genes 3127
.2. S eparation of multiple functions that reside within thesame protein
3127
.3. D issecting complexes 3137
.4. M utagenesis of tethered proteins can also be useful inidentifying unique gain-of-function alleles
3147
.5. T ethering of proteins to different areas of the reporter canhave different effects
315vier Inc.
reserved.
299

300 Jeff Coller and Marv Wickens
7
.6. Id entifying mRNA localization functions and visualizing taggedmRNAs in vivo
3157
.7. T ethered function can be used to detect both stimulatory andinhibitory events
3177
.8. A nalyzing mRNA modifying enzymes 3178. P
rospects 318Ack
nowledgments 318Refe
rences 318Abstract
Proteins and protein complexes that regulate mRNA metabolism must possess
two activities. They bind the mRNA, and then elicit some function, that is,
regulate mRNA splicing, transport, localization, translation, or stability. These
two activities can often reside in different proteins in a complex, or in different
regions of a single polypeptide. Much can be learned about the function of the
protein or complex once it is stripped of the constraints imposed by RNA
binding. With this in mind, we developed a ‘‘tethered function’’ assay, in
which the mRNA regulatory protein is brought to the 30 UTR of an mRNA reporter
through a heterologous RNA–protein interaction. In this manner, the functional
activity of the protein can be studied independent of its intrinsic ability to
recognize and bind to RNA. This simple assay has proven useful in dissecting
numerous proteins involved in posttranscriptional regulation. We discuss the
basic assay, consider technical issues, and present case studies that exemplify
the strengths and limitations of the approach.
1. Introduction and Rationale
In studying proteins that regulate mRNAmetabolism, it often is usefulto experimentally separate function from mRNA binding. In manyinstances, the natural mRNA target for a given protein is unknown; anyassay of function must therefore be performed independent of the naturalRNA–protein interaction. In addition, because posttranscriptional regu-latory steps often are coupled, genetic analysis of functions in vivo can becomplicated by indirect effects. Lastly, mutations in many critical RNA-binding proteins have pleiotropic effects on the cell and make it impossibleto deduce which functions are direct. To circumvent these problems, wehave developed a useful technique that allows the function of a protein to beanalyzed, unconstrained by that protein’s natural ability to interact with itsmRNA target. We commonly refer to the technique as a ‘‘tethered functionassay.’’ The approach is adaptable and overcomes multiple complications inthe study of mRNA-binding proteins.
In tethered function assays, the polypeptide of interest is tethered to areporter mRNA through a heterologous RNA–protein interaction
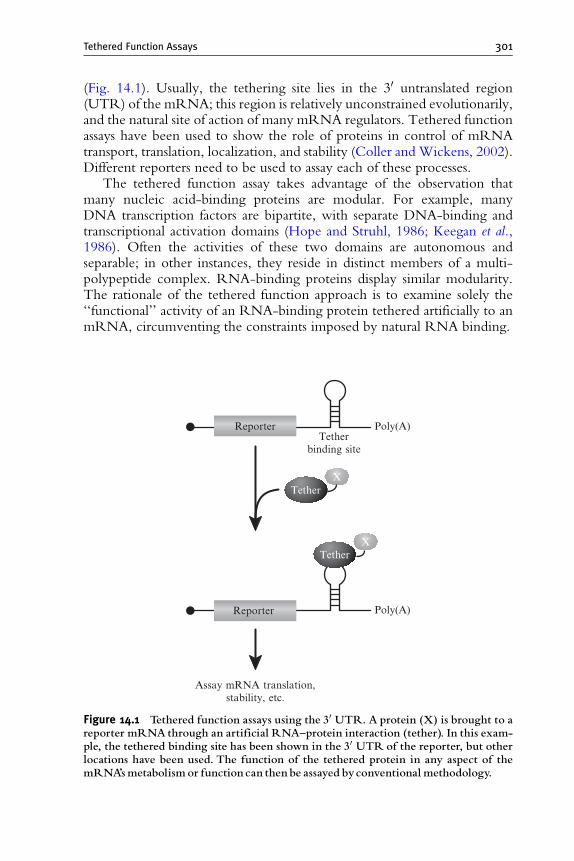
Tethered Function Assays 301
(Fig. 14.1). Usually, the tethering site lies in the 30 untranslated region(UTR) of the mRNA; this region is relatively unconstrained evolutionarily,and the natural site of action of many mRNA regulators. Tethered functionassays have been used to show the role of proteins in control of mRNAtransport, translation, localization, and stability (Coller and Wickens, 2002).Different reporters need to be used to assay each of these processes.
The tethered function assay takes advantage of the observation thatmany nucleic acid-binding proteins are modular. For example, manyDNA transcription factors are bipartite, with separate DNA-binding andtranscriptional activation domains (Hope and Struhl, 1986; Keegan et al.,1986). Often the activities of these two domains are autonomous andseparable; in other instances, they reside in distinct members of a multi-polypeptide complex. RNA-binding proteins display similar modularity.The rationale of the tethered function approach is to examine solely the‘‘functional’’ activity of an RNA-binding protein tethered artificially to anmRNA, circumventing the constraints imposed by natural RNA binding.
Poly(A)
Assay mRNA translation,stability, etc.
Reporter
Poly(A)
Tetherbinding site
X
Tether
Tether
X
Reporter
Figure 14.1 Tethered function assays using the 30 UTR. A protein (X) is brought to areporter mRNAthrough an artificial RNA^protein interaction (tether). In this exam-ple, the tethered binding site has been shown in the 30 UTR of the reporter, but otherlocations have been used. The function of the tethered protein in any aspect of themRNA’smetabolismor function can then be assayed byconventional methodology.

302 Jeff Coller and Marv Wickens
In some cases, RNA binding and function may not be readily separable.For example, in nucleases and helicases, the nucleic acid-binding site is alsothe active site of the protein. Moreover, the interaction of a protein with itsnatural RNA-binding site can regulate the protein’s activity; in theseinstances, it may be impossible to assay the function of the tethered proteinin the absence of its cognate site.
2. The Basic Design of the TetheredFunction Assay
The design of the tethered function assay is relatively straightforward.To determine the effects of a protein X on mRNA metabolism, a chimericprotein is expressed in vivo in which protein X is continuous with a tetheringpolypeptide (see Fig. 14.1). The tethering protein is an RNA-bindingprotein that recognizes an RNA tag sequence with high specificity andaffinity. The effect of the fusion protein on mRNA metabolism is deter-mined by coexpressing the chimera with anmRNA reporter (such as lacZ orluciferase) into which a tag RNA sequence has been embedded. The fusionprotein’s effects on mRNA metabolism are assayed by conventional means[i.e., Western blot, Northern blot, reverse transcriptase polymerase chainreaction (RT-PCR), etc.]. While the assay is relatively straightforward,several issues discussed in the following sections should be considered atthe outset in designing a tethering experiment.
The assay, though powerful, is artificial. Only positive results are mean-ingful: lack of effects cannot be interpreted. Some RNA-binding proteinsmay require other proteins or their cognate RNA-binding sites to function,or be inactive as chimeras, or require appropriate positioning on themRNA.
2.1. Position of the tethering site
A first consideration when designing a tethered function assay is the positionin the mRNA of the tag sequence (i.e., the tethering site). While differentlaboratories have used tethered function assays and placed tag sequenceswithin all regions of the mRNA, the most useful and common site is the 30UTR (Coller andWickens, 2002). The tethering of proteins to the 30 UTRhas particular biological and experimental advantages. Importantly, manysites that regulate diverse steps in an mRNA’s life, including its transport,cytoplasmic localization, stability, and translational activity, often reside inthe 30 UTR. Thus, tethering to that region places regulators where theymight well function. In addition, it is known that the exact location ofseveral 30 UTR regulators is not critical for their function, implying that
Tethered Function Assays 303
precise spatial positioning is not critical. Lastly, the 30 UTR has fewerconstraints than either the 50 UTR (which can affect translational initiationfrequency) or the open reading frame. The intercistronic region of bicis-tronic mRNAs also is relatively unconstrained and has been used fortethered function experiments using the same rationale (De Gregorioet al., 1999, 2001; Furuyama and Bruzik, 2002; Shen and Green, 2006;Spellman et al., 2005; Wang et al., 2006).
3. The Tether
In choosing which protein to use as the tether, it is necessary toconsider affinity and specificity for the RNA tag, subcellular localization,and impact of the tether on the activity of the test protein. The mostcommon tether is the bacteriophage MS2 coat protein (Beach et al., 1999;Bertrand et al., 1998; Coller et al., 1998; Collier et al., 2005; Dickson et al.,2001; Dugre-Brisson et al., 2005; Gray et al., 2000; Kim et al., 2005; Longet al., 2000; Lykke-Andersen et al., 2000, 2001; Minshall and Standart,2004; Minshall et al., 2001; Ruiz-Echevarria and Peltz, 2000). However,the iron response element binding protein (IRP), a derivative of bacterio-phage l N-protein (De Gregorio et al., 1999, 2001), and the spliceosomalU1A protein have been used successfully (Brodsky and Silver 2000; Finouxand Seraphin, 2006). In the following sections we will discuss each of thesespecific tethers and their merits and drawbacks.
3.1. The MS2 bacteriophage coat protein as a tether
The MS2 coat protein has been a popular choice for several reasons. First,this protein is relatively small (14 kDa), thus minimizing potential disrup-tions to the test protein. Second, the biochemistry of theMS2 coat’s bindingto its target sequence has been well established. Specifically, the MS2 coat isknown to bind with high specificity and selectivity to a 21-nucleotide RNAstem–loop (Kd ¼ 1 nM; Carey and Uhlenbeck, 1983). In addition, muta-tions in the binding site are available that increase or decrease affinity. Inparticular, the substitution of a single U within the stem–loop to a Cincreases affinity 50-fold over wild type (Lowary and Uhlenbeck, 1987).Moreover, use ofMS2 allows a high dosage of tethered proteins to be presenton the mRNA: the MS2 coat interacts with its target sequence as a dimer;thus for every stem–loop present in the mRNA reporter, two tetheredproteins are present. Lastly, MS2 binds cooperatively to two stem–loops,further increasing the occupancy of sites (Witherell et al., 1990). In someapplications, the more protein that is bound, the better; each of these factorscontribute to a strong signal in the functional assay.
304 Jeff Coller and Marv Wickens
On the other hand, theMS2 coat protein is not the simplest optionwhen itis necessary to carefully control the number of tethered protein moleculesbound. Since the MS2 coat protein binds as a dimer to a single site, andinteracts with adjacent sites cooperatively, a large (and not trivial to determine)number of protein molecules may be bound to the targeted mRNA.
3.2. N-peptide as a tether
The bacteriophage l N protein is often used in the tethered function assay(Baron-Benhamou et al., 2004). N-protein regulates bacterial transcrip-tional antitermination by binding to a 19-nucleotide RNA hairpin withinearly phage operons called boxB (Scharpf et al., 2000). Importantly, theN-peptide/boxB interaction occurs with high affinity (Kd ¼ 1.3 nM). Theparticular advantage of the N-peptide in tethering assays is the result of itsextremely small size; only 22 amino acids are required for the high affinityinteraction with boxB RNA. Because of this, many laboratories have optedto use the N-peptide rather than MS2 coat protein, reasoning that itminimizes potential interference with the fusion protein’s function(Baron-Benhamou et al., 2004). Another desirable feature of N-peptide isthat unlike the MS2 coat, the protein binds 1:1 to its RNA target.
3.3. U1A protein and IRP as tethers
Both the U1A protein and IRP have been used successfully as tethers (DeGregorio et al., 1999; Finoux and Seraphin, 2006). U1A is a U1 smallnuclear ribonucleoprotein (snRNP)-specific protein that binds with highspecificity and affinity to a 30-nt RNA hairpin (Kd ¼ 5 nM; van Gelderet al., 1993). IRP also binds to a 30-nt RNA hairpin that normally resideswithin the UTRs of target mRNAs with high affinities (Kd ¼ 90 pM;Barton et al., 1990). Like N-peptide, the concentration of both U1A andIRP on the reporter mRNA is theoretically 1:1 (protein:RNA tag). UnlikeN-peptide, however, both of these proteins are relatively large: 38 kDa forU1A and 97 kDa for IRP. As a result, they have not commonly been usedin tethered function assays.
In general, the MS2 coat provides the highest concentration of tetheredproteins to be bound to the reporter per binding site. This may allowphenotypes to be observed without greatly increasing the overall length ofthe mRNA reporter, an undesired situation in some applications. N-peptide,on the other hand, allows the delivery of a single tethered protein per bindingsite. The cost of this control of stoichiometry can be a need to introducemultiple tandem binding sites (more than four) in order to observe a robustphenotype (see below); the trade-off is an increase in reporter length. None-theless, the relative merits of MS2 coat protein, N-peptide, U1A, or IRP aresituation specific. All have been successfully used tomeasure effects onmRNA
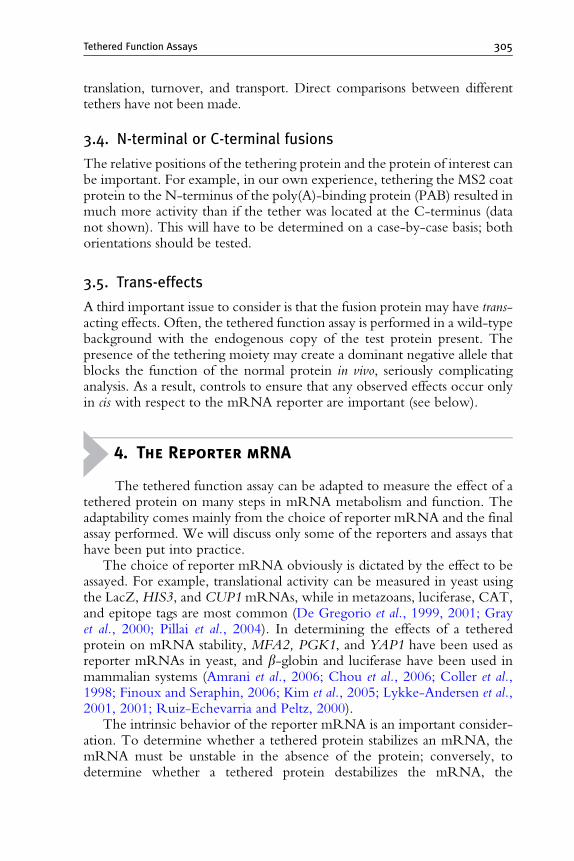
Tethered Function Assays 305
translation, turnover, and transport. Direct comparisons between differenttethers have not been made.
3.4. N-terminal or C-terminal fusions
The relative positions of the tethering protein and the protein of interest canbe important. For example, in our own experience, tethering the MS2 coatprotein to the N-terminus of the poly(A)-binding protein (PAB) resulted inmuch more activity than if the tether was located at the C-terminus (datanot shown). This will have to be determined on a case-by-case basis; bothorientations should be tested.
3.5. Trans-effects
A third important issue to consider is that the fusion protein may have trans-acting effects. Often, the tethered function assay is performed in a wild-typebackground with the endogenous copy of the test protein present. Thepresence of the tethering moiety may create a dominant negative allele thatblocks the function of the normal protein in vivo, seriously complicatinganalysis. As a result, controls to ensure that any observed effects occur onlyin cis with respect to the mRNA reporter are important (see below).
4. The Reporter mRNA
The tethered function assay can be adapted to measure the effect of atethered protein on many steps in mRNA metabolism and function. Theadaptability comes mainly from the choice of reporter mRNA and the finalassay performed. We will discuss only some of the reporters and assays thathave been put into practice.
The choice of reporter mRNA obviously is dictated by the effect to beassayed. For example, translational activity can be measured in yeast usingthe LacZ, HIS3, and CUP1 mRNAs, while in metazoans, luciferase, CAT,and epitope tags are most common (De Gregorio et al., 1999, 2001; Grayet al., 2000; Pillai et al., 2004). In determining the effects of a tetheredprotein on mRNA stability, MFA2, PGK1, and YAP1 have been used asreporter mRNAs in yeast, and b-globin and luciferase have been used inmammalian systems (Amrani et al., 2006; Chou et al., 2006; Coller et al.,1998; Finoux and Seraphin, 2006; Kim et al., 2005; Lykke-Andersen et al.,2001, 2001; Ruiz-Echevarria and Peltz, 2000).
The intrinsic behavior of the reporter mRNA is an important consider-ation. To determine whether a tethered protein stabilizes an mRNA, themRNA must be unstable in the absence of the protein; conversely, todetermine whether a tethered protein destabilizes the mRNA, the

00 1 2 3 5
25
50
75
100
Per
cent
tra
nsla
tion
Number of binding elements
Poly(A)
NAgo2
( )1–5 boxBelements
Ago2/N fusionAgo2 alone
A
B
Reporter
Figure 14.2 The number of tethered binding sites can influence phenotypic read-out.(A) Shown is the effect of increasing the number of tethered binding sites on transla-tional repression mediated by tethered Ago2 (Pillai et al. 2004). Specifically, 0,1, 2, 3, or 5boxB elements were introduced into the 30 UTRof a reporter gene expressing Renillaluciferase (RL). (B) The reporters were transfected into HeLa cells expressing eitherAgo2 (black bars) or anN-peptideAgo2 fusion (gray bars) and translation measured byenzymatic assay. As shown, increasing the numberof tethered binding sites dramaticallyinfluences the repression observed.
306 Jeff Coller and Marv Wickens
mRNA reporter must be stable without the protein. The same reasoningapplies to effects on other aspects of mRNA metabolism such as translationand subcellular localization.
4.1. The number and location of tethered binding sites
The number and location of tether binding sites are important variables.First, it should be decided where the tethered sites should be positioned,i.e., the 50 UTR, 30 UTR, or coding region. This depends on the suspectedrole of the protein in mRNA metabolism. For example, a protein thoughtto regulate polyadenylation might logically be placed in the 30 UTR. It isimportant that the placement of the tethered binding sites not interfere on

Tethered Function Assays 307
its own with the mRNA. For example, in testing the role of tethered PABon mRNA stability, sites were placed in a region of theMFA2 30 UTR thatwas known not to affect the mRNA’s half-life (Coller et al., 1998; Muhlradand Parker, 1992). Placement elsewhere would have dramatically alteredthe normal turnover rate of this message. It is helpful, therefore, to select as areporter an mRNA whose cis-acting sequences are well characterized.Obviously these issues make it important that the behavior of the reportermRNA with and without tethering sites be compared in the absence of thechimeric protein (see below, and Fig. 14.2).
A second issue in designing a reporter concerns the number of tetheredbinding sites. In many cases using the MS2 bacteriophage coat as the tether,two stem–loops have been sufficient to observe an effect (Coller et al., 1998;Gray et al., 2000; Minshall et al., 2001; Ruiz-Echevarria and Peltz, 2000).However, many more sites have been used, ranging from 6 to 24 (Bertrandet al., 1998; Fusco et al., 2003; Lykke-Andersen et al., 2000, 2001; Pillaiet al., 2004). The effect of the number of binding sites has been evaluatedsystematically in two reports (Lykke-Andersen et al., 2000; Pillai et al.,2004). Increasing the number of binding sites can increase the signal andenhance the assay’s sensitivity. In Fig. 14.2, the extent of translationalrepression achieved by a tethered protein is proportional to the number ofbinding sites (Pillai et al., 2004).
5. A Priori Considerations About the Logic ofthe Assay
5.1. Multiprotein complexes
mRNA regulatory events often occur through multiprotein complexesformed via protein–protein and protein–RNA interactions. In such cases,RNA binding may occur via one critical protein, which tethers the activityof another protein to the mRNA. Thus, the ‘‘active’’ protein may notdirectly contact the RNA. One strength of the tethered approach is itsability to assay the ‘‘activity’’ independent of RNA binding.
5.2. The role of RNA binding in function
The interaction between RNA and protein in some cases is essential foractivity. RNA–protein interactions can change the conformation of theRNA, the protein, or both; not surprisingly, some complexes are biologi-cally active, while the free RNAs or proteins are not (Williamson, 2000).Certain RNA ligands likely can influence activation or repression activity,much as in DNA-induced allosteric effects on transcription factors (Lefstinand Yamamoto, 1998; Scully et al., 2000). In addition, the context of the
308 Jeff Coller and Marv Wickens
natural binding site may be important for the protein’s activity becauseessential factors are bound in the neighborhood.
These considerations have two implications. First, negative results in atethered function assay are meaningless, even if the RNA and protein dointeract on the reporter. Second, the outcome seen—for example, mRNAstabilization by a particular tethered protein—may differ when the protein isassociated with its natural RNA-binding site. The same issues apply toDNA-binding transcription factor complexes, which have been powerfullydissected via comparable tethering approaches.
5.3. Analyzing function without knowing the target
In many cases, putative RNA-binding proteins have been identified, buttheir respective RNA target is unknown. One asset of the tetheringapproach is that a protein’s activity can be determined without knowingthe natural RNA target.
5.4. Analyzing the function of essential genes
In some cases, the RNA-binding protein under investigation is essential forcell viability; as a result, traditional genetic techniques are complicated bypleiotropic effects. The tethered function assay allows the function of theprotein to be examined on just one mRNA species in an otherwisewild-type cell.
6. Important Controls
Several controls are critical in tethered function assays, and shouldalways be performed (Fig. 14.3). It is necessary to ensure that (1) the tetheredbinding site does not affect the mRNA on its own, (2) the tethering proteinalone (e.g., MS2 coat protein) does not have an impact, and (3) any observedeffects should occur only in cis (that is, when the protein is bound to themRNA). To control for possible trans-acting effects, the chimeric proteinshould be expressed alongside a reporter that lacks binding sites. This set ofcontrols can ensure that an observed effect is specific to the protein ofinterest, and occurs only when it is associated with the mRNA in cis (seeFig. 14.3).
This concludes the general discussion of the design of a basic tetheredfunction assay. In the following section we discuss a few specific exampleswith the aforementioned general principles considered. These case studiesare not meant to be comprehensive of the literature but rather provide asample of the uses of the tethered function assay to address certain biologicalissues. An overview is provided in Table 14.1.
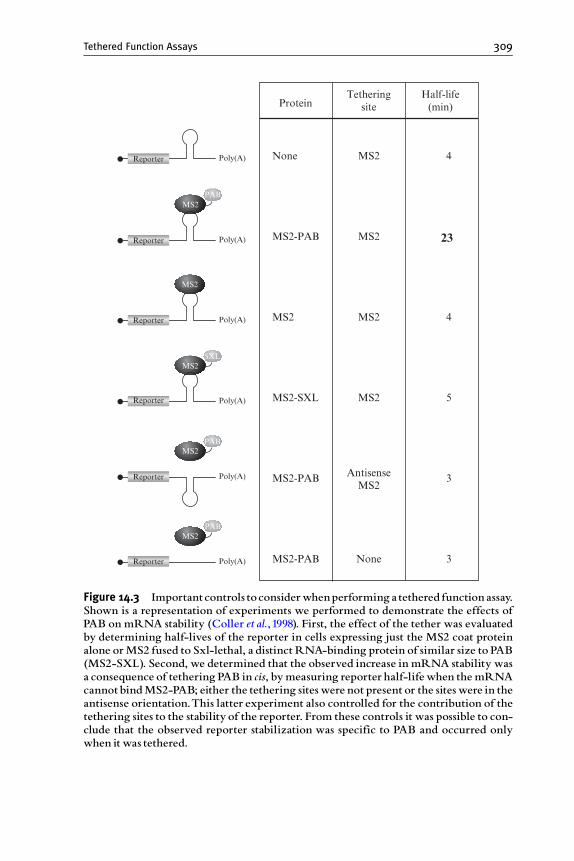
ProteinTethering
siteHalf-life(min)
None
MS2-PAB
MS2
MS2-SXL
AntisenseMS2
MS2-PAB
MS2-PAB
MS2
MS2
MS2
MS2
None
4
23
4
5
3
3
Poly(A)
MS2PAB
Poly(A)
MS2PAB
Poly(A)
MS2PAB
Poly(A)
MS2SXL
Poly(A)
MS2
Poly(A)Reporter
Reporter
Reporter
Reporter
Reporter
Reporter
Figure 14.3 Importantcontrols toconsiderwhenperforming atethered function assay.Shown is a representation of experiments we performed to demonstrate the effects ofPAB on mRNA stability (Coller et al.,1998). First, the effect of the tether was evaluatedby determining half-lives of the reporter in cells expressing just the MS2 coat proteinalone orMS2 fused to Sxl-lethal, a distinct RNA-binding protein of similar size to PAB(MS2-SXL). Second, we determined that the observed increase in mRNA stability wasa consequence of tethering PAB in cis, bymeasuring reporter half-lifewhen the mRNAcannotbindMS2-PAB; either the tethering siteswere not present or the siteswere in theantisense orientation.This latter experiment also controlled for the contribution of thetethering sites to the stability of the reporter. From these controls it was possible to con-clude that the observed reporter stabilization was specific to PAB and occurred onlywhen it was tethered.
Tethered Function Assays 309

Table 14.1 Uses and adaptations of tethered function assays
Key issue Protein Organism Tether Reporter Effects Reference
Analysis of essential
genes
Pab1p Yeast MS2 MFA2,
PGK1
Tethered Pab1p stabilizes
mRNA, functions
independent of poly(A)
Coller et al.,1998
Separation of multiple
functions
PAB1, Pab1p Xenopus, yeast MS2 Luciferase,
CUP1
Distinct regions of tethered
PAB1 stimulate translation
and stabilize mRNA in vivo
Gray et al., 2000
Xp54 Xenopus MS2 Luciferase Tethered Xp54 represses or
stimulates translation of poly
(A) minus reporters
Minshall et al., 2001
SF2/ASF Xenopus, HeLa
cells
MS2 Luciferase Tethering SR proteins
demonstrates they have a
novel role in translation
Sanford et al., 2004
Dissection of complex Ago2, Ago4 HeLa cells N-peptide Luciferase Tethered Ago proteins repress
translation, suggests that
miRNA functions to guide
Ago proteins to message
Pillai et al., 2004
hUPF1, hUPF2,
hUPF3,
hUPF3b
Mammalian cells MS2 b-Globin Tethered UPFs transform a
normal message into a
message subject to NMD
Lykke-Andersen et al., 2000
RNP, S1, Y14,
DEK,
REF2,
SRm160
Mammalian cells MS2 b-Globin Tethered RNP S1 stimulates
NMD on a normal mRNA
Lykke-Andersen et al., 2001
310
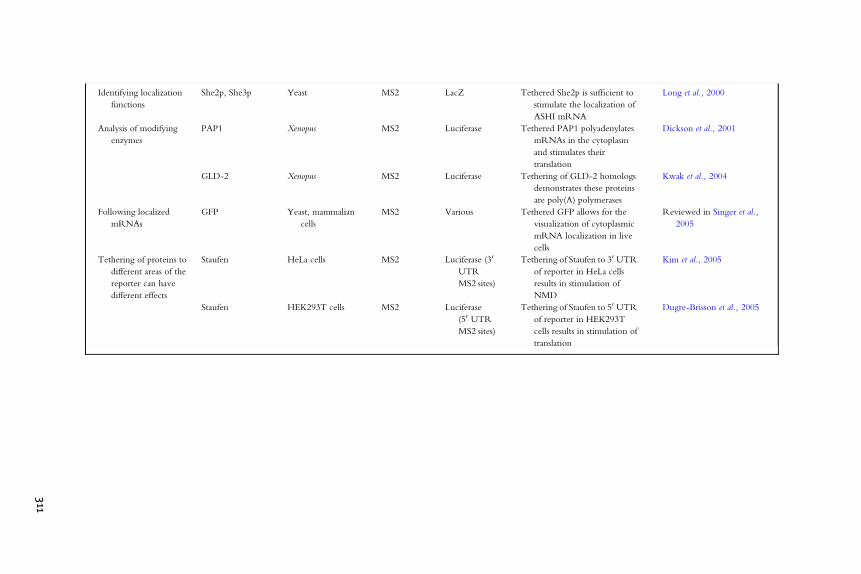
Identifying localization
functions
She2p, She3p Yeast MS2 LacZ Tethered She2p is sufficient to
stimulate the localization of
ASHI mRNA
Long et al., 2000
Analysis of modifying
enzymes
PAP1 Xenopus MS2 Luciferase Tethered PAP1 polyadenylates
mRNAs in the cytoplasm
and stimulates their
translation
Dickson et al., 2001
GLD-2 Xenopus MS2 Luciferase Tethering of GLD-2 homologs
demonstrates these proteins
are poly(A) polymerases
Kwak et al., 2004
Following localized
mRNAs
GFP Yeast, mammalian
cells
MS2 Various Tethered GFP allows for the
visualization of cytoplasmic
mRNA localization in live
cells
Reviewed in Singer et al.,
2005
Tethering of proteins to
different areas of the
reporter can have
different effects
Staufen HeLa cells MS2 Luciferase (30
UTR
MS2 sites)
Tethering of Staufen to 30 UTR
of reporter in HeLa cells
results in stimulation of
NMD
Kim et al., 2005
Staufen HEK293T cells MS2 Luciferase
(50 UTR
MS2 sites)
Tethering of Staufen to 50 UTR
of reporter in HEK293T
cells results in stimulation of
translation
Dugre-Brisson et al., 2005
311
312 Jeff Coller and Marv Wickens
7. Examples of the Tethered Function Assay inthe Literature
7.1. Analyzing essential genes
Tethered function assays allow the presence of essential RNA-bindingproteins to be modulated on a target mRNAwithout affecting cell viability.For example, in Saccharomyces cerevisiae, PAB is an essential gene involved inmany different aspects of mRNA metabolism. Studies of PAB1 functionusing conditional alleles or genetic suppressors have shown that this proteinis required for efficient mRNA translation, coupled deadenylation anddecay, and polyadenylation. Detailed analysis of these functions in vivo iscomplicated by the breadth of PAB’s roles and the fact that it is essential.Tethered function assays were used to circumvent these pleiotropic effects.Using this approach, PAB was shown to stabilize an mRNA to which it wastethered (Coller et al., 1998). The activities of mutant forms of PAB (astethered proteins) have been determined, and the active regions identified,even though yeast carrying the equivalent mutants would not be viable(Coller et al., 1998; Gray et al., 2000).
Tethered function assays have also facilitated analysis of essential transla-tion initiation factors. For example, eukaryotic initiation factor (eIF)4G, acritical member of the cap-binding complex, is thought to recruit the 40Sribosome to the mRNA by simultaneously binding both cap-bindingfactors (eIF4E) and a 40S ribosome-associated complex (eIF3). A wealthof biochemical data has illuminated the contribution of eIF4G to translationin vitro. De Gregorio et al. (1999) used a tethered function approach toreveal mechanisms of eIF4G action in vivo. They first determined thateIF4G tethered to the intergenic region of a bicistronic reporter mRNAwas sufficient to drive mRNA translation independent of the cap. Thisenabled identification of a conserved core domain of eIF4G that is requiredfor translational stimulation (De Gregorio et al., 1999). Similar studies withtranslational initiation factor eIF4E demonstrated that it stimulates transla-tion independent of its ability to bind the cap (De Gregorio et al., 2001).This latter study pioneered the use of N-peptide as a tethering device(Baron-Benhamou et al., 2004).
7.2. Separation of multiple functions that reside within thesame protein
Many posttranscriptional events are coupled. For example, splicing and 30polyadenylation influence one another and these events influence transport,degradation, and translation of the mRNA. In several cases, proteinsinvolved in an upstream event can also have a dramatic role in a downstream

Tethered Function Assays 313
event. This complicates the use of conventional mutational analysis inpinpointing the protein’s direct effects. In such cases, tethered functionassays can help determine which of many affected steps are due directly tothe activity of the protein.
In one example of this approach, SR proteins were shown to directlyaffect both splicing and translation (Sanford et al., 2004). SR proteins are alarge family of nuclear phosphoproteins required for constitutive and alter-native splicing. A subset of SR proteins is known to shuttle between thenucleus and cytoplasm, suggesting that these proteins play important cyto-plasmic roles in mRNA metabolism. Since many alterations in SR proteinsin vivo impact splicing, it was difficult to determine whether any observedeffects on translation were a direct effect of the SR defect or an indirectconsequence of the splicing defect. To overcome this limitation, Sanfordet al. (2004) used a tethered function assay in which they injected reportermRNA bearing the MS2-RNA binding element with an MS2-SF2/ASF(an SR protein) protein fusion into the cytoplasm of Xenopus oocytes. Thedata demonstrated that tethered SF2/ASF stimulated translation by approx-imately 6-fold over the appropriate controls. This was also shown to be ageneral property of SF2/ASF by demonstrating that similar phenotypeswere observed in HeLa cell-free translation extracts.
These findings resulted in the conclusion that SR proteins can promotemRNA translation after they are deposited on the mRNA via splicing.From the standpoint of this review, the important point is that the tetheredfunction assay allowed the elucidation of a role for SR proteins in mRNAtranslation by removing the complication of the upstream event, i.e.,splicing.
7.3. Dissecting complexes
Tethered function assays can be particularly useful when genetics is complexor unsuited to the problem. Many regulatory events are controlled bymultiprotein complexes. Discrete components of the complex provideRNA binding and recognition, which in turn recruit the functional activityto the site of regulation.
7.3.1. Protein complexes: NMDAnalysis of non-sense-mediated decay (NMD) is exemplary. MammalianmRNAs are targeted for rapid turnover when they contain a stop codonthat is greater than 50 nucleotides upstream of the last exon–exon boundary, aprocess termed NMD. A group of proteins binds to the exon–exon (E/E)junction of mammalian mRNA subject to NMD (Le Hir et al., 2000a,b;Singh and Lykke-Andersen, 2003). Although this complex is primarily foundon NMD substrates, it was unclear if their presence was a cause or effectof the transcript being targeted for NMD. Lykke-Andersen et al. (2001)

314 Jeff Coller and Marv Wickens
used a tethered function approach to test whether the placement of any ofthese proteins on a normal mRNA would elicit an NMD response. Whilethe E/E complex consists of at least five proteins, only tethered RNP S1elicited NMD. In this case, the tethered function approach revealed a roleof a specific protein in eliciting the function of a multiprotein complex (E/E complex), and showed it was a cause, rather than an effect, of the NMDprocess.
7.3.2. RNA–protein complexes: miRNAsThe tethered function assay has helped identify key components in theRNA protein complex associated with miRNA-mediated gene silencing.Ten years ago, a small, noncoding RNA of approximately 21 nucleotides,lin-4, was shown to bind the 30 UTR of lin-14 mRNA in the nematodeCaenorhabditis elegans, and to silence its translation (Pasquinelli et al., 2005).Since that initial discovery, miRNAs have emerged as ubiquitous regulatorsof mRNA translation and stability.
Numerous factors are required for miRNAmaturation and for the assem-bly of the miRNA into a ribonucleoprotein (RNP) complex that repressestranslation of the target mRNA. The RNA interference silencing complex(RISC) has been shown to be necessary for cessation of mRNA translation byan miRNA (Filipowicz, 2005; Sontheimer, 2005). Tethered function assaysmade it possible to dissect the repression function of RISC from the miRNA:specific components of RISC, namely Ago1–2, are sufficient to translationallyrepress reporter mRNAs to which they are artificially bound (Behm-Ansmantet al., 2006; Pillai et al., 2004; Rehwinkel et al., 2005).
7.4. Mutagenesis of tethered proteins can also be useful inidentifying unique gain-of-function alleles
Because the effects of a tethered protein are examined on a single reportermRNA, the effects of many manipulations of the protein sequence can beexamined readily and conclusively. This can reveal novel molecular propertiesin the protein.
This general approach has been applied to the Dhh1p/RCK1/p54family of RNA helicases (Minshall and Standart, 2004; Minshall et al.,2001). The Xenopus homolog, Xp54, is sufficient to repress the translationof an mRNA to whose 30 UTR it is tethered. Interestingly, mutants withinthe putative DEAD box motif of this protein transform this helicase from atranslational repressor into a translational stimulator. These results mayindicate that Xp54 may serve two roles in mRNA metabolism that aredependent on modulation of its conformation or helicase activity.
Tethered Function Assays 315
7.5. Tethering of proteins to different areas of the reportercan have different effects
It should be noted that the tethered function assay measures the effect of anmRNP complex in its nonnative context and thus may induce emergentproperties of the protein. Moreover, the protein of interest may havedistinct functions when positioned differently on the mRNA reporter.Indeed, it has been documented that similar proteins when tethered todifferent areas of an mRNA can have distinct outcomes.
For example, the conserved mRNA-binding protein Staufen is impor-tant during early embryonic development in Drosophila and has been iden-tified as an important regulator of mammalian mRNA processes. Tetheringof mammalian Staufen to the 50 UTR of reporter mRNAs stimulatestranslation without impacting mRNA stability in HEK293T cells and rabbitreticulocyte lysates (Dugre-Brisson et al., 2005). Interestingly, tetheringmammalian Staufen to the 30 UTR in HeLa cells does not stimulatetranslation, but instead destabilizes the mRNA (Kim et al., 2005). Thesetwo reports are from distinct cells types, and so require further analysis.However, it may be that Staufen possesses different activities, dependent onits location in the mRNA. This property would echo that of IRP; bound tothe 50 UTR of ferritin mRNA, it inhibits translation; bound to the 30 UTRof transferrin mRNA, it inhibits mRNA decay (Hentze et al., 2004). It mayturn out to be important to compare the effects of proteins tethered todifferent locales to reveal region-specific differences.
7.6. Identifying mRNA localization functions and visualizingtagged mRNAs in vivo
Proteins that cause an mRNA to move to a particular location within a cellcan be assayed using the tethered function approach. For example, yeastShe2p and She3p are present in a complex on theASH1 30 UTR. Tetheringeither She2p or She3p to the 30 UTR of a reporter gene was sufficientto stimulate that mRNA’s localization to the bud tip (Long et al., 2000).These findings directly demonstrate a localization function, and shouldenable its genetic dissection away from formation of the complex or bindingto RNA.
Several adaptations of the tethered function assay have been developedto tag an mRNA for further analysis, rather than study a particular protein’seffects. Although these are not strictly tethered function assays (as theprotein is merely a tag), we mention them here because they are so closelyrelated technically. They now are widely used, and have been reviewed intheir own right (Beach et al., 1999; Singer et al., 2005); we discuss only asingle, early pioneering example.
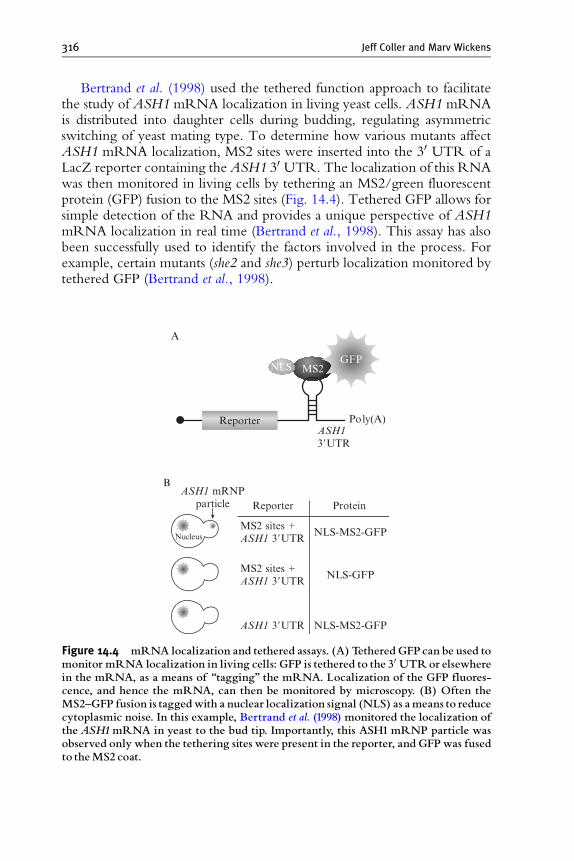
316 Jeff Coller and Marv Wickens
Bertrand et al. (1998) used the tethered function approach to facilitatethe study of ASH1 mRNA localization in living yeast cells. ASH1 mRNAis distributed into daughter cells during budding, regulating asymmetricswitching of yeast mating type. To determine how various mutants affectASH1 mRNA localization, MS2 sites were inserted into the 30 UTR of aLacZ reporter containing the ASH1 30 UTR. The localization of this RNAwas then monitored in living cells by tethering an MS2/green fluorescentprotein (GFP) fusion to the MS2 sites (Fig. 14.4). Tethered GFP allows forsimple detection of the RNA and provides a unique perspective of ASH1mRNA localization in real time (Bertrand et al., 1998). This assay has alsobeen successfully used to identify the factors involved in the process. Forexample, certain mutants (she2 and she3) perturb localization monitored bytethered GFP (Bertrand et al., 1998).
ASH13UTR
MS2 sites +ASH1 3UTR
Reporter Protein
NLS-MS2-GFP
MS2 sites +ASH1 3UTR
NLS-GFP
ASH1 3UTR NLS-MS2-GFP
Nucleus
ASH1 mRNPparticle
A
B
Poly(A)
MS2
Reporter
GFPNLS
Figure 14.4 mRNA localization and tethered assays. (A) Tethered GFP can be used tomonitor mRNA localization in living cells: GFP is tethered to the 30 UTRor elsewherein the mRNA, as a means of ‘‘tagging’’ the mRNA. Localization of the GFP fluores-cence, and hence the mRNA, can then be monitored by microscopy. (B) Often theMS2^GFP fusion is taggedwith a nuclear localization signal (NLS) as ameans to reducecytoplasmic noise. In this example, Bertrand et al. (1998) monitored the localization oftheASH1mRNA in yeast to the bud tip. Importantly, this ASH1 mRNP particle wasobserved only when the tethering sites were present in the reporter, and GFP was fusedto theMS2 coat.
Tethered Function Assays 317
7.7. Tethered function can be used to detect both stimulatoryand inhibitory events
As mentioned, the tethered function assay is highly adaptable. Tetheredfunction assays have been used to monitor stimulatory and inhibitory effectsof mRNA metabolism factors. For instance, in Xenopus it was demonstratedthat tethered DAZL stimulates translation (Collier et al., 2005), while usingthe same reporters others have shown that tethered Xp54 inhibits mRNAtranslation in Xenopus (Minshall and Standart, 2004; Minshall et al., 2001).Similar results have been seen for assaying effects on mRNA stability.Certain classes of AU-rich binding proteins will stabilize mRNA whentethered, while others destabilize the mRNA ( Barreau et al., 2006; Chouet al., 2006). Thus, tethered function assays provide flexibility in allowing arange of phenotypes to be observed.
7.8. Analyzing m R NA modifying enzymes
Tethered function assays have been used to identify enzymes involved inmRNA processing. Sequences near the 30 end of an mRNA recruit acomplex of proteins that promotes 30 end cleavage and polyadenylation.By tethering the relevant poly(A) polymerase directly to the 30 end of thereporter, that enzyme was shown to be sufficient for the elongation of poly(A) tails in oocytes and to stimulate translation as a result ( Dickson et al.,2001). Sites for interaction with other components of the complex aredispensable (Dickson et al., 2001). The same general approach has beenused to identify other divergent poly(A) adding enzymes, termed theGLD-2 family, from C. elegans, flies, frogs, mice, and humans (Kwaket al., 2004; J. E. Kwak et al ., unpublished observations; Wang et al., 2002).
A strength of the tethered approach is that many candidate open readingframes (ORFs) can be tested rapidly. A limitation is that false negatives arise.For example, two Saccharomyces cerevisiae proteins, Trf4p and Trf5p, that areknown to be poly(A) polymerases, differ dramatically as tethered proteins.Trf5p is active, and Trf4p is not ( J. E. Kwak et al., unpublished observations).This may reflect a difference in their substrate specificity, requirements forRNA or protein partners, or be an artifactual consequence of an inactiveconformation in one chimeric protein.
Tethering assays can reveal unanticipated biochemical activities. In thesame group of tethering experiments that identified the GLD-2 family,certain relatives of these PAPs turn out not to add poly(A) at all, but to addpoly(U) instead ( J. E. Kwak et al., unpublished observations). Investigationsinto the biological role of these newly discovered poly(U) polymerases arecurrently underway. The key point here is that tethered assays enabled facilebiochemical identification of the RNA modifications they catalyze.

318 Jeff Coller and Marv Wickens
8. Prospects
Tethered function assays provide a simple means to address the role ofspecific RNA-binding proteins on mRNAmetabolism and function. Theiruse is certainly not limited to the few examples mentioned here and inTable 14.1. The tethered function approach provides a unique platform forthe study of suspect regulators of mRNA metabolism that have unknowntarget specificity and/or functional activity. Of particular interest are simplephenotypic screens that allow the rapid identification of tethered proteinson the metabolism of a given reporter.
As the genome sequences of more species become available, methods toanalyze function beyond familial sequence resemblance are needed. Tetheredfunction assays may provide a rapid screen to sort proteins into functionalfamilies.
ACKNOWLEDGMENTS
We thank many individuals who have contributed their thoughts and ideas to this review, mostnotably, Drs. Jens Lykke-Anderson, Scott Ballantyne, Kristian Baker, Kris Dickson, Niki Gray,Stan Fields, Mattias Hentze, Allan Jacobson, Roy Parker, Stu Peltz, Daniel Seay, Rob Singer,Nancy Standart, and Joan Steiz. We also thank Drs. Wenqian Hu and Thomas J. Sweet forcritical reading of the manuscript. Work in theWickens laboratory is supported by grants fromthe National Institutes of Health (NIH). Dr. Coller is supported by a grant from the AmericanCancer Society and the NIH.
REFERENCES
Amrani, N., Dong, S., He, F., Ganesan, R., Ghosh, S., Kervestin, S., Li, C., Mangus, D. A.,Spatrick, P., and Jacobson, A. (2006). Aberrant termination triggers nonsense-mediatedmRNA decay. Biochem. Soc. Trans. 34, 39–42.
Baron-Benhamou, J., Gehring, N. H., Kulozik, A. E., and Hentze, M.W. (2004). Using thelambdaN peptide to tether proteins to RNAs. Methods Mol. Biol. 257, 135–154.
Barreau, C., Watrin, T., Beverley Osborne, H., and Paillard, L. (2006). Protein expression isincreased by a class III AU-rich element and tethered CUG-BP1. Biochem. Biophys. Res.Commun. 347, 723–730.
Barton, H. A., Eisenstein, R. S., Bomford, A., and Munro, H. N. (1990). Determinants ofthe interaction between the iron-responsive element-binding protein and its binding sitein rat L-ferritin mRNA. J. Biol. Chem. 265, 7000–7008.
Beach, D. L., Salmon, E. D., and Bloom, K. (1999). Localization and anchoring of mRNAin budding yeast. Curr. Biol. 9, 569–578.
Behm-Ansmant, I., Rehwinkel, J., Doerks, T., Stark, A., Bork, P., and Izaurralde, E. (2006).mRNA degradation by miRNAs and GW182 requires both CCR4:NOT deadenylaseand DCP1:DCP2 decapping complexes. Genes Dev. 20, 1885–1898.
Bertrand, E., Chartrand, P., Schaefer, M., Shenoy, S. M., Singer, R. H., and Long, R. M.(1998). Localization of ASH1 mRNA particles in living yeast. Mol. Cell 2, 437–445.

Tethered Function Assays 319
Brodsky, A. S., and Silver, P. A. (2000). Pre-mRNA processing factors are required fornuclear export. RNA 6, 1737–1749.
Carey, J., and Uhlenbeck, O. C. (1983). Kinetic and thermodynamic characterization of theR17 coat protein-ribonucleic acid interaction. Biochemistry 22, 2610–2615.
Chou, C. F., Mulky, A., Maitra, S., Lin, W. J., Gherzi, R., Kappes, J., and Chen, C. Y.(2006). Tethering KSRP, a decay-promoting AU-rich element-binding protein, tomRNAs elicits mRNA decay. Mol. Cell. Biol. 26, 3695–3706.
Coller, J., and Wickens, M. (2002). Tethered function assays using 30 untranslated regions.Methods 26, 142–150.
Coller, J. M., Gray, N. K., and Wickens, M. P. (1998). mRNA stabilization by poly(A)binding protein is independent of poly(A) and requires translation. Genes Dev. 12,3226–3235.
Collier, B., Gorgoni, B., Loveridge, C., Cooke, H. J., and Gray, N. K. (2005). The DAZLfamily proteins are PABP-binding proteins that regulate translation in germ cells. EMBOJ. 24, 2656–2666.
De Gregorio, E., Preiss, T., and Hentze, M.W. (1999). Translation driven by an eIF4G coredomain in vivo. EMBO J. 18, 4865–4874.
De Gregorio, E., Baron, J., Preiss, T., and Hentze, M.W. (2001). Tethered-function analysisreveals that elF4E can recruit ribosomes independent of its binding to the cap structure.RNA 7, 106–113.
Dickson, K. S., Thompson, S. R., Gray, N. K., and Wickens, M. (2001). Poly(A) polymer-ase and the regulation of cytoplasmic polyadenylation. J. Biol. Chem. 276, 41810–41816.
Dugre-Brisson, S., Elvira, G., Boulay, K., Chatel-Chaix, L., Mouland, A. J., andDesGroseillers, L. (2005). Interaction of Staufen1 with the 50 end of mRNA facilitatestranslation of these RNAs. Nucleic Acids Res. 33, 4797–4812.
Filipowicz, W. (2005). RNAi: The nuts and bolts of the RISC machine. Cell 122, 17–20.Finoux, A. L., and Seraphin, B. (2006). In vivo targeting of the yeast Pop2 deadenylase
subunit to reporter transcripts induces their rapid degradation and generates new decayintermediates. J. Biol. Chem. 281, 25940–25947.
Furuyama, S., and Bruzik, J. P. (2002). Multiple roles for SR proteins in trans splicing. Mol.Cell. Biol. 22, 5337–5346.
Fusco, D., Accornero, N., Lavoie, B., Shenoy, S. M., Blanchard, J. M., Singer, R. H., andBertrand, E. (2003). Single mRNA molecules demonstrate probabilistic movement inliving mammalian cells. Curr. Biol. 13, 161–167.
Gray, N. K., Coller, J. M., Dickson, K. S., and Wickens, M. (2000). Multiple portions ofpoly(A)-binding protein stimulate translation in vivo. EMBO J. 19, 4723–4733.
Hentze, M. W., Muckenthaler, M. U., and Andrews, N. C. (2004). Balancing acts:Molecular control of mammalian iron metabolism. Cell 117, 285–297.
Hope, I. A., and Struhl, K. (1986). Functional dissection of a eukaryotic transcriptionalactivator protein, GCN4 of yeast. Cell 46, 885–894.
Keegan, L., Gill, G., and Ptashne, M. (1986). Separation of DNA binding from thetranscription-activating function of a eukaryotic regulatory protein. Science 231,699–704.
Kim, Y. K., Furic, L., Desgroseillers, L., and Maquat, L. E. (2005). Mammalian Staufen1recruits Upf1 to specific mRNA 30UTRs so as to elicit mRNA decay. Cell 120,195–208.
Kwak, J. E., Wang, L., Ballantyne, S., Kimble, J., and Wickens, M. (2004). MammalianGLD-2 homologs are poly(A) polymerases. Proc. Natl. Acad. Sci. USA 101, 4407–4412.
Lefstin, J. A., and Yamamoto, K. R. (1998). Allosteric effects of DNA on transcriptionalregulators. Nature 392, 885–888.
Le Hir, H., Izaurralde, E., Maquat, L. E., and Moore, M. J. (2000a). The spliceosomedeposits multiple proteins 20–24 nucleotides upstream of mRNA exon-exon junctions.EMBO J. 19, 6860–6869.

320 Jeff Coller and Marv Wickens
Le Hir, H., Moore, M. J., and Maquat, L. E. (2000b). Pre-mRNA splicing alters mRNPcomposition: Evidence for stable association of proteins at exon-exon junctions. GenesDev. 14, 1098–1108.
Long, R. M., Gu,W., Lorimer, E., Singer, R. H., and Chartrand, P. (2000). She2p is a novelRNA-binding protein that recruits the Myo4p-She3p complex to ASH1 mRNA.EMBO J. 19, 6592–6601.
Lowary, P. T., and Uhlenbeck, O. C. (1987). An RNA mutation that increases the affinityof an RNA-protein interaction. Nucleic Acids Res. 15, 10483–10493.
Lykke-Andersen, J., Shu, M. D., and Steitz, J. A. (2000). Human Upf proteins target anmRNA for nonsense-mediated decay when bound downstream of a termination codon.Cell 103, 1121–1131.
Lykke-Andersen, J., Shu, M. D., and Steitz, J. A. (2001). Communication of the position ofexon-exon junctions to the mRNA surveillance machinery by the protein RNPS1.Science 293, 1836–1839.
Minshall, N., and Standart, N. (2004). The active form of Xp54 RNA helicase in transla-tional repression is an RNA-mediated oligomer. Nucleic Acids Res. 32, 1325–1334.
Minshall, N., Thom, G., and Standart, N. (2001). A conserved role of a DEAD box helicasein mRNA masking. RNA 7, 1728–1742.
Muhlrad, D., and Parker, R. (1992). Mutations affecting stability and deadenylation of theyeast MFA2 transcript. Genes Dev. 6, 2100–2111.
Pasquinelli, A. E., Hunter, S., and Bracht, J. (2005). MicroRNAs: A developing story. Curr.Opin. Genet. Dev. 15, 200–205.
Pillai, R. S., Artus, C. G., and Filipowicz, W. (2004). Tethering of human Ago proteins tomRNA mimics the miRNA-mediated repression of protein synthesis. RNA 10,1518–1525.
Rehwinkel, J., Behm-Ansmant, I., Gatfield, D., and Izaurralde, E. (2005). A crucial role forGW182 and the DCP1:DCP2 decapping complex in miRNA-mediated gene silencing.RNA 11, 1640–1647.
Ruiz-Echevarria, M. J., and Peltz, S. W. (2000). The RNA binding protein Pub1modulates the stability of transcripts containing upstream open reading frames. Cell101, 741–751.
Sanford, J. R., Gray, N. K., Beckmann, K., and Caceres, J. F. (2004). A novel role forshuttling SR proteins in mRNA translation. Genes Dev. 18, 755–768.
Scharpf, M., Sticht, H., Schweimer, K., Boehm, M., Hoffmann, S., and Rosch, P. (2000).Antitermination in bacteriophage lambda. The structure of the N36 peptide-boxB RNAcomplex. Eur. J. Biochem. 267, 2397–2408.
Scully, K. M., Jacobson, E. M., Jepsen, K., Lunyak, V., Viadiu, H., Carriere, C.,Rose, D. W., Hooshmand, F., Aggarwal, A. K., and Rosenfeld, M. G. (2000). Allostericeffects of Pit-1 DNA sites on long-term repression in cell type specification. Science 290,1127–1131.
Shen, H., and Green, M. R. (2006). RS domains contact splicing signals and promotesplicing by a common mechanism in yeast through humans. Genes Dev. 20, 1755–1765.
Singer, R. H., Lawrence, D. S., Ovryn, B., and Condeelis, J. (2005). Imaging of geneexpression in living cells and tissues. J. Biomed. Opt. 10, 051406.
Singh, G., and Lykke-Andersen, J. (2003). New insights into the formation of activenonsense-mediated decay complexes. Trends Biochem. Sci. 28, 464–466.
Sontheimer, E. J. (2005). Assembly and function of RNA silencing complexes. Nat. Rev.Mol. Cell. Biol. 6, 127–138.
Spellman, R., Rideau, A., Matlin, A., Gooding, C., Robinson, F., McGlincy, N.,Grellscheid, S. N., Southby, J., Wollerton, M., and Smith, C. W. (2005). Regulationof alternative splicing by PTB and associated factors. Biochem. Soc. Trans. 33, 457–460.

Tethered Function Assays 321
van Gelder, C. W., Gunderson, S. I., Jansen, E. J., Boelens, W. C., Polycarpou-Schwarz, M., Mattaj, I. W., and van Venrooij, W. J. (1993). A complex secondarystructure in U1A pre-mRNA that binds two molecules of U1A protein is required forregulation of polyadenylation. EMBO J. 12, 5191–5200.
Wang, L., Eckmann, C. R., Kadyk, L.C, Wickens, M., and Kimble, J. (2002). A regulatorycytoplasmic poly(A) polymerase in Caenorhabditis elegans. Nature 419, 312–316.
Wang, Z., Xiao, X., Van Nostrand, E., and Burge, C. B. (2006). General and specificfunctions of exonic splicing silencers in splicing control. Mol. Cell 23, 61–70.
Williamson, J. R. (2000). Induced fit in RNA-protein recognition. Nat. Struct. Biol. 7,834–837.
Witherell, G. W., Wu, H. N., and Uhlenbeck, O. C. (1990). Cooperative binding of R17coat protein to RNA. Biochemistry 29, 11051–11057.
C H A P T E R F I F T E E N
M
IS
*
ethods
SN 0
DepaBioloScien
Analysis of Ribosomal ShuntingDuring Translation Initiationin Eukaryotic mRNAs
Vincent P. Mauro,* Stephen A. Chappell,* and John Dresios *, †
Contents
1. In
in
076
rtmgy,ce A
troduction
Enzymology, Volume 429 # 2007
-6879, DOI: 10.1016/S0076-6879(07)29015-9 All rig
ent of Neurobiology, The Scripps Research Institute, and The Skaggs Institute for ChLa Jolla, Californiapplications International Corporation, San Diego, California
Else
hts
em
324
2. D
efining the Site or Sites of Ribosomal Recruitment 3242
.1. A ssessment of cap-dependent translation usinghairpin structures
3262
.2. O ther approaches to block cap-dependent translation 3302
.3. A ssessment of cap-independent translation 3323. E
xperimental Approaches to Determine Which Segments of anmRNA Are Shunted
3343
.1. U se of hairpin structures as obstacles 3353
.2. U se of upstream AUG codons as obstacles 3374. Id
entification of Ribosomal Shunt Sites 3395. D
etermining Whether Putative Shunt Sites Bind toRibosomal Subunits
3405
.1. P rocedures 3406. A
ssessing mRNA–rRNA Base Pairing in Yeast 3446
.1. P rocedure 3467. A
ssessing Ribosomal Shunting Mediated by mRNA–rRNA BasePairing Interactions
3498. C
onsiderations in Using the Mouse–Yeast Hybrid rRNA System 351Ackn
owledgments 352Refe
rences 352Abstract
In eukaryotes, translation initiation involves recruitment of ribosomal subunits
at either the 50 m7G cap structure or at an internal ribosome entry site (IRES).
For most mRNAs, the initiation codon is located some distance downstream,
vier Inc.
reserved.
ical
323

324 Vincent P. Mauro et al.
necessitating ribosomal movement to this site. Although the mechanistic
details of this movement remain to be fully resolved, it appears to be nonlinear
for some mRNAs (i.e., ribosomal subunits appear to bypass [shunt] segments of
the 50 leader as they move to the initiation codon). This chapter describes
various experimental approaches to assess ribosomal shunting and to identify
mRNA elements (shunt sites) that facilitate shunting. In addition, we provide an
overview of approaches that can be used to investigate the mechanism used by
individual shunt sites, along with a detailed protocol for investigating putative
base pairing interactions between shunt sites and 18S rRNA.
1. Introduction
For eukaryotic mRNAs, ribosomal recruitment occurs some distanceupstream of the initiation codon, necessitating ribosomal movement forinitiation to occur. In theory, this movement may occur by linear scanningof the intervening nucleotides (Fig. 15.1A), scanning some of the interven-ing nucleotides while shunting others (Fig. 15.1B), not scanning at all, butmoving between so-called ‘‘shunt sites’’ (Fig. 15.1C), or completely bypass-ing the intervening nucleotides by shunting directly to the initiation codon(Fig. 15.1D).
Ribosomal shunting may explain why the translation of some mRNAsproceeds efficiently even though these mRNAs contain sequence or struc-tural elements in their 50 leaders that should either divert or block scanningribosomes. These ‘‘obstacles’’ include upstream AUG codons and stableRNA conformations, respectively. To assess shunting in such candidatemRNAs, it is necessary to identify the site or sites at which ribosomalsubunits are recruited, determining which mRNA segments are shunted,defining shunt sites if they occur, and elucidating the underlying shuntingmechanism.
2. Defining the Site or Sitesof Ribosomal Recruitment
The first step in assessing ribosomal shunting involves determining thesite of ribosomal recruitment, which is most frequently thought to occur ateither the m7G cap structure or at an internal ribosome entry site (IRES;reviewed in Hellen and Sarnow, 2001; Vagner et al., 2001). The former is amodified nucleotide, which is present at the 50 ends of all mRNAs that aretranscribed by RNA polymerase II. The cap structure facilitates translationinitiation by interacting with a specific set of initiation factors that links it to
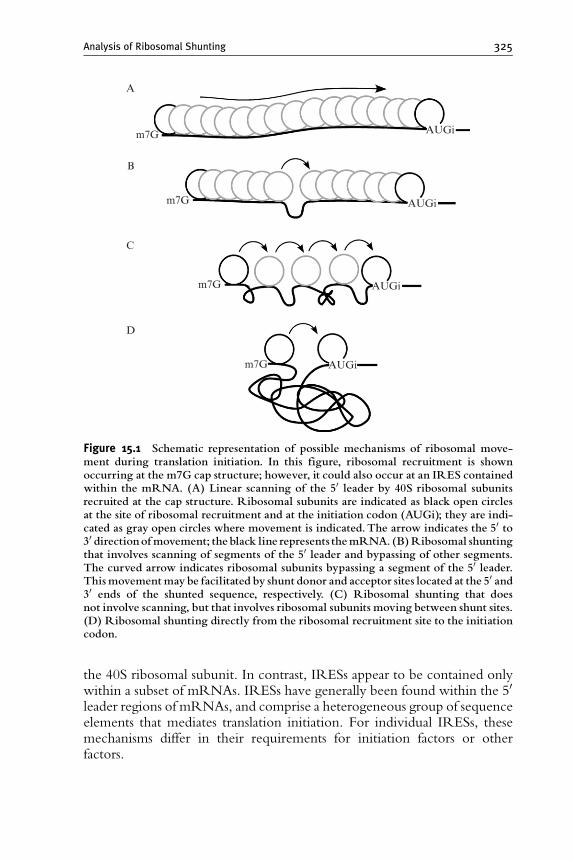
A
B
C
D
m7G
m7G
m7G
m7G AUGi
AUGi
AUGi
AUGi
Figure 15.1 Schematic representation of possible mechanisms of ribosomal move-ment during translation initiation. In this figure, ribosomal recruitment is shownoccurring at the m7G cap structure; however, it could also occur at an IRES containedwithin the mRNA. (A) Linear scanning of the 50 leader by 40S ribosomal subunitsrecruited at the cap structure. Ribosomal subunits are indicated as black open circlesat the site of ribosomal recruitment and at the initiation codon (AUGi); they are indi-cated as gray open circles where movement is indicated. The arrow indicates the 50 to30 directionofmovement; the black line represents themRNA. (B)Ribosomal shuntingthat involves scanning of segments of the 50 leader and bypassing of other segments.The curved arrow indicates ribosomal subunits bypassing a segment of the 50 leader.Thismovementmay be facilitated by shunt donor and acceptor sites located at the 50 and30 ends of the shunted sequence, respectively. (C) Ribosomal shunting that doesnot involve scanning, but that involves ribosomal subunits moving between shunt sites.(D) Ribosomal shunting directly from the ribosomal recruitment site to the initiationcodon.
Analysis of Ribosomal Shunting 325
the 40S ribosomal subunit. In contrast, IRESs appear to be contained onlywithin a subset of mRNAs. IRESs have generally been found within the 50leader regions of mRNAs, and comprise a heterogeneous group of sequenceelements that mediates translation initiation. For individual IRESs, thesemechanisms differ in their requirements for initiation factors or otherfactors.

326 Vincent P. Mauro et al.
2.1. Assessment of cap-dependent translation usinghairpin structures
To assess whether the cap structure is the site of ribosomal recruitment, it isnecessary to block this site and look at the effects on translation. One way toaccomplish this is to introduce a stable stem–loop (hairpin) structure nearthe 50 end of a reporter mRNA containing the 50 leader sequence. Themechanism by which such structures block cap-dependent translation mayinvolve masking of the cap structure; however, it appears more likely thatthe structures prevent recruitment of 40S ribosomal subunits by interferingwith the formation of the eukaryotic initiation factor (eIF)4F complex orwith the eIF4F–eIF3 association (discussed in Kapp and Lorsch, 2004).
In our studies, we have blocked cap-dependent translation using a 60-ntpalindromic sequence that is predicted to form a hairpin structure with acalculated stability of approximately 55 kcal/mol (Stoneley et al., 1998).In various studies, the presence of this hairpin structure at the 50 end of areporter mRNA inhibited cap-dependent translation by approximately 75%to 85% in transiently transfected mammalian cells, when compared to anmRNA lacking the hairpin structure (Chappell et al., 2000, 2001; Stoneleyet al., 1998). This same hairpin structure inhibited cap-dependent translationby approximately 100% in yeast (Zhou et al., 2001).
There are several ways to generate a construct encoding an mRNAwitha hairpin structure. Such constructs can be generated by insertion of ahairpin structure at the 50 end of the 50 leader, either in the context of anatural or synthetic mRNA. If there is a naturally occurring restriction siteat or near the 50 end of the mRNA, this site can be used to insert a hairpinstructure. If such a site is not present, it can be introduced by site-directedmutagenesis, either at the transcription start site or immediately downstreamof it.
Although a DNA fragment encoding a hairpin structure can be gener-ated by polymerase chain reaction (PCR) amplification of an oligonucleo-tide template, we have found that it is difficult to amplify oligonucleotidescontaining such palindromic sequences. An easier approach involves clon-ing two fragments into the DNA construct, each corresponding to one-halfof the hairpin structure. For this cloning, each fragment can be clonedindependently to facilitate its sequencing, and then combined into thesame construct. An advantage of this approach is that it introduces arestriction site into the loop of the hairpin structure; the presence of thisrestriction site can be used to rapidly identify plasmids containing thehairpin structure. The thermodynamic stability of a hairpin structure canbe predicted using the MFold algorithm (Zuker et al., 1999).
A considerationwith the use of hairpin structures is the possibility of theircleavage. In our earlier studies, we observed that a hairpin structurecontained within a recombinant mRNA was cleaved when this mRNA
Analysis of Ribosomal Shunting 327
was expressed in transfected cells (Chappell et al., 2006a). This observationsuggests that any observed translation that relies on sequences locatedupstream of the hairpin structure must be due to ribosome movement acrossnoncovalently linked RNAs. It is therefore important to perform appropri-ate RNA analyses to determine whether the presence of the hairpin structureaffects mRNA integrity or levels. A protocol describing how to assess theintegrity of a hairpin structure is included below in the section on usingRNAhairpin structures as barriers to translation to assess ribosomal shunting.
A caveat associated with the use of a hairpin structure to assesscap-dependent translation is that such a structural element may inhibittranslation in ways other than impeding cap-dependent ribosomal recruit-ment. For example, a hairpin structure may inhibit translation by affectingthe conformation and activity of an IRES element that may be presentdownstream of the hairpin structure. Alternatively, it may affect the accessi-bility of the initiation codon (Chappell et al., 2006b). It is therefore advisableto further assess cap-dependent translation using additional approaches (e.g.,by blocking the activities of individual initiation factors involved incap-dependent translation initiation). This can be accomplished in variousways (e.g., by expressing a hypophosphorylated 4E-BP in cells to sequesterthe cap-binding protein eIF4E) (Gingras et al., 1999; Pinkstaff et al., 2001),or by expressing the picornavirus 2A protease to cleave initiation factoreIF4G and preventing it from simultaneously interacting with both themRNA andwith the ribosomal subunit (via eIF3).While the latter approachhas been used successfully to block the translation of globin mRNA whenboth the mRNA and enzyme were injected into Xenopus oocytes (Keiperand Rhoads, 1997), it should be kept in mind that cap-dependent translationmay not be completely inhibited. For example, the extent to which transla-tion is blocked will depend on various factors, including the levels of theseinhibitory proteins (see Pinkstaff et al., 2001). To obtain an indication of theextent to which cap-dependent translation is blocked, a cap-dependentmRNA (e.g., a recombinant mRNA containing the b-globin 50 leader)should be included in these experiments.
2.1.1. Procedure: transient transfection of mammalian cellswith Photinus luciferase reporter constructs
The evaluation of cap-dependent translation described here, as well as otherstudies described in this chapter, uses the pGL3c plasmid (Promega), whichcontains Photinus luciferase as a reporter gene, and assays its levels in tran-siently transfected mammalian cells. However, the same strategies applywhen performing such studies using other reporter cistrons or authenticcoding sequences.
The experimental details of transient transfection, as typically performed inour laboratory in mouse neuroblastoma N2a cells, are detailed below. Notethat we have successfully used these same conditions with numerous other cell

328 Vincent P. Mauro et al.
lines, including rat glial tumor C6, mouse fibroblast NIH 3T3 (3T3), B104 ratneural tumor, and human neuroblastoma SK-N-SH (SK). In other cell lines,it may be necessary to vary conditions for efficient transfection.
Twenty-four hours prior to transfection, cell monolayers are trypsinized[0.25% trypsin in 1 mM ethylenediaminetetraacetic acid (EDTA); Gibco],cells are counted using a hematocrit, and replated at 1 105 cells per well insix-well culture plates with 1 ml of growth media [Dulbecco’s modifiedEagle medium (DMEM) containing 10% fetal bovine serum (FBS),100 units penicillin, 100 units streptomycin, and 292 mg L-glutamine (Invi-trogen Corporation)] per well. After culturing for 24 h at 37, with 5%CO2,and 98% humidity, cells are transiently transfected. For each well, 100 ml ofOpti-MEMÒ I reduced serum media (GibcoTM Invitrogen Corporation) ismixed with 3 ml FuGENEÒ 6 Transfection Reagent (Roche Diagnostics)and incubated for 5 min at room temperature. Then 0.5 mg of reporterplasmid is added to the Opti-MEM/FuGENE 6 mix, along with 0.2 mg ofthe pCMV-b plasmid (Clontech), which is included as a measure of trans-fection efficiency. The mixture is incubated at room temperature for 15 minand applied to a cell monolayer, which has had the growth media removed,covering themonolayer as evenly as possible with the solution.Onemilliliterof fresh growth media is then applied and the cells cultured for an additional24 h, after which the growth media are removed and the cells are washedwith approximately 0.25 ml of a phosphate-buffered saline solution. Cellsare lysed using 0.25 ml of 1 Passive Lysis buffer (Promega) for 15 min on arocking platform, followed by manual scraping with a rubber policeman.Lysates are then transferred to 1.5-ml Eppendorf tubes.
Photinus luciferase assays are performed using 20 ml of cell lysate in 96-wellplates using the Luciferase Assay System (Promega). In our studies, we use aMicroLumat LB P luminometer (EG&G Berthold) to measure luciferaseactivity. Photinus luciferase activities are normalized for transfection efficiencyusing the b-galactosidase activity of the control construct. To measure thisactivity, 20 ml of cell lysate is assayed in transparent 96-well plates (Falcon)using the FluoReporter lacZ kit (Invitrogen) on a Millipore CytofluorTM
2350 measurement system. Translation efficiencies are then expressed asnormalized luciferase activities in raw light units divided by normalizedluciferase mRNA levels, which are determined using ribonuclease protectionassays (RPAs).
2.1.2. Procedure: Ribonuclease protection assaysFor RPAs, total cellular RNA is isolated from transfected cells using 1 ml ofTRIzolÒ Reagent (Invitrogen) per well. RNA is extracted according to themanufacturer’s instructions and resuspended in 30 ml of diethyl pyrocarbo-nate (DEPC)-treated H2O. Due to the high sensitivity of the RPA, it isimportant to remove any residual reporter DNA in the RNA preparation.This is accomplished using the DNA-freeTM Kit (Ambion) according to themanufacturer’s instructions.
Analysis of Ribosomal Shunting 329
RPA probes are generated by PCR amplification of 1 ng of a plasmidDNA template that contains the target sequence. Plasmid templates includethe pGL3c plasmid (Promega) for the Photinus luciferase probe and thepCMV-b plasmid for the lacZ probe. The Photinus luciferase RPA probecorresponds to nucleotides 1839 to 1939 of the Photinus luciferase codingsequence as numbered in the pGL3c plasmid and can be amplified efficientlyusing the following oligonucleotides:
(F) 50-ATATATGAATTCGAAGTACCGAAAGGTCTTA-30 and(R) 50-ATATATACTAGTCTAGAATTACACGGCGATCT-30
The b-galactosidase RPA probe corresponds to nucleotides 875 to 1095of the b-galactosidase coding sequence as numbered in the pCMV-bplasmid and can be amplified using the following oligonucleotides:
(F) 50-ATATATAAGCTTGTCGTTTACTTTGACCAAC-30 and(R) 50-ATATATCTCGAGACTGTTGGGAAGGGCGAT-30
The PCR reactions contain 30 pmol of each oligonucleotideand 2.5 units of pfuUltraTM DNA polymerase (Stratagene). PCR ampli-fication proceeds for 35 cycles at the following cycling conditions:94 for 1 min, 56 for 1 min, and 72 for 1 min. Amplified products areisolated from 2% agarose gels, restricted using the appropriate restrictionsites as indicated below, and cloned into the pBluescriptÒ KS plasmid(Stratagene).
The amplified products are cloned downstream of the T7 or T3 RNApolymerase promoters, which are contained within the pBluescriptÒ KSplasmid. In our studies, we cloned Photinus luciferase sequences downstreamof the T7 promoter (using EcoRI and SpeI restriction sites) and the lacZsequences downstreamof the T3 promoter (usingHindIII andXhoI restrictionsites). For transcription reactions from the T7 promoter, the plasmid islinearized with HindIII and for the T3 promoter it is linearized with BamHI.Linearized plasmid DNA is precipitated with 1/20th volume 0.5 M EDTA,1/10th volume 3 M sodium acetate, and 2 volumes ethanol at 20 for30 min. Precipitated plasmids are resuspended in RNase-free water at aconcentration of approximately 1 mg/ml. Of each linearized DNA template1 mg is used to generate radiolabeled riboprobes using the MAXIscriptÒ
In Vitro Transcription Kit (Ambion) with either T7 or T3 RNA polymerases,as appropriate. The reactions contain 5 ml of Easy Tides [a-32P]CTP(3000 Ci/mmol, Dupont/NEN) and are incubated at 37 for 1 h. Unincor-porated nucleotides are removed by spin-column chromatography usingSephadex B-25 columns (Pharmacia).
A Photinus luciferase riboprobe generated as described above is 162nucleotides long (see below) and contains 101 nucleotides that should beprotected by the Photinus luciferase mRNA (underlined). The other 61nucleotides are derived from the plasmid and should not be protected(in italics).

330 Vincent P. Mauro et al.
50-GGGCGAAUUGGAGCUCCACCGCGGUGGCGGCCGCUCUAGAACUAGUCUAGAAUUACACGGCGAUCUUUCCGCCCUUCUUGGCCUUUAUGAGGAUCUCUCUGAUUUUUCUUGCGUCGAGUUUUCCGGUAAGACCUUUCGGUACUUCGAAUUCGAUAUCAAGCU-30
The lacZ riboprobe generated as above is 296 nucleotides long (seebelow) and contains 221 nucleotides that should be protected by the lacZmRNA (underlined) and 75 nucleotides derived from the plasmid (italics)that should not be protected.
5-CUAAAGGGAACAAAAGCUGGGUACGCGGCCCCCCGAGCUCACUGUUGGGAAGGGCGAUCGGTGCGGGCCUCUUCGCUAUUACGCCAGCUGGCGAAAGGGGGAUGUGCUGCAAGGCGAUUAAGUUGGGUAACGCCAGGGUUUUCCCAGUCACGACGUUGUAAAACGACGGGAUCGCGCUUGAGCAGCUCCUUGCUGGUGUCCAGACCAAUGCCUCCCAGACCGGCAACGAAAAUCACGUUCUUGUUGGUCAAAGUAAACGACAAGCUUGAUAUCGAAUUCCUGCAGCCCGGGGGAUC-30
RPAs are performed using the RPA IIITM Ribonuclease ProtectionAssay Kit (Ambion). Briefly, in vitro transcribed riboprobes are isolatedfrom 6% denaturing polyacrylamide gels using 350 ml probe elution buffer.We routinely ethanol precipitate approximately 80,000 cpm of each radi-olabeled riboprobe with 1 mg of DNase-treated RNA from transfected cellsat 20 for 1 h. The precipitated RNA/probe mixtures are resuspended in10 ml of Hybridization III buffer, heated to 90 for 3 min, and allowed tohybridize overnight at 45. Riboprobe that remains unhybridized isremoved by the addition of 150 ml of RNase Digestion III buffer containinga 1:100 dilution of an RNase A/RNase T1 mixture and incubated at 37 for30 min. RNase digestion is terminated and the protected riboprobes areprecipitated by the addition of 225 ml of RNase Inactivation/PrecipitationIII Solution at20 for 15 min. Precipitated probes are then resuspended in5 ml of Gel loading buffer II, heated to 90 for 3 min, and loaded onto 6%denaturing polyacrylamide gels alongside molecular weight markers. Fol-lowing electrophoresis, gels are dried and visualized on a Storm 860 Phos-phorImager (Molecular Dynamics). The gel bands corresponding toRNase-protected fragments are then quantified using AlphaEaseFCStand-Alone software (Alpha Innotech, San Leandro, CA).
2.2. Other approaches to block cap-dependent translation
Cap-dependent translation can also be assessed in rabbit reticulocyte orother cell-free lysates using in vitro transcribed mRNAs. In such an experi-ment, the in vitro transcribed mRNA is translated in the absence or presenceof a cap analogue, e.g., m7GpppG, which blocks cap-dependent translation

Analysis of Ribosomal Shunting 331
by binding to eIF4E and preventing it from binding to the capped mRNAs.As in transfected cells, cap-dependent translation can also be assayed in cell-free lysates by comparing the translation of mRNAs lacking or containing a50 hairpin structure (Rogers et al., 2004).
2.2.1. Procedure: cell-free translationCapped mRNA transcripts for such experiments can be transcribed fromDNA templates containing a suitable promoter sequence, e.g., T3 or T7RNA polymerase using a system such as the mMESSAGE mMACHINERNA transcription kit (Ambion, Austin, TX), which can yield up to 80%capped transcripts. A typical transcription reaction is performed using 1 mgof linearized template, which has been ethanol precipitated and resuspendedin DEPC-treated H2O. Following the transcription reaction, unincorpo-rated nucleotides are removed by spin-column chromatography usingSephadex G-25 columns. The transcripts are then quantitated by ultraviolet(UV) light absorbance at A260.
Translation reactions are performed in cell-free lysates using 0.5 mg ofthe capped mRNA templates in the presence or absence of 0.2 mM capanalogue (m7G(50)ppp(50)G, Roche Diagnostics). As in the cellular experi-ments described above, the inclusion in these experiments of a cap-dependent positive control mRNA will provide an indication of the extentto which cap-dependent translation is blocked.
To prepare a translating cell lysate from cultured cells (we have routinelyused N2a and C6 cells), 40 10-cm plates of cells are grown to approximately90% confluency, the growth medium is removed, and each plate is trypsi-nized using 2 ml trypsin at 37. The trypsinized cells are combined in 50-mlconical Falcon tubes (BD Biosciences) at 10 plates per tube on ice. Plates arewashed with 10 ml of ice-cold phosphate-buffered saline per 10 plates,which is also combined with the trypsinized cells (30 ml final volume per50-ml tube). Cells are centrifuged at 800g at 4, the supernatant isaspirated, and the cell pellet is washed in a further 10 ml of ice-coldphosphate-buffered saline. The cells are then pelleted again as describedabove. The supernatant is removed and the cells in each tube are resus-pended in 1 ml of Hypotonic buffer (10 mM HEPES, pH 7.4, 1.5 mM Mg(CH3OO)2, 15 mM KCl), which is supplemented with 0.5 ml 1 M dithio-threitol (DTT) per 1 ml of cell volume on ice. Cells are allowed to swell forapproximately 10 min and then homogenized with 110 strokes of a 10-mlDounce homogenizer. Cell lysates are then transferred to prechilled micro-fuge tubes and centrifuged at 16,000g in a refrigerated microcentrifuge for10 min at 4. The supernatants are then removed, combined, and can bestored at 80 until use.
In vitro translation reactions are performed in a total volume of 20 ml,which contains 10 ml of translating cell lysate with 0.5 mg of cappedmRNA, 50 mM of each amino acid (Complete Amino Acids Mixture
332 Vincent P. Mauro et al.
(Promega), 10 units of SUPERase InTM (Ambion), 100 mM (CH3OO)K,1.3 mM Mg(CH3OO)2, and 2 ml of 10 reaction mixture (250 mMHEPES, pH 7.4, 250 mg/ml creatine kinase, 100 mM creatine phosphate,20 mM DTT, 10 mM ATP, 20 mM GTP, 750 mg/ml tRNA, 2.4 mMspermidine, and 25 mM cAMP). Reactions are incubated for 1 h at 30.
In vitro translations using Rabbit Reticulocyte Lysate (Promega) areperformed in a total volume of 20 ml using 0.5 mg of capped mRNAs with14 ml of lysate, 20 mM of each amino acid (Amino Acids Mixture’s MinusLeucine, and Minus Methionine [Promega]), and 4 units SUPERase Infor 15 min at 30. In vitro translations to assess cap-dependent translationare performed in the presence or absence of 0.2 mM cap analogue (m7G(50)ppp(50)G, Roche Diagnostics).
Parallel translation reactions are set up to assess mRNA integrity over theincubation period to rule out that the observed results may be due tomRNA degradation. mRNA is purified from reaction mixtures at thestart and end of the incubation period and is analyzed by Northern blotanalysis using a Photinus luciferase probe. Such a riboprobe can be generatedfrom the Photinus luciferase reporter constructs, which contain a T7 RNApromoter at the 30 end of the coding sequence, by linearizing withNcoI andtranscribing using the MAXIscript In Vitro Transcription Kit.
Based on tests as described above, it should be possible to determinewhether a 50 leader facilitates translation initiation by a cap-dependentmechanism. If this is not the case (i.e., if translation is only partly cap-dependent or completely cap independent), it may indicate that an IRES iscontributing to the observed translation.
2.3. Assessment of cap-independent translation
Putative IRESs can be evaluated using established criteria, which includetesting the putative IRES in the intercistronic region of a dicistronicmRNA to determine whether it can drive expression of the second cistronin a manner that is independent of the translation of the first cistron, e.g., byinserting a hairpin structure into the 50 leader to block translation of the firstcistron and measuring whether expression of the second cistron persists.Another important test involves showing that the activity of the putativeIRES depends on the production of the dicistronic mRNA, rather than onthe production of monocistronic mRNAs corresponding to the secondcistron. The latter may arise by cryptic promoter activity, or by splicing orcleavage of the dicistronic mRNA. Convincing tests involve showing thatexpression of the second cistron does not occur when the promoter drivingtranscription of the dicistronic mRNA is deleted (Chappell and Mauro,2003; Dobson et al., 2005). Another approach involves showing thatexpression of the second cistron is proportional to the amount of dicistronicmRNA produced, for example, when the dicistronic mRNA is transcribed

Analysis of Ribosomal Shunting 333
using promoters of different strengths (Fig. 15.2), or by using a promoter theactivity of which can be regulated (Martineau et al., 2004; Mauro et al.,2004). Inasmuch as the levels of monocistronic mRNAs transcribed from acryptic promoter should not increase in response to the increased transcrip-tion of the dicistronic mRNA, this approach has an additional advantage inthat it makes it possible to measure IRES activity even from sequences thatmay have some cryptic promoter activity. The possibility that monocistro-nic mRNAs are produced by splicing of the dicistronic mRNA can bedetermined by performing reverse transcriptase polymerase chain reaction(RT-PCR) using oligonucleotide primers located at the 50 and 30 ends ofthe mRNA. These reactions will yield a product corresponding to the full-length mRNA. Monocistronic mRNAs arising from cryptic splicing of themRNA will yield a shorter PCR product or shorter products. A final
Renilla
R
R
R P
P
P
P
R
Photinus
1 10 100
Normalized luciferase activity
SV40p
CMVp
1000
Figure 15.2 Assessing IRES activity using promoters of different strengths to drivevarious levels of dicistronic mRNAs. The dicistronic mRNA constructs indicatedencodeRenilla luciferase as the first cistron and Photinus luciferase as the second cistron.The gray bar in the intercistronic region of two of the constructs represents a 22-ntsequence element from the 50 leader of theRbm3mRNA (Chappell et al., 2004).The toptwo constructs are transcribed by the SV40 promoter (SV40p); the bottom two con-structs are transcribed by the more active CMVpromoter (CMVp).The constructs weretested in mouse Neuro 2a (N2a) cells.The results show that the expression of theRenillaluciferase enzyme is more than 100-fold higher in cells transfected with the CMVcon-struct compared to the SV40 construct.The results (shown on a log scale) also show thatthe Photinus luciferase enzyme is expressed at a low level relative to Renilla luciferaseexpression in the control constructs, but is expressed at a higher level in constructs con-taining theRbm3 sequence, and is proportional to theRenilla luciferase levels.This resultindicates that the activityof theRbm3 sequence depends onproduction of the dicistronicmRNA, and that the translation of the second cistron occurs from the dicistronic tem-plate.This result is consistent with IRES activity and is inconsistent with the possibilityof cryptic promoter activity.The luciferase activities represent raw light units normal-ized for transfection efficiencies and are set at 1.0 for the Photinus luciferase activity ofthe SV40RPconstruct. Horizontal lines indicate standard error of themean (SEM).

334 Vincent P. Mauro et al.
possibility regarding apparent IRES activity is that cleavage may occurbetween the two cistrons, leading to some 50 end-dependent translation ofthe second cistron. This possibility can be addressed by performing RNAanalyses to detect the cleaved RNA fragments. Appropriate assays mayinclude RNase protection assays of the intercistronic region or Northernblots.
In all of the above experiments, it is important to note that the detectionof a shorter mRNA does not necessarily rule out IRES activity. The latterrequires knowing that the shorter mRNA contains the second cistron and ispresent at levels sufficient to account for the observed activity. In the casesof cryptic promoter activity or splicing, mRNA levels can be estimated byperforming RNA analyses in a quantitative manner using monocistronicmRNAs corresponding to the second cistron as a reference (e.g., seeCornelis et al., 2000).
To determine the location of an IRES within the 50 leader, its bound-aries can be mapped. The 50 boundary can be defined by deletion analysis(i.e., by progressively deleting nucleotides from the 50 end to determinewhich nucleotides are required for IRES activity). Likewise, progressivedeletions from the 30 end can define the 30 boundary. Deletion analyses ofthis type can be most efficiently performed in several steps (i.e., starting withrelatively large deletions to roughly map the boundaries, followed by asecond and perhaps additional smaller deletions to more finely map theseboundaries). The size of the deletions and the number of steps required todefine boundaries will be determined in large part by the length of the50 leader.
Note that it may be difficult or impossible to define distinct IRESboundaries if the IRES has a modular composition (i.e., if it is composedof shorter IRES elements that can function independently). For example, inour analysis of translational elements in the 50 leader of the Rbm3 mRNA(Chappell andMauro, 2003), we began with deletions of approximately 100nucleotides. Based on the results of these deletions, we identified fragmentswith discrete IRES elements and defined the boundaries of four cis-actingsequences within one 100-nt fragment. These boundaries were definedusing 20-nt deletions, followed by 5-nt deletions, and finally individualnucleotide deletions where required.
3. Experimental Approaches to Determine WhichSegments of an mRNA Are Shunted
Stable hairpin structures and upstream AUG codons can block trans-lation initiation when inserted between the site of ribosomal recruitmentand the initiation codon. The inability of either obstacle to block translation

Analysis of Ribosomal Shunting 335
suggests that they are bypassed by ribosomal subunits. It should be noted,however, that although these elements may block translation, they do notnecessarily provide evidence for the mechanism of ribosomal movement.For example, a hairpin structure may inhibit translation because it blocksscanning ribosomes. Alternatively, a hairpin structure may inhibit transla-tion because it sterically blocks a ribosomal subunit, which is tethered to thecap, from interacting with the initiation codon (Chappell et al., 2006b).Likewise, an upstream AUG codon may block translation because it divertsscanning ribosomal subunits, or because it competes for ribosomal subunitsthat are either tethered to mRNA or clustered in the vicinity. This notion ofribosomal tethering and clustering was described in an earlier publication(Chappell et al., 2006b) to explain how ribosomal subunits reach an AUGcodon. Tethering suggests that ribosomal complexes that are bound to themRNA, e.g., via the eIF4F complex at the cap structure, may reach anAUG codon by bypassing intervening sequences. Alternatively, clusteringsuggests that movement to an AUG codon may involve the dynamicbinding and release of ribosomal subunits at internal sites.
3.1. Use of hairpin structures as obstacles
An RNA hairpin structure can be inserted at various locations within the 50leader and its effects on translation measured to determine whether particu-lar sites in the mRNA are bypassed. The sequence of a hairpin structureused in our studies is shown below. The restriction sites used for thisconstruction should be unique as far as possible and will depend on thosepresent in the mRNA of interest:
(restriction site) CCAGCGUAAUCGGGAACGUCGUAGGGGUAAGCCAUUGUACGACCACCGGCUCGAGGGGCCC (restriction site)GGGCCCCUCGAGCCGGUGGUCGUACAAUGGCUUACCCCUACGACGUUCCCGAUUACGCUGG (restriction site)
A hairpin structure can be introduced at various sites within the mRNAusing restriction sites as described earlier for the evaluation of cap-dependent translation. Alternatively, DNA fragments corresponding tonucleotide sequences located upstream and downstream of the hairpinstructure can be generated by PCR amplification using appropriate oligo-nucleotide primers. In this strategy, three fragments (upstream, hairpin, anddownstream) are ligated together in a reporter plasmid. The use of differentrestriction sites at each location will ensure that the fragments will assemblein the right order and correct orientation.
An additional obstacle that we have embedded in the stem of our hairpinstructure (Chappell et al., 2006a) is an AUG codon (underlined) in excellentnucleotide context (A at 3 and G at þ4, relative to the A of the AUGcodon, which is designated as þ1; Kozak, 1986). When out of frame with

336 Vincent P. Mauro et al.
the initial condon, this second obstacle provides a failsafe mechanism (i.e., itshould be utilized if the hairpin structure is melted and it is exposed) andshould result in decreased reporter activity. Translation initiating at theembedded AUG codon also provides a means to monitor the double-stranded status of the hairpin structure in that utilization of the embeddedAUG codon can be measured. If the embedded AUG codon is in framewith the initiation codon, translation initiating at this site will produce anextended reporter protein the expression of which can be monitored byWestern blot analysis of the reporter protein. Alternatively, introduction ofan epitope tag (e.g., an hydroxyapatite [HA] tag into the open reading frame[ORF] derived from the embedded AUG codon) may enable translationinitiating at the embedded AUG codon to be monitored, even if the derivedORF is out of frame with the initiation codon. The hairpin structuredescribed above contains such a tag. Detection of the epitope-taggedprotein can be detected (e.g., with an anti-HA tag antibody, providedthat that this protein is of sufficient length for Western blot analysis). Thestability of short epitope-tagged proteins may also be an issue in such studies.However, this can be assessed with a control construct that expresses theepitope-tagged protein.
The caveats discussed earlier for using hairpin structures to assess cap-dependent translation also apply when using these structures to assessshunting; specifically, hairpin structures may affect translation by alteringother conformations in the 50 leader, which may affect the structure oractivity of an IRES or the accessibility of the AUG codon. Also, ourobservation of efficient translation of mRNAs in which the RNA hairpinstructure is cleaved in transfected cells provides strong evidence for shuntingbetween noncovalently linked RNAs, but underscores the need to performRNA analyses to look for such cleavage. Such cleavage may in some caseslead to degradation of the mRNA, or to differential degradation of one ofthe fragments.
3.1.1. Procedure: Assessing the integrity of an RNAhairpin structure
The integrity of hairpin structures contained within mRNAs can be assessedby performing RPAs on DNase-treated mRNA using two riboprobes: onecomplementary to the 30 stem of the hairpin (hp) structure (hp probe) and theother to the Photinus luciferase coding sequence (discussed above). The latteris included as a control to monitor the presence of the mRNA targets. TheRPA probe for the hairpin structure can be generated using 1 ng of a plasmidcontaining the 50 half of the hairpin structure as a template for PCRamplification using reaction conditions as described above. The 50 half ofthe hairpin sequence is amplified using a forward primer containing the SpeIrestriction site at its 50 end, and a reverse primer containing the XhoIrestriction site at its 30 end. After isolation from a 2% agarose gel, this

Analysis of Ribosomal Shunting 337
fragment is cloned upstream of the T7 RNA polymerase promoter containedwithin the pBluescript KS plasmid using SpeI and XhoI restriction sites. Thehairpin-encoding plasmid is then linearized with XhoI, precipitated, andtranscribed as described above. The resulting 128-nucleotide hairpin ribop-robe (see below) contains 67 nucleotides of sequence that should be protectedby the 30 hairpin sequence (underlined) and 61 nucleotides derived from thepBluscript plasmid that should not be protected (italics).
50-GGGCGAAUUGGAGCUCCACCGCGGUGGCGGCCGCUCUAGAACUAGCAGCUGGAAUUCCCAGCGUAAUCGGGAACGUCGUAGGGGUAAGCCAUUGUACGACCACCGGCUCGAGGGGCCCGACGUCUCGA-30
In our studies, we have also included two in vitro transcribed controlRNAs in the RPA (Chappell et al., 2006a). One of the RNAs contained thefull hairpin sequence and luciferase coding sequences (full hp RNA); theother RNA is similar, but lacks the 50 half of the hairpin structure (half hpRNA). When these control RNAs were tested in the RPA with the hp andPhotinus luciferase probes, we found that the half hp RNA was protected byboth the hp probe and the Photinus luciferase probe. In contrast, the fullhairpin RNA was protected only by the Photinus luciferase probe, presum-ably because base pairing of the hairpin structure precluded its hybridization.Consequently, the extent to which the hp probe is protected and the lengthof the protected product provide indications as to the integrity of the hairpinstructure and can be used as references for hairpin integrity. For example, asin our previous studies (Chappell et al., 2006a), if the RPA of RNA fromtransfected cells shows that the hp and Photinus luciferase probes protectfragments of relative intensity similar to theRPA of the control half hpRNA(i.e., the ratios of the two protected bands are the same), it would suggest thatthe hairpin structure was completely clipped in the transfected cells.
Both the half hp and full hp RNAs are transcribed in vitro from plasmidslinearized using a BamHI restriction site that is located downstream of thePhotinus luciferase coding sequence. As described above, transcriptions areperformed using the MAXIscriptÒ T7 In Vitro Transcription Kit.
3.2. Use of upstream AUG codons as obstacles
An indication that an mRNA may use a shunting mechanism for translationinitiation is the presence of one or more AUG codons in its 50 leader,particularly if the mRNA is translated efficiently despite the presence ofupstream AUG codons that reside in a good nucleotide context. This conclu-sion is based on the suggestion that scanning ribosomal subunits will initiatetranslation almost exclusively at an AUG codon that resides in a good context(Kozak, 1986, 2002).
338 Vincent P. Mauro et al.
The first step to evaluate shunting in an mRNA with upstream AUGcodons would be to mutate these upstream AUG codons, individually andin combination and measure the effects of these mutations on translation.These experiments can be performed in transiently transfected cells usingreporter constructs as described above. If segments of the 50 leader contain-ing an upstream AUG codon are shunted, mutation of the upstream AUGcodon should not affect translation of the reporter protein. In contrast, if anupstream AUG codon is utilized, its mutation is expected to increasetranslation of the reporter protein.
We have used this approach of mutating upstream AUG codons in ouranalysis of the 50 leader of the b-secretase (BACE1) mRNA. The resultsshowed that mutation of any or all of four upstream AUG codons had noeffect on translation in rat B104 cells (Rogers et al., 2004), even though thecontexts of all four AUG codons were capable of facilitating relativelyefficient levels of translation initiation when tested individually in the 50leader of the b-globin mRNA. These results provided strong evidence forribosomal shunting in the BACE1 50 leader.
Upstream AUG codons can also be introduced into mRNAs as obsta-cles, much like hairpin structures. For such experiments, it is important touse an AUG codon that resides in a good context. Important nucleotidesinclude a purine at3 (A is best) with a G atþ4, as long as it is not followedby a U at þ5 (Kozak, 1997).
Ideally, an upstream AUG codon is introduced such that the resultingORF overlaps the reporter cistron. Such upstream ORFs will either be inframe with the initiation codon or out of frame with it. In either case,translation initiating at an upstream AUG codon is expected to divertribosomes from the initiation codon and reduce translation of the authenticreporter protein. A potential problem with the use of an in-frame AUGcodon with a reporter protein that is monitored by measuring its enzymaticactivity is that the fusion protein, e.g., an N-terminal extended Photinusluciferase protein, may have enzyme activity that is different from that of theauthentic protein. Consequentially, it is necessary to physically monitor theexpression of the extended protein by Western blot analysis using anantibody to the reporter protein. We have used these complementaryapproaches in our earlier studies (Chappell et al., 2006a). Note that themolecular mass of the Photinus luciferase protein is approximately 60 kDaand that the size of the extended products will vary depending on thelocation of the upstream AUG codon. In our earlier studies, we were ableto detect an extension of 17 amino acids, which increased the molecularmass by approximately 2 kDa (Chappell et al., 2006a).
Depending on the sequence of the 50 leader, it may not be possible togenerate an ORF that overlaps the initiation codon from all locationswithin the 50 leader. Stop codons that occur between an introducedupstream AUG codon and the authentic initiation codon will generate

Analysis of Ribosomal Shunting 339
upstream ORFs that terminate before reaching the initiation codon.In some cases, a stop codon can be avoided by shifting the upstream AUGcodon by one or two nucleotides. If this cannot be done, it may still bepossible to perform a shunting analysis by introducing upstream AUGcodons that generate upstream ORFs that do not overlap the initiationcodon. Ribosomes initiating translation at such an upstream ORF will bediverted from the main cistron and should still result in its decreasedtranslation. However, if the upstream ORF is short, a fraction of ribosomesmay remain associated with the mRNA after its translation and reinitiatetranslation at the main cistron (Kozak, 2002). Another possibility forupstream AUG codons that yield only short ORFs, none of which overlapsthe initiation codon, is to mutate one or more of the upstream stop codons.These mutations of the stop codons should also be tested in the absence ofthe upstream AUG codon to determine whether these mutations them-selves affect translation.
As with the introduction of a hairpin structure into the 50 leader of anmRNA, a consideration in these studies is that the introduction of somemutations that generate upstream AUG codons may have unintended effectson translation. For example, some mutations may alter the conformation ofthe 50 leader. However, we expect that the introduction of upstream AUGcodons will be much less disruptive than the introduction of RNA hairpinstructures. Note that it may be possible to minimize potential problemsassociated with mutating the 50 leader by introducing point mutations atsites where some of the nucleotides already fit the consensus.
3.2.1. Procedure: Photinus luciferase Western blottingTo monitor Photinus luciferase levels by Western blot analysis, 70 ml of celllysate, in Passive Lysis buffer (Promega), is preheated to 70 for 10 min in thepresence of 5 ml 1MDTT and 25 ml 4 sample loading buffer (Invitrogen).Then 30 ml of denatured protein is loaded onto a 7% Tris-acetate gel inTris-acetate buffer (Invitrogen). Proteins are transferred to poly(vinylidenedifluoride) membranes (Bio-Rad) and probed with goat anti-Photinusluciferase polyclonal IgG first antibody (1:1000 dilution) and donkeyantigoat IgG second antibody conjugated to alkaline phosphatase (1:5000dilution) (both from Promega). Western blots are developed using theWestern Breeze chemiluminescent Western blot immunodetection kit(Invitrogen).
4. Identification of Ribosomal Shunt Sites
The experimental approaches of positioning barriers to translationwithin an mRNA 50 leader can identify candidate shunt sites. A fragmentcontaining such candidate shunt sites can be tested in isolation to determine
340 Vincent P. Mauro et al.
if it can facilitate shunting across a hairpin structure or an upstream AUGcodon when flanking the shunt site, or when tested on one side of theobstacle, with a bona fide shunt site (e.g., the Gtx element; Chappell et al.,2006a) on the other side of it. This approach is based on synthetic shuntingconstructs developed in our analysis of the Gtx element. The Gtx elementwas initially identified as an IRES element (Chappell et al., 2000), andsubsequently shown to facilitate ribosomal shunting independent of itsability to recruit ribosomes (Chappell et al., 2006a). In the shunting analysis,we testedmultiple copies of theGtx element upstream of the obstacle, with asingle element downstream. In this particular example, multiple copies of theGtx element were used to increase the signal-to-noise ratio by increasingribosomal recruitment upstream of the obstacle.
This same shunting assay can be used to define the boundaries of shuntsites contained within fragments that show positive results in this assay.These boundaries are defined by deletion analysis, as was described abovefor IRES modules. A consideration in these studies is that some shunt sitesmay not function when tested in this assay because their activities requireother sequences not contained within the fragment being tested, or becausespecific RNA conformations are required for activity and may be altered inthis context. These possibilities can be addressed to some extent by testinglarger segments. A candidate shunt site can be further analyzed in thecontext of the authentic 50 leader by mutating this sequence and determin-ing whether the mutation affects shunting, for example, across an upstreamAUG codon or hairpin structure.
5. Determining Whether Putative Shunt SitesBind to Ribosomal Subunits
Shunt sites presumably facilitate the nonlinear movement of 40Sribosomal subunits by interacting with these subunits either directly orindirectly. To determine whether binding is direct, binding assays can beperformed using a radiolabeled RNA probe corresponding to the definedshunt site or larger segments of the 50 leader containing shunt sites. Theseprobes can be incubated with purified 40S ribosomal subunits, and bindingassessed using nitrocellulose filter binding assays.
5.1. Procedures
5.1.1. Isolation of 40S ribosomal subunits40S ribosomal subunits can be isolated from lysates of cultured cells preparedas described above for the preparation of cell-free lysates. Cell lysates areallowed to thaw on ice and each milliliter of lysate is supplemented with 1 ml
Analysis of Ribosomal Shunting 341
of 200 mM ethyleneglycoltetraacetic acid (EGTA), 10 ml of 1 mg/ml apro-tinin, and 10 ml of 10 mM phenylmethylsulfonyl fluoride. The lysates arethen transferred to 3.2-ml-thick welled polycarbonate tubes (#362305,Beckman) and centrifuged at 176,000g for 90 min at 4. Unless otherwiseindicated, we perform such centrifugation steps using an OptimaTM TLXUltracentrifuge with a TLA 100.4 fixed angle rotor. Pellets are gentlyresuspended in 200 ml Resuspension buffer (0.25 M sucrose, 20 mMHEPES, pH 7.4, 50 mMKCl, 2 mMMgCl2, 0.1 mM EDTA) with a Teflonpestle on ice. The A260 of the resuspended polysomes is measured and thesolution diluted to 50 A260 units/ml in a solution with a final concentrationof 500 mM KCl, 50 mM HEPES, pH 7.4, 2 mM MgCl2, and 2 mM DTT;1 mM GTP and 1 mM puromycin are then added and the resuspendedpolysomes are incubated on ice for 15 min followed by 37 for 15 min.
To prepare isolated ribosomal subunits, the resuspended puromycin-treated ribosomes (see above) are loaded onto 15% to 35% linear sucrosegradients (sucrose in 500 mM KCl, 1.5 mM MgCl2, 20 mM HEPES, pH7.4, 2 mMDTT) and centrifuged at 74,000g in an SW28 rotor for 13.5 h at4 with slow deceleration in a Beckman OptimaTM ultracentrifuge.The gradient is fractionated using an ISCO TRISTM fractionator at anabsorbance of A260. Fractions corresponding to 40S ribosomal subunits arepooled and diluted with a buffer containing 20 mM HEPES, pH 7.4,1.5 mM MgCl2, and 2 mM DTT. Diluted fractions are centrifuged at338,000g for 20 h at 4. The supernatant is removed and isolated ribosomalsubunits are resuspended in 50 ml Resuspension buffer. The A260 of thesuspension is measured and stored in 5-ml aliquots at 80. This protocolcan yield relatively pure populations of 40S ribosomal subunits that can beused for binding assays (see below).
5.1.2. Nitrocellulose filter binding assaysNitrocellulose filter binding assays can be performed using either DNA orRNA probes of various lengths. 50 end-labeled oligonucleotide probes aregenerated by incubating 20 pmol of oligonucleotide with 20 units of polynu-cleotide kinase (PNK) in 1 PNK buffer (New England Biolabs) in a reactioncontaining 5 ml [g-32P]ATP (20 mCi, Dupont/NEN) for 30 min at 37.Unincorporated nucleotides are removed by passing the reaction throughtwo Sephadex Microspin G-25 columns. Longer radiolabeled RNA probesare transcribed in vitro fromDNA templates, e.g., using T7 RNA polymerase,as described earlier. Radiolabeled probes (40,000 cpm) are incubatedwith 40Sribosomal subunits in Binding buffer 1 (20 mM Tris–HCl, pH 7.4, at 4,6 mM NaCl, 5 mM 2-mercaptoethanol, 1 mM Na3EDTA, pH 8.8, 10%glycerol, and 1.8 mM MgCl2) for 30 min at 37 in a final volume of 10 ml.Samples are then diluted to 100 ml in the same buffer and filtered throughnitrocellulose filters (0.45 mm) using either a dot blot or slot blot apparatus.Prior to filtering, the nitrocellulose filters are prepared by presoaking the

342 Vincent P. Mauro et al.
membrane in 0.4 M KOH for 10 min, rinsing with H2O until the pH isneutral, and equilibrating in Binding buffer 1 for 1 h before use. After filteringthe binding reactions, the wells are washed several times with Binding buffer 1prewarmed to 37. The filter will bind to protein but not nucleic acids and thuswill retain the ribosomal subunits, along with any bound probes, while anyunbound probe will pass through. The radiolabeled filter-bound probe canthen be visualized and quantified. For our studies we use a Storm 860PhosphorImager and AlphaEaseFC Stand-Alone software. Filter-bound 32Pcan also be measured by liquid scintillation counting. For these experiments,background is the counts retained by the filter in the absence of ribosomalsubunits. Binding specificity can be determined by competing with variousunlabeled RNAs, including the probe itself as a specific competitor. Nonspe-cific competitors may include a scrambled or mutated probe sequence ortRNA (see Hall and Kranz, 1999; Woodbury and von Hippel, 1983; Zangand Romaniuk, 1995). In addition, by incubating the radiolabeled RNAprobes with increasing amounts of isolated ribosomal subunits, the bindingstrengths of any interactions can be estimated.
If the results of the binding assays described above indicate that particularshunt sites do not bind directly to isolated 40S ribosomal subunits, this maysuggest that a cellular trans-acting factor or factors are mediating interactionsbetween the mRNA and the ribosomal subunit. The identification of suchfactors is not the focus of this chapter, but an example of such an analysis canbe found in references (Xi et al., 2004, 2005). If the results of these studiesindicate direct binding, the nature of this binding can be pursued as follows:
5.1.3. UV crosslinking and localization of crosslinked probesProbes determined to bind specifically to ribosomal subunits can be furtherinvestigated by UV crosslinking analyses (see Hu et al., 1999; Tranque et al.,1998) to distinguish between binding that occurs to rRNA or to ribosomalproteins. Crosslinking is performed using RNA probes containing thecrosslinking reagent 4-thiouridine (s4U, USB). Such probes can be tran-scribed in vitro, e.g., using T7 RNA polymerase. A typical reaction wouldinclude 30 mM DTT, 400 mM each of GTP and ATP, a 280 mM:120 mMmixture of s4UTP:UTP, 40 mM CTP (Ambion), 50 mCi of [a-32P]CTP(3000 Ci/mmol, Dupont NEN), and 25 units of T7 RNA polymerase(Stratagene). Nonradioactive competitor RNAs are transcribed using500 mM each of GTP, CTP, ATP, and UTP at 37 for 3 h. Transcriptionreactions are terminated by the addition of 20 units of DNase I (Ambion) todigest the template. RNA is extracted with phenol/chloroform (1:1) andfurther purified by passage through Sephadex Microspin G-25 columns.In addition to various specific competitor RNAs, nonspecific competitors,e.g., poly(C) RNA (50 nt), which was used in our previous studies(Tranque et al., 1998), can be generated similarly by in vitro transcription.
Analysis of Ribosomal Shunting 343
Crosslinking reactions contain 20 pmol of s4U labeled probe and 2 pmolof ribosomal subunits in Binding buffer 2 (10 mMTris–HCl, pH 7.4, 50 mMKCl, 10 mM MgCl2) in the presence of 150 pmol of tRNA. Samples areincubated at 37 for 10 min, cooled on ice, and crosslinked by exposure to365 nm UV light for 10 min. The ribosomal proteins are extracted from therRNA using TRIzol reagent. If the radioactivity is associated with theaqueous fraction (RNA) and not with the extracted protein, the RNA isthen precipitated and electrophoresed on 1.2% agarose/formaldehyde gels.RNA in the gel is visualized with ethidium bromide and the gel is thentransferred to HybondNþ nylon membrane (Amersham) and exposed tofilm to confirm association with rRNA.
For probes that appear to crosslink to a ribosomal protein or proteins, theseproteins can be identified using various approaches, including two-dimensional gel electrophoresis and mass spectrometry. Numerous publishedprotocols describe these approaches and they are not covered in this chapter.
For probes that crosslink to rRNA, the site of interaction can belocalized using oligonucleotide-directed RNase H digestion of the rRNA(Hu et al., 1999; Tranque et al., 1998). In this method, the rRNA isspecifically cleaved at various sites, and for each case, the fragment boundto the radiolabeled probe is identified. To cleave the rRNA, short comple-mentary DNA oligonucleotides are annealed to the rRNA in RNase Hbuffer (40 mM Tris–HCl, pH 7.9, 10 mM MgCl2, 60 mM KCl, and 1 mMDTT). The mixture is heated to 50 for 3 min, and then incubated at 30for an additional 30 min. Then 0.5 mg of RNase H is added and theincubation is continued at 30 for another 30 min. The RNA is purifiedand electrophoresed as described above.
A consideration in the crosslinking studies is that the extent of UVcrosslinking is affected by the number and position of the s4U residueswithin the probes (Dubreuil et al., 1991). For individual sequences that lackU residues, an s4U residue can be introduced at either end of the sequencecorresponding to the shunt site.
Inhibition of reverse transcriptase (toeprinting) can be used to furtherdefine the location of a crosslinked probe in the 18S rRNA that has beenroughly mapped by oligonucleotide-directed RNase H digestion. Thisprocedure can be performed using RNA extracted from ribosomal subunitsthat have been crosslinked to a nonradioactive s4U-containing probe. TheRNA is extracted with phenol/chloroform (1:1) and toeprinted usingoligonucleotide primers located downstream of the crosslinked site. SeeRingquist and Gold (1998) for detailed protocols and considerations whenusing this method.
Putative base pairing interactions can then be tested using a hybrid yeastsystem that was used in our earlier studies (Chappell et al., 2006a; Dresioset al., 2006) and is described below.

344 Vincent P. Mauro et al.
6. Assessing mRNA–rRNA Base Pairing in Yeast
Binding that occurs between anmRNA shunt site and 18S rRNAcan befurther evaluated by altering both mRNA and rRNA sequences and deter-miningwhether an intact complementarymatch is required for shunting. If so,mutations that disrupt putative mRNA–rRNA base pairing should abolishshunting mediated by these sites. Similarly, mutations that restore comple-mentarity should restore shunting. In an earlier study, we used this approach todetermine whether a specific mRNA–rRNA base pairing interaction couldfacilitate ribosomal shunting in model mRNAs (Chappell et al., 2006a).To perform these studies, we applied a yeast experimental system that wedeveloped earlier to evaluate mRNA–rRNA base pairing (Dresios et al.,2006). This system employs ribosomes harboring hybrid mouse–yeast 18SrRNA sequences and enables analysis of a putative shunt site withcomplementarity to mouse but not yeast 18S rRNA sequences.
In our analysis of shunting mediated by the Gtx element, we showedthat efficient shunting required an intact element on both sides of theobstacle. Inasmuch as there is only one functional binding site for thiselement in the 40S ribosomal subunit (Dresios et al., 2006), we were ableto conclude that shunting mediated by this element involved dynamicbinding and dissociation of ribosomal subunits upstream of the obstacle,and rebinding at a downstream element (Chappell et al., 2006a).
It is also possible to analyze putative shunt sites with complementarity tothe yeast wild-type 18S rRNA that may occur in yeast or mammalianmRNAs; however, this analysis requires a different approach that is beyondthe scope of this chapter. Ideally, shunt sites from mammalian mRNAswould be analyzed in a mammalian system; however, a suitable mammaliansystem that enables alterations in the 18S rRNA has not yet been developed.
An advantage of analyzing mRNA–rRNA base pairing in the yeasthybrid system is that alternative explanations for reporter activity, such ascryptic promoter activity in the DNA constructs, are highly unlikelybecause any cryptic promoter activity should occur to a similar extent inyeast cells that express either wild-type or recombinant 18S rRNAs.
In earlier studies, we assessedmRNA–rRNAbase pairing in Saccharomycescerevisiae strain NOY908, which lacks all chromosomal copies of the 35SrDNA gene. The survival of these cells requires the expression of the35S rRNA from a high-copy number episomal vector (pNOY373,Fig. 15.3A; Wai et al., 2000). The expression of mouse–yeast hybrid ormutated yeast 18S rRNAs is achieved by transforming these cells with a secondplasmid, again in the context of the 35S rRNA. In plasmid pVM1, which isderived from pNOY353, the yeast 18S rRNA sequences from nucleotides 31to 1625 were replaced with the corresponding mouse sequences using

NOY908(rdn∆∆::HIS3 pNOY373)
Transformation withpNOY353 (or pVM1)
NOY908 + pNOY353 (or pVM1)
5S
5S
5S
pNOY373
pNOY373 pNOY353or pVM1
25S
E
25S25S
2m
2m
amp
TRP1
amp
amp
LEU2
LEU2
35S
35S35S
18S
18S
5.8S
5.8S
Hybrid 18S
GAL7P
GAL7T
Day: 0 3
3
5
5 7 9
5.8S
A B
CE
Figure 15.3 Ye a st syste m for ex pre ss i ng re co mbin a nt 18 S r R NAs. ( A ) Mou s e ^ ye a sthyb r id 18S r R NAs a re ex pre ss e d i n ye a st st rai n NOY 908 ( rd n DDHIS3 pNOY 373),wh ich g rows by t ra nsc r ipt ion vi a R NA polyme ras e I of a s i ngle r DNA re peat o n pl a s m idp N OY373 ( Wa i et al., 20 0 0). T h is st ra i n was t ra ns fo r me d w it h a s e co nd pl a s m id,p NOY 353, c a r r y i ng w i ld - t y pe ye a st s e que nces i n t he 35 S rDNA ge ne or pVM1, c a r r y i ngmou s e ^ye a st hyb r id 18 S r DNA s e que nces. I n t he sche m at ic, t he mou s e rDNA s e que ncesco nta i ne d w it h i n t he hyb r id 18S r DNA i n pVM1 a re i nd icated by t he h atche d g ray b a r.In both pNOY353 and pVM1, transcription of the 35S rRNA is driven by theGAL7pro-moter in the presence of galactose. Transformants are plated on galactose media andcel l s c a r r y i ng p NOY 353 or pVM1 a re s elected for t he i r abi l it y to g row i n t he abs e nceof t r y ptopha n. Yea st st ra i n NOY9 08 a nd pl a s m ids p NOY 353 a nd p NOY393, wh icha re u s e d fo r t h is a n a lys is, we re obtai ne d f ro m D r. M. No mu ra at t he Un ive rsit y ofCa l i fo r n i a, I r v i ne. Sche m at ic re pre s e ntat io n of p NOY 373 a nd p NOY 353 f ro m Fig. 2of Wa i et al. (20 0 0), by pe r m iss ion of O x ford Un ive rsit y P re ss. (B ) Sche m at ic re pre s e nta-tion of a mouse^yeast hybrid18S rRNA.The mouse sequences are indicated by the grayline; the yeast sequences are indicated by the black lines.The 50 and 30 ends of the rRNAare indicated. The secondary structures were adapted from those obtained onthe Comparative RNAWeb Site (http://www.rna.icmb.utexas.edu/) of Robert Gutell,Ph.D., University of Texas. (C) Northern blot analysis of total RNA prepared fromyeast cells expressing the hybrid18S rRNAatdifferent time points. Northern blotswerehybridized with an oligonucleotide probe that recognizes the mouse 18S rRNA at nts770 to 795, butdoes not recognize the yeast molecule.
Analysis of Ribosomal Shunting 345

346 Vincent P. Mauro et al.
conservedNdeI andBsrGI restriction sites. This extensive exchange of approx-imately 90% of the rRNA sequences was designed tomaximize the number ofnucleotide differences between the yeast and hybrid 18S rRNAs and thus thenumber of putative mRNA elements that could be analyzed using this system.In addition, this extensive exchange of rRNA sequences was designed tomaintain the higher order interactions of the rRNA as much as possible(Thompson et al., 2001; Fig. 15.3B). The hybrid 18S rRNA contains the 50domain, central domain, and 30 major domain of the mouse 18S rRNA, andthe 30 minor domain (helices 44 and 45) of the yeast 18S rRNA.
Ribosomes generated in this manner were active as judged by variouscriteria including functional assays and their presence in actively translatingpolysomes (Dresios et al., 2006). However, it should be noted that we havenot been able to establish cell lines expressing only the mouse–yeast hybrid18S rRNA using standard plasmid shuffling techniques, suggesting that thehybrid ribosomes alone cannot support viability. In addition, we noted thatlevels of the hybrid rRNA are substantially reduced over time (Fig. 15.3C),making it necessary to perform these studies with cells that are freshlytransformed.
6.1. Procedure
6.1.1. Evaluation of base pairing interactions between mRNAand 18S rRNA
To assess a particular base pairing interaction, NOY908 is transformed withpVM1 or with pNOY353 (wild type). Cultures of NOY908 cells startedfrom a single colony are grown overnight in 2% glucose synthetic medialacking histidine (to select for maintenance of the deleted chromosomalrDNA locus) and leucine (to select for pNOY373) to an optical density of1.0 at 600 nm. Cells (1 ml per transformation) are harvested by centrifuga-tion at 6000g for 5 min at room temperature, washed twice with sterilewater (10 ml), and resuspended in 0.2 ml of Solution A per transformation(10 mMTris–HCl, pH 7.5, 1 mM EDTA, 200 mM lithium acetate [pH 7.5,adjusted with acetic acid]). For higher transformation efficiencies, culturesthat have reached an optical density of 1.0 at 600 nm are diluted to 0.5 infresh synthetic media and grown for another generation (approximately 5 h)before harvesting. Then 50 mg of high-molecular-weight carrier DNA(herring testis or salmon sperm) that has been denatured by boiling for5 min prior to use is added to the cell suspension followed by 1 mg of pVM1,pNOY353, or pNOY353 mutated plasmids. The solution is mixed, sup-plemented with 1.2 ml of Solution B (Solution A plus 40% PEG (3350 or4000)], and incubated at 30 with shaking. Cells are heat shocked at 42 for15 to 30 min and pelleted by centrifugation at 12,000g for 15 sec. Cells areresuspended in 0.2 ml of TE buffer (10 mM Tris–HCl, pH 7.5, 1 mMEDTA), plated on 2% galactose synthetic media lacking tryptophan

Analysis of Ribosomal Shunting 347
(to select for the presence of pVM1) and histidine, and incubated at 30 for 3to 5 days until transformants appear.
To determine whether particular transformants express the mouse–yeasthybrid 18S rRNA (from plasmid pVM1), or the mutated yeast 18S rRNA(from a plasmid derived from pNOY353), single colonies are selected andgrown in 5 ml galactose synthetic media lacking tryptophan and histidine.Cells are harvested at an optical density of 0.8 to 1.0 at 600 nm and theRNA is extracted following the hot phenol method. Briefly, cells are spundown at 6000g for 5 min at 4, washed once with ice-cold water, andresuspended in 0.4 ml TES solution (10 mM Tris–HCl, pH 7.5, 5 mMEDTA, 1% sodium dodecyl sulfate [SDS]). An equal volume of acidicphenol (pH 4.3) is then added and the mixture is vortexed for 10 sec,followed by incubation at 65 for 1 h with gentle agitation. After thisincubation, the mixture is placed on ice for 5 min and centrifuged at12,000g for 5 min at 4. Acidic phenol (0.4 ml) is added to the top(aqueous) phase, the mixture is vortexed for 30 sec, cooled on ice for5 min, and centrifuged at 12,000g for 5 min at 4. The aqueous phase istransferred to a new tube, 0.4 ml of chloroform is added, the mixture isvortexed for 30 sec, and centrifuged at 12,000g for 5 min at 4. Sodiumacetate (pH 5.3) is added to the aqueous phase to a final concentration of 0.3M, followed by 2 volumes of ethanol, and the sample is centrifuged at12,000g at 4 for 10 min. The pellet (total RNA) is washed twice with70% ethanol and resuspended in sterile water. Hybrid 18S rRNA can bedetected by Northern blot analysis of total RNA, e.g., using a 1% agarose-formaldehyde gel transferred to a Nylon membrane, and probed with a 50end-labeled (32P) oligonucleotide probe that is specific to the mouse–yeasthybrid 18S rRNA or to the mutated yeast 18S rRNA.We have successfullyused a probe complementary to nucleotides 775 to 791 of the mouse 18SrRNA to detect the hybrid 18S rRNA (TGAGTGTCCCGCGGGGC).
Quantitative Northern blots can be used to assess the amount of hybridor mutated 18S rRNA relative to the yeast wild-type 18S rRNA. To thisend, the recombinant yeast RNA is resolved alongside various dilutions oftotal mouse or wild-type yeast RNA. Wild-type yeast RNA can beobtained as described above and total mouse RNA can be obtained fromcultured mouse cell lines, e.g., mouse N2a cells. In our studies, we extractedmouse RNA using TRIzol reagent. Northern blots of the recombinantyeast RNA and wild-type yeast or mouse RNAs are probed withrRNA-specific oligonucleotide probes complementary to mouse 18SrRNA at nucleotides 775 to 791 (see above) and the hybridization inten-sities are compared to determine how much mouse RNA gives a signalcomparable to the recombinant yeast RNA. This comparison with themouse rRNA is valid because total yeast RNA contains approximatelythe same amount of 18S rRNA as total mouse RNA based on ethidiumbromide staining (Dresios et al., 2006). In our earlier studies, we showed

348 Vincent P. Mauro et al.
that up to approximately 10% of the 18S rRNA in NOY908-pVM1 cellswas the mouse–yeast hybrid 18S rRNA, and that approximately 5% ofthe 18S rRNA in cells with pVM7, which contains a point mutation ofthe yeast 18S rRNA (Dresios et al., 2006). Although these levels of hybridribosomes were sufficient for our earlier analyses (Chappell et al.,2006a; Dresios et al., 2006), they may be a limitation for some analyses ofmRNA–rRNA base pairing interactions, which have smaller effects ontranslation. An advantage of this system is that it can be used to assessthe effects of mutations in the 18S rRNA that are not compatible withcell viability because cell survival does not depend on the recombinantribosomal subunits.
To confirm that the recombinant 18S rRNA is present in ribosomalsubunits, ribosomes are prepared from yeast cells and tested for its presence.To prepare ribosomes from transformed NOY908 cells, 50 ml cultures aregrown in galactose synthetic media lacking tryptophan and histidine. Cellsare pelleted and resuspended in Homogenization buffer (20 mM Tris–HCl,pH 7.5, 100 mM KCl, 10 mM MgCl2, 2 mM DTT) using 2 to 3 ml ofbuffer per gram of cells, and lysed at 4 using glass beads (0.425 to 0.6 mmdiameter, Sigma). Three to four grams of glass beads are used per milliliter ofcell suspension. Each such lysis is performed in a capped SS34 centrifugetubes (35 ml). The tube is shaken by hand at 4 using a vertical motion ofapproximately 50 cm; it is shaken two times per second for 1 min, thenchilled on ice for 1 min. This shaking procedure is repeated a total of fivetimes. The lysate is centrifuged at 10,000g for 15 min at 4. The superna-tant (postnuclear fraction) is centrifuged at 100,000g for 3 h at 4 to obtaina P100 pellet containing ribosomes and an S100 supernatant. RNA isextracted with TRIzol from these fractions and analyzed on Northernblots using an oligonucleotide probe specific for the recombinant 18SrRNA. The presence of the recombinant rRNA in the P100 fractionsuggests that it is incorporated into ribosomes.
To obtain further evidence that the recombinant 18S rRNAs are presentin active ribosomes, polysome profiles of cells transformed with theserRNAs are performed, followed by RNA isolation and blotting usingrRNA-specific probes. Yeast cultures (50 ml) grown in galactose selectivemedia lacking tryptophan and histidine and treated with cycloheximide(100 mg/ml) at mid-log phase are immediately harvested by centrifugationat 6000g for 5 min at 4. Cells are lysed in SS34 tubes using glass beads anda postnuclear fraction is prepared as described above. The supernatant islayered onto a 10% to 50% (w/w) linear sucrose gradient in Solution C(50 mM Tris acetate, pH 7.5, 50 mM NH4Cl, 12 mM MgCl2) and centri-fuged at 4 for 2.5 h at 260,000g in an SW41 rotor. Gradients arecollected, e.g., by the use of an ISCO fractionator. RNA in each fractionis precipitated with 1/10th volume 5 M ammonium acetate and 2 volumesethanol, extracted with TRIzol, and reprecipitated by the addition of

Analysis of Ribosomal Shunting 349
1/10th volume 3 M sodium acetate (pH 5.3) and 2 volumes of ethanol.Finally, RNA is resuspended in water, and analyzed on Northern blotsusing an oligonucleotide probe specific for the recombinant 18S rRNA.
It should be noted that the doubling time of the NOY908 cells (untrans-formed or transformed with another plasmid expressing either wild-type orrecombinant rRNA) is approximately 5 h (Wai et al., 2000, and unpub-lished observations) compared to wild-type strains containing chromosomalrDNA genes, which divide approximately every 90 min (Chuang et al.,1997; Dong et al., 2004; Yu and Warner, 2001). This delayed growth isreflected in polysome profiles with fewer and smaller polysome peaks thanthose obtained with wild-type strains.
An alternative approach to identify colonies with active ribosomal sub-units containingmouse–yeast hybrid 18S rRNA involves selecting yeast cellsfor their ability to grow on media lacking a specific auxotrophic marker, thetranslation of which requires ribosomes harboring mouse 18S rRNAsequences. Our preliminary studies using this approach indicated that cellstransformedwith a construct expressing aTRP1mRNA,which contains a 50hairpin structure and five Gtx elements, grew only in cells containing themouse–yeast hybrid rRNA. Northern blot analysis of these cells revealedthe presence of the hybrid rRNA in ribosomes (data not shown).
7. Assessing Ribosomal Shunting Mediatedby mRNA–rRNA Base Pairing Interactions
A typical shunting experiment designed to determine whether aputative shunt site functions by an mRNA–rRNA base pairing mechanismcan be performed using constructs containing either a hairpin structure orupstream AUG codon as a shunting obstacle, as described above (also seeChappell et al., 2006a). The key to these studies is to determine whether anintact complementary match between the mRNA element and the 18SrRNA is required for reporter gene activity, which would indicate thatribosomal subunits shunted across the obstacle. Such an analysis involvesshowing that shunting occurs when the match is intact, is disrupted by pointmutations of the 18S rRNA that disrupt complementarity, and is restoredwhen the mRNA element is mutated to restore complementarity.
Depending on the specific mRNA or sequence element under investi-gation, experiments can be performed using constructs that either containor lack a hairpin structure at their 50 ends. In earlier studies, we usedconstructs with 50 hairpin structures to increase the signal-to-noise ratioby reducing the contribution of the cap structure (Chappell et al., 2006a;Dresios et al., 2006). Figure 15.4 shows an analysis of ribosomal recruitmentvia mRNA–rRNA base pairing using reporter mRNAs that lack a hairpinstructure at their 50 ends. The results obtained with these constructs were

Photinus luciferase
Translation efficiency ( 105) in transformedNOY908 cells
pNOY353pVM1Gtx-9nt
0 2 4 6 8 10
Gtx-7nt
Figure 15.4 Assessing ribosomal recruitment via mRNA^rRNA base pairing usingreporter mRNAs that lack a hairpin structure at their 50 ends.Monocistronic constructsare indicated schematically. Gray bars representGtx elements containing either 9-nt or7-nt elements, which are complementary tomouse18S rRNA (Dresios et al.,2006). Con-structs were transformed into strain NOY908 expressing wild-type 18S rRNA(pNOY353; white bar) or hybrid 18S rRNA (pVM1; hatched bar). The data are repre-sented as translation efficiency (luciferase activity per unit mRNA). Horizontal linesrepresent standard deviations.
350 Vincent P. Mauro et al.
comparable to those obtained with reporter mRNAs containing a hairpinstructure at their 50 ends (Dresios et al., 2006) (i.e., cells expressing thehybrid 18S rRNA translated mRNAs containing five copies of the Gtxtranslational enhancer element with a higher relative efficiency than cellsexpressing yeast wild-type 18S rRNA). The only difference is that the effecton translation in this experiment was approximately 3-fold for the 9-ntelement while in the published study it was approximately 160-fold becausethe contribution of the cap was effectively eliminated by the hairpinstructures. It is also interesting that the 3-fold increase in translation effi-ciency is similar to what we had observed in transfected mammalian cellswith these constructs (Chappell et al., 2004).
For such experiments, NOY908 cells harboring either pVM1 orpNOY353 are transformed with hairpin or upstream AUG-containingshunting constructs. In our studies, we have performed these studies usingPhotinus luciferase as the reporter gene, in an expression vector that containsthe Gal1 promoter in the pYES2 vector (further information regarding theconstruction of these vectors can be found in Dresios et al., 2006). Depend-ing on the specifics of the 50 leader and mRNA elements under investiga-tion, such studies can be performed using constructs that either contain astable hairpin structure at their 50 ends to minimize the contribution of the50 cap structure or that lack such a structure, e.g., for a cap-dependentmRNA. Yeast transformed with these constructs are cultured at 30 onsynthetic galactose media lacking tryptophan, histidine, and uracil (to selectfor the pYES2 reporter plasmid). Single colonies are selected and grown in5 ml of the same media until they reach an OD600 reading of 1.0. Cells are
Analysis of Ribosomal Shunting 351
pelleted by centrifugation at 12,000g for 1 min and resuspended in sterilewater. Each suspension is divided into two equal parts: one to test forluciferase activity and the other for RNA analysis. To measure luciferaseactivity, cells are centrifuged at 12,000g for 1 min and resuspended in300 ml of Reporter Lysis buffer (Promega). Suspensions are then transferredto microfuge tubes containing 0.3 g glass beads. Cells are lysed by vortexingthree times for 30 sec at room temperature with 1 min intervals on ice. Thelysed cells are centrifuged at 12,000g for 5 min and 10 to 20 ml of thesupernatant is assayed for luciferase activity as described above. ReportermRNA levels are determined by probing Northern blots with an in vitrotranscribed Photinus luciferase probe. RNA is extracted from transformedyeast using the hot phenol method described earlier and probed as describedabove using a full-length Photinus luciferase probe. Hybridization signals canbe visualized and quantified using various approaches. We have used aStorm 860 PhosphorImager for visualization and ImageQuant software(Molecular Dynamics). It is also possible to quantify mRNA from suchstudies using other methods, including RPAs, which was discussed above,or quantitative RT-PCR (Chappell et al., 2004).
To test whether the activity of a candidate shunt site requires thepresence of an intact complementary match within the hybrid 18S rRNA,both the candidate shunt site and the 18S rRNA can be mutated and theeffects of these point mutations tested in cells. The large size of plasmidpNOY353 makes site-directed mutagenesis difficult. For this reason, wefound it necessary to subclone a smaller fragment of the 18S rDNA into thepBluescript II KS(þ) vector and perform site-directed mutagenesis in thissmaller construct using the Quick-Change II XL kit (Stratagene). In ourstudies, we used a 1045 nucleotide BssHII restriction fragment of the 18SrDNA (nucleotides 485 to 1530), which contained our putative mRNA-binding site. However, depending on the location of the complementarymatch within the 18S rRNA, other restriction fragments may have to besubcloned for mutagenesis. Other unique restriction sites that can be used tosubclone various fragments of the 18S rRNA areNdeI andNcoI, which residenear the 50 end of the 18S rDNA, and EcoRI and BsrGI, which reside near the30 end of the 18S rDNA.ThemutagenizedDNA fragment is then cloned backinto the pNOY353 backbone using the appropriate restriction sites.
8. Considerations in Using the Mouse–YeastHybrid rRNA System
The mouse–yeast hybrid rRNA system described in this chapterdiffers from the yeast wild-type 18S rRNA at 418 out of 1865 nucleotides,and can be used only to test putative base pairing interactions between

352 Vincent P. Mauro et al.
mRNA sequences with complementarity to mammalian but not to yeast18S rRNAs.
To evaluate the levels of hybrid 18S rRNA over time, NOY908-pVM1transformants are selected on galactose synthetic media lacking tryptophanand histidine as described earlier. A single colony is inoculated in liquidmedia lacking the aforementioned biosynthetic markers and the culture isgrown at 30 to an optical density of 1.0 at 600 nm. Of this culture 5 ml isused to extract total yeast RNA, while 50 ml of the same culture is re-inoculated in 5 ml of the same liquid media and grown at 30 to an opticaldensity of 1.0 at 600 nm. This process is repeated several times and thevarious RNAs are analyzed by Northern blot analysis using a mouse-specific18S rRNA probe. As shown in Fig. 15.3C, the amount of hybrid 18SrRNA in NOY908-pVM1 cells declined with time. In addition, recombi-nation between plasmids encoding wild-type and mouse–yeast hybrid 18SrDNA sequences in the NOY908-pVM1 yeast cells may lead to a loss ofDNA fragments encoding 18S rRNA hybrid sequences. Such recombina-tion events may also yield a heterogeneous population of rRNA transcriptsbearing yeast and mouse sequences at different ratios. Recombinationevents of this type cannot yield false-positive results in that the sequenceelements under investigation must be inactive with the wild-type yeast 18SrRNA; however, they may lower the sensitivity of the system.
ACKNOWLEDGMENTS
Funding was provided by the National Institutes of Health (GM61725) and the G. Haroldand Leila Y. Mathers Charitable Foundation to V.P.M., and from the Skaggs Institute forChemical Biology ( J.D., S.A.C.).
REFERENCES
Chappell, S. A., and Mauro, V. P. (2003). The internal ribosome entry site (IRES) containedwithin the RNA-binding motif protein 3 (Rbm3) mRNA is composed of functionallydistinct elements. J. Biol. Chem. 278, 33793–33800.
Chappell, S. A., Edelman, G. M., and Mauro, V. P. (2000). A 9-nt segment of a cellularmRNA can function as an internal ribosome entry site (IRES) and when present inlinked multiple copies greatly enhances IRES activity. Proc. Natl. Acad. Sci. USA 97,1536–1541.
Chappell, S. A., Owens, G. C., and Mauro, V. P. (2001). A 50 leader of Rbm3, a cold-stressinduced mRNA, mediates internal initiation of translation with increased efficiencyunder conditions of mild hypothermia. J. Biol. Chem. 276, 36917–36922.
Chappell, S. A., Edelman, G. M., and Mauro, V. P. (2004). Biochemical and functionalanalysis of a 9-nucleotide RNA sequence that affects translation efficiency in eukaryoticcells. Proc. Natl. Acad. Sci. USA 101, 9590–9594.

Analysis of Ribosomal Shunting 353
Chappell, S. A., Dresios, J., Edelman, G. M., and Mauro, V. P. (2006a). Ribosomalshunting mediated by a translational enhancer element that base pairs to 18S rRNA.Proc. Natl. Acad. Sci. USA 103, 9488–9493.
Chappell, S. A., Edelman, G. M., and Mauro, V. P. (2006b). Ribosomal tethering andclustering as mechanisms for translation initiation. Proc. Natl. Acad. Sci. USA 16, 16.
Chuang, R. Y., Weaver, P. L., Liu, Z., and Chang, T. H. (1997). Requirement of the -DEAD-Box protein ded1p for messenger RNA translation. Science 275, 1468–1471.
Cornelis, S., Bruynooghe, Y., Denecker, G., Van Huffel, S., Tinton, S., and Beyaert, R.(2000). Identification and characterization of a novel cell cycle-regulated internal ribo-some entry site. Mol. Cell 5, 597–605.
Dobson, T., Minic, A., Nielsen, K., Amiott, E., and Krushel, L. (2005). Internal initiation oftranslation of the TrkB mRNA is mediated by multiple regions within the 50 leader.Nucleic Acids Res. 33, 2929–2941.
Dong, J., Lai, R., Nielsen, K., Fekete, C. A., Qiu, H., and Hinnebusch, A. G. (2004). Theessential ATP-binding cassette protein RLI1 functions in translation by promotingpreinitiation complex assembly. J. Biol. Chem. 279, 42157–42168.
Dresios, J., Chappell, S. A., Zhou, W., and Mauro, V. P. (2006). An mRNA–rRNA base-pairing mechanism for translation initiation in eukaryotes. Nat. Struct. Mol. Biol. 13,30–34.
Dubreuil, Y. L., Expert-Bezancon, A., and Favre, A. (1991). Conformation and structuralfluctuations of a 218 nucleotides long rRNA fragment: 4-Thiouridine as an intrinsicphotolabelling probe. Nucleic Acids Res. 19, 3653–3660.
Gingras, A. C., Gygi, S. P., Raught, B., Polakiewicz, R. D., Abraham, R. T.,Hoekstra, M. F., Aebersold, R., and Sonenberg, N. (1999). Regulation of 4E-BP1phosphorylation: A novel two-step mechanism. Genes Dev. 13, 1422–1437.
Hall, K. B., and Kranz, J. K. (1999). Nitrocellulose filter binding for determination ofdissociation constants. Methods Mol. Biol. 118, 105–114.
Hellen, C. U., and Sarnow, P. (2001). Internal ribosome entry sites in eukaryotic mRNAmolecules. Genes Dev. 15, 1593–1612.
Hu, M. C.-Y., Tranque, P., Edelman, G. M., and Mauro, V. P. (1999). rRNA-comple-mentarity in the 50 UTR of mRNA specifying the Gtx homeodomain protein: Evidencethat base-pairing to 18S rRNA affects translational efficiency. Proc. Natl. Acad. Sci. USA96, 1339–1344.
Kapp, L. D., and Lorsch, J. R. (2004). The molecular mechanics of eukaryotic translation.Annu. Rev. Biochem. 73, 657–704.
Keiper, B. D., and Rhoads, R. E. (1997). Cap-independent translation initiation in Xenopusoocytes. Nucleic Acids Res. 25, 395–402.
Kozak, M. (1986). Point mutations define a sequence flanking the AUG initiator codon thatmodulates translation by eukaryotic ribosomes. Cell 44, 283–292.
Kozak, M. (1997). Recognition of AUG and alternative initiator codons is augmented by Gin position þ4 but is not generally affected by the nucleotides in positions þ5 and þ6.EMBO J. 16, 2482–2492.
Kozak, M. (2002). Pushing the limits of the scanning mechanism for initiation of translation.Gene 299, 1–34.
Martineau, Y., Le Bec, C., Monbrun, L., Allo, V., Chiu, I. M., Danos, O., Moine, H.,Prats, H., and Prats, A. C. (2004). Internal ribosome entry site structural motifs conservedamong mammalian fibroblast growth factor 1 alternatively spliced mRNAs. Mol. CellBiol. 24, 7622–7635.
Mauro, V. P., Edelman, G. M., and Zhou, W. (2004). Reevaluation of the conclusion thatIRES-activity reported within the 50 leader of the TIF4631 gene is due to promoteractivity. RNA 10, 895–897.
354 Vincent P. Mauro et al.
Pinkstaff, J. K., Chappell, S. A., Mauro, V. P., Edelman, G. M., and Krushel, L. A. (2001).Internal initiation of translation of five dendritically-localized neuronal mRNAs. Proc.Natl. Acad. Sci. USA 98, 2770–2775.
Ringquist, S., and Gold, L. (1998). Toeprinting assays. Mapping by blocks to reversetranscriptase primer extension. Methods Mol. Biol. 77, 283–295.
Rogers, G. W., Jr., Edelman, G. M., and Mauro, V. P. (2004). Differential utilization ofupstream AUGs in the beta-secretase mRNA suggests that a shunting mechanismregulates translation. Proc. Natl. Acad. Sci. USA 101, 2794–2799.
Stoneley, M., Paulin, F. E. M., Le Quesne, J. P. C., Chappell, S. A., andWillis, A. E. (1998).C-Myc 50 untranslated region contains an internal ribosome entry segment. Oncogene 16,423–428.
Thompson, J., Tapprich, W. E., Munger, C., and Dahlberg, A. E. (2001). Staphylococcusaureus domain V functions in Escherichia coli ribosomes provided a conserved interactionwith domain IV is restored. RNA 7, 1076–1083.
Tranque, P., Hu, M. C.-Y., Edelman, G. M., and Mauro, V. P. (1998). rRNA comple-mentarity within mRNAs: A possible basis for mRNA-ribosome interactions and trans-lational control. Proc. Natl. Acad. Sci. USA 95, 12238–12243.
Vagner, S., Galy, B., and Pyronnet, S. (2001). Irresistible IRES: Attracting the translationmachinery to internal ribosome entry sites. EMBO Rep. 2, 893–898.
Wai, H. H., Vu, L., Oakes, M., and Nomura, M. (2000). Complete deletion of yeastchromosomal rDNA repeats and integration of a new rDNA repeat: Use of rDNAdeletion strains for functional analysis of rDNA promoter elements in vivo. Nucleic AcidsRes. 28, 3524–3534.
Woodbury, C. P., Jr., and von Hippel, P. H. (1983). On the determination of deoxyribo-nucleic acid-protein interaction parameters using the nitrocellulose filter-binding assay.Biochemistry 22, 4730–4737.
Xi, Q., Cuesta, R., and Schneider, R. J. (2004). Tethering of eIF4G to adenoviral mRNAsby viral 100k protein drives ribosome shunting. Genes Dev. 18, 1997–2009.
Xi, Q., Cuesta, R., and Schneider, R. J. (2005). Regulation of translation by ribosomeshunting through phosphotyrosine-dependent coupling of adenovirus protein 100k toviral mRNAs. J. Virol. 79, 5676–5683.
Yu, X., and Warner, J. R. (2001). Expression of a micro-protein. J. Biol. Chem. 276,33821–33825.
Zang, W.-Q., and Romaniuk, P. J. (1995). Characterization of the 5 S RNA bindingactivity of Xenopus zinc finger protein p43. J. Mol. Biol. 245, 549–558.
Zhou, W., Edelman, G. M., and Mauro, V. P. (2001). Transcript leader regions of twoSaccharomyces cerevisiae mRNAs contain internal ribosome entry sites that function inliving cells. Proc. Natl. Acad. Sci. USA 98, 1531–1536.
Zuker, M., Mathews, D. H., and Turner, D. H. (1999). Algorithms and thermodynamics forRNA secondary structure prediction: A practical guide. In ‘‘In RNA Biochemistry andBiotechnology’’ ( J. Barciszewski and B. F. C. Clark, eds.), pp. 11–43. Kluwer AcademicPublishers, Amsterdam.

Author Index
A
Aamodt, E. J., 263, 264, 266, 267, 270, 273, 275,276, 277, 278, 291
Abergel, C., 270Abraham, R. T., 327Abrams, J., 280Abreo, F., 267Accornero, N., 307Acker, M. G., 15, 16, 85, 164, 184, 185, 186, 187,
191, 195Adam, S. A., 264, 285Adami, G. R., 142Adams, M. D., 228, 236Aebersold, R., 327Aebi, M., 128Aggarwal, A. K., 307Agol, V. I., 55, 58, 84, 85Akhmaloka, 222Algire, M. A., 84, 85, 120, 125, 164, 185, 191Allo, V., 333Altman, M., 10Altmann, M., 37, 116, 117, 280, 285, 289Amanatides, P. G., 228Amiott, E., 332Amiri, A., 267, 274, 275, 277Amrani, N., 203, 204, 213, 220, 221, 222, 305Anand, M., 129Anderson, C. W., 204Anderson, J., 117, 118, 141, 145, 147, 164,
166, 167Anderson, P., 220Andino, R., 77Ando, I., 234Andrews, N. C., 315Andrieu, J., 286Anthony, D. D., 13, 14, 15, 18, 100Applefield, D. J., 118, 126Arefin, M. S., 126, 184, 185, 186, 187, 195, 196Armknecht, S., 237, 238Armstrong, C. M., 291Artus, C. G., 305, 306, 307, 310, 314Asano, K., 85, 105, 107, 109, 117, 118, 119, 120,
124, 125, 126, 128, 130, 139, 140, 141, 143,145, 147, 150, 155, 164, 165, 166, 167, 169,185, 191
Ashburner, M., 238Ashfield, T., 45Asling, B., 235
Audic, S., 270Aviv, H., 54, 58
B
Bachler, M., 86Bailey, M., 71Bailey-Serres, J., 274, 275, 276, 292, 293Balachandran, S., 244Balasta, M. L., 37, 38, 42, 47, 49Ballantyne, S., 311, 317Baltimore, D., 58, 61, 62Bandyopadhyay, A., 164Bandyopadhyay, S., 244Barber, G. N., 109, 244Barford, D., 222Barmchi, M. P., 233Barnes, C. A., 116Baron, J., 303, 305, 312Baron-Benhamou, J., 304, 312Barreau, C., 317Bartel, D. P., 24, 25, 244Bartel, P. L., 141, 142, 145Bartenschlager, R., 67, 68, 78Barth-Baus, D., 1Barton, D. J., 55, 56, 64, 76, 77Barton, G. J., 269Barton, H. A., 304Basak, S., 264Basler, K., 232Baumann, U., 116, 117BDGP Gene Disruption Project, 230, 231Beach, D. L., 303, 315Beal, P. A., 15Beane, W., 264Beaton, A., 230, 231Becker, P. B., 24, 31Beckmann, K., 24, 310, 313Bedwell, D. M., 220, 221, 222Behm-Ansmant, I., 314Behrens, S. E., 244Belawat, P., 232Belk, J., 204, 220Belle, R., 264Bellen, H. J., 229, 233Bellon, B., 291Belsham, G. J., 15, 58Belvin, M., 233Bendahmane, A., 271, 279
355

356 Author Index
Bendixen, C., 143Benne, R., 13, 17, 85Benz, J., 116, 117Bernal, A., 234Bernard, R., 244Berset, C., 285Bertin, N., 291Bertrand, E., 303, 307, 316Beverley Osborne, H., 317Beyaert, R., 334Bhasker, C. R., 15Bidou, L., 220Bieck, E., 67Birnbaum, M. J., 228, 232Bitterman, P. B., 267Black, E. P., 56Blakely, S. A., 118, 126Blanc, A., 37Blanchard, J. M., 307Blobel, G., 67, 204Bloom, K., 303, 315Blum, H. E., 67Blumenthal, T., 264, 266, 270, 273, 276, 277, 278Boehm, M., 304Boehringer, D., 85Boeke, J. D., 110, 114, 156, 187, 188Boelens, W. C., 304Bogart, K. P., 233Boghaert, E. R., 267Bohm, G., 288Boime, I., 54, 58Bolger, G., 71Bomford, A., 304Bonetti, B., 221Bonneau, P., 71Bonner, J. J., 234Bonner, W. M., 64Bordeleau, M. E., 15Bordeleau, W. M., 58Borden, K. L., 264, 284, 285, 286Bork, P., 314Borson, N. D., 252Borsook, H., 2Borukhov, S. I., 84, 85, 98, 99, 102, 165Bose, S. K., 244Boulay, K., 303, 311, 315Boutros, M., 237, 238Boxem, M., 291Bracht, J., 314Bradham, C., 264Brady, J. N., 147Brand, A. H., 229Brass, V., 67Brault, M., 71Braun, R. E., 244Brazas, R., 247Bredenbeek, P., 102Breeden, L., 143
Brendler, T., 12Breuer, S., 232Brock, G., 244Brodsky, A. S., 303Brown, A. H., 220Brown, P. O., 11Browning, K. S., 37, 38, 42, 43, 44, 45, 47, 49,
272, 275, 278, 279, 282, 286, 290Brown-Luedi, M. L., 13, 17, 85Bruynooghe, Y., 334Bruzik, J. P., 303Buaas, F. W., 244Buchholz, R., 230, 231, 233Bukh, J., 68Burge, C. B., 244, 303Burke, D., 209Burley, S. K., 126, 184, 185, 186, 187, 195, 196,
263, 271Burness, A. T., 58Burns, J., 285, 290Burton, D. R., 78Bushell, M., 37, 172
C
Caceres, J. F., 310, 313Cameron, A., 263, 267, 274, 275, 281, 284,
288, 289Cameron, D. R., 71Camilleri, C., 263, 274Camonis, J., 286, 290Camus, E., 245Candresse, T., 271, 279Cao, C., 185, 186, 198Capdevila, J., 232Caranta, C., 271, 275, 278, 279Carberry, S. E., 272, 273Carey, J., 303Carlill, R. D., 12Carlson, C. B., 15Carlson, J. W., 233Caron, D. J., 244Carrera, P., 234, 235Carriere, C., 307Carrington, J. C., 48Carter, M. S., 11Carter, P., 267Carthew, R. W., 236Casanova, J., 234, 235Cashel, M., 208Castagnetti, S., 24Castilho-Valavicius, B., 107Celniker, S. E., 228Cesareni, G., 117Chakrabarti, A., 99Chakraburtty, K., 129Chan, J., 15Chan, S. K., 267

Author Index 357
Chang, T. H., 349Chappell, S. A., 323, 326, 327, 332, 333, 334,
335, 337, 338, 340, 344, 345, 348, 349,350, 351
Chard, L. S., 15, 58Chartrand, P., 303, 307, 311, 315, 316Chatel-Chaix, L., 303, 311, 315Chaudhry, Y., 286Chaudhuri, J., 99Chekulaeva, M., 24Chen, C. Y., 305, 317Chen, J. J., 109Chen, L., 244Chen, R.-H., 117Chernovskaya, T. V., 68Chervenak, R. P., 267Chesneau, A., 291Cheung, L. M., 230, 231, 233Cheung, R. C., 72, 73, 78Cheung, Y.-N., 120, 125Chiang, L., 267Chicoine, J. D., 228, 233, 234, 267, 277, 284, 285Chien, C. T., 141, 142, 145Chiu, I. M., 333Chiu, Y. H., 230Cho, P. F., 228, 233, 234, 267, 277, 284, 285Cho, Y. H., 244Choi, S. K., 85, 95, 98, 99, 100, 185, 190,
195, 196Cho-Park, I. B., 228, 233, 234, 267, 277,
284, 285Cho-Park, Y. A., 228, 233, 234, 267, 277,
284, 285Chou, C. F., 305, 317Chou, T. B., 235Choudary, P. V., 257Chroboczek, J., 286Chu, W. M., 257Chuang, R. Y., 349Cigan, A. M., 109, 118, 121Clamp, M., 269Clark, I. E., 24Claverie, J.-M., 270Clayton, J., 118, 130, 141, 147, 165, 166,
167, 169Clemens, M. J., 37Cohen, N., 54, 264, 284, 285, 286Cohen, S. M., 234Coller, J. M., 299, 301, 303, 305, 307, 309,
310, 312Collier, B., 303, 317Collins, R. T., 234Combe, J., 277, 278Condeelis, J., 311, 315Conway, T. W., 99Cook, K. R., 233Cooke, H. J., 303, 317Corey, D., 280
Cormier, P., 264Cornelis, S., 334Corona, D. F., 24, 31Corthesy, B., 244Cosentino, G. P., 285Cosson, B., 264Costa-Mattioli, M., 64, 76, 77Crouch, D., 126Cuesta, R., 342Cuff, J., 269Cui, L., 220Cui, Y., 118Culbertson, M. R., 220Culjkovic, B., 264, 284, 285Cullin, C., 10Cunniff, J., 230Curtis, C., 109, 118, 120, 124, 126, 128Czaplinski, K., 220
D
Dadlez, M., 263Dahlberg, A. E., 345Danos, O., 333Dar, A. C., 185, 198Daram, P., 232Darzynkiewicz, E., 5, 30, 263, 266, 270, 271, 272,
273, 274, 276, 282Das, A. K., 222Das, K., 99Das, S., 99Date, T., 68, 78Davis, R. E., 270, 274, 282Davis, R. H., 208Dawson, D., 209Deal, J. E., 233Deal-Herr, M. E., 233Deasy, C. L., 2De Benedetti, A., 267DeFatta, R. J., 267De Gregorio, E., 303, 304, 305, 312de la Cruz, A. F., 232del Corral, R. D., 289Demsky, M., 230, 231, 233Denaevsky, Y. E., 221Denecker, G., 334Denoulet, P., 244Derynck, R., 117Deschenes, R. J., 119, 191de Serres, F. J., 208DesGroseillers, L., 303, 305, 311, 315Deshmukh, M., 37Deshpande, A. M., 264, 266, 270, 273, 276,
277, 278Dever, T. E., 85, 95, 98, 99, 100, 106, 107, 109,
118, 126, 140, 183, 184, 185, 186, 187, 190,195, 196, 198
Dey, M., 185, 198
358 Author Index
Dickson, B. J., 235Dickson, K. S., 303, 305, 307, 310, 311, 312, 317Diffley, J. F., 176Dinkova, T. D., 261, 267, 274, 275, 276, 277,
278, 291, 292Dinman, J. D., 118Disteche, C., 244Dmitriev, S. E., 221Do, F., 71Dobson, T., 332Doerks, T., 314Dohmen, R. J., 176Dominguez, D., 116, 117Dompe, N. A., 230, 231, 233Donahue, T. D., 118Donahue, T. F., 15, 85, 107, 109, 120, 121, 150,
166, 167Dong, J., 349Dong, S., 220, 221, 222, 305Donia, M., 15Dorn, R., 234Dorner, A. J., 76Dostie, J., 264, 285Doudna, J. A., 85, 98, 172Dresios, J., 323, 327, 335, 337, 338, 340, 344,
345, 348, 349, 350, 351Drewes, L. R., 252Dreyfuss, G., 76Du, M., 220Dubisson, J., 72, 73, 78Dublet, B., 286Dubrana, M.-P., 271, 279Dubreuil, Y. L., 343Duchange, N., 245Dudock, B. S., 204Dugre-Brisson, S., 303, 311, 315Duke, G. M., 55Duncan, C., 234Duprat, A., 275, 278, 279Duprey, E., 76Dusek, Z., 166Dussault, M., 271, 279Dwyer, D. S., 271Dyer, J. R., 263Dynlacht, B. D., 166
E
Easton, L. E., 85, 86, 87, 90, 92, 93, 95, 97, 98,99, 101, 102
Eckmann, C. R., 317Edde, B., 244Edelhoff, S., 244Edelman, G. M., 326, 327, 331, 333, 335, 337,
338, 340, 342, 343, 344, 348, 349, 350, 351Edgar, B. A., 228, 231, 232Eisele-Walter, S., 45Eisen, M. B., 11
Eisenstein, R. S., 304Ekker, S., 280El Amrani, A., 286, 290Elledge, S. J., 142Ellis, M. C., 232Elvira, G., 303, 311, 315Emerson, S. U., 68Ephrussi, A., 24Erickson, A. H., 204Erickson, F. L., 118Erme, S. M., 244Erni, B., 13Estevez, Y., 287Evans, C. A., 228Evans, D. R., 222Evans, D. R. H., 116Evans, M. J., 78Evans-Holm, M., 233Expert-Bezancon, A., 343Eyers, S., 271, 279
F
Fahrenkrug, S. C., 263, 264, 266, 267, 275, 276,281, 284, 288, 289
Fan, Y., 267, 274, 275, 277Fang, P., 204, 207, 218, 220Farabaugh, P., 220Fata-Hartley, C. L., 76, 77Favre, A., 343Favre, D., 271Fawcett, R., 230, 231, 233Feder, J. N., 37Fekete, C. A., 84, 98, 118, 120, 125, 126, 141,
164, 172, 185, 349Feng, L., 109, 118Ferraiulol, M., 264, 285Fields, S., 141, 142, 145Fierro-Monti, I., 244, 285, 290Filipowicz, W., 305, 306, 307, 310, 314Fink, G. R., 110, 114, 143, 156, 188Finoux, A. L., 303, 304, 305Flanegan, J. B., 55, 56, 64, 76, 77Fletcher, C. M., 263Fletcher, S. P., 66, 85Ford, R., 244Francis-Lang, H. L., 230, 231, 233Franzusoff, A., 190, 204, 207Fraser, C. S., 85, 98, 172Freed, D. D., 48Freeman, B., 128Freire, M., 263, 274, 286, 290Frese, M., 67Freudenreich, D., 24Friebe, P., 67Friedland, D. E., 272Friedman, C. C., 270, 274, 282Fringer, J. M., 185
Author Index 359
Fritsch, E. F., 39, 58, 60, 64, 65, 69, 171Fu, L. W., 221Fukada, Y., 110Fukuhara, S., 263Furic, L., 303, 305, 311, 315Furusaka, A., 68Furuyama, S., 303Fusco, D., 307Fyrberg, E. A., 238
G
Gaba, A., 204, 208, 218, 219, 220Galle, R. F., 228Gallie, D. R., 35, 36, 37, 38, 39, 42, 43, 44, 45,
47, 48, 49, 282Gallois, J.-L., 271, 279Galloni, M., 228, 231Galy, B., 324Gamberi, C., 228, 285Gan, W., 263, 282Ganesan, R., 204, 213, 220, 221, 222, 305Gangloff, S., 143Gao, H. Q., 15Gao, L., 220Gao, Z., 271, 279Garceau, P., 15Garcia-Barrio, M. T., 126Garcia-Blanco, M. A., 247Gasmi, L., 244Gatfield, D., 234, 314Gavis, E. R., 24Ge, H., 291Geballe, A. P., 11, 12, 211Gebauer, F., 23, 24, 31Gehring, N. H., 304, 312Gelbart, W. M., 234Gene Disruption Project, 230, 231George, R. A., 228Gerace, L., 257German-Retana, S., 271, 279, 287Gerondopoulos, A., 286Gherzi, R., 305, 317Ghosh, R., 99Ghosh, S., 213, 220, 221, 222, 305Giachetti, C., 56Gietz, R. D., 110, 142Gingras, A.-C., 57, 58, 64, 76, 77, 263, 271,
285, 327Ginzburg, I., 244Gioldasi, I., 286Glazer, E., 78Gocayne, J. D., 228Godefroy-Colburn, T., 12, 13Godfrey, W. R., 244Gold, L., 18, 94, 344Goldberg, D. S., 291Goldstein, E. S., 234
Goldstein, J., 166Goldstein, L. S. B., 238Golic, K. G., 235, 238Golub, T., 267Gomez, E., 85, 118, 119, 167Goodfellow, I., 286Gooding, C., 303Gorbalenya, A. E., 55Gorgoni, B., 303, 317Gorlich, D., 263Gosert, R., 67Goss, D. J., 37, 38, 42, 47, 49, 272, 273, 282, 287Goudreau, N., 71Goyer, C., 37Grabowski, G. A., 244Gradi, A., 37Graff, J. R., 267Gramstad, G. D., 234Granier, F., 286, 290Grant, C. M., 126Grant, D., 233Grassmann, C. W., 244Gray, N. K., 303, 305, 307, 309, 310, 311, 312,
313, 317Green, M. R., 303Greenberg, H. B., 72, 73, 78Greenberg, J. R., 141, 147, 164, 166, 167Greenspan, R. J., 233, 238Grellscheid, S. N., 303Grosse, F., 244Grskovic, M., 24Gryczynski, Z., 84, 98, 120, 185Grzela, R., 286Gu, W., 303, 311, 315Guenier, A. S., 15Guerrero, I., 232Guest, S., 234Gumport, R. I., 248Gunderson, S. I., 304Guo, W., 244Guttman, N., 62Gygi, S. P., 327
H
Haas, S. A., 237Habermann, A., 68, 78Hacker, U., 233Hafen, E., 232Haggensmit, A. J., 2Haghighat, A., 15, 285Hahn, H., 57, 58Hall, K. B., 342Hall, M. N., 285Hall, N. S., 109, 118, 120, 124, 126, 128, 155Halmos, T., 71Han, J.-D., 291Hanachi, P., 117

360 Author Index
Hanamm, M. T., 15Hanecak, R., 76Hanic-Joyce, P. J., 116Hannig, E. M., 15, 85, 107, 109, 118, 120, 121,
124, 126, 128, 150, 155, 167Hansen, L. J., 282Hanyu-Nakamura, K., 234, 285Hao, T., 291Harper, J. W., 142Harrington, T., 263, 266, 273, 276Hartz, D., 18, 94Harvey, I., 15Hasek, J., 117, 118, 172Hasler, J., 257Hatin, I., 220Hawley, R. S., 238Hay, B. A., 232Hayashi, N., 257He, F., 220, 221, 222, 305He, H., 109, 118, 147He, Y., 233Hellen, C. U., 18, 66, 84, 85, 86, 94, 95, 98, 99,
100, 102, 107, 140, 165, 172, 174, 185, 195,196, 221, 324
Helliwell, S. B., 285Hemmings, B. A., 222Hentze, M. W., 23, 24, 31, 84, 85, 303, 304, 305,
312, 315Herdy, B., 64, 76, 77Hernandez, G., 24, 266, 269, 281, 289Herold, J., 77Hershey, J. W., 85, 172Hershey, J. W. B., 11, 13, 17, 85, 117, 147,
164, 165Hess, D., 244Hiesinger, P. R., 233Higa, T., 15, 58Higgins, D. R., 187Hild, M., 237Hinnebusch, A. G., 11, 85, 107, 109, 116, 117,
118, 119, 120, 125, 126, 128, 129, 130, 140,141, 143, 145, 147, 150, 163, 164, 165, 166,167, 169, 170, 171, 172, 173, 174, 175, 177,178, 185, 191, 349
Hiramoto, J., 68Hiremath, L. S., 282Hoekstra, M. F., 327Hoffmann, S., 304Holt, R. A., 228Hood, H. M., 218Hood, L., 275Hooshmand, F., 307Hope, I. A., 301Horn, C., 233Horn, F., 291Hoskins, R. A., 228, 233Houghton, M., 78Hradec, J., 166
Hsu, C., 264Hsu, H. H., 72, 73, 78Hu, H., 244Hu, M. C.-Y., 342, 343Huang, H., 107, 120, 121Huang, H. K., 15, 85, 150, 167Huang, W.-I., 282Hudson, S. G., 234Huetter, R., 110, 128Hui, D. J., 15Hunt, T., 2, 76, 204Hunter, S., 314Huppert, K., 233Hynes, R. O., 78
I
Ii, M., 109, 118Iizuka, N., 66, 190, 204, 207Imataka, H., 37, 77, 78Imperial, M., 234Imre, E. M., 117Inagaki, S., 237Inchauspe, G., 102Ishida, T., 263Isken, O., 244Ito, H., 110Izaurralde, E., 234, 313, 314
J
Jackle, H., 234, 235Jackson, B. M., 107, 128Jackson, R. J., 2, 54, 55, 66, 68, 76, 85, 204Jackson, V., 166Jacobs, B. L., 250Jacobson, A., 76, 203, 204, 208, 213, 218, 219,
220, 221, 222, 305Jacobson, E. M., 307Jacq, B., 291Jaenicke, R., 288Jagus, R., 261, 263, 264, 266, 267, 269, 270, 274,
275, 276, 280, 281, 282, 284, 288, 289, 290Jang, S. K., 55Jankowska-Anyszka, M., 263, 264, 266, 270, 271,
272, 273, 274, 276, 277, 278, 282Jankowsky, E., 15Janody, F., 291Jansen, E. J., 304Jensen, O., 285, 290Jentsch, T. J., 75Jepsen, K., 307Jeske, M., 24Ji, H., 85, 98Jivotovskaya, A., 118, 126, 164, 165, 167, 169,
170, 171, 172, 173, 174, 175, 177, 178Johannes, G., 11Johansen, E., 271, 279Johnston, G. C., 116

Author Index 361
Johnston, L. A., 232Johnstone, O., 228, 234, 235Jones, E. W., 119Jones, K. M., 220Joshi, B., 263, 264, 266, 267, 269, 270, 274, 275,
276, 280, 281, 282, 284, 288, 289, 290Joshi-Barve, S., 263, 267Jurecic, V., 244
K
Kadyk, L. C., 317Kaenjak-Angeletti, A., 220Kageyama, Y., 237Kalbacher, B., 208Kann, M., 244Kao, P. N., 244, 250Kapp, L. D., 84, 93, 262, 326Kapp, R. F., 15, 16Kappes, J., 305, 317Karin, M., 244Kassem, M., 285, 290Kato, T., 68, 78Katze, M. G., 109Kaufman, R. J., 15, 16, 78Kawagishi-Kobayashi, M., 109, 126Kawaguchi, R., 275, 292, 293Kawasaki, I., 267, 274, 275, 277Kazachkov, Y. A., 55Kazemi, S., 15, 16Keaser, C., 270, 271, 273, 274Keegan, L., 301Keeling, K. M., 220Keene, J. D., 258Keighley, G., 2Keilty, A., 234Keiper, B. D., 263, 264, 266, 267, 270, 271, 273,
274, 275, 276, 277, 278, 282, 291, 327Kenan, D. J., 258Kenny, J., 244Kentsis, A., 264, 286Kerr, I. M., 54, 58Kerr, K., 237Kervestin, S., 213, 220, 221, 222, 305Keyomarsi, K., 142Khaleghpour, K., 232Khan, M. A., 287Khan, S. N., 15, 16Kiger, A., 237, 238Kildsgaard, J., 196Kim, E. K., 234Kim, H. C., 271Kim, J. R., 184, 186, 187Kim, S. S., 244Kim, Y. K., 303, 305, 311, 315Kimble, J., 311, 317Kimbrell, D. A., 234Kimura, A., 110
Kinzy, T. G., 118, 129Kirkegaard, K., 56Kirsch, L., 234Kislig, E., 116Kiss, I., 233Kitamura, K., 263Klaassen, E. C., 257Kobayashi, M., 45Kobayashi, R., 244Kobayashi, T., 78Koch, B., 237Kohara, Y., 267, 274, 275, 277Kolitz, S., 15, 16Kolupaeva, V. G., 18, 84, 85, 165, 172, 174Komar, A. A., 10Kondo, T., 237Korneeva, N. L., 267, 275, 276, 277, 278, 291Korner, A., 54Koromoilas, A. E., 15, 16Kozak, M., 2, 19, 221, 335, 337, 338, 339Kranz, J. K., 342Krausslich, H. G., 55, 68, 78Krishnamoorthy, T., 85, 119, 125, 126, 141, 143,
150, 167Krol, A., 257Kruh, J., 2Kruse, D. S., 109, 118, 120, 124, 126, 128Krushel, L., 327, 332Kuhlow, C., 272, 282Kukolj, G., 71Kulozik, A. E., 304, 312Kumar, R., 15Kushnirov, V. V., 220Kwak, J. E., 311, 317
L
LaBell, A. A., 234Labib, K., 176Labrie, L., 286Lachance, P. E., 228, 231, 232LaCroute, F., 114, 156Laemmli, U. K., 39, 159Lagace, L., 71Lai, R., 349Laliberte, J., 286Lall, S., 270, 274, 282Lamarre, D., 71Lamphear, B. J., 263, 264, 266, 270, 272, 273,
276, 277, 278Lander, E., 267Langland, J. O., 250Lanier, J., 220LaPlante, S. R., 71Larcher, J. C., 244La Scola, B., 270Lasda, E., 247Lashkevich, V. A., 68
362 Author Index
Lasko, P., 227, 228, 231, 232, 233, 234, 235, 267,277, 284, 285
Lauer, S. J., 42Laverty, T., 230, 231, 233Lavoie, B., 307Lawrence, C. W., 110Lawrence, D. S., 311, 315Lax, S. R., 42Lazaris-Karatzas, A., 267Lazzarini, R. A., 208Le, H., 37, 38, 42, 45, 47, 48, 49Leary, J., 85, 98Leathers, V., 45, 48Le Bec, C., 333Leder, P., 54, 58Lee, B., 105Lee, B. S., 220Lee, C. G., 244Lee, H. S., 37Lee, J. H., 85, 95, 98, 99, 100, 185, 190, 195, 196Lee, J. Y., 172Lee, K., 244, 264, 266, 269, 270, 281Lee, S. G., 244Lee, S. I., 220Lee, Y. S., 236Leeds, P., 220Lefstin, J. A., 307LeGall, O., 271, 279Le Gall, O., 287Legrain, P., 291Le Hir, H., 313Lehmann, R., 24, 25Leicht, B. G., 234Leidal, A. M., 228Lemon, S., 102Leonova, T., 244Le Quesne, J. P. C., 326Lesage, M., 271, 279Lesnik, T., 10Levis, R. W., 233Lewis, B. P., 244Lewis, J. D., 85Lewis, S. E., 228Lewkorowicz, M., 270, 271, 273, 274Li, B., 109, 118, 267Li, C., 220, 221, 222, 305Li, H., 244, 263Li, L., 281Li, N., 291Li, P. W., 228Li, S., 291Li, T. H., 257Li, Y., 267Liang, T. J., 68, 78Liao, G., 233Liao, H. J., 244Lie, Y. S., 24, 25Lilie, H., 288
Lim, H., 244Lin, A., 245Lin, C., 78Lin, E., 245Lin, S. W., 245Lin, W. J., 305, 317Lindenbach, B. D., 67, 78Linder, P., 118Lindqvist, L., 15, 58Ling, J., 37Lipmann, F., 99Liu, C. C., 78Liu, L., 267Liu, W. M., 257Liu, Z., 349Llinas-Brunet, M., 71Locker, N., 83, 85, 86, 87, 90, 92, 93, 95, 97, 98,
99, 101, 102Lodish, H. F., 58, 61, 62Lohmann, V., 67Lomakin, I. B., 84, 85, 95, 98, 99, 100, 172, 174,
185, 195, 196Lon, P., 150London, I. M., 109Long, R. M., 303, 307, 311, 315, 316Lopez-Lastra, M., 55, 67, 68, 69, 71, 72, 73,
75, 78Lorimer, E., 303, 311, 315Lorsch, J. R., 15, 16, 84, 93, 98, 107, 118, 120,
125, 126, 140, 164, 184, 185, 186, 187, 191,195, 196, 262, 326
Loveridge, C., 303, 317Lowary, P. T., 303Lowy, P. H., 2Lucas, W. J., 37Lukavsky, P. J., 83, 85, 86, 87, 90, 92, 93, 95, 97,
98, 99, 101, 102Lunyak, V., 307Lyapustin, V. N., 68Lykke-Andersen, J., 303, 305, 307, 310, 313
M
Maag, D., 84, 85, 98, 120, 125, 126, 164, 184,185, 186, 187, 191, 195, 196
Macdonald, P. M., 24, 25Macreadie, I. G., 117Maderazo, A. B., 220Maeder, D., 264, 266, 269, 270, 281Maia, D. M., 42Maile, R., 232Maisonneuve, B., 271, 279Maitra, S., 305, 317Maitra, U., 99, 164Majumdar, R., 164Mak, P., 263Malec, J., 58Maley, F., 73

Author Index 363
Malina, A., 15Manfruelli, P., 234Mangus, D. A., 213, 220, 221, 222, 305Maniatis, T., 39, 58, 60, 64, 65, 69, 171Manivasakam, P., 142Manjunath, S., 274, 276Maquat, L. E., 303, 305, 311, 313, 315Maraia, R., 170, 257Marcotrigiano, J., 263, 271Marintchev, A., 109, 155Maroto, F. G., 24Marques, J., 278Marquis, M., 71Marshall, T. K., 119, 191Martin, E. M., 58Martineau, Y., 333Marton, M. J., 107, 126, 129Maruyama, T., 78Marx, G., 166Masiarz, F., 78Masutani, M., 77Mathew, A. A., 116, 174Mathews, D. H., 326Mathews, M., 54, 243, 244, 246, 251Mathey-Prevot, B., 234, 238Matlin, A., 303Matsumoto-Taniura, N., 257Matsuo, H., 263Mattaj, I. W., 263, 304Matthews, J., 15Matthiesen, R., 285, 290Maule, A., 271, 279Maurice, R., 71Mauro, V. P., 323, 326, 327, 331, 332, 333, 334,
335, 337, 338, 340, 342, 343, 344, 345, 348,349, 350, 351
Mayeda, A., 244Mayeur, G. L., 172Mazden, N., 230, 231Mazier, M., 271, 279McCarthy, J. E. G., 109, 118, 264McCourt, D. W., 78McDowell, M., 58, 61McGlincy, N., 303McGuire, A. M., 263McIntosh, J. R., 248McKeating, J. A., 78McKendrick, L., 281, 282McKercher, G., 71McPheeters, D. S., 18, 94Melton, D. A., 37Menand, B., 275, 278, 279Merrick, W. C., 1, 4, 10, 11, 13, 14, 15, 16, 17,
18, 84, 85, 93, 100, 164, 165, 185, 190, 221Messenguy, F., 143Methot, N., 15Metz, A. M., 37, 38, 42, 47, 49Meulewaeter, F., 277, 278
Meyer, M. R., 107Meyer, S., 24Michaels, R., 244Michon, T., 287Mikami, S., 77, 78Milash, B., 230, 231, 233Mili, S., 244Miller, J. H., 142Milstein, S., 291Minic, A., 332Minshall, N., 303, 307, 310, 314, 317Miozzari, G., 110Miron, M., 228, 231, 232Misra, S., 230, 231Mitchell, D. A., 119, 191Mitchell, S. F., 120, 125Miura, K., 263Miyagawa, H., 263Miyamoto, M., 68, 78Miyazaki, W. Y., 230, 231, 233Miyoshi, H., 271, 286, 287Mizokami, M., 68, 78Mohammad, S. S., 119, 128Mohammed, S., 285, 290Mohr, E., 291Mohr, S. E., 234Moine, H., 333Molla, A., 55, 76Monbrun, L., 333Monroe, R., 257Montine, K. S., 267Moon, J., 221Moore, M. J., 313Moradpour, D., 67Morales, J., 264Morasco, B. J., 55, 56, 64, 76, 77Morawietz, H., 234Moreno, J. M., 196Mori, A., 15, 58Morin, E., 264Morino, S., 37, 263Moritz, M., 171, 178Morley, S. J., 37, 281, 282Morris, D. R., 275Morris, N. R., 230Mortensen, K. K., 196Mouland, A. J., 303, 311, 315Moury, B., 271, 279Muckenthaler, M. U., 315Mueller, P. P., 126Mugnier, P., 222Muhlrad, D., 307Mulky, A., 305, 317Muller, P. P., 280Mullins, J. M., 248Mulner-Lorillon, O., 264Munakata, H., 257Mundry, K. W., 45

364 Author Index
Munger, C., 345Munro, H. N., 304Munroe, D., 76Murata, K., 110Murray, E. L., 264Murray, J. A. H., 117Murthy, K., 68, 78Muto, S., 286, 287
N
Nagayama, K., 68Najita, L., 190, 204, 207Nakamura, A., 234, 235, 285Namy, O., 220Nar, H., 71Nasevicius, A., 280Nasmyth, K., 143Natarajan, K., 107Nathan, C., 267Natoni, A., 286Natsoulis, G., 110, 114, 156, 188Natsuaki, T., 286, 287Neff, C. L., 117Neilsen, K. H., 164, 169, 170, 171, 174, 178Nelson, M. R., 228Neufeld, T. P., 232Newsome, T. P., 235Ng, J., 244Nguyen, N., 15Nicaise, V., 271, 279Nicklin, M. J., 55Niederberger, P., 110, 128Niedzwiecka, A., 263Nielsen, K., 166, 332, 349Nielsen, K. H., 85, 116, 118, 126, 141, 163, 164,
165, 167, 169, 170, 171, 172, 173, 174, 175,177, 185, 191
Nielsen, P. J., 147Niepel, M., 37, 48Nika, J., 85, 150, 167Niranjanakumari, S., 247Noel Ellis, T., 271, 279Nomoto, A., 66Nomura, M., 345, 346, 349Northcote, P., 15Novac, O., 15Novak, J. E., 56Nozoe, Y., 263Nybakken, K., 238Nystedt, S., 233
O
Oakes, M., 345, 346, 349Oberer, M., 15, 58O’Day, M., 234Offen, N., 233
Ogata, H., 270Ohmori, T., 286, 287Okabe, K., 263Okamoto, H., 257Olsen, D. S., 85, 164, 185, 191Olsen, H., 271O’Neill, E. M., 232Orr-Dahan, I., 270, 271, 273, 274Ortiz, P. A., 129Ostareck-Lederer, A., 85Otto, G. A., 98Ovchinnikov, L. P., 76Ovryn, B., 311, 315Owens, G. C., 326Ozato, K., 185, 198
P
Pabich, E. K., 121Paillard, L., 317Pain, V. M., 37, 281, 282Palacios, I. M., 234Pallansch, M. A., 55, 66Palloix, A., 271, 279Palmenberg, A. C., 55, 57, 58, 76, 77Pardue, M. L., 24Park, E. H., 211Parker, R., 244, 307Parks, A. L., 233Paro, R., 237Parrott, A. M., 243, 244, 246, 251Pasquinelli, A. E., 314Patel, R. C., 244Paterson, B. M., 204Pathak, V. K., 147Paul, A. V., 55, 56, 76Paulin, F. E. M., 326Pause, A., 15, 55, 67, 68, 69, 71, 72, 73, 75, 78,
264, 285Pavitt, G. D., 85, 118, 119, 125, 126, 128, 141,
143, 150, 167Pavitt, G. P., 119Pelham, H. R., 204Pelham, H. R. B., 54, 55Pellerin, C., 71Pelletier, J., 12, 15, 16, 55, 58, 211, 280Peltz, S. W., 118, 220, 303, 305, 307Penin, F., 67Pepio, A. M., 263Perez, J. M., 264, 284, 285, 286Perkins, D. J., 244Perreault, S., 55, 67, 68, 69, 71, 72, 73, 75, 78Perrimon, N., 229, 234, 235, 237, 238Pestova, T. V., 18, 66, 84, 85, 86, 94, 95, 98, 99,
100, 102, 107, 118, 120, 125, 126, 140, 165,172, 174, 185, 195, 196, 221
Peterson, D. T., 17Petracek, M., 277, 278

Author Index 365
Phan, L., 85, 117, 118, 119, 125, 126, 141, 143,145, 147, 150, 164, 166, 167, 172, 185, 191
Picard, D., 117Piccioni, F., 228Pidoux, J., 245Pietrzak, M., 272Pietschmann, T., 67, 68, 78Pilipenko, E. V., 84, 85Pillai, R. S., 305, 306, 307, 310, 314Pillet, V., 291Pilote, L., 71Pinkstaff, J. K., 327Pirollet, F., 257Pisarev, A. V., 221Pise-Masison, C. A., 147Plaskitt, K. A., 45Plummer, T. H., Jr., 73Polakiewicz, R. D., 327Polunovksy, V. A., 267Polycarpou-Schwarz, M., 304Poulin, F., 228, 233, 234Pragai, B. M., 78Prats, A. C., 333Prats, H., 333Preiss, T., 24, 31, 303, 304, 305, 312Proud, C., 285, 290Pruijn, G. J., 257Ptashne, M., 301Ptushkina, M., 264Puglisi, J. D., 86, 98Pulak, R., 220Purcell, R. H., 68Pyronnet, S., 15, 324
Q
Qin, J., 141, 147, 164, 166, 167Qin, X., 256Qiu, D., 244Qiu, H., 126, 349
R
Radimerski, T., 232Radonovich, M., 147Ramaswamy, S., 267Ramirez, M., 128Rando, T. A., 244Raoult, D., 270Rasmussen, C., 116Raught, B., 37, 64, 76, 77, 228, 231, 285, 327Ravel, J. M., 37, 42Ray, S., 287Reed, K. E., 66Rehwinkel, J., 314Reichman, T. W., 244, 246, 251Reiff, D. F., 231Ren, B., 166Ren, J., 37
Renesto, P., 270Reuter, G., 234Revers, F., 275, 278, 279Rhem, E. J., 230, 231Rho, H. M., 244Rhoads, R. E., 5, 30, 261, 263, 264, 266, 267,
270, 271, 272, 273, 274, 275, 276, 277, 278,282, 291, 292, 327
Rice, C. M., 66, 67, 72, 73, 78Rich, A., 24Richardson, J. P., 128Richter, J., 264, 267, 284, 285Rideau, A., 303Rijnbrand, R., 102Ringquist, S., 344Rinker-Schaeffer, C., 263, 267Rivera-Pomar, R., 24, 289Robaglia, C., 263, 271, 274, 275, 278, 279,
286, 290Robalino, J., 263, 264, 266, 267, 275, 276, 280,
281, 284, 288, 289, 290Robert, C., 270Robert, F., 15, 16Roberts, B. E., 204Roberts, C., 107Roberts, J. K., 37, 42Roberts, L., 286Robinson, F., 303Roder, L., 291Rodriguez, C., 263, 274Roecklein, J. A., 145Roepstorff, P., 285, 290Rogers, G. W., Jr., 331, 338Roll-Mecak, A., 126, 184, 185, 186, 187,
195, 196Rom, E., 37, 271Romaniuk, P. J., 342Rong, Y. S., 235Roote, J., 233Rorth, P., 229Rosch, P., 304Rose, D. W., 307Rosenfeld, M. G., 307Rosenwald, I. B., 267Ross, K., 267Rotenberg, M. O., 171, 178Rothestein, R., 143Rousset, J. P., 220Roy, G., 232Rubin, C. M., 257Rubin, G. M., 229, 230, 231, 232, 233Rubtsova, M. P., 221Rudolph, R., 288Rueckert, R. R., 55, 66Ruffel, S., 271, 279Ruis, H., 117, 118Ruiz-Echevarria, M. J., 303, 305, 307Russell, D. G., 72, 73, 78

366 Author Index
Russell, D. W., 208Ruszczynska, K., 272Ruud, K. A., 272, 282Ryner, L., 230, 231, 233
S
Sachs, A. B., 84, 85, 117, 118, 164, 185, 190,191, 204
Sachs, M. S., 11, 12, 203, 204, 207, 208, 211, 218,219, 220
Safer, B., 17Salas-Marco, J., 220, 222Salmon, E. D., 303, 315Salo, W. L., 252Sambrook, J., 39, 58, 60, 64, 65, 69, 171, 208Sanchez, C., 291Sanchez de Jimenez, E., 274, 275Sanford, J. R., 310, 313Sanjuan, R., 271, 279Santoro, R., 285, 290Sarisky, R. T., 244Sarnow, P., 11, 84, 85, 95, 100, 190, 204, 207,
256, 324Sasaki, M., 263Sato, K., 234, 285Saumweber, H., 234Saunders, L. R., 244Sauvaget, D., 245Savio, P., 85, 164, 185, 191Schaefer, M., 303, 307, 316Schagger, H., 211Scharpf, M., 304Schena, M., 117, 119Scherer, S. E., 228Schiestl, R. H., 110, 142Schilling, M., 244Schimke, R. T., 37Schinazi, R. F., 220Schindelholz, B., 232Schmelzle, T., 285Schmid, C. W., 257Schmid, S. R., 118Schmidt-Rose, T., 75Schmitz, N., 285Schneider, R. J., 342Schoenberg, D. R., 264Schoenfeld, L. W., 164, 172Schott, E. J., 280, 290Schreier, M. H., 13Schroeder, R., 86Schulze, K. L., 233Schummer, M., 275Schuster, C. F., 231Schwartz, P., 289Schweimer, K., 304Scitkin, Y. V., 53Scott, M. P., 24Scully, K. M., 307
Searle, S. M., 269Sekelsky, J. J., 236Selby, M. J., 78Selig, L., 291Semler, B. L., 56, 76Sen, G. C., 15, 244SenGupta, D., 145Sengupta, T. K., 244Seraphin, B., 303, 304, 305Shalev, A., 118, 130, 141, 147, 165, 166, 167, 169Shapira, M., 270, 271, 273, 274Sharma, M., 264, 286Sharp, P. A., 24, 25Shatsky, I. N., 18, 66, 84, 85, 86, 94, 100, 221Shaw, J. G., 45Shen, H., 303Shen, X., 263Shenoy, S. M., 303, 307, 316Sherman, F., 110, 111, 142, 157, 188Shi, L., 244Shi, Y., 71Shim, J., 244Shin, B., 164, 169, 170, 171, 174, 178Shin, B. S., 116, 118, 126, 174, 183, 184, 185,
186, 187, 195, 196Shin, H. J., 244Shirokikh, N., 118, 120, 125, 126Shu, M. D., 303, 305, 307, 310, 313Sicheri, F., 185, 198Sierra, J. M., 24, 289Sigrist, S. J., 231Sikorski, R. S., 187Silver, P. A., 303Silverman, J. B., 109, 126Sinenko, S. A., 234Singer, M. A., 230, 231, 233Singer, R. A., 116Singer, R. H., 303, 307, 311, 315, 316Singh, C. M., 230, 231, 233Singh, C. R., 105, 109, 118, 120, 124, 126, 128,
139, 141, 155Singh, G., 313Singh, R. C., 109, 118Siwanowicz, I., 196Skrabanek, L., 264, 284, 285Slade, D., 107Sleat, D. E., 45Slepenkov, S. V., 272Smerage, L. E., 77Smibert, C. A., 228Smith, A. J., 244Smith, C. W., 303Solomon, M. J., 166Sommadossi, J. P., 220Sonenberg, N., 12, 15, 37, 53, 55, 56, 57, 58, 64,
67, 68, 69, 71, 72, 73, 75, 76, 77, 78, 228,231, 232, 233, 234, 263, 264, 267, 271, 277,280, 284, 285, 327

Author Index 367
Song, H., 222Sontheimer, E. J., 314Sossin, W. S., 263Southby, J., 303Spaan, W., 102Spatrick, P., 305Spellman, R., 303Sperling-Petersen, H. U., 196Spevak, C. C., 211, 218Spicer, E. K., 244Spradling, A. C., 229, 230, 231, 233Stachelska, A., 272Staehelin, T., 13Stahl, G., 220Standart, N., 303, 307, 310, 314, 317Stansfield, I., 220, 222Stark, A., 314Stark, H., 85Stearns, T., 209Steitz, J. A., 244, 303, 305, 307, 310, 313Stephenson, A. E., 234Stepinski, J., 5, 30, 263, 270, 271, 273, 274, 282Stern, B. D., 282Stern, D. M., 230, 231, 233Sternglanz, R., 141, 142, 145Stevens, A., 264Sticht, H., 304St Johnston, D., 234Stocker, H., 232Stolarski, R., 5, 30, 263, 266, 272, 273, 276Stoneley, M., 326Storti, R. V., 24Strathern, J. N., 187Straus, J. W., 204Strokovska, L., 286Strome, S., 267, 274, 275, 277Strub, K., 257Strudwick, S., 264, 286Struhl, G., 232Struhl, K., 301Sturchler, C., 257Suehiro, N., 286, 287Sugino, A., 110Sullivan, W., 238Suter, B., 24Suzan, M., 270Sved, S., 58Svitkin, Y., 15Svitkin, Y. V., 15, 37, 55, 56, 57, 58, 64, 67, 68,
69, 71, 72, 73, 75, 76, 77, 78Syder, A. J., 78Sykes, C., 165, 167, 169, 171, 172, 173, 174, 175Szamecz, B., 116, 118, 126, 163, 164, 169, 170,
171, 174, 178
T
Takacs, J. E., 120, 125Takahashi, T., 286, 287
Takasawa, S., 257Tamura, T., 185, 198Tan, A. T., 267Tan, L. R., 233Tan, S. L., 71Tanaka, J., 15, 58Tanaka, T., 68Tanguay, R. L., 37, 38, 42, 45, 47, 48, 49Taniguchi, T., 263Tapprich, W. E., 345Tarentino, A. L., 73Tarun, S. Z., Jr., 85, 117, 118, 164, 185, 190,
191, 204Teesdale-Spittle, P., 15Tellinghuisen, T. L., 78Temme, C., 24Tercero, J. A., 176Tettweiler, G., 227Thach, R. E., 12, 13Thermann, R., 85Thibault, S. T., 230, 231, 233Thiel, P. R., 231Thijssen, J. P., 257Thom, G., 303, 307, 310, 314, 317Thomas, C., 271, 279Thomas, G., 232Thompson, J., 345Thompson, S. R., 303, 311, 317Tinton, S., 334Tohgo, A., 257Tomoo, K., 263, 286, 287Topisirovic, I., 264, 284, 285Tourneur, C., 286, 290Trachsel, H., 10, 37, 116, 117, 118, 147, 280, 285Tran, H., 244Tranque, P., 342, 343Traut, R., 18, 94Treadway, S. L., 234Trimble, R. B., 73Trueheart, J., 110, 114, 156, 188Trutschl, M., 267, 275, 277, 292Tsang, G., 233Tsantrizos, Y. S., 71Tsukamoto, T., 286, 287Tsukiyama-Kohara, K., 66Tudor, A., 267Tuite, M. F., 220, 222Turnbull, D., 248Turner, D. H., 326Turner, P. C., 45Tuschl, T., 24, 25Twell, D., 277, 278
U
Udagawa, T., 105Ugarova, T. Y., 68Uhlenbeck, O. C., 248, 303Umen, J. G., 220

368 Author Index
Unbehaun, A., 84, 85, 98, 99, 102, 172, 174Ung, T. K., 109, 126Urlaub, H., 289
V
Vagner, S., 324Valasek, L., 116, 117, 118, 126, 147, 164, 165,
167, 169, 170, 171, 172, 173, 174, 175,177, 178
Valasek, L., 141, 163, 164, 166, 172, 174, 190Valaskova, V., 172van der Straaten, T., 102van Eldik, G., 277, 278van Gelder, C. W., 257, 304van Heerden, A., 42Van Huffel, S., 334Van Nostrand, E., 303van Venrooij, W. J., 257, 304Varmus, H. E., 220Varshavsky, A., 166, 176Vazquez de Aldana, C. R., 128Vazquez-Pianzola, P., 24, 266, 269, 281Velasco, C., 264Venken, K. J., 229Verdu, J., 228, 232Verlhac, M.-H., 117Verrotti, A. C., 228Vestal, D. J., 244Viadiu, H., 307Vidal, M., 291Vidalain, P.-O., 291Vilela, C., 264Villaescusa, J. C., 228Villa-Komaroff, L., 58, 61, 62Viranaicken, W., 244Vogel, H., 244von Ahsen, U., 86von der Haar, T., 109, 118von Hippel, P. H., 342von Jagow, G., 211Vornlocher, H. P., 141, 147, 164, 166, 167Vu, L., 345, 346, 349
W
Waddell, C., 5, 30Wagner, G., 15, 58, 109, 155, 263Wahle, E., 24Wai, H. H., 345, 346, 349Wakita, T., 68, 78Walbot, V., 37, 44, 45Waldman, A. A., 166Walhout, A., 291Wallace, S. T., 86Walsh, M. R., 243, 244, 246, 251Walter, J., 287Walter, P., 67Wang, C. C., 281
Wang, L., 311, 317Wang, Z., 204, 218, 220, 303Warner, J. R., 167, 349Warrior, R., 230Watkins, P. A., 45Watrin, T., 317Watts, J. W., 45Weaver, P. L., 349Webb, H. M., 222Webster, C., 37, 42Wei, C.-C., 37, 38, 42, 47, 49Wei, N., 142Wek, R. C., 118, 128Wells, D. R., 45, 47, 48Weng, Y., 220Westendorf, J. M., 257Wharton, K. A., 234Whetter, L., 102White, J., 267Wickens, M., 299, 301, 303, 305, 307, 309, 310,
311, 312, 317Wieczorek, Z., 272William Lown, J., 15Williams, A., 274, 276Williams, B., 278Williams, B. R., 244Williams, D., 285, 290Williamson, J. R., 307Willis, A. E., 326Wilson, J. E., 85, 95, 100Wilson, M. A., 282Wilson, T. M., 45Wimmer, E., 55, 76Wimmer, E. A., 233Winter, C. G., 233Wirbelauer, C., 244Witherell, G., 15Witherell, G. W., 303Wittwer, F., 232Wojnar, J. M., 15Wolff, T., 232Wolfner, M., 143Wolk, B., 78Wollerton, M., 303Wood, J. M., 220Wood, W., 37Woodbury, C. P., Jr., 342Woods, R. A., 142Woolford, J. L., 37Woolford, J. L., Jr., 171, 178Work, T. S., 54, 58Wu, C., 203, 207Wu, H. N., 303Wu, P., 176Wu, X., 45Wyckoff, D., 24Wynn, R., 234Wyslouch-Cieszynska, A., 263

Author Index 369
X
Xi, Q., 342Xiao, X., 303Xu, Y. H., 244Xu, Z., 45, 244
Y
Yamamoto, K. R., 117, 119, 307Yamamoto, Y., 109, 118, 120, 124, 126, 128,
141, 155Yanagi, M., 68Yanow, S. K., 263Yasuda, K., 237Yasui, K., 68Yates, J. R., 244Yep, D., 143Yisraeli, J. K., 37Yoffe, Y., 270, 271, 273, 274Yokoyama, S., 77, 78Yonekura, H., 257Yoon, H., 15, 107, 120, 121Yoon, S., 220
Yu, X., 167, 349Yu, Y., 85, 98
Z
Zagorski, W., 286Zamore, P. D., 24, 25Zang, W.-Q., 342Zapata, J. M., 24Zappavigna, V., 228Zeira, Z., 270, 271, 273, 274Zhang, F., 141, 164, 172Zhang, S., 244Zhang, X., 141, 147, 164, 166, 167Zhao, G., 244Zhao, Z., 68, 78Zhou, W., 326, 333, 344, 345, 348, 350, 351Zieve, G. W., 248Zimmer, S. G., 267Zoll, W. L., 185, 190Zong, Q., 275Zuberek, J., 270, 271, 273, 274Zuker, M., 326
Subject Index
A
Affinity chromatographyeIF4E RNA cap-binding assay, 273–27448S initiation complex affinity purification
complex assembly and affinitychromatography, 89–91
dihydrostreptomycin-coupled Sepharosepreparation, 88
overview, 85–86StreptTag incorporation on messenger
RNA, 86sucrose density gradient centrifugation,
91–94
ATP regeneration, Drosophila cell-free translationsystem, 30–31
B
Bacteriophage tethering proteins, see Tetheredfunction assay
C
Cell-free translation systems, see Drosophila cell-free translation system; Krebs-2 cell-freeextract; Neurospora crassa cell-free translationsystem; Rabbit reticulocyte lysate;Saccharomyses cerevisiae cell-free translationsystem; Wheat germ fractionated translationlysate
Coimmunoprecipitationimmunoaffinity resin preparation
anti-FLAG affinity resin, 158anti-HA affinity resin, 158–159
immunoprecipitation and Western blot, 159materials, 156–157principles, 156translation initiation multifactor complex,
140–141troubleshooting, 159whole cell extract preparation, 157–158
D
DNA microarray, polysomal messenger RNAdistribution analysis, 291–293
Dominant negative mutant, translation initiationfactor analysis in yeast, 116–120
Drosophila cell-free translation system
applications, 23–24embryo extracts
overview, 24–25preparation, 27–28
ovary extractsoverview, 24–25preparation, 25–27
translation assayATP regeneration system, 30–31buffers, 31–32messenger RNA, 28, 30optimization, 28reporters, 31
Drosophila stock centers, 239
E
eIF1, yeast genes, 107eIF2
phosphorylation, 107, 109rabbit reticulocyte lysate analysis, 15–16Sui- mutant studies of start codon stringency
in yeast
b-galactosidase assay, 122–123histidine phenotype, 121–122materials, 121overview, 120–121UUG/AUG ratio calculation, 123yeast genes, 107eIF3, subunits, 164eIF4
rabbit reticulocyte lysate analysis, 15–16RNA helicase activity, 44start codon selection role of eIF4F, 109subunits and functions, 36–37, 262wheat germ fractionated translation lysate
studies
cap dependence analysis, 42–45depletion effects, 38–49tobacco etch virus 5’-leader studies, 48–49tobacco mosaic virus enhancer studies, 45,47–48
eIF4Ecell-free translation system studies
depletion and functional recovery, 282–283inhibition studies, 283overview, 281–282classes, 264, 266–267clinical significance, 267
371

372 Subject Index
eIF4E (cont.)complementation studies in yeast, 280–281DNA microarray analysis of polysomal
messenger RNA distribution, 291–293eIF4G interactions, 263expression profiling
messenger RNA levels, 274–276protein levels, 276–277
functional overview, 262–264, 266–267knockout mutants, 277–278mutant studies in Drosophila, 228plant mutations and viral resistance, 278–279protein-protein interactions
binding protein types and functions,284–287
far-Western analysis, 289–290interactome database analysis, 290–291mass spectrometry, 290pull down assays
bait selection, 287prey selection, 288–289recombinant protein production,
287–288yeast two-hybrid analysis, 289
RNA cap-binding assaysaffinity chromatography, 273–274fluorescence quenching equilibrium
measurements, 272–273RNA interference, 277–278, 280sequence analysis
homology between species, 264, 268–270mutation analysis, 270–271relationships among sequences, 270tertiary structure modeling, 271
structure, 263eIF5
48S complex initiation factor release inductionassays, 99–100
rabbit reticulocyte lysate analysis, 15Sui- mutant studies of start codon stringency in
yeast
b-galactosidase assay, 122–123histidine phenotype, 121–122materials, 121overview, 120–121UUG/AUG ratio calculation, 123yeast genes, 107, 185eIF5B
expression and purification from yeast,191–193
intragenic suppressor analysis
genetic selection of suppressorsscreening, 187–188site-directed mutagenesis, 186–187
overview, 184–186polysome profiling, 188–190yeast cell extract preparation for translation
assays, 190–191
ribosome studiesribosome-binding assay, 196–198ribosome-dependent uncoupled GTPase
assay, 195–196ribosome purification
crude 80S ribosomes from yeast, 193–194reassociated 80S ribosomes from yeast,
194
Encephalomyocarditis virus, see Krebs-2 cell-free extract
F
5-Fluoroorotic acidlethal yeast mutation analysis, 114–116plasmid shuffling, 114–116
FLP/FRT recombination system, translationinitiation factor studies in Drosophila,233, 235
FOA, see 5-Fluoroorotic acidFormaldehyde cross-linking, see Preinitiation
complex
G
GAL-HIS3, see Yeast two-hybrid systemGAL-LacZ, see Yeast two-hybrid systemGAL4-UAS system, see P-elementGcn2, eIF2 substrate, 109GCN4, reporter assays of yeast translation
initiationGcd- phenotype tests, 127–129Gcn- phenotype
mechanism analysis, 128tests, 127–129
materials, 126–127overview, 123–126
GFP, see Green fluorescent proteinGlutathione S-transferase pull-down assay
bacterial lysate preparation containing fusionproteins, 148–149
binding reaction, 150–153glutathione resin adsorption, 149–150materials, 147–148prey protein preparation, 150principles, 146–147third protein effects on protein-protein
interaction, 153–154translation initiation multifactor complex,
140–141verification of direct interactions, 153
Green fluorescent protein, eIF4E fusion, 276–277
H
Heparin, preinitiation complex stabilizationformaldehyde cross-linked preinitiation
complex comparison, 172–174, 181overview, 166, 172–174
Hepatitis C virus, see Krebs-2 cell-free extract

Subject Index 373
Homologous recombination, translation initiationfactor studies in Drosophila, 235–236
I
Initiation codon, see Start codon48S Initiation complex
affinity purification
complex assembly and affinitychromatography, 89–91dihydrostreptomycin-coupled Sepharose
preparation, 88overview, 85–86StreptTag incorporation on messenger
RNA, 86sucrose density gradient centrifugation,
91–94canonical and internal ribosome entry site-
mediated translation, 84–85eIF5-induced initiation factor release assays,
99–100forms, 85GTPase assay, 99Northern blot, 98reconstitution, 85sucrose density gradient centrifugation of 80S
ribosome formation, 100, 102toe printing, 94–95Western blot, 95, 97–98
Internal ribosome entry sitemediated translation in reticulocyte lysates,
12–13translation initiation mediation, 85
IRES, see Internal ribosome entry siteIron response element-binding protein, tether in
tethered function assay, 304–305IRP, see Iron response element-binding protein
K
Krebs-2 cell-free extractcell culture and storage, 61encephalomyocarditis virus replication
infectious virus particle generation, 56–58materials, 58–61overview, 54–56plaque assay, 66reaction product quantification
gel electrophoresis and autoradiography,64
trichloroacetic acid precipitation, 63–64RNA replication
analysis, 65synthesis, 64
translationincubation conditions, 63kinetics, 56
virus synthesis, 65–66hepatitis C virus RNA replication
canine pancreatic microsomal membranesupplementation, 67–68, 70
denaturing gel electrophoresis of translatedproteins, 70–71
glycosylation analysis, 72–73, 75materials, 68–70NS3 protease inhibitor characterization,
71–72overview, 66–67potassium salt optimum, 68protease protection assay, 75–76Western blot, 68
prospects for study, 76–78S10 extract
nuclease treatment, 63preparation, 62
L
Luciferaseribosomal recruitment reporter constructs,
327–328translation initiation analysis in wheat germ
fractionated translation lysate, 42Western blot of Photinus enzyme, 339–340
M
Mass spectrometry, eIF4E binding partneridentification, 290
Messenger RNAcap dependence of translation, see also
Ribosomal shunting
eIF4E cap-binding assaysaffinity chromatography, 273–274fluorescence quenching equilibrium
measurements, 272–273rabbit reticulocyte lysate studies, 11wheat germ fractionated translation lysate
studies of eIF4, 42–45DNA microarray analysis of polysomal
messenger RNA distribution, 291–293Drosophila cell-free translation system, 28, 30eIF4E expression profiling, 274–276reticulocyte lysate studies of translation
initiationcap-dependence analysis, 11competition studies, 12–13RNA preparation, 5
ribosomal RNA base pairinganalysis in yeast, 344–345, 347–348mouse-yeast hybrid ribosomal RNA system,
352ribosomal shunting mediation assessment,
349–351ribosomal shunting, see Ribosomal shuntingtethered function assay
function analysis without known RNAtarget, 308

374 Subject Index
Messenger RNA (cont.)
localization functions and visualizationin vivo, 315–316modifying enzyme analysis, 317reporter selection and tethered binding sites,
305–307RNA binding in function, 307–308stimulatory and inhibitory effects of
metabolism factors, 317wheat germ fractionated translation lysate
studiescap dependence analysis, 42–45RNA synthesis, 37
MicroRNA, tethered function assay of mediatedgene silencing, 314
mRNA, see Messenger RNAMS2, tether in tethered function assay, 303–304
N
Neurospora crassa cell-free translation systemcycloheximide effects on ribosomal toe print at
termination site, 221–222DNA sequencing, 217gel filtration, 216materials, 204–205, 207, 214–215nuclease treatment, 210, 216preparation, 208–209, 215–216primer preparation for toe printing and
sequencing, 211–212, 217pulse-chase analysis of protein synthesis,
219–220toe printing, 212, 217–218transcription in vitro, 208, 215translation, gel electrophoresis, and
autoradiography, 211, 216–217upstream open reading frame translational
regulation analysis, 218–219NMD, see Nonsense-mediated decayNonsense-mediated decay, tethered function
assay of multiprotein complexes, 313–314Northern blot
formaldehyde cross-linked preinitiationcomplex, 170–171
48S initiation complex, 98messenger RNA-ribosomal RNA base pairing
analysis in yeast, 347–348N protein, N-peptide as tether in tethered
function assay, 304Nuclear factor 90
epitope tagging, 245–246functional overview, 244RNA immunoprecipitation assay
asynchronous cell findings, 251buffers, 247G2/M phase cells, 248–251incubation conditions and analysis, 247–248principles, 246–247
RNA identificationoverview, 252poly(A) tailing, 255–256primers, 253reverse transcriptase-polymerase chain
reaction, 253–254RNA species identified and significance,
255–257sequencing, 254–255
RNA interactions, 244
P
PABP, see Poly(A)-binding proteinPCR, see Polymerase chain reactionP-element
FLP/FRT recombination system, 233, 235GAL4-UAS system, 229, 232–233homologous recombination, 235–236imprecise excision, 233mutant alleles of translation initiation factors
and regulators, 234overview, 228–229translation initiation factors and transposable
element insertion lines, 230–231Peptide N-glycosidase F, hepatitis C virus
envelope protein glycosylation analysis fromKrebs-2 cell-free extracts, 72–73, 74
PIC, see Preinitiation complexPKR, see Protein kinase RNA activatedPNGase F, see Peptide N-glycosidase FPoly(A)-binding protein
depletion in wheat germ translation lysate, 38,43, 47, 49
function, 37Polymerase chain reaction, eIF4E transcript
expression profiling, 274–276Polymerase chain reaction, RNA identification in
RNA immunoprecipitation assay withreverse transcriptase-polymerase chainreaction, 253–254
Polysome profilingeIF5B intragenic suppressor analysis, 188–190formaldehyde cross-linked preinitiation
complex, 176, 178–179yeast
elongation defect identification, 133materials, 131overview, 129, 131sucrose density gradient centrifugation,
132–133vacant ribosome identification, 133whole cell extract preparation, 131–132
Preinitiation complexcomponents and functions, 164–165formaldehyde cross-linking
analysis of fractionated complexesNorthern blot, 170–171

Subject Index 375
resedimentation, 171–172, 175–176Western blot, 169–170
cross-linking in vivo, 168formaldehyde concentration effects,
174–175heparin stabilization comparison, 172–174,
181overview, 166polysome profiling, 176, 178–179rationale, 168whole cell extract preparation and
fractionation, 168–169heparin stabilization, 166, 172–174
Primer extension inhibition, see Toe printingProtein kinase RNA activated, eIF2 substrate, 109Protein-protein interactions, see
Coimmunoprecipitation; eIF4E;Glutathione S-transferase pull-down assay;Yeast two-hybrid system
R
Rabbit reticulocyte lysatehistorical perspective, 248S initiation complex assembly and affinity
chromatography, 89–91translation initiation studies
initiation factor variation, 13, 15–16internal ribosome entry site-mediated
translation, 12–13materials, 3messenger RNA
cap-dependence analysis, 11competition studies, 12–13preparation, 5
optimization of translation, 8, 10overview, 2reaction product quantification
gel electrophoresis and autoradiography,6–8
trichloroacetic acid precipitation, 6reinitiation studies, 11–12reporter selection, 10sucrose gradient centrifugation of
complexes, 16–18toe printing, 18–19transfer RNA preparation, 4translation reaction
high-specific radioactivity productpreparation, 13
sulfur-35 methionine labeling, 5–6
Reticulocyte lysate, see Rabbit reticulocyte lysateRibonuclease protection assay, cap-dependenttranslation assessment using hairpinstructures, 328–330
Ribosomal RNAmessenger RNA-ribosomal RNA base pairing
analysis in yeast, 344–345, 347–348
ribosomal shunting mediation assessment,349–351
mouse-yeast hybrid ribosomal RNAsystem, 352
Ribosomal shuntingcap-dependent translation assessment
cell-free translation systems, 330–332hairpin structures
overview, 326–327ribonuclease protection assay, 328–330transient transfection with luciferase
reporter constructs, 327–328cap-independent translation assessment,
332–334ribosomal recruitment
overview, 324sites, 324–325
shunted messenger RNA segmentdetermination
hairpin structures as obstacles, 335–337overview, 334–335upstream AUG codons as obstacles,
337–340Ribosome
eIF5B studies
ribosome-dependent uncoupled GTPaseassay, 195–196ribosome-binding assay, 196–198ribosome purification
crude 80S ribosomes from yeast, 193–194reassociated 80S ribosomes from yeast,
194polysome profiling, see Polysome profilingsucrose density gradient centrifugation of 80S
ribosome formation, 100, 102RIP, see RNA immunoprecipitationRNA cap, see Messenger RNARNA immunoprecipitation, RNA bound to
nuclear factor 90asynchronous cell findings, 251buffers, 247G2/M phase cells, 248–251incubation conditions and analysis,
247–248principles, 246–247RNA identification
overview, 252poly(A) tailing, 255–256primers, 253reverse transcriptase-polymerase chain
reaction, 253–254RNA species identified and significance,
255–257sequencing, 254–255
RNA interferenceeIF4E knockdown, 277–278, 280translation initiation factor studies in
Drosophila, 236–238

376 Subject Index
RNA-protein interactions, see RNAimmunoprecipitation; Tetheredfunction assay
rRNA, see Ribosomal RNA
S
Saccharomyces cerevisiae cell-free translation systemcycloheximide effects on ribosomal toe print at
termination site, 221–222DNA sequencing, 217gel filtration, 216materials, 204–205, 207, 214–215nuclease treatment, 210, 216premature translation termination analysis,
220–221preparation, 209–210, 215–216primer preparation for toe printing and
sequencing, 211–212, 217Sup35p role in retroreinitiation after premature
termination, 222toe printing, 212, 217–218, 220–221transcription in vitro, 208, 215translation, gel electrophoresis, and
autoradiography, 211, 216–217Site-directed mutagenesis
eIF5B, 186–187protein-protein interaction analysis, 154–156
Start codonmessenger RNA-ribosomal RNA base pairing
analysis in yeast, 344–345, 347–348mouse-yeast hybrid ribosomal RNA system,
352ribosomal shunting mediation assessment,
349–351shunt site binding assay to ribosomal subunits
isolation of 40S ribosomal subunits, 341nitrocellulose filter binding assay, 341–342overview, 340–341ultraviolet crosslinking and localization of
crosslinked probe, 342–344shunted messenger RNA segment
determination using upstream AUGcodons as obstacles, 337–340
shunt site identification, 340Sui- mutant studies of start codon stringency
in yeastb-galactosidase assay, 122–123histidine phenotype, 121–122materials, 121overview, 120–121UUG/AUG ratio calculation, 123
StreptTag, see Affinity chromatographySucrose density gradient centrifugation
formaldehyde cross-linked preinitiationcomplex, 169–169, 171–172,175–176, 181
48S initiation complex, 91–94
polysome profiling for eIF5B intragenicsuppressor analysis, 188–190
polysome profiling in yeast, 132–13380S ribosome formation, 100, 102translation initiation complexes from
reticulocyte lysates, 16–18Sup35p, role in retroreinitiation after premature
translation termination, 222
T
Tethered function assayapplications
essential gene function analysis, 308, 312examples, 310–311function analysis without known RNA
target, 308messenger RNA-modifying enzyme
analysis, 317multiple protein function elucidation,
312–313multiprotein complex dissection
microRNA-mediated gene silencing,314
nonsense-mediated decay, 313–314overview, 307, 313
prospects, 318RNA binding in function, 307–308stimulatory and inhibitory effects of
messenger RNA metabolismfactors, 317
control, 308–309gain-of-function allele identification with
tethered protein mutagenesis, 314messenger RNA
localization functions and visualizationin vivo, 315–316
reporter selection and tethered binding sites,305–307
principles, 300–301rationale, 301tethering site position, 302–303, 315tether types
bacteriophage g N-peptide, 304iron response element-binding protein,
304–305MS2 bacteriophage coat protein, 303–304N-terminal versus C-terminal
fusions, 305selection factors, 303trans-acting effects, 305U1A, 304–305
Toe printingcycloheximide effects on ribosomal toe print at
termination site, 221–22248S initiation complex, 94–95Neurospora crassa cell-free translation system,
212, 217–218

Subject Index 377
premature translation termination analysis,220–221
Saccharomyces cerevisiae cell-free translationsystem, 212, 217–218, 220–221
translation initiation studies in reticulocytelysates, 18–19
Translation initiation, see Drosophila cell-freetranslation system; 48S Initiation complex;Krebs-2 cell-free extract; Neurospora crassacell-free translation system; Preinitiationcomplex; Rabbit reticulocyte lysate;Ribosomal shunting; Saccharomyces cerevisiaecell-free translation system; Wheat germfractionated translation lysate
Trf 5p, tethered function assay, 317
U
U1A, tether in tethered function assay, 304–305
W
Western blotcoimmunoprecipitation, 159eIF4E
binding partner far-Western analysis,289–290
expression analysis, 276formaldehyde cross-linked preinitiation
complex, 169–170hepatitis C virus components expressed in
Krebs-2 cell-free extract, 6848S initiation complex, 95, 97–98luciferase from Photinus, 339–340wheat germ fractionated translation lysate,
40–41Wheat germ fractionated translation lysate
advantages in translation studies, 36
denaturing gel electrophoresis, 39–40preparation, 38–39translation initiation analysis
depletion of initiation factors, 38incubation conditions, 41–42luciferase reporter assay, 42messenger RNA
cap dependence analysis, 42–45synthesis, 37
tobacco etch virus 5’-leader studies, 48–49tobacco mosaic virus enhancer studies, 45,
47–48Western blot, 40–41
Y
Yeast cell-free translation system, see Saccharomycescerevisiae cell-free translation system
Yeast growth assay, translation factor mutantsmedia, 111overview, 109–11quantitative spot assay, 113–114solutions, 111–112strains, 110transformation, 112–113
Yeast two-hybrid systemdomain interaction analysis, 145–146eIF4E binding partner analysis, 289materials, 142principles, 141–142screening
GAL-HIS3 expression levels, 143GAL-LacZ expression levels, 143, 145troubleshooting, 145
translation initiation multifactor complex,140–141
Related Documents